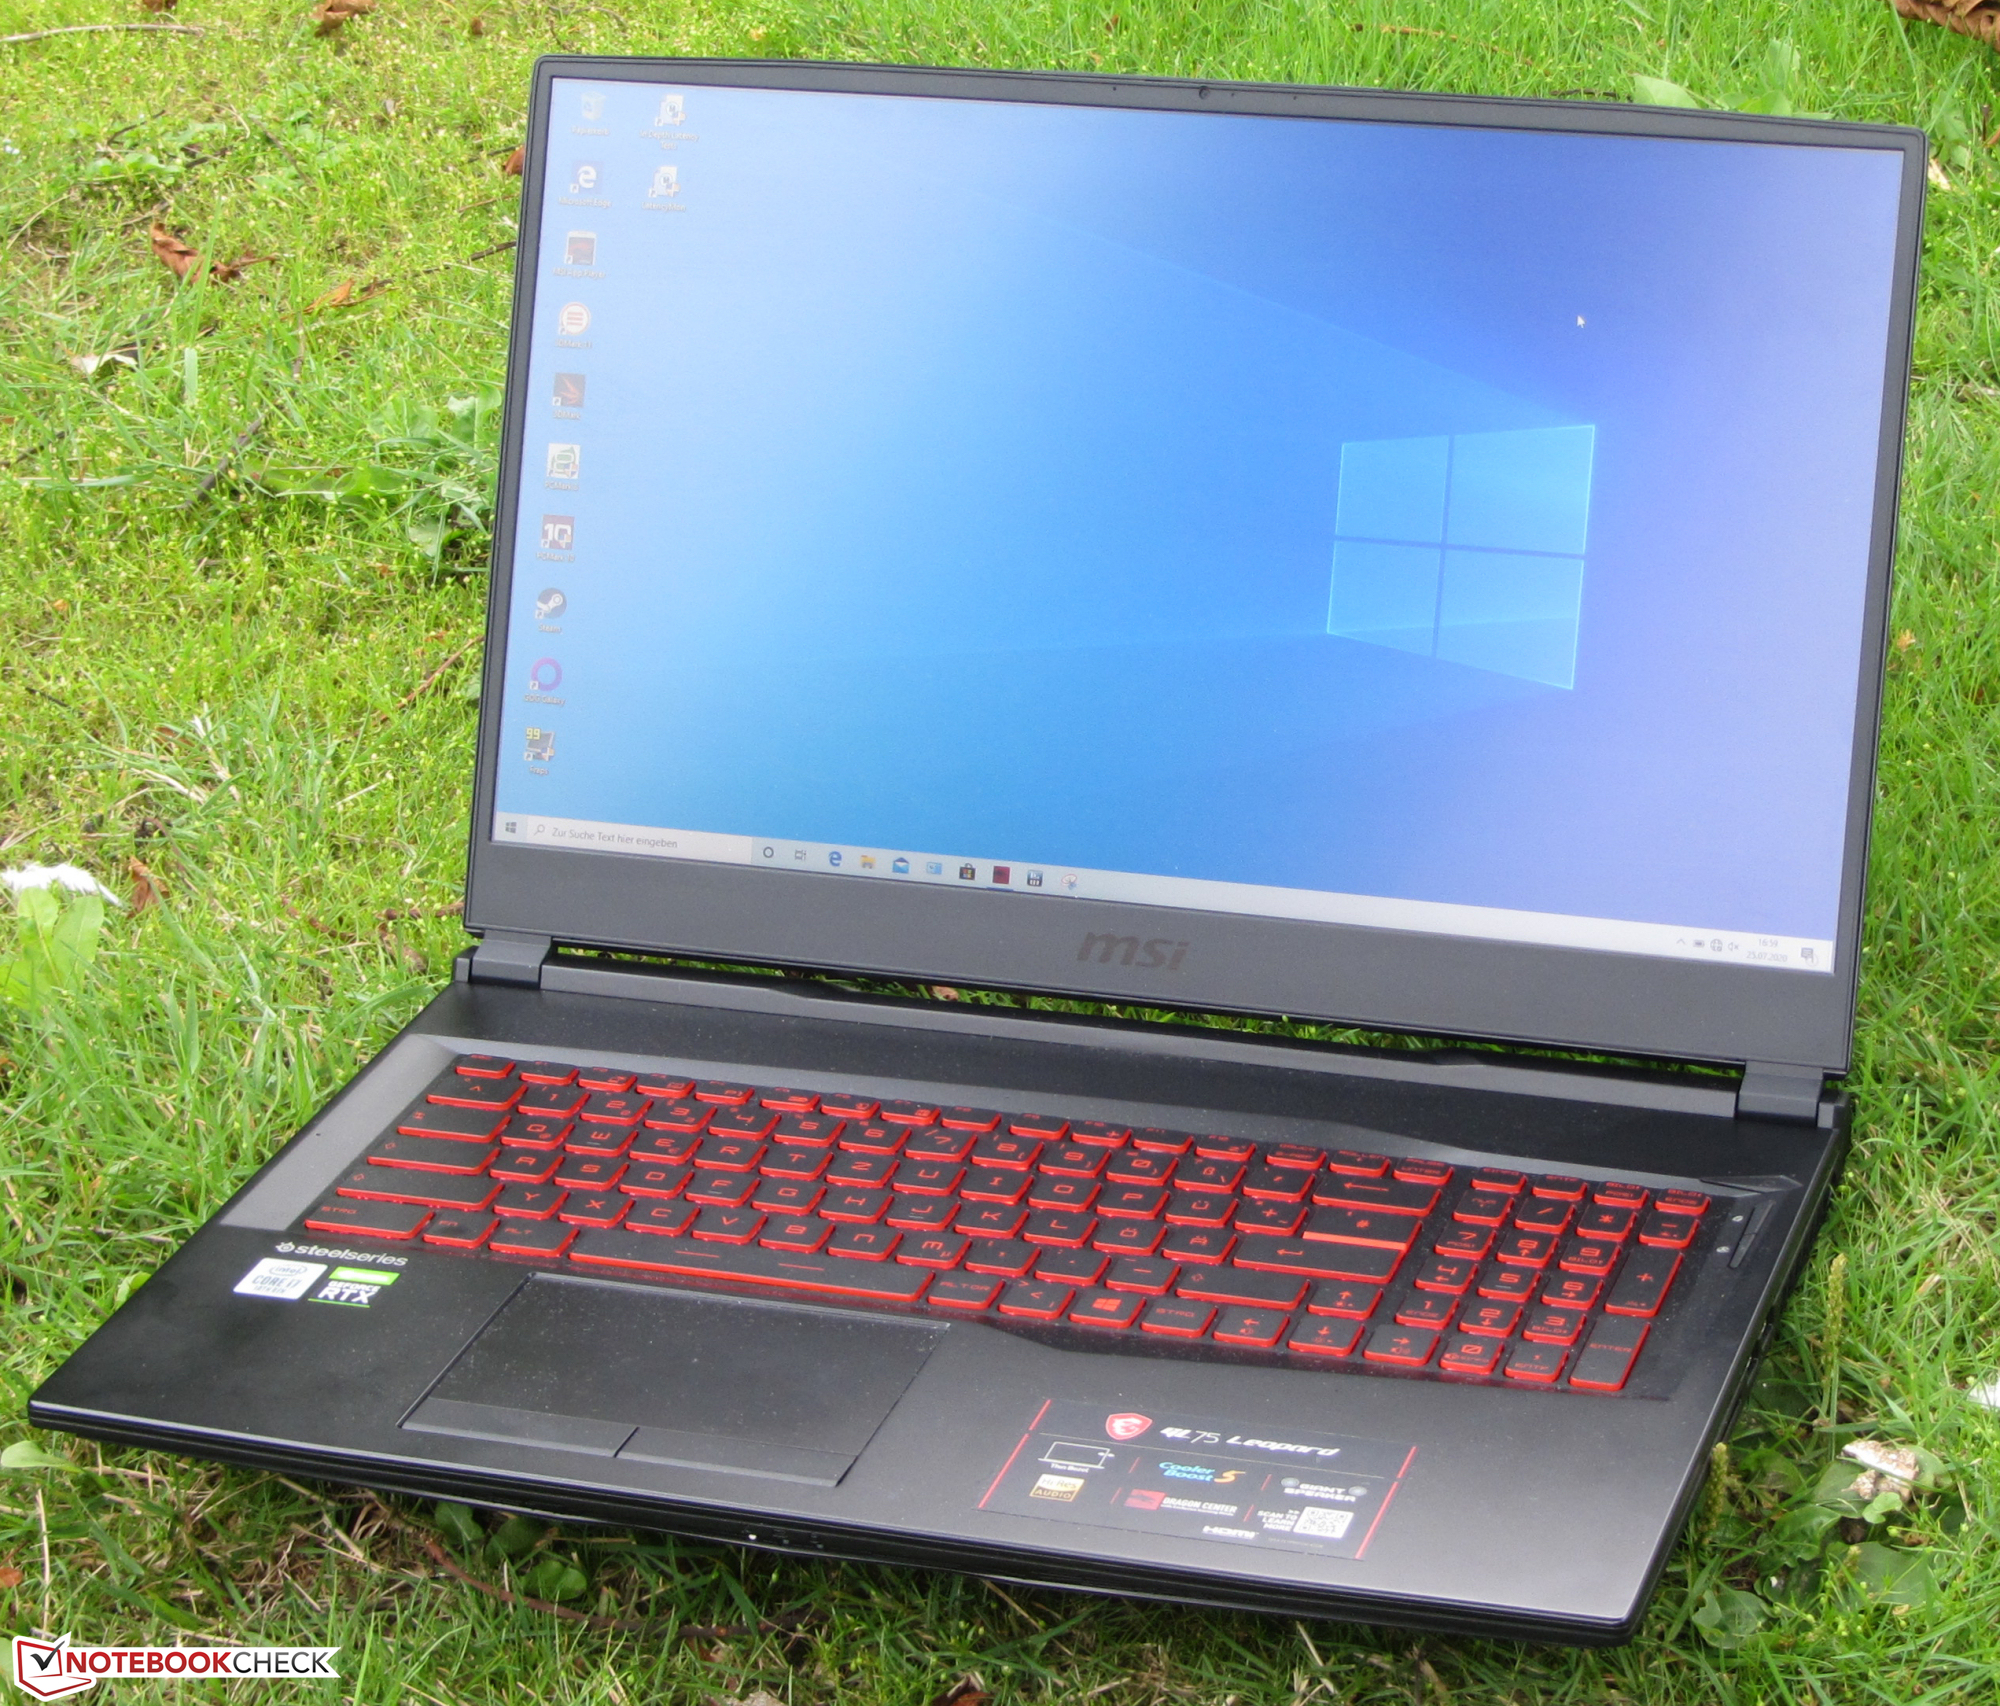
Test du MSI GL75 Leopard (i7-10750H, RTX 2070, FHD, 144 Hz) : PC portable de jeu réussi avec écran 144 Hz
Note | Date | Modèle | Poids | Épaisseur | Taille | Résolution | Prix |
|---|---|---|---|---|---|---|---|
| 83.5 % v7 (old) | 09/20 | MSI GL75 10SFR i7-10750H, GeForce RTX 2070 Mobile | 2.6 kg | 28 mm | 17.30" | 1920x1080 | |
| 80.6 % v7 (old) | 08/20 | Acer Nitro 5 AN517-52-77DS i7-10750H, GeForce RTX 2060 Mobile | 2.2 kg | 24.9 mm | 17.30" | 1920x1080 | |
| 83.2 % v7 (old) | 12/19 | Schenker XMG Neo 17 XNE17M19 i7-9750H, GeForce RTX 2060 Mobile | 2.5 kg | 27 mm | 17.30" | 1920x1080 | |
| 84 % v7 (old) | 04/20 | Lenovo Legion Y740-17IRHg-81UJ001VGE i7-9750H, GeForce RTX 2080 Max-Q | 3 kg | 25.5 mm | 17.30" | 1920x1080 |
| SD Card Reader | |
| average JPG Copy Test (av. of 3 runs) | |
| Moyenne de la classe Gaming (20.9 - 210, n=53, 2 dernières années) | |
| Schenker XMG Neo 17 (Toshiba Exceria Pro SDXC 64 GB UHS-II) | |
| Schenker XMG Neo 17 XNE17M19 (Toshiba Exceria Pro SDXC 64 GB UHS-II) | |
| MSI GP75 Leopard 9SD (Toshiba Exceria Pro SDXC 64 GB UHS-II) | |
| MSI GL75 9SEK-056US | |
| MSI GL75 10SFR (Toshiba Exceria Pro SDXC 64 GB UHS-II) | |
| maximum AS SSD Seq Read Test (1GB) | |
| Moyenne de la classe Gaming (25.5 - 261, n=50, 2 dernières années) | |
| Schenker XMG Neo 17 (Toshiba Exceria Pro SDXC 64 GB UHS-II) | |
| Schenker XMG Neo 17 XNE17M19 (Toshiba Exceria Pro SDXC 64 GB UHS-II) | |
| MSI GL75 9SEK-056US | |
| MSI GP75 Leopard 9SD (Toshiba Exceria Pro SDXC 64 GB UHS-II) | |
| MSI GL75 10SFR (Toshiba Exceria Pro SDXC 64 GB UHS-II) | |


| |||||||||||||||||||||||||
Homogénéité de la luminosité: 86 %
Valeur mesurée au centre, sur batterie: 337 cd/m²
Contraste: 1549:1 (Valeurs des noirs: 0.215 cd/m²)
ΔE ColorChecker Calman: 1.98 | ∀{0.5-29.43 Ø4.72}
calibrated: 2.01
ΔE Greyscale Calman: 2.97 | ∀{0.09-98 Ø4.97}
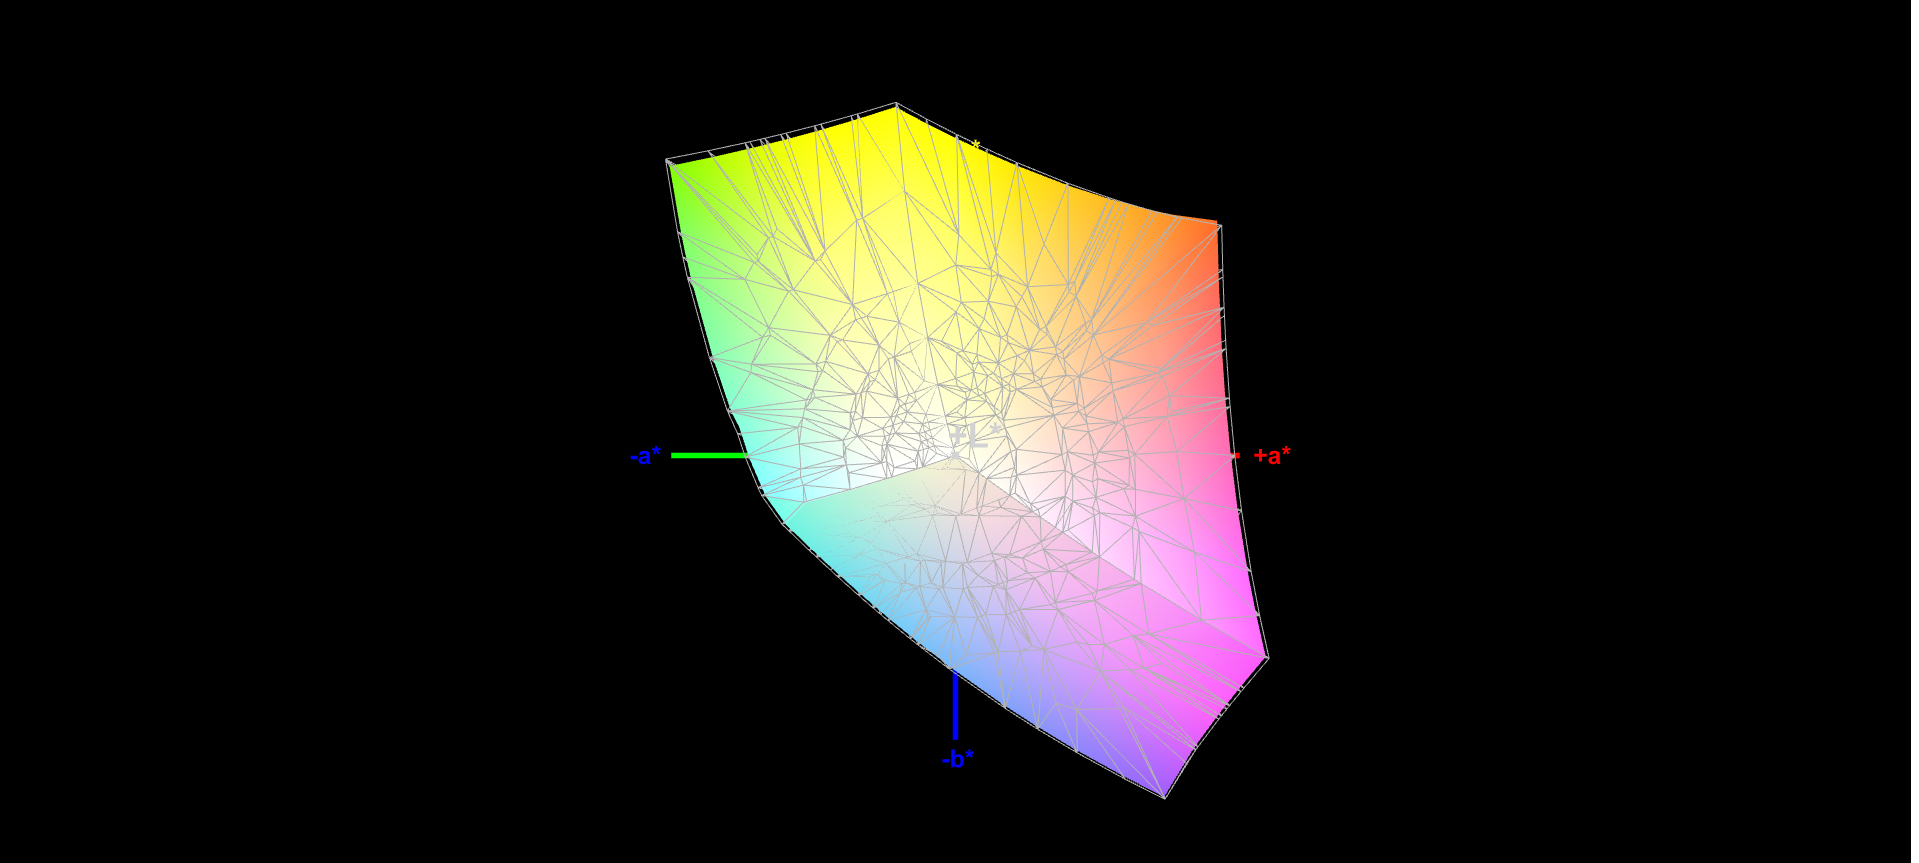
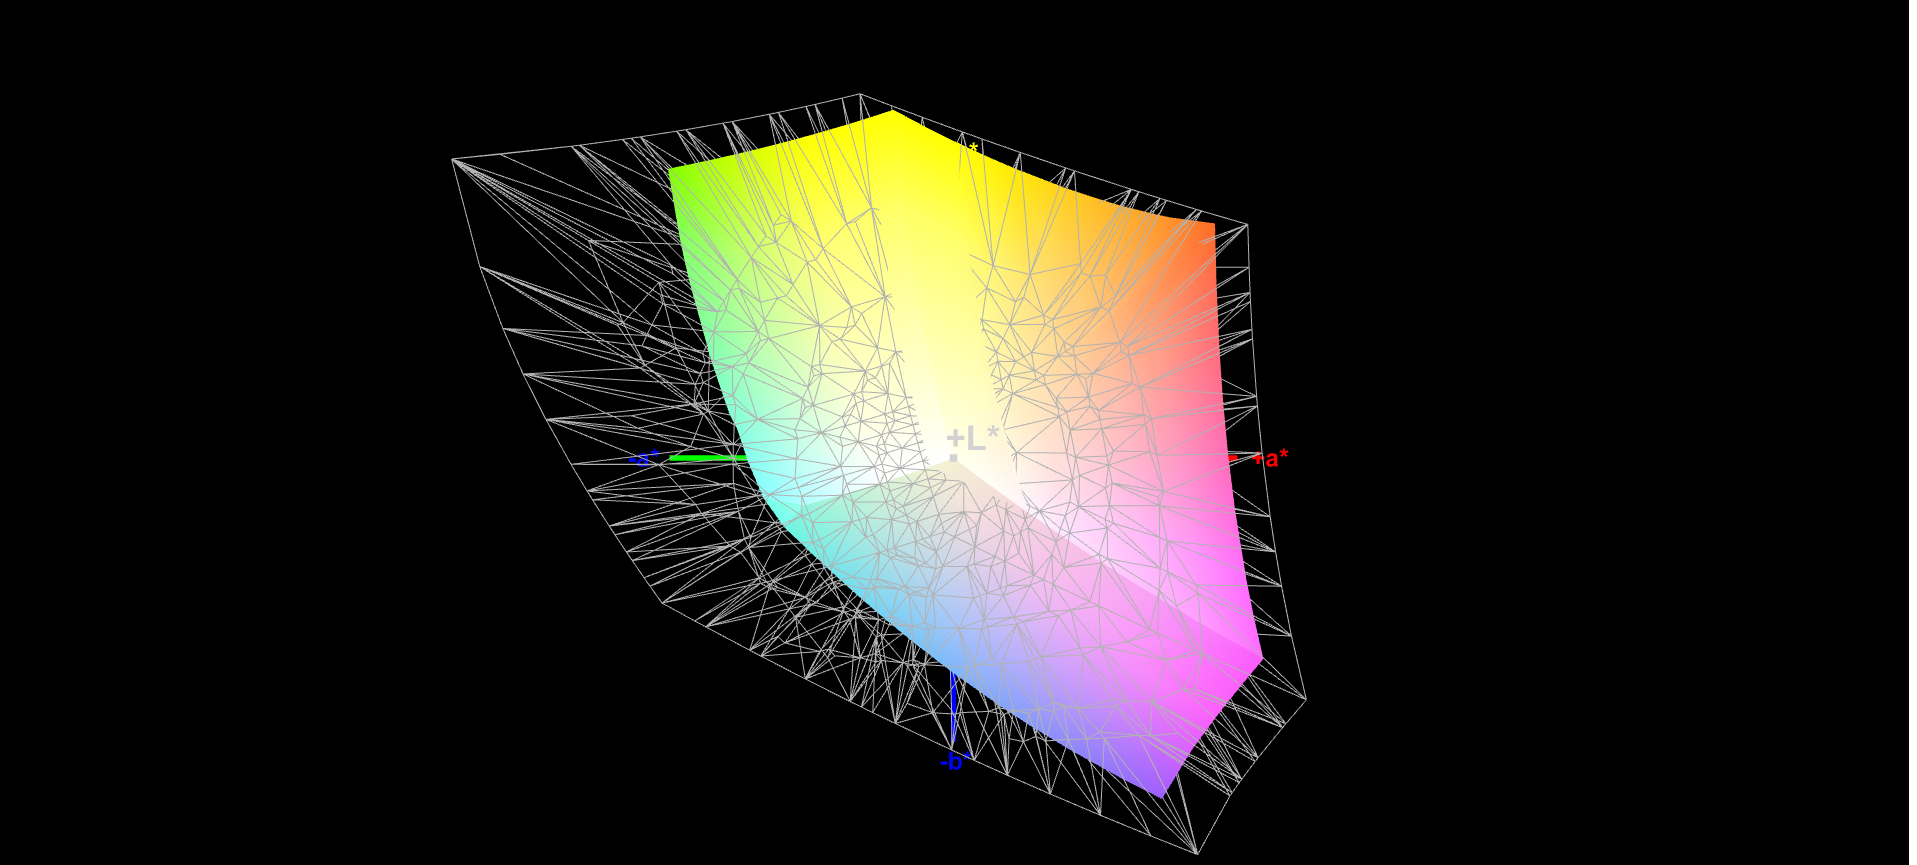
96% sRGB (Argyll 1.6.3 3D)
61% AdobeRGB 1998 (Argyll 1.6.3 3D)
66% AdobeRGB 1998 (Argyll 3D)
96.2% sRGB (Argyll 3D)
63.9% Display P3 (Argyll 3D)
Gamma: 2.41
CCT: 6750 K
| MSI GL75 10SFR Chi Mei N173HCE-G33, IPS, 1920x1080, 17.3" | Acer Nitro 5 AN517-52-77DS AU Optronics B173HAN04.7, IPS, 1920x1080, 17.3" | Schenker XMG Neo 17 XNE17M19 LG LP173WFG-SPB1 (LGD0615), IPS, 1920x1080, 17.3" | Lenovo Legion Y740-17IRHg-81UJ001VGE AUO_B173HAN03, IPS, 1920x1080, 17.3" | MSI GL75 9SEK-056US AU Optronics AUO479D (B173HAN04.7), IPS, 1920x1080, 17.3" | MSI GP75 Leopard 9SD Chi Mei N173HCE-G33 (CMN175C), IPS, 1920x1080, 17.3" | |
|---|---|---|---|---|---|---|
| Display | -38% | -0% | -2% | -36% | -1% | |
| Display P3 Coverage (%) | 63.9 | 39.47 -38% | 64.6 1% | 63.8 0% | 41.12 -36% | 63.4 -1% |
| sRGB Coverage (%) | 96.2 | 58.9 -39% | 95.6 -1% | 92.7 -4% | 61.1 -36% | 94.9 -1% |
| AdobeRGB 1998 Coverage (%) | 66 | 40.77 -38% | 65.6 -1% | 65.3 -1% | 42.49 -36% | 65.1 -1% |
| Response Times | -191% | -30% | -28% | -144% | 18% | |
| Response Time Grey 50% / Grey 80% * (ms) | 12 ? | 35 ? -192% | 15.6 ? -30% | 16 ? -33% | 26 ? -117% | 8 ? 33% |
| Response Time Black / White * (ms) | 9 ? | 26 ? -189% | 11.6 ? -29% | 11 ? -22% | 24.4 ? -171% | 8.8 ? 2% |
| PWM Frequency (Hz) | 208 ? | 25510 ? | ||||
| Screen | -87% | -27% | -33% | -67% | -9% | |
| Brightness middle (cd/m²) | 333 | 263 -21% | 318 -5% | 310 -7% | 259.1 -22% | 420 26% |
| Brightness (cd/m²) | 309 | 246 -20% | 286 -7% | 281 -9% | 261 -16% | 393 27% |
| Brightness Distribution (%) | 86 | 85 -1% | 86 0% | 85 -1% | 93 8% | 91 6% |
| Black Level * (cd/m²) | 0.215 | 0.47 -119% | 0.23 -7% | 0.31 -44% | 0.25 -16% | 0.32 -49% |
| Contrast (:1) | 1549 | 560 -64% | 1383 -11% | 1000 -35% | 1036 -33% | 1313 -15% |
| Colorchecker dE 2000 * | 1.98 | 5.07 -156% | 3.89 -96% | 3.86 -95% | 4.23 -114% | 3.04 -54% |
| Colorchecker dE 2000 max. * | 4.34 | 20.5 -372% | 10.56 -143% | 7.8 -80% | 23.39 -439% | 7.22 -66% |
| Colorchecker dE 2000 calibrated * | 2.01 | 4.9 -144% | 1.03 49% | 3.9 -94% | 0.89 56% | |
| Greyscale dE 2000 * | 2.97 | 2.55 14% | 5.3 -78% | 4.48 -51% | 1.3 56% | 3.91 -32% |
| Gamma | 2.41 91% | 2.37 93% | 2.46 89% | 2.5 88% | 2.076 106% | 2.26 97% |
| CCT | 6750 96% | 6446 101% | 7462 87% | 7542 86% | 6542 99% | 7138 91% |
| Color Space (Percent of AdobeRGB 1998) (%) | 61 | 37 -39% | 60 -2% | 60 -2% | 39 -36% | 60 -2% |
| Color Space (Percent of sRGB) (%) | 96 | 59 -39% | 96 0% | 93 -3% | 61 -36% | 95 -1% |
| Moyenne finale (programmes/paramètres) | -105% /
-91% | -19% /
-23% | -21% /
-26% | -82% /
-71% | 3% /
-5% |
* ... Moindre est la valeur, meilleures sont les performances
Temps de réponse de l'écran
| ↔ Temps de réponse noir à blanc | ||
|---|---|---|
| 9 ms ... hausse ↗ et chute ↘ combinées | ↗ 5 ms hausse | 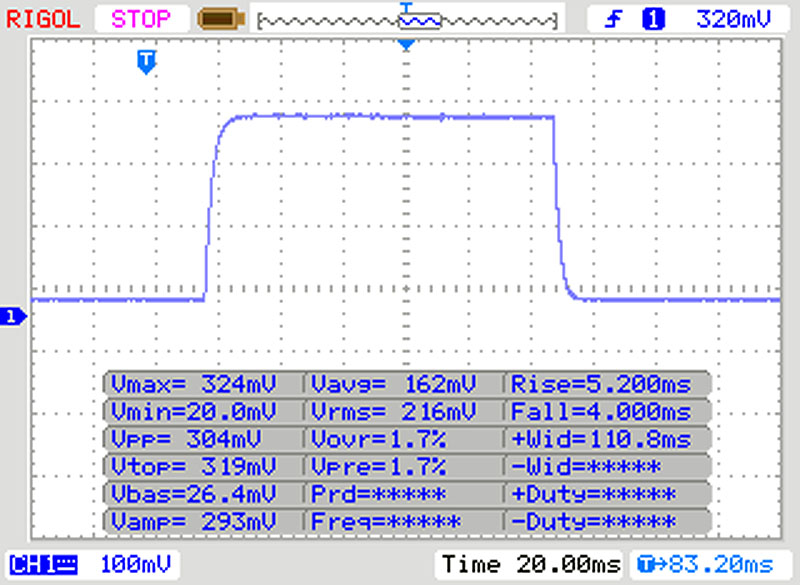 |
| ↘ 4 ms chute | ||
| L'écran montre de faibles temps de réponse, un bon écran pour jouer. En comparaison, tous les appareils testés affichent entre 0.1 (minimum) et 240 (maximum) ms. » 25 % des appareils testés affichent de meilleures performances. Cela signifie que les latences relevées sont meilleures que la moyenne (19.8 ms) de tous les appareils testés. | ||
| ↔ Temps de réponse gris 50% à gris 80% | ||
| 12 ms ... hausse ↗ et chute ↘ combinées | ↗ 6 ms hausse | 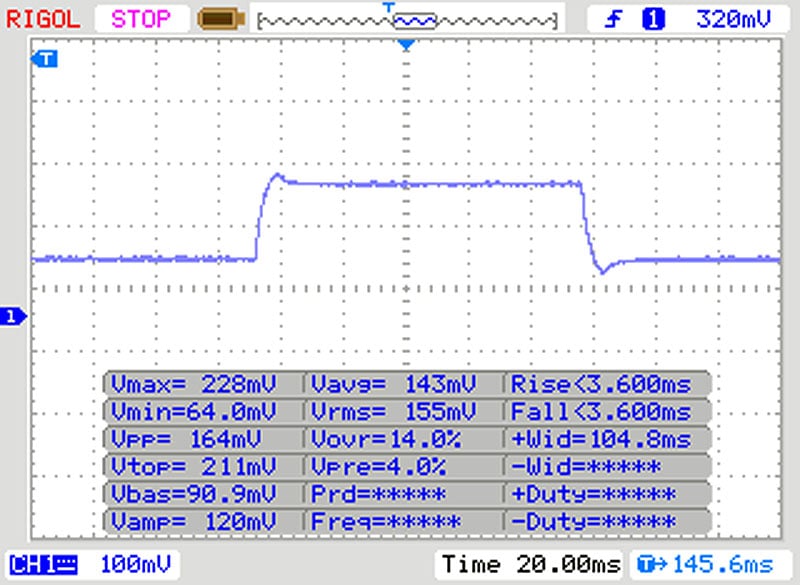 |
| ↘ 6 ms chute | ||
| L'écran montre de bons temps de réponse, mais insuffisant pour du jeu compétitif. En comparaison, tous les appareils testés affichent entre 0.165 (minimum) et 636 (maximum) ms. » 25 % des appareils testés affichent de meilleures performances. Cela signifie que les latences relevées sont meilleures que la moyenne (31 ms) de tous les appareils testés. | ||
Scintillement / MLI (Modulation de largeur d'impulsion)
| Scintillement / MLI (Modulation de largeur d'impulsion) décelé | 208 Hz | ≤ 30 Niveau de luminosité | 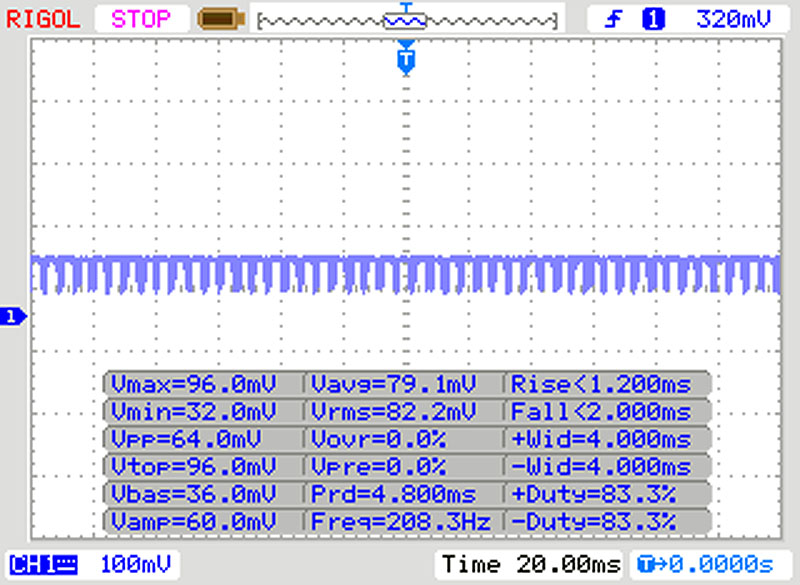 |
Le rétroéclairage de l'écran scintille à la fréquence de 208 Hz (certainement du fait de l'utilisation d'une MDI - Modulation de largeur d'impulsion) à un niveau de luminosité inférieur ou égal à 30 % . Aucun scintillement ne devrait être perceptible au-dessus de cette valeur. La fréquence de rafraîchissement de 208 Hz est relativement faible, les personnes les plus sensibles devraient percevoir un scintillement et être sujettes à une fatigue oculaire accrue (avec le niveau de luminosité indiqué) En comparaison, 52 % des appareils testés n'emploient pas MDI pour assombrir leur écran. Nous avons relevé une moyenne à 7763 (minimum : 5 - maximum : 343500) Hz dans le cas où une MDI était active. | |||

* ... Moindre est la valeur, meilleures sont les performances
| PCMark 8 Home Score Accelerated v2 | 3372 points | |
| PCMark 8 Creative Score Accelerated v2 | 3874 points | |
| PCMark 8 Work Score Accelerated v2 | 5678 points | |
| PCMark 10 Score | 5179 points | |
Aide | ||
| DPC Latencies / LatencyMon - interrupt to process latency (max), Web, Youtube, Prime95 | |
| Asus TUF A17 FA706IU-AS76 | |
| MSI GL75 10SFR | |
| MSI Bravo 17 A4DDR | |
| Acer Nitro 5 AN517-52-77DS | |
* ... Moindre est la valeur, meilleures sont les performances

| MSI GL75 10SFR Lite-On CL1-8D512 | Acer Nitro 5 AN517-52-77DS WDC PC SN530 SDBPNPZ-1T00 | Schenker XMG Neo 17 XNE17M19 Samsung SSD 970 EVO Plus 500GB | Lenovo Legion Y740-17IRHg-81UJ001VGE Samsung SSD PM981 MZVLB1T0HALR | Schenker XMG Neo 17 Samsung SSD 970 EVO Plus 1TB | MSI GL75 9SEK-056US WDC PC SN520 SDAPNUW-512G | MSI GP75 Leopard 9SD Kingston RBUSNS8154P3256GJ1 | MSI Bravo 17 A4DDR Toshiba KBG30ZMV512G | Asus TUF A17 FA706IU-AS76 Intel SSD 660p 1TB SSDPEKNW010T8 | Moyenne Lite-On CL1-8D512 | |
|---|---|---|---|---|---|---|---|---|---|---|
| CrystalDiskMark 5.2 / 6 | 5% | 11% | 21% | 7% | 7% | -45% | -24% | 15% | -16% | |
| Write 4K (MB/s) | 132.2 | 140 6% | 103.2 -22% | 101.2 -23% | 92.7 -30% | 149.1 13% | 105.8 -20% | 94.6 -28% | 189.7 43% | 119 ? -10% |
| Read 4K (MB/s) | 45.62 | 49.04 7% | 42.11 -8% | 44.61 -2% | 41.4 -9% | 48.58 6% | 27.89 -39% | 47.12 3% | 62.3 37% | 35.6 ? -22% |
| Write Seq (MB/s) | 1511 | 1963 30% | 1087 -28% | 2295 52% | 1363 -10% | 270.8 -82% | 850 -44% | 1681 11% | 1099 ? -27% | |
| Read Seq (MB/s) | 1890 | 1455 -23% | 974 -48% | 2174 15% | 1259 -33% | 879 -53% | 1157 -39% | 1608 -15% | 1806 ? -4% | |
| Write 4K Q32T1 (MB/s) | 375.9 | 398.2 6% | 404.7 8% | 401.2 7% | 289.7 -23% | 462 23% | 273.3 -27% | 277.7 -26% | 468.6 25% | 390 ? 4% |
| Read 4K Q32T1 (MB/s) | 525 | 461.9 -12% | 469.8 -11% | 475.5 -9% | 337.5 -36% | 606 15% | 361.2 -31% | 546 4% | 541 3% | 371 ? -29% |
| Write Seq Q32T1 (MB/s) | 1505 | 1969 31% | 3279 118% | 2397 59% | 3332 121% | 1454 -3% | 253 -83% | 908 -40% | 1770 18% | 965 ? -36% |
| Read Seq Q32T1 (MB/s) | 2008 | 1927 -4% | 3513 75% | 3337 66% | 3477 73% | 1724 -14% | 1505 -25% | 1632 -19% | 1898 -5% | 1998 ? 0% |
| Write 4K Q8T8 (MB/s) | 1562 | 1211 | ||||||||
| Read 4K Q8T8 (MB/s) | 1373 | 1104 | ||||||||
| AS SSD | 51% | 119% | 89% | 130% | 49% | -53% | 6% | 30% | -13% | |
| Seq Read (MB/s) | 1923 | 1804 -6% | 2274 18% | 2800 46% | 2359 23% | 1296 -33% | 748 -61% | 1420 -26% | 1320 -31% | 1795 ? -7% |
| Seq Write (MB/s) | 1065 | 1922 80% | 2522 137% | 2424 128% | 2469 132% | 1391 31% | 219 -79% | 922 -13% | 1539 45% | 706 ? -34% |
| 4K Read (MB/s) | 25.43 | 38.21 50% | 49.72 96% | 42.77 68% | 53.5 110% | 29.67 17% | 25.7 1% | 48.51 91% | 56.3 121% | 24.8 ? -2% |
| 4K Write (MB/s) | 101.9 | 105 3% | 118.2 16% | 94.8 -7% | 117.6 15% | 82.4 -19% | 116.8 15% | 158.5 56% | 92.6 ? -9% | |
| 4K-64 Read (MB/s) | 477.9 | 976 104% | 1209 153% | 1406 194% | 1579 230% | 1042 118% | 259.3 -46% | 928 94% | 586 23% | 379 ? -21% |
| 4K-64 Write (MB/s) | 563 | 1150 104% | 2218 294% | 1697 201% | 2048 264% | 1284 128% | 190.2 -66% | 345.4 -39% | 820 46% | 472 ? -16% |
| Access Time Read * (ms) | 0.053 | 0.055 -4% | 0.05 6% | 0.048 9% | 0.108 -104% | 0.159 -200% | 0.089 -68% | 0.043 19% | 0.069 ? -30% | |
| Access Time Write * (ms) | 0.126 | 0.045 64% | 0.031 75% | 0.039 69% | 0.03 76% | 0.031 75% | 0.058 54% | 0.189 -50% | 0.113 10% | 0.134 ? -6% |
| Score Read (Points) | 696 | 1194 72% | 1486 114% | 1729 148% | 1869 169% | 1201 73% | 360 -48% | 1119 61% | 775 11% | 584 ? -16% |
| Score Write (Points) | 771 | 1747 127% | 2588 236% | 2034 164% | 2413 213% | 1542 100% | 294 -62% | 554 -28% | 1132 47% | 635 ? -18% |
| Score Total (Points) | 1785 | 3563 100% | 4855 172% | 4630 159% | 5248 194% | 3363 88% | 821 -54% | 2232 25% | 2333 31% | 1469 ? -18% |
| Copy ISO MB/s (MB/s) | 1710 | 1305 -24% | 2148 26% | 1736 2% | 1710 ? 0% | |||||
| Copy Program MB/s (MB/s) | 465.3 | 467.5 0% | 582 25% | 553 19% | 465 ? 0% | |||||
| Copy Game MB/s (MB/s) | 1042 | 872 -16% | 1278 23% | 1264 21% | 1042 ? 0% | |||||
| Moyenne finale (programmes/paramètres) | 28% /
33% | 65% /
73% | 55% /
64% | 69% /
78% | 28% /
33% | -49% /
-49% | -9% /
-7% | 23% /
24% | -15% /
-14% |
* ... Moindre est la valeur, meilleures sont les performances
Continuous load read: DiskSpd Read Loop, Queue Depth 8
| 3DMark 11 Performance | 21006 points | |
| 3DMark Cloud Gate Standard Score | 36210 points | |
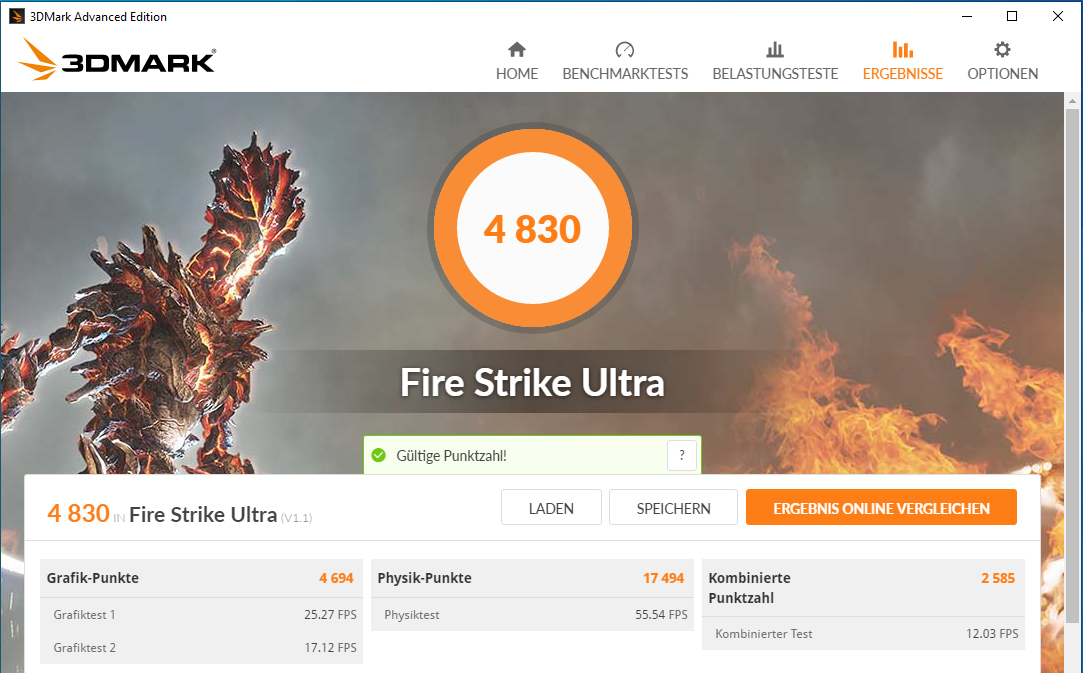
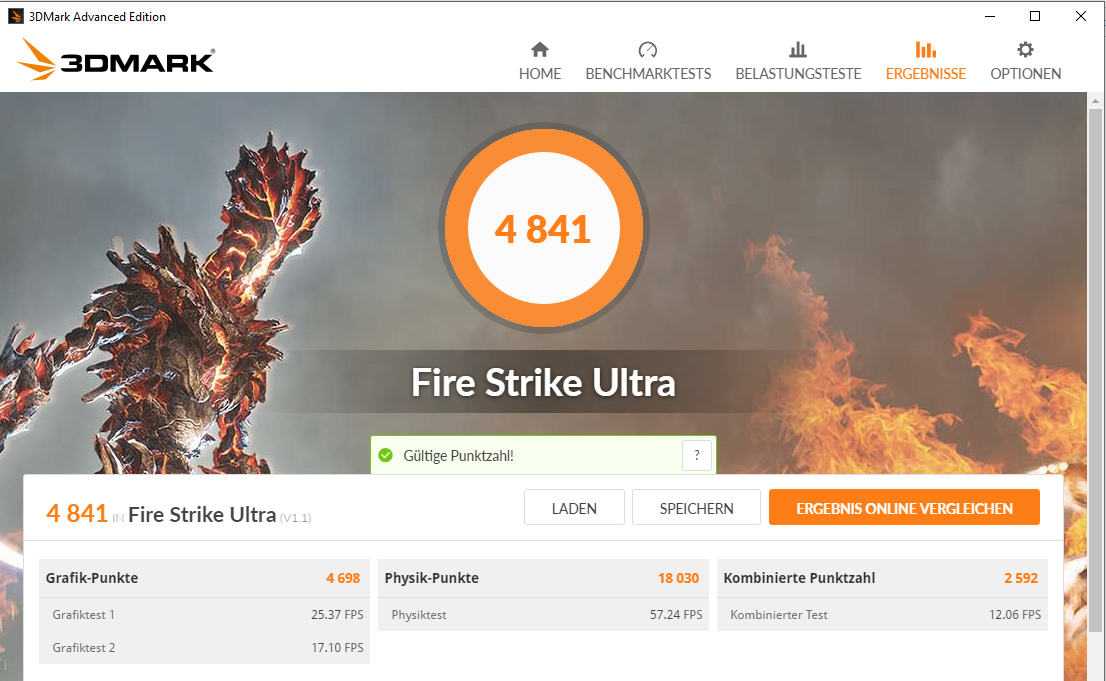
| 3DMark Fire Strike Score | 17529 points | |
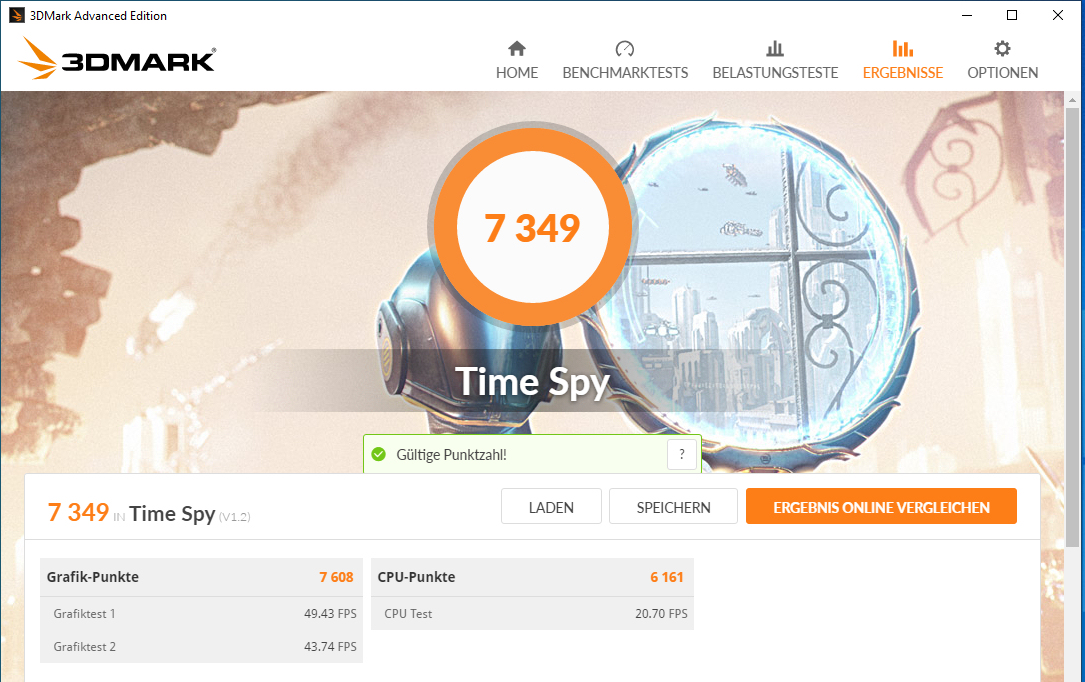
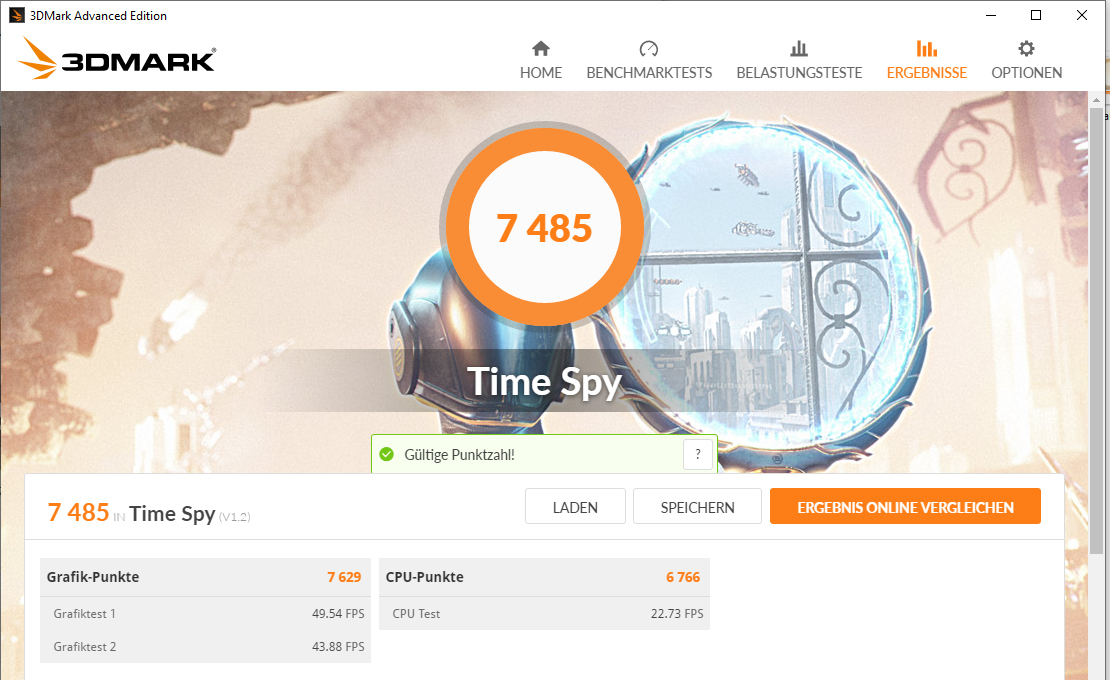
| 3DMark Time Spy Score | 7349 points | |
Aide | ||
| BioShock Infinite - 1920x1080 Ultra Preset, DX11 (DDOF) | |
| Moyenne NVIDIA GeForce RTX 2070 Mobile (136.9 - 187.8, n=9) | |
| Lenovo Legion Y740-17IRHg-81UJ001VGE | |
| MSI GL75 10SFR | |
| MSI GP75 Leopard 9SD | |
| Acer Nitro 5 AN517-52-77DS | |
| Shadow of the Tomb Raider - 1920x1080 Highest Preset AA:T | |
| Moyenne de la classe Gaming (96 - 116, n=2, 2 dernières années) | |
| MSI GL75 10SFR | |
| Moyenne NVIDIA GeForce RTX 2070 Mobile (74.2 - 97, n=11) | |
| MSI GL75 9SEK-056US | |
| Asus TUF A17 FA706IU-AS76 | |
| Acer Nitro 5 AN517-52-77DS | |
| MSI Bravo 17 A4DDR | |
| Total War: Three Kingdoms - 1920x1080 Ultra (incl textures) | |
| MSI GL75 10SFR | |
| Moyenne NVIDIA GeForce RTX 2070 Mobile (n=1) | |
| Acer Nitro 5 AN517-52-77DS | |
| Red Dead Redemption 2 - 1920x1080 Maximum Settings | |
| MSI GL75 10SFR | |
| Moyenne NVIDIA GeForce RTX 2070 Mobile (42.4 - 43, n=3) | |
| Acer Nitro 5 AN517-52-77DS | |
| Doom Eternal - 1920x1080 Ultra Preset | |
| Moyenne NVIDIA GeForce RTX 2070 Mobile (145.1 - 157, n=3) | |
| MSI GL75 10SFR | |
| Acer Nitro 5 AN517-52-77DS | |
| MSI Bravo 17 A4DDR | |
| Bas | Moyen | Élevé | Ultra | |
|---|---|---|---|---|
| BioShock Infinite (2013) | 332.8 | 294.5 | 276.3 | 163.7 |
| The Witcher 3 (2015) | 286.3 | 226.7 | 147.1 | 79.9 |
| Dota 2 Reborn (2015) | 147.2 | 129.4 | 121.8 | 115 |
| X-Plane 11.11 (2018) | 107 | 92.3 | 79.6 | |
| Shadow of the Tomb Raider (2018) | 118 | 104 | 100 | 93 |
| Total War: Three Kingdoms (2019) | 232.7 | 129.9 | 88.5 | 63.1 |
| Red Dead Redemption 2 (2019) | 127.9 | 97.5 | 66.4 | 43 |
| Hunt Showdown (2020) | 184.2 | 124 | 101.7 | |
| Doom Eternal (2020) | 217.6 | 162 | 148.9 | 145.1 |
| Gears Tactics (2020) | 226.5 | 169.9 | 115.2 | 90.9 |
| F1 2020 (2020) | 230 | 177 | 148 | 115 |
| Death Stranding (2020) | 149.3 | 126 | 114.6 | 112 |
Degré de la nuisance sonore
| Au repos |
| 32.2 / 32.2 / 32.2 dB(A) |
| Fortement sollicité |
| 52.8 / 53.2 dB(A) |
 | ||
30 dB silencieux 40 dB(A) audible 50 dB(A) bruyant |
||
min: | ||
| MSI GL75 10SFR i7-10750H, GeForce RTX 2070 Mobile | Acer Nitro 5 AN517-52-77DS i7-10750H, GeForce RTX 2060 Mobile | Schenker XMG Neo 17 XNE17M19 i7-9750H, GeForce RTX 2060 Mobile | Lenovo Legion Y740-17IRHg-81UJ001VGE i7-9750H, GeForce RTX 2080 Max-Q | MSI GL75 9SEK-056US i7-9750H, GeForce RTX 2060 Mobile | MSI GP75 Leopard 9SD i7-9750H, GeForce GTX 1660 Ti Mobile | Moyenne NVIDIA GeForce RTX 2070 Mobile | Moyenne de la classe Gaming | |
|---|---|---|---|---|---|---|---|---|
| Noise | 10% | 5% | 12% | 6% | -1% | 2% | 13% | |
| arrêt / environnement * (dB) | 30.1 | 30.2 -0% | 31 -3% | 30.3 -1% | 28.1 7% | 29 4% | 28.8 ? 4% | 24.1 ? 20% |
| Idle Minimum * (dB) | 32.2 | 30.2 6% | 31 4% | 30.3 6% | 30.9 4% | 29 10% | 30.4 ? 6% | 25.9 ? 20% |
| Idle Average * (dB) | 32.2 | 30.2 6% | 33 -2% | 30.3 6% | 30.9 4% | 34 -6% | 31.7 ? 2% | 27.4 ? 15% |
| Idle Maximum * (dB) | 32.2 | 30.2 6% | 35 -9% | 30.5 5% | 31 4% | 37 -15% | 34.9 ? -8% | 29.9 ? 7% |
| Load Average * (dB) | 52.8 | 41.5 21% | 43 19% | 40.8 23% | 39 26% | 53 -0% | 46.8 ? 11% | 43.3 ? 18% |
| Witcher 3 ultra * (dB) | 53.8 | 44.5 17% | 45 16% | 40.5 25% | 53.5 1% | 51 5% | ||
| Load Maximum * (dB) | 53.2 | 44.6 16% | 47 12% | 40.8 23% | 53.5 -1% | 55 -3% | 55.8 ? -5% | 54.2 ? -2% |
* ... Moindre est la valeur, meilleures sont les performances
(±) La température maximale du côté supérieur est de 44 °C / 111 F, par rapport à la moyenne de 40.4 °C / 105 F, allant de 21.2 à 68.8 °C pour la classe Gaming.
(±) Le fond chauffe jusqu'à un maximum de 42.5 °C / 109 F, contre une moyenne de 43.2 °C / 110 F
(+) En utilisation inactive, la température moyenne du côté supérieur est de 27.4 °C / 81 F, par rapport à la moyenne du dispositif de 33.9 °C / 93 F.
(±) En jouant à The Witcher 3, la température moyenne du côté supérieur est de 36.4 °C / 98 F, alors que la moyenne de l'appareil est de 33.9 °C / 93 F.
(+) Les repose-poignets et le pavé tactile atteignent la température maximale de la peau (33.3 °C / 91.9 F) et ne sont donc pas chauds.
(-) La température moyenne de la zone de l'appui-paume de dispositifs similaires était de 28.8 °C / 83.8 F (-4.5 °C / #-8.1 F).
| MSI GL75 10SFR i7-10750H, GeForce RTX 2070 Mobile | Acer Nitro 5 AN517-52-77DS i7-10750H, GeForce RTX 2060 Mobile | Schenker XMG Neo 17 XNE17M19 i7-9750H, GeForce RTX 2060 Mobile | Lenovo Legion Y740-17IRHg-81UJ001VGE i7-9750H, GeForce RTX 2080 Max-Q | MSI GL75 9SEK-056US i7-9750H, GeForce RTX 2060 Mobile | MSI GP75 Leopard 9SD i7-9750H, GeForce GTX 1660 Ti Mobile | Moyenne NVIDIA GeForce RTX 2070 Mobile | Moyenne de la classe Gaming | |
|---|---|---|---|---|---|---|---|---|
| Heat | -7% | -4% | -4% | -27% | -3% | -14% | -10% | |
| Maximum Upper Side * (°C) | 44 | 50.6 -15% | 48 -9% | 40.7 7% | 49.4 -12% | 45 -2% | 47.1 ? -7% | 45.2 ? -3% |
| Maximum Bottom * (°C) | 42.5 | 53.8 -27% | 54 -27% | 42.2 1% | 50.6 -19% | 42 1% | 51 ? -20% | 48.2 ? -13% |
| Idle Upper Side * (°C) | 29.1 | 26.6 9% | 26 11% | 31.9 -10% | 39 -34% | 30 -3% | 31.8 ? -9% | 31 ? -7% |
| Idle Bottom * (°C) | 29.5 | 27.8 6% | 27 8% | 33.9 -15% | 42 -42% | 32 -8% | 34.8 ? -18% | 34.3 ? -16% |
* ... Moindre est la valeur, meilleures sont les performances
MSI GL75 10SFR analyse audio
(±) | le niveau sonore du haut-parleur est moyen mais bon (75.6# dB)
Basses 100 - 315 Hz
(-) | presque aucune basse - en moyenne 20.3% plus bas que la médiane
(±) | la linéarité des basses est moyenne (13.1% delta à la fréquence précédente)
Médiums 400 - 2000 Hz
(+) | médiane équilibrée - seulement 1.9% de la médiane
(±) | la linéarité des médiums est moyenne (7% delta à la fréquence précédente)
Aiguës 2 - 16 kHz
(+) | des sommets équilibrés - à seulement 2.3% de la médiane
(+) | les aigus sont linéaires (3.7% delta à la fréquence précédente)
Globalement 100 - 16 000 Hz
(+) | le son global est linéaire (13.9% différence à la médiane)
Par rapport à la même classe
» 22% de tous les appareils testés de cette catégorie étaient meilleurs, 7% similaires, 71% pires
» Le meilleur avait un delta de 6%, la moyenne était de 18%, le pire était de 132%.
Par rapport à tous les appareils testés
» 16% de tous les appareils testés étaient meilleurs, 4% similaires, 80% pires
» Le meilleur avait un delta de 4%, la moyenne était de 23%, le pire était de 134%.
| Éteint/en veille | |
| Au repos | |
| Fortement sollicité |
|
Légende:
min: | |
| MSI GL75 10SFR i7-10750H, GeForce RTX 2070 Mobile | Acer Nitro 5 AN517-52-77DS i7-10750H, GeForce RTX 2060 Mobile | Schenker XMG Neo 17 XNE17M19 i7-9750H, GeForce RTX 2060 Mobile | Lenovo Legion Y740-17IRHg-81UJ001VGE i7-9750H, GeForce RTX 2080 Max-Q | MSI GL75 9SEK-056US i7-9750H, GeForce RTX 2060 Mobile | MSI GP75 Leopard 9SD i7-9750H, GeForce GTX 1660 Ti Mobile | Moyenne NVIDIA GeForce RTX 2070 Mobile | Moyenne de la classe Gaming | |
|---|---|---|---|---|---|---|---|---|
| Power Consumption | 34% | 14% | -18% | 15% | 11% | -42% | -9% | |
| Idle Minimum * (Watt) | 12 | 5.4 55% | 11 8% | 15.7 -31% | 10.7 11% | 10 17% | 21.4 ? -78% | 12.8 ? -7% |
| Idle Average * (Watt) | 16.6 | 9.8 41% | 14 16% | 26.3 -58% | 15.2 8% | 15 10% | 26.3 ? -58% | 18.5 ? -11% |
| Idle Maximum * (Watt) | 18 | 10.9 39% | 20 -11% | 28 -56% | 17.8 1% | 22 -22% | 32.2 ? -79% | 24 ? -33% |
| Load Average * (Watt) | 130 | 104 20% | 100 23% | 136 -5% | 88.2 32% | 92 29% | 114.8 ? 12% | 108.2 ? 17% |
| Witcher 3 ultra * (Watt) | 203 | 134.3 34% | 151 26% | 160 21% | 147.8 27% | 153 25% | ||
| Load Maximum * (Watt) | 224 | 193 14% | 174 22% | 177 21% | 206.5 8% | 216 4% | 238 ? -6% | 254 ? -13% |
* ... Moindre est la valeur, meilleures sont les performances
| MSI GL75 10SFR i7-10750H, GeForce RTX 2070 Mobile, 51 Wh | Acer Nitro 5 AN517-52-77DS i7-10750H, GeForce RTX 2060 Mobile, 57.48 Wh | Schenker XMG Neo 17 XNE17M19 i7-9750H, GeForce RTX 2060 Mobile, 46 Wh | Lenovo Legion Y740-17IRHg-81UJ001VGE i7-9750H, GeForce RTX 2080 Max-Q, 76 Wh | MSI GL75 9SEK-056US i7-9750H, GeForce RTX 2060 Mobile, 51 Wh | MSI GP75 Leopard 9SD i7-9750H, GeForce GTX 1660 Ti Mobile, 51 Wh | Moyenne de la classe Gaming | |
|---|---|---|---|---|---|---|---|
| Autonomie de la batterie | 83% | 17% | -15% | 19% | -23% | 70% | |
| Reader / Idle (h) | 6.4 | 11 72% | 6.7 5% | 3.8 -41% | 7.9 23% | 4.8 -25% | 8.71 ? 36% |
| H.264 (h) | 5.2 | 7.3 40% | 2.8 -46% | 8.9 ? 71% | |||
| WiFi v1.3 (h) | 3.9 | 6.6 69% | 4.7 21% | 3 -23% | 4.2 8% | 3.2 -18% | 7.09 ? 82% |
| Load (h) | 0.8 | 2 150% | 1 25% | 1.2 50% | 1 25% | 0.6 -25% | 1.51 ? 89% |
Points positifs
Points négatifs
Le MSI GL75 fait ce pour quoi il a été conçu, et fait tourner fluidement tous les jeux récents. Aucun compromis de résolution ou de qualité ne sont à déplorer. La combinaison d'un processeur hexacœur Core i7-10750H et d'une carte graphique GeForce RTX 2070 rend cela possible.
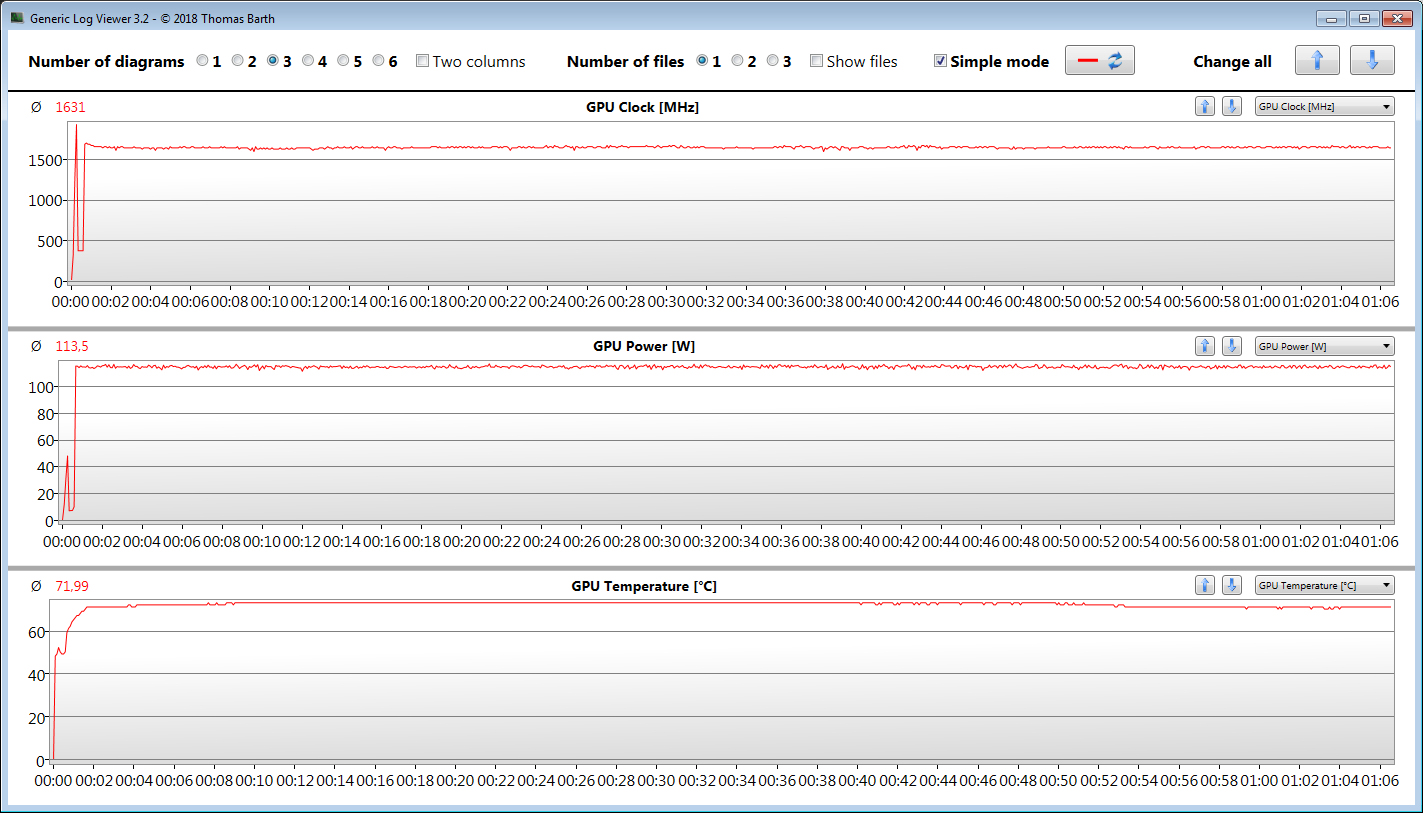
Mais ces composants puissants doivent être refroidis : les deux ventilateurs tournent rapidement et bruyamment en cas de sollicitations. Cela permet au châssis de ne pas trop chauffer.
Avec le GL75 Leopard10SFR-221, MSI propose un PC portable de jeu équilibré, à un prix raisonnable.
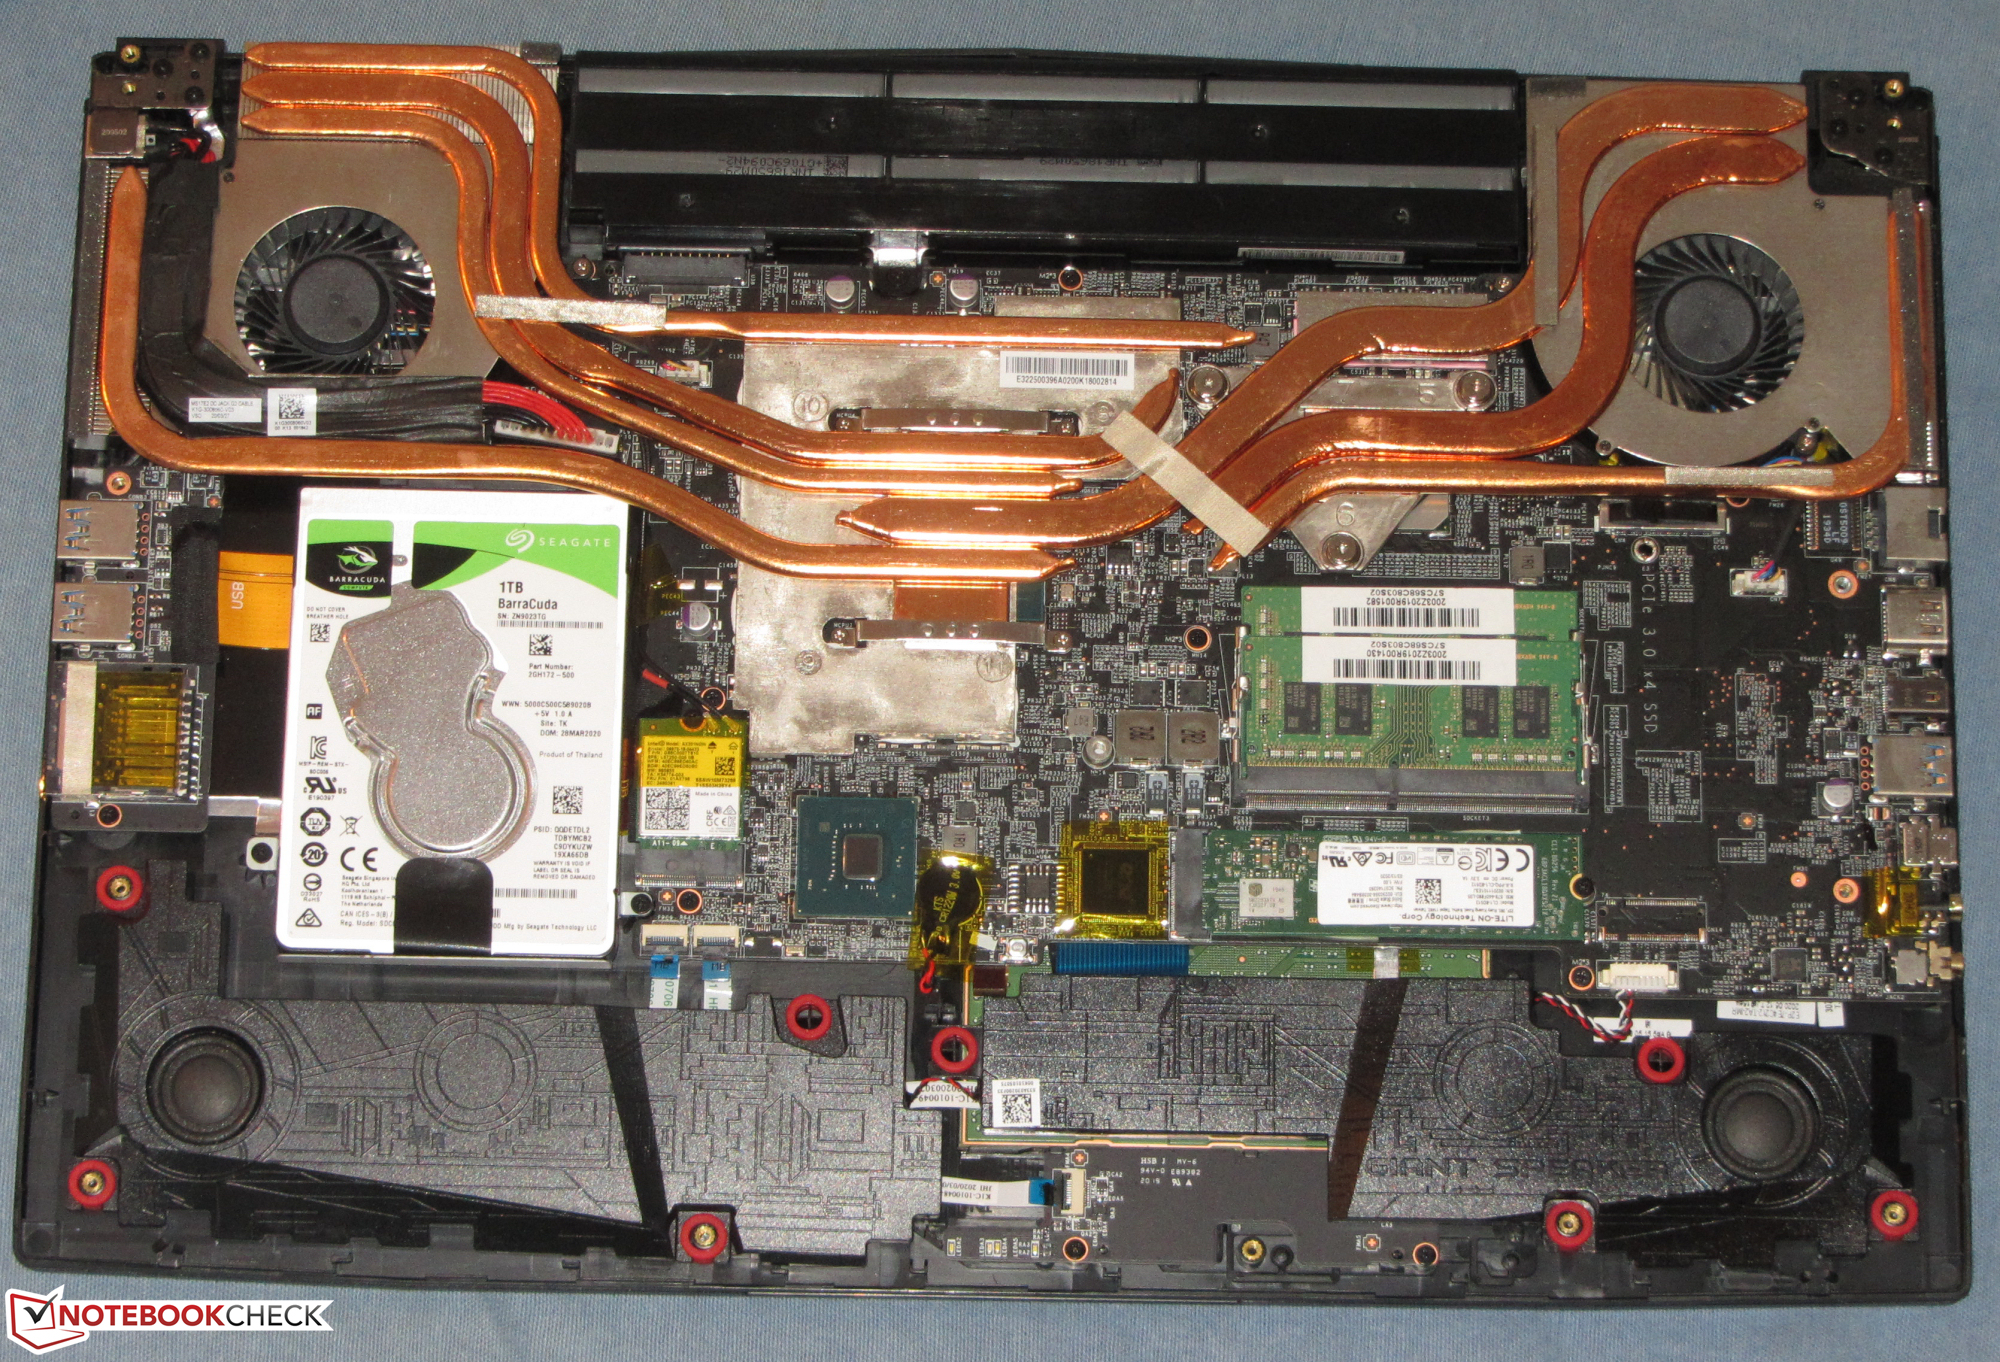
Le PC portable possède un SSD NVMe rapide, de 512 Go. Un portable de jeu n'ayant jamais trop de stockage, MSI inclut également un disque dur de 1 To (7200 tr/min.). Les deux disques peuvent être changés, mais uniquement en retirant toute la coque inférieure.
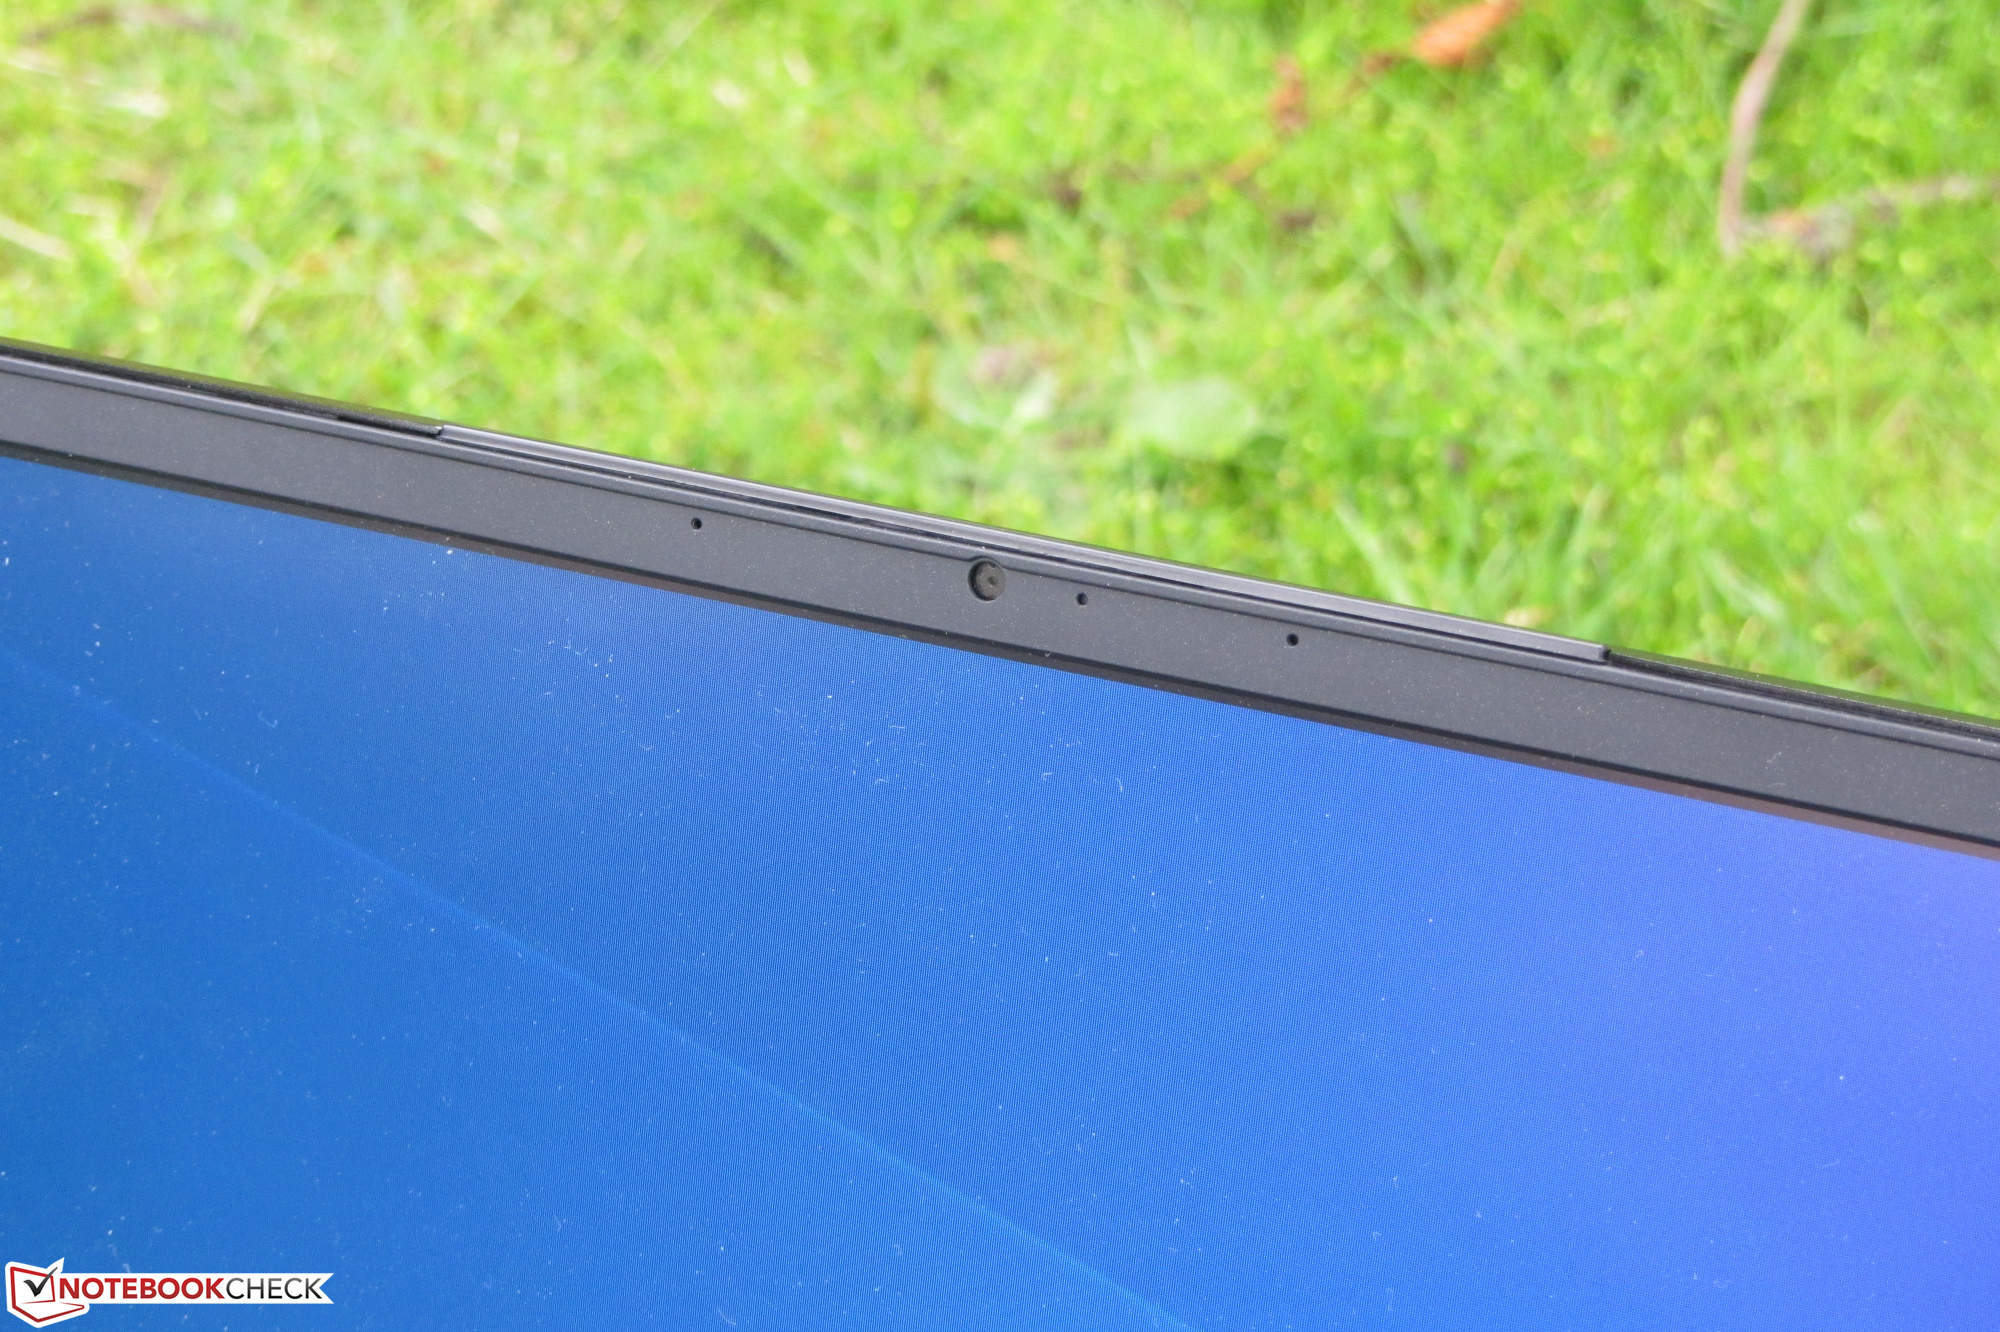
L'écran mat IPS Full HD de 144 Hz marque des points avec ses angles de vision, sa luminosité, son contraste, ses temps de réponse et ses couleurs fidèles. La couverture colorimétrique est bonne.
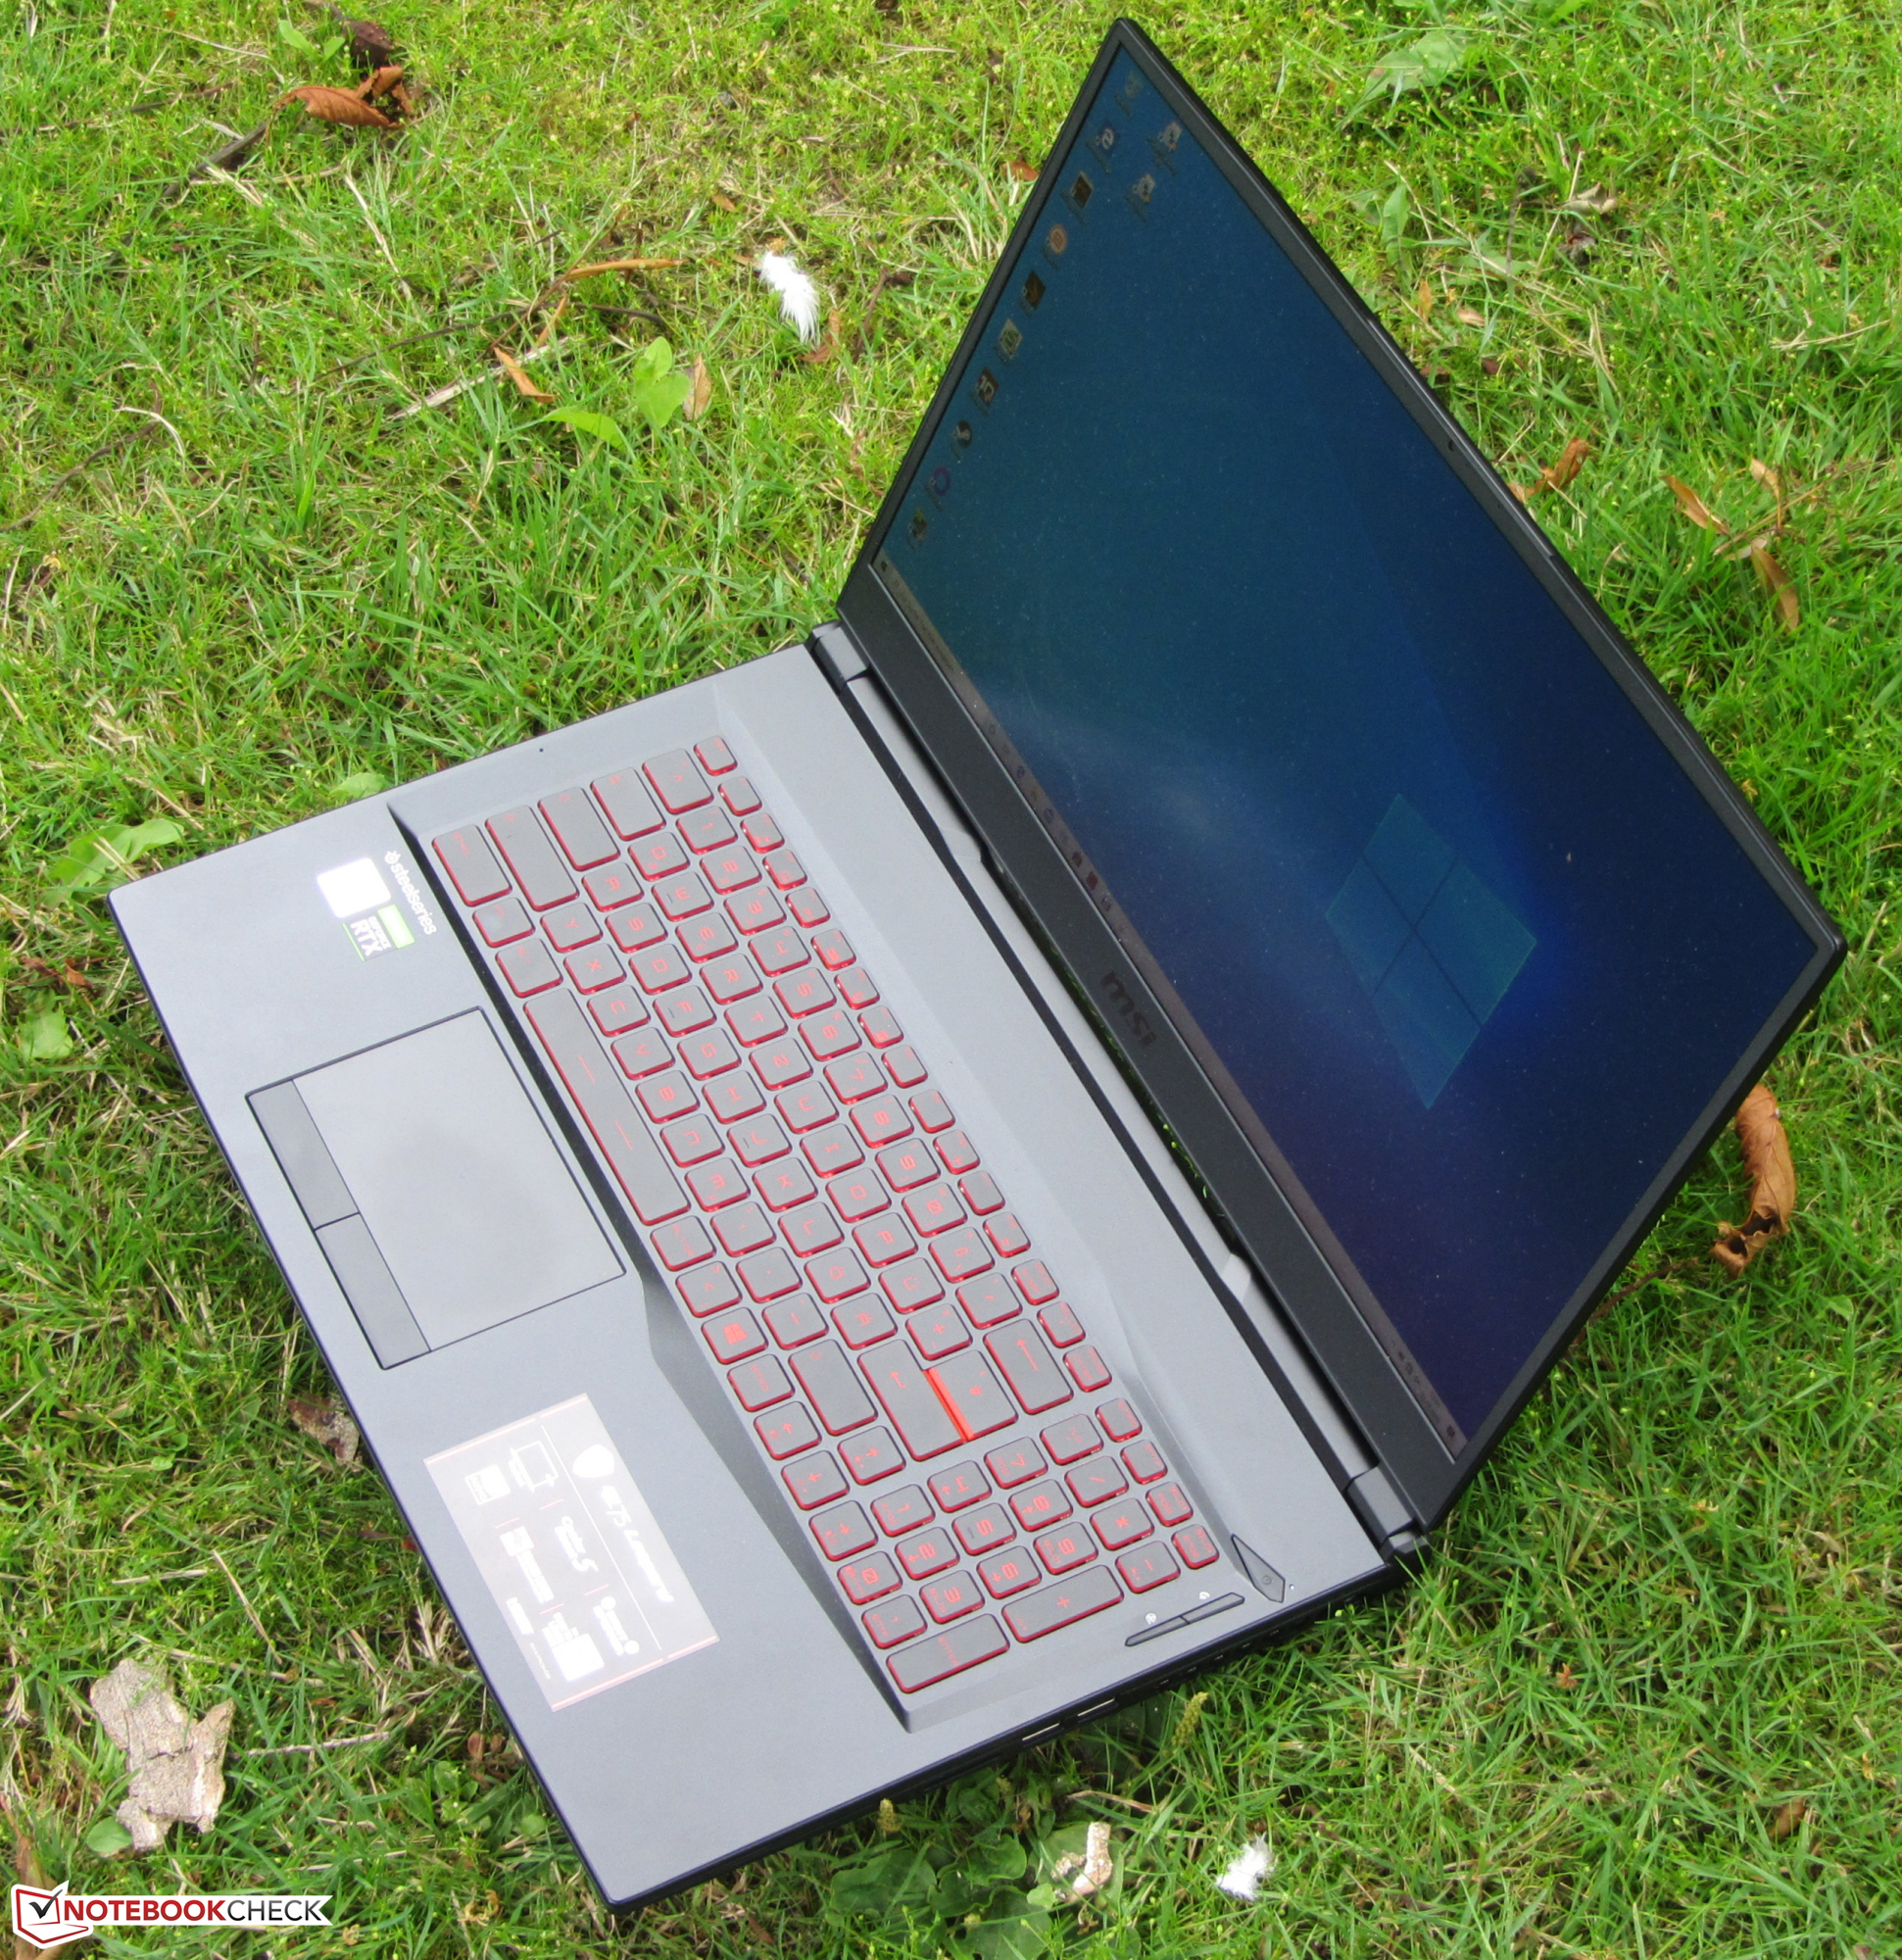
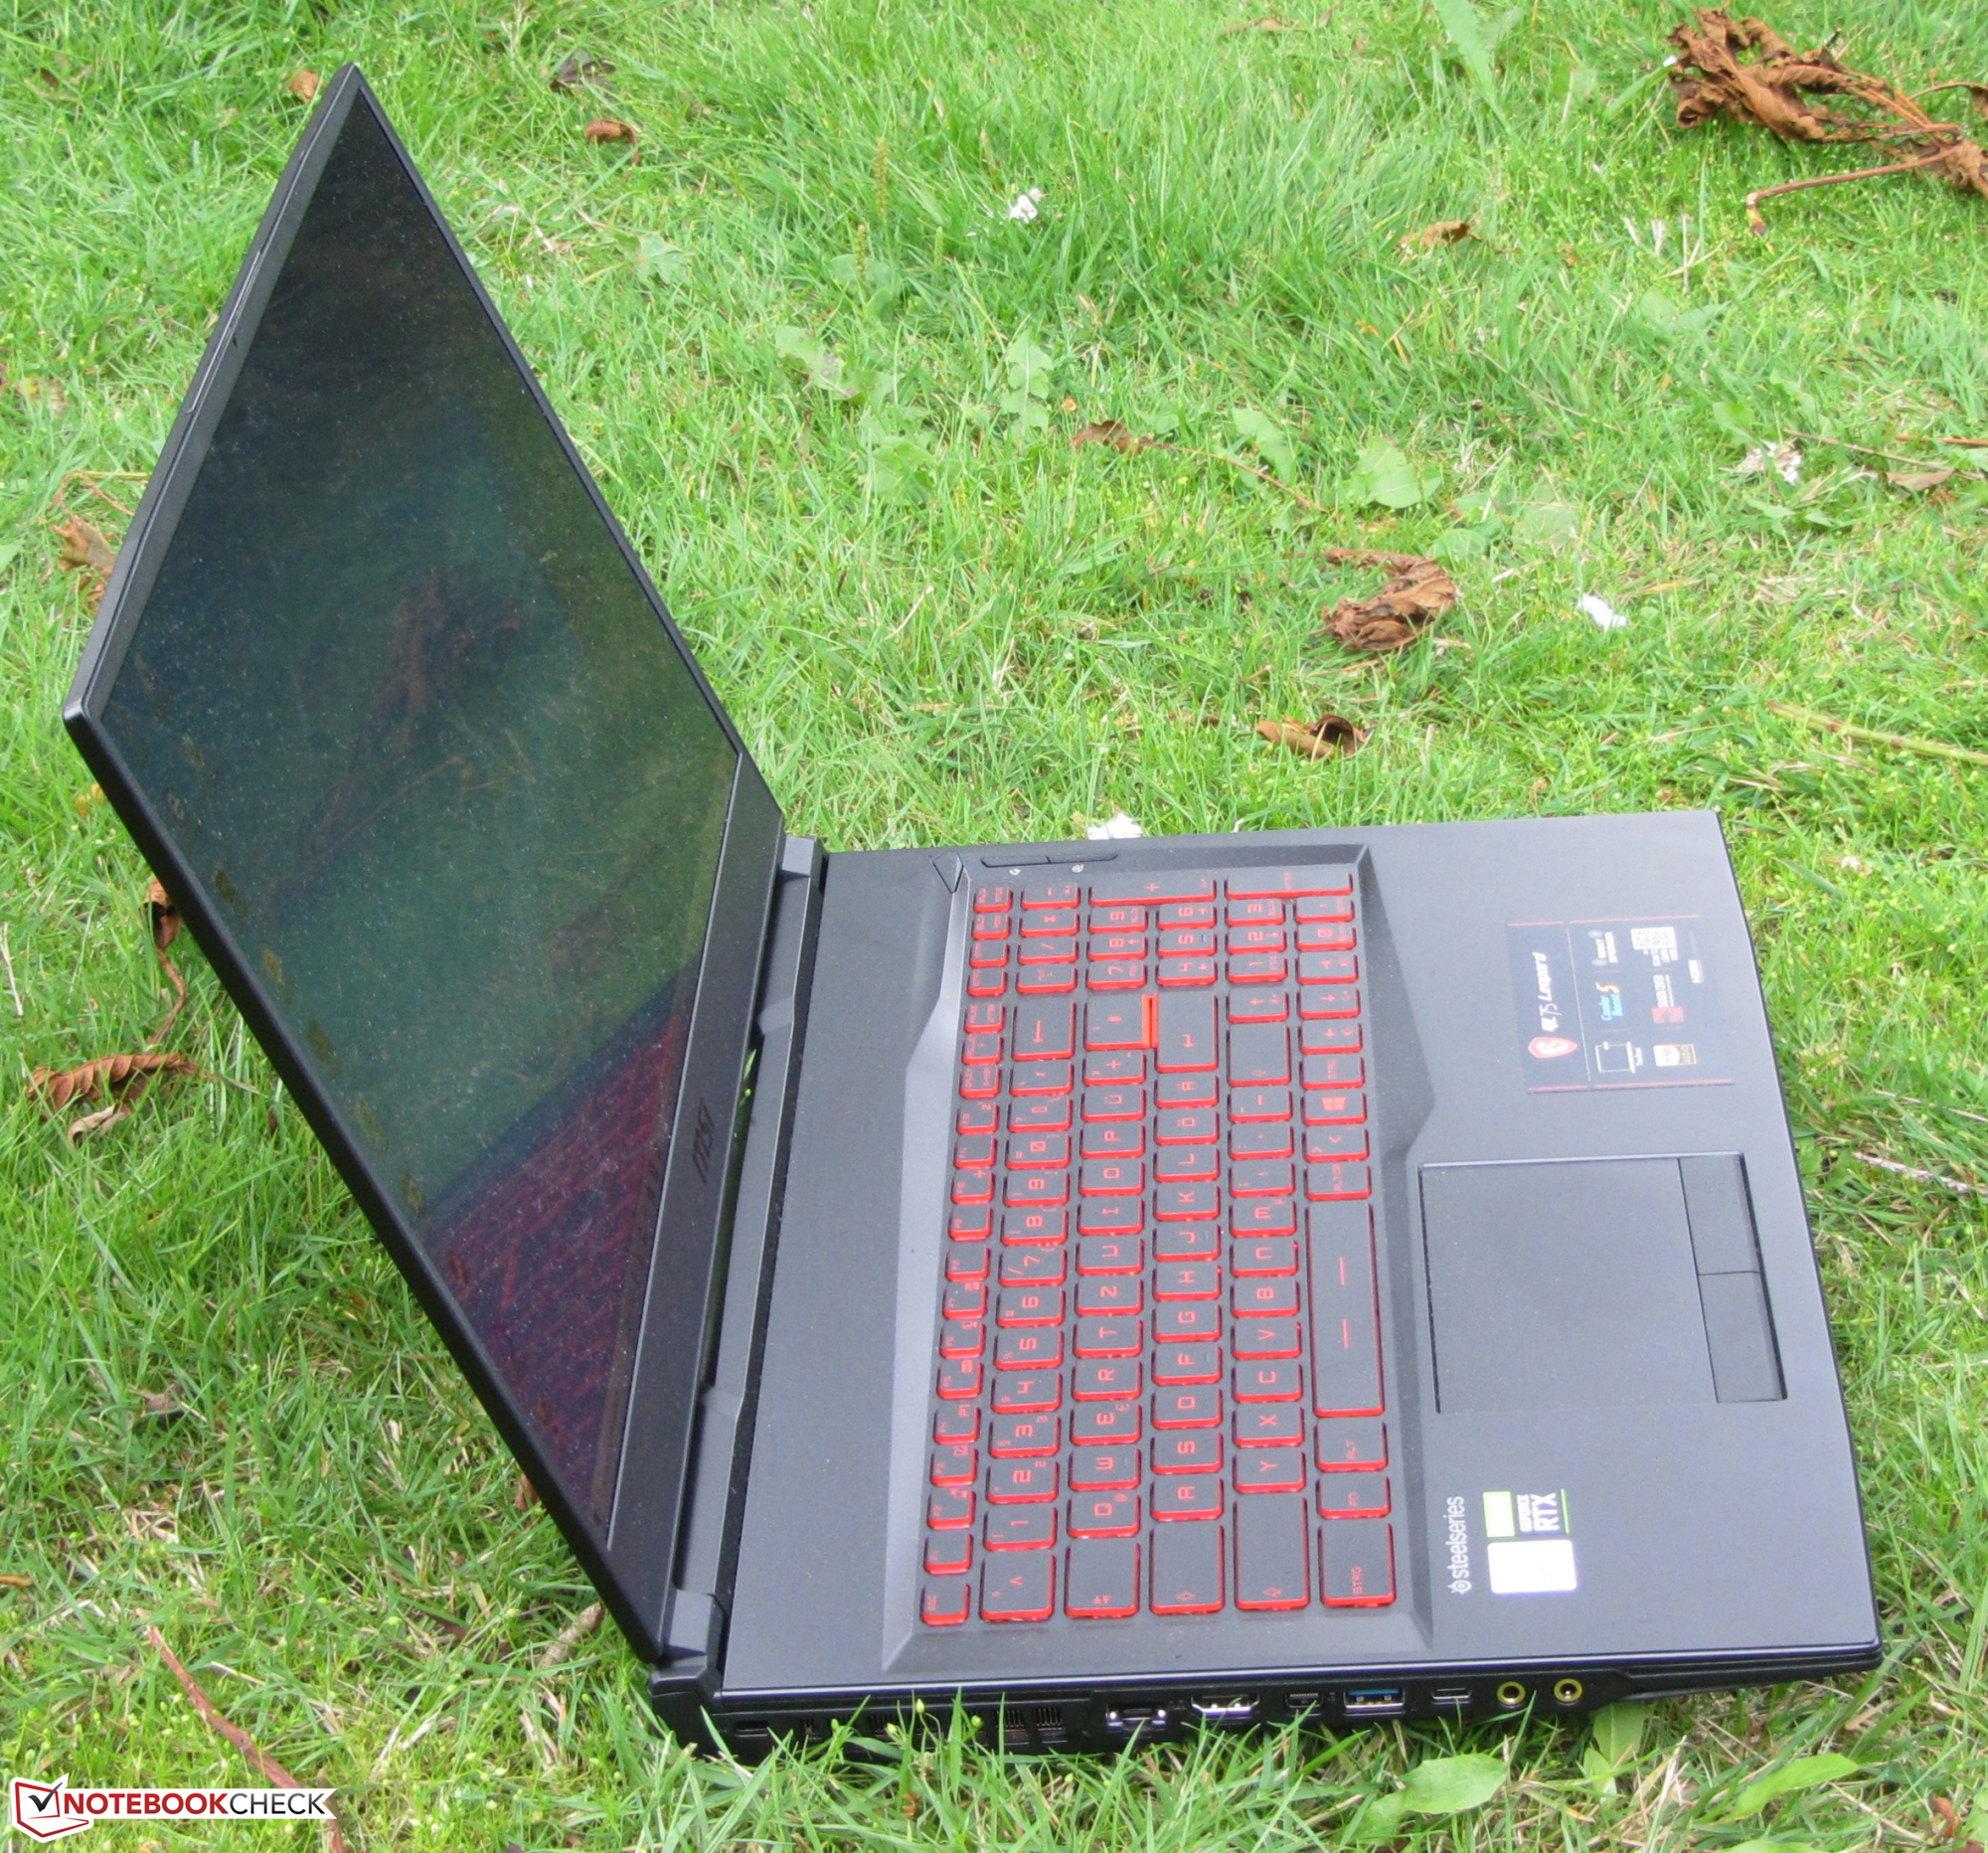
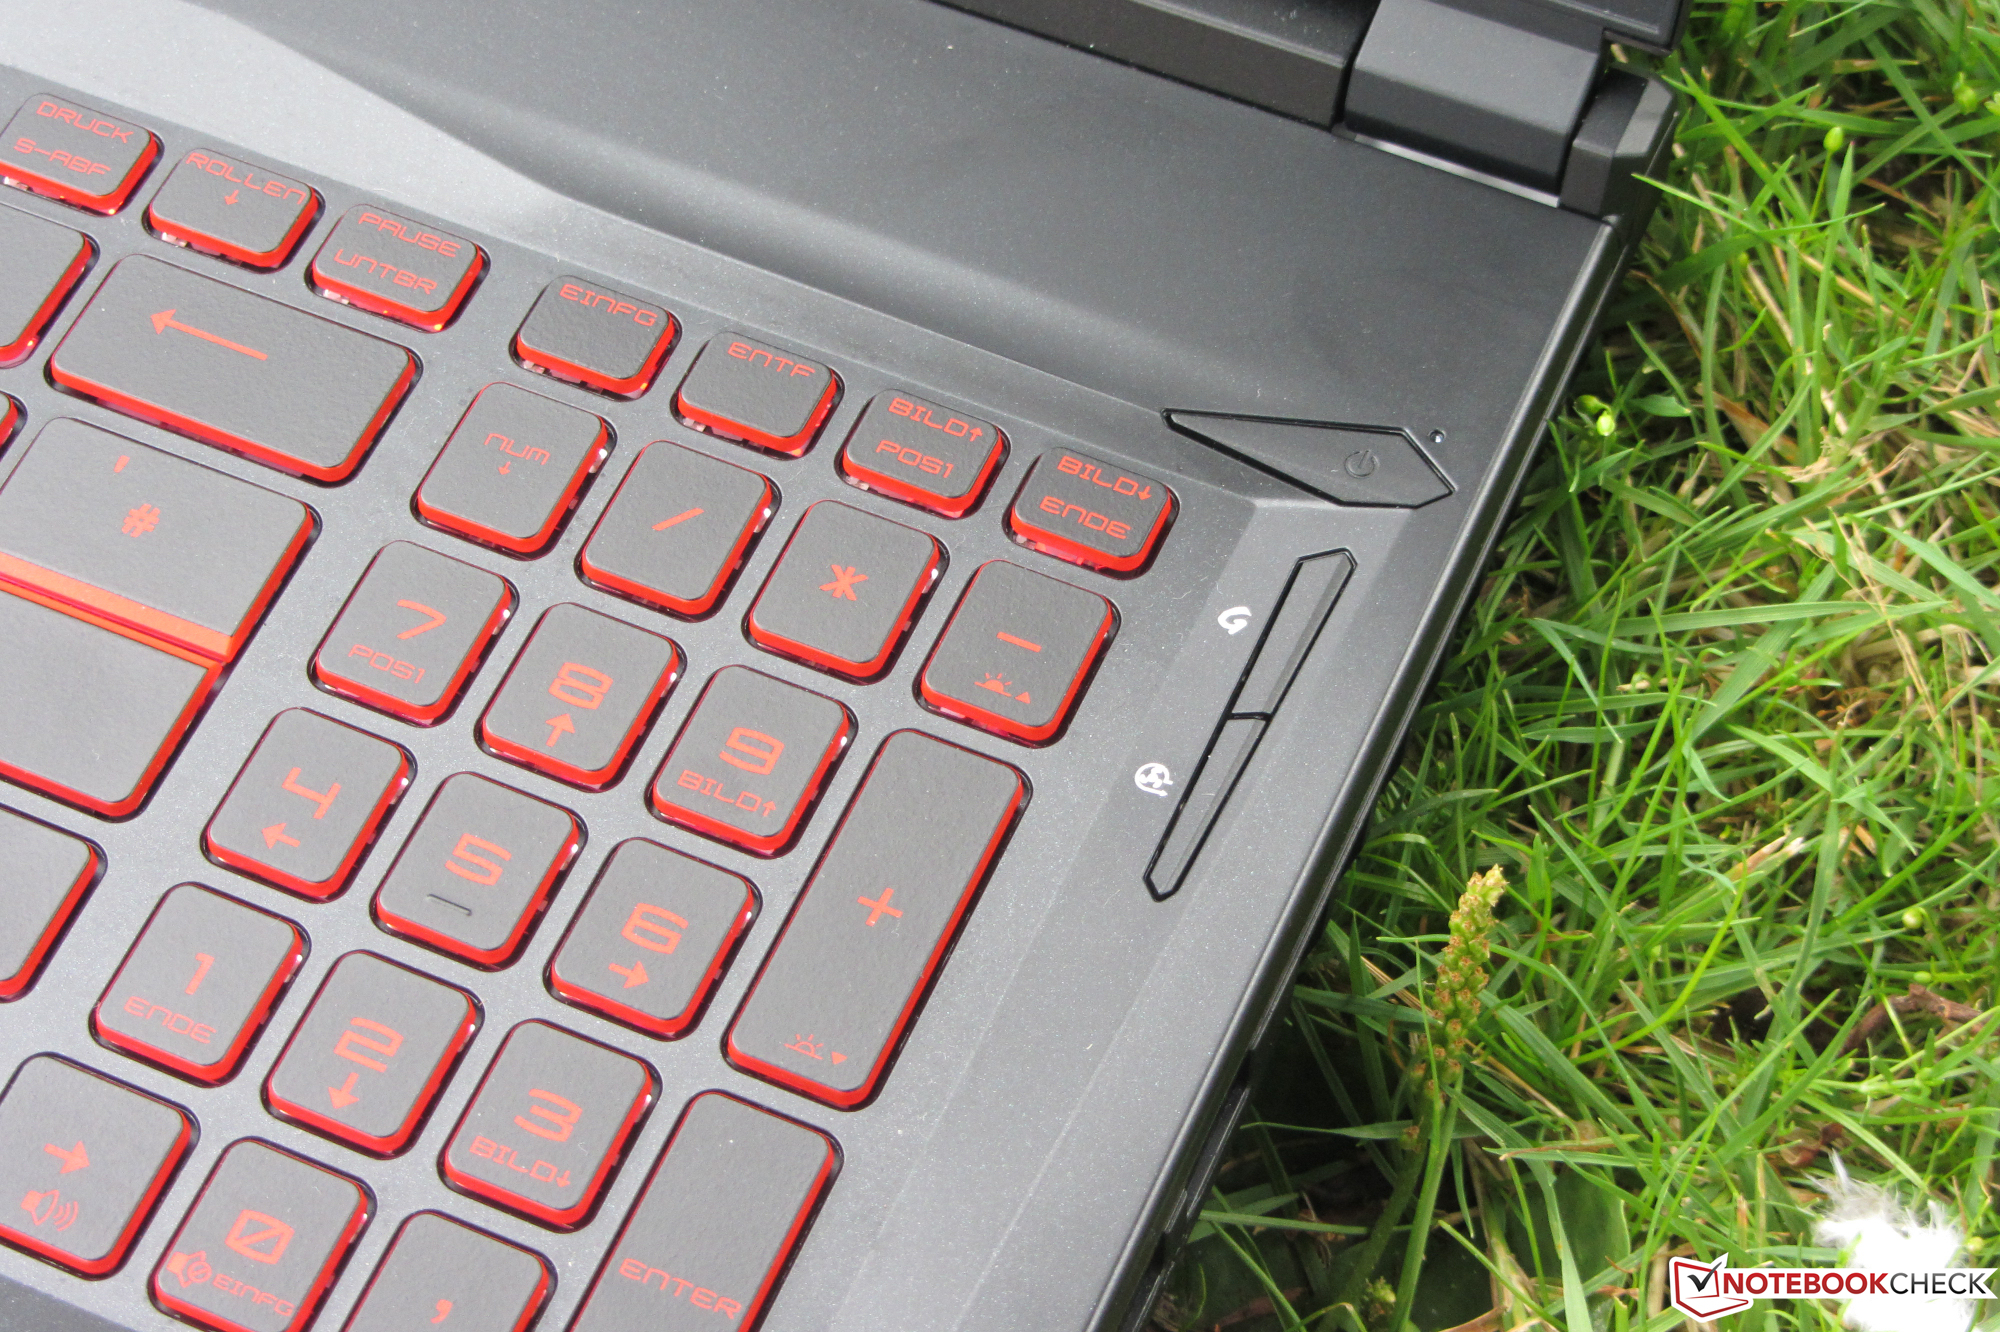
L'autonomie ne bat pas des records, mais suffit pour un portable de jeu. Le clavier rétroéclairé convient à une utilisation quotidienne, même s'il n'est pas RVB comme son prédécesseur l'était, ainsi que son alter-ego, mais possède une teinte rouge. L'appareil ne possède pas non plus de port Thunderbolt 3. MSI n'a intégré qu'un port USB C 3.2 Gen 2 sans DisplayPort via USB C ni Power Delivery.
L’intégralité de cette critique est disponible en anglais en suivant ce lien.
MSI GL75 10SFR
- 07/31/2020 v7 (old)
Sascha Mölck
Price comparison
