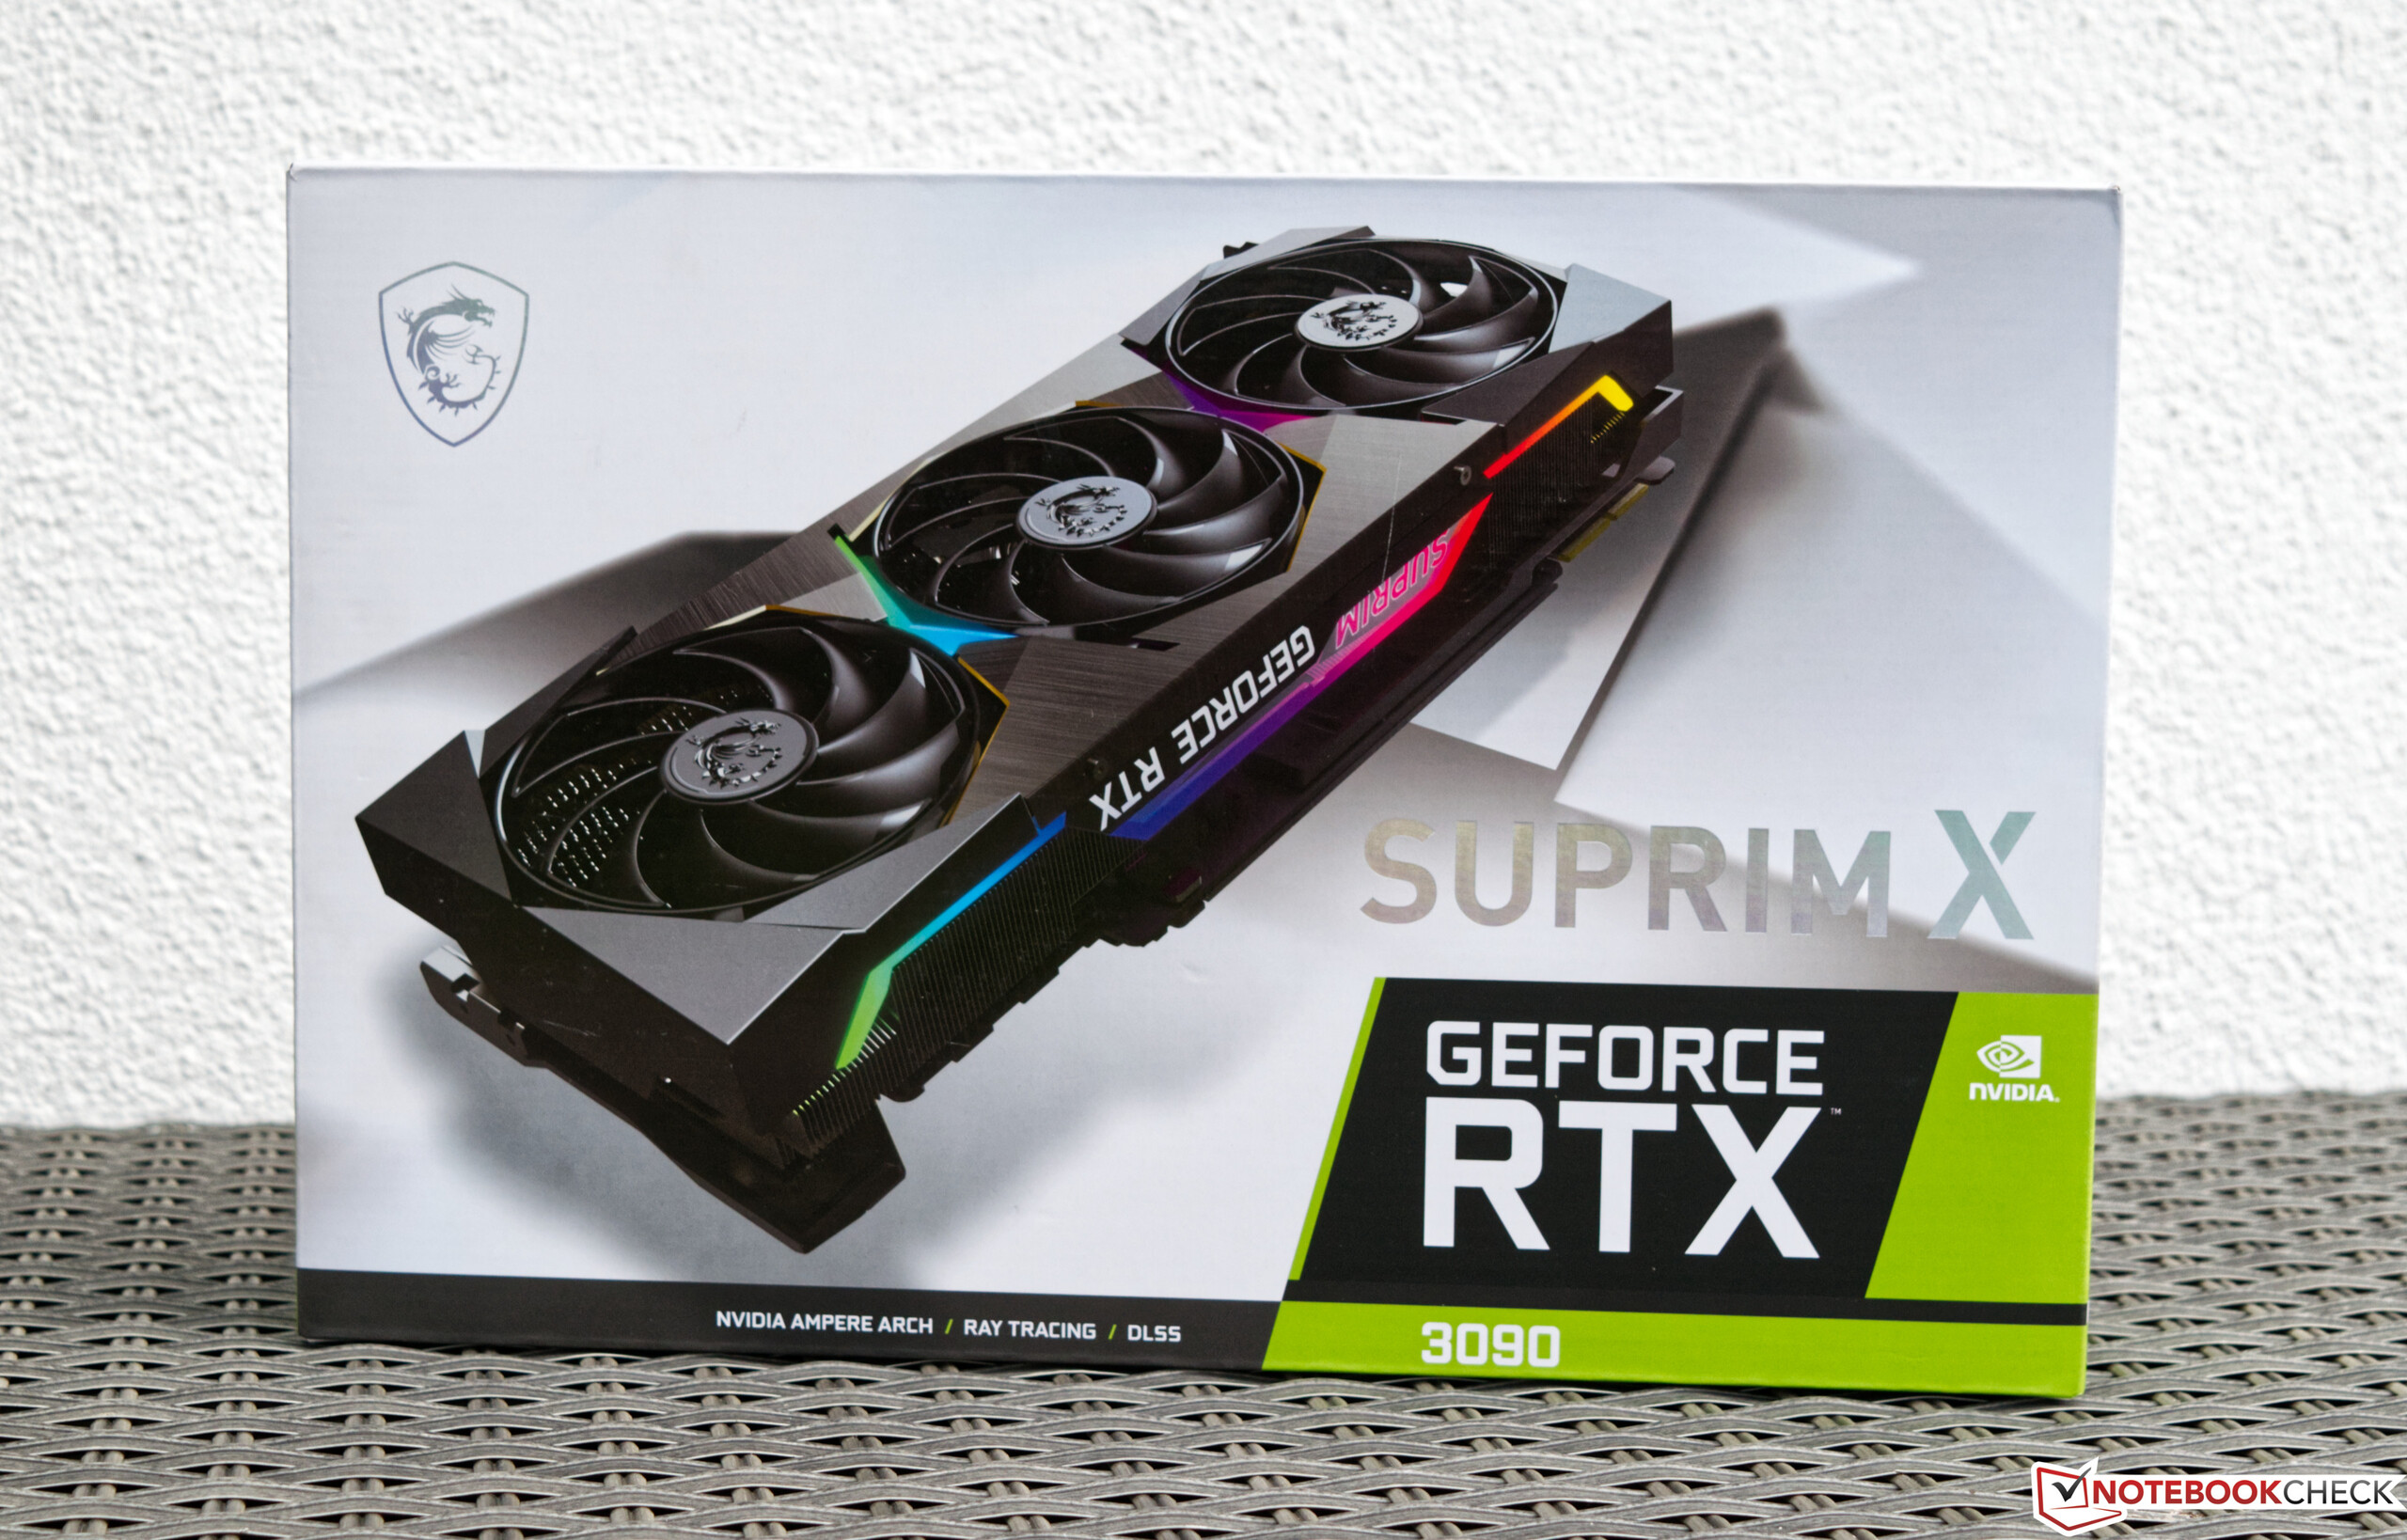
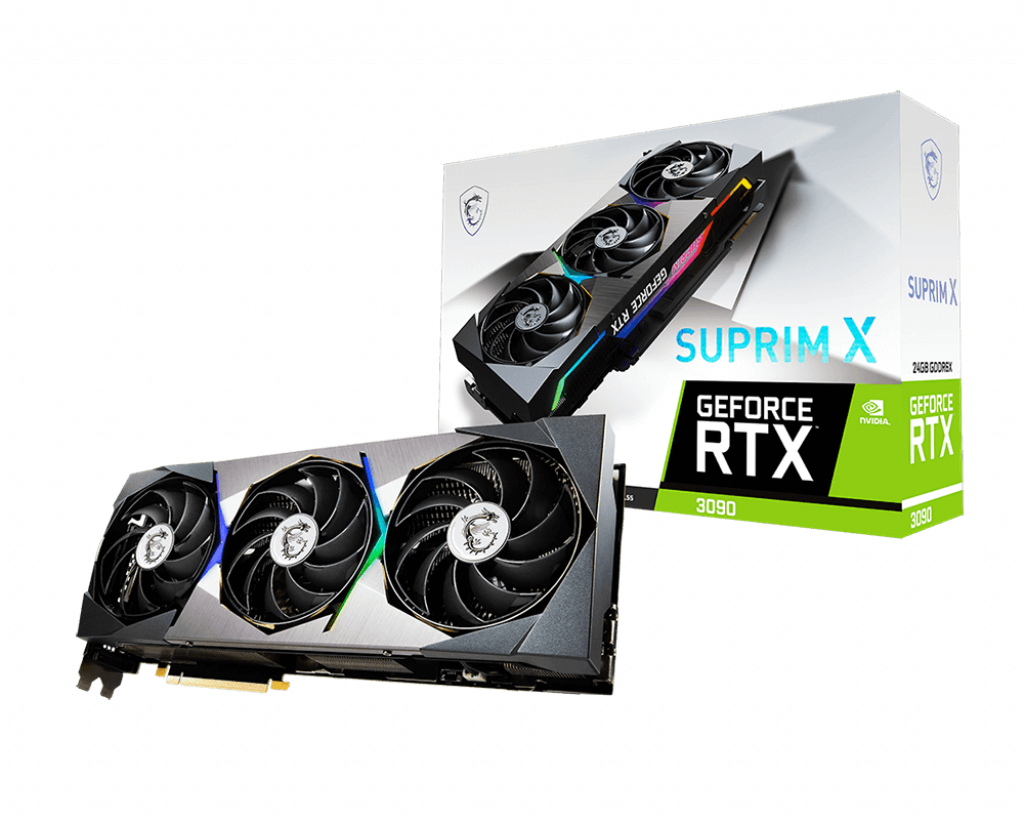
Test de la GeForce RTX 3090 Suprim X : la nouvelle série de cartes graphiques haut de gamme de MSI


Jusqu'à présent, le Gaming X Trio était la partie du portefeuille de MSIdestinée aux modèles spéciaux haut de gamme. Ces dernières années, il y avait aussi de temps en temps des modèles Lightning Z, qui offraient encore plus de performances grâce à des composants sélectionnés et des réglages spéciaux. Aujourd'hui, MSI introduit une nouvelle division dans le secteur haut de gamme avec les modèles Suprim X. Sous ce nom, MSI propose les modèles RTX 3070, 3080 et 3090 des nouvelles cartes graphiques Ampere. En même temps, il y a toujours les modèles Gaming X Trio, qui doivent se contenter de performances légèrement inférieures, car les modèles Suprim X offrent un BIOS avec un TDP plus élevé
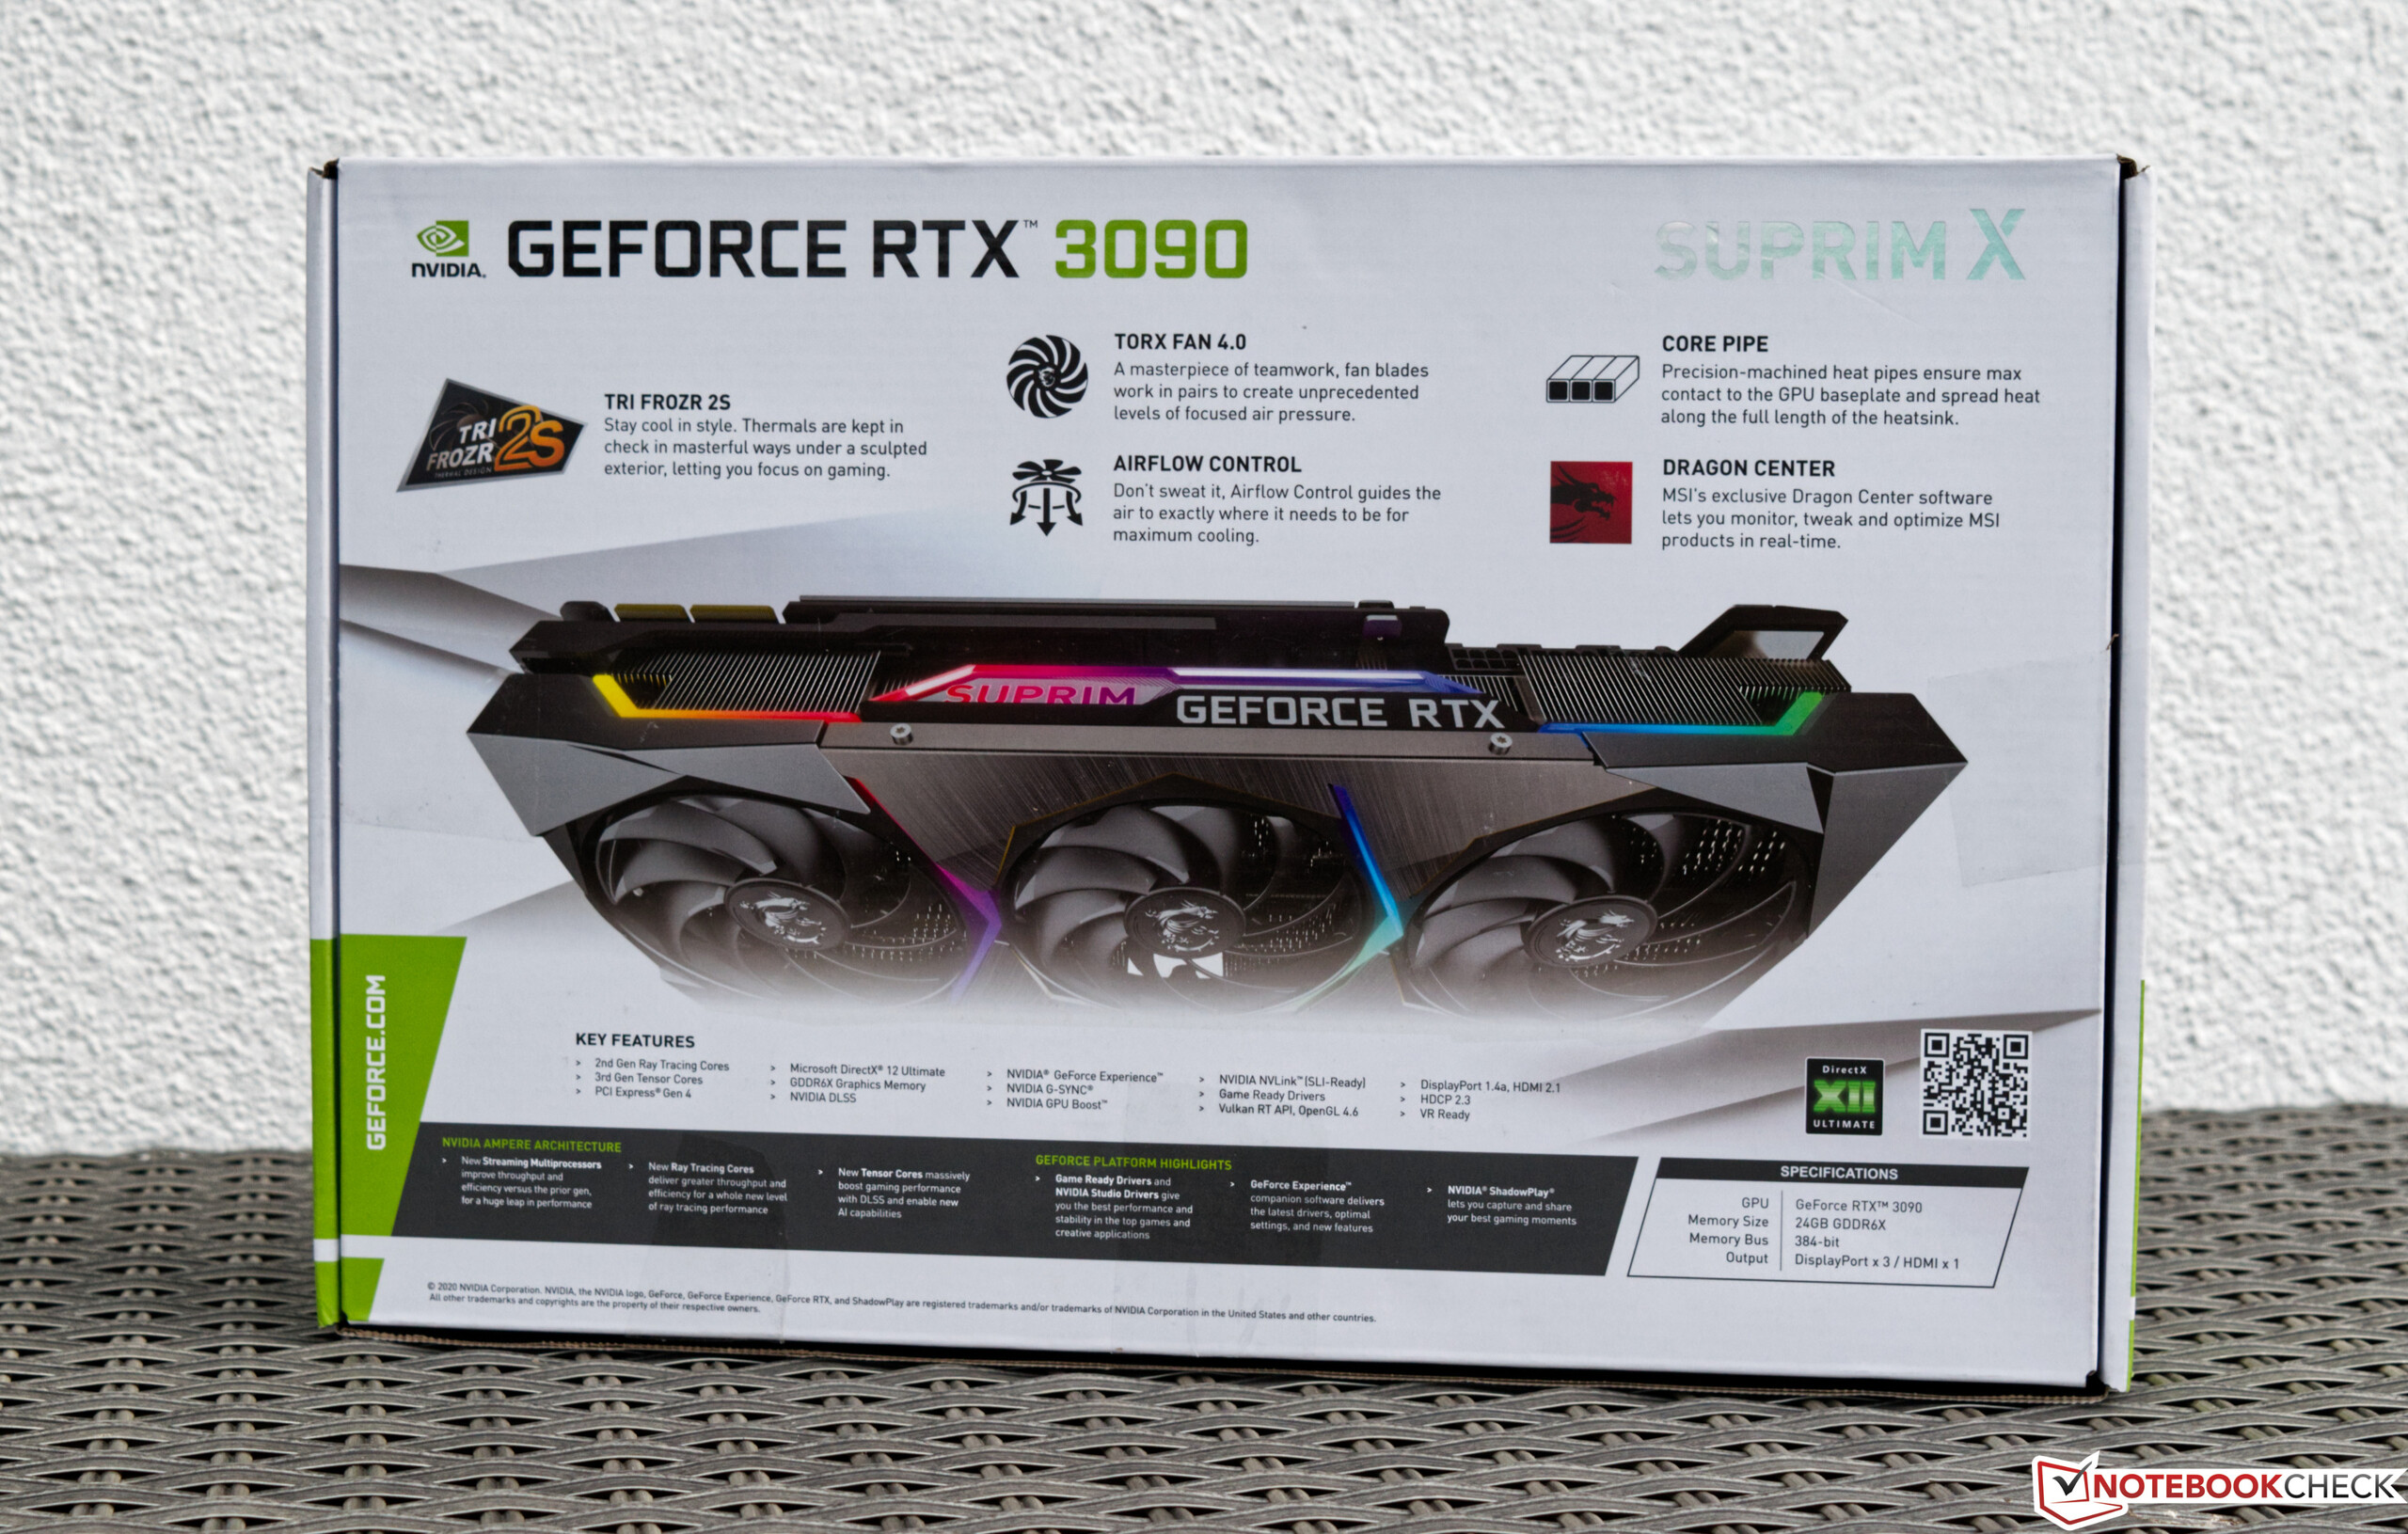
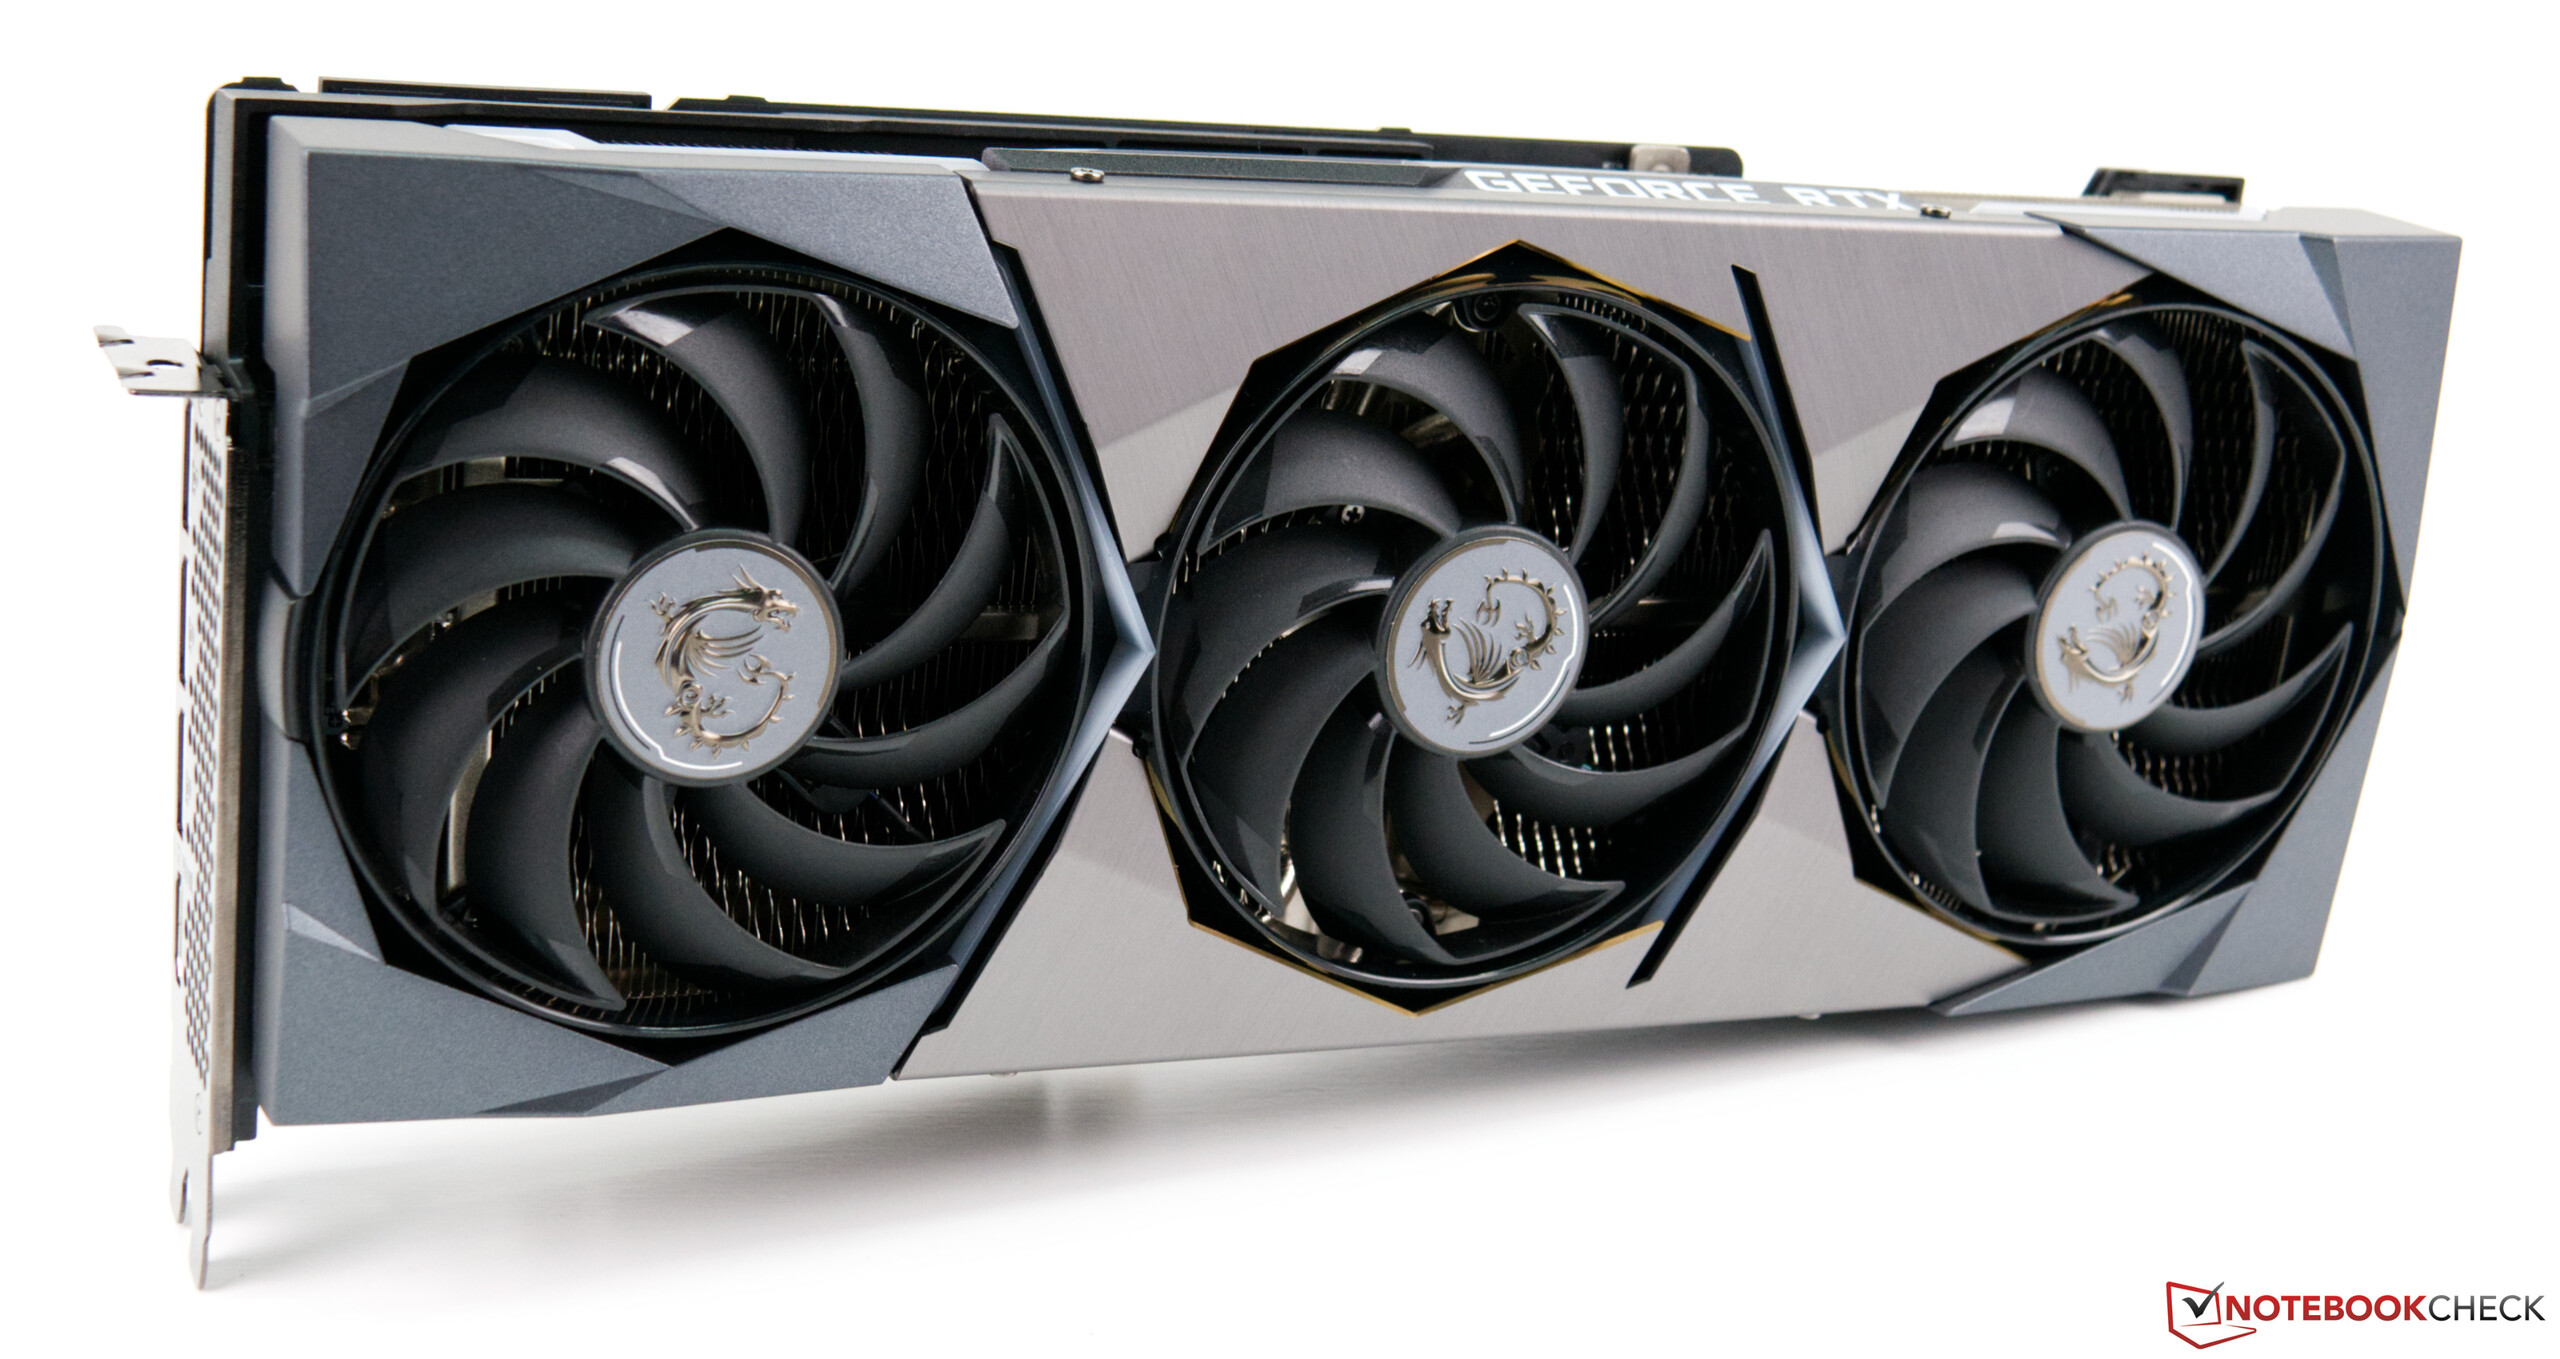
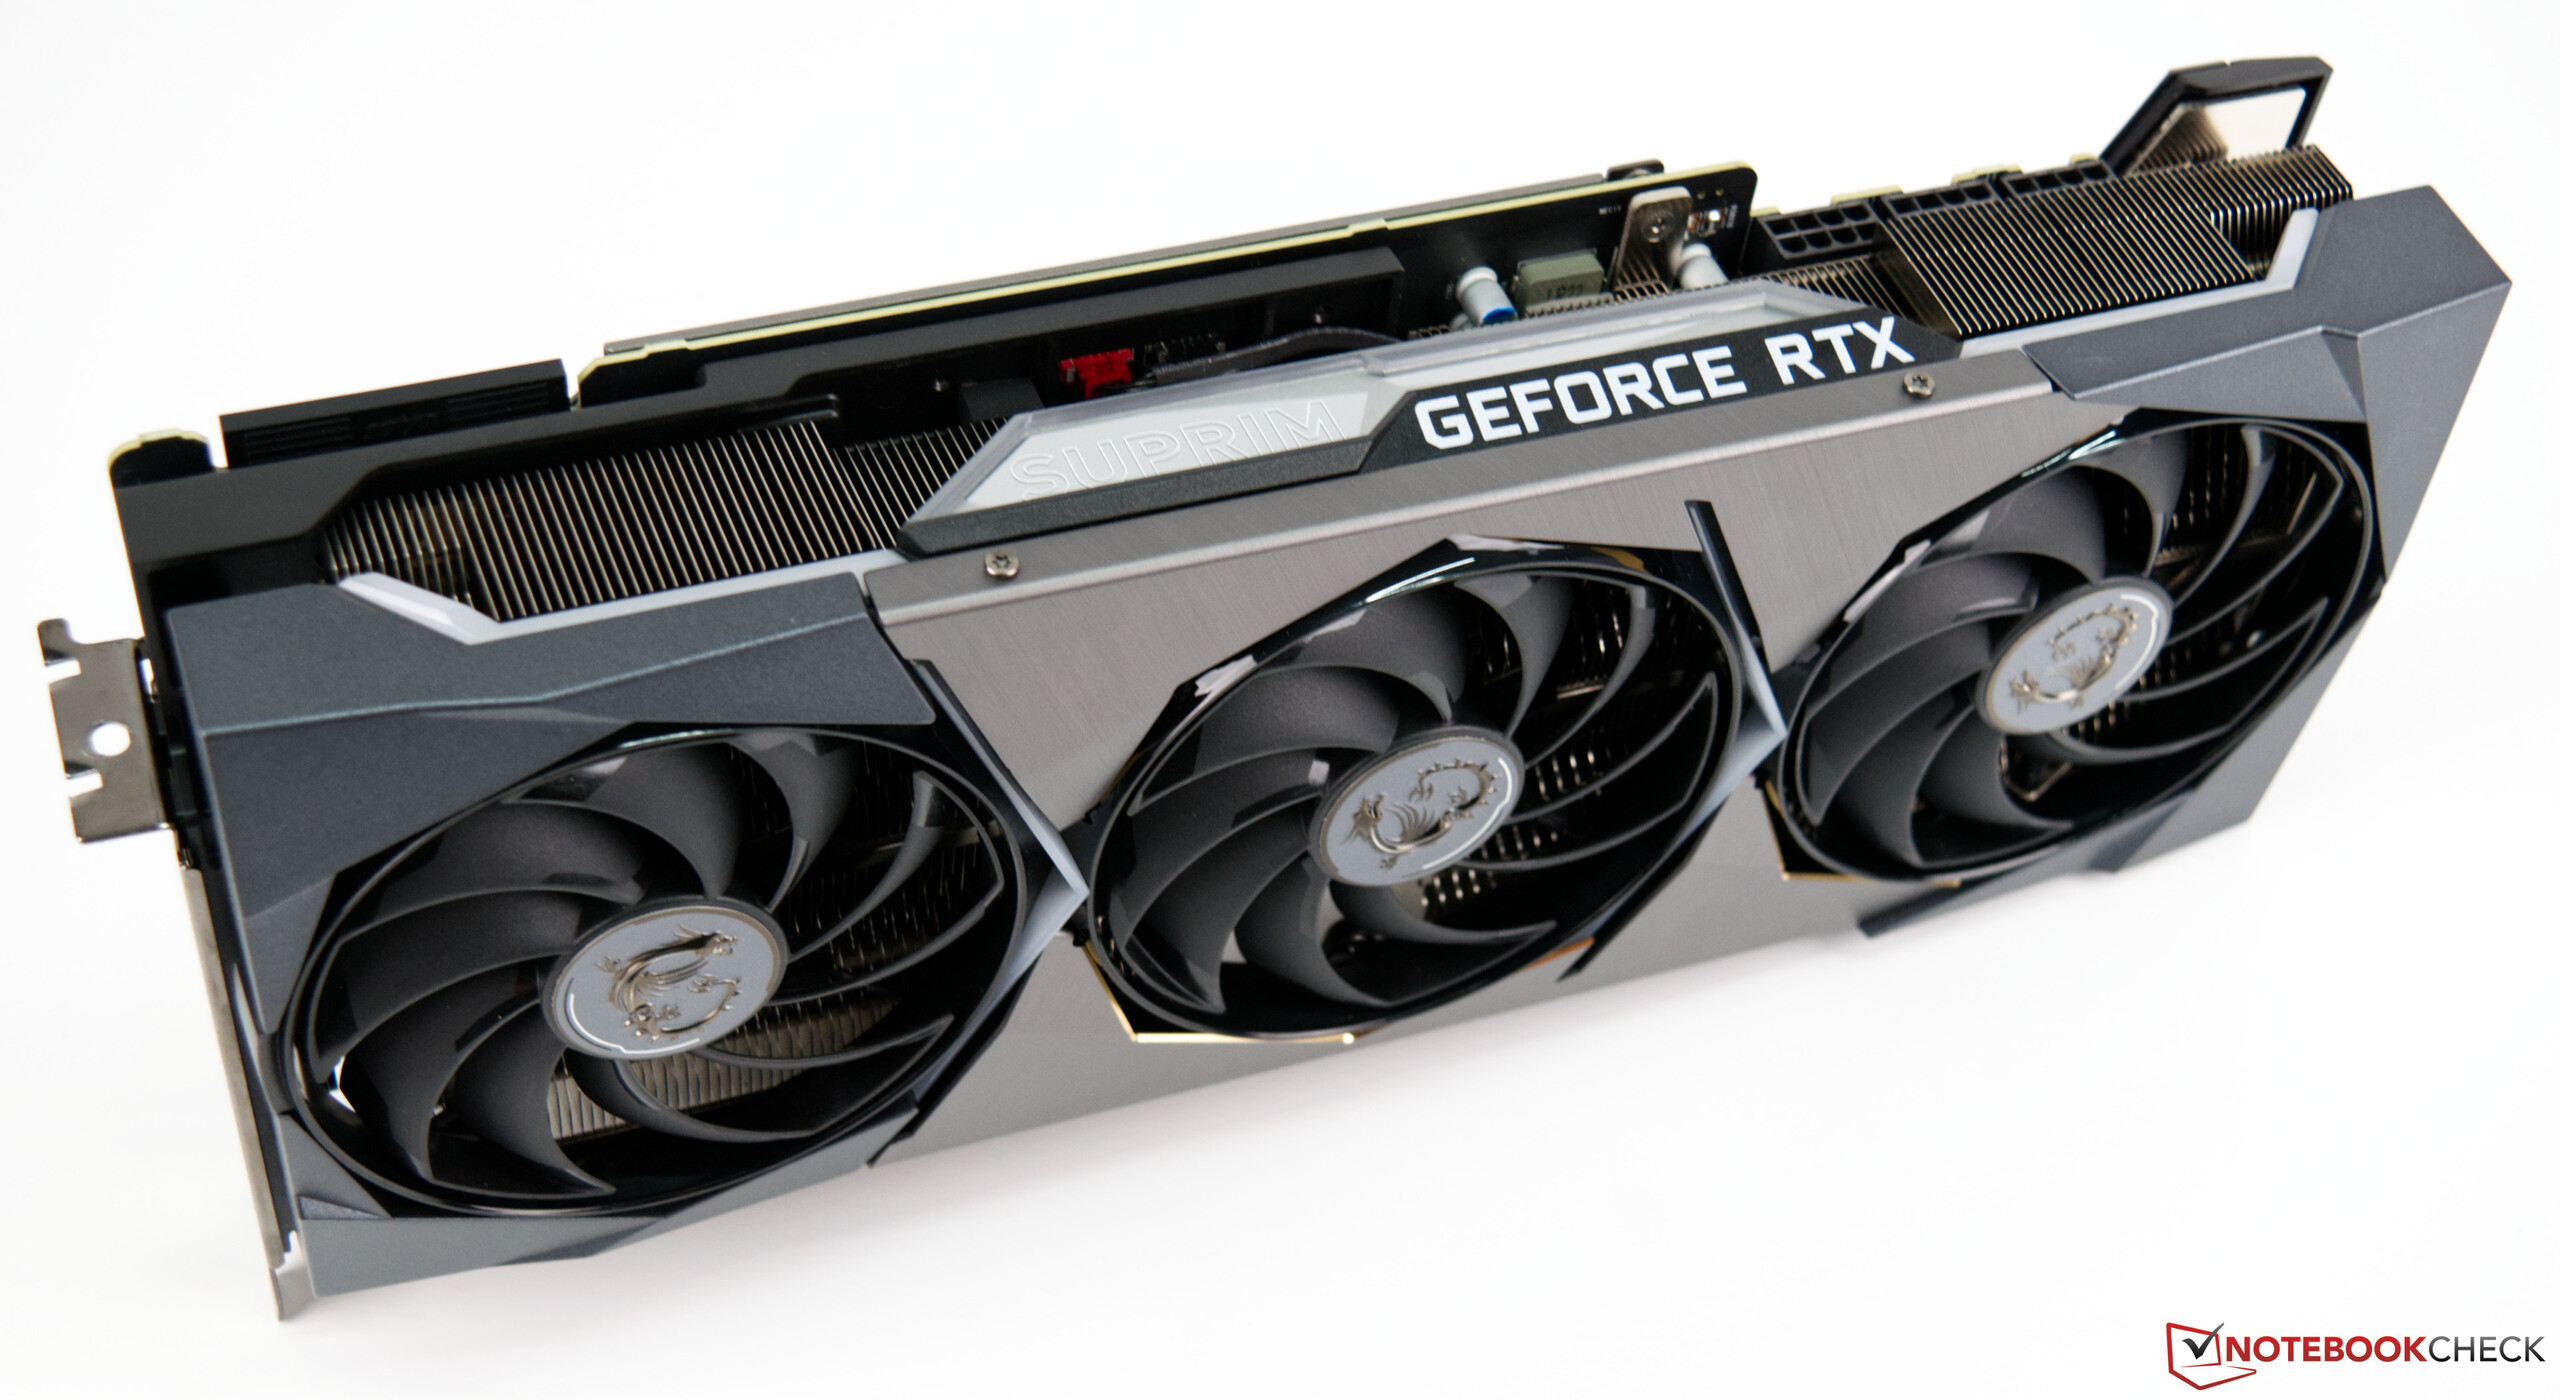
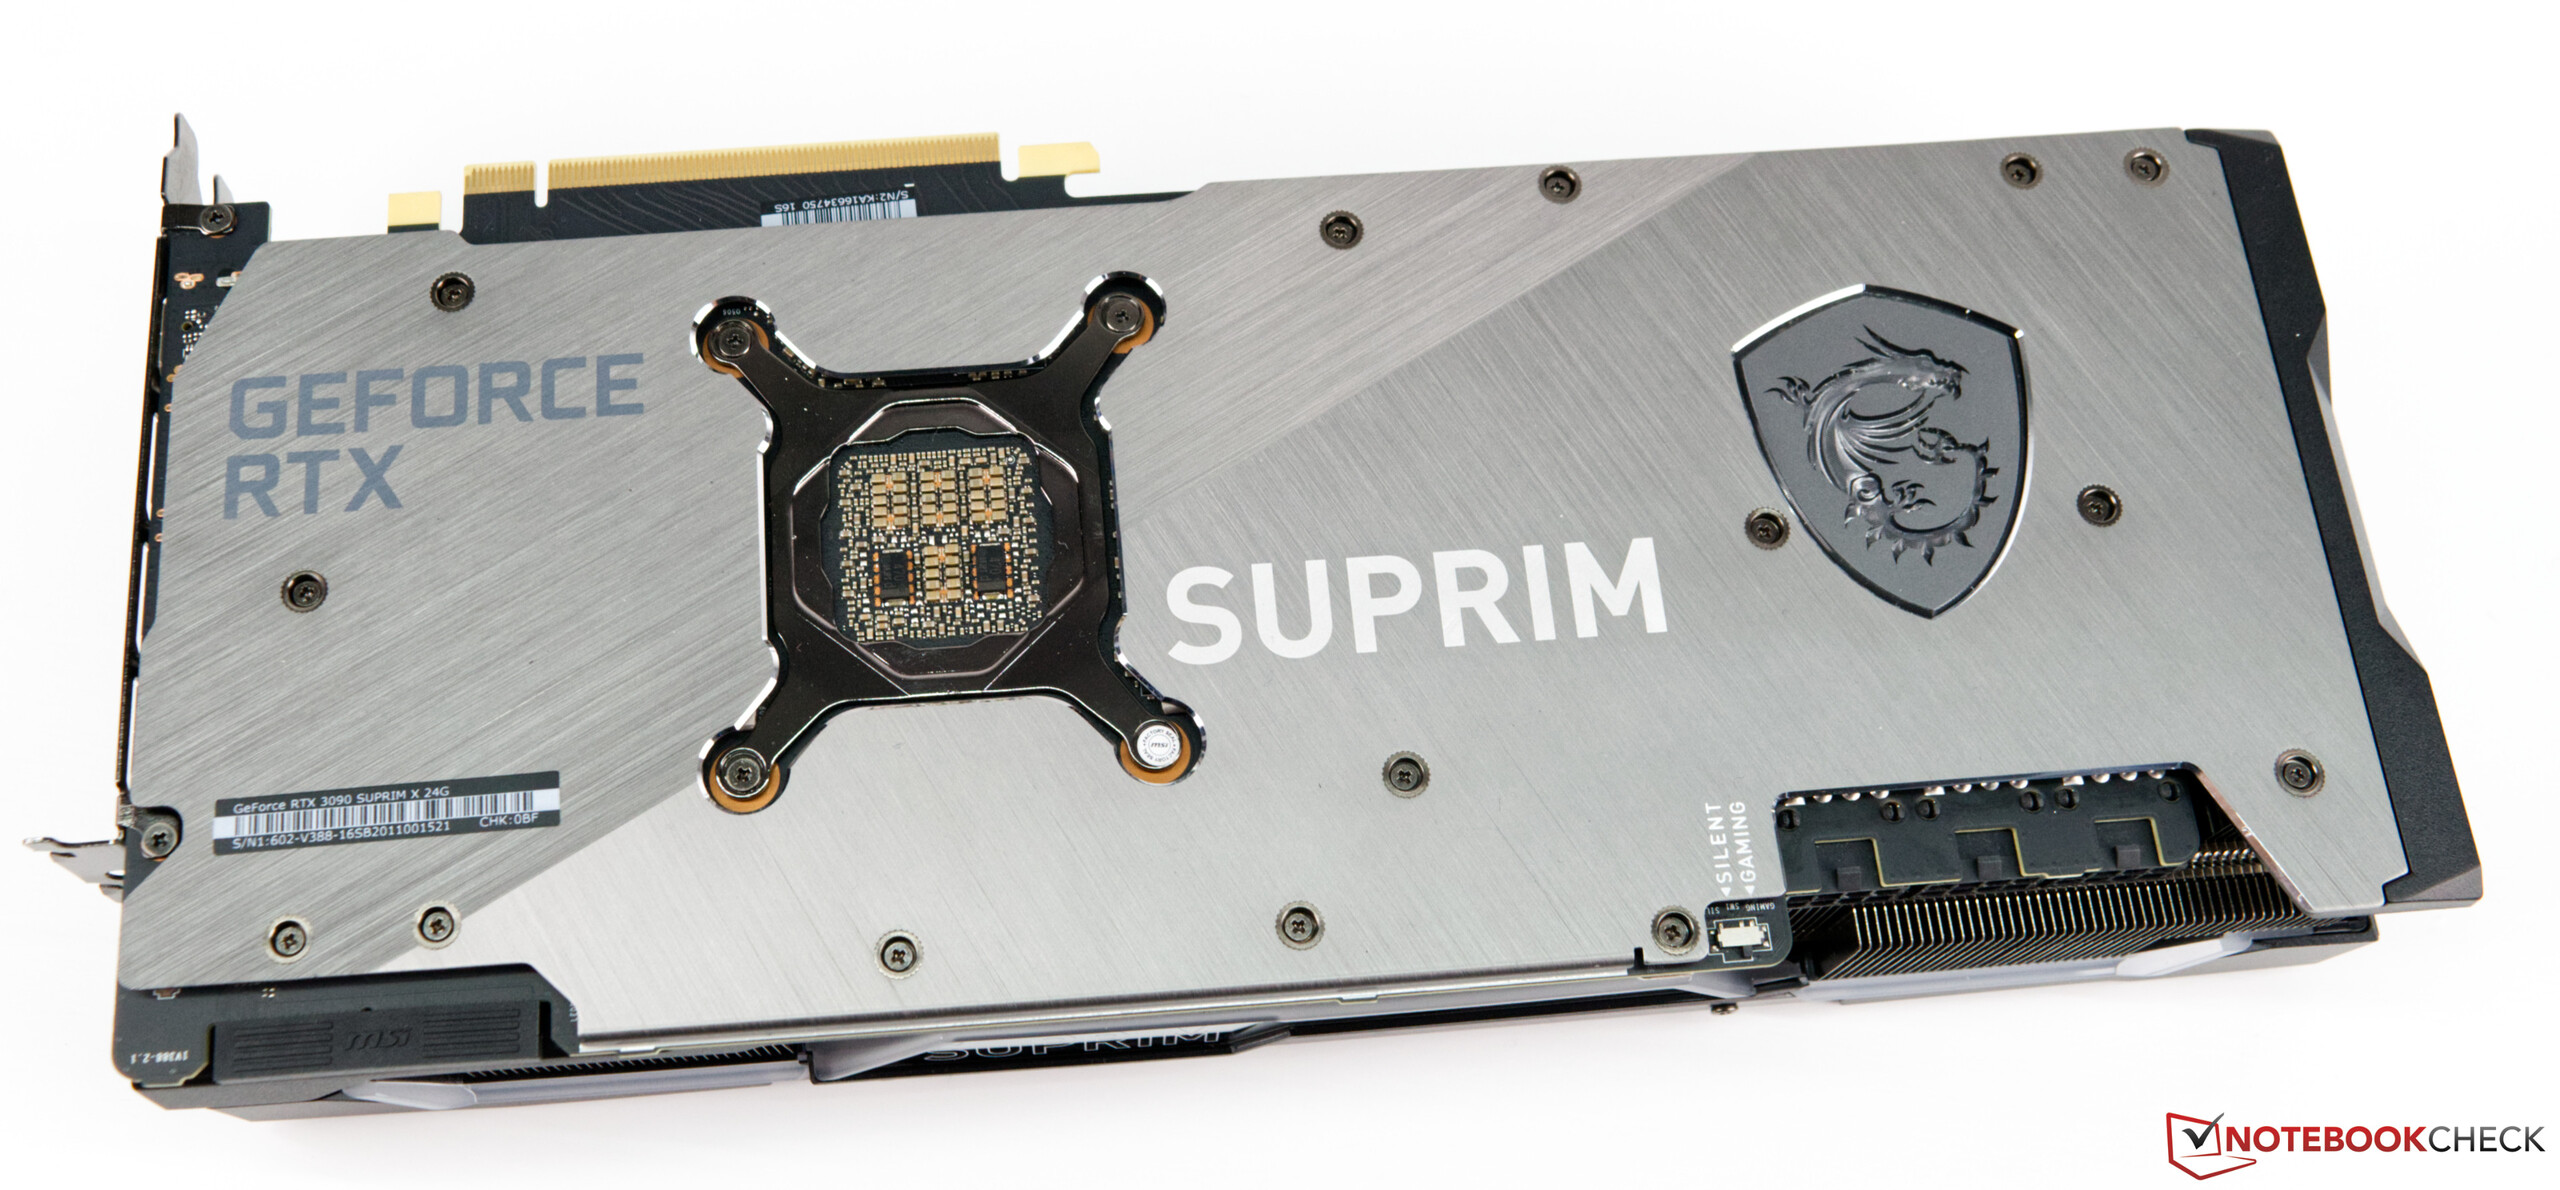
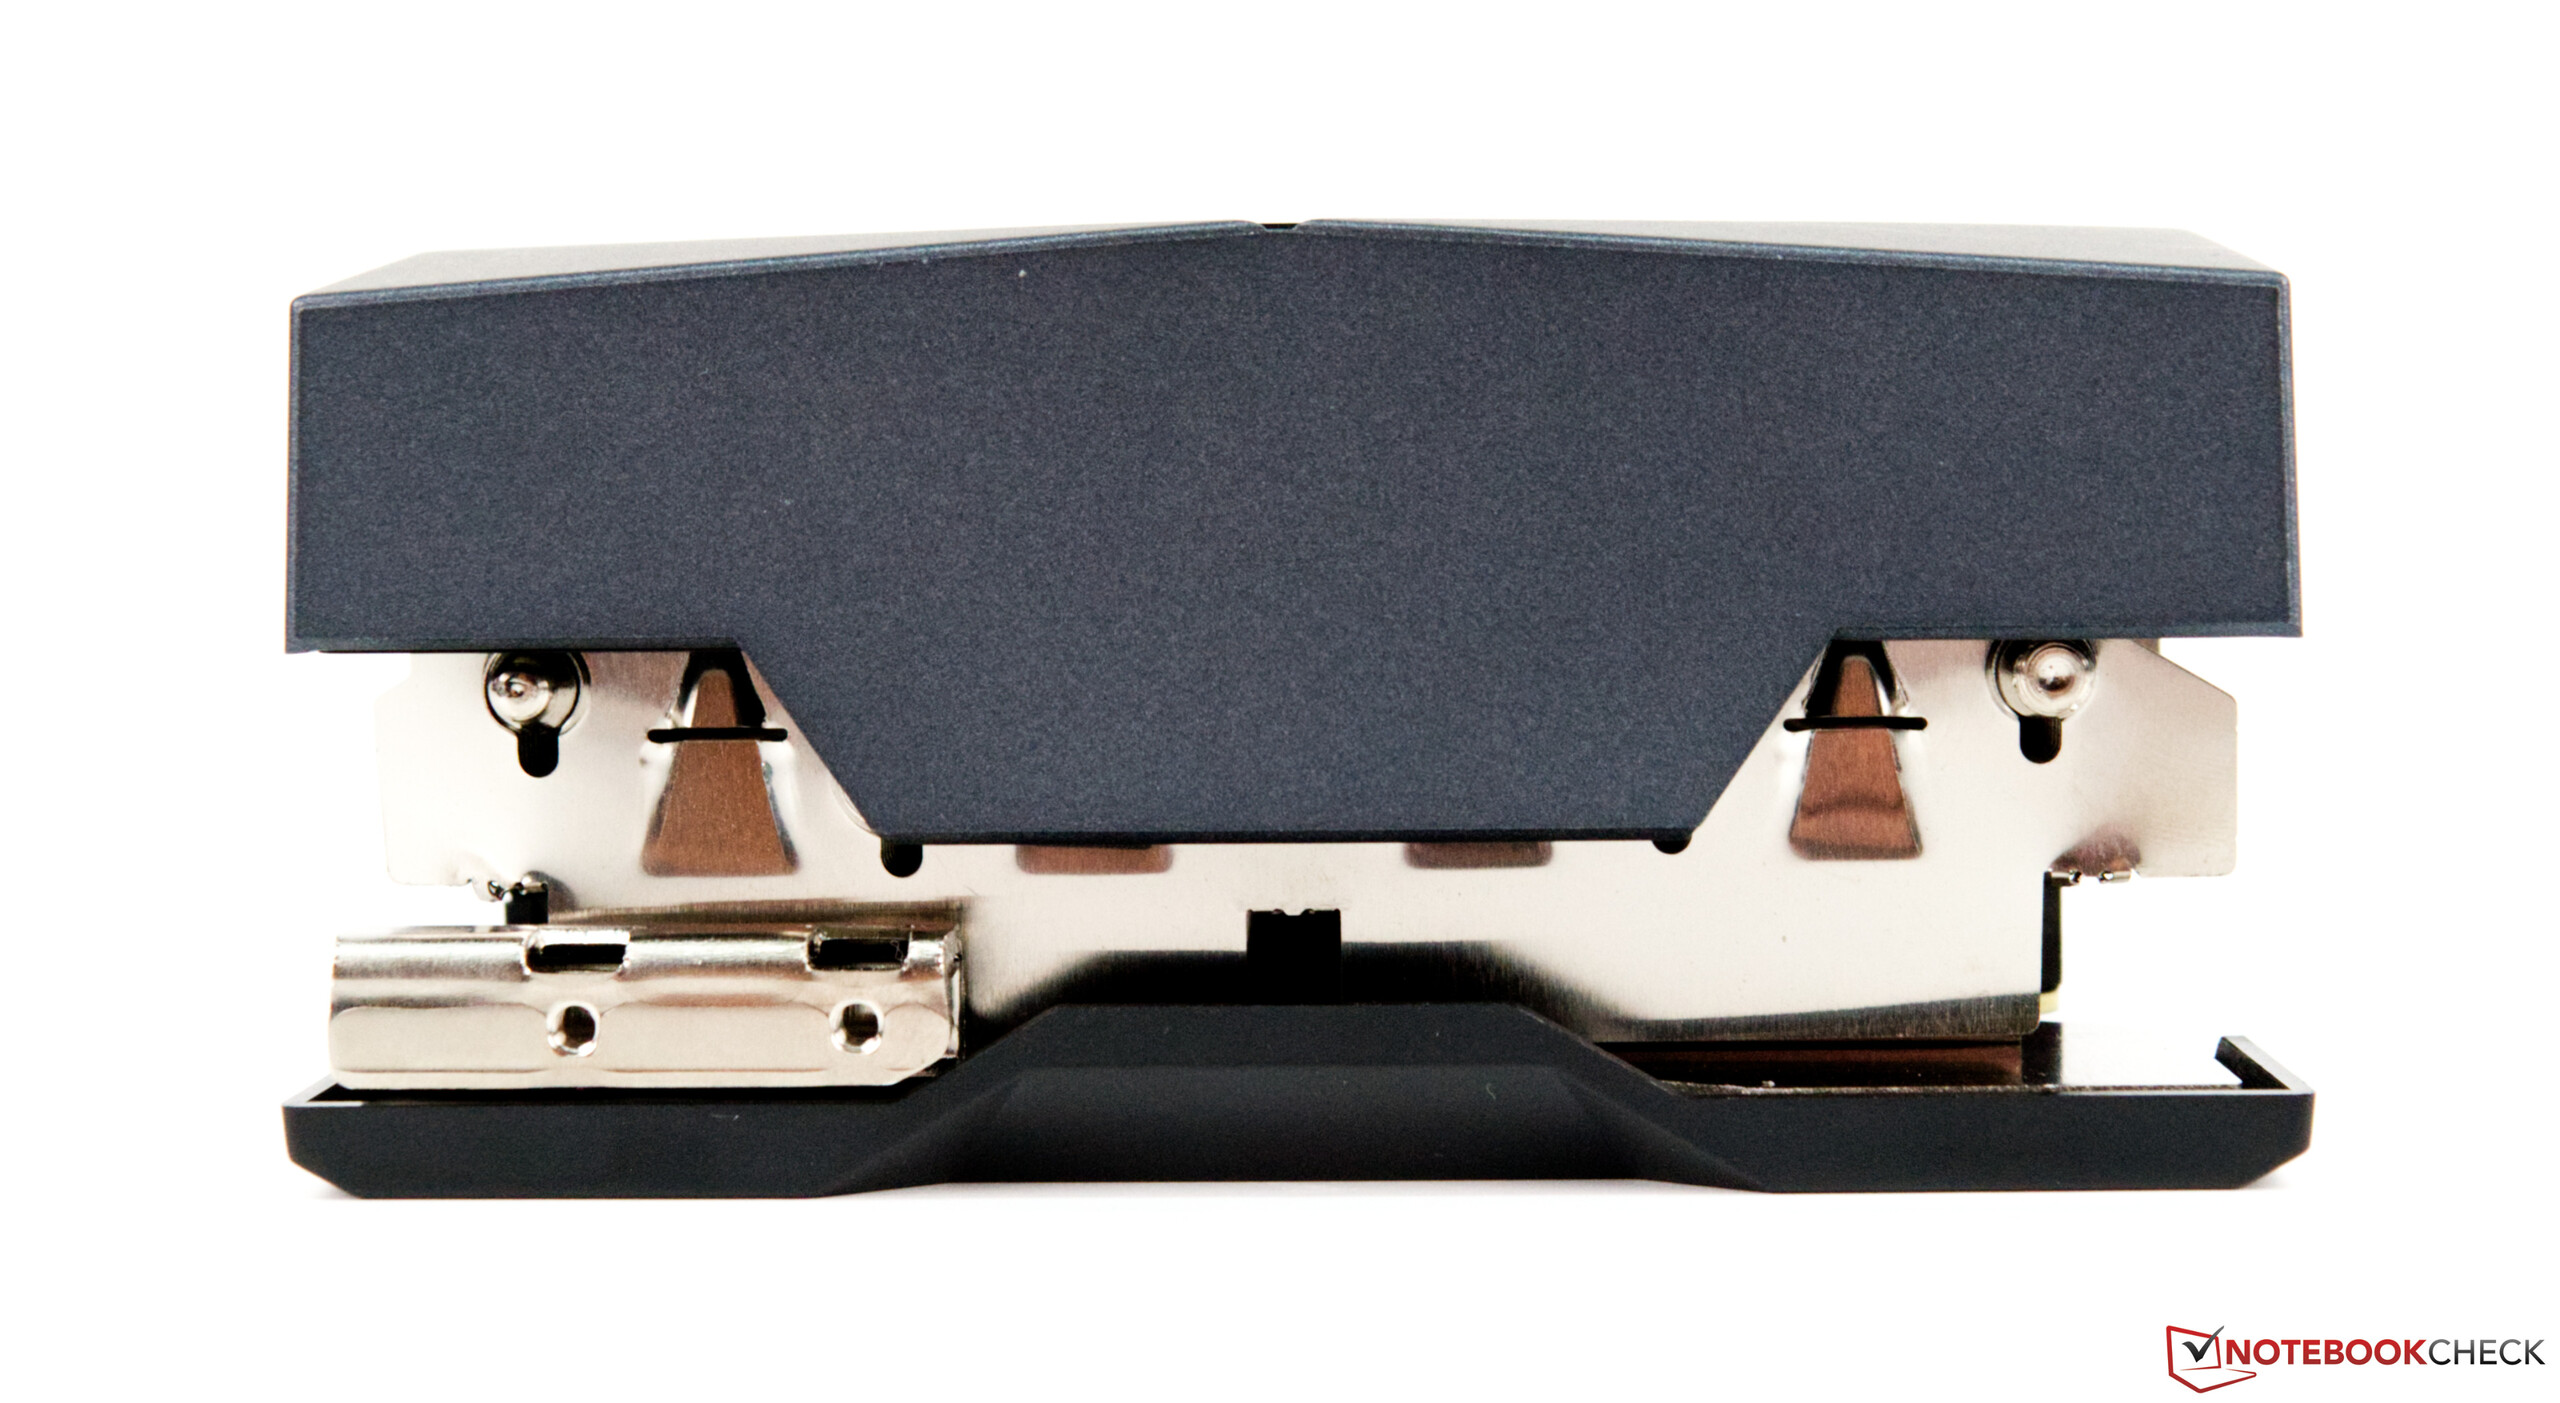
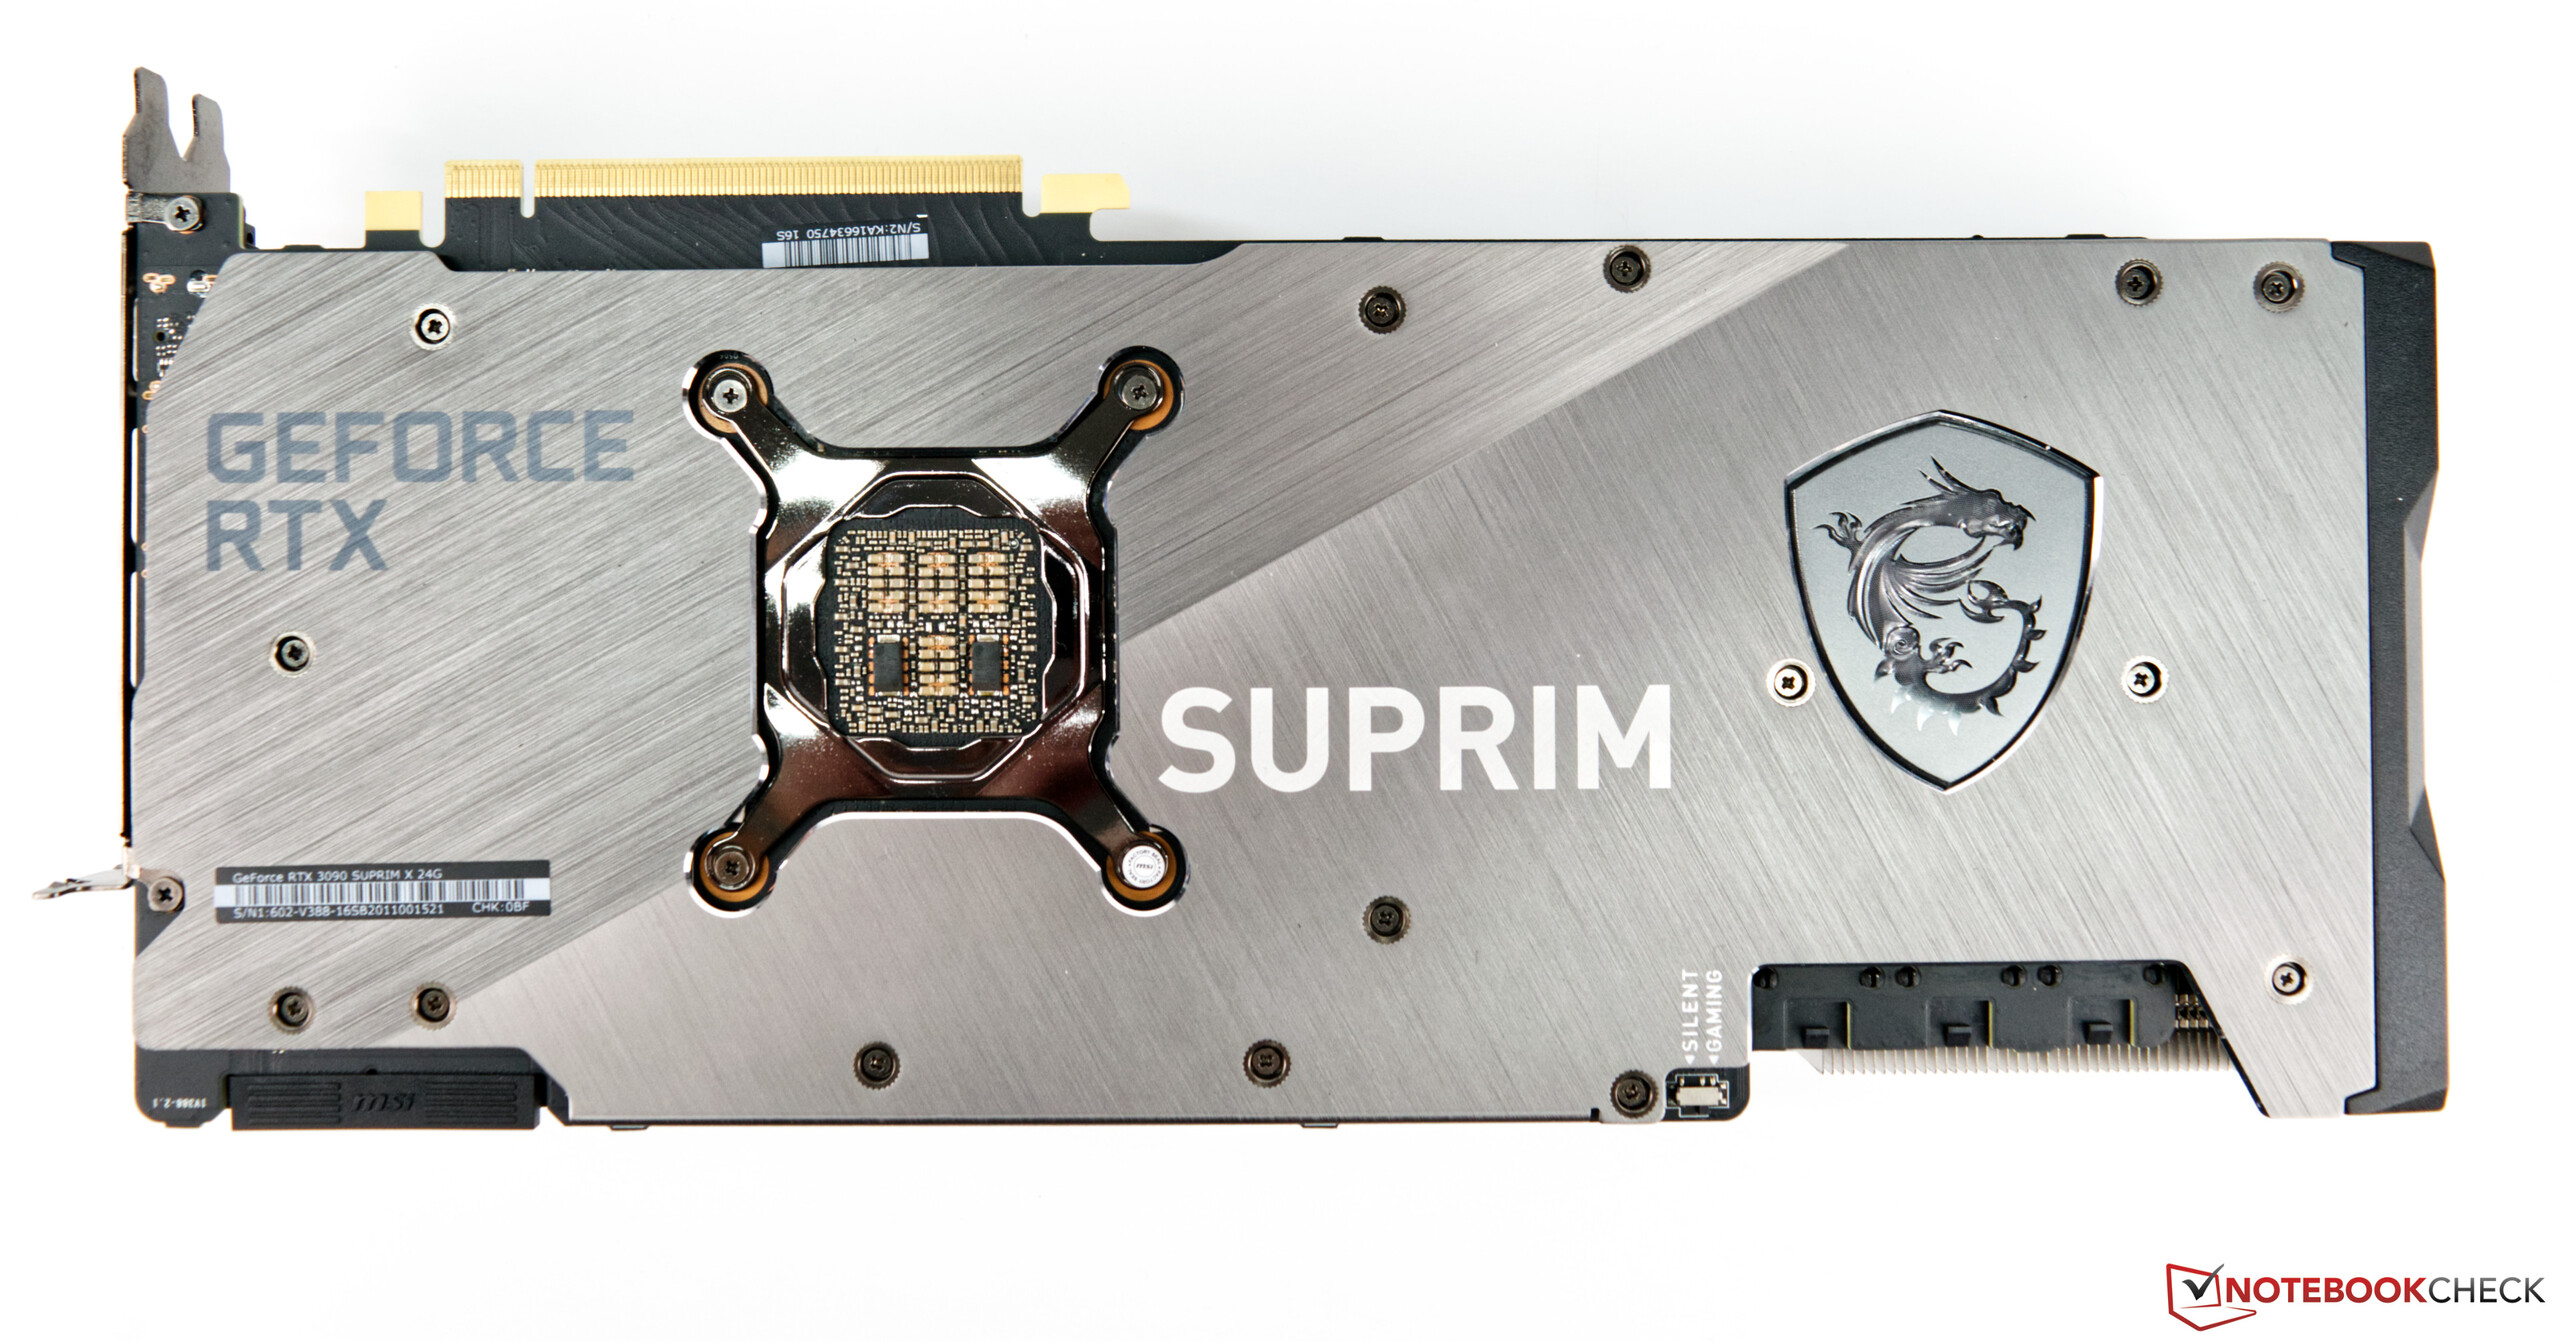
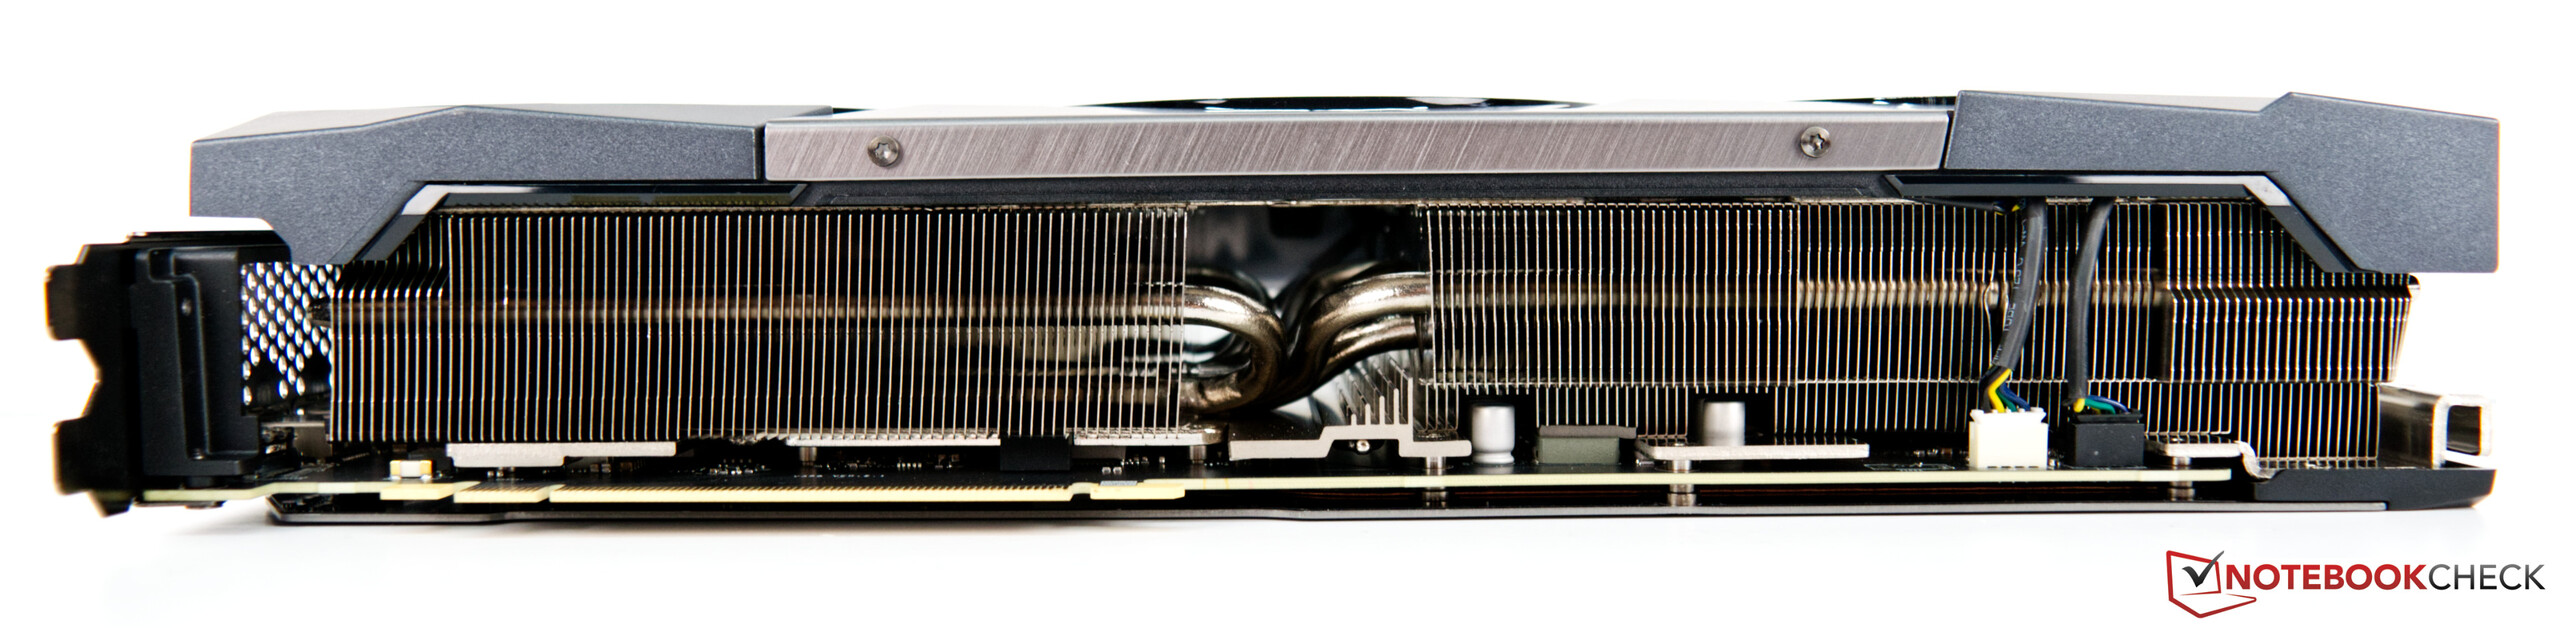
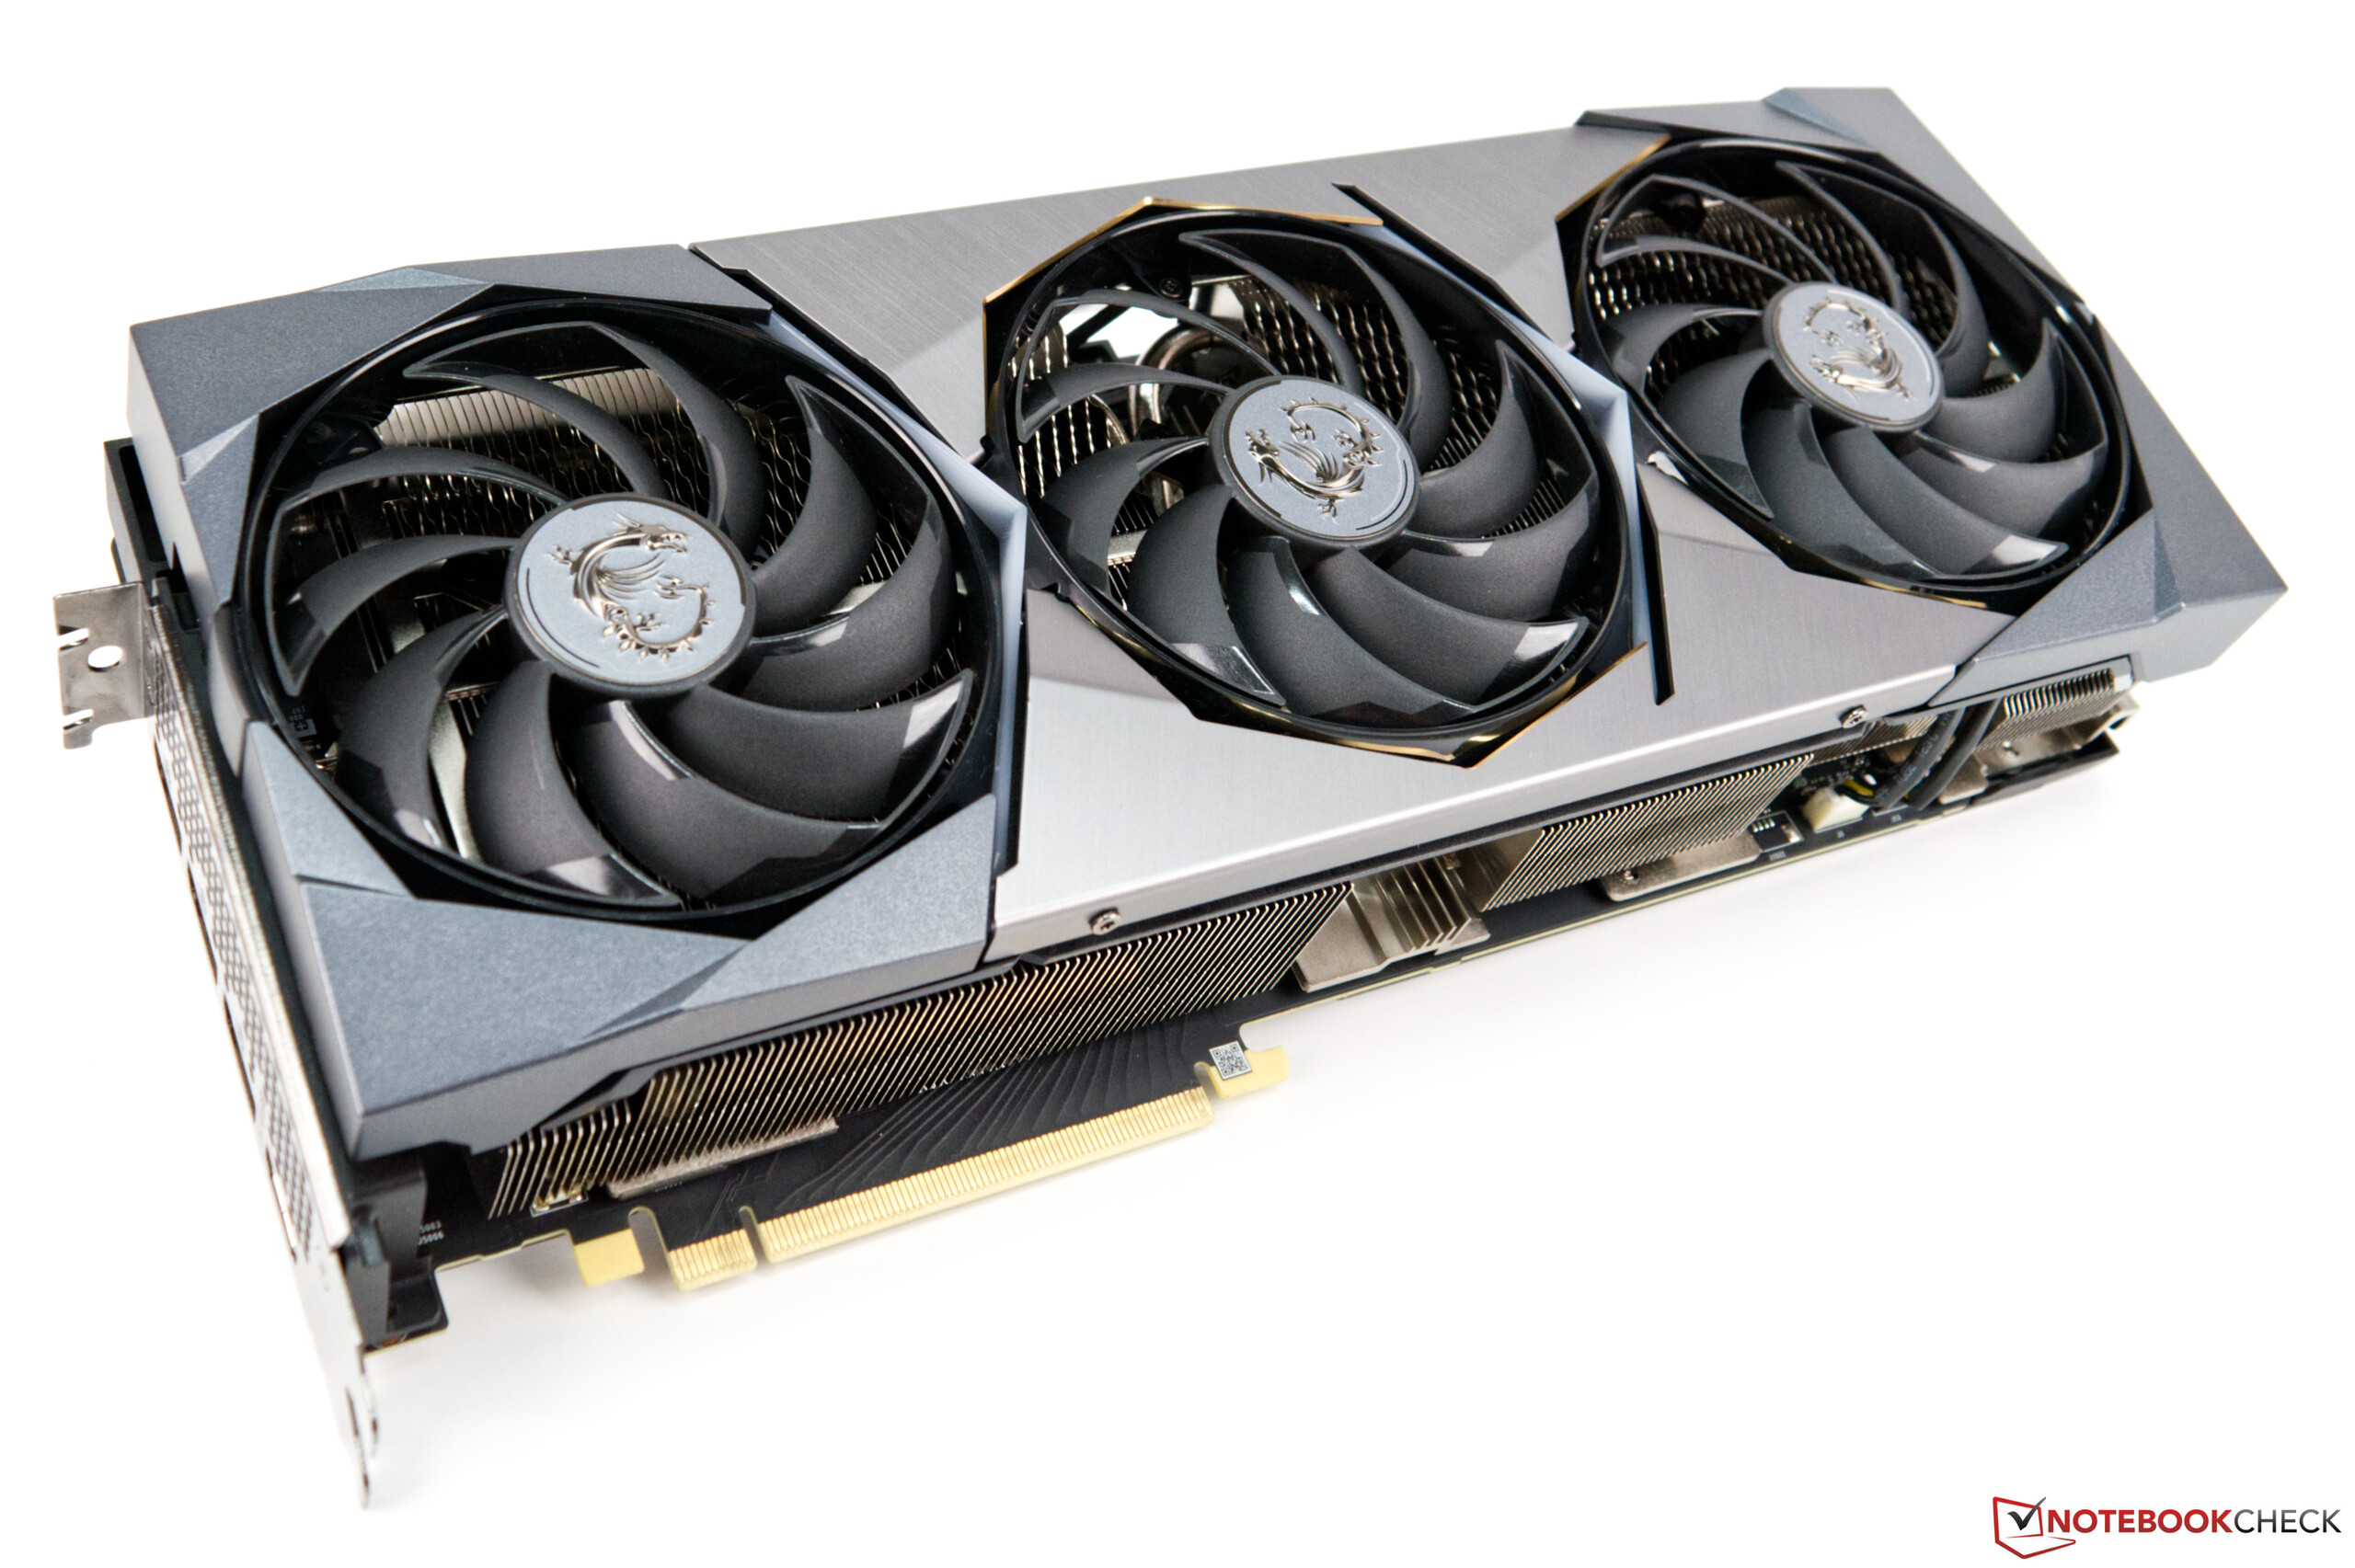
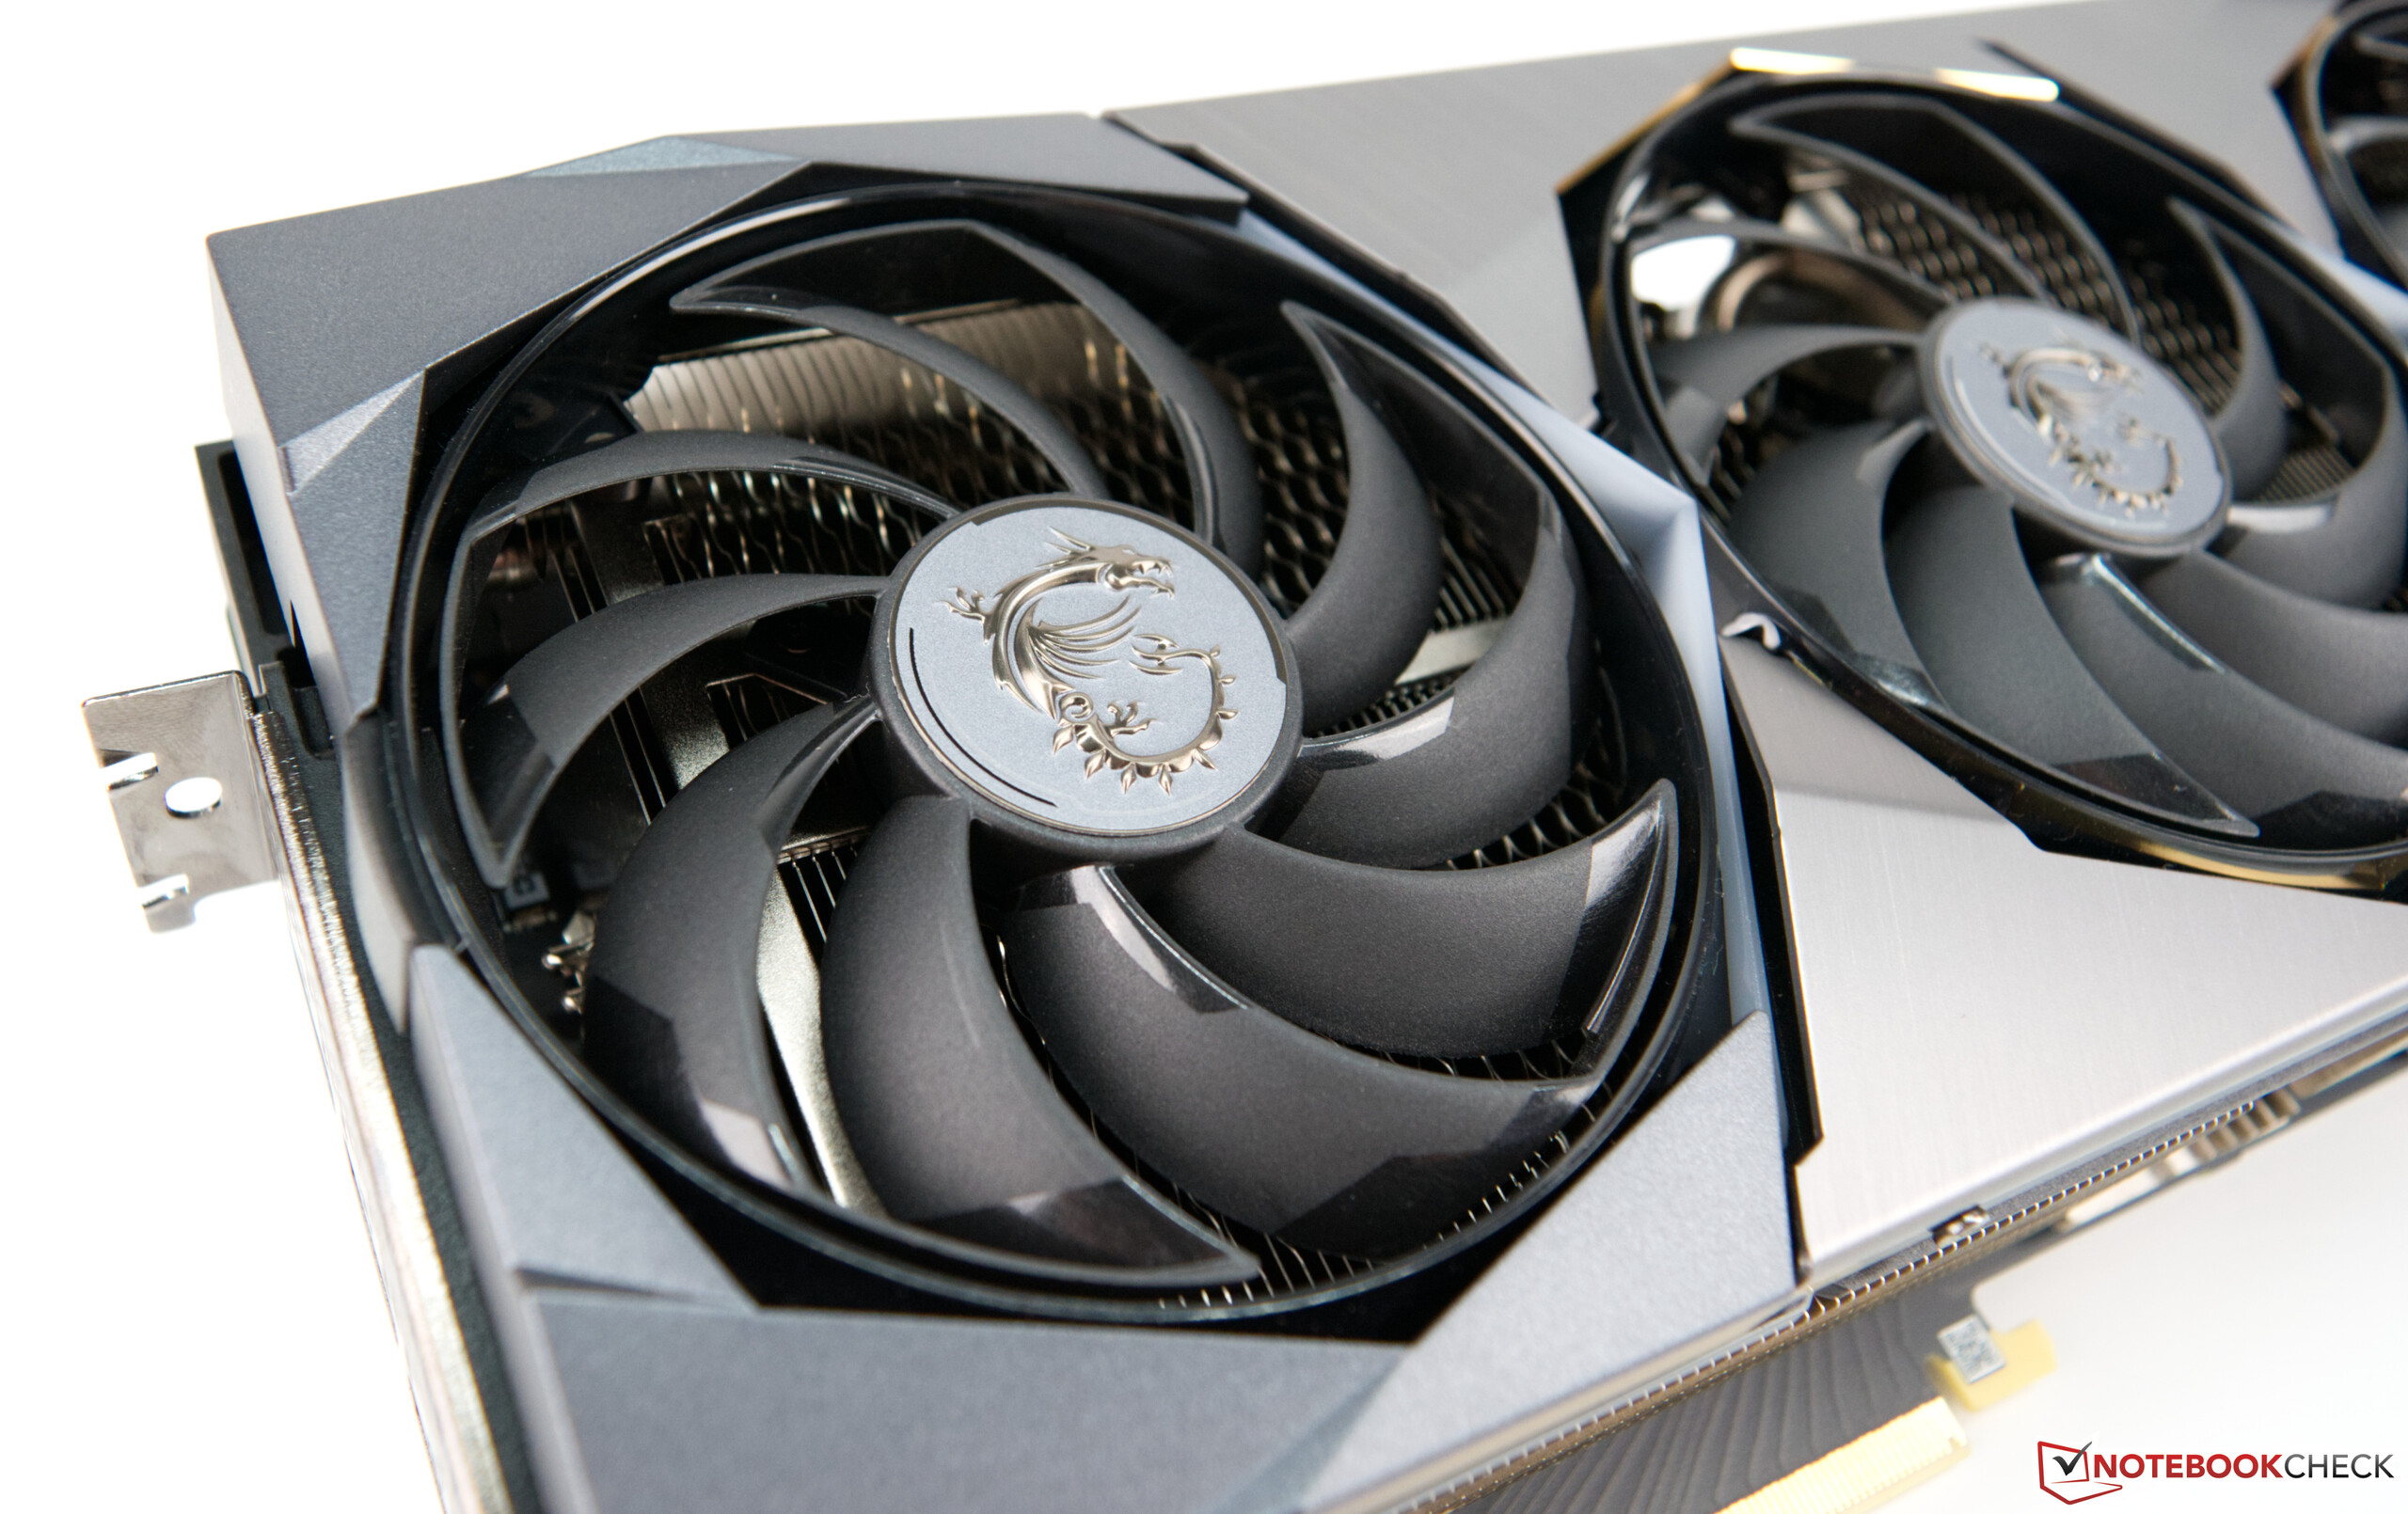
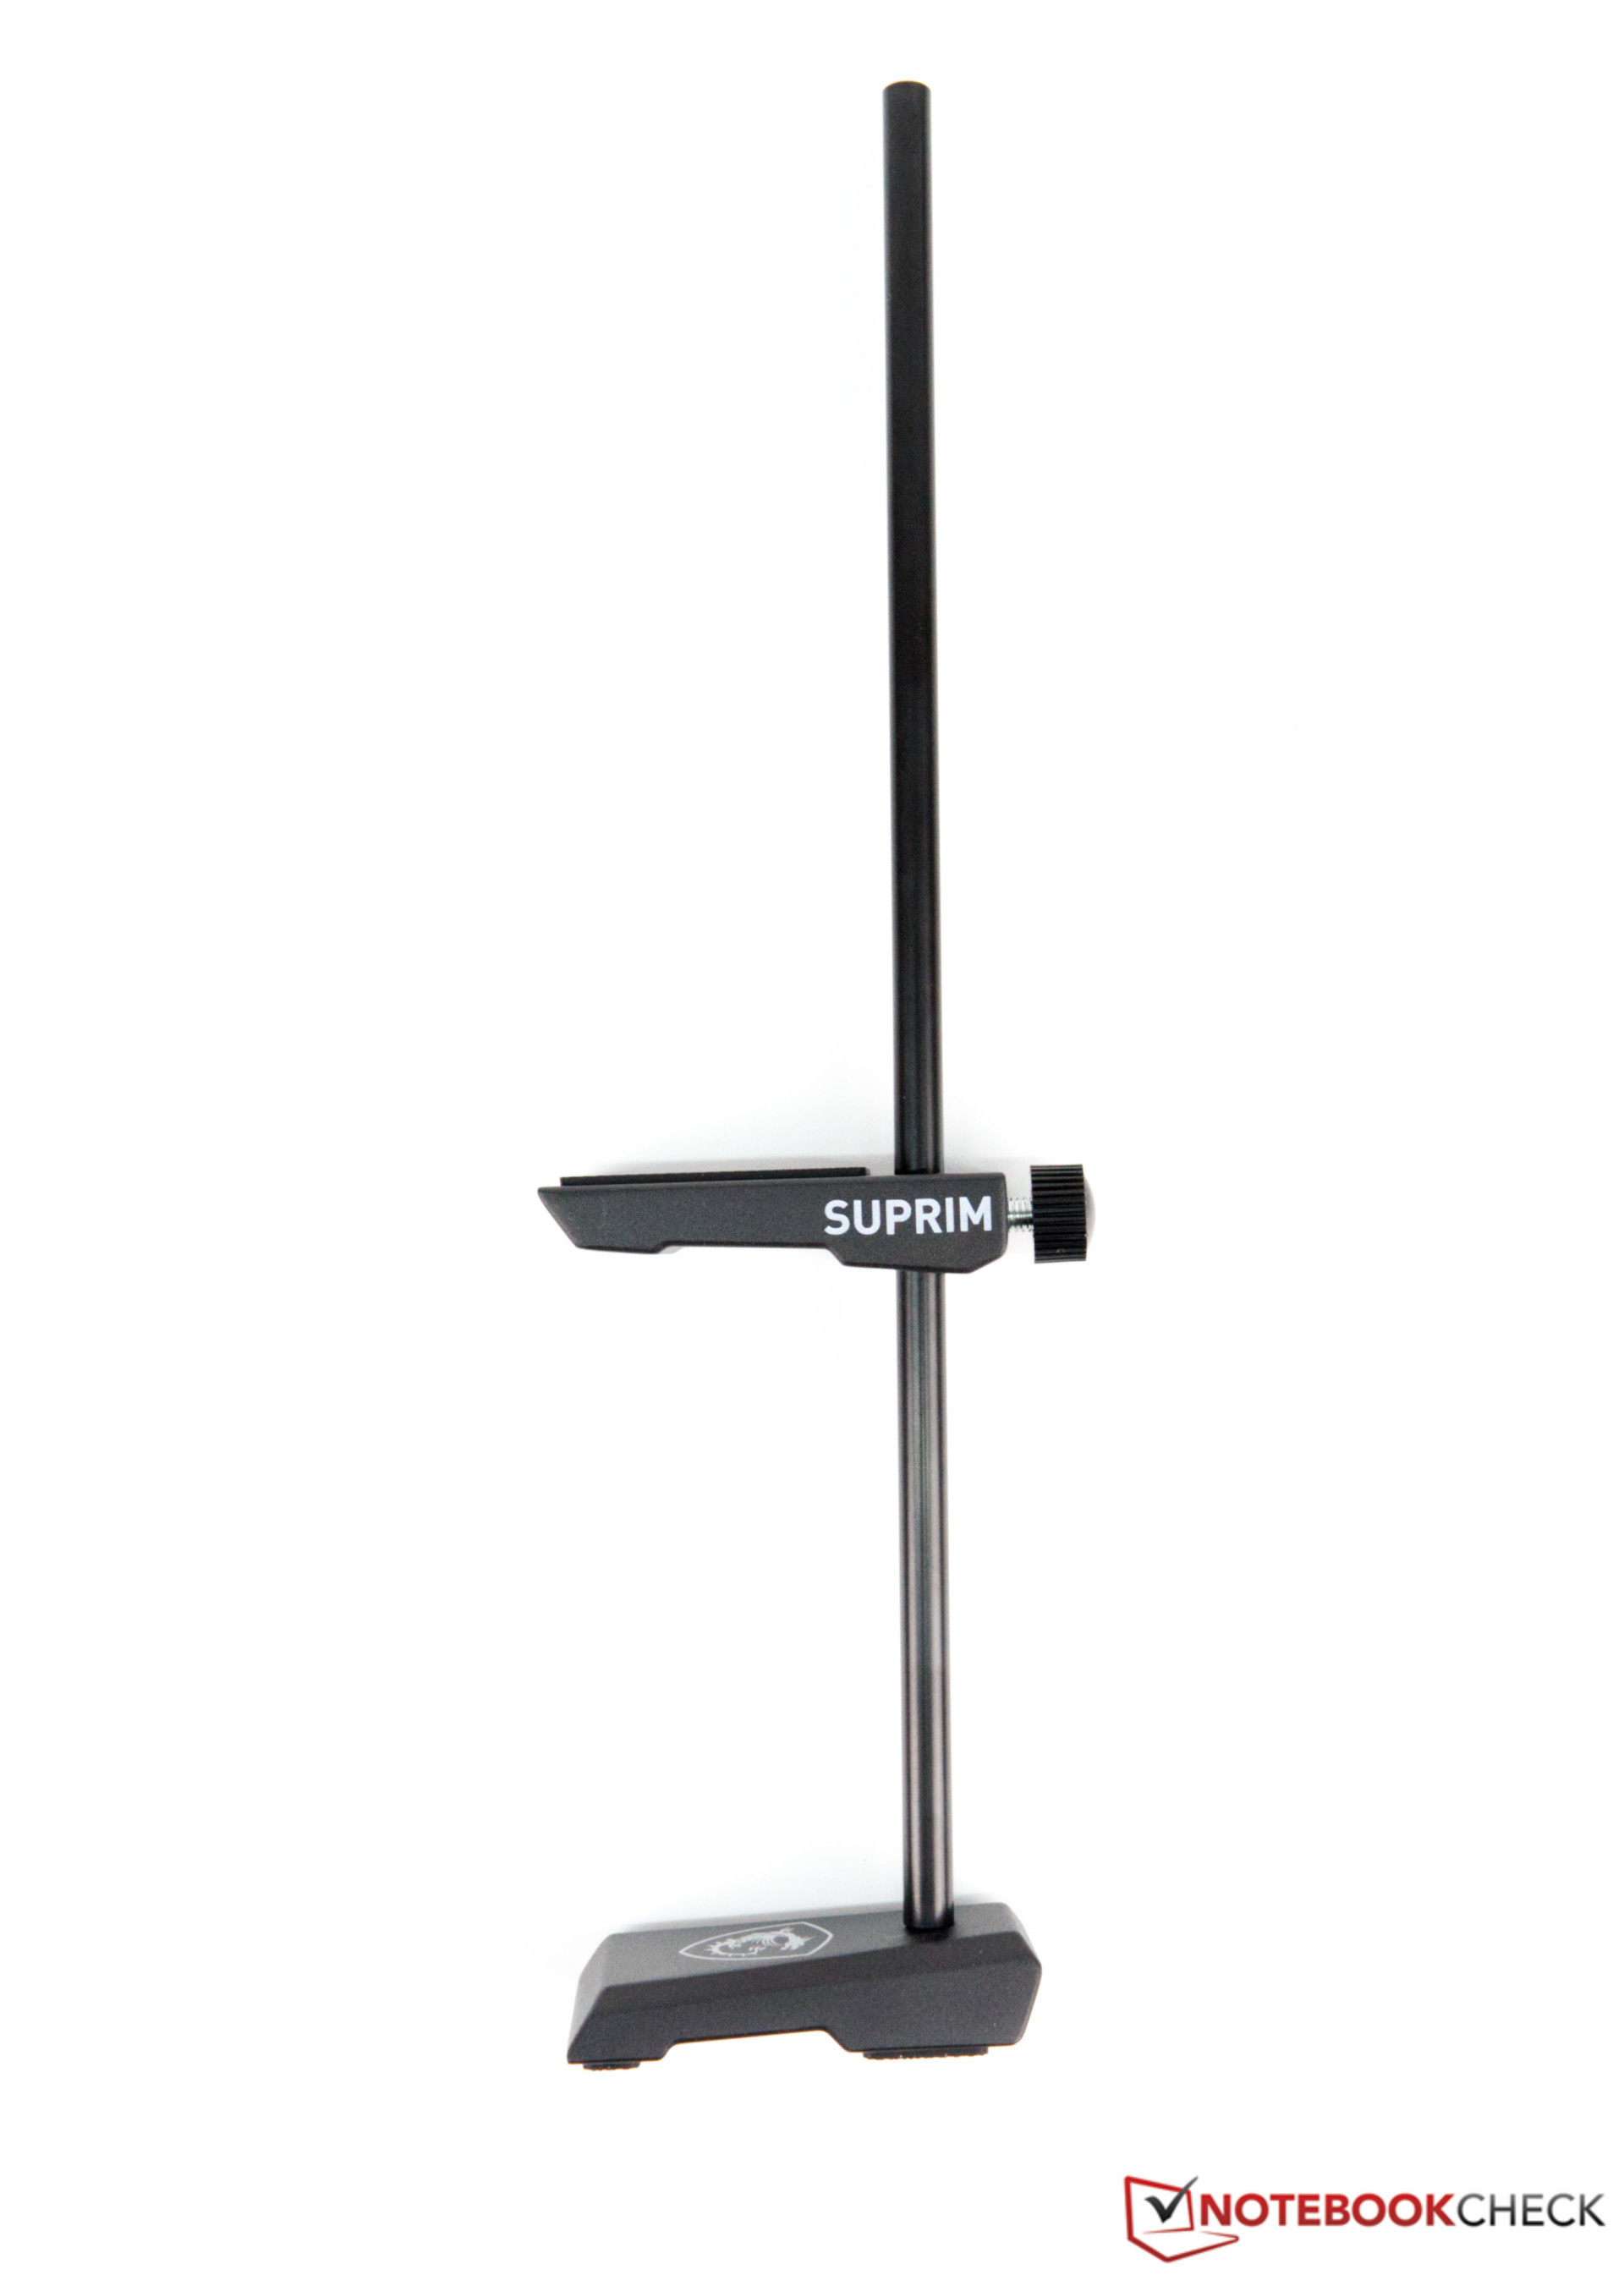
Nous avons examiné le modèle supérieur basé sur la RTX 3090 et nous étions très enthousiastes quant aux résultats après avoir déballé la carte graphique. Certes, il devrait y avoir beaucoup de place dans le boîtier, car la carte graphique mesure une énorme longueur totale de 34 centimètres. Le poids total est de 1,7 kg, c'est pourquoi MSI a également prévu un support séparé pour stabiliser la carte graphique à la fin en raison de la longueur excessive. Sans ce support, la carte graphique s'affaisse beaucoup dans le boîtier, ce qui fait craindre que le slot PCIe soit endommagé à long terme. Il ne devrait pas y avoir de problèmes si vous la montez verticalement. De plus, le refroidisseur est très épais, de sorte qu'il faut trois emplacements au total
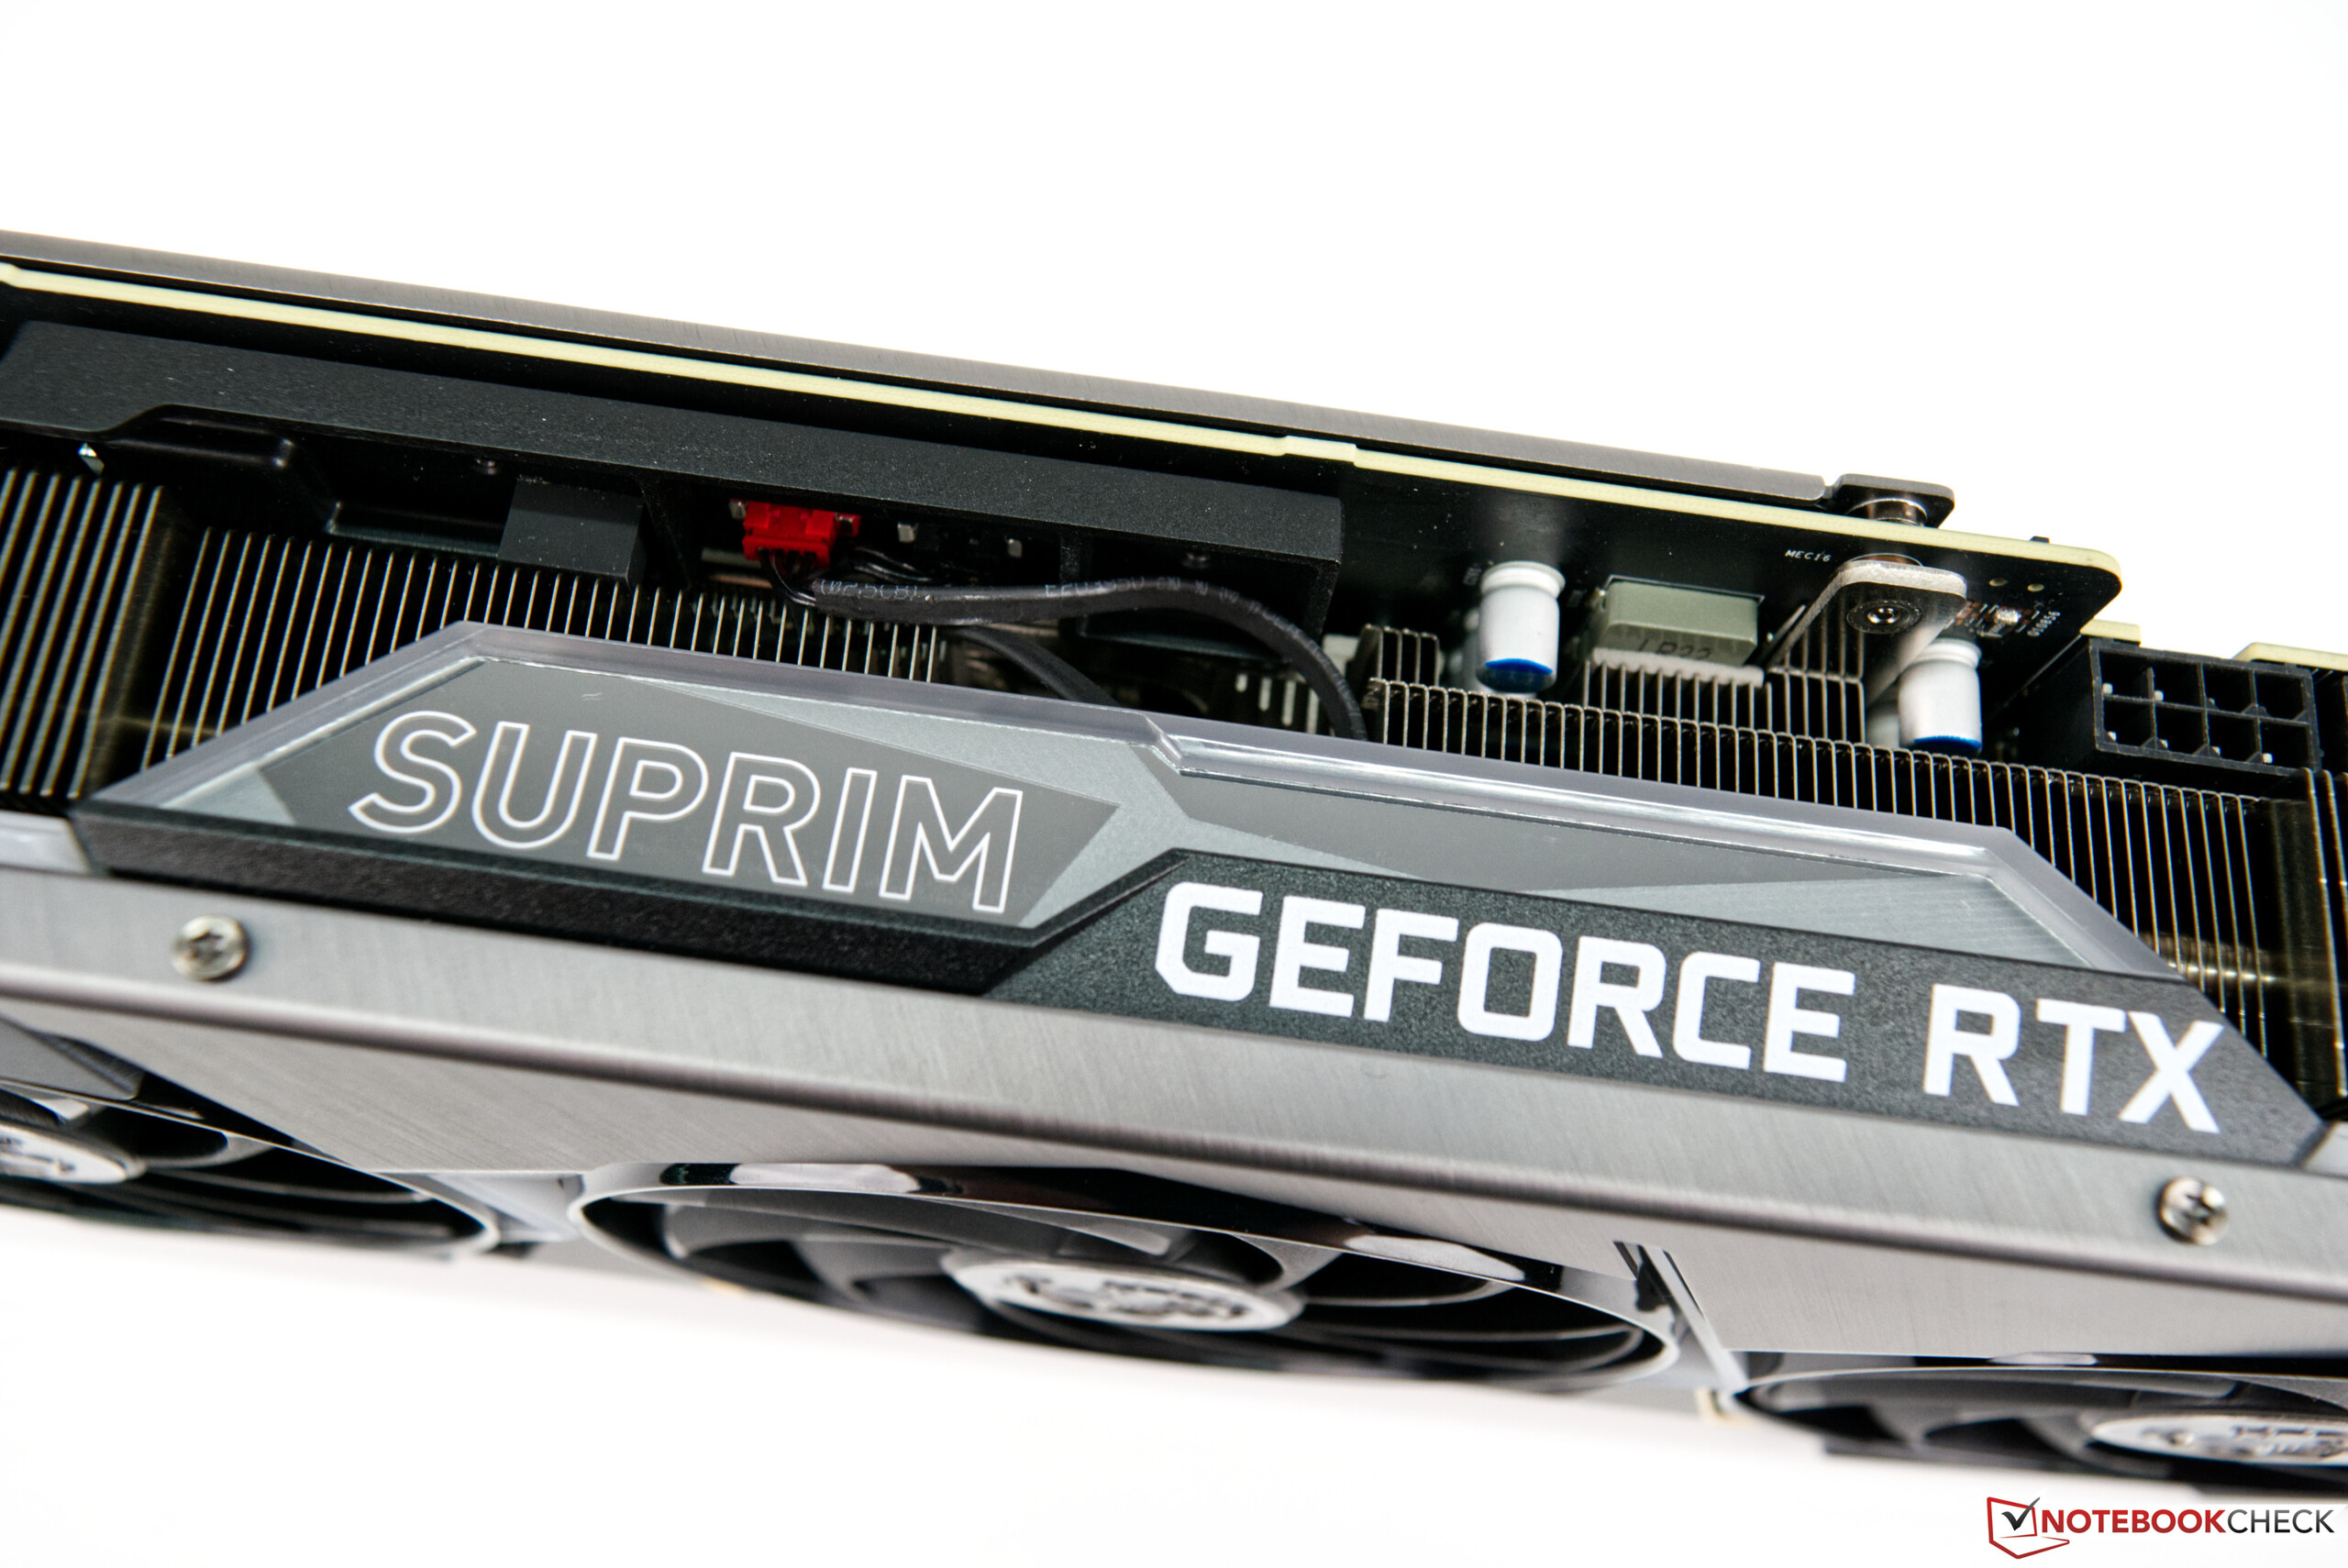
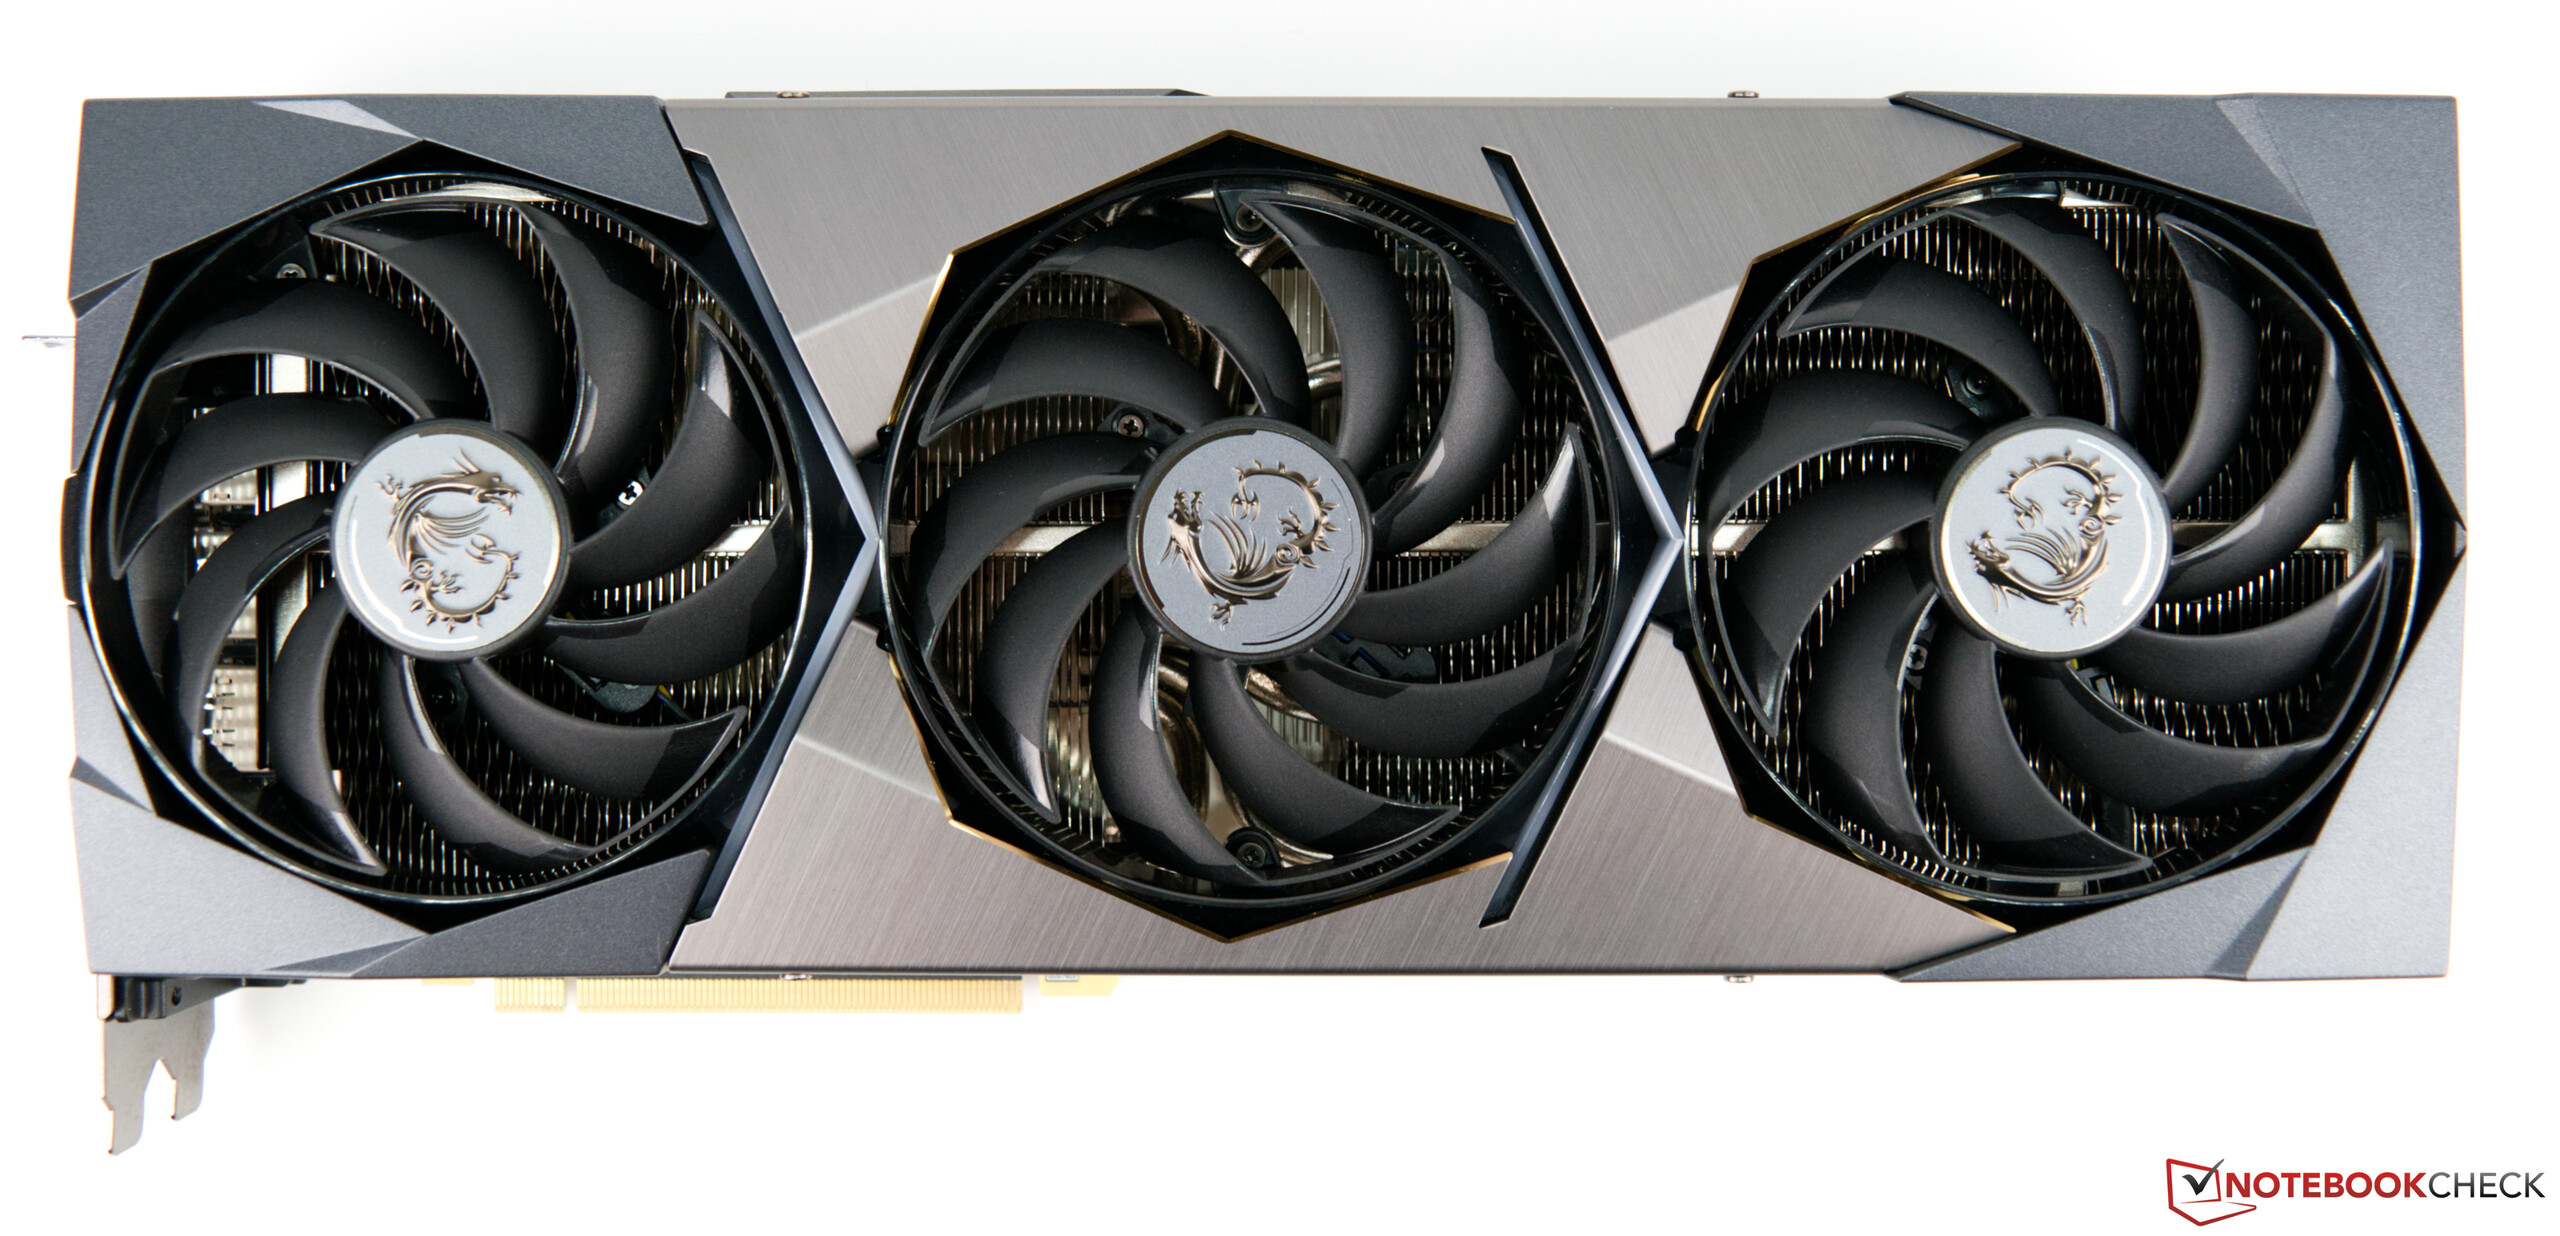
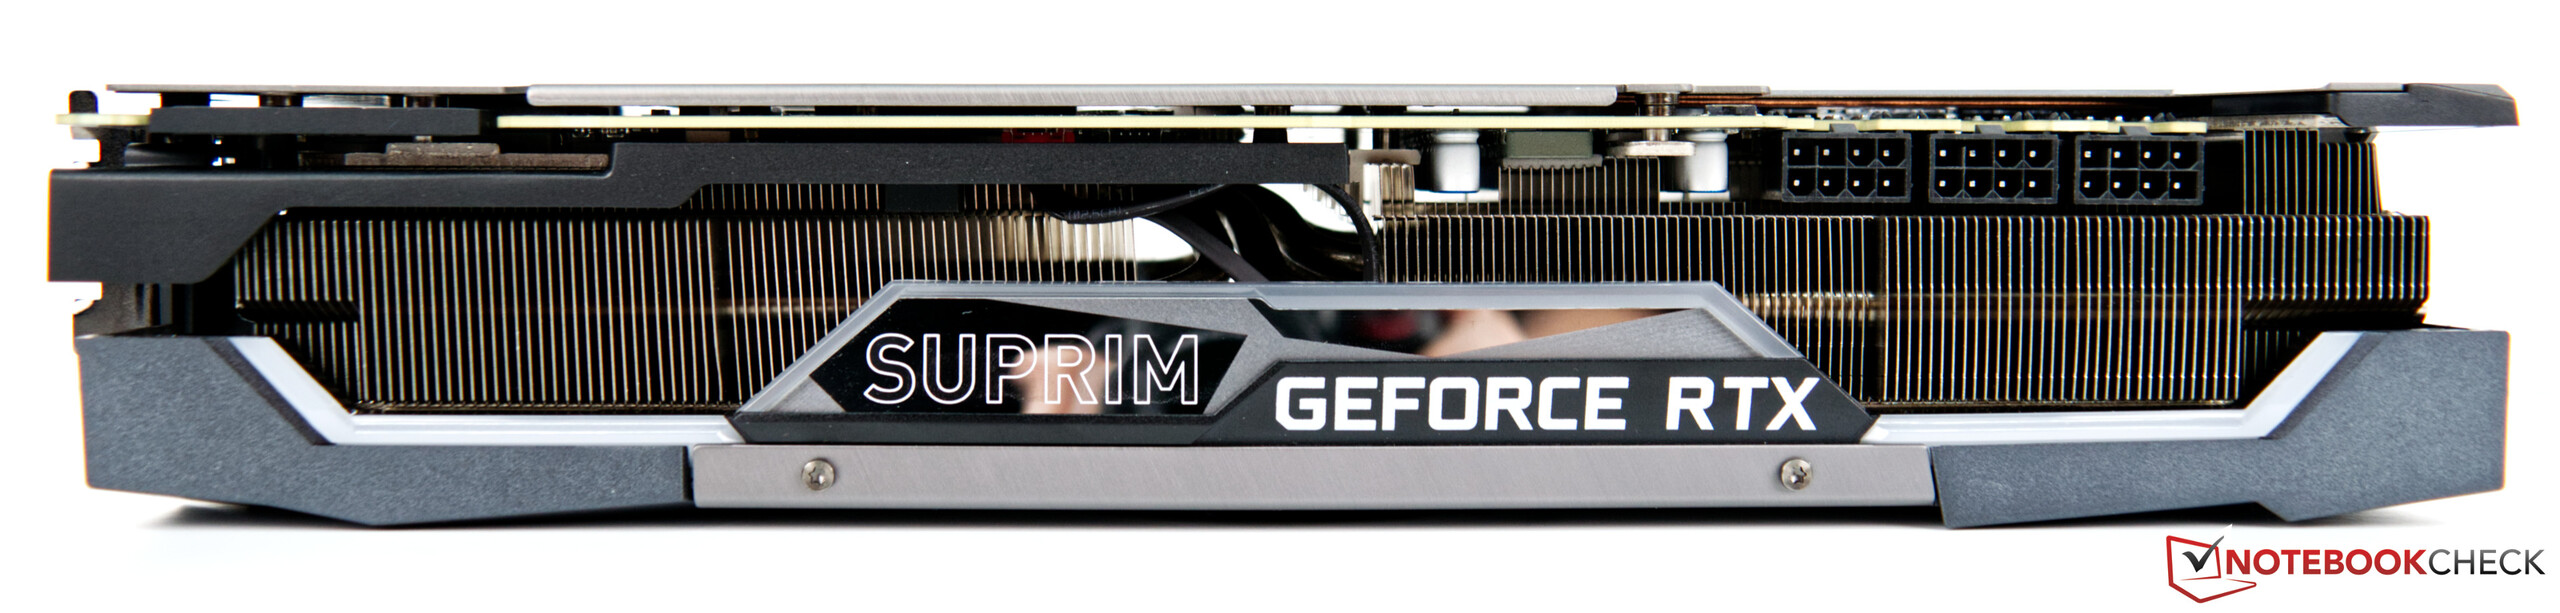
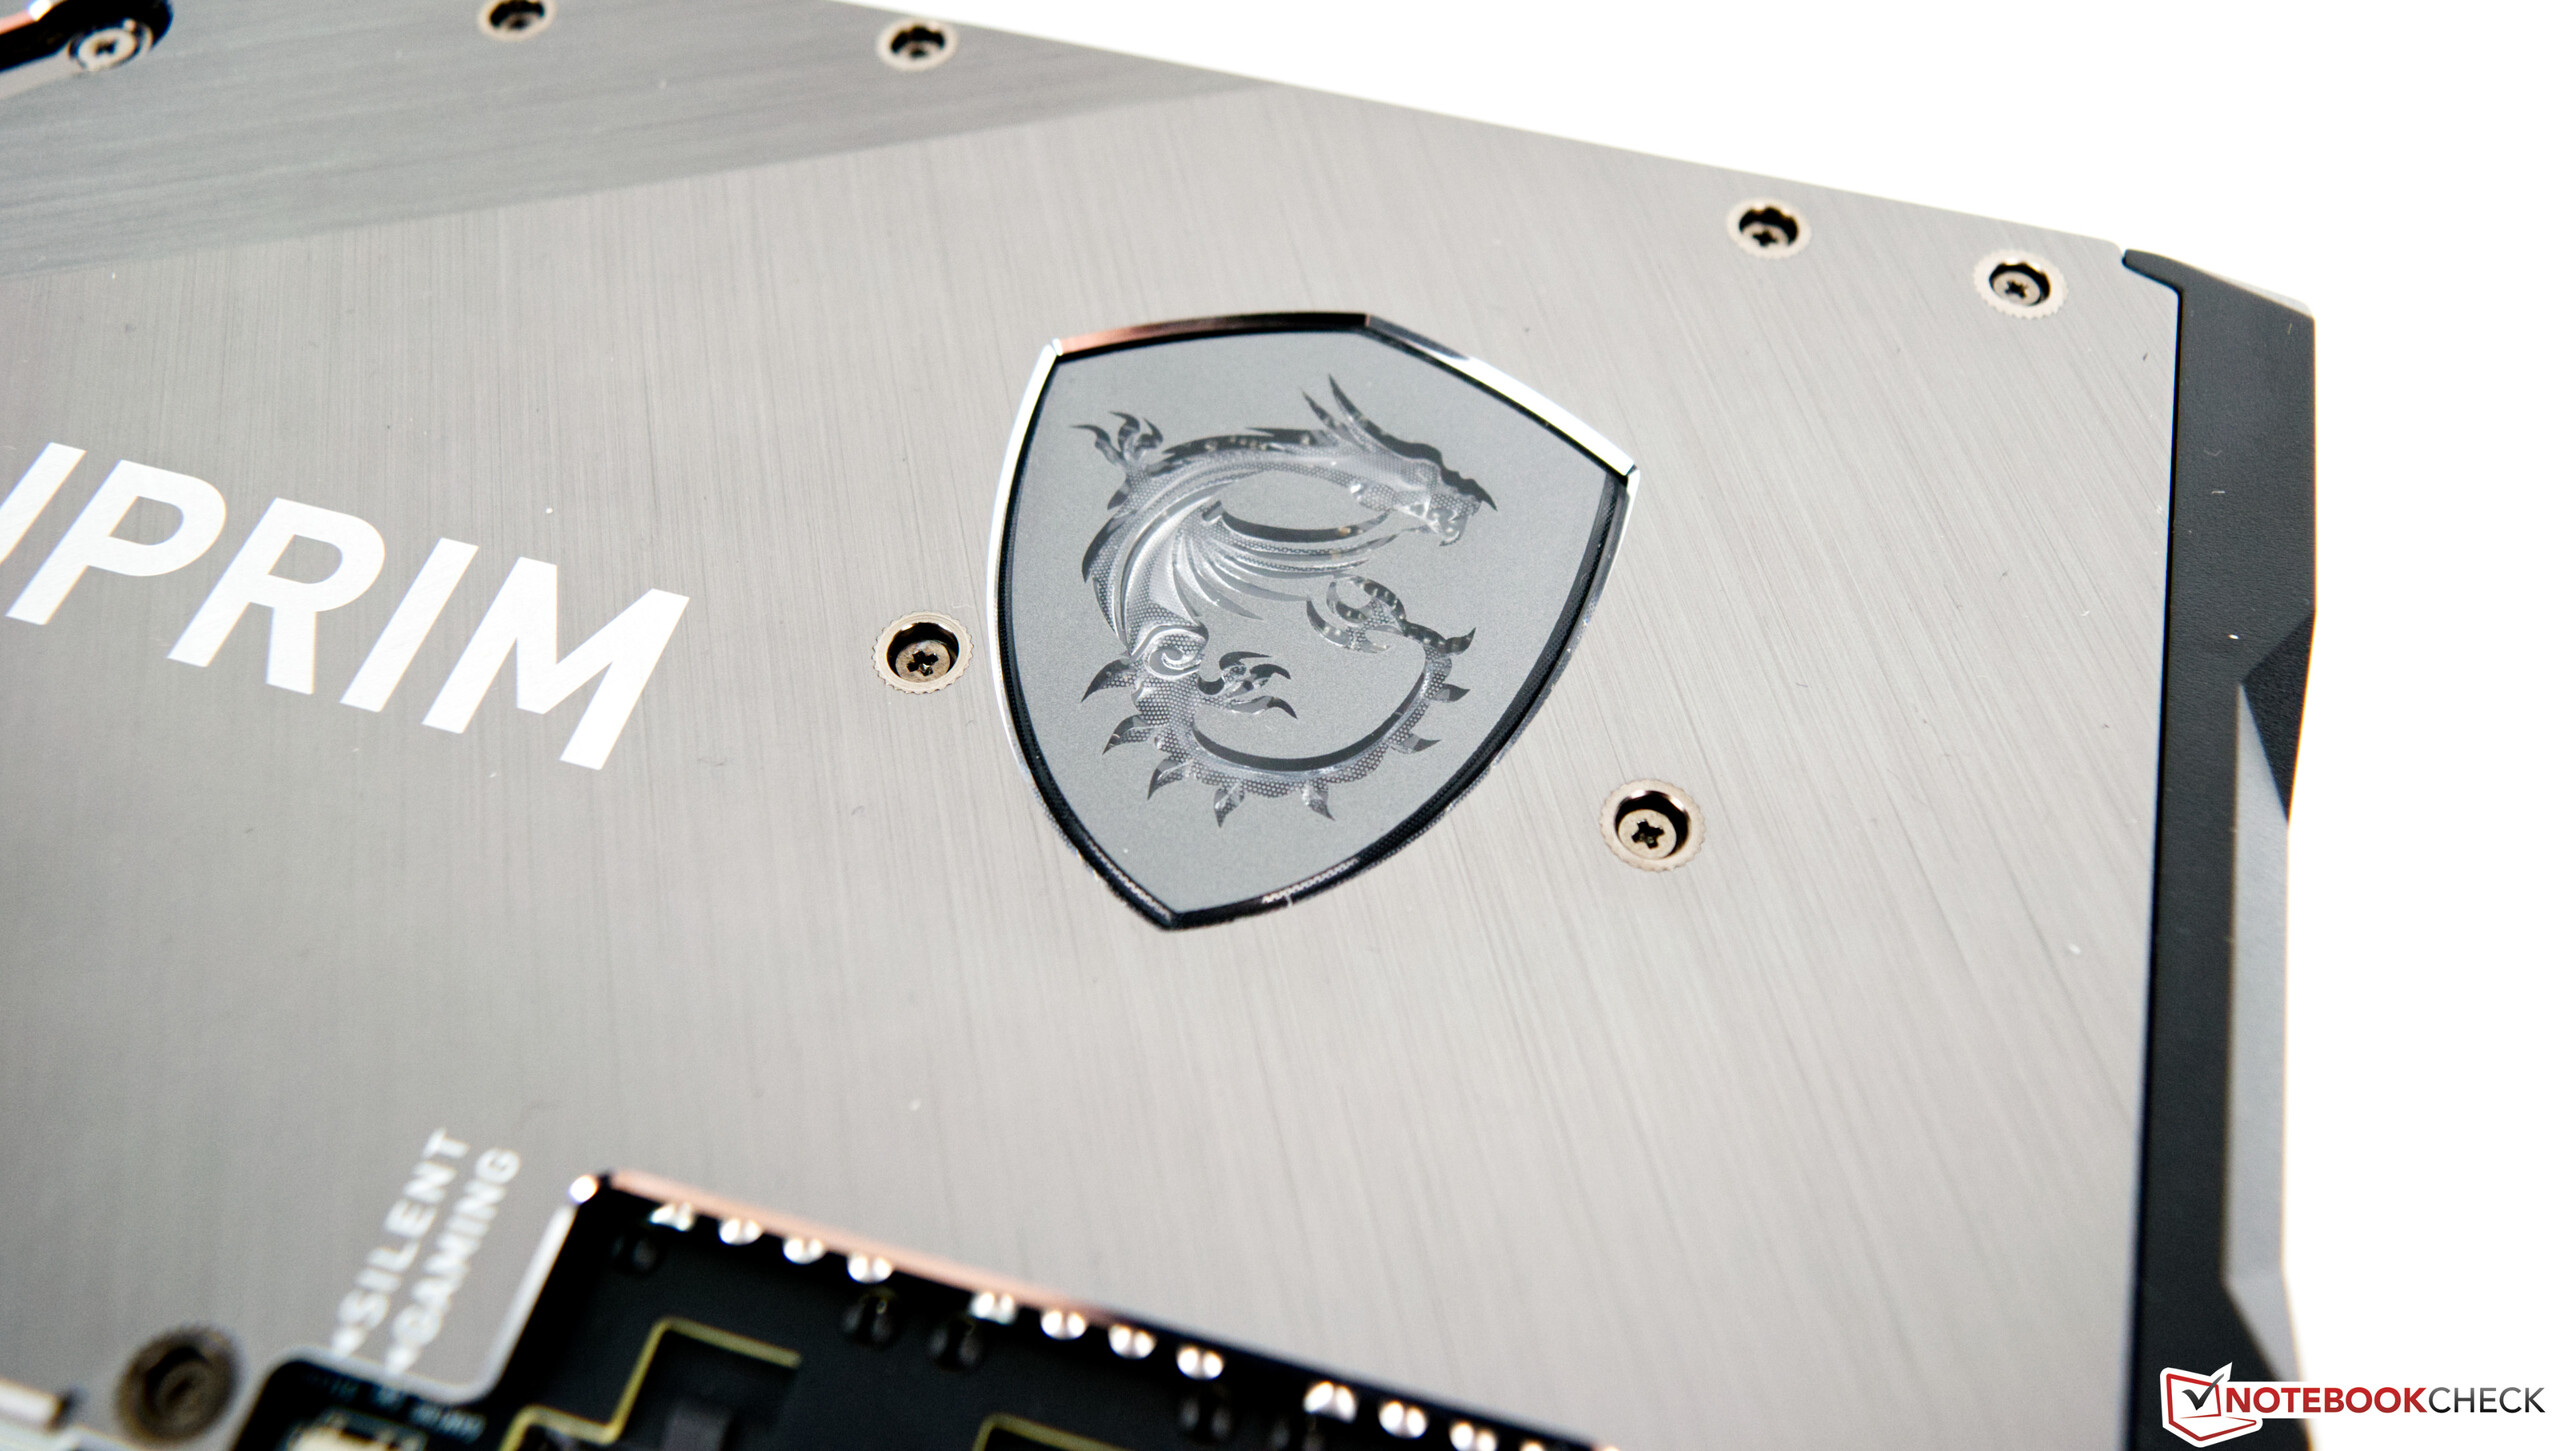
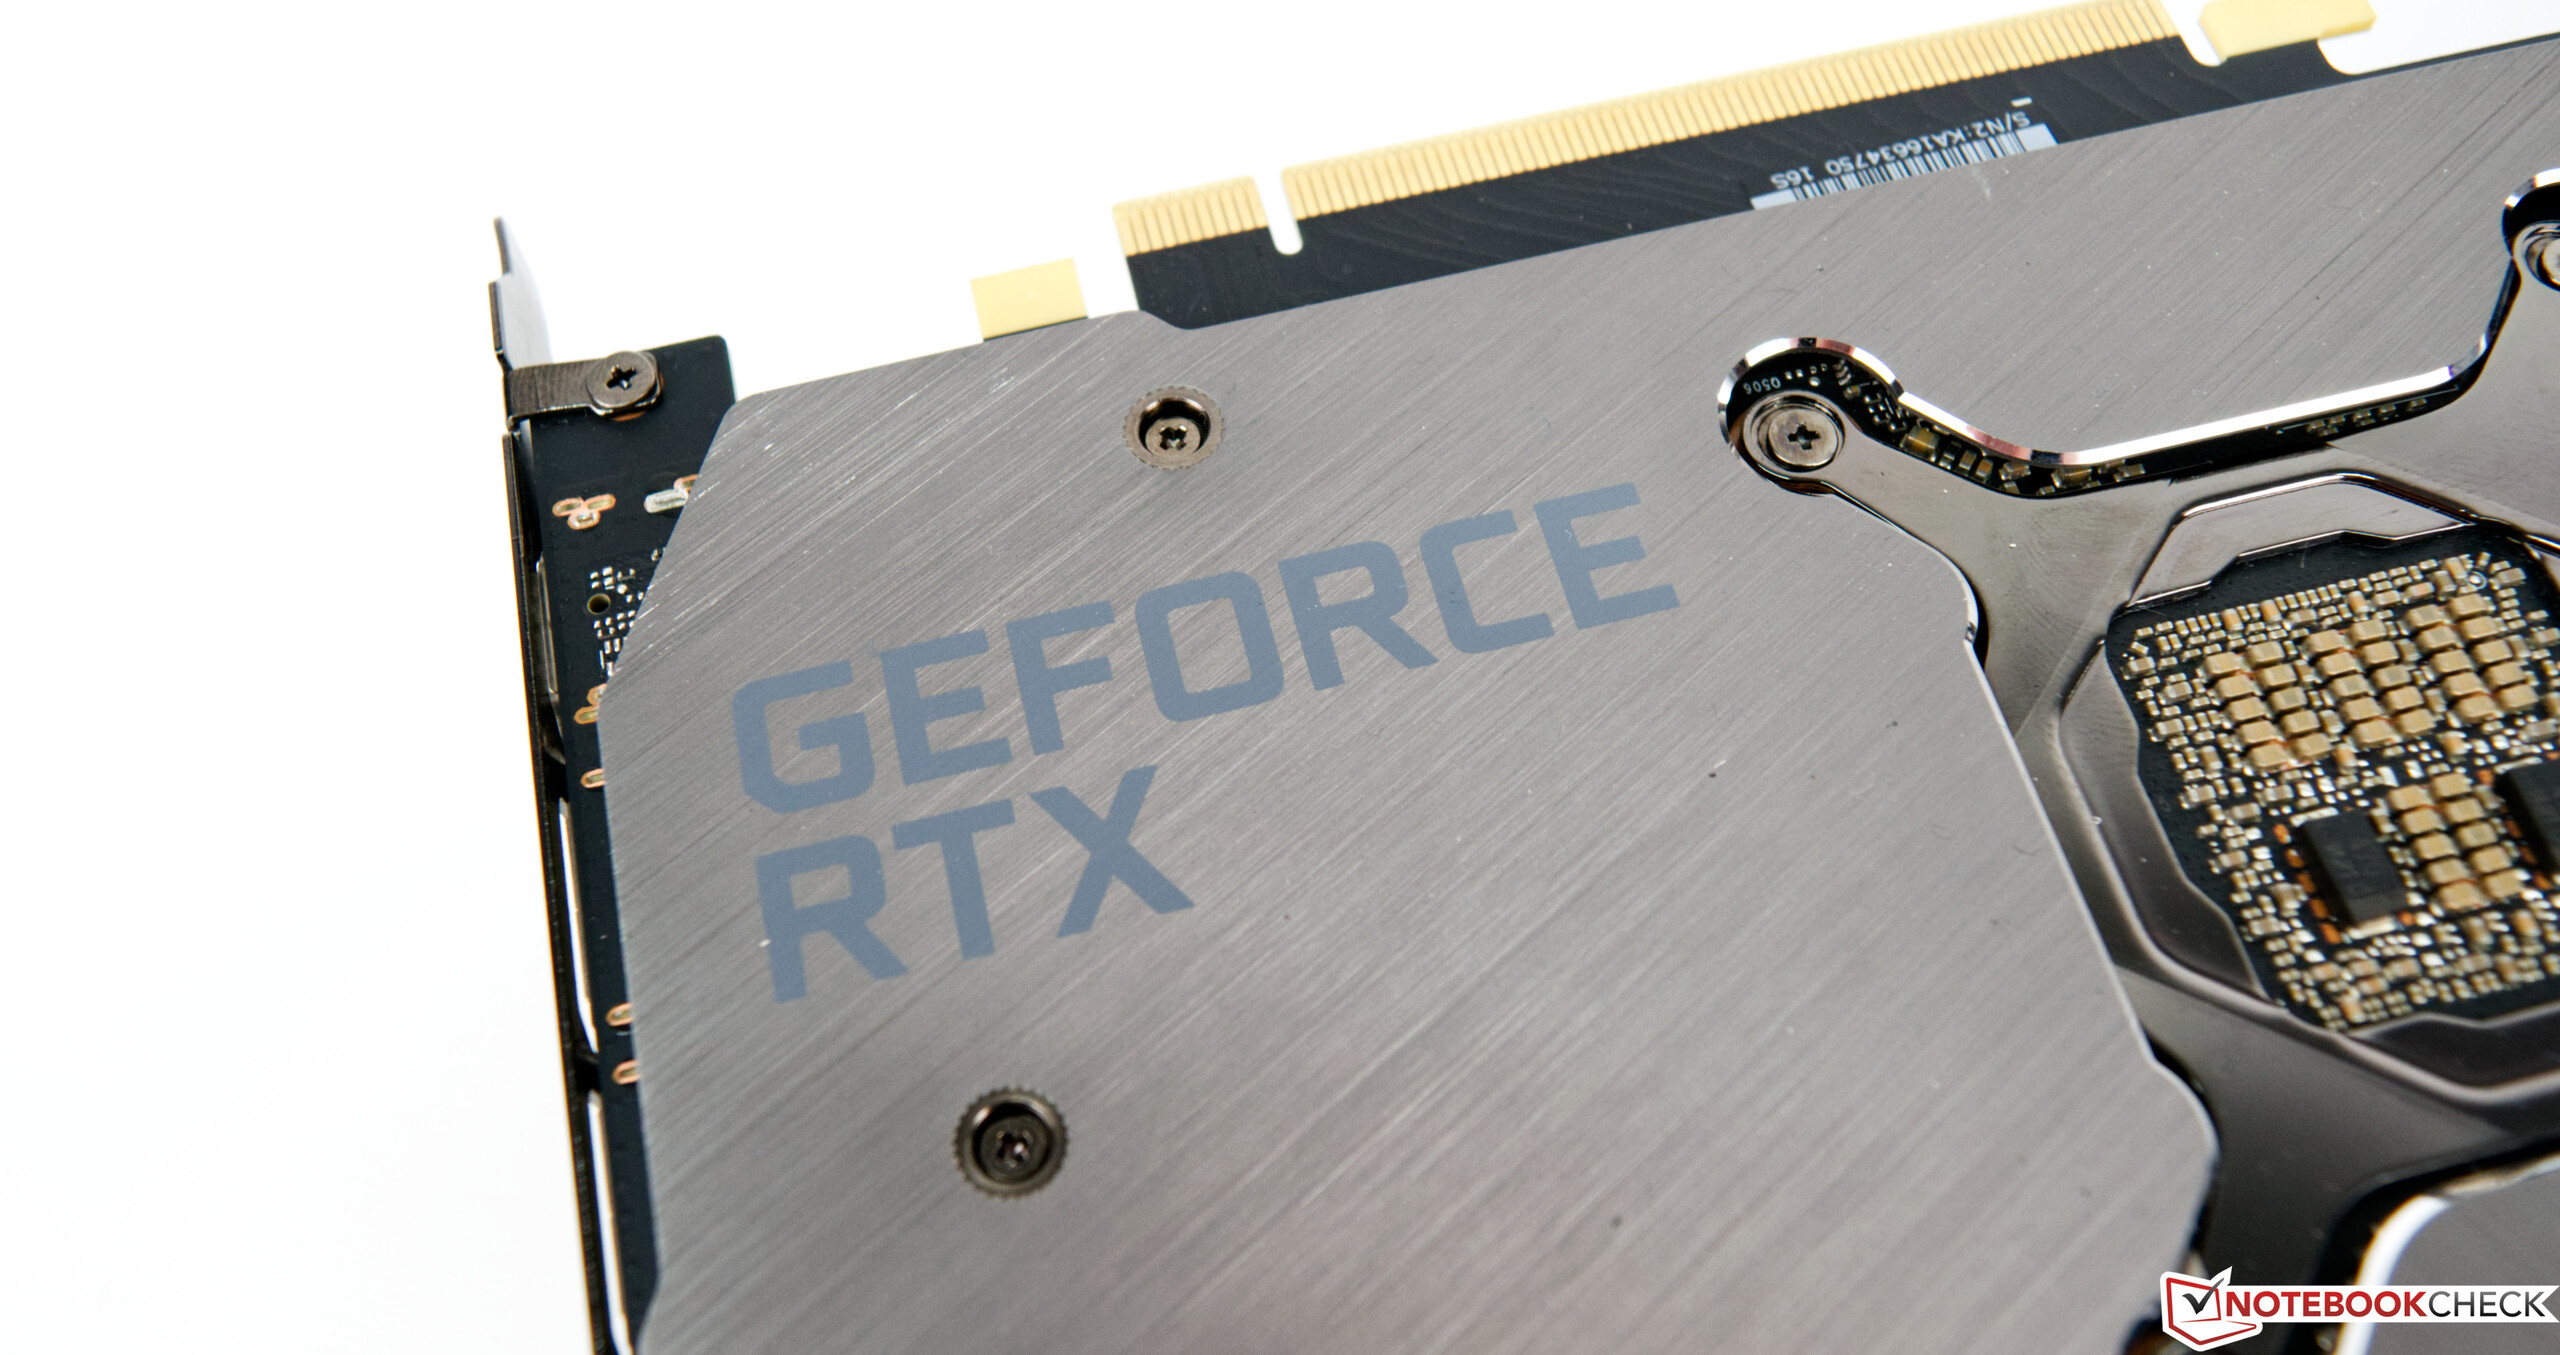
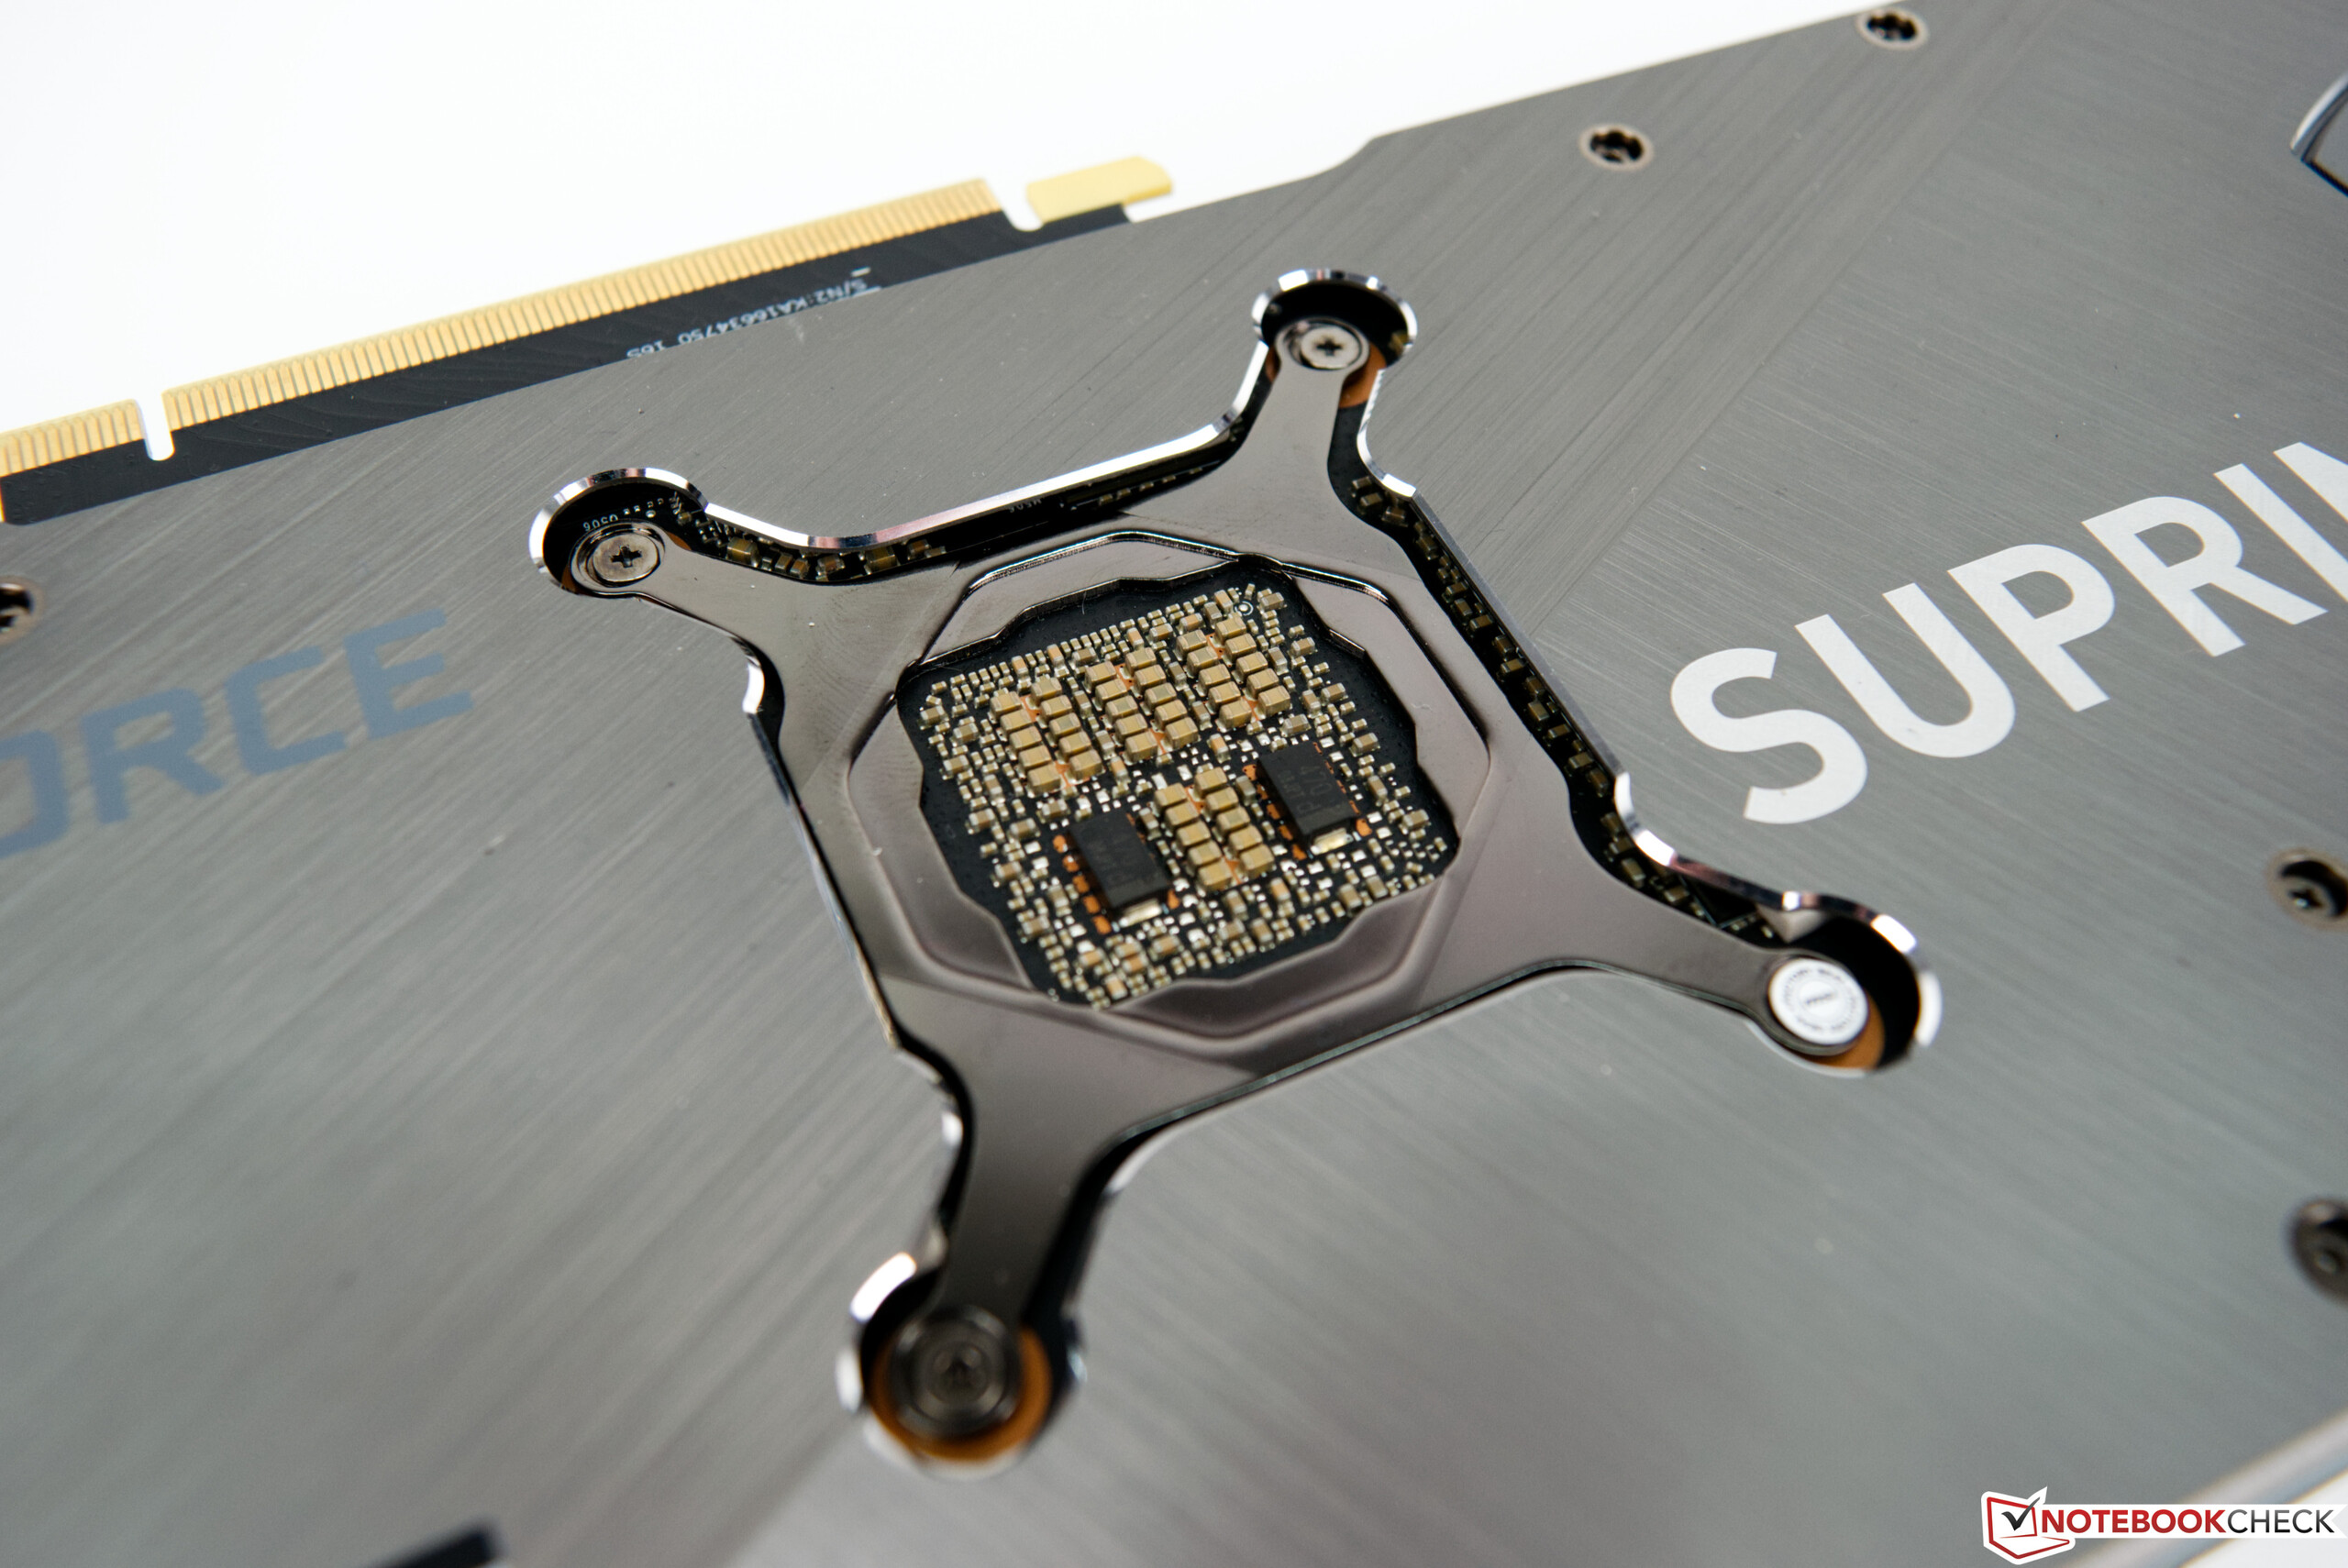
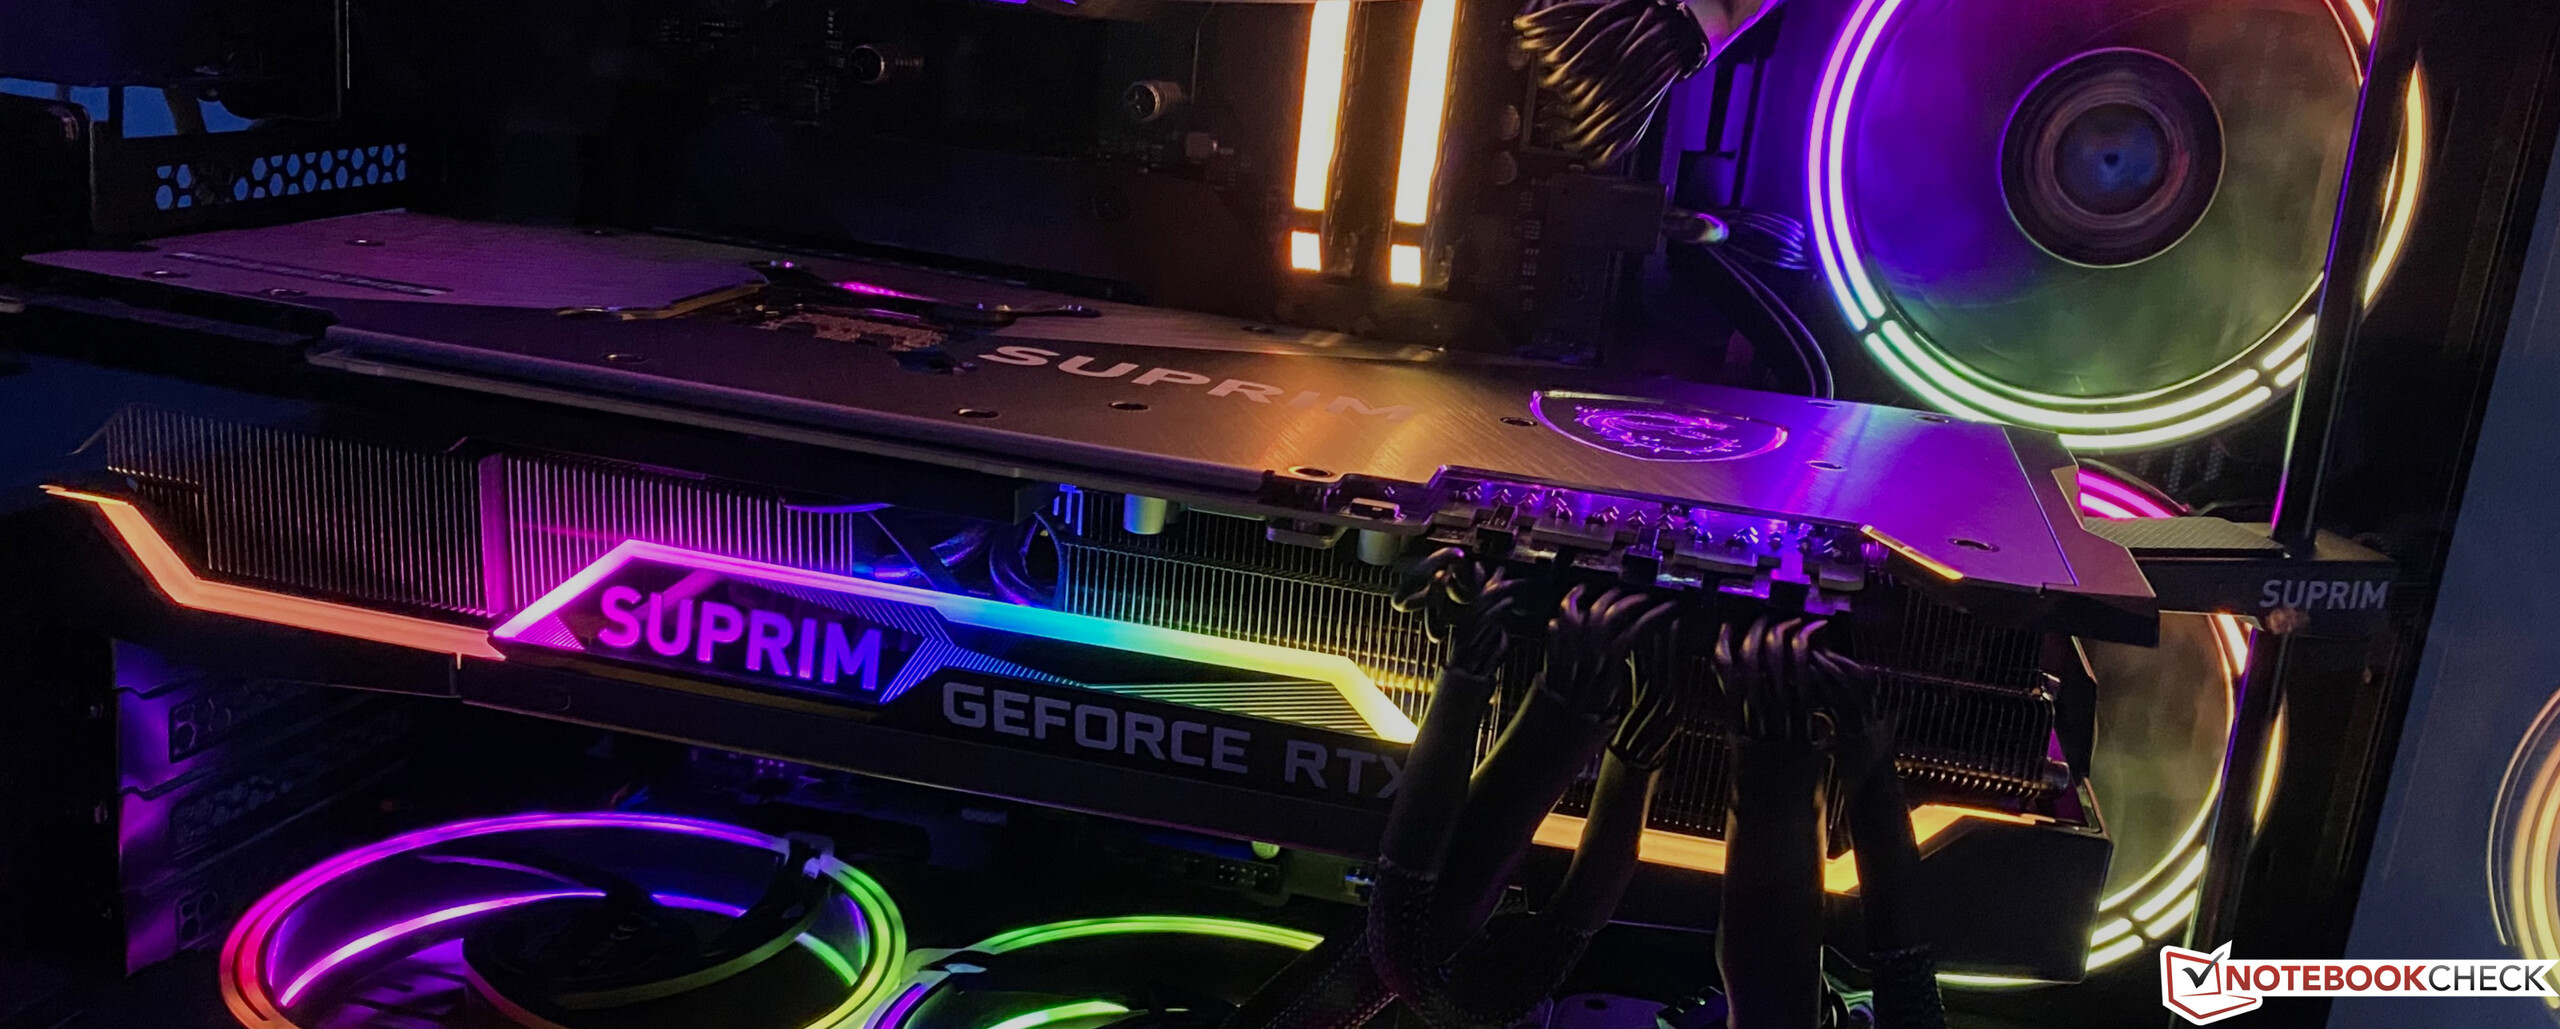
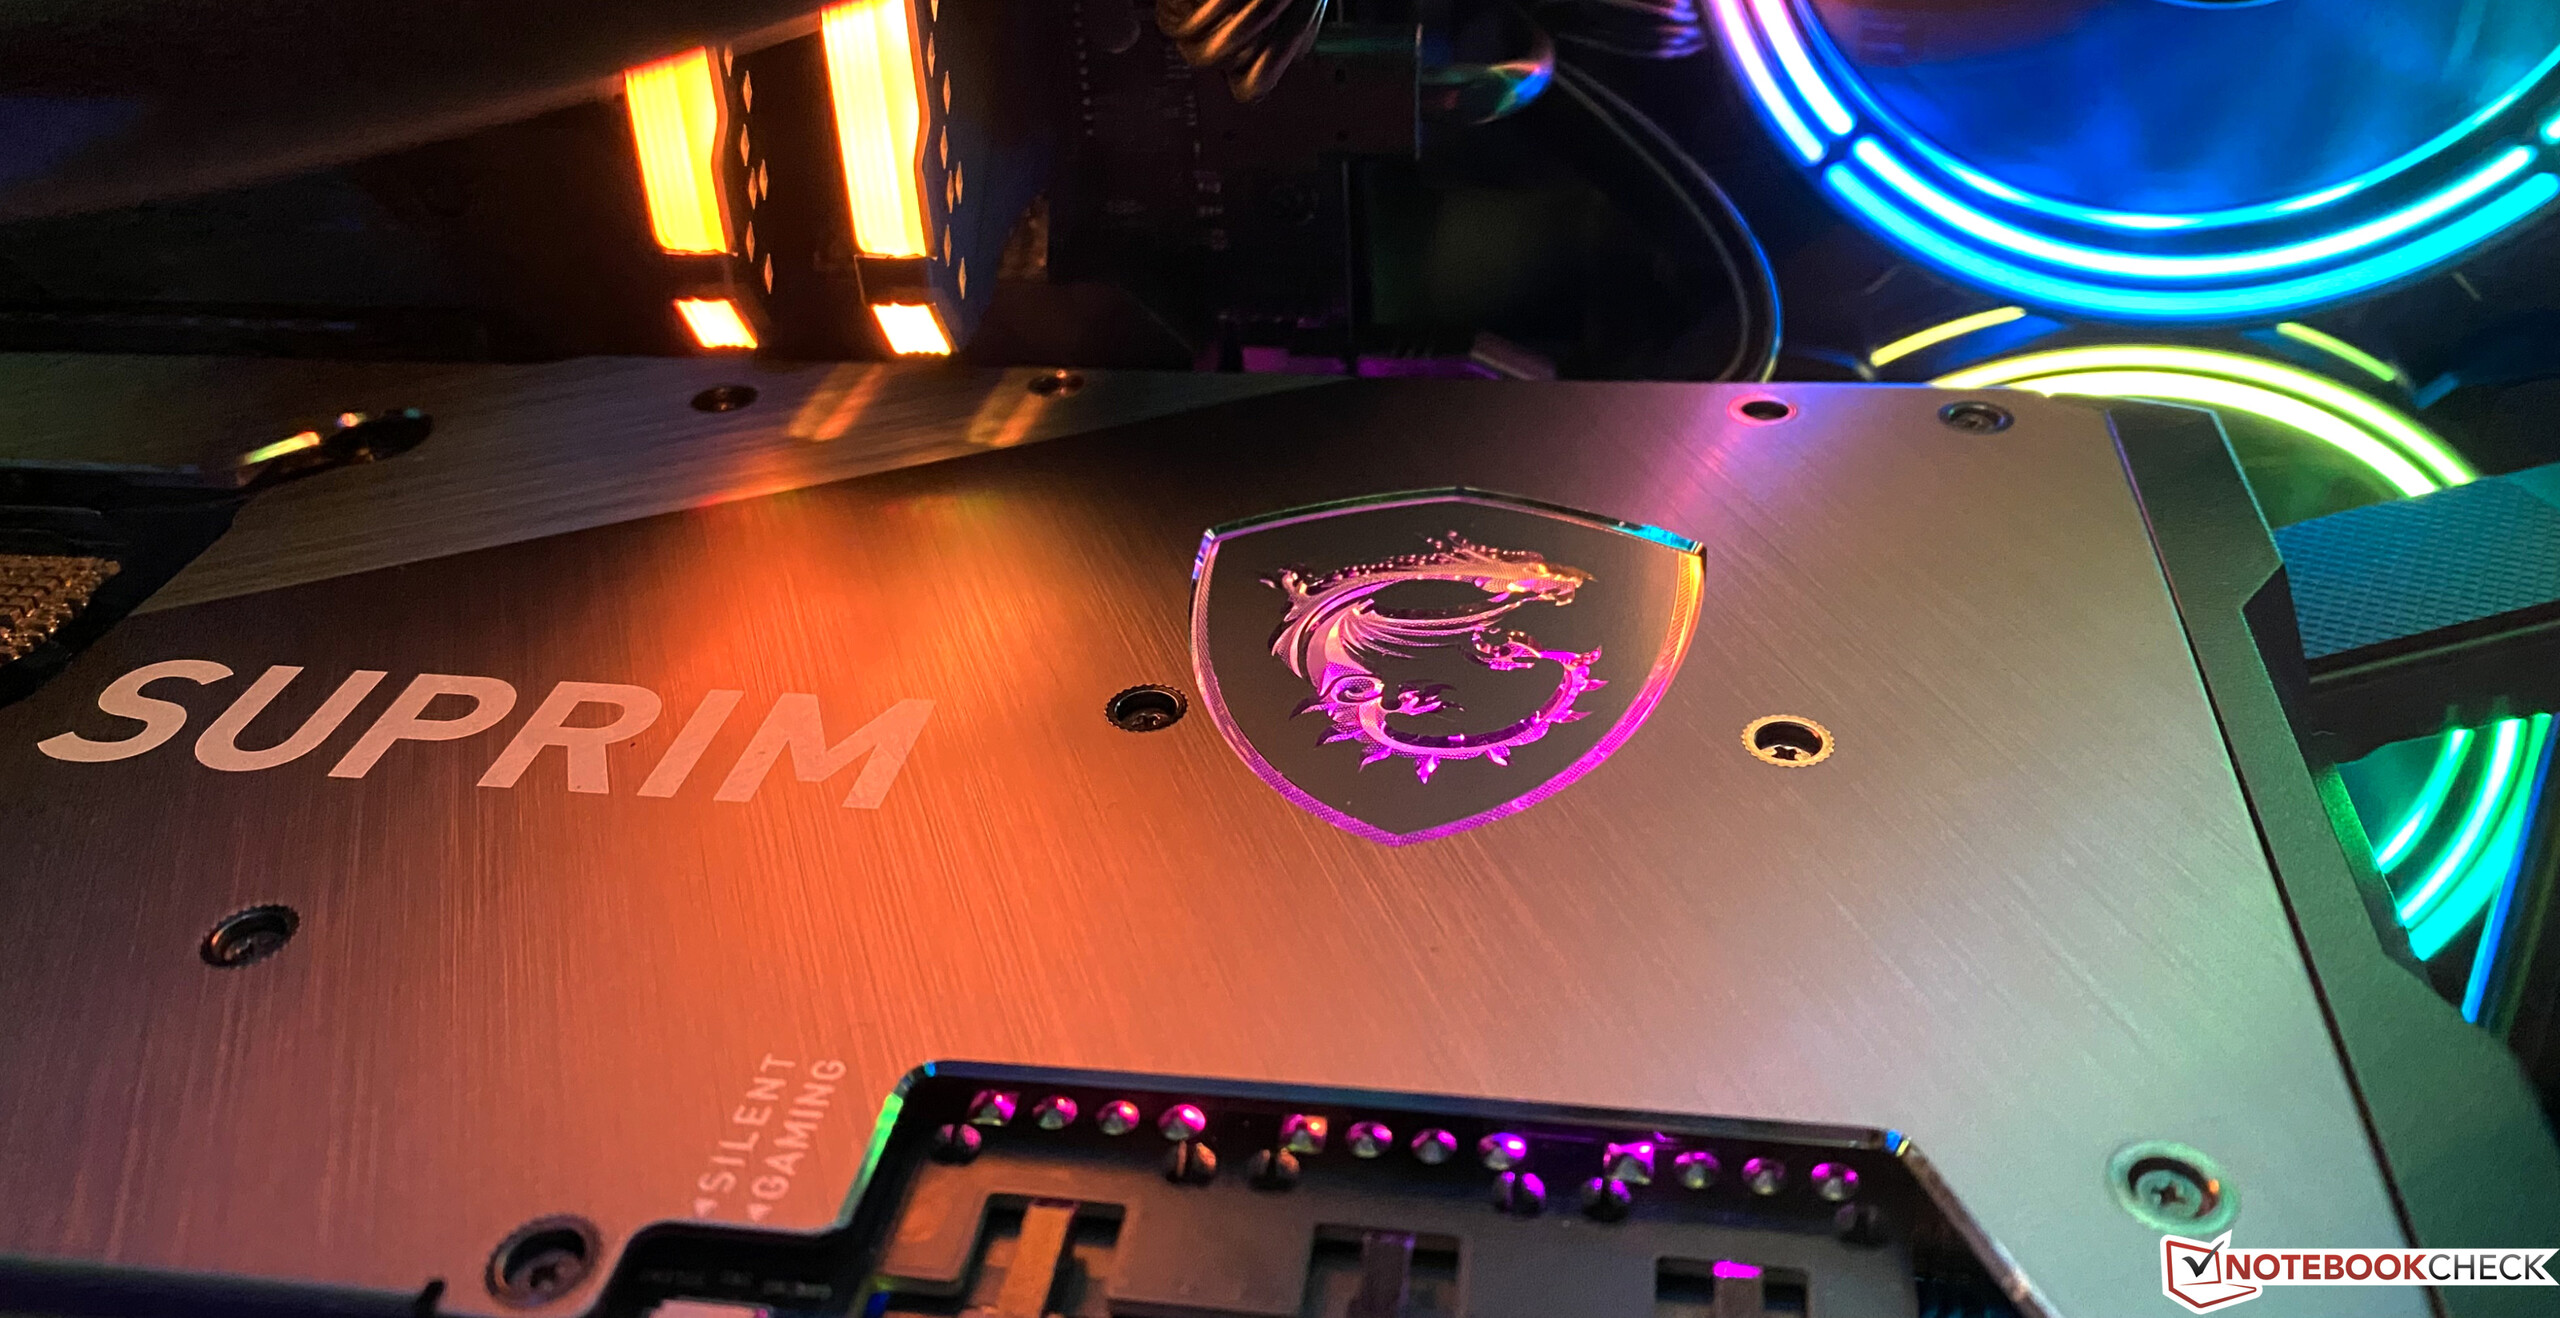
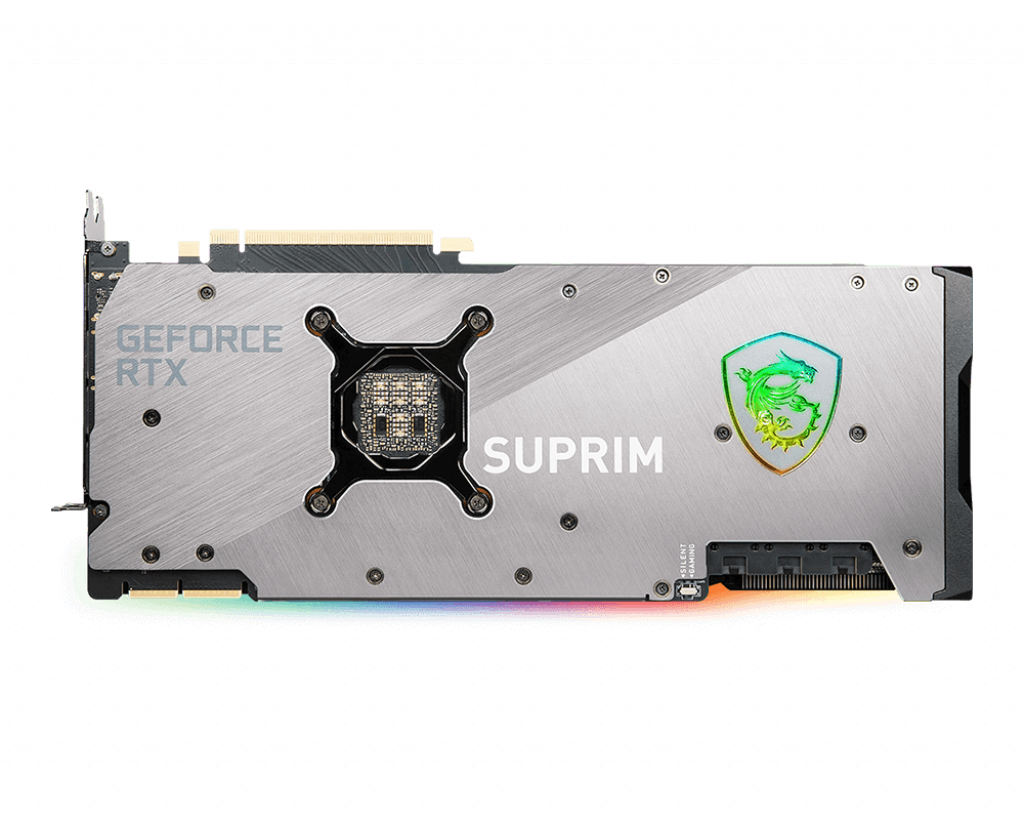
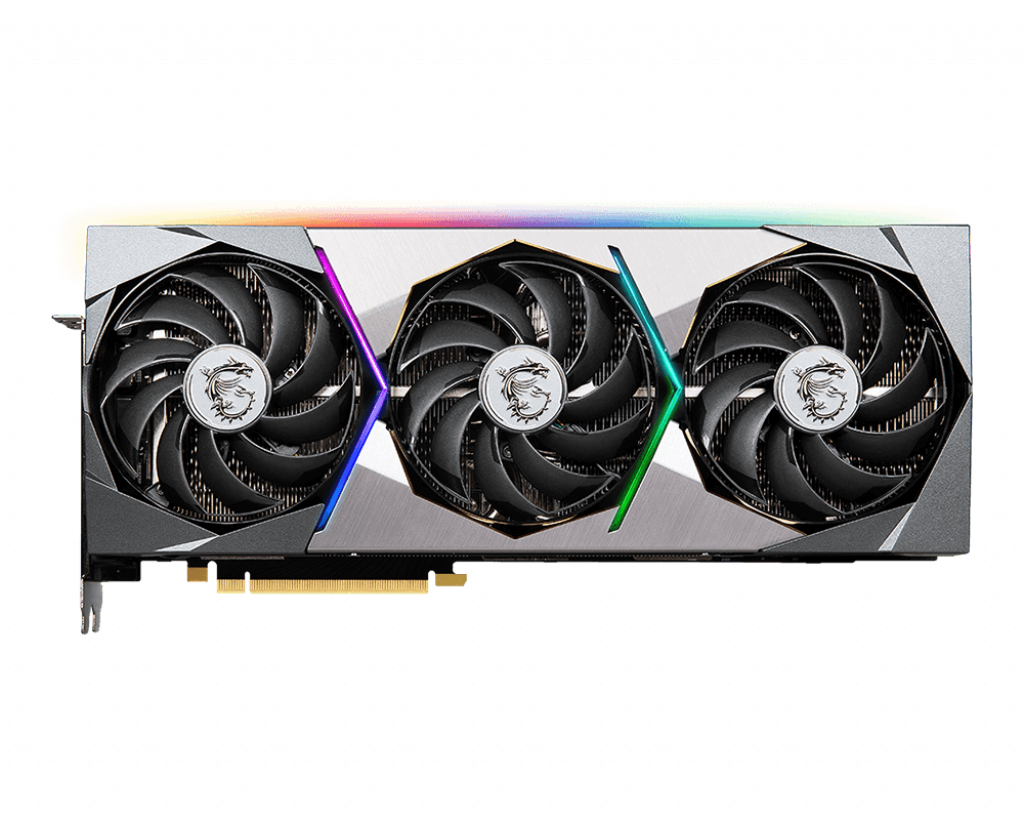
La qualité de construction du MSI GeForce RTX 3090 Suprim X est très élevée. Cette carte graphique a un aspect et un toucher très haut de gamme. L'avant et l'arrière sont en aluminium, bien qu'il y ait également quelques éléments en plastique à l'avant. Cependant, ceux-ci ne gâchent en rien l'impression de haute qualité. Au total, sept puissants caloducs distribuent la chaleur à l'énorme dissipateur thermique, car il faut aussi contrôler les 420 watts. En outre, vous pouvez toujours compter sur un éclairage RGB. Le MSI GeForce RTX 3090 Suprim X possède de nombreux éléments lumineux qui supplient littéralement pour un boîtier avec un panneau latéral de fenêtre
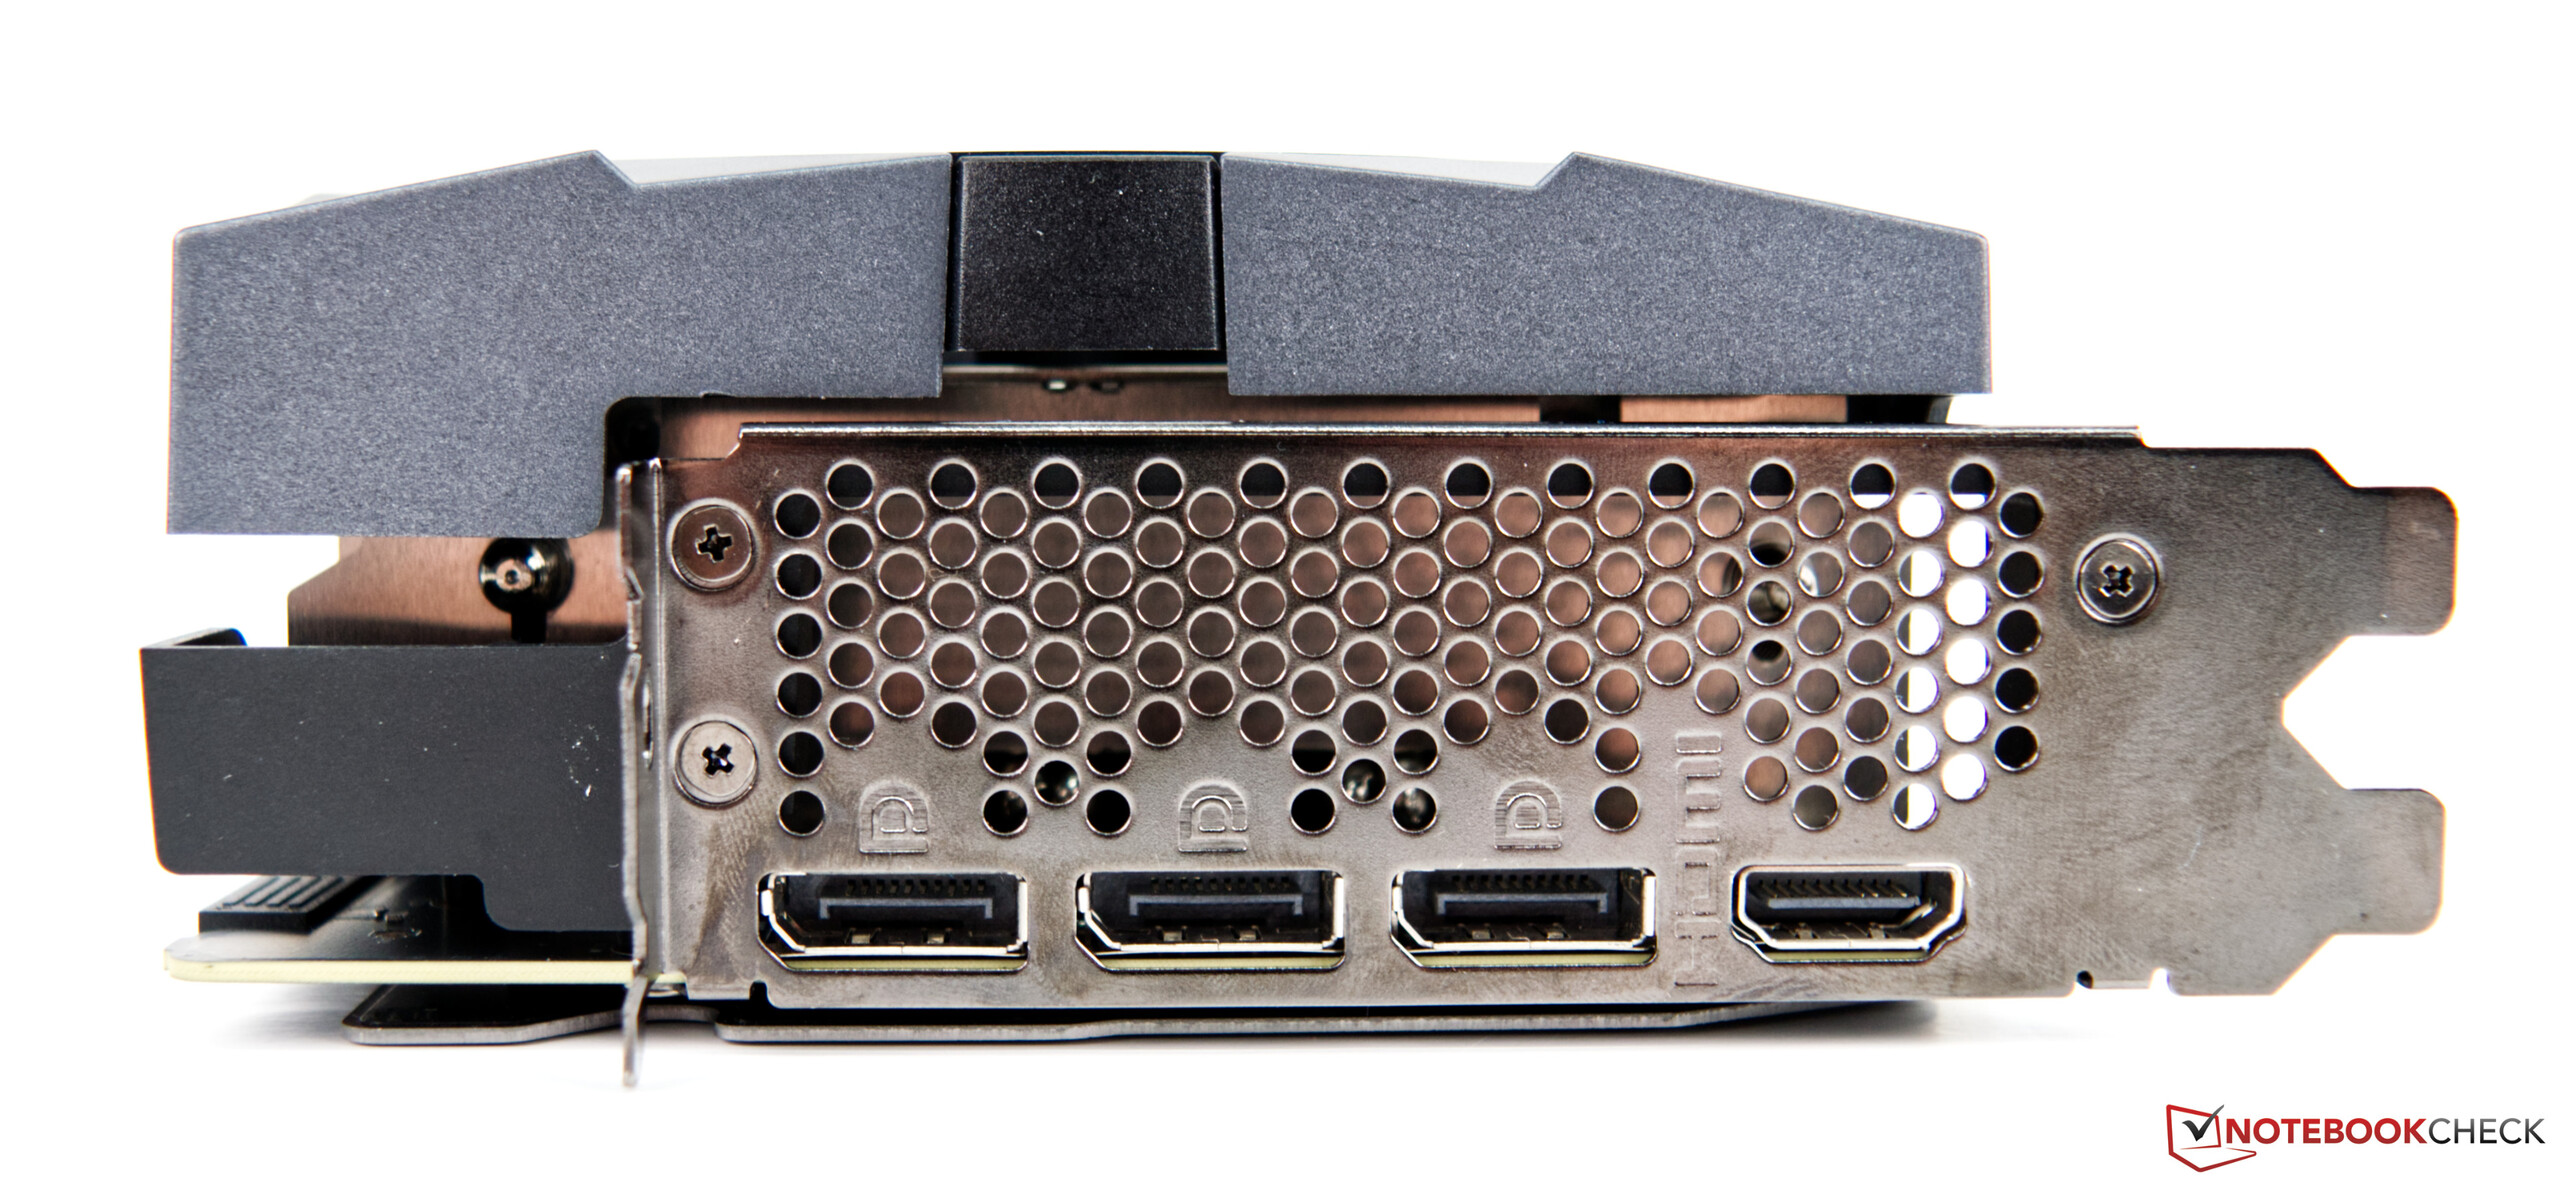
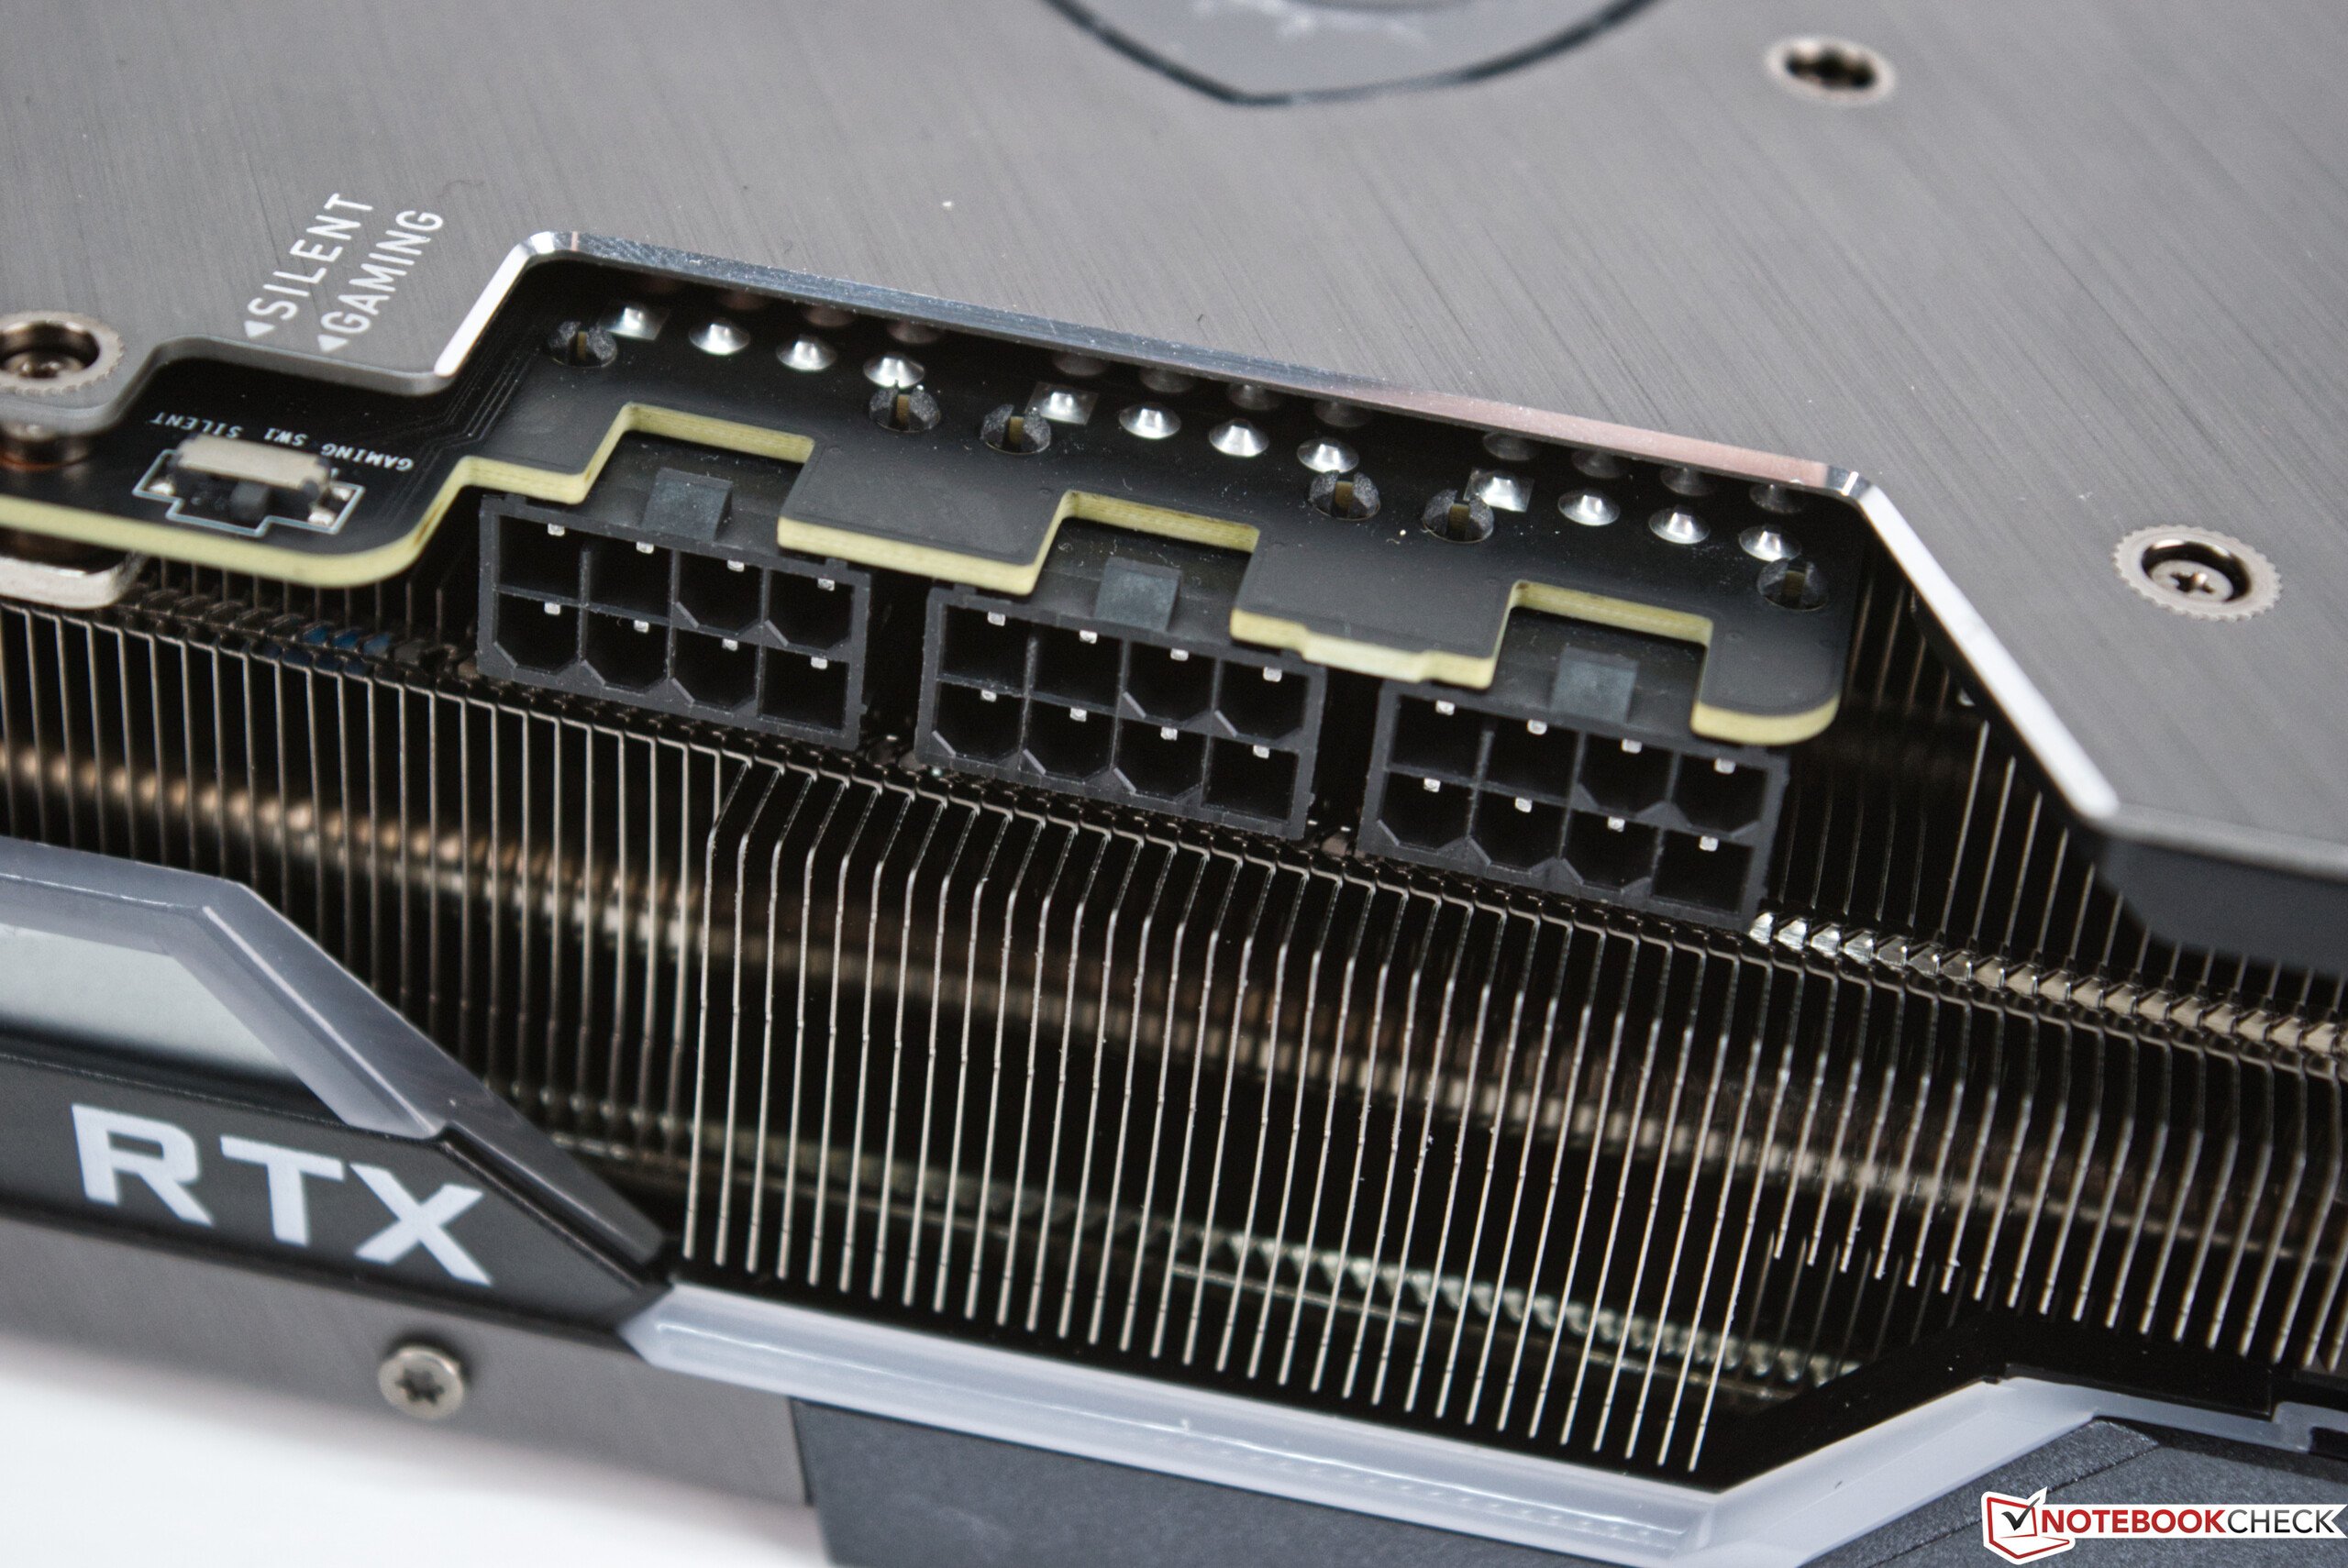
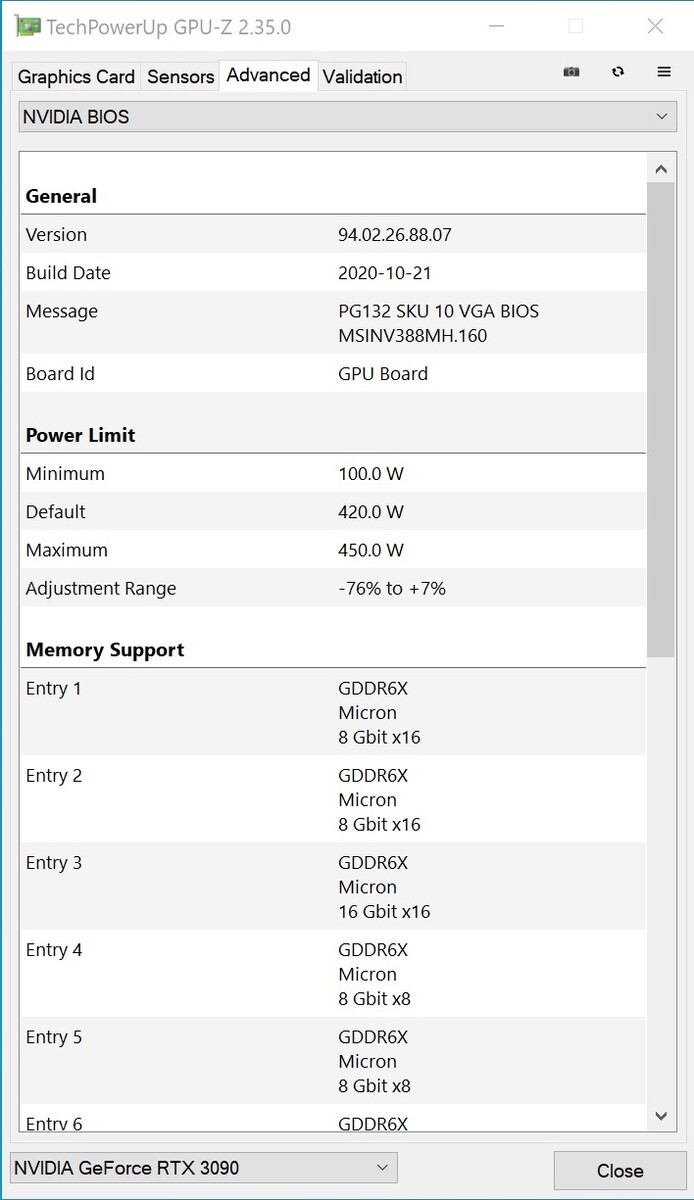
Comme déjà mentionné, le MSI GeForce RTX 3090 Suprim X est équipé d'un BIOS de 420 watts, ce qui signifie que l'utilisation de trois connecteurs d'alimentation à 8 broches est inévitable. En externe, les écrans 8K jusqu'à 60 Hz peuvent être connectés via HDMI grâce à la norme 2.1. De même, 4K à 120 Hz sont également possibles via cette connexion, ce qui a pu être confirmé lors du test. De plus, il existe trois connexions DisplayPort 1.4a.
Le MSI GeForce RTX 3090 Suprim X comparé aux autres GPU NVIDIA
| Spécification | RTX3090 (Suprim X) | RTX 3090 (FE) | RTX 3080 FE | RTX 3070 FE | Titan RTX | TITAN X Pascal | RTX 2080 Ti | RTX 2080 |
| Chip | GA102 | GA102 | GA102 | GA104 | TU102 | GP102 | TU102 | TU104 |
| Processus FinFET | 8nm | 8 nm | 8 nm | 8 nm | 8 nm | 12 nm | 16 nm | 12 nm |
| CUDAcores | 10,496 | 10,496 | 8,704 | 5,888 | 4,608 | 3,584 | 4,352 | 2,944 |
| Textureunits | 328 | 328 | 272 | 184 | 288 | 224 | 272 | 184 |
| Noyaux tenseurs | 3283ème génération | 328 3ème génération | 272 3ème génération | 184 3ème génération | 576 2ème génération | - | 544 2ème génération | 368 2ème génération |
| RTcores | 82 | 82 | 68 | 46 | 72 | - | 68 | 46 |
| Horloge de base GPU | 1,395 MHz | 1,395 MHz | 1,440 MHz | 1,500 MHz | 1,350 MHz | 1,417 MHz | 1,350 MHz | 1,515 MHz |
| Horloge de boost GPU | 1,860 MHz | 1,695 MHz | 1,710 MHz | 1,750 MHz | 1,770 MHz | 1,531 MHz | 1,545 MHz | 1,710 MHz |
| Memorybus | 384-bit | 384-bit | 320-bit | 256-bit | 384-bit | 384-bit | 352-bit | 256-bit |
| Bande passante mémoire | 936GB/s | 936 GB/s | 760 GB/s | 448 GB/s | 672 GB/s | 480.4 GB/s | 616 GB/s | 448 GB/s |
| Mémoire vidéo | 24GB GDDR6X | 24 GB GDDR6X | 10 GB GDDR6X | 8 GB GDDR6 | 24 GB GDDR6 | 12 GB GDDR5X | 11 GB GDDR6 | 8 GB GDDR6 |
| Consommation d'énergie | 420W | 350 W | 320 W | 220 W | 280 W | 250 W | 250 W | 215 W |
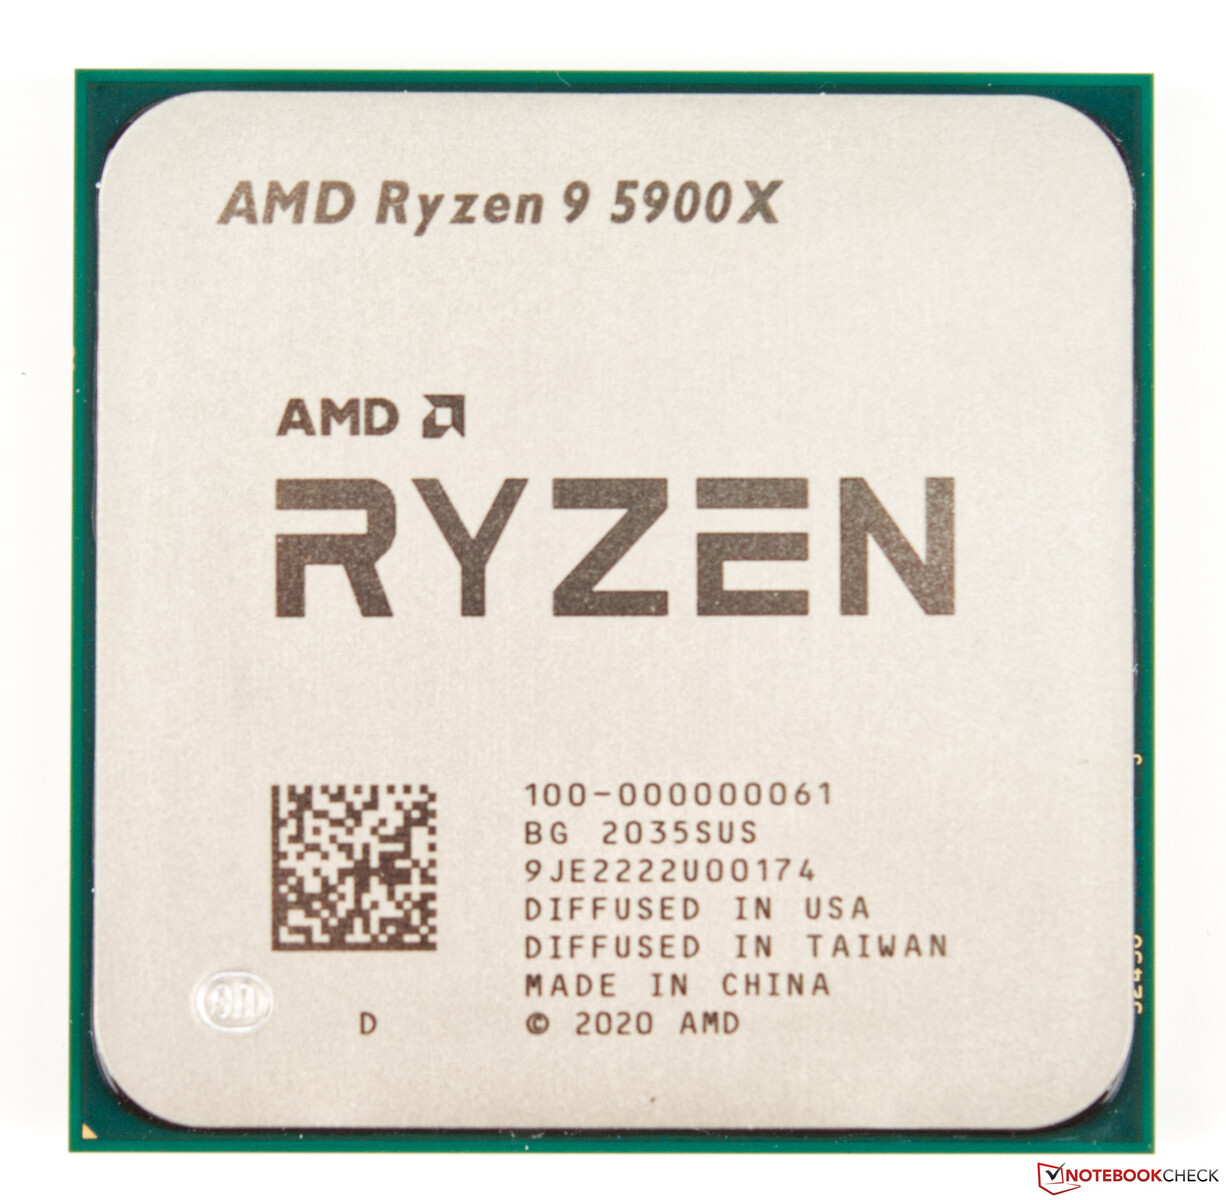
Notre système de test avec l'AMD Ryzen 9 5900X comme base
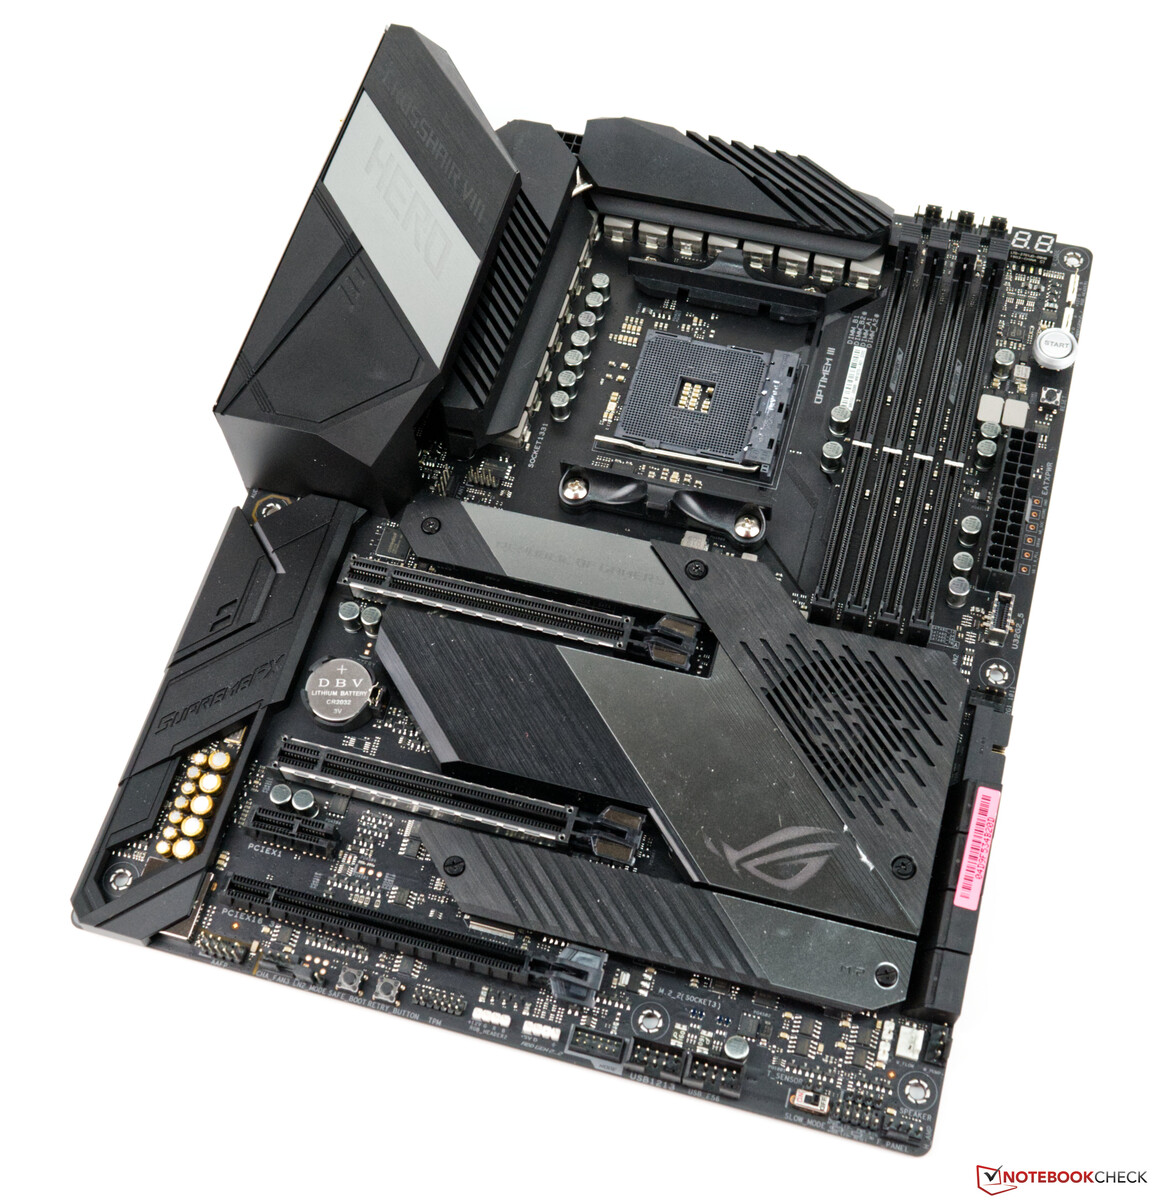
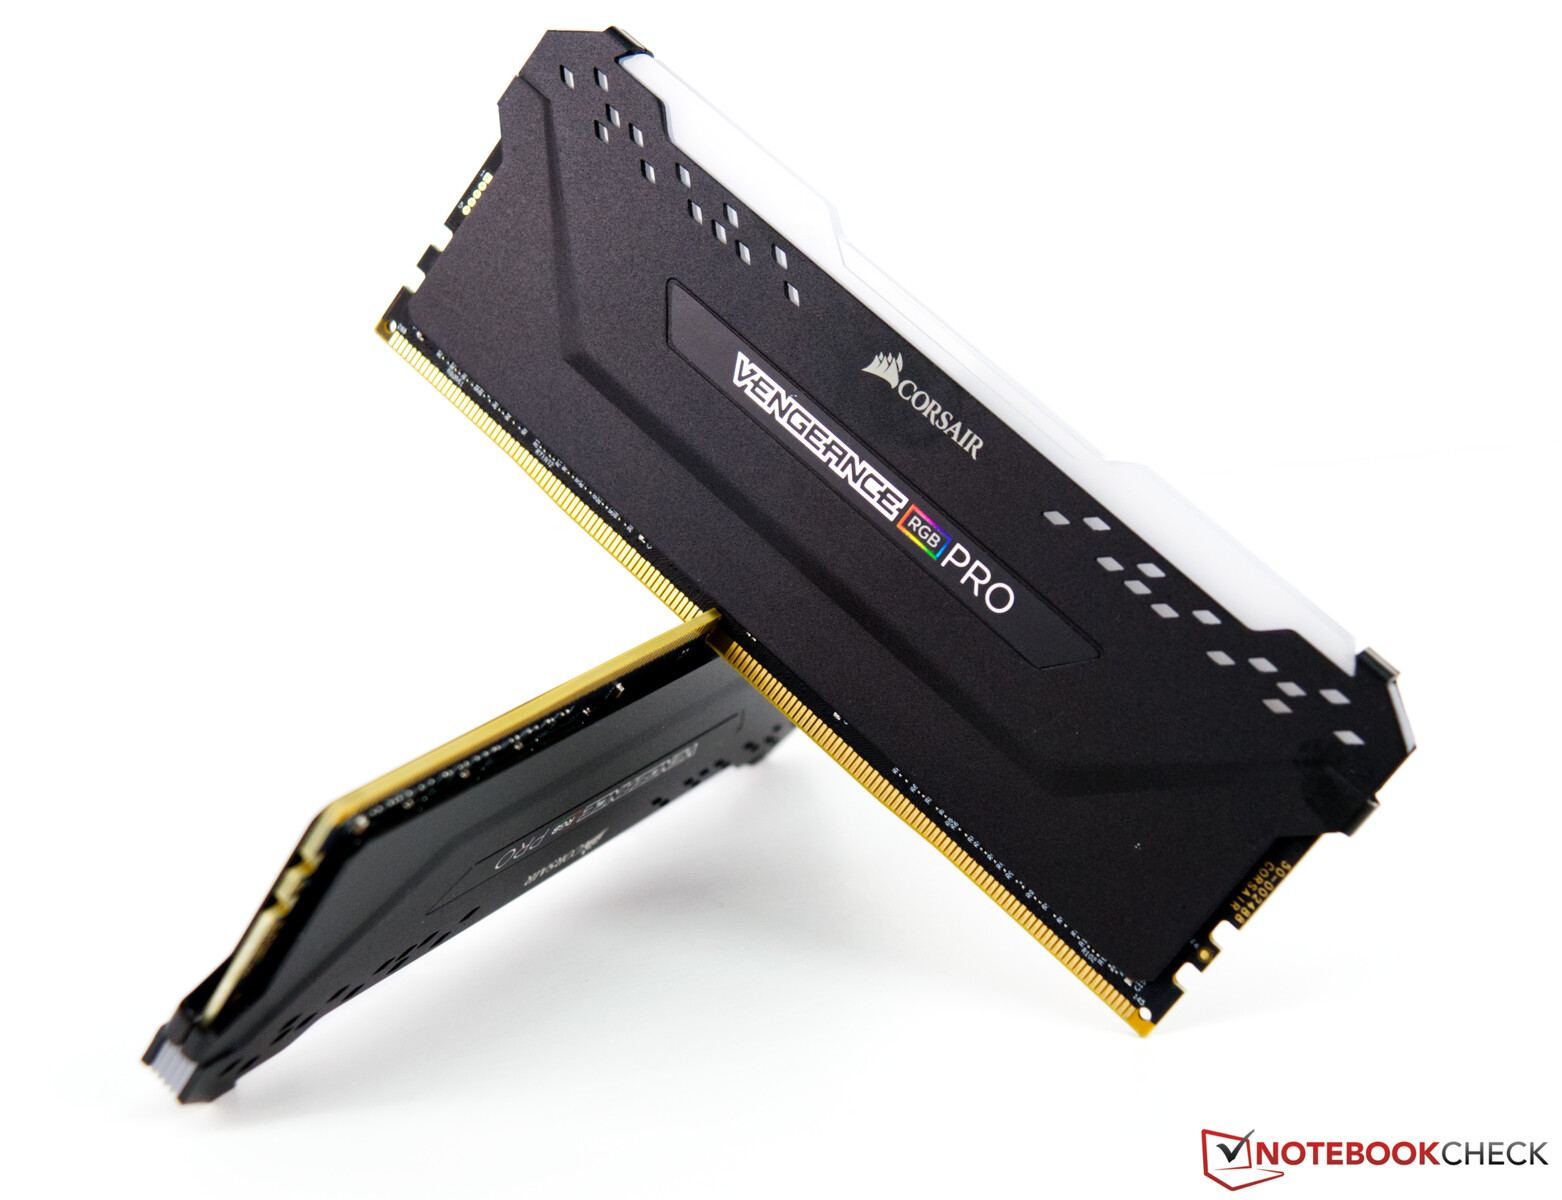
Une plateforme AMD actuelle basée sur le Crosshair VIII de l'Asus X570 ROG sert de système de test. L'unité centrale (AMD Ryzen 9 5900X) offre de bonnes performances CPU, et nous utilisons un refroidisseur d'eau AIO(Alphacool Eisbaer 280 mm) pour le refroidissement. Les 32 Go de RAM proviennent de la société Corsair et s'affichent à 4 000 MHz. Nous utilisons l'Acer Predator XB321HK comme moniteur. Il ne nous limite pas grâce à sa capacité UHD. A ce stade, nous voudrions remercier AMD pour avoir fourni la plate-forme de test ainsi que Corsair pour le kit de RAM
Pour les prochaines évaluations et tests, nous utilisons le système suivant
- Lian Li O11 Dynamique
- AMD Ryzen 9 5900X
- MSI GeForce RTX 3090 Suprim X (Nvidiadriver 457.30)
- Asus X570 ROG Crosshair VIII Hero Wi-Fi (BIOS 2402, paramètres par défaut, XMP 1 pour DDR4-4000)
- Corsair RM1000X : bloc d'alimentation de 1 000 watts
- Kit Corsair Vengeance RGB Pro DDR4-4000 2 x 16 Go RAM
- Corsair MP600 2 TB M.2 PCIe 4.0 SSD
- Crucial MX500 2 TB (pour les jeux)
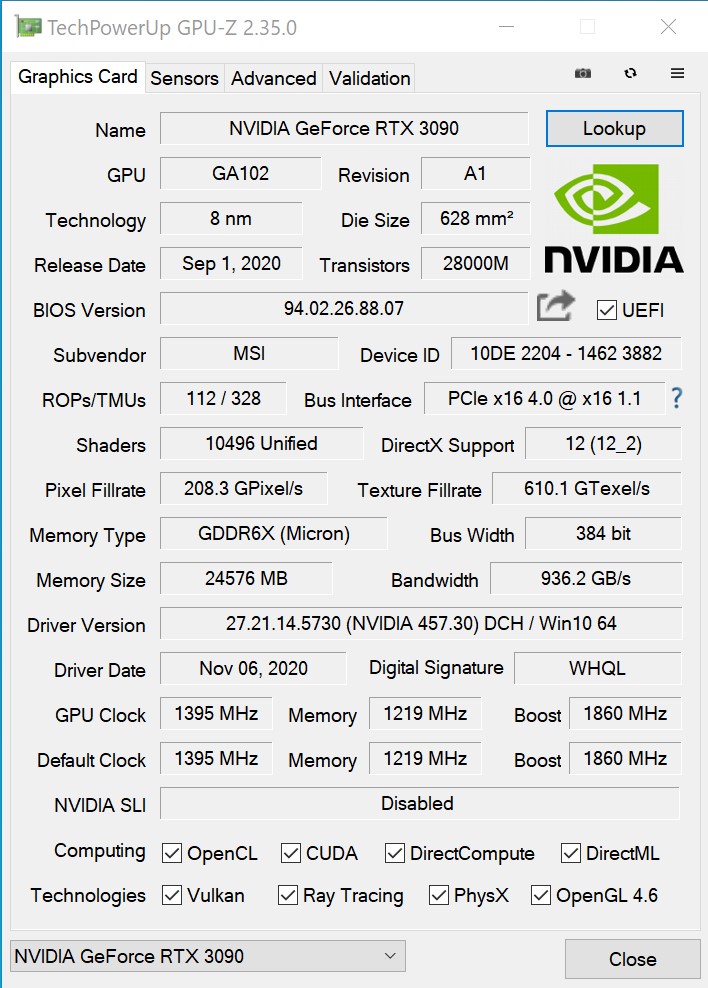
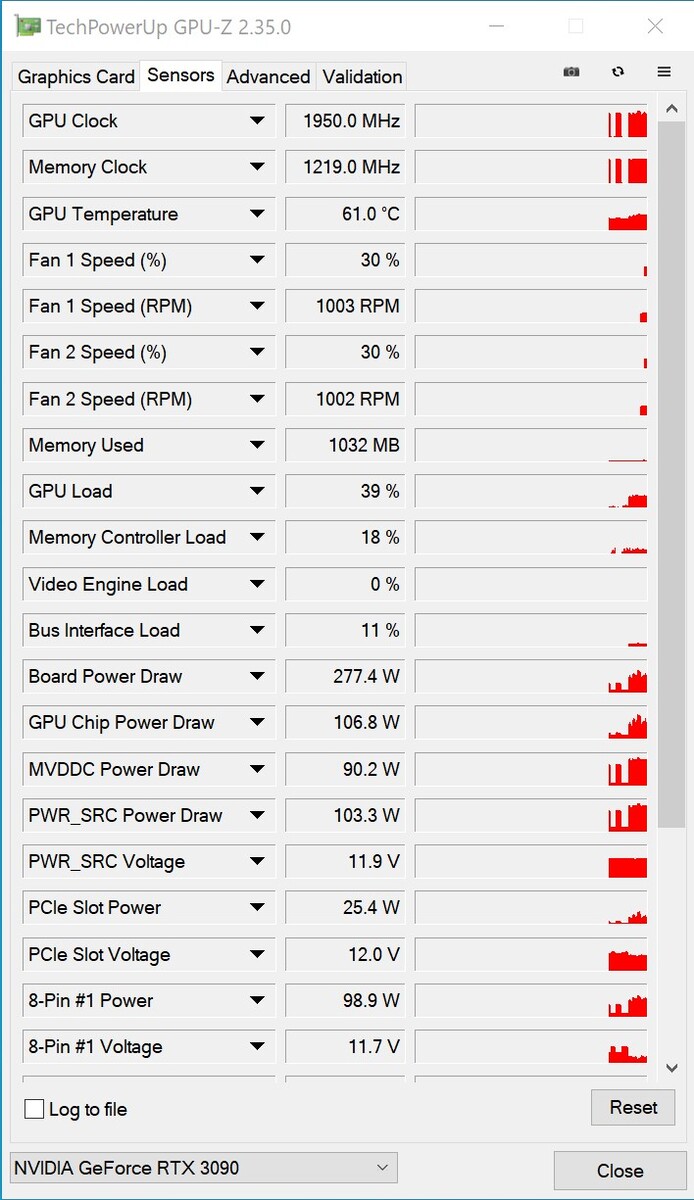
Les vitesses d'horloge de la MSI GeForce RTX 3090 Suprim X
MSI maintient la vitesse de l'horloge de base en ligne avec le modèle de référence. Néanmoins, à 1 860 MHz, MSI augmente considérablement la fréquence d'horloge du RTX 3090 Suprim X. De plus, le mode OC peut être activé dans le centre Dragon de MSI, ce qui augmente la vitesse d'horloge de boost à 1 875 MHz, encore plus élevée. Tous les tests de cette étude ont été effectués avec les paramètres par défaut et sans le mode OC. La VRAM reste également inchangée, c'est pourquoi la largeur de bande de la mémoire est identique au modèle de référence
Repères synthétiques
Dans les benchmarks synthétiques, la MSI GeForce RTX 3090 Suprim X et laAMD Radeon RX 6800 XT sont presque à égalité. L'écart par rapport à laGeForce RTX 3080 est clairement visible et augmente à des résolutions plus élevées. Par rapport au GeForce RTX 2080 Ti, l'avance du nouveau vaisseau amiral atteint 40 à 50 %. LeNvidia Titan RTX est basé sur la même puce que leRTX 2080 Ti et accuse un retard similaire.
En raison du bon refroidissement et du TDP plus élevé du MSI GeForce RTX 3090 Suprim X, les performances devraient être meilleures qu'avec l'édition Founders de Nvidia. Cependant, nous ne pouvons pas faire de déclarations valables concernant les performances du modèle de référence pour le moment, car nous n'avons pas encore pu tester ce modèle.
| Unigine Superposition | |
| 1280x720 720p Low | |
| Titan RTX | |
| Radeon RX 6800 XT | |
| MSI GeForce RTX 3090 Suprim X | |
| GeForce RTX 3070 | |
| GeForce RTX 3080 | |
| 1920x1080 1080p High | |
| MSI GeForce RTX 3090 Suprim X | |
| Radeon RX 6800 XT | |
| GeForce RTX 3080 | |
| Titan RTX | |
| GeForce RTX 3070 | |
| 1920x1080 1080p Extreme | |
| MSI GeForce RTX 3090 Suprim X | |
| GeForce RTX 3080 | |
| Radeon RX 6800 XT | |
| Titan RTX | |
| GeForce RTX 3070 | |
| 3840x2160 4k Optimized | |
| MSI GeForce RTX 3090 Suprim X | |
| GeForce RTX 3080 | |
| Radeon RX 6800 XT | |
| Titan RTX | |
| GeForce RTX 3070 | |
| 7680x4320 8k Optimized | |
| MSI GeForce RTX 3090 Suprim X | |
| GeForce RTX 3080 | |
| Titan RTX | |
| Radeon RX 6800 XT | |
| GeForce RTX 3070 | |
| Unigine Valley 1.0 | |
| 1920x1080 Extreme HD DirectX AA:x8 | |
| MSI GeForce RTX 3090 Suprim X | |
| Radeon RX 6800 XT | |
| Titan RTX | |
| GeForce RTX 3080 | |
| GeForce RTX 2080 Ti (Desktop) | |
| GeForce RTX 3070 | |
| GeForce RTX 2080 Super (Desktop) | |
| GeForce RTX 2080 (Desktop) | |
| GeForce RTX 2070 Super (Desktop) | |
| GeForce RTX 2070 (Desktop) | |
| Radeon VII | |
| GeForce RTX 2060 Super (Desktop) | |
| Radeon RX 5700 XT (Desktop) | |
| Radeon RX 5700 (Desktop) | |
| GeForce RTX 2060 (Desktop) | |
| 1920x1080 Extreme HD Preset OpenGL AA:x8 | |
| MSI GeForce RTX 3090 Suprim X | |
| GeForce RTX 3080 | |
| Titan RTX | |
| Radeon RX 6800 XT | |
| GeForce RTX 2080 Ti (Desktop) | |
| GeForce RTX 3070 | |
| GeForce RTX 2080 Super (Desktop) | |
| GeForce RTX 2080 (Desktop) | |
| GeForce RTX 2070 Super (Desktop) | |
| GeForce RTX 2070 (Desktop) | |
| GeForce RTX 2060 Super (Desktop) | |
| Radeon RX 5700 XT (Desktop) | |
| GeForce RTX 2060 (Desktop) | |
| Radeon RX 5700 (Desktop) | |
| Radeon VII | |
Repères de jeu
Pour commencer, on peut dire que le MSI GeForce RTX 3090 Suprim X peut traiter tous les titres modernes sans aucun problème. Il y a parfois des jeux où la fréquence d'images moyenne passe en dessous de la barre des 60 images par seconde en 2160p. Néanmoins, il est possible de jouer en douceur, et vous n'avez pas l'impression de regarder un diaporama.
Par rapport à la GeForce RTX 3080le GeForce RTX 3090 peut se démarquer un peu à plusieurs reprises. Néanmoins, la carte graphique nécessite toujours de très hautes résolutions afin de pouvoir également profiter de la différence de performances. Toutefois, par rapport à la Radeon RX 6800 XT d'AMDLa performance plus du GeForce RTX 3090 est bien plus importante que celle des benchmarks synthétiques. Les performances varient en fonction du jeu, bien que l'AMD Radeon RX 6800 XT donne toujours le ton
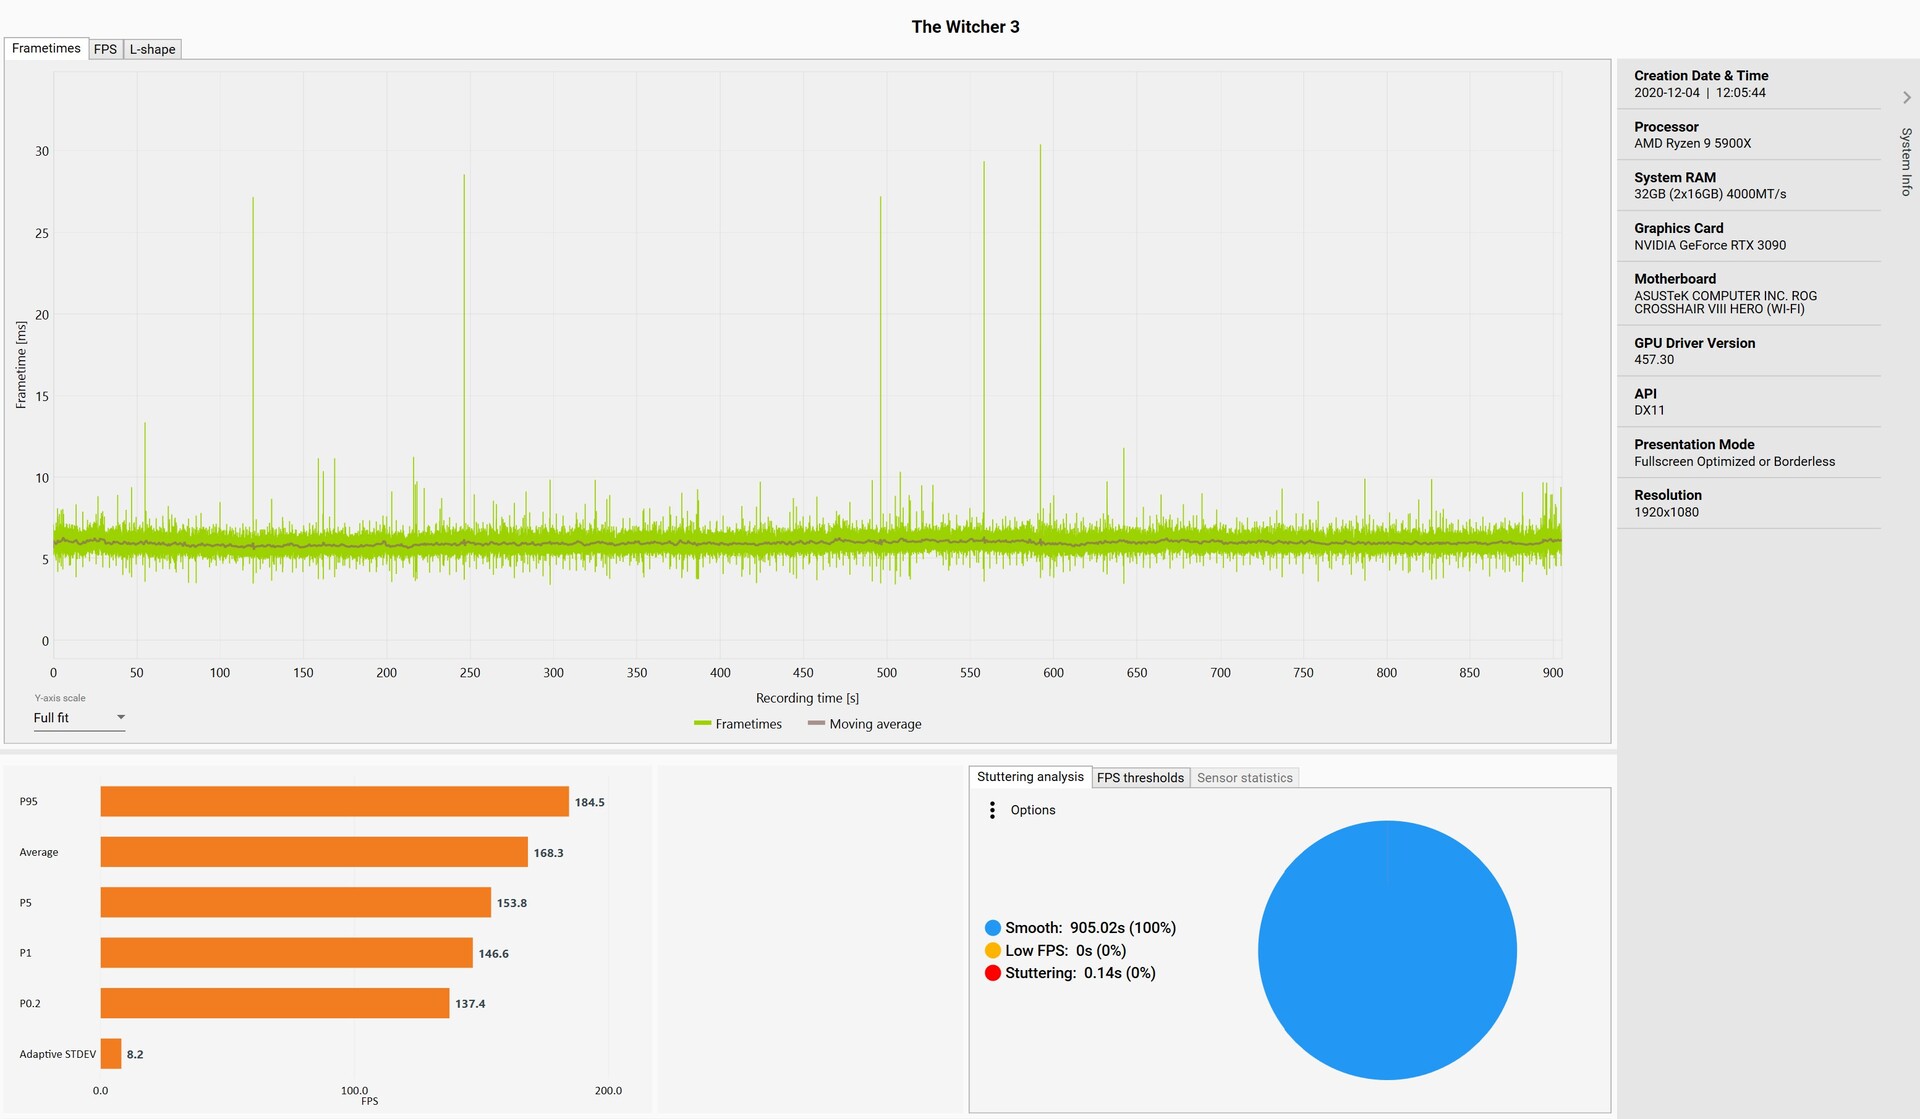
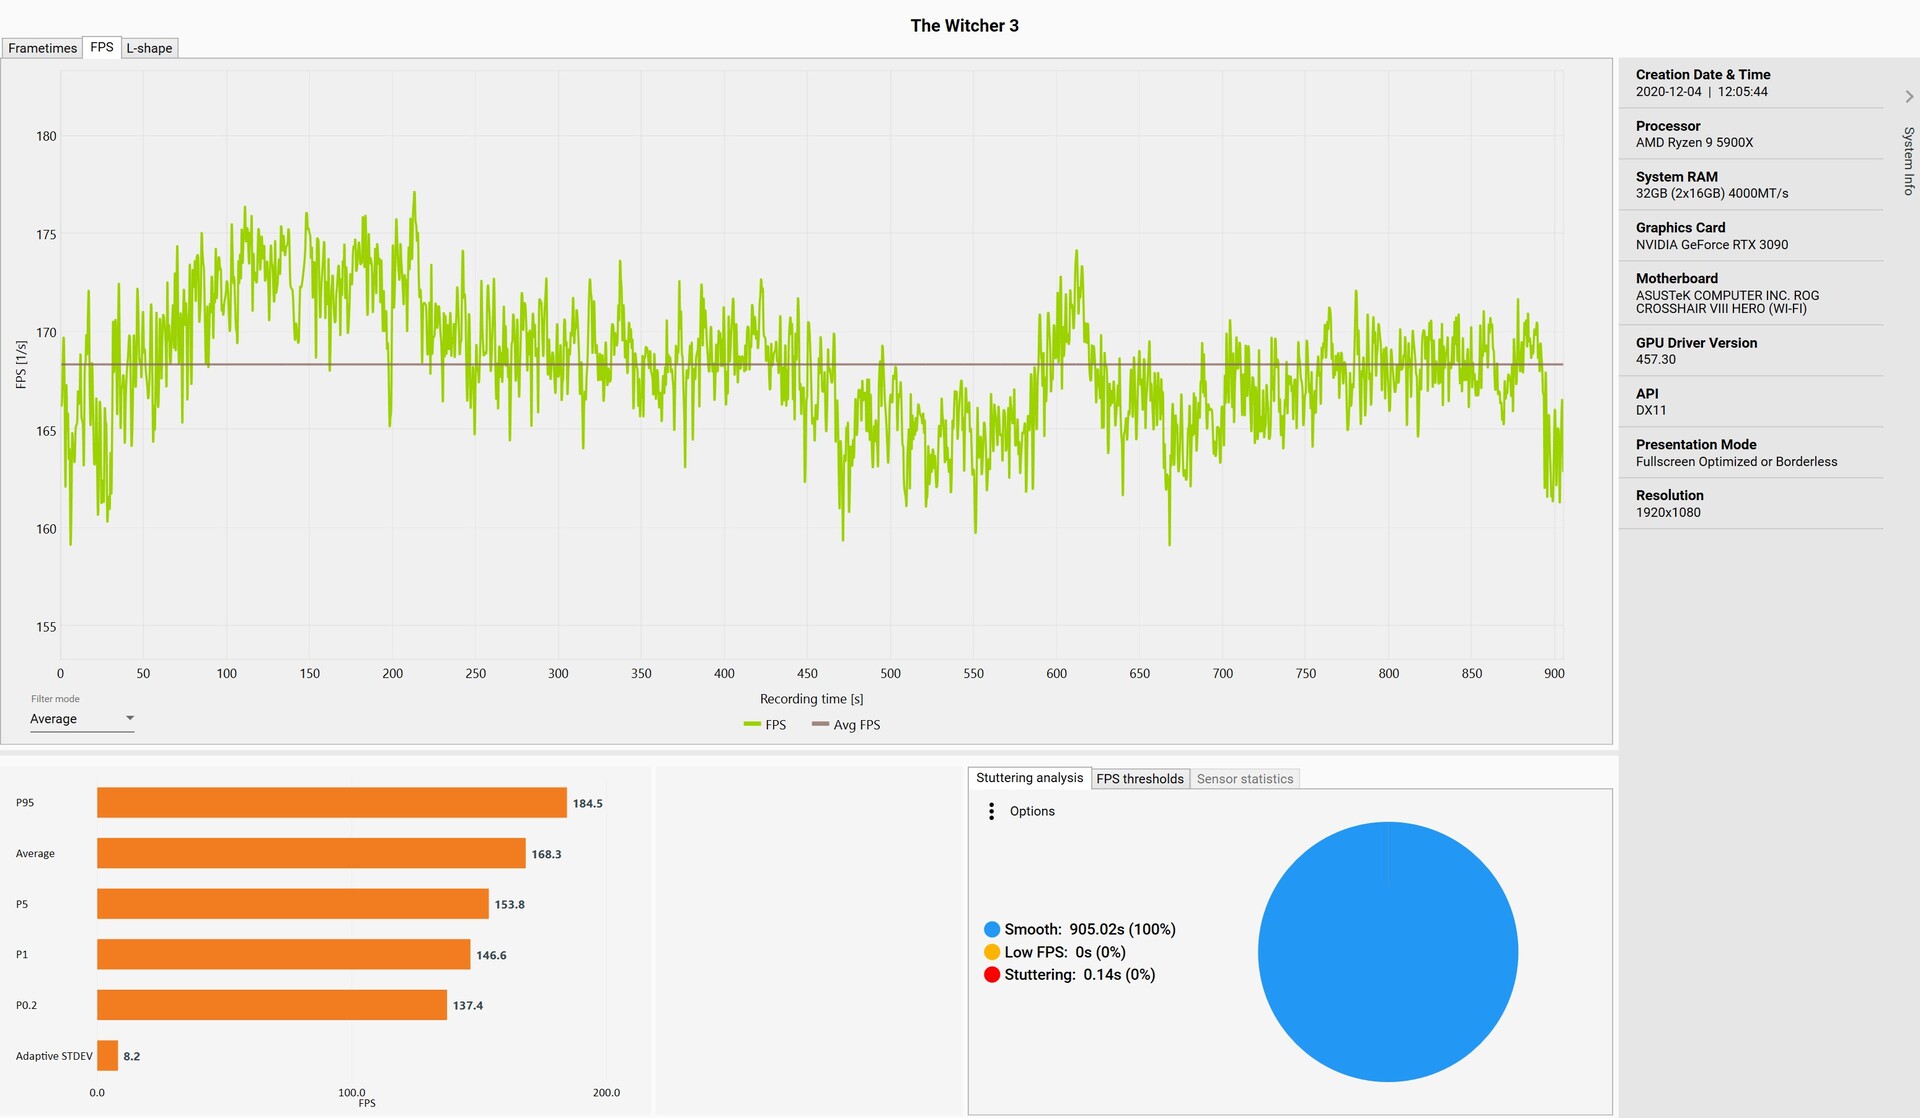
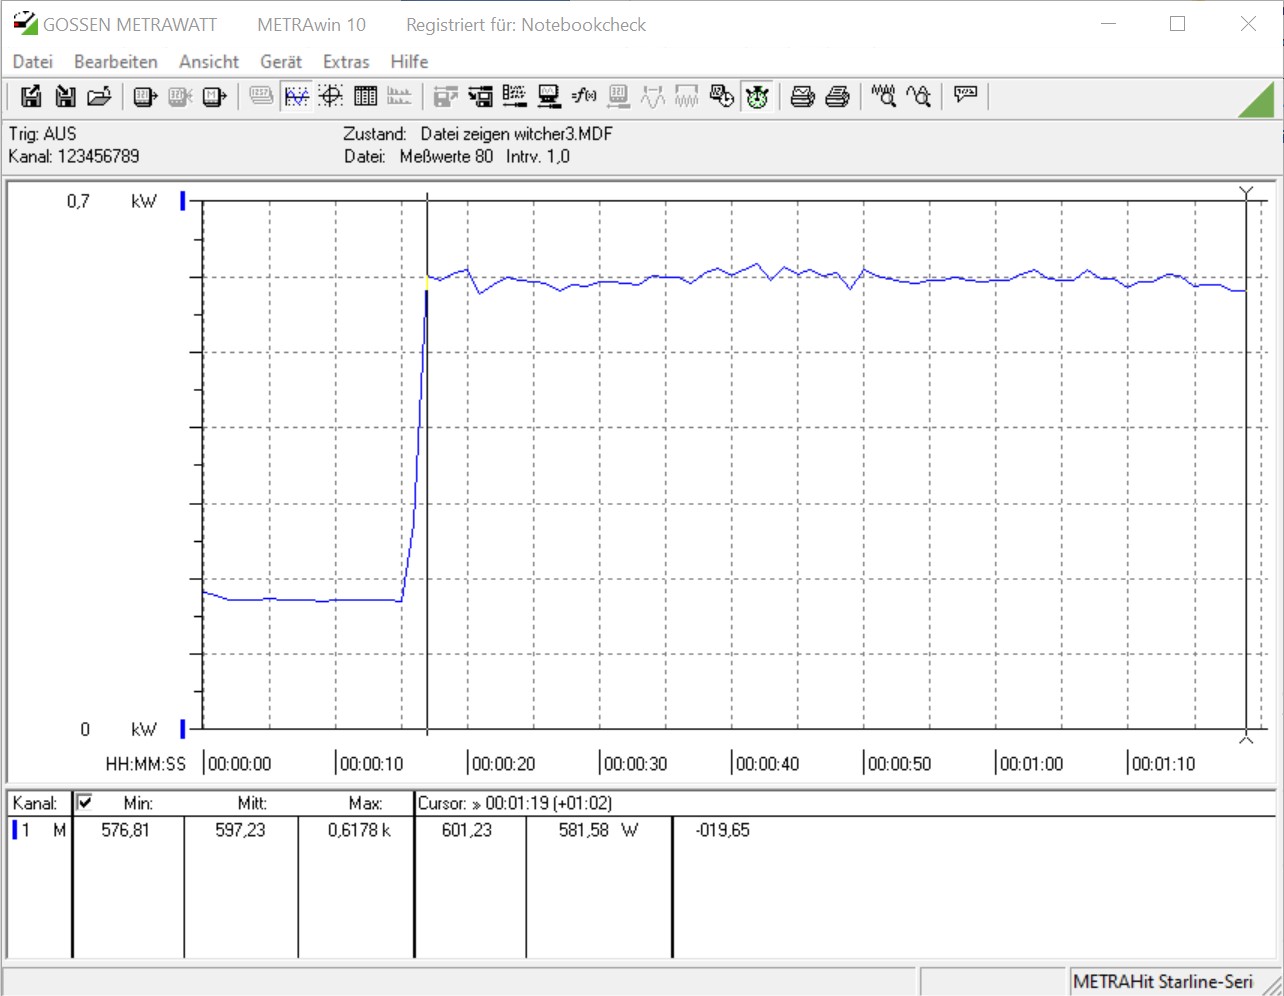
Nous utilisons le jeu The Witcher 3 (Ultra preset) pour enregistrer les temps de trame et la progression des trames, car il s'adapte aussi très bien aux dernières cartes graphiques. Il n'y a aucune anomalie dans les temps de trame. Néanmoins, il n'y a que quelques aberrations isolées qui n'affectent pas le bon déroulement du jeu. En ce qui concerne la progression des images, les taux d'images sont un peu meilleurs dans le premier tiers ; ils se stabilisent toutefois dans la suite du jeu et affichent un très bon résultat de 168 FPS sur l'ensemble de la période. À titre de comparaison : Le siteAsus GeForce RTX 3080 ROG Strix Gaming OC a atteint 139 FPS.
| Far Cry New Dawn - 3840x2160 Ultra Preset | |
| MSI GeForce RTX 3090 Suprim X | |
| Radeon RX 6800 XT | |
| GeForce RTX 3080 | |
| Titan RTX | |
| Titan RTX | |
| GeForce RTX 2080 Ti (Desktop) | |
| GeForce RTX 3070 | |
| GeForce RTX 2080 Super (Desktop) | |
| GeForce RTX 2080 (Desktop) | |
| Radeon VII | |
| GeForce RTX 2070 Super (Desktop) | |
| Radeon RX 5700 XT (Desktop) | |
| GeForce RTX 2070 (Desktop) | |
| Radeon RX 5700 (Desktop) | |
| GeForce RTX 2060 Super (Desktop) | |
| RX Vega 64 | |
| GeForce RTX 2060 (Desktop) | |
| Far Cry 5 - 3840x2160 Ultra Preset AA:T | |
| MSI GeForce RTX 3090 Suprim X | |
| GeForce RTX 3080 | |
| Radeon RX 6800 XT | |
| Titan RTX | |
| Titan RTX | |
| GeForce RTX 2080 Ti (Desktop) | |
| GeForce RTX 3070 | |
| GeForce RTX 2080 Super (Desktop) | |
| GeForce RTX 2080 (Desktop) | |
| Radeon VII | |
| GeForce RTX 2070 Super (Desktop) | |
| Radeon RX 5700 XT (Desktop) | |
| GeForce RTX 2070 (Desktop) | |
| GeForce RTX 2060 Super (Desktop) | |
| Radeon RX 5700 (Desktop) | |
| RX Vega 64 | |
| GeForce RTX 2060 (Desktop) | |
| F1 2020 - 3840x2160 Ultra High Preset AA:T AF:16x | |
| MSI GeForce RTX 3090 Suprim X | |
| Radeon RX 6800 XT | |
| GeForce RTX 3080 | |
| Titan RTX | |
| GeForce RTX 3070 | |
| Borderlands 3 - 3840x2160 Badass Overall Quality (DX11) | |
| MSI GeForce RTX 3090 Suprim X | |
| GeForce RTX 3080 | |
| Radeon RX 6800 XT | |
| Titan RTX | |
| Titan RTX | |
| GeForce RTX 3070 | |
| GeForce RTX 2080 Ti (Desktop) | |
| Metro Exodus - 3840x2160 Ultra Quality AF:16x | |
| MSI GeForce RTX 3090 Suprim X | |
| GeForce RTX 3080 | |
| Radeon RX 6800 XT | |
| Titan RTX | |
| Titan RTX | |
| GeForce RTX 3070 | |
| GeForce RTX 2080 Ti (Desktop) | |
| RX Vega 64 | |
| GeForce RTX 2080 Super (Desktop) | |
| GeForce RTX 2080 (Desktop) | |
| Radeon VII | |
| GeForce RTX 2070 Super (Desktop) | |
| GeForce RTX 2070 (Desktop) | |
| GeForce RTX 2060 Super (Desktop) | |
| Radeon RX 5700 XT (Desktop) | |
| Radeon RX 5700 (Desktop) | |
| GeForce RTX 2060 (Desktop) | |
| Red Dead Redemption 2 - 3840x2160 Maximum Settings | |
| MSI GeForce RTX 3090 Suprim X | |
| GeForce RTX 3080 | |
| Radeon RX 6800 XT | |
| GeForce RTX 3070 | |
| Titan RTX | |
| Rise of the Tomb Raider - 3840x2160 High Preset AA:FX AF:4x | |
| MSI GeForce RTX 3090 Suprim X | |
| GeForce RTX 3080 | |
| Radeon RX 6800 XT | |
| GeForce RTX 2080 Ti (Desktop) | |
| GeForce RTX 3070 | |
| GeForce RTX 2080 Super (Desktop) | |
| GeForce RTX 2080 (Desktop) | |
| GeForce RTX 2070 Super (Desktop) | |
| GeForce RTX 2070 (Desktop) | |
| Radeon VII | |
| GeForce RTX 2060 Super (Desktop) | |
| RX Vega 64 | |
| GeForce RTX 2060 (Desktop) | |
| Shadow of the Tomb Raider - 3840x2160 Highest Preset AA:T | |
| MSI GeForce RTX 3090 Suprim X | |
| GeForce RTX 3080 | |
| Radeon RX 6800 XT | |
| Titan RTX | |
| Titan RTX | |
| GeForce RTX 3070 | |
| GeForce RTX 2080 Ti (Desktop) | |
| GeForce RTX 2080 Super (Desktop) | |
| GeForce RTX 2080 (Desktop) | |
| Radeon VII | |
| GeForce RTX 2070 Super (Desktop) | |
| GeForce RTX 2070 (Desktop) | |
| Radeon RX 5700 XT (Desktop) | |
| GeForce RTX 2060 Super (Desktop) | |
| Radeon RX 5700 (Desktop) | |
| GeForce RTX 2060 (Desktop) | |
| RX Vega 64 | |
| Mafia Definitive Edition - 3840x2160 High Preset | |
| MSI GeForce RTX 3090 Suprim X | |
| GeForce RTX 3080 | |
| Titan RTX | |
| Radeon RX 6800 XT | |
| GeForce RTX 3070 | |
| Watch Dogs Legion - 3840x2160 Ultra Preset (DX12) | |
| MSI GeForce RTX 3090 Suprim X | |
| GeForce RTX 3080 | |
| Radeon RX 6800 XT | |
| Titan RTX | |
| GeForce RTX 3070 | |
| The Witcher 3 - 3840x2160 High Graphics & Postprocessing (Nvidia HairWorks Off) | |
| MSI GeForce RTX 3090 Suprim X | |
| GeForce RTX 3080 | |
| Radeon RX 6800 XT | |
| Titan RTX | |
| Titan RTX | |
| GeForce RTX 2080 Ti (Desktop) | |
| GeForce RTX 3070 | |
| GeForce RTX 2080 Super (Desktop) | |
| GeForce RTX 2080 (Desktop) | |
| GeForce RTX 2070 Super (Desktop) | |
| GeForce RTX 2070 (Desktop) | |
| GeForce RTX 2060 Super (Desktop) | |
| Radeon VII | |
| Radeon RX 5700 XT (Desktop) | |
| GeForce RTX 2060 (Desktop) | |
| RX Vega 64 | |
| Radeon RX 5700 (Desktop) | |
| Bas | Moyen | Élevé | Ultra | QHD | 4K | |
|---|---|---|---|---|---|---|
| GTA V (2015) | 184 | 176 | 175 | 114 | 109 | 164 |
| The Witcher 3 (2015) | 355 | 335 | 292 | 160 | 128 | |
| Dota 2 Reborn (2015) | 169.9 | 143.2 | 144.3 | 140.3 | 142.8 | |
| Rise of the Tomb Raider (2016) | 300 | 263 | 257 | 240 | 128 | |
| Final Fantasy XV Benchmark (2018) | 219 | 189 | 156 | 133 | 87.6 | |
| X-Plane 11.11 (2018) | 151 | 126 | 96.8 | 83 | ||
| Far Cry 5 (2018) | 179 | 162 | 153 | 141 | 137 | 106 |
| Strange Brigade (2018) | 525 | 415 | 372 | 330 | 255 | 158 |
| Shadow of the Tomb Raider (2018) | 201 | 193 | 177 | 188 | 162 | 95.6 |
| Battlefield V (2018) | 184 | 164 | 151 | 141 | 124 | 94 |
| Apex Legends (2019) | 144 | 144 | 144 | 144 | 144 | 139 |
| Far Cry New Dawn (2019) | 134 | 117 | 117 | 106 | 105 | 96 |
| Metro Exodus (2019) | 190 | 166 | 155 | 132 | 112 | 76.3 |
| The Division 2 (2019) | 239 | 221 | 188 | 160 | 128 | 77.5 |
| Anno 1800 (2019) | 145 | 145 | 105 | 54.8 | 53.9 | 52.5 |
| Rage 2 (2019) | 264 | 192 | 168 | 163 | 110 | 56.7 |
| Control (2019) | 238 | 215 | 177 | 123 | 66 | |
| Borderlands 3 (2019) | 178 | 157 | 145 | 135 | 117 | 73.4 |
| Star Wars Jedi Fallen Order (2019) | 133 | 132 | 131 | 130 | 111 | |
| Red Dead Redemption 2 (2019) | 175 | 174 | 155 | 115 | 96 | 67 |
| Hunt Showdown (2020) | 270 | 278 | 252 | 217 | 121 | |
| Doom Eternal (2020) | 314 | 310 | 298 | 296 | 295 | 188 |
| F1 2020 (2020) | 386 | 336 | 322 | 266 | 219 | 144 |
| Death Stranding (2020) | 209 | 207 | 203 | 210 | 176 | 110 |
| Horizon Zero Dawn (2020) | 203 | 196 | 181 | 166 | 148 | 95 |
| Crysis Remastered (2020) | 266 | 209 | 130 | 102 | 86.7 | 64.9 |
| Serious Sam 4 (2020) | 138.7 | 129.8 | 125.3 | 121.3 | 118.4 | 115.1 |
| Mafia Definitive Edition (2020) | 180 | 161 | 157 | 149 | 89.1 | |
| Star Wars Squadrons (2020) | 454 | 419 | 403 | 389 | 305 | 197 |
| FIFA 21 (2020) | 202 | 194 | 195 | 202 | 207 | 213 |
| Watch Dogs Legion (2020) | 128 | 127 | 111 | 103 | 89.7 | 60.3 |
| Dirt 5 (2020) | 191 | 149 | 127 | 112 | 100 | 73.8 |
| Assassin´s Creed Valhalla (2020) | 137 | 112 | 97 | 88 | 76 | 55 |
| Call of Duty Black Ops Cold War (2020) | 251 | 223 | 172 | 161 | 122 | 76.1 |
| Yakuza Like a Dragon (2020) | 116 | 114 | 115 | 116 | 116 | 80.2 |
Calcul des performances
Dans LuxMark et ComputeMark, le MSI GeForce RTX 3090 Suprim X obtient un score légèrement supérieur à celui du GeForce RTX 3080 en raison de la meilleure performance brute. Cependant, le GeForce RTX 3090 doit admettre une nette défaite àLe RX 6800 XT d'AMD dans le test LuxMark Sala. Chaque architecture a ses avantages et ses inconvénients, qui sont pris en charge différemment par les programmes et les pilotes. Les tests SPECviewperf sont principalement destinés aux postes de travail. Ceux-ci offrent plus de performances avec les modèles Quadro et FirePro qu'avec les modèles grand public grâce aux optimisations des pilotes
| SPECviewperf 2020 | |
| 3840x2160 Solidworks (solidworks-05) | |
| MSI GeForce RTX 3090 Suprim X | |
| MSI GeForce RTX 3070 Gaming X Trio | |
| AMD Radeon RX 6800 XT | |
| 3840x2160 Siemens NX (snx-04) | |
| AMD Radeon RX 6800 XT | |
| MSI GeForce RTX 3090 Suprim X | |
| MSI GeForce RTX 3070 Gaming X Trio | |
| 3840x2160 Medical (medical-03) | |
| AMD Radeon RX 6800 XT | |
| MSI GeForce RTX 3090 Suprim X | |
| MSI GeForce RTX 3070 Gaming X Trio | |
| 3840x2160 Maya (maya-06) | |
| MSI GeForce RTX 3090 Suprim X | |
| MSI GeForce RTX 3070 Gaming X Trio | |
| AMD Radeon RX 6800 XT | |
| 3840x2160 Energy (energy-03) | |
| MSI GeForce RTX 3090 Suprim X | |
| AMD Radeon RX 6800 XT | |
| MSI GeForce RTX 3070 Gaming X Trio | |
| 3840x2160 Creo (creo-03) | |
| MSI GeForce RTX 3090 Suprim X | |
| MSI GeForce RTX 3070 Gaming X Trio | |
| AMD Radeon RX 6800 XT | |
| 3840x2160 CATIA (catia-06) | |
| MSI GeForce RTX 3090 Suprim X | |
| MSI GeForce RTX 3070 Gaming X Trio | |
| AMD Radeon RX 6800 XT | |
| 3840x2160 3ds Max (3dsmax-07) | |
| MSI GeForce RTX 3090 Suprim X | |
| AMD Radeon RX 6800 XT | |
| MSI GeForce RTX 3070 Gaming X Trio | |
Émissions de la MSI GeForce RTX 3090 Suprim X
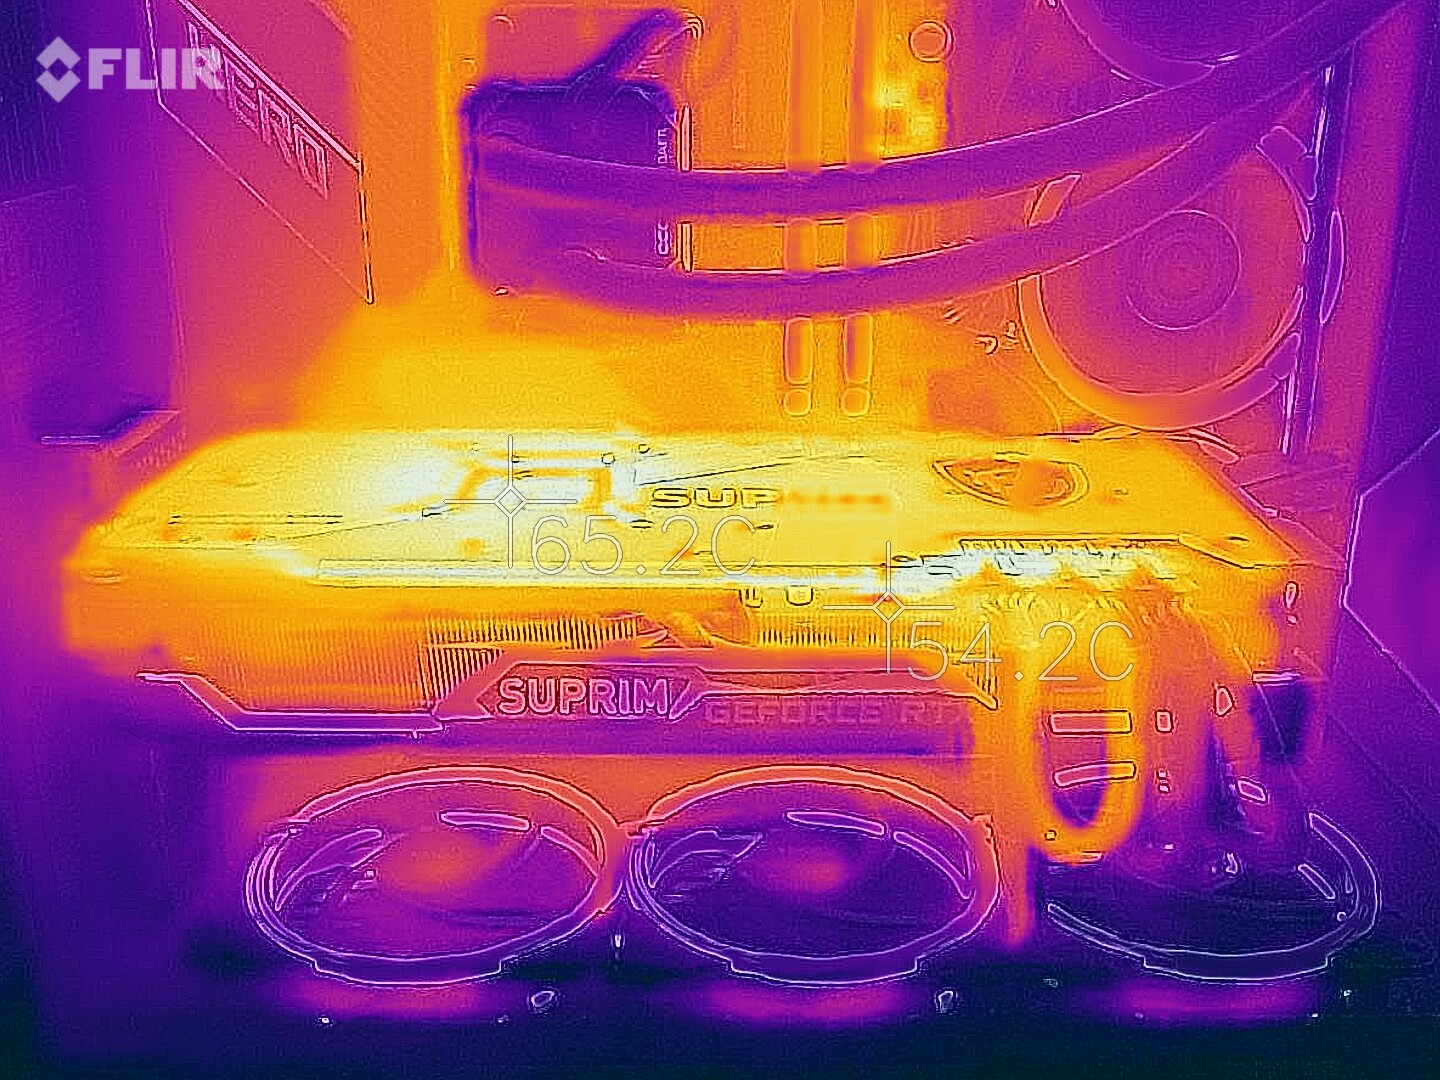
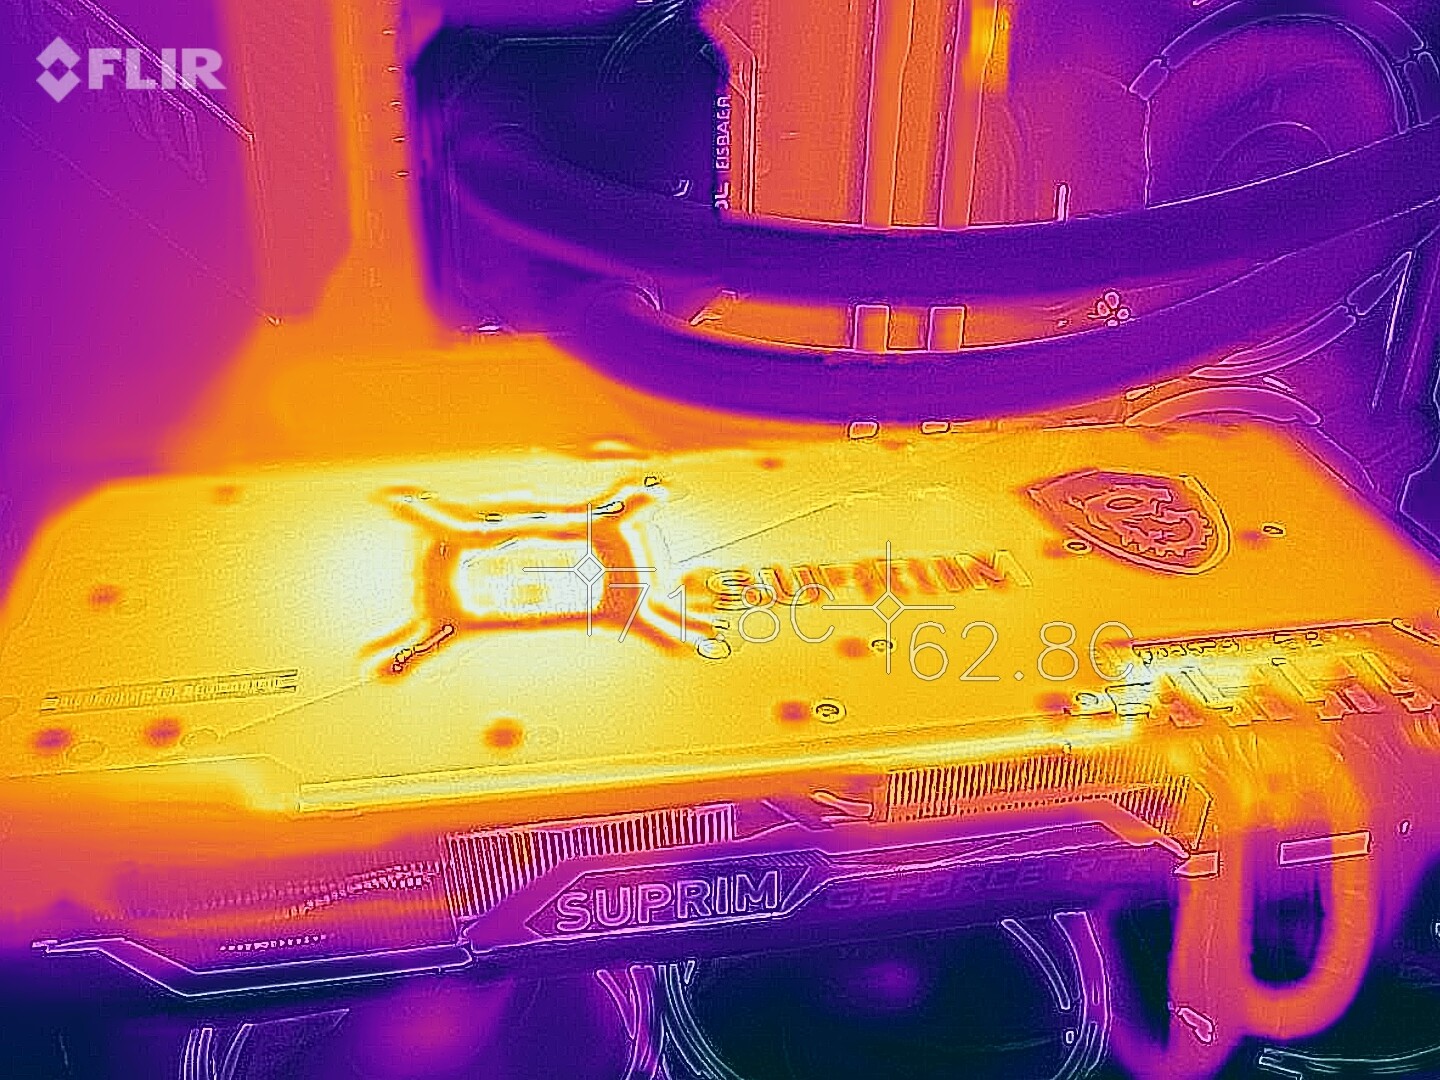
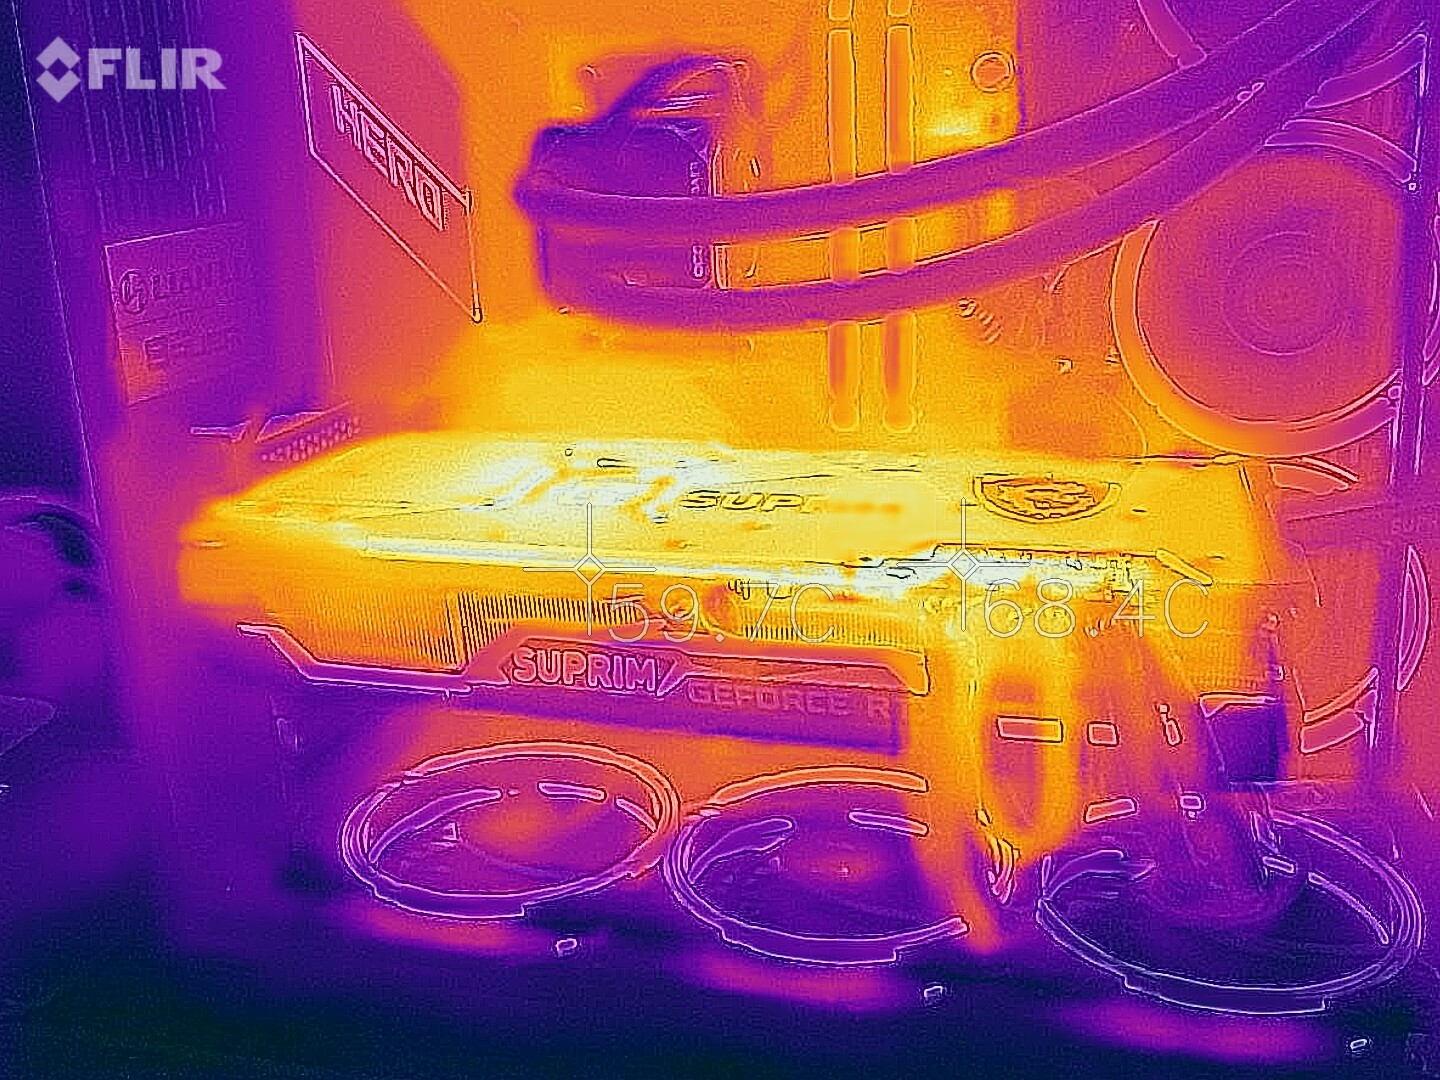
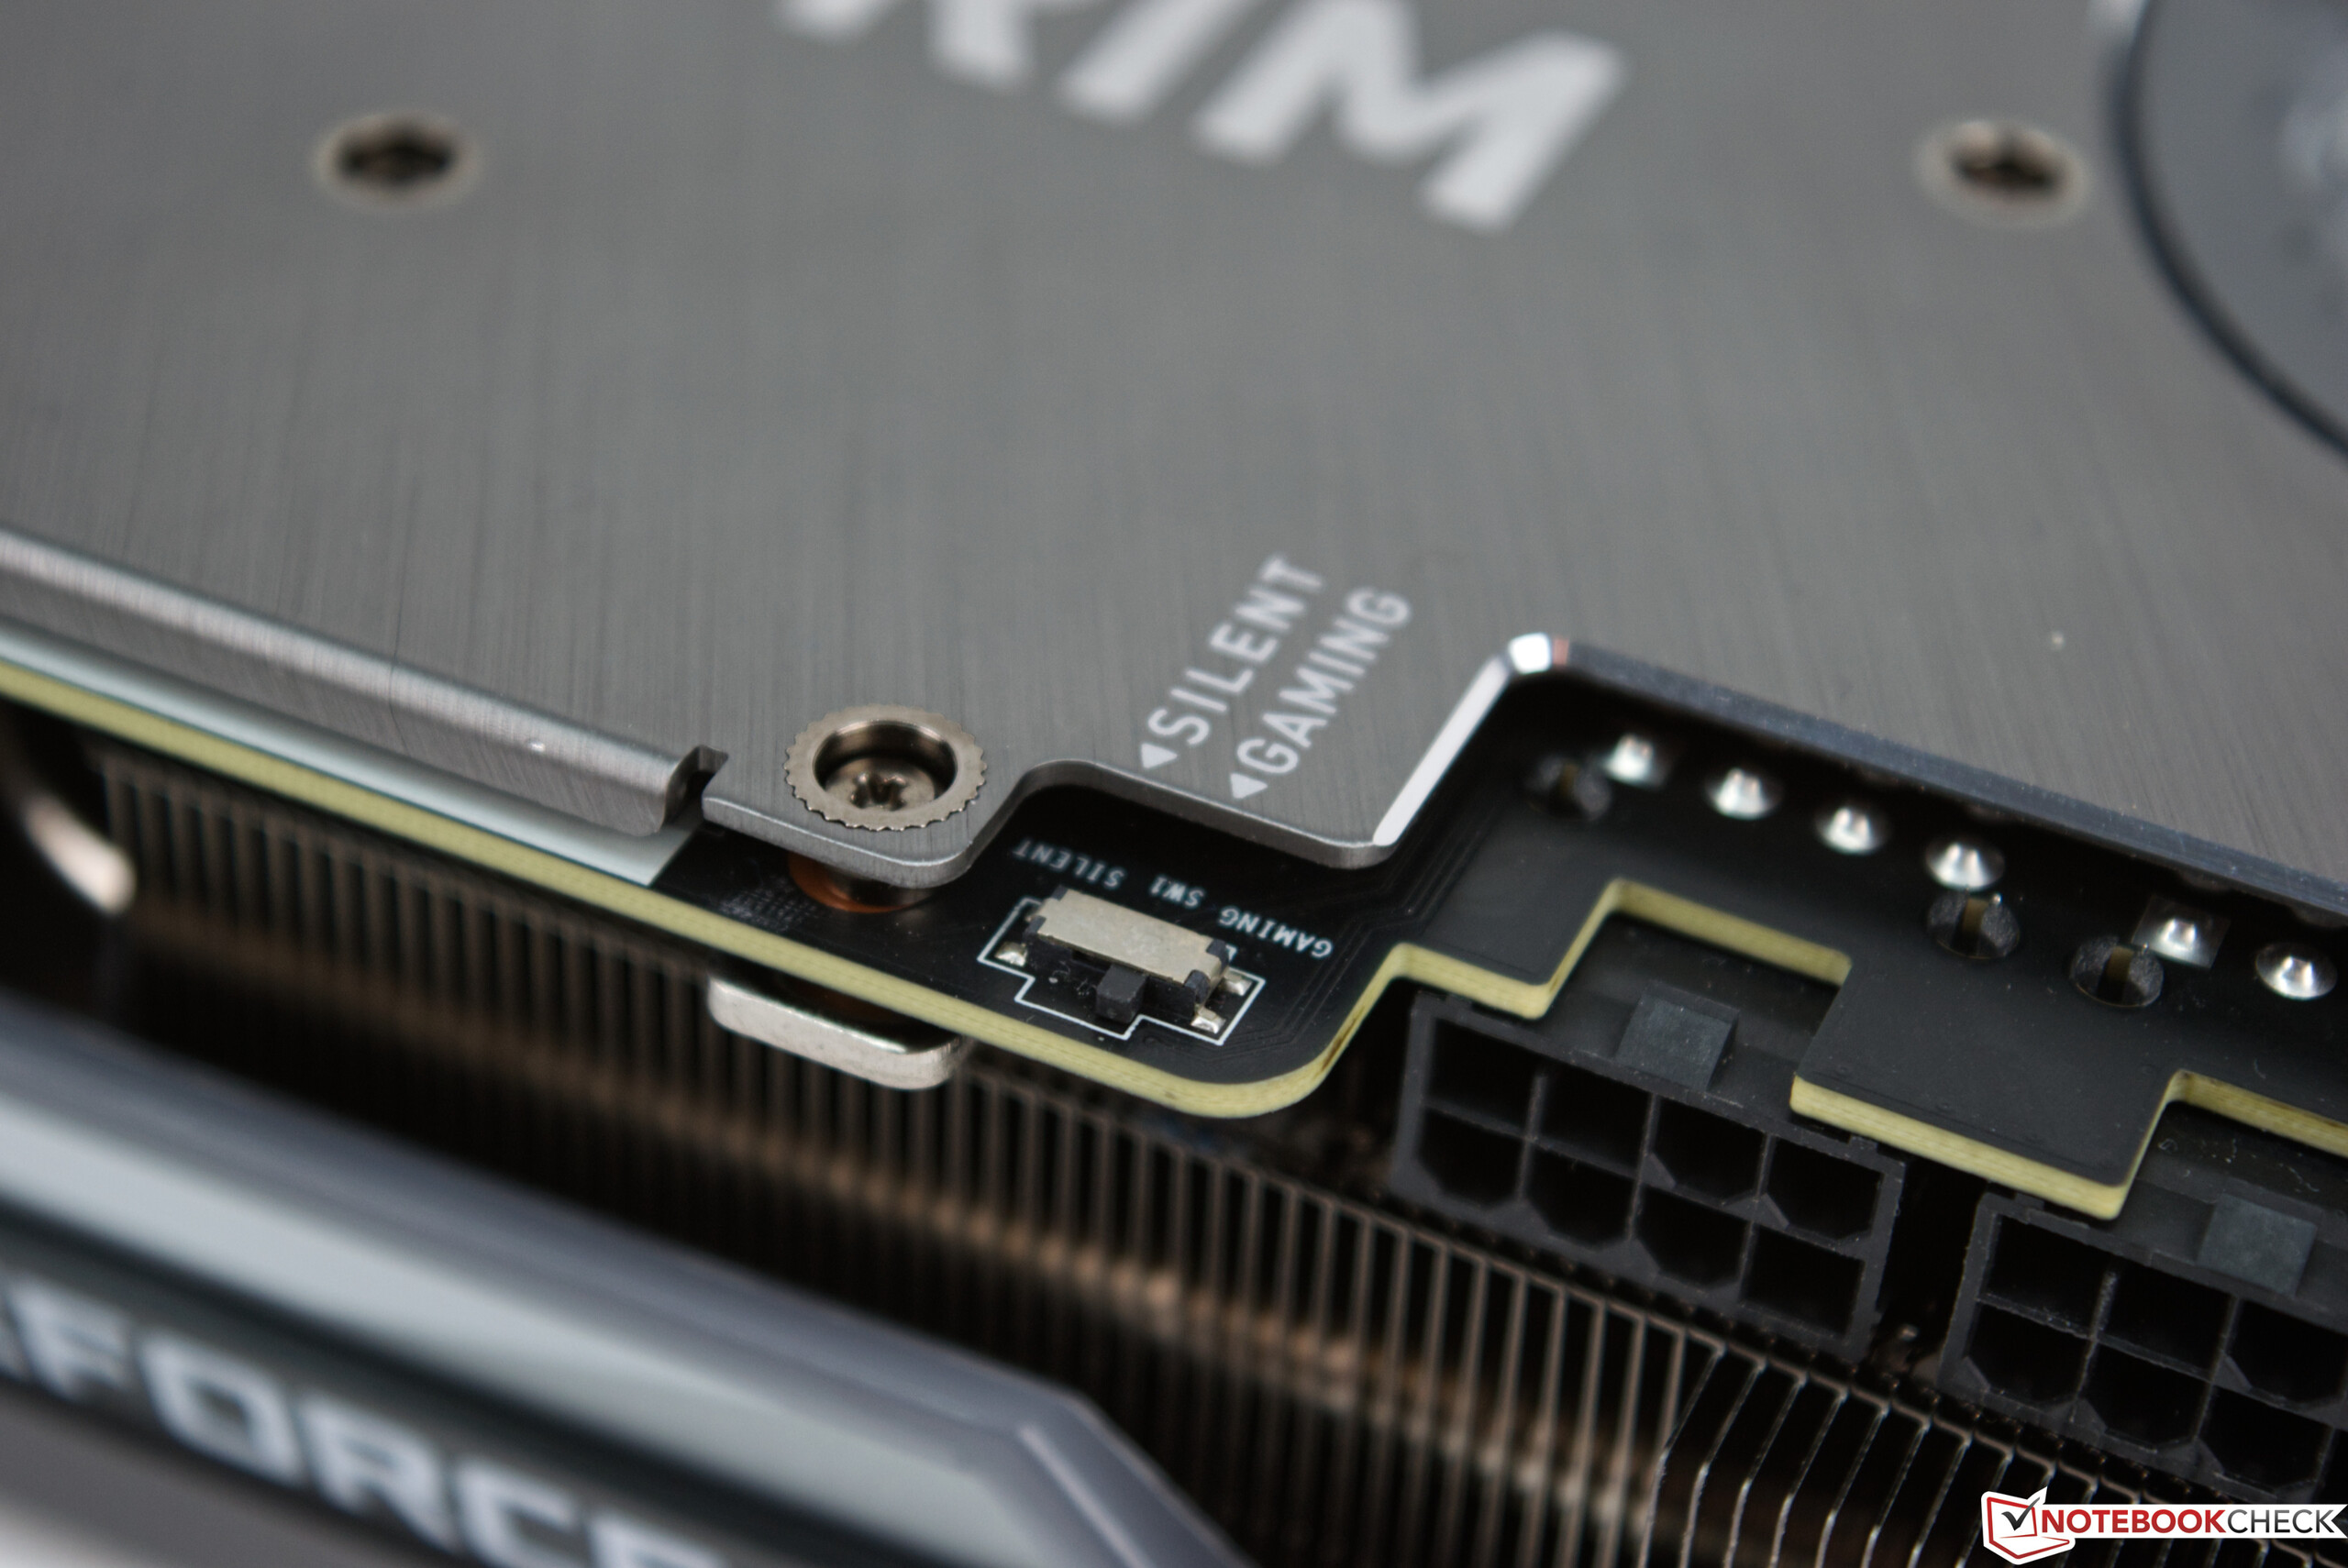
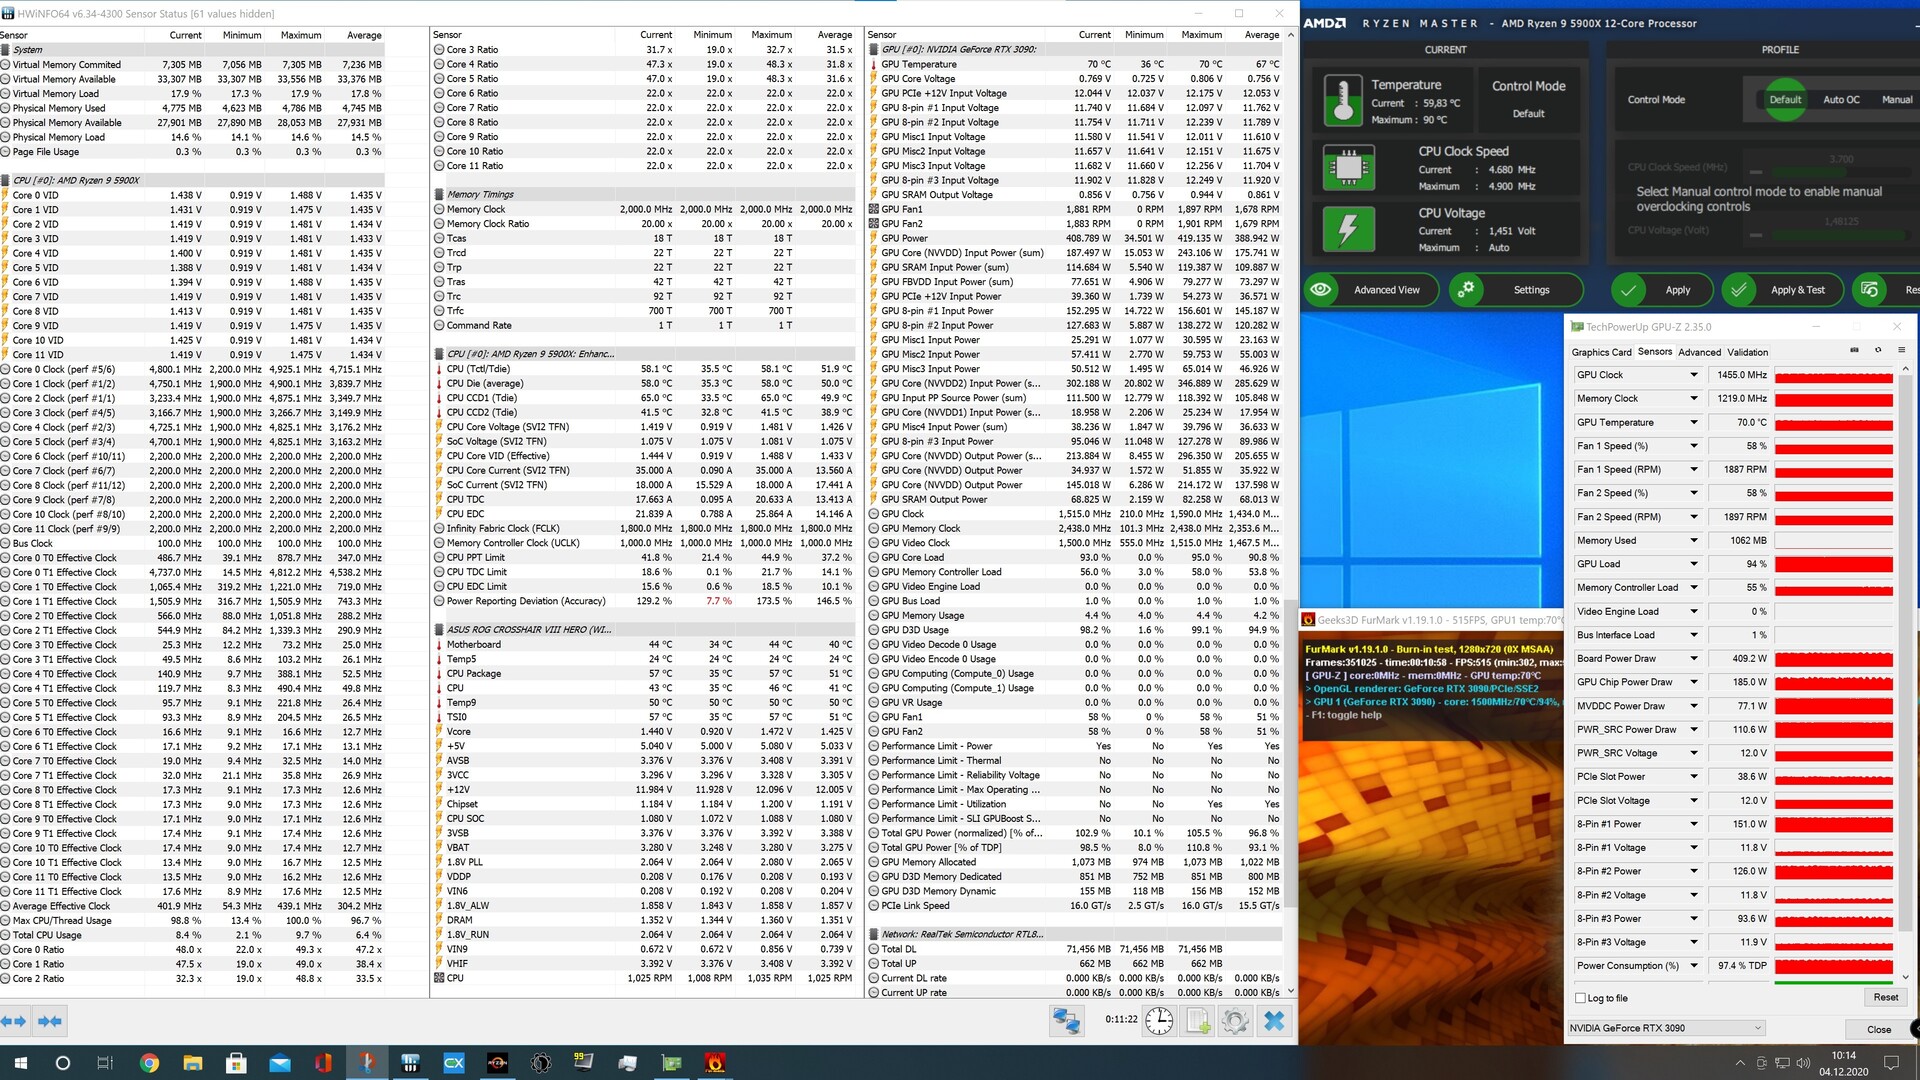
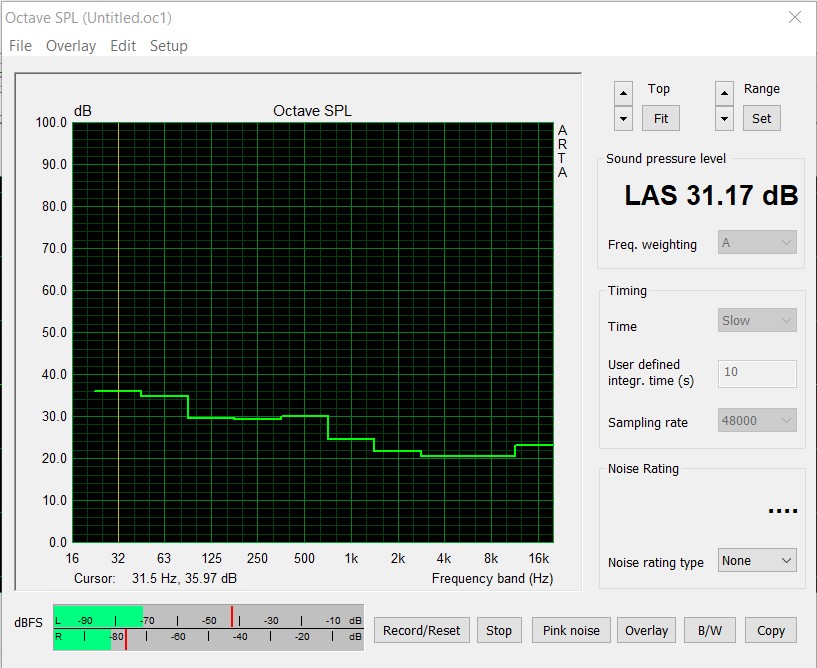
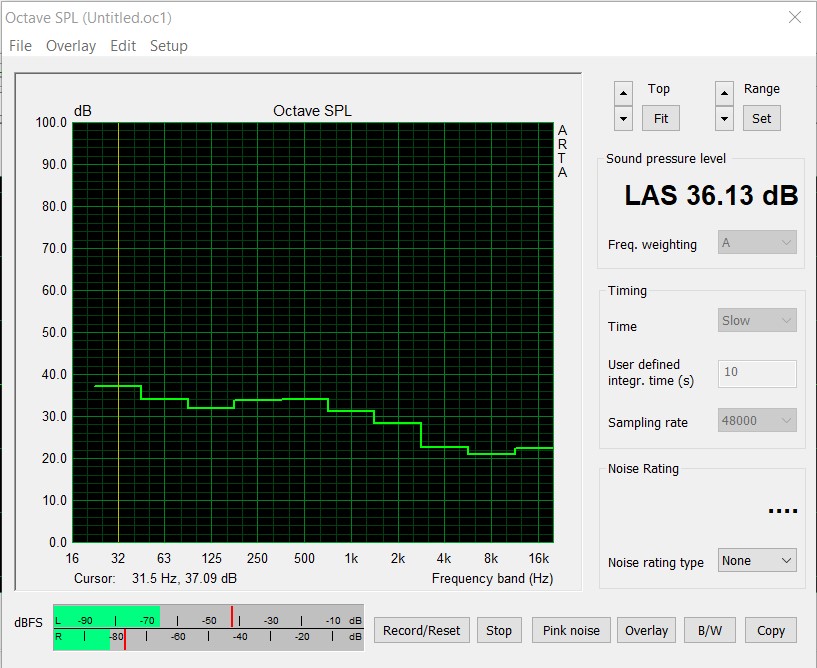
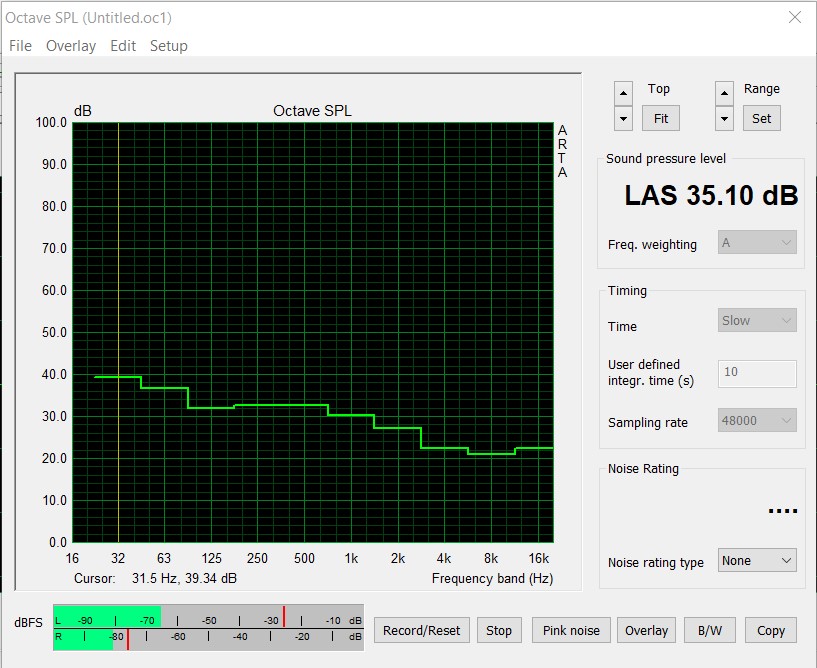
Il devrait être clair pour tout le monde que vous ne pouvez pas vous attendre à des miracles d'économie d'énergie avec le GeForce RTX 3090. MSI augmente encore la consommation d'énergie du GeForce RTX 3090 Suprim X avec un TDP plus élevé allant jusqu'à 420 watts. À titre de comparaison : Le modèle de référence a un TDP spécifié allant jusqu'à 350 watts. Bien que MSI ajoute 70 watts supplémentaires, notre échantillon d'examen se comporte assez bien dans le test de charge. 70 °C (~158 °F) est la température la plus élevée dans le test de charge lorsque le boîtier est fermé. C'est une bonne valeur et montre que le concept de refroidissement fonctionne de manière optimale. Les trois ventilateurs de 100 millimètres s'arrêtent même souvent et ne commencent à tourner qu'à un peu moins de 50 °C (~122 °F). Cela signifie que la carte graphique n'est pas audible en cas d'utilisation au ralenti ; les ventilateurs n'ont pas besoin de fonctionner lorsque le boîtier est bien aéré. En charge, nous mesurons un niveau de bruit de 36,1 dB(A) pour l'ensemble du système à une distance de 20 centimètres à côté du boîtier et à la hauteur de la carte graphique. Si l'on laisse la carte graphique fonctionner en mode silencieux, le niveau de bruit baisse légèrement à 35,1 dB(A)
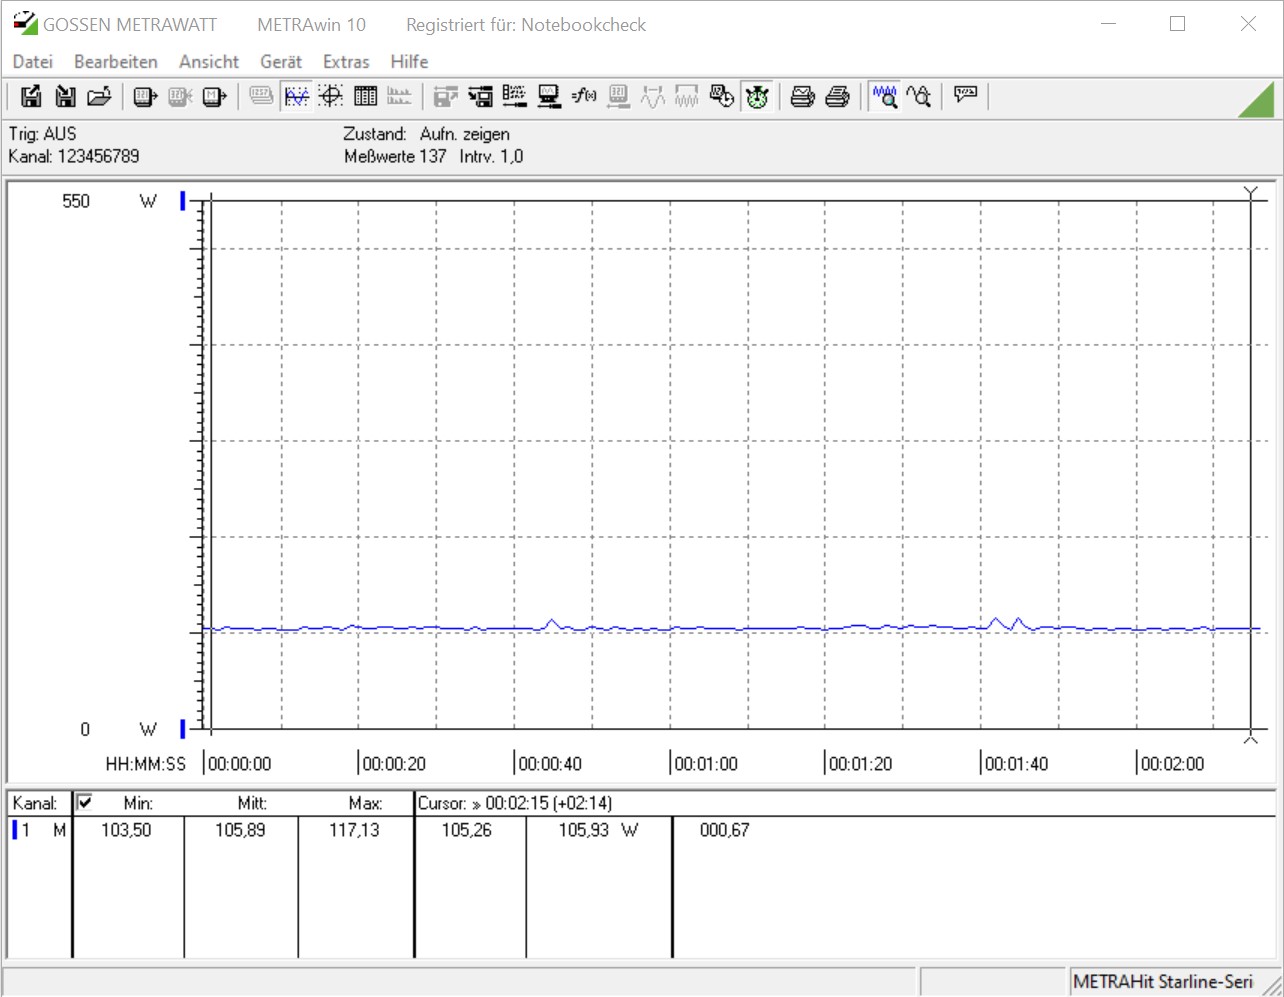
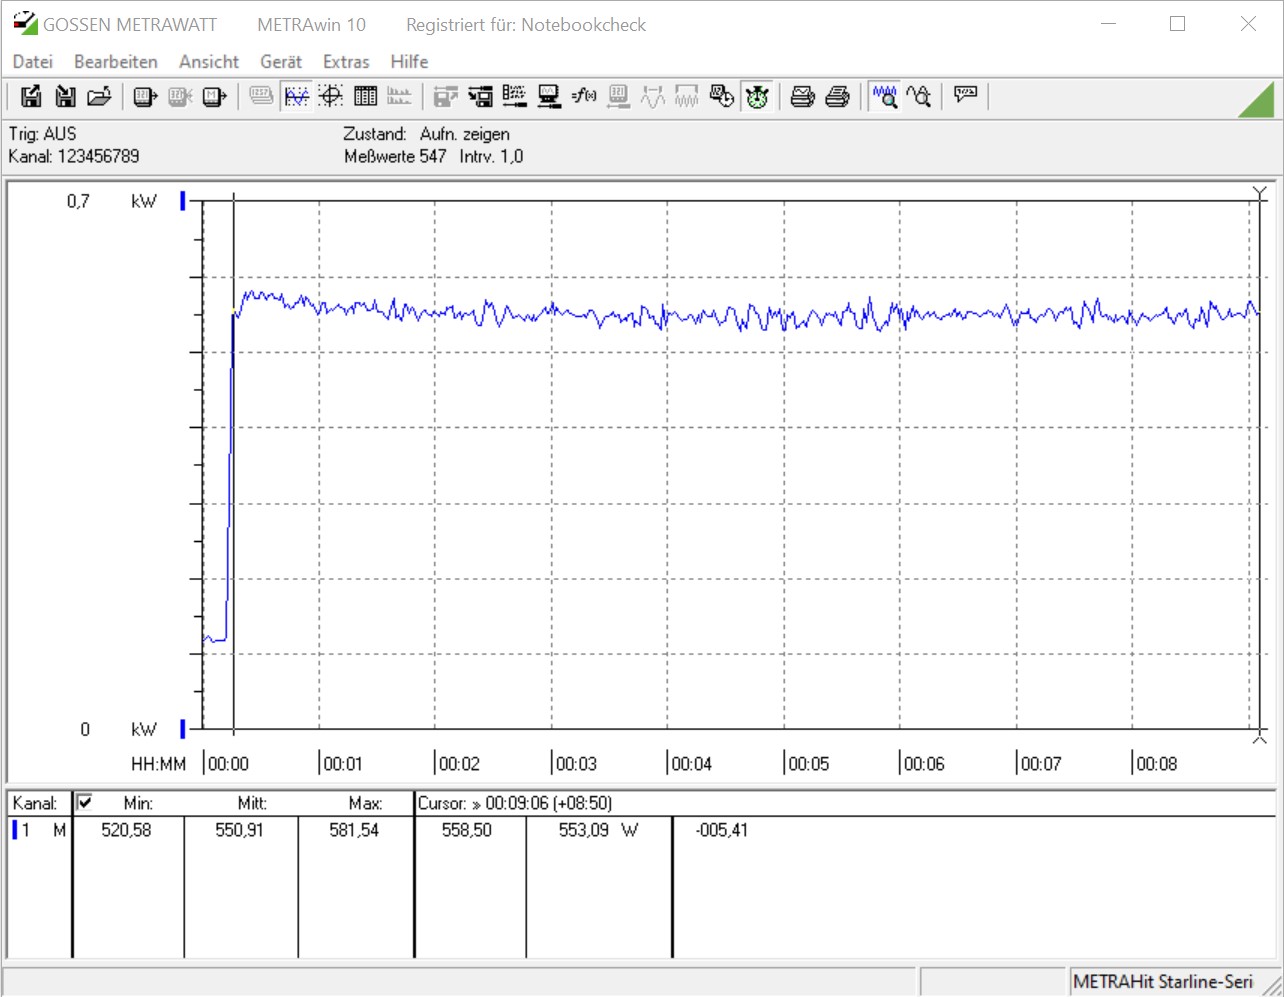
Comme prévu, la consommation d'énergie est élevée. Il convient également de mentionner que nos mesures concernent l'ensemble du système (y compris neuf ventilateurs de 120 millimètres). En utilisation au repos, un peu moins de 106 watts sont tirés de la prise de courant ; dans le même temps, 597 watts sont affichés sur notre appareil de mesure en charge lors du jeu. Si vous augmentez maintenant la puissance cible à 450 watts, vous dépasserez facilement 600 watts pendant le jeu. Par rapport aux autres cartes graphiques que nous avons testées jusqu'à présent, la MSI GeForce RTX 3090 Suprim X est de loin en tête dans ce domaine.
Ceux qui achètent la MSI GeForce RTX 3090 Suprim X doivent absolument disposer d'un bloc d'alimentation puissant. Nous recommandons un bloc d'alimentation de 850 watts au minimum.
| Power Consumption | |
| 1920x1080 The Witcher 3 ultra (external Monitor) | |
| MSI GeForce RTX 3090 Suprim X (Idle: 105.9 W) | |
| ASUS GeForce RTX 3080 ROG STRIX OC GAMING (Idle: 88.3 W) | |
| AMD Radeon RX 6800 XT (Idle: 99.5 W) | |
| KFA2 GeForce RTX 2080 Ti EX (Idle: 100.5 W) | |
| AMD Radeon RX Vega 64 (Idle: 74.3 W) | |
| MSI RTX 2080 Gaming X Trio (Idle: 87.78 W) | |
| MSI GeForce RTX 3070 Gaming X Trio (Idle: 95.1 W) | |
| Nvidia GeForce RTX 2080 Super (Idle: 78.87 W) | |
| AMD Radeon RX 5700 XT (Idle: 69.8 W) | |
| Nvidia GeForce RTX 2070 Super (96.8 ips, Idle: 80.5 W) | |
| MSI RTX 2070 Gaming Z 8G (Idle: 73.3 W) | |
| AMD Radeon VII (Idle: 81.39 W) | |
| Nvidia GeForce RTX 2060 Super (82.7 ips, Idle: 77.12 W) | |
| AMD Radeon RX 5700 (84.2 ips, Idle: 64.5 W) | |
| MSI RTX 2060 Gaming Z 6G (Idle: 74.66 W) | |
| 1280x720 FurMark 1.19 GPU Stress Test (external Monitor) | |
| MSI GeForce RTX 3090 Suprim X (Idle: 105.9 W) | |
| ASUS GeForce RTX 3080 ROG STRIX OC GAMING (Idle: 88.3 W) | |
| AMD Radeon RX 6800 XT (Idle: 99.5 W) | |
| AMD Radeon VII (Idle: 81.39 W) | |
| MSI RTX 2080 Gaming X Trio | |
| KFA2 GeForce RTX 2080 Ti EX (Idle: 100.5 W) | |
| MSI GeForce RTX 3070 Gaming X Trio (Idle: 95.1 W) | |
| Nvidia GeForce RTX 2080 Super (Idle: 78.87 W) | |
| MSI RTX 2070 Gaming Z 8G (Idle: 73.3 W) | |
| AMD Radeon RX 5700 XT (239 ips, Idle: 69.8 W) | |
| Nvidia GeForce RTX 2070 Super (283 ips, Idle: 80.5 W) | |
| MSI RTX 2060 Gaming Z 6G (Idle: 74.66 W) | |
| Nvidia GeForce RTX 2060 Super (237 ips, Idle: 77.12 W) | |
| AMD Radeon RX 5700 (207 ips, Idle: 64.5 W) | |
* ... Moindre est la valeur, meilleures sont les performances
Points positifs
Points négatifs
Verdict - Très avide de pouvoir et extrêmement rapide
La RTX 3090 de GeForce est sans aucun doute la carte graphique de jeu la plus rapide du marché à l'heure actuelle. Avec la Suprim X de MSI GeForce RTX 3090, nous avons eu un modèle spécial de MSI dans le test ; non seulement elle a pu convaincre avec de très bonnes performances de jeu, mais le nouveau modèle Suprim X a aussi beaucoup à offrir en ce qui concerne son apparence. À cela s'ajoute une fabrication de très haute qualité qui se reflète tant au niveau de l'aspect que du toucher. Néanmoins, vous devez savoir que ces très hautes performances s'accompagnent d'une très forte demande en énergie. On ne peut passer sous silence les presque 600 watts du système de test sans moniteur. Le plus grand avantage du GeForce RTX 3090 est la VRAM de 24 Go, puisqu'elle est plus de deux fois plus grande que celle du GeForce RTX 3080. À long terme, cela pourrait signifier la fin du RTX 3080. AMD adopte une approche différente avec ses cartes graphiques RX 6000 et propose les trois modèles avec 16 Go de VRAM.
Si l'on considère la performance pure du jeu, le MSI GeForce RTX 3090 Suprim X peut clairement tenir tête à un GeForce RTX 3080. Avec la Radeon RX 6800 XT, AMD se classe derrière la RTX 3080. Par conséquent, AMD ne peut représenter une menace pour Nvidia qu'avec une Radeon RX 6900 XT. Nous n'avons pas actuellement de données valables pour une comparaison avec une Radeon RX 6900 XT. Les principaux atouts de Nvidia sont actuellement le ray tracing et le DLSS. Le premier est également offert par les nouvelles cartes graphiques Big Navi d'AMD, mais AMD est toujours à la traîne en termes de performances dans ce domaine.
MSI a lancé une nouvelle série haut de gamme avec le GeForce RTX 3090 Suprim X. Le nouveau modèle haut de gamme offre un plaisir de jeu sans compromis, mais il nécessite des résolutions très élevées pour ne pas toujours fonctionner à la limite du CPU.
Malheureusement, la situation actuelle du marché est tendue depuis des mois, et ceux qui veulent acheter une nouvelle carte graphique doivent prendre ce qui est disponible. Obtenir la carte que vous voulez est presque un miracle pour le moment. En outre, les prix ont explosé, ce qui s'applique également à la MSI GeForce RTX 3090 Suprim X. Selon MSI, le PDSF de notre échantillon d'examen est de 1 649 euros (~1 998 $). Cependant, la carte graphique est cotée sur Geizhals pour près de 2 000 euros (~2 423 $) et parfois même pour beaucoup plus.
Tous les repères et les résultats des tests pour le RTX 3090 se trouvent sur le site de la carte graphique pour leGeForce RTX 3090(régulièrement mis à jour).

