Test de la Gigabyte GeForce RTX 4080 Super Gaming OC 16G : jeu égal avec la RX 7900 XTX pour 200 $ de moins que la RTX 4080 non Super Gaming

Nous avons jusqu'à présent examiné plusieurs nouveaux GPU de la série RTX 40 Super, dont la RTX 4070 Super Founders Edition, Gigabyte RTX 4070 Super Gaming OCde Gigabyte et la Asus TUF Gaming RTX 4070 Ti Super.
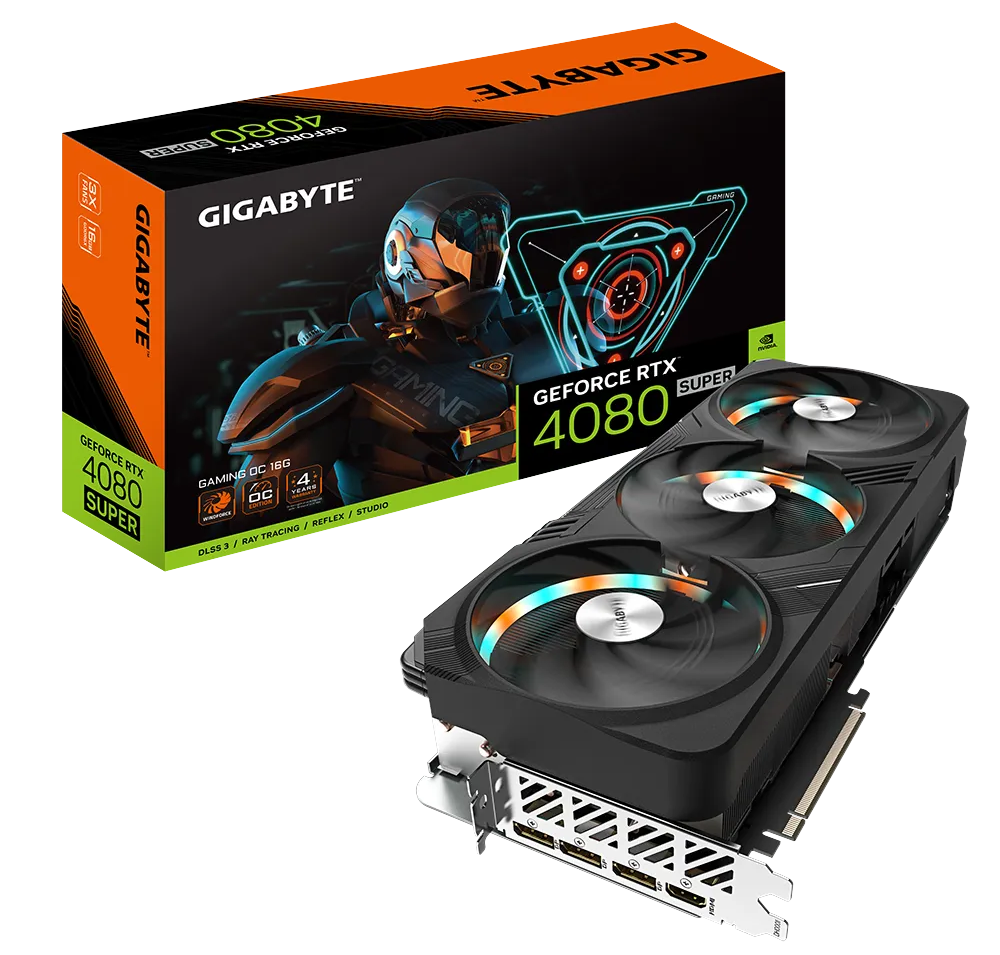
Aujourd'hui, nous avons avec nous la Gigabyte GeForce RTX 4080 Super Gaming OC 16G - un rafraîchissement de milieu de cycle de vie qui supplante complètement la RTX 4080 précédente.
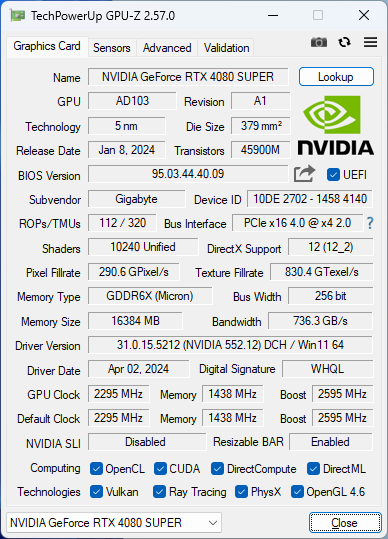
Alors que la RTX 4080 originale comportait 9 728 cœurs CUDA, la nouvelle RTX 4080 Super exploite au maximum le die AD103 en faisant fonctionner les 10 240 cœurs CUDA à pleine capacité. L'augmentation du nombre de shaders n'est que de 5%, ce qui n'est pas très impressionnant contrairement à la RTX 4070 Super (+21%) et à la RTX 4070 Super Ti (+10%). La VRAM reste inchangée à 16 Go GDDR6X, mais la bande passante globale est légèrement augmentée à 736,3 Go/s contre 716,8 Go/s pour la RTX 4080 non Super.
La RTX 4080 Super est vendue au prix de 1 000 dollars US, contre 200 dollars US pour la version originale. La version de Gigabyte de la RTX 4080 Super ajoute quelques avantages supplémentaires pour une prime nominale de 50 $US à un prix de vente de 1 050 $US.
En Inde, ce GPU est actuellement disponible dans une fourchette de ₹1,20,000 à ₹1,28,000 selon le revendeur et est livré avec une garantie standard de trois ans pouvant être prolongée d'une année supplémentaire.
Dans cet article, nous examinons la Gigabyte RTX 4080 Super Gaming OC et voyons si les gains de performance et le prix annoncés sont raisonnables, en particulier avec le lancement de Blackwell prévu plus tard dans l'année.
Comparaison du Gigabyte GeForce RTX 4080 Super Gaming OC 16G avec d'autres GPU Nvidia
| Spécification | RTX 4090 FE | Gigabyte RTX 4080 Super Gaming OC | RTX 4080 FE | Asus TUF RTX 4070 Ti Super | RTX 4070 Super FE | ZotacRTX 4070 AMP Airo | KFA2RTX 4060 Ti EX | RTX 3090 Ti FE | RTX 3090 FE | RTX 3080 Ti FE | RTX 3070 FE | Titan RTX |
|---|---|---|---|---|---|---|---|---|---|---|---|---|
| Puce | AD102 | AD103 | AD103 | AD103 | AD104 | AD104 | AD106 | GA102 | GA102 | GA102 | 4 | TU102 |
| Processus FinFET | 4N personnalisé | 4N personnalisé | 4N personnalisé | 4N personnalisé | 4N personnalisé | 4N personnalisé | 4N personnalisé | 8 nm | 8 nm | 8 nm | 8 nm | 12 nm |
| Cœurs CUDA | 16 384 | 10 240 | 9 728 | 8 448 | 7 168 | 5 888 | 4 352 | 10 752 | 10 496 | 10 240 | 5 888 | 4 608 |
| Unités de texture | 512 | 320 | 304 | 264 | 224 | 184 | 136 | 336 | 328 | 320 | 184 | 288 |
| Tensor Cores | 512 4th Gen. | 320 4th Gen. | 304 4th Gen. | 264 4th Gen. | 224 4th Gen. | 184 4th Gen. | 136 4th Gen. | 336 3rd Gen. | 328 3rd Gen. | 320 3rd Gen. | 184 3rd Gen. | 576 2nd Gen. |
| RT Cores | 128 3rd Gen. | 80 3rd Gen. | 76 3rd Gen. | 66 3rd Gen. | 56 3rd Gen. | 46 3rd Gen. | 34 3rd Gen. | 84 2nd Gen. | 82 2nd Gen. | 80 2nd Gen. | 46 2nd Gen. | 72 |
| Horloge de base du GPU | 2,235 MHz | 2,295 MHz | 2,205 MHz | 2,340 MHz | 1,980 MHz | 1,920 MHz | 2,310 MHz | 1,560 MHz | 1,395 MHz | 1,365 MHz | 1,500 MHz | 1,350 MHz |
| Horloge Boost GPU | 2,520 MHz | 2,595 MHz | 2,505 MHz | 2,610 MHz | 2,475 MHz | 2,535 MHz | 2,535 MHz | 1,860 MHz | 1,695 MHz | 1,665 MHz | 1,750 MHz | 1,770 MHz |
| Bus mémoire | 384-bit | 256-bit | 256-bit | 256-bit | 192-bit | 192-bit | 128-bit | 384-bit | 384-bit | 384-bit | 256-bit | 384-bit |
| Bande passante mémoire | 1 008 GB/s | 736,3 GB/s | 716,8 GB/s | 672 GB/s | 504 GB/s | 504 GB/s | 288 GB/s | 1 008 GB/s | 936 GB/s | 912 GB/s | 448 GB/s | 672 GB/s |
| Mémoire vidéo | 24 GB GDDR6X | 16 GB GDDR6X | 16 GB GDDR6X | 16 GB GDDR6X | 12 GB GDDR6X | 12 GB GDDR6X | 8 GB GDDR6 | 24 GB GDDR6X | 24 GB GDDR6X | 12 GB GDDR6X | 8 GB GDDR6 | 24 GB GDDR6 |
| Consommation électrique | 450 W | 320 W | 320 W | 285 W | 220 W | 215 W | 160 W | 450 W | 350 W | 350 W | 220 W | 280 W |
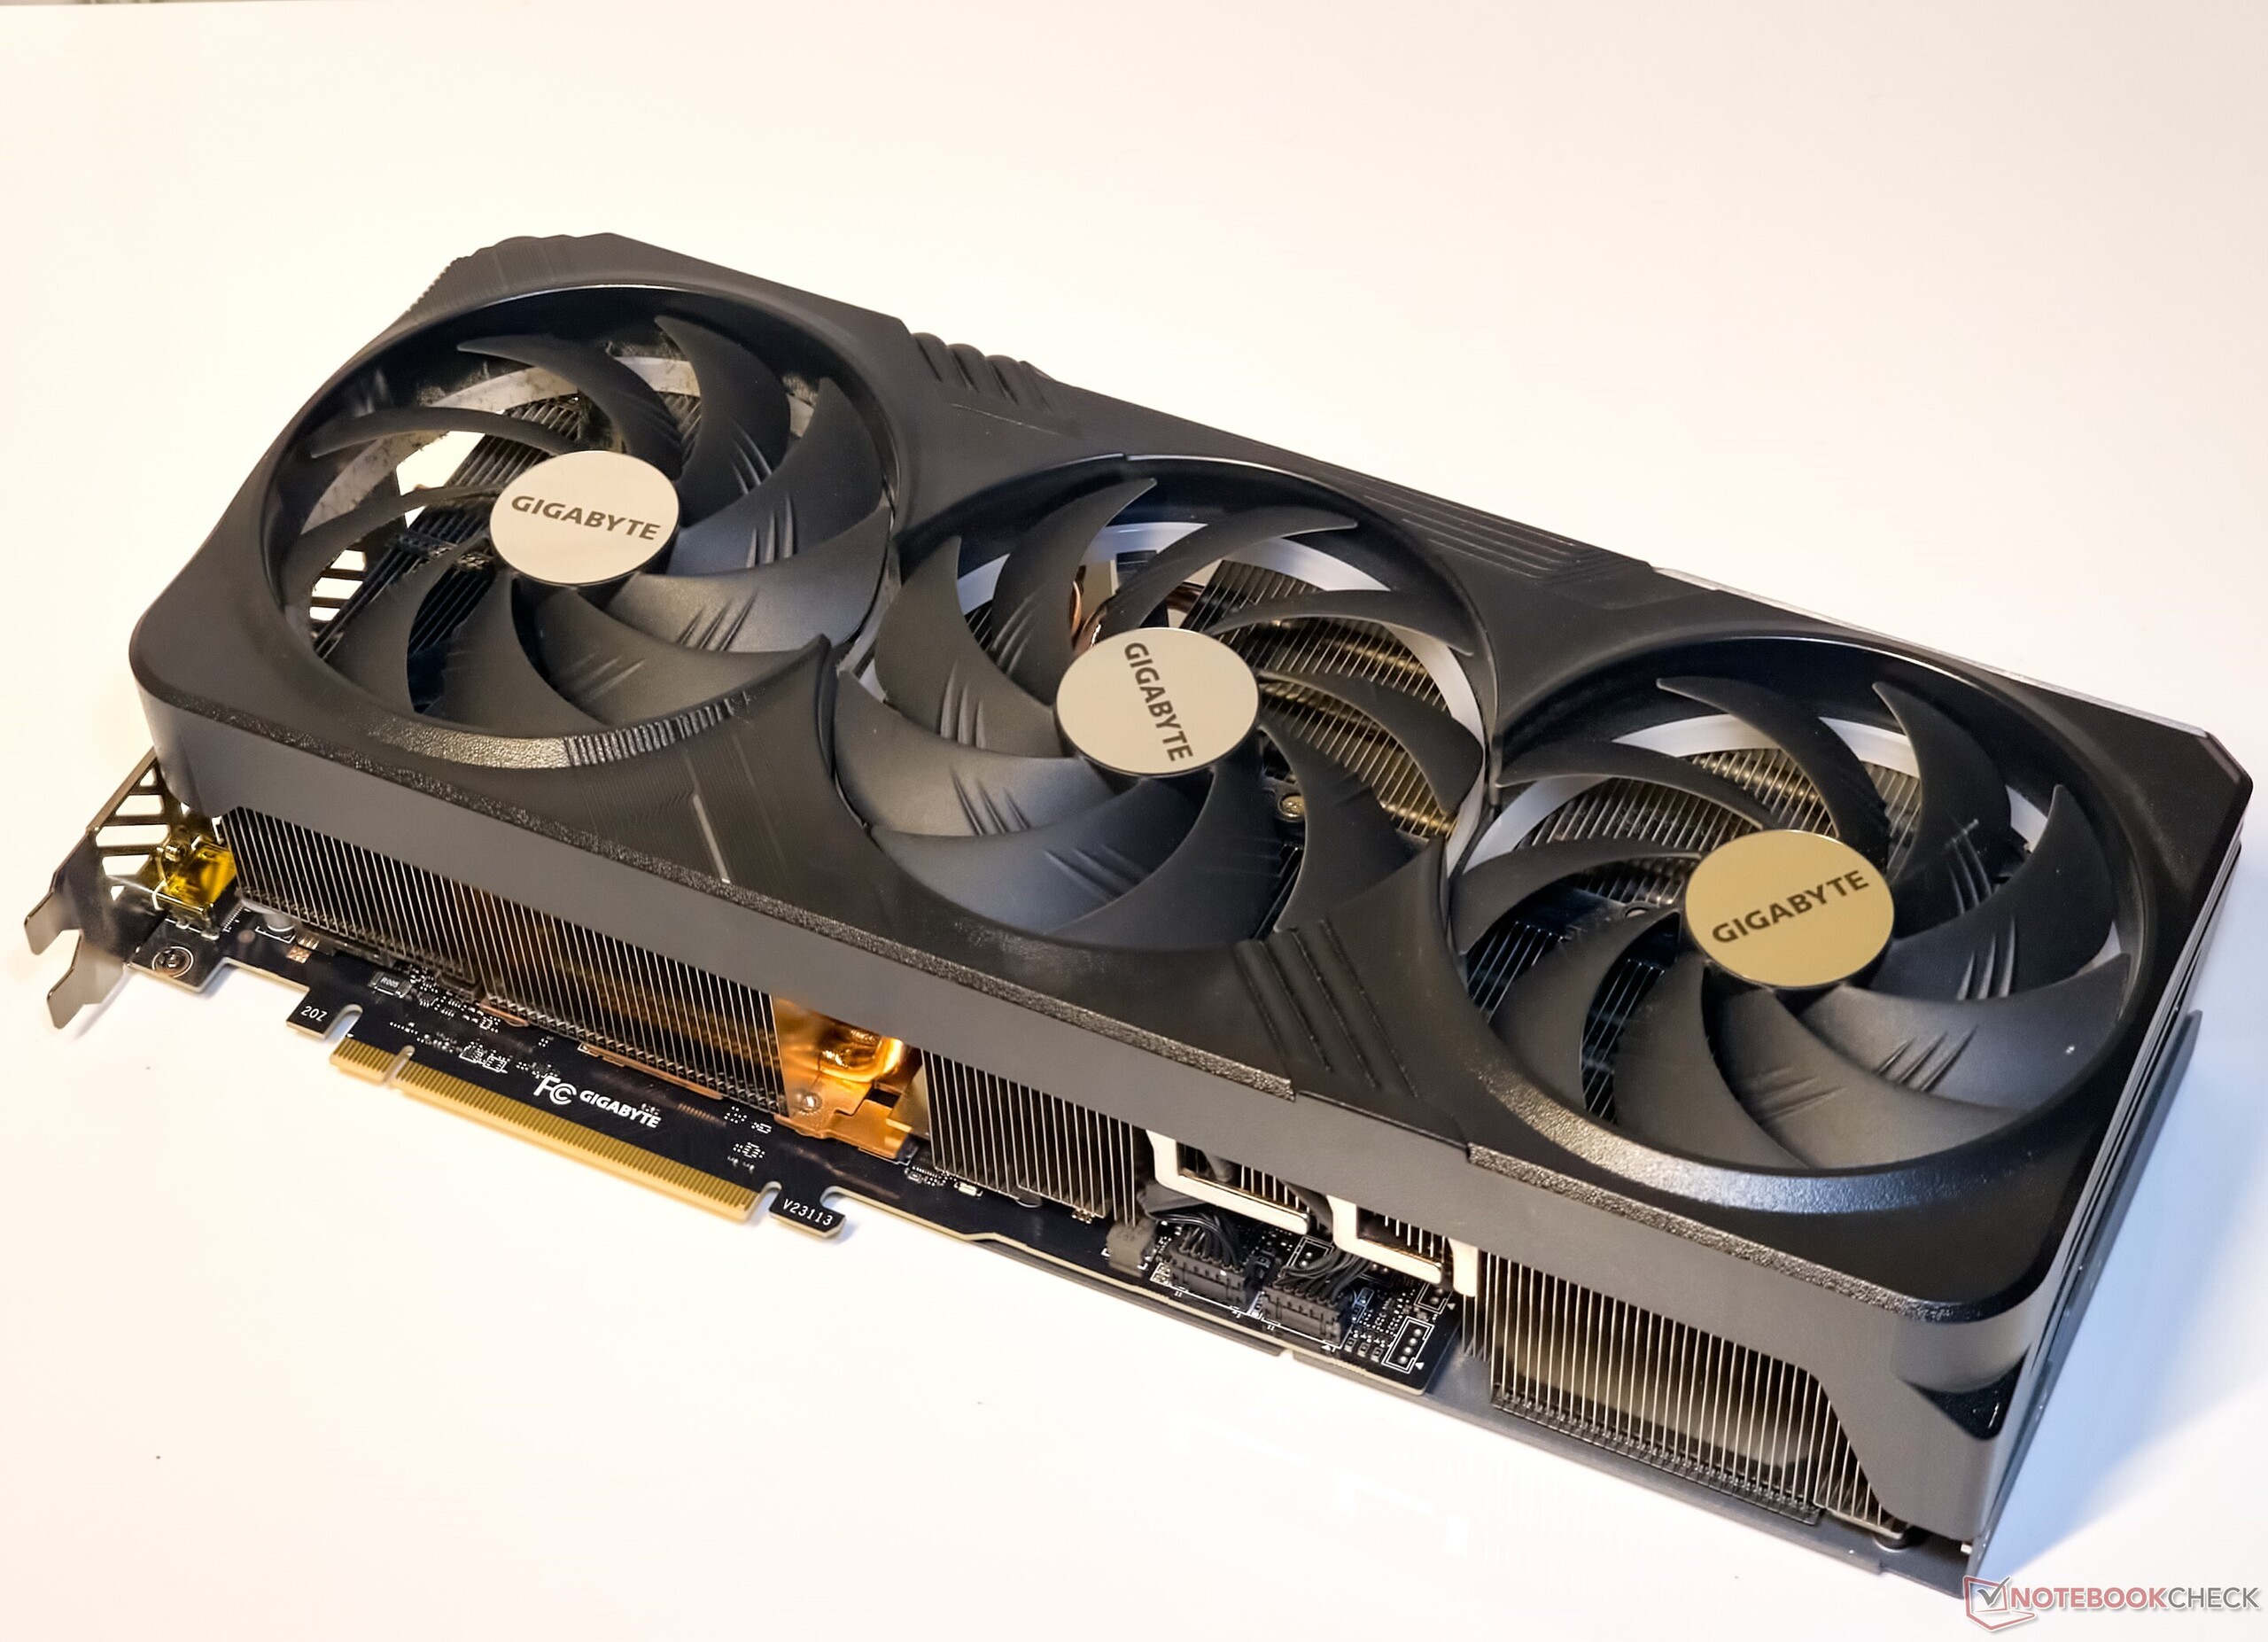
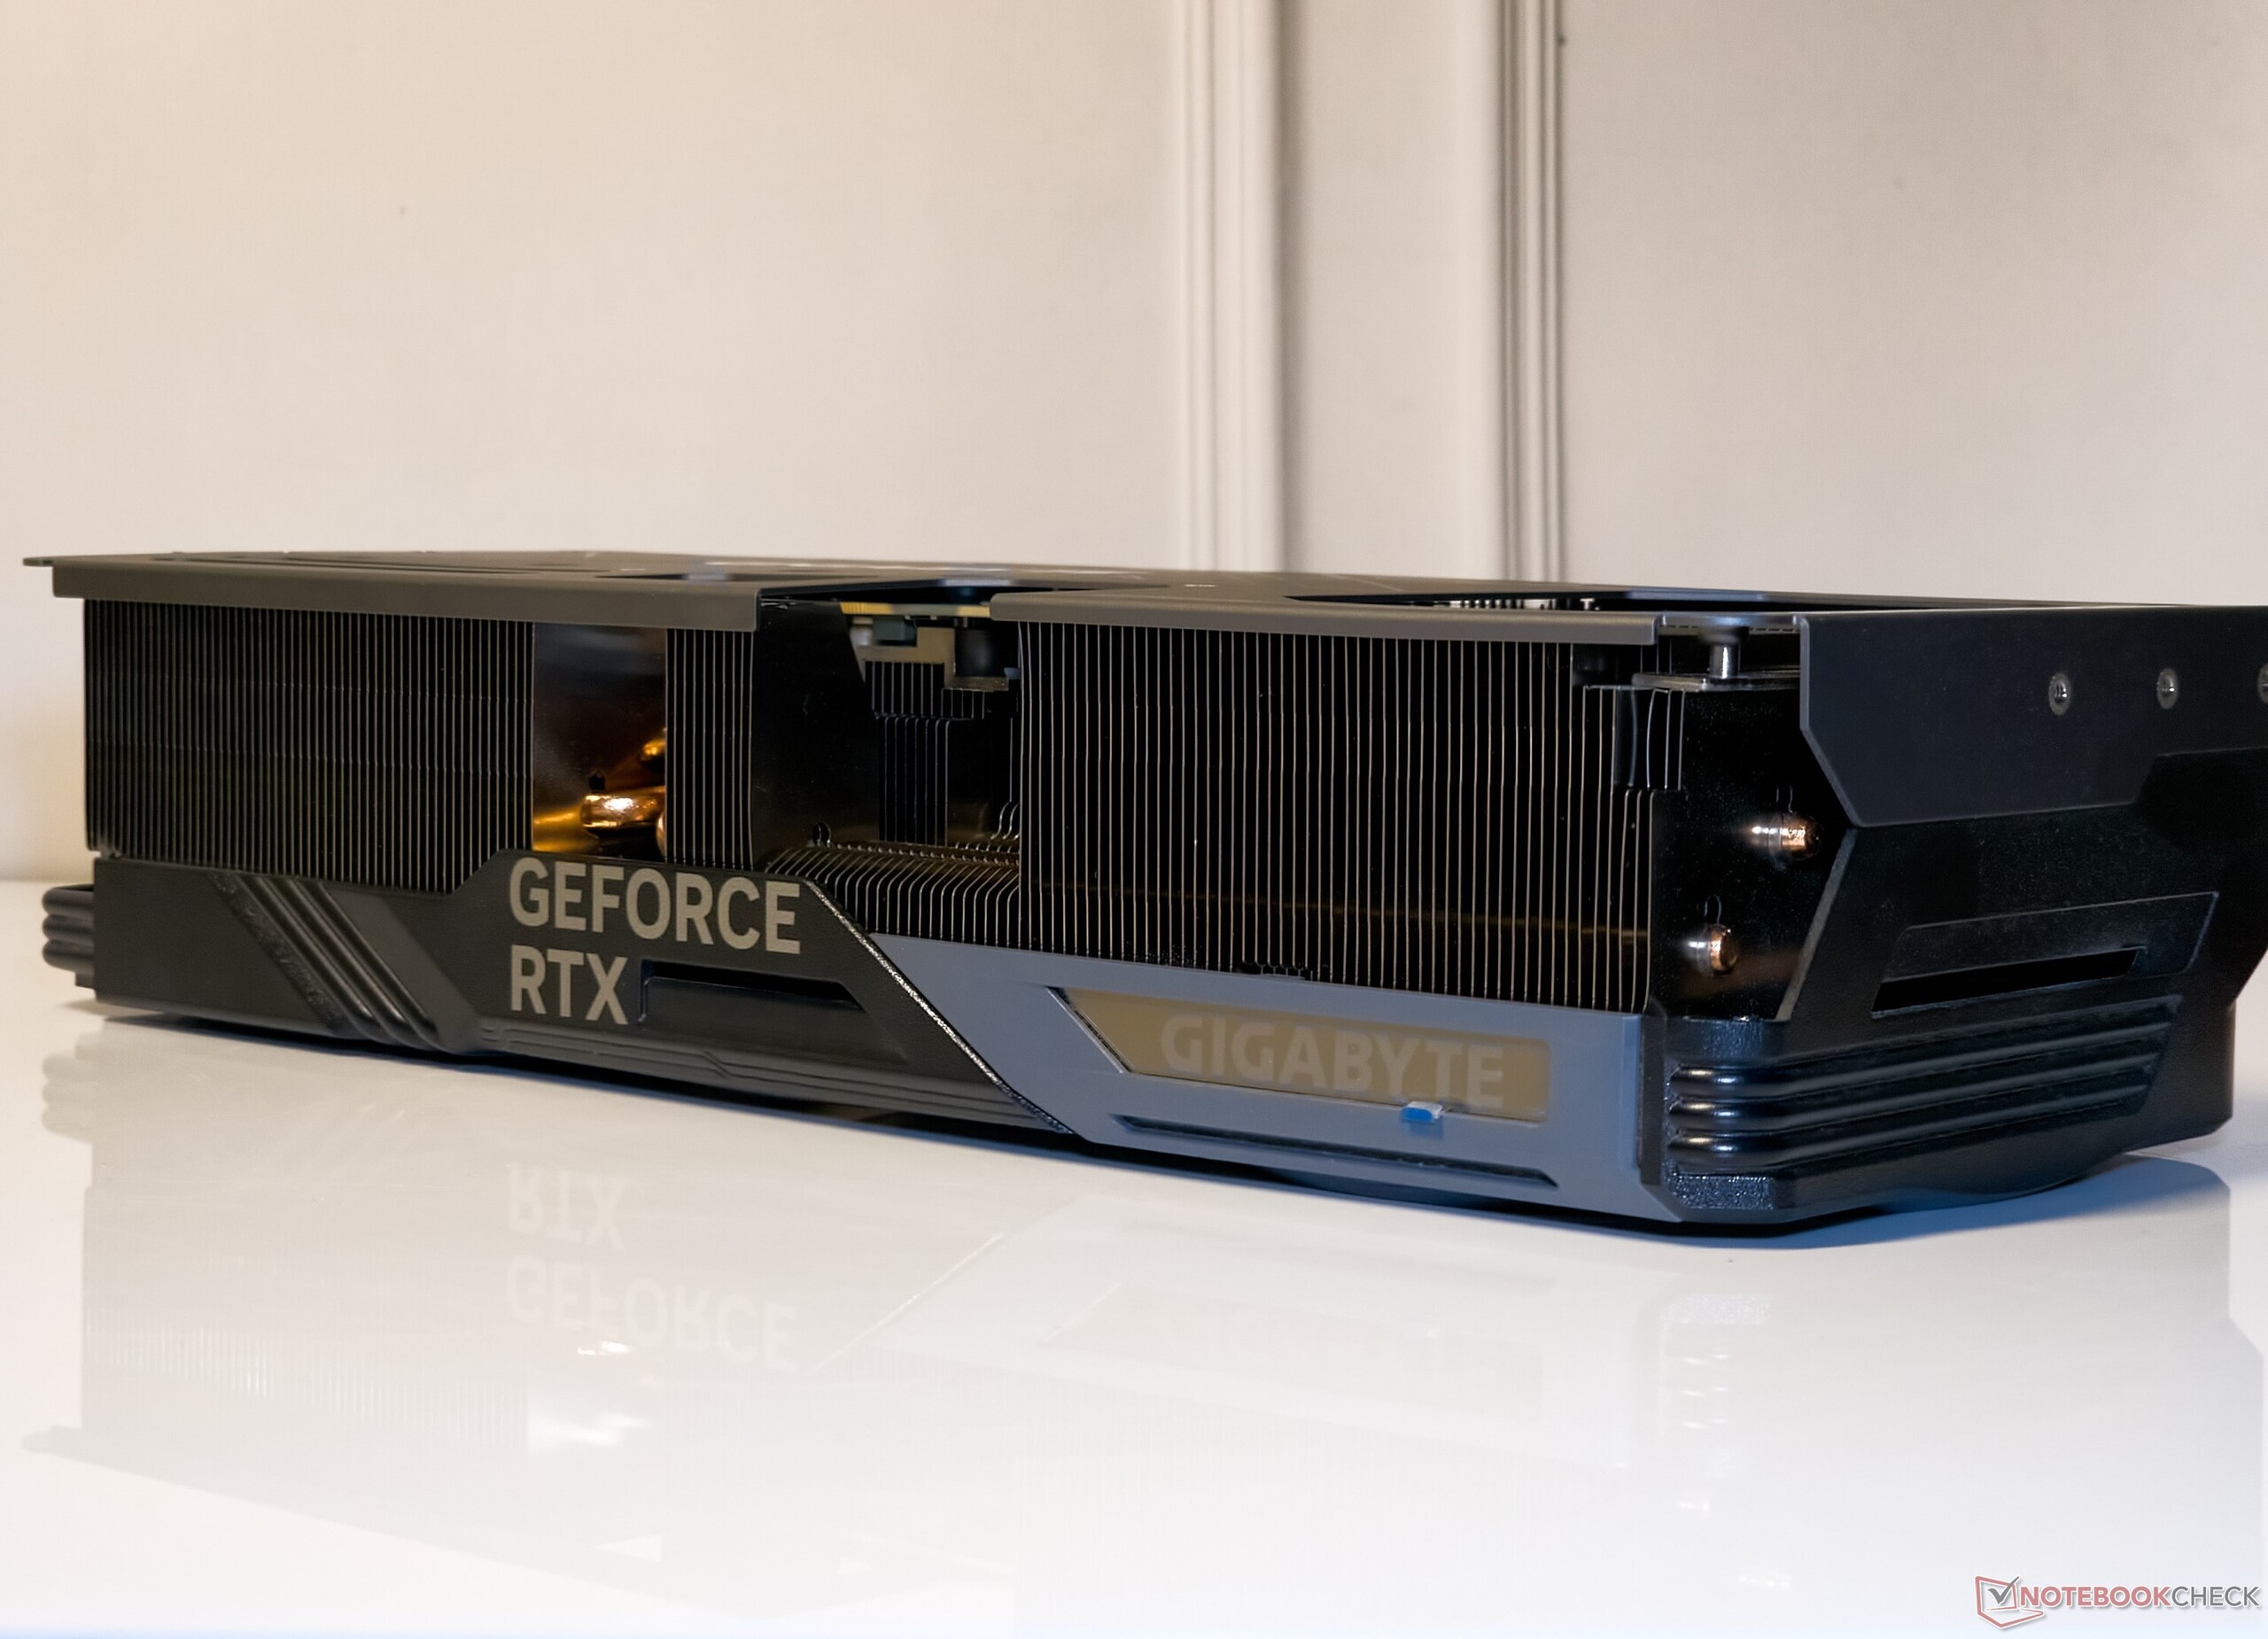
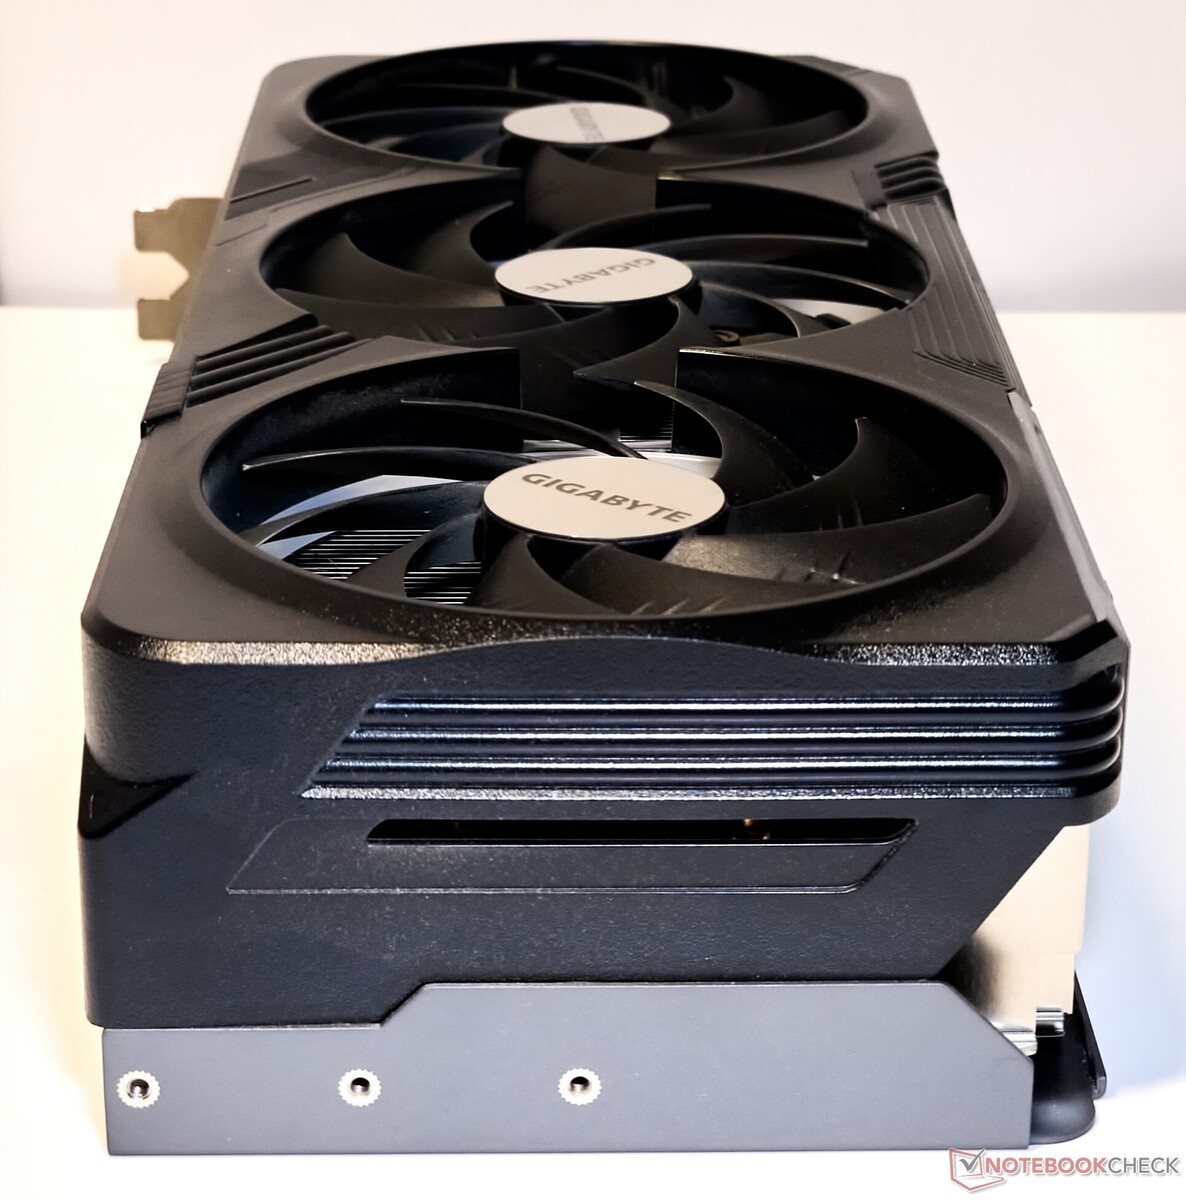
Le Gigabyte GeForce RTX 4080 Super Gaming OC de près
Gigabyte n'a pas changé le design de la RTX 4080 Super Gaming OC 16G par rapport à son prédécesseur non Super. Avec ses 342 x 150 x 75 mm et son poids de 1,74 kg, la RTX 4080 Super Gaming OC occupe près de trois emplacements PCIe sur la carte, ce qui lui permet de bénéficier d'un boîtier plus grand et d'une carte mère E-ATX dans l'idéal.
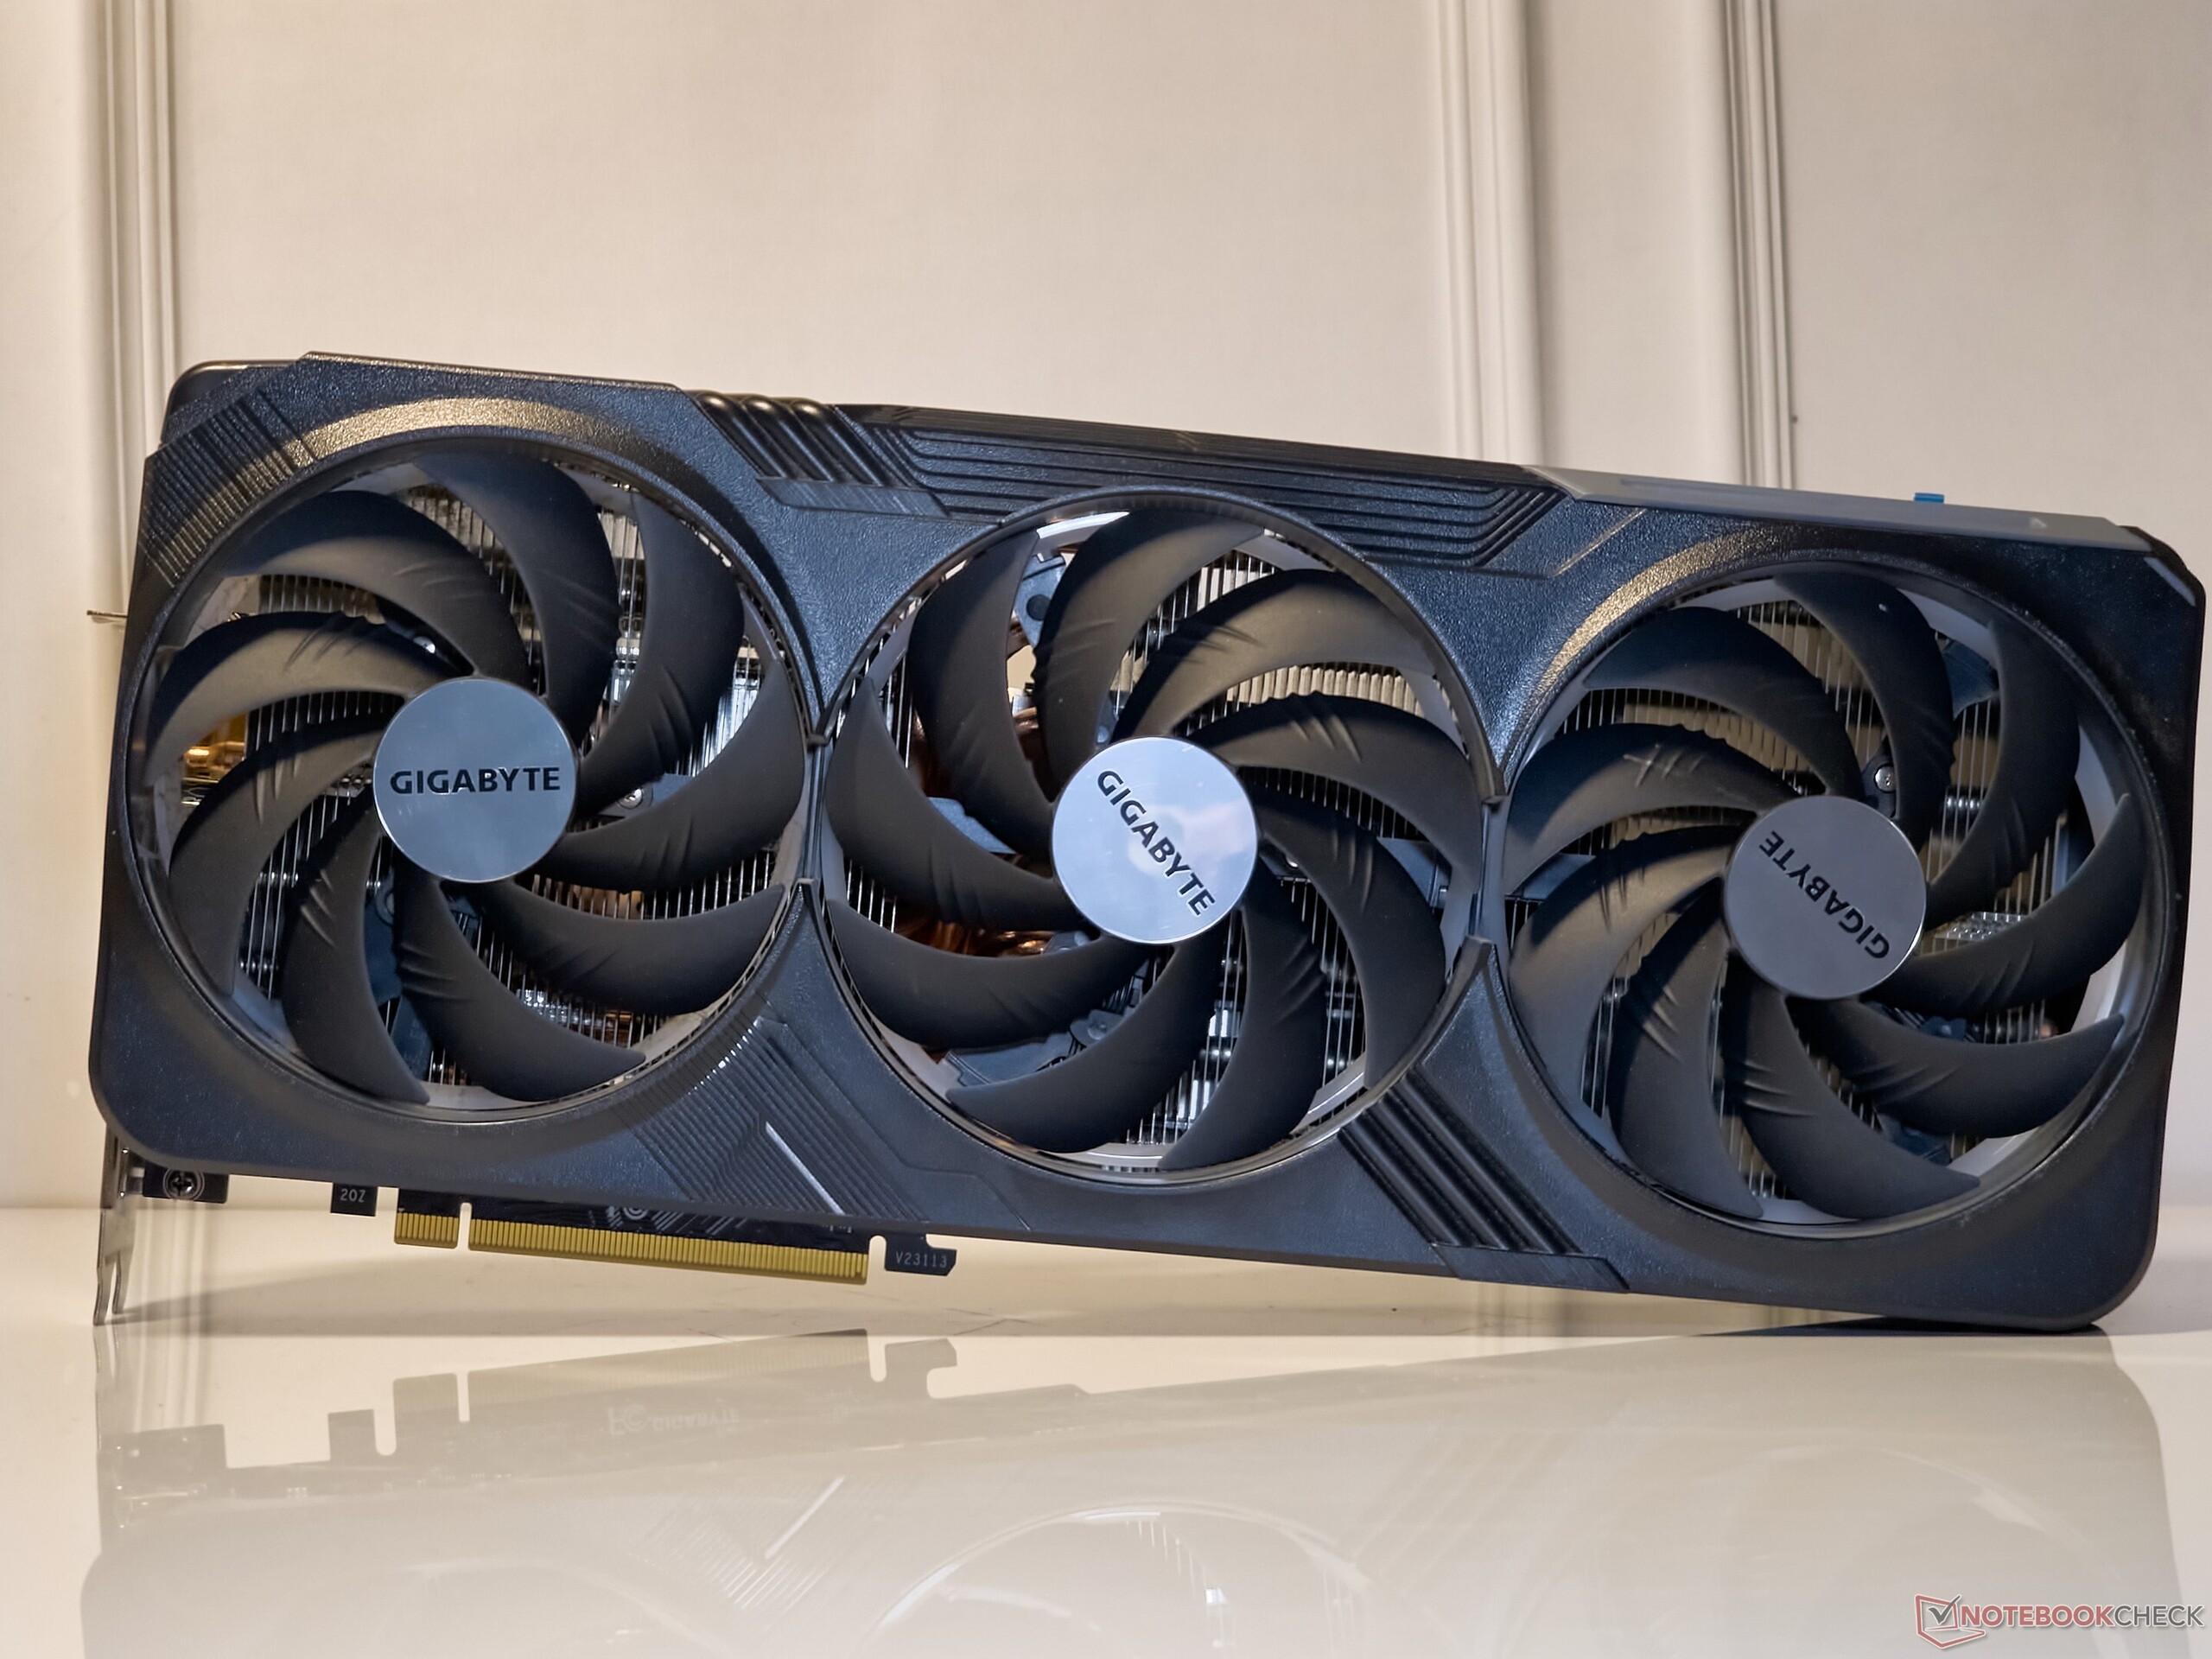
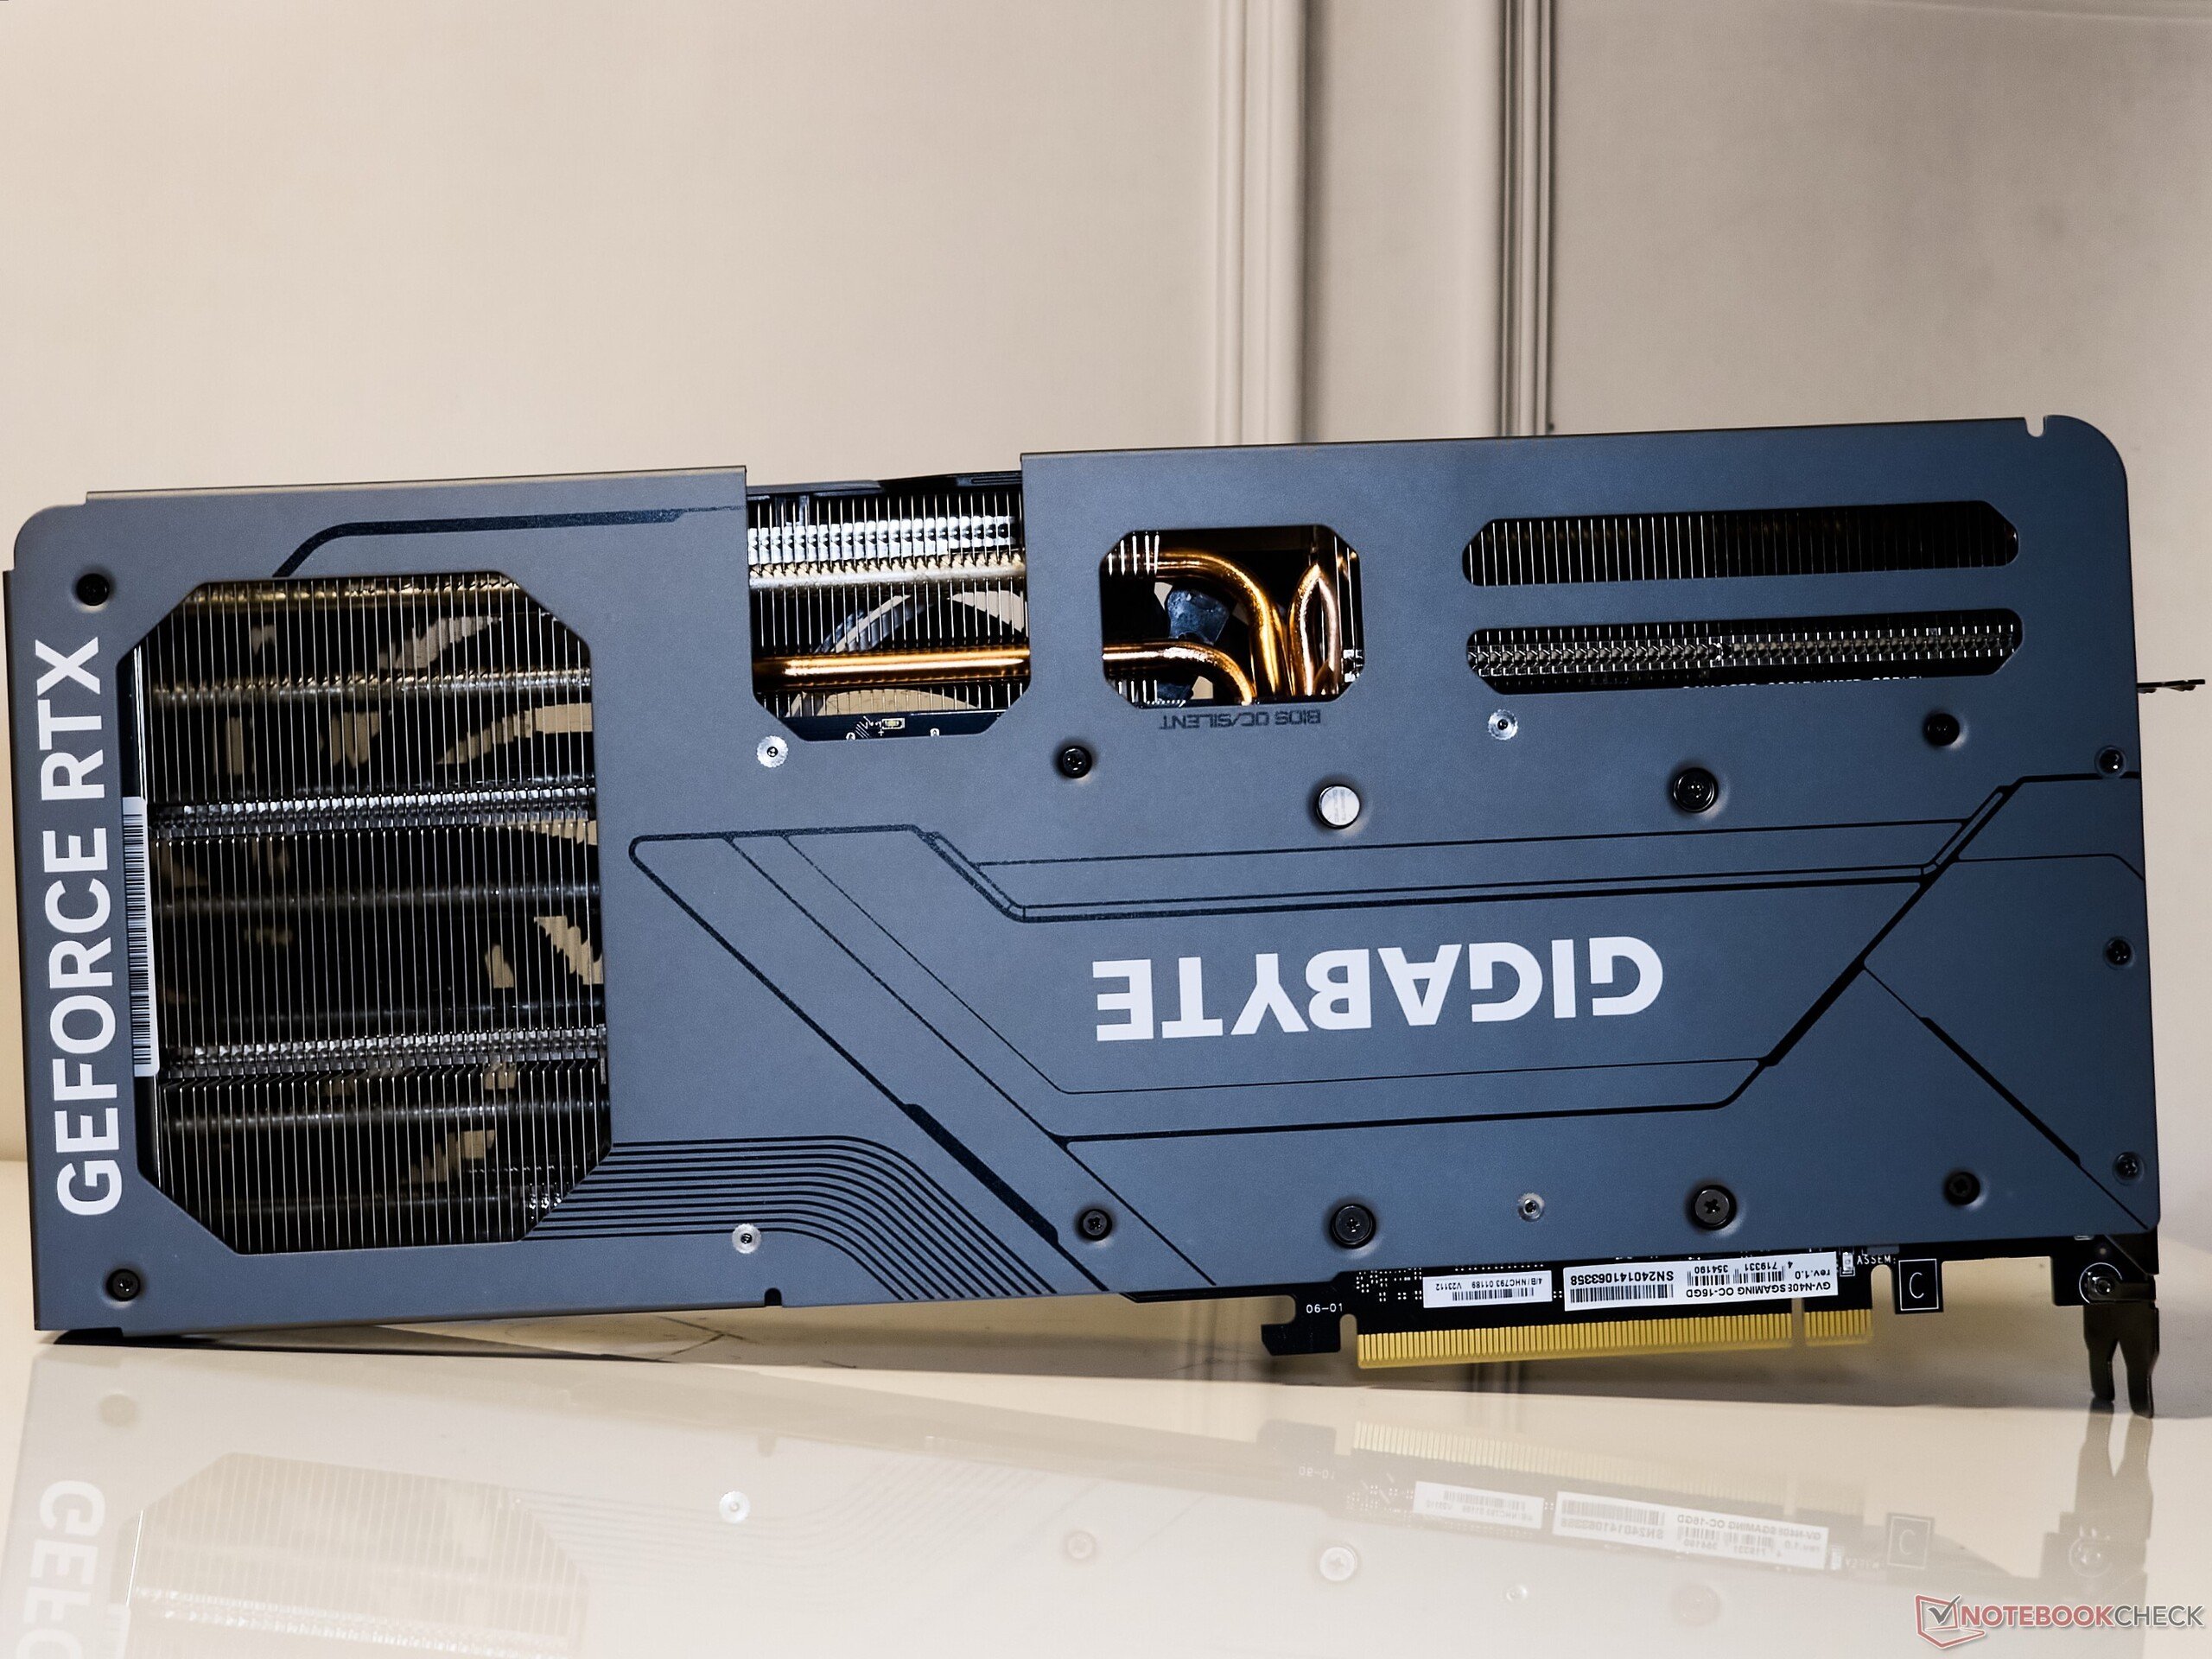
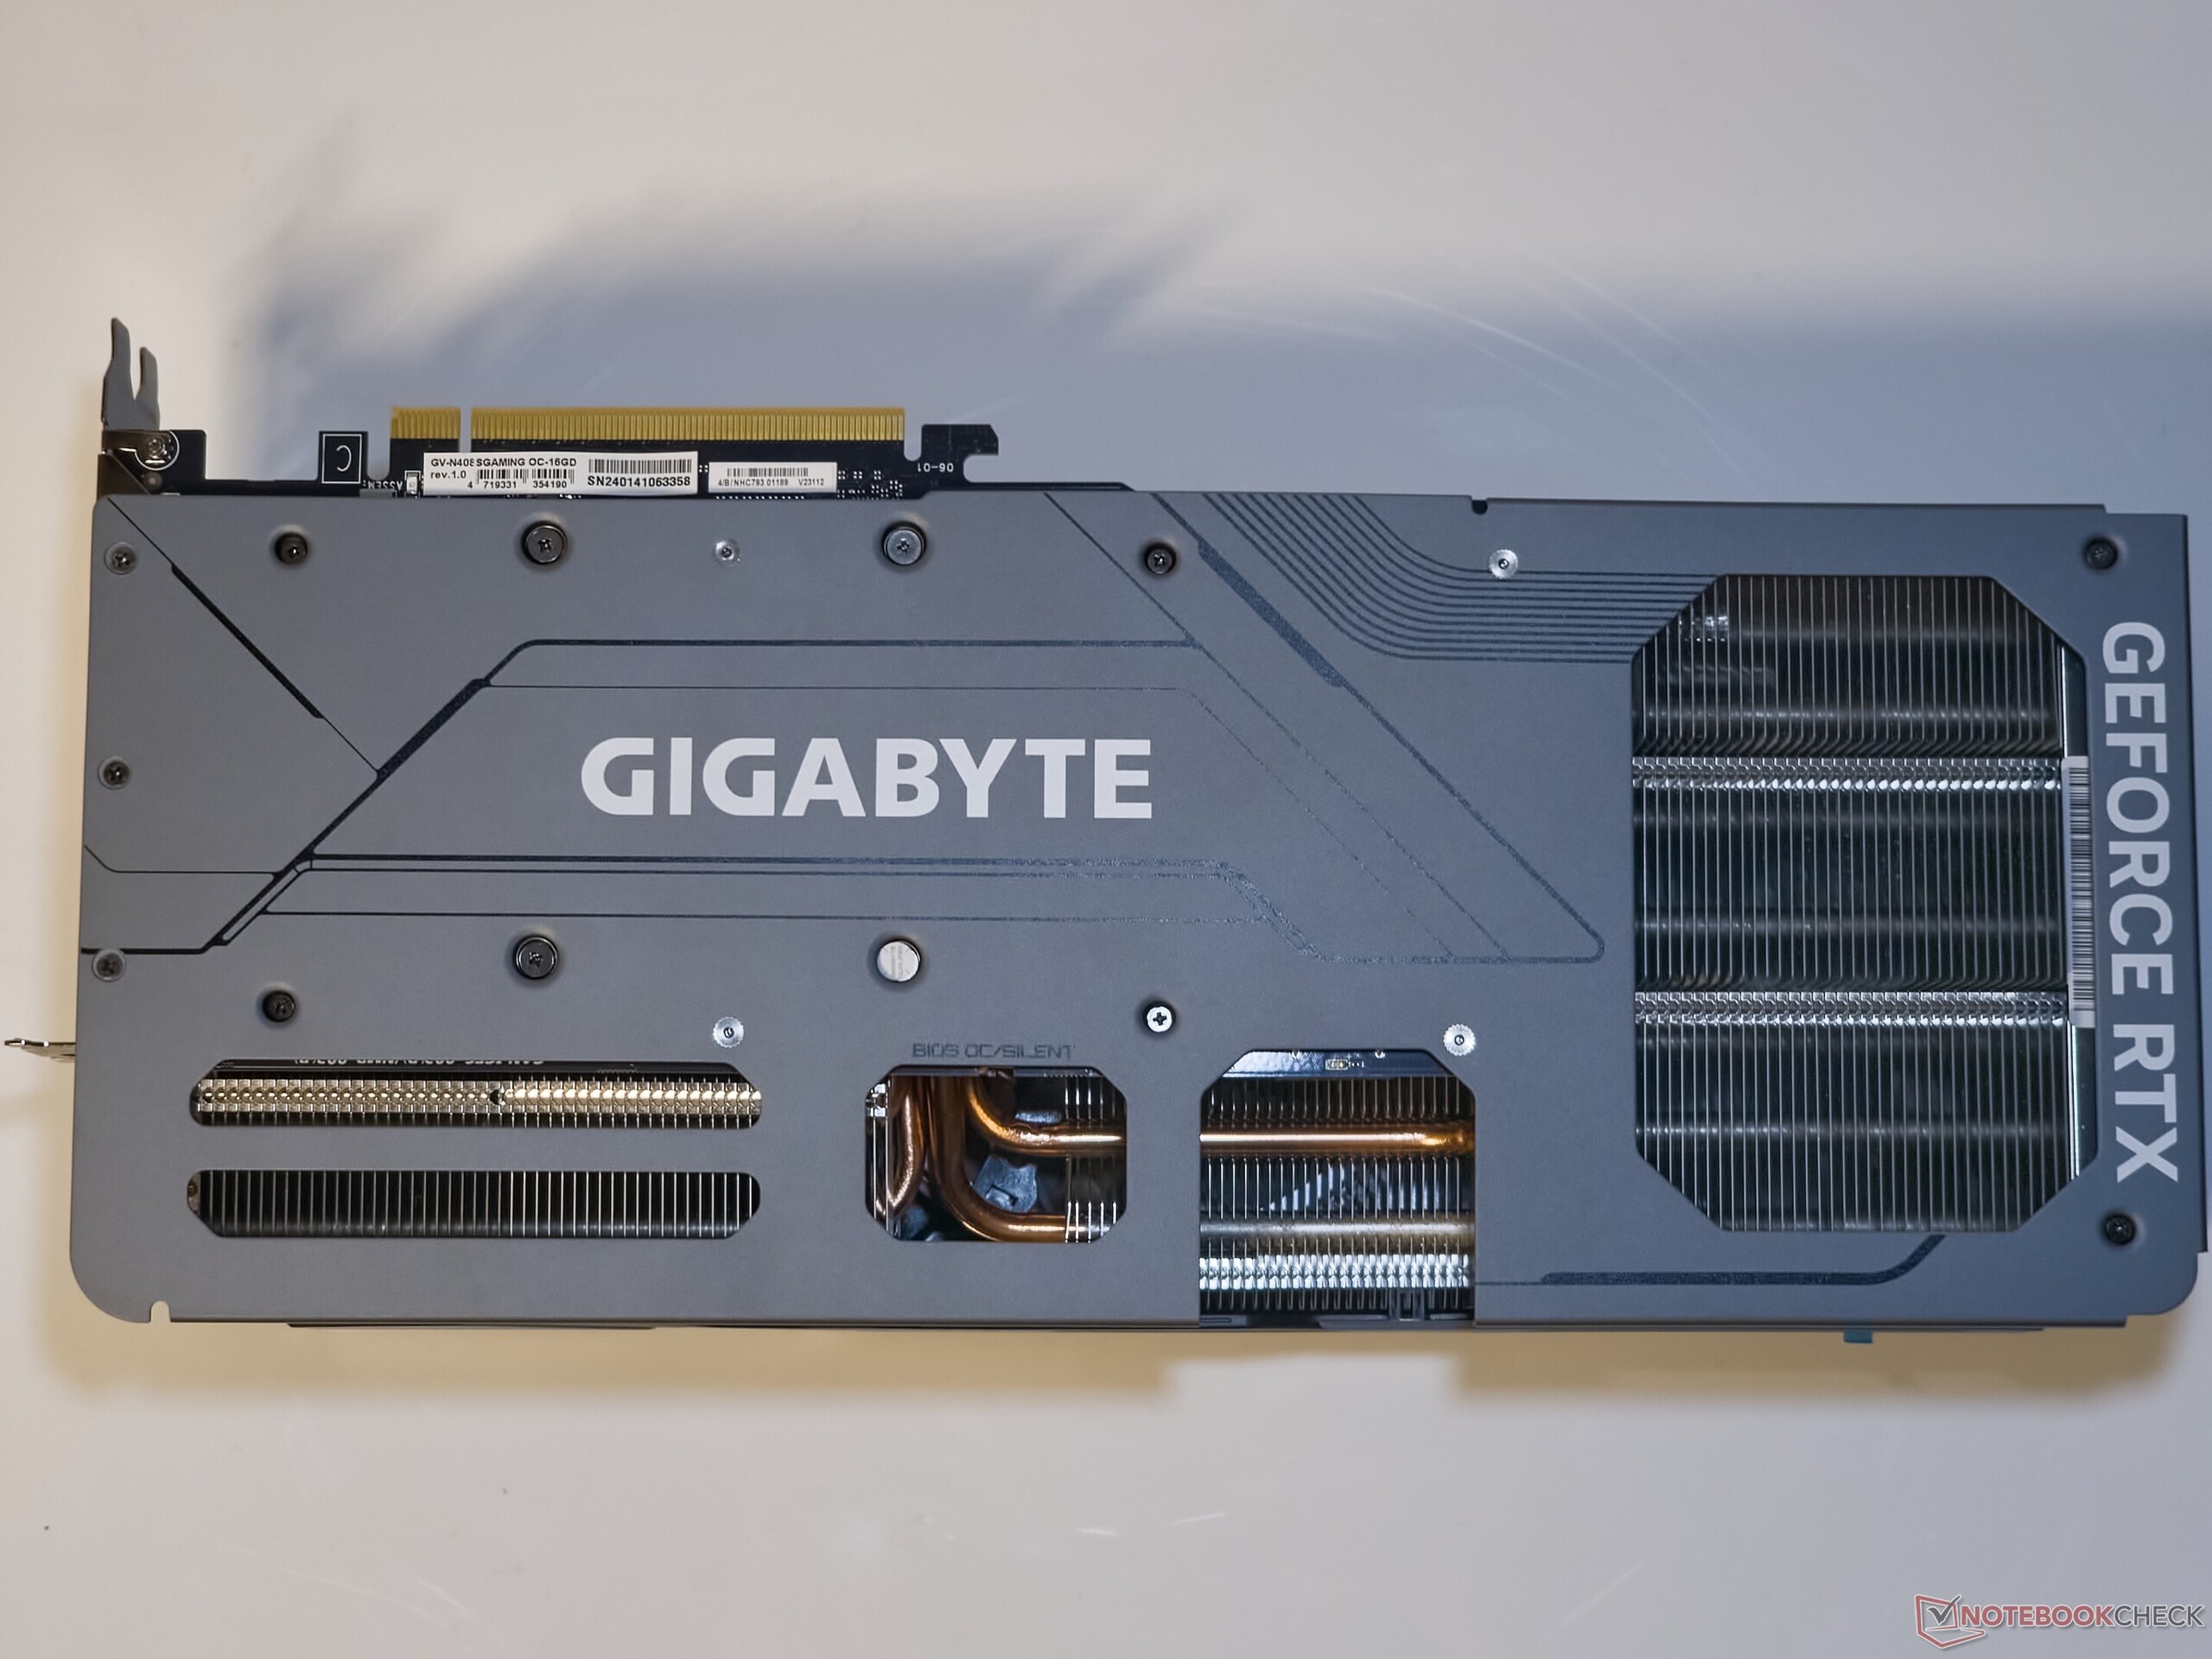
La carte est dotée d'une coque avant en plastique, mais robuste, et d'une plaque arrière en métal. Les effets RGB sont similaires à ceux de la RTX 4070 Super Gaming OC - un logo Gigabyte brillant sur le dessus et des anneaux lumineux le long de la circonférence de chaque ventilateur.
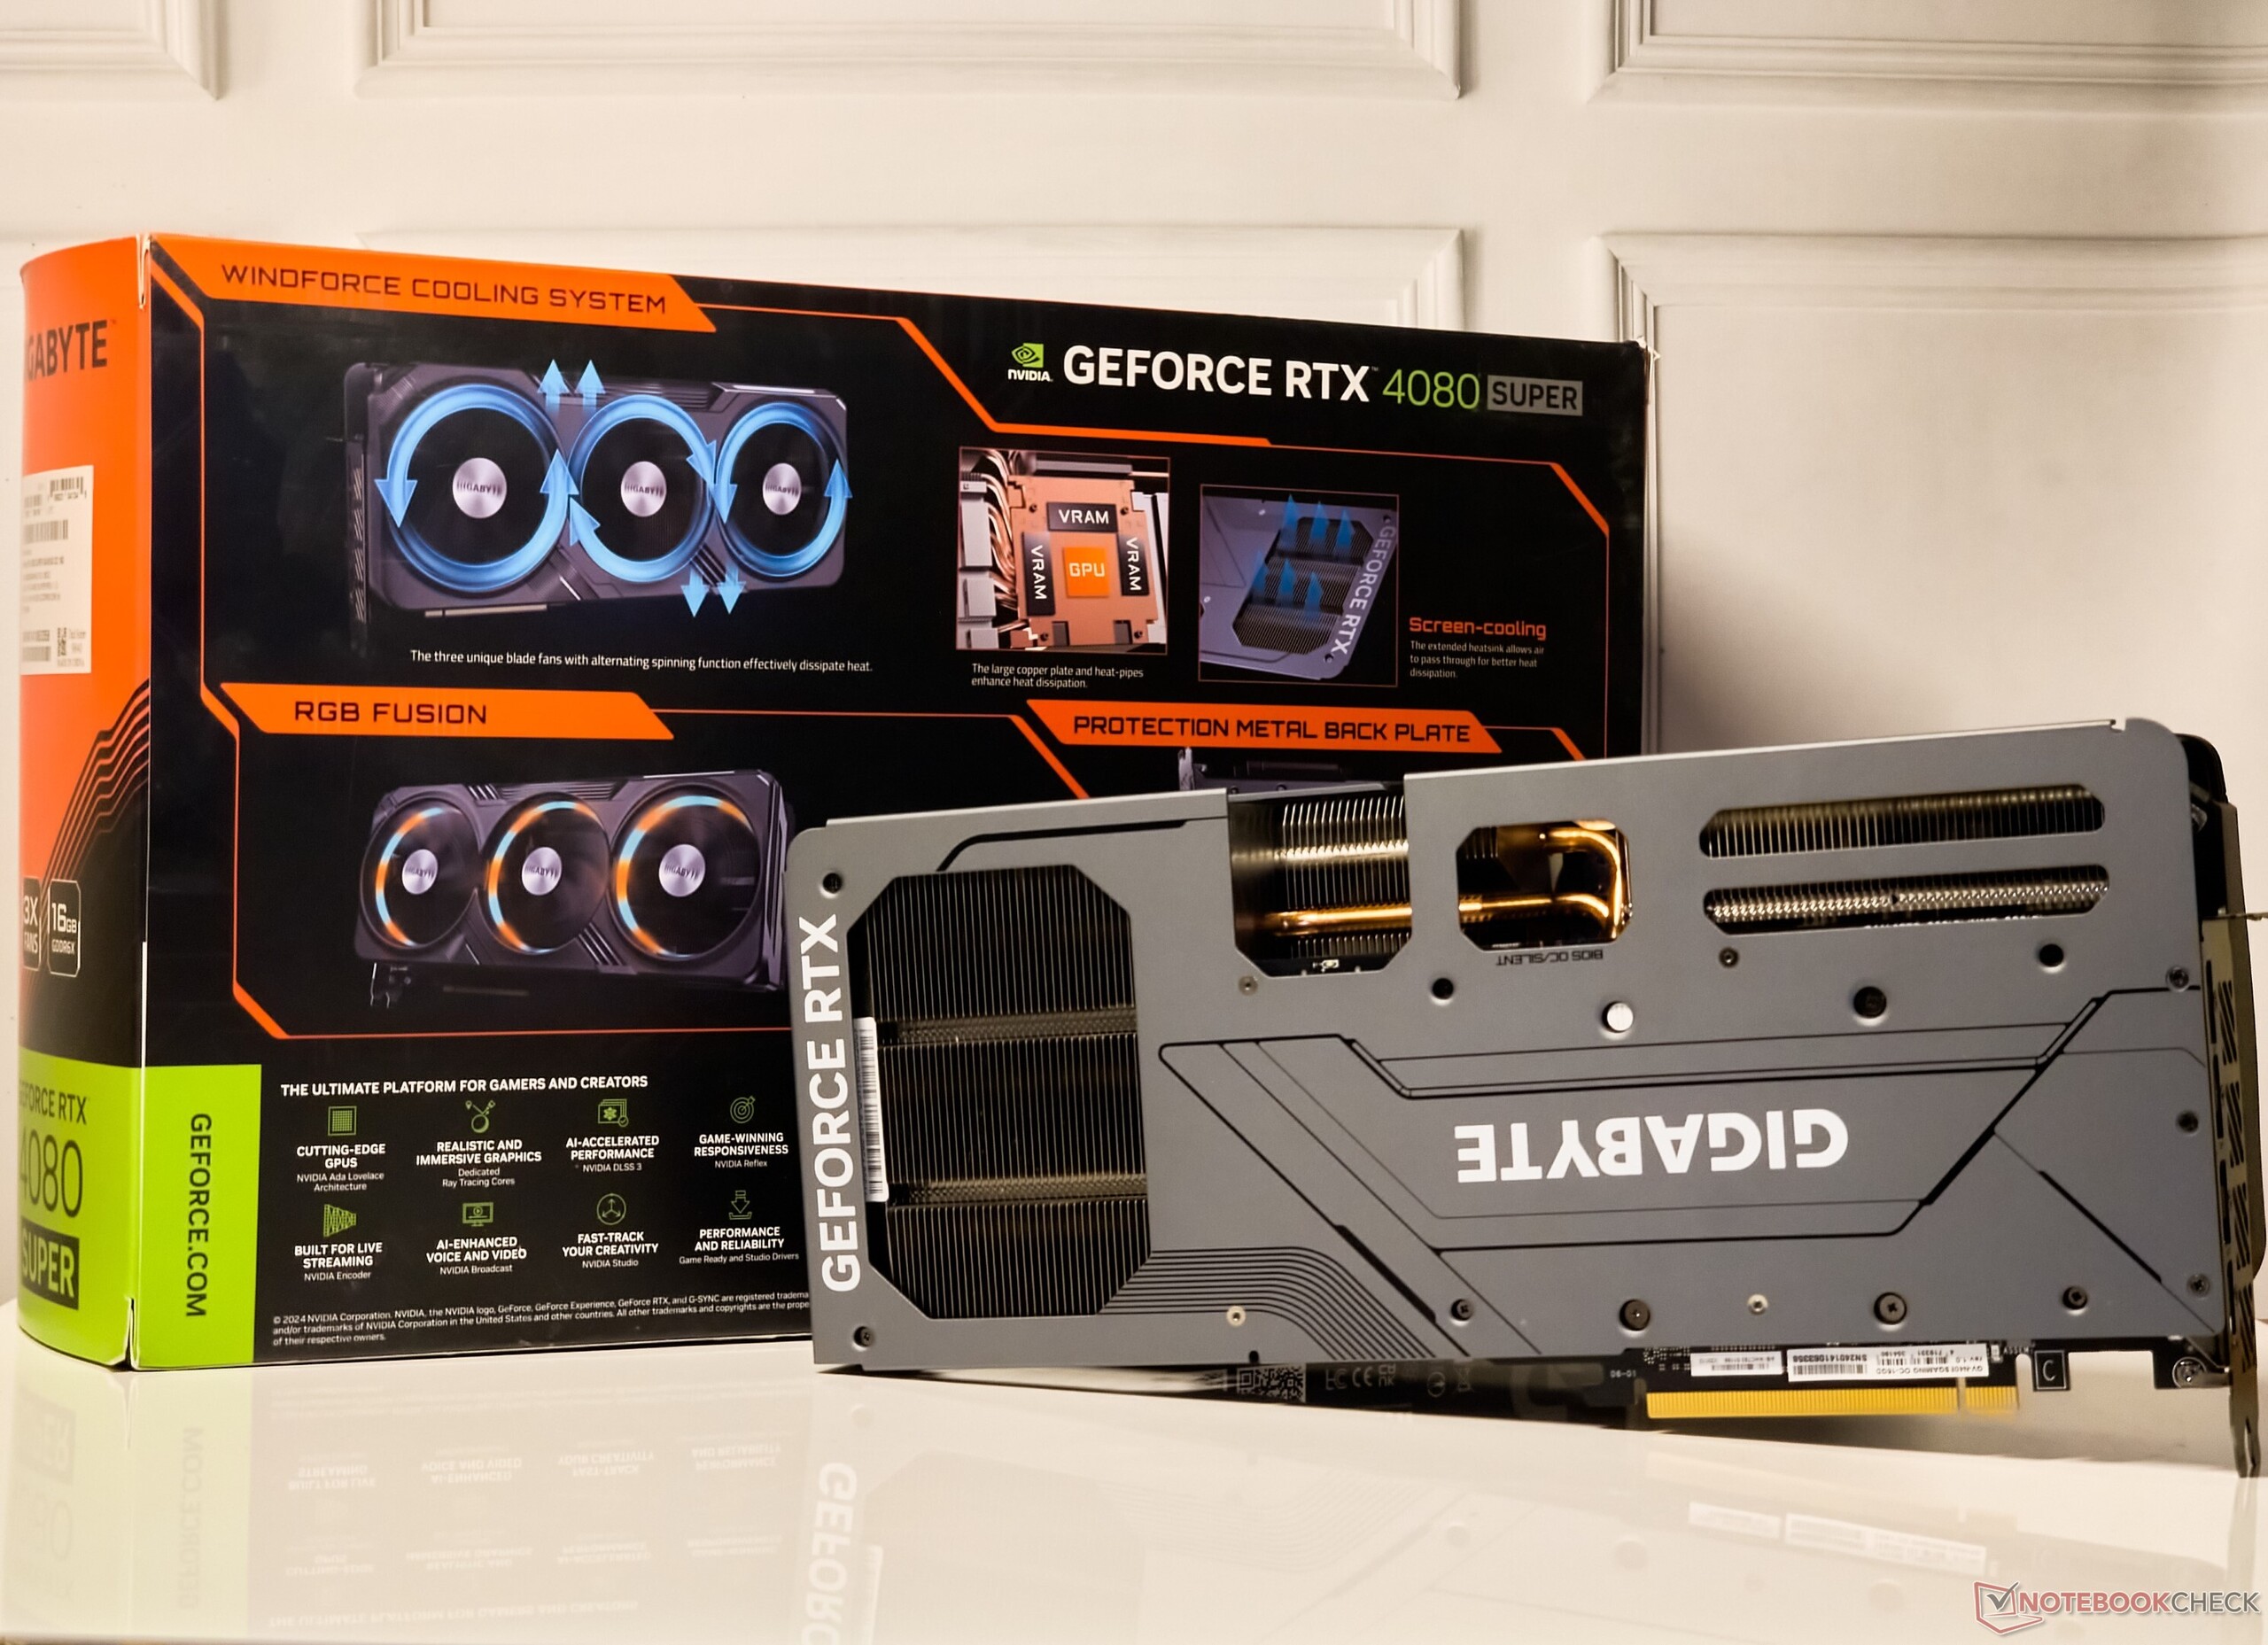
La boîte contient un guide de démarrage rapide, une carte de garantie, un connecteur d'alimentation 12VHPWR vers 3x 8 broches, des supports et des vis.
La RTX 4080 Super Gaming OC dispose d'un ensemble de ports standard, dont 3 sorties DisplayPort 1.4 et 1 sortie HDMI 2.1a.
Comme c'est le cas pour les cartes Gigabyte, un interrupteur Dual-BIOS est présent pour basculer entre les modes BIOS OC et Silent.
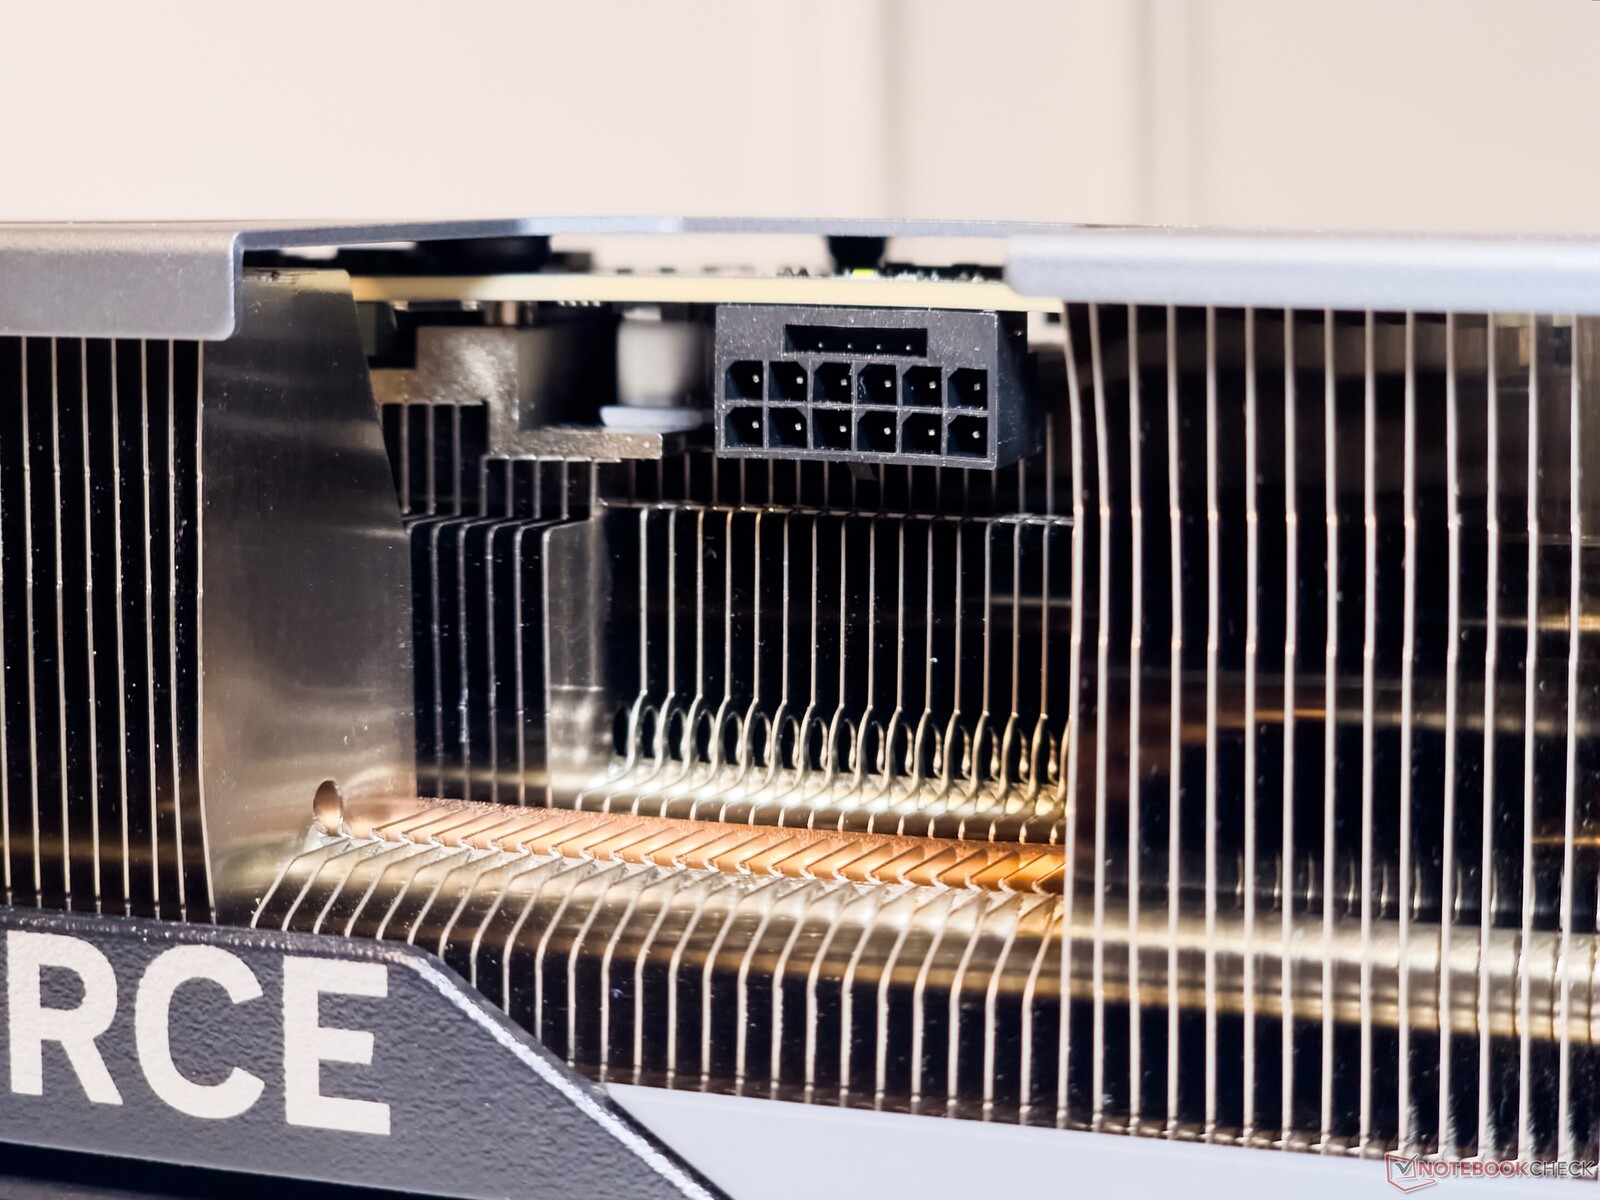
L'alimentation du GPU est assurée par le connecteur 12VHPWR désormais par défaut. Nous n'avons rencontré aucun problème pour faire tenir le connecteur PCIe Gen 5 à 16 broches de l'unité d'alimentation. Par mesure de précaution, Gigabyte fournit également un indicateur LED qui s'allume pour signaler tout problème de connexion.


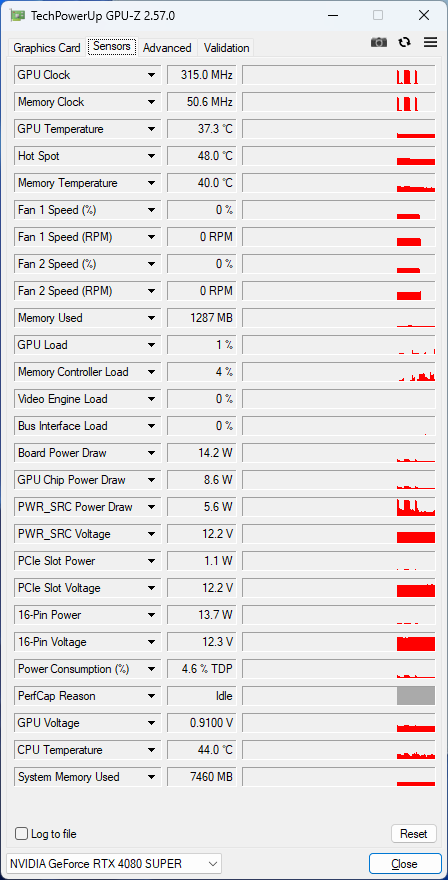
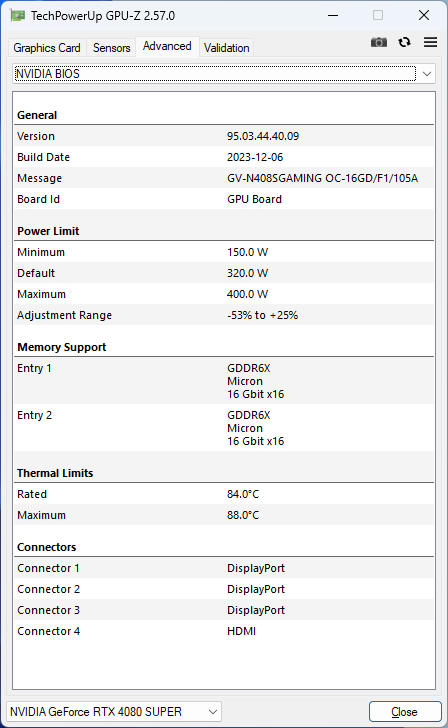
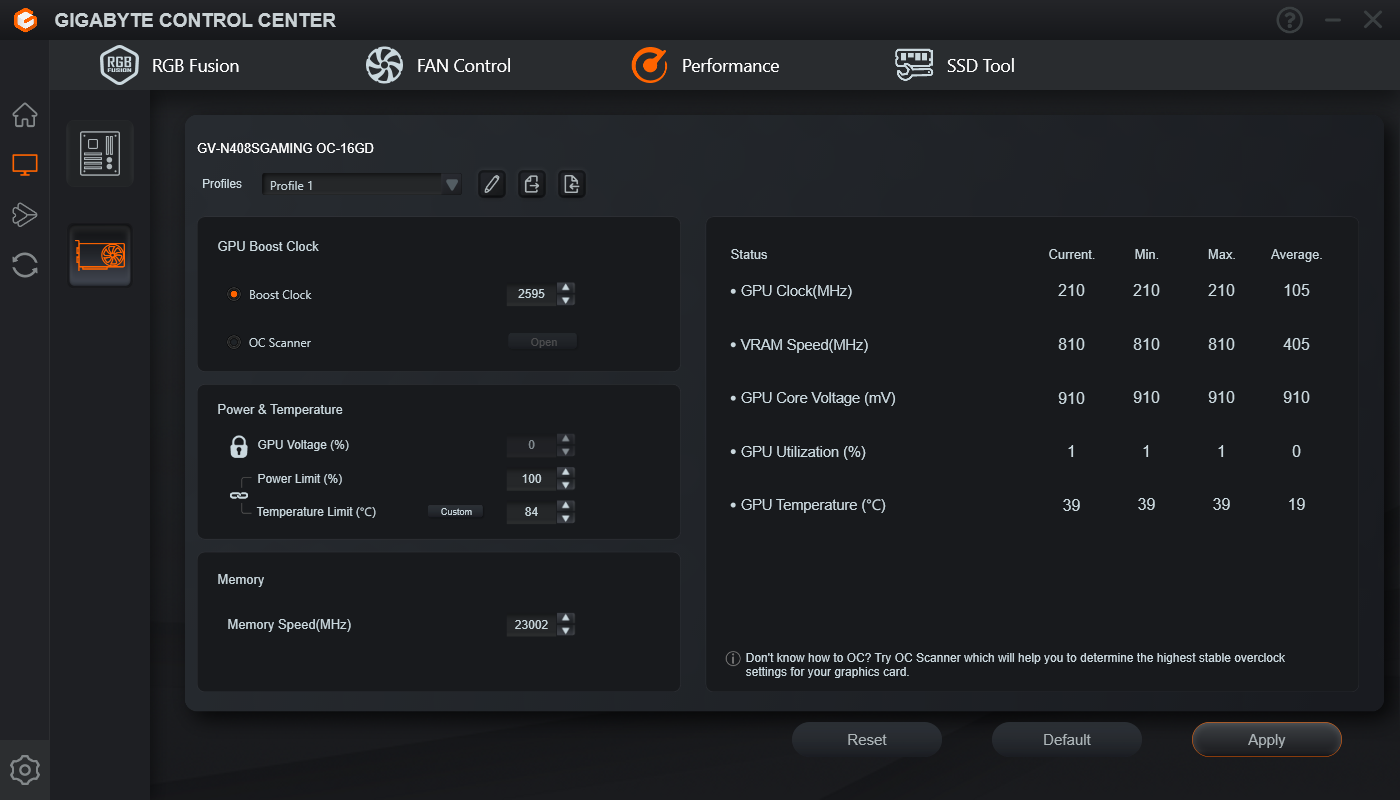
La Gigabyte GeForce RTX 4080 Super Gaming OC 16G peut booster jusqu'à 2 595 MHz et dispose d'une marge de puissance supplémentaire de 25 % pour permettre des augmentations de TGP jusqu'à 400 W.
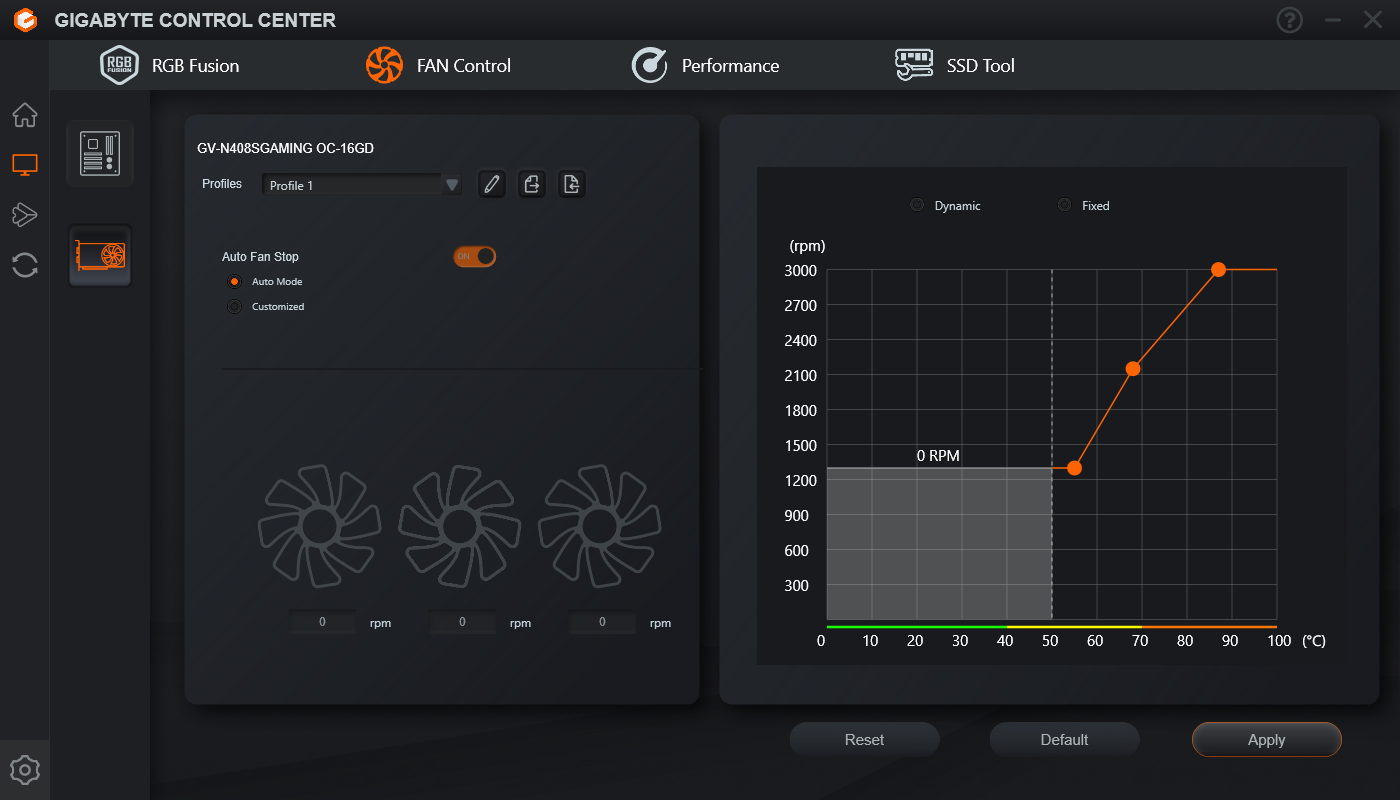
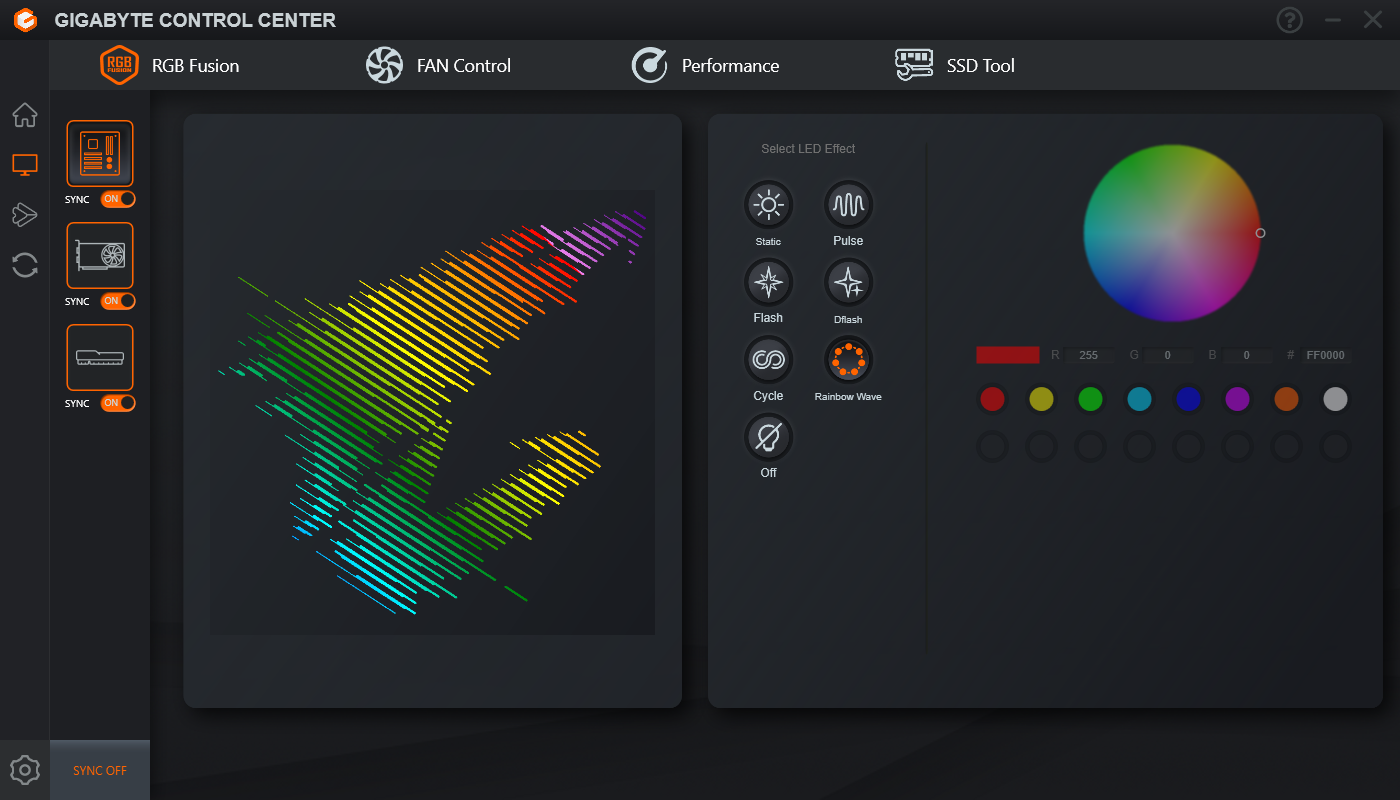
Certains aspects du GPU tels que l'overclocking, les courbes de ventilation et les effets RGB peuvent être contrôlés via le Gigabyte Control Center.
Banc d'essai : RTX 4080 Super Gaming OC avec le Core i9-13900K
Notre système de test est toujours basé sur l'Intel Core i9-13900K et la plateforme Z790 afin de s'assurer que les cartes ne sont pas bloquées par le CPU. La configuration comprend :
- Banc de test Cooler MasterFrame 700
- Intel Core i9-13900K avec PL1=PL2
- Carte mère Gigabyte Z790 Aorus Master
- Gigabyte Aorus Gen4 2 TB NVMe SSD
- Sabrent Rocket 4 Plus Gen4 2 TB NVMe SSD
- 2x 16 GB Kingston Fury Renegade DDR5-6400 RAM avec timings 32-39-39-80 à 1.40 V
- MoniteurMSI MAG 274UPF 4K 144 Hz
- Refroidisseur Cooler MasterLiquid ML360L V2 ARGB AiO
- Cooler Master MVE Gold V2 1250 ATX 3.0 PSU entièrement modulaire
Windows 11 23H2 avec les derniers correctifs, ainsi que le pilote Nvidia Game Ready version 552.12 ont été utilisés.
D'après nos tests internes, les performances du Core i9-13900K et du chipset Z790 sont comparables à celles d'un AMD Ryzen 9 7950X et X670E.
Nous tenons à remercier Cooler Master pour avoir fourni le banc d'essai, le refroidisseur et le bloc d'alimentation, Gigabyte pour la carte mère, le processeur et le disque SSD, Sabrent pour le disque SSD, MSI pour l'écran et Kingston pour la mémoire.
Benchmarks synthétiques : 5% de gain global par rapport à la RTX 4080
Les performances synthétiques cumulées montrent que la RTX 4080 Super Gaming OC prend 5% d'avance sur la RTX 4080 Founders Edition (FE), ce qui correspond à une augmentation équivalente du nombre de cœurs CUDA. Des écarts plus importants ont été observés entre ces deux cartes dans 3DMark Port Royal (+7%) et 3DMark 11 Performance GPU (11%).
La RTX 4080 Super Gaming OC se rapproche largement de la AMD Radeon RX 7900 XTX dans les tests synthétiques globaux, mais cette dernière affiche des gains décents dans 3DMark Fire Strike et Time Spy.
Les scores Unigine montrent un gain de 2 à 5% avec la RTX 4080 Super Gaming OC par rapport à la RTX 4080 Founders Edition.
La RTX 4090 Founders Edition continue d'être la carte à battre avec des scores 25% plus élevés que la RTX 4080 Super Gaming OC.
3DMark 11: 1280x720 Performance GPU
3DMark: 1920x1080 Fire Strike Graphics | 3840x2160 Fire Strike Ultra Graphics | Fire Strike Extreme Graphics | 2560x1440 Time Spy Graphics | 2560x1440 Port Royal Graphics | 2560x1440 Speed Way Score
Unigine Heaven 4.0: Extreme Preset DX11 | Extreme Preset OpenGL
Unigine Valley 1.0: 1920x1080 Extreme HD DirectX AA:x8 | 1920x1080 Extreme HD Preset OpenGL AA:x8
Unigine Superposition: 1280x720 720p Low | 1920x1080 1080p Extreme | 3840x2160 4k Optimized | 7680x4320 8k Optimized
| Performance rating | |
| NVIDIA GeForce RTX 4090 Founders Edition | |
| AMD Radeon RX 7900 XTX | |
| Gigabyte GeForce RTX 4080 Super Gaming OC | |
| NVIDIA GeForce RTX 4080 Founders Edition | |
| Moyenne de la classe Desktop | |
| AMD Radeon RX 7900 XT | |
| Asus TUF Gaming GeForce RTX 4070 Ti Super | |
| Gigabyte Aorus GeForce RTX 4070 Ti Master | |
| Asus TUF Gaming GeForce RTX 4070 Ti | |
| Moyenne NVIDIA GeForce RTX 4070 Ti | |
| Gigabyte GeForce RTX 4070 Super Gaming OC 12G | |
| Moyenne NVIDIA GeForce RTX 3090 | |
| Moyenne NVIDIA GeForce RTX 3080 Ti | |
| NVIDIA GeForce RTX 4070 Super Founders Edition | |
| AMD Radeon RX 7800 XT | |
| Zotac Gaming GeForce RTX 4070 AMP Airo | |
| Moyenne NVIDIA GeForce RTX 3080 -1! | |
| Sapphire Pulse Radeon RX 7700 XT | |
| Moyenne NVIDIA Titan RTX | |
| Moyenne NVIDIA GeForce RTX 4060 Ti 8G | |
| KFA2 GeForce RTX 4060 Ti EX, 16GB GDDR6 | |
| XFX Speedster QICK 308 Radeon RX 7600 Black Edition | |
| KFA2 GeForce RTX 4060 1-Click-OC 2X | |
| 3DMark / Speed Way Score | |
| NVIDIA GeForce RTX 4090 Founders Edition | |
| Gigabyte GeForce RTX 4080 Super Gaming OC | |
| Moyenne de la classe Desktop (492 - 14564, n=42, 2 dernières années) | |
| NVIDIA GeForce RTX 4080 Founders Edition | |
| Asus TUF Gaming GeForce RTX 4070 Ti Super | |
| AMD Radeon RX 7900 XTX | |
| Gigabyte Aorus GeForce RTX 4070 Ti Master | |
| Moyenne NVIDIA GeForce RTX 4070 Ti (5392 - 5546, n=6) | |
| Asus TUF Gaming GeForce RTX 4070 Ti | |
| Asus TUF Gaming GeForce RTX 4070 Ti (Quiet BIOS) | |
| Gigabyte GeForce RTX 4070 Super Gaming OC 12G | |
| Moyenne NVIDIA GeForce RTX 3090 (5173 - 5299, n=4) | |
| Moyenne NVIDIA GeForce RTX 3080 Ti (5195 - 5223, n=2) | |
| NVIDIA GeForce RTX 4070 Super Founders Edition | |
| AMD Radeon RX 7900 XT | |
| Zotac Gaming GeForce RTX 4070 AMP Airo | |
| AMD Radeon RX 7800 XT | |
| Moyenne NVIDIA Titan RTX (3182 - 3205, n=3) | |
| Moyenne NVIDIA GeForce RTX 4060 Ti 8G (3158 - 3206, n=3) | |
| KFA2 GeForce RTX 4060 Ti EX, 16GB GDDR6 | |
| Sapphire Pulse Radeon RX 7700 XT | |
| KFA2 GeForce RTX 4060 1-Click-OC 2X | |
| XFX Speedster QICK 308 Radeon RX 7600 Black Edition | |
| Unigine Heaven 4.0 / Extreme Preset DX11 | |
| NVIDIA GeForce RTX 4090 Founders Edition | |
| Gigabyte GeForce RTX 4080 Super Gaming OC | |
| AMD Radeon RX 7900 XTX | |
| NVIDIA GeForce RTX 4080 Founders Edition | |
| AMD Radeon RX 7900 XT | |
| Gigabyte Aorus GeForce RTX 4070 Ti Master | |
| Asus TUF Gaming GeForce RTX 4070 Ti | |
| Moyenne de la classe Desktop (10.9 - 545, n=44, 2 dernières années) | |
| Moyenne NVIDIA GeForce RTX 4070 Ti (298 - 319, n=5) | |
| Asus TUF Gaming GeForce RTX 4070 Ti Super | |
| Moyenne NVIDIA GeForce RTX 3090 (272 - 315, n=12) | |
| Moyenne NVIDIA GeForce RTX 3080 Ti (290 - 312, n=4) | |
| Gigabyte GeForce RTX 4070 Super Gaming OC 12G | |
| NVIDIA GeForce RTX 4070 Super Founders Edition | |
| Zotac Gaming GeForce RTX 4070 AMP Airo | |
| Moyenne NVIDIA GeForce RTX 3080 (233 - 253, n=2) | |
| AMD Radeon RX 7800 XT | |
| Moyenne NVIDIA Titan RTX (207 - 248, n=12) | |
| Sapphire Pulse Radeon RX 7700 XT | |
| Moyenne NVIDIA GeForce RTX 4060 Ti 8G (170.7 - 181.6, n=4) | |
| KFA2 GeForce RTX 4060 Ti EX, 16GB GDDR6 | |
| KFA2 GeForce RTX 4060 1-Click-OC 2X | |
| XFX Speedster QICK 308 Radeon RX 7600 Black Edition | |
| Unigine Heaven 4.0 / Extreme Preset OpenGL | |
| NVIDIA GeForce RTX 4090 Founders Edition | |
| Gigabyte GeForce RTX 4080 Super Gaming OC | |
| AMD Radeon RX 7900 XTX | |
| NVIDIA GeForce RTX 4080 Founders Edition | |
| AMD Radeon RX 7900 XT | |
| Asus TUF Gaming GeForce RTX 4070 Ti Super | |
| Moyenne de la classe Desktop (11.7 - 551, n=30, 2 dernières années) | |
| Gigabyte Aorus GeForce RTX 4070 Ti Master | |
| Moyenne NVIDIA GeForce RTX 4070 Ti (291 - 297, n=4) | |
| Asus TUF Gaming GeForce RTX 4070 Ti | |
| Gigabyte GeForce RTX 4070 Super Gaming OC 12G | |
| NVIDIA GeForce RTX 4070 Super Founders Edition | |
| Moyenne NVIDIA GeForce RTX 3080 Ti (264 - 282, n=4) | |
| Moyenne NVIDIA GeForce RTX 3090 (188.2 - 284, n=11) | |
| AMD Radeon RX 7800 XT | |
| Moyenne NVIDIA GeForce RTX 3080 (232 - 243, n=2) | |
| Zotac Gaming GeForce RTX 4070 AMP Airo | |
| Moyenne NVIDIA Titan RTX (203 - 299, n=12) | |
| Sapphire Pulse Radeon RX 7700 XT | |
| Moyenne NVIDIA GeForce RTX 4060 Ti 8G (173 - 176, n=3) | |
| KFA2 GeForce RTX 4060 Ti EX, 16GB GDDR6 | |
| XFX Speedster QICK 308 Radeon RX 7600 Black Edition | |
| KFA2 GeForce RTX 4060 1-Click-OC 2X | |
| Unigine Superposition / 8k Optimized | |
| NVIDIA GeForce RTX 4090 Founders Edition | |
| Moyenne de la classe Desktop (914 - 18770, n=42, 2 dernières années) | |
| AMD Radeon RX 7900 XTX | |
| Gigabyte GeForce RTX 4080 Super Gaming OC | |
| NVIDIA GeForce RTX 4080 Founders Edition | |
| Moyenne NVIDIA GeForce RTX 3090 (6961 - 7521, n=12) | |
| Asus TUF Gaming GeForce RTX 4070 Ti Super | |
| Moyenne NVIDIA GeForce RTX 3080 Ti (6920 - 7161, n=4) | |
| AMD Radeon RX 7900 XT | |
| Gigabyte Aorus GeForce RTX 4070 Ti Master | |
| Asus TUF Gaming GeForce RTX 4070 Ti | |
| Moyenne NVIDIA GeForce RTX 4070 Ti (6276 - 6454, n=5) | |
| Moyenne NVIDIA GeForce RTX 3080 (6243 - 6346, n=2) | |
| Gigabyte GeForce RTX 4070 Super Gaming OC 12G | |
| NVIDIA GeForce RTX 4070 Super Founders Edition | |
| Moyenne NVIDIA Titan RTX (5255 - 5571, n=9) | |
| AMD Radeon RX 7800 XT | |
| Zotac Gaming GeForce RTX 4070 AMP Airo | |
| Sapphire Pulse Radeon RX 7700 XT | |
| Moyenne NVIDIA GeForce RTX 4060 Ti 8G (3477 - 3571, n=4) | |
| KFA2 GeForce RTX 4060 Ti EX, 16GB GDDR6 | |
| KFA2 GeForce RTX 4060 1-Click-OC 2X | |
| XFX Speedster QICK 308 Radeon RX 7600 Black Edition | |
3DMark 11: 1280x720 Performance GPU
3DMark: 1920x1080 Fire Strike Graphics | 3840x2160 Fire Strike Ultra Graphics | Fire Strike Extreme Graphics | 2560x1440 Time Spy Graphics | 2560x1440 Port Royal Graphics | 2560x1440 Speed Way Score
Unigine Heaven 4.0: Extreme Preset DX11 | Extreme Preset OpenGL
Unigine Valley 1.0: 1920x1080 Extreme HD DirectX AA:x8 | 1920x1080 Extreme HD Preset OpenGL AA:x8
Unigine Superposition: 1280x720 720p Low | 1920x1080 1080p Extreme | 3840x2160 4k Optimized | 7680x4320 8k Optimized
| 3DMark 11 Performance | 57532 points | |
| 3DMark Ice Storm Standard Score | 294683 points | |
| 3DMark Cloud Gate Standard Score | 80761 points | |
| 3DMark Fire Strike Score | 45427 points | |
| 3DMark Fire Strike Extreme Score | 31385 points | |
| 3DMark Time Spy Score | 27111 points | |
Aide | ||
Performances de calcul : Gains significatifs par rapport à la RX 7900 XTX
La RTX 4080 Super Gaming OC est capable de terminer le rendu Blender CUDA Classroom une seconde plus vite que la RTX 4080 FE et est environ 3% plus rapide dans V-Ray 5 CUDA.
Les scores LuxMark Sala sont à égalité entre ces deux GPU, et la RTX 4080 Super Gaming OC prend 62% d'avance sur la RX 7900 XTX dans ce test.
Bien que la RX 7900 XT et RX 7900 XTX se comportent bien dans la majorité des tests ComputeMark, la RTX 4080 Super Gaming OC obtient un avantage significatif dans le QJuliaRayTrace qui pousse la carte de Gigabyte légèrement devant les deux fleurons d'AMD dans ce benchmark.
Blender: v3.3 Classroom CUDA | v3.3 Classroom OPTIX/RTX
LuxMark v2.0 64Bit: Room GPUs-only | Sala GPUs-only
ComputeMark v2.1: 1024x600 Normal, Score | 1024x600 Normal, QJuliaRayTrace | 1024x600 Normal, Mandel Scalar | 1024x600 Normal, Mandel Vector | 1024x600 Normal, Fluid 2DTexArr | 1024x600 Normal, Fluid 3DTex
| V-Ray 5 Benchmark / GPU RTX | |
| NVIDIA GeForce RTX 4090 Founders Edition (5.0.1) | |
| Moyenne de la classe Desktop (1408 - 7496, n=35, 2 dernières années) | |
| Gigabyte GeForce RTX 4080 Super Gaming OC (5.0.1) | |
| NVIDIA GeForce RTX 4080 Founders Edition | |
| Asus TUF Gaming GeForce RTX 4070 Ti Super (5.0.1) | |
| Gigabyte Aorus GeForce RTX 4070 Ti Master (5.0.1) | |
| Asus TUF Gaming GeForce RTX 4070 Ti (5.0.1) | |
| Moyenne NVIDIA GeForce RTX 4070 Ti (3054 - 3221, n=5) | |
| Gigabyte GeForce RTX 4070 Super Gaming OC 12G (5.0.1) | |
| NVIDIA GeForce RTX 4070 Super Founders Edition (5.0.1) | |
| Moyenne NVIDIA GeForce RTX 3090 (2551 - 2979, n=15) | |
| Moyenne NVIDIA GeForce RTX 3080 Ti (2727 - 2883, n=3) | |
| Zotac Gaming GeForce RTX 4070 AMP Airo (5.0.1) | |
| AMD Radeon RX 7800 XT (5.0.1) | |
| KFA2 GeForce RTX 4060 Ti EX, 16GB GDDR6 (5.0.1) | |
| Sapphire Pulse Radeon RX 7700 XT (5.0.1) | |
| Moyenne NVIDIA GeForce RTX 4060 Ti 8G (1860 - 2024, n=3) | |
| KFA2 GeForce RTX 4060 1-Click-OC 2X (5.0.1) | |
| Moyenne NVIDIA Titan RTX (1246 - 1348, n=7) | |
| Blender / v3.3 Classroom CUDA | |
| KFA2 GeForce RTX 4060 1-Click-OC 2X (3.3.3) | |
| Moyenne NVIDIA Titan RTX (n=1) | |
| Moyenne NVIDIA GeForce RTX 4060 Ti 8G (n=1) | |
| Zotac Gaming GeForce RTX 4070 AMP Airo (3.3.3) | |
| Moyenne NVIDIA GeForce RTX 3080 Ti (21 - 22, n=2) | |
| Moyenne NVIDIA GeForce RTX 3090 (20 - 22, n=13) | |
| NVIDIA GeForce RTX 4070 Super Founders Edition (3.3.3) | |
| Gigabyte GeForce RTX 4070 Super Gaming OC 12G (3.3.3) | |
| Moyenne NVIDIA GeForce RTX 4070 Ti (18 - 19, n=3) | |
| Moyenne de la classe Desktop (8 - 54, n=31, 2 dernières années) | |
| Gigabyte Aorus GeForce RTX 4070 Ti Master (3.3.2) | |
| Asus TUF Gaming GeForce RTX 4070 Ti Super (3.3.3) | |
| NVIDIA GeForce RTX 4080 Founders Edition (3.3.3) | |
| Gigabyte GeForce RTX 4080 Super Gaming OC (3.3.3) | |
| Blender / v3.3 Classroom OPTIX/RTX | |
| KFA2 GeForce RTX 4060 1-Click-OC 2X (3.3.3) | |
| Moyenne NVIDIA Titan RTX (n=1) | |
| KFA2 GeForce RTX 4060 Ti EX, 16GB GDDR6 (3.3.3) | |
| Moyenne NVIDIA GeForce RTX 4060 Ti 8G (17 - 18, n=3) | |
| Moyenne NVIDIA GeForce RTX 3080 Ti (14 - 15, n=2) | |
| Zotac Gaming GeForce RTX 4070 AMP Airo (3.3.3) | |
| Moyenne NVIDIA GeForce RTX 3090 (13 - 14, n=13) | |
| Asus TUF Gaming GeForce RTX 4070 Ti (3.3.2) | |
| Moyenne NVIDIA GeForce RTX 4070 Ti (11 - 12, n=5) | |
| Gigabyte Aorus GeForce RTX 4070 Ti Master (3.3.2) | |
| NVIDIA GeForce RTX 4070 Super Founders Edition (3.3.3) | |
| Gigabyte GeForce RTX 4070 Super Gaming OC 12G (3.3.3) | |
| Moyenne de la classe Desktop (5 - 19, n=30, 2 dernières années) | |
| Asus TUF Gaming GeForce RTX 4070 Ti Super (3.3.3) | |
| NVIDIA GeForce RTX 4080 Founders Edition (3.3.3) | |
| NVIDIA GeForce RTX 4090 Founders Edition (3.3.0) | |
| Gigabyte GeForce RTX 4080 Super Gaming OC (3.3.3) | |
| LuxMark v2.0 64Bit / Room GPUs-only | |
| NVIDIA GeForce RTX 4090 Founders Edition | |
| Gigabyte GeForce RTX 4080 Super Gaming OC | |
| NVIDIA GeForce RTX 4080 Founders Edition | |
| Asus TUF Gaming GeForce RTX 4070 Ti Super | |
| Moyenne de la classe Desktop (370 - 14722, n=40, 2 dernières années) | |
| Gigabyte Aorus GeForce RTX 4070 Ti Master | |
| Asus TUF Gaming GeForce RTX 4070 Ti | |
| NVIDIA GeForce RTX 4070 Super Founders Edition | |
| Gigabyte GeForce RTX 4070 Super Gaming OC 12G | |
| Moyenne NVIDIA GeForce RTX 4070 Ti (7625 - 8436, n=5) | |
| Zotac Gaming GeForce RTX 4070 AMP Airo | |
| Moyenne NVIDIA GeForce RTX 3080 Ti (5772 - 6464, n=4) | |
| Moyenne NVIDIA GeForce RTX 3090 (5727 - 5985, n=10) | |
| AMD Radeon RX 7900 XTX | |
| Moyenne NVIDIA GeForce RTX 3080 (5112 - 5198, n=2) | |
| Moyenne NVIDIA GeForce RTX 4060 Ti 8G (4558 - 5058, n=4) | |
| Moyenne NVIDIA Titan RTX (4643 - 4703, n=2) | |
| KFA2 GeForce RTX 4060 Ti EX, 16GB GDDR6 | |
| AMD Radeon RX 7900 XT | |
| KFA2 GeForce RTX 4060 1-Click-OC 2X | |
| AMD Radeon RX 7800 XT | |
| Sapphire Pulse Radeon RX 7700 XT | |
| XFX Speedster QICK 308 Radeon RX 7600 Black Edition | |
Blender: v3.3 Classroom CUDA | v3.3 Classroom OPTIX/RTX
LuxMark v2.0 64Bit: Room GPUs-only | Sala GPUs-only
ComputeMark v2.1: 1024x600 Normal, Score | 1024x600 Normal, QJuliaRayTrace | 1024x600 Normal, Mandel Scalar | 1024x600 Normal, Mandel Vector | 1024x600 Normal, Fluid 2DTexArr | 1024x600 Normal, Fluid 3DTex
* ... Moindre est la valeur, meilleures sont les performances
Performances de jeu : La RX 7900 XTX prend de l'avance sur la trame
Alors que la RTX 4090 reste le GPU le plus convoité deux ans après son lancement, la nouvelle RTX 4080 Super est l'offre phare de Nvidia pour les joueurs.
La RTX 4080 Super Gaming OC est 12% plus performante que la RTX 4080 FE dans les tests de jeu cumulés en 1080p, 1440p et 4K Ultra, tout en battant la RTX 3090 de 28%.
La RX 7900 XTX conserve une avance de 4 % sur la RTX 4080 Super Gaming OC, bien que cette dernière affiche de bons résultats en F1 22, Borderlands 3et Final Fantasy XV.
La RTX 4080 Super est capable d'atteindre 100 fps dans de nombreux titres AAA en 4K Ultra. L'utilisation d'upscalers tels que DLSS, FSR et XeSS est recommandée pour une expérience de jeu plus fluide dans les titres modernes à forte texture, notamment Cyberpunk 2077 2.0 Phantom Libertyalan Wake 2 et Avatar : Frontiers of Pandora.
The Witcher 3: 3840x2160 Ultra Graphics & Postprocessing (HBAO+) | 3840x2160 High Graphics & Postprocessing (Nvidia HairWorks Off) | 1920x1080 Ultra Graphics & Postprocessing (HBAO+)
Metro Exodus: 3840x2160 Ultra Quality AF:16x | 2560x1440 Ultra Quality AF:16x | 1920x1080 Ultra Quality AF:16x
Control: 3840x2160 High Quality Preset | 2560x1440 High Quality Preset | 1920x1080 High Quality Preset
Borderlands 3: 3840x2160 Badass Overall Quality (DX11) | 2560x1440 Badass Overall Quality (DX11) | 1920x1080 Badass Overall Quality (DX11)
Shadow of the Tomb Raider: 3840x2160 Highest Preset AA:T | 2560x1440 Highest Preset AA:T | 1920x1080 Highest Preset AA:T
F1 22: 3840x2160 Ultra High Preset AA:T AF:16x | 2560x1440 Ultra High Preset AA:T AF:16x | 1920x1080 Ultra High Preset AA:T AF:16x
Final Fantasy XV Benchmark: 3840x2160 High Quality | 2560x1440 High Quality | 1920x1080 High Quality
| Performance rating | |
| NVIDIA GeForce RTX 4090 Founders Edition | |
| AMD Radeon RX 7900 XTX | |
| Gigabyte GeForce RTX 4080 Super Gaming OC | |
| AMD Radeon RX 7900 XT | |
| NVIDIA GeForce RTX 4080 Founders Edition | |
| Asus TUF Gaming GeForce RTX 4070 Ti Super -1! | |
| Asus TUF Gaming GeForce RTX 4070 Ti | |
| Gigabyte Aorus GeForce RTX 4070 Ti Master | |
| Moyenne NVIDIA GeForce RTX 4070 Ti | |
| Gigabyte GeForce RTX 4070 Super Gaming OC 12G | |
| Moyenne NVIDIA GeForce RTX 3080 Ti | |
| Moyenne NVIDIA GeForce RTX 3090 | |
| NVIDIA GeForce RTX 4070 Super Founders Edition | |
| AMD Radeon RX 7800 XT | |
| Zotac Gaming GeForce RTX 4070 AMP Airo | |
| Moyenne NVIDIA GeForce RTX 3080 | |
| Sapphire Pulse Radeon RX 7700 XT | |
| Moyenne NVIDIA Titan RTX | |
| Moyenne NVIDIA GeForce RTX 4060 Ti 8G | |
| KFA2 GeForce RTX 4060 Ti EX, 16GB GDDR6 | |
| KFA2 GeForce RTX 4060 1-Click-OC 2X | |
| XFX Speedster QICK 308 Radeon RX 7600 Black Edition | |
| The Witcher 3 / Ultra Graphics & Postprocessing (HBAO+) | |
| NVIDIA GeForce RTX 4090 Founders Edition | |
| AMD Radeon RX 7900 XTX | |
| Gigabyte GeForce RTX 4080 Super Gaming OC | |
| NVIDIA GeForce RTX 4080 Founders Edition | |
| AMD Radeon RX 7900 XT | |
| Asus TUF Gaming GeForce RTX 4070 Ti Super | |
| Asus TUF Gaming GeForce RTX 4070 Ti | |
| Moyenne NVIDIA GeForce RTX 4070 Ti (92.4 - 98.3, n=4) | |
| Moyenne NVIDIA GeForce RTX 3080 Ti (93.1 - 96.4, n=4) | |
| Gigabyte Aorus GeForce RTX 4070 Ti Master | |
| Moyenne NVIDIA GeForce RTX 3090 (85.4 - 98.5, n=10) | |
| Gigabyte GeForce RTX 4070 Super Gaming OC 12G | |
| NVIDIA GeForce RTX 4070 Super Founders Edition | |
| Moyenne NVIDIA GeForce RTX 3080 (78 - 85.7, n=2) | |
| AMD Radeon RX 7800 XT | |
| Zotac Gaming GeForce RTX 4070 AMP Airo | |
| Moyenne NVIDIA Titan RTX (n=1) | |
| Sapphire Pulse Radeon RX 7700 XT | |
| Moyenne NVIDIA GeForce RTX 4060 Ti 8G (53.9 - 54.3, n=3) | |
| KFA2 GeForce RTX 4060 Ti EX, 16GB GDDR6 | |
| XFX Speedster QICK 308 Radeon RX 7600 Black Edition | |
| KFA2 GeForce RTX 4060 1-Click-OC 2X | |
| The Witcher 3 / High Graphics & Postprocessing (Nvidia HairWorks Off) | |
| NVIDIA GeForce RTX 4090 Founders Edition | |
| Gigabyte GeForce RTX 4080 Super Gaming OC | |
| NVIDIA GeForce RTX 4080 Founders Edition | |
| AMD Radeon RX 7900 XTX | |
| AMD Radeon RX 7900 XT | |
| Moyenne NVIDIA GeForce RTX 3080 Ti (149 - 156.8, n=4) | |
| Moyenne NVIDIA GeForce RTX 3090 (128 - 160.2, n=14) | |
| Asus TUF Gaming GeForce RTX 4070 Ti | |
| Gigabyte Aorus GeForce RTX 4070 Ti Master | |
| Moyenne NVIDIA GeForce RTX 4070 Ti (143 - 151.9, n=4) | |
| Gigabyte GeForce RTX 4070 Super Gaming OC 12G | |
| NVIDIA GeForce RTX 4070 Super Founders Edition | |
| Zotac Gaming GeForce RTX 4070 AMP Airo | |
| Moyenne NVIDIA GeForce RTX 3080 (114 - 115, n=2) | |
| AMD Radeon RX 7800 XT | |
| Moyenne NVIDIA Titan RTX (94 - 107.1, n=28) | |
| Sapphire Pulse Radeon RX 7700 XT | |
| Moyenne NVIDIA GeForce RTX 4060 Ti 8G (78.5 - 80.4, n=3) | |
| KFA2 GeForce RTX 4060 Ti EX, 16GB GDDR6 | |
| KFA2 GeForce RTX 4060 1-Click-OC 2X | |
| XFX Speedster QICK 308 Radeon RX 7600 Black Edition | |
| The Witcher 3 / Ultra Graphics & Postprocessing (HBAO+) | |
| NVIDIA GeForce RTX 4090 Founders Edition | |
| AMD Radeon RX 7900 XTX | |
| AMD Radeon RX 7900 XT | |
| NVIDIA GeForce RTX 4080 Founders Edition | |
| Gigabyte GeForce RTX 4080 Super Gaming OC | |
| Asus TUF Gaming GeForce RTX 4070 Ti | |
| Moyenne NVIDIA GeForce RTX 4070 Ti (217 - 230, n=5) | |
| Gigabyte Aorus GeForce RTX 4070 Ti Master | |
| Asus TUF Gaming GeForce RTX 4070 Ti Super | |
| Gigabyte GeForce RTX 4070 Super Gaming OC 12G | |
| NVIDIA GeForce RTX 4070 Super Founders Edition | |
| AMD Radeon RX 7800 XT | |
| Moyenne NVIDIA GeForce RTX 3090 (160 - 192.6, n=18) | |
| Moyenne NVIDIA GeForce RTX 3080 Ti (174 - 184.6, n=4) | |
| Zotac Gaming GeForce RTX 4070 AMP Airo | |
| Sapphire Pulse Radeon RX 7700 XT | |
| Moyenne NVIDIA GeForce RTX 3080 (145 - 152, n=2) | |
| Moyenne NVIDIA GeForce RTX 4060 Ti 8G (134.1 - 140.6, n=4) | |
| Moyenne NVIDIA Titan RTX (124 - 150, n=28) | |
| KFA2 GeForce RTX 4060 Ti EX, 16GB GDDR6 | |
| XFX Speedster QICK 308 Radeon RX 7600 Black Edition | |
| KFA2 GeForce RTX 4060 1-Click-OC 2X | |
| Metro Exodus / Ultra Quality | |
| NVIDIA GeForce RTX 4090 Founders Edition | |
| AMD Radeon RX 7900 XTX | |
| Gigabyte GeForce RTX 4080 Super Gaming OC | |
| NVIDIA GeForce RTX 4080 Founders Edition | |
| AMD Radeon RX 7900 XT | |
| Gigabyte Aorus GeForce RTX 4070 Ti Master | |
| Asus TUF Gaming GeForce RTX 4070 Ti | |
| Asus TUF Gaming GeForce RTX 4070 Ti Super | |
| Moyenne NVIDIA GeForce RTX 4070 Ti (81.2 - 85, n=4) | |
| Gigabyte GeForce RTX 4070 Super Gaming OC 12G | |
| Moyenne NVIDIA GeForce RTX 3080 Ti (74.2 - 77.1, n=4) | |
| Moyenne NVIDIA GeForce RTX 3090 (70.6 - 77.3, n=12) | |
| NVIDIA GeForce RTX 4070 Super Founders Edition | |
| AMD Radeon RX 7800 XT | |
| Zotac Gaming GeForce RTX 4070 AMP Airo | |
| Moyenne NVIDIA GeForce RTX 3080 (64.1 - 65.9, n=2) | |
| Sapphire Pulse Radeon RX 7700 XT | |
| Moyenne NVIDIA Titan RTX (51.3 - 57.9, n=27) | |
| Moyenne NVIDIA GeForce RTX 4060 Ti 8G (48.4 - 49.3, n=3) | |
| KFA2 GeForce RTX 4060 Ti EX, 16GB GDDR6 | |
| KFA2 GeForce RTX 4060 1-Click-OC 2X | |
| XFX Speedster QICK 308 Radeon RX 7600 Black Edition | |
| Metro Exodus / Ultra Quality | |
| NVIDIA GeForce RTX 4090 Founders Edition | |
| AMD Radeon RX 7900 XTX | |
| Gigabyte GeForce RTX 4080 Super Gaming OC | |
| AMD Radeon RX 7900 XT | |
| Gigabyte Aorus GeForce RTX 4070 Ti Master | |
| Asus TUF Gaming GeForce RTX 4070 Ti | |
| Asus TUF Gaming GeForce RTX 4070 Ti Super | |
| Moyenne NVIDIA GeForce RTX 4070 Ti (126.7 - 132.3, n=4) | |
| NVIDIA GeForce RTX 4080 Founders Edition | |
| Gigabyte GeForce RTX 4070 Super Gaming OC 12G | |
| NVIDIA GeForce RTX 4070 Super Founders Edition | |
| Moyenne NVIDIA GeForce RTX 3080 Ti (110 - 118, n=4) | |
| Moyenne NVIDIA GeForce RTX 3090 (102 - 118.2, n=12) | |
| Zotac Gaming GeForce RTX 4070 AMP Airo | |
| AMD Radeon RX 7800 XT | |
| Moyenne NVIDIA GeForce RTX 3080 (92.2 - 97.4, n=2) | |
| Sapphire Pulse Radeon RX 7700 XT | |
| Moyenne NVIDIA Titan RTX (69 - 92.9, n=26) | |
| Moyenne NVIDIA GeForce RTX 4060 Ti 8G (78.9 - 80.1, n=3) | |
| KFA2 GeForce RTX 4060 Ti EX, 16GB GDDR6 | |
| XFX Speedster QICK 308 Radeon RX 7600 Black Edition | |
| KFA2 GeForce RTX 4060 1-Click-OC 2X | |
| Metro Exodus / Ultra Quality | |
| NVIDIA GeForce RTX 4090 Founders Edition | |
| AMD Radeon RX 7900 XTX | |
| Gigabyte GeForce RTX 4080 Super Gaming OC | |
| AMD Radeon RX 7900 XT | |
| Asus TUF Gaming GeForce RTX 4070 Ti | |
| Gigabyte Aorus GeForce RTX 4070 Ti Master | |
| Moyenne NVIDIA GeForce RTX 4070 Ti (155.6 - 161.4, n=4) | |
| Asus TUF Gaming GeForce RTX 4070 Ti Super | |
| Gigabyte GeForce RTX 4070 Super Gaming OC 12G | |
| NVIDIA GeForce RTX 4080 Founders Edition | |
| NVIDIA GeForce RTX 4070 Super Founders Edition | |
| Moyenne NVIDIA GeForce RTX 3080 Ti (131 - 144.2, n=5) | |
| Moyenne NVIDIA GeForce RTX 3090 (108 - 145, n=12) | |
| Zotac Gaming GeForce RTX 4070 AMP Airo | |
| AMD Radeon RX 7800 XT | |
| Sapphire Pulse Radeon RX 7700 XT | |
| Moyenne NVIDIA GeForce RTX 3080 (111 - 116, n=2) | |
| Moyenne NVIDIA Titan RTX (73 - 116, n=27) | |
| Moyenne NVIDIA GeForce RTX 4060 Ti 8G (100.6 - 101.8, n=3) | |
| KFA2 GeForce RTX 4060 Ti EX, 16GB GDDR6 | |
| XFX Speedster QICK 308 Radeon RX 7600 Black Edition | |
| KFA2 GeForce RTX 4060 1-Click-OC 2X | |
| Control / High Quality Preset | |
| NVIDIA GeForce RTX 4090 Founders Edition | |
| AMD Radeon RX 7900 XTX | |
| Gigabyte GeForce RTX 4080 Super Gaming OC | |
| AMD Radeon RX 7900 XT | |
| NVIDIA GeForce RTX 4080 Founders Edition | |
| Asus TUF Gaming GeForce RTX 4070 Ti Super | |
| Moyenne NVIDIA GeForce RTX 4070 Ti (63.8 - 66.2, n=4) | |
| Asus TUF Gaming GeForce RTX 4070 Ti | |
| Gigabyte Aorus GeForce RTX 4070 Ti Master | |
| Moyenne NVIDIA GeForce RTX 3080 Ti (63.9 - 64.9, n=3) | |
| Moyenne NVIDIA GeForce RTX 3090 (61.3 - 66, n=5) | |
| AMD Radeon RX 7800 XT | |
| Gigabyte GeForce RTX 4070 Super Gaming OC 12G | |
| NVIDIA GeForce RTX 4070 Super Founders Edition | |
| Moyenne NVIDIA GeForce RTX 3080 (56.2 - 56.7, n=2) | |
| Zotac Gaming GeForce RTX 4070 AMP Airo | |
| Moyenne NVIDIA Titan RTX (45.2 - 47.3, n=3) | |
| Sapphire Pulse Radeon RX 7700 XT | |
| KFA2 GeForce RTX 4060 Ti EX, 16GB GDDR6 | |
| Moyenne NVIDIA GeForce RTX 4060 Ti 8G (34.3 - 37.3, n=3) | |
| XFX Speedster QICK 308 Radeon RX 7600 Black Edition | |
| KFA2 GeForce RTX 4060 1-Click-OC 2X | |
| Control / High Quality Preset | |
| NVIDIA GeForce RTX 4090 Founders Edition | |
| AMD Radeon RX 7900 XTX | |
| AMD Radeon RX 7900 XT | |
| Gigabyte GeForce RTX 4080 Super Gaming OC | |
| Asus TUF Gaming GeForce RTX 4070 Ti | |
| Gigabyte Aorus GeForce RTX 4070 Ti Master | |
| Asus TUF Gaming GeForce RTX 4070 Ti Super | |
| Moyenne NVIDIA GeForce RTX 3080 Ti (122 - 125.5, n=3) | |
| Moyenne NVIDIA GeForce RTX 4070 Ti (100 - 130.6, n=4) | |
| Moyenne NVIDIA GeForce RTX 3090 (115.8 - 123.7, n=5) | |
| AMD Radeon RX 7800 XT | |
| NVIDIA GeForce RTX 4080 Founders Edition | |
| Gigabyte GeForce RTX 4070 Super Gaming OC 12G | |
| NVIDIA GeForce RTX 4070 Super Founders Edition | |
| Moyenne NVIDIA GeForce RTX 3080 (105 - 106, n=2) | |
| Zotac Gaming GeForce RTX 4070 AMP Airo | |
| Sapphire Pulse Radeon RX 7700 XT | |
| Moyenne NVIDIA Titan RTX (89 - 93.6, n=3) | |
| Moyenne NVIDIA GeForce RTX 4060 Ti 8G (69.2 - 75.3, n=3) | |
| KFA2 GeForce RTX 4060 Ti EX, 16GB GDDR6 | |
| XFX Speedster QICK 308 Radeon RX 7600 Black Edition | |
| KFA2 GeForce RTX 4060 1-Click-OC 2X | |
| Control / High Quality Preset | |
| AMD Radeon RX 7900 XTX | |
| NVIDIA GeForce RTX 4090 Founders Edition | |
| AMD Radeon RX 7900 XT | |
| Gigabyte GeForce RTX 4080 Super Gaming OC | |
| Asus TUF Gaming GeForce RTX 4070 Ti | |
| Gigabyte Aorus GeForce RTX 4070 Ti Master | |
| Moyenne NVIDIA GeForce RTX 4070 Ti (196.6 - 202, n=4) | |
| Asus TUF Gaming GeForce RTX 4070 Ti Super | |
| AMD Radeon RX 7800 XT | |
| Moyenne NVIDIA GeForce RTX 3080 Ti (181 - 190.7, n=3) | |
| Gigabyte GeForce RTX 4070 Super Gaming OC 12G | |
| Moyenne NVIDIA GeForce RTX 3090 (172.2 - 189.2, n=5) | |
| NVIDIA GeForce RTX 4070 Super Founders Edition | |
| NVIDIA GeForce RTX 4080 Founders Edition | |
| Zotac Gaming GeForce RTX 4070 AMP Airo | |
| Sapphire Pulse Radeon RX 7700 XT | |
| Moyenne NVIDIA GeForce RTX 3080 (151 - 155, n=2) | |
| Moyenne NVIDIA Titan RTX (135 - 141.9, n=3) | |
| Moyenne NVIDIA GeForce RTX 4060 Ti 8G (115.7 - 120.2, n=3) | |
| KFA2 GeForce RTX 4060 Ti EX, 16GB GDDR6 | |
| XFX Speedster QICK 308 Radeon RX 7600 Black Edition | |
| KFA2 GeForce RTX 4060 1-Click-OC 2X | |
| Borderlands 3 / Badass Overall Quality (DX11) | |
| NVIDIA GeForce RTX 4090 Founders Edition | |
| Gigabyte GeForce RTX 4080 Super Gaming OC | |
| NVIDIA GeForce RTX 4080 Founders Edition | |
| AMD Radeon RX 7900 XTX | |
| Asus TUF Gaming GeForce RTX 4070 Ti Super | |
| Gigabyte Aorus GeForce RTX 4070 Ti Master | |
| AMD Radeon RX 7900 XT | |
| Asus TUF Gaming GeForce RTX 4070 Ti | |
| Moyenne NVIDIA GeForce RTX 4070 Ti (71.9 - 74.9, n=4) | |
| Moyenne NVIDIA GeForce RTX 3090 (68 - 75.3, n=13) | |
| Moyenne NVIDIA GeForce RTX 3080 Ti (71.2 - 74, n=4) | |
| Gigabyte GeForce RTX 4070 Super Gaming OC 12G | |
| NVIDIA GeForce RTX 4070 Super Founders Edition | |
| Moyenne NVIDIA GeForce RTX 3080 (61.5 - 61.9, n=2) | |
| Zotac Gaming GeForce RTX 4070 AMP Airo | |
| AMD Radeon RX 7800 XT | |
| Sapphire Pulse Radeon RX 7700 XT | |
| Moyenne NVIDIA Titan RTX (46 - 52.8, n=29) | |
| Moyenne NVIDIA GeForce RTX 4060 Ti 8G (43.1 - 43.7, n=3) | |
| KFA2 GeForce RTX 4060 Ti EX, 16GB GDDR6 | |
| XFX Speedster QICK 308 Radeon RX 7600 Black Edition | |
| KFA2 GeForce RTX 4060 1-Click-OC 2X | |
| Borderlands 3 / Badass Overall Quality (DX11) | |
| NVIDIA GeForce RTX 4090 Founders Edition | |
| Gigabyte GeForce RTX 4080 Super Gaming OC | |
| NVIDIA GeForce RTX 4080 Founders Edition | |
| AMD Radeon RX 7900 XTX | |
| Asus TUF Gaming GeForce RTX 4070 Ti Super | |
| Gigabyte Aorus GeForce RTX 4070 Ti Master | |
| Asus TUF Gaming GeForce RTX 4070 Ti | |
| Moyenne NVIDIA GeForce RTX 4070 Ti (134.3 - 142, n=4) | |
| AMD Radeon RX 7900 XT | |
| Gigabyte GeForce RTX 4070 Super Gaming OC 12G | |
| NVIDIA GeForce RTX 4070 Super Founders Edition | |
| Moyenne NVIDIA GeForce RTX 3080 Ti (114 - 130.2, n=4) | |
| Moyenne NVIDIA GeForce RTX 3090 (105 - 131.6, n=13) | |
| Zotac Gaming GeForce RTX 4070 AMP Airo | |
| AMD Radeon RX 7800 XT | |
| Moyenne NVIDIA GeForce RTX 3080 (95.7 - 103, n=2) | |
| Sapphire Pulse Radeon RX 7700 XT | |
| Moyenne NVIDIA Titan RTX (74 - 93.1, n=29) | |
| Moyenne NVIDIA GeForce RTX 4060 Ti 8G (83.9 - 85.2, n=3) | |
| KFA2 GeForce RTX 4060 Ti EX, 16GB GDDR6 | |
| XFX Speedster QICK 308 Radeon RX 7600 Black Edition | |
| KFA2 GeForce RTX 4060 1-Click-OC 2X | |
| Borderlands 3 / Badass Overall Quality (DX11) | |
| NVIDIA GeForce RTX 4090 Founders Edition | |
| Asus TUF Gaming GeForce RTX 4070 Ti | |
| Gigabyte GeForce RTX 4080 Super Gaming OC | |
| Gigabyte Aorus GeForce RTX 4070 Ti Master | |
| AMD Radeon RX 7900 XTX | |
| Moyenne NVIDIA GeForce RTX 4070 Ti (171.4 - 186.9, n=4) | |
| NVIDIA GeForce RTX 4080 Founders Edition | |
| Asus TUF Gaming GeForce RTX 4070 Ti Super | |
| AMD Radeon RX 7900 XT | |
| Gigabyte GeForce RTX 4070 Super Gaming OC 12G | |
| NVIDIA GeForce RTX 4070 Super Founders Edition | |
| Zotac Gaming GeForce RTX 4070 AMP Airo | |
| Moyenne NVIDIA GeForce RTX 3080 Ti (129 - 164.9, n=4) | |
| Moyenne NVIDIA GeForce RTX 3090 (117 - 170.1, n=13) | |
| AMD Radeon RX 7800 XT | |
| Sapphire Pulse Radeon RX 7700 XT | |
| Moyenne NVIDIA GeForce RTX 3080 (117 - 128, n=2) | |
| Moyenne NVIDIA GeForce RTX 4060 Ti 8G (121.5 - 123.5, n=3) | |
| KFA2 GeForce RTX 4060 Ti EX, 16GB GDDR6 | |
| Moyenne NVIDIA Titan RTX (77.2 - 128.7, n=29) | |
| XFX Speedster QICK 308 Radeon RX 7600 Black Edition | |
| KFA2 GeForce RTX 4060 1-Click-OC 2X | |
| Shadow of the Tomb Raider / Highest Preset | |
| NVIDIA GeForce RTX 4090 Founders Edition | |
| AMD Radeon RX 7900 XTX | |
| Gigabyte GeForce RTX 4080 Super Gaming OC | |
| NVIDIA GeForce RTX 4080 Founders Edition | |
| AMD Radeon RX 7900 XT | |
| Asus TUF Gaming GeForce RTX 4070 Ti Super | |
| Gigabyte Aorus GeForce RTX 4070 Ti Master | |
| Asus TUF Gaming GeForce RTX 4070 Ti | |
| Moyenne NVIDIA GeForce RTX 4070 Ti (102.7 - 104.9, n=4) | |
| Gigabyte GeForce RTX 4070 Super Gaming OC 12G | |
| Moyenne NVIDIA GeForce RTX 3090 (89.3 - 99.7, n=12) | |
| Moyenne NVIDIA GeForce RTX 3080 Ti (93 - 98.6, n=3) | |
| NVIDIA GeForce RTX 4070 Super Founders Edition | |
| Moyenne NVIDIA GeForce RTX 3080 (83.9 - 87.9, n=2) | |
| Zotac Gaming GeForce RTX 4070 AMP Airo | |
| AMD Radeon RX 7800 XT | |
| Moyenne NVIDIA Titan RTX (59 - 71.1, n=24) | |
| Sapphire Pulse Radeon RX 7700 XT | |
| KFA2 GeForce RTX 4060 Ti EX, 16GB GDDR6 | |
| Moyenne NVIDIA GeForce RTX 4060 Ti 8G (58.1 - 58.7, n=3) | |
| KFA2 GeForce RTX 4060 1-Click-OC 2X | |
| XFX Speedster QICK 308 Radeon RX 7600 Black Edition | |
| Shadow of the Tomb Raider / Highest Preset | |
| NVIDIA GeForce RTX 4090 Founders Edition | |
| AMD Radeon RX 7900 XTX | |
| Gigabyte GeForce RTX 4080 Super Gaming OC | |
| Asus TUF Gaming GeForce RTX 4070 Ti Super | |
| Gigabyte Aorus GeForce RTX 4070 Ti Master | |
| AMD Radeon RX 7900 XT | |
| Asus TUF Gaming GeForce RTX 4070 Ti | |
| Moyenne NVIDIA GeForce RTX 4070 Ti (195.9 - 204, n=4) | |
| NVIDIA GeForce RTX 4080 Founders Edition | |
| Gigabyte GeForce RTX 4070 Super Gaming OC 12G | |
| Moyenne NVIDIA GeForce RTX 3090 (137 - 172.3, n=12) | |
| NVIDIA GeForce RTX 4070 Super Founders Edition | |
| Moyenne NVIDIA GeForce RTX 3080 Ti (157 - 173.3, n=3) | |
| Zotac Gaming GeForce RTX 4070 AMP Airo | |
| AMD Radeon RX 7800 XT | |
| Moyenne NVIDIA GeForce RTX 3080 (147 - 152, n=2) | |
| Sapphire Pulse Radeon RX 7700 XT | |
| Moyenne NVIDIA GeForce RTX 4060 Ti 8G (119.3 - 121.2, n=3) | |
| KFA2 GeForce RTX 4060 Ti EX, 16GB GDDR6 | |
| Moyenne NVIDIA Titan RTX (98 - 128, n=23) | |
| KFA2 GeForce RTX 4060 1-Click-OC 2X | |
| XFX Speedster QICK 308 Radeon RX 7600 Black Edition | |
| Shadow of the Tomb Raider / Highest Preset | |
| NVIDIA GeForce RTX 4090 Founders Edition | |
| AMD Radeon RX 7900 XTX | |
| AMD Radeon RX 7900 XT | |
| Asus TUF Gaming GeForce RTX 4070 Ti | |
| Gigabyte Aorus GeForce RTX 4070 Ti Master | |
| Moyenne NVIDIA GeForce RTX 4070 Ti (263 - 280, n=4) | |
| Gigabyte GeForce RTX 4080 Super Gaming OC | |
| Asus TUF Gaming GeForce RTX 4070 Ti Super | |
| Gigabyte GeForce RTX 4070 Super Gaming OC 12G | |
| NVIDIA GeForce RTX 4070 Super Founders Edition | |
| Zotac Gaming GeForce RTX 4070 AMP Airo | |
| NVIDIA GeForce RTX 4080 Founders Edition | |
| AMD Radeon RX 7800 XT | |
| Moyenne NVIDIA GeForce RTX 3080 Ti (178 - 238, n=3) | |
| Moyenne NVIDIA GeForce RTX 3090 (145 - 240, n=14) | |
| Sapphire Pulse Radeon RX 7700 XT | |
| KFA2 GeForce RTX 4060 Ti EX, 16GB GDDR6 | |
| Moyenne NVIDIA GeForce RTX 4060 Ti 8G (181.6 - 184, n=3) | |
| Moyenne NVIDIA GeForce RTX 3080 (177 - 185, n=2) | |
| Moyenne NVIDIA Titan RTX (106 - 178.8, n=24) | |
| KFA2 GeForce RTX 4060 1-Click-OC 2X | |
| XFX Speedster QICK 308 Radeon RX 7600 Black Edition | |
The Witcher 3: 3840x2160 Ultra Graphics & Postprocessing (HBAO+) | 3840x2160 High Graphics & Postprocessing (Nvidia HairWorks Off) | 1920x1080 Ultra Graphics & Postprocessing (HBAO+)
Metro Exodus: 3840x2160 Ultra Quality AF:16x | 2560x1440 Ultra Quality AF:16x | 1920x1080 Ultra Quality AF:16x
Control: 3840x2160 High Quality Preset | 2560x1440 High Quality Preset | 1920x1080 High Quality Preset
Borderlands 3: 3840x2160 Badass Overall Quality (DX11) | 2560x1440 Badass Overall Quality (DX11) | 1920x1080 Badass Overall Quality (DX11)
Shadow of the Tomb Raider: 3840x2160 Highest Preset AA:T | 2560x1440 Highest Preset AA:T | 1920x1080 Highest Preset AA:T
F1 22: 3840x2160 Ultra High Preset AA:T AF:16x | 2560x1440 Ultra High Preset AA:T AF:16x | 1920x1080 Ultra High Preset AA:T AF:16x
Final Fantasy XV Benchmark: 3840x2160 High Quality | 2560x1440 High Quality | 1920x1080 High Quality
Performances du ray tracing
Des jeux tels que Metro Exodus (sans l'édition améliorée), Controlet Far Cry 6 la RX 7900 XTX a réussi à battre de justesse la RTX 4080 Super Gaming OC en ray tracing 1080p Ultra natif.
Cela dit, la RTX 4080 Super Gaming OC a une avance de 3 à 17% sur la RTX 4080 FE en ray tracing natif.
| Bas | Moyen | Élevé | Ultra | QHD | 4K DLSS | 4K FSR | 4K | |
|---|---|---|---|---|---|---|---|---|
| GTA V (2015) | 188.2 | 188 | 186.9 | 165.4 | 164.6 | 163.6 | ||
| The Witcher 3 (2015) | 470 | 241 | 196.2 | 186.4 | ||||
| Dota 2 Reborn (2015) | 273 | 245 | 236 | 222 | 214 | |||
| Final Fantasy XV Benchmark (2018) | 235 | 236 | 225 | 193.5 | 117.8 | |||
| X-Plane 11.11 (2018) | 236 | 207 | 154.9 | 132.2 | ||||
| Far Cry 5 (2018) | 206 | 202 | 193 | 134 | ||||
| Strange Brigade (2018) | 626 | 519 | 501 | 480 | 389 | 197.3 | ||
| Shadow of the Tomb Raider (2018) | 271 | 262 | 224 | 127.5 | ||||
| Metro Exodus (2019) | 203 | 169.4 | 144.9 | 97.7 | ||||
| Control (2019) | 221 | 206 | 145 | 86.4 | 76.5 | |||
| Borderlands 3 (2019) | 184.4 | 186.3 | 161.6 | 97.6 | ||||
| Mafia Definitive Edition (2020) | 248 | 232 | 202 | 111.4 | ||||
| Watch Dogs Legion (2020) | 149 | 144.5 | 127 | 80.5 | ||||
| Far Cry 6 (2021) | 212 | 194.4 | 179.8 | 162.8 | 99.3 | |||
| Dying Light 2 (2022) | 217 | 165.9 | 123.7 | 65 | ||||
| Cyberpunk 2077 1.6 (2022) | 209 | 208 | 198.4 | 187.8 | 127.9 | 63 | ||
| Ghostwire Tokyo (2022) | 299 | 298 | 247 | 120 | ||||
| F1 22 (2022) | 368 | 166.4 | 112.9 | 59.2 | ||||
| F1 23 (2023) | 393 | 165.4 | 108.3 | 94.5 | 54.5 | |||
| Baldur's Gate 3 (2023) | 245 | 237 | 232 | 186.8 | 160.7 | 97.6 | ||
| Cyberpunk 2077 (2023) | 197.5 | 198.3 | 186.9 | 173.8 | 121.7 | 55.6 | ||
| Assassin's Creed Mirage (2023) | 243 | 191 | 158 | 135 | 101 | |||
| Alan Wake 2 (2023) | 130.1 | 122.4 | 90.1 | 77.6 | 53.5 | |||
| Avatar Frontiers of Pandora (2023) | 158.9 | 128.8 | 90.1 | 81.1 | 48.4 | |||
| Skull & Bones (2024) | 205 | 172 | 137 | 114 | 105 | 101 | 78 |
Émissions : Bruit plus élevé, mais performance relativement stable à l'effort
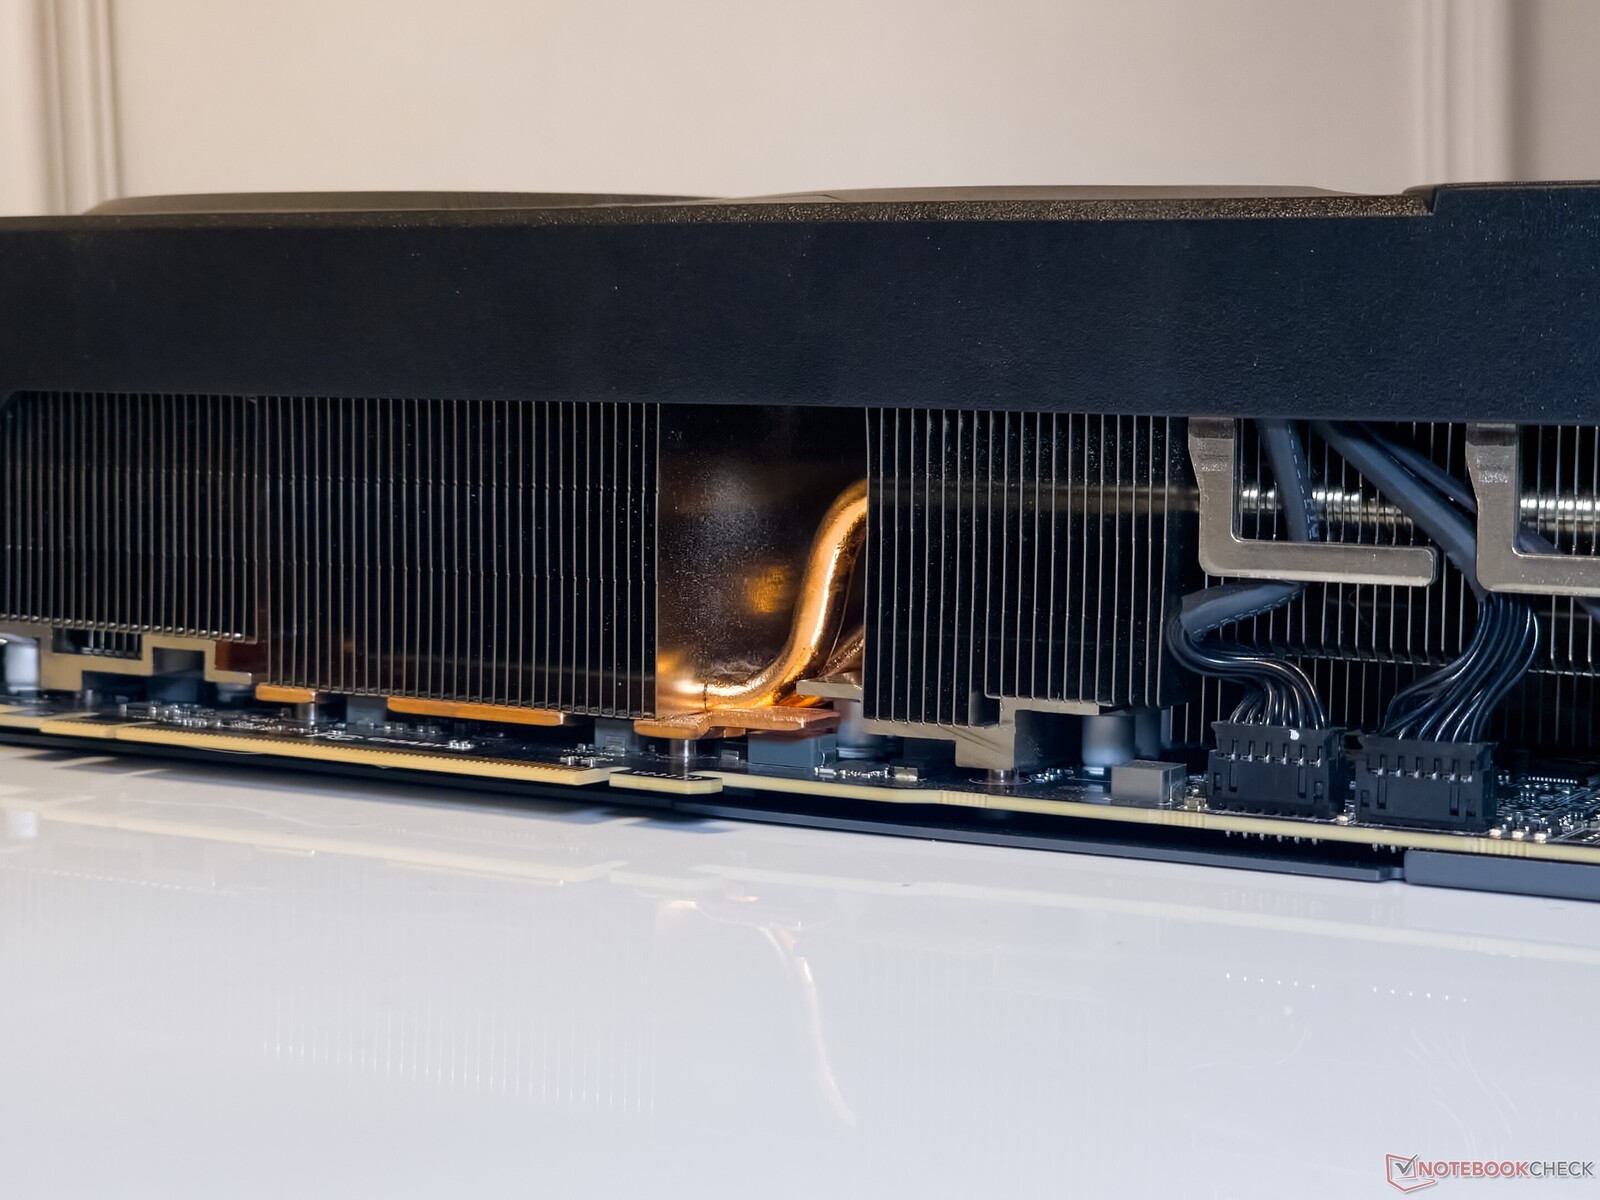
La RTX 4080 Super Gaming OC utilise le système de refroidissement WindForce de Gigabyte, composé de trois ventilateurs de 110 mm à rotation alternée, de neuf heatpipes et d'une plaque de cuivre à contact direct.
Selon Gigabyte, les ventilateurs à roulements à billes utilisent un nano lubrifiant à base de graphène qui est censé prolonger la durée de vie, comme les ventilateurs à double roulement à billes.
La plaque arrière en métal présente une large découpe pour l'évacuation de l'air qui est, en fait, une extension du dissipateur thermique.
Tests de résistance
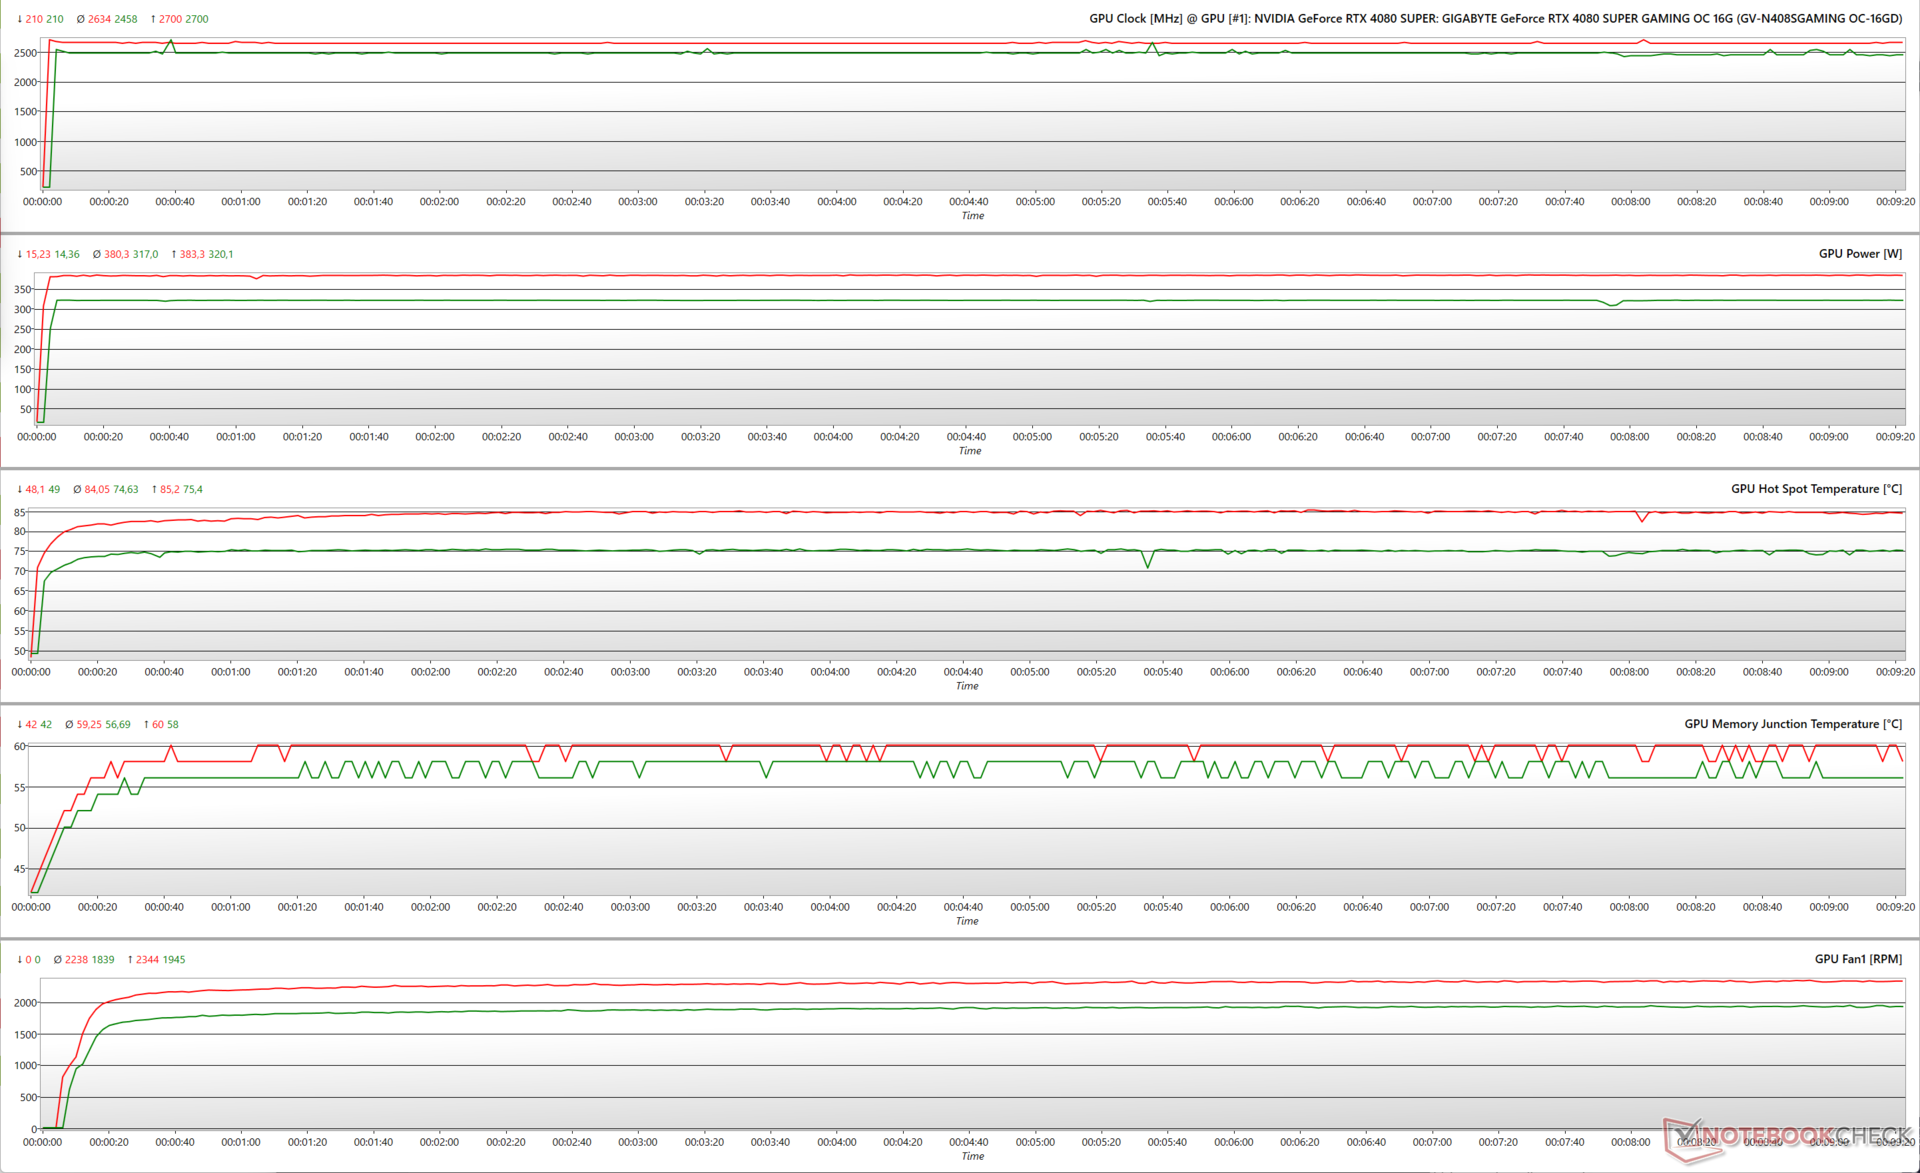
En stressant la RTX 4080 Super Gaming OC avec FurMark (1,280 x 720, pas d'AA), le GPU utilise les 320 W TGP disponibles à un objectif de puissance (PT) de 100%. Il en résulte un boost clock moyen de 2 458 MHz et des températures proches de 75 °C.
Avec un PT de 125 %, le GPU ne peut utiliser que 383 W sur les 400 W théoriquement disponibles. Ceci a été observé précédemment avec la RTX 4070 Super Gaming OC.
Le GPU atteint une fréquence moyenne de 2 634 MHz et la température du hotspot s'élève à 84°C.
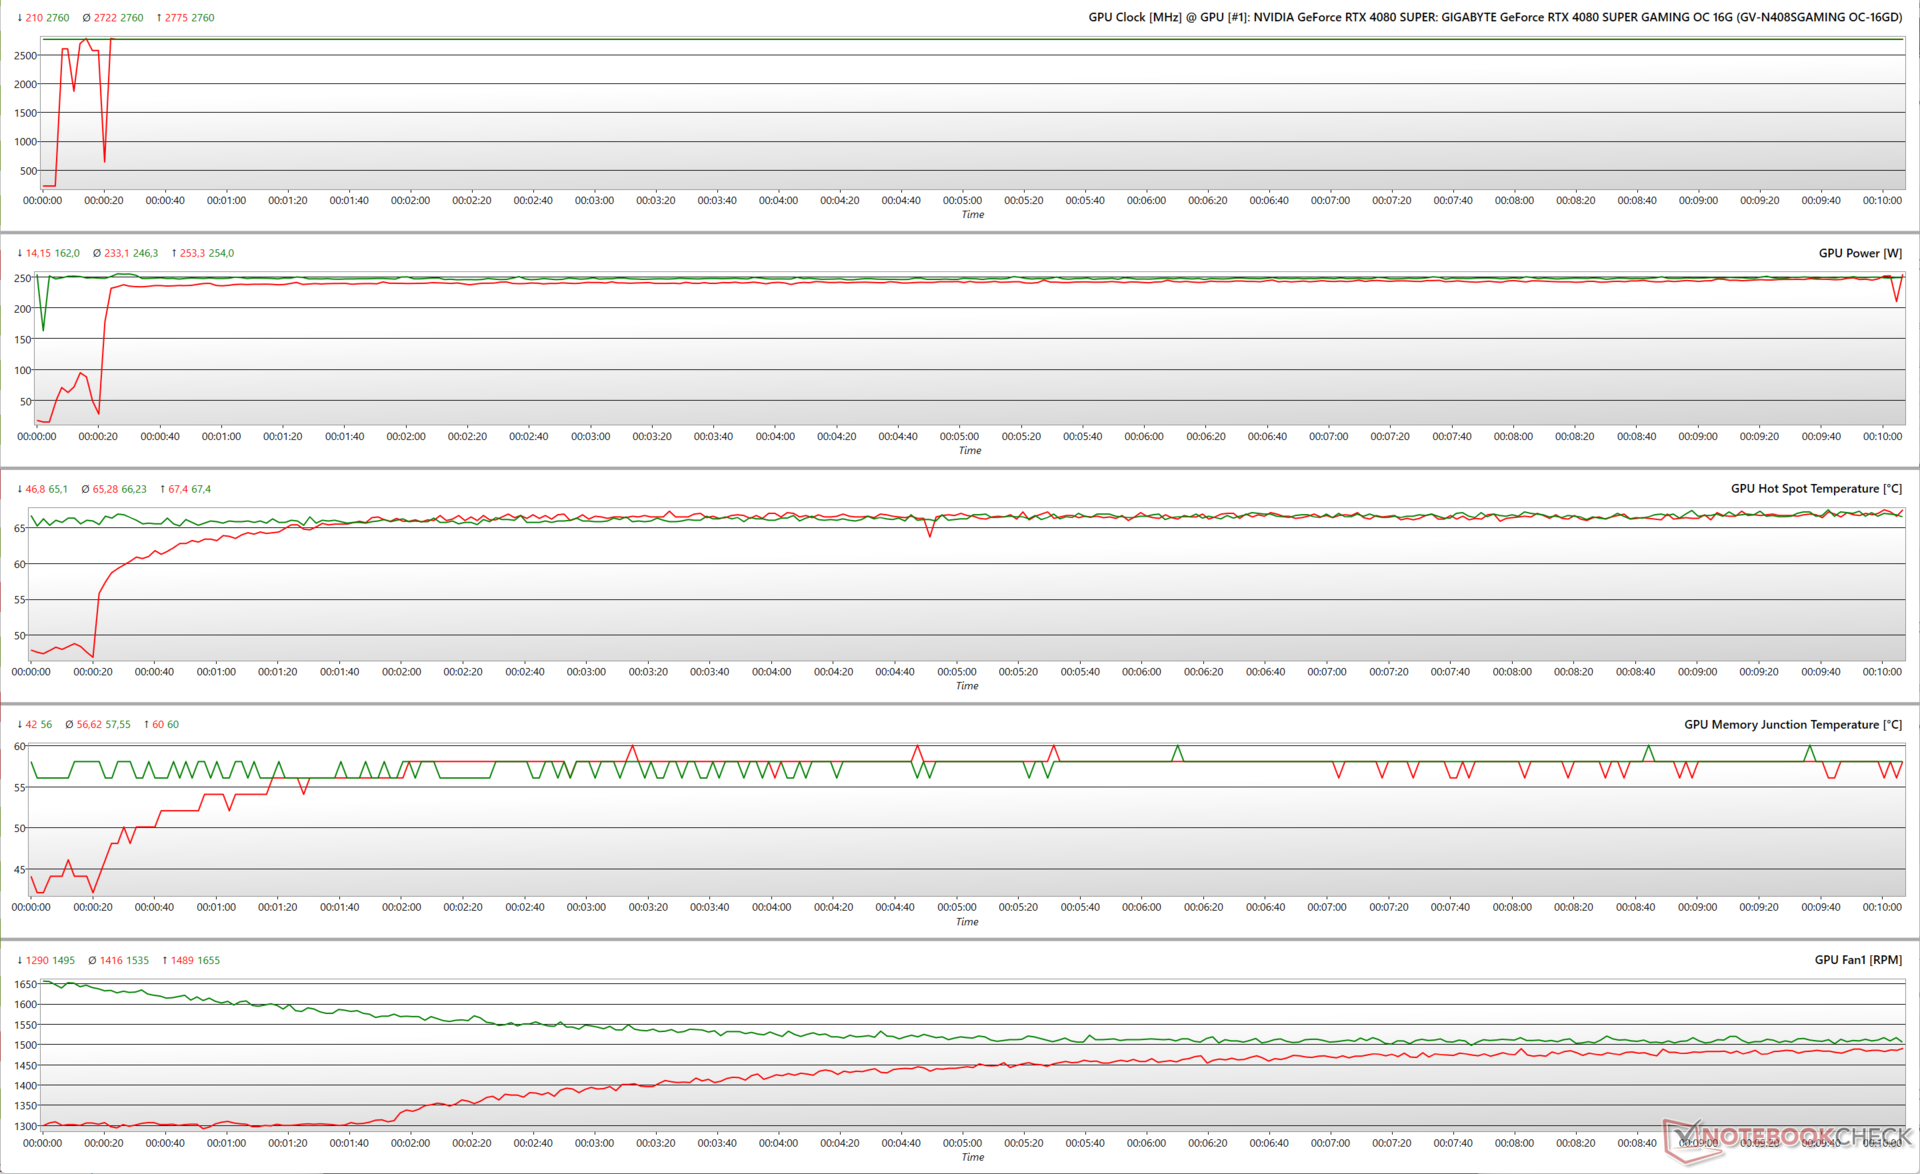
Lors de l'exécution de Le Witcher 3 à 1080p Ultra, la RTX 4080 Super Gaming OC parvient à maintenir une fréquence de 2 760 MHz à 100% PT tout en consommant 254 W.
Comme c'est la norme avec les cartes Ada, l'augmentation de la puissance cible dans les charges de travail de jeu ne confère aucun avantage apparent. Les paramètres tels que la vitesse d'horloge, la consommation d'énergie et les températures des points chauds sont identiques sur le site Witcher 3, même à 125 % de PT.
Le tableau des FPS de Witcher 3
Le système de refroidissement WindForce de Gigabyte semble bien fonctionner pour atténuer les problèmes d'étranglement. Nous n'avons observé aucune baisse d'images lors des tests de stress avec The Witcher 3 en 1080p Ultra et 4K Ultra.
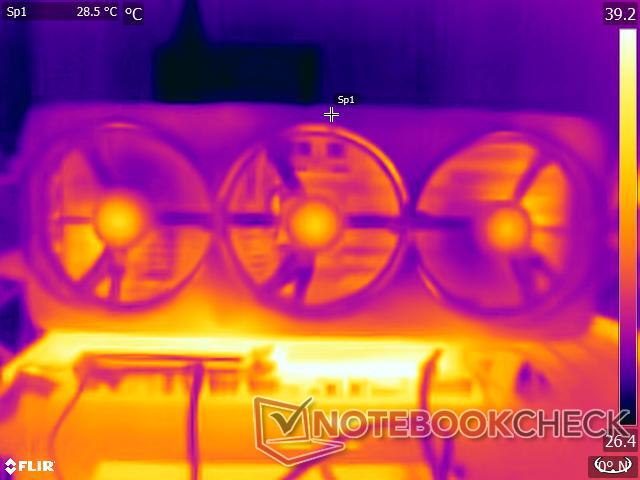
Températures de surface
Les températures de surface sous charge sont généralement tolérables. À une température ambiante de 23 °C, la coque avant en plastique reste relativement froide à 28,5 °C, tandis que le panneau arrière en métal frôle les 48 °C.
La zone proche du connecteur 12VHPWR devient également assez chaude, atteignant 50 °C.


Niveaux de bruit
La RTX 4080 Super Gaming OC est plus bruyante que la RTX 4070 Super Gaming OC.
Ceci étant dit, les ventilateurs s'arrêtent complètement au ralenti et ne commencent à tourner qu'une fois que la température du cœur atteint la barre des 55 °C, conformément à la courbe de ventilation par défaut.
Les utilisateurs peuvent choisir entre les modes BIOS OC et Silent VBIOS, mais nous n'avons pas observé de différences significatives entre les deux pendant les tests. Le commutateur VBIOS semble en fait redondant puisque vous pouvez facilement ajuster les courbes de ventilateur à votre convenance dans l'application Gigabyte Control Center.
Néanmoins, nous avons enregistré un niveau de pression acoustique (SPL) maximum de 54,21 dB(A) en stressant le GPU avec FurMark en mode BIOS OC à un PT de 125%.
Les niveaux de bruit en jouant avec The Witcher 3 à 1080p Ultra sont restés en dessous de 50 dB(A) SPL dans tous les modes testés.
| Stress Test | Mode VBIOS / Power Target | Vitesse maximale du ventilateur (RPM) Bruit du ventilateur dB.A.Vitesse du ventilateur (RPM) | Bruit du ventilateur dB(A) |
| FurMark 1280 x 720, sans AA | BIOS OC / 100% | 1,937 | 49.37 |
| FurMark 1280 x 720, sans AA | BIOS Silent / 100% | 1,997 | 50.09 |
| FurMark 1280 x 720, sans AA | BIOS OC / 125% | 2,326 | 54.21 |
| FurMark 1280 x 720, sans AA | BIOS Silent / 125% | 2,302 | 54.10 |
| Le Witcher 3 1080p Ultra | BIOS OC / 100% | 1,814 | 48.24 |
| Le Witcher 3 1080p Ultra | Silent BIOS / 100% | 1,801 | 48.66 |
| La Witcher 3 1080p Ultra | BIOS OC / 125% | 1,866 | 49.29 |
| Le Witcher 3 1080p Ultra | Silent BIOS / 125% | 1,813 | 49.13 |
Gestion de l'énergie : Comparable à la RTX 4080 FE à 100% PT
La RTX 4080 Super Gaming OC n'est pas la plus économe en matière de consommation d'énergie étant donné le puissant die AD103 mais elle est tout de même 20% plus économe que la RX 7900 XTX.
La consommation de la carte Gigabyte lors des tests FurMark et The Witcher 3 est comparable à celle de la RTX 4080 FE à un PT de 100%, tout en étant 6% moins efficace que cette dernière.
La consommation en jouant à The Witcher 3 en 1080p Ultra n'est que marginalement plus élevée en passant de 100% à 125% PT comparé à un delta plus perceptible de 15% dans FurMark.
Power Consumption: External monitor
| 1280x720 FurMark 1.19 GPU Stress Test (external Monitor) | |
| 1920x1080 The Witcher 3 ultra (external Monitor) | |
* ... Moindre est la valeur, meilleures sont les performances
Points positifs
Points négatifs
Verdict : Gains supplémentaires avec l'AD103 complet à un prix réduit

La Gigabyte GeForce RTX 4080 Super Gaming OC 16G supplante complètement son prédécesseur RTX 4080 pour un prix inférieur tout en offrant 5% de shaders en plus, un boost nominal de 45 MHz, et une mémoire légèrement plus rapide. Gigabyte a conservé tous les aspects familiers de la variante de la dernière génération - un design à trois emplacements, une configuration WindForce à trois ventilateurs avec neuf heatpipes, et un RGB décent.
Dans l'ensemble, la carte de Gigabyte parvient à devancer la RTX 4080 Founders Edition dans les synthèses correspondant à l'augmentation du nombre de shaders. Les deltas ont été étonnamment plus larges dans les tests de jeu, mais les gains exacts, s'il y en a, dépendront du jeu lui-même et de la résolution à laquelle vous jouez.
La RTX 4090 Founders Edition (US$1,599 sur Best Buy) est toujours en tête des classements, et Nvidia a peu d'incitation à lancer une RTX 4090 Ti ou Super puisque Team Red semble nonchalant face à toute tentative de perturber le statu quo du vaisseau amiral.
La Gigabyte RTX 4080 Super Gaming OC 16G offre d'excellentes performances de jeu en 4K qui ne font que s'améliorer avec la prise en charge des nouvelles technologies DLSS. L'augmentation de 50 dollars par rapport à la RTX 4080 Super FE n'est pas totalement inutile, mais la Radeon RX 7900 XTX d'AMD est une offre tout aussi compétente si vous cherchez à économiser un peu plus d'argent
Nvidia semble avoir bien joué ses cartes (jeu de mots) en réduisant le prix de vente de la RTX 4080 FE de 200 dollars. Idéalement, ce prix aurait dû être celui de 2022, mais il a fallu attendre l'arrivée de la Radeon RX 7900 XTX d'AMD (à partir de 926 € sur Amazon) pour offrir un semblant de concurrence.
Les deux cartes sont excellentes pour les jeux en 1440p à taux de rafraîchissement élevé et en 4K natif à 60 fps, mais la RX 7900 XTX semble être un meilleur pari en termes de rapport qualité-prix dans ce segment.
Cependant, la RTX 4080 Super Gaming OC offre des avantages que seules les cartes Nvidia peuvent offrir à l'heure actuelle. Il s'agit notamment d'une meilleure performance globale de ray tracing avec le support des technologies DLSS 3 frame generation et DLSS 3.5 ray reconstruction, et d'une efficacité énergétique massivement améliorée.
Gigabyte propose un ensemble de fonctionnalités décentes pour la somme supplémentaire de 50 dollars, comme un refroidisseur très performant, un double commutateur VBIOS, une esthétique soignée, des supports pour éviter l'affaissement du GPU, et une garantie de quatre ans.
Mais est-ce que cela a du sens de dépenser 1000 dollars pour un nouveau GPU à ce stade ? Peut-être pas. La RTX 4070 Super (à partir de 600 dollars sur Amazon) est déjà capable de jouer en 4K avec un peu d'aide à l'upscaling, et il est peut-être plus prudent d'attendre de voir ce que les GPU Nvidia Blackwell et AMD RDNA 4 auront à offrir plus tard dans l'année.
La RTX 4080 non Super originale est officiellement EoL'd, mais ce n'est pas une mauvaise idée de chasser les bonnes affaires dans votre marché local.
Prix et disponibilité
La Gigabyte GeForce RTX 4080 Super Gaming OC 16G est officiellement vendue au prix de 1 050 dollars US, mais elle est actuellement vendue au prix de 1 100 dollars US sur Amazon US et Best Buy US.
La carte n'est pas encore listée sur Amazon India, mais les prix dans les magasins de détail locaux peuvent varier entre ₹1,20,000 et ₹1,28,000.
Transparency
La sélection des appareils à examiner est effectuée par notre équipe éditoriale. L'échantillon de test a été prêté à l'auteur par le fabricant ou le détaillant pour les besoins de cet examen. Le prêteur n'a pas eu d'influence sur cette évaluation et le fabricant n'a pas reçu de copie de cette évaluation avant sa publication. Il n'y avait aucune obligation de publier cet article. En tant que média indépendant, Notebookcheck n'est pas soumis à l'autorité des fabricants, des détaillants ou des éditeurs.
Voici comment Notebookcheck teste
Chaque année, Notebookcheck examine de manière indépendante des centaines d'ordinateurs portables et de smartphones en utilisant des procédures standardisées afin de garantir que tous les résultats sont comparables. Nous avons continuellement développé nos méthodes de test depuis environ 20 ans et avons établi des normes industrielles dans le processus. Dans nos laboratoires de test, des équipements de mesure de haute qualité sont utilisés par des techniciens et des rédacteurs expérimentés. Ces tests impliquent un processus de validation en plusieurs étapes. Notre système d'évaluation complexe repose sur des centaines de mesures et de points de référence bien fondés, ce qui garantit l'objectivité.Price comparison

