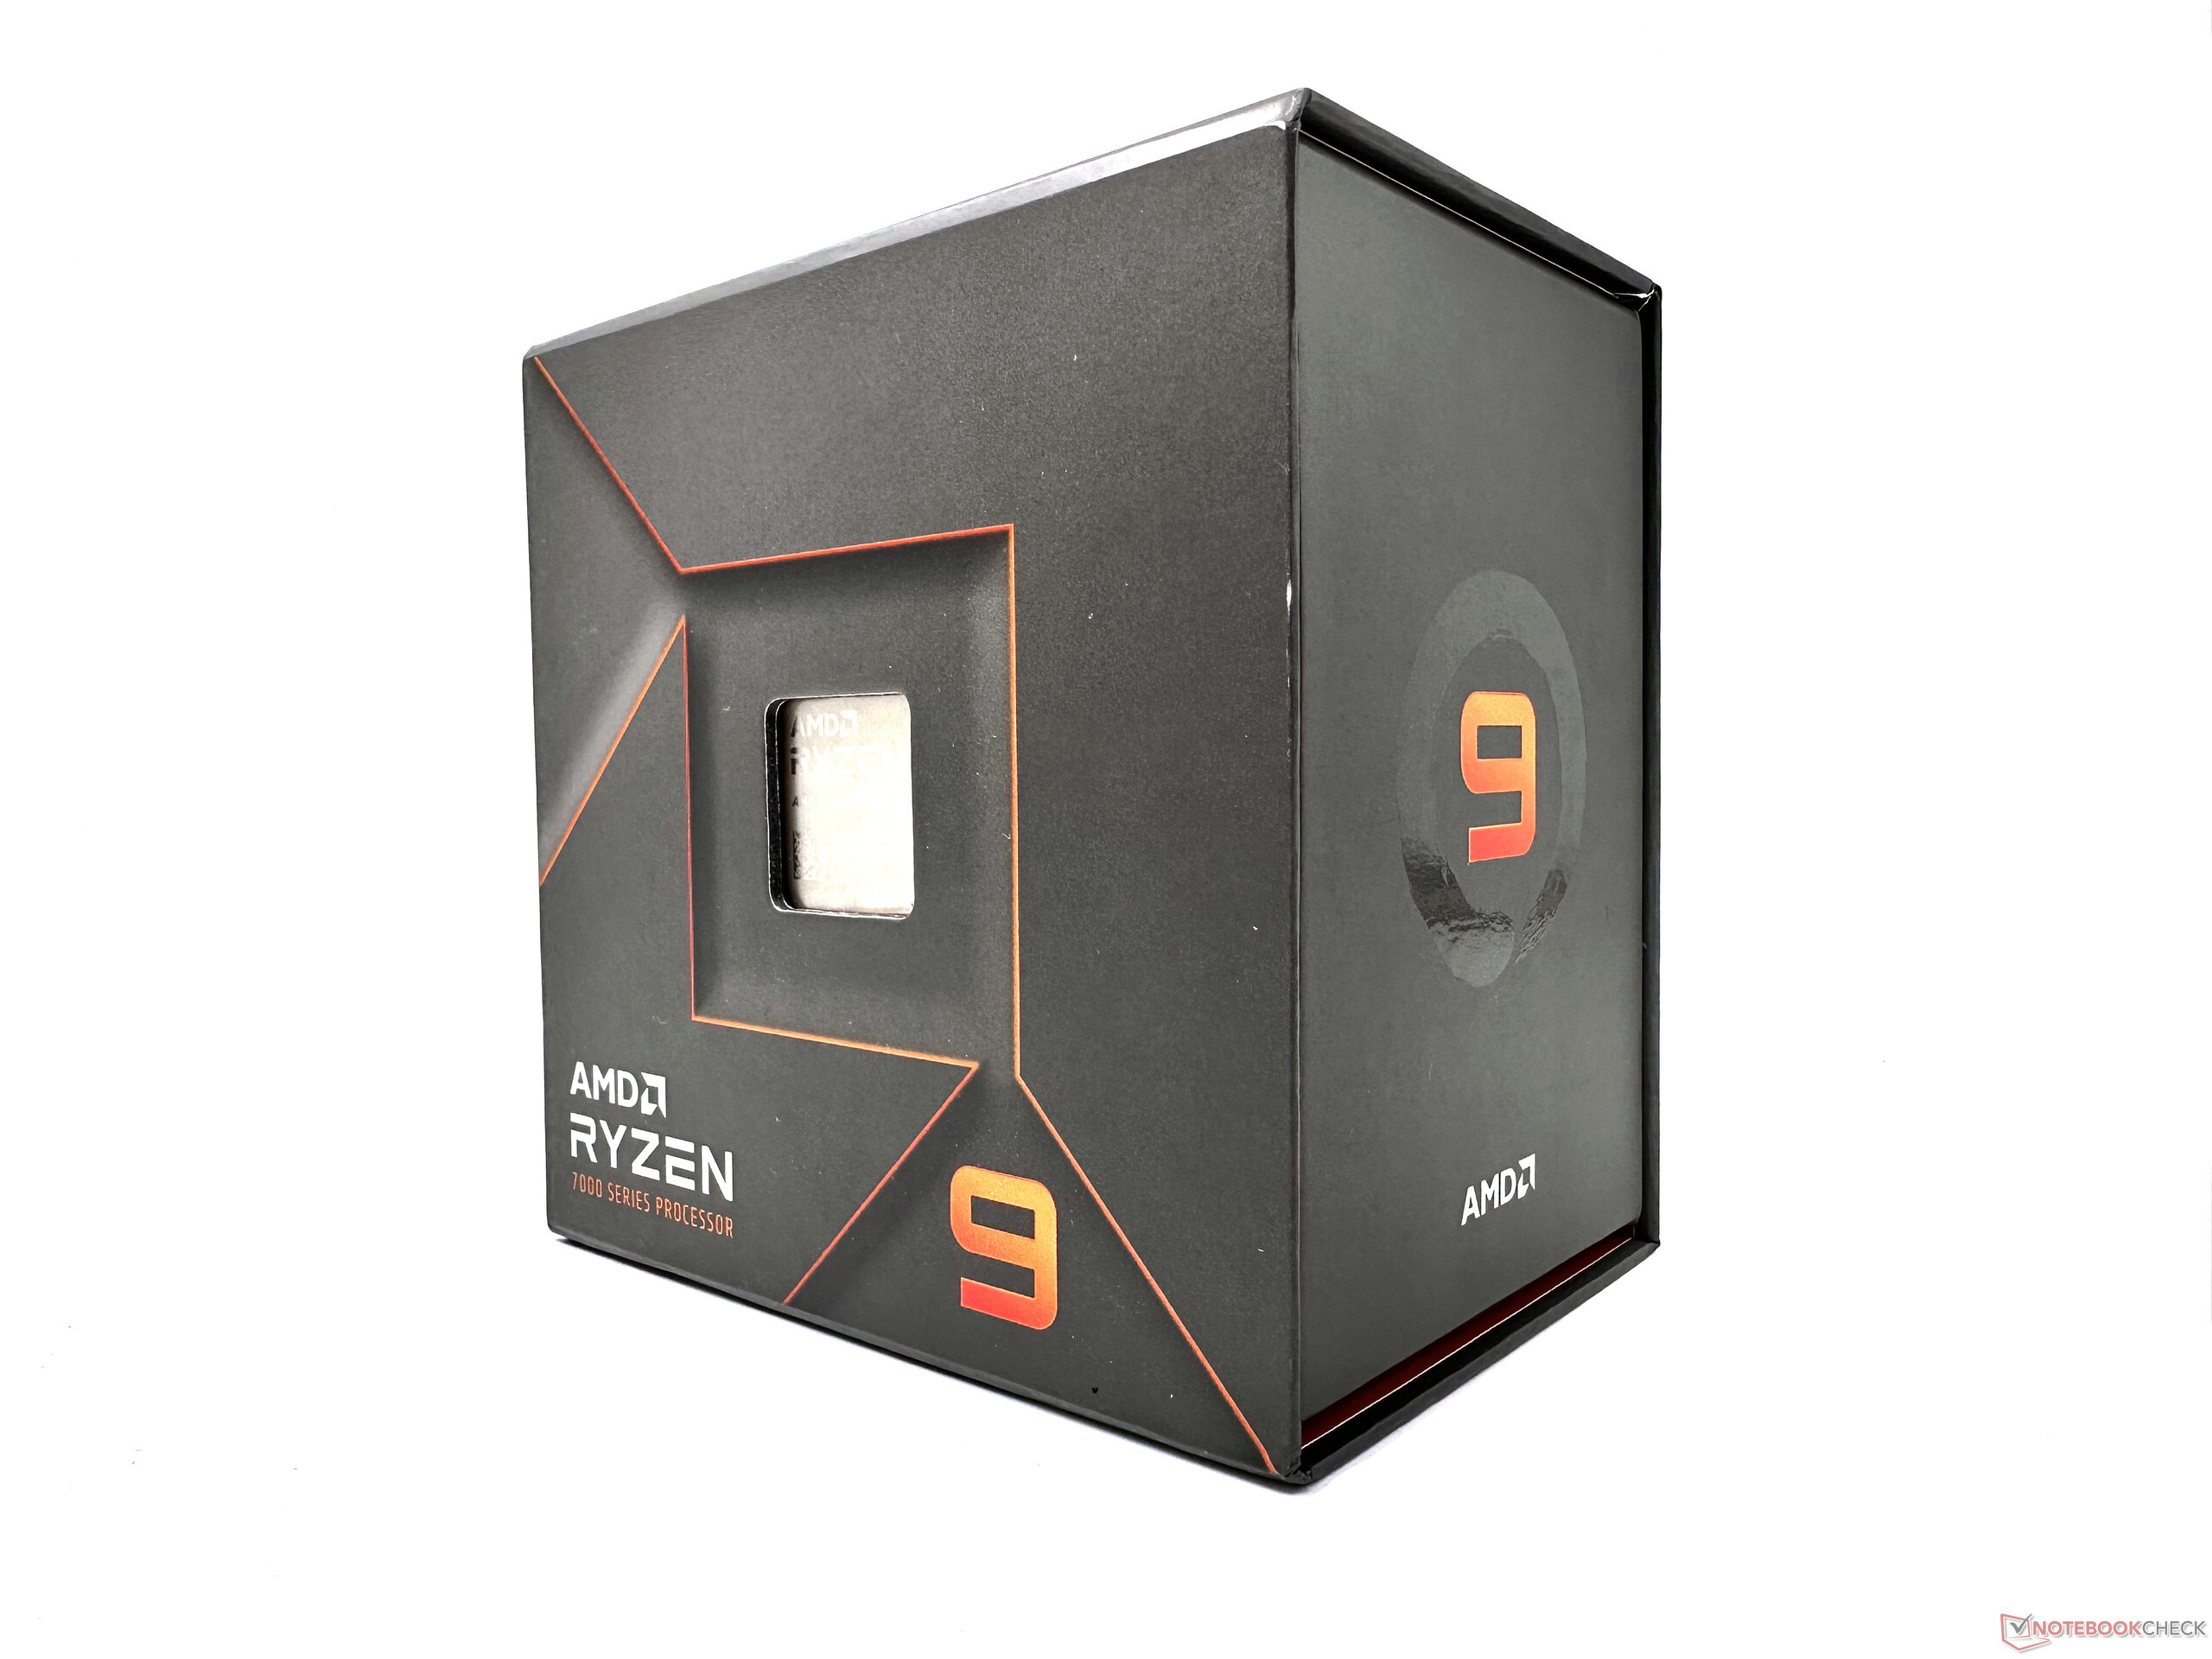
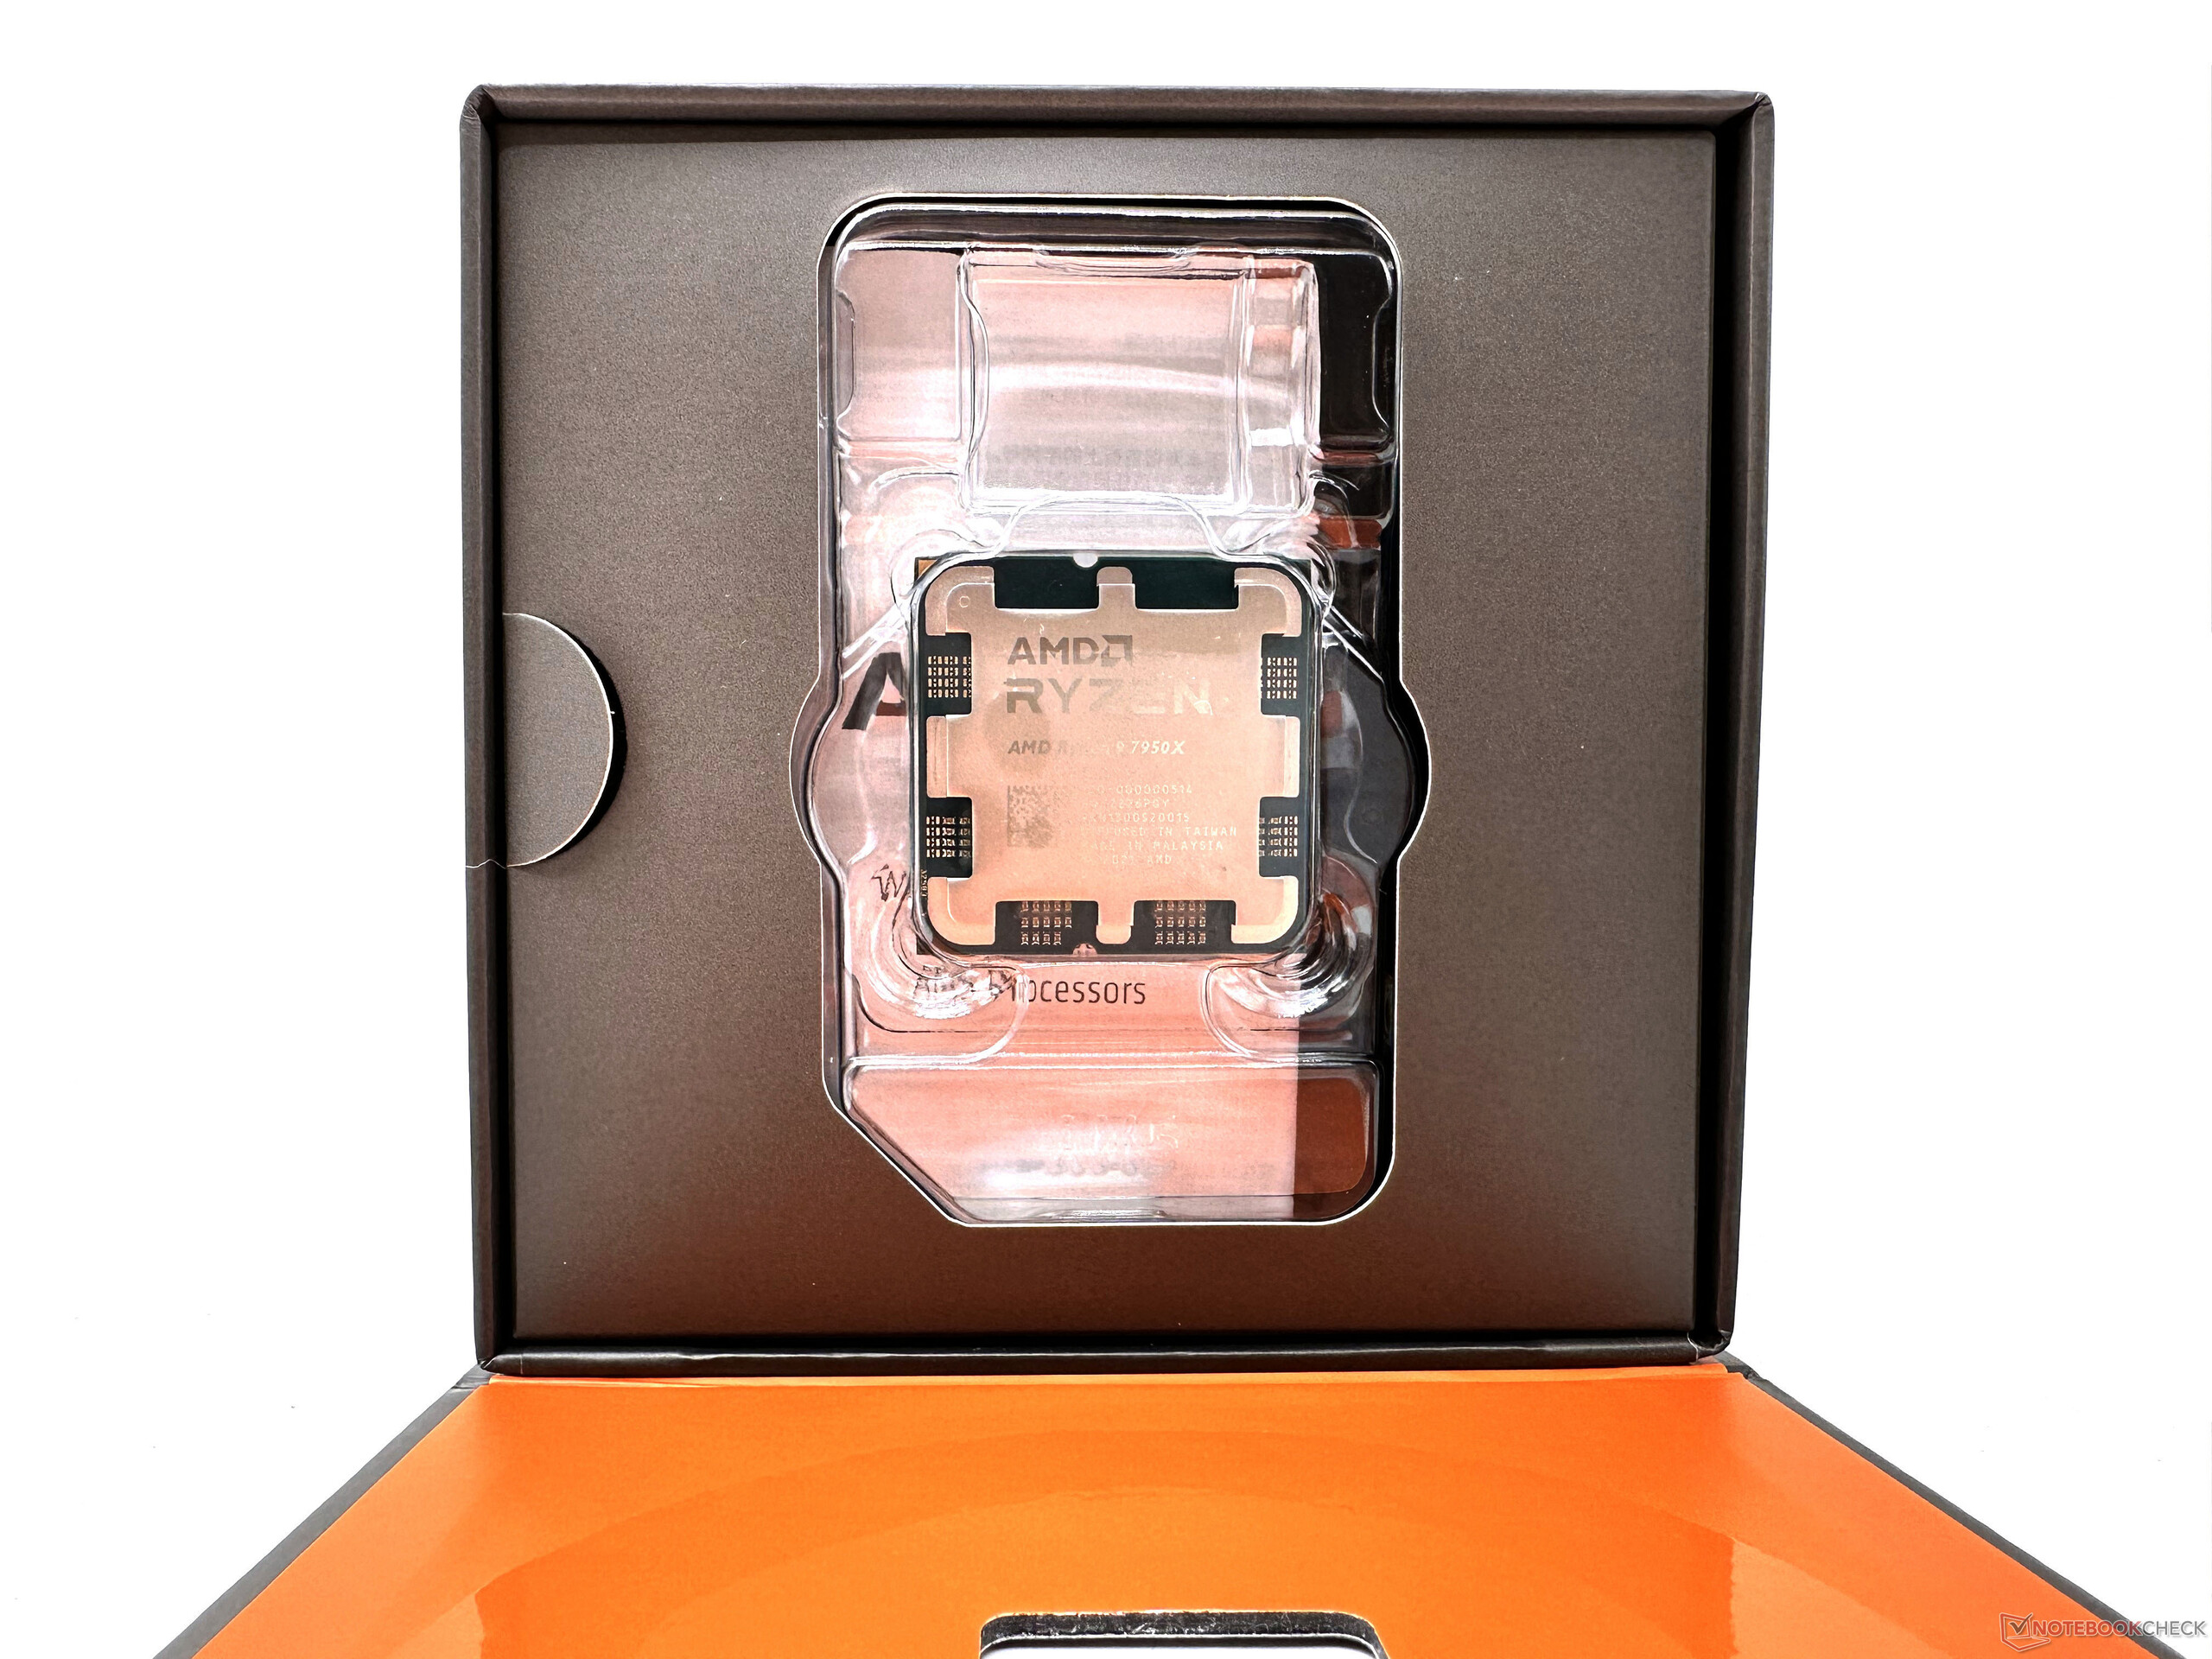
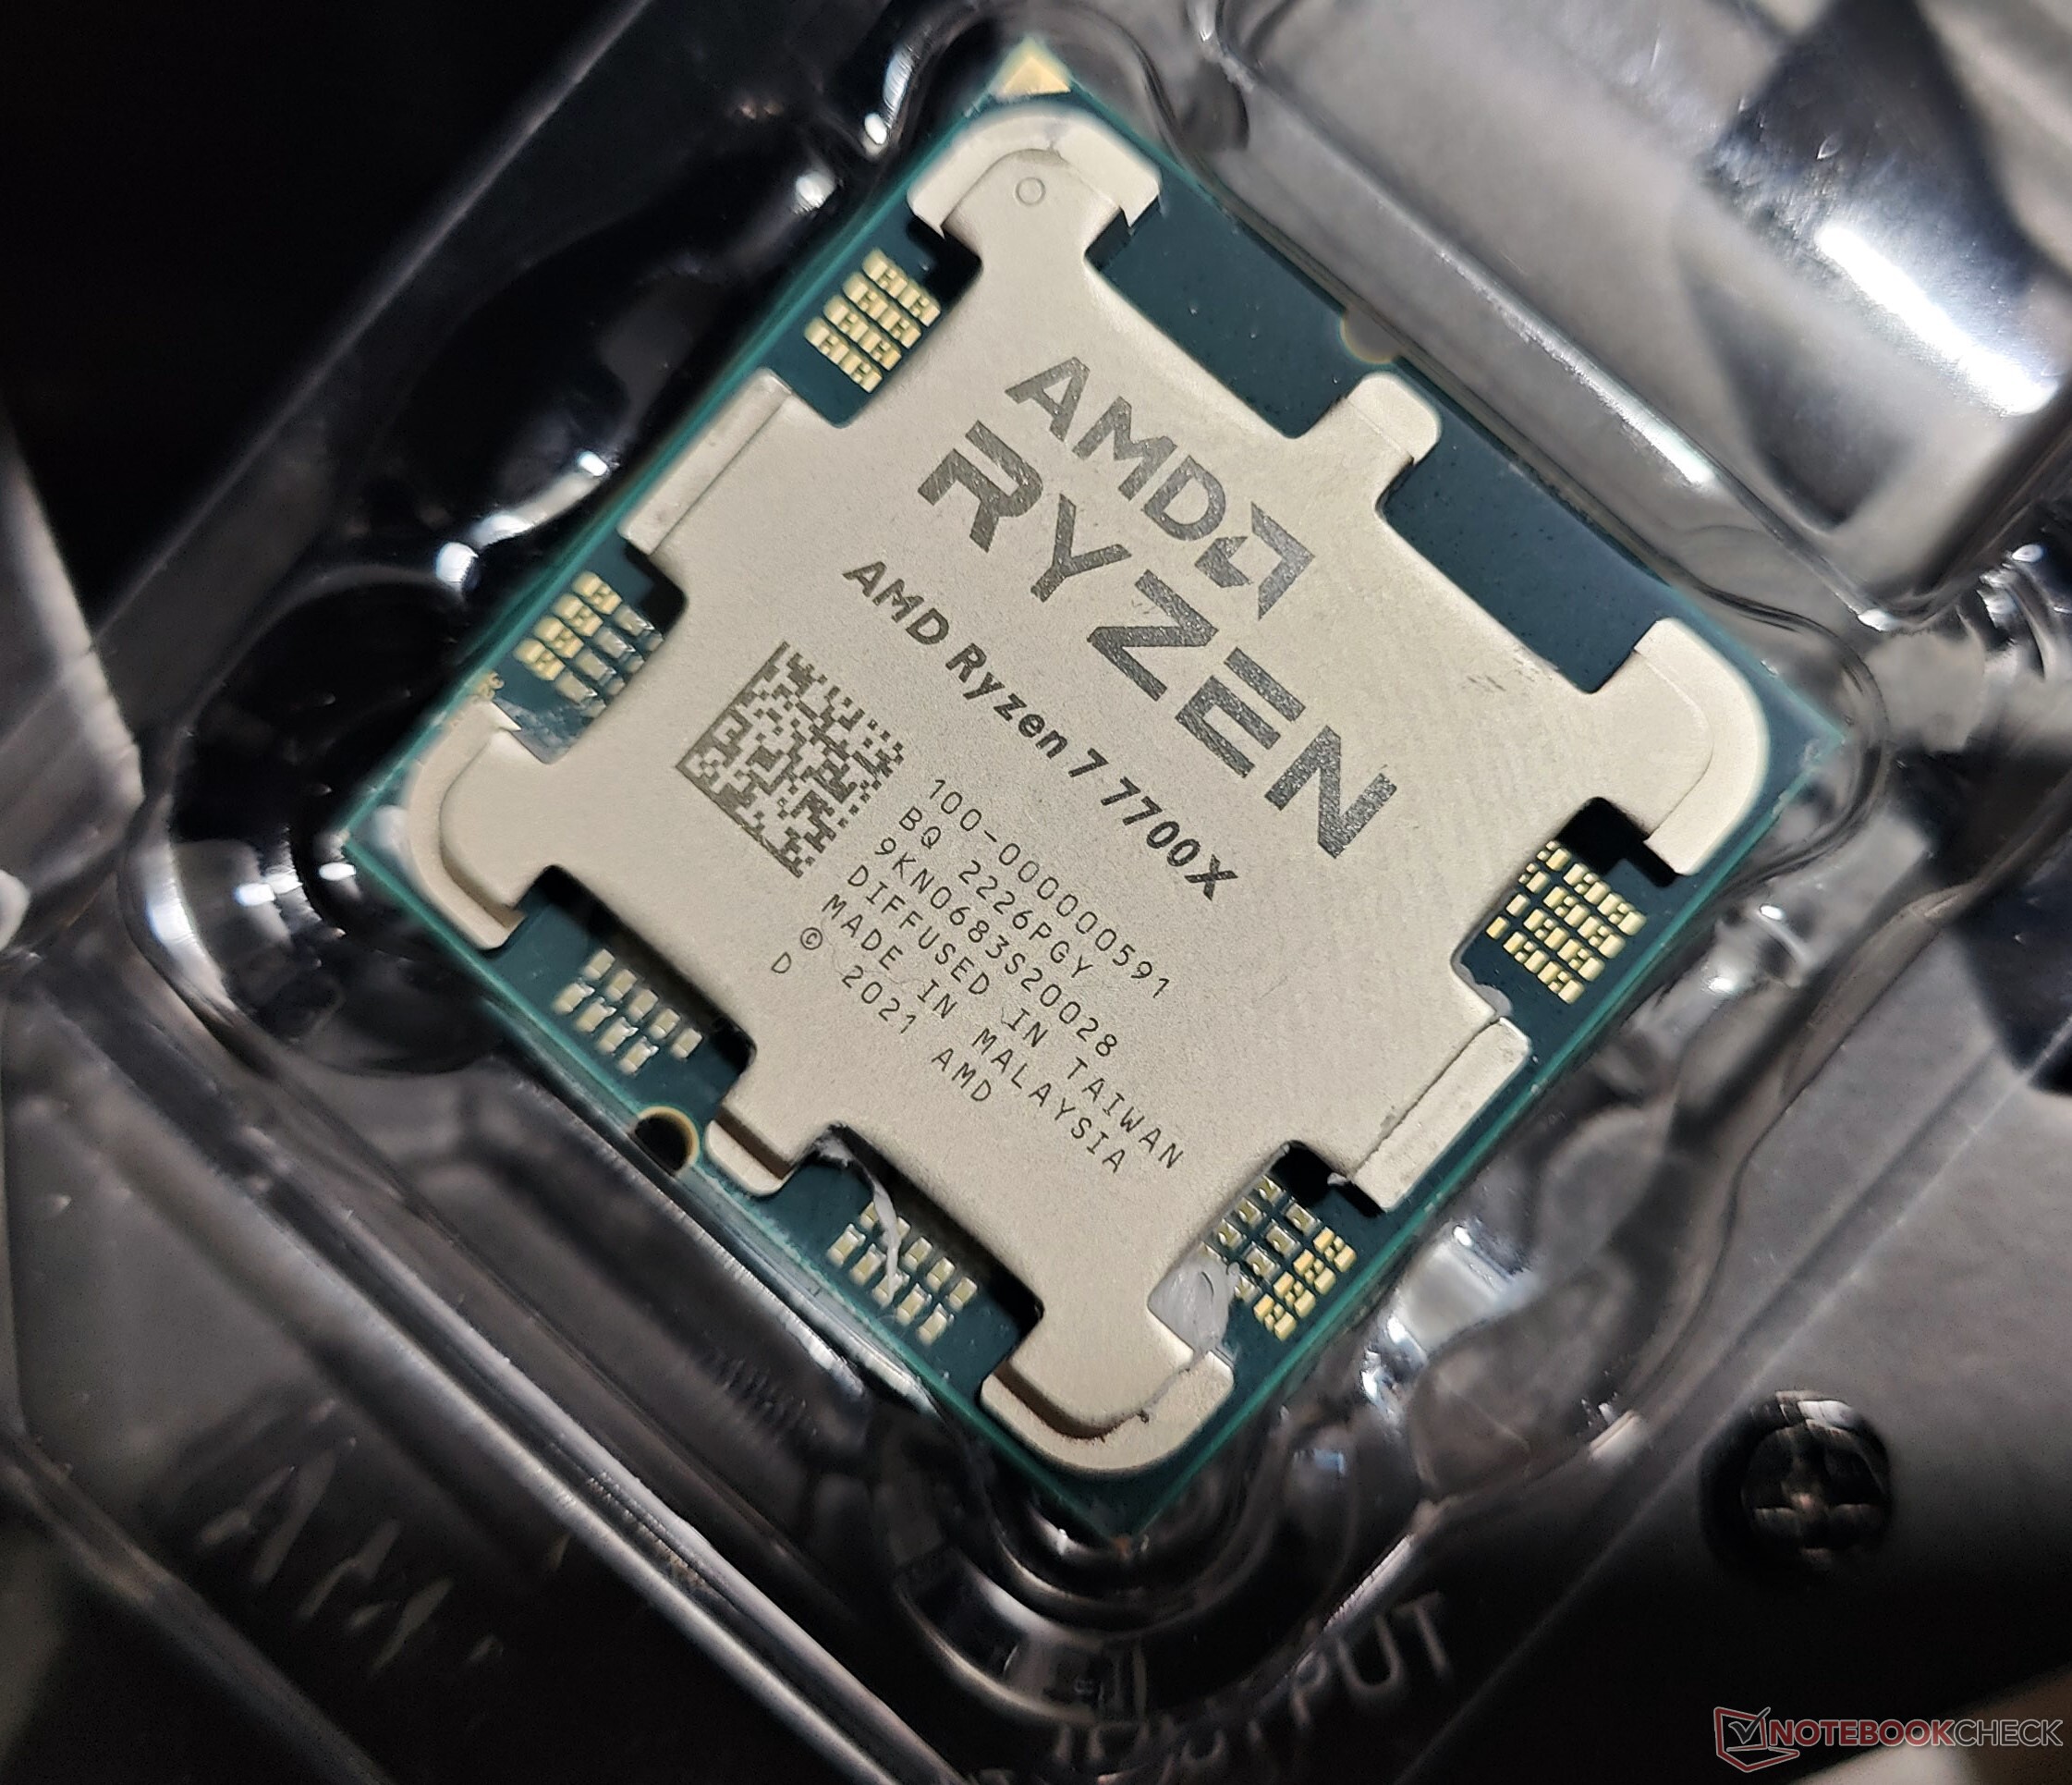
Test des AMD Ryzen 9 7950X et 7 7700X : performances et gains d'efficacité qui contrecarrent Raptor Lake
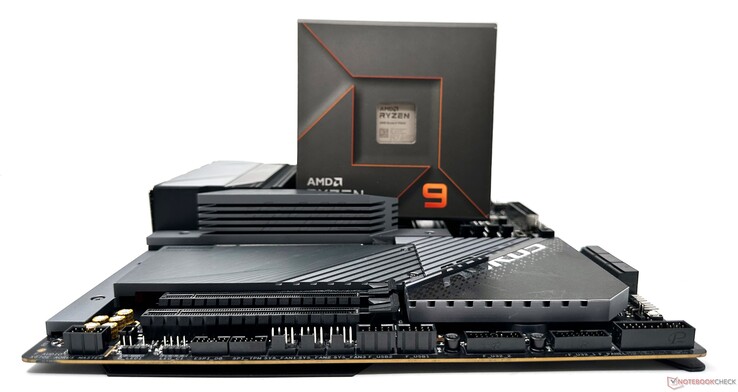
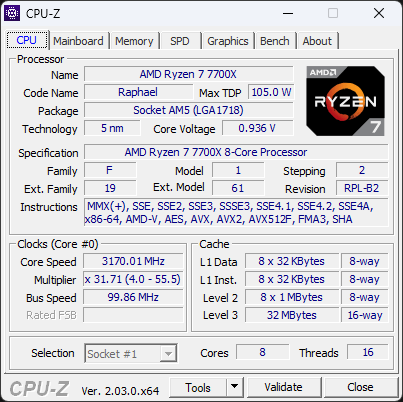
Après avoir conservé la plateforme AM4 pendant plus d'une demi-décennie, Zen 4 marque le premier changement de génération d'AMD vers une nouvelle ère de l'informatique PC. La gamme Raphael Zen 4, qui compte quatre UGS à ce jour, apporte avec elle un support natif des technologies DDR5 et PCIe Gen 5. En outre, les processeurs Zen 4 sont dotés du support des instructions AVX-512, d'un iGPU RDNA 2 intégré et de la promesse de gains IPC et d'efficacité énergétique accrus.
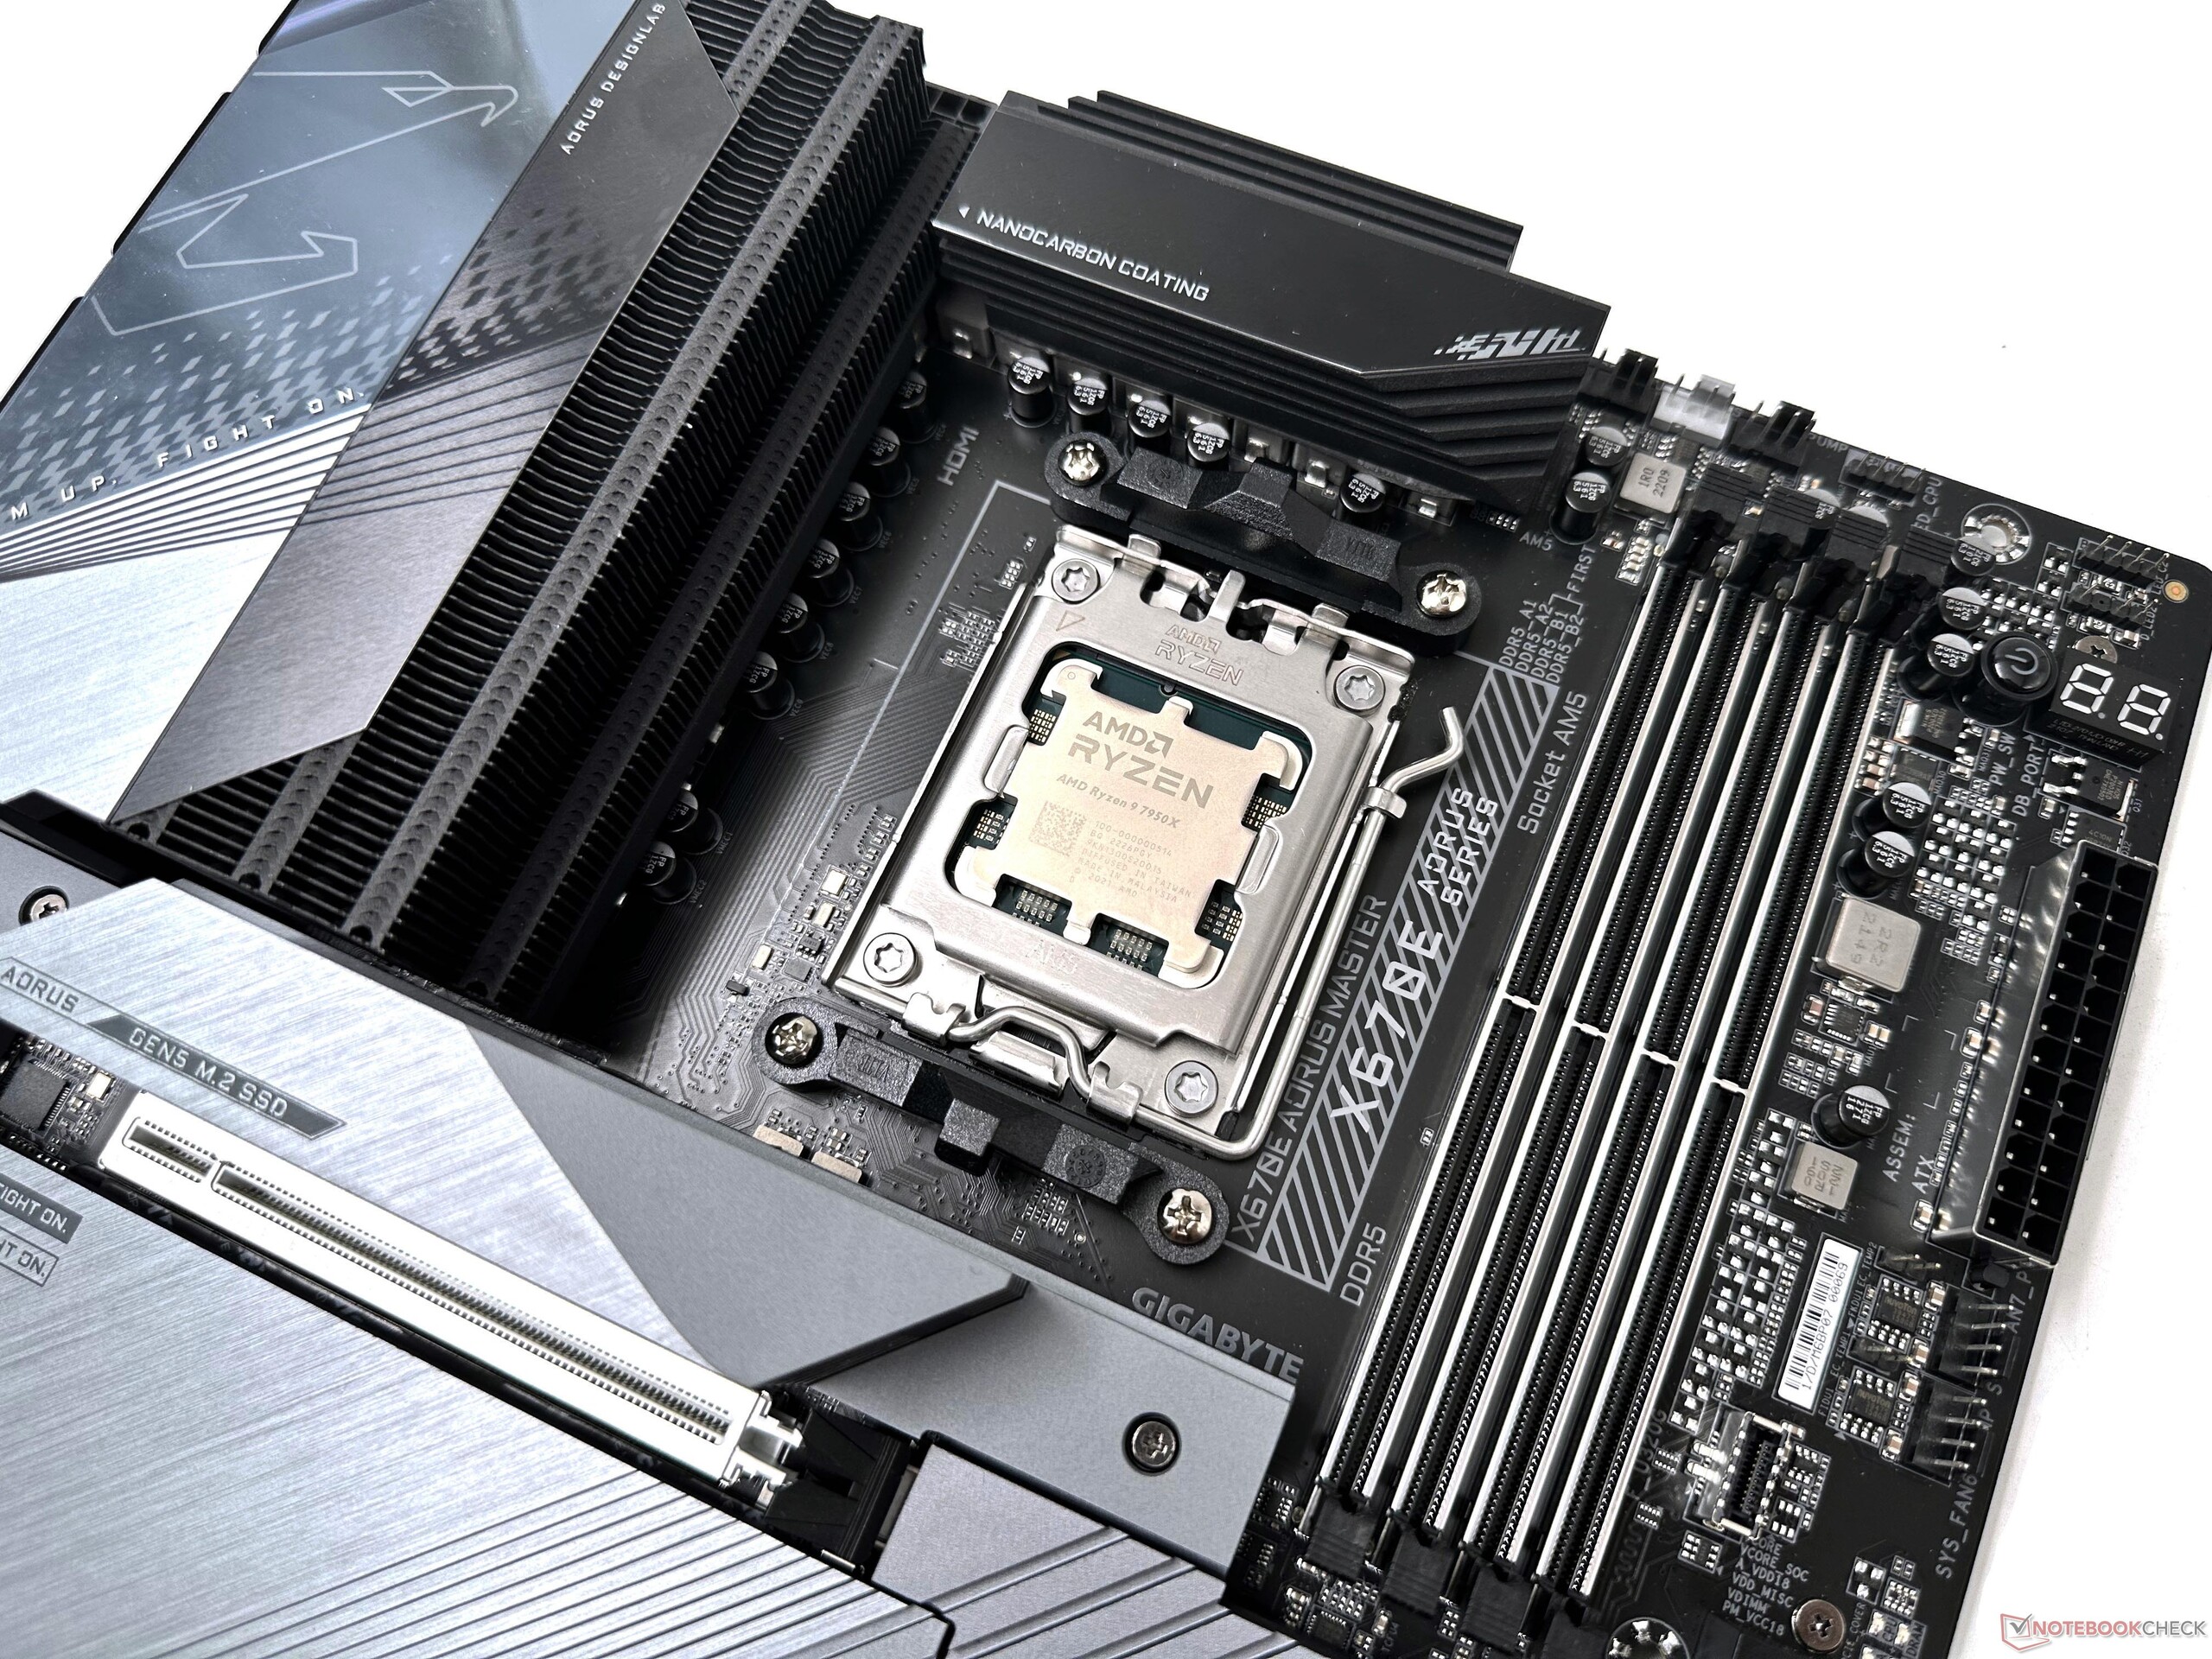
Les séries Zen 4 Ryzen 7000 nécessitent de nouvelles cartes mères basées sur le socket AM5les cartes phares X670E comportent même des chipsets Dual-PROM21 en chaîne. Le nouveau socket LGA 1718 permet d'augmenter les limites de puissance jusqu'à 230 W TDP, ce qui peut accueillir des CPU jusqu'à 170 W TDP.
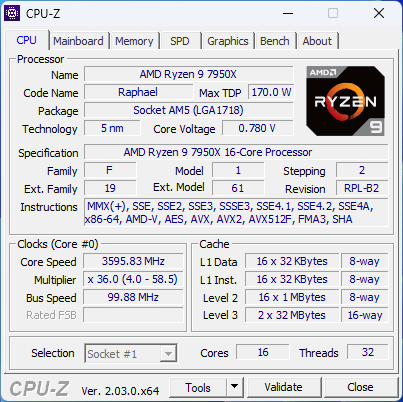
Les matrices complexes de base (CCD) du Zen 4 sont fabriquées sur le nœud TSMC 5 nm, tandis que la matrice E/S, qui abrite l'iGPU 2-CU RDNA 2, les voies PCIe Gen 5 et le contrôleur mémoire DDR5, utilise le TSMC 6 nm. Contrairement à Intel Raptor Lakequi prend en charge les mémoires DDR4 et DDR5, l'AM5 ne prend en charge que la mémoire DDR5
Bien que cela apporte plusieurs avantages techniques, il y a un hic à court terme pour le consommateur puisque les prix de la DDR5 restent plus élevés que ceux de la DDR4
Avec l'AM4, les utilisateurs devaient configurer le fabric, le contrôleur de mémoire et les horloges de mémoire pour qu'ils fonctionnent dans un rapport 1:1:1, ce qui signifie que la RAM DDR4-3600 était le point idéal pour Ryzen 5000. Dans Ryzen 7000, l'horloge de la matrice peut être réglée sur Auto tandis que le contrôleur de mémoire et les horloges de mémoire peuvent fonctionner dans un rapport 1:1
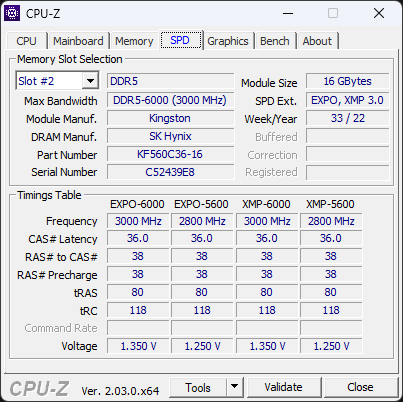
AMD recommande la RAM DDR5-6000 pour Ryzen 7000. Les utilisateurs peuvent choisir parmi des profils EXPO prédéterminés, ce qui est en fait la façon libre de droits d'AMD de définir l'OC de la mémoire en un clic, similaire à bien des égards au XMP d'Intel. Notre plateforme de test a pris un temps inhabituellement long pour s'adapter aux nouveaux profils EXPO, mais les nouvelles mises à jour du BIOS devraient permettre des changements plus rapides.
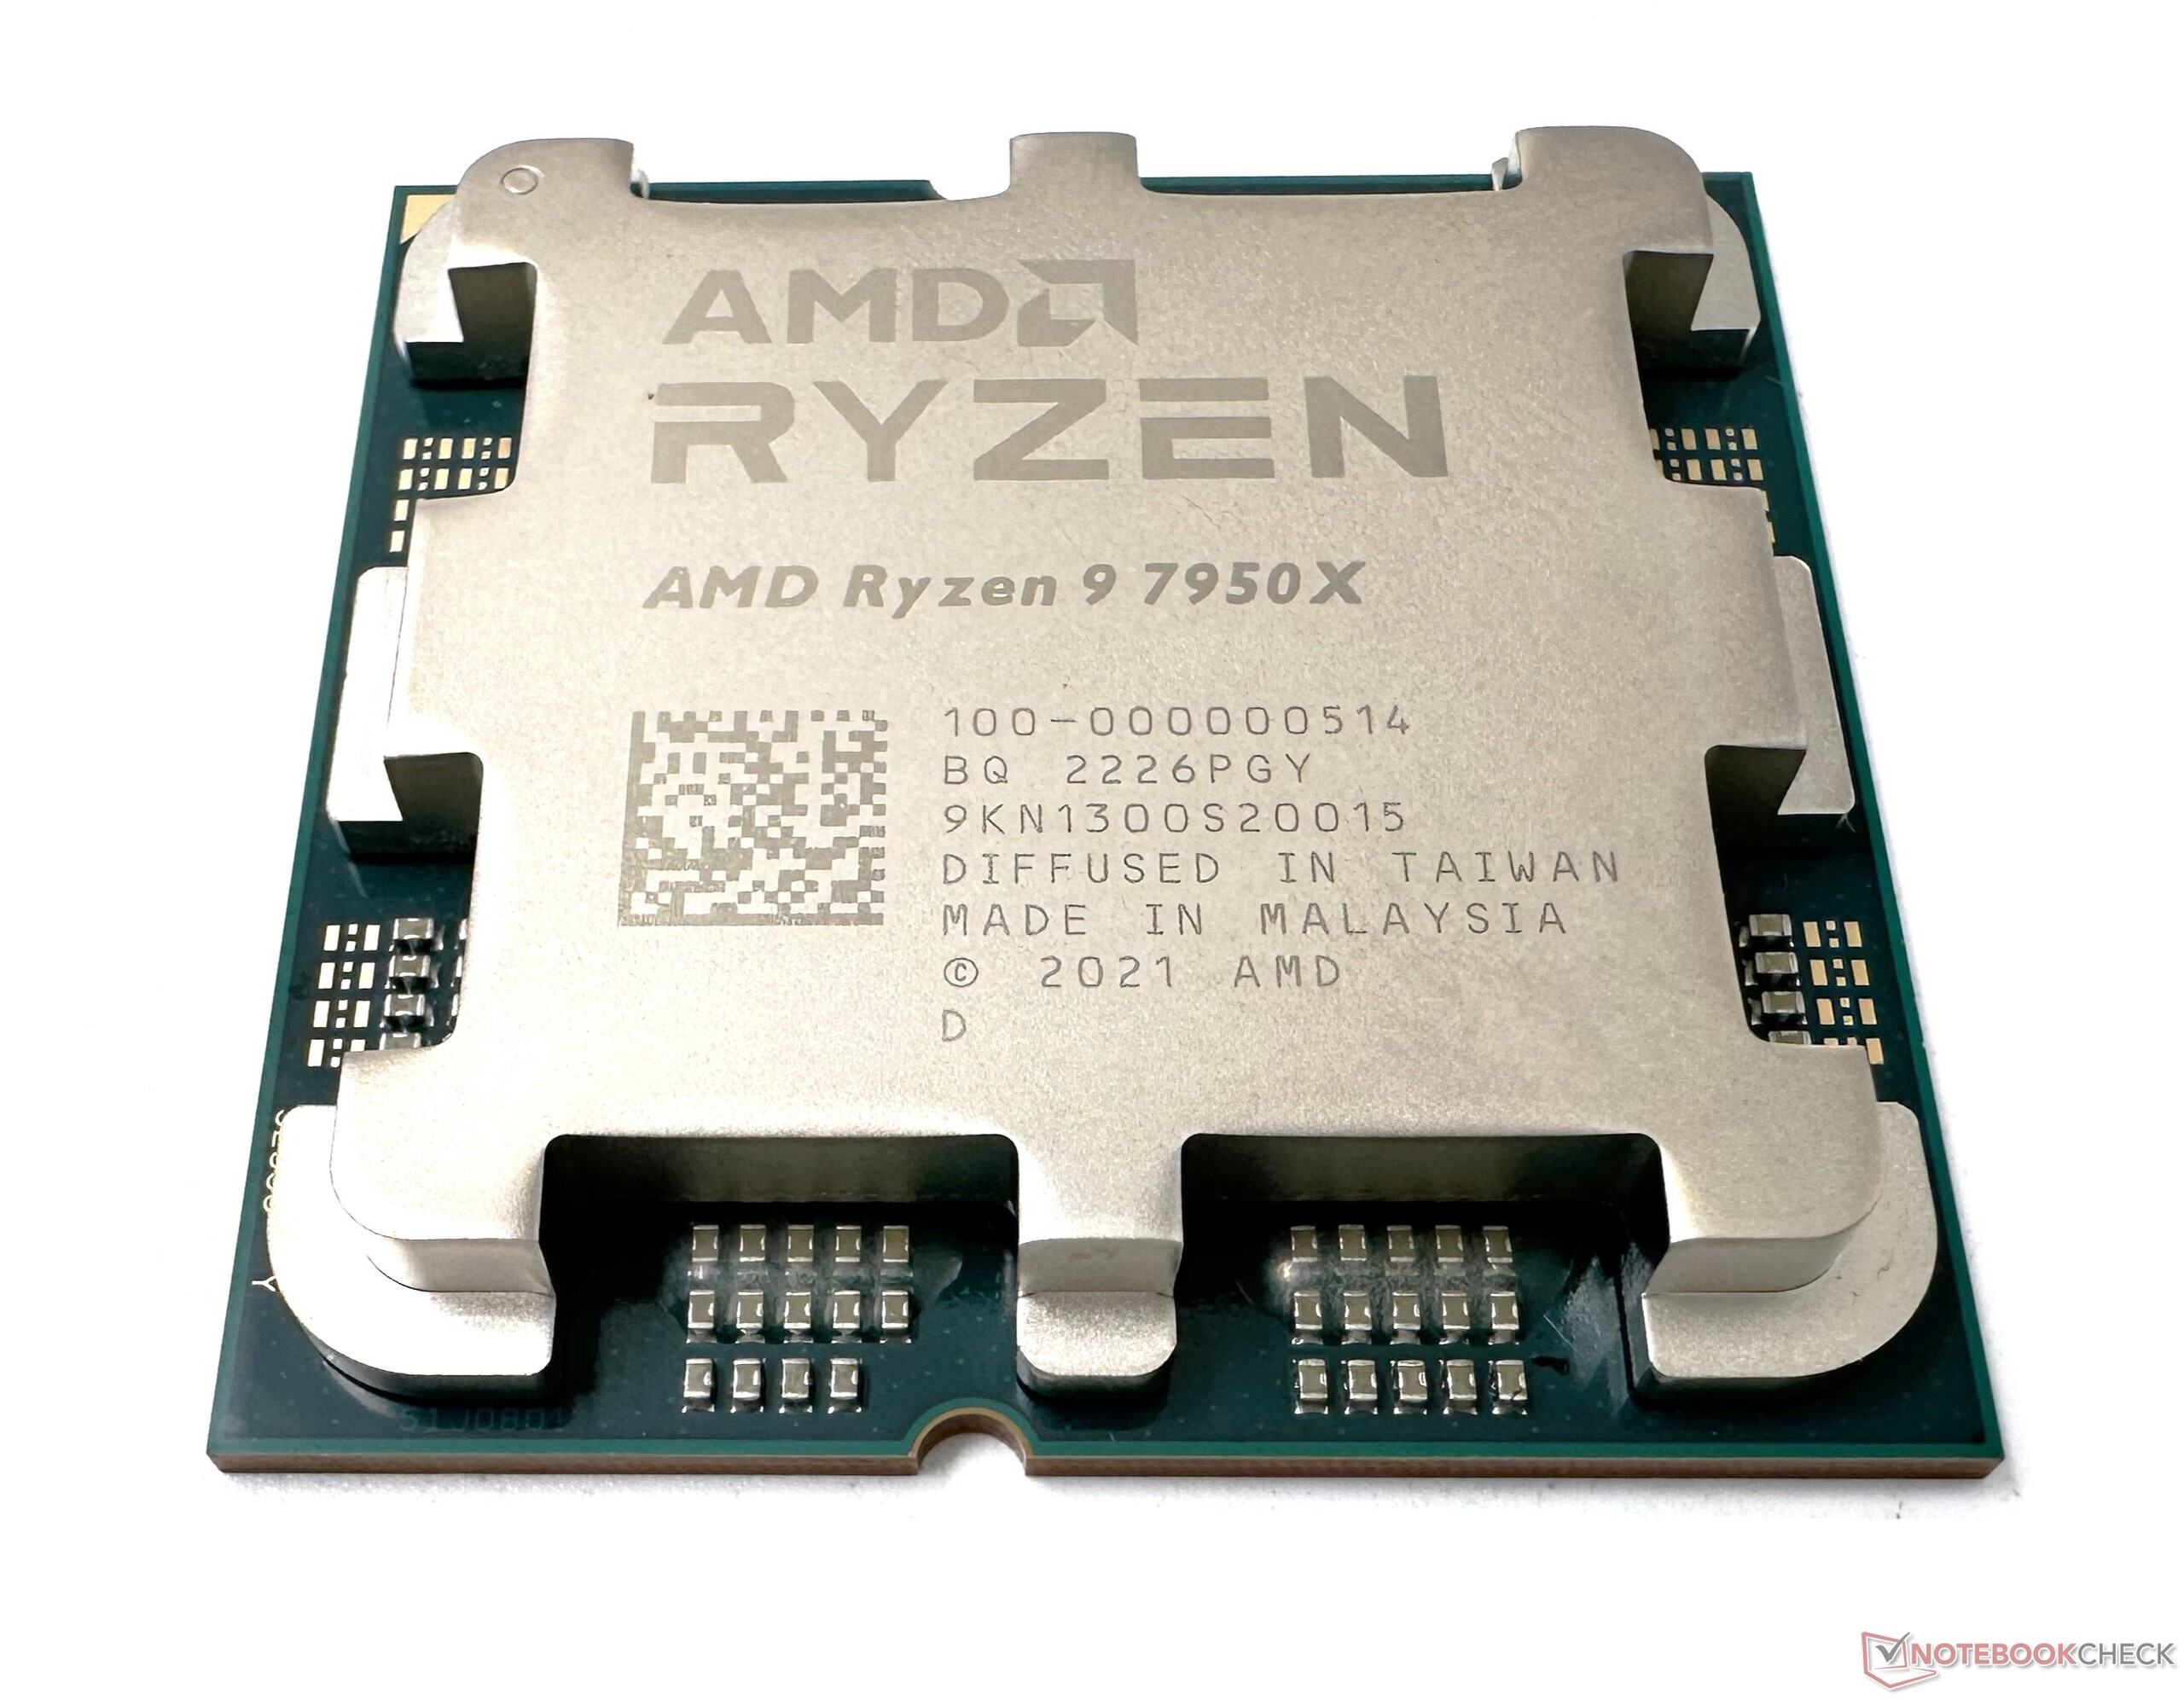
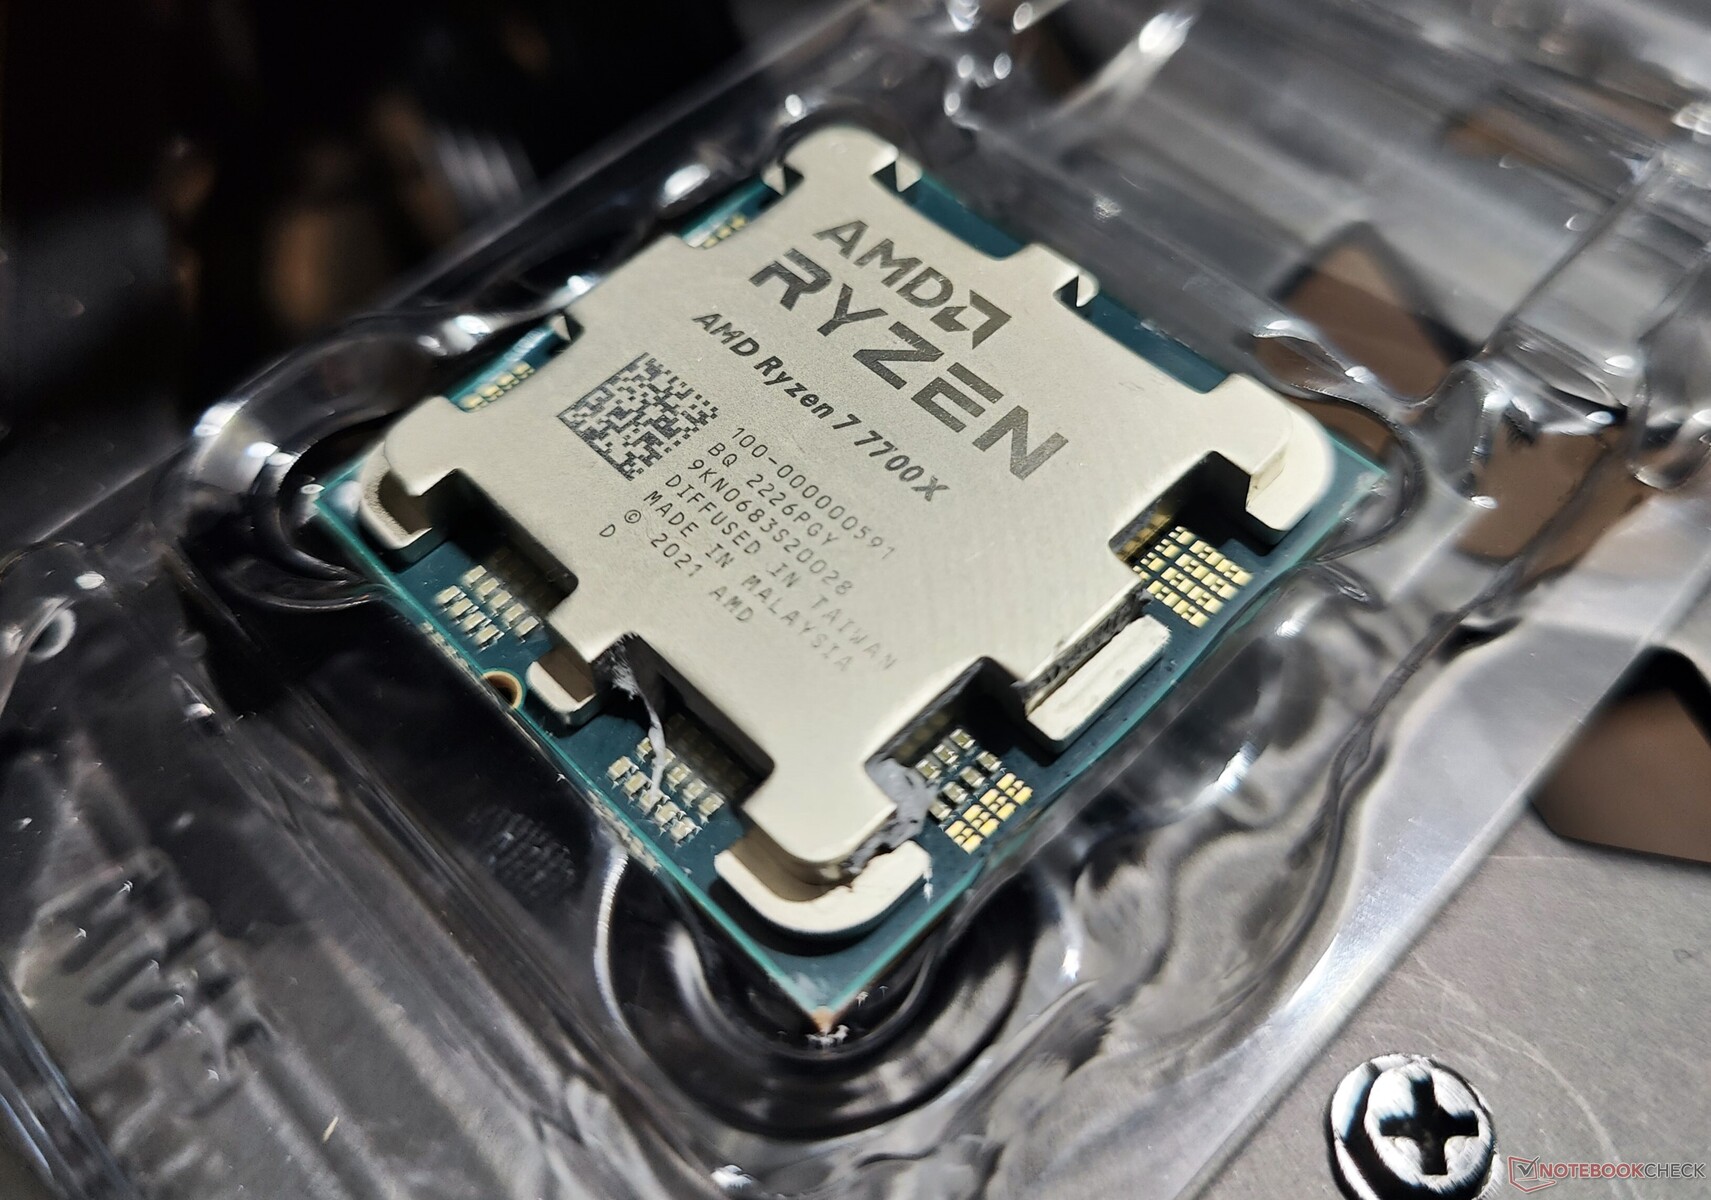
Nous avons précédemment examiné le AMD Ryzen 9 7900X et le Ryzen 5 7600X et nous sommes sortis assez impressionnés par ce qui est offert. Dans cette revue, nous complétons l'actuelle pile Zen 4 Ryzen 7000 en testant le Ryzen 9 7950X et le Ryzen 7 7700X en détail. Maintenant que la gamme Raptor Lake d'Intel est également disponible, les comparaisons deviennent encore plus intéressantes.
Un aperçu des processeurs de bureau Zen 4 Ryzen 7000 d'AMD "Raphael"
| SKU | Cœurs/Treads | Horloge de base | Turbo Clock | Cache L2 | Cache L3 | TDP | PPT | Prix de lancement |
|---|---|---|---|---|---|---|---|---|
| Ryzen 9 7950X | 16/32 | 4,5 GHz | 5,7 GHz | 16x 1 Mo | 64 Mo | 170 W | 230 W | US$699 / €849 |
| Ryzen 9 7900X | 12/24 | 4,7 GHz | 5,6 GHz | 12x 1 Mo | 64 Mo | 170 W | 230 W | US$549 / €669 |
| Ryzen 7 7700X | 8/16 | 4,5 GHz | 5,4 GHz | 8x 1 Mo | 32 Mo | 105 W | 142 W | US$399 / €479 |
| Ryzen 5 7600X | 6/12 | 4,7 GHz | 5,3 GHz | 6x 1 Mo | 32 Mo | 105 W | 142 W | US$299 / €359 |
Le banc d'essai : Le Zen 4 est associé à la RTX 3090
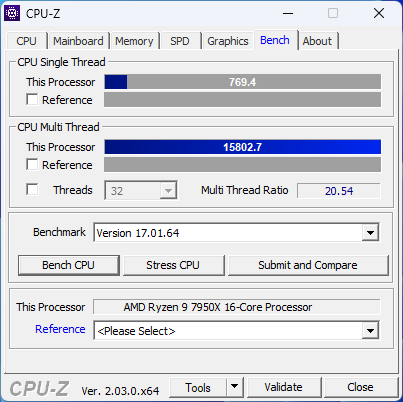
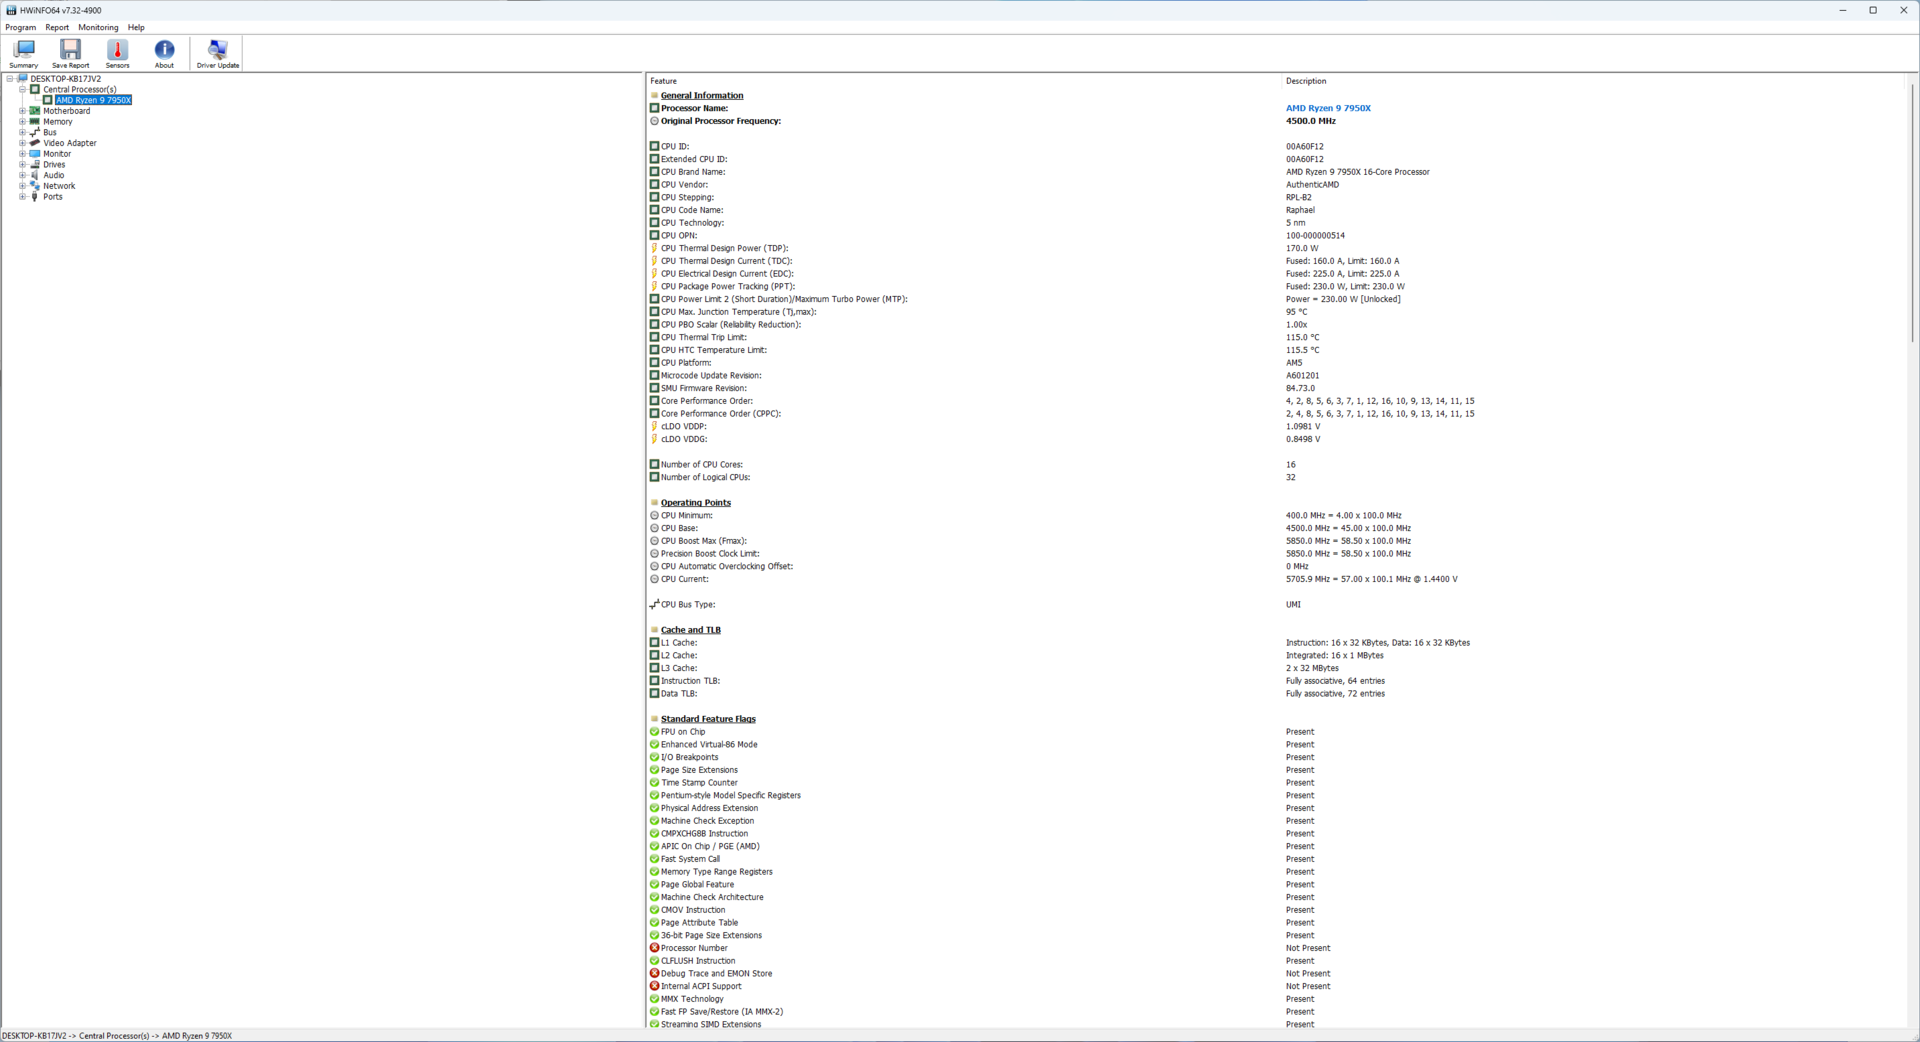
Nous avons utilisé les composants suivants pour tester le Ryzen 7 7700X et le Ryzen 9 7950X
- Banc de test Cooler Master MasterFrame 700
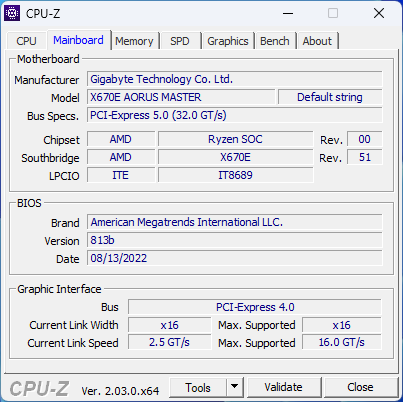
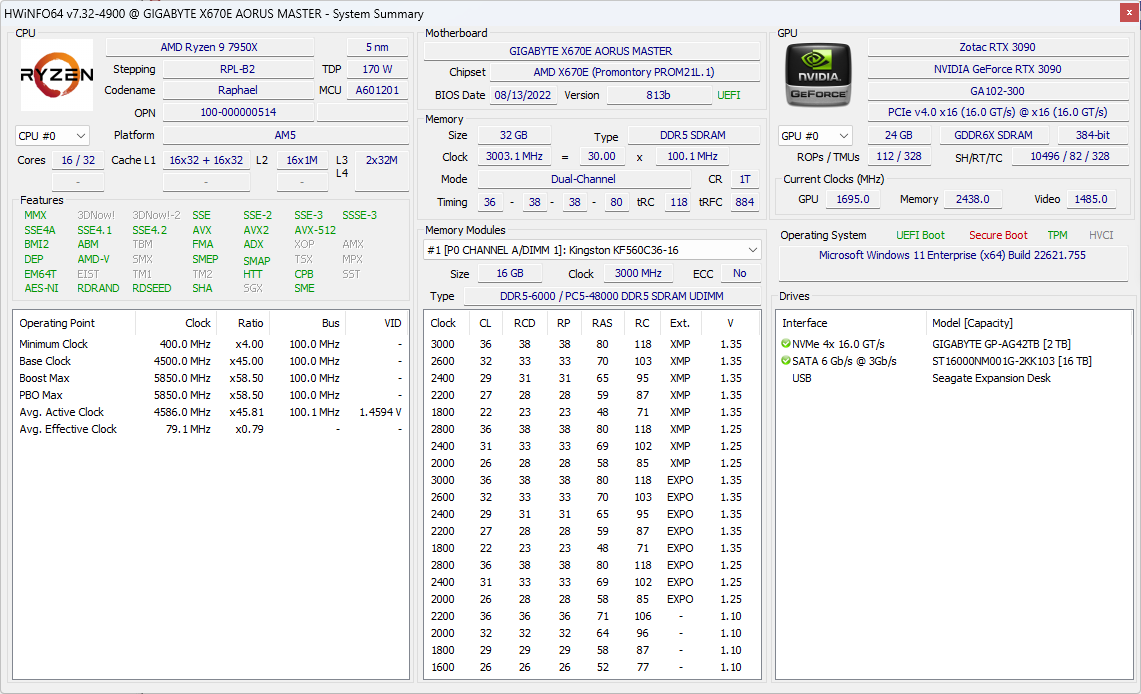
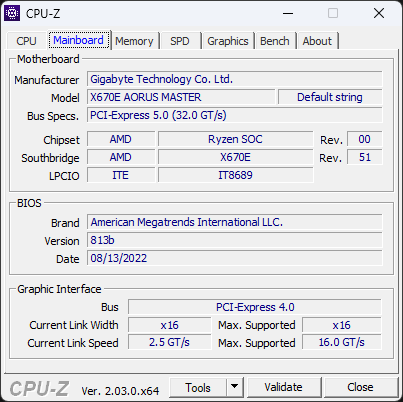
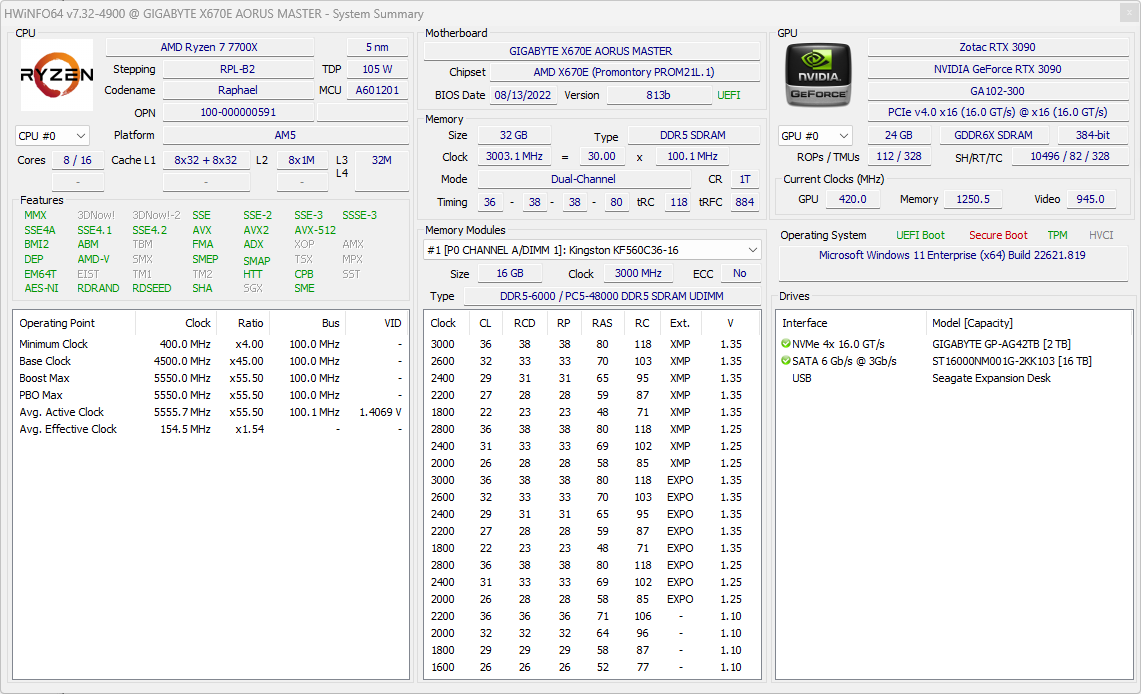
- Carte mère Gigabyte X670E Aorus Master avec BIOS de référence version 813b
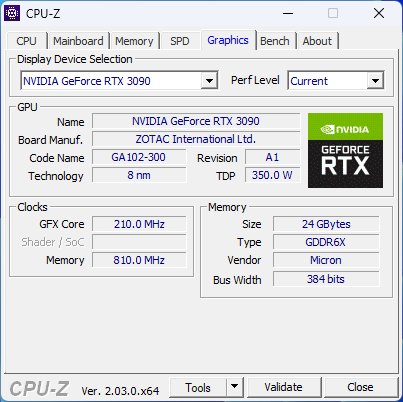
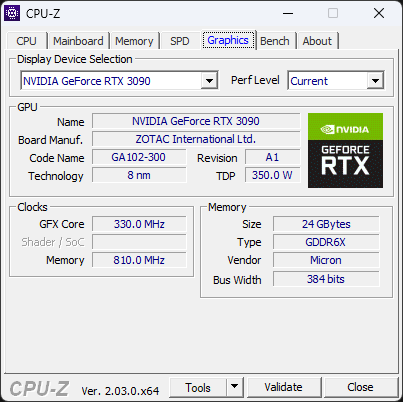
- Zotac Gaming GeForce RTX 3090 GPU Trinity
- Gigabyte Aorus Gen 4 2 TB NVMe SSD pour les benchmarks et les jeux
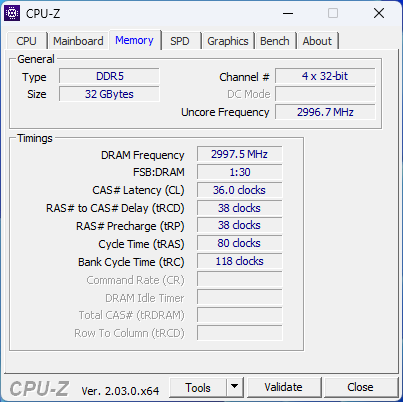
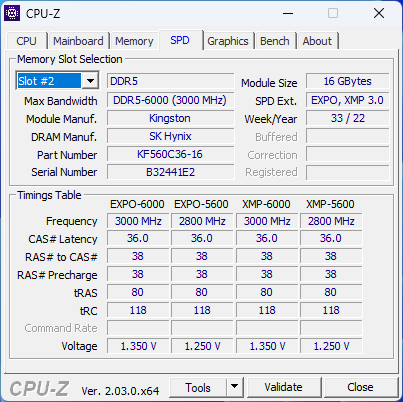
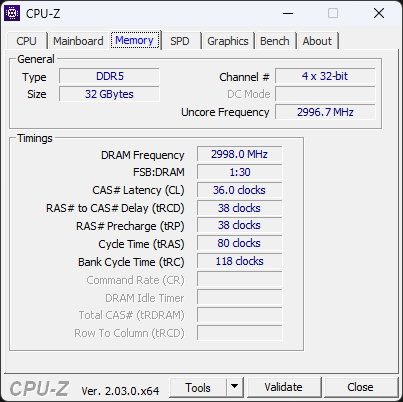
- 2x 16 GB Kingston Fury Beast DDR5-6000 RAM avec timings 36-38-38-80 à 1.35 V
- Moniteur Gigabyte M28U 4K 144 Hz
- Refroidisseur MasterLiquid ML360L V2 ARGB AIO de Cooler Master
- Bloc d'alimentation entièrement modulaire Cooler Master MVE Gold 1250 V2
Nous tenons à remercier AMD pour la fourniture des processeurs Ryzen 7 7700X et Ryzen 9 7950X, de la carte mère X670E Aorus Master et du kit mémoire Kingston DDR5. Nous tenons également à remercier Zotac pour le GPU RTX 3090 Trinity, Gigabyte pour le moniteur M28U et le SSD NVMe Aorus, et enfin Cooler Master pour le banc de test, le refroidisseur AIO et l'alimentation.
Bancs d'essai des processeurs : Une concurrence acharnée avec Raptor Lake
Alors que les scores cumulés montrent que les fleurons d'Intel et d'AMD sont à égalité, les benchmarks individuels montrent quelques différences. Par exemple, le Ryzen 9 7950X est environ 11% plus lent dans Cinebench R23 single-core par rapport au Core i9-13900K.
AMD Ryzen 9 7950X
Le delta entre le Ryzen 9 7950X et le Core i9-13900K n'est pas très significatif dans les tests Cinebench R20, Cinebench R15 et Geekbench single-core.
Le Ryzen 9 7950X a une avance de 20% sur le Core i9-13900K dans TrueCrypt et est capable de battre le fleuron de Raptor Lake d'un cheveu dans HWBOT x264 4K et 7-Zip multi. Dans la plupart des autres cas, les performances du Ryzen 9 7950X et du Core i9-13900K sont pratiquement identiques.
Le Core i9-13900K semble avoir un très léger avantage dans les exécutions multicœurs, mais les résultats globaux sont conformes à ce que nous considérons comme des variations d'une exécution à l'autre
AMD Ryzen 7 7700X
Il est intéressant de noter que le Ryzen 7 7700X 8C/16T a pu prendre l'avantage sur le Core i5-13600K 14C/20T Intel Core i5-13600K Processor - Benchmarks and Specs dans les scores cumulés de tous les tests. Si le Core i5-13600K et le Ryzen 7 7700X affichent des performances quasi identiques en mode monocœur, le premier a une avance de 24 % dans les tests multicœurs de Cinebench
Les processeurs Ryzen 7000 en général semblent avoir de meilleures performances que leurs homologues d'Intel dans le test 7-Zip à un seul cœur, le Ryzen 7 7700X devançant le Core i5-13600K de 23 %. Le Ryzen 7 7700X a également pris le moins de temps parmi tous les processeurs comparés dans notre benchmark LibreOffice de conversion de 20 documents PDF.
| Performance rating - Percent | |
| AMD Ryzen 9 7950X | |
| Intel Core i9-13900K | |
| AMD Ryzen 9 7900X | |
| AMD Ryzen 9 5950X | |
| AMD Ryzen 7 7700X | |
| Intel Core i5-13600K | |
| Intel Core i9-12900K | |
| AMD Ryzen 9 5900X -2! | |
| AMD Ryzen 5 7600X | |
| AMD Ryzen 7 5800X | |
| Intel Core i5-12600K | |
| AMD Ryzen 7 5800X3D | |
| AMD Ryzen 5 5600X | |
| Cinebench R23 | |
| Single Core | |
| Intel Core i9-13900K | |
| AMD Ryzen 9 7900X | |
| AMD Ryzen 9 7950X | |
| Intel Core i5-13600K | |
| Intel Core i9-12900K | |
| AMD Ryzen 7 7700X | |
| AMD Ryzen 5 7600X | |
| Intel Core i5-12600K | |
| AMD Ryzen 9 5950X | |
| AMD Ryzen 9 5900X | |
| AMD Ryzen 7 5800X | |
| AMD Ryzen 5 5600X | |
| AMD Ryzen 7 5800X3D | |
| Multi Core | |
| Intel Core i9-13900K | |
| AMD Ryzen 9 7950X | |
| AMD Ryzen 9 7900X | |
| AMD Ryzen 9 5950X | |
| Intel Core i9-12900K | |
| Intel Core i5-13600K | |
| AMD Ryzen 9 5900X | |
| AMD Ryzen 7 7700X | |
| Intel Core i5-12600K | |
| AMD Ryzen 5 7600X | |
| AMD Ryzen 7 5800X | |
| AMD Ryzen 7 5800X3D | |
| AMD Ryzen 5 5600X | |
| Cinebench R20 | |
| CPU (Single Core) | |
| Intel Core i9-13900K | |
| AMD Ryzen 9 7900X | |
| AMD Ryzen 9 7950X | |
| Intel Core i5-13600K | |
| AMD Ryzen 7 7700X | |
| Intel Core i9-12900K | |
| AMD Ryzen 5 7600X | |
| Intel Core i5-12600K | |
| AMD Ryzen 9 5950X | |
| AMD Ryzen 9 5900X | |
| AMD Ryzen 7 5800X | |
| AMD Ryzen 5 5600X | |
| AMD Ryzen 7 5800X3D | |
| CPU (Multi Core) | |
| Intel Core i9-13900K | |
| AMD Ryzen 9 7950X | |
| AMD Ryzen 9 7900X | |
| AMD Ryzen 9 5950X | |
| Intel Core i9-12900K | |
| Intel Core i5-13600K | |
| AMD Ryzen 9 5900X | |
| AMD Ryzen 7 7700X | |
| Intel Core i5-12600K | |
| AMD Ryzen 7 5800X | |
| AMD Ryzen 5 7600X | |
| AMD Ryzen 7 5800X3D | |
| AMD Ryzen 5 5600X | |
| Cinebench R15 | |
| CPU Single 64Bit | |
| Intel Core i9-13900K | |
| AMD Ryzen 9 7900X | |
| AMD Ryzen 9 7950X | |
| AMD Ryzen 5 7600X | |
| AMD Ryzen 7 7700X | |
| Intel Core i5-13600K | |
| Intel Core i9-12900K | |
| Intel Core i5-12600K | |
| AMD Ryzen 9 5950X | |
| AMD Ryzen 9 5900X | |
| AMD Ryzen 7 5800X | |
| AMD Ryzen 5 5600X | |
| AMD Ryzen 7 5800X3D | |
| CPU Multi 64Bit | |
| AMD Ryzen 9 7950X | |
| Intel Core i9-13900K | |
| AMD Ryzen 9 7900X | |
| AMD Ryzen 9 5950X | |
| Intel Core i9-12900K | |
| AMD Ryzen 9 5900X | |
| Intel Core i5-13600K | |
| AMD Ryzen 7 7700X | |
| AMD Ryzen 7 5800X | |
| Intel Core i5-12600K | |
| AMD Ryzen 5 7600X | |
| AMD Ryzen 7 5800X3D | |
| AMD Ryzen 5 5600X | |
| Blender - v2.79 BMW27 CPU | |
| AMD Ryzen 5 5600X | |
| AMD Ryzen 7 5800X3D | |
| AMD Ryzen 5 7600X | |
| AMD Ryzen 7 5800X | |
| Intel Core i5-12600K | |
| AMD Ryzen 7 7700X | |
| AMD Ryzen 9 5900X | |
| Intel Core i5-13600K | |
| Intel Core i9-12900K | |
| AMD Ryzen 9 5950X | |
| AMD Ryzen 9 7900X | |
| AMD Ryzen 9 7950X | |
| Intel Core i9-13900K | |
| X264 HD Benchmark 4.0 | |
| Pass 1 | |
| Intel Core i9-13900K | |
| Intel Core i5-13600K | |
| AMD Ryzen 9 7950X | |
| AMD Ryzen 9 7900X | |
| AMD Ryzen 7 7700X | |
| Intel Core i9-12900K | |
| AMD Ryzen 5 7600X | |
| AMD Ryzen 7 5800X | |
| AMD Ryzen 9 5950X | |
| AMD Ryzen 9 5900X | |
| Intel Core i5-12600K | |
| AMD Ryzen 5 5600X | |
| AMD Ryzen 7 5800X3D | |
| Pass 2 | |
| AMD Ryzen 9 7950X | |
| Intel Core i9-13900K | |
| AMD Ryzen 9 7900X | |
| AMD Ryzen 9 5950X | |
| Intel Core i9-12900K | |
| Intel Core i5-13600K | |
| AMD Ryzen 9 5900X | |
| AMD Ryzen 7 7700X | |
| AMD Ryzen 7 5800X | |
| Intel Core i5-12600K | |
| AMD Ryzen 5 7600X | |
| AMD Ryzen 7 5800X3D | |
| AMD Ryzen 5 5600X | |
| TrueCrypt | |
| AES Mean 100MB | |
| AMD Ryzen 9 7950X | |
| Intel Core i9-13900K | |
| AMD Ryzen 9 5950X | |
| AMD Ryzen 9 5900X | |
| Intel Core i5-13600K | |
| Intel Core i9-12900K | |
| AMD Ryzen 7 7700X | |
| AMD Ryzen 7 5800X | |
| AMD Ryzen 9 7900X | |
| AMD Ryzen 7 5800X3D | |
| AMD Ryzen 5 7600X | |
| Intel Core i5-12600K | |
| AMD Ryzen 5 5600X | |
| Twofish Mean 100MB | |
| Intel Core i9-13900K | |
| AMD Ryzen 9 7950X | |
| AMD Ryzen 9 5950X | |
| Intel Core i9-12900K | |
| Intel Core i5-13600K | |
| AMD Ryzen 9 5900X | |
| AMD Ryzen 9 7900X | |
| AMD Ryzen 7 7700X | |
| Intel Core i5-12600K | |
| AMD Ryzen 7 5800X | |
| AMD Ryzen 7 5800X3D | |
| AMD Ryzen 5 7600X | |
| AMD Ryzen 5 5600X | |
| Serpent Mean 100MB | |
| Intel Core i9-13900K | |
| AMD Ryzen 9 7950X | |
| AMD Ryzen 9 5950X | |
| Intel Core i9-12900K | |
| AMD Ryzen 9 5900X | |
| Intel Core i5-13600K | |
| AMD Ryzen 9 7900X | |
| AMD Ryzen 7 7700X | |
| AMD Ryzen 7 5800X | |
| Intel Core i5-12600K | |
| AMD Ryzen 7 5800X3D | |
| AMD Ryzen 5 7600X | |
| AMD Ryzen 5 5600X | |
| Geekbench 5.5 | |
| Single-Core | |
| Intel Core i9-13900K | |
| AMD Ryzen 9 7900X | |
| AMD Ryzen 9 7950X | |
| AMD Ryzen 7 7700X | |
| AMD Ryzen 5 7600X | |
| Intel Core i9-12900K | |
| Intel Core i5-13600K | |
| Intel Core i5-12600K | |
| AMD Ryzen 9 5950X | |
| AMD Ryzen 9 5900X | |
| AMD Ryzen 7 5800X | |
| AMD Ryzen 5 5600X | |
| AMD Ryzen 7 5800X3D | |
| Multi-Core | |
| Intel Core i9-13900K | |
| AMD Ryzen 9 7950X | |
| AMD Ryzen 9 7900X | |
| Intel Core i9-12900K | |
| AMD Ryzen 9 5950X | |
| Intel Core i5-13600K | |
| AMD Ryzen 7 7700X | |
| AMD Ryzen 9 5900X | |
| Intel Core i5-12600K | |
| AMD Ryzen 5 7600X | |
| AMD Ryzen 7 5800X | |
| AMD Ryzen 7 5800X3D | |
| AMD Ryzen 5 5600X | |
| Geekbench 5.0 | |
| 5.0 Single-Core | |
| Intel Core i9-13900K | |
| AMD Ryzen 9 7900X | |
| AMD Ryzen 9 7950X | |
| AMD Ryzen 5 7600X | |
| AMD Ryzen 7 7700X | |
| Intel Core i9-12900K | |
| Intel Core i5-13600K | |
| Intel Core i5-12600K | |
| AMD Ryzen 9 5950X | |
| AMD Ryzen 7 5800X | |
| AMD Ryzen 9 5900X | |
| AMD Ryzen 5 5600X | |
| AMD Ryzen 7 5800X3D | |
| 5.0 Multi-Core | |
| Intel Core i9-13900K | |
| AMD Ryzen 9 7950X | |
| AMD Ryzen 9 7900X | |
| Intel Core i9-12900K | |
| Intel Core i5-13600K | |
| AMD Ryzen 9 5950X | |
| AMD Ryzen 7 7700X | |
| AMD Ryzen 9 5900X | |
| Intel Core i5-12600K | |
| AMD Ryzen 5 7600X | |
| AMD Ryzen 7 5800X | |
| AMD Ryzen 7 5800X3D | |
| AMD Ryzen 5 5600X | |
| Geekbench 4.4 | |
| 64 Bit Single-Core Score | |
| Intel Core i9-13900K | |
| AMD Ryzen 9 7900X | |
| AMD Ryzen 9 7950X | |
| AMD Ryzen 7 7700X | |
| AMD Ryzen 5 7600X | |
| Intel Core i9-12900K | |
| Intel Core i5-13600K | |
| Intel Core i5-12600K | |
| AMD Ryzen 7 5800X | |
| AMD Ryzen 9 5900X | |
| AMD Ryzen 9 5950X | |
| AMD Ryzen 7 5800X3D | |
| AMD Ryzen 5 5600X | |
| 64 Bit Multi-Core Score | |
| Intel Core i9-13900K | |
| AMD Ryzen 9 7950X | |
| AMD Ryzen 9 7900X | |
| Intel Core i9-12900K | |
| AMD Ryzen 9 5950X | |
| Intel Core i5-13600K | |
| AMD Ryzen 7 7700X | |
| AMD Ryzen 9 5900X | |
| AMD Ryzen 5 7600X | |
| Intel Core i5-12600K | |
| AMD Ryzen 7 5800X | |
| AMD Ryzen 7 5800X3D | |
| AMD Ryzen 5 5600X | |
| HWBOT x265 Benchmark v2.2 - 4k Preset | |
| AMD Ryzen 9 7950X | |
| Intel Core i9-13900K | |
| AMD Ryzen 9 7900X | |
| AMD Ryzen 9 5950X | |
| Intel Core i5-12600K | |
| Intel Core i9-12900K | |
| Intel Core i5-13600K | |
| AMD Ryzen 7 7700X | |
| AMD Ryzen 9 5900X | |
| AMD Ryzen 5 7600X | |
| AMD Ryzen 7 5800X | |
| AMD Ryzen 7 5800X3D | |
| AMD Ryzen 5 5600X | |
| R Benchmark 2.5 - Overall mean | |
| AMD Ryzen 7 5800X3D | |
| AMD Ryzen 5 5600X | |
| AMD Ryzen 9 5950X | |
| AMD Ryzen 9 5900X | |
| AMD Ryzen 7 5800X | |
| Intel Core i5-12600K | |
| Intel Core i9-12900K | |
| Intel Core i5-13600K | |
| AMD Ryzen 9 7950X | |
| AMD Ryzen 7 7700X | |
| AMD Ryzen 5 7600X | |
| AMD Ryzen 9 7900X | |
| Intel Core i9-13900K | |
| LibreOffice - 20 Documents To PDF | |
| Intel Core i5-12600K | |
| AMD Ryzen 7 5800X3D | |
| AMD Ryzen 9 5900X | |
| AMD Ryzen 9 5950X | |
| AMD Ryzen 5 5600X | |
| AMD Ryzen 7 5800X | |
| Intel Core i9-12900K | |
| AMD Ryzen 5 7600X | |
| Intel Core i9-13900K | |
| AMD Ryzen 9 7950X | |
| Intel Core i5-13600K | |
| AMD Ryzen 9 7900X | |
| AMD Ryzen 7 7700X | |
* ... Moindre est la valeur, meilleures sont les performances
Dans l'ensemble, le Ryzen 9 7950X et le Ryzen 7 7700X obtiennent des résultats admirables dans notre suite de tests CPU. Le processeur phare AMD Zen 4 à 16 cœurs est à égalité avec le Core i9-13900K d'Intel Raptor Lake en termes de performances globales, tandis que la différence entre le Ryzen 7 7700X et le Core i5-13600K est bien en deçà de la marge d'erreur.
Le Ryzen 9 7950X offre une amélioration décente de 29% des performances cumulées du CPU par rapport au Ryzen 9 5950X. Les utilisateurs qui passent de la version Alder Lake Core i9-12900K trouveront un gain substantiel de 36 % en termes de performances globales, les avantages se situant principalement au niveau des charges de travail multifilières.
Le Ryzen 7 7700X est capable de se positionner confortablement devant le Core i9-12900K single-core, ce qui en fait une bonne proposition de valeur pour les flux de travail fortement monofilaires tels que les jeux.
Cinebench R15 Multi Loop
AMD ne fournit pas de refroidisseur dans la boîte pour le Ryzen 9 7950X ou le Ryzen 7 7700X, vous devrez donc compter sur une option tierce capable. Les processeurs Ryzen 7000 ont reçu quelques critiques pour le TjMax de 95 °C, mais AMD assure que ce n'est pas un problème
Selon la société, les puces de la série Ryzen 7000 sont conçues pour fonctionner à une TjMax de 95 °C 24 heures sur 24, 7 jours sur 7, sans aucun risque de dommage. Une température de fonctionnement maximale sûre aussi élevée permet à l'algorithme de boost Overdrive de Precision d'extraire le maximum de performances du processeur. Il est possible de passer à des valeurs encore plus élevées (jusqu'à un maximum de 115 °C) ou de passer en mode Eco pour un fonctionnement plus froid (nous y reviendrons).
Le Ryzen 9 7950X et le Ryzen 7 7700X offrent tous deux un fonctionnement bien soutenu, sans étranglement, grâce aux excellentes performances de refroidissement du Cooler MasterLiquid ML360L V2 ARGB AIO.
Performances du système : Augmentation significative de la productivité par rapport à Zen 3
Les Ryzen 9 7950X et les Ryzen 7 7700X n'ont aucun scrupule à faire tourner la plupart des applications de productivité. Les tests AIDA64 montrent systématiquement que le Ryzen 9 7950X est en tête des classements, avec souvent une avance significative sur le Core i9-13900K. Une situation similaire est observée avec le Ryzen 7 7700X et le Core i5-13600K. Le test CPU PhotoWorxx, cependant, voit une domination d'Intel.
Pour une raison quelconque, PCMark 10 n'a pas pu être exécuté dans les paramètres par défaut du Ryzen 7 7700X, bien que nous ayons pu exécuter le benchmark en mode Eco du processeur. Par conséquent, nous n'avons pas inclus le 7700X dans le tableau ci-dessous.
CrossMark, d'autre part, voit le Ryzen 9 7950X presque à égalité avec le Core i9-13900K, ce qui est également le cas avec la paire Ryzen 7 7700X et Core i5-13600K.
Comme nous l'avions vu précédemment dans les benchmarks des CPU, la série Ryzen 7000 présente des gains significatifs d'une génération à l'autre dans les tests de productivité également. Par exemple, le Ryzen 9 7950X montre une augmentation massive de 69% dans les scores globaux de CrossMark, tout en affichant également un avantage de performance écrasante dans la plupart des tests CPU AIDA64.
Dans les tests CPU 3DMark, le Core i9-13900K a une légère avance sur le Ryzen 9 7950X dans Fire Strike Physics, tandis que le Ryzen 7 7700X et le Core i5-13600K sont à égalité. Time Spy Le test CPU voit les processeurs Intel en tête en général, avec le Ryzen 9 7950X à la traîne derrière le Core i9-13900K de 18%.
| 3DMark 11 - 1280x720 Performance Physics | |
| AMD Ryzen 9 7950X | |
| Intel Core i9-13900K | |
| AMD Ryzen 7 7700X | |
| Intel Core i5-13600K | |
| AMD Ryzen 9 7900X | |
| Intel Core i9-12900K | |
| AMD Ryzen 7 5800X3D | |
| AMD Ryzen 5 7600X | |
| AMD Ryzen 9 5950X | |
| Intel Core i5-12600K | |
| AMD Ryzen 9 5900X | |
| AMD Ryzen 7 5800X | |
| AMD Ryzen 5 5600X | |
| 3DMark | |
| 1920x1080 Fire Strike Physics | |
| Intel Core i9-13900K | |
| AMD Ryzen 9 7950X | |
| AMD Ryzen 9 7900X | |
| AMD Ryzen 9 5950X | |
| Intel Core i9-12900K | |
| AMD Ryzen 9 5900X | |
| Intel Core i5-13600K | |
| AMD Ryzen 7 7700X | |
| AMD Ryzen 7 5800X | |
| AMD Ryzen 5 7600X | |
| Intel Core i5-12600K | |
| AMD Ryzen 7 5800X3D | |
| AMD Ryzen 5 5600X | |
| 2560x1440 Time Spy CPU | |
| Intel Core i9-13900K | |
| Intel Core i9-12900K | |
| Intel Core i5-13600K | |
| AMD Ryzen 9 7900X | |
| AMD Ryzen 9 7950X | |
| AMD Ryzen 7 7700X | |
| Intel Core i5-12600K | |
| AMD Ryzen 9 5950X | |
| AMD Ryzen 9 5900X | |
| AMD Ryzen 7 5800X3D | |
| AMD Ryzen 7 5800X | |
| AMD Ryzen 5 7600X | |
| AMD Ryzen 5 5600X | |
| PCMark 10 | |
| Score | |
| AMD Ryzen 9 7950X | |
| AMD Ryzen 9 7900X | |
| Intel Core i9-13900K | |
| AMD Ryzen 5 7600X | |
| Intel Core i5-13600K | |
| AMD Ryzen 9 5950X | |
| Intel Core i9-12900K | |
| AMD Ryzen 9 5900X | |
| AMD Ryzen 5 5600X | |
| Intel Core i5-12600K | |
| AMD Ryzen 7 5800X | |
| AMD Ryzen 7 5800X3D | |
| Essentials | |
| Intel Core i9-13900K | |
| AMD Ryzen 9 7900X | |
| AMD Ryzen 9 7950X | |
| Intel Core i5-13600K | |
| AMD Ryzen 5 7600X | |
| AMD Ryzen 7 5800X | |
| AMD Ryzen 5 5600X | |
| AMD Ryzen 9 5950X | |
| Intel Core i9-12900K | |
| AMD Ryzen 9 5900X | |
| Intel Core i5-12600K | |
| AMD Ryzen 7 5800X3D | |
| Productivity | |
| AMD Ryzen 5 7600X | |
| AMD Ryzen 9 7950X | |
| AMD Ryzen 9 7900X | |
| Intel Core i5-13600K | |
| Intel Core i9-13900K | |
| AMD Ryzen 9 5950X | |
| AMD Ryzen 7 5800X | |
| Intel Core i5-12600K | |
| AMD Ryzen 5 5600X | |
| Intel Core i9-12900K | |
| AMD Ryzen 9 5900X | |
| AMD Ryzen 7 5800X3D | |
| Digital Content Creation | |
| AMD Ryzen 9 7950X | |
| AMD Ryzen 9 7900X | |
| Intel Core i9-13900K | |
| Intel Core i5-13600K | |
| AMD Ryzen 5 7600X | |
| AMD Ryzen 9 5950X | |
| Intel Core i9-12900K | |
| AMD Ryzen 9 5900X | |
| AMD Ryzen 7 5800X3D | |
| AMD Ryzen 7 5800X | |
| Intel Core i5-12600K | |
| AMD Ryzen 5 5600X | |
| PCMark 10 Score | 10153 points | |
Aide | ||
| Performance rating - Percent | |
| Intel Core i9-12900K -1! | |
| Intel Core i5-12600K -1! | |
| AMD Ryzen 9 7900X | |
| Intel Core i9-13900K | |
| AMD Ryzen 9 7950X | |
| Intel Core i5-13600K | |
| AMD Ryzen 5 7600X | |
| AMD Ryzen 9 5900X | |
| AMD Ryzen 7 7700X | |
| AMD Ryzen 9 5950X | |
| AMD Ryzen 7 5800X | |
| AMD Ryzen 5 5600X | |
| AMD Ryzen 7 5800X3D | |
| AIDA64 | |
| Memory Copy | |
| Intel Core i9-13900K | |
| Intel Core i9-12900K | |
| Intel Core i5-13600K | |
| Intel Core i5-12600K | |
| AMD Ryzen 9 7900X | |
| AMD Ryzen 9 7950X | |
| AMD Ryzen 9 5900X | |
| AMD Ryzen 5 7600X | |
| AMD Ryzen 7 7700X | |
| AMD Ryzen 9 5950X | |
| AMD Ryzen 7 5800X | |
| AMD Ryzen 5 5600X | |
| AMD Ryzen 7 5800X3D | |
| Memory Latency | |
| Intel Core i5-13600K | |
| Intel Core i9-13900K | |
| AMD Ryzen 7 5800X3D | |
| AMD Ryzen 9 5950X | |
| AMD Ryzen 7 7700X | |
| AMD Ryzen 9 7950X | |
| AMD Ryzen 5 5600X | |
| AMD Ryzen 5 7600X | |
| AMD Ryzen 9 7900X | |
| AMD Ryzen 7 5800X | |
| AMD Ryzen 9 5900X | |
| Memory Read | |
| Intel Core i9-13900K | |
| Intel Core i9-12900K | |
| Intel Core i5-12600K | |
| Intel Core i5-13600K | |
| AMD Ryzen 9 7950X | |
| AMD Ryzen 9 7900X | |
| AMD Ryzen 9 5900X | |
| AMD Ryzen 7 5800X | |
| AMD Ryzen 9 5950X | |
| AMD Ryzen 5 5600X | |
| AMD Ryzen 7 7700X | |
| AMD Ryzen 5 7600X | |
| AMD Ryzen 7 5800X3D | |
| Memory Write | |
| AMD Ryzen 5 7600X | |
| AMD Ryzen 7 7700X | |
| AMD Ryzen 9 7900X | |
| AMD Ryzen 9 7950X | |
| Intel Core i9-13900K | |
| Intel Core i5-12600K | |
| Intel Core i9-12900K | |
| Intel Core i5-13600K | |
| AMD Ryzen 9 5900X | |
| AMD Ryzen 9 5950X | |
| AMD Ryzen 7 5800X | |
| AMD Ryzen 5 5600X | |
| AMD Ryzen 7 5800X3D | |
* ... Moindre est la valeur, meilleures sont les performances
Mode Eco : 65 W Le Ryzen 9 7950X surpasse le Core i9-12900K
Le mode Eco est essentiellement le langage d'AMD pour faire fonctionner le CPU à un TDP inférieur. Avec Zen 4, la société annonce des économies d'énergie substantielles avec un faible impact sur les performances. Les valeurs de TDP proposées dépendent de l'UGS - un CPU de 170 W peut être configuré pour fonctionner à 105 W ou 65 W, tandis qu'une puce de 105 W peut être abaissée à 65 W
Notre carte de test Gigabyte X670E Aorus Master ne pouvait fonctionner qu'avec le BIOS de référence 813b d'AMD. Cela signifie que notre configuration n'offrait pas une option en un clic pour activer le mode Eco, bien que les unités de détail devraient être en mesure de mettre à niveau vers des versions plus récentes qui offrent une approche plus simple. Vous pouvez également activer ces paramètres à partir de la dernière version de Ryzen Master.
Néanmoins, nous avons utilisé les valeurs suivantes fournies par AMD dans les paramètres PBO du firmware pour activer les TDP correspondants
- 65 W TDP = 88,000 PPT ; 75,000 TDC ; 150,000 EDC
- 105 W TDP = 142,000 PPT ; 110,000 TDC ; 170,000 EDC
- 170 W TDP = 230,000 PPT ; 160,000 TDC ; 225,000 EDC
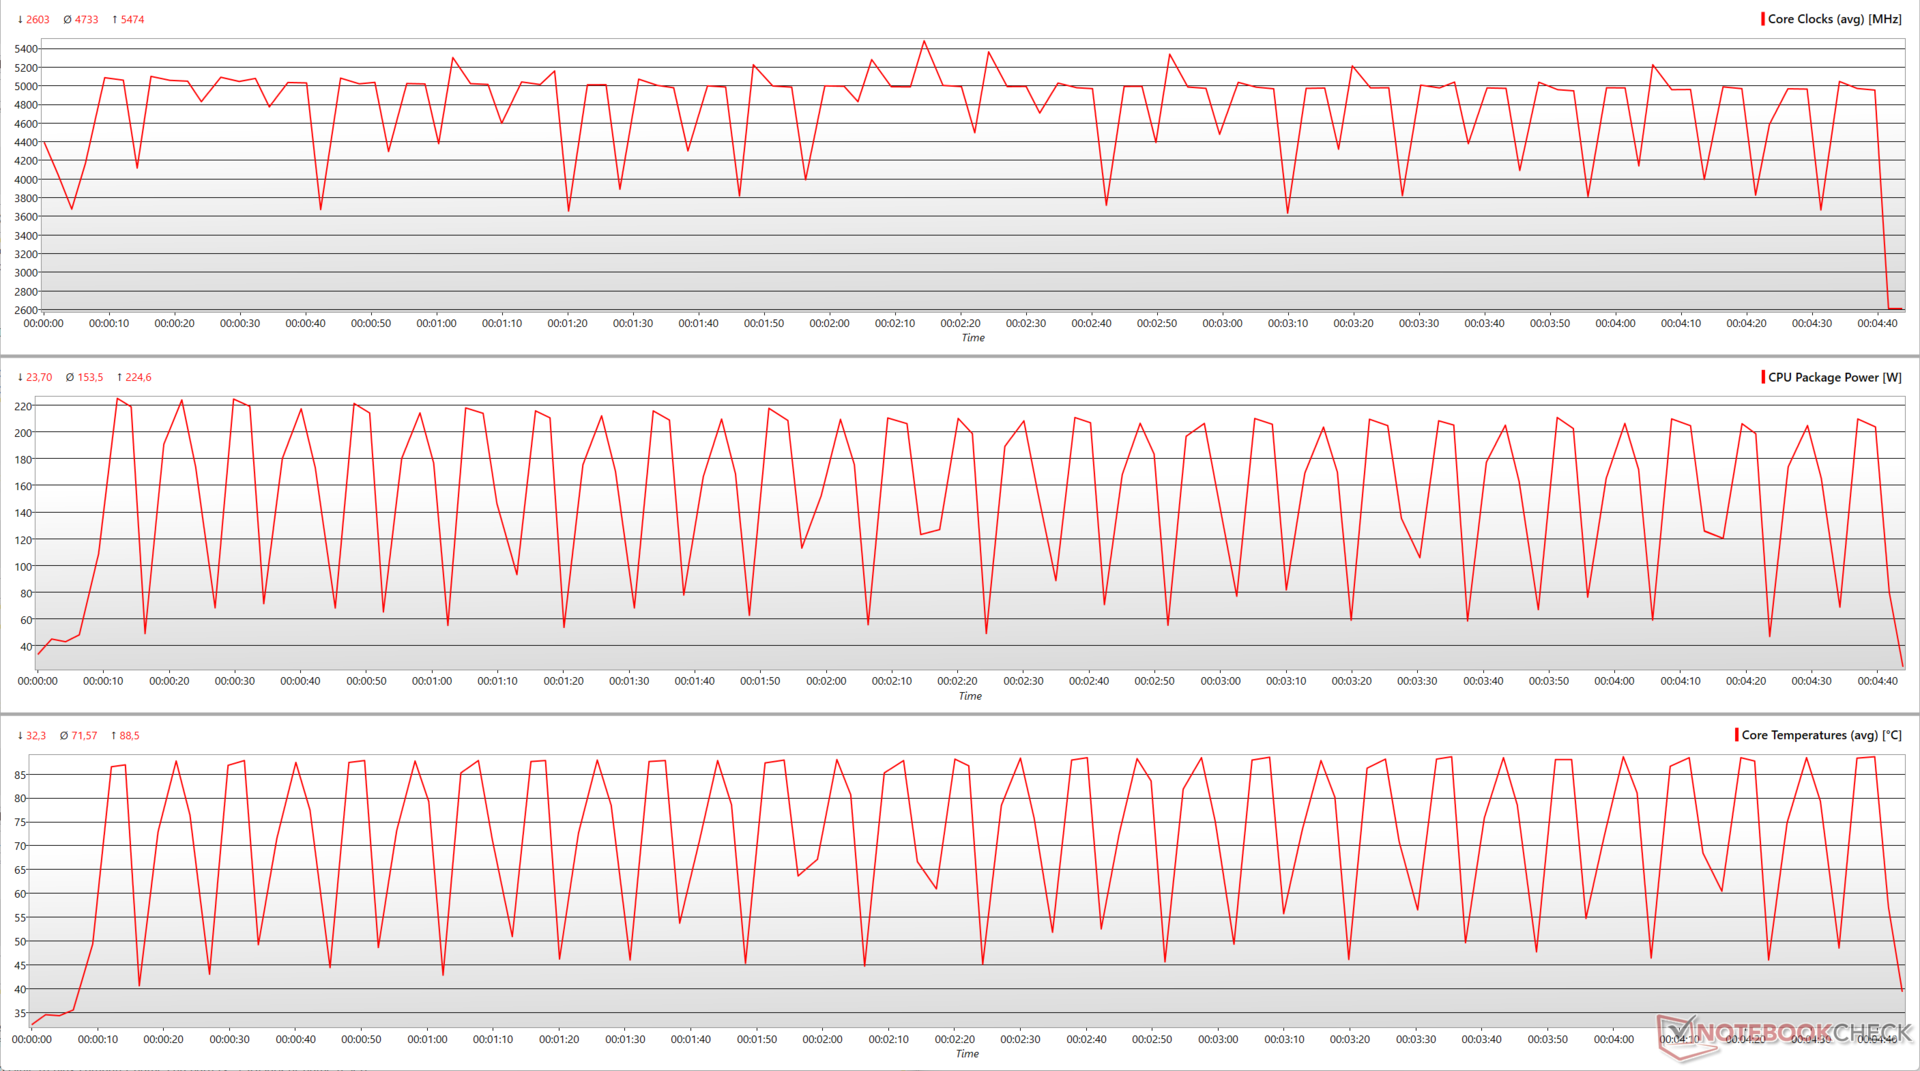
Nous voyons immédiatement les avantages de l'abaissement du TDP du Ryzen 9 7950X dans le test multi-core 30-loop de Cinebench R15. Avec un TDP de 105 W, le Ryzen 9 7950X perd à peine 7% de performance, avec une légère baisse du boost maximum de 5,47 GHz à 5,43 GHz. Les températures maximales du cœur connaissent également une baisse significative de 22 %, passant de 88,5 °C à 68,3 °C.
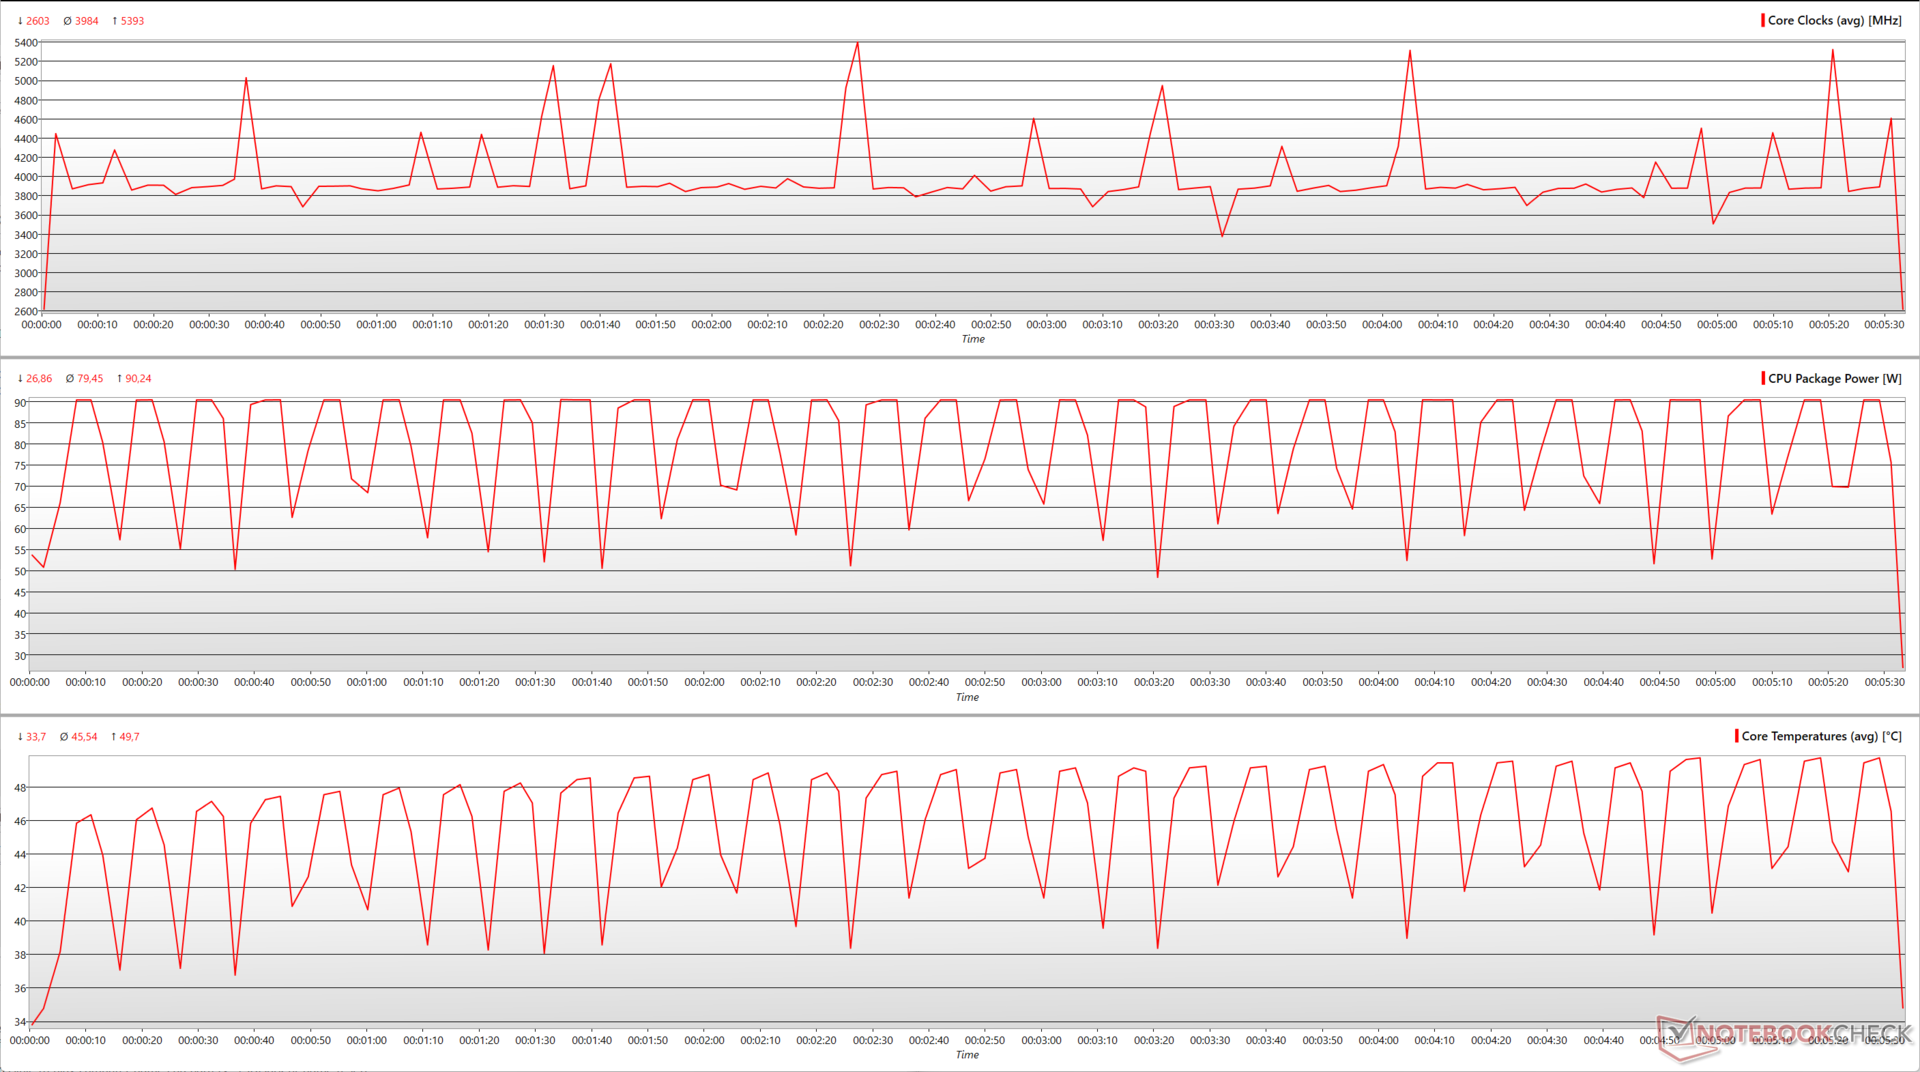
À 65 W, le Ryzen 9 7950X perd environ 22,4 % de ses performances dans le benchmark, étant donné la réduction marquée des horloges centrales. Cependant, le processeur a maintenant une température de cœur beaucoup plus basse, d'environ 50 °C, avec une puissance de boîtier maximale de seulement 90 W.
| Ryzen 9 7950X TDP | CB R15 Multi-Core Score | Fréquence centrale moyenne (GHz) | Max. Fréquence centrale (GHz) | Puissance max. Puissance du boîtier (W) | Température max. Température du cœur (°C) |
|---|---|---|---|---|---|
| 170 W | 6,236 | 4.77 | 5.47 | 224.6 | 88.5 |
| 105 W | 5,800 (-7%) | 4.54 -(4.82%) | 5.43 (-0.73%) | 145.6 (-35.17%) | 68.3 (-22.82%) |
| 65 W | 4,836 (-22.4%) | 3.98 (-16.56%) | 5.39 (-1.46%) | 90.24 (-59.82%) | 49.7 (-43.84%) |

L'impact sur les performances globales du passage de 170 W à 105 W est négligeable dans la plupart des cas, bien que les charges de travail multicœurs très intensives puissent subir un impact légèrement plus important. La différence entre 170 W et 65 W est plus perceptible, avec une réduction cumulée d'environ 9 % dans les tests.
Les taux d'images dans Le Witcher 3 à 1080p Ultra ne semblent pas être affectés par la réduction du TDP. Nous avons effectivement remarqué des fps moyens marginalement plus élevés aux TDP inférieurs, mais les valeurs de fps maximales étaient inférieures par rapport au TDP par défaut.
| Performance rating - Percent | |
| Intel Core i9-13900K | |
| AMD Ryzen 9 7950X | |
| AMD Ryzen 9 7950X ECO 105 W | |
| AMD Ryzen 9 7900X | |
| AMD Ryzen 9 7950X ECO 65 W | |
| Intel Core i9-12900K | |
| Intel Core i5-13600K | |
| AMD Ryzen 7 7700X | |
| AMD Ryzen 7 7700X ECO 65 W | |
| AMD Ryzen 9 5950X | |
| AMD Ryzen 5 7600X | |
| AMD Ryzen 9 5900X | |
| Intel Core i5-12600K | |
| AMD Ryzen 7 5800X | |
| AMD Ryzen 7 5800X3D | |
| AMD Ryzen 5 5600X | |
| Cinebench R23 | |
| Single Core | |
| Intel Core i9-13900K | |
| AMD Ryzen 9 7900X | |
| AMD Ryzen 9 7950X | |
| Intel Core i5-13600K | |
| AMD Ryzen 9 7950X ECO 65 W | |
| AMD Ryzen 9 7950X ECO 105 W | |
| Intel Core i9-12900K | |
| AMD Ryzen 7 7700X ECO 65 W | |
| AMD Ryzen 7 7700X | |
| AMD Ryzen 5 7600X | |
| Intel Core i5-12600K | |
| AMD Ryzen 9 5950X | |
| AMD Ryzen 9 5900X | |
| AMD Ryzen 7 5800X | |
| AMD Ryzen 5 5600X | |
| AMD Ryzen 7 5800X3D | |
| Multi Core | |
| Intel Core i9-13900K | |
| AMD Ryzen 9 7950X | |
| AMD Ryzen 9 7950X ECO 105 W | |
| AMD Ryzen 9 7950X ECO 65 W | |
| AMD Ryzen 9 7900X | |
| AMD Ryzen 9 5950X | |
| Intel Core i9-12900K | |
| Intel Core i5-13600K | |
| AMD Ryzen 9 5900X | |
| AMD Ryzen 7 7700X | |
| AMD Ryzen 7 7700X ECO 65 W | |
| Intel Core i5-12600K | |
| AMD Ryzen 5 7600X | |
| AMD Ryzen 7 5800X | |
| AMD Ryzen 7 5800X3D | |
| AMD Ryzen 5 5600X | |
| Cinebench R20 | |
| CPU (Single Core) | |
| Intel Core i9-13900K | |
| AMD Ryzen 9 7900X | |
| AMD Ryzen 9 7950X | |
| AMD Ryzen 9 7950X ECO 65 W | |
| AMD Ryzen 9 7950X ECO 105 W | |
| Intel Core i5-13600K | |
| AMD Ryzen 7 7700X ECO 65 W | |
| AMD Ryzen 7 7700X | |
| Intel Core i9-12900K | |
| AMD Ryzen 5 7600X | |
| Intel Core i5-12600K | |
| AMD Ryzen 9 5950X | |
| AMD Ryzen 9 5900X | |
| AMD Ryzen 7 5800X | |
| AMD Ryzen 5 5600X | |
| AMD Ryzen 7 5800X3D | |
| CPU (Multi Core) | |
| Intel Core i9-13900K | |
| AMD Ryzen 9 7950X | |
| AMD Ryzen 9 7950X ECO 105 W | |
| AMD Ryzen 9 7950X ECO 65 W | |
| AMD Ryzen 9 7900X | |
| AMD Ryzen 9 5950X | |
| Intel Core i9-12900K | |
| Intel Core i5-13600K | |
| AMD Ryzen 9 5900X | |
| AMD Ryzen 7 7700X | |
| AMD Ryzen 7 7700X ECO 65 W | |
| Intel Core i5-12600K | |
| AMD Ryzen 7 5800X | |
| AMD Ryzen 5 7600X | |
| AMD Ryzen 7 5800X3D | |
| AMD Ryzen 5 5600X | |
| Cinebench R15 | |
| CPU Single 64Bit | |
| Intel Core i9-13900K | |
| AMD Ryzen 9 7900X | |
| AMD Ryzen 9 7950X | |
| AMD Ryzen 9 7950X ECO 105 W | |
| AMD Ryzen 7 7700X ECO 65 W | |
| AMD Ryzen 5 7600X | |
| AMD Ryzen 9 7950X ECO 65 W | |
| AMD Ryzen 7 7700X | |
| Intel Core i5-13600K | |
| Intel Core i9-12900K | |
| Intel Core i5-12600K | |
| AMD Ryzen 9 5950X | |
| AMD Ryzen 9 5900X | |
| AMD Ryzen 7 5800X | |
| AMD Ryzen 5 5600X | |
| AMD Ryzen 7 5800X3D | |
| CPU Multi 64Bit | |
| AMD Ryzen 9 7950X | |
| Intel Core i9-13900K | |
| AMD Ryzen 9 7950X ECO 105 W | |
| AMD Ryzen 9 7900X | |
| AMD Ryzen 9 7950X ECO 65 W | |
| AMD Ryzen 9 5950X | |
| Intel Core i9-12900K | |
| AMD Ryzen 9 5900X | |
| Intel Core i5-13600K | |
| AMD Ryzen 7 7700X | |
| AMD Ryzen 7 7700X ECO 65 W | |
| AMD Ryzen 7 5800X | |
| Intel Core i5-12600K | |
| AMD Ryzen 5 7600X | |
| AMD Ryzen 7 5800X3D | |
| AMD Ryzen 5 5600X | |
| Blender - v2.79 BMW27 CPU | |
| AMD Ryzen 5 5600X | |
| AMD Ryzen 7 5800X3D | |
| AMD Ryzen 5 7600X | |
| AMD Ryzen 7 5800X | |
| Intel Core i5-12600K | |
| AMD Ryzen 7 7700X ECO 65 W | |
| AMD Ryzen 7 7700X | |
| AMD Ryzen 9 5900X | |
| Intel Core i5-13600K | |
| Intel Core i9-12900K | |
| AMD Ryzen 9 5950X | |
| AMD Ryzen 9 7900X | |
| AMD Ryzen 9 7950X ECO 65 W | |
| AMD Ryzen 9 7950X ECO 105 W | |
| AMD Ryzen 9 7950X | |
| Intel Core i9-13900K | |
| Geekbench 5.5 | |
| Single-Core | |
| Intel Core i9-13900K | |
| AMD Ryzen 9 7900X | |
| AMD Ryzen 9 7950X ECO 65 W | |
| AMD Ryzen 9 7950X ECO 105 W | |
| AMD Ryzen 9 7950X | |
| AMD Ryzen 7 7700X | |
| AMD Ryzen 7 7700X ECO 65 W | |
| AMD Ryzen 5 7600X | |
| Intel Core i9-12900K | |
| Intel Core i5-13600K | |
| Intel Core i5-12600K | |
| AMD Ryzen 9 5950X | |
| AMD Ryzen 9 5900X | |
| AMD Ryzen 7 5800X | |
| AMD Ryzen 5 5600X | |
| AMD Ryzen 7 5800X3D | |
| Multi-Core | |
| Intel Core i9-13900K | |
| AMD Ryzen 9 7950X | |
| AMD Ryzen 9 7950X ECO 105 W | |
| AMD Ryzen 9 7950X ECO 65 W | |
| AMD Ryzen 9 7900X | |
| Intel Core i9-12900K | |
| AMD Ryzen 9 5950X | |
| Intel Core i5-13600K | |
| AMD Ryzen 7 7700X | |
| AMD Ryzen 7 7700X ECO 65 W | |
| AMD Ryzen 9 5900X | |
| Intel Core i5-12600K | |
| AMD Ryzen 5 7600X | |
| AMD Ryzen 7 5800X | |
| AMD Ryzen 7 5800X3D | |
| AMD Ryzen 5 5600X | |
| HWBOT x265 Benchmark v2.2 - 4k Preset | |
| AMD Ryzen 9 7950X | |
| Intel Core i9-13900K | |
| AMD Ryzen 9 7950X ECO 105 W | |
| AMD Ryzen 9 7900X | |
| AMD Ryzen 9 7950X ECO 65 W | |
| AMD Ryzen 9 5950X | |
| Intel Core i5-12600K | |
| Intel Core i9-12900K | |
| Intel Core i5-13600K | |
| AMD Ryzen 7 7700X | |
| AMD Ryzen 9 5900X | |
| AMD Ryzen 7 7700X ECO 65 W | |
| AMD Ryzen 5 7600X | |
| AMD Ryzen 7 5800X | |
| AMD Ryzen 7 5800X3D | |
| AMD Ryzen 5 5600X | |
| R Benchmark 2.5 - Overall mean | |
| AMD Ryzen 7 5800X3D | |
| AMD Ryzen 5 5600X | |
| AMD Ryzen 9 5950X | |
| AMD Ryzen 9 5900X | |
| AMD Ryzen 7 5800X | |
| Intel Core i5-12600K | |
| Intel Core i9-12900K | |
| Intel Core i5-13600K | |
| AMD Ryzen 7 7700X ECO 65 W | |
| AMD Ryzen 9 7950X | |
| AMD Ryzen 9 7950X ECO 65 W | |
| AMD Ryzen 9 7950X ECO 105 W | |
| AMD Ryzen 7 7700X | |
| AMD Ryzen 5 7600X | |
| AMD Ryzen 9 7900X | |
| Intel Core i9-13900K | |
| LibreOffice - 20 Documents To PDF | |
| Intel Core i5-12600K | |
| AMD Ryzen 7 5800X3D | |
| AMD Ryzen 9 5900X | |
| AMD Ryzen 9 5950X | |
| AMD Ryzen 5 5600X | |
| AMD Ryzen 7 5800X | |
| Intel Core i9-12900K | |
| AMD Ryzen 5 7600X | |
| Intel Core i9-13900K | |
| AMD Ryzen 9 7950X | |
| Intel Core i5-13600K | |
| AMD Ryzen 9 7900X | |
| AMD Ryzen 7 7700X ECO 65 W | |
| AMD Ryzen 7 7700X | |
| AMD Ryzen 9 7950X ECO 65 W | |
| AMD Ryzen 9 7950X ECO 105 W | |
| The Witcher 3 - 1920x1080 Ultra Graphics & Postprocessing (HBAO+) | |
| AMD Ryzen 7 5800X3D | |
| AMD Ryzen 9 7900X | |
| AMD Ryzen 5 7600X | |
| Intel Core i5-13600K | |
| Intel Core i9-13900K | |
| AMD Ryzen 9 7950X ECO 105 W | |
| AMD Ryzen 9 7950X ECO 65 W | |
| AMD Ryzen 9 7950X | |
| AMD Ryzen 7 7700X | |
| AMD Ryzen 7 7700X ECO 65 W | |
| Intel Core i5-12600K | |
| AMD Ryzen 9 5900X | |
| AMD Ryzen 9 5950X | |
| AMD Ryzen 7 5800X | |
| AMD Ryzen 5 5600X | |
| Intel Core i9-12900K | |
* ... Moindre est la valeur, meilleures sont les performances
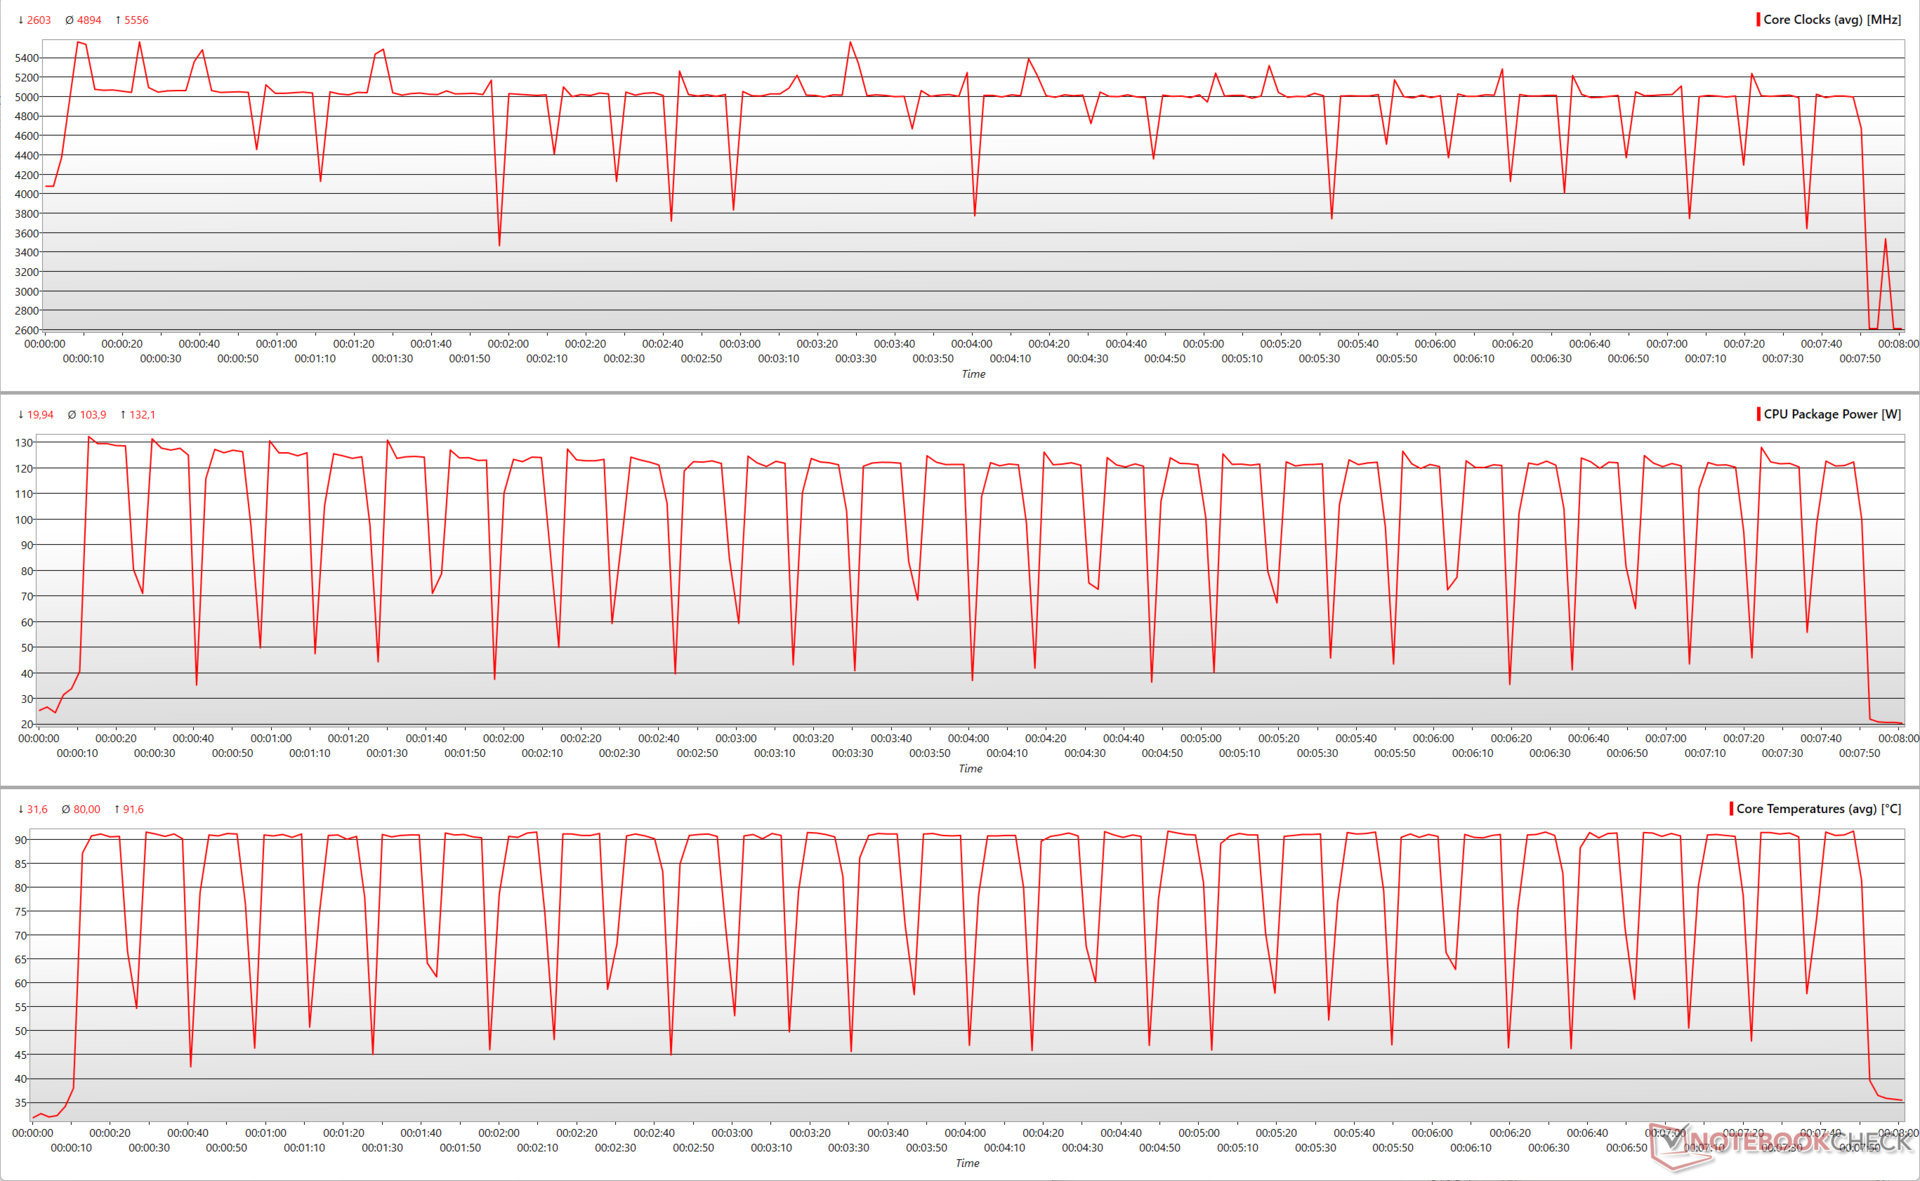
| Ryzen 7 7700X TDP | CB R15 Multi-Core Score | Fréquence centrale moyenne (GHz) | Max. Fréquence centrale (GHz) | Puissance max. Puissance du boîtier (W) | Température max. Température du cœur (°C) |
|---|---|---|---|---|---|
| 105 W | 3191 | 4,89 | 5,55 | 132,1 | 91,6 |
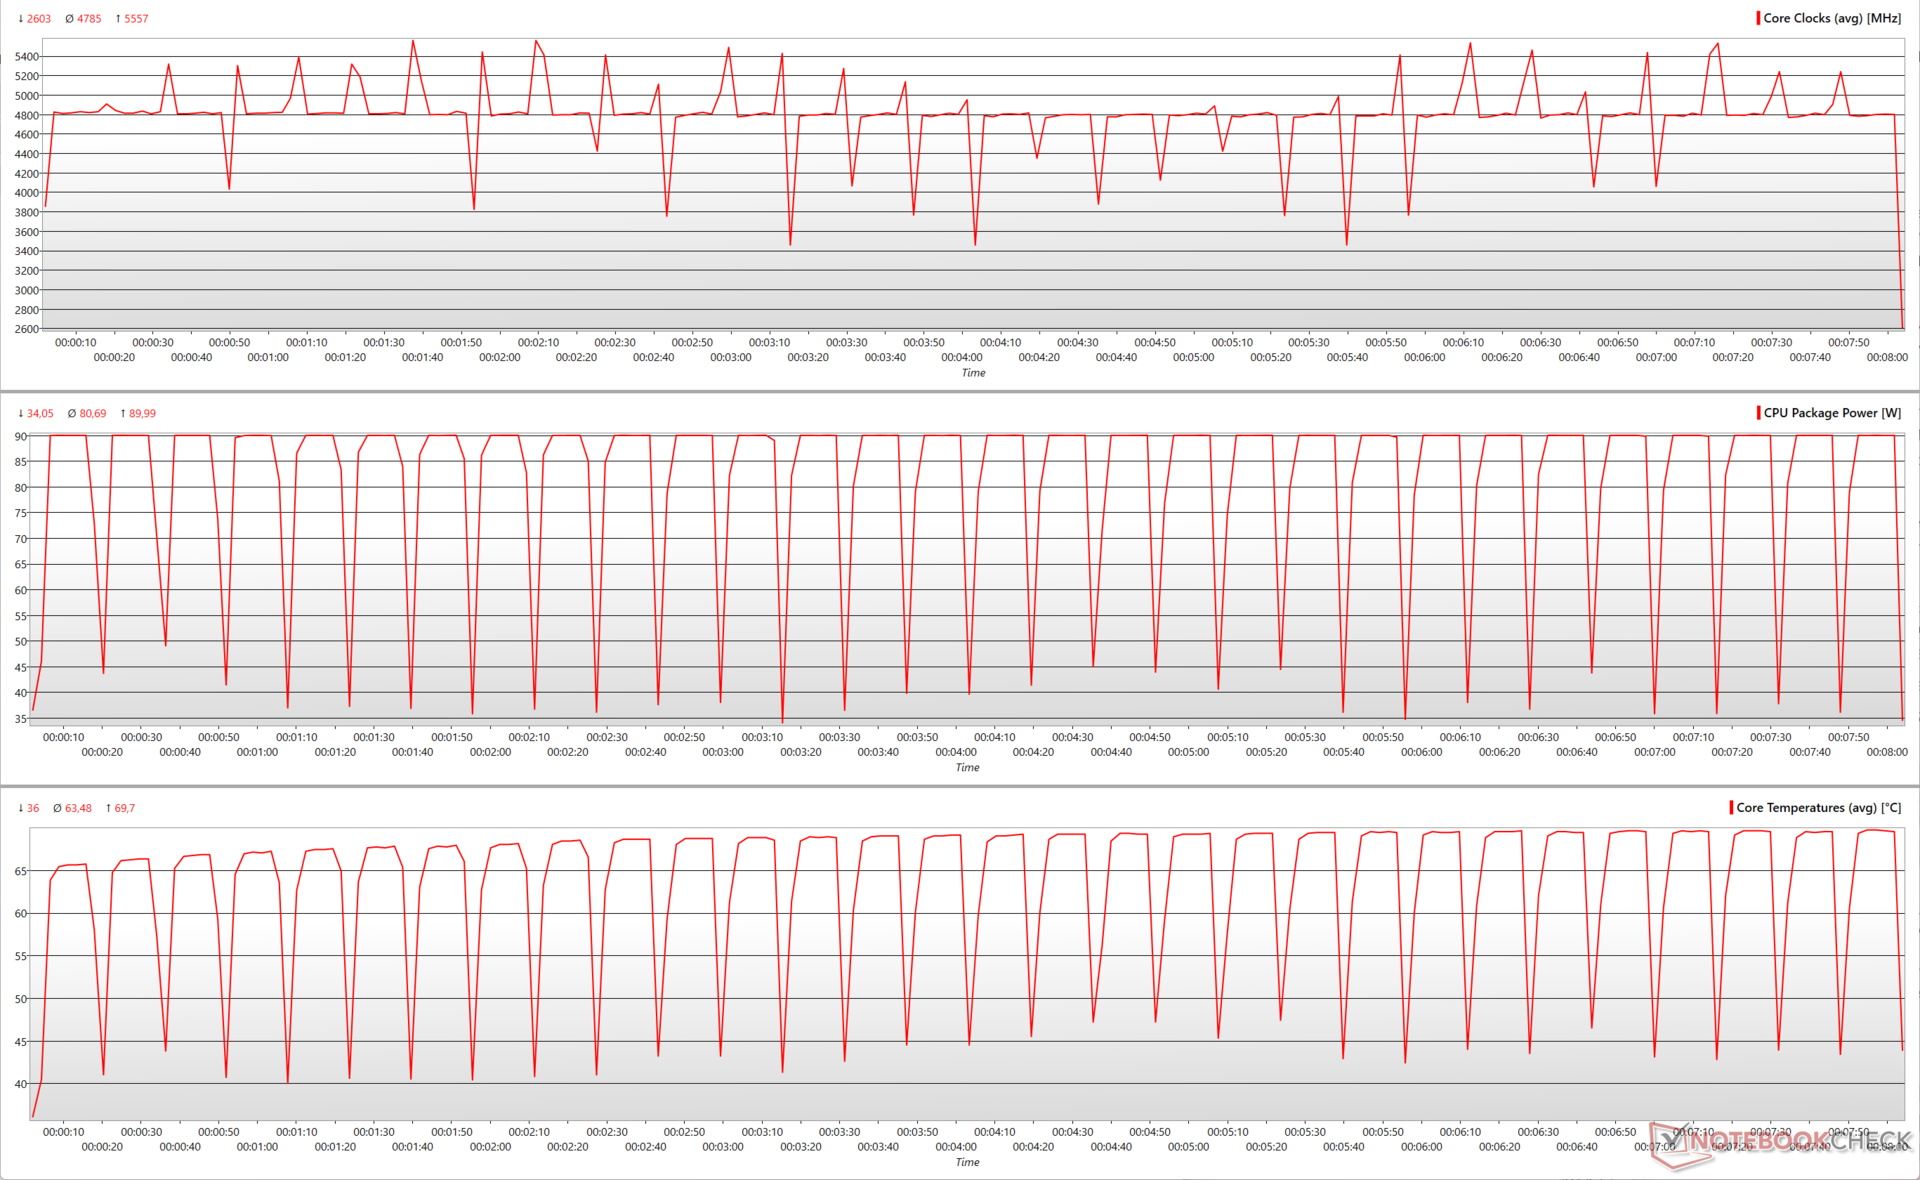
| 65 W | 3036 (-4,85%) | 4,78 (-2,24%) | 5,55 | 90 (-31,86%) | 69,7 (-23,9%) |
La baisse à 65 W de 105 W avec le Ryzen 7 7700X est moins radicale, avec seulement près de 5% de réduction dans les scores multi-cœurs de Cinebench R15. Bien que nous voyons une légère réduction dans les horloges moyennes du cœur, la vitesse d'horloge maximale culmine toujours à 5,55 GHz pendant l'exécution
La température maximale du cœur à 65 W est maintenant proche de 70 °C, ce qui représente une réduction de 24 % par rapport au paramètre par défaut qui peut entraîner des températures proches de 92 °C.
Cumulativement, le Ryzen 7 7700X ne perd pas grand-chose s'il est exploité à un TDP de 65 W. Le Witcher 3 à 1080p Ultra voit une fois de plus des images marginalement plus élevées, mais cela peut être considéré comme étant dans la marge d'erreur.
Globalement, le Ryzen 9 7950X à 65 W est toujours 14% plus rapide qu'un Core i9-12900K fonctionnant à un PL1=PL2 de 241 W, ce qui est une excellente efficacité. Par rapport au Core i9-13900K, le Ryzen 9 7950X est à la traîne de seulement 5 % à 105 W.
De même, le Ryzen 7 7700X à 65 W est pratiquement à égalité avec le Ryzen 9 5950X fonctionnant au TDP par défaut de 105 W (142 W PL2) tout en étant juste 6% plus lent que le Core i5-13600K par défaut (125 W PL1, 181 W PL2).
Nous recommandons de faire tourner les Ryzen 9 7950X et Ryzen 7 7700X en mode Eco, à moins que vous n'ayez besoin de libérer toute la puissance brute de ces processeurs pour des flux de travail exigeants.
3D et performances de jeu : Une compétition serrée avec le meilleur d'Intel
Le Ryzen 9 7950X et le Ryzen 7 7700X montrent de légères régressions dans les performances GPU 3DMark par rapport au Ryzen 5 7600X et au Ryzen 9 7900X. Cependant, les performances sont équivalentes à celles des Core i5-13600K et Core i9-13900K.
| Performance rating - Percent | |
| AMD Ryzen 5 7600X | |
| AMD Ryzen 9 7900X | |
| Intel Core i5-13600K | |
| Intel Core i9-13900K | |
| AMD Ryzen 9 7950X | |
| AMD Ryzen 7 7700X | |
| 3DMark | |
| 1920x1080 Fire Strike Graphics | |
| AMD Ryzen 5 7600X | |
| AMD Ryzen 9 7900X | |
| Intel Core i5-13600K | |
| Intel Core i9-13900K | |
| AMD Ryzen 9 7950X | |
| AMD Ryzen 7 7700X | |
| 2560x1440 Time Spy Graphics | |
| AMD Ryzen 9 7900X | |
| AMD Ryzen 5 7600X | |
| Intel Core i9-13900K | |
| Intel Core i5-13600K | |
| AMD Ryzen 7 7700X | |
| AMD Ryzen 9 7950X | |
| 3DMark 11 - 1280x720 Performance GPU | |
| AMD Ryzen 5 7600X | |
| AMD Ryzen 9 7900X | |
| Intel Core i5-13600K | |
| Intel Core i9-13900K | |
| AMD Ryzen 9 7950X | |
| AMD Ryzen 7 7700X | |
| 3DMark 11 Performance | 48825 points | |
| 3DMark Fire Strike Score | 42285 points | |
| 3DMark Time Spy Score | 18279 points | |
Aide | ||
Il n'est pas fréquent de voir des processeurs Intel et AMD rivaliser au coude à coude dans le domaine du jeu. Le Ryzen 9 7950X et le Ryzen 7 7700X sont tous deux d'excellents processeurs de jeu, surtout lorsqu'ils sont associés à des GPU rapides tels que la série GeForce RTX 30 ou la série Radeon RX 6000 et plus. La différence de performances cumulées entre les processeurs Intel Raptor Lake et les processeurs AMD Zen 4 correspondants semble négligeable.
Cela étant dit, des jeux individuels peuvent favoriser une plateforme par rapport à l'autre. Par exemple, nous voyons le Ryzen 9 7950X réaliser une avance de 21% sur le Core i9-13900K dans Final Fantasy XV 1080p High, tandis que ce dernier devance le 7950X de 13% dans Far Cry 5 à 1080p Ultra. Le Ryzen 9 7900Xd'autre part, devance le Ryzen 9 7950X de 7% dans The Witcher 3 à 1080p Ultra
Dans l'ensemble, le Ryzen 9 7950X et le Ryzen 7 7700X sont à égalité dans les jeux. Si vous êtes principalement un joueur, vous pouvez économiser une bonne somme d'argent en optant pour le Ryzen 7 7700X ou même le Ryzen 5 7600X.
| Performance rating - Percent | |
| Intel Core i9-13900K | |
| AMD Ryzen 9 7900X | |
| AMD Ryzen 5 7600X | |
| Moyenne de la classe Desktop | |
| AMD Ryzen 9 7950X | |
| AMD Ryzen 7 7700X | |
| Intel Core i5-13600K | |
| The Witcher 3 | |
| 1920x1080 Ultra Graphics & Postprocessing (HBAO+) | |
| Moyenne de la classe Desktop (7.8 - 369, n=48, 2 dernières années) | |
| AMD Ryzen 9 7900X | |
| AMD Ryzen 5 7600X | |
| Intel Core i5-13600K | |
| Intel Core i9-13900K | |
| AMD Ryzen 9 7950X | |
| AMD Ryzen 7 7700X | |
| 1024x768 Low Graphics & Postprocessing | |
| AMD Ryzen 9 7900X | |
| Intel Core i9-13900K | |
| AMD Ryzen 7 7700X | |
| AMD Ryzen 5 7600X | |
| AMD Ryzen 9 7950X | |
| Moyenne de la classe Desktop (39.3 - 841, n=30, 2 dernières années) | |
| Intel Core i5-13600K | |
| Cyberpunk 2077 1.6 | |
| 3840x2160 Ultra Preset | |
| AMD Ryzen 9 7950X | |
| AMD Ryzen 7 7700X | |
| AMD Ryzen 9 7900X | |
| AMD Ryzen 5 7600X | |
| 2560x1440 Ultra Preset | |
| AMD Ryzen 9 7950X | |
| AMD Ryzen 7 7700X | |
| AMD Ryzen 9 7900X | |
| AMD Ryzen 5 7600X | |
| 1920x1080 Ultra Preset | |
| AMD Ryzen 9 7900X | |
| AMD Ryzen 7 7700X | |
| AMD Ryzen 9 7950X | |
| AMD Ryzen 5 7600X | |
| F1 22 | |
| 3840x2160 Ultra High Preset AA:T AF:16x | |
| Moyenne de la classe Desktop (31.1 - 113.3, n=14, 2 dernières années) | |
| AMD Ryzen 5 7600X | |
| AMD Ryzen 9 7900X | |
| Intel Core i5-13600K | |
| AMD Ryzen 9 7950X | |
| AMD Ryzen 7 7700X | |
| Intel Core i9-13900K | |
| 2560x1440 Ultra High Preset AA:T AF:16x | |
| Moyenne de la classe Desktop (64.1 - 194.3, n=14, 2 dernières années) | |
| AMD Ryzen 5 7600X | |
| Intel Core i5-13600K | |
| AMD Ryzen 7 7700X | |
| AMD Ryzen 9 7900X | |
| AMD Ryzen 9 7950X | |
| Intel Core i9-13900K | |
| 1920x1080 Ultra High Preset AA:T AF:16x | |
| Moyenne de la classe Desktop (100.2 - 219, n=14, 2 dernières années) | |
| Intel Core i5-13600K | |
| AMD Ryzen 9 7950X | |
| AMD Ryzen 7 7700X | |
| AMD Ryzen 5 7600X | |
| AMD Ryzen 9 7900X | |
| Intel Core i9-13900K | |
| Far Cry 6 | |
| 3840x2160 Ultra Graphics Quality + HD Textures AA:T | |
| Moyenne de la classe Desktop (31.7 - 190.9, n=16, 2 dernières années) | |
| Intel Core i9-13900K | |
| Intel Core i5-13600K | |
| AMD Ryzen 9 7950X | |
| AMD Ryzen 7 7700X | |
| 2560x1440 Ultra Graphics Quality + HD Textures AA:T | |
| Moyenne de la classe Desktop (106.2 - 248, n=16, 2 dernières années) | |
| AMD Ryzen 9 7950X | |
| Intel Core i9-13900K | |
| Intel Core i5-13600K | |
| AMD Ryzen 7 7700X | |
| 1920x1080 Ultra Graphics Quality + HD Textures AA:T | |
| Moyenne de la classe Desktop (134.7 - 254, n=16, 2 dernières années) | |
| Intel Core i9-13900K | |
| Intel Core i5-13600K | |
| AMD Ryzen 9 7950X | |
| AMD Ryzen 7 7700X | |
| Borderlands 3 | |
| 3840x2160 Badass Overall Quality (DX11) | |
| Moyenne de la classe Desktop (76.7 - 168, n=13, 2 dernières années) | |
| AMD Ryzen 9 7900X | |
| AMD Ryzen 5 7600X | |
| Intel Core i5-13600K | |
| Intel Core i9-13900K | |
| AMD Ryzen 9 7950X | |
| AMD Ryzen 7 7700X | |
| 2560x1440 Badass Overall Quality (DX11) | |
| Moyenne de la classe Desktop (129.5 - 223, n=13, 2 dernières années) | |
| AMD Ryzen 9 7900X | |
| AMD Ryzen 5 7600X | |
| Intel Core i9-13900K | |
| Intel Core i5-13600K | |
| AMD Ryzen 9 7950X | |
| AMD Ryzen 7 7700X | |
| 1920x1080 Badass Overall Quality (DX11) | |
| Moyenne de la classe Desktop (6.4 - 248, n=14, 2 dernières années) | |
| AMD Ryzen 9 7900X | |
| Intel Core i9-13900K | |
| AMD Ryzen 5 7600X | |
| Intel Core i5-13600K | |
| AMD Ryzen 9 7950X | |
| AMD Ryzen 7 7700X | |
AMD Ryzen 9 7950X with Nvidia GeForce RTX 3090
| Bas | Moyen | Élevé | Ultra | QHD | 4K | |
|---|---|---|---|---|---|---|
| GTA V (2015) | 187.8 | 187.8 | 187.3 | 155.4 | 150.1 | 181.9 |
| The Witcher 3 (2015) | 703 | 551 | 358 | 175.2 | 150.9 | |
| Dota 2 Reborn (2015) | 293.2 | 259.3 | 248.5 | 222.3 | 208.1 | |
| Final Fantasy XV Benchmark (2018) | 235 | 229 | 229 | 142.4 | 86.8 | |
| X-Plane 11.11 (2018) | 216 | 187.9 | 141 | 122.5 | ||
| Far Cry 5 (2018) | 216 | 196 | 189 | 176 | 169 | 105 |
| Strange Brigade (2018) | 694 | 503 | 404 | 351 | 265 | 158.1 |
| Shadow of the Tomb Raider (2018) | 304 | 255 | 247 | 232 | 169 | 96 |
| Far Cry New Dawn (2019) | 176 | 160 | 156 | 142 | 139 | 105 |
| Metro Exodus (2019) | 281 | 215 | 170.4 | 137 | 112.5 | 73.5 |
| Borderlands 3 (2019) | 219 | 201 | 179.4 | 156.3 | 126.3 | 72.6 |
| F1 2021 (2021) | 619 | 542 | 436 | 225 | 172.8 | 101.8 |
| Far Cry 6 (2021) | 205 | 189 | 169 | 151 | 134 | 84 |
| Forza Horizon 5 (2021) | 337 | 223 | 202 | 129 | 114 | 84 |
| Cyberpunk 2077 1.6 (2022) | 209 | 175.6 | 149.8 | 137.5 | 93.1 | 46.5 |
| Tiny Tina's Wonderlands (2022) | 349 | 289 | 209 | 165.9 | 122 | 69 |
| F1 22 (2022) | 412 | 424 | 355 | 127.9 | 83.3 | 42 |
AMD Ryzen 7 7700X with Nvidia GeForce RTX 3090
| Bas | Moyen | Élevé | Ultra | QHD | 4K | |
|---|---|---|---|---|---|---|
| GTA V (2015) | 187.8 | 187.6 | 186.4 | 155.8 | 148.3 | 180 |
| The Witcher 3 (2015) | 726 | 529 | 344 | 172.4 | 148.3 | |
| Dota 2 Reborn (2015) | 292.3 | 256.4 | 249.8 | 231.1 | 203.5 | |
| Final Fantasy XV Benchmark (2018) | 237 | 237 | 178.3 | 138.4 | 84.3 | |
| X-Plane 11.11 (2018) | 224 | 190.7 | 145.9 | 124 | ||
| Far Cry 5 (2018) | 233 | 201 | 194 | 177 | 168 | 104 |
| Strange Brigade (2018) | 797 | 509 | 404 | 352 | 263 | 157.6 |
| Shadow of the Tomb Raider (2018) | 307 | 252 | 240 | 223 | 168 | 96 |
| Far Cry New Dawn (2019) | 192 | 169 | 162 | 144 | 138 | 104 |
| Metro Exodus (2019) | 317 | 219 | 171.6 | 136.6 | 112.1 | 73.3 |
| Borderlands 3 (2019) | 230 | 197.3 | 174.9 | 153 | 122.6 | 70.3 |
| F1 2021 (2021) | 663 | 543 | 453 | 222 | 169.3 | 101.1 |
| Far Cry 6 (2021) | 196 | 183 | 163 | 149 | 127 | 82 |
| Forza Horizon 5 (2021) | 295 | 205 | 193 | 129 | 114 | 84 |
| Cyberpunk 2077 1.6 (2022) | 205 | 172.1 | 151.3 | 137.7 | 92.8 | 46.2 |
| Tiny Tina's Wonderlands (2022) | 359 | 287 | 204 | 161.8 | 118.8 | 67.5 |
| F1 22 (2022) | 400 | 415 | 352 | 127.2 | 83.9 | 42 |
Consommation d'énergie : Gains d'efficacité multi-core substantiels en mode Eco
Le Zen 4 " Raphaël " d'AMD semble être assez économe en énergie par rapport à la concurrence de Raptor Lake. La consommation totale du système dans le test multi-core Cinebench R15 avec le système basé sur le Ryzen 9 7950X est inférieure de 24% par rapport au PC Core i9-13900K, bien qu'elle soit également supérieure de 12% par rapport au Core i9-12900K.
La configuration basée sur le Ryzen 7 7700X consomme 16% d'énergie en moins dans Cinebench R15 multi-core par rapport au Core i5-13600K et est plus ou moins similaire à un système équipé du Ryzen 9 5900X.
Le mode Eco permet d'obtenir des gains d'efficacité énergétique significatifs. Dans le cas du Ryzen 9 7950X, les exécutions à 105 W et 65 W sont respectivement 29 % et 47 % plus efficaces que le TDP par défaut de 170 W dans Cinebench R15 multi-core.
De même, le Ryzen 7700X de 65 W peut se permettre une efficacité supérieure de 17 % dans le même benchmark par rapport au TDP de fonctionnement par défaut de 105 W du CPU.
Étant donné que les performances mono-coeur sont relativement peu affectées par le changement de TDP, il ne semble pas y avoir d'avantage perceptible en termes d'efficacité pour les jeux, comme on peut le voir dans les graphiques d'efficacité de The Witcher 3 1080p Ultra. Cela dit, l'utilisation de ces puces à des TDP inférieurs entraîne une réduction de la consommation d'énergie globale.
Power Consumption: External Monitor
| Power Consumption / Cinebench R15 Multi Efficiency (external Monitor) | |
| AMD Ryzen 9 7950X ECO 65 W, NVIDIA GeForce RTX 3090 | |
| Moyenne de la classe Desktop (13.7 - 41.2, n=14, 2 dernières années) | |
| AMD Ryzen 9 7950X ECO 105 W, NVIDIA GeForce RTX 3090 | |
| AMD Ryzen 9 5950X, NVIDIA Titan RTX | |
| AMD Ryzen 9 7950X, NVIDIA GeForce RTX 3090 | |
| Moyenne NVIDIA GeForce RTX 3090 (11.7 - 25.2, n=13) | |
| AMD Ryzen 9 5900X, NVIDIA Titan RTX | |
| AMD Ryzen 9 7900X, NVIDIA GeForce RTX 3090 | |
| AMD Ryzen 7 7700X ECO 65 W, NVIDIA GeForce RTX 3090 | |
| AMD Ryzen 7 7700X, NVIDIA GeForce RTX 3090 | |
| Intel Core i9-13900K, NVIDIA GeForce RTX 3090 | |
| Intel Core i5-13600K, NVIDIA GeForce RTX 3090 | |
| Intel Core i9-12900K, NVIDIA Titan RTX | |
| Intel Core i5-12600K, NVIDIA Titan RTX | |
| AMD Ryzen 7 5800X, NVIDIA Titan RTX | |
| AMD Ryzen 5 7600X, NVIDIA GeForce RTX 3090 | |
| AMD Ryzen 5 5600X, NVIDIA Titan RTX | |
| AMD Ryzen 7 5800X3D, NVIDIA GeForce RTX 3090 Ti | |
| Power Consumption / Witcher 3 ultra Efficiency (external Monitor) | |
| Moyenne de la classe Desktop (0.113 - 0.653, n=44, 2 dernières années) | |
| Intel Core i5-13600K, NVIDIA GeForce RTX 3090 | |
| AMD Ryzen 5 7600X, NVIDIA GeForce RTX 3090 | |
| Intel Core i5-12600K, NVIDIA Titan RTX | |
| Moyenne NVIDIA GeForce RTX 3090 (0.268 - 0.3954, n=15) | |
| AMD Ryzen 7 5800X3D, NVIDIA GeForce RTX 3090 Ti | |
| AMD Ryzen 5 5600X, NVIDIA Titan RTX | |
| AMD Ryzen 9 7900X, NVIDIA GeForce RTX 3090 | |
| Intel Core i9-13900K, NVIDIA GeForce RTX 3090 | |
| AMD Ryzen 7 7700X, NVIDIA GeForce RTX 3090 | |
| AMD Ryzen 7 5800X, NVIDIA Titan RTX | |
| AMD Ryzen 9 7950X ECO 105 W, NVIDIA GeForce RTX 3090 | |
| AMD Ryzen 9 7950X ECO 65 W, NVIDIA GeForce RTX 3090 | |
| AMD Ryzen 9 7950X, NVIDIA GeForce RTX 3090 | |
| AMD Ryzen 7 7700X ECO 65 W, NVIDIA GeForce RTX 3090 | |
| AMD Ryzen 9 5900X, NVIDIA Titan RTX | |
| AMD Ryzen 9 5950X, NVIDIA Titan RTX | |
| Intel Core i9-12900K, NVIDIA Titan RTX | |
| Power Consumption / Cinebench R15 Multi (external Monitor) | |
| Intel Core i9-13900K, NVIDIA GeForce RTX 3090 | |
| AMD Ryzen 9 7950X, NVIDIA GeForce RTX 3090 (Idle: 95.2 W) | |
| Intel Core i9-12900K, NVIDIA Titan RTX (Idle: 70.5 W) | |
| AMD Ryzen 9 7900X, NVIDIA GeForce RTX 3090 | |
| Intel Core i5-13600K, NVIDIA GeForce RTX 3090 | |
| Moyenne NVIDIA GeForce RTX 3090 (Idle: 149.4 - 480, n=14 W) | |
| AMD Ryzen 9 7950X ECO 105 W, NVIDIA GeForce RTX 3090 (Idle: 93.4 W) | |
| AMD Ryzen 7 7700X, NVIDIA GeForce RTX 3090 (Idle: 89.8 W) | |
| AMD Ryzen 9 5900X, NVIDIA Titan RTX (Idle: 78.1 W) | |
| Moyenne de la classe Desktop (Idle: 78.9 - 356, n=14, 2 dernières années W) | |
| AMD Ryzen 9 5950X, NVIDIA Titan RTX (Idle: 78 W) | |
| AMD Ryzen 7 5800X, NVIDIA Titan RTX (Idle: 77.5 W) | |
| AMD Ryzen 5 7600X, NVIDIA GeForce RTX 3090 | |
| AMD Ryzen 7 5800X3D, NVIDIA GeForce RTX 3090 Ti (Idle: 102 W) | |
| Intel Core i5-12600K, NVIDIA Titan RTX (Idle: 70.45 W) | |
| AMD Ryzen 7 7700X ECO 65 W, NVIDIA GeForce RTX 3090 | |
| AMD Ryzen 9 7950X ECO 65 W, NVIDIA GeForce RTX 3090 (Idle: 93.1 W) | |
| AMD Ryzen 5 5600X, NVIDIA Titan RTX (Idle: 79.23 W) | |
| Power Consumption / Prime95 V2810 Stress (external Monitor) | |
| Intel Core i9-13900K, NVIDIA GeForce RTX 3090 | |
| Intel Core i5-13600K, NVIDIA GeForce RTX 3090 | |
| AMD Ryzen 9 7950X, NVIDIA GeForce RTX 3090 (Idle: 95.2 W) | |
| AMD Ryzen 9 7900X, NVIDIA GeForce RTX 3090 | |
| Intel Core i9-12900K, NVIDIA Titan RTX (Idle: 70.5 W) | |
| Moyenne NVIDIA GeForce RTX 3090 (Idle: 163.2 - 471, n=14 W) | |
| Intel Core i5-12600K, NVIDIA Titan RTX (Idle: 70.45 W) | |
| AMD Ryzen 9 7950X ECO 105 W, NVIDIA GeForce RTX 3090 (Idle: 93.4 W) | |
| AMD Ryzen 9 5950X, NVIDIA Titan RTX (Idle: 78 W) | |
| AMD Ryzen 7 5800X, NVIDIA Titan RTX (Idle: 77.5 W) | |
| AMD Ryzen 9 5900X, NVIDIA Titan RTX (Idle: 78.1 W) | |
| Moyenne de la classe Desktop (Idle: 75.3 - 379, n=14, 2 dernières années W) | |
| AMD Ryzen 7 7700X, NVIDIA GeForce RTX 3090 (Idle: 89.8 W) | |
| AMD Ryzen 5 7600X, NVIDIA GeForce RTX 3090 | |
| AMD Ryzen 7 5800X3D, NVIDIA GeForce RTX 3090 Ti (Idle: 102 W) | |
| AMD Ryzen 7 7700X ECO 65 W, NVIDIA GeForce RTX 3090 | |
| AMD Ryzen 9 7950X ECO 65 W, NVIDIA GeForce RTX 3090 (Idle: 93.1 W) | |
| AMD Ryzen 5 5600X, NVIDIA Titan RTX (Idle: 79.23 W) | |
| Power Consumption / The Witcher 3 ultra (external Monitor) | |
| AMD Ryzen 7 5800X3D, NVIDIA GeForce RTX 3090 Ti (Idle: 102 W) | |
| AMD Ryzen 9 7900X, NVIDIA GeForce RTX 3090 | |
| AMD Ryzen 9 7950X, NVIDIA GeForce RTX 3090 (Idle: 95.2 W) | |
| AMD Ryzen 9 7950X ECO 105 W, NVIDIA GeForce RTX 3090 (Idle: 93.4 W) | |
| AMD Ryzen 9 7950X ECO 65 W, NVIDIA GeForce RTX 3090 (Idle: 93.1 W) | |
| Intel Core i9-13900K, NVIDIA GeForce RTX 3090 | |
| AMD Ryzen 7 7700X ECO 65 W, NVIDIA GeForce RTX 3090 | |
| Moyenne NVIDIA GeForce RTX 3090 (Idle: 464 - 597, n=18 W) | |
| AMD Ryzen 5 7600X, NVIDIA GeForce RTX 3090 | |
| AMD Ryzen 7 7700X, NVIDIA GeForce RTX 3090 (Idle: 89.8 W) | |
| Intel Core i5-13600K, NVIDIA GeForce RTX 3090 | |
| Intel Core i9-12900K, NVIDIA Titan RTX (Idle: 70.5 W) | |
| AMD Ryzen 9 5950X, NVIDIA Titan RTX (Idle: 78 W) | |
| AMD Ryzen 9 5900X, NVIDIA Titan RTX (Idle: 78.1 W) | |
| Moyenne de la classe Desktop (Idle: 69 - 692, n=44, 2 dernières années W) | |
| AMD Ryzen 7 5800X, NVIDIA Titan RTX (Idle: 77.5 W) | |
| AMD Ryzen 5 5600X, NVIDIA Titan RTX (Idle: 79.23 W) | |
| Intel Core i5-12600K, NVIDIA Titan RTX (Idle: 70.45 W) | |
* ... Moindre est la valeur, meilleures sont les performances
Points positifs
Points négatifs
Verdict : vous ne pouvez pas vous tromper avec le Zen 4


l'année 2022 s'est avérée être une année très intéressante pour les passionnés de PC. Nous avons vu Nvidia et AMD présenter leurs architectures GPU Ada Lovelace et RDNA 3, tandis qu'Intel et AMD se sont affrontés avec leurs gammes Raptor Lake et Zen 4 Raphael.
L'AMD Ryzen 9 7950X constitue une option convaincante pour tous ceux qui recherchent un processeur de bureau grand public phare pour alimenter leurs projets créatifs et ne poser aucun goulot d'étranglement dans les jeux. Les performances du Ryzen 9 7950X sont comparables à celles du Core i9-13900K dans les benchmarks globaux de CPU. Individuellement, certains tests favorisent le fleuron de Raptor Lake, mais les différences ne sont pas drastiques pour être perceptibles dans le monde réel.
Comparativement, le Ryzen 7 7700X est en retard de 25% sur le Ryzen 9 7950X. Cependant, cette puce 8C/16T peut faire mieux qu'un Core i5-13600K ou même un Core i9-12900Kce qui mérite d'être apprécié.
Les AMD Ryzen 9 7950X et Ryzen 7 7700X représentent une mise à niveau substantielle par rapport à Zen 3 et garantissent que les offres Raptor Lake d'Intel ne resteront pas sans concurrence. L'option permettant d'exploiter le mode Eco sans pénalités de performance significatives est une cerise sur le gâteau. "
Le Ryzen 9 7950X et le Ryzen 7 7700X sont tous deux parfaits pour la productivité générale. Le Ryzen 9 7950X semble être une meilleure option par rapport au Core i9-13900K, si votre flux de travail comprend beaucoup de mathématiques en virgule flottante, comme le prouvent nos tests AIDA64.
Le mode Eco is est peut-être le meilleur argument de vente de cette génération de processeurs AMD. Le fait que vous puissiez obtenir un gain assez significatif avec un Ryzen 9 7950X de 65 W par rapport à un Core i9-12900K de 241 W n'est pas à dédaigner. Les utilisateurs à la recherche d'une efficacité énergétique accrue pour des flux de travail moins exigeants trouveront que le Ryzen 9 7950X à 65 W peut être jusqu'à 47% plus efficace qu'avec les paramètres d'origine.
Le Ryzen 7 7700X est déjà une puce très efficace en soi, mais l'abaissement du TDP à 65 W se traduit toujours par des économies d'énergie palpables. Les joueurs n'ont pas à s'inquiéter de perdre beaucoup de performances avec un TDP plus faible, puisque les performances monocœurs restent relativement inchangées.
Le socket AM4 a été supprimé par la nouvelle plateforme AM5, qui apporte avec elle le support natif de DDR5 et PCIe Gen 5. Contrairement à Intel, AMD a choisi de rendre AM5 exclusif à la DDR5. La DDR5 est payante pour l'instant, et il faudra un certain temps avant que les prix ne deviennent plus stables et comparables à ceux de la DDR4.
Vous devez également prendre en compte le coût d'une mise à niveau de la carte mère - les cartes mères X670 commencent souvent autour de 400 $ US, avec des fleurons X670E entièrement équipés dépassant même 1 200 $ US pour la seule carte. La bonne nouvelle, cependant, est que votre système de refroidissement actuel sera probablement adapté et que la plate-forme sera prise en charge au moins jusqu'en 2025.
Avec le Ryzen 9 7950X et le Ryzen 7 7700X, et aussi avec le Ryzen 9 7900X et Ryzen 5 7600XaMD a dissipé les craintes que les puces Zen 4 " Raphael " ne soient pas à la hauteur de Raptor Lake d'Intel. Zen 4 présente une mise à niveau convaincante, malgré l'investissement initial dans la plateforme AM5.
L'arrivée imminente des Ryzen 7000 X3D dans les mois à venir offre une perspective encore plus séduisante, et les choses ne peuvent que s'améliorer à partir de maintenant.
Prix et disponibilité
Intel semble avoir un avantage avec les prix de lancement MSRPs cette fois-ci. Le Core i9-13900K a été lancé à 589 $US MSRP, mais il est actuellement vendu au détail à 660 $US. Le AMD Ryzen 9 7950X, d'autre part, a été lancé à 699 $ US, mais vous pouvez maintenant obtenir le mastodonte 16C/32T pour 574 $ US sur Best Buy et Newegg. Les prix sur le site Amazon US storesemble toutefois avoir augmenté à 748 $ US
En Inde, le Ryzen 9 7950X a été lancé avec un PDSF de ₹67,999 mais est maintenant disponible pour ₹62,749 sur Amazon India et pour environ ₹58,000 chez d'autres détaillants.
L'AMD Ryzen 7 7700X est également disponible à un prix réduit de 350 $US sur Best Buy et Newegg. En Inde, le processeur avait un prix de lancement de ₹39,499 mais peut être acheté pour environ ₹34,000 sur Amazon India et d'autres magasins.
Price comparison

