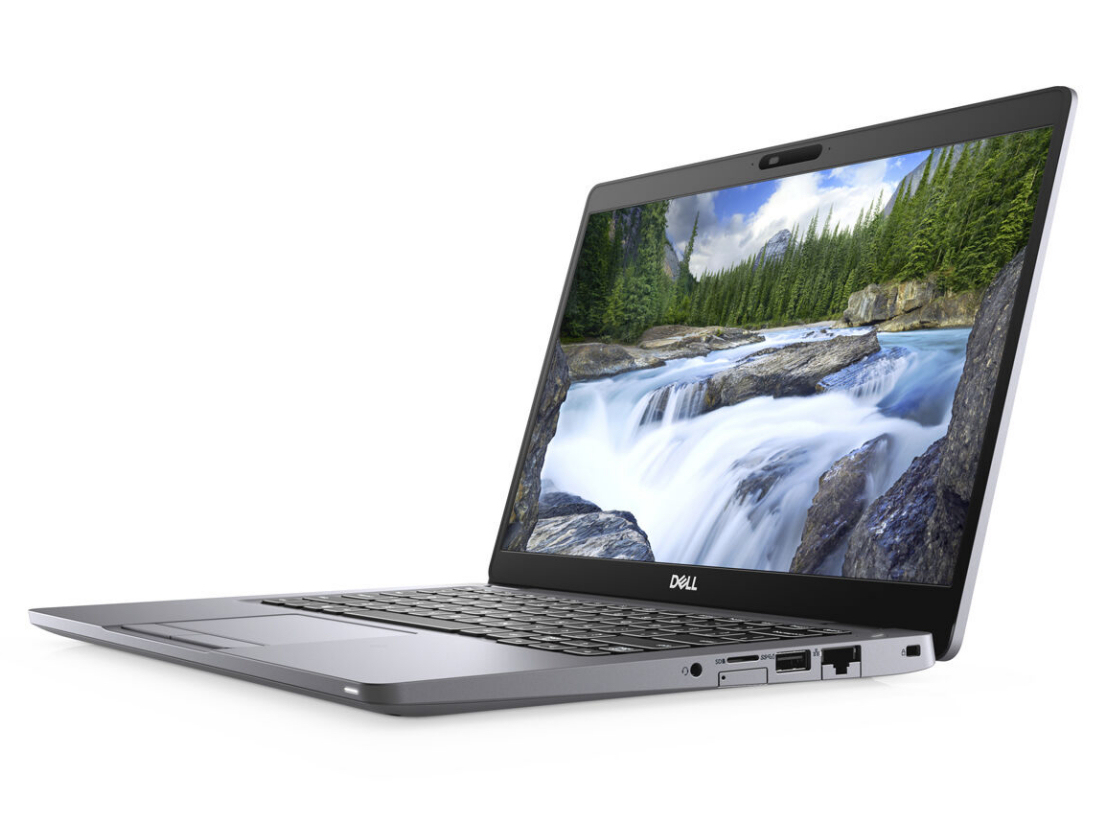
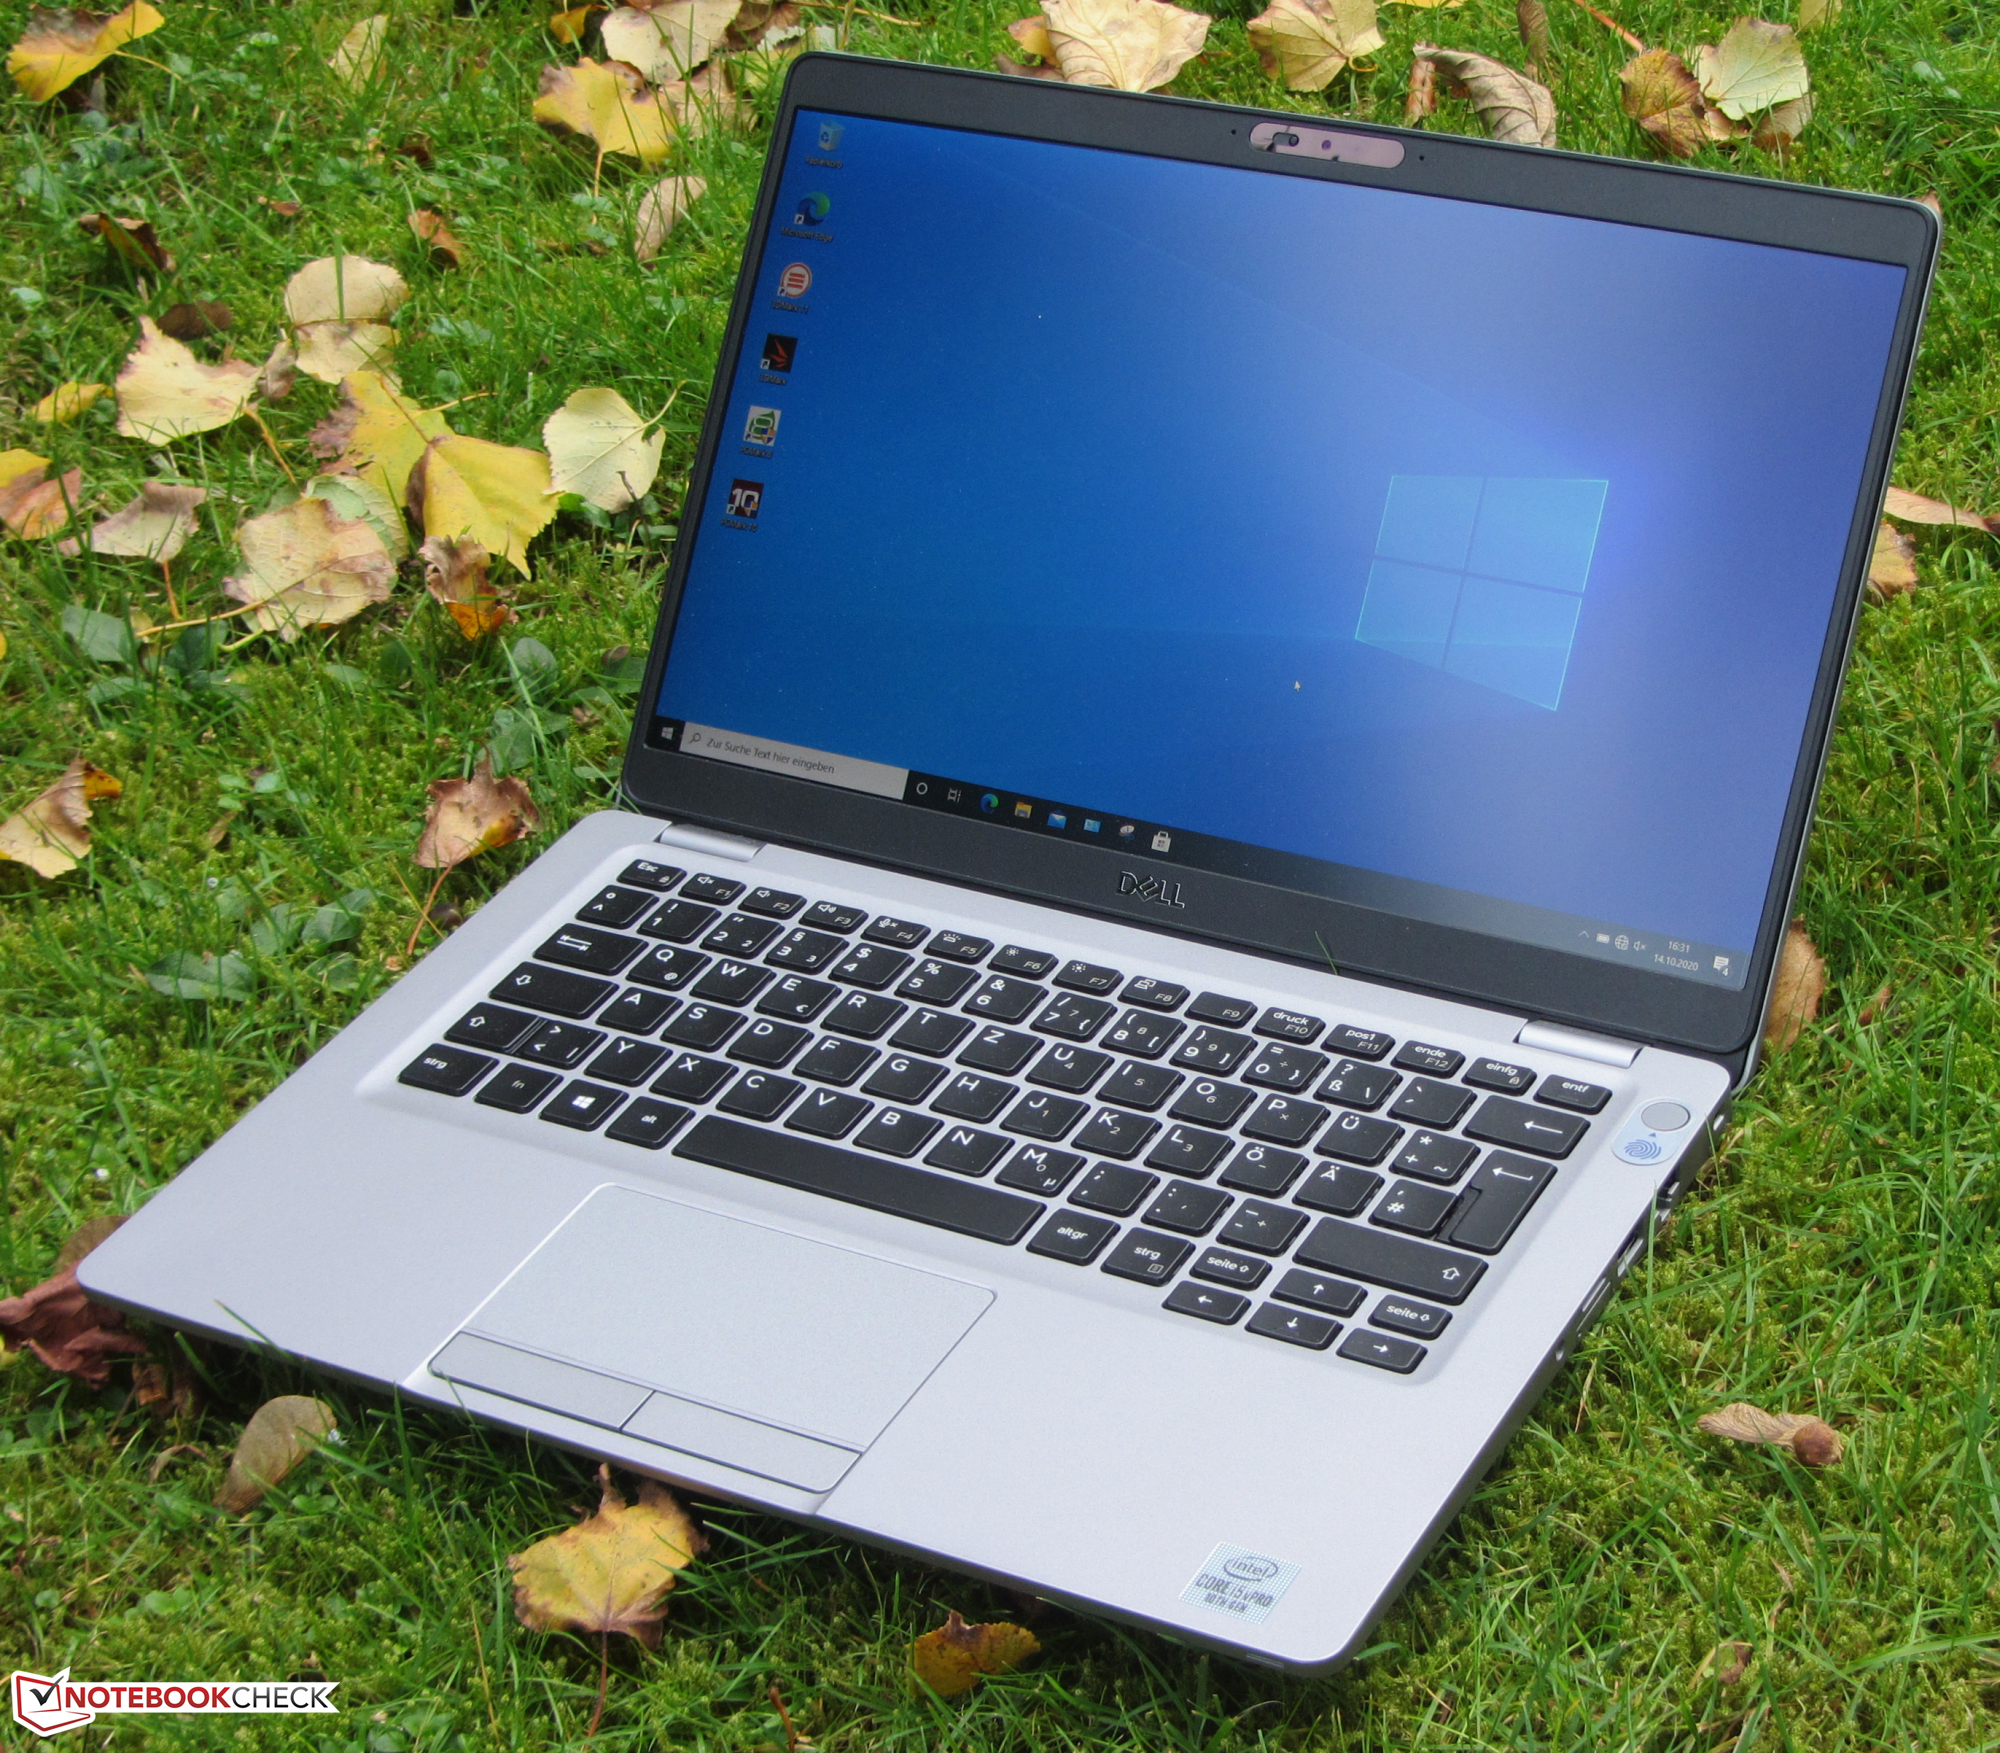
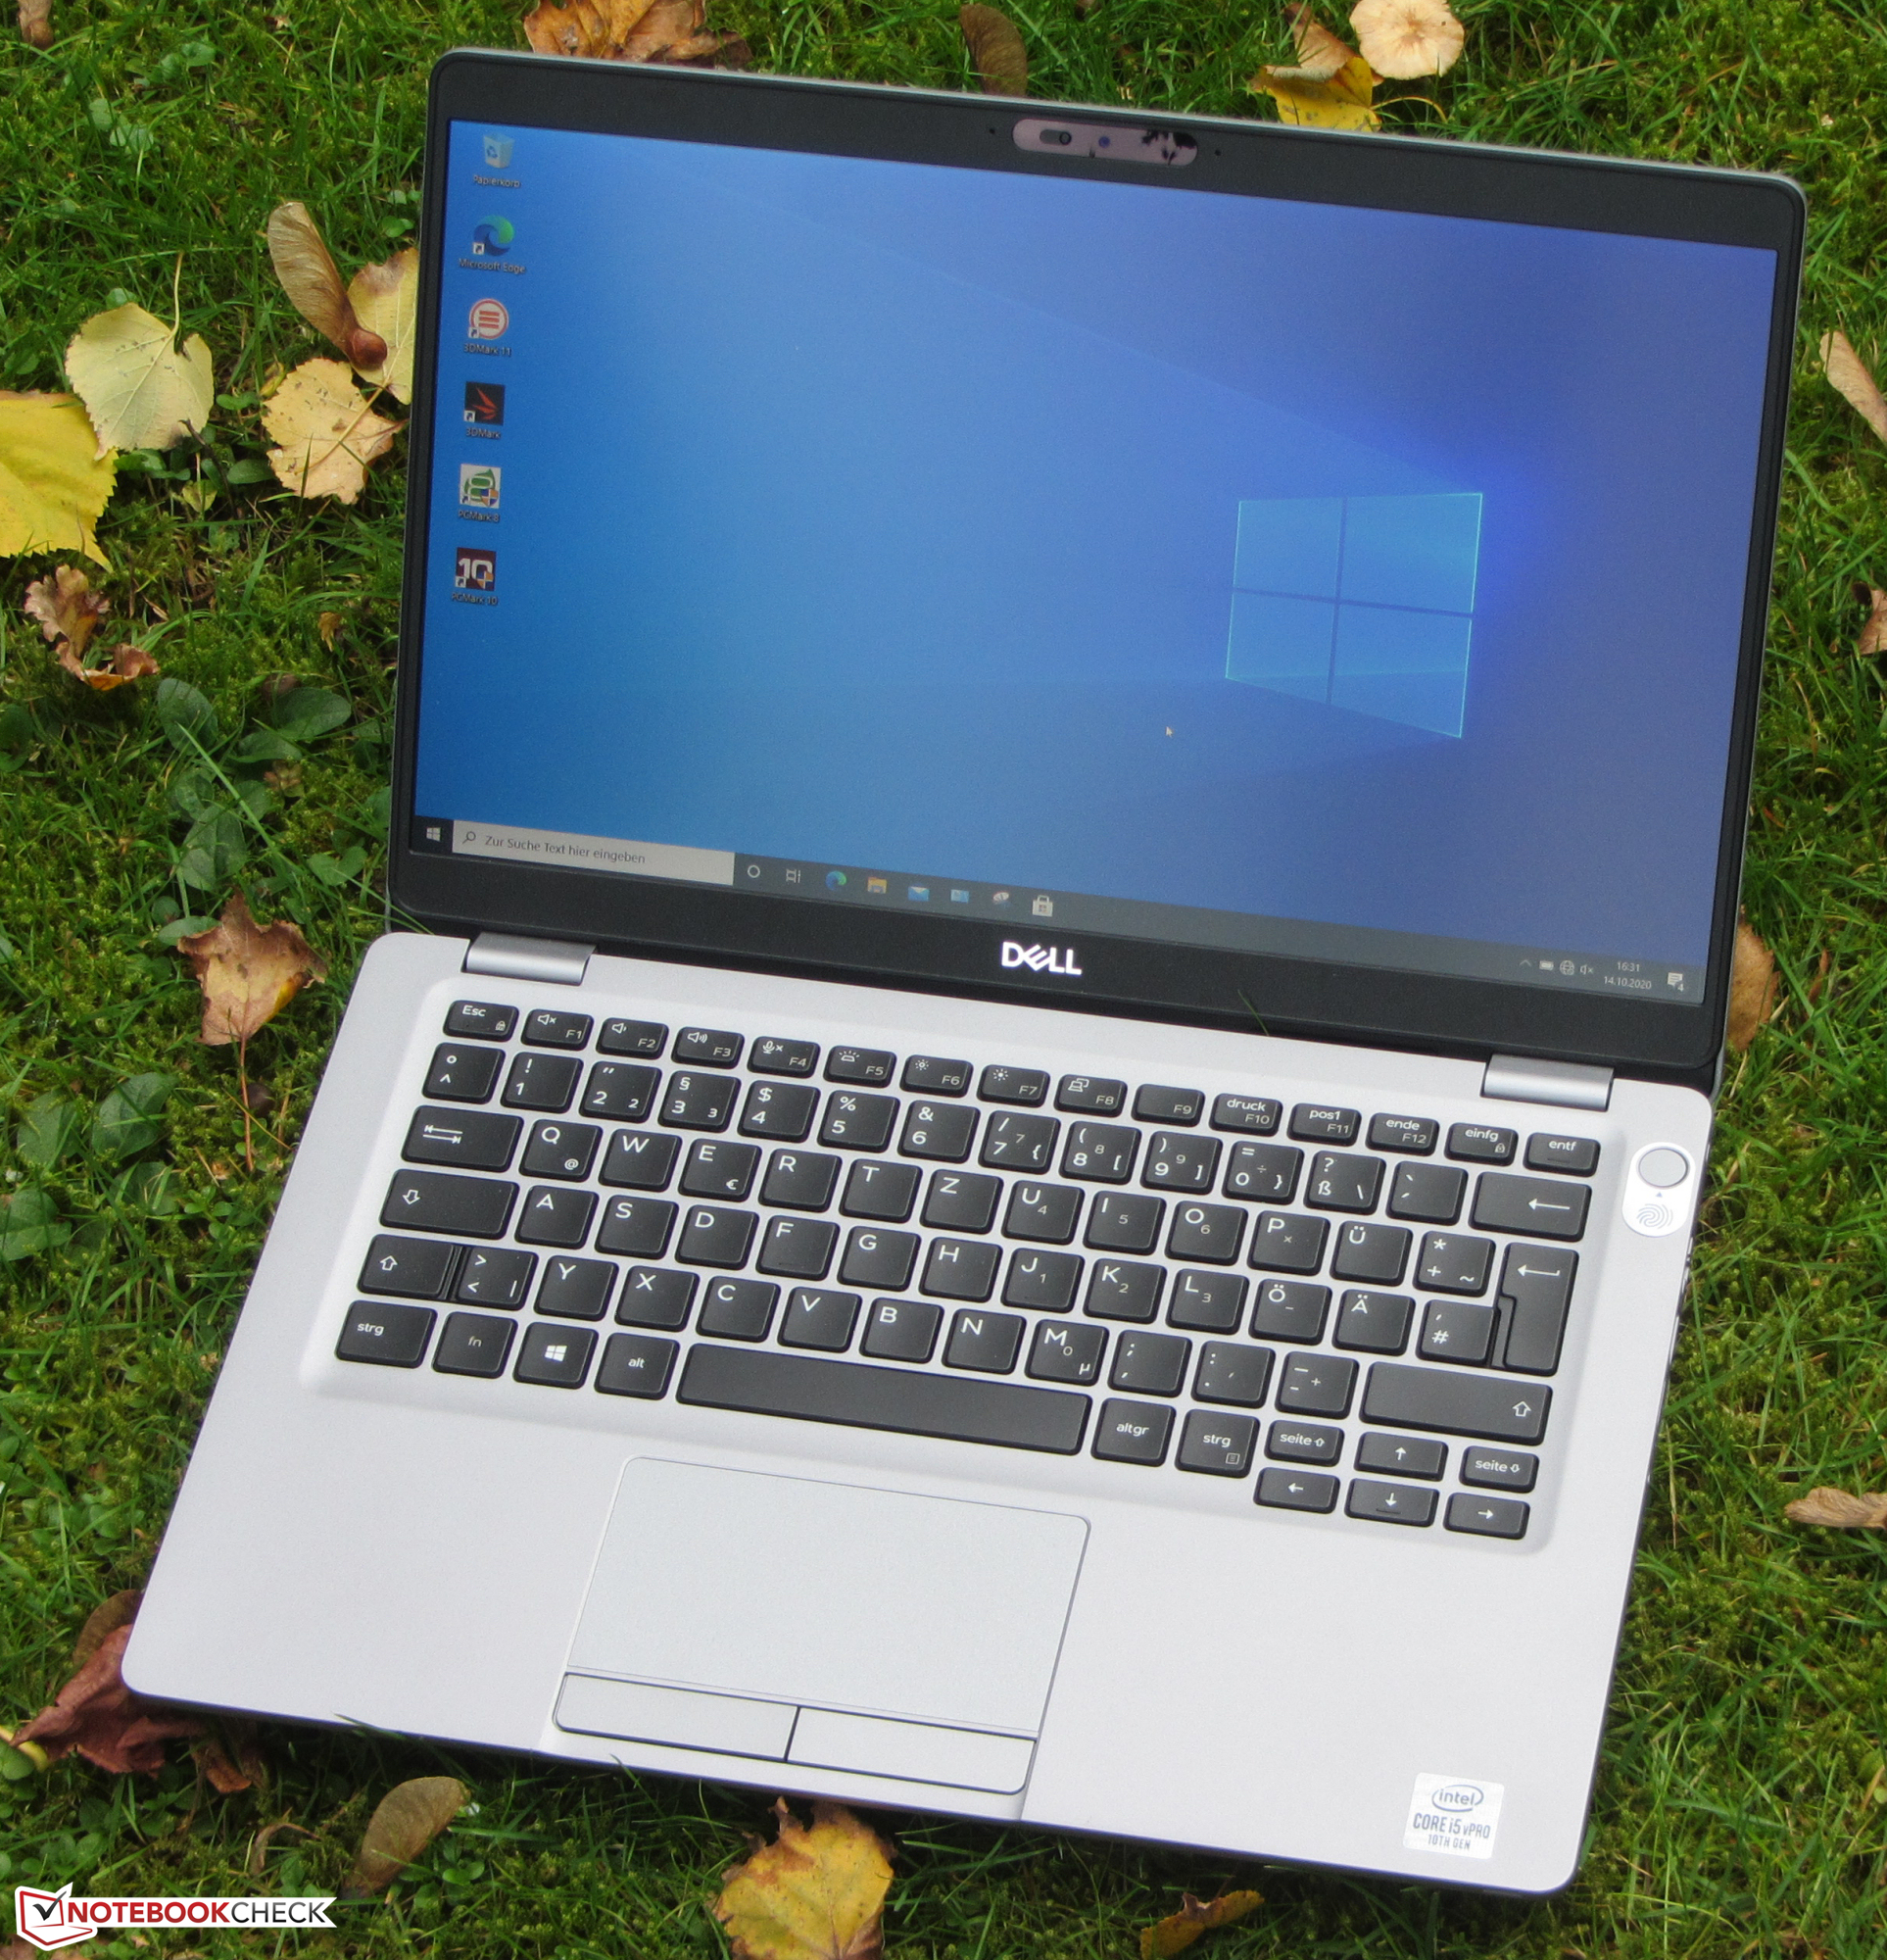
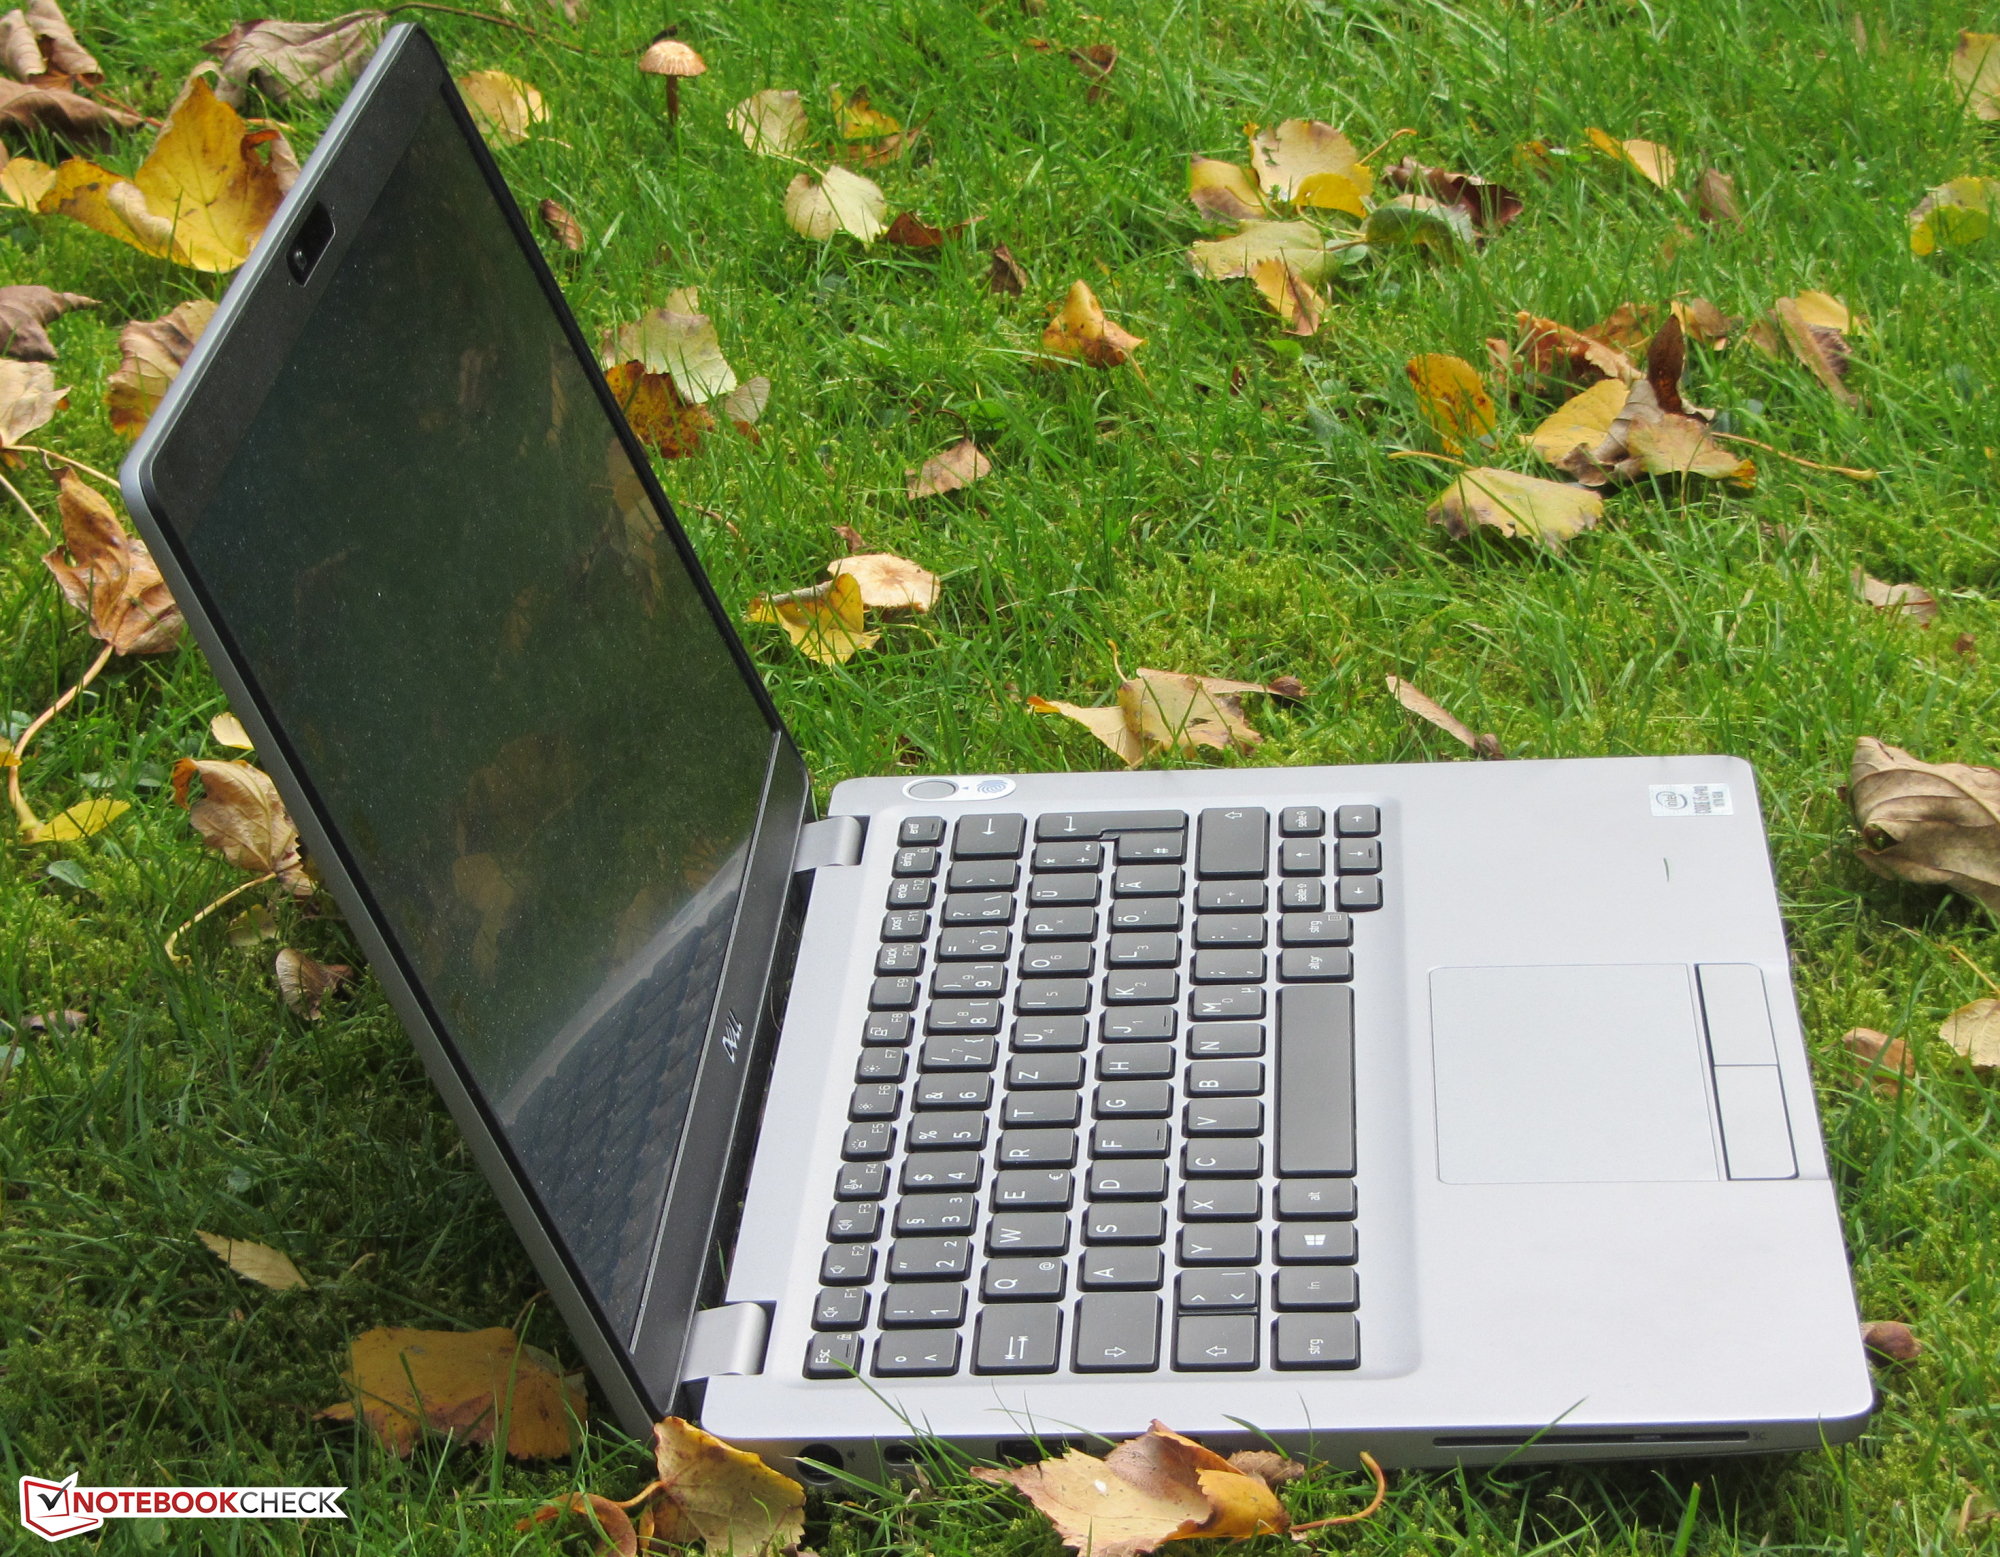
Test du Dell Latitude 5310 (i5-10310U, UHD 620, FHD) : portable pro avec une bonne autonomie
Note | Date | Modèle | Poids | Épaisseur | Taille | Résolution | Prix |
|---|---|---|---|---|---|---|---|
| 86.8 % v7 (old) | 11/20 | Dell Latitude 5310-GXX0D i5-10310U, UHD Graphics 620 | 1.2 kg | 19.7 mm | 13.30" | 1920x1080 | |
| 88.7 % v7 (old) | 10/20 | HP EliteBook 830 G7 i7-10810U, UHD Graphics 620 | 1.3 kg | 18.1 mm | 13.30" | 1920x1080 | |
| 83.7 % v7 (old) | Fujitsu Lifebook U939 i5 i5-8265U, UHD Graphics 620 | 900 g | 15 mm | 13.30" | 1920x1080 | ||
| 85.1 % v7 (old) | 06/20 | Dynabook Portege X30L-G1331 i5-10210U, UHD Graphics 620 | 859 g | 17.9 mm | 13.30" | 1920x1080 | |
| 89.5 % v7 (old) | 09/20 | Lenovo ThinkPad X13-20UGS00800 R7 PRO 4750U, Vega 7 | 1.3 kg | 16.9 mm | 13.30" | 1920x1080 | |
| 88 % v7 (old) | 09/20 | Lenovo ThinkPad X13-20T20033GE i5-10210U, UHD Graphics 620 | 1.3 kg | 16.9 mm | 13.30" | 1920x1080 |
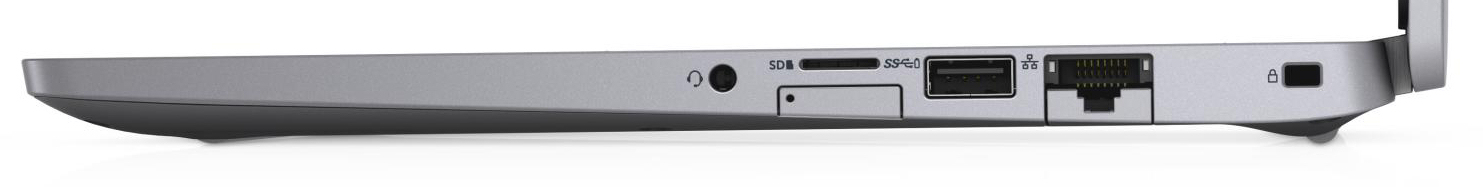
| SD Card Reader | |
| average JPG Copy Test (av. of 3 runs) | |
| Fujitsu Lifebook U939 i5 (Toshiba Exceria Pro SDXC 64 GB UHS-II) | |
| Dell Latitude 5310-GXX0D (Toshiba Exceria Pro M501 microSDXC 64GB) | |
| Dynabook Portege X30L-G1331 (Toshiba Exceria Pro M501 64 GB UHS-II) | |
| Moyenne de la classe Subnotebook (23.7 - 188, n=9, 2 dernières années) | |
| Lenovo ThinkPad X13-20UGS00800 (Toshiba Exceria Pro M501 64 GB UHS-II) | |
| Lenovo ThinkPad X13-20T20033GE (Toshiba Exceria Pro M501 64 GB UHS-II) | |
| maximum AS SSD Seq Read Test (1GB) | |
| Dell Latitude 5310-GXX0D (Toshiba Exceria Pro M501 microSDXC 64GB) | |
| Fujitsu Lifebook U939 i5 (Toshiba Exceria Pro SDXC 64 GB UHS-II) | |
| Moyenne de la classe Subnotebook (24.9 - 195, n=8, 2 dernières années) | |
| Dynabook Portege X30L-G1331 (Toshiba Exceria Pro M501 64 GB UHS-II) | |
| Lenovo ThinkPad X13-20UGS00800 (Toshiba Exceria Pro M501 64 GB UHS-II) | |
| Lenovo ThinkPad X13-20T20033GE (Toshiba Exceria Pro M501 64 GB UHS-II) | |
| Networking | |
| iperf3 transmit AX12 | |
| Dell Latitude 5310-GXX0D | |
| Dynabook Portege X30L-G1331 | |
| Moyenne Intel Wi-Fi 6 AX201 (49.8 - 1775, n=324) | |
| HP EliteBook 830 G7 | |
| Lenovo ThinkPad X13-20UGS00800 | |
| Lenovo ThinkPad X13-20T20033GE | |
| Fujitsu Lifebook U939 i5 | |
| iperf3 receive AX12 | |
| Lenovo ThinkPad X13-20T20033GE | |
| Dell Latitude 5310-GXX0D | |
| HP EliteBook 830 G7 | |
| Lenovo ThinkPad X13-20UGS00800 | |
| Moyenne Intel Wi-Fi 6 AX201 (136 - 1743, n=324) | |
| Dynabook Portege X30L-G1331 | |
| Fujitsu Lifebook U939 i5 | |


| |||||||||||||||||||||||||
Homogénéité de la luminosité: 83 %
Valeur mesurée au centre, sur batterie: 303 cd/m²
Contraste: 927:1 (Valeurs des noirs: 0.33 cd/m²)
ΔE ColorChecker Calman: 6.89 | ∀{0.5-29.43 Ø4.72}
ΔE Greyscale Calman: 7.32 | ∀{0.09-98 Ø4.97}
93% sRGB (Argyll 1.6.3 3D)
59% AdobeRGB 1998 (Argyll 1.6.3 3D)
63.2% AdobeRGB 1998 (Argyll 3D)
90.8% sRGB (Argyll 3D)
61.8% Display P3 (Argyll 3D)
Gamma: 3.74
CCT: 6101 K
| Dell Latitude 5310-GXX0D LG Philips LP133WF7-SPF1, IPS, 1920x1080, 13.3" | HP EliteBook 830 G7 Chi Mei CMN13A9, IPS, 1920x1080, 13.3" | Fujitsu Lifebook U939 i5 Sharp SHP14BD, IPS, 1920x1080, 13.3" | Dynabook Portege X30L-G1331 Toshiba TOS508F, IPS, 1920x1080, 13.3" | Lenovo ThinkPad X13-20UGS00800 B133HAK01.1, IPS LED, 1920x1080, 13.3" | Lenovo ThinkPad X13-20T20033GE Lenovo B133HAK01.1, IPS, 1920x1080, 13.3" | |
|---|---|---|---|---|---|---|
| Display | 7% | 5% | 7% | 5% | 6% | |
| Display P3 Coverage (%) | 61.8 | 65.7 6% | 65.3 6% | 66.9 8% | 64.8 5% | 66 7% |
| sRGB Coverage (%) | 90.8 | 97.4 7% | 95 5% | 97.6 7% | 95.6 5% | 96.2 6% |
| AdobeRGB 1998 Coverage (%) | 63.2 | 67.4 7% | 66 4% | 67.8 7% | 65.7 4% | 67.2 6% |
| Response Times | 4% | -1% | -9% | -3% | 3% | |
| Response Time Grey 50% / Grey 80% * (ms) | 51 ? | 46.8 ? 8% | 55.2 ? -8% | 54.8 ? -7% | 56.8 ? -11% | 52.8 ? -4% |
| Response Time Black / White * (ms) | 32 ? | 32 ? -0% | 29.6 ? 7% | 35.6 ? -11% | 30 ? 6% | 29.2 ? 9% |
| PWM Frequency (Hz) | 26600 ? | 211.9 ? | 23810 ? | |||
| Screen | 39% | 16% | 36% | 18% | 18% | |
| Brightness middle (cd/m²) | 306 | 454.5 49% | 384 25% | 482 58% | 331 8% | 359 17% |
| Brightness (cd/m²) | 293 | 435 48% | 362 24% | 452 54% | 315 8% | 342 17% |
| Brightness Distribution (%) | 83 | 91 10% | 90 8% | 91 10% | 90 8% | 90 8% |
| Black Level * (cd/m²) | 0.33 | 0.27 18% | 0.31 6% | 0.4 -21% | 0.21 36% | 0.21 36% |
| Contrast (:1) | 927 | 1683 82% | 1239 34% | 1205 30% | 1576 70% | 1710 84% |
| Colorchecker dE 2000 * | 6.89 | 3.12 55% | 4.8 30% | 1.85 73% | 6.1 11% | 6.7 3% |
| Colorchecker dE 2000 max. * | 11.66 | 4.85 58% | 9.4 19% | 3.08 74% | 10 14% | 10.9 7% |
| Greyscale dE 2000 * | 7.32 | 3.1 58% | 6.6 10% | 2 73% | 6.3 14% | 7.4 -1% |
| Gamma | 3.74 59% | 2.01 109% | 2.2 100% | 2.1 105% | 2.77 79% | 2.85 77% |
| CCT | 6101 107% | 6902 94% | 7999 81% | 6822 95% | 6938 94% | 6309 103% |
| Color Space (Percent of AdobeRGB 1998) (%) | 59 | 61.5 4% | 61.2 4% | 62.5 6% | 60.7 3% | 61.7 5% |
| Color Space (Percent of sRGB) (%) | 93 | 97 4% | 95 2% | 97.7 5% | 95.4 3% | 95.9 3% |
| Colorchecker dE 2000 calibrated * | 1.97 | 1.4 | 1.2 | 1.2 | 1.3 | |
| Moyenne finale (programmes/paramètres) | 17% /
28% | 7% /
12% | 11% /
24% | 7% /
12% | 9% /
14% |
* ... Moindre est la valeur, meilleures sont les performances
Temps de réponse de l'écran
| ↔ Temps de réponse noir à blanc | ||
|---|---|---|
| 32 ms ... hausse ↗ et chute ↘ combinées | ↗ 18 ms hausse | 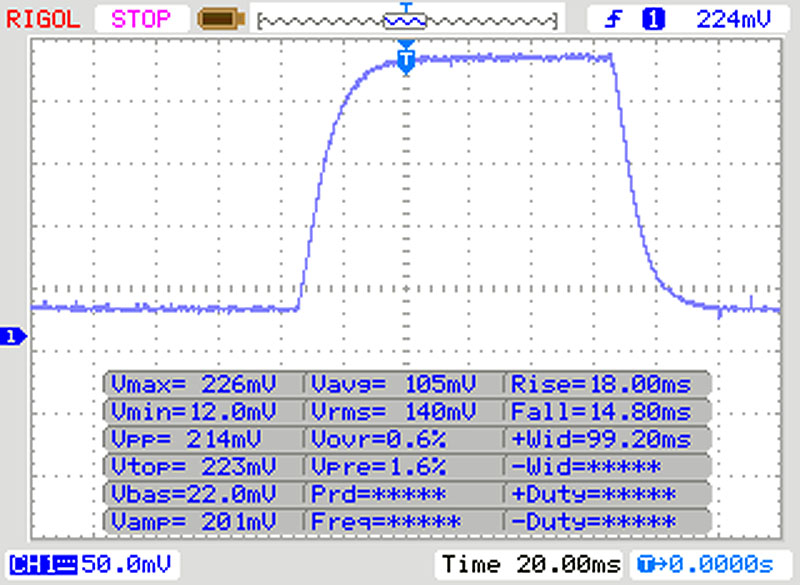 |
| ↘ 14 ms chute | ||
| L'écran souffre de latences très élevées, à éviter pour le jeu. En comparaison, tous les appareils testés affichent entre 0.1 (minimum) et 240 (maximum) ms. » 86 % des appareils testés affichent de meilleures performances. Cela signifie que les latences relevées sont moins bonnes que la moyenne (19.8 ms) de tous les appareils testés. | ||
| ↔ Temps de réponse gris 50% à gris 80% | ||
| 51 ms ... hausse ↗ et chute ↘ combinées | ↗ 23 ms hausse | 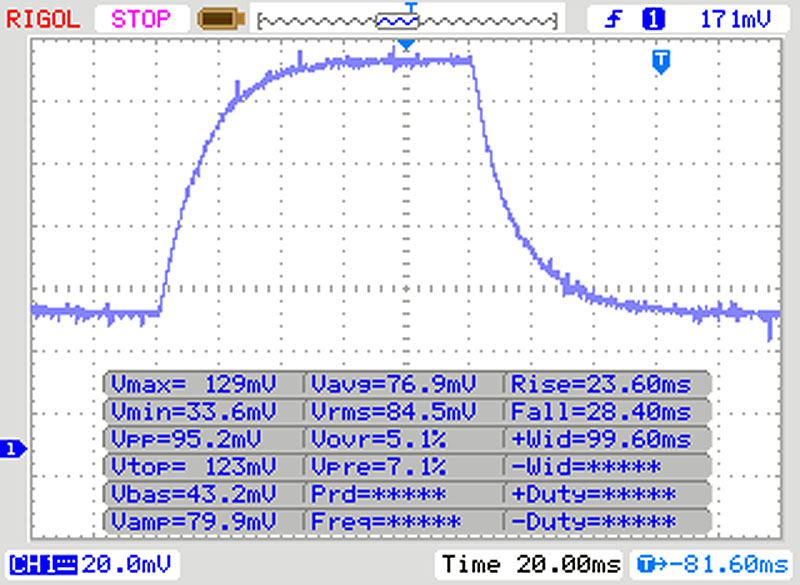 |
| ↘ 28 ms chute | ||
| L'écran souffre de latences très élevées, à éviter pour le jeu. En comparaison, tous les appareils testés affichent entre 0.165 (minimum) et 636 (maximum) ms. » 87 % des appareils testés affichent de meilleures performances. Cela signifie que les latences relevées sont moins bonnes que la moyenne (31 ms) de tous les appareils testés. | ||
Scintillement / MLI (Modulation de largeur d'impulsion)
| Scintillement / MLI (Modulation de largeur d'impulsion) non décelé | 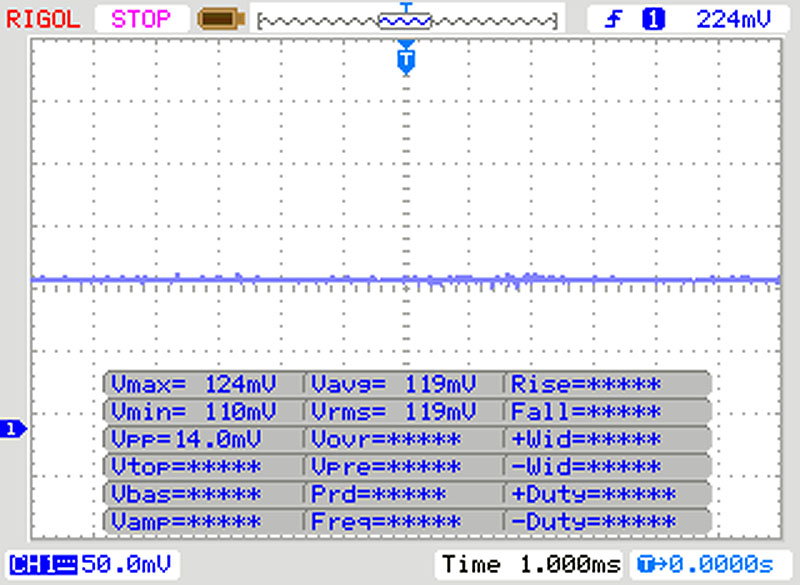 | ||
En comparaison, 52 % des appareils testés n'emploient pas MDI pour assombrir leur écran. Nous avons relevé une moyenne à 7763 (minimum : 5 - maximum : 343500) Hz dans le cas où une MDI était active. | |||
| HWBOT x265 Benchmark v2.2 - 4k Preset | |
| Moyenne de la classe Subnotebook (0.97 - 25.1, n=56, 2 dernières années) | |
| Lenovo ThinkPad X13-20UGS00800 | |
| Dell Latitude 5310-GXX0D | |
| HP EliteBook 830 G7 | |
| Lenovo ThinkPad X13-20T20033GE | |
| Moyenne Intel Core i5-10310U (3.88 - 5.35, n=5) | |
| Dynabook Portege X30L-G1331 | |
| Fujitsu Lifebook U939 i5 | |
| LibreOffice - 20 Documents To PDF | |
| HP EliteBook 830 G7 | |
| Moyenne Intel Core i5-10310U (60 - 71.4, n=5) | |
| Fujitsu Lifebook U939 i5 | |
| Dynabook Portege X30L-G1331 | |
| Dell Latitude 5310-GXX0D | |
| Lenovo ThinkPad X13-20UGS00800 | |
| Moyenne de la classe Subnotebook (39.9 - 220, n=55, 2 dernières années) | |
| Lenovo ThinkPad X13-20T20033GE | |
* ... Moindre est la valeur, meilleures sont les performances
| PCMark 8 Home Score Accelerated v2 | 3469 points | |
| PCMark 8 Creative Score Accelerated v2 | 3539 points | |
| PCMark 8 Work Score Accelerated v2 | 4764 points | |
| PCMark 10 Score | 4085 points | |
Aide | ||
| DPC Latencies / LatencyMon - interrupt to process latency (max), Web, Youtube, Prime95 | |
| Dell Latitude 5310-GXX0D | |
| Dynabook Portege X30L-G1331 | |
| Lenovo ThinkPad X13-20UGS00800 | |
| Lenovo ThinkPad X13-20T20033GE | |
| Fujitsu Lifebook U939 i5 | |
| HP EliteBook 830 G7 | |
* ... Moindre est la valeur, meilleures sont les performances

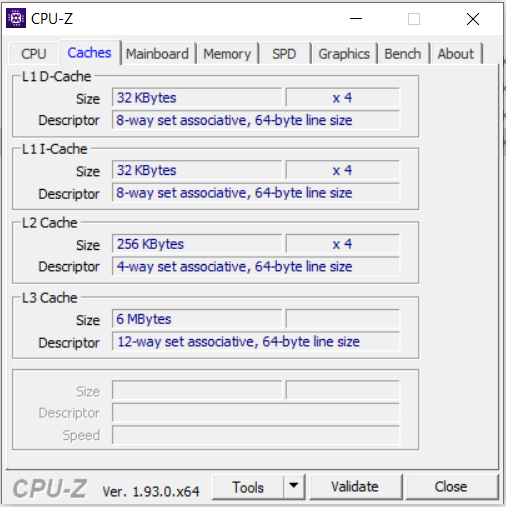
| Dell Latitude 5310-GXX0D SK Hynix BC511 HFM512GDJTNI | HP EliteBook 830 G7 Samsung SSD PM981a MZVLB512HBJQ | Fujitsu Lifebook U939 i5 Samsung SSD PM981 MZVLB512HAJQ | Dynabook Portege X30L-G1331 Samsung SSD PM981a MZVLB512HBJQ | Lenovo ThinkPad X13-20UGS00800 Samsung SSD PM981a MZVLB512HBJQ | Lenovo ThinkPad X13-20T20033GE Samsung SSD PM981a MZVLB512HBJQ | Moyenne SK Hynix BC511 HFM512GDJTNI | |
|---|---|---|---|---|---|---|---|
| CrystalDiskMark 5.2 / 6 | 49% | 26% | 46% | 46% | 48% | -6% | |
| Write 4K (MB/s) | 145.5 | 118.3 -19% | 159 9% | 164.1 13% | 95.7 -34% | 131.1 -10% | 111 ? -24% |
| Read 4K (MB/s) | 48.83 | 60.4 24% | 48.12 -1% | 49.34 1% | 37.47 -23% | 45.48 -7% | 42.6 ? -13% |
| Write Seq (MB/s) | 1067 | 2067 94% | 1657 55% | 1777 67% | 2032 90% | 2042 91% | 1037 ? -3% |
| Read Seq (MB/s) | 1133 | 2394 111% | 1522 34% | 1752 55% | 2207 95% | 2259 99% | 1100 ? -3% |
| Write 4K Q32T1 (MB/s) | 420.3 | 325.5 -23% | 349.2 -17% | 401.1 -5% | 517 23% | 429.1 2% | 410 ? -2% |
| Read 4K Q32T1 (MB/s) | 462.6 | 332.2 -28% | 452.2 -2% | 498.7 8% | 387 -16% | 370.7 -20% | 444 ? -4% |
| Write Seq Q32T1 (MB/s) | 1077 | 2978 177% | 1941 80% | 2988 177% | 2977 176% | 2963 175% | 1072 ? 0% |
| Read Seq Q32T1 (MB/s) | 2302 | 3552 54% | 3510 52% | 3544 54% | 3556 54% | 3564 55% | 2269 ? -1% |
| AS SSD | 8% | 38% | 59% | 35% | 29% | -11% | |
| Seq Read (MB/s) | 1975 | 2081 5% | 2677 36% | 2067 5% | 2553 29% | 2714 37% | 1458 ? -26% |
| Seq Write (MB/s) | 1002 | 1433 43% | 1819 82% | 2444 144% | 1406 40% | 1374 37% | 900 ? -10% |
| 4K Read (MB/s) | 51.8 | 49.92 -4% | 53.7 4% | 55.8 8% | 48.53 -6% | 51.2 -1% | 49 ? -5% |
| 4K Write (MB/s) | 121.7 | 119.1 -2% | 145.8 20% | 124.6 2% | 119.6 -2% | 135.7 12% | 114.9 ? -6% |
| 4K-64 Read (MB/s) | 806 | 585 -27% | 1202 49% | 1601 99% | 808 0% | 962 19% | 776 ? -4% |
| 4K-64 Write (MB/s) | 780 | 1630 109% | 1290 65% | 1696 117% | 1846 137% | 1420 82% | 744 ? -5% |
| Access Time Read * (ms) | 0.04 | 0.043 -8% | 0.044 -10% | 0.048 -20% | 0.062 -55% | 0.043 -8% | 0.061 ? -53% |
| Access Time Write * (ms) | 0.031 | 0.097 -213% | 0.026 16% | 0.091 -194% | 0.031 -0% | 0.028 10% | 0.03329 ? -7% |
| Score Read (Points) | 1055 | 843 -20% | 1523 44% | 1864 77% | 1112 5% | 1284 22% | 970 ? -8% |
| Score Write (Points) | 1002 | 1892 89% | 1618 61% | 2065 106% | 2107 110% | 1693 69% | 949 ? -5% |
| Score Total (Points) | 2562 | 3149 23% | 3887 52% | 4908 92% | 3742 46% | 3579 40% | 2401 ? -6% |
| Copy ISO MB/s (MB/s) | 742 | 2452 230% | 2051 176% | 1395 88% | 864 ? 16% | ||
| Copy Program MB/s (MB/s) | 389.9 | 72.2 -81% | 572 47% | 491.8 26% | 309 ? -21% | ||
| Copy Game MB/s (MB/s) | 556 | 404 -27% | 1447 160% | 948 71% | 499 ? -10% | ||
| Moyenne finale (programmes/paramètres) | 29% /
23% | 32% /
33% | 53% /
54% | 41% /
39% | 39% /
37% | -9% /
-9% |
* ... Moindre est la valeur, meilleures sont les performances
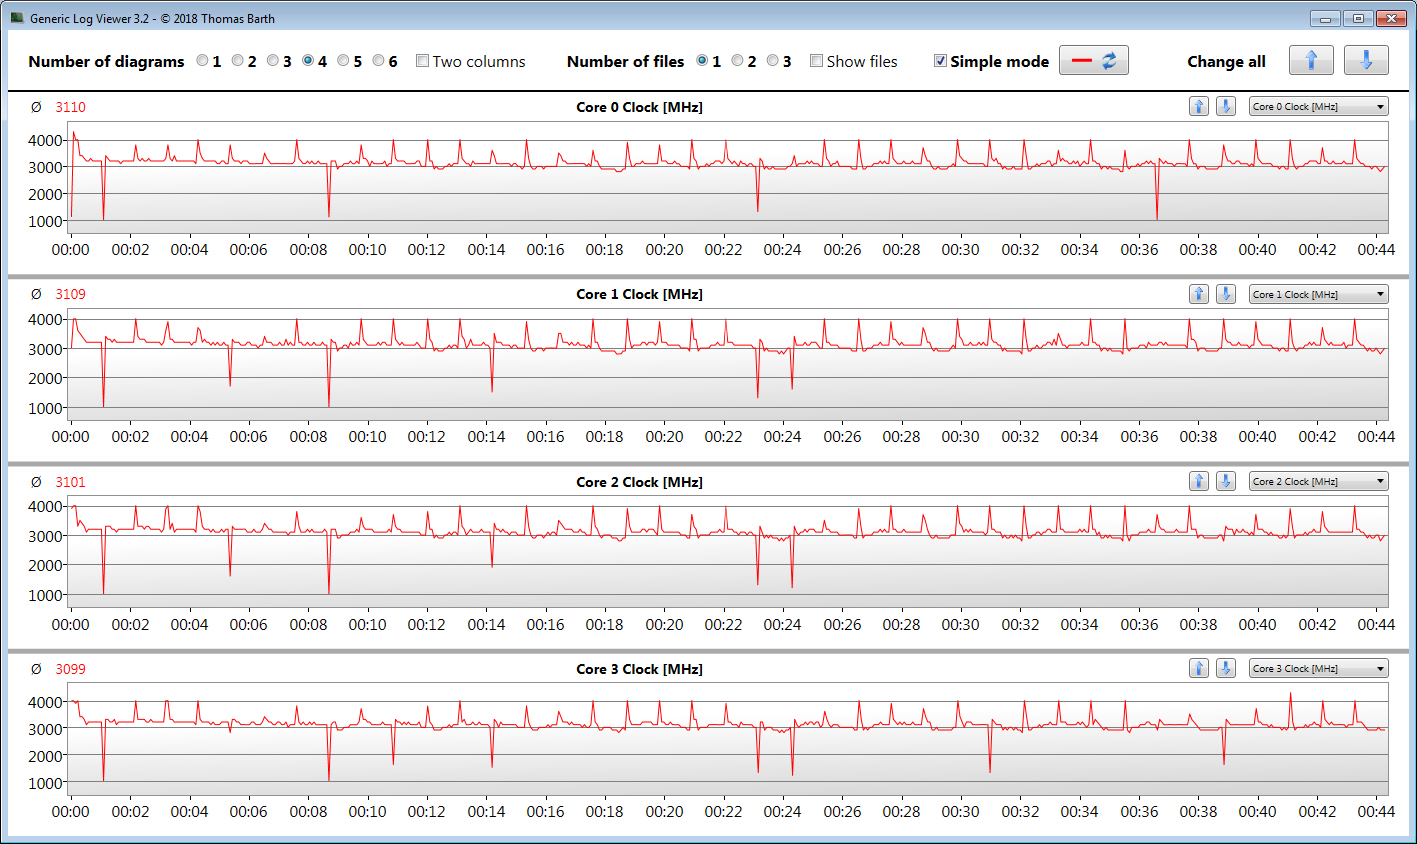
Continuous load read: DiskSpd Read Loop, Queue Depth 8
| 3DMark 11 Performance | 2067 points | |
| 3DMark Ice Storm Standard Score | 60188 points | |
| 3DMark Cloud Gate Standard Score | 8812 points | |
| 3DMark Fire Strike Score | 1110 points | |
| 3DMark Time Spy Score | 453 points | |
Aide | ||
| 3DMark 11 - 1280x720 Performance GPU | |
| Moyenne de la classe Subnotebook (995 - 18489, n=54, 2 dernières années) | |
| Lenovo ThinkPad X13-20UGS00800 | |
| HP EliteBook 830 G7 | |
| Dell Latitude 5310-GXX0D | |
| Lenovo ThinkPad X13-20T20033GE | |
| Dynabook Portege X30L-G1331 | |
| Moyenne Intel UHD Graphics 620 (1144 - 3432, n=244) | |
| Fujitsu Lifebook U939 i5 | |
| Bas | Moyen | Élevé | Ultra | |
|---|---|---|---|---|
| Tomb Raider (2013) | 97.6 | 47.6 | 28.2 | 13.1 |
| BioShock Infinite (2013) | 58.1 | 34.7 | 28.3 | 9 |
| Dota 2 Reborn (2015) | 73.5 | 39.5 | 19.5 | 17.3 |
| X-Plane 11.11 (2018) | 8.59 | 7.45 | 8.82 | |
| Far Cry 5 (2018) | 15 | 7 | 6 | 5 |
Degré de la nuisance sonore
| Au repos |
| 24.9 / 24.9 / 24.9 dB(A) |
| Fortement sollicité |
| 37.7 / 41.2 dB(A) |
 | ||
30 dB silencieux 40 dB(A) audible 50 dB(A) bruyant |
||
min: | ||
| Dell Latitude 5310-GXX0D i5-10310U, UHD Graphics 620 | HP EliteBook 830 G7 i7-10810U, UHD Graphics 620 | Fujitsu Lifebook U939 i5 i5-8265U, UHD Graphics 620 | Dynabook Portege X30L-G1331 i5-10210U, UHD Graphics 620 | Lenovo ThinkPad X13-20UGS00800 R7 PRO 4750U, Vega 7 | Lenovo ThinkPad X13-20T20033GE i5-10210U, UHD Graphics 620 | Moyenne Intel UHD Graphics 620 | Moyenne de la classe Subnotebook | |
|---|---|---|---|---|---|---|---|---|
| Noise | -2% | -9% | -6% | -5% | -6% | -8% | 2% | |
| arrêt / environnement * (dB) | 24.9 | 26.8 -8% | 29.8 -20% | 28.5 -14% | 29.1 -17% | 29.3 -18% | 29 ? -16% | 24.2 ? 3% |
| Idle Minimum * (dB) | 24.9 | 27.1 -9% | 29.8 -20% | 28.5 -14% | 29.1 -17% | 29.3 -18% | 29.1 ? -17% | 24.3 ? 2% |
| Idle Average * (dB) | 24.9 | 27.1 -9% | 29.8 -20% | 28.5 -14% | 29.1 -17% | 29.3 -18% | 29.1 ? -17% | 24.5 ? 2% |
| Idle Maximum * (dB) | 24.9 | 27.1 -9% | 29.8 -20% | 28.5 -14% | 29.1 -17% | 29.3 -18% | 29.7 ? -19% | 25.1 ? -1% |
| Load Average * (dB) | 37.7 | 31.4 17% | 31.7 16% | 32 15% | 31.1 18% | 30.7 19% | 33.5 ? 11% | 34.1 ? 10% |
| Load Maximum * (dB) | 41.2 | 39 5% | 36.3 12% | 38 8% | 31.8 23% | 34 17% | 36.1 ? 12% | 42.1 ? -2% |
* ... Moindre est la valeur, meilleures sont les performances
(±) La température maximale du côté supérieur est de 42.2 °C / 108 F, par rapport à la moyenne de 35.9 °C / 97 F, allant de 21.4 à 59 °C pour la classe Subnotebook.
(±) Le fond chauffe jusqu'à un maximum de 44 °C / 111 F, contre une moyenne de 39.2 °C / 103 F
(+) En utilisation inactive, la température moyenne du côté supérieur est de 27.7 °C / 82 F, par rapport à la moyenne du dispositif de 30.8 °C / 87 F.
(+) Les repose-poignets et le pavé tactile sont plus froids que la température de la peau avec un maximum de 29.6 °C / 85.3 F et sont donc froids au toucher.
(±) La température moyenne de la zone de l'appui-paume de dispositifs similaires était de 28.2 °C / 82.8 F (-1.4 °C / #-2.5 F).
| Dell Latitude 5310-GXX0D i5-10310U, UHD Graphics 620 | HP EliteBook 830 G7 i7-10810U, UHD Graphics 620 | Fujitsu Lifebook U939 i5 i5-8265U, UHD Graphics 620 | Dynabook Portege X30L-G1331 i5-10210U, UHD Graphics 620 | Lenovo ThinkPad X13-20UGS00800 R7 PRO 4750U, Vega 7 | Lenovo ThinkPad X13-20T20033GE i5-10210U, UHD Graphics 620 | Moyenne Intel UHD Graphics 620 | Moyenne de la classe Subnotebook | |
|---|---|---|---|---|---|---|---|---|
| Heat | -3% | 3% | -11% | 7% | 2% | 3% | 4% | |
| Maximum Upper Side * (°C) | 42.2 | 41 3% | 46.3 -10% | 41.2 2% | 44.8 -6% | 48.4 -15% | 41.1 ? 3% | 41.7 ? 1% |
| Maximum Bottom * (°C) | 44 | 47.2 -7% | 44.9 -2% | 44 -0% | 42.1 4% | 43.8 -0% | 44.3 ? -1% | 43.5 ? 1% |
| Idle Upper Side * (°C) | 28.6 | 28 2% | 25.8 10% | 34.6 -21% | 24.1 16% | 25.2 12% | 26.8 ? 6% | 26.8 ? 6% |
| Idle Bottom * (°C) | 29.2 | 32 -10% | 25.8 12% | 36.2 -24% | 25.1 14% | 25.7 12% | 27.7 ? 5% | 27.4 ? 6% |
* ... Moindre est la valeur, meilleures sont les performances
Dell Latitude 5310-GXX0D analyse audio
(-) | haut-parleurs pas très forts (70.5 dB)
Basses 100 - 315 Hz
(±) | basse réduite - en moyenne 13.8% inférieure à la médiane
(±) | la linéarité des basses est moyenne (13.5% delta à la fréquence précédente)
Médiums 400 - 2000 Hz
(+) | médiane équilibrée - seulement 4.3% de la médiane
(±) | la linéarité des médiums est moyenne (7% delta à la fréquence précédente)
Aiguës 2 - 16 kHz
(+) | des sommets équilibrés - à seulement 1.4% de la médiane
(+) | les aigus sont linéaires (3% delta à la fréquence précédente)
Globalement 100 - 16 000 Hz
(+) | le son global est linéaire (14.4% différence à la médiane)
Par rapport à la même classe
» 29% de tous les appareils testés de cette catégorie étaient meilleurs, 6% similaires, 65% pires
» Le meilleur avait un delta de 5%, la moyenne était de 18%, le pire était de 53%.
Par rapport à tous les appareils testés
» 18% de tous les appareils testés étaient meilleurs, 4% similaires, 78% pires
» Le meilleur avait un delta de 4%, la moyenne était de 23%, le pire était de 134%.
| Éteint/en veille | |
| Au repos | |
| Fortement sollicité |
|
Légende:
min: | |
| Dell Latitude 5310-GXX0D i5-10310U, UHD Graphics 620 | HP EliteBook 830 G7 i7-10810U, UHD Graphics 620 | Fujitsu Lifebook U939 i5 i5-8265U, UHD Graphics 620 | Dynabook Portege X30L-G1331 i5-10210U, UHD Graphics 620 | Lenovo ThinkPad X13-20UGS00800 R7 PRO 4750U, Vega 7 | Lenovo ThinkPad X13-20T20033GE i5-10210U, UHD Graphics 620 | Moyenne Intel UHD Graphics 620 | Moyenne de la classe Subnotebook | |
|---|---|---|---|---|---|---|---|---|
| Power Consumption | -13% | -22% | -10% | -63% | -18% | -30% | -35% | |
| Idle Minimum * (Watt) | 2.2 | 3.6 -64% | 3.1 -41% | 2.8 -27% | 6 -173% | 2.9 -32% | 3.81 ? -73% | 3.78 ? -72% |
| Idle Average * (Watt) | 4 | 4.7 -18% | 5.9 -48% | 4.9 -23% | 8.9 -123% | 5.6 -40% | 6.94 ? -74% | 6.57 ? -64% |
| Idle Maximum * (Watt) | 6.9 | 5.1 26% | 9.2 -33% | 9 -30% | 11.3 -64% | 8.9 -29% | 8.75 ? -27% | 7.94 ? -15% |
| Load Average * (Watt) | 37 | 33.3 10% | 35.8 3% | 31.2 16% | 34.2 8% | 30.1 19% | 35 ? 5% | 41.9 ? -13% |
| Load Maximum * (Watt) | 58 | 70 -21% | 51.9 11% | 49.4 15% | 37.2 36% | 61.3 -6% | 47.5 ? 18% | 64.4 ? -11% |
* ... Moindre est la valeur, meilleures sont les performances
| Dell Latitude 5310-GXX0D i5-10310U, UHD Graphics 620, 60 Wh | HP EliteBook 830 G7 i7-10810U, UHD Graphics 620, 53 Wh | Fujitsu Lifebook U939 i5 i5-8265U, UHD Graphics 620, 50 Wh | Dynabook Portege X30L-G1331 i5-10210U, UHD Graphics 620, 42 Wh | Lenovo ThinkPad X13-20UGS00800 R7 PRO 4750U, Vega 7, 48 Wh | Lenovo ThinkPad X13-20T20033GE i5-10210U, UHD Graphics 620, 48 Wh | Moyenne de la classe Subnotebook | |
|---|---|---|---|---|---|---|---|
| Autonomie de la batterie | 14% | -35% | -35% | -45% | -24% | -7% | |
| Reader / Idle (h) | 26.5 | 34.6 31% | 28.6 ? 8% | ||||
| H.264 (h) | 17.1 | 8.3 -51% | 11.7 -32% | 15.4 ? -10% | |||
| WiFi v1.3 (h) | 12.7 | 11.5 -9% | 8.2 -35% | 8.3 -35% | 8.7 -31% | 9.3 -27% | 14 ? 10% |
| Load (h) | 3.1 | 3.7 19% | 1.5 -52% | 2.7 -13% | 1.969 ? -36% |
Points positifs
Points négatifs

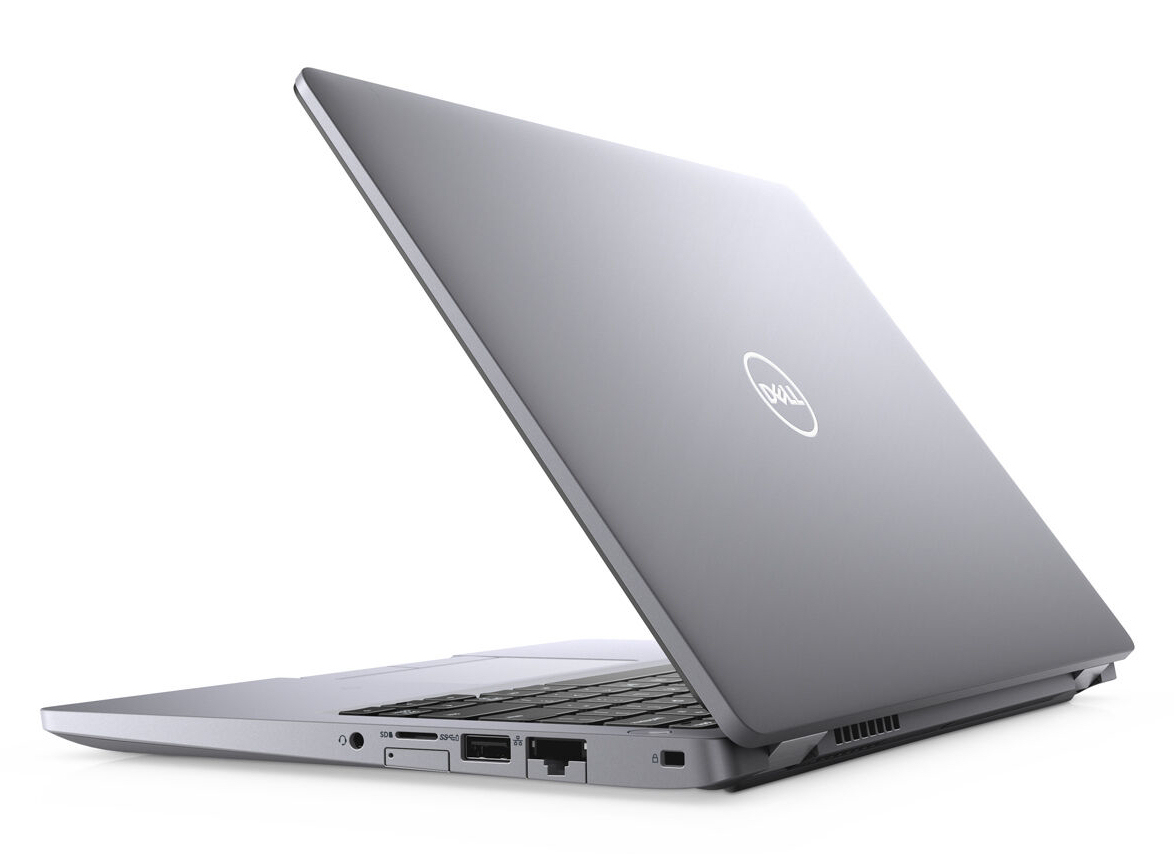
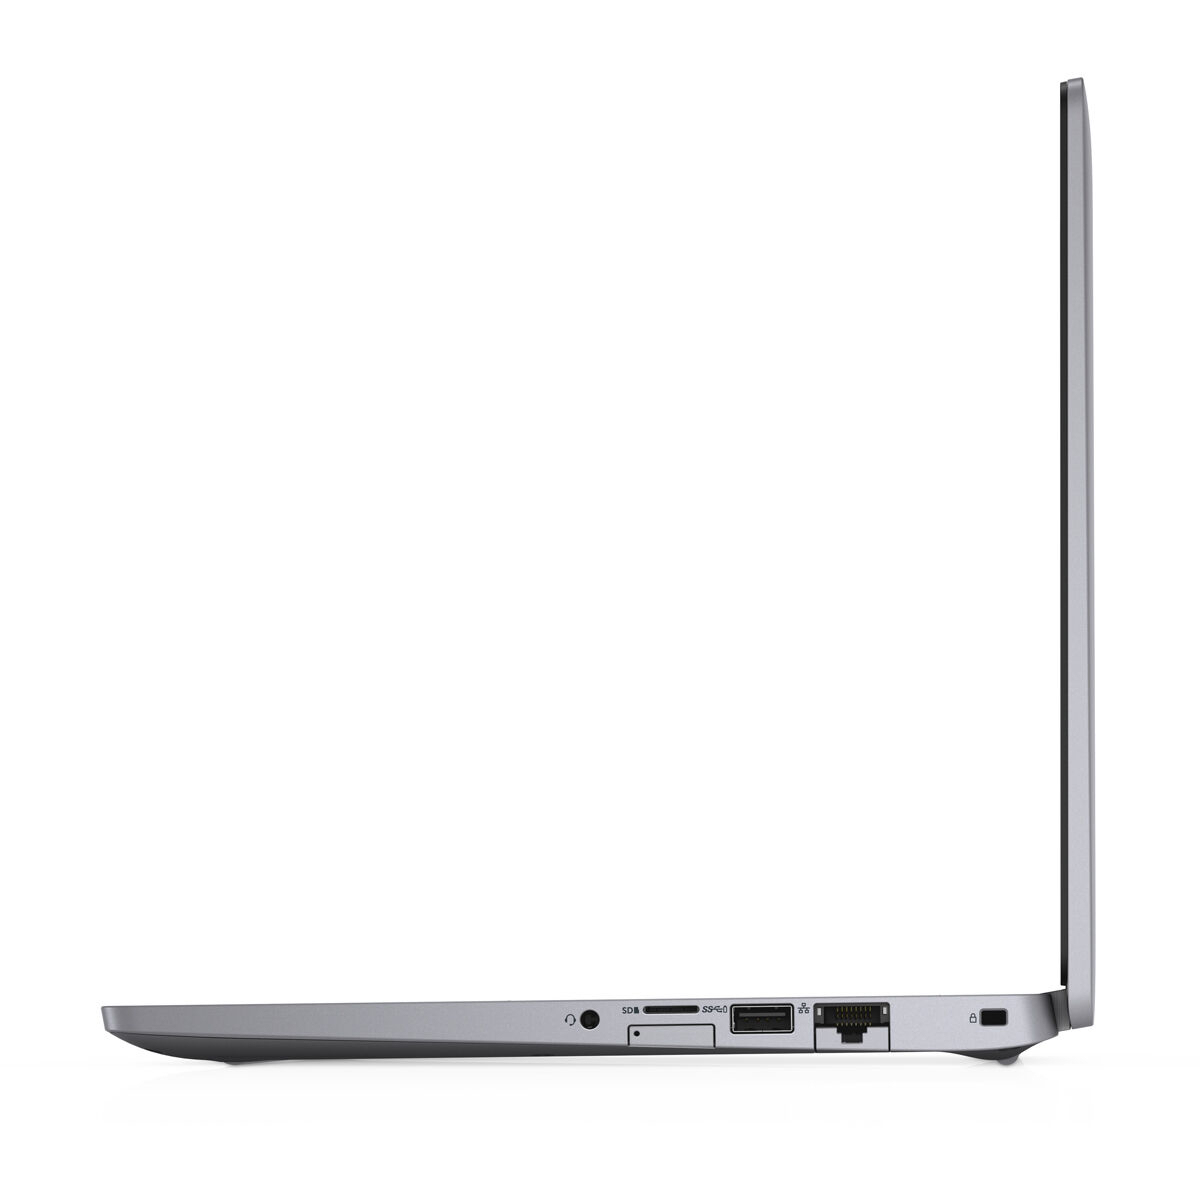
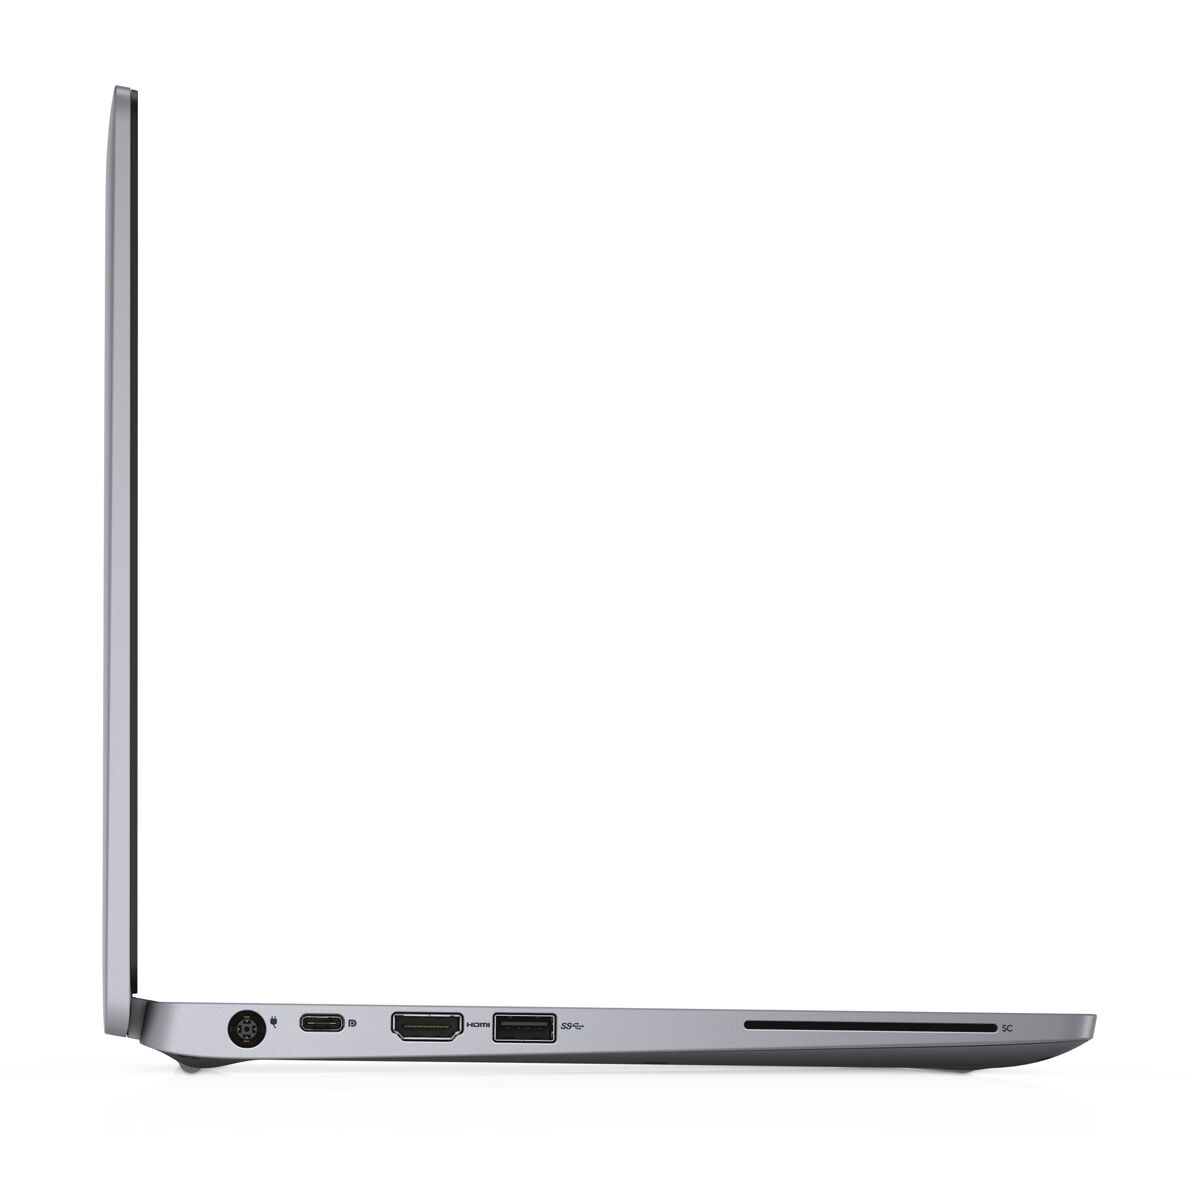
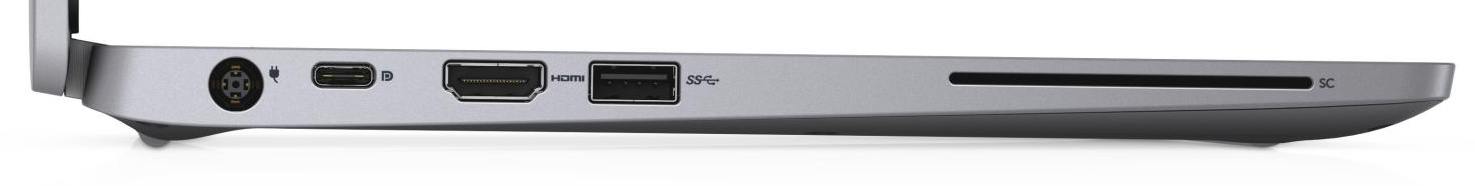
Le Latitude est un compagnon endurant pour le quotidien. En une charge, l'appareil tient toute la journée. Et il peut être rechargé grâce au port USB C, en plus du port Dell propriétaire.
Avec le Latitude 5310, Dell propose un portable pro sans gros défaut.
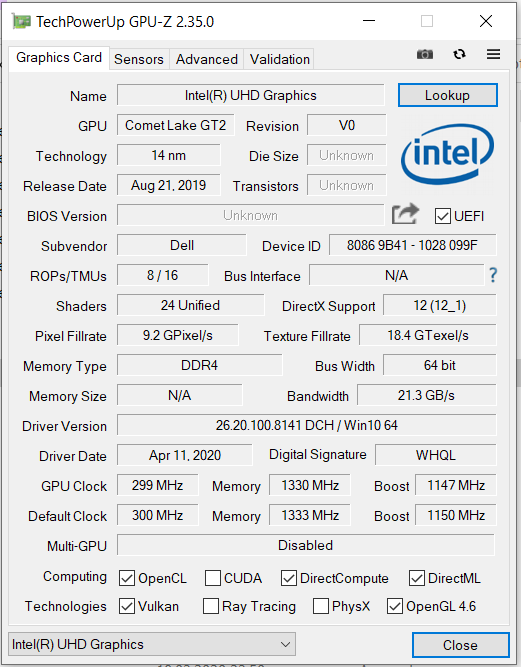
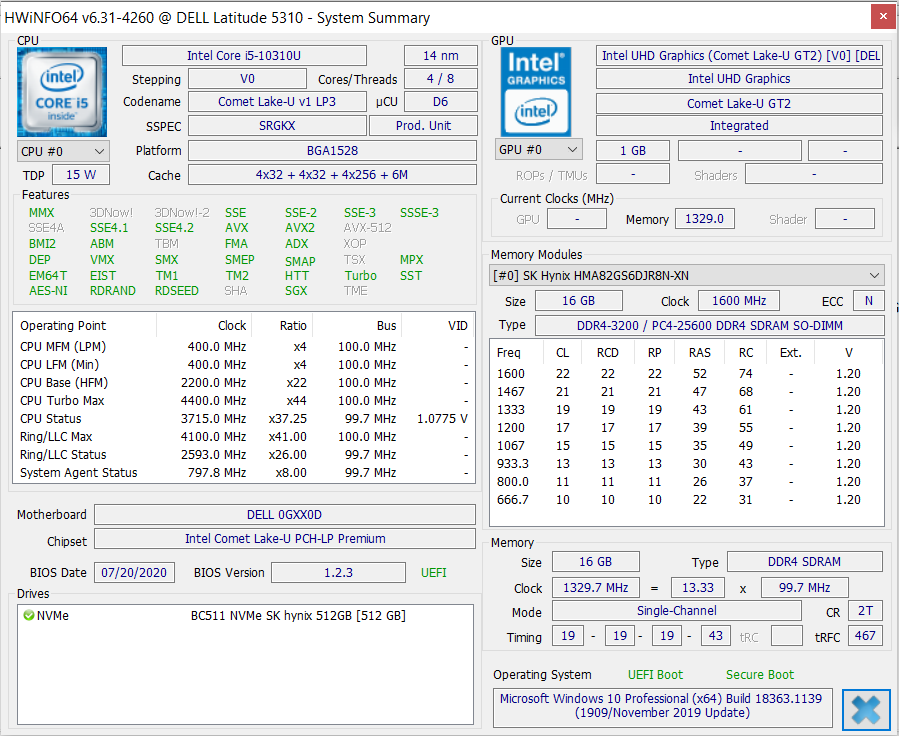
Le processeur Core i5 fournit assez de puissance de calcul pour la bureautique et Internet. La chauffe et le bruit sont à un niveau acceptable.
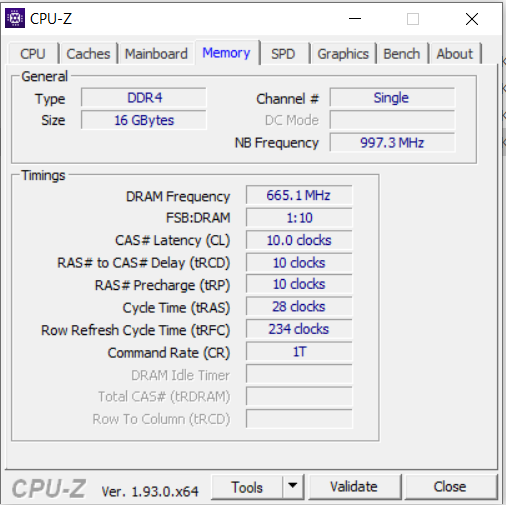
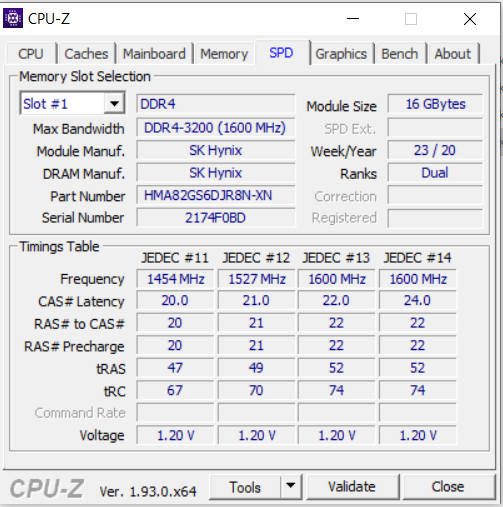
Le processeur peut accéder à 8 Go de RAM (un module de 8 Go, mono canal, maximum 32 Go). L'installation d'un deuxième module est recommandée, pour activer le mode double canal. Le SSD NVMe (512 Go) permet au système d'être réactif, et il est possible de le remplacer par un modèle plus rapide et / ou plus gros. La maintenance et les mises à jour nécessitent de retirer la coque inférieure.
L'écran (Full HD, IPS) marque des points avec sa surface matte, ses angles de vision, la fidélité de ses couleurs, et sa couverture des espaces colorimétriques. La luminosité et le contraste sont corrects - mais cela aurait pu être mieux vu le prix de l'appareil. Dell propose un module LTE en option, mais notre modèle n'en a pas. Il peut cependant être ajouté après-coup, les antennes et l'emplacement SIM étant présents.
L’intégralité de cette critique est disponible en anglais en suivant ce lien.
Dell Latitude 5310-GXX0D
- 10/18/2020 v7 (old)
Sascha Mölck
Price comparison
