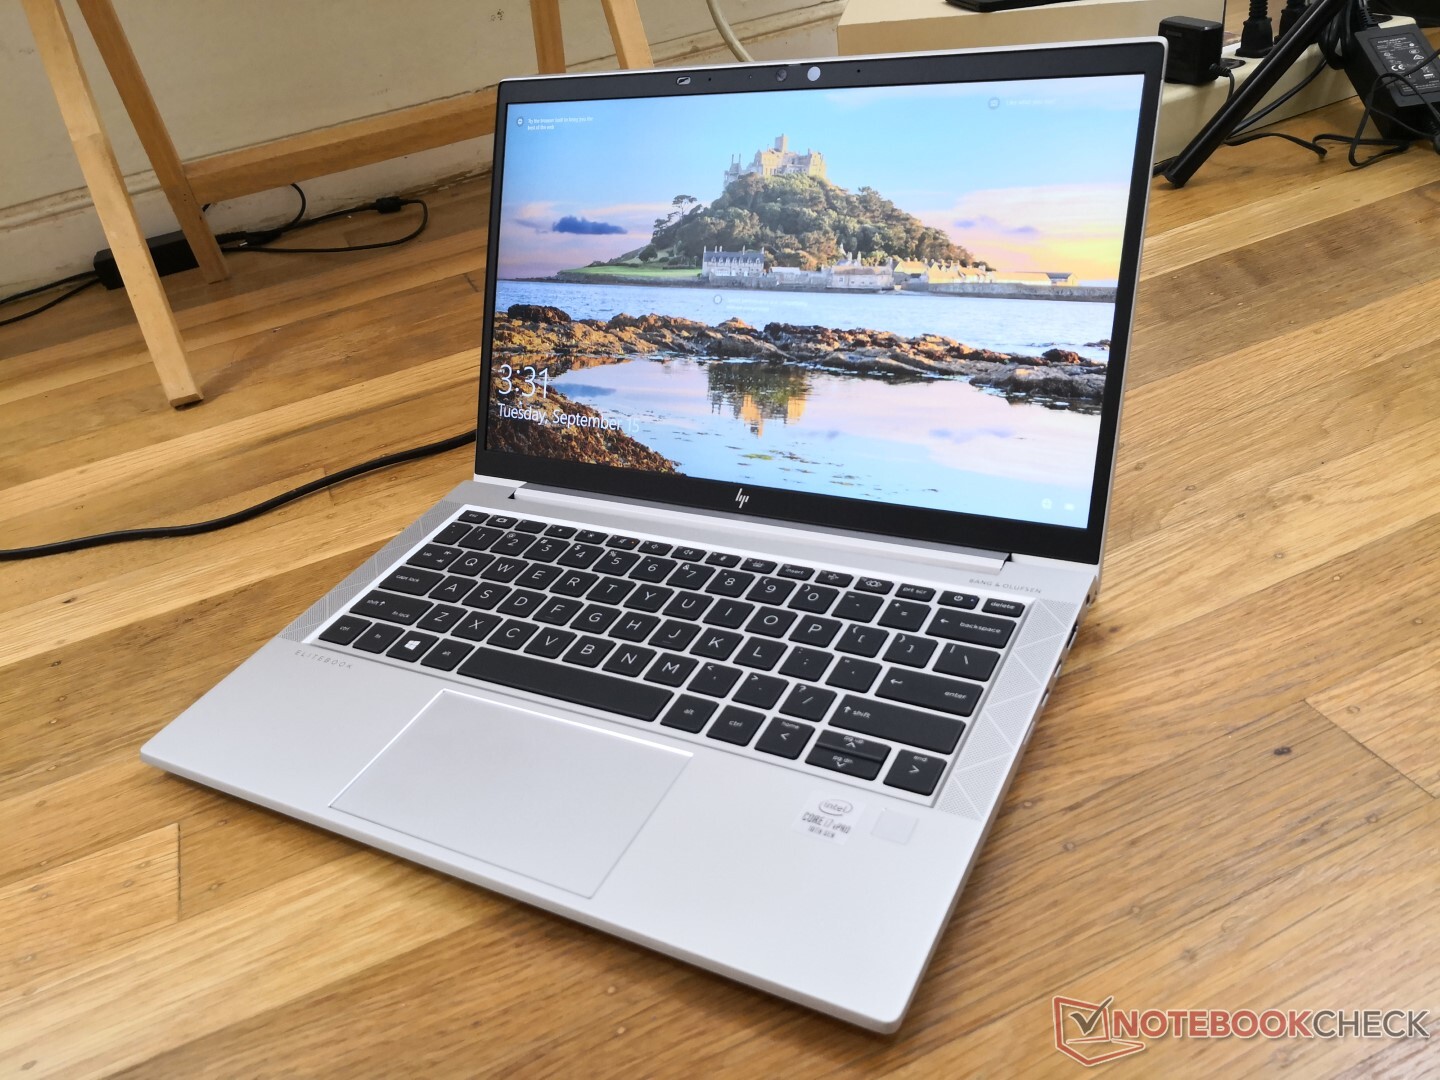
Test du HP EliteBook 830 G7 (i7-10810U, UHD 620, FHD) : premium pour le grand public
Note | Date | Modèle | Poids | Épaisseur | Taille | Résolution | Prix |
|---|---|---|---|---|---|---|---|
| 88.7 % v7 (old) | 10/20 | HP EliteBook 830 G7 i7-10810U, UHD Graphics 620 | 1.3 kg | 18.1 mm | 13.30" | 1920x1080 | |
| 87.9 % v7 (old) | 10/19 | HP EliteBook x360 830 G6 i7-8565U, UHD Graphics 620 | 1.5 kg | 16.9 mm | 13.30" | 1920x1080 | |
| 88 % v7 (old) | 09/20 | Lenovo ThinkPad X13-20T20033GE i5-10210U, UHD Graphics 620 | 1.3 kg | 16.9 mm | 13.30" | 1920x1080 | |
| 89.4 % v7 (old) | 08/20 | Dell Latitude 7310 i7-10610U, UHD Graphics 620 | 1.2 kg | 18.3 mm | 13.30" | 1920x1080 | |
| 85.1 % v7 (old) | 06/20 | Dynabook Portege X30L-G1331 i5-10210U, UHD Graphics 620 | 859 g | 17.9 mm | 13.30" | 1920x1080 | |
| 84 % v7 (old) | 03/20 | Microsoft Surface Laptop 3 13 Core i5-1035G7 i5-1035G7, Iris Plus Graphics G7 (Ice Lake 64 EU) | 1.3 kg | 14.5 mm | 13.50" | 2256x1504 |


| |||||||||||||||||||||||||
Homogénéité de la luminosité: 91 %
Valeur mesurée au centre, sur batterie: 454.5 cd/m²
Contraste: 1683:1 (Valeurs des noirs: 0.27 cd/m²)
ΔE ColorChecker Calman: 3.12 | ∀{0.5-29.43 Ø4.72}
calibrated: 1.97
ΔE Greyscale Calman: 3.1 | ∀{0.09-98 Ø4.97}
97% sRGB (Argyll 1.6.3 3D)
61.5% AdobeRGB 1998 (Argyll 1.6.3 3D)
67.4% AdobeRGB 1998 (Argyll 3D)
97.4% sRGB (Argyll 3D)
65.7% Display P3 (Argyll 3D)
Gamma: 2.01
CCT: 6902 K
| HP EliteBook 830 G7 Chi Mei CMN13A9, IPS, 13.3", 1920x1080 | HP EliteBook x360 830 G6 M133NVFC R5, IPS LED, 13.3", 1920x1080 | Lenovo ThinkPad X13-20T20033GE Lenovo B133HAK01.1, IPS, 13.3", 1920x1080 | Dell Latitude 7310 AU Optronics B133HAN, IPS, 13.3", 1920x1080 | Dynabook Portege X30L-G1331 Toshiba TOS508F, IPS, 13.3", 1920x1080 | Microsoft Surface Laptop 3 13 Core i5-1035G7 Sharp LQ135P1JX51, IPS, 13.5", 2256x1504 | |
|---|---|---|---|---|---|---|
| Display | -0% | -0% | 6% | 1% | 1% | |
| Display P3 Coverage (%) | 65.7 | 66.1 1% | 66 0% | 71.8 9% | 66.9 2% | 65.7 0% |
| sRGB Coverage (%) | 97.4 | 95.3 -2% | 96.2 -1% | 99.3 2% | 97.6 0% | 98.6 1% |
| AdobeRGB 1998 Coverage (%) | 67.4 | 67.5 0% | 67.2 0% | 72.4 7% | 67.8 1% | 67.8 1% |
| Response Times | 6% | -2% | 12% | -14% | -28% | |
| Response Time Grey 50% / Grey 80% * (ms) | 46.8 ? | 44 ? 6% | 52.8 ? -13% | 40.8 ? 13% | 54.8 ? -17% | 59.2 ? -26% |
| Response Time Black / White * (ms) | 32 ? | 30 ? 6% | 29.2 ? 9% | 28.8 ? 10% | 35.6 ? -11% | 41.6 ? -30% |
| PWM Frequency (Hz) | 26600 ? | 952 ? | 23810 ? | 21740 ? | ||
| Screen | 10% | -33% | 5% | 8% | 14% | |
| Brightness middle (cd/m²) | 454.5 | 603 33% | 359 -21% | 332.7 -27% | 482 6% | 403.4 -11% |
| Brightness (cd/m²) | 435 | 692 59% | 342 -21% | 329 -24% | 452 4% | 397 -9% |
| Brightness Distribution (%) | 91 | 69 -24% | 90 -1% | 89 -2% | 91 0% | 89 -2% |
| Black Level * (cd/m²) | 0.27 | 0.26 4% | 0.21 22% | 0.25 7% | 0.4 -48% | 0.34 -26% |
| Contrast (:1) | 1683 | 2319 38% | 1710 2% | 1331 -21% | 1205 -28% | 1186 -30% |
| Colorchecker dE 2000 * | 3.12 | 2.2 29% | 6.7 -115% | 2.15 31% | 1.85 41% | 0.94 70% |
| Colorchecker dE 2000 max. * | 4.85 | 7.7 -59% | 10.9 -125% | 3.89 20% | 3.08 36% | 2.92 40% |
| Colorchecker dE 2000 calibrated * | 1.97 | 1.5 24% | 1.3 34% | 1.09 45% | 1.2 39% | 0.99 50% |
| Greyscale dE 2000 * | 3.1 | 2.6 16% | 7.4 -139% | 2.5 19% | 2 35% | 0.9 71% |
| Gamma | 2.01 109% | 2.17 101% | 2.85 77% | 2.3 96% | 2.1 105% | 2.13 103% |
| CCT | 6902 94% | 6412 101% | 6309 103% | 6347 102% | 6822 95% | 6620 98% |
| Color Space (Percent of AdobeRGB 1998) (%) | 61.5 | 60.2 -2% | 61.7 0% | 64.1 4% | 62.5 2% | 62.3 1% |
| Color Space (Percent of sRGB) (%) | 97 | 93.6 -4% | 95.9 -1% | 99.4 2% | 97.7 1% | 98.7 2% |
| Moyenne finale (programmes/paramètres) | 5% /
8% | -12% /
-23% | 8% /
6% | -2% /
4% | -4% /
6% |
* ... Moindre est la valeur, meilleures sont les performances
Temps de réponse de l'écran
| ↔ Temps de réponse noir à blanc | ||
|---|---|---|
| 32 ms ... hausse ↗ et chute ↘ combinées | ↗ 15.6 ms hausse | 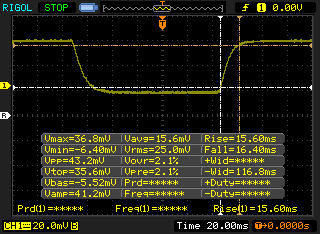 |
| ↘ 16.4 ms chute | ||
| L'écran souffre de latences très élevées, à éviter pour le jeu. En comparaison, tous les appareils testés affichent entre 0.1 (minimum) et 240 (maximum) ms. » 86 % des appareils testés affichent de meilleures performances. Cela signifie que les latences relevées sont moins bonnes que la moyenne (19.8 ms) de tous les appareils testés. | ||
| ↔ Temps de réponse gris 50% à gris 80% | ||
| 46.8 ms ... hausse ↗ et chute ↘ combinées | ↗ 24 ms hausse | 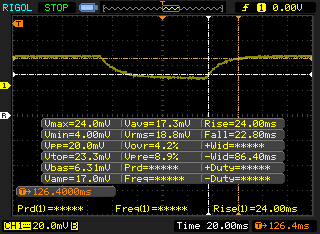 |
| ↘ 22.8 ms chute | ||
| L'écran souffre de latences très élevées, à éviter pour le jeu. En comparaison, tous les appareils testés affichent entre 0.165 (minimum) et 636 (maximum) ms. » 81 % des appareils testés affichent de meilleures performances. Cela signifie que les latences relevées sont moins bonnes que la moyenne (31 ms) de tous les appareils testés. | ||
Scintillement / MLI (Modulation de largeur d'impulsion)
| Scintillement / MLI (Modulation de largeur d'impulsion) décelé | 26600 Hz | ≤ 62 Niveau de luminosité | 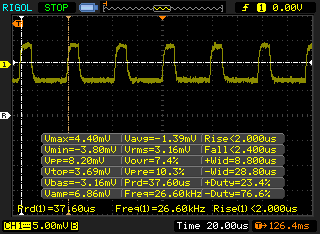 |
Le rétroéclairage de l'écran scintille à la fréquence de 26600 Hz (certainement du fait de l'utilisation d'une MDI - Modulation de largeur d'impulsion) à un niveau de luminosité inférieur ou égal à 62 % . Aucun scintillement ne devrait être perceptible au-dessus de cette valeur. La fréquence de rafraîchissement de 26600 Hz est élevée, la grande majorité des utilisateurs ne devrait pas percevoir de scintillements et être sujette à une fatigue oculaire accrue. En comparaison, 52 % des appareils testés n'emploient pas MDI pour assombrir leur écran. Nous avons relevé une moyenne à 7763 (minimum : 5 - maximum : 343500) Hz dans le cas où une MDI était active. | |||
Cinebench R15: CPU Multi 64Bit | CPU Single 64Bit
Blender: v2.79 BMW27 CPU
7-Zip 18.03: 7z b 4 -mmt1 | 7z b 4
Geekbench 5.5: Single-Core | Multi-Core
HWBOT x265 Benchmark v2.2: 4k Preset
LibreOffice : 20 Documents To PDF
R Benchmark 2.5: Overall mean
| LibreOffice / 20 Documents To PDF | |
| HP EliteBook 830 G7 | |
| Moyenne Intel Core i7-10810U (60.6 - 68.2, n=5) | |
| Lenovo ThinkPad E14 Gen2-20T7S00W00 | |
| Microsoft Surface Book 3 15 | |
| Dell XPS 15 9500 Core i5 | |
| Lenovo ThinkPad X13-20UGS00800 | |
| Asus VivoBook Flip 14 TM420IA | |
| Acer TravelMate P6 P614-51T-G2-72ZU | |
| Lenovo ThinkPad X13-20T20033GE | |
* ... Moindre est la valeur, meilleures sont les performances
| PCMark 8 Home Score Accelerated v2 | 3569 points | |
| PCMark 8 Work Score Accelerated v2 | 4763 points | |
| PCMark 10 Score | 4185 points | |
Aide | ||
| DPC Latencies / LatencyMon - interrupt to process latency (max), Web, Youtube, Prime95 | |
| Dell Latitude 9510 2-in-1 | |
| Acer TravelMate P6 P614-51T-G2-72ZU | |
| Dynabook Portege X30L-G1331 | |
| Lenovo ThinkPad X13-20UGS00800 | |
| Dell XPS 13 9300 i5 FHD | |
| Lenovo ThinkPad X13-20T20033GE | |
| Dell Latitude 7310 | |
| HP EliteBook 830 G7 | |
| Lenovo ThinkPad E14 Gen2-20T7S00W00 | |
| Asus VivoBook Flip 14 TM420IA | |
* ... Moindre est la valeur, meilleures sont les performances
| HP EliteBook 830 G7 Samsung SSD PM981a MZVLB512HBJQ | HP EliteBook x360 830 G6 WDC PC SN720 SDAPNTW-1T00 | Lenovo ThinkPad X13-20T20033GE Samsung SSD PM981a MZVLB512HBJQ | Dell Latitude 7310 Samsung SSD PM981a MZVLB512HBJQ | Microsoft Surface Laptop 3 13 Core i5-1035G7 SK hynix BC501 HFM256GDGTNG | |
|---|---|---|---|---|---|
| AS SSD | 9% | 20% | 62% | -14% | |
| Seq Read (MB/s) | 2081 | 2446 18% | 2714 30% | 2054 -1% | 1387 -33% |
| Seq Write (MB/s) | 1433 | 1319 -8% | 1374 -4% | 1575 10% | 504 -65% |
| 4K Read (MB/s) | 49.92 | 44.69 -10% | 51.2 3% | 52.1 4% | 42.35 -15% |
| 4K Write (MB/s) | 119.1 | 151.5 27% | 135.7 14% | 137.3 15% | 120 1% |
| 4K-64 Read (MB/s) | 585 | 603 3% | 962 64% | 618 6% | 497.4 -15% |
| 4K-64 Write (MB/s) | 1630 | 1410 -13% | 1420 -13% | 1317 -19% | 354.9 -78% |
| Access Time Read * (ms) | 0.043 | 0.052 -21% | 0.043 -0% | 0.044 -2% | 0.055 -28% |
| Access Time Write * (ms) | 0.097 | 0.026 73% | 0.028 71% | 0.083 14% | 0.093 4% |
| Score Read (Points) | 843 | 892 6% | 1284 52% | 876 4% | 678 -20% |
| Score Write (Points) | 1892 | 1693 -11% | 1693 -11% | 1611 -15% | 525 -72% |
| Score Total (Points) | 3149 | 2997 -5% | 3579 14% | 2927 -7% | 1520 -52% |
| Copy ISO MB/s (MB/s) | 2452 | 2990 22% | 2297 -6% | 764 -69% | |
| Copy Program MB/s (MB/s) | 72.2 | 106.5 48% | 540 648% | 256.1 255% | |
| Copy Game MB/s (MB/s) | 404 | 385.4 -5% | 1288 219% | 368.4 -9% | |
| CrystalDiskMark 5.2 / 6 | -13% | 3% | 6% | -32% | |
| Write 4K (MB/s) | 118.3 | 122.8 4% | 131.1 11% | 135.2 14% | 112.3 -5% |
| Read 4K (MB/s) | 60.4 | 46.89 -22% | 45.48 -25% | 50.7 -16% | 42.13 -30% |
| Write Seq (MB/s) | 2067 | 1801 -13% | 2042 -1% | 2155 4% | 630 -70% |
| Read Seq (MB/s) | 2394 | 1014 -58% | 2259 -6% | 2504 5% | 1023 -57% |
| Write 4K Q32T1 (MB/s) | 325.5 | 333.7 3% | 429.1 32% | 395.6 22% | 336.6 3% |
| Read 4K Q32T1 (MB/s) | 332.2 | 314.4 -5% | 370.7 12% | 394.5 19% | 399.6 20% |
| Write Seq Q32T1 (MB/s) | 2978 | 2784 -7% | 2963 -1% | 2987 0% | 821 -72% |
| Read Seq Q32T1 (MB/s) | 3552 | 3261 -8% | 3564 0% | 3564 0% | 2030 -43% |
| Write 4K Q8T8 (MB/s) | 300.6 | ||||
| Read 4K Q8T8 (MB/s) | 751 | ||||
| Moyenne finale (programmes/paramètres) | -2% /
1% | 12% /
13% | 34% /
42% | -23% /
-20% |
* ... Moindre est la valeur, meilleures sont les performances

Disk Throttling: DiskSpd Read Loop, Queue Depth 8
| 3DMark 11 Performance | 2176 points | |
| 3DMark Cloud Gate Standard Score | 9927 points | |
| 3DMark Fire Strike Score | 1248 points | |
| 3DMark Time Spy Score | 497 points | |
Aide | ||
| Bas | Moyen | Élevé | Ultra | |
|---|---|---|---|---|
| Dota 2 Reborn (2015) | 75.8 | 49.1 | 22.4 | 19.7 |
| X-Plane 11.11 (2018) | 11.9 | 10.6 | 10.1 |
| HP EliteBook 830 G7 UHD Graphics 620, i7-10810U, Samsung SSD PM981a MZVLB512HBJQ | HP EliteBook x360 830 G6 UHD Graphics 620, i7-8565U, WDC PC SN720 SDAPNTW-1T00 | Lenovo ThinkPad X13-20T20033GE UHD Graphics 620, i5-10210U, Samsung SSD PM981a MZVLB512HBJQ | Dell Latitude 7310 UHD Graphics 620, i7-10610U, Samsung SSD PM981a MZVLB512HBJQ | Dynabook Portege X30L-G1331 UHD Graphics 620, i5-10210U, Samsung SSD PM981a MZVLB512HBJQ | Microsoft Surface Laptop 3 13 Core i5-1035G7 Iris Plus Graphics G7 (Ice Lake 64 EU), i5-1035G7, SK hynix BC501 HFM256GDGTNG | |
|---|---|---|---|---|---|---|
| Noise | -5% | -3% | -5% | -3% | -3% | |
| arrêt / environnement * (dB) | 26.8 | 28.8 -7% | 29.3 -9% | 29 -8% | 28.5 -6% | 28.5 -6% |
| Idle Minimum * (dB) | 27.1 | 28.8 -6% | 29.3 -8% | 29 -7% | 28.5 -5% | 28.5 -5% |
| Idle Average * (dB) | 27.1 | 28.8 -6% | 29.3 -8% | 29 -7% | 28.5 -5% | 28.5 -5% |
| Idle Maximum * (dB) | 27.1 | 32.2 -19% | 29.3 -8% | 29 -7% | 28.5 -5% | 28.5 -5% |
| Load Average * (dB) | 31.4 | 32.2 -3% | 30.7 2% | 30.1 4% | 32 -2% | 28.5 9% |
| Load Maximum * (dB) | 39 | 34.4 12% | 34 13% | 41.3 -6% | 38 3% | 40.4 -4% |
| Witcher 3 ultra * (dB) | 40.4 |
* ... Moindre est la valeur, meilleures sont les performances
Degré de la nuisance sonore
| Au repos |
| 27.1 / 27.1 / 27.1 dB(A) |
| Fortement sollicité |
| 31.4 / 39 dB(A) |
 | ||
30 dB silencieux 40 dB(A) audible 50 dB(A) bruyant |
||
min: | ||
(±) La température maximale du côté supérieur est de 41 °C / 106 F, par rapport à la moyenne de 35.9 °C / 97 F, allant de 21.4 à 59 °C pour la classe Subnotebook.
(-) Le fond chauffe jusqu'à un maximum de 47.2 °C / 117 F, contre une moyenne de 39.2 °C / 103 F
(+) En utilisation inactive, la température moyenne du côté supérieur est de 27.4 °C / 81 F, par rapport à la moyenne du dispositif de 30.8 °C / 87 F.
(+) Les repose-poignets et le pavé tactile sont plus froids que la température de la peau avec un maximum de 31.6 °C / 88.9 F et sont donc froids au toucher.
(-) La température moyenne de la zone de l'appui-paume de dispositifs similaires était de 28.2 °C / 82.8 F (-3.4 °C / #-6.1 F).
HP EliteBook 830 G7 analyse audio
(±) | le niveau sonore du haut-parleur est moyen mais bon (80.4# dB)
Basses 100 - 315 Hz
(±) | basse réduite - en moyenne 14.5% inférieure à la médiane
(±) | la linéarité des basses est moyenne (12.9% delta à la fréquence précédente)
Médiums 400 - 2000 Hz
(+) | médiane équilibrée - seulement 1.6% de la médiane
(+) | les médiums sont linéaires (2.5% delta à la fréquence précédente)
Aiguës 2 - 16 kHz
(+) | des sommets équilibrés - à seulement 4.2% de la médiane
(+) | les aigus sont linéaires (4.2% delta à la fréquence précédente)
Globalement 100 - 16 000 Hz
(+) | le son global est linéaire (14% différence à la médiane)
Par rapport à la même classe
» 26% de tous les appareils testés de cette catégorie étaient meilleurs, 6% similaires, 68% pires
» Le meilleur avait un delta de 5%, la moyenne était de 18%, le pire était de 53%.
Par rapport à tous les appareils testés
» 16% de tous les appareils testés étaient meilleurs, 4% similaires, 80% pires
» Le meilleur avait un delta de 4%, la moyenne était de 23%, le pire était de 134%.
Apple MacBook 12 (Early 2016) 1.1 GHz analyse audio
(+) | les haut-parleurs peuvent jouer relativement fort (83.6# dB)
Basses 100 - 315 Hz
(±) | basse réduite - en moyenne 11.3% inférieure à la médiane
(±) | la linéarité des basses est moyenne (14.2% delta à la fréquence précédente)
Médiums 400 - 2000 Hz
(+) | médiane équilibrée - seulement 2.4% de la médiane
(+) | les médiums sont linéaires (5.5% delta à la fréquence précédente)
Aiguës 2 - 16 kHz
(+) | des sommets équilibrés - à seulement 2% de la médiane
(+) | les aigus sont linéaires (4.5% delta à la fréquence précédente)
Globalement 100 - 16 000 Hz
(+) | le son global est linéaire (10.2% différence à la médiane)
Par rapport à la même classe
» 7% de tous les appareils testés de cette catégorie étaient meilleurs, 2% similaires, 91% pires
» Le meilleur avait un delta de 5%, la moyenne était de 18%, le pire était de 53%.
Par rapport à tous les appareils testés
» 5% de tous les appareils testés étaient meilleurs, 1% similaires, 94% pires
» Le meilleur avait un delta de 4%, la moyenne était de 23%, le pire était de 134%.
| Éteint/en veille | |
| Au repos | |
| Fortement sollicité |
|
Légende:
min: | |
| HP EliteBook 830 G7 i7-10810U, UHD Graphics 620, Samsung SSD PM981a MZVLB512HBJQ, IPS, 1920x1080, 13.3" | HP EliteBook x360 830 G6 i7-8565U, UHD Graphics 620, WDC PC SN720 SDAPNTW-1T00, IPS LED, 1920x1080, 13.3" | Lenovo ThinkPad X13-20T20033GE i5-10210U, UHD Graphics 620, Samsung SSD PM981a MZVLB512HBJQ, IPS, 1920x1080, 13.3" | Dell Latitude 7310 i7-10610U, UHD Graphics 620, Samsung SSD PM981a MZVLB512HBJQ, IPS, 1920x1080, 13.3" | Dynabook Portege X30L-G1331 i5-10210U, UHD Graphics 620, Samsung SSD PM981a MZVLB512HBJQ, IPS, 1920x1080, 13.3" | Microsoft Surface Laptop 3 13 Core i5-1035G7 i5-1035G7, Iris Plus Graphics G7 (Ice Lake 64 EU), SK hynix BC501 HFM256GDGTNG, IPS, 2256x1504, 13.5" | |
|---|---|---|---|---|---|---|
| Power Consumption | -40% | -11% | 7% | -5% | -30% | |
| Idle Minimum * (Watt) | 3.6 | 4.4 -22% | 2.9 19% | 2.7 25% | 2.8 22% | 4.4 -22% |
| Idle Average * (Watt) | 4.7 | 8 -70% | 5.6 -19% | 4.4 6% | 4.9 -4% | 7.5 -60% |
| Idle Maximum * (Watt) | 5.1 | 10.6 -108% | 8.9 -75% | 4.8 6% | 9 -76% | 7.8 -53% |
| Load Average * (Watt) | 33.3 | 34.6 -4% | 30.1 10% | 33.4 -0% | 31.2 6% | 41.9 -26% |
| Load Maximum * (Watt) | 70 | 68.2 3% | 61.3 12% | 69.7 -0% | 49.4 29% | 63.9 9% |
| Witcher 3 ultra * (Watt) | 40.8 |
* ... Moindre est la valeur, meilleures sont les performances
| HP EliteBook 830 G7 i7-10810U, UHD Graphics 620, 53 Wh | HP EliteBook x360 830 G6 i7-8565U, UHD Graphics 620, 53 Wh | Lenovo ThinkPad X13-20T20033GE i5-10210U, UHD Graphics 620, 48 Wh | Dell Latitude 7310 i7-10610U, UHD Graphics 620, 52 Wh | Dynabook Portege X30L-G1331 i5-10210U, UHD Graphics 620, 42 Wh | Microsoft Surface Laptop 3 13 Core i5-1035G7 i5-1035G7, Iris Plus Graphics G7 (Ice Lake 64 EU), 45 Wh | |
|---|---|---|---|---|---|---|
| Autonomie de la batterie | -25% | -23% | -11% | -28% | -26% | |
| Reader / Idle (h) | 34.6 | 37.4 8% | 34.4 -1% | |||
| WiFi v1.3 (h) | 11.5 | 9.8 -15% | 9.3 -19% | 12.6 10% | 8.3 -28% | 8.3 -28% |
| Load (h) | 3.7 | 2.4 -35% | 2.7 -27% | 1.8 -51% | 1.9 -49% |
Points positifs
Points négatifs

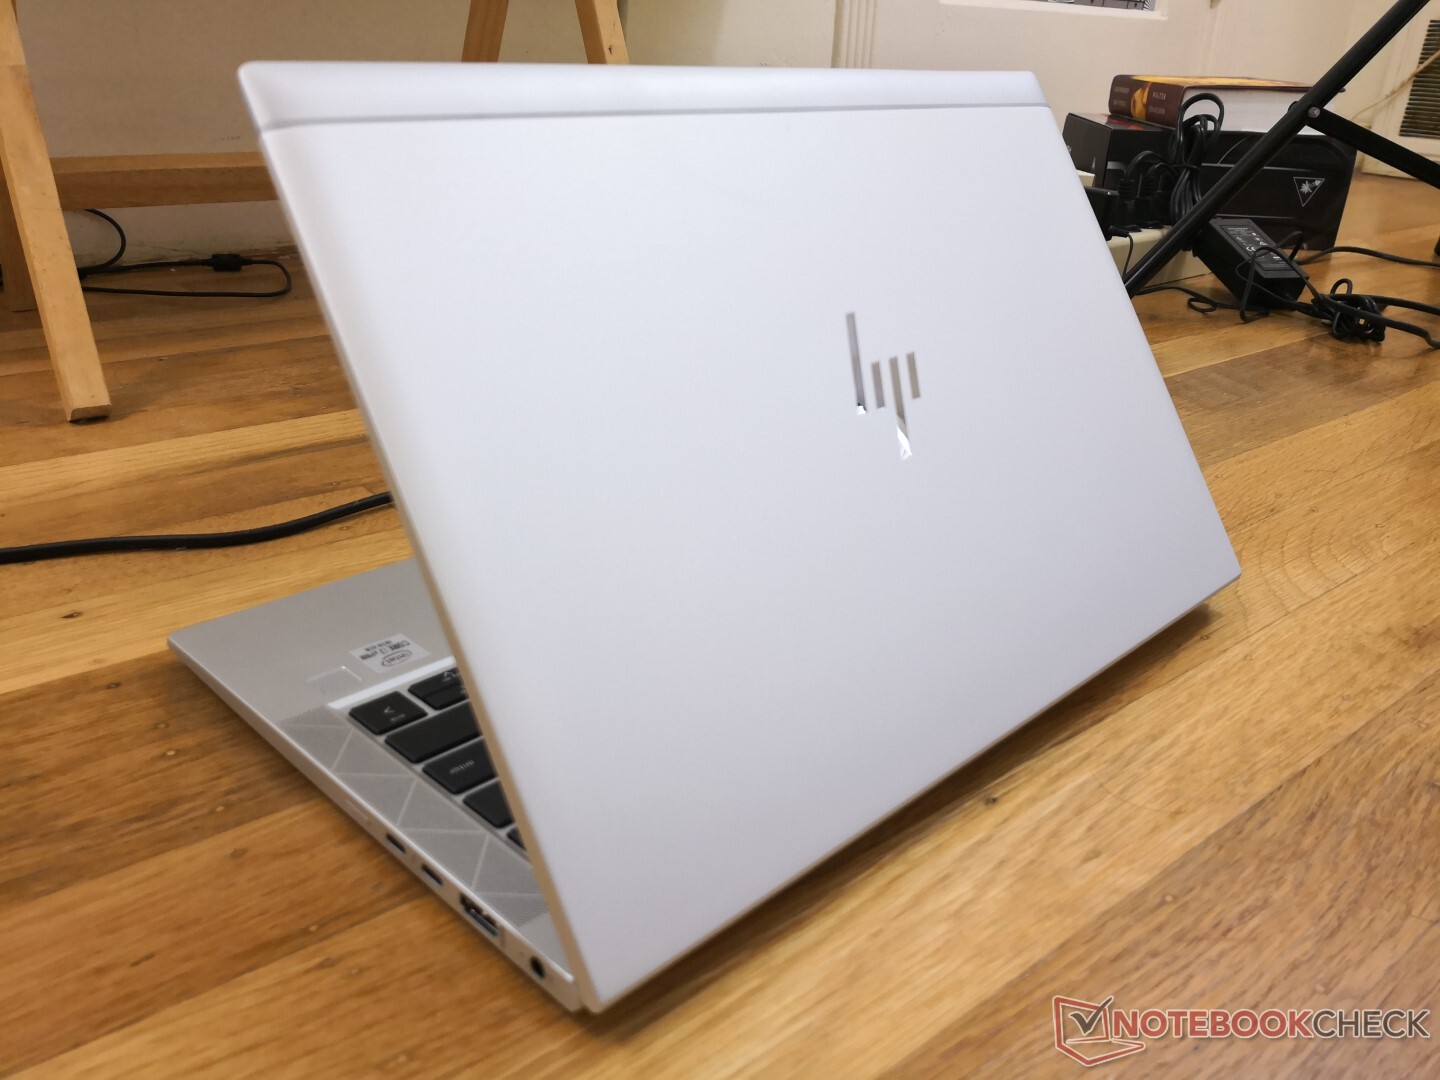
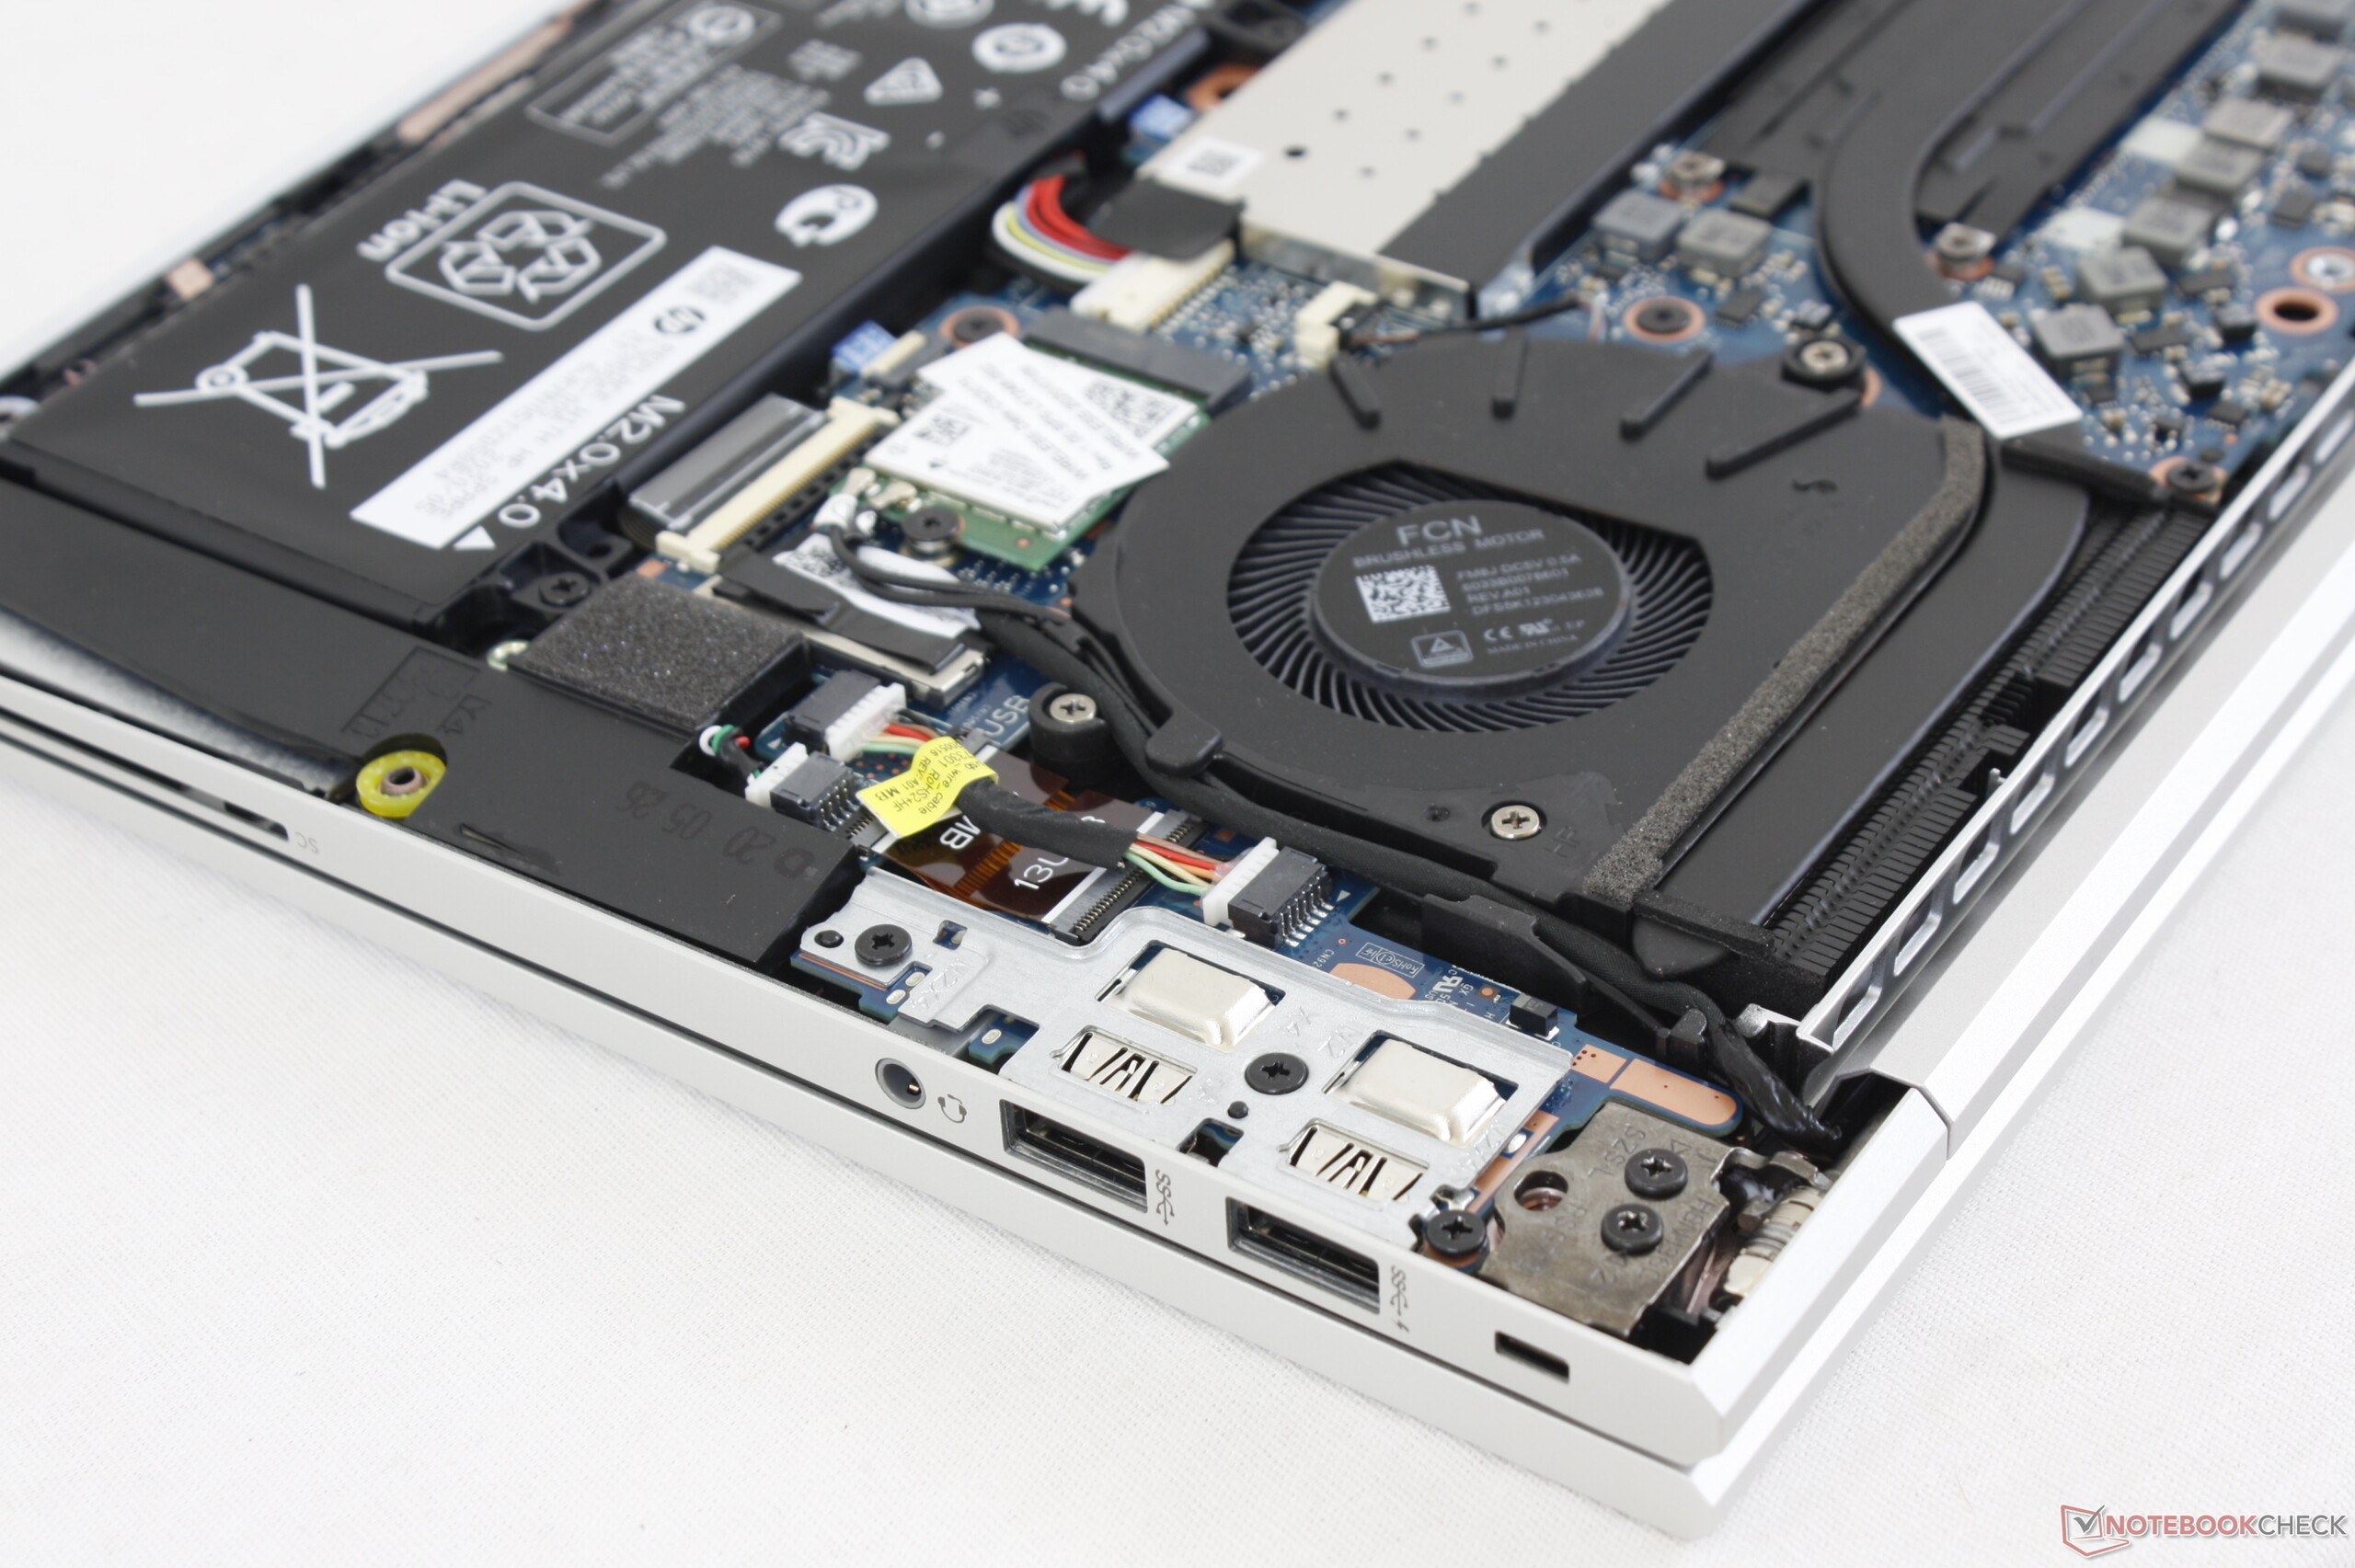
Il n'y avait pas assez de raisons valables pour passer de l'EliteBook 830 G5 au 830 G6, mais le dernier 830 G7 est une évolution majeure au regard du design et de la mobilité, et peut être plus facilement conseillé que ses prédécesseurs. Son clavier confortable, son écran ultra-lumineux en option, et les RAM / WLAN / SSD amovibles sont rares dans cette catégorie, tels les ThinkPad X13 et Latitude 7310.
Alors que nous adorons l'ensemble, l'absence de certaines fonctionnalités déçoit. Le trackpoint, les boutons de souris dédiés, le lecteur de carte SD, les graphismes Iris / GeForce MX, le bouton de démarrage hybride lecteur d'empreinte digitale et le capteur de proximité ne sont pas disponibles, quelle que soit la configuration. Les performances du processeur continuent à être inférieures à la moyenne. Si cela est excusable pour un ultraportable, c'est néanmoins gênant pour ceux qui auraient voulu pouvoir utiliser tout le potentiel du processeur.
Le HP EliteBook 830 G7 est un ultraportable pro du milieu de gamme, qui ressemble à une machine haut de gamme. Certaines fonctionnalités habituelles des PC portables pros sont absentes, mais l'EliteBook compense cela par sa rigidité, son évolutivité, sa luminosité, et son excellente expérience de frappe.
L’intégralité de cette critique est disponible en anglais en suivant ce lien.
HP EliteBook 830 G7
- 09/19/2020 v7 (old)
Allen Ngo
Price comparison
