Test du Lenovo ThinkPad X13 (i5-10210U, UHD 620, FHD) : petit, léger, compatible 4G
Note | Date | Modèle | Poids | Épaisseur | Taille | Résolution | Prix |
|---|---|---|---|---|---|---|---|
| 88 % v7 (old) | 09/20 | Lenovo ThinkPad X13-20T20033GE i5-10210U, UHD Graphics 620 | 1.3 kg | 16.9 mm | 13.30" | 1920x1080 | |
| 90.3 % v6 (old) | 05/19 | Lenovo ThinkPad X390-20Q1S02M00 i5-8265U, UHD Graphics 620 | 1.3 kg | 16.9 mm | 13.30" | 1920x1080 | |
| 88.8 % v7 (old) | 04/20 | Dell XPS 13 9300 i5 FHD i5-1035G1, UHD Graphics G1 (Ice Lake 32 EU) | 1.2 kg | 14.8 mm | 13.40" | 1920x1200 | |
| 85.1 % v7 (old) | 06/20 | Dynabook Portege X30L-G1331 i5-10210U, UHD Graphics 620 | 859 g | 17.9 mm | 13.30" | 1920x1080 | |
| 87.4 % v7 (old) | 07/20 | Huawei MateBook X Pro 2020 i7 i7-10510U, GeForce MX250 | 1.3 kg | 14.6 mm | 13.90" | 3000x2000 |

| SD Card Reader | |
| average JPG Copy Test (av. of 3 runs) | |
| Dell XPS 13 9300 i5 FHD (Toshiba Exceria Pro M501 64 GB UHS-II) | |
| Lenovo ThinkPad X390-20Q1S02M00 (Toshiba Exceria Pro M501) | |
| Dynabook Portege X30L-G1331 (Toshiba Exceria Pro M501 64 GB UHS-II) | |
| Moyenne de la classe Office (19.8 - 198.5, n=22, 2 dernières années) | |
| Lenovo ThinkPad X13-20T20033GE (Toshiba Exceria Pro M501 64 GB UHS-II) | |
| maximum AS SSD Seq Read Test (1GB) | |
| Dell XPS 13 9300 i5 FHD (Toshiba Exceria Pro M501 64 GB UHS-II) | |
| Lenovo ThinkPad X390-20Q1S02M00 (Toshiba Exceria Pro M501) | |
| Dynabook Portege X30L-G1331 (Toshiba Exceria Pro M501 64 GB UHS-II) | |
| Moyenne de la classe Office (27.4 - 249, n=21, 2 dernières années) | |
| Lenovo ThinkPad X13-20T20033GE (Toshiba Exceria Pro M501 64 GB UHS-II) | |


| |||||||||||||||||||||||||
Homogénéité de la luminosité: 90 %
Valeur mesurée au centre, sur batterie: 360 cd/m²
Contraste: 1710:1 (Valeurs des noirs: 0.21 cd/m²)
ΔE ColorChecker Calman: 6.7 | ∀{0.5-29.43 Ø4.73}
calibrated: 1.3
ΔE Greyscale Calman: 7.4 | ∀{0.09-98 Ø4.97}
95.9% sRGB (Argyll 1.6.3 3D)
61.7% AdobeRGB 1998 (Argyll 1.6.3 3D)
67.2% AdobeRGB 1998 (Argyll 3D)
96.2% sRGB (Argyll 3D)
66% Display P3 (Argyll 3D)
Gamma: 2.85
CCT: 6309 K
| Lenovo ThinkPad X13-20T20033GE Lenovo B133HAK01.1, IPS, 1920x1080, 13.3" | Lenovo ThinkPad X390-20Q1S02M00 LP133WF7-SPB1, IPS LED, 1920x1080, 13.3" | Dell XPS 13 9300 i5 FHD SHP14CB, IPS, 1920x1200, 13.4" | Dynabook Portege X30L-G1331 Toshiba TOS508F, IPS, 1920x1080, 13.3" | Huawei MateBook X Pro 2020 i7 JDI LPM139M422A, LTPS, 3000x2000, 13.9" | |
|---|---|---|---|---|---|
| Display | -1% | 7% | 1% | 2% | |
| Display P3 Coverage (%) | 66 | 65.3 -1% | 71.5 8% | 66.9 1% | 66.6 1% |
| sRGB Coverage (%) | 96.2 | 95.9 0% | 99.4 3% | 97.6 1% | 99.4 3% |
| AdobeRGB 1998 Coverage (%) | 67.2 | 66.6 -1% | 73.5 9% | 67.8 1% | 68.6 2% |
| Response Times | -13% | -14% | -13% | 1% | |
| Response Time Grey 50% / Grey 80% * (ms) | 52.8 ? | 57.6 ? -9% | 60 ? -14% | 54.8 ? -4% | 49.6 ? 6% |
| Response Time Black / White * (ms) | 29.2 ? | 34 ? -16% | 33.2 ? -14% | 35.6 ? -22% | 30.8 ? -5% |
| PWM Frequency (Hz) | 2500 ? | 23810 ? | 29070 ? | ||
| Screen | 18% | 21% | 16% | 30% | |
| Brightness middle (cd/m²) | 359 | 356 -1% | 619 72% | 482 34% | 557 55% |
| Brightness (cd/m²) | 342 | 336 -2% | 591 73% | 452 32% | 532 56% |
| Brightness Distribution (%) | 90 | 88 -2% | 91 1% | 91 1% | 87 -3% |
| Black Level * (cd/m²) | 0.21 | 0.16 24% | 0.35 -67% | 0.4 -90% | 0.33 -57% |
| Contrast (:1) | 1710 | 2225 30% | 1769 3% | 1205 -30% | 1688 -1% |
| Colorchecker dE 2000 * | 6.7 | 3.6 46% | 3 55% | 1.85 72% | 1.4 79% |
| Colorchecker dE 2000 max. * | 10.9 | 5.5 50% | 8.2 25% | 3.08 72% | 2.5 77% |
| Colorchecker dE 2000 calibrated * | 1.3 | 1.1 15% | 1 23% | 1.2 8% | 0.7 46% |
| Greyscale dE 2000 * | 7.4 | 4.7 36% | 5.2 30% | 2 73% | 2 73% |
| Gamma | 2.85 77% | 2.48 89% | 2.14 103% | 2.1 105% | 2.14 103% |
| CCT | 6309 103% | 6374 102% | 6340 103% | 6822 95% | 6689 97% |
| Color Space (Percent of AdobeRGB 1998) (%) | 61.7 | 61.3 -1% | 66.9 8% | 62.5 1% | 62.5 1% |
| Color Space (Percent of sRGB) (%) | 95.9 | 95.7 0% | 99.3 4% | 97.7 2% | 99.5 4% |
| Moyenne finale (programmes/paramètres) | 1% /
11% | 5% /
14% | 1% /
10% | 11% /
21% |
* ... Moindre est la valeur, meilleures sont les performances
Temps de réponse de l'écran
| ↔ Temps de réponse noir à blanc | ||
|---|---|---|
| 29.2 ms ... hausse ↗ et chute ↘ combinées | ↗ 16.8 ms hausse | 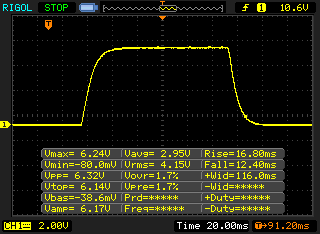 |
| ↘ 12.4 ms chute | ||
| L'écran souffre de latences relativement élevées, insuffisant pour le jeu. En comparaison, tous les appareils testés affichent entre 0.1 (minimum) et 240 (maximum) ms. » 78 % des appareils testés affichent de meilleures performances. Cela signifie que les latences relevées sont moins bonnes que la moyenne (19.9 ms) de tous les appareils testés. | ||
| ↔ Temps de réponse gris 50% à gris 80% | ||
| 52.8 ms ... hausse ↗ et chute ↘ combinées | ↗ 26 ms hausse | 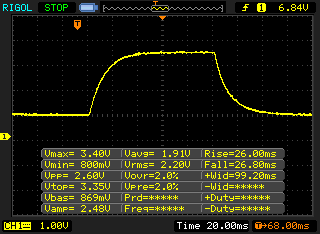 |
| ↘ 26.8 ms chute | ||
| L'écran souffre de latences très élevées, à éviter pour le jeu. En comparaison, tous les appareils testés affichent entre 0.165 (minimum) et 636 (maximum) ms. » 89 % des appareils testés affichent de meilleures performances. Cela signifie que les latences relevées sont moins bonnes que la moyenne (31.1 ms) de tous les appareils testés. | ||
Scintillement / MLI (Modulation de largeur d'impulsion)
| Scintillement / MLI (Modulation de largeur d'impulsion) non décelé | 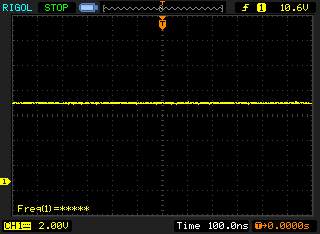 | ||
En comparaison, 52 % des appareils testés n'emploient pas MDI pour assombrir leur écran. Nous avons relevé une moyenne à 7784 (minimum : 5 - maximum : 343500) Hz dans le cas où une MDI était active. | |||
Cinebench R15: CPU Single 64Bit | CPU Multi 64Bit
Blender: v2.79 BMW27 CPU
7-Zip 18.03: 7z b 4 -mmt1 | 7z b 4
Geekbench 5.5: Single-Core | Multi-Core
HWBOT x265 Benchmark v2.2: 4k Preset
LibreOffice : 20 Documents To PDF
R Benchmark 2.5: Overall mean
| Cinebench R20 / CPU (Single Core) | |
| Moyenne de la classe Office (345 - 816, n=73, 2 dernières années) | |
| Dell XPS 13 9300 i5 FHD | |
| Dynabook Portege X30L-G1331 | |
| Moyenne Intel Core i5-10210U (322 - 428, n=30) | |
| Huawei MateBook X Pro 2020 i7 | |
| Lenovo ThinkPad X13-20T20033GE | |
| Cinebench R20 / CPU (Multi Core) | |
| Moyenne de la classe Office (648 - 8840, n=73, 2 dernières années) | |
| Dell XPS 13 9300 i5 FHD | |
| Lenovo ThinkPad X13-20T20033GE | |
| Moyenne Intel Core i5-10210U (722 - 1820, n=30) | |
| Dynabook Portege X30L-G1331 | |
| Huawei MateBook X Pro 2020 i7 | |
| Cinebench R15 / CPU Single 64Bit | |
| Moyenne de la classe Office (99.5 - 312, n=75, 2 dernières années) | |
| Huawei MateBook X Pro 2020 i7 | |
| Lenovo ThinkPad X13-20T20033GE | |
| Dell XPS 13 9300 i5 FHD | |
| Dynabook Portege X30L-G1331 | |
| Moyenne Intel Core i5-10210U (134 - 174, n=35) | |
| Lenovo ThinkPad X390-20Q1S02M00 | |
| Cinebench R15 / CPU Multi 64Bit | |
| Moyenne de la classe Office (250 - 3380, n=75, 2 dernières années) | |
| Lenovo ThinkPad X13-20T20033GE | |
| Lenovo ThinkPad X390-20Q1S02M00 | |
| Dell XPS 13 9300 i5 FHD | |
| Dell XPS 13 9300 i5 FHD | |
| Moyenne Intel Core i5-10210U (320 - 790, n=35) | |
| Huawei MateBook X Pro 2020 i7 | |
| Dynabook Portege X30L-G1331 | |
| Blender / v2.79 BMW27 CPU | |
| Huawei MateBook X Pro 2020 i7 | |
| Dynabook Portege X30L-G1331 | |
| Moyenne Intel Core i5-10210U (585 - 1339, n=24) | |
| Dell XPS 13 9300 i5 FHD | |
| Lenovo ThinkPad X13-20T20033GE | |
| Moyenne de la classe Office (158 - 1940, n=74, 2 dernières années) | |
| 7-Zip 18.03 / 7z b 4 -mmt1 | |
| Moyenne de la classe Office (3387 - 6469, n=75, 2 dernières années) | |
| Huawei MateBook X Pro 2020 i7 | |
| Dynabook Portege X30L-G1331 | |
| Lenovo ThinkPad X13-20T20033GE | |
| Moyenne Intel Core i5-10210U (3504 - 4467, n=24) | |
| Dell XPS 13 9300 i5 FHD | |
| 7-Zip 18.03 / 7z b 4 | |
| Moyenne de la classe Office (7098 - 76886, n=75, 2 dernières années) | |
| Dell XPS 13 9300 i5 FHD | |
| Lenovo ThinkPad X13-20T20033GE | |
| Moyenne Intel Core i5-10210U (10920 - 21679, n=24) | |
| Huawei MateBook X Pro 2020 i7 | |
| Dynabook Portege X30L-G1331 | |
| Geekbench 5.5 / Single-Core | |
| Moyenne de la classe Office (811 - 2128, n=71, 2 dernières années) | |
| Dell XPS 13 9300 i5 FHD | |
| Dynabook Portege X30L-G1331 | |
| Lenovo ThinkPad X13-20T20033GE | |
| Moyenne Intel Core i5-10210U (949 - 1133, n=27) | |
| Huawei MateBook X Pro 2020 i7 | |
| Geekbench 5.5 / Multi-Core | |
| Moyenne de la classe Office (1483 - 16999, n=71, 2 dernières années) | |
| Dell XPS 13 9300 i5 FHD | |
| Lenovo ThinkPad X13-20T20033GE | |
| Dynabook Portege X30L-G1331 | |
| Moyenne Intel Core i5-10210U (2079 - 4256, n=27) | |
| Huawei MateBook X Pro 2020 i7 | |
| HWBOT x265 Benchmark v2.2 / 4k Preset | |
| Moyenne de la classe Office (2.21 - 26, n=74, 2 dernières années) | |
| Lenovo ThinkPad X13-20T20033GE | |
| Moyenne Intel Core i5-10210U (2.36 - 6.28, n=24) | |
| Dell XPS 13 9300 i5 FHD | |
| Dynabook Portege X30L-G1331 | |
| Huawei MateBook X Pro 2020 i7 | |
| LibreOffice / 20 Documents To PDF | |
| Moyenne Intel Core i5-10210U (49.6 - 80.3, n=18) | |
| Dynabook Portege X30L-G1331 | |
| Moyenne de la classe Office (39.9 - 102.3, n=74, 2 dernières années) | |
| Huawei MateBook X Pro 2020 i7 | |
| Lenovo ThinkPad X13-20T20033GE | |
| R Benchmark 2.5 / Overall mean | |
| Moyenne Intel Core i5-10210U (0.658 - 0.901, n=24) | |
| Dell XPS 13 9300 i5 FHD | |
| Lenovo ThinkPad X13-20T20033GE | |
| Dynabook Portege X30L-G1331 | |
| Huawei MateBook X Pro 2020 i7 | |
| Moyenne de la classe Office (0.4098 - 0.888, n=74, 2 dernières années) | |
* ... Moindre est la valeur, meilleures sont les performances
| PCMark 8 Home Score Accelerated v2 | 3789 points | |
| PCMark 8 Work Score Accelerated v2 | 5114 points | |
| PCMark 10 Score | 4184 points | |
Aide | ||
| DPC Latencies / LatencyMon - interrupt to process latency (max), Web, Youtube, Prime95 | |
| Dynabook Portege X30L-G1331 | |
| Dell XPS 13 9300 i5 FHD | |
| Lenovo ThinkPad X13-20T20033GE | |
* ... Moindre est la valeur, meilleures sont les performances
| Lenovo ThinkPad X13-20T20033GE Samsung SSD PM981a MZVLB512HBJQ | Lenovo ThinkPad X390-20Q1S02M00 Intel SSD Pro 7600p SSDPEKKF512G8L | Dell XPS 13 9300 i5 FHD Toshiba XG6 KXG60ZNV512G | Dynabook Portege X30L-G1331 Samsung SSD PM981a MZVLB512HBJQ | Huawei MateBook X Pro 2020 i7 Samsung PM981a MZVLB1T0HBLR | Moyenne Samsung SSD PM981a MZVLB512HBJQ | |
|---|---|---|---|---|---|---|
| CrystalDiskMark 5.2 / 6 | -12% | -8% | 3% | 7% | 5% | |
| Write 4K (MB/s) | 131.1 | 120.7 -8% | 121.9 -7% | 164.1 25% | 165.6 26% | 140.8 ? 7% |
| Read 4K (MB/s) | 45.48 | 58.5 29% | 50 10% | 49.34 8% | 50.2 10% | 48.6 ? 7% |
| Write Seq (MB/s) | 2042 | 1491 -27% | 1497 -27% | 1777 -13% | 1905 -7% | 2106 ? 3% |
| Read Seq (MB/s) | 2259 | 2760 22% | 2111 -7% | 1752 -22% | 1669 -26% | 2099 ? -7% |
| Write 4K Q32T1 (MB/s) | 429.1 | 237.5 -45% | 365.9 -15% | 401.1 -7% | 474.6 11% | 451 ? 5% |
| Read 4K Q32T1 (MB/s) | 370.7 | 336.1 -9% | 384.6 4% | 498.7 35% | 508 37% | 482 ? 30% |
| Write Seq Q32T1 (MB/s) | 2963 | 1512 -49% | 2748 -7% | 2988 1% | 3007 1% | 2903 ? -2% |
| Read Seq Q32T1 (MB/s) | 3564 | 3154 -12% | 3119 -12% | 3544 -1% | 3556 0% | 3511 ? -1% |
| Write 4K Q8T8 (MB/s) | 1065 | 914 ? | ||||
| Read 4K Q8T8 (MB/s) | 891 | 1017 ? | ||||
| AS SSD | -2% | -20% | 1% | 26% | 2% | |
| Seq Read (MB/s) | 2714 | 2689 -1% | 2328 -14% | 2067 -24% | 2737 1% | 2412 ? -11% |
| Seq Write (MB/s) | 1374 | 1462 6% | 1137 -17% | 2444 78% | 2530 84% | 1983 ? 44% |
| 4K Read (MB/s) | 51.2 | 63.8 25% | 48.07 -6% | 55.8 9% | 54 5% | 53.1 ? 4% |
| 4K Write (MB/s) | 135.7 | 139.8 3% | 120.6 -11% | 124.6 -8% | 152.5 12% | 131.1 ? -3% |
| 4K-64 Read (MB/s) | 962 | 865 -10% | 899 -7% | 1601 66% | 2011 109% | 1201 ? 25% |
| 4K-64 Write (MB/s) | 1420 | 1041 -27% | 1220 -14% | 1696 19% | 1260 -11% | 1726 ? 22% |
| Access Time Read * (ms) | 0.043 | 0.037 14% | 0.085 -98% | 0.048 -12% | 0.066 -53% | 0.05525 ? -28% |
| Access Time Write * (ms) | 0.028 | 0.024 14% | 0.033 -18% | 0.091 -225% | 0.024 14% | 0.05394 ? -93% |
| Score Read (Points) | 1284 | 1198 -7% | 1180 -8% | 1864 45% | 2339 82% | 1495 ? 16% |
| Score Write (Points) | 1693 | 1328 -22% | 1455 -14% | 2065 22% | 1666 -2% | 2055 ? 21% |
| Score Total (Points) | 3579 | 3095 -14% | 3189 -11% | 4908 37% | 5191 45% | 4303 ? 20% |
| Moyenne finale (programmes/paramètres) | -7% /
-6% | -14% /
-15% | 2% /
2% | 17% /
18% | 4% /
3% |
* ... Moindre est la valeur, meilleures sont les performances

Continuous reading performance: DiskSpd Read Loop, Queue Depth 8
| 3DMark 11 Performance | 2117 points | |
| 3DMark Fire Strike Score | 1210 points | |
| 3DMark Time Spy Score | 483 points | |
Aide | ||
| Bas | Moyen | Élevé | Ultra | |
|---|---|---|---|---|
| The Witcher 3 (2015) | 17.9 | |||
| Dota 2 Reborn (2015) | 83.7 | 51.4 | 22.6 | 19.9 |
| Final Fantasy XV Benchmark (2018) | 11.49 | |||
| X-Plane 11.11 (2018) | 13.2 | 15.9 | 14.4 | |
| Far Cry 5 (2018) | 16 |
Degré de la nuisance sonore
| Au repos |
| 29.3 / 29.3 / 29.3 dB(A) |
| Fortement sollicité |
| 30.7 / 34 dB(A) |
 | ||
30 dB silencieux 40 dB(A) audible 50 dB(A) bruyant |
||
min: | ||
(-) La température maximale du côté supérieur est de 48.4 °C / 119 F, par rapport à la moyenne de 34.3 °C / 94 F, allant de 21.2 à 62.5 °C pour la classe Office.
(±) Le fond chauffe jusqu'à un maximum de 43.8 °C / 111 F, contre une moyenne de 36.8 °C / 98 F
(+) En utilisation inactive, la température moyenne du côté supérieur est de 24.4 °C / 76 F, par rapport à la moyenne du dispositif de 29.5 °C / 85 F.
(+) Les repose-poignets et le pavé tactile atteignent la température maximale de la peau (35.9 °C / 96.6 F) et ne sont donc pas chauds.
(-) La température moyenne de la zone de l'appui-paume de dispositifs similaires était de 27.5 °C / 81.5 F (-8.4 °C / #-15.1 F).
Lenovo ThinkPad X13-20T20033GE analyse audio
(±) | le niveau sonore du haut-parleur est moyen mais bon (74.6# dB)
Basses 100 - 315 Hz
(-) | presque aucune basse - en moyenne 17.9% plus bas que la médiane
(±) | la linéarité des basses est moyenne (13.2% delta à la fréquence précédente)
Médiums 400 - 2000 Hz
(+) | médiane équilibrée - seulement 4.6% de la médiane
(+) | les médiums sont linéaires (4.4% delta à la fréquence précédente)
Aiguës 2 - 16 kHz
(+) | des sommets équilibrés - à seulement 2.6% de la médiane
(±) | la linéarité des aigus est moyenne (7% delta à la fréquence précédente)
Globalement 100 - 16 000 Hz
(±) | la linéarité du son global est moyenne (23.8% de différence avec la médiane)
Par rapport à la même classe
» 68% de tous les appareils testés de cette catégorie étaient meilleurs, 8% similaires, 24% pires
» Le meilleur avait un delta de 7%, la moyenne était de 21%, le pire était de 53%.
Par rapport à tous les appareils testés
» 71% de tous les appareils testés étaient meilleurs, 6% similaires, 22% pires
» Le meilleur avait un delta de 4%, la moyenne était de 24%, le pire était de 134%.
| Éteint/en veille | |
| Au repos | |
| Fortement sollicité |
|
Légende:
min: | |
| Lenovo ThinkPad X13-20T20033GE i5-10210U, UHD Graphics 620, Samsung SSD PM981a MZVLB512HBJQ, IPS, 1920x1080, 13.3" | Lenovo ThinkPad X390-20Q1S02M00 i5-8265U, UHD Graphics 620, Intel SSD Pro 7600p SSDPEKKF512G8L, IPS LED, 1920x1080, 13.3" | Dell XPS 13 9300 i5 FHD i5-1035G1, UHD Graphics G1 (Ice Lake 32 EU), Toshiba XG6 KXG60ZNV512G, IPS, 1920x1200, 13.4" | Dynabook Portege X30L-G1331 i5-10210U, UHD Graphics 620, Samsung SSD PM981a MZVLB512HBJQ, IPS, 1920x1080, 13.3" | Huawei MateBook X Pro 2020 i7 i7-10510U, GeForce MX250, Samsung PM981a MZVLB1T0HBLR, LTPS, 3000x2000, 13.9" | Moyenne Intel UHD Graphics 620 | Moyenne de la classe Office | |
|---|---|---|---|---|---|---|---|
| Power Consumption | -13% | -8% | 6% | -43% | -9% | -26% | |
| Idle Minimum * (Watt) | 2.9 | 3.4 -17% | 3.4 -17% | 2.8 3% | 4.3 -48% | 3.81 ? -31% | 4.41 ? -52% |
| Idle Average * (Watt) | 5.6 | 5.6 -0% | 6 -7% | 4.9 12% | 8.5 -52% | 6.94 ? -24% | 7.37 ? -32% |
| Idle Maximum * (Watt) | 8.9 | 8.7 2% | 10.2 -15% | 9 -1% | 12 -35% | 8.75 ? 2% | 8.58 ? 4% |
| Load Average * (Watt) | 30.1 | 43.6 -45% | 36.6 -22% | 31.2 -4% | 54.8 -82% | 35 ? -16% | 43 ? -43% |
| Load Maximum * (Watt) | 61.3 | 65 -6% | 49.3 20% | 49.4 19% | 61.5 -0% | 47.5 ? 23% | 64.6 ? -5% |
| Witcher 3 ultra * (Watt) | 47.1 |
* ... Moindre est la valeur, meilleures sont les performances
| Lenovo ThinkPad X13-20T20033GE i5-10210U, UHD Graphics 620, 48 Wh | Lenovo ThinkPad X390-20Q1S02M00 i5-8265U, UHD Graphics 620, 48 Wh | Dell XPS 13 9300 i5 FHD i5-1035G1, UHD Graphics G1 (Ice Lake 32 EU), 52 Wh | Dynabook Portege X30L-G1331 i5-10210U, UHD Graphics 620, 42 Wh | Huawei MateBook X Pro 2020 i7 i7-10510U, GeForce MX250, 57.4 Wh | Moyenne de la classe Office | |
|---|---|---|---|---|---|---|
| Autonomie de la batterie | -14% | 25% | -11% | 1% | 11% | |
| H.264 (h) | 11.7 | 12.7 9% | 14.4 23% | 11.9 2% | 15 ? 28% | |
| WiFi v1.3 (h) | 9.3 | 8.3 -11% | 11.7 26% | 8.3 -11% | 10.4 12% | 12.9 ? 39% |
| Load (h) | 2.7 | 1.6 -41% | 3.4 26% | 2.4 -11% | 1.794 ? -34% |
Points positifs
Points négatifs
Verdict - Forces connues dans un châssis connu
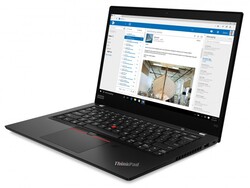

Le Lenovo ThinkPad X13 dévoile ses forces dans notre test : châssis de haute qualité, bons périphériques d'entrée, et autonomie correcte. Avec son écran de 13,3 pouces, le PC portable compact est bien adapté aux nomades. Cependant, le ThinkPad X390, le prédécesseur du X13, avait déjà ces qualités - ce ne sont donc pas les vrais avantages du nouveau portable, qui se cachent ailleurs.
Le Lenovo ThinkPad X13 avec processeur Intel Core i5 est plus efficient que son prédécesseur, mais n'offre qu'un léger gain de performances.
Le X13 possède une meilleure autonomie grâce à son processeur plus efficient. Le nouveau processeur fournit des performances correctes au quotidien, mais chute rapidement au niveau de l'Intel Core i5-8265U du ThinkPad X390 en cas de sollicitations prolongées. Les performances du nouveau système sont un peu supérieures, mais il ne faut pas s'attendre à un gain de plus de 10 %. De ce fait, nous ne recommandons pas aux possesseurs du ThinkPad X390 de passer au X13, et ceux qui n'ont pas besoin d'un bonne autonomie ni de performances légèrement supérieures, économiserons même en achetant le modèle précédent...
L’intégralité de cette critique est disponible en anglais en suivant ce lien.
Lenovo ThinkPad X13-20T20033GE
- 08/13/2020 v7 (old)
Mike Wobker