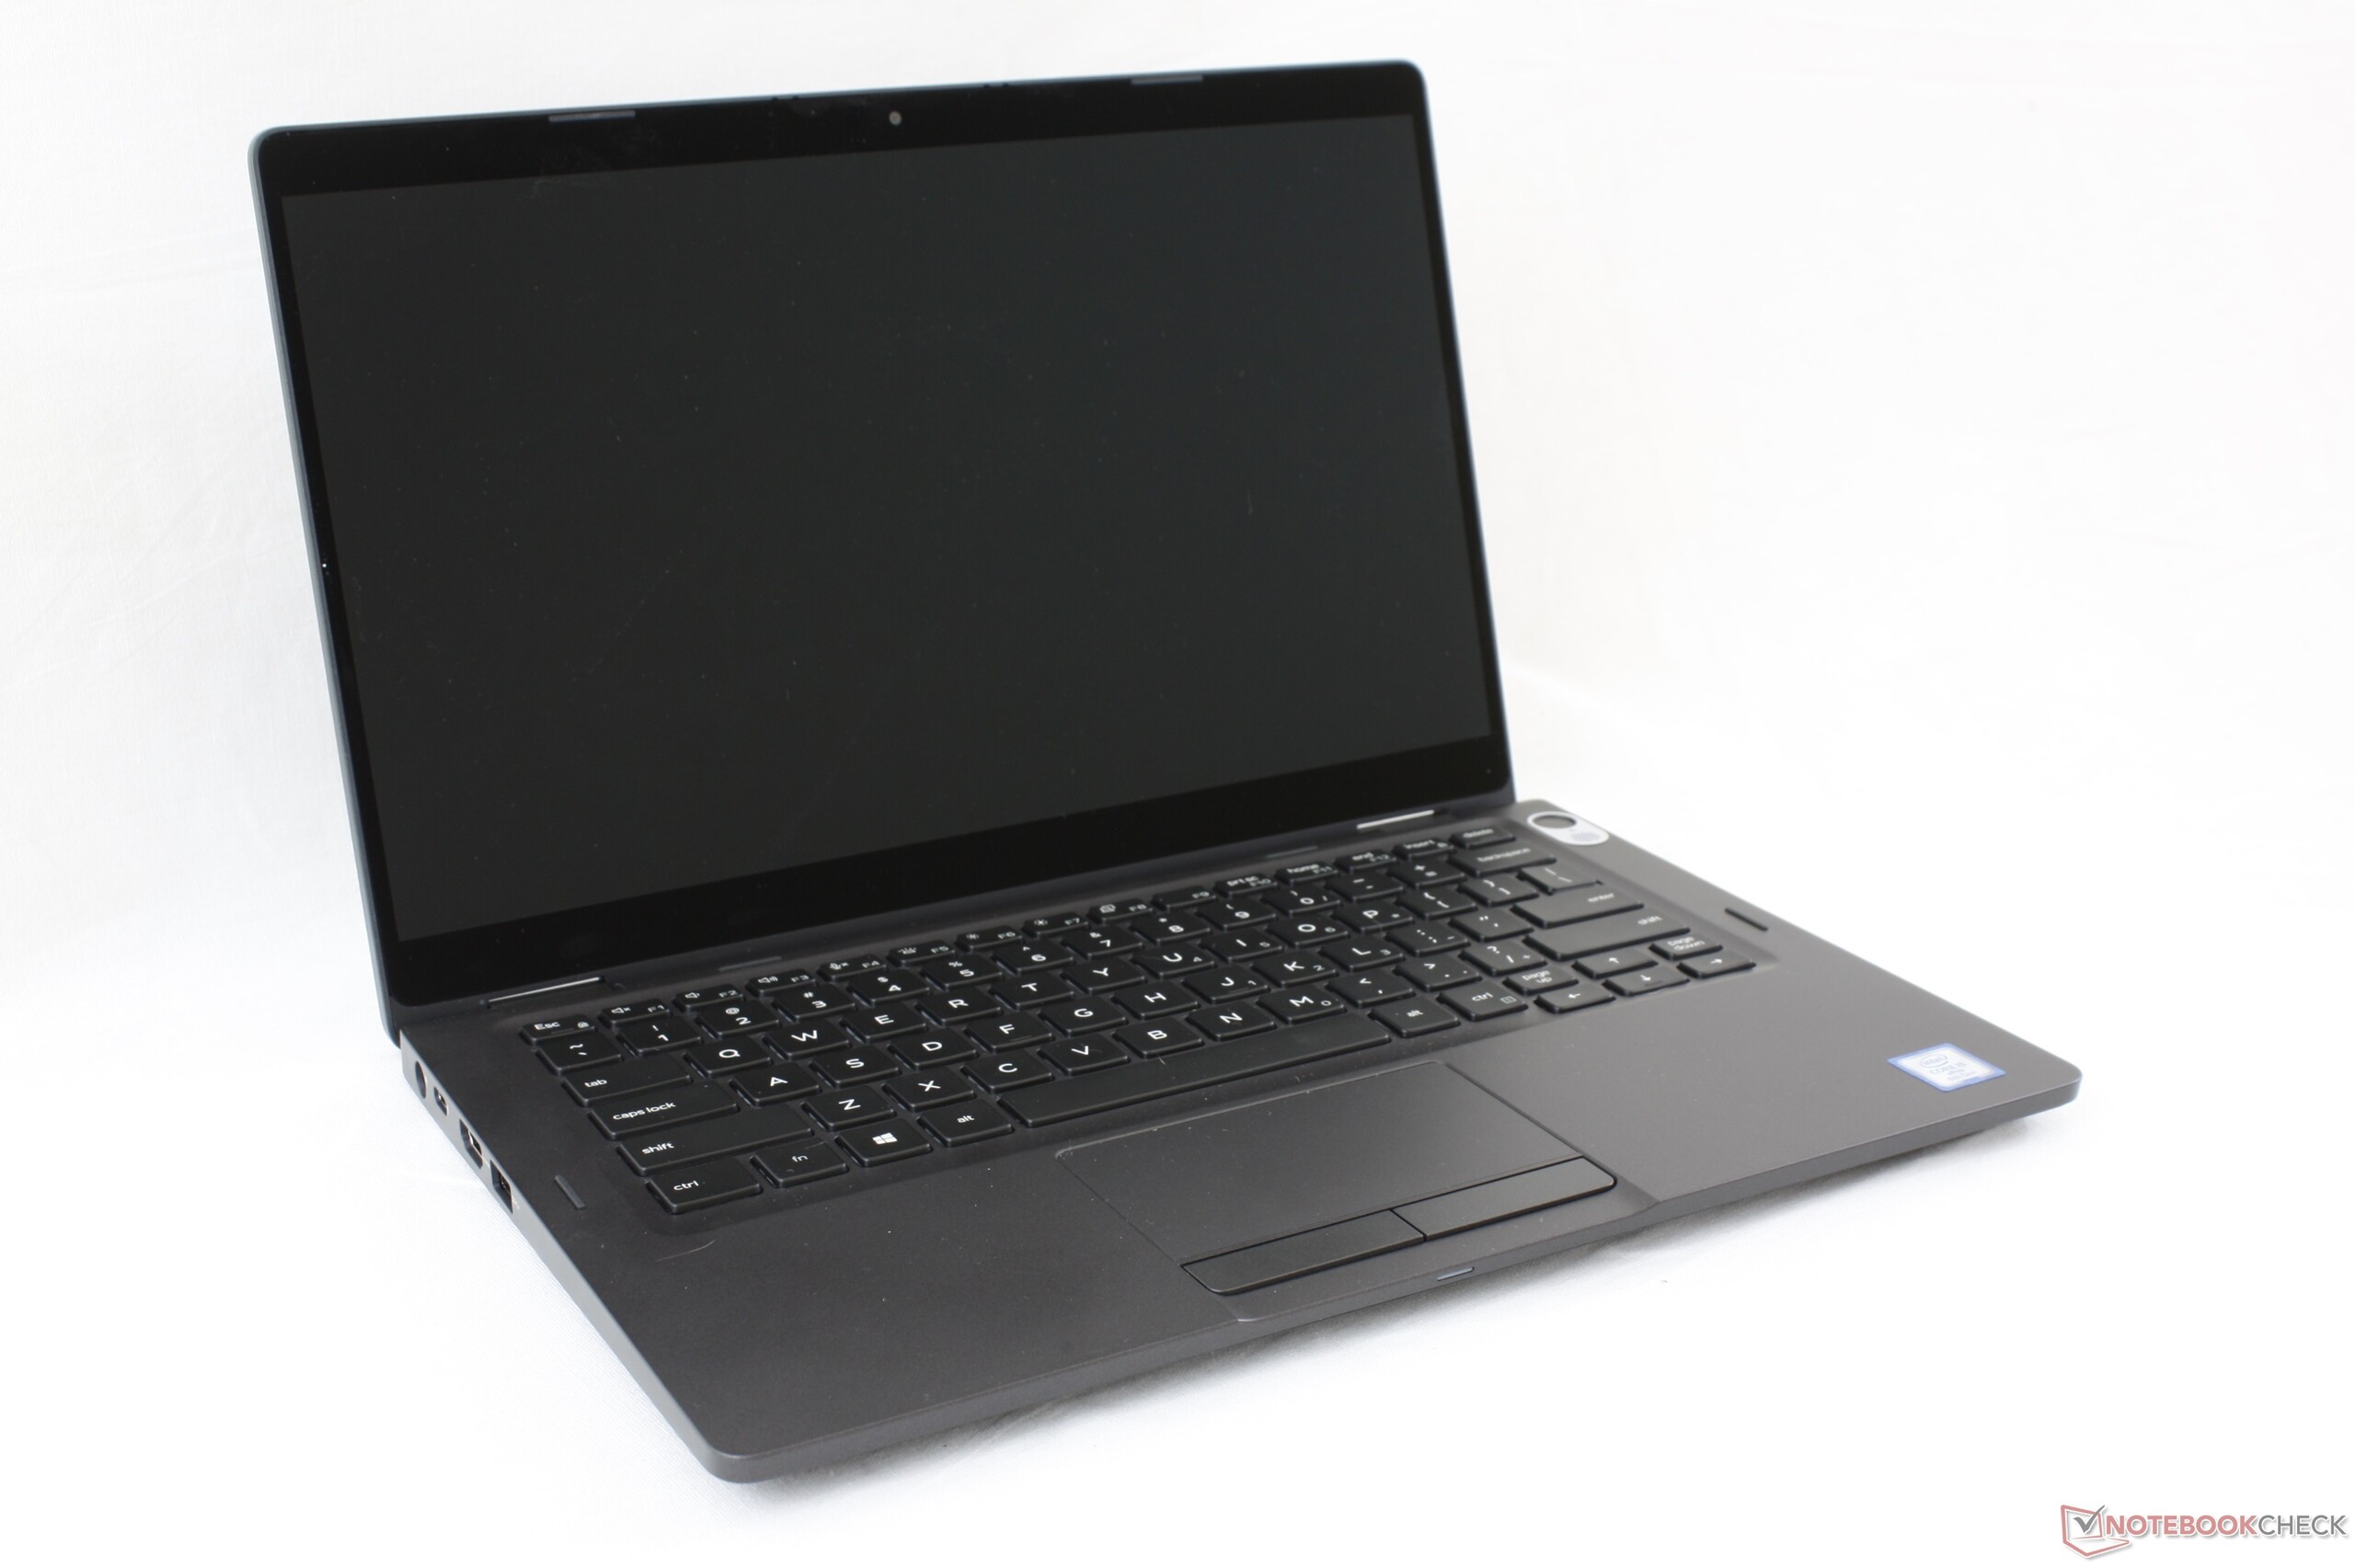
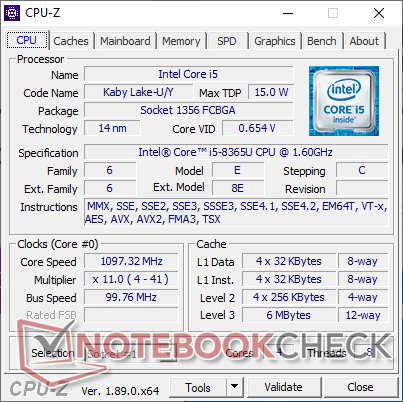
Courte critique du Dell Latitude 13 5300 2-en-1 (i5-8365U, UHD 620, FHD) : une alternative convertible au ThinkPad X390 Yoga
| SD Card Reader | |
| average JPG Copy Test (av. of 3 runs) | |
| Dell XPS 13 9380 2019 (Toshiba Exceria Pro SDXC 64 GB UHS-II) | |
| Dell Latitude 13 5300 2-in-1 (Toshiba Exceria Pro M501) | |
| Samsung Notebook 9 NP930QAA (Toshiba Exceria Pro M501 microSDXC 64GB) | |
| Lenovo ThinkPad X390-20Q1S02M00 (Toshiba Exceria Pro M501) | |
| HP ProBook 430 G6-5TJ89EA (Toshiba Exceria Pro SDXC 64 GB UHS-II) | |
| maximum AS SSD Seq Read Test (1GB) | |
| Dell XPS 13 9380 2019 (Toshiba Exceria Pro SDXC 64 GB UHS-II) | |
| Dell Latitude 13 5300 2-in-1 (Toshiba Exceria Pro M501) | |
| Samsung Notebook 9 NP930QAA (Toshiba Exceria Pro M501 microSDXC 64GB) | |
| Lenovo ThinkPad X390-20Q1S02M00 (Toshiba Exceria Pro M501) | |
| HP ProBook 430 G6-5TJ89EA (Toshiba Exceria Pro SDXC 64 GB UHS-II) | |
| |||||||||||||||||||||||||
Homogénéité de la luminosité: 89 %
Valeur mesurée au centre, sur batterie: 316.2 cd/m²
Contraste: 1171:1 (Valeurs des noirs: 0.27 cd/m²)
ΔE ColorChecker Calman: 5.67 | ∀{0.5-29.43 Ø4.71}
calibrated: 1.26
ΔE Greyscale Calman: 7 | ∀{0.09-98 Ø4.96}
95.7% sRGB (Argyll 1.6.3 3D)
61.4% AdobeRGB 1998 (Argyll 1.6.3 3D)
66.5% AdobeRGB 1998 (Argyll 3D)
95.7% sRGB (Argyll 3D)
64.9% Display P3 (Argyll 3D)
Gamma: 2.64
CCT: 6440 K
| Dell Latitude 13 5300 2-in-1 LG Philips LGD05DC, IPS, 13.3", 1920x1080 | Lenovo ThinkPad X390-20Q1S02M00 LP133WF7-SPB1, IPS LED, 13.3", 1920x1080 | Samsung Notebook 9 NP930QAA BOE075E, IPS, 13.3", 1920x1080 | Dell XPS 13 9380 2019 ID: AUO 282B B133ZAN Dell: 90NTH, IPS, 13.3", 3840x2160 | HP Spectre x360 13t-ae000 LGD0588, IPS, 13.3", 3840x2160 | HP EliteBook x360 1030 G3 45X96UT Chi Mei CMN1380, IPS, 13.3", 1920x1080 | |
|---|---|---|---|---|---|---|
| Display | 0% | -1% | -2% | 8% | 3% | |
| Display P3 Coverage (%) | 64.9 | 65.3 1% | 65.4 1% | 64.7 0% | 71.9 11% | 66.7 3% |
| sRGB Coverage (%) | 95.7 | 95.9 0% | 91.5 -4% | 93.1 -3% | 98.1 3% | 98.6 3% |
| AdobeRGB 1998 Coverage (%) | 66.5 | 66.6 0% | 66.2 0% | 65.3 -2% | 73.1 10% | 68.7 3% |
| Response Times | -48% | -23% | -52% | -36% | -9% | |
| Response Time Grey 50% / Grey 80% * (ms) | 37.6 ? | 57.6 ? -53% | 49.2 ? -31% | 58 ? -54% | 51.6 ? -37% | 39.6 ? -5% |
| Response Time Black / White * (ms) | 24 ? | 34 ? -42% | 27.6 ? -15% | 36 ? -50% | 32.4 ? -35% | 27.2 ? -13% |
| PWM Frequency (Hz) | 3049 ? | 26040 ? | ||||
| Screen | 25% | -5% | 2% | 19% | 17% | |
| Brightness middle (cd/m²) | 316.2 | 356 13% | 473 50% | 404 28% | 329.8 4% | 467.2 48% |
| Brightness (cd/m²) | 298 | 336 13% | 441 48% | 389 31% | 318 7% | 445 49% |
| Brightness Distribution (%) | 89 | 88 -1% | 88 -1% | 85 -4% | 74 -17% | 91 2% |
| Black Level * (cd/m²) | 0.27 | 0.16 41% | 0.57 -111% | 0.37 -37% | 0.25 7% | 0.4 -48% |
| Contrast (:1) | 1171 | 2225 90% | 830 -29% | 1092 -7% | 1319 13% | 1168 0% |
| Colorchecker dE 2000 * | 5.67 | 3.6 37% | 3.72 34% | 3.72 34% | 2.37 58% | 2.41 57% |
| Colorchecker dE 2000 max. * | 7.97 | 5.5 31% | 7.83 2% | 7.38 7% | 4.08 49% | 5.58 30% |
| Colorchecker dE 2000 calibrated * | 1.26 | 1.1 13% | 2.14 -70% | 2.06 -63% | 1.33 -6% | |
| Greyscale dE 2000 * | 7 | 4.7 33% | 5.1 27% | 4.44 37% | 2.8 60% | 3.7 47% |
| Gamma | 2.64 83% | 2.48 89% | 2.31 95% | 2.34 94% | 2.145 103% | 2.37 93% |
| CCT | 6440 101% | 6374 102% | 7569 86% | 7095 92% | 6441 101% | 7158 91% |
| Color Space (Percent of AdobeRGB 1998) (%) | 61.4 | 61.3 0% | 58.9 -4% | 60 -2% | 67 9% | 62.5 2% |
| Color Space (Percent of sRGB) (%) | 95.7 | 95.7 0% | 90.8 -5% | 93 -3% | 98 2% | 99.6 4% |
| Moyenne finale (programmes/paramètres) | -8% /
11% | -10% /
-7% | -17% /
-6% | -3% /
10% | 4% /
11% |
* ... Moindre est la valeur, meilleures sont les performances
Temps de réponse de l'écran
| ↔ Temps de réponse noir à blanc | ||
|---|---|---|
| 24 ms ... hausse ↗ et chute ↘ combinées | ↗ 13.2 ms hausse | 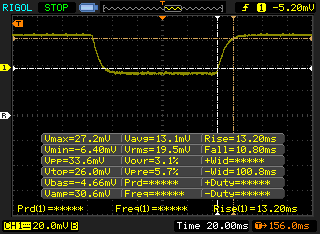 |
| ↘ 10.8 ms chute | ||
| L'écran montre de bons temps de réponse, mais insuffisant pour du jeu compétitif. En comparaison, tous les appareils testés affichent entre 0.1 (minimum) et 240 (maximum) ms. » 54 % des appareils testés affichent de meilleures performances. Cela signifie que les latences relevées sont moins bonnes que la moyenne (19.8 ms) de tous les appareils testés. | ||
| ↔ Temps de réponse gris 50% à gris 80% | ||
| 37.6 ms ... hausse ↗ et chute ↘ combinées | ↗ 18.8 ms hausse | 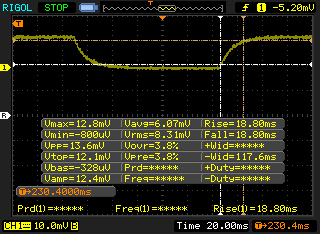 |
| ↘ 18.8 ms chute | ||
| L'écran souffre de latences très élevées, à éviter pour le jeu. En comparaison, tous les appareils testés affichent entre 0.165 (minimum) et 636 (maximum) ms. » 55 % des appareils testés affichent de meilleures performances. Cela signifie que les latences relevées sont moins bonnes que la moyenne (30.9 ms) de tous les appareils testés. | ||
Scintillement / MLI (Modulation de largeur d'impulsion)
| Scintillement / MLI (Modulation de largeur d'impulsion) non décelé | 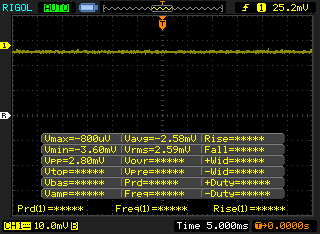 | ||
En comparaison, 52 % des appareils testés n'emploient pas MDI pour assombrir leur écran. Nous avons relevé une moyenne à 7741 (minimum : 5 - maximum : 343500) Hz dans le cas où une MDI était active. | |||
| Cinebench R15 | |
| CPU Single 64Bit | |
| Dell Latitude 7400 2-in-1 | |
| Dell Inspiron 13 7380 | |
| Dell G3 15 3579 | |
| Dell XPS 13 9370 i7 UHD | |
| Dell Latitude 13 5300 2-in-1 | |
| Dell XPS 13 9360 FHD i7 Iris | |
| Dell XPS 13 9380 2019 | |
| Dell Latitude 14 5495 | |
| Dell Latitude 13 3390 | |
| Dell XPS 13 9360-4764 | |
| HP 14-dk0008ng | |
| CPU Multi 64Bit | |
| Dell G3 15 3579 | |
| Dell Latitude 14 5495 | |
| Dell XPS 13 9380 2019 | |
| Dell XPS 13 9370 i7 UHD | |
| Dell Latitude 7400 2-in-1 | |
| Dell Latitude 13 5300 2-in-1 | |
| Dell Inspiron 13 7380 | |
| Dell Latitude 13 3390 | |
| HP 14-dk0008ng | |
| Dell XPS 13 9360-4764 | |
| Dell XPS 13 9360 FHD i7 Iris | |
| PCMark 8 Home Score Accelerated v2 | 3485 points | |
| PCMark 8 Work Score Accelerated v2 | 4911 points | |
| PCMark 10 Score | 3863 points | |
Aide | ||
| Dell Latitude 13 5300 2-in-1 SK hynix PC401 HFS256GD9TNG | Lenovo ThinkPad X390-20Q1S02M00 Intel SSD Pro 7600p SSDPEKKF512G8L | Huawei MateBook 13 i7 Samsung SSD PM981 MZVLB512HAJQ | HP Spectre x360 13t-ae000 Lite-On CA1-8D256-HP | HP EliteBook x360 1030 G3 45X96UT Samsung SSD PM981 MZVLB512HAJQ | |
|---|---|---|---|---|---|
| AS SSD | 93% | 123% | 5% | 89% | |
| Seq Read (MB/s) | 1236 | 2689 118% | 1889 53% | 2133 73% | 1798 45% |
| Seq Write (MB/s) | 500 | 1462 192% | 1812 262% | 945 89% | 1374 175% |
| 4K Read (MB/s) | 40.1 | 63.8 59% | 55.5 38% | 29.84 -26% | 46.05 15% |
| 4K Write (MB/s) | 115.7 | 139.8 21% | 118.4 2% | 91.4 -21% | 104.3 -10% |
| 4K-64 Read (MB/s) | 474.1 | 865 82% | 1257 165% | 725 53% | 1408 197% |
| 4K-64 Write (MB/s) | 350.4 | 1041 197% | 1571 348% | 404.1 15% | 790 125% |
| Access Time Read * (ms) | 0.04 | 0.037 7% | 0.041 -2% | 0.121 -203% | 0.041 -2% |
| Access Time Write * (ms) | 0.051 | 0.024 53% | 0.032 37% | 0.13 -155% | 0.036 29% |
| Score Read (Points) | 638 | 1198 88% | 1502 135% | 968 52% | 1634 156% |
| Score Write (Points) | 516 | 1328 157% | 1871 263% | 590 14% | 1032 100% |
| Score Total (Points) | 1456 | 3095 113% | 4147 185% | 1998 37% | 3484 139% |
| Copy ISO MB/s (MB/s) | 818 | 1290 58% | 1800 120% | 1492 82% | 1947 138% |
| Copy Program MB/s (MB/s) | 395.5 | 436.5 10% | 385.6 -3% | 300.9 -24% | 453.9 15% |
| Copy Game MB/s (MB/s) | 452.5 | 1147 153% | 982 117% | 839 85% | 990 119% |
* ... Moindre est la valeur, meilleures sont les performances

| 3DMark | |
| 1280x720 Cloud Gate Standard Graphics | |
| Dell G3 15 3579 | |
| Huawei MateBook 13 i7 | |
| HP 14-dk0008ng | |
| Dell XPS 13 9360 FHD i7 Iris | |
| Dell Latitude 14 5495 | |
| Dell Inspiron 13 7380 | |
| Dell XPS 13 9380 2019 | |
| Dell XPS 13 9370 i7 UHD | |
| Moyenne Intel UHD Graphics 620 (6205 - 16400, n=225) | |
| Dell Latitude 13 3390 | |
| Dell XPS 13 9360-4764 | |
| Dell Latitude 13 5300 2-in-1 | |
| HP ProBook 430 G6-5TJ89EA | |
| 1280x720 Cloud Gate Standard Score | |
| Dell G3 15 3579 | |
| Huawei MateBook 13 i7 | |
| HP 14-dk0008ng | |
| Dell XPS 13 9380 2019 | |
| Dell Latitude 14 5495 | |
| Dell Inspiron 13 7380 | |
| Dell XPS 13 9370 i7 UHD | |
| Moyenne Intel UHD Graphics 620 (5358 - 10960, n=225) | |
| Dell Latitude 13 5300 2-in-1 | |
| Dell Latitude 13 3390 | |
| Dell XPS 13 9360 FHD i7 Iris | |
| HP ProBook 430 G6-5TJ89EA | |
| Dell XPS 13 9360-4764 | |
| 3DMark 11 | |
| 1280x720 Performance GPU | |
| Dell G3 15 3579 | |
| Huawei MateBook 13 i7 | |
| HP 14-dk0008ng | |
| Dell Latitude 14 5495 | |
| Dell XPS 13 9360 FHD i7 Iris | |
| Dell XPS 13 9370 i7 UHD | |
| Dell Inspiron 13 7380 | |
| Dell XPS 13 9380 2019 | |
| Moyenne Intel UHD Graphics 620 (1144 - 3432, n=244) | |
| Dell Latitude 13 5300 2-in-1 | |
| HP ProBook 430 G6-5TJ89EA | |
| Dell XPS 13 9360-4764 | |
| Dell Latitude 13 3390 | |
| 1280x720 Performance Combined | |
| Dell G3 15 3579 | |
| Huawei MateBook 13 i7 | |
| HP 14-dk0008ng | |
| Dell Latitude 14 5495 | |
| Dell XPS 13 9360 FHD i7 Iris | |
| Dell XPS 13 9380 2019 | |
| Dell XPS 13 9370 i7 UHD | |
| Dell Inspiron 13 7380 | |
| Moyenne Intel UHD Graphics 620 (927 - 2505, n=244) | |
| Dell XPS 13 9360-4764 | |
| Dell Latitude 13 3390 | |
| Dell Latitude 13 5300 2-in-1 | |
| HP ProBook 430 G6-5TJ89EA | |
| 3DMark 06 Standard Score | 10108 points | |
| 3DMark 11 Performance | 1896 points | |
| 3DMark Ice Storm Standard Score | 51629 points | |
| 3DMark Cloud Gate Standard Score | 8000 points | |
Aide | ||
| Dell Latitude 13 5300 2-in-1 UHD Graphics 620, i5-8365U, SK hynix PC401 HFS256GD9TNG | Lenovo ThinkPad X390-20Q1S02M00 UHD Graphics 620, i5-8265U, Intel SSD Pro 7600p SSDPEKKF512G8L | Huawei MateBook 13 i7 GeForce MX150, i7-8565U, Samsung SSD PM981 MZVLB512HAJQ | Samsung Notebook 9 NP930QAA UHD Graphics 620, i5-8550U, Samsung PM961 MZVLW256HEHP | HP Spectre x360 13t-ae000 UHD Graphics 620, i5-8550U, Lite-On CA1-8D256-HP | HP EliteBook x360 1030 G3 45X96UT UHD Graphics 620, i7-8650U, Samsung SSD PM981 MZVLB512HAJQ | |
|---|---|---|---|---|---|---|
| Noise | 2% | -1% | 2% | 7% | 6% | |
| arrêt / environnement * (dB) | 28.5 | 29.2 -2% | 28.6 -0% | 29 -2% | 28.2 1% | 28.5 -0% |
| Idle Minimum * (dB) | 28.5 | 29.2 -2% | 28.6 -0% | 29 -2% | 28.2 1% | 28.5 -0% |
| Idle Average * (dB) | 28.5 | 29.2 -2% | 28.6 -0% | 29 -2% | 28.2 1% | 28.5 -0% |
| Idle Maximum * (dB) | 28.5 | 29.2 -2% | 28.6 -0% | 29 -2% | 28.2 1% | 28.5 -0% |
| Load Average * (dB) | 35.5 | 34.8 2% | 34.2 4% | 32.6 8% | 30.7 14% | 30.8 13% |
| Load Maximum * (dB) | 42.1 | 34.8 17% | 47 -12% | 36.7 13% | 32.9 22% | 32.8 22% |
| Witcher 3 ultra * (dB) | 43 |
* ... Moindre est la valeur, meilleures sont les performances
Degré de la nuisance sonore
| Au repos |
| 28.5 / 28.5 / 28.5 dB(A) |
| Fortement sollicité |
| 35.5 / 42.1 dB(A) |
 | ||
30 dB silencieux 40 dB(A) audible 50 dB(A) bruyant |
||
min: | ||
(-) La température maximale du côté supérieur est de 47.2 °C / 117 F, par rapport à la moyenne de 34.3 °C / 94 F, allant de 21.2 à 62.5 °C pour la classe Office.
(-) Le fond chauffe jusqu'à un maximum de 60 °C / 140 F, contre une moyenne de 36.8 °C / 98 F
(+) En utilisation inactive, la température moyenne du côté supérieur est de 28.7 °C / 84 F, par rapport à la moyenne du dispositif de 29.5 °C / 85 F.
(+) Les repose-poignets et le pavé tactile sont plus froids que la température de la peau avec un maximum de 31.2 °C / 88.2 F et sont donc froids au toucher.
(-) La température moyenne de la zone de l'appui-paume de dispositifs similaires était de 27.6 °C / 81.7 F (-3.6 °C / #-6.5 F).
Dell Latitude 13 5300 2-in-1 analyse audio
(+) | les haut-parleurs peuvent jouer relativement fort (83.7# dB)
Basses 100 - 315 Hz
(±) | basse réduite - en moyenne 12.5% inférieure à la médiane
(±) | la linéarité des basses est moyenne (10.6% delta à la fréquence précédente)
Médiums 400 - 2000 Hz
(+) | médiane équilibrée - seulement 3.9% de la médiane
(+) | les médiums sont linéaires (6.8% delta à la fréquence précédente)
Aiguës 2 - 16 kHz
(+) | des sommets équilibrés - à seulement 1.6% de la médiane
(+) | les aigus sont linéaires (4.9% delta à la fréquence précédente)
Globalement 100 - 16 000 Hz
(+) | le son global est linéaire (14.5% différence à la médiane)
Par rapport à la même classe
» 12% de tous les appareils testés de cette catégorie étaient meilleurs, 4% similaires, 84% pires
» Le meilleur avait un delta de 7%, la moyenne était de 21%, le pire était de 53%.
Par rapport à tous les appareils testés
» 19% de tous les appareils testés étaient meilleurs, 4% similaires, 77% pires
» Le meilleur avait un delta de 4%, la moyenne était de 23%, le pire était de 134%.
Apple MacBook 12 (Early 2016) 1.1 GHz analyse audio
(+) | les haut-parleurs peuvent jouer relativement fort (83.6# dB)
Basses 100 - 315 Hz
(±) | basse réduite - en moyenne 11.3% inférieure à la médiane
(±) | la linéarité des basses est moyenne (14.2% delta à la fréquence précédente)
Médiums 400 - 2000 Hz
(+) | médiane équilibrée - seulement 2.4% de la médiane
(+) | les médiums sont linéaires (5.5% delta à la fréquence précédente)
Aiguës 2 - 16 kHz
(+) | des sommets équilibrés - à seulement 2% de la médiane
(+) | les aigus sont linéaires (4.5% delta à la fréquence précédente)
Globalement 100 - 16 000 Hz
(+) | le son global est linéaire (10.2% différence à la médiane)
Par rapport à la même classe
» 7% de tous les appareils testés de cette catégorie étaient meilleurs, 2% similaires, 90% pires
» Le meilleur avait un delta de 5%, la moyenne était de 18%, le pire était de 53%.
Par rapport à tous les appareils testés
» 5% de tous les appareils testés étaient meilleurs, 1% similaires, 94% pires
» Le meilleur avait un delta de 4%, la moyenne était de 23%, le pire était de 134%.
| Éteint/en veille | |
| Au repos | |
| Fortement sollicité |
|
Légende:
min: | |
| Dell Latitude 13 5300 2-in-1 i5-8365U, UHD Graphics 620, SK hynix PC401 HFS256GD9TNG, IPS, 1920x1080, 13.3" | Lenovo ThinkPad X390-20Q1S02M00 i5-8265U, UHD Graphics 620, Intel SSD Pro 7600p SSDPEKKF512G8L, IPS LED, 1920x1080, 13.3" | Huawei MateBook 13 i7 i7-8565U, GeForce MX150, Samsung SSD PM981 MZVLB512HAJQ, IPS, 2160x1440, 13" | Samsung Notebook 9 NP930QAA i5-8550U, UHD Graphics 620, Samsung PM961 MZVLW256HEHP, IPS, 1920x1080, 13.3" | HP Spectre x360 13t-ae000 i5-8550U, UHD Graphics 620, Lite-On CA1-8D256-HP, IPS, 3840x2160, 13.3" | HP EliteBook 735 G5 3UN62EA R7 2700U, Vega 10, Toshiba KBG30ZMV256G, IPS, 1920x1080, 13.3" | HP EliteBook x360 1030 G3 45X96UT i7-8650U, UHD Graphics 620, Samsung SSD PM981 MZVLB512HAJQ, IPS, 1920x1080, 13.3" | |
|---|---|---|---|---|---|---|---|
| Power Consumption | -14% | -43% | -53% | -40% | -43% | -21% | |
| Idle Minimum * (Watt) | 2.8 | 3.4 -21% | 3.5 -25% | 4.4 -57% | 5.9 -111% | 5.5 -96% | 3.4 -21% |
| Idle Average * (Watt) | 5.1 | 5.6 -10% | 7.5 -47% | 11.8 -131% | 9.8 -92% | 9.4 -84% | 7.6 -49% |
| Idle Maximum * (Watt) | 7.1 | 8.7 -23% | 12.4 -75% | 15.5 -118% | 10.6 -49% | 11.6 -63% | 11.5 -62% |
| Load Average * (Watt) | 39.9 | 43.6 -9% | 64.2 -61% | 38 5% | 36.6 8% | 39 2% | 35.4 11% |
| Load Maximum * (Watt) | 60.3 | 65 -8% | 65.7 -9% | 39.8 34% | 34.3 43% | 45.6 24% | 51.9 14% |
| Witcher 3 ultra * (Watt) | 52.5 |
* ... Moindre est la valeur, meilleures sont les performances
| Dell Latitude 13 5300 2-in-1 i5-8365U, UHD Graphics 620, 60 Wh | Lenovo ThinkPad X390-20Q1S02M00 i5-8265U, UHD Graphics 620, 48 Wh | Huawei MateBook 13 i7 i7-8565U, GeForce MX150, 41.7 Wh | Samsung Notebook 9 NP930QAA i5-8550U, UHD Graphics 620, 39 Wh | HP Spectre x360 13t-ae000 i5-8550U, UHD Graphics 620, 60 Wh | HP EliteBook x360 1030 G3 45X96UT i7-8650U, UHD Graphics 620, 56.2 Wh | |
|---|---|---|---|---|---|---|
| Autonomie de la batterie | -22% | -43% | -43% | -19% | -6% | |
| Reader / Idle (h) | 28.3 | 15.4 -46% | 14.6 -48% | |||
| WiFi v1.3 (h) | 10.4 | 8.3 -20% | 7.6 -27% | 6.6 -37% | 7.1 -32% | 9.8 -6% |
| Load (h) | 2.1 | 1.6 -24% | 0.9 -57% | 1.2 -43% | 2 -5% |
Points positifs
Points négatifs
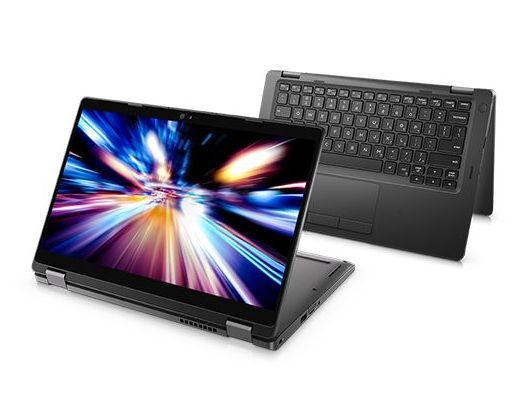
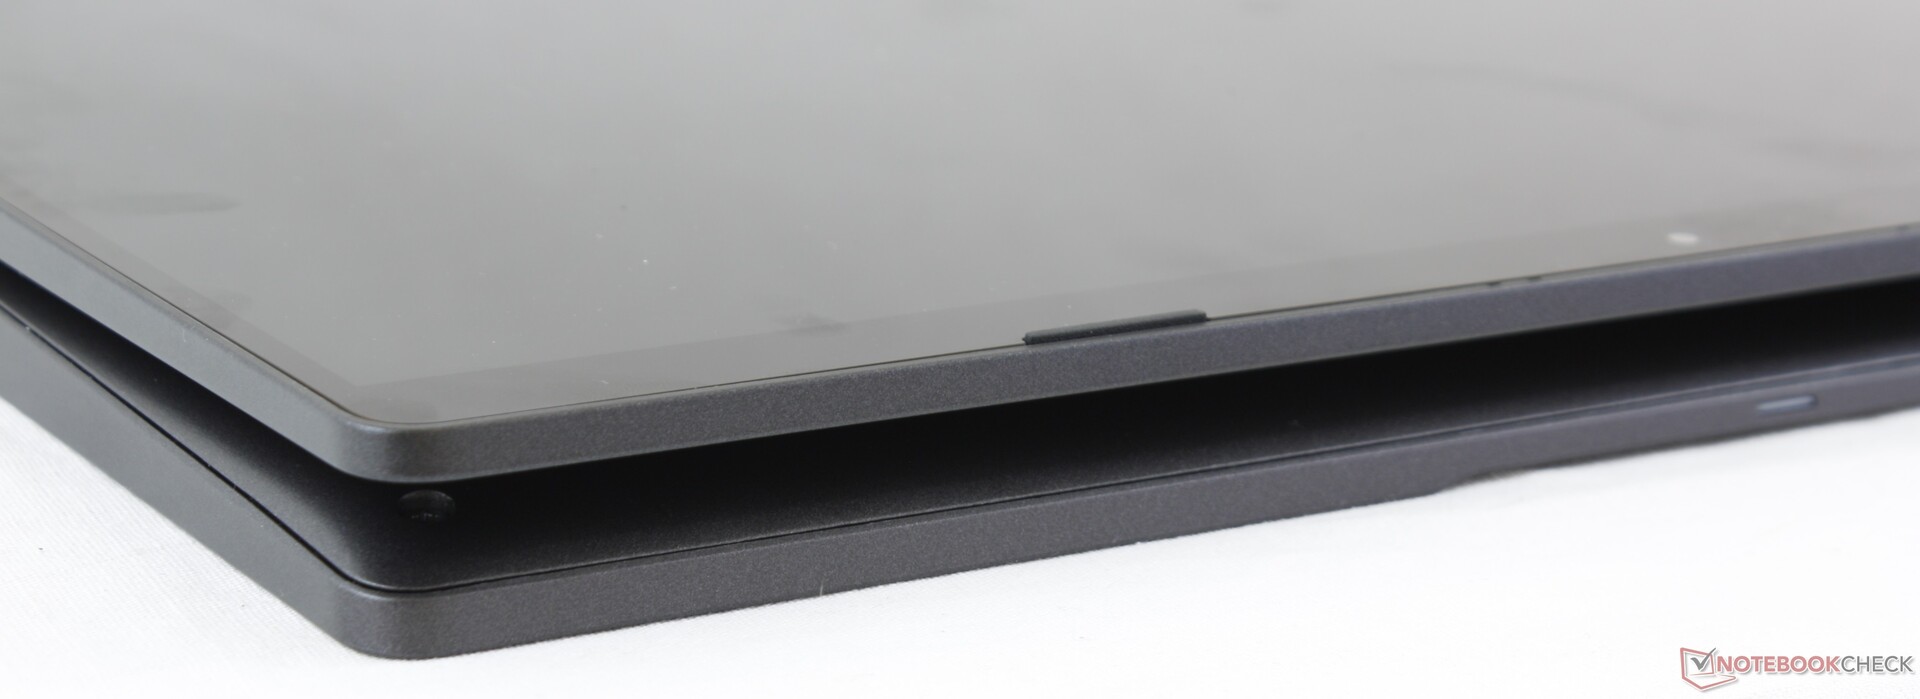
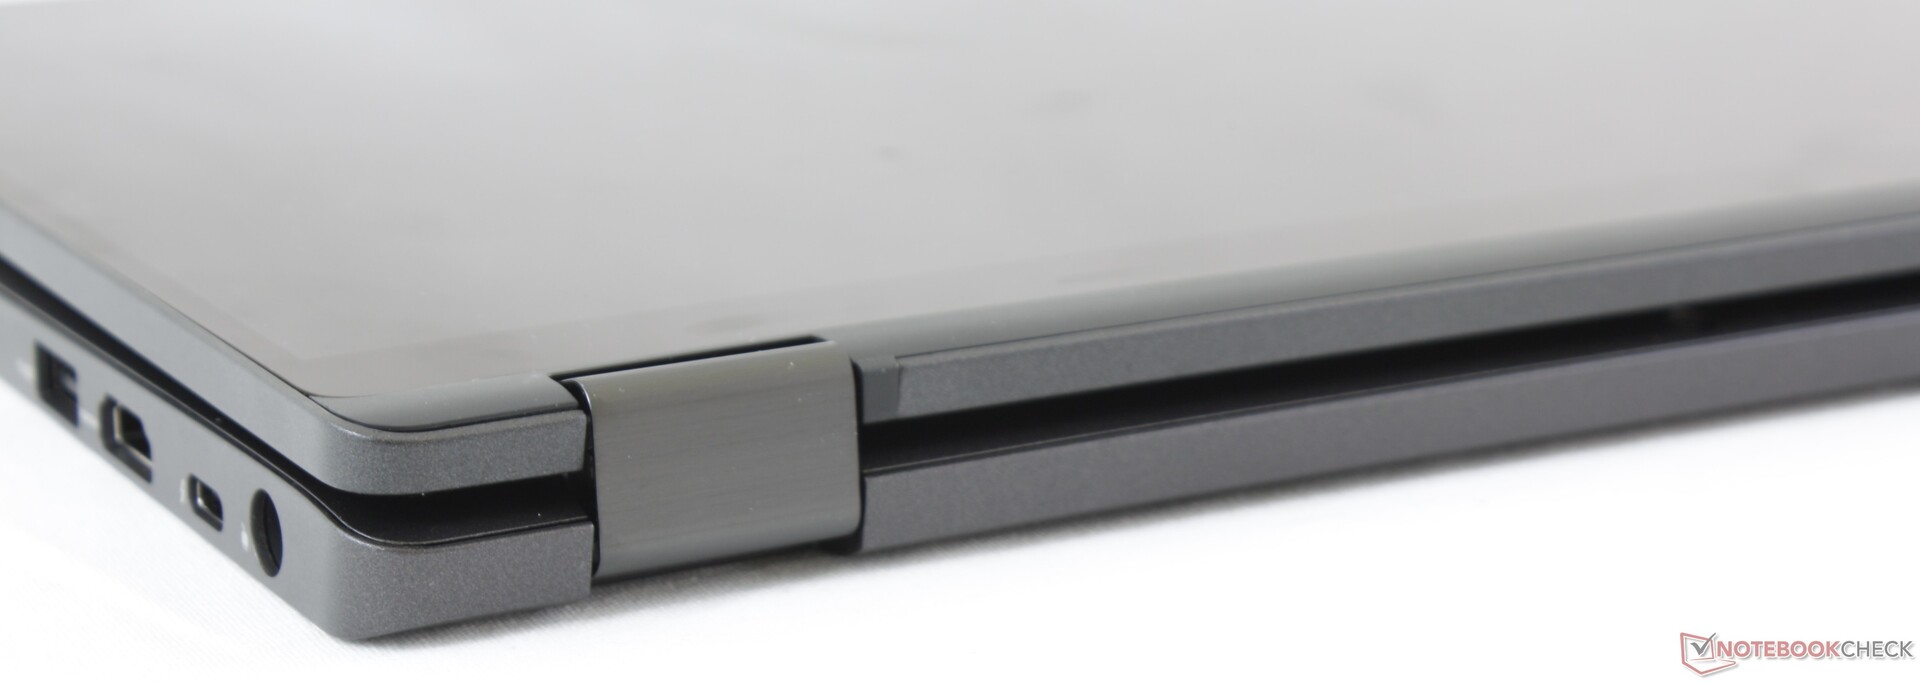
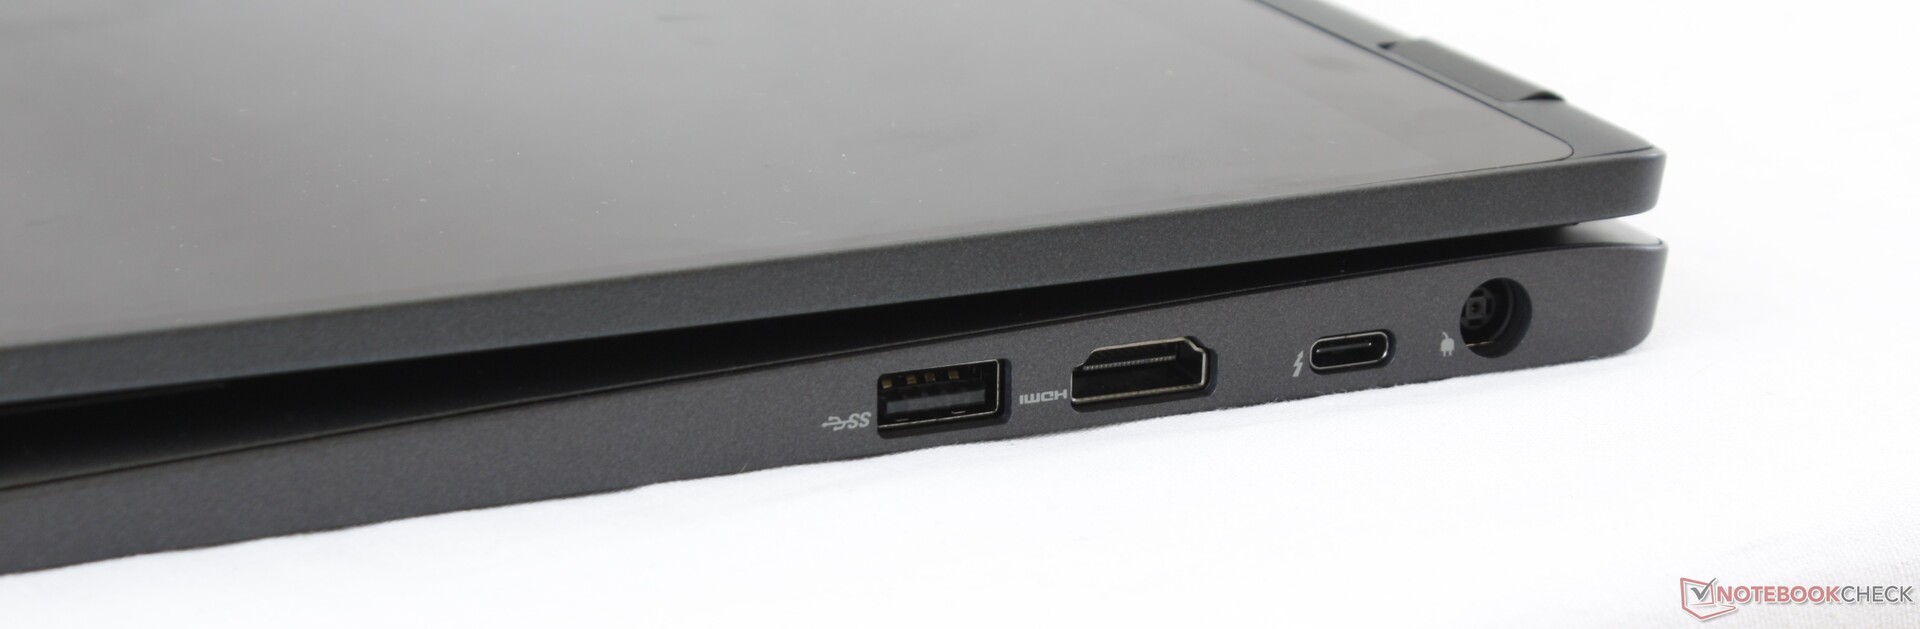
Le Dell Latitude 13 5300 2-en-1 fait le boulot, sans le faire ni mieux ni moins bien que les autres ultraportables pros, sans se démarquer. Ses charnières à 360 degrés sont pratiques, mais il est un peu plus lourd que les machines Lenovo ou HP. Il prend en charge un stylet actif, mais sa fixation magnétique est moins sécurisée qu’un logement intégré ou qu’une sangle physique. L’autonomie est bonne, mais l’entrée secteur est propriétaire au lieu d’être en USB C, plus universel.
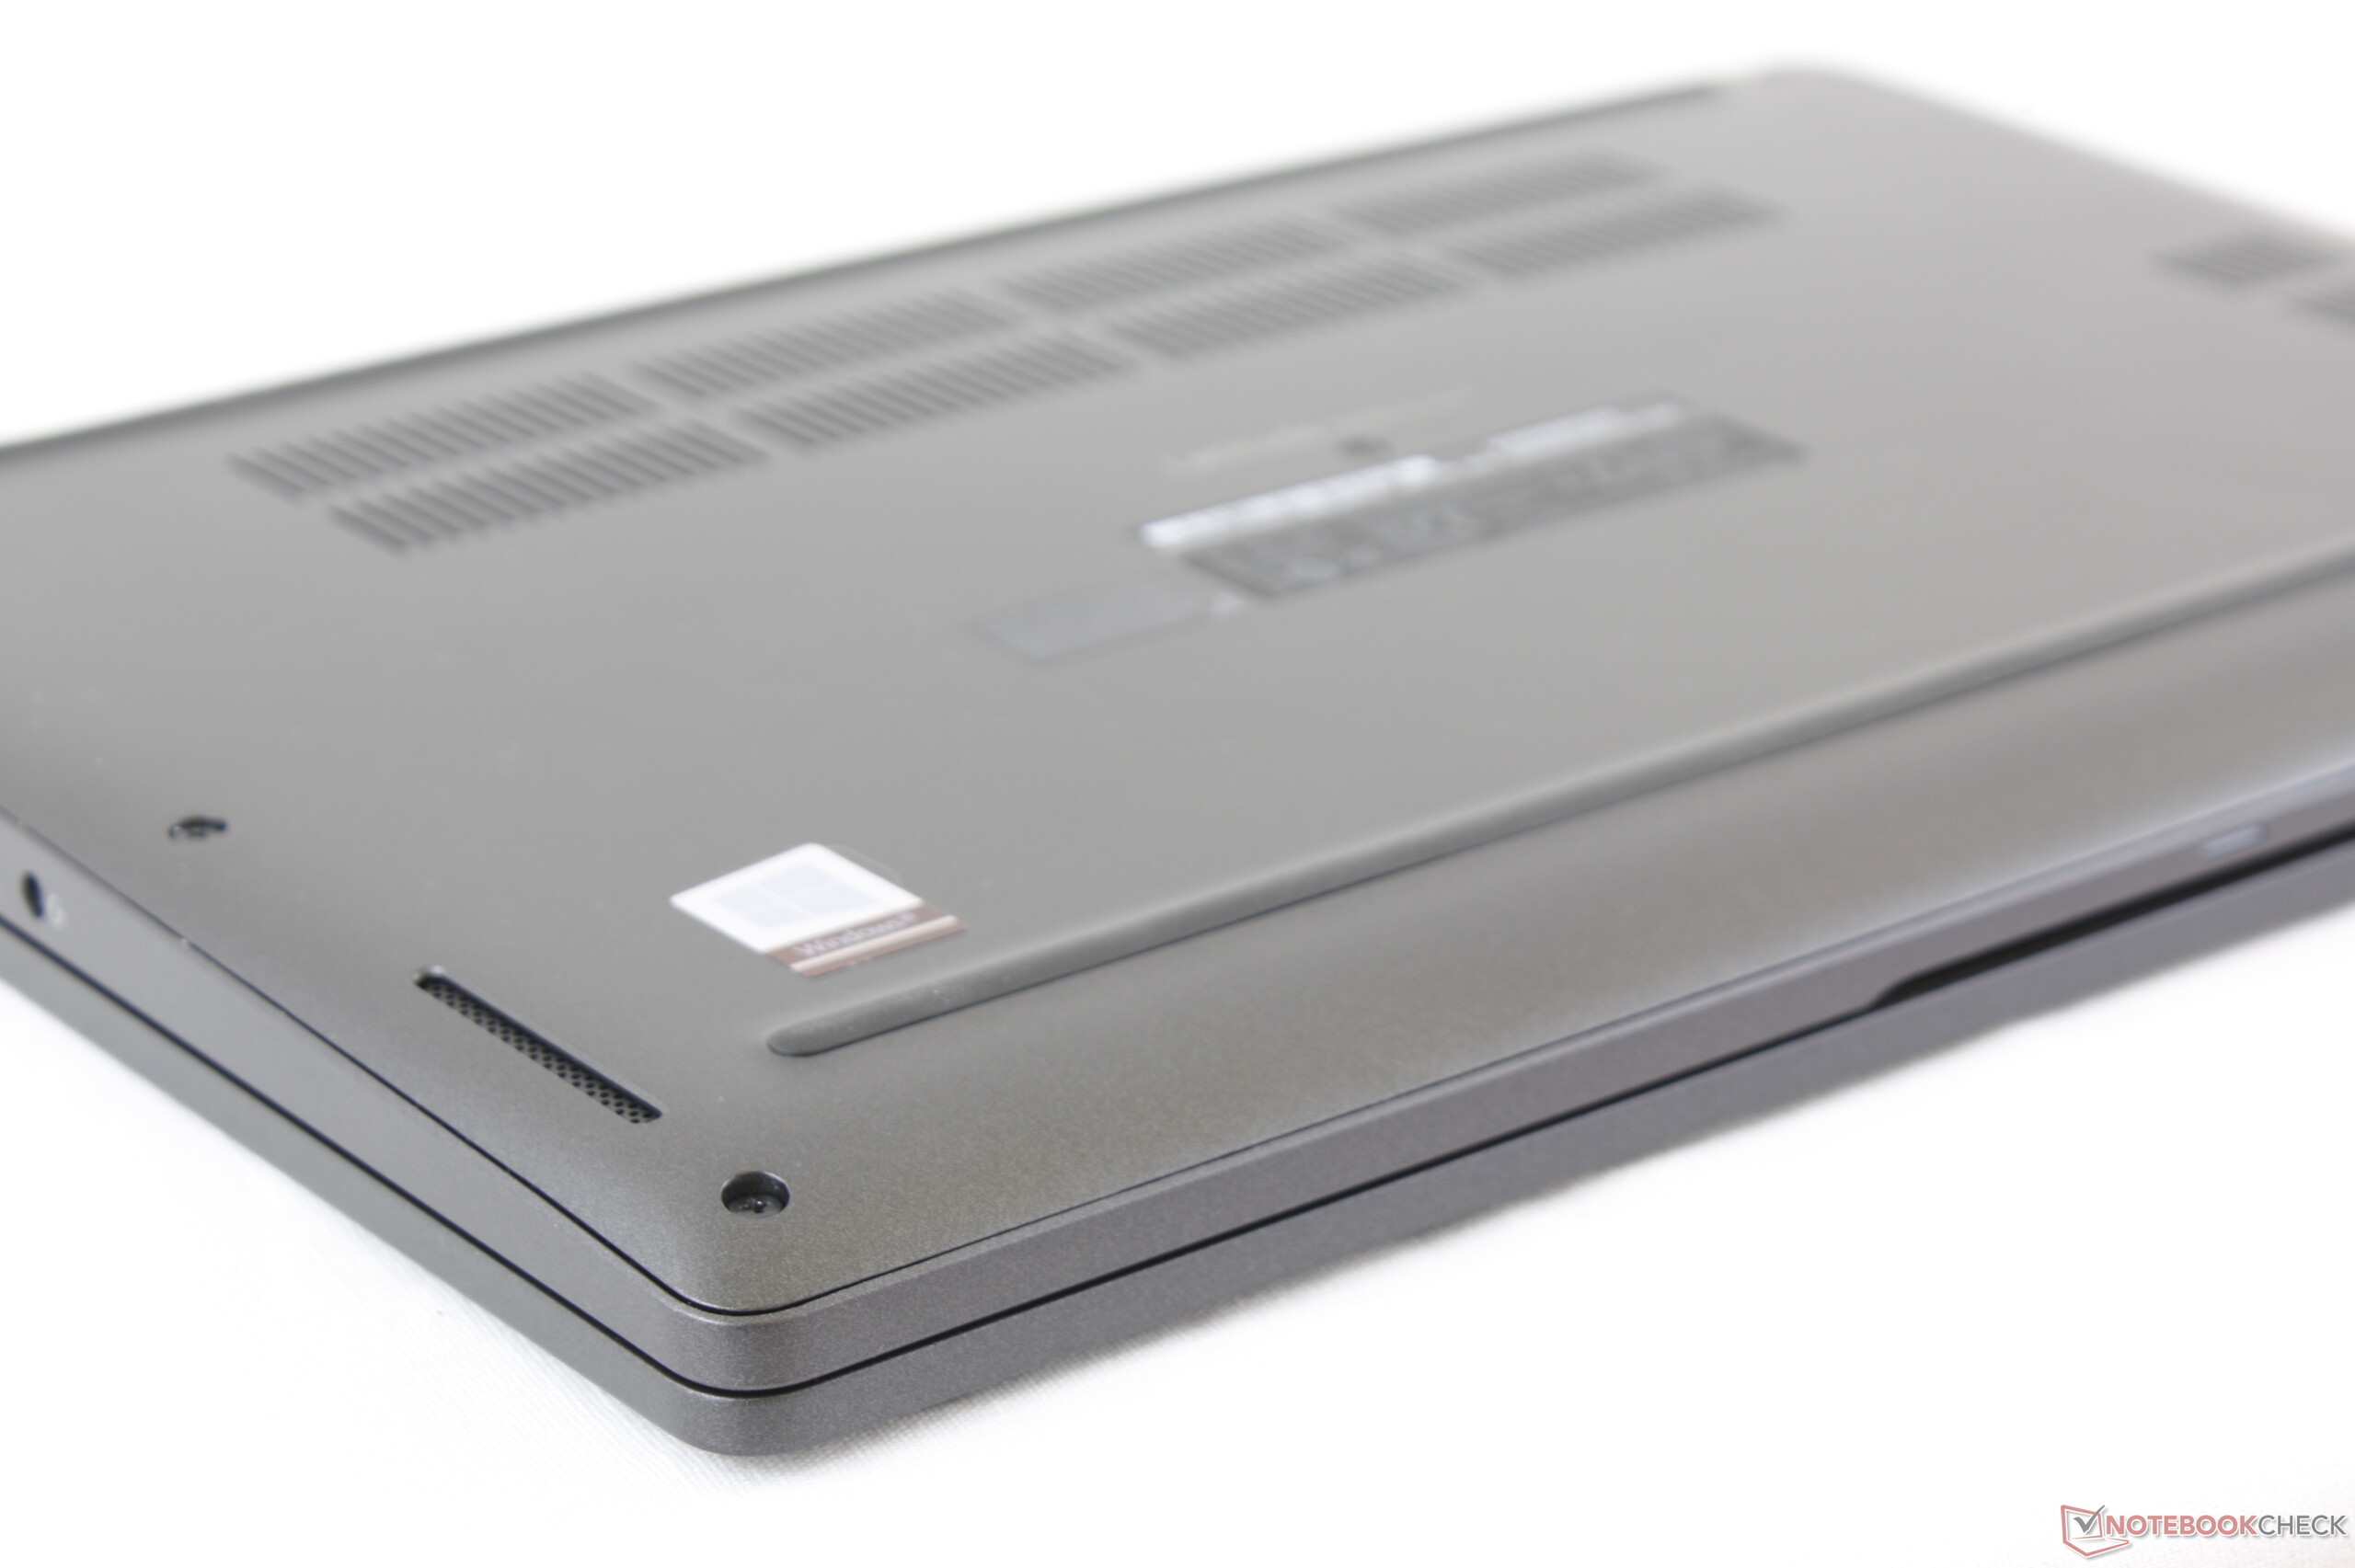
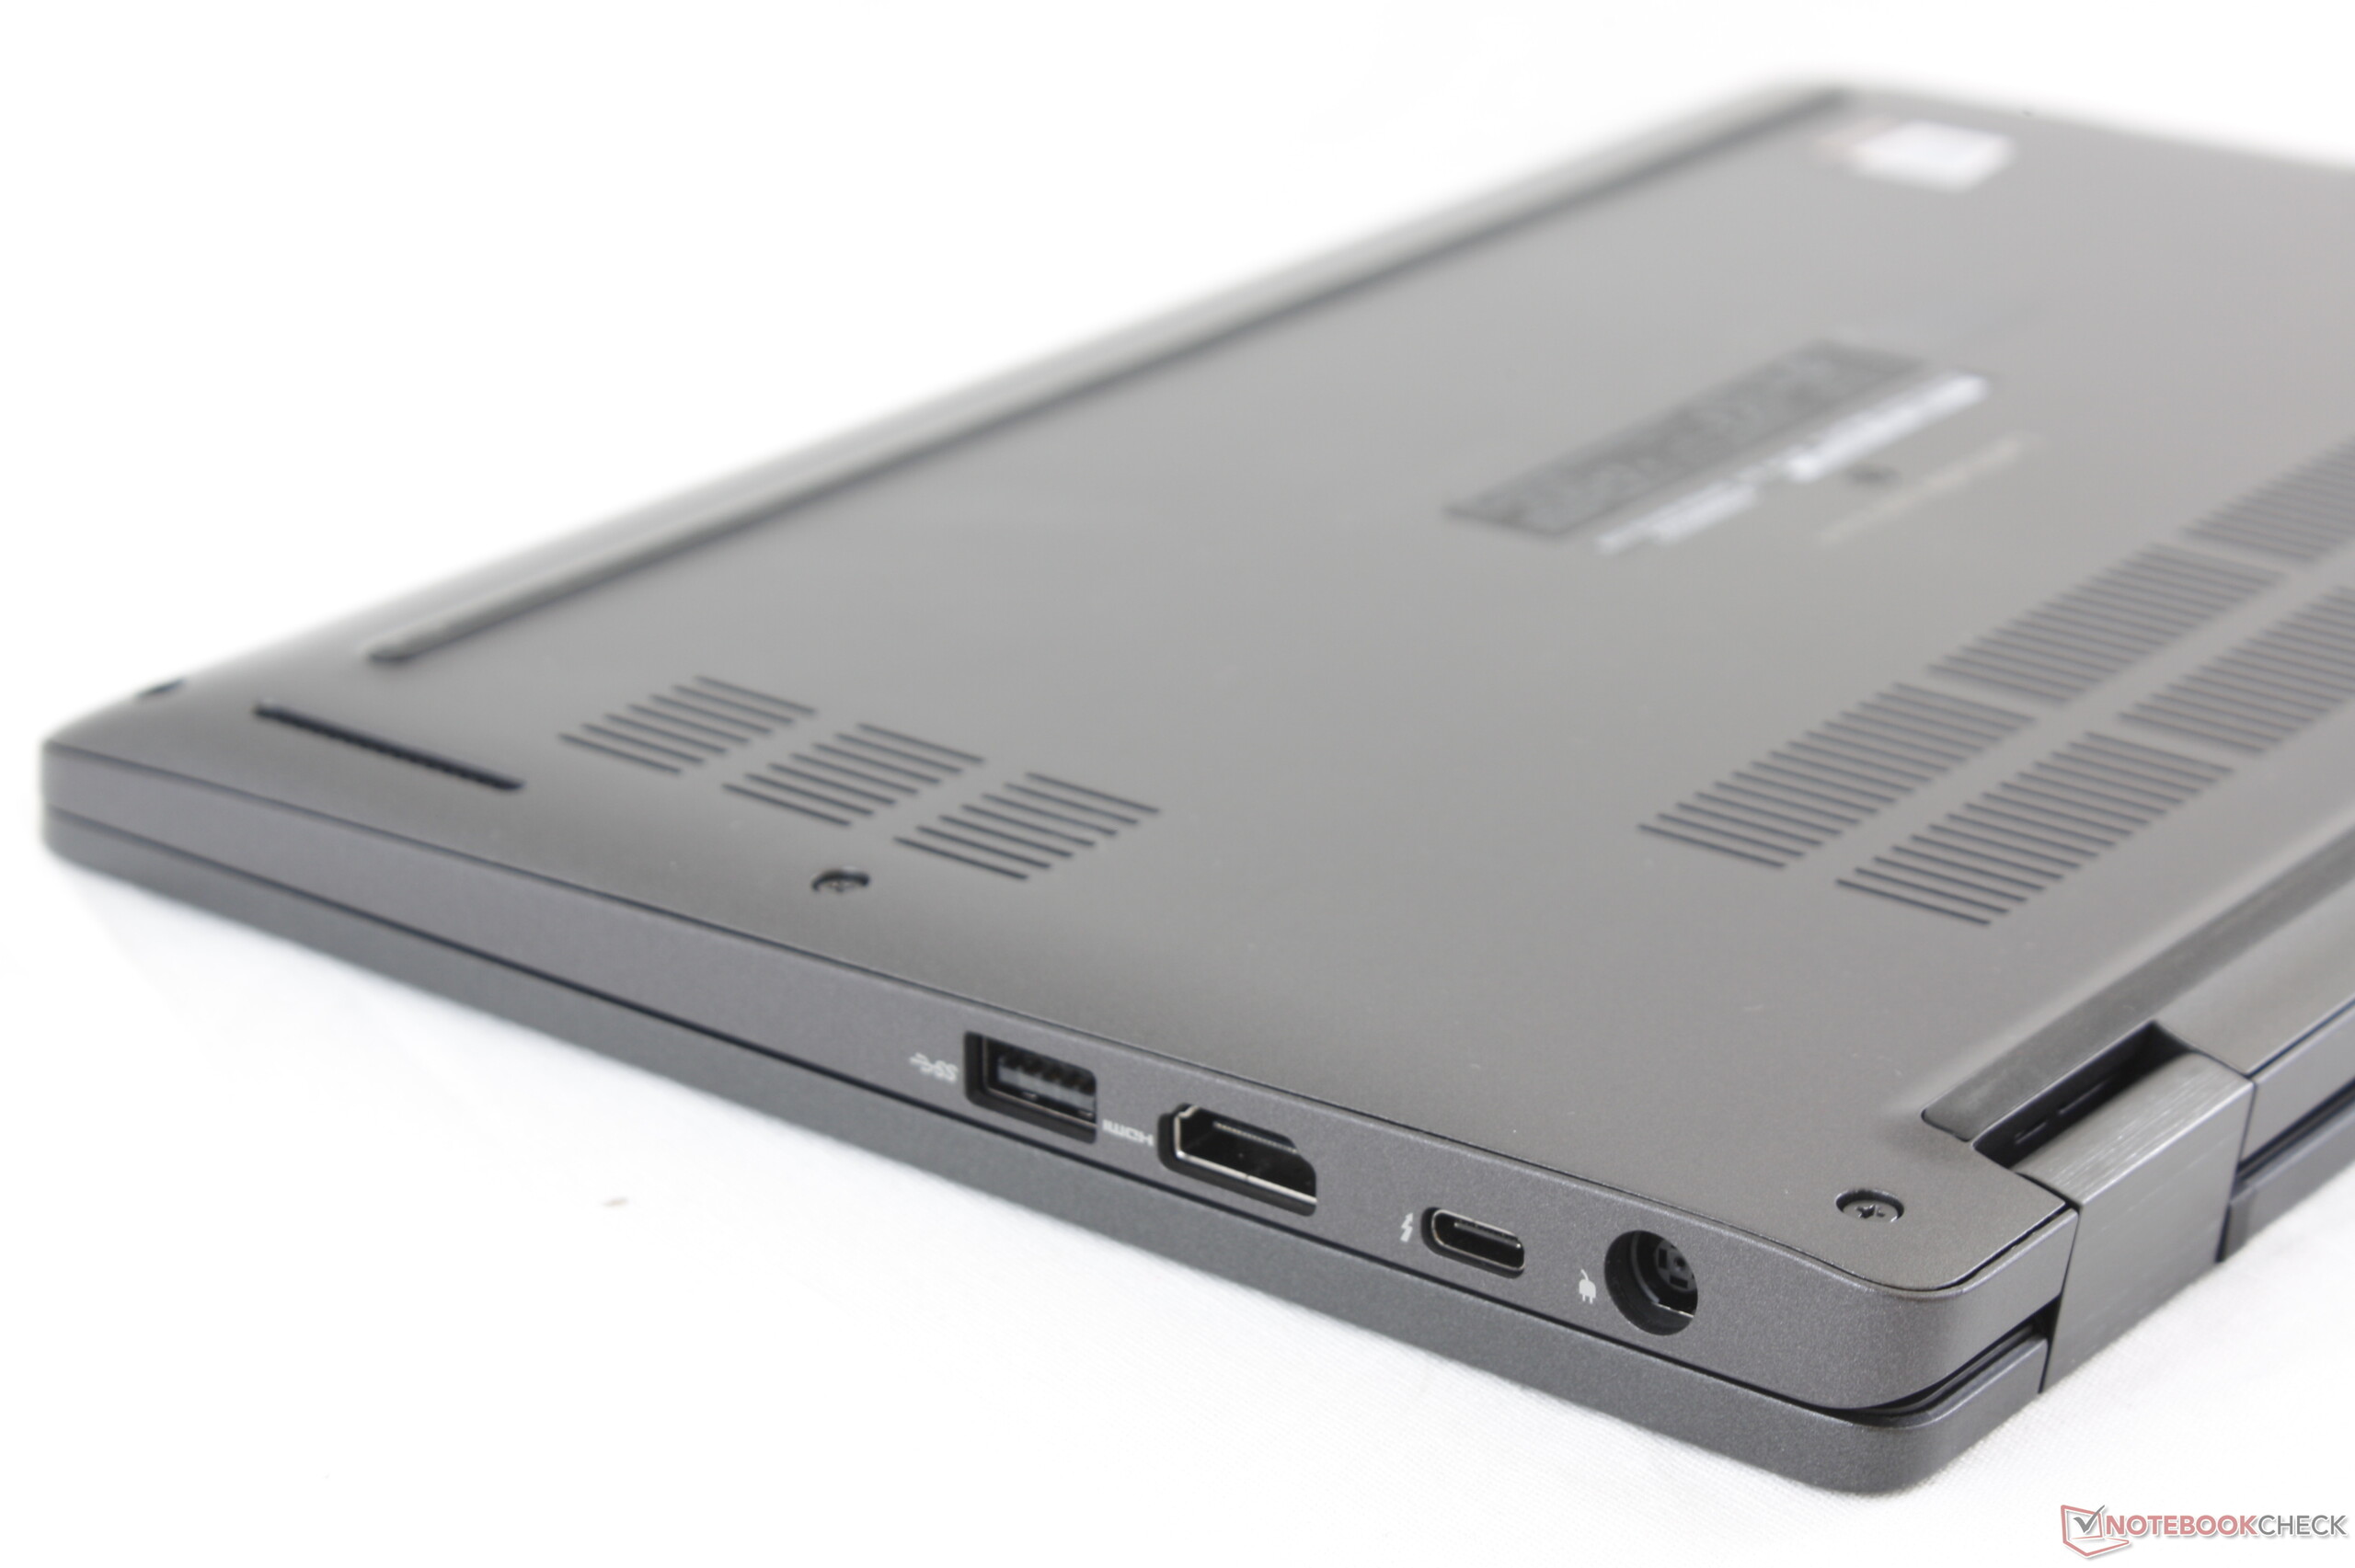
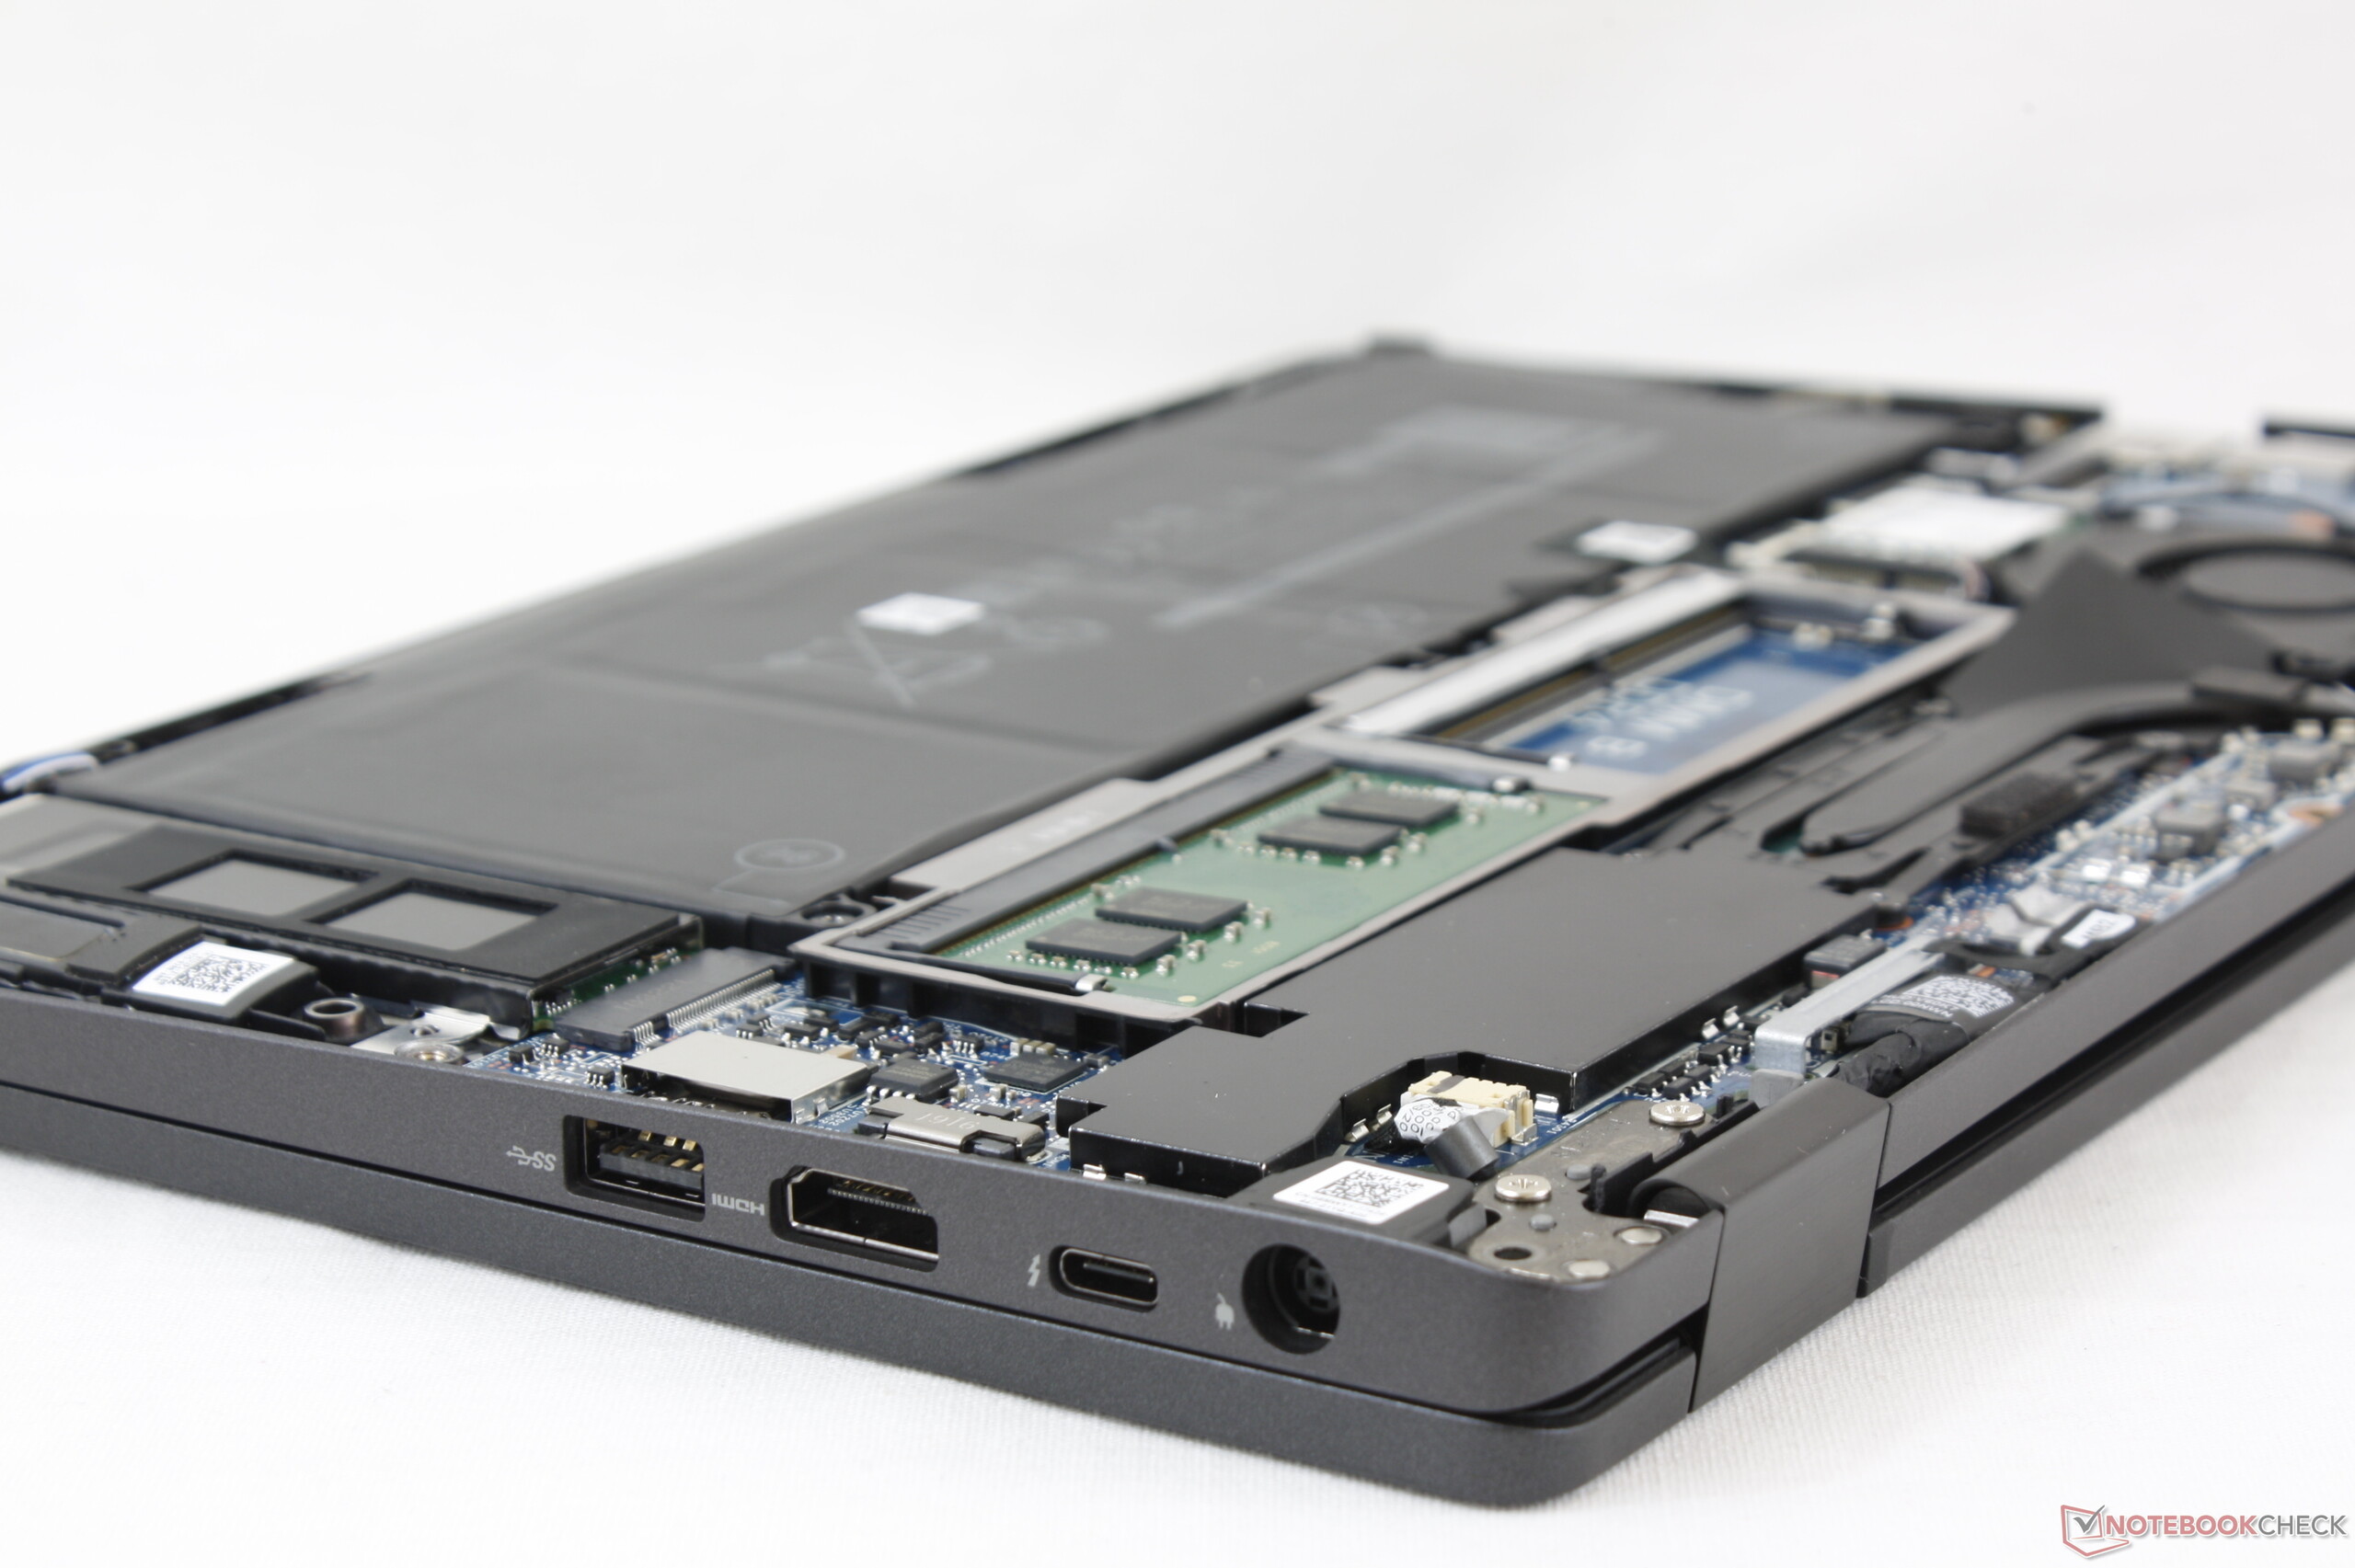
Le meilleur aspect du convertible Latitude est son évolutivité. Dell facilite le changement des composants internes, avec pour seul besoin un tournevis Philips. Les fonctionnalités plus haut de gammes, comme le Thunderbolt 3, le lecteur de carte à puce et le WWAN sont tous optionnels et non de série, pour garder un prix contenu pour ceux qui n’ont pas besoin de ces extras. Les modèles du milieu de gamme devraient toujours ainsi proposer des options, et il y en a beaucoup dans la série Latitude 5000, permettant au client de trouver exactement ce qu’il veut.
Si vous pouvez mettre un peu plus d’argent, le HP EliteBook x360 1030 G3 est plus léger et plus lumineux, avec des touches plus fermes. Sinon le Latitude 13 5300 2-en-1 est une alternative efficace au ThinkPad X390 Yoga au même niveau tarifaire, étant un peu plus solide et autonome. Nous recommandons de laisser de côté la version Core i7 et de choisir la version Core i5, et d’ajouter des extras plus concrets comme le WWAN, le Thunderbolt 3, un stockage plus grand, ou une meilleure garantie.
Tout de services, d’options et de connectivité. Le Latitude 13 5300 2-en-1 fait bien cela, couvrant les usages typiques de bureau et hors bureau. Il pourrait être un peu plus léger et son écran un peu plus lumineux pour une meilleure utilisation à l’extérieur, et pour mieux exploiter son format convertible.
L’intégralité de cette critique est disponible en anglais en suivant ce lien.
Dell Latitude 13 5300 2-in-1
- 10/17/2019 v7 (old)
Allen Ngo
Price comparison
