Test du Dynabook Portégé X30-F (i5-8265U, UHD 620, FHD) : léger, fin et endurant
Note | Date | Modèle | Poids | Épaisseur | Taille | Résolution | Prix |
|---|---|---|---|---|---|---|---|
| 87 % v7 (old) | 11/19 | Dynabook Portégé X30-F-10N i5-8265U, UHD Graphics 620 | 1.1 kg | 16.4 mm | 13.30" | 1920x1080 | |
| 88.2 % v6 (old) | 08/17 | Toshiba Portege X30-D (PT274U-01N001) i7-7600U, HD Graphics 620 | 1 kg | 15.9 mm | 13.30" | 1920x1080 | |
| 90.3 % v6 (old) | 05/19 | Lenovo ThinkPad X390-20Q1S02M00 i5-8265U, UHD Graphics 620 | 1.3 kg | 16.9 mm | 13.30" | 1920x1080 | |
| 88.8 % v7 (old) | 10/19 | Lenovo ThinkPad X395 R3 PRO 3300U, Vega 6 | 1.3 kg | 16.9 mm | 13.30" | 1920x1080 | |
| 86.8 % v7 (old) | 09/19 | Dell Latitude 7300-P99G i7-8665U, UHD Graphics 620 | 1.4 kg | 18.45 mm | 13.30" | 1920x1080 | |
| 86.4 % v6 (old) | 09/18 | HP EliteBook 735 G5 3UN62EA R7 2700U, Vega 10 | 1.3 kg | 17 mm | 13.30" | 1920x1080 | |
| 88.2 % v6 (old) | 05/18 | HP EliteBook 830 G5-3JX74EA i5-8550U, UHD Graphics 620 | 1.3 kg | 17.7 mm | 13.30" | 1920x1080 |
| SD Card Reader | |
| average JPG Copy Test (av. of 3 runs) | |
| Dell Latitude 7300-P99G (Toshiba Exceria Pro M501 microSDXC 64GB) | |
| Lenovo ThinkPad X390-20Q1S02M00 (Toshiba Exceria Pro M501) | |
| Moyenne de la classe Subnotebook (23.7 - 188, n=9, 2 dernières années) | |
| Lenovo ThinkPad X395 | |
| Dynabook Portégé X30-F-10N (Toshiba Exceria Pro M501 microSDXC 64GB) | |
| Toshiba Portege X30-D (PT274U-01N001) (Toshiba Exceria Pro M401) | |
| maximum AS SSD Seq Read Test (1GB) | |
| Dell Latitude 7300-P99G (Toshiba Exceria Pro M501 microSDXC 64GB) | |
| Moyenne de la classe Subnotebook (24.9 - 195, n=8, 2 dernières années) | |
| Toshiba Portege X30-D (PT274U-01N001) (Toshiba Exceria Pro M401) | |
| Lenovo ThinkPad X390-20Q1S02M00 (Toshiba Exceria Pro M501) | |
| Lenovo ThinkPad X395 | |
| Dynabook Portégé X30-F-10N (Toshiba Exceria Pro M501 microSDXC 64GB) | |
| |||||||||||||||||||||||||
Homogénéité de la luminosité: 86 %
Valeur mesurée au centre, sur batterie: 428 cd/m²
Contraste: 1319:1 (Valeurs des noirs: 0.31 cd/m²)
ΔE ColorChecker Calman: 3.2 | ∀{0.5-29.43 Ø4.72}
ΔE Greyscale Calman: 4.6 | ∀{0.09-98 Ø4.97}
95% sRGB (Argyll 1.6.3 3D)
60% AdobeRGB 1998 (Argyll 1.6.3 3D)
65.2% AdobeRGB 1998 (Argyll 3D)
95% sRGB (Argyll 3D)
64.3% Display P3 (Argyll 3D)
Gamma: 2.14
CCT: 7321 K
| Dynabook Portégé X30-F-10N IPS, 1920x1080, 13.3" | Toshiba Portege X30-D (PT274U-01N001) IPS, 1920x1080, 13.3" | Lenovo ThinkPad X390-20Q1S02M00 IPS LED, 1920x1080, 13.3" | Lenovo ThinkPad X395 IPS, 1920x1080, 13.3" | Dell Latitude 7300-P99G IPS LED, 1920x1080, 13.3" | HP EliteBook 735 G5 3UN62EA IPS, 1920x1080, 13.3" | HP EliteBook 830 G5-3JX74EA IPS LED, 1920x1080, 13.3" | |
|---|---|---|---|---|---|---|---|
| Display | 1% | 2% | 0% | -1% | 7% | -2% | |
| Display P3 Coverage (%) | 64.3 | 66.4 3% | 65.3 2% | 64.1 0% | 64.6 0% | 71.1 11% | 64.2 0% |
| sRGB Coverage (%) | 95 | 93.5 -2% | 95.9 1% | 95.2 0% | 91.5 -4% | 96.3 1% | 89.2 -6% |
| AdobeRGB 1998 Coverage (%) | 65.2 | 66.6 2% | 66.6 2% | 65.8 1% | 65.5 0% | 71.4 10% | 65.2 0% |
| Response Times | 24% | -2% | 4% | 26% | 22% | 32% | |
| Response Time Grey 50% / Grey 80% * (ms) | 56 ? | 36.8 ? 34% | 57.6 ? -3% | 55 ? 2% | 39 ? 30% | 42 ? 25% | 36 ? 36% |
| Response Time Black / White * (ms) | 34 ? | 29.6 ? 13% | 34 ? -0% | 32 ? 6% | 27 ? 21% | 28 ? 18% | 24.8 ? 27% |
| PWM Frequency (Hz) | 250 ? | 20500 ? | 1020 ? | ||||
| Screen | 3% | 9% | 9% | -28% | -14% | -13% | |
| Brightness middle (cd/m²) | 409 | 332.6 -19% | 356 -13% | 356 -13% | 341 -17% | 464 13% | 316 -23% |
| Brightness (cd/m²) | 390 | 323 -17% | 336 -14% | 336 -14% | 306 -22% | 426 9% | 326 -16% |
| Brightness Distribution (%) | 86 | 86 0% | 88 2% | 88 2% | 79 -8% | 85 -1% | 85 -1% |
| Black Level * (cd/m²) | 0.31 | 0.28 10% | 0.16 48% | 0.16 48% | 0.31 -0% | 0.42 -35% | 0.19 39% |
| Contrast (:1) | 1319 | 1188 -10% | 2225 69% | 2225 69% | 1100 -17% | 1105 -16% | 1663 26% |
| Colorchecker dE 2000 * | 3.2 | 2.6 19% | 3.6 -13% | 3.6 -13% | 6.43 -101% | 4.49 -40% | 4.5 -41% |
| Colorchecker dE 2000 max. * | 6.4 | 6.7 -5% | 5.5 14% | 5.5 14% | 10.33 -61% | 8.77 -37% | 12.1 -89% |
| Greyscale dE 2000 * | 4.6 | 2.5 46% | 4.7 -2% | 4.7 -2% | 6.9 -50% | 6.44 -40% | 5 -9% |
| Gamma | 2.14 103% | 2.12 104% | 2.48 89% | 2.92 75% | 2.23 99% | 2.41 91% | 2.22 99% |
| CCT | 7321 89% | 6720 97% | 6374 102% | 6222 104% | 8338 78% | 6922 94% | 6018 108% |
| Color Space (Percent of AdobeRGB 1998) (%) | 60 | 62 3% | 61.3 2% | 61 2% | 59 -2% | 63 5% | 57.9 -3% |
| Color Space (Percent of sRGB) (%) | 95 | 94 -1% | 95.7 1% | 96 1% | 91 -4% | 96 1% | 87.3 -8% |
| Colorchecker dE 2000 calibrated * | 1.1 | 1.11 | 2.36 | 1.27 | 2.9 | ||
| Moyenne finale (programmes/paramètres) | 9% /
5% | 3% /
6% | 4% /
7% | -1% /
-16% | 5% /
-5% | 6% /
-5% |
* ... Moindre est la valeur, meilleures sont les performances
Temps de réponse de l'écran
| ↔ Temps de réponse noir à blanc | ||
|---|---|---|
| 34 ms ... hausse ↗ et chute ↘ combinées | ↗ 18 ms hausse | 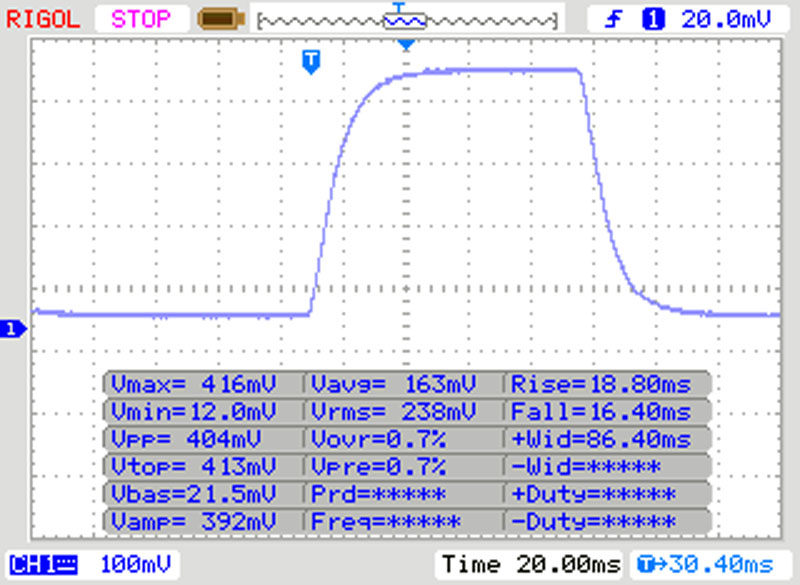 |
| ↘ 16 ms chute | ||
| L'écran souffre de latences très élevées, à éviter pour le jeu. En comparaison, tous les appareils testés affichent entre 0.1 (minimum) et 240 (maximum) ms. » 91 % des appareils testés affichent de meilleures performances. Cela signifie que les latences relevées sont moins bonnes que la moyenne (19.8 ms) de tous les appareils testés. | ||
| ↔ Temps de réponse gris 50% à gris 80% | ||
| 56 ms ... hausse ↗ et chute ↘ combinées | ↗ 26 ms hausse | 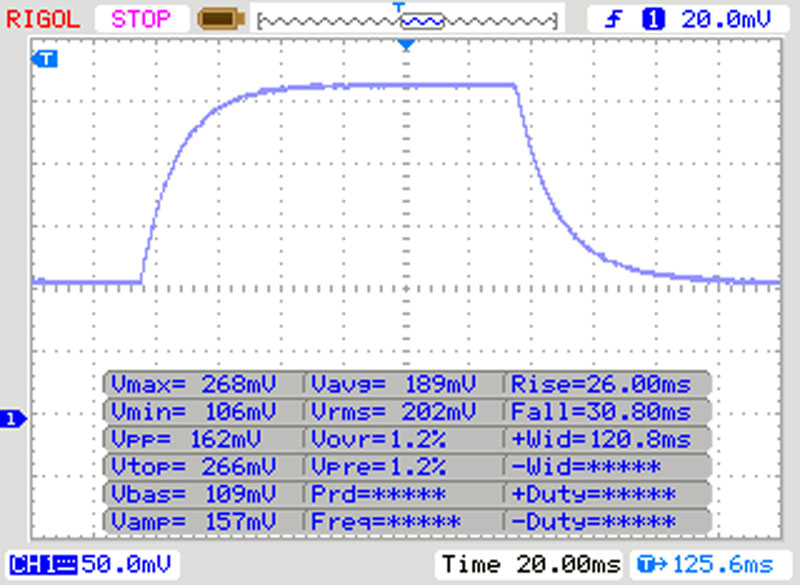 |
| ↘ 30 ms chute | ||
| L'écran souffre de latences très élevées, à éviter pour le jeu. En comparaison, tous les appareils testés affichent entre 0.165 (minimum) et 636 (maximum) ms. » 93 % des appareils testés affichent de meilleures performances. Cela signifie que les latences relevées sont moins bonnes que la moyenne (31 ms) de tous les appareils testés. | ||
Scintillement / MLI (Modulation de largeur d'impulsion)
| Scintillement / MLI (Modulation de largeur d'impulsion) décelé | 250 Hz | ≤ 20 Niveau de luminosité | 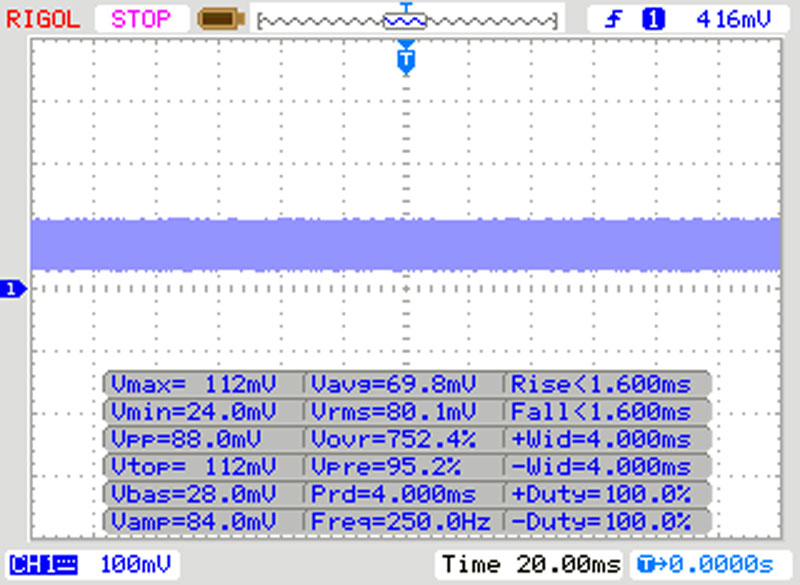 |
Le rétroéclairage de l'écran scintille à la fréquence de 250 Hz (certainement du fait de l'utilisation d'une MDI - Modulation de largeur d'impulsion) à un niveau de luminosité inférieur ou égal à 20 % . Aucun scintillement ne devrait être perceptible au-dessus de cette valeur. La fréquence de rafraîchissement de 250 Hz est relativement faible, les personnes les plus sensibles devraient percevoir un scintillement et être sujettes à une fatigue oculaire accrue (avec le niveau de luminosité indiqué) En comparaison, 52 % des appareils testés n'emploient pas MDI pour assombrir leur écran. Nous avons relevé une moyenne à 7763 (minimum : 5 - maximum : 343500) Hz dans le cas où une MDI était active. | |||
| Geekbench 4.4 | |
| 64 Bit Multi-Core Score | |
| Moyenne de la classe Subnotebook (27854 - 45023, n=7, 2 dernières années) | |
| Moyenne Intel Core i5-8265U (7144 - 16249, n=19) | |
| Dynabook Portégé X30-F-10N | |
| 64 Bit Single-Core Score | |
| Moyenne de la classe Subnotebook (5976 - 8929, n=7, 2 dernières années) | |
| Moyenne Intel Core i5-8265U (2106 - 4830, n=19) | |
| Dynabook Portégé X30-F-10N | |
| Mozilla Kraken 1.1 - Total | |
| HP EliteBook 735 G5 3UN62EA | |
| Dynabook Portégé X30-F-10N (Edge 44) | |
| Moyenne Intel Core i5-8265U (851 - 1245, n=25) | |
| Lenovo ThinkPad X390-20Q1S02M00 (Edge) | |
| HP EliteBook 830 G5-3JX74EA (Edge) | |
| Dell Latitude 7300-P99G (Edge) | |
| Moyenne de la classe Subnotebook (234 - 1104, n=60, 2 dernières années) | |
| JetStream 1.1 - 1.1 Total | |
| Moyenne de la classe Subnotebook (215 - 476, n=2, 2 dernières années) | |
| HP EliteBook 830 G5-3JX74EA (Edge) | |
| Dynabook Portégé X30-F-10N (Edge 44) | |
| Moyenne Intel Core i5-8265U (193.7 - 244, n=19) | |
| HP EliteBook 735 G5 3UN62EA | |
* ... Moindre est la valeur, meilleures sont les performances
| PCMark 8 Home Score Accelerated v2 | 3298 points | |
| PCMark 8 Creative Score Accelerated v2 | 3473 points | |
| PCMark 8 Work Score Accelerated v2 | 4735 points | |
| PCMark 10 Score | 3595 points | |
Aide | ||

| Dynabook Portégé X30-F-10N Samsung SSD PM981 MZVLB256HAHQ | Lenovo ThinkPad X390-20Q1S02M00 Intel SSD Pro 7600p SSDPEKKF512G8L | Lenovo ThinkPad X395 Samsung SSD PM981a MZVLB256HBHQ | Dell Latitude 7300-P99G Samsung SSD PM981 MZVLB512HAJQ | HP EliteBook 735 G5 3UN62EA Toshiba KBG30ZMV256G | HP EliteBook 830 G5-3JX74EA Samsung SSD PM961 1TB M.2 PCIe 3.0 x4 NVMe (MZVLW1T0) | Moyenne Samsung SSD PM981 MZVLB256HAHQ | Moyenne de la classe Subnotebook | |
|---|---|---|---|---|---|---|---|---|
| CrystalDiskMark 5.2 / 6 | -3% | 9% | 29% | -38% | -5% | -4% | 69% | |
| Write 4K (MB/s) | 102.1 | 120.7 18% | 129.4 27% | 141.1 38% | 97.3 -5% | 108.5 6% | 116.1 ? 14% | 155.4 ? 52% |
| Read 4K (MB/s) | 3738 | 58.5 -98% | 41.6 -99% | 46.37 -99% | 44.58 -99% | 40.53 -99% | 189.5 ? -95% | 64.3 ? -98% |
| Write Seq (MB/s) | 1507 | 1491 -1% | 2334 55% | 1994 32% | 883 -41% | 1026 -32% | 1409 ? -7% | 2846 ? 89% |
| Read Seq (MB/s) | 1723 | 2760 60% | 2151 25% | 2275 32% | 1050 -39% | 2080 21% | 1624 ? -6% | 3299 ? 91% |
| Write 4K Q32T1 (MB/s) | 300.9 | 237.5 -21% | 234 -22% | 493.3 64% | 167.3 -44% | 451 50% | 360 ? 20% | 431 ? 43% |
| Read 4K Q32T1 (MB/s) | 273.7 | 336.1 23% | 325.7 19% | 429 57% | 337.4 23% | 269.7 -1% | 396 ? 45% | 504 ? 84% |
| Write Seq Q32T1 (MB/s) | 1494 | 1512 1% | 2348 57% | 2992 100% | 789 -47% | 1770 18% | 1492 ? 0% | 4671 ? 213% |
| Read Seq Q32T1 (MB/s) | 3309 | 3154 -5% | 3563 8% | 3562 8% | 1606 -51% | 3214 -3% | 3313 ? 0% | 5833 ? 76% |
| 3DMark 11 Performance | 1882 points | |
| 3DMark Cloud Gate Standard Score | 7837 points | |
| 3DMark Fire Strike Score | 997 points | |
Aide | ||
| Bas | Moyen | Élevé | Ultra | |
|---|---|---|---|---|
| BioShock Infinite (2013) | 48.4 | 30 | 23.4 | 7.5 |
Degré de la nuisance sonore
| Au repos |
| 30.4 / 30.4 / 30.4 dB(A) |
| Fortement sollicité |
| 37.8 / 40.1 dB(A) |
 | ||
30 dB silencieux 40 dB(A) audible 50 dB(A) bruyant |
||
min: | ||
(±) La température maximale du côté supérieur est de 40 °C / 104 F, par rapport à la moyenne de 35.9 °C / 97 F, allant de 21.4 à 59 °C pour la classe Subnotebook.
(+) Le fond chauffe jusqu'à un maximum de 38 °C / 100 F, contre une moyenne de 39.2 °C / 103 F
(+) En utilisation inactive, la température moyenne du côté supérieur est de 24.6 °C / 76 F, par rapport à la moyenne du dispositif de 30.8 °C / 87 F.
(+) Les repose-poignets et le pavé tactile sont plus froids que la température de la peau avec un maximum de 24.9 °C / 76.8 F et sont donc froids au toucher.
(+) La température moyenne de la zone de l'appui-paume de dispositifs similaires était de 28.2 °C / 82.8 F (+3.3 °C / #6 F).
Dynabook Portégé X30-F-10N analyse audio
(-) | haut-parleurs pas très forts (69.9 dB)
Basses 100 - 315 Hz
(-) | presque aucune basse - en moyenne 20.4% plus bas que la médiane
(±) | la linéarité des basses est moyenne (12.8% delta à la fréquence précédente)
Médiums 400 - 2000 Hz
(+) | médiane équilibrée - seulement 1.4% de la médiane
(+) | les médiums sont linéaires (4.5% delta à la fréquence précédente)
Aiguës 2 - 16 kHz
(+) | des sommets équilibrés - à seulement 4% de la médiane
(+) | les aigus sont linéaires (6.3% delta à la fréquence précédente)
Globalement 100 - 16 000 Hz
(±) | la linéarité du son global est moyenne (18.3% de différence avec la médiane)
Par rapport à la même classe
» 53% de tous les appareils testés de cette catégorie étaient meilleurs, 7% similaires, 40% pires
» Le meilleur avait un delta de 5%, la moyenne était de 18%, le pire était de 53%.
Par rapport à tous les appareils testés
» 40% de tous les appareils testés étaient meilleurs, 8% similaires, 52% pires
» Le meilleur avait un delta de 4%, la moyenne était de 24%, le pire était de 134%.
| Éteint/en veille | |
| Au repos | |
| Fortement sollicité |
|
Légende:
min: | |
Points positifs
Points négatifs

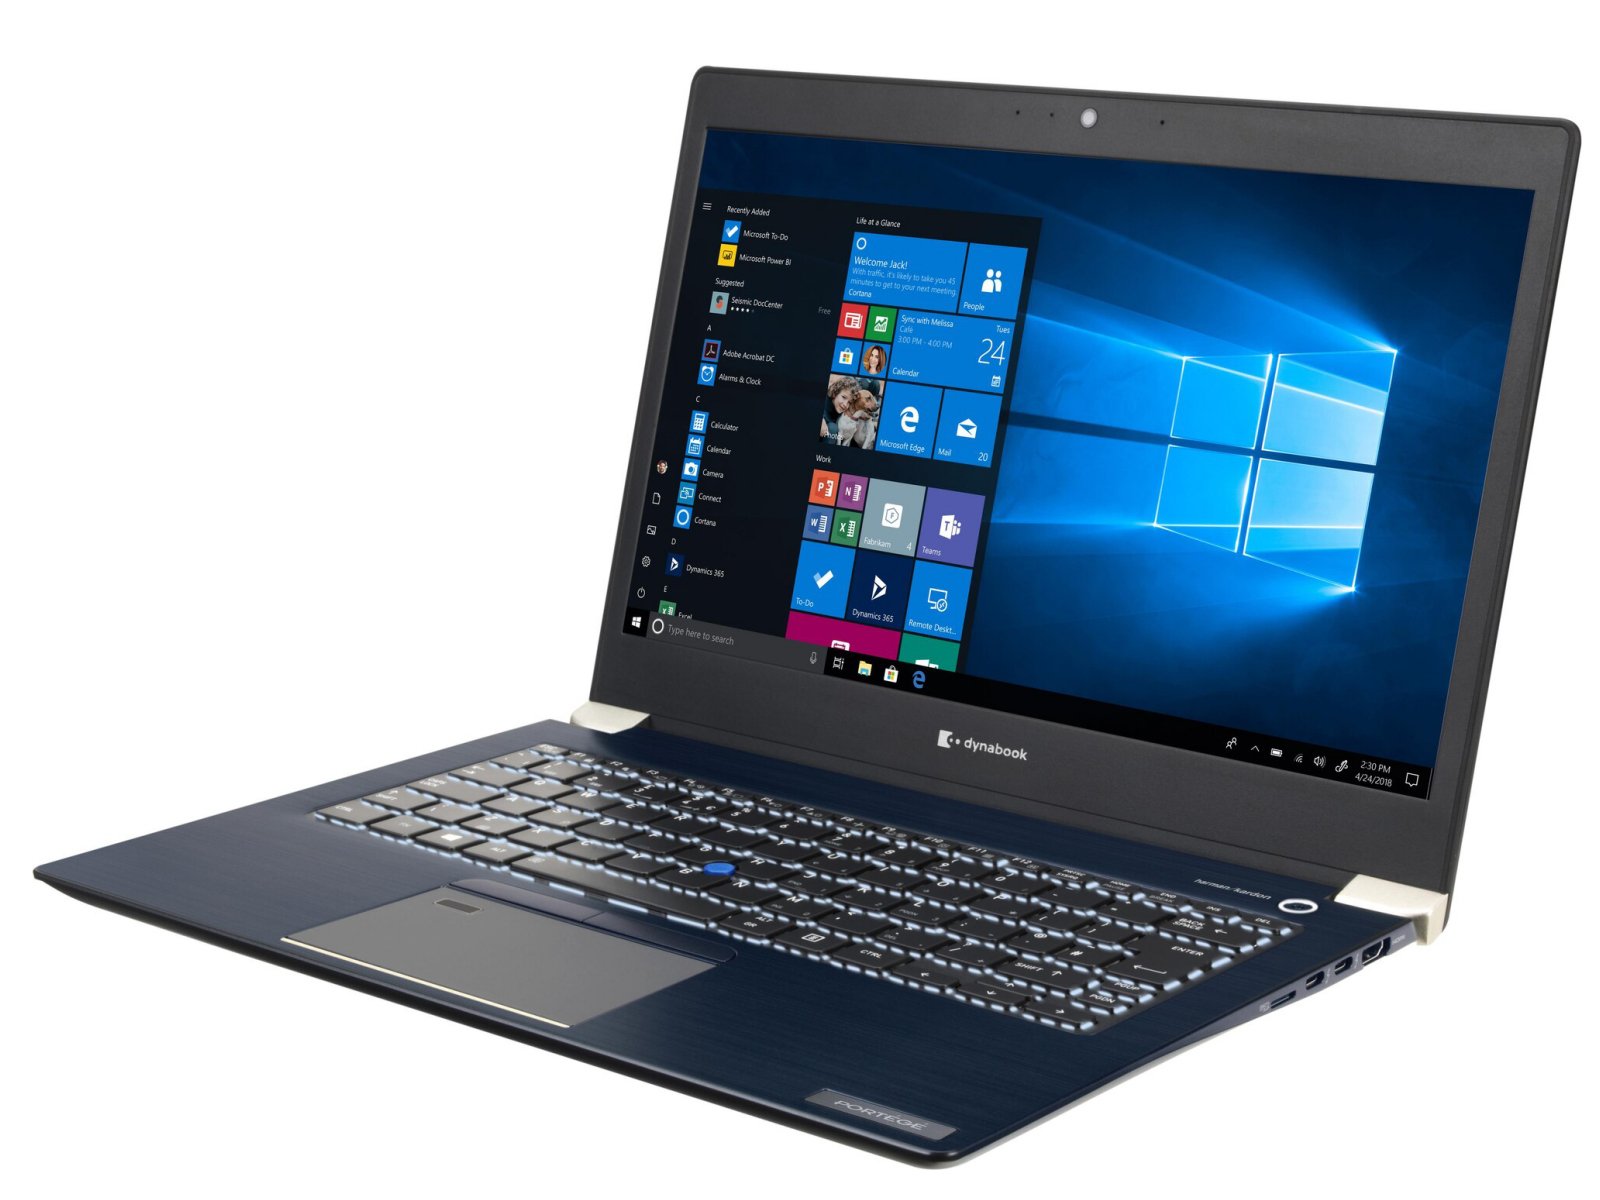
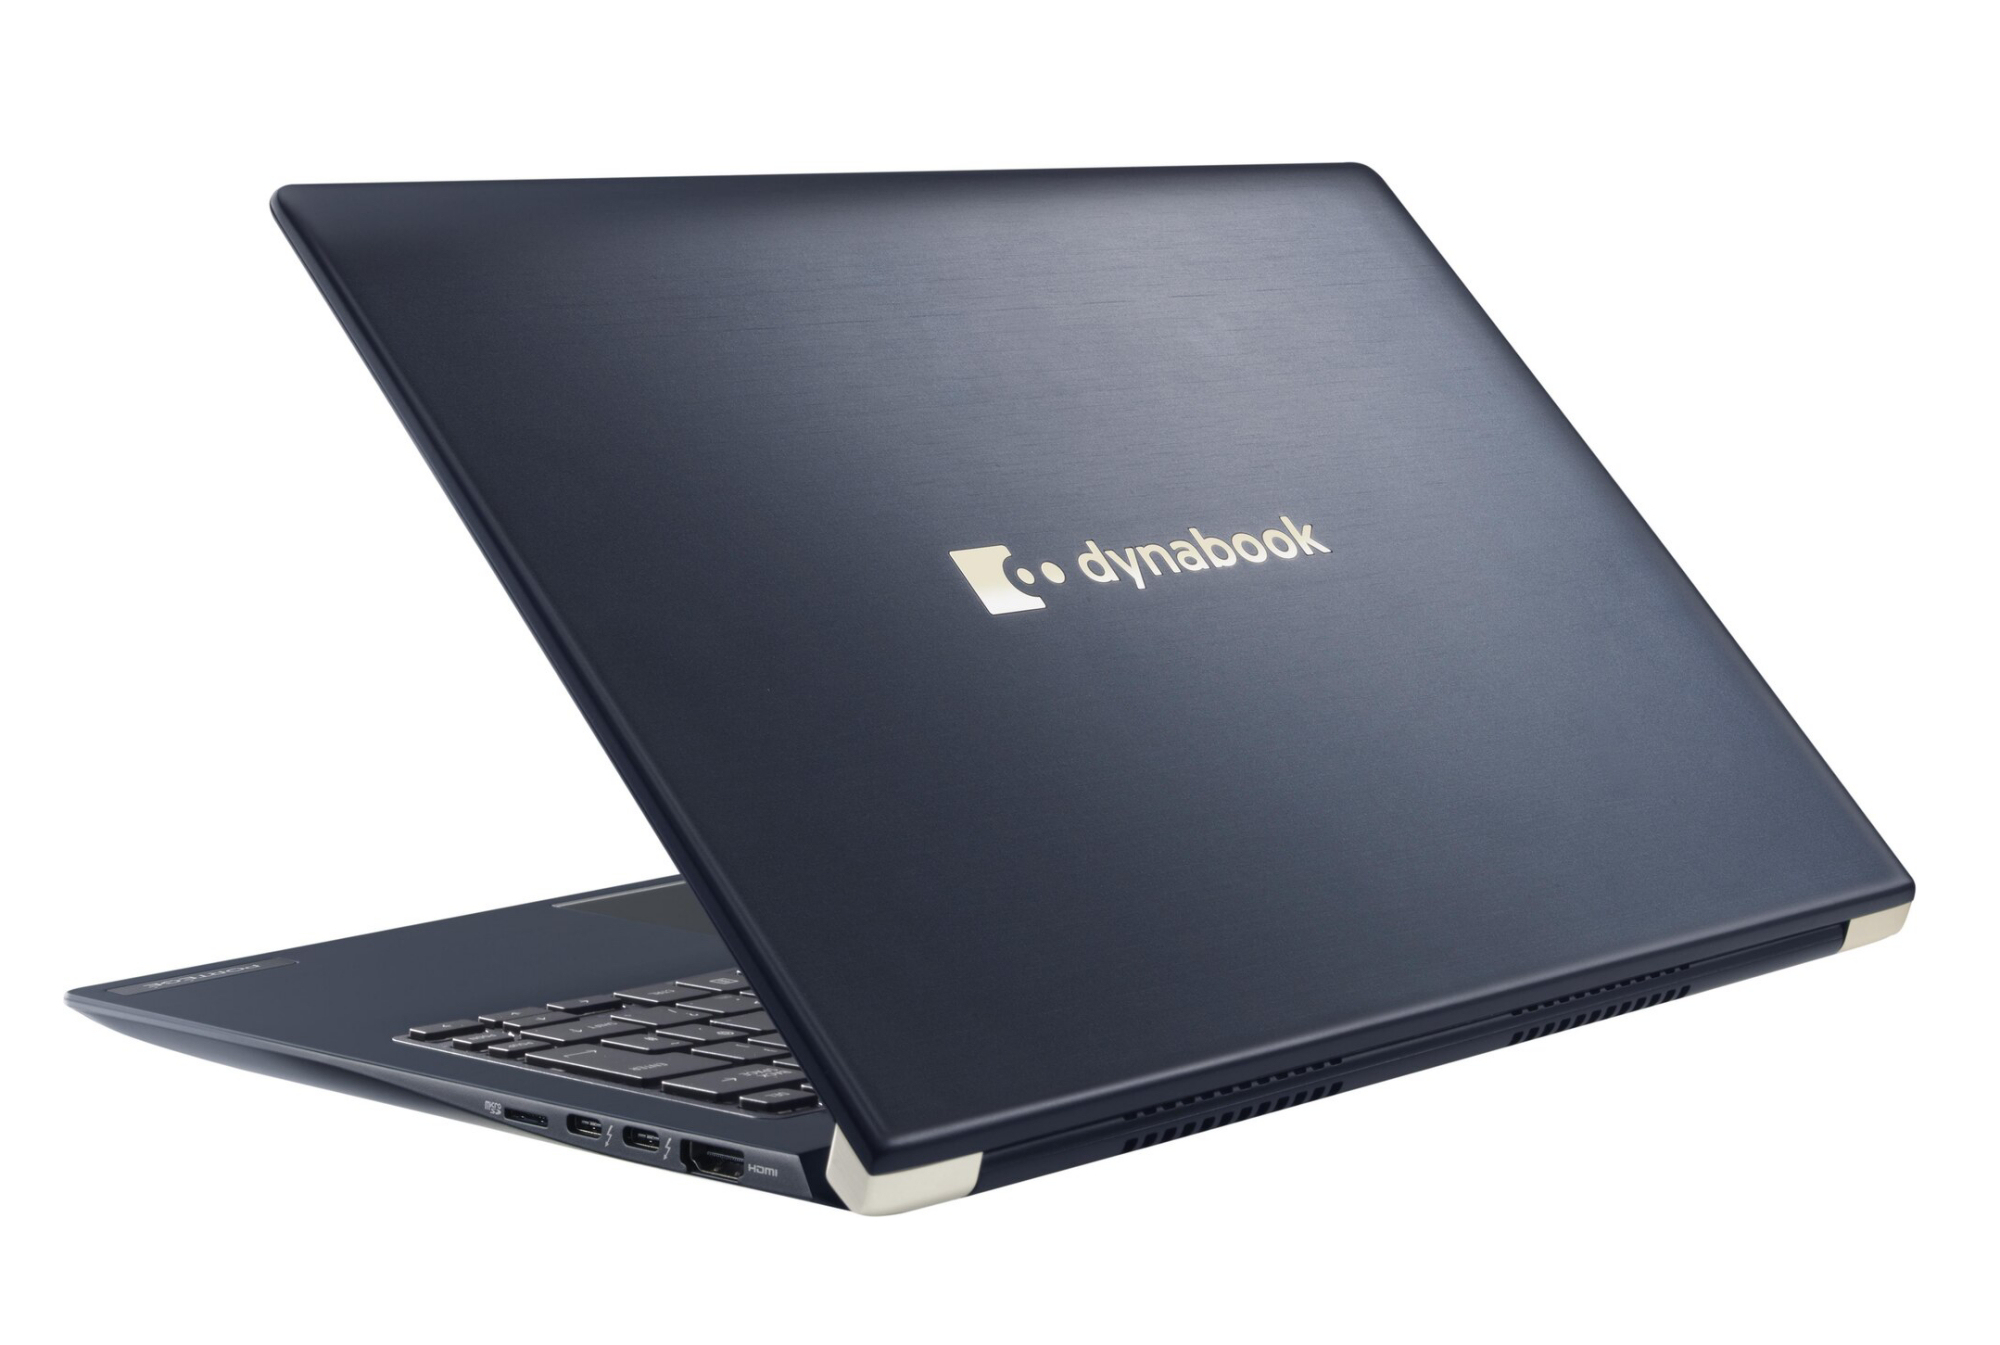
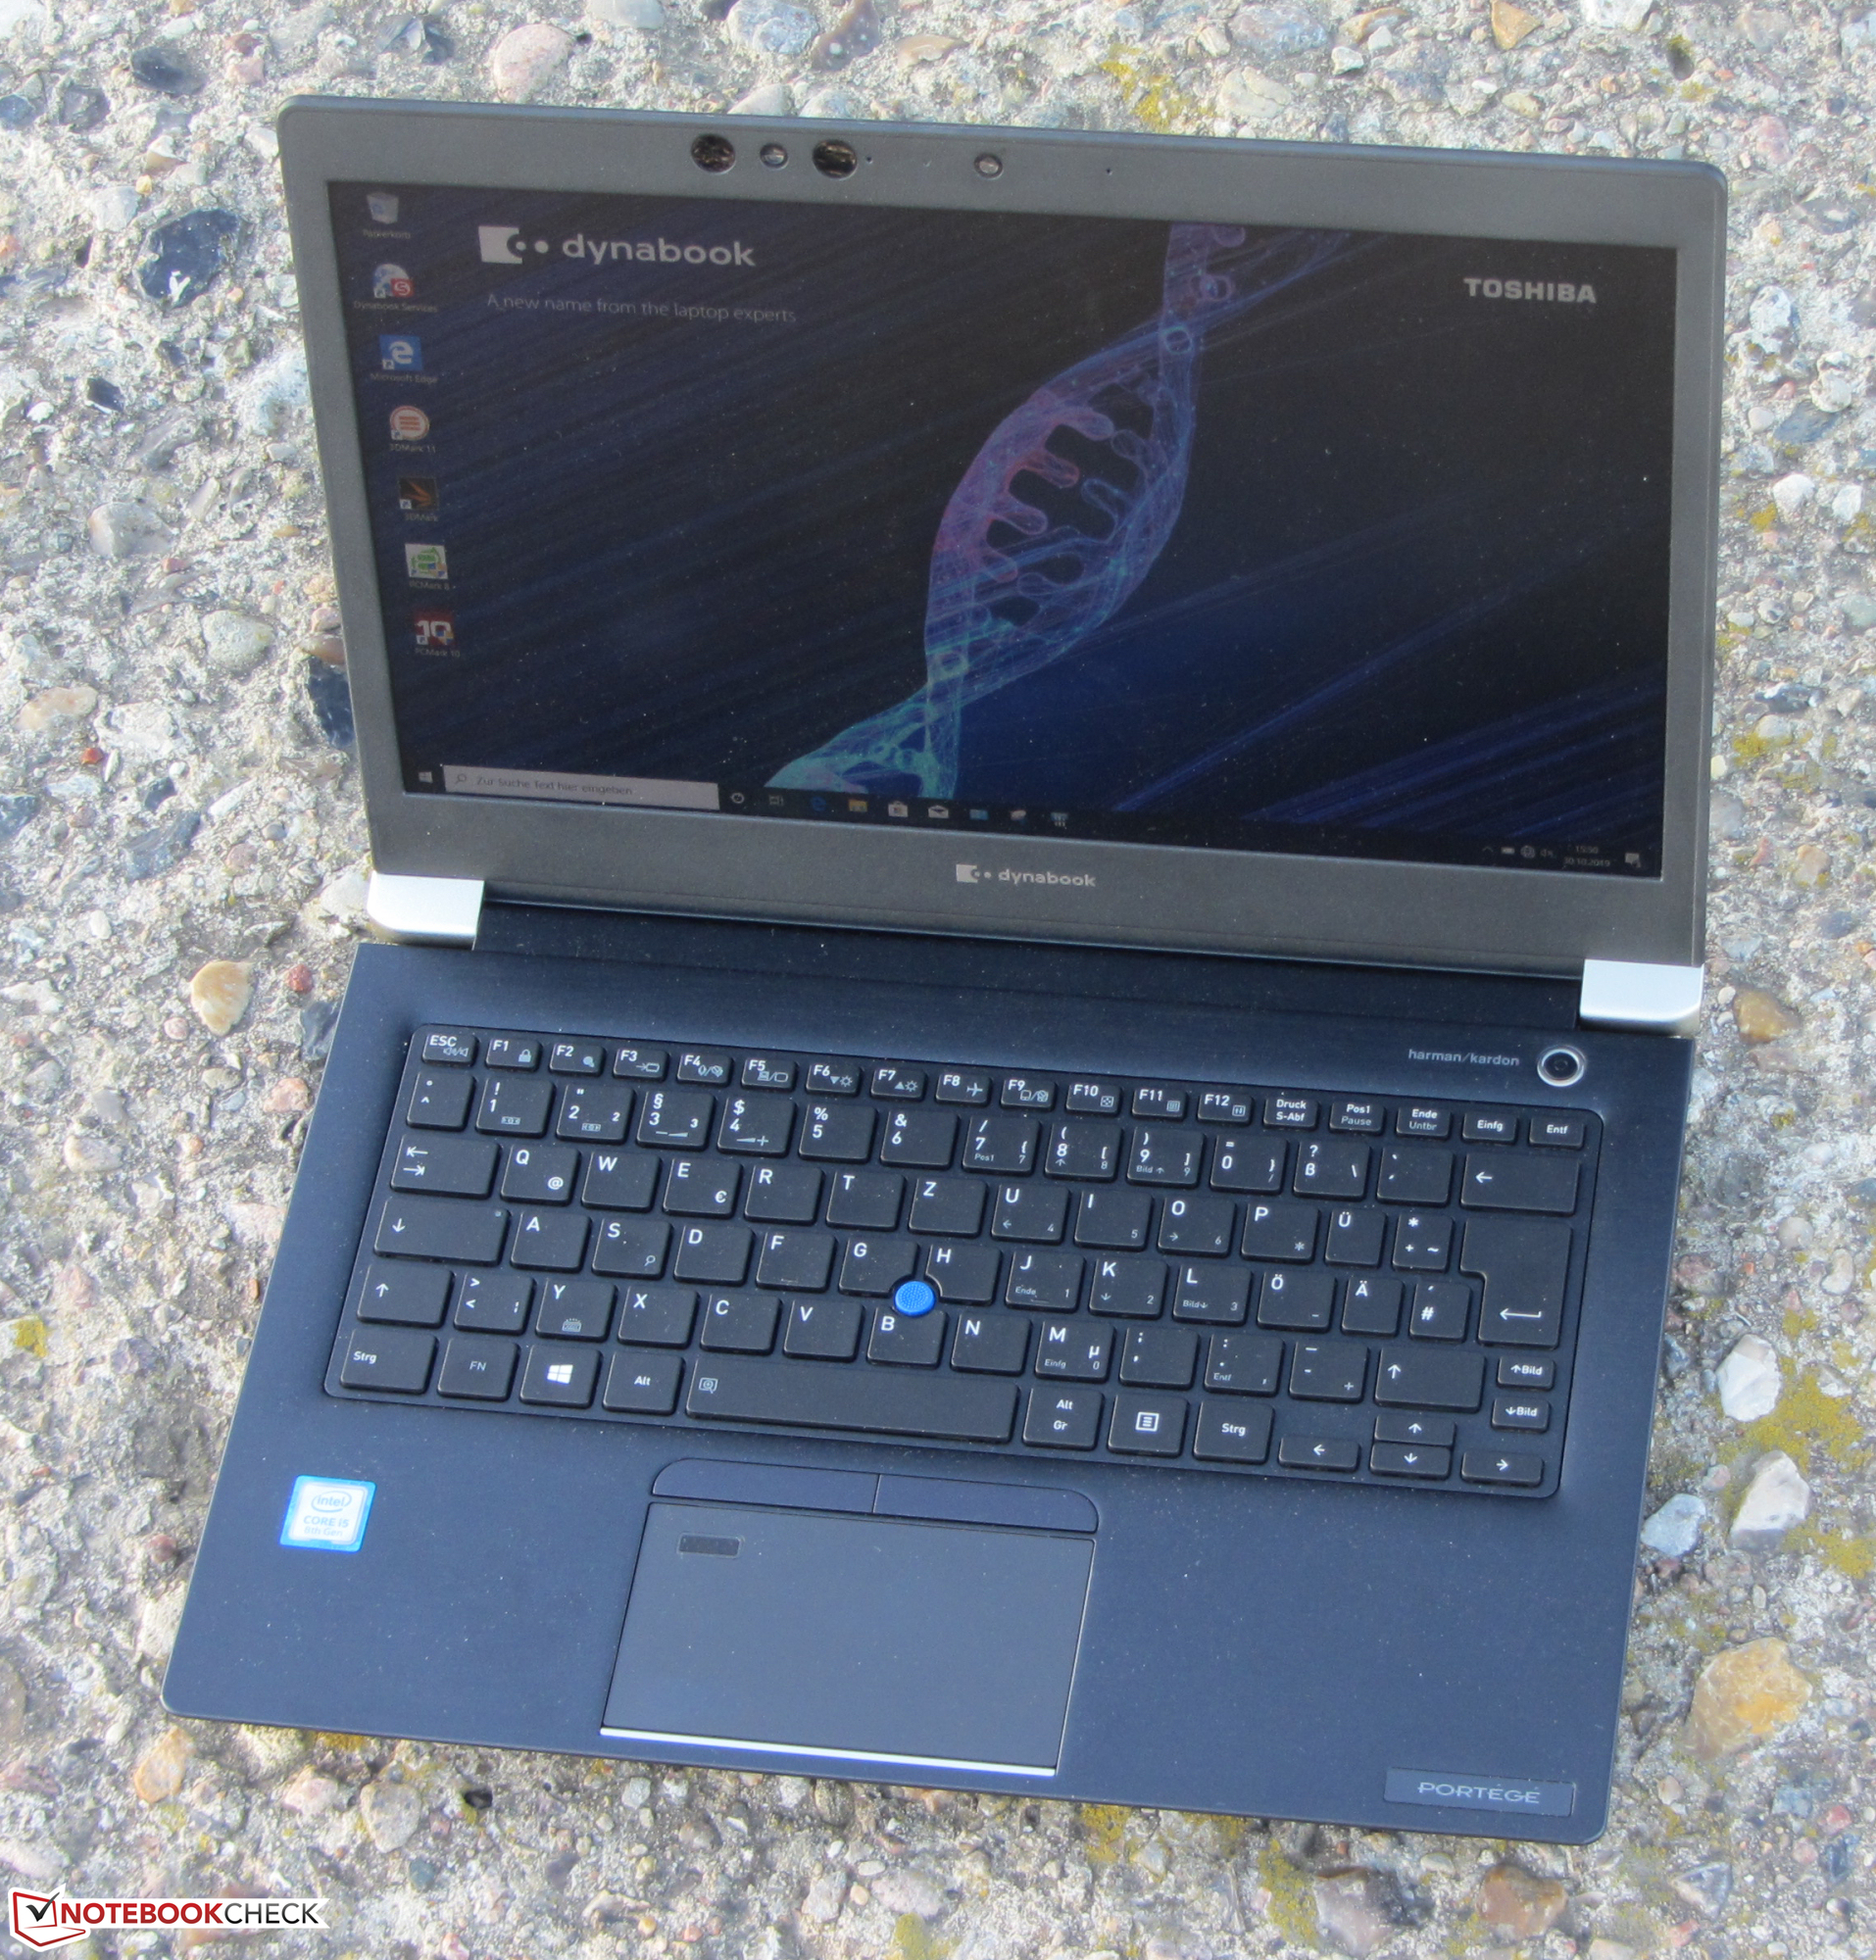
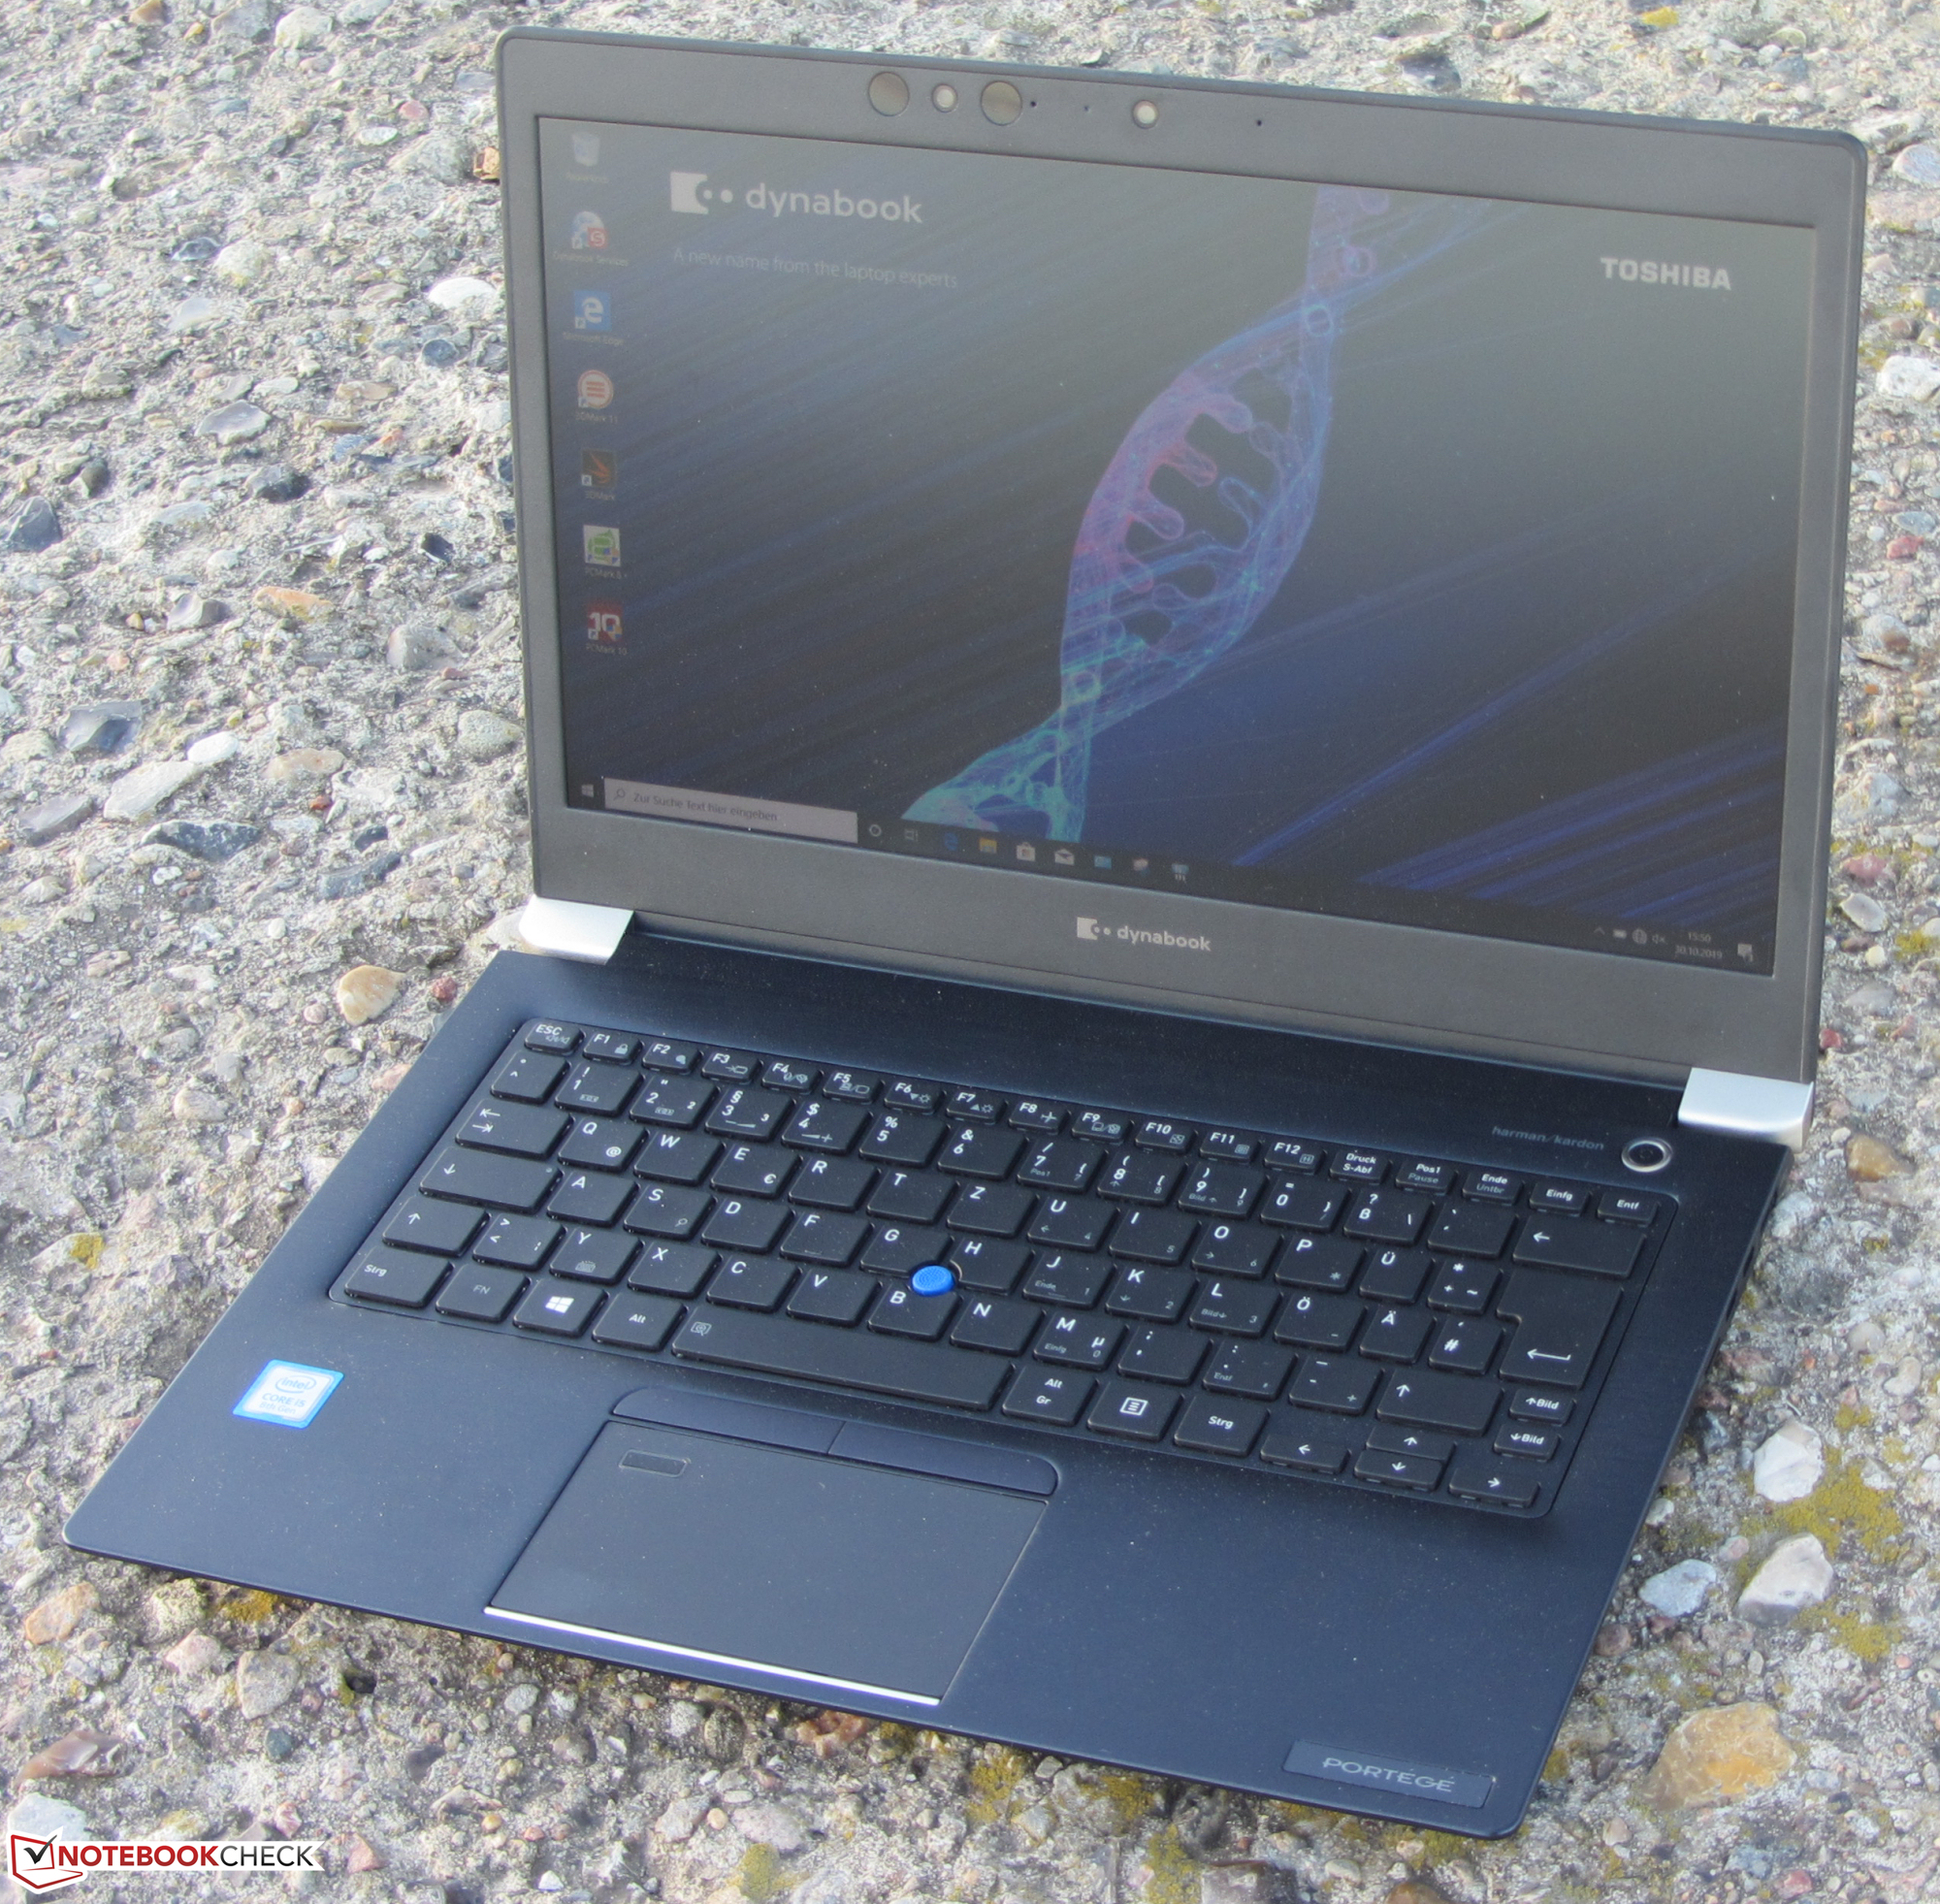
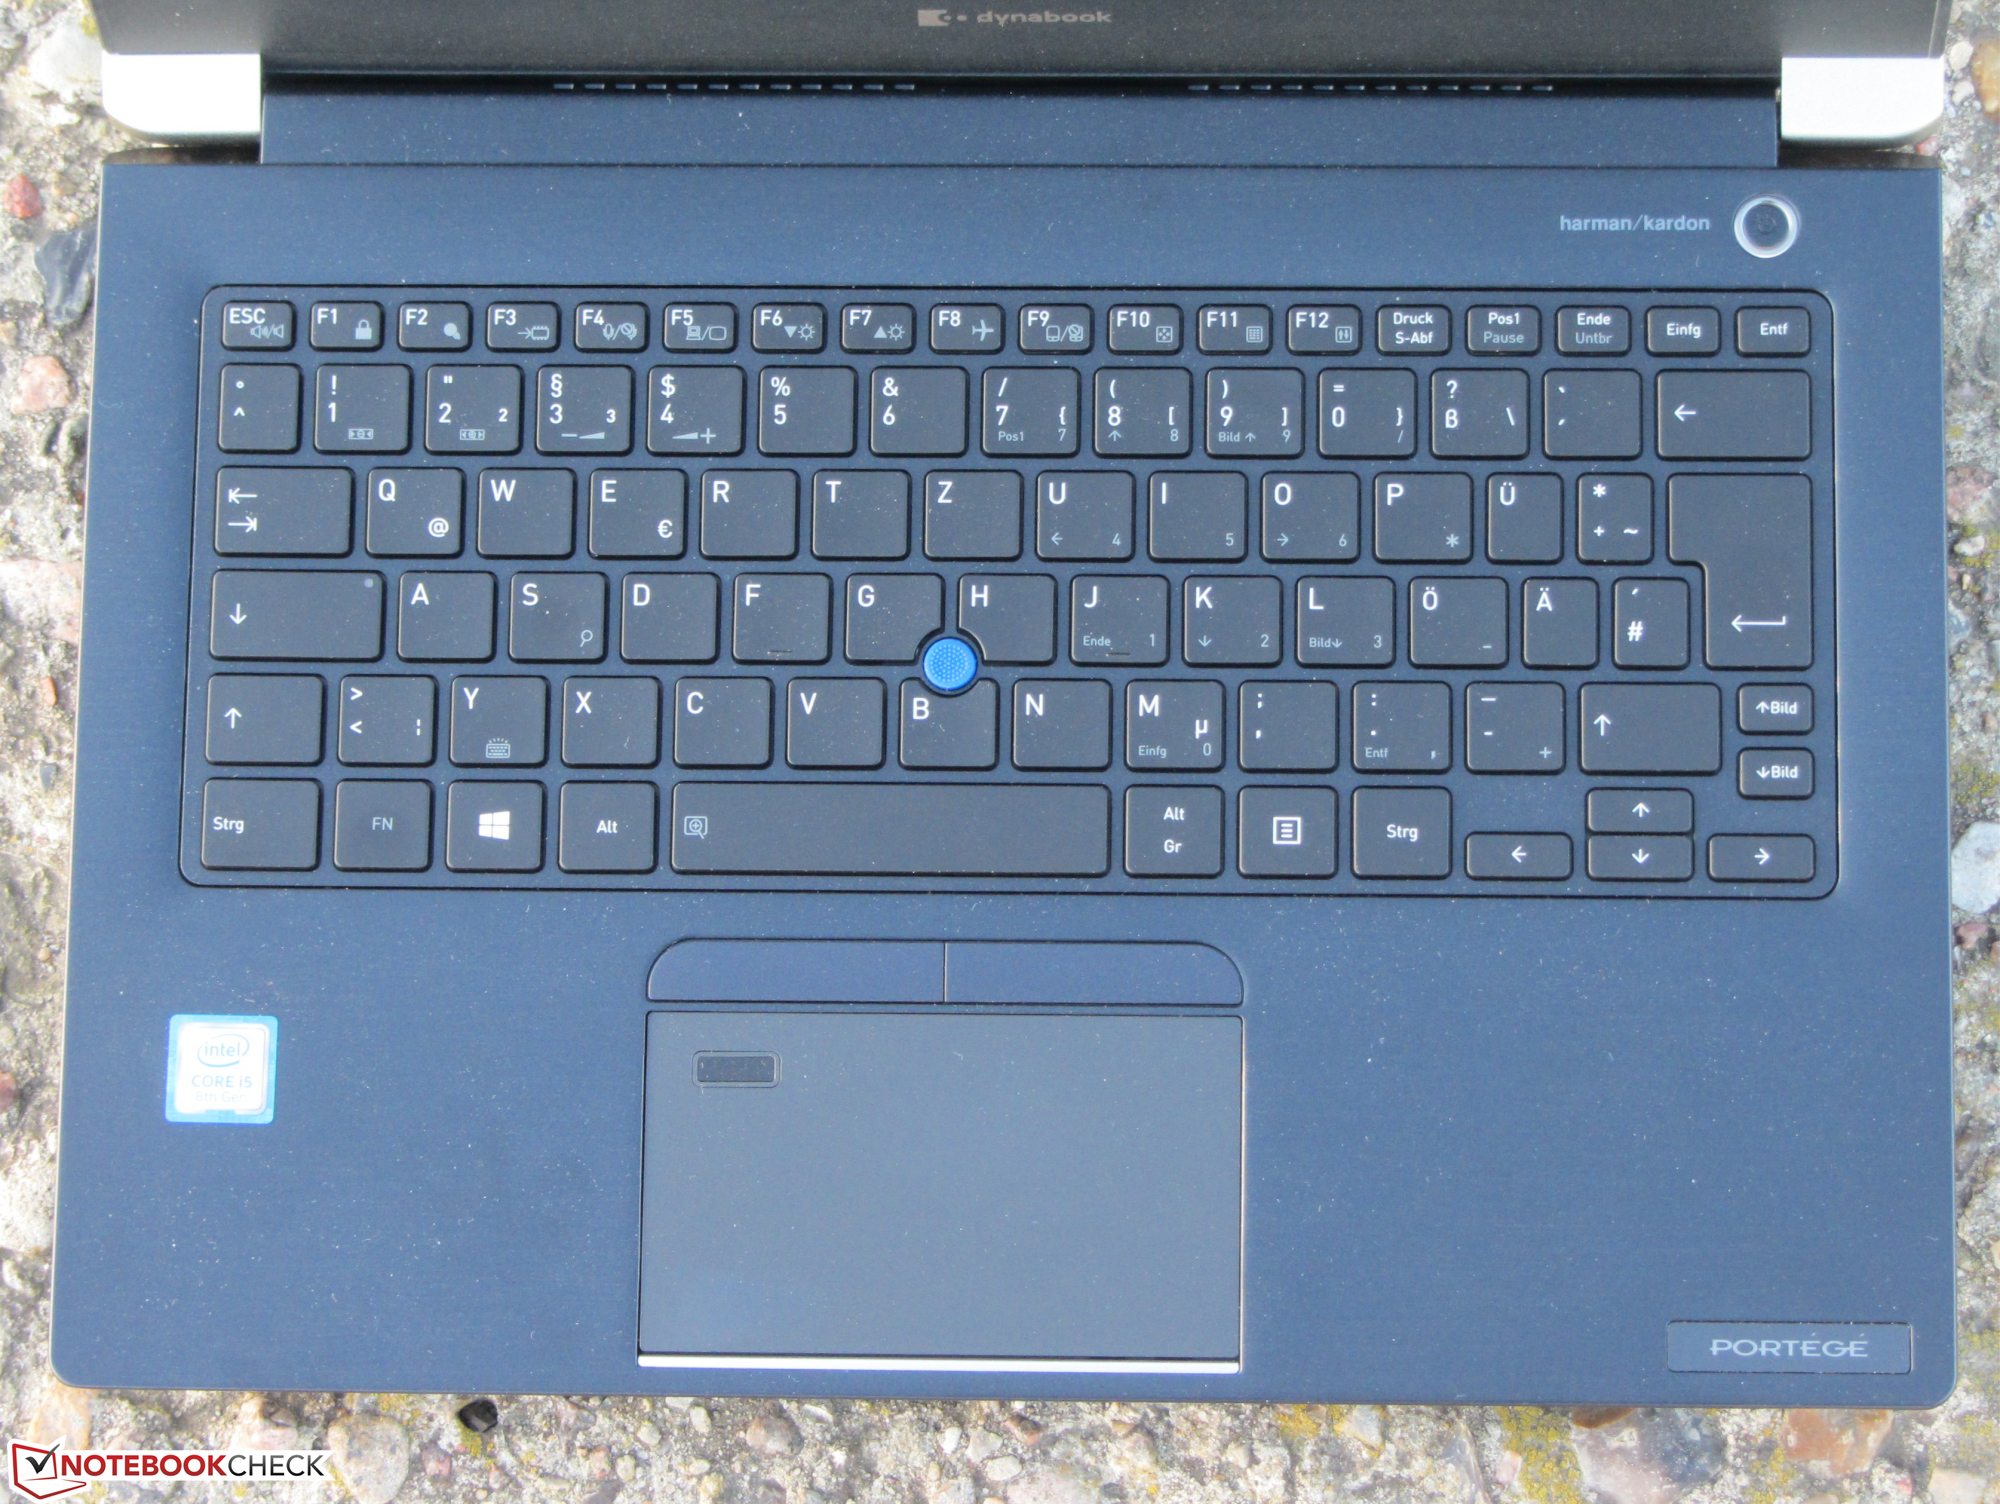
Avec le Portégé X30-F, Dynabook fait avant tout une mise à jour. Le châssis est celui de ses prédécesseurs – par exemple, le Toshiba Portégé X30-D. De ce fait, le nouveau modèle hérite de beaucoup des avantages et inconvénients de ses prédécesseurs. Légèreté, solidité et maintenance aisée sont les points positifs. Les points négatifs sont liés au clavier, à la sensibilité aux traces de doigt, et à la partie écran pas assez rigide.
La dernière version du Portégé X30 est également conçue pour les nomades.
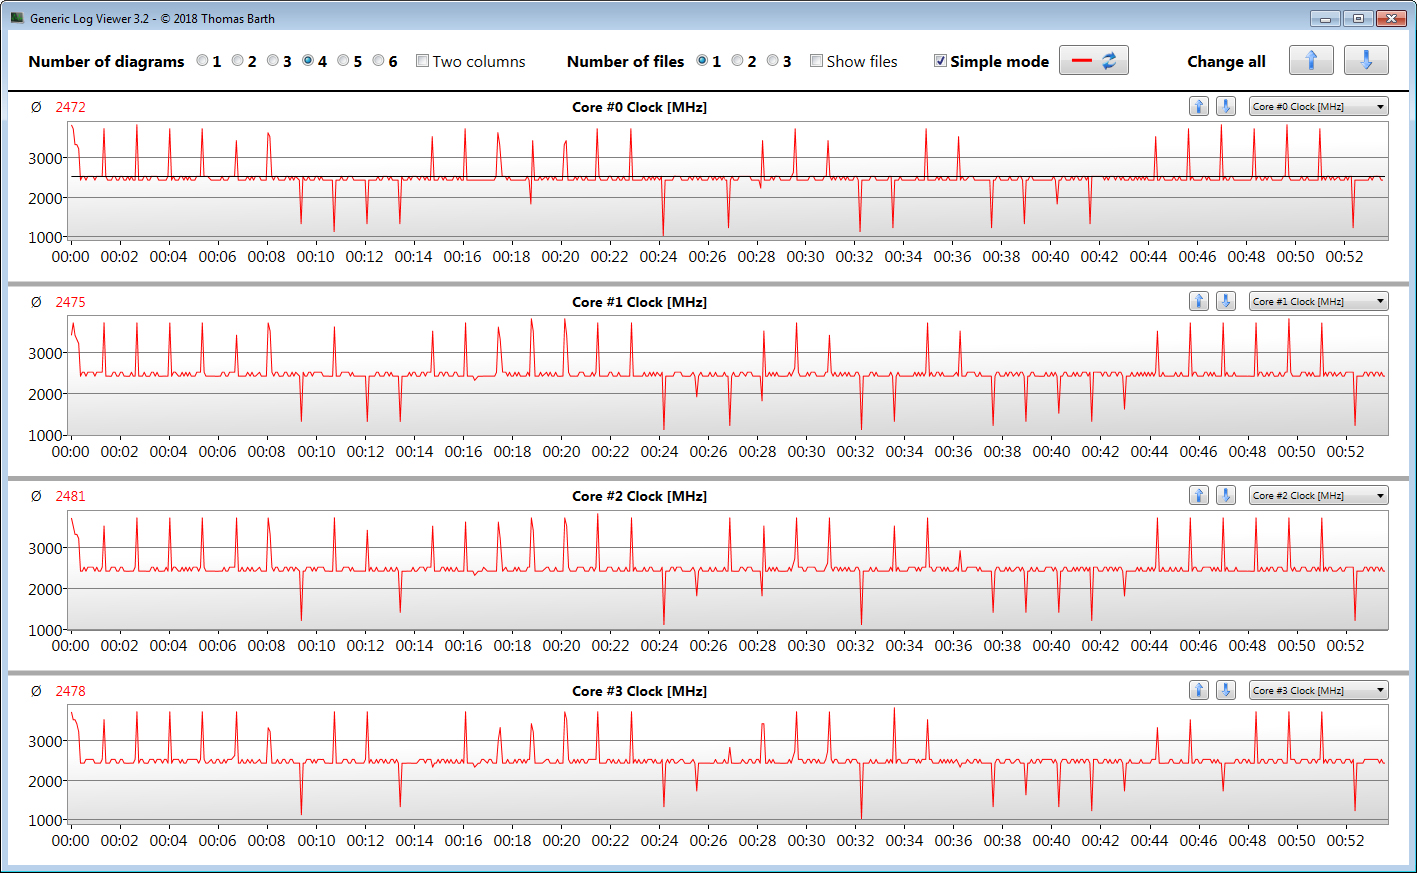
Le processeur Whiskey Lake quadricœur est assez puissant pour la bureautique et Internet. Cependant, le processeur n’utilise son Turbo que de façon limitée sur batterie. Conséquence néanmoins positive : le X30 possède une excellente autonomie.
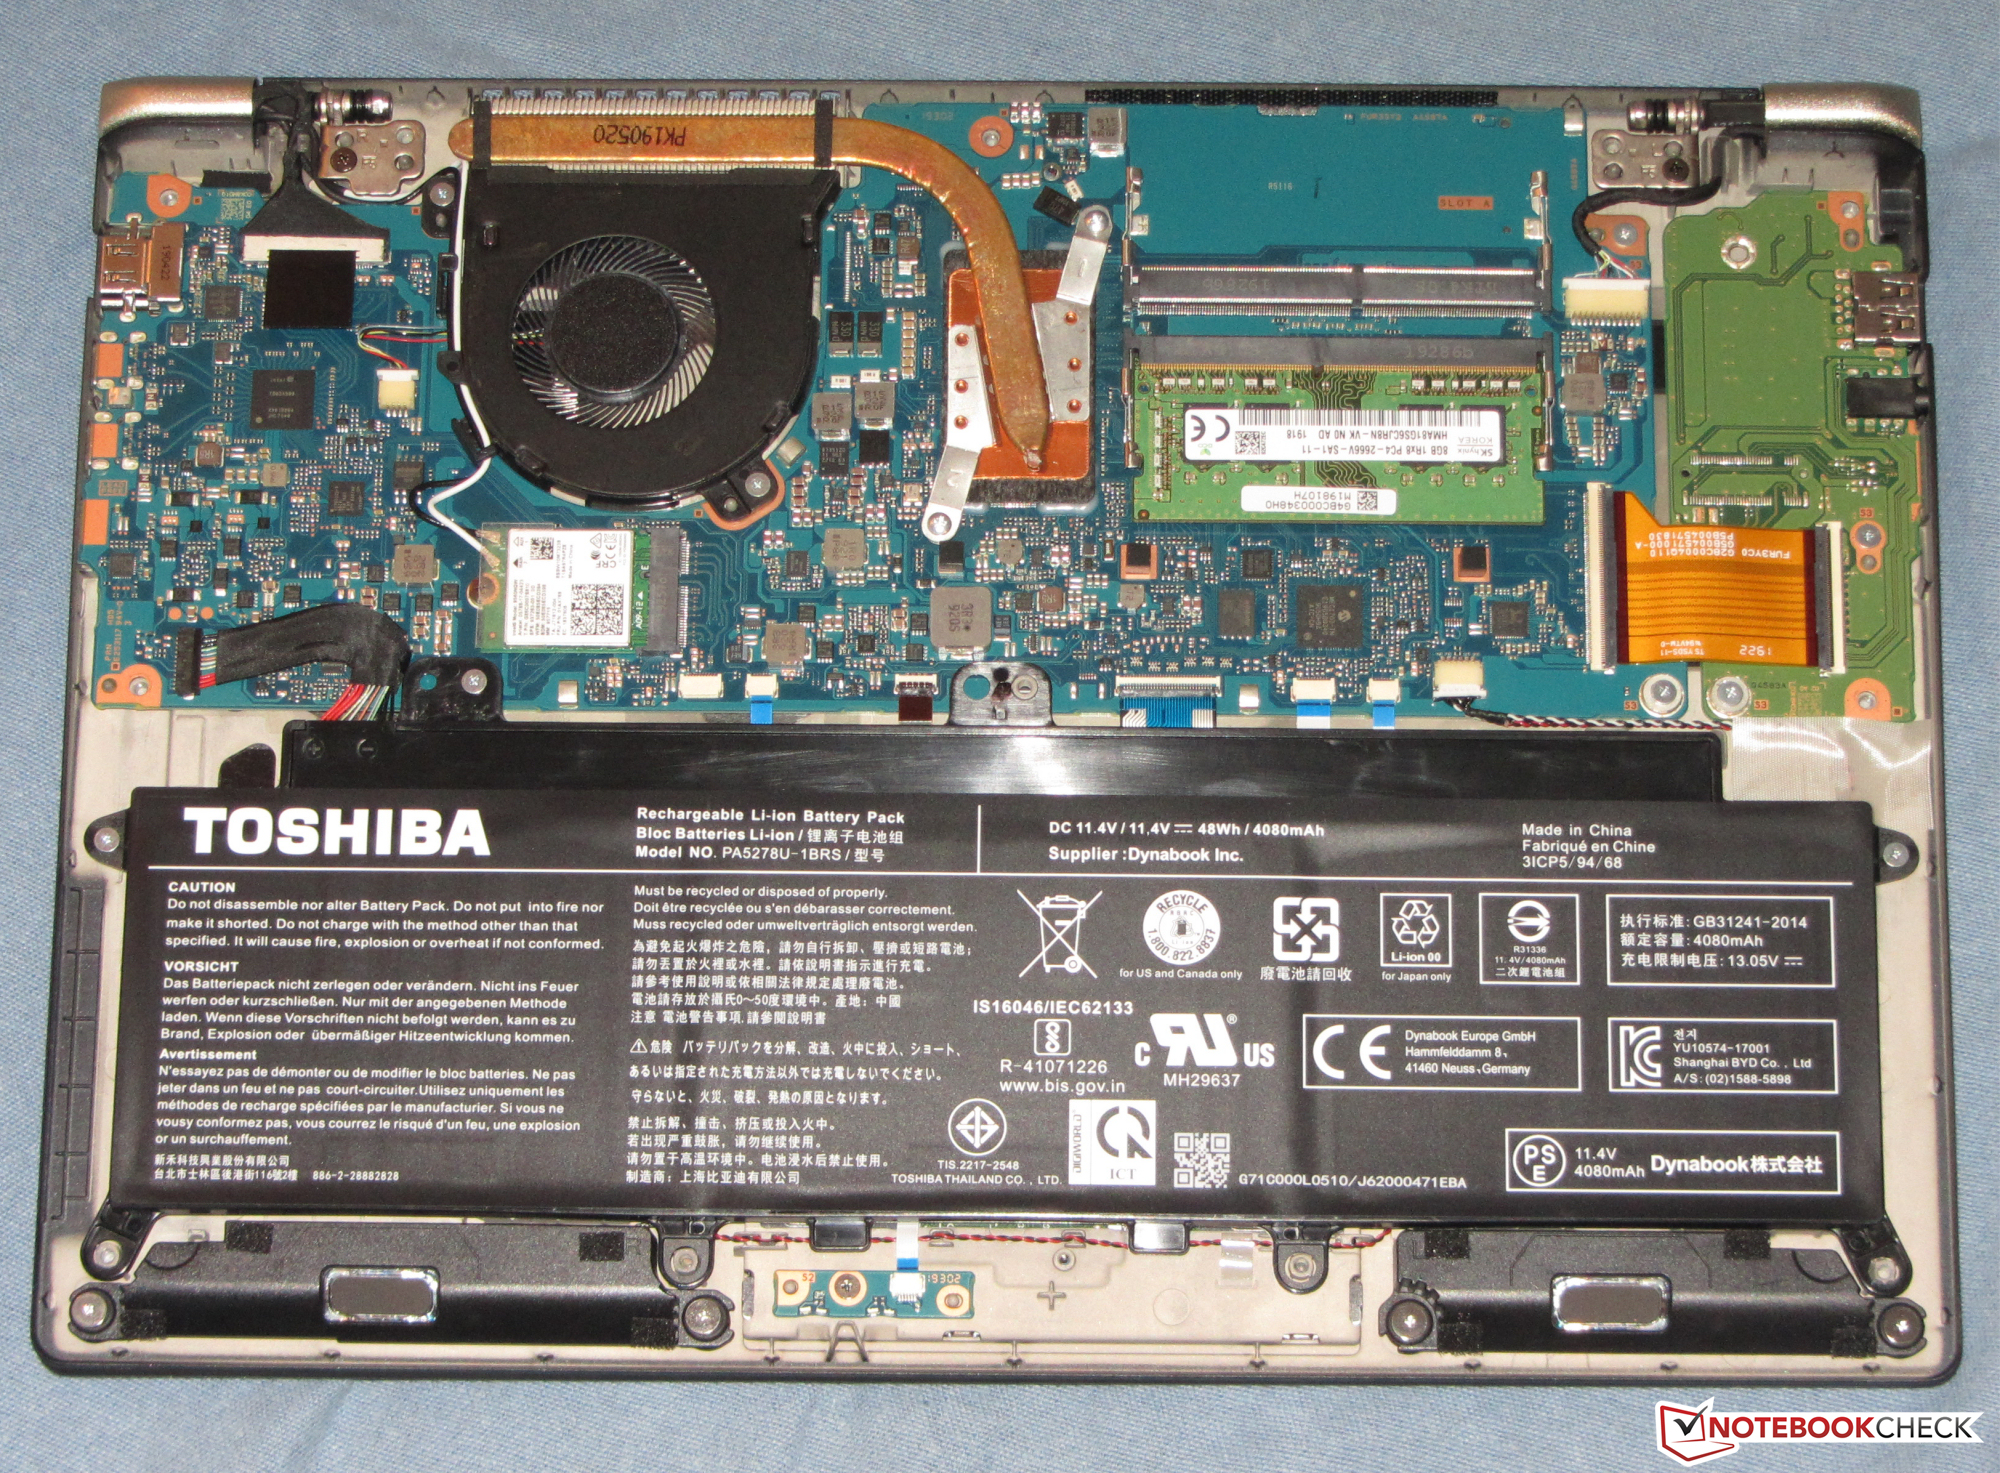
Le SSD NVMe (M.2 2280) permet au système d’être réactif. Il est possible de le changer, mais ce n’est pas simple : il est monté du mauvais côté de la carte-mère, ce qui signifie qu’il faudra enlever celle-ci afin de changer le stockage.
L’écran mat IPS marque des points avec de bons angles de vision, un bon contraste, une luminosité suffisante, et des couleurs plutôt fidèles en sortie d’usine. Notre modèle ne possède pas de modem LTE, qui ne peut malheureusement pas être ajouté. Si cela est nécessaire, il faudra prendre une configuration différente du X30 pour avoir Internet mobile.
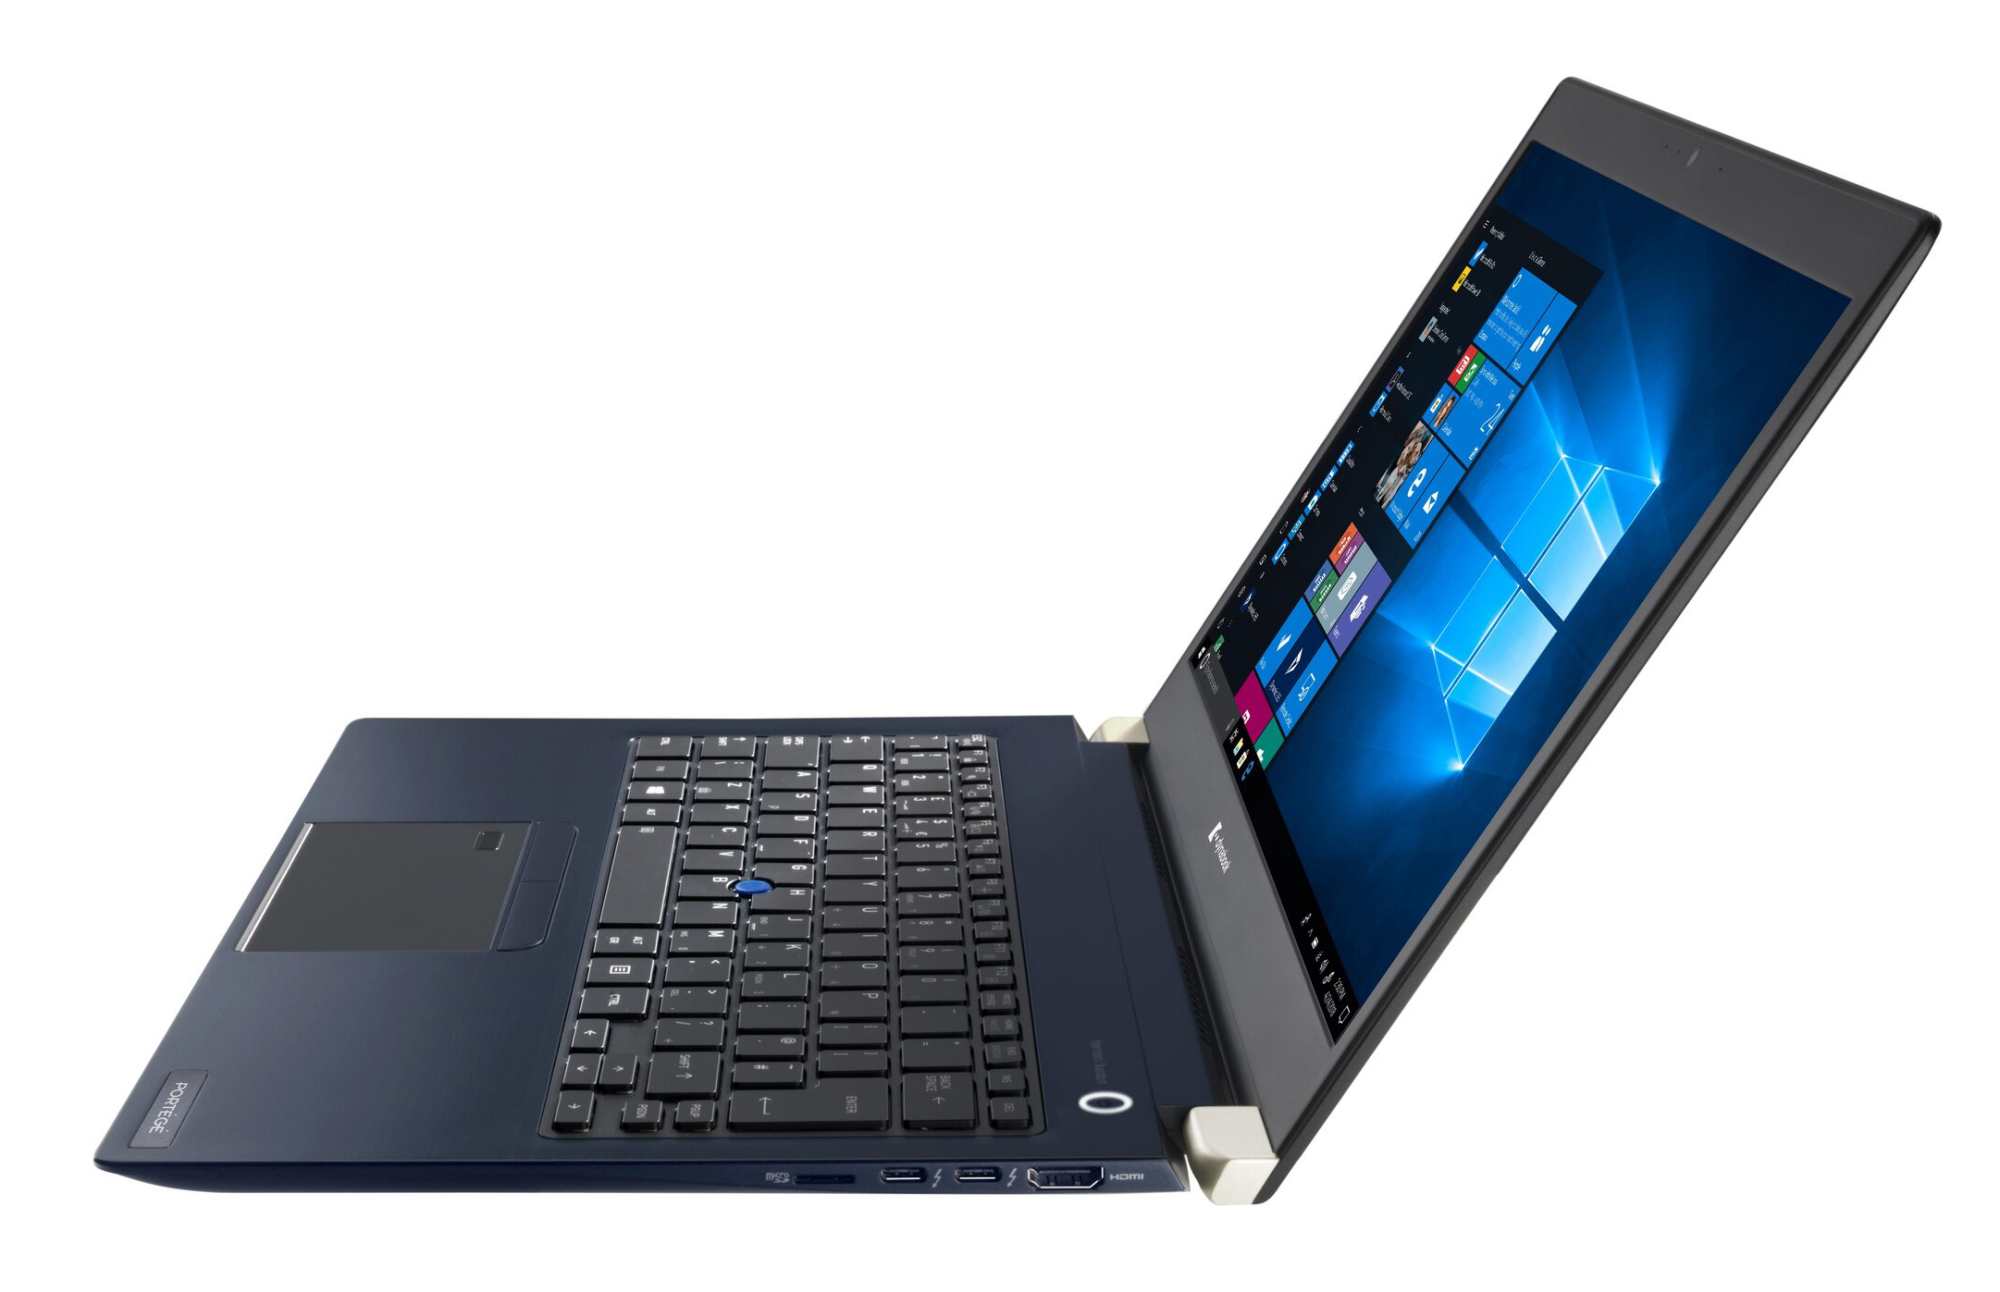
Les deux ports Thunderbolt 3 permettent la connexion de stations d’accueil et / ou d’une carte graphique externe puissante. Les deux ports prennent en charge le Power Delivery 3.0 et le DisplayPort via USB C (il faudra pour cela un adaptateur, vendu séparément).
L’intégralité de cette critique est disponible en anglais en suivant ce lien.
Dynabook Portégé X30-F-10N
- 11/04/2019 v7 (old)
Sascha Mölck