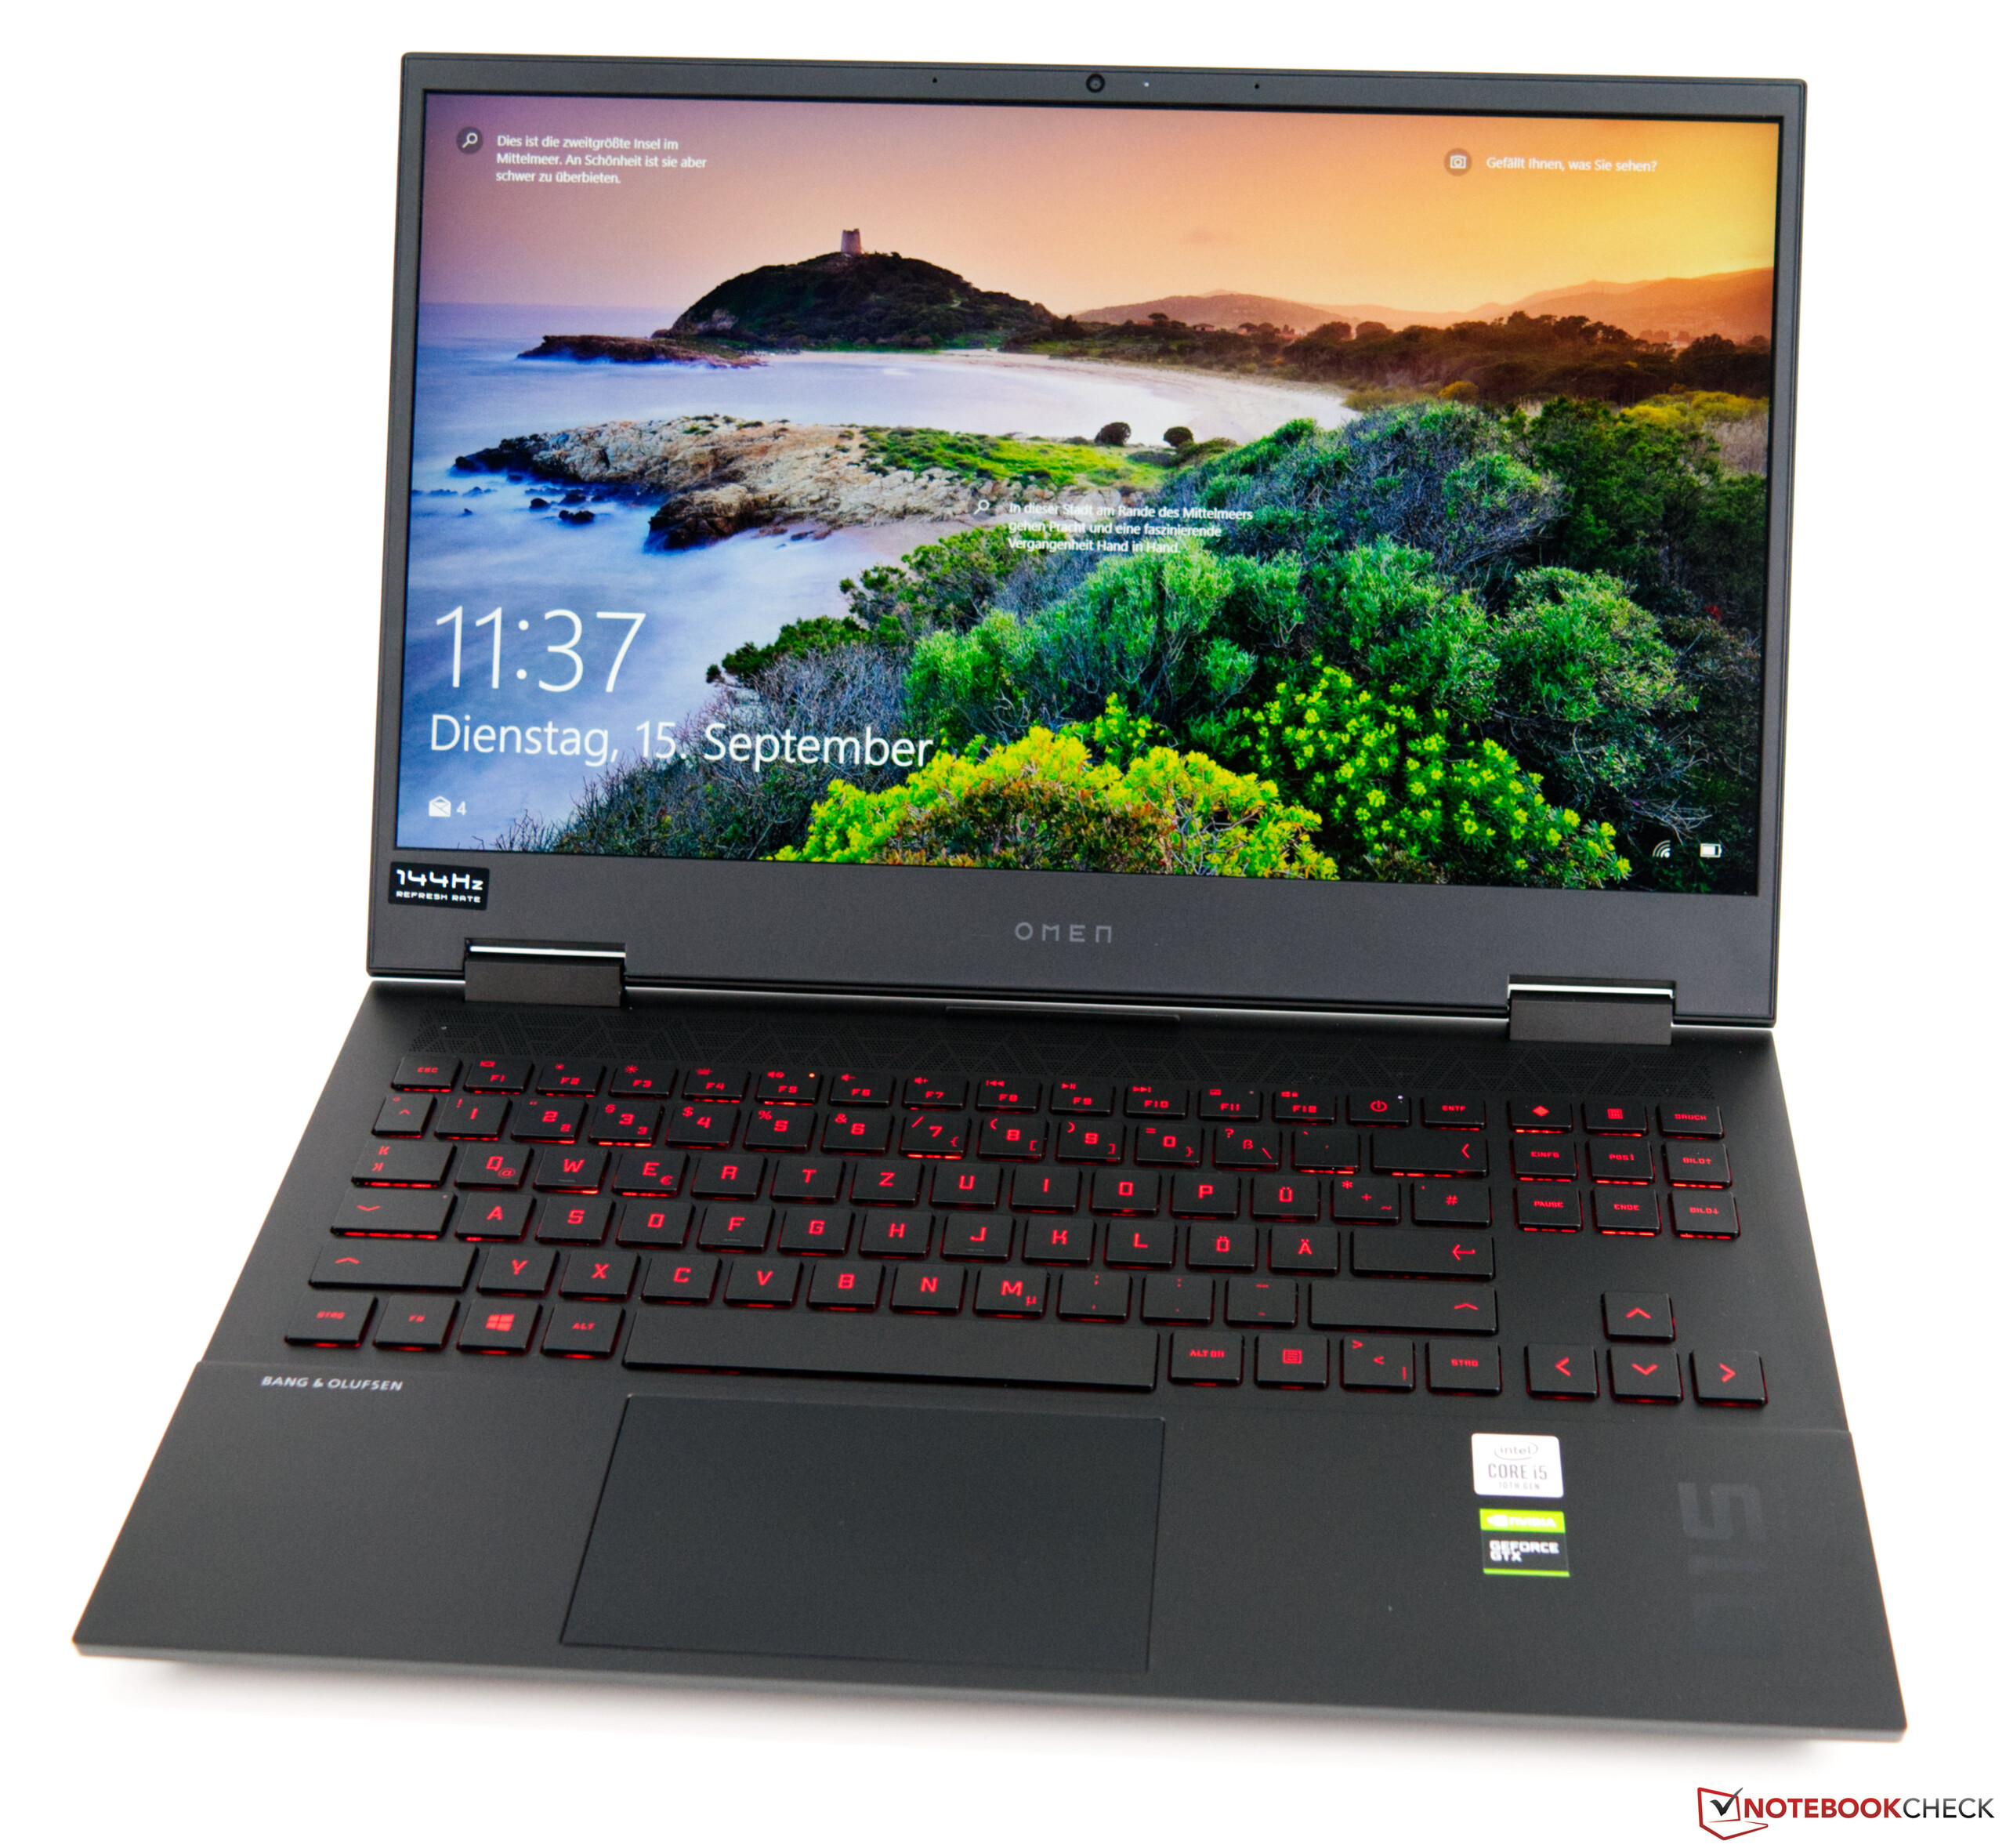
Test du HP Omen 15 (i5-10300H, GTX 1660 Ti, FHD, 144 Hz) : portable de jeu avec une bonne autonomie
Note | Date | Modèle | Poids | Épaisseur | Taille | Résolution | Prix |
|---|---|---|---|---|---|---|---|
| 82.1 % v7 (old) | 10/20 | HP Omen 15-ek0456ng i5-10300H, GeForce GTX 1660 Ti Mobile | 2.1 kg | 32 mm | 15.60" | 1920x1080 | |
| 81.2 % v7 (old) | 10/20 | Asus ROG Zephyrus G15 GA502IU-ES76 R7 4800HS, GeForce GTX 1660 Ti Max-Q | 2.1 kg | 19.9 mm | 15.60" | 1920x1080 | |
| 81.3 % v7 (old) | 02/20 | Schenker XMG Core 15 GK5CP6V i7-9750H, GeForce GTX 1660 Ti Mobile | 2 kg | 26 mm | 15.60" | 1920x1080 | |
| 81.2 % v7 (old) | Nexoc GH5 515IG i5-10300H, GeForce GTX 1650 Mobile | 2.1 kg | 24.9 mm | 15.60" | 1920x1080 | ||
| 79.5 % v7 (old) | 08/20 | MSI Bravo 15 A4DCR R7 4800H, Radeon RX 5300M | 2 kg | 22 mm | 15.60" | 1920x1080 | |
| 81.5 % v7 (old) | 07/19 | HP Omen 15-dc1020ng i5-9300H, GeForce GTX 1650 Mobile | 2.3 kg | 25 mm | 15.60" | 1920x1080 |
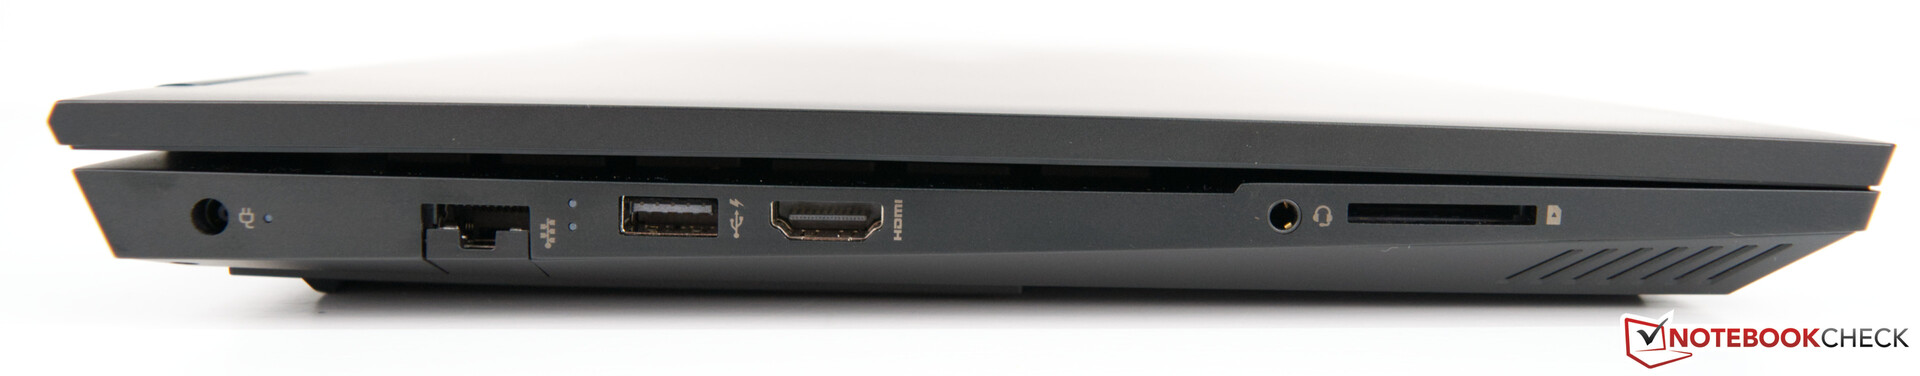
| SD Card Reader | |
| average JPG Copy Test (av. of 3 runs) | |
| Moyenne de la classe Gaming (20.9 - 210, n=54, 2 dernières années) | |
| Nexoc GH5 515IG (Toshiba Exceria Pro SDXC 64 GB UHS-II) | |
| HP Omen 15-dc1020ng (Toshiba Exceria Pro SDXC 64 GB UHS-II) | |
| HP Omen 15-ek0456ng (Toshiba Exceria Pro SDXC 64 GB UHS-II) | |
| Schenker XMG Core 15 GK5CP6V (Toshiba Exceria Pro SDXC 64 GB UHS-II) | |
| maximum AS SSD Seq Read Test (1GB) | |
| Moyenne de la classe Gaming (25.5 - 261, n=51, 2 dernières années) | |
| HP Omen 15-dc1020ng (Toshiba Exceria Pro SDXC 64 GB UHS-II) | |
| Nexoc GH5 515IG (Toshiba Exceria Pro SDXC 64 GB UHS-II) | |
| HP Omen 15-ek0456ng (Toshiba Exceria Pro SDXC 64 GB UHS-II) | |
| Schenker XMG Core 15 GK5CP6V (Toshiba Exceria Pro SDXC 64 GB UHS-II) | |
| Networking | |
| iperf3 transmit AX12 | |
| Nexoc GH5 515IG | |
| MSI Bravo 15 A4DCR | |
| Moyenne Intel Wi-Fi 6 AX201 (49.8 - 1775, n=324) | |
| Schenker XMG Core 15 GK5CP6V | |
| Asus ROG Zephyrus G15 GA502IU-ES76 | |
| HP Omen 15-dc1020ng | |
| HP Omen 15-ek0456ng | |
| iperf3 receive AX12 | |
| Nexoc GH5 515IG | |
| Schenker XMG Core 15 GK5CP6V | |
| MSI Bravo 15 A4DCR | |
| Moyenne Intel Wi-Fi 6 AX201 (136 - 1743, n=324) | |
| Asus ROG Zephyrus G15 GA502IU-ES76 | |
| HP Omen 15-ek0456ng | |
| HP Omen 15-dc1020ng | |


| |||||||||||||||||||||||||
Homogénéité de la luminosité: 87 %
Valeur mesurée au centre, sur batterie: 269 cd/m²
Contraste: 1427:1 (Valeurs des noirs: 0.22 cd/m²)
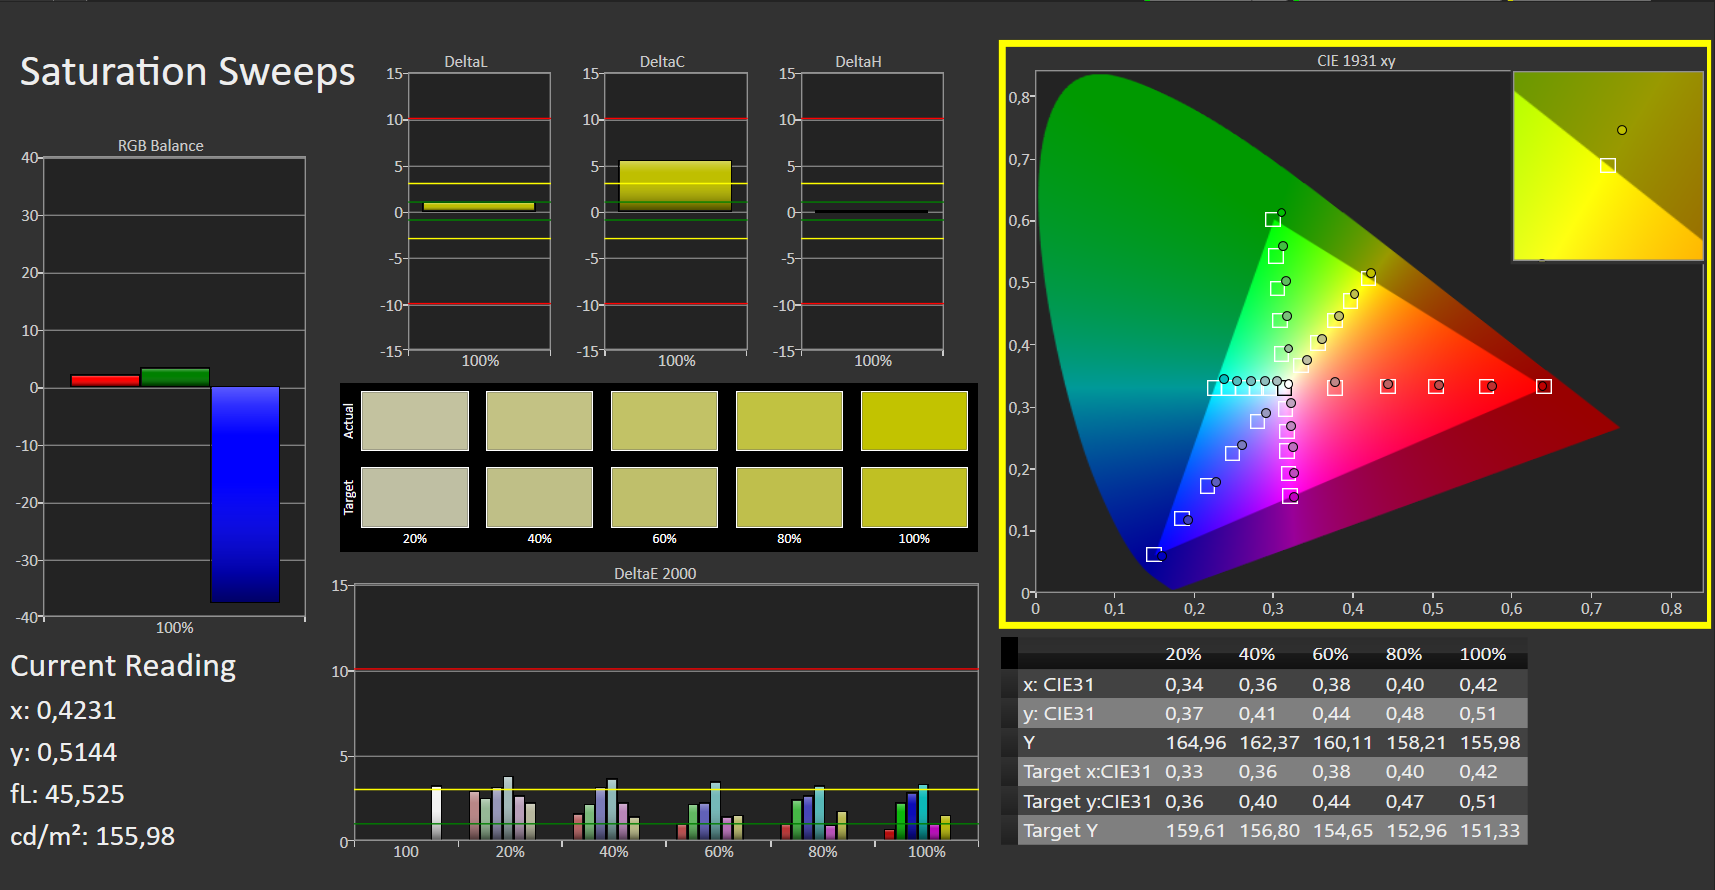
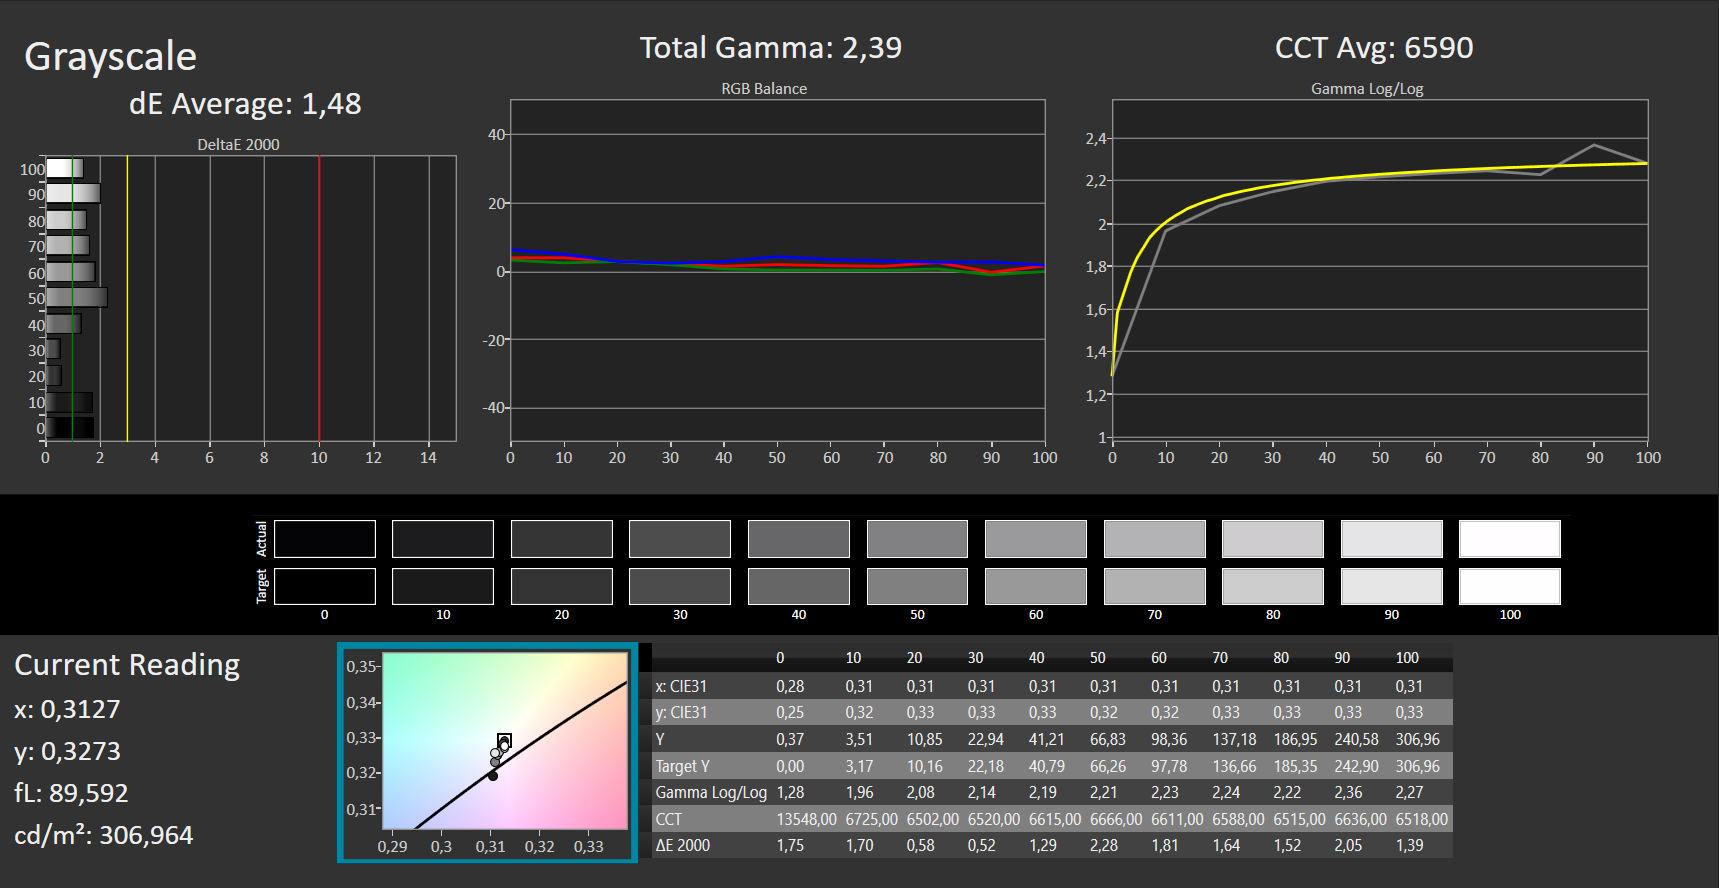
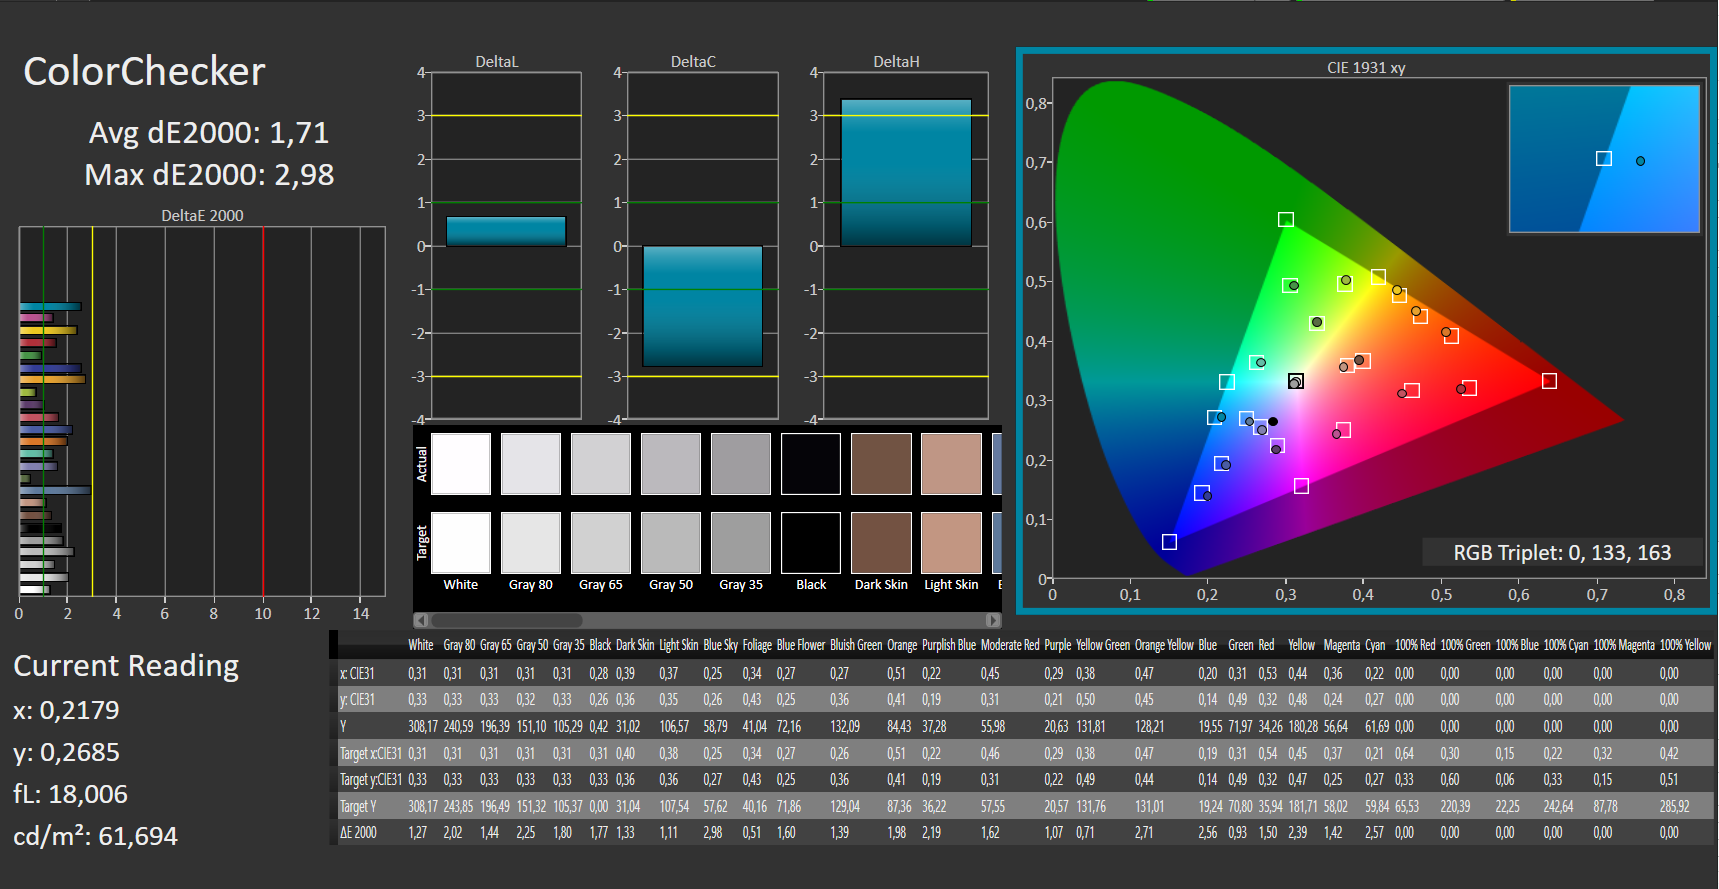
ΔE ColorChecker Calman: 2.51 | ∀{0.5-29.43 Ø4.73}
calibrated: 1.71
ΔE Greyscale Calman: 3.26 | ∀{0.09-98 Ø4.97}
Gamma: 2.42
CCT: 6150 K
| HP Omen 15-ek0456ng LGD05FE, IPS, 1920x1080, 15.6" | Asus ROG Zephyrus G15 GA502IU-ES76 Panda LM156LF-2F01, IPS, 1920x1080, 15.6" | Schenker XMG Core 15 GK5CP6V BOEhydis NV156FHM-N4G (BOE084D), IPS, 1920x1080, 15.6" | Nexoc GH5 515IG LG Philips LP156WFC-SPD1, IPS, 1920x1080, 15.6" | MSI Bravo 15 A4DCR AU Optronics B156HAN08.0 (AUO80ED), IPS-Level, 1920x1080, 15.6" | HP Omen 15-dc1020ng LGD05CE, IPS, 1920x1080, 15.6" | |
|---|---|---|---|---|---|---|
| Display | ||||||
| Display P3 Coverage (%) | 38.9 | 63.3 | 37.91 | 62 | 38.37 | |
| sRGB Coverage (%) | 58.5 | 91.2 | 57 | 86.8 | 57.6 | |
| AdobeRGB 1998 Coverage (%) | 40.22 | 65 | 39.19 | 62.7 | 39.69 | |
| Response Times | -89% | 27% | -117% | 6% | -152% | |
| Response Time Grey 50% / Grey 80% * (ms) | 17 ? | 24.4 ? -44% | 8.8 ? 48% | 34.8 ? -105% | 16 ? 6% | 40 ? -135% |
| Response Time Black / White * (ms) | 11 ? | 25.6 ? -133% | 10.4 ? 5% | 25.2 ? -129% | 10.4 ? 5% | 29.6 ? -169% |
| PWM Frequency (Hz) | ||||||
| Screen | -73% | -17% | -34% | -39% | -78% | |
| Brightness middle (cd/m²) | 314 | 255.9 -19% | 324 3% | 261 -17% | 311 -1% | 251 -20% |
| Brightness (cd/m²) | 293 | 246 -16% | 296 1% | 254 -13% | 313 7% | 232 -21% |
| Brightness Distribution (%) | 87 | 89 2% | 88 1% | 93 7% | 88 1% | 76 -13% |
| Black Level * (cd/m²) | 0.22 | 0.22 -0% | 0.27 -23% | 0.23 -5% | 0.43 -95% | 0.17 23% |
| Contrast (:1) | 1427 | 1163 -19% | 1200 -16% | 1135 -20% | 723 -49% | 1476 3% |
| Colorchecker dE 2000 * | 2.51 | 5.15 -105% | 4.07 -62% | 4.71 -88% | 4.5 -79% | 6.2 -147% |
| Colorchecker dE 2000 max. * | 4.42 | 17.11 -287% | 6.39 -45% | 7.6 -72% | 7.97 -80% | 18.6 -321% |
| Colorchecker dE 2000 calibrated * | 1.71 | 4.83 -182% | 1.49 13% | 3.67 -115% | 2.65 -55% | 4.8 -181% |
| Greyscale dE 2000 * | 3.26 | 4.2 -29% | 4.01 -23% | 2.76 15% | 3.3 -1% | 4.2 -29% |
| Gamma | 2.42 91% | 2.16 102% | 2.6 85% | 2.42 91% | 2.129 103% | 2.32 95% |
| CCT | 6150 106% | 7500 87% | 7350 88% | 7090 92% | 7227 90% | 7454 87% |
| Color Space (Percent of AdobeRGB 1998) (%) | 36.9 | 59 | 36 | 63 | 36.5 | |
| Color Space (Percent of sRGB) (%) | 58 | 91 | 56 | 86 | 57.4 | |
| Moyenne finale (programmes/paramètres) | -81% /
-76% | 5% /
-9% | -76% /
-49% | -17% /
-31% | -115% /
-92% |
* ... Moindre est la valeur, meilleures sont les performances


Temps de réponse de l'écran
| ↔ Temps de réponse noir à blanc | ||
|---|---|---|
| 11 ms ... hausse ↗ et chute ↘ combinées | ↗ 7 ms hausse | 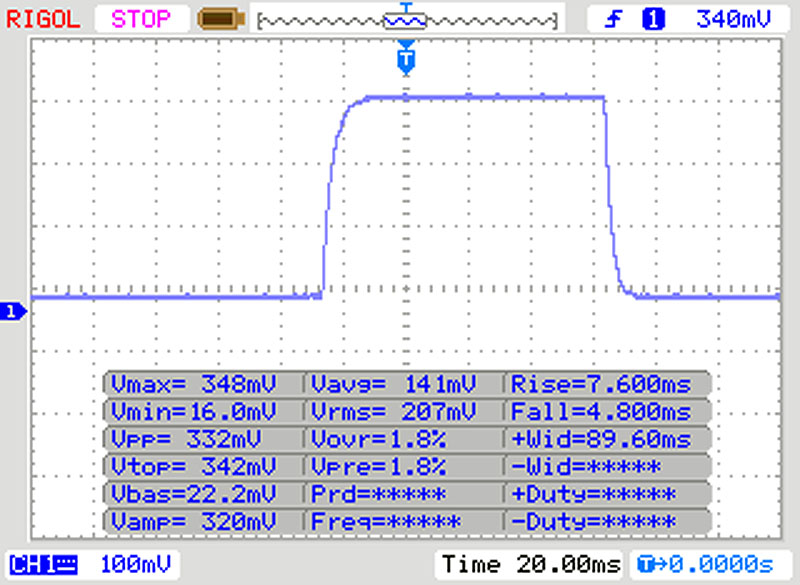 |
| ↘ 4 ms chute | ||
| L'écran montre de bons temps de réponse, mais insuffisant pour du jeu compétitif. En comparaison, tous les appareils testés affichent entre 0.1 (minimum) et 240 (maximum) ms. » 29 % des appareils testés affichent de meilleures performances. Cela signifie que les latences relevées sont meilleures que la moyenne (19.9 ms) de tous les appareils testés. | ||
| ↔ Temps de réponse gris 50% à gris 80% | ||
| 17 ms ... hausse ↗ et chute ↘ combinées | ↗ 9 ms hausse | 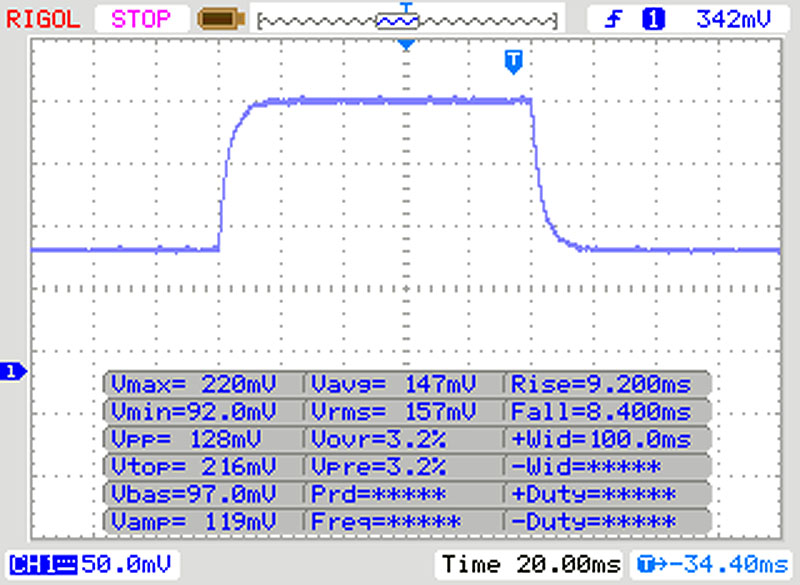 |
| ↘ 8 ms chute | ||
| L'écran montre de bons temps de réponse, mais insuffisant pour du jeu compétitif. En comparaison, tous les appareils testés affichent entre 0.165 (minimum) et 636 (maximum) ms. » 31 % des appareils testés affichent de meilleures performances. Cela signifie que les latences relevées sont meilleures que la moyenne (31.1 ms) de tous les appareils testés. | ||
Scintillement / MLI (Modulation de largeur d'impulsion)
| Scintillement / MLI (Modulation de largeur d'impulsion) non décelé | 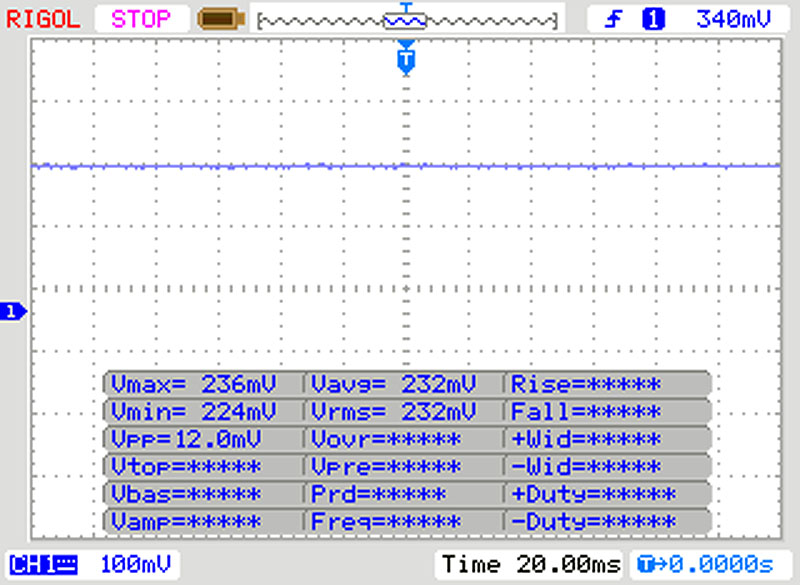 | ||
En comparaison, 52 % des appareils testés n'emploient pas MDI pour assombrir leur écran. Nous avons relevé une moyenne à 7791 (minimum : 5 - maximum : 343500) Hz dans le cas où une MDI était active. | |||
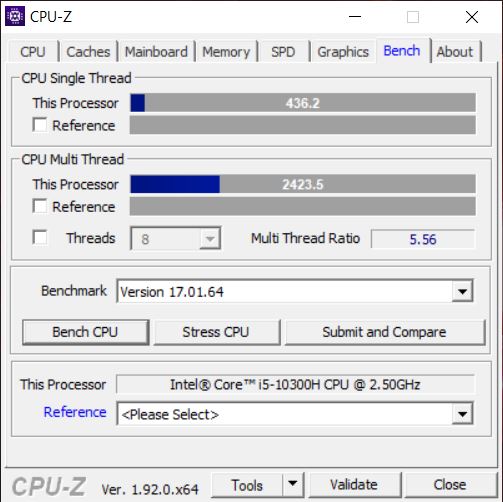

Cinebench R15: CPU Single 64Bit | CPU Multi 64Bit
Blender: v2.79 BMW27 CPU
7-Zip 18.03: 7z b 4 -mmt1 | 7z b 4
Geekbench 5.5: Single-Core | Multi-Core
HWBOT x265 Benchmark v2.2: 4k Preset
LibreOffice : 20 Documents To PDF
R Benchmark 2.5: Overall mean
| Cinebench R20 / CPU (Single Core) | |
| Moyenne de la classe Gaming (442 - 895, n=109, 2 dernières années) | |
| Asus ROG Zephyrus G15 GA502IU-ES76 | |
| MSI Bravo 15 A4DCR | |
| Nexoc GH5 515IG | |
| HP Omen 15-ek0456ng | |
| Schenker XMG Core 15 GK5CP6V | |
| Moyenne Intel Core i5-10300H (312 - 470, n=15) | |
| HP Omen 15-dc1020ng | |
| Cinebench R20 / CPU (Multi Core) | |
| Moyenne de la classe Gaming (4029 - 16108, n=109, 2 dernières années) | |
| MSI Bravo 15 A4DCR | |
| Asus ROG Zephyrus G15 GA502IU-ES76 | |
| HP Omen 15-ek0456ng | |
| Schenker XMG Core 15 GK5CP6V | |
| Moyenne Intel Core i5-10300H (1397 - 2240, n=15) | |
| Nexoc GH5 515IG | |
| HP Omen 15-dc1020ng | |
| Cinebench R15 / CPU Single 64Bit | |
| Moyenne de la classe Gaming (188.8 - 343, n=109, 2 dernières années) | |
| Schenker XMG Core 15 GK5CP6V | |
| HP Omen 15-ek0456ng | |
| MSI Bravo 15 A4DCR | |
| Nexoc GH5 515IG | |
| Asus ROG Zephyrus G15 GA502IU-ES76 | |
| Moyenne Intel Core i5-10300H (108 - 194, n=17) | |
| HP Omen 15-dc1020ng | |
| Cinebench R15 / CPU Multi 64Bit | |
| Moyenne de la classe Gaming (1578 - 6271, n=109, 2 dernières années) | |
| MSI Bravo 15 A4DCR | |
| Asus ROG Zephyrus G15 GA502IU-ES76 | |
| Schenker XMG Core 15 GK5CP6V | |
| HP Omen 15-ek0456ng | |
| Nexoc GH5 515IG | |
| Moyenne Intel Core i5-10300H (536 - 921, n=17) | |
| HP Omen 15-dc1020ng | |
| Blender / v2.79 BMW27 CPU | |
| HP Omen 15-dc1020ng | |
| Nexoc GH5 515IG | |
| Moyenne Intel Core i5-10300H (479 - 555, n=14) | |
| HP Omen 15-ek0456ng | |
| Schenker XMG Core 15 GK5CP6V | |
| MSI Bravo 15 A4DCR | |
| Asus ROG Zephyrus G15 GA502IU-ES76 | |
| Moyenne de la classe Gaming (80 - 330, n=107, 2 dernières années) | |
| 7-Zip 18.03 / 7z b 4 -mmt1 | |
| Moyenne de la classe Gaming (4199 - 7436, n=108, 2 dernières années) | |
| HP Omen 15-ek0456ng | |
| Nexoc GH5 515IG | |
| Schenker XMG Core 15 GK5CP6V | |
| Moyenne Intel Core i5-10300H (2945 - 4956, n=14) | |
| Asus ROG Zephyrus G15 GA502IU-ES76 | |
| HP Omen 15-dc1020ng | |
| MSI Bravo 15 A4DCR | |
| 7-Zip 18.03 / 7z b 4 | |
| Moyenne de la classe Gaming (33491 - 148086, n=108, 2 dernières années) | |
| Asus ROG Zephyrus G15 GA502IU-ES76 | |
| MSI Bravo 15 A4DCR | |
| Schenker XMG Core 15 GK5CP6V | |
| HP Omen 15-ek0456ng | |
| Moyenne Intel Core i5-10300H (15146 - 24841, n=14) | |
| Nexoc GH5 515IG | |
| HP Omen 15-dc1020ng | |
| Geekbench 5.5 / Single-Core | |
| Moyenne de la classe Gaming (986 - 2474, n=108, 2 dernières années) | |
| HP Omen 15-ek0456ng | |
| HP Omen 15-ek0456ng | |
| Nexoc GH5 515IG | |
| Asus ROG Zephyrus G15 GA502IU-ES76 | |
| Moyenne Intel Core i5-10300H (703 - 1241, n=16) | |
| Schenker XMG Core 15 GK5CP6V | |
| MSI Bravo 15 A4DCR | |
| Geekbench 5.5 / Multi-Core | |
| Moyenne de la classe Gaming (6460 - 27010, n=108, 2 dernières années) | |
| Asus ROG Zephyrus G15 GA502IU-ES76 | |
| MSI Bravo 15 A4DCR | |
| Schenker XMG Core 15 GK5CP6V | |
| Nexoc GH5 515IG | |
| HP Omen 15-ek0456ng | |
| HP Omen 15-ek0456ng | |
| Moyenne Intel Core i5-10300H (2783 - 4728, n=16) | |
| HWBOT x265 Benchmark v2.2 / 4k Preset | |
| Moyenne de la classe Gaming (11.5 - 44.3, n=108, 2 dernières années) | |
| Asus ROG Zephyrus G15 GA502IU-ES76 | |
| MSI Bravo 15 A4DCR | |
| Schenker XMG Core 15 GK5CP6V | |
| HP Omen 15-ek0456ng | |
| Moyenne Intel Core i5-10300H (6.13 - 7.78, n=14) | |
| Nexoc GH5 515IG | |
| HP Omen 15-dc1020ng | |
| LibreOffice / 20 Documents To PDF | |
| MSI Bravo 15 A4DCR | |
| Moyenne Intel Core i5-10300H (23.9 - 94, n=14) | |
| Nexoc GH5 515IG | |
| Asus ROG Zephyrus G15 GA502IU-ES76 | |
| Moyenne de la classe Gaming (19 - 88.8, n=108, 2 dernières années) | |
| HP Omen 15-ek0456ng | |
| R Benchmark 2.5 / Overall mean | |
| Moyenne Intel Core i5-10300H (0.625 - 1.088, n=14) | |
| Schenker XMG Core 15 GK5CP6V | |
| HP Omen 15-ek0456ng | |
| Nexoc GH5 515IG | |
| MSI Bravo 15 A4DCR | |
| Asus ROG Zephyrus G15 GA502IU-ES76 | |
| Moyenne de la classe Gaming (0.3439 - 0.759, n=109, 2 dernières années) | |
* ... Moindre est la valeur, meilleures sont les performances
| PCMark 8 | |
| Home Score Accelerated v2 | |
| Moyenne de la classe Gaming (n=12 dernières années) | |
| Asus ROG Zephyrus G15 GA502IU-ES76 | |
| HP Omen 15-ek0456ng | |
| Moyenne Intel Core i5-10300H, NVIDIA GeForce GTX 1660 Ti Mobile (n=1) | |
| Nexoc GH5 515IG | |
| HP Omen 15-dc1020ng | |
| Work Score Accelerated v2 | |
| Asus ROG Zephyrus G15 GA502IU-ES76 | |
| HP Omen 15-ek0456ng | |
| Moyenne Intel Core i5-10300H, NVIDIA GeForce GTX 1660 Ti Mobile (n=1) | |
| Nexoc GH5 515IG | |
| HP Omen 15-dc1020ng | |
| Moyenne de la classe Gaming (n=12 dernières années) | |
| PCMark 8 Home Score Accelerated v2 | 4853 points | |
| PCMark 8 Creative Score Accelerated v2 | 7696 points | |
| PCMark 8 Work Score Accelerated v2 | 5507 points | |
| PCMark 10 Score | 5127 points | |
Aide | ||
| DPC Latencies / LatencyMon - interrupt to process latency (max), Web, Youtube, Prime95 | |
| HP Omen 15-ek0456ng | |
* ... Moindre est la valeur, meilleures sont les performances
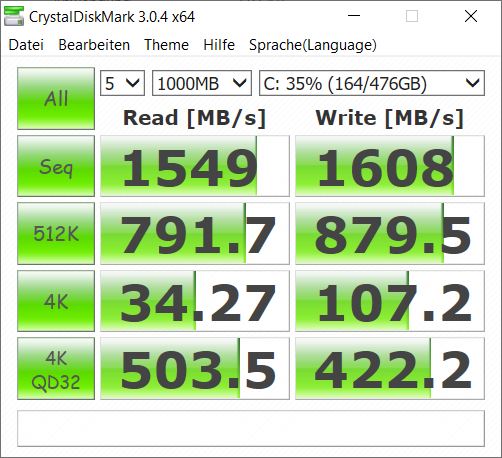
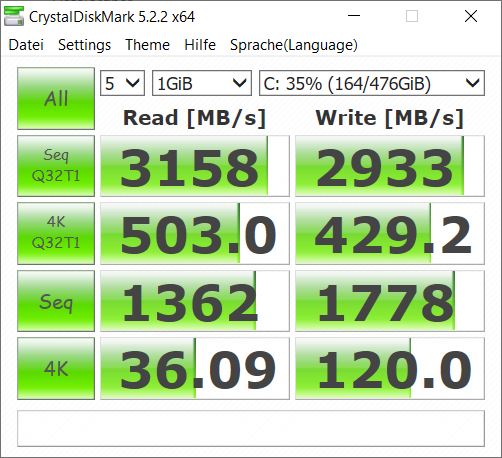
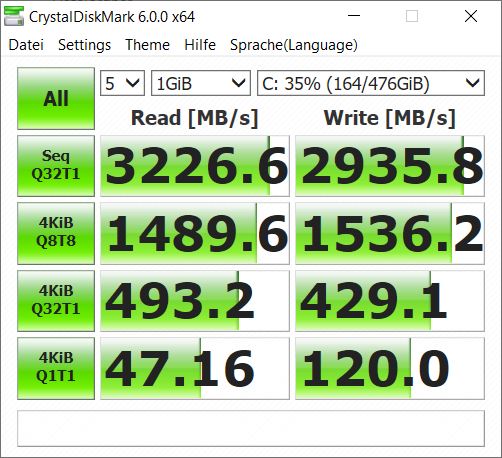
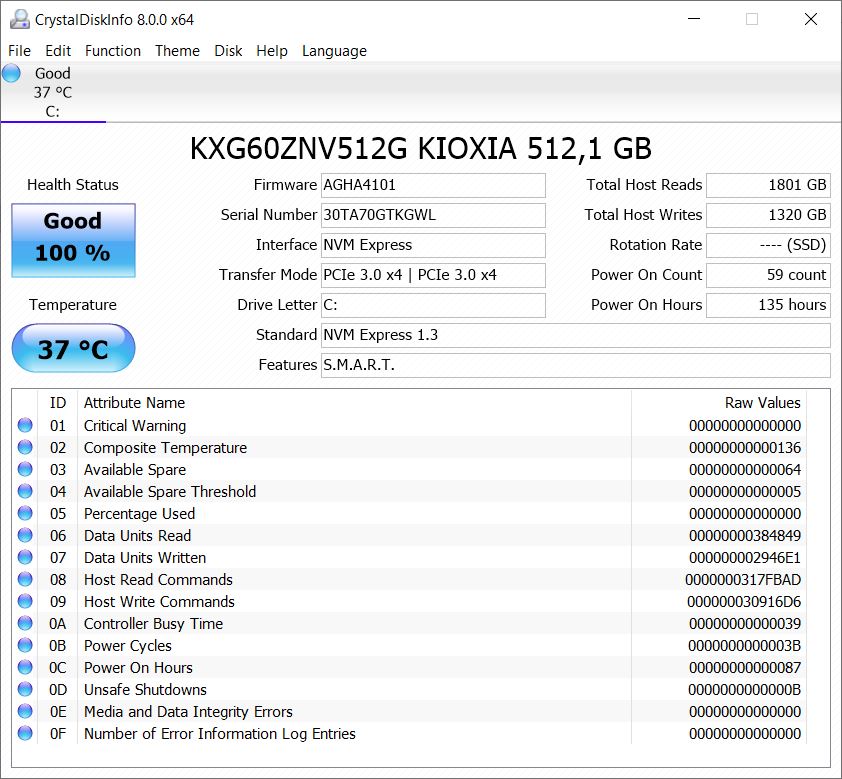
| HP Omen 15-ek0456ng Toshiba XG6 KXG60ZNV512G | Asus ROG Zephyrus G15 GA502IU-ES76 Intel SSD 660p 1TB SSDPEKNW010T8 | Schenker XMG Core 15 GK5CP6V Samsung SSD 970 EVO Plus 500GB | Nexoc GH5 515IG Samsung SSD 860 Evo 512GB | MSI Bravo 15 A4DCR Samsung PM981a MZVLB1T0HBLR | HP Omen 15-dc1020ng WDC PC SN720 SDAQNTW-512G | Moyenne Toshiba XG6 KXG60ZNV512G | |
|---|---|---|---|---|---|---|---|
| CrystalDiskMark 5.2 / 6 | 10% | -3% | -46% | 21% | 3% | -10% | |
| Write 4K (MB/s) | 120 | 189.6 58% | 102 -15% | 89.6 -25% | 118.3 -1% | 112.1 -7% | 112.8 ? -6% |
| Read 4K (MB/s) | 36.09 | 61.7 71% | 41.39 15% | 40.88 13% | 43.73 21% | 42.01 16% | 42.7 ? 18% |
| Write Seq (MB/s) | 1778 | 1730 -3% | 1649 -7% | 518 -71% | 2854 61% | 1964 10% | 1489 ? -16% |
| Read Seq (MB/s) | 1362 | 1620 19% | 1367 0% | 539 -60% | 2302 69% | 2065 52% | 1771 ? 30% |
| Write 4K Q32T1 (MB/s) | 429.1 | 474.2 11% | 379 -12% | 304 -29% | 418.5 -2% | 318.2 -26% | 345 ? -20% |
| Read 4K Q32T1 (MB/s) | 493.2 | 528 7% | 401.2 -19% | 329 -33% | 517 5% | 406.7 -18% | 359 ? -27% |
| Write Seq Q32T1 (MB/s) | 2936 | 1795 -39% | 3276 12% | 529 -82% | 3008 2% | 2534 -14% | 2257 ? -23% |
| Read Seq Q32T1 (MB/s) | 3227 | 1880 -42% | 3417 6% | 561 -83% | 3568 11% | 3438 7% | 2926 ? -9% |
| Write 4K Q8T8 (MB/s) | 1536 | 1080 ? -30% | |||||
| Read 4K Q8T8 (MB/s) | 1490 | 1232 ? -17% | |||||
| AS SSD | -37% | 19% | -54% | 30% | -4% | -16% | |
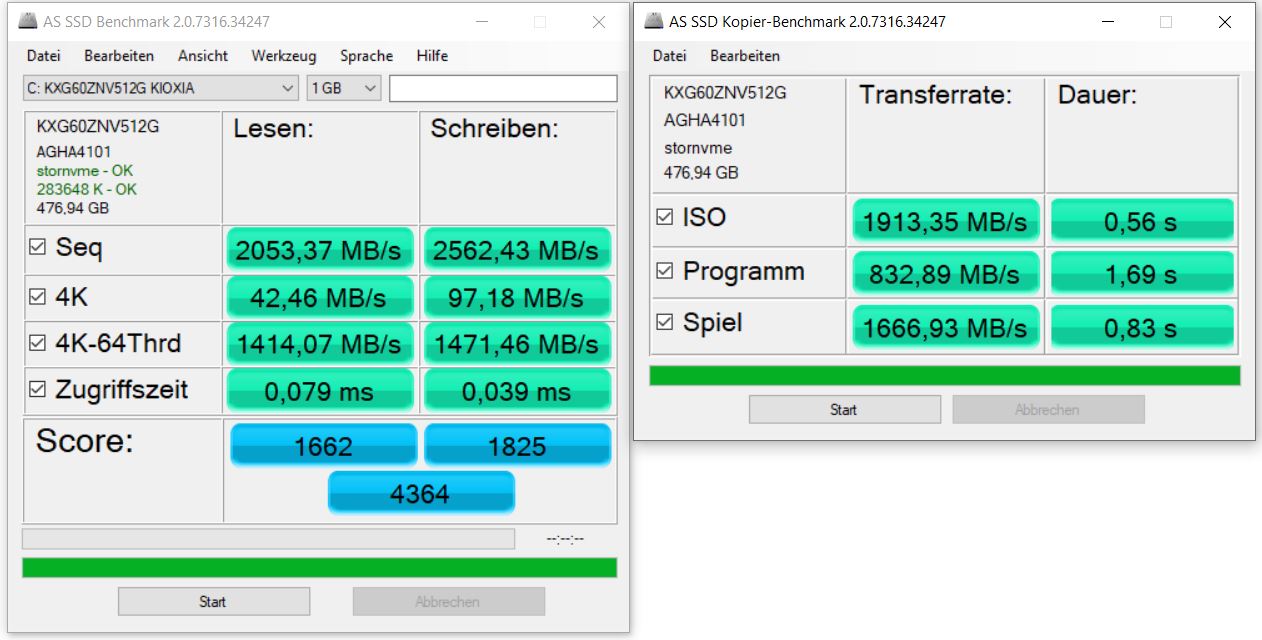
| Seq Read (MB/s) | 2053 | 1197 -42% | 2261 10% | 524 -74% | 2730 33% | 2955 44% | 2456 ? 20% |
| Seq Write (MB/s) | 2562 | 1637 -36% | 2393 -7% | 495 -81% | 2513 -2% | 2440 -5% | 1493 ? -42% |
| 4K Read (MB/s) | 42.46 | 56.3 33% | 54.6 29% | 38.93 -8% | 61.4 45% | 40.56 -4% | 44.1 ? 4% |
| 4K Write (MB/s) | 97.2 | 159 64% | 118.4 22% | 87.3 -10% | 156.1 61% | 118.6 22% | 119.3 ? 23% |
| 4K-64 Read (MB/s) | 1414 | 583 -59% | 1376 -3% | 380 -73% | 1780 26% | 1283 -9% | 980 ? -31% |
| 4K-64 Write (MB/s) | 1471 | 838 -43% | 2299 56% | 335.7 -77% | 1920 31% | 1538 5% | 1180 ? -20% |
| Access Time Read * (ms) | 0.079 | 0.062 22% | 0.07 11% | 0.073 8% | 0.063 20% | 0.084 -6% | 0.08057 ? -2% |
| Access Time Write * (ms) | 0.039 | 0.128 -228% | 0.031 21% | 0.039 -0% | 0.025 36% | 0.032 18% | 0.055 ? -41% |
| Score Read (Points) | 1662 | 759 -54% | 1657 0% | 471 -72% | 2114 27% | 1619 -3% | 1269 ? -24% |
| Score Write (Points) | 1825 | 1160 -36% | 2657 46% | 472 -74% | 2327 28% | 1901 4% | 1449 ? -21% |
| Score Total (Points) | 4364 | 2350 -46% | 5175 19% | 1198 -73% | 5518 26% | 4323 -1% | 3326 ? -24% |
| Copy ISO MB/s (MB/s) | 1913 | 1376 -28% | 500 -74% | 1418 -26% | 1894 ? -1% | ||
| Copy Program MB/s (MB/s) | 833 | 568 -32% | 283.8 -66% | 392.5 -53% | 552 ? -34% | ||
| Copy Game MB/s (MB/s) | 1667 | 1180 -29% | 319.6 -81% | 907 -46% | 1187 ? -29% | ||
| Moyenne finale (programmes/paramètres) | -14% /
-20% | 8% /
10% | -50% /
-51% | 26% /
26% | -1% /
-2% | -13% /
-13% |
* ... Moindre est la valeur, meilleures sont les performances

Continuous load read: DiskSpd Read Loop, Queue Depth 8
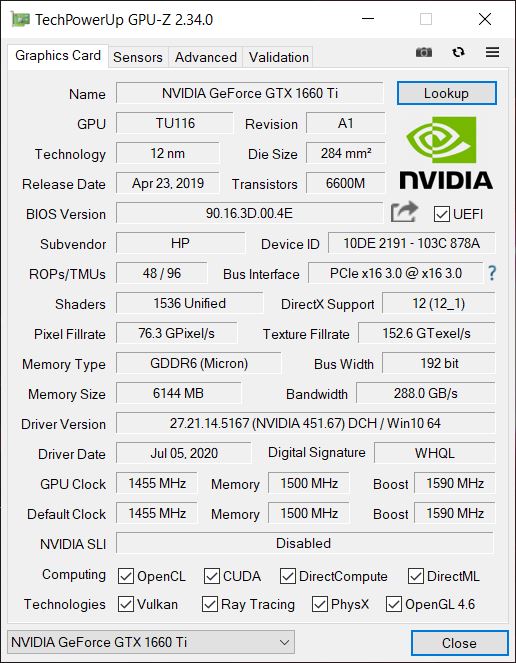
| 3DMark 11 Performance | 16523 points | |
| 3DMark Ice Storm Standard Score | 119496 points | |
| 3DMark Cloud Gate Standard Score | 31686 points | |
| 3DMark Fire Strike Score | 12767 points | |
| 3DMark Fire Strike Extreme Score | 6478 points | |
| 3DMark Time Spy Score | 4946 points | |
Aide | ||
| Bas | Moyen | Élevé | Ultra | |
|---|---|---|---|---|
| BioShock Infinite (2013) | 309.5 | 277.4 | 258.1 | 137 |
| GTA V (2015) | 164 | 133 | 71.8 | |
| The Witcher 3 (2015) | 256 | 179 | 104 | 54.2 |
| Dota 2 Reborn (2015) | 143.5 | 126.8 | 119 | 113.6 |
| Rise of the Tomb Raider (2016) | 232 | 166 | 97.8 | 87.4 |
| Final Fantasy XV Benchmark (2018) | 133 | 81.4 | 59.9 | |
| X-Plane 11.11 (2018) | 85.7 | 77.8 | 67.1 | |
| Far Cry 5 (2018) | 124 | 97 | 90 | 85 |
| Strange Brigade (2018) | 292 | 144 | 114 | 97.4 |
| Far Cry New Dawn (2019) | 106 | 88 | 85 | 76 |
| Metro Exodus (2019) | 129 | 72.5 | 54.9 | 43.1 |
Degré de la nuisance sonore
| Au repos |
| 32.4 / 32.4 / 32.4 dB(A) |
| Fortement sollicité |
| 32.5 / 51.9 dB(A) |
 | ||
30 dB silencieux 40 dB(A) audible 50 dB(A) bruyant |
||
min: | ||
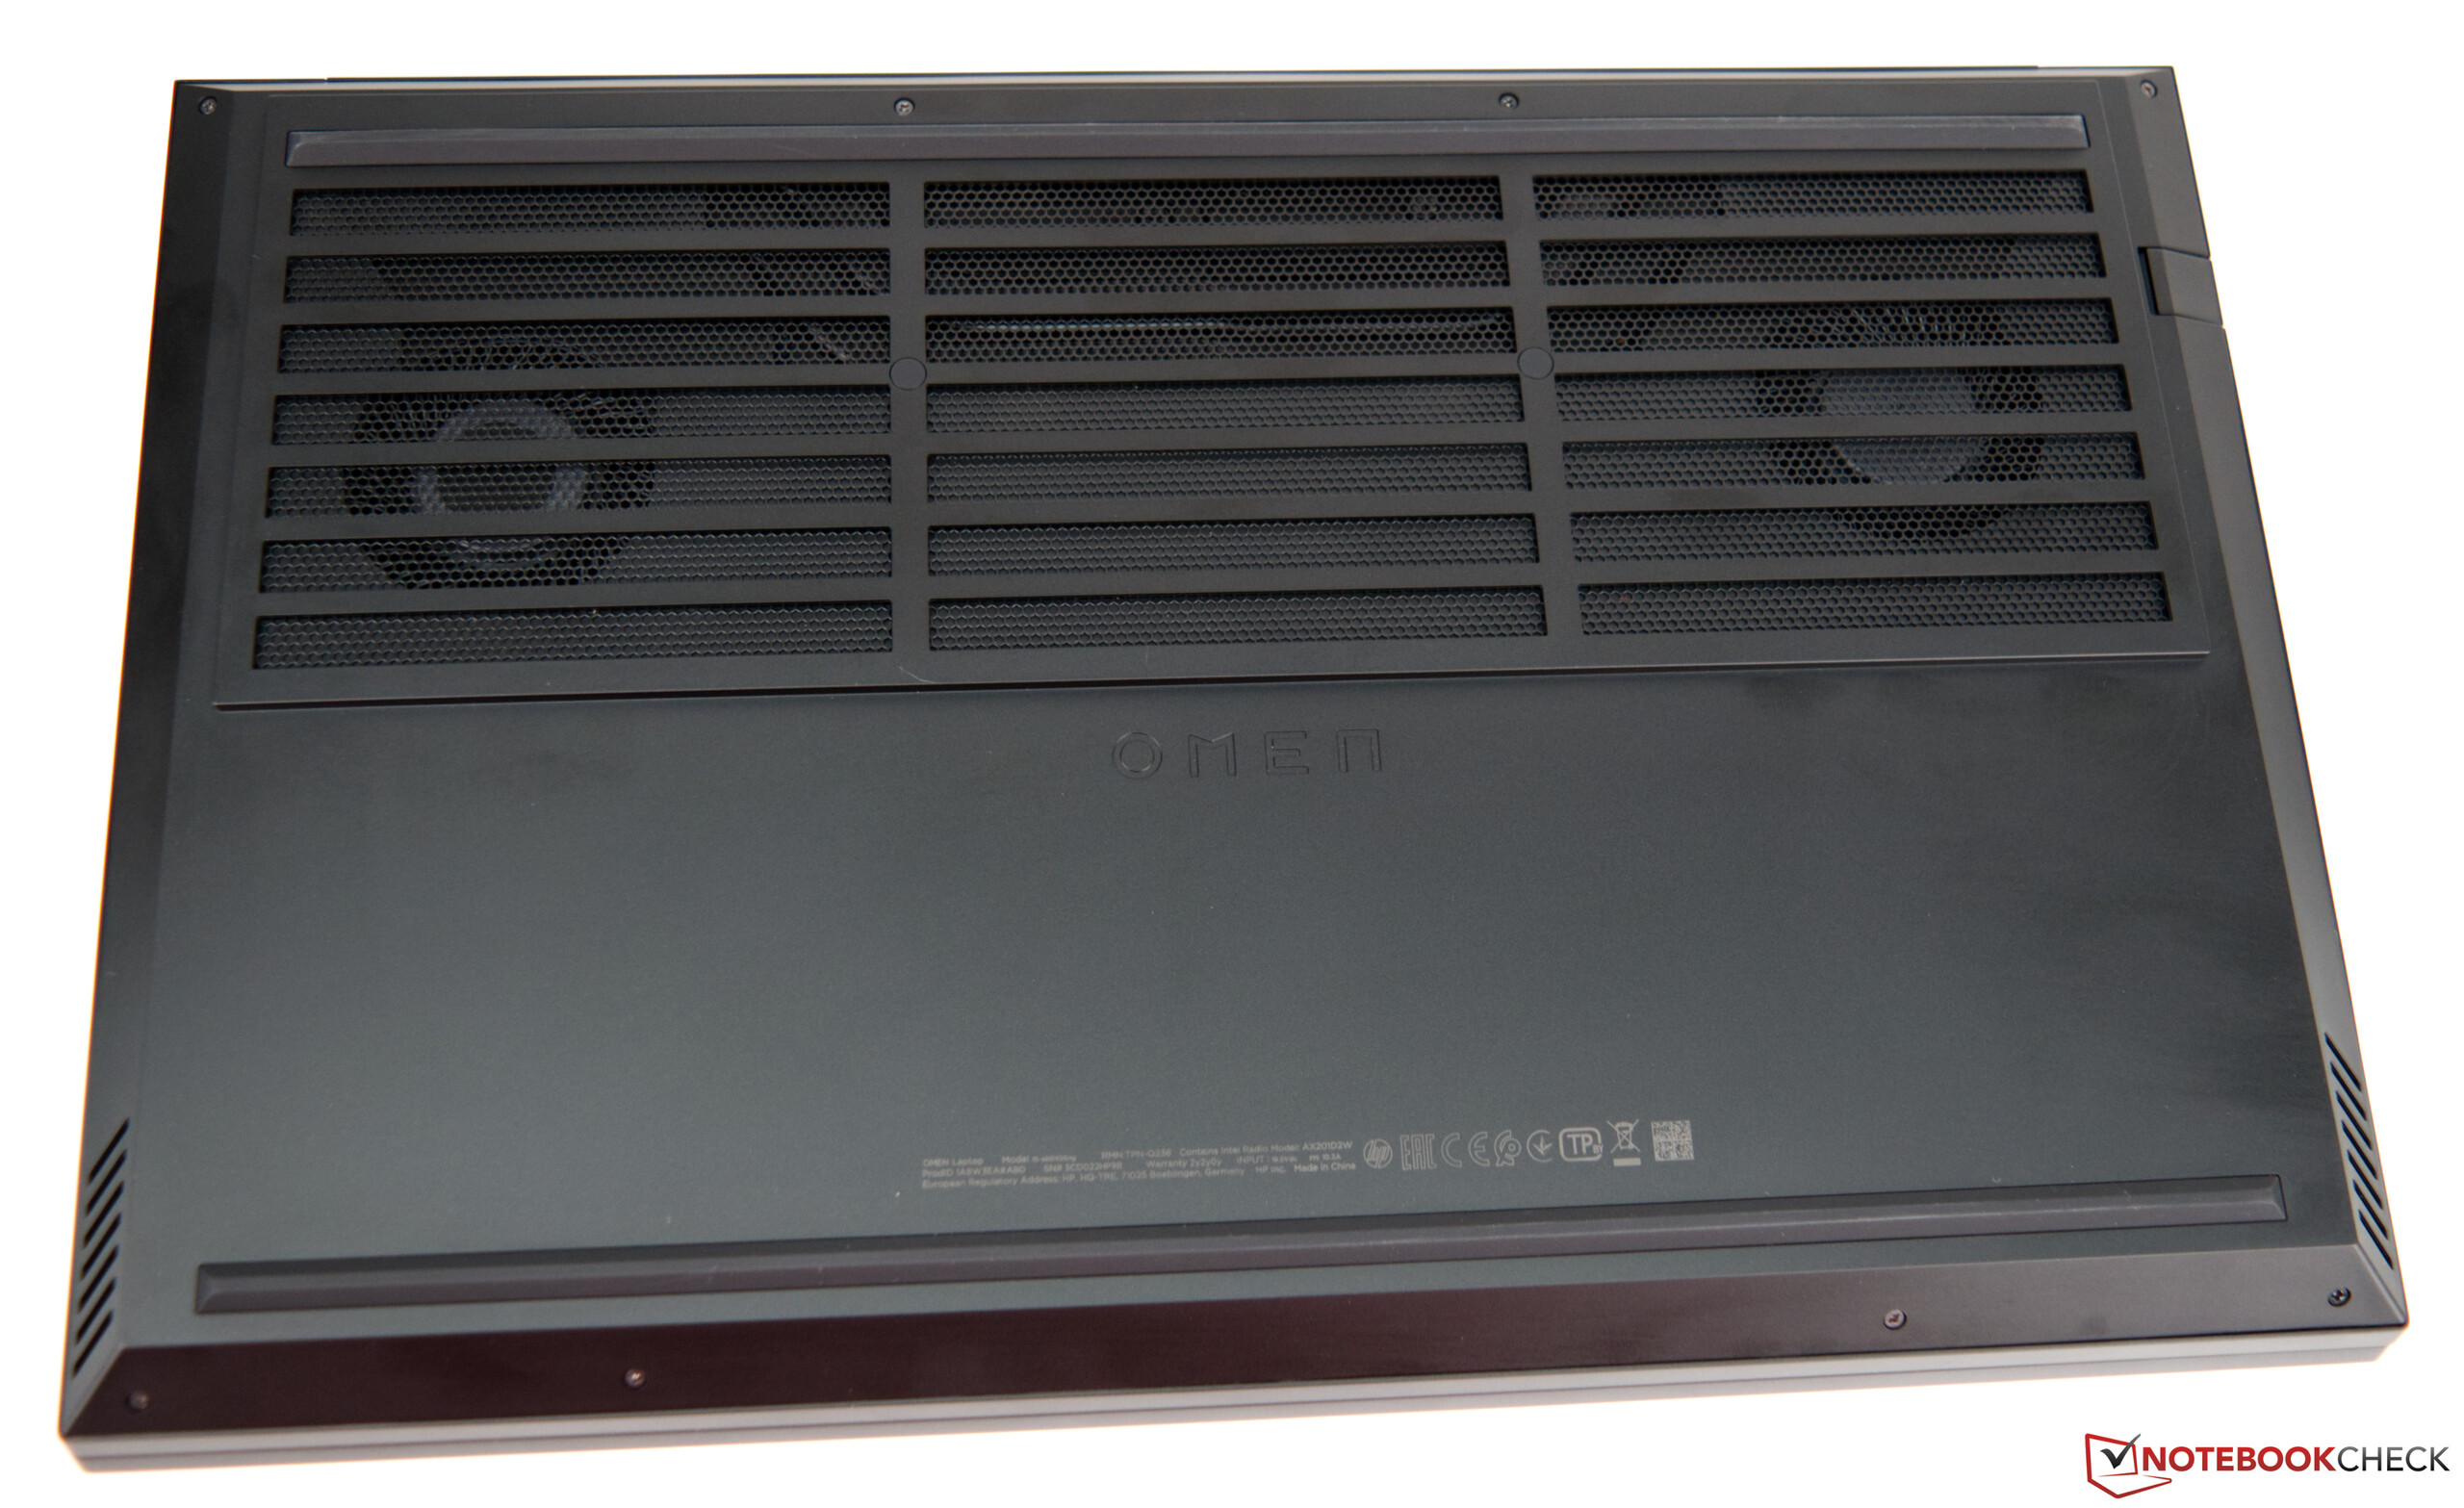
(±) La température maximale du côté supérieur est de 40.2 °C / 104 F, par rapport à la moyenne de 40.4 °C / 105 F, allant de 21.2 à 68.8 °C pour la classe Gaming.
(-) Le fond chauffe jusqu'à un maximum de 48.4 °C / 119 F, contre une moyenne de 43.2 °C / 110 F
(+) En utilisation inactive, la température moyenne du côté supérieur est de 24.8 °C / 77 F, par rapport à la moyenne du dispositif de 33.9 °C / 93 F.
(±) En jouant à The Witcher 3, la température moyenne du côté supérieur est de 32 °C / 90 F, alors que la moyenne de l'appareil est de 33.9 °C / 93 F.
(+) Les repose-poignets et le pavé tactile sont plus froids que la température de la peau avec un maximum de 29.9 °C / 85.8 F et sont donc froids au toucher.
(±) La température moyenne de la zone de l'appui-paume de dispositifs similaires était de 28.8 °C / 83.8 F (-1.1 °C / #-2 F).
HP Omen 15-ek0456ng analyse audio
(-) | haut-parleurs pas très forts (58.1 dB)
Basses 100 - 315 Hz
(-) | presque aucune basse - en moyenne 17.3% plus bas que la médiane
(±) | la linéarité des basses est moyenne (13% delta à la fréquence précédente)
Médiums 400 - 2000 Hz
(+) | médiane équilibrée - seulement 3.4% de la médiane
(±) | la linéarité des médiums est moyenne (9.7% delta à la fréquence précédente)
Aiguës 2 - 16 kHz
(+) | des sommets équilibrés - à seulement 3.2% de la médiane
(+) | les aigus sont linéaires (5.4% delta à la fréquence précédente)
Globalement 100 - 16 000 Hz
(±) | la linéarité du son global est moyenne (22% de différence avec la médiane)
Par rapport à la même classe
» 79% de tous les appareils testés de cette catégorie étaient meilleurs, 6% similaires, 15% pires
» Le meilleur avait un delta de 6%, la moyenne était de 18%, le pire était de 132%.
Par rapport à tous les appareils testés
» 63% de tous les appareils testés étaient meilleurs, 6% similaires, 30% pires
» Le meilleur avait un delta de 4%, la moyenne était de 24%, le pire était de 134%.
Asus ROG Zephyrus G15 GA502IU-ES76 analyse audio
(±) | le niveau sonore du haut-parleur est moyen mais bon (81# dB)
Basses 100 - 315 Hz
(±) | basse réduite - en moyenne 5.9% inférieure à la médiane
(±) | la linéarité des basses est moyenne (11.4% delta à la fréquence précédente)
Médiums 400 - 2000 Hz
(+) | médiane équilibrée - seulement 2.2% de la médiane
(+) | les médiums sont linéaires (4% delta à la fréquence précédente)
Aiguës 2 - 16 kHz
(±) | sommets plus élevés - en moyenne 6.5% plus élevés que la médiane
(+) | les aigus sont linéaires (6.5% delta à la fréquence précédente)
Globalement 100 - 16 000 Hz
(+) | le son global est linéaire (13.1% différence à la médiane)
Par rapport à la même classe
» 18% de tous les appareils testés de cette catégorie étaient meilleurs, 4% similaires, 78% pires
» Le meilleur avait un delta de 6%, la moyenne était de 18%, le pire était de 132%.
Par rapport à tous les appareils testés
» 13% de tous les appareils testés étaient meilleurs, 3% similaires, 84% pires
» Le meilleur avait un delta de 4%, la moyenne était de 24%, le pire était de 134%.
| Éteint/en veille | |
| Au repos | |
| Fortement sollicité |
|
Légende:
min: | |
| HP Omen 15-ek0456ng i5-10300H, GeForce GTX 1660 Ti Mobile, Toshiba XG6 KXG60ZNV512G, IPS, 1920x1080, 15.6" | Asus ROG Zephyrus G15 GA502IU-ES76 R7 4800HS, GeForce GTX 1660 Ti Max-Q, Intel SSD 660p 1TB SSDPEKNW010T8, IPS, 1920x1080, 15.6" | Schenker XMG Core 15 GK5CP6V i7-9750H, GeForce GTX 1660 Ti Mobile, Samsung SSD 970 EVO Plus 500GB, IPS, 1920x1080, 15.6" | Nexoc GH5 515IG i5-10300H, GeForce GTX 1650 Mobile, Samsung SSD 860 Evo 512GB, IPS, 1920x1080, 15.6" | MSI Bravo 15 A4DCR R7 4800H, Radeon RX 5300M, Samsung PM981a MZVLB1T0HBLR, IPS-Level, 1920x1080, 15.6" | HP Omen 15-dc1020ng i5-9300H, GeForce GTX 1650 Mobile, WDC PC SN720 SDAQNTW-512G, IPS, 1920x1080, 15.6" | Moyenne NVIDIA GeForce GTX 1660 Ti Mobile | Moyenne de la classe Gaming | |
|---|---|---|---|---|---|---|---|---|
| Power Consumption | 38% | 7% | 33% | 1% | 35% | -22% | -33% | |
| Idle Minimum * (Watt) | 9.2 | 5.1 45% | 9 2% | 3 67% | 11 -20% | 4.04 56% | 12.4 ? -35% | 13.2 ? -43% |
| Idle Average * (Watt) | 14.6 | 8.4 42% | 12 18% | 7 52% | 14 4% | 7.2 51% | 18 ? -23% | 18.9 ? -29% |
| Idle Maximum * (Watt) | 18.1 | 9.1 50% | 18 1% | 16 12% | 25 -38% | 11.4 37% | 25.3 ? -40% | 24.3 ? -34% |
| Load Average * (Watt) | 84 | 55.1 34% | 86 -2% | 85 -1% | 72 14% | 80.8 4% | 93.5 ? -11% | 108.3 ? -29% |
| Witcher 3 ultra * (Watt) | 142 | 97.5 31% | 126 11% | 86 39% | 100 30% | 93.6 34% | ||
| Load Maximum * (Watt) | 194 | 140.2 28% | 173 11% | 134 31% | 163 16% | 144.5 26% | 191.9 ? 1% | 254 ? -31% |
* ... Moindre est la valeur, meilleures sont les performances
| HP Omen 15-ek0456ng i5-10300H, GeForce GTX 1660 Ti Mobile, 70.91 Wh | Asus ROG Zephyrus G15 GA502IU-ES76 R7 4800HS, GeForce GTX 1660 Ti Max-Q, 76 Wh | Schenker XMG Core 15 GK5CP6V i7-9750H, GeForce GTX 1660 Ti Mobile, 46 Wh | Nexoc GH5 515IG i5-10300H, GeForce GTX 1650 Mobile, 48.96 Wh | MSI Bravo 15 A4DCR R7 4800H, Radeon RX 5300M, 51 Wh | HP Omen 15-dc1020ng i5-9300H, GeForce GTX 1650 Mobile, 52.5 Wh | Moyenne de la classe Gaming | |
|---|---|---|---|---|---|---|---|
| Autonomie de la batterie | -15% | -51% | -1% | -39% | 8% | -1% | |
| Reader / Idle (h) | 11.7 | 7.1 -39% | 6.1 -48% | 14.9 27% | 7 -40% | 15.9 36% | 8.71 ? -26% |
| H.264 (h) | 6.4 | 6.5 2% | 8 25% | 8.26 ? 29% | |||
| WiFi v1.3 (h) | 6.5 | 5.3 -18% | 3.6 -45% | 6.4 -2% | 4.5 -31% | 6.4 -2% | 7.04 ? 8% |
| Load (h) | 1.7 | 1.9 12% | 0.7 -59% | 1.2 -29% | 0.9 -47% | 1.2 -29% | 1.47 ? -14% |
| Witcher 3 ultra (h) | 1 |


Points positifs
Points négatifs
Verdict - Slight deductions in style points
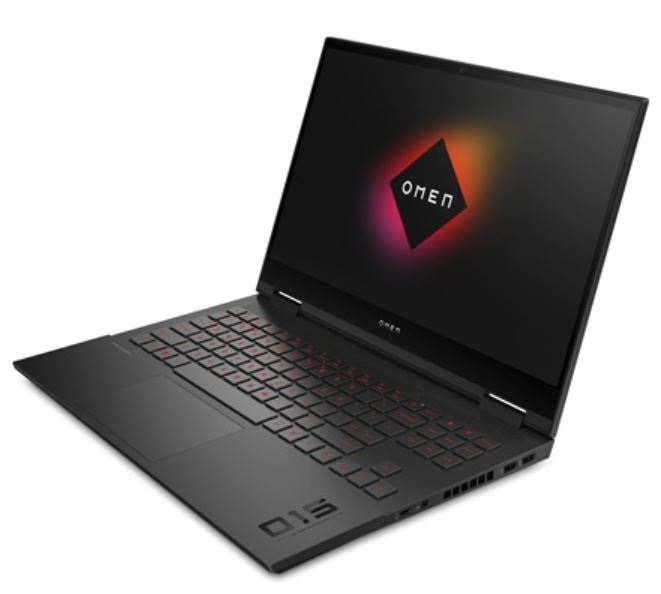
Le HP Omen 15 est un bon portable de jeu qui ne vous ruinera pas. Et néanmoins, l'appareil est très performant, et permet de jouer même aux titres les plus récents. Notre configuration de test coûte près de 1 250 €. Le Core i5-10300H ne propose que 4 coeurs, mais parvient à se maintenir à un bon niveau en jeu pur. En comparaison directe de performances, le Core i5-10300H doit quand même s'avouer battu face aux processeurs six ou huit coeurs. Avec la GeForce GTX 1660 Ti, le jeu est vraiment réussi, grâce également à l'excellent écran. A près de 300 cd/m², il n'est pas extrêmement lumineux, mais cela suffit pour l'usage ciblé. De plus, les déviations réduites de couleur aident à obtenir une bonne note. En revanche, il faut critiquer le stockage inclus, les 512 Go présents étant un peu justes de nos jours. Heureusement, un deuxième module M.2 peut être ajouté pour agrandir l'espace de stockage. Et cela est facile, parce que la coque inférieure se retire sans trop d'efforts.
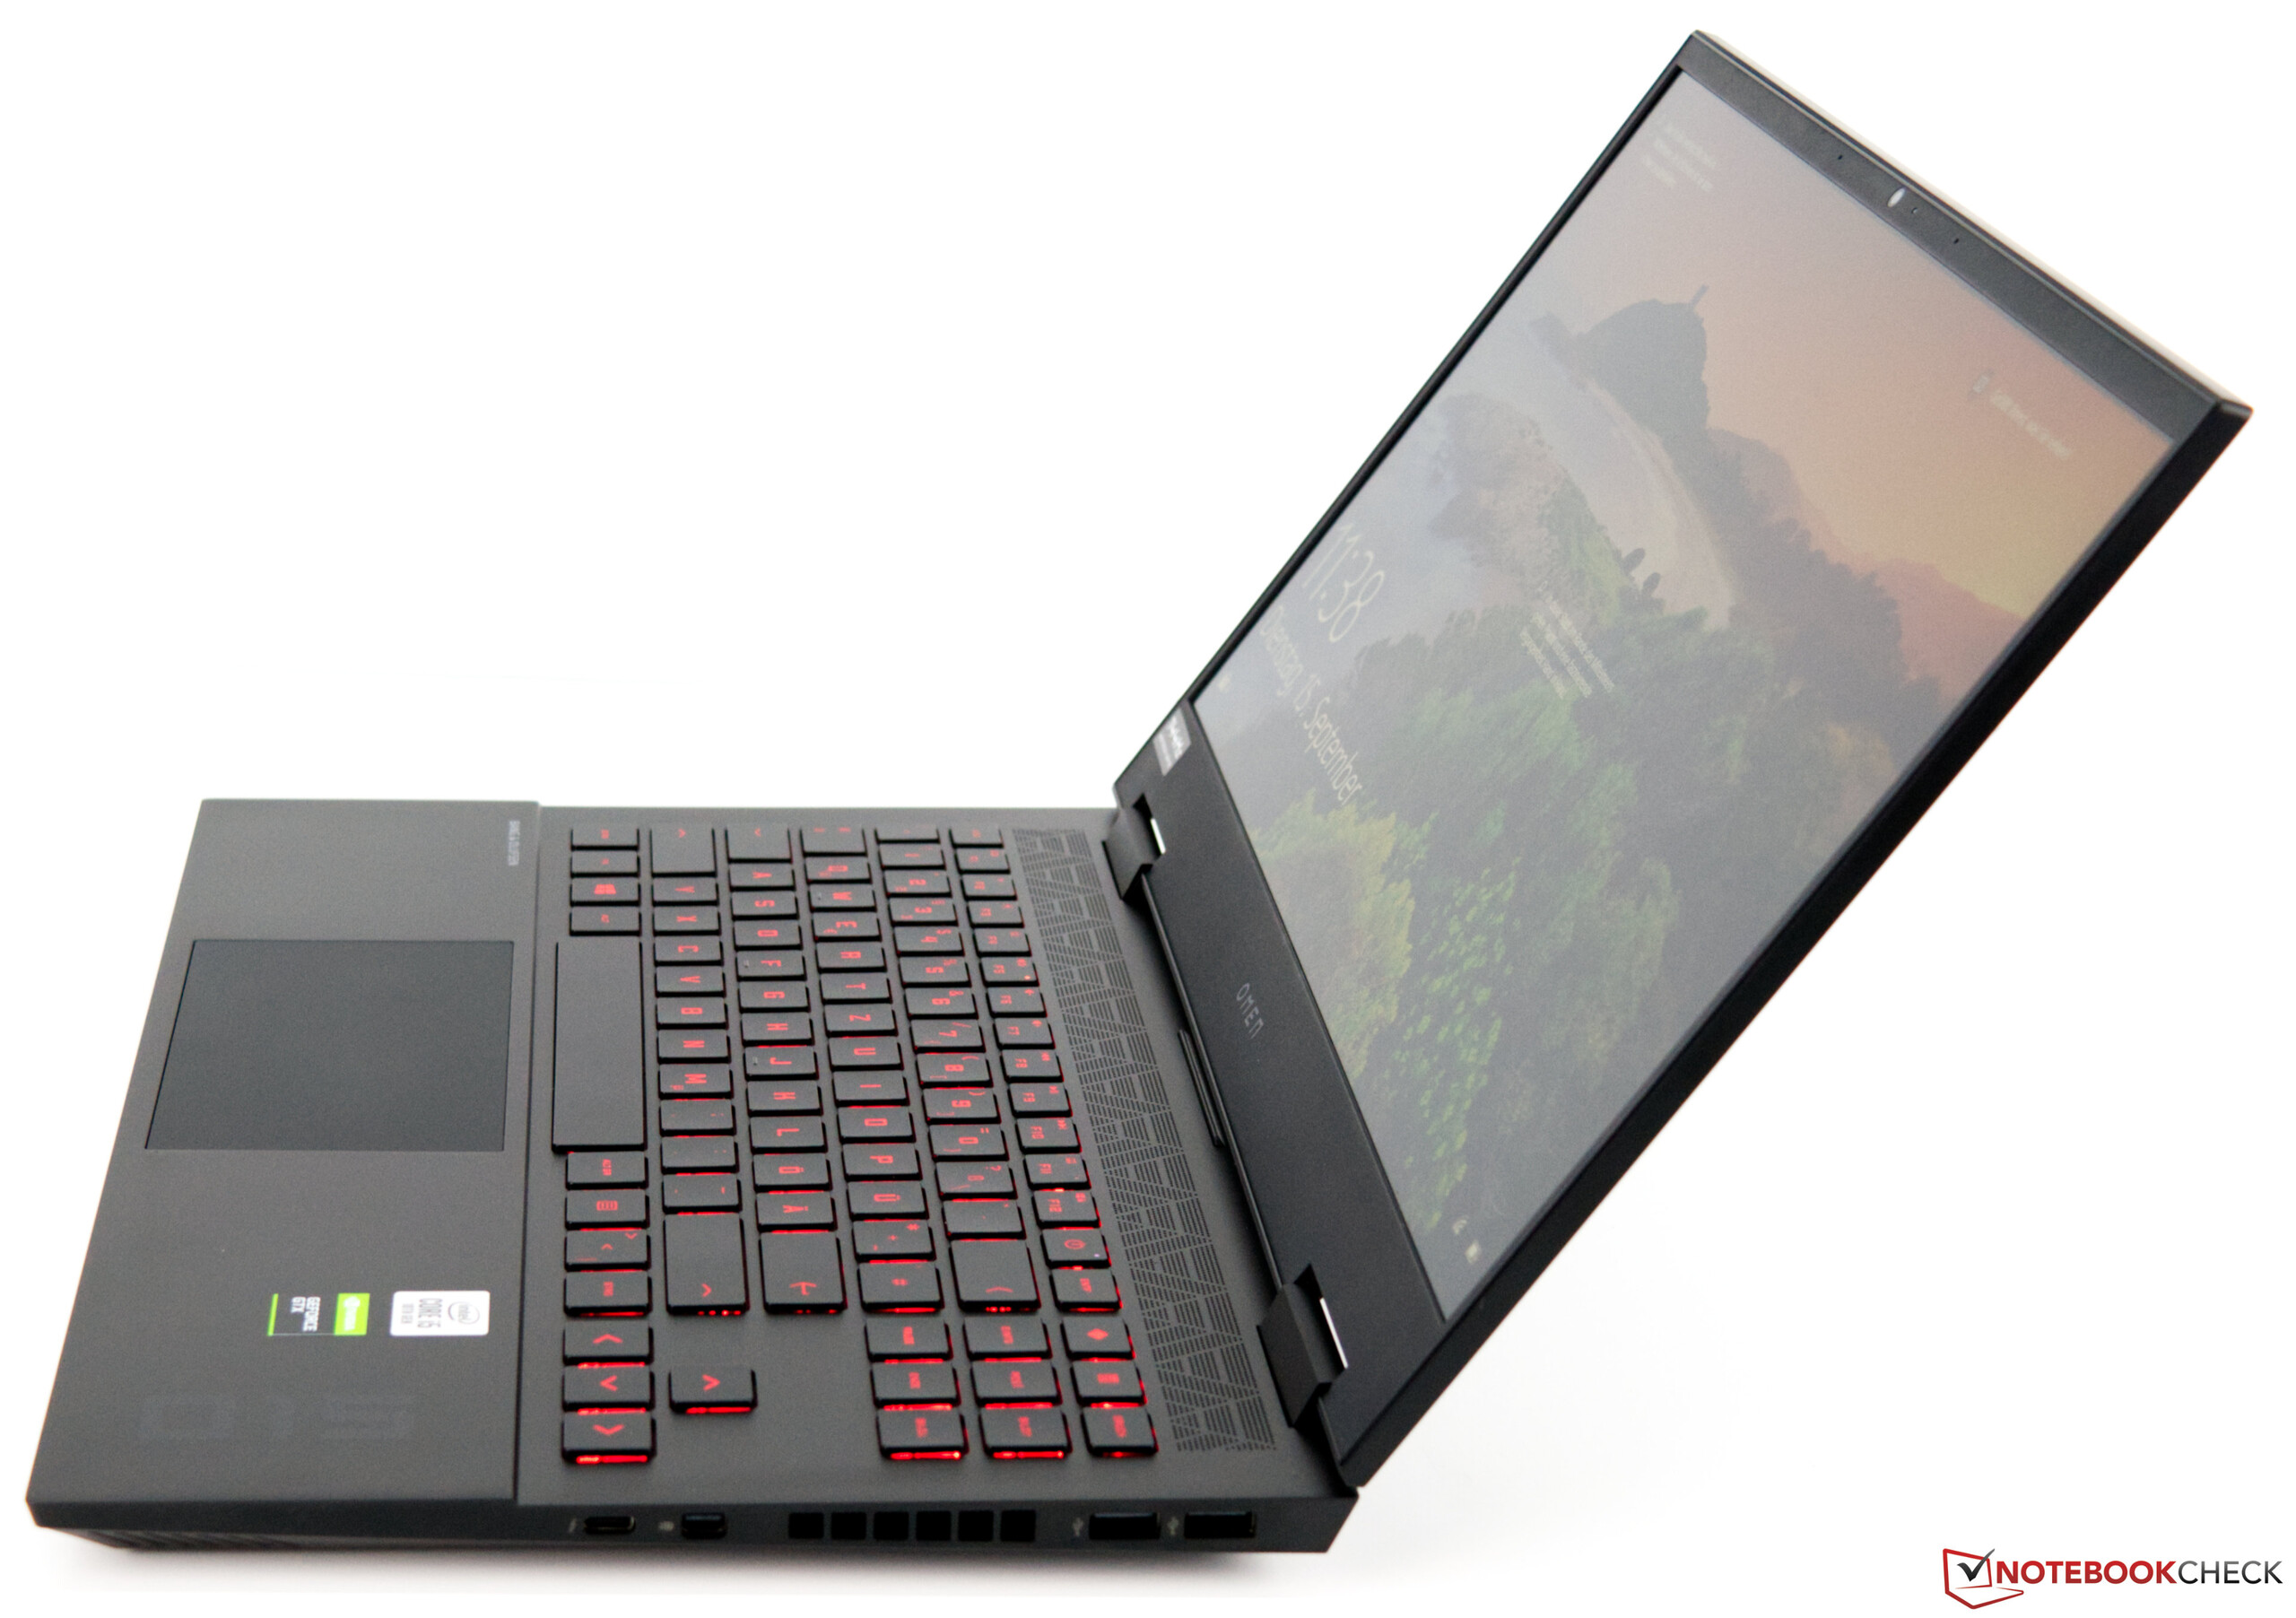
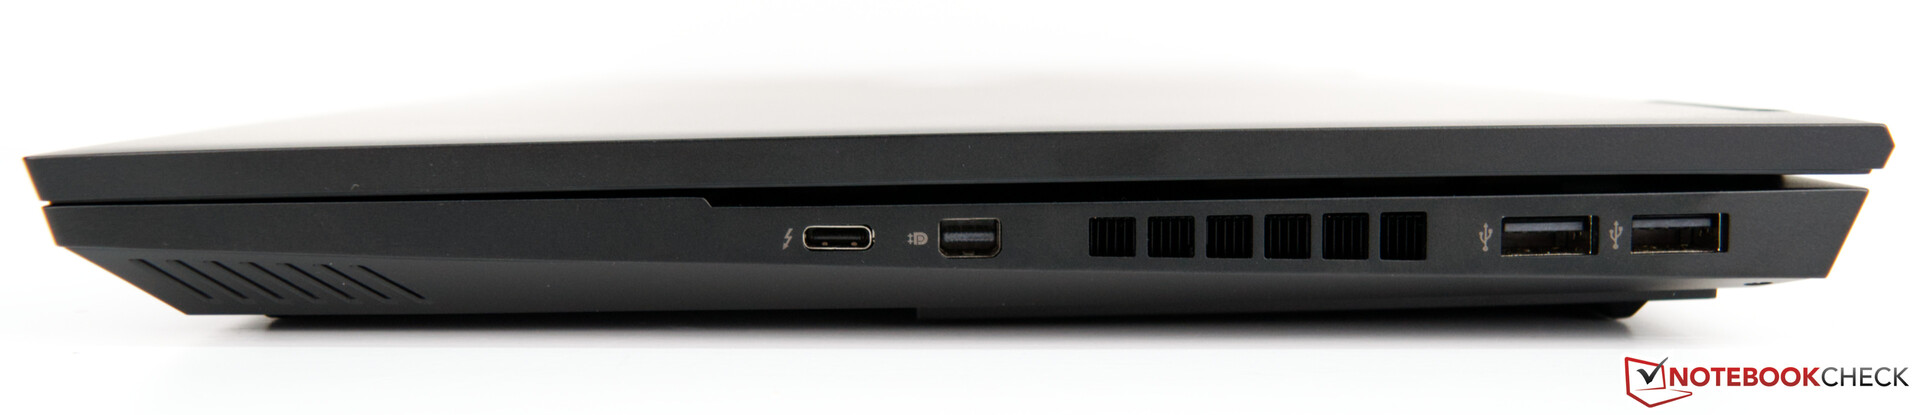
Le HP Omen 15 est un bon portable de jeu avec une bonne configuration de ports et une bonne autonomie.
Au niveau sonore, il faudra cependant composer avec une ventilation constante, audible même au ralenti. Malheureusement, on voit également au châssis que c'est une machine à petit prix. L'abondance des ports doit en revanche à nouveau être louée, avec la présence de Thunderbolt 3, qui permet à l'Omen 15 d'être paré pour l'avenir. Il en va de même pour le Wifi 6 - même s'il n'est pas exploité au mieux...
L’intégralité de cette critique est disponible en anglais en suivant ce lien.
HP Omen 15-ek0456ng
- 09/18/2020 v7 (old)
Sebastian Bade
Price comparison
