Notebookcheck Logo

Test complet de l'Asus Zephyrus G15 GA502IU (Ryzen 7 4800HS, GTX 1660 Ti Max-Q, FHD 144 Hz) : les débuts de l'AMD Ryzen 7 4800HS
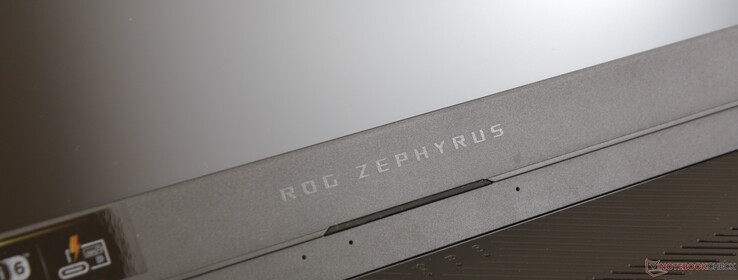
Mieux que le Core i9, tout en consommant moins.

Même le processeur mobile Ryzen 7 de série H le plus lent est capable de surpasser la plupart des PC portables de jeu tournant sur le dernier processeur Core i7 Comet Lake H de 10e génération. Alors que les performances du processeur sont excellentes, les 1 300 € demandés pour le Zephyrus G15 sont un peu élevés vu la carte graphique GRX 1660 Ti Max-Q.

L'Asus Zephyrus G15 GA502IU est une mise à jour du GA502DU de l'an dernier. Il remplace l'ancien Ryzen 7 3750H Zen+ 12 nm par le nouveau Ryzen 7 4800HS Zen 2 7 nm, tout en gardant le reste à peu près inchangé. Ainsi, nos commentaires à propos du châssis et des caractéristiques physiques du GA502DU s'applique au GA502IU.

Notre modèle de test est vendu à environ 1 300 €, tandis que la version plus haut de gamme avec GeForce RTX 2060 est vendu 100 € de plus. Alors que le processeur Ryzen 7 4800H est le seul disponible, on peut choisir entre un écran mat 1080p à 144 ou 240 Hz, avec adaptive sync. Les concurrents sont les portables de jeu de 15,6 pouces du milieu de gamme, tels le Razer Blade 15 Modèle de base, le Gigabyte Aorus 15, le MSI GL65, ou le HP Omen 15 2020.

Les joueurs qui ont un budget plus élevé peuvent considérer les série Asus ROG Zephyrus S plus haut de gamme, ou Strix Scar.

Plus de tests de machines Asus :

Asus ROG Zephyrus G15 GA502IU-ES76 (ROG Zephyrus G15 GA502 Gamme)
Processeur
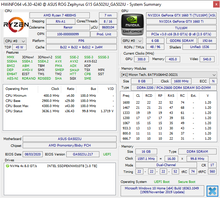
AMD Ryzen 7 4800HS 8 x 2.9 - 4.2 GHz, Renoir-HS (Zen 2)
Carte graphique
NVIDIA GeForce GTX 1660 Ti Max-Q - 6 Go VRAM, Processeur: 1240 MHz, Mémoire: 1530 MHz, GDDR6, 452.06, Optimus
Mémoire
16 Go 
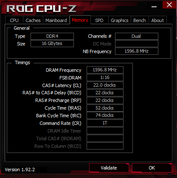
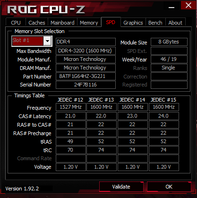
, 8 Go soudés + 8 Go DDR4-3200, 22-22-22-52, double canal
Écran
15.60 pouces 16:9, 1920 x 1080 pixel 141 PPP, Panda LM156LF-2F01, IPS, NCP004D, brillant: non, 144 Hz
Carte mère
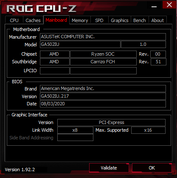
AMD Promontory/Bixby FCH
Disque dur
Intel SSD 660p 1TB SSDPEKNW010T8, 1024 Go 
Carte son
AMD Raven/Renoir/VanGogh/Cezanne - Audio Processor - HD Audio Controller
Connexions
4 USB 3.0 / 3.1 Gen1, 1 USB 3.1 Gen2, 1 HDMI, 1 DisplayPort, 1 Encoche de Sécurité Kensington, Connectique audio: jack
Réseau
Realtek RTL8168/8111 Gigabit-LAN (10/100/1000MBit/s), Intel Wi-Fi 6 AX200 (a/b/g/n = Wi-Fi 4/ac = Wi-Fi 5/ax = Wi-Fi 6/), Bluetooth 5.1
Taille
Hauteur x Largeur x Profondeur (en mm): 19.9 x 360 x 252
Batterie
76 Wh Lithium-Polymère
Système d'exploitation
Microsoft Windows 10 Home 64 Bit
Fonctionnalités additionnelles
Haut-parleurs: stéréo, Clavier: chiclet, Rétroéclairage du clavier: oui, Asus Armoury Crate, 12 Mois Garantie
Poids
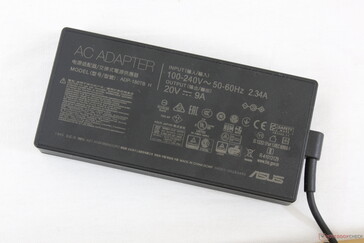
2.111 kg, Alimentation: 508 g
Prix
1300 USD
Remarque : le fabricant peut utiliser des composants provenant de différents fournisseurs, notamment des panneaux d'affichage, des lecteurs ou des clés USB ayant des spécifications similaires.


Note
Date
Modèle
Poids
Épaisseur
Taille
Résolution
Meilleur prix
81.2 %
v7 (old)
10/20
Asus ROG Zephyrus G15 GA502IU-ES76
R7 4800HS, GeForce GTX 1660 Ti Max-Q
2.1 kg19.9 mm15.60"1920x1080
84.5 %
v7 (old)
08/20
Asus ROG Zephyrus Duo 15 GX550LXS
i9-10980HK, GeForce RTX 2080 Super Max-Q
2.5 kg20 mm15.60"3840x2160
83.3 %
v6 (old)
07/19
Asus ROG Zephyrus G15 GA502DU
R7 3750H, GeForce GTX 1660 Ti Max-Q
2.1 kg20.4 mm15.60"1920x1080
86.9 %
v7 (old)
09/20
Razer Blade 15 RTX 2070 Super Max-Q
i7-10875H, GeForce RTX 2070 Super Max-Q
2.1 kg17.8 mm15.60"1920x1080
83.3 %
v7 (old)
08/20
Lenovo Legion 5 15IMH05H
i5-10300H, GeForce RTX 2060 Mobile
2.5 kg26.1 mm15.60"1920x1080
82.5 %
v7 (old)
09/20
MSI GS66 Stealth 10SE-045
i7-10750H, GeForce RTX 2060 Mobile
2.2 kg19.8 mm15.60"1920x1080
82.6 %
v7 (old)
Eluktronics RP-15
R7 4800H, GeForce RTX 2060 Mobile
1.9 kg20 mm15.60"1920x1080

Châssis

Le châssis est élégant, léger et très fin, comparé aux autres PC portables à 1000 €, qui sont souvent plus épais et plus lourds. Les séries Acer Nitro 5 et MSI GL par exemple ont nombre de composants identiques à ceux d enotre Asus, tout en étant moins attirants et plus cheap. La série GA502 utilise du plastique similaire, mais parvient à mieux le camoufler que les autres appareils du même niveau de prix. En bref, notre Asus ressemble à une machine de jeu haut de gamme, sans avoir à utiliser d'alliages en métal coûteux.

La rigidité du châssis est en revanche toujours moins bonne que sur les autres portables de jeu fins et légers comme le Razer Blade 15, le MSI GS66 ou la série Zephyrus S d'Asus. La partie écran et le centre du clavier, par exemple, sont assez flexibles, ou ploient plus facilement sous la pression que ces concurrents.

La base du Zephyrus G15 est toujours largement en plastique, mais l'ensemble est net, avec une allure haut de gamme.
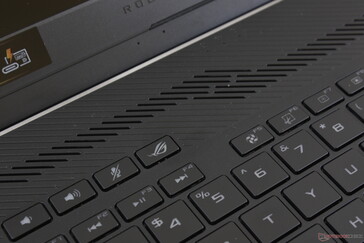
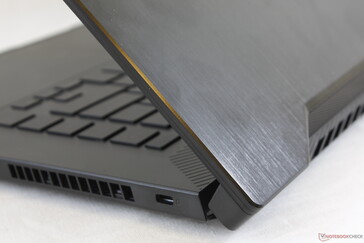
Les grilles supplémentaires tout au long du Zephyrus G15 aident à la circulation de l'air.
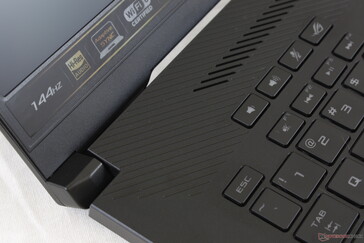
Les charnières du G15 sont petites, avec des craquements réduits au minium lors de l'ajustement.
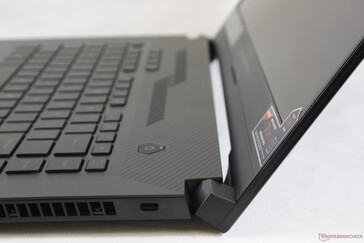
L'angle maximum d'ouverture du Zephyrus G15 est plutôt réduit (environ 130 °).
Tordre la base du G15 permet de constater qu'elle ploie et craque plus facilement que celle du Razer Blade 15 Modèle de base.
Partie écran en aluminium brossé du Zephyrus G15. La partie écran est plus sensible aux torsions et aux ploiements que la base.
363.1 mm 259.6 mm 26.1 mm 2.5 kg360 mm 252 mm 20.4 mm 2.1 kg360 mm 268 mm 20 mm 2.5 kg360 mm 246 mm 20 mm 1.9 kg360 mm 252 mm 19.9 mm 2.1 kg358 mm 248 mm 19.8 mm 2.2 kg355 mm 235 mm 17.8 mm 2.1 kg297 mm 210 mm 1 mm 5.7 g

Connectivité

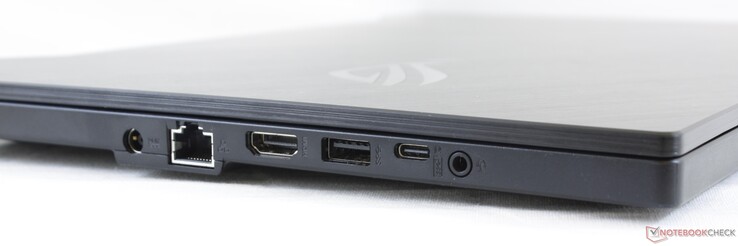
La sélection des ports est bonne, avec RJ45, HDMI et USB C avec DisplayPort. En revanche le Thunderbolt 3 est absent, ainsi que le lecteur de carte SD.

La position des ports est peu favorable aux gauchers, parce qu'ils sont proches entre eux et situés vers l'avant.

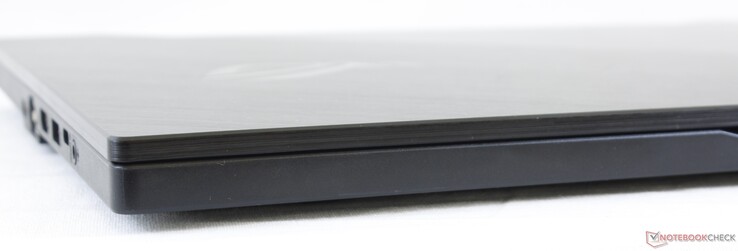
A l'avant : aucune connectivité.
Côté droit : 2 USB A 3.1 Gen 1, verrou de sécurité Kensington.
A l'arrière : aucune connectivité.
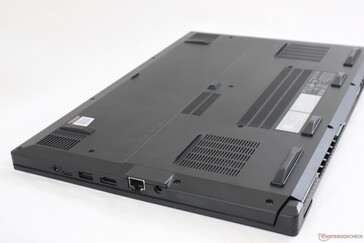
Côté gauche : entrée secteur, Gigabit RJ-45, HDMI 2.0b, USB A 3.1 Gen 1, USB C 3.1 Gen 2 avec DisplayPort 1.4, prise jack.

Communication

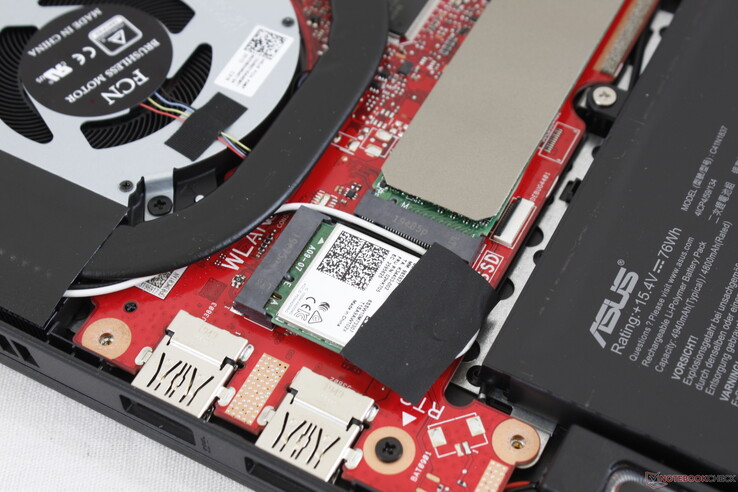
L'Intel AX200 intègre par défaut le Wifi 6 et le Bluetooth 5.1, à l'inverse du module RealTek Wifi 5 plutôt lent sur le GA502DU de l'an dernier. Nous n'avons pas rencontré de problèmes avec notre routeur de test Netgear RAX200.

Asus Zephyrus G15 GA502IU - Module Wifi amovible.
Networking
iperf3 transmit AX12
Eluktronics RP-15
Intel Wi-Fi 6 AX200
1408 (1199min - 1516max) MBit/s +48%
MSI GS66 Stealth 10SE-045
Intel Wi-Fi 6 AX201
1350 MBit/s +42%
Asus ROG Zephyrus Duo 15 GX550LXS
Intel Wi-Fi 6 AX201
1290 MBit/s +35%
Razer Blade 15 RTX 2070 Super Max-Q
Intel Wi-Fi 6 AX201
1240 (619min - 1284max) MBit/s +30%
Asus ROG Zephyrus G15 GA502IU-ES76
Intel Wi-Fi 6 AX200
953 (432min - 1093max) MBit/s
Lenovo Legion 5 15IMH05H
Intel Wi-Fi 6 AX201
566 (37min - 647max) MBit/s -41%
iperf3 receive AX12
Eluktronics RP-15
Intel Wi-Fi 6 AX200
1447 (1179min - 1507max) MBit/s +20%
Razer Blade 15 RTX 2070 Super Max-Q
Intel Wi-Fi 6 AX201
1394 (843min - 1528max) MBit/s +15%
MSI GS66 Stealth 10SE-045
Intel Wi-Fi 6 AX201
1340 MBit/s +11%
Asus ROG Zephyrus Duo 15 GX550LXS
Intel Wi-Fi 6 AX201
1260 MBit/s +4%
Asus ROG Zephyrus G15 GA502IU-ES76
Intel Wi-Fi 6 AX200
1210 (800min - 1337max) MBit/s
Lenovo Legion 5 15IMH05H
Intel Wi-Fi 6 AX201
880 (772min - 916max) MBit/s -27%
0501001502002503003504004505005506006507007508008509009501000105011001150120012501300Tooltip
Asus ROG Zephyrus G15 GA502IU-ES76; iperf3 receive AX12; iperf 3.1.3: Ø1210 (800-1337)
Asus ROG Zephyrus G15 GA502IU-ES76; iperf3 transmit AX12; iperf 3.1.3: Ø939 (432-1093)

Webcam

Il n'y a pas de webcam intégrée, ce qu'Asus explique par les bordures d'écran très étroites autour de l'écran. On notera cependant que les nouveaux ultrabooks, comme les derniers XPS 15, XPS 17 ou Spectre, prouvent que l'on peut intégrer une webcam sans sacrifier les bordures d'écran étroites ni le positionnement.

Maintenance

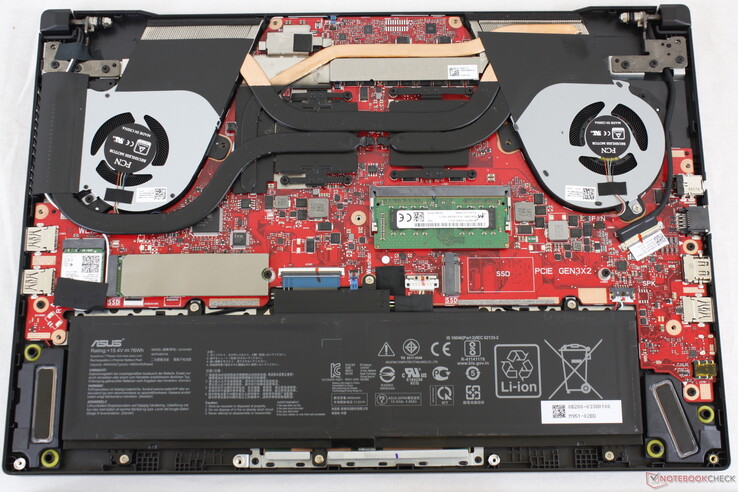
Il faut de la patience pour retirer la coque inférieure, puisqu'il y a 15 vis au total. L'organisation est identique à ce qu'elle était sur le GA502DU de l'an dernier, mis à part quelques légers changements des caloducs.

Accessoires et garantie

Il n'y a pas d'extras dans la boîte autres que l'adaptateur secteur et que la documentation. La garantie limitée de deux ans s'applique le souvent.

Périphériques d'entrée

Clavier et Touchpad

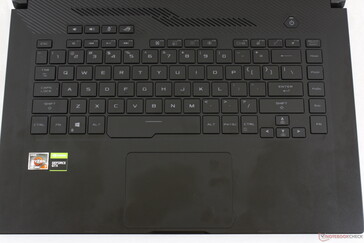
Nous n'étions pas fans du clavier et du clickpad du GA502DU, si bien qu'il est décevant de les retrouver dans le GA502IU. Le retour est toujours plus mou et plus la course plus courte que sur les claviers de série SteelSeries chez MSI, tandis que le fond gris des touches ne contraste pas beaucoup avec les écritures sombres. Nous apprécions en revanche la rangée supplémentaire de touches supplémentaires en haut et la colonne supplémentaire à droite. Mais pour une frappe régulière, les ZenBook feront mieux.

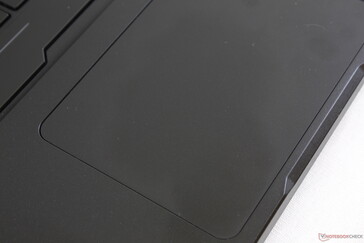
La glisse sur le clickpad Precision (10,5 x 7,5 cm) est bonne à des vitesses moyennes ou élevées, mais le doigt a tendance à coller à des vitesses moins élevées. Les touches de souris intégrées sont peu satisfaisantes à utiliser, à cause de leur retour réduit et mou.

Organisation Asus ROG classique du clavier pour le GA502IU. Le retour et la course sont cependant plus mou et courte que d'habitude.
La taille du clickpad du Zephyrus G15 est correcte, mais les touches de souris intégrées aurait dû être plus fermes.
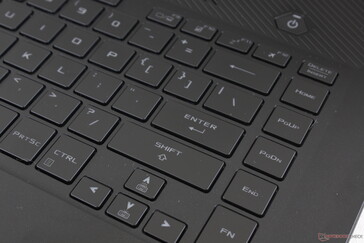
Le fond gris des touches du Zephyrus contrastent faiblement avec les écritures, à moins que le rétroéclariage blanc une zone soit activé.
Petites touches de flèches pour le Zephyrus, plus comme sur le TUF A17.

Ecran

L'un des défauts majeurs du GA502DU de l'an dernier était son écran 60 Hz moyen. Cette année, Asus a laissé tomber les version 60 et 120 Hz, pour ne proposer que des 144 et 240 Hz. Malheureusement, la dalle 144 Hz possède des temps de réponses et une couverture colorimétrique moins bons que la plupart des autres dalles 144 Hz, avec des couleurs moins bonnes et un ghosting notable. Cela parce que le GA502IU utilise toujours des dalles IPS de Panda, et non les dalles meilleures d'AU Optronics ou de Sharp.

La version 240 Hz est sensée corriger les principaux défauts de la dalle 144 Hz, Asus promettant des temps de réponse de 3 ms et une couverture sRVB de 100 %, contre 15 ms et 58 % pour la version 144 Hz. Nos résultats ne vont ici que s'appliquer à la version 144 Hz.

Pas de version en verre bord à bord ou 4K UHD pour le Zephyrus G15 GA502IU.
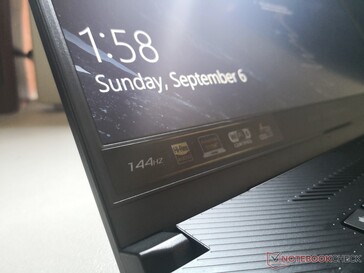
Les bordures d'écran du Zephyrus G15 2020 sont étroites sur trois des quatre côtés.
L'écran du GA502IU est légèrement granuleux et pas aussi net qu'une alternative brillante, à cause de la surcouche matte.
On note de légères fuites de lumière inégales le long des bords de l'écran du GA502IU.
261.1
cd/m²
239.8
cd/m²
240.1
cd/m²
250.6
cd/m²
255.9
cd/m²
233.2
cd/m²
247.5
cd/m²
245.6
cd/m²
240.1
cd/m²
Homogénéité de la luminosité
Panda LM156LF-2F01 tested with X-Rite i1Pro 2
Maximum: 261.1 cd/m² (Nits) Moyenne: 246 cd/m² Minimum: 11.63 cd/m²
Homogénéité de la luminosité: 89 %
Valeur mesurée au centre, sur batterie: 255.9 cd/m²
Contraste: 1163:1 (Valeurs des noirs: 0.22 cd/m²)
ΔE Color 5.15 | 0.5-29.43 Ø4.91, calibrated: 4.83
ΔE Greyscale 4.2 | 0.5-98 Ø5.2
58% sRGB (Argyll 1.6.3 3D)
36.9% AdobeRGB 1998 (Argyll 1.6.3 3D)
40.22% AdobeRGB 1998 (Argyll 2.2.0 3D)
58.5% sRGB (Argyll 2.2.0 3D)
38.9% Display P3 (Argyll 2.2.0 3D)
Gamma: 2.16
Asus ROG Zephyrus G15 GA502IU-ES76
Panda LM156LF-2F01, IPS, 15.6", 1920x1080
Asus ROG Zephyrus Duo 15 GX550LXS
AU Optronics B156ZAN03.1, IPS, 15.6", 3840x2160
Asus ROG Zephyrus G15 GA502DU
Panda LM156LF-CL03, IPS, 15.6", 1920x1080
Razer Blade 15 RTX 2070 Super Max-Q
AU Optronics B156HAN12.0, IPS, 15.6", 1920x1080
Lenovo Legion 5 15IMH05H
BOE CQ NV156FHM-NX1, IPS, 15.6", 1920x1080
MSI GS66 Stealth 10SE-045
Sharp LQ156M1JW03, IPS, 15.6", 1920x1080
Eluktronics RP-15
BOE NV156FHM-N4G, IPS, 15.6", 1920x1080
Display
114%
4%
74%
-0%
71%
61%
Display P3 Coverage
38.9
87
124%
40.33
4%
69.4
78%
38.8
0%
67.5
74%
63.7
64%
sRGB Coverage
58.5
100
71%
60.6
4%
98.8
69%
57.8
-1%
98.3
68%
92
57%
AdobeRGB 1998 Coverage
40.22
99.9
148%
41.69
4%
70.5
75%
40.09
0%
68.9
71%
65.2
62%
Response Times
-63%
-24%
78%
14%
55%
45%
Response Time Grey 50% / Grey 80% *
24.4 ?(11.6, 12.8)
56.4 ?(26.4, 30)
-131%
34 ?(17.2, 16.8)
-39%
3.2 ?(1.4, 1.8)
87%
26 ?(12, 14)
-7%
12 ?(7.6, 4.4)
51%
17.2 ?(6, 11.2)
30%
Response Time Black / White *
25.6 ?(15.2, 10.4)
24.4 ?(10, 14.4)
5%
28 ?(17.2, 10.8)
-9%
8 ?(4, 4)
69%
17 ?(8, 9)
34%
10.4 ?(6, 4.4)
59%
10.4 ?(6, 4.4)
59%
PWM Frequency
21280 ?(34)
23580 ?(19)
Screen
57%
-4%
30%
6%
28%
13%
Brightness middle
255.9
398
56%
240.1
-6%
345.4
35%
301
18%
272
6%
298.6
17%
Brightness
246
385
57%
231
-6%
342
39%
277
13%
259
5%
289
17%
Brightness Distribution
89
90
1%
85
-4%
90
1%
77
-13%
91
2%
90
1%
Black Level *
0.22
0.28
-27%
0.34
-55%
0.34
-55%
0.26
-18%
0.27
-23%
0.35
-59%
Contrast
1163
1421
22%
706
-39%
1016
-13%
1158
0%
1007
-13%
853
-27%
Colorchecker dE 2000 *
5.15
1.53
70%
4.2
18%
3.18
38%
5.12
1%
2.42
53%
5.01
3%
Colorchecker dE 2000 max. *
17.11
3.69
78%
17.8
-4%
6.57
62%
8.86
48%
6.93
59%
7.06
59%
Colorchecker dE 2000 calibrated *
4.83
0.77
84%
4.09
15%
1.77
63%
4.88
-1%
0.88
82%
2.52
48%
Greyscale dE 2000 *
4.2
2.4
43%
2.8
33%
3.8
10%
3.47
17%
4.5
-7%
5.4
-29%
Gamma
2.16 102%
2.19 100%
2.2 100%
2.15 102%
2.37 93%
2.188 101%
2.54 87%
CCT
7500 87%
6996 93%
6925 94%
7109 91%
7062 92%
7369 88%
7461 87%
Color Space (Percent of AdobeRGB 1998)
36.9
100
171%
38.4
4%
64.3
74%
37
0%
69
87%
59.1
60%
Color Space (Percent of sRGB)
58
100
72%
60.4
4%
99
71%
57
-2%
91
57%
91.6
58%
Moyenne finale (programmes/paramètres)
36% / 53%
-8% / -5%
61% / 44%
7% / 6%
51% / 39%
40% / 26%

* ... Moindre est la valeur, meilleures sont les performances

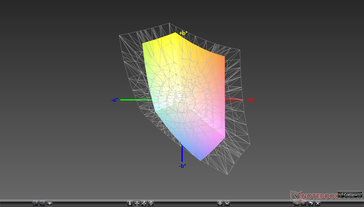
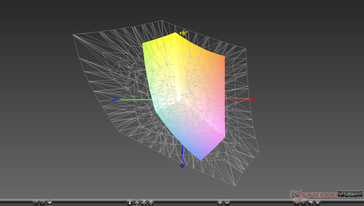
La couverture des espaces colorimétriques est réduite pour un portable de jeu, à seulement 58 % de l'espace sRVB, ou même 37 % de l'espace AdobeRVB, contre une couverture sRVB à 100 % pour la plupart des alternatives moyen et haut de gammes comme le MSI GS66 ou le Razer Blade 15.

Asus Zephyrus G15 GA502IU : couverture sRVB.
Asus Zephyrus G15 GA502IU : couverture AdobeRVB.

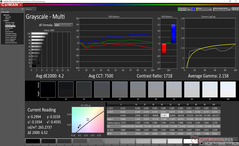
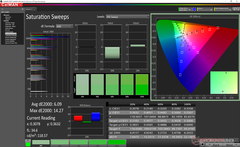
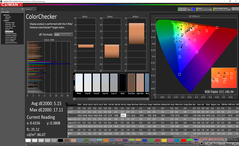
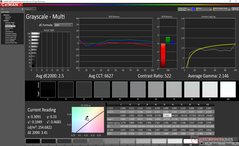
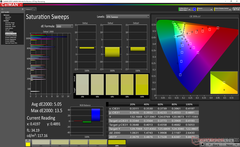
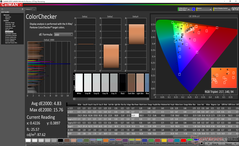
Les mesures X-Rite montrent que l'écran est plutôt bien calibré en sortie d'usine, avec un DeltaE de l'échelle de gris et des couleurs moyen, à respectivement 4,2 et 5,15. La température est en revanche trop froide. Le calibrage d e l'écran améliore les couleurs et l'échelle de gris. A noter que les couleurs sont de moins en moins fidèles à des niveaux de saturation plus élevés, même après calibrage, à cause de l'espace colorimétrique réduit noté plus haut.

Asus Zephyrus G15 GA502IU - Échelle de gris avant calibrage.
Asus Zephyrus G15 GA502IU - Courbes de saturation avant calibrage.
Asus Zephyrus G15 GA502IU - ColorChecker avant calibrage.
Asus Zephyrus G15 GA502IU - Échelle de gris après calibrage.
Asus Zephyrus G15 GA502IU - Courbes de saturation après calibrage.
Asus Zephyrus G15 GA502IU - ColorChecker après calibrage.

Temps de réponse de l'écran

Le temps de réponse d'un écran mesure la rapidité à laquelle l'écran est capable de changer une couleur pour une autre. Un temps de réponse élevé se traduit par une image floutée pour les objets en mouvement. Les joueurs bénéficieront de faibles latences d'affichage en jeu.
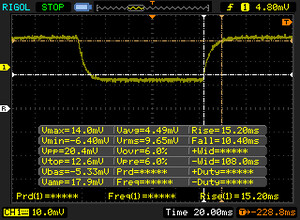
       Temps de réponse noir à blanc
25.6 ms ... hausse ↗ et chute ↘ combinées↗ 15.2 ms hausse
↘ 10.4 ms chute
L'écran souffre de latences relativement élevées, insuffisant pour le jeu.
En comparaison, tous les appareils testés affichent entre 0.1 (minimum) et 240 (maximum) ms. » 58 % des appareils testés affichent de meilleures performances.
Cela signifie que les latences relevées sont moins bonnes que la moyenne (20.9 ms) de tous les appareils testés.
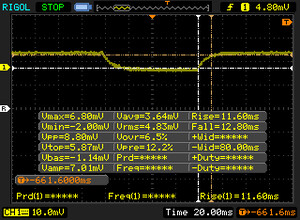
       Temps de réponse gris 50% à gris 80%
24.4 ms ... hausse ↗ et chute ↘ combinées↗ 11.6 ms hausse
↘ 12.8 ms chute
L'écran montre de bons temps de réponse, mais insuffisant pour du jeu compétitif.
En comparaison, tous les appareils testés affichent entre 0.165 (minimum) et 636 (maximum) ms. » 31 % des appareils testés affichent de meilleures performances.
Cela signifie que les latences relevées sont meilleures que la moyenne (32.8 ms) de tous les appareils testés.

Scintillement / MLI (Modulation de largeur d'impulsion)

Afin d'abaisser la luminosité de l'écran, certains ordinateurs portables font varier très rapidement le rétroéclairage entre éteint et allumé. La fréquence à laquelle le rétroéclairage s'éteint et se rallume est normalement fixée à une valeur qui permet de rendre la variation indétectable à l'œil nu? Si la fréquence est trop basse, certaines personnes peuvent être sujettes à une fatigue oculaire, des maux de tête ou même percevoir les variations.
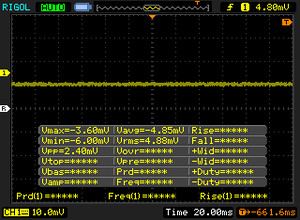
Scintillement / MLI (Modulation de largeur d'impulsion) non décelé

En comparaison, 53 % des appareils testés n'emploient pas MDI pour assombrir leur écran. Nous avons relevé une moyenne à 8705 (minimum : 5 - maximum : 343500) Hz dans le cas où une MDI était active.

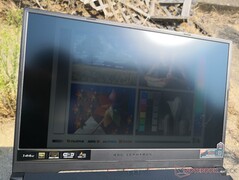
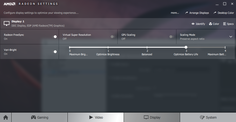
La visibilité à l'extérieur est moins bonne qu'avec la plupart des portables de jeu de 15,6 pouces, la luminosité maximale de l'écran étant ici d'environ 250 cd/m², contre 300 en moyenne pour la catégorie. De plus, il faut penser à désactiver l'AMD Vari-Bright, faute de quoi la luminosité culminera à seulement 152 cd/m² sur batterie, réduisant encore plus la lisibilité de l'écran. Des ultrabooks comme le ZenBook Pro 15 ou le XPS 15 ont des écrans bien plus lumineux, pour un usage plus aisé à l'extérieur.

Asus Zephyrus G15 GA502IU - À l'extérieur par temps ensoleillé.
Asus Zephyrus G15 GA502IU - À l'extérieur à l'ombre.
Asus Zephyrus G15 GA502IU - À l'extérieur par temps ensoleillé.
Angles de vision IPS larges pour le Zephyrus. Les couleurs, la luminosité et le contraste se dégradent depuis des angles extrêmes.

Performances

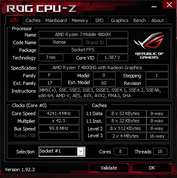
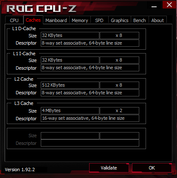
La série Asus GA502 sort du lot en étant l'une des premières à proposer le Ryzen 7 4800HS 8 cœurs. A la différence du Ryzen 7 4800H 45 W non bridé, le 4800HS possède une enveloppe thermique réduite à 35 W, afin de correspondre aux châssis plus fins comme celui du GA502. C'est néanmoins une énorme évolution sur la génération précédente 4 cœurs Ryzen 7 3750H, et AMD en fait le concurrent des populaires Core i9-9880H ou i7-10875H 8 cœurs.

Les possibilités graphiques sont limitées à une GeForce GTX 1660 Ti Max-Q ou à une RTX 2060. Il aurait été intéressant d'avoir une Radeon RX 5500M ou 5600M avec le SmartShift d'AMD, comme avec le Dell G5 15SE, mais les GPU Nvidia sont des choix plus sécurisés quand on en vient à la compatibilité et aux pilotes. Le FreeSync est présent par défaut sur toutes les versions.

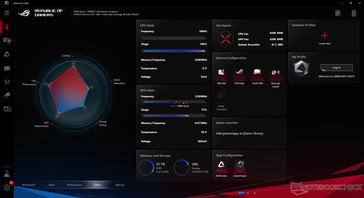
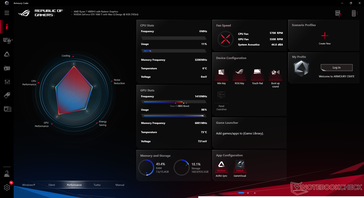
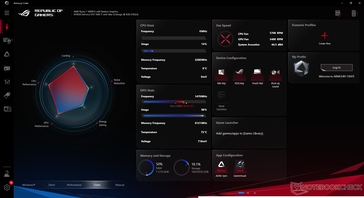
Nous avons utilisé le mode Turbo d'Asus pour effectuer tous les tests de performances ci-dessous, pour atteindre le meilleur score possible. Nous conseillons aux utilisateurs de se familiariser avec l'utilitaire Asus Armory Crate, ce logiciel influençant grandement le niveau sonore des ventilateurs et les performances.

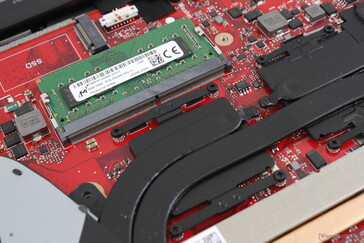
Les 8 Go de RAM sont soudés et un emplacement SODIMM est disponible, permettant de monter à un total de 40 Go.


Processeur

Les performances du processeur sont au coude à coude avec celles du Core i7-10875H 45 W, dans les tests monothread comme dans les tests multithread, même si le Ryzen 7 4800HS est en 35 W. Les performances sont stables avec CineBench R15 xT en boucle, comme le montre le graphique ci-dessous. Plus notablement, le Ryzen 9 4900HS du Zephyrus G14 n'est au mieux que de 10 % plus rapide, même avant tout throttling des performances.

Consultez notre page dédiée au Ryzen 7 4800HS  pour avoir plus d'informations techniques et de tests sur le processeur.

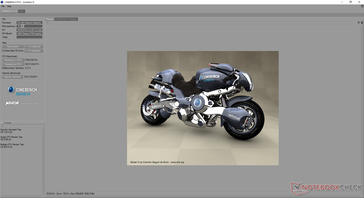
Asus Zephyrus G15 GA502IU - CineBench R10 32 bit.
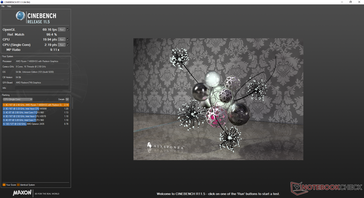
Asus Zephyrus G15 GA502IU - CineBench R11.5 64 bit.
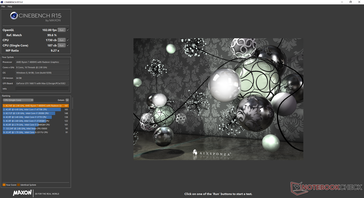
Asus Zephyrus G15 GA502IU - CineBench R15.
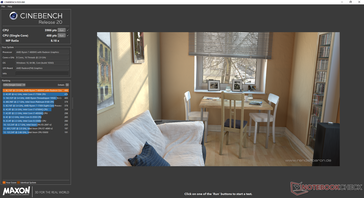
Asus Zephyrus G15 GA502IU - CineBench R20.
01002003004005006007008009001000110012001300140015001600170018001900Tooltip
Asus ROG Zephyrus G15 GA502IU-ES76 GeForce GTX 1660 Ti Max-Q, R7 4800HS, Intel SSD 660p 1TB SSDPEKNW010T8; CPU Multi 64Bit: Ø1634 (1595.85-1741.4)
Dell G5 15 SE 5505 P89F Radeon RX 5600M, R7 4800H, Samsung PM991 MZ9LQ512HALU; CPU Multi 64Bit: Ø1845 (1564.03-1971.71)
Asus Zephyrus G14 GA401IV GeForce RTX 2060 Max-Q, R9 4900HS, Intel SSD 660p 1TB SSDPEKNW010T8; CPU Multi 64Bit: Ø1655 (1591.98-1850.91)
MSI GS75 10SF-609US GeForce RTX 2070 Max-Q, i7-10875H, WDC PC SN730 SDBPNTY-512G; CPU Multi 64Bit: Ø1620 (1596.04-1713.21)
Cinebench R20: CPU (Multi Core) | CPU (Single Core)
Cinebench R15: CPU Multi 64Bit | CPU Single 64Bit
Blender: v2.79 BMW27 CPU
7-Zip 18.03: 7z b 4 -mmt1 | 7z b 4
Geekbench 5.5: Single-Core | Multi-Core
HWBOT x265 Benchmark v2.2: 4k Preset
LibreOffice : 20 Documents To PDF
R Benchmark 2.5: Overall mean
Cinebench R20 / CPU (Multi Core)
Eluktronics RP-17
AMD Ryzen 7 4800H
4552 Points +18%
Alienware m17 R3 P45E
Intel Core i9-10980HK
4487 Points +16%
Eurocom Sky X4C i9-9900KS
Intel Core i9-9900KS
4463 Points +15%
Asus Zephyrus G14 GA401IV
AMD Ryzen 9 4900HS
4288 Points +11%
MSI GS75 10SF-609US
Intel Core i7-10875H
3885 Points 0%
Asus ROG Zephyrus G15 GA502IU-ES76
AMD Ryzen 7 4800HS
3869 Points
Alienware m15 R3 P87F
Intel Core i7-10750H
3299 Points -15%
HP Pavilion Gaming 15-ec1206ng
AMD Ryzen 5 4600H
3271 Points -15%
Walmart EVOO Gaming 17
Intel Core i7-9750H
3059 Points -21%
Dell G5 15 5590
Intel Core i7-8750H
2707 Points -30%
Asus ROG Zephyrus G15 GA502DU
AMD Ryzen 7 3750H
1825 Points -53%
Cinebench R20 / CPU (Single Core)
Eurocom Sky X4C i9-9900KS
Intel Core i9-9900KS
509 Points +6%
Asus Zephyrus G14 GA401IV
AMD Ryzen 9 4900HS
495 Points +3%
Eluktronics RP-17
AMD Ryzen 7 4800H
484 Points 0%
Asus ROG Zephyrus G15 GA502IU-ES76
AMD Ryzen 7 4800HS
482 Points
Alienware m15 R3 P87F
Intel Core i7-10750H
479 Points -1%
MSI GS75 10SF-609US
Intel Core i7-10875H
475 Points -1%
Alienware m17 R3 P45E
Intel Core i9-10980HK
465 Points -4%
Walmart EVOO Gaming 17
Intel Core i7-9750H
442 Points -8%
HP Pavilion Gaming 15-ec1206ng
AMD Ryzen 5 4600H
436 Points -10%
Dell G5 15 5590
Intel Core i7-8750H
403 Points -16%
Asus ROG Zephyrus G15 GA502DU
AMD Ryzen 7 3750H
340 Points -29%
Cinebench R15 / CPU Multi 64Bit
Eurocom Sky X4C i9-9900KS
Intel Core i9-9900KS
1962 Points +20%
Eluktronics RP-17
AMD Ryzen 7 4800H
1932 (1913.23min - 1932.18max) Points +18%
Asus Zephyrus G14 GA401IV
AMD Ryzen 9 4900HS
1863 Points +14%
Alienware m17 R3 P45E
Intel Core i9-10980HK
1836 (1770.85min - 1836.46max) Points +12%
MSI GS75 10SF-609US
Intel Core i7-10875H
1713 (1596.04min - 1713.21max) Points +5%
Asus ROG Zephyrus G15 GA502IU-ES76
AMD Ryzen 7 4800HS
1634 (1595.85min - 1741.4max) Points
HP Pavilion Gaming 15-ec1206ng
AMD Ryzen 5 4600H
1418 Points -13%
Alienware m15 R3 P87F
Intel Core i7-10750H
1347 (1320.39min - 1347.39max) Points -18%
Walmart EVOO Gaming 17
Intel Core i7-9750H
1285 Points -21%
Dell G5 15 5590
Intel Core i7-8750H
1191 Points -27%
Asus ROG Zephyrus G15 GA502DU
AMD Ryzen 7 3750H
805 Points -51%
Cinebench R15 / CPU Single 64Bit
Eurocom Sky X4C i9-9900KS
Intel Core i9-9900KS
215 Points +16%
Alienware m17 R3 P45E
Intel Core i9-10980HK
208 Points +12%
Alienware m15 R3 P87F
Intel Core i7-10750H
201 Points +8%
MSI GS75 10SF-609US
Intel Core i7-10875H
198 Points +6%
Asus Zephyrus G14 GA401IV
AMD Ryzen 9 4900HS
193 Points +4%
Eluktronics RP-17
AMD Ryzen 7 4800H
187 Points +1%
Asus ROG Zephyrus G15 GA502IU-ES76
AMD Ryzen 7 4800HS
186 Points
Walmart EVOO Gaming 17
Intel Core i7-9750H
181 Points -3%
HP Pavilion Gaming 15-ec1206ng
AMD Ryzen 5 4600H
176 Points -5%
Dell G5 15 5590
Intel Core i7-8750H
165 Points -11%
Asus ROG Zephyrus G15 GA502DU
AMD Ryzen 7 3750H
144 Points -23%
Blender / v2.79 BMW27 CPU
Asus ROG Zephyrus G15 GA502DU
AMD Ryzen 7 3750H
584 Seconds * -106%
HP Pavilion Gaming 15-ec1206ng
AMD Ryzen 5 4600H
337.2 Seconds * -19%
Alienware m15 R3 P87F
Intel Core i7-10750H
326 Seconds * -15%
Asus Zephyrus G14 GA401IV
AMD Ryzen 9 4900HS
297 Seconds * -5%
Asus ROG Zephyrus G15 GA502IU-ES76
AMD Ryzen 7 4800HS
284 Seconds *
MSI GS75 10SF-609US
Intel Core i7-10875H
280 Seconds * +1%
Eluktronics RP-17
AMD Ryzen 7 4800H
248 Seconds * +13%
Eurocom Sky X4C i9-9900KS
Intel Core i9-9900KS
244 Seconds * +14%
Alienware m17 R3 P45E
Intel Core i9-10980HK
239 Seconds * +16%
7-Zip 18.03 / 7z b 4 -mmt1
Eurocom Sky X4C i9-9900KS
Intel Core i9-9900KS
5674 MIPS +22%
Alienware m17 R3 P45E
Intel Core i9-10980HK
5493 MIPS +18%
MSI GS75 10SF-609US
Intel Core i7-10875H
5232 MIPS +12%
Asus ROG Zephyrus G15 GA502IU-ES76
AMD Ryzen 7 4800HS
4655 MIPS
Asus Zephyrus G14 GA401IV
AMD Ryzen 9 4900HS
4634 MIPS 0%
Eluktronics RP-17
AMD Ryzen 7 4800H
4634 MIPS 0%
Alienware m15 R3 P87F
Intel Core i7-10750H
4504 MIPS -3%
HP Pavilion Gaming 15-ec1206ng
AMD Ryzen 5 4600H
4414 MIPS -5%
Asus ROG Zephyrus G15 GA502DU
AMD Ryzen 7 3750H
3511 MIPS -25%
7-Zip 18.03 / 7z b 4
Eurocom Sky X4C i9-9900KS
Intel Core i9-9900KS
55064 MIPS +14%
Eluktronics RP-17
AMD Ryzen 7 4800H
50428 MIPS +4%
Asus Zephyrus G14 GA401IV
AMD Ryzen 9 4900HS
48577 MIPS 0%
MSI GS75 10SF-609US
Intel Core i7-10875H
48397 MIPS 0%
Asus ROG Zephyrus G15 GA502IU-ES76
AMD Ryzen 7 4800HS
48392 MIPS
Alienware m17 R3 P45E
Intel Core i9-10980HK
46659 MIPS -4%
HP Pavilion Gaming 15-ec1206ng
AMD Ryzen 5 4600H
37625 MIPS -22%
Alienware m15 R3 P87F
Intel Core i7-10750H
35346 MIPS -27%
Asus ROG Zephyrus G15 GA502DU
AMD Ryzen 7 3750H
18689 MIPS -61%
Geekbench 5.5 / Single-Core
Eurocom Sky X4C i9-9900KS
Intel Core i9-9900KS
1372 Points +15%
Alienware m17 R3 P45E
Intel Core i9-10980HK
1351 Points +14%
MSI GS75 10SF-609US
Intel Core i7-10875H
1271 Points +7%
Alienware m15 R3 P87F
Intel Core i7-10750H
1269 Points +7%
Asus Zephyrus G14 GA401IV
AMD Ryzen 9 4900HS
1218 Points +3%
Asus ROG Zephyrus G15 GA502IU-ES76
AMD Ryzen 7 4800HS
1188 Points
Eluktronics RP-17
AMD Ryzen 7 4800H
1176 Points -1%
HP Pavilion Gaming 15-ec1206ng
AMD Ryzen 5 4600H
1116 Points -6%
Geekbench 5.5 / Multi-Core
Eurocom Sky X4C i9-9900KS
Intel Core i9-9900KS
9100 Points +18%
MSI GS75 10SF-609US
Intel Core i7-10875H
8363 Points +9%
Alienware m17 R3 P45E
Intel Core i9-10980HK
7991 Points +4%
Eluktronics RP-17
AMD Ryzen 7 4800H
7864 Points +2%
Asus ROG Zephyrus G15 GA502IU-ES76
AMD Ryzen 7 4800HS
7682 Points
Asus Zephyrus G14 GA401IV
AMD Ryzen 9 4900HS
7675 Points 0%
Alienware m15 R3 P87F
Intel Core i7-10750H
6380 Points -17%
HP Pavilion Gaming 15-ec1206ng
AMD Ryzen 5 4600H
5739 Points -25%
HWBOT x265 Benchmark v2.2 / 4k Preset
Eurocom Sky X4C i9-9900KS
Intel Core i9-9900KS
15.31 fps +28%
Alienware m17 R3 P45E
Intel Core i9-10980HK
14.6 fps +22%
Eluktronics RP-17
AMD Ryzen 7 4800H
13.1 fps +9%
MSI GS75 10SF-609US
Intel Core i7-10875H
12.8 fps +7%
Asus Zephyrus G14 GA401IV
AMD Ryzen 9 4900HS
12.19 fps +2%
Asus ROG Zephyrus G15 GA502IU-ES76
AMD Ryzen 7 4800HS
12 fps
Alienware m15 R3 P87F
Intel Core i7-10750H
11.1 fps -7%
HP Pavilion Gaming 15-ec1206ng
AMD Ryzen 5 4600H
10.4 fps -13%
Asus ROG Zephyrus G15 GA502DU
AMD Ryzen 7 3750H
4.352 fps -64%
LibreOffice / 20 Documents To PDF
HP Pavilion Gaming 15-ec1206ng
AMD Ryzen 5 4600H
73.3 s * -29%
Alienware m15 R3 P87F
Intel Core i7-10750H
60.1 s * -6%
Eluktronics RP-17
AMD Ryzen 7 4800H
57.7 s * -2%
Asus ROG Zephyrus G15 GA502IU-ES76
AMD Ryzen 7 4800HS
56.7 s *
MSI GS75 10SF-609US
Intel Core i7-10875H
50.2 s * +11%
Alienware m17 R3 P45E
Intel Core i9-10980HK
49.5 s * +13%
R Benchmark 2.5 / Overall mean
Alienware m15 R3 P87F
Intel Core i7-10750H
0.708 sec * -22%
HP Pavilion Gaming 15-ec1206ng
AMD Ryzen 5 4600H
0.61 sec * -5%
MSI GS75 10SF-609US
Intel Core i7-10875H
0.589 sec * -2%
Eluktronics RP-17
AMD Ryzen 7 4800H
0.582 sec * -0%
Asus ROG Zephyrus G15 GA502IU-ES76
AMD Ryzen 7 4800HS
0.58 sec *
Alienware m17 R3 P45E
Intel Core i9-10980HK
0.564 sec * +3%

* ... Moindre est la valeur, meilleures sont les performances

Cinebench R10 Rendering Single 32Bit
5705
Cinebench R10 Shading 32Bit
13213
Cinebench R10 Rendering Multiple CPUs 32Bit
36313
Cinebench R11.5 CPU Multi 64Bit
19.94 Points
Cinebench R11.5 OpenGL 64Bit
69.2 fps
Cinebench R11.5 CPU Single 64Bit
2.19 Points
Cinebench R15 CPU Single 64Bit
186 Points
Cinebench R15 Ref. Match 64Bit
99.6 %
Cinebench R15 OpenGL 64Bit
102 fps
Cinebench R15 CPU Multi 64Bit
1634 Points
Cinebench R20 CPU (Single Core)
482 Points
Cinebench R20 CPU (Multi Core)
3869 Points
Aide

Performances globales

Les tests PCMark surpassent largement l'ancien GA502DU, équipé du Ryzen 7 3750H de la génération précédente, tout en frôlant l'Eluktronics RP-15 intégrant le Ryzen 7 4800H non bridé. Nous n'avons pas eu de problèmes logiciels ou matériels durant le temps passé avec la machine, même si l'utilitaire Armoury Crate profiterait d'être un peu peaufiné.

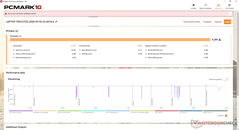
Asus Zephyrus G15 GA502IU - PCMark 10 Standard.
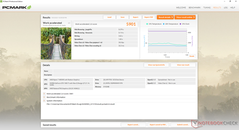
Asus Zephyrus G15 GA502IU - PCMark 8 Home Accelerated.
Asus Zephyrus G15 GA502IU - PCMark 8 Work Accelerated.
PCMark 10
Score
Razer Blade 15 RTX 2070 Super Max-Q
GeForce RTX 2070 Super Max-Q, i7-10875H, Samsung SSD PM981a MZVLB512HBJQ
6739 Points +27%
Eluktronics RP-15
GeForce RTX 2060 Mobile, R7 4800H, Phison PM81000GPMQCN28BTF-E12S4 M.2 NVM SSD
5706 Points +8%
Asus ROG Zephyrus G15 GA502IU-ES76
GeForce GTX 1660 Ti Max-Q, R7 4800HS, Intel SSD 660p 1TB SSDPEKNW010T8
5291 Points
Asus ROG Zephyrus Duo 15 GX550LXS
GeForce RTX 2080 Super Max-Q, i9-10980HK, 2x Samsung PM981a MZVLB1T0HBLR (RAID 0)
5277 Points 0%
MSI GS66 Stealth 10SE-045
GeForce RTX 2060 Mobile, i7-10750H, Samsung SSD PM981 MZVLB1T0HALR
4984 Points -6%
Lenovo Legion 5 15IMH05H
GeForce RTX 2060 Mobile, i5-10300H, Samsung PM991 MZALQ512HALU
4887 Points -8%
Asus ROG Zephyrus G15 GA502DU
GeForce GTX 1660 Ti Max-Q, R7 3750H, Intel SSD 660p SSDPEKNW512G8
4322 Points -18%
Essentials
Razer Blade 15 RTX 2070 Super Max-Q
GeForce RTX 2070 Super Max-Q, i7-10875H, Samsung SSD PM981a MZVLB512HBJQ
10341 Points +13%
Eluktronics RP-15
GeForce RTX 2060 Mobile, R7 4800H, Phison PM81000GPMQCN28BTF-E12S4 M.2 NVM SSD
9765 Points +7%
MSI GS66 Stealth 10SE-045
GeForce RTX 2060 Mobile, i7-10750H, Samsung SSD PM981 MZVLB1T0HALR
9446 Points +3%
Asus ROG Zephyrus Duo 15 GX550LXS
GeForce RTX 2080 Super Max-Q, i9-10980HK, 2x Samsung PM981a MZVLB1T0HBLR (RAID 0)
9438 Points +3%
Asus ROG Zephyrus G15 GA502IU-ES76
GeForce GTX 1660 Ti Max-Q, R7 4800HS, Intel SSD 660p 1TB SSDPEKNW010T8
9162 Points
Lenovo Legion 5 15IMH05H
GeForce RTX 2060 Mobile, i5-10300H, Samsung PM991 MZALQ512HALU
9008 Points -2%
Asus ROG Zephyrus G15 GA502DU
GeForce GTX 1660 Ti Max-Q, R7 3750H, Intel SSD 660p SSDPEKNW512G8
7424 Points -19%
Productivity
Razer Blade 15 RTX 2070 Super Max-Q
GeForce RTX 2070 Super Max-Q, i7-10875H, Samsung SSD PM981a MZVLB512HBJQ
8503 Points +20%
Lenovo Legion 5 15IMH05H
GeForce RTX 2060 Mobile, i5-10300H, Samsung PM991 MZALQ512HALU
8058 Points +14%
Asus ROG Zephyrus Duo 15 GX550LXS
GeForce RTX 2080 Super Max-Q, i9-10980HK, 2x Samsung PM981a MZVLB1T0HBLR (RAID 0)
7935 Points +12%
MSI GS66 Stealth 10SE-045
GeForce RTX 2060 Mobile, i7-10750H, Samsung SSD PM981 MZVLB1T0HALR
7671 Points +8%
Eluktronics RP-15
GeForce RTX 2060 Mobile, R7 4800H, Phison PM81000GPMQCN28BTF-E12S4 M.2 NVM SSD
7586 Points +7%
Asus ROG Zephyrus G15 GA502IU-ES76
GeForce GTX 1660 Ti Max-Q, R7 4800HS, Intel SSD 660p 1TB SSDPEKNW010T8
7082 Points
Asus ROG Zephyrus G15 GA502DU
GeForce GTX 1660 Ti Max-Q, R7 3750H, Intel SSD 660p SSDPEKNW512G8
6305 Points -11%
Digital Content Creation
Razer Blade 15 RTX 2070 Super Max-Q
GeForce RTX 2070 Super Max-Q, i7-10875H, Samsung SSD PM981a MZVLB512HBJQ
9448 Points +53%
Eluktronics RP-15
GeForce RTX 2060 Mobile, R7 4800H, Phison PM81000GPMQCN28BTF-E12S4 M.2 NVM SSD
6808 Points +10%
Asus ROG Zephyrus G15 GA502IU-ES76
GeForce GTX 1660 Ti Max-Q, R7 4800HS, Intel SSD 660p 1TB SSDPEKNW010T8
6195 Points
Asus ROG Zephyrus Duo 15 GX550LXS
GeForce RTX 2080 Super Max-Q, i9-10980HK, 2x Samsung PM981a MZVLB1T0HBLR (RAID 0)
5177 Points -16%
Asus ROG Zephyrus G15 GA502DU
GeForce GTX 1660 Ti Max-Q, R7 3750H, Intel SSD 660p SSDPEKNW512G8
4682 Points -24%
MSI GS66 Stealth 10SE-045
GeForce RTX 2060 Mobile, i7-10750H, Samsung SSD PM981 MZVLB1T0HALR
4638 Points -25%
Lenovo Legion 5 15IMH05H
GeForce RTX 2060 Mobile, i5-10300H, Samsung PM991 MZALQ512HALU
4366 Points -30%
PCMark 8
Home Score Accelerated v2
Razer Blade 15 RTX 2070 Super Max-Q
GeForce RTX 2070 Super Max-Q, i7-10875H, Samsung SSD PM981a MZVLB512HBJQ
5840 Points +19%
Eluktronics RP-15
GeForce RTX 2060 Mobile, R7 4800H, Phison PM81000GPMQCN28BTF-E12S4 M.2 NVM SSD
4937 Points 0%
Asus ROG Zephyrus G15 GA502IU-ES76
GeForce GTX 1660 Ti Max-Q, R7 4800HS, Intel SSD 660p 1TB SSDPEKNW010T8
4913 Points
MSI GS66 Stealth 10SE-045
GeForce RTX 2060 Mobile, i7-10750H, Samsung SSD PM981 MZVLB1T0HALR
4539 Points -8%
Lenovo Legion 5 15IMH05H
GeForce RTX 2060 Mobile, i5-10300H, Samsung PM991 MZALQ512HALU
3984 Points -19%
Asus ROG Zephyrus Duo 15 GX550LXS
GeForce RTX 2080 Super Max-Q, i9-10980HK, 2x Samsung PM981a MZVLB1T0HBLR (RAID 0)
3821 Points -22%
Asus ROG Zephyrus G15 GA502DU
GeForce GTX 1660 Ti Max-Q, R7 3750H, Intel SSD 660p SSDPEKNW512G8
3642 Points -26%
Work Score Accelerated v2
Razer Blade 15 RTX 2070 Super Max-Q
GeForce RTX 2070 Super Max-Q, i7-10875H, Samsung SSD PM981a MZVLB512HBJQ
6825 Points +16%
Eluktronics RP-15
GeForce RTX 2060 Mobile, R7 4800H, Phison PM81000GPMQCN28BTF-E12S4 M.2 NVM SSD
5969 Points +1%
MSI GS66 Stealth 10SE-045
GeForce RTX 2060 Mobile, i7-10750H, Samsung SSD PM981 MZVLB1T0HALR
5908 Points 0%
Asus ROG Zephyrus G15 GA502IU-ES76
GeForce GTX 1660 Ti Max-Q, R7 4800HS, Intel SSD 660p 1TB SSDPEKNW010T8
5901 Points
Lenovo Legion 5 15IMH05H
GeForce RTX 2060 Mobile, i5-10300H, Samsung PM991 MZALQ512HALU
5319 Points -10%
Asus ROG Zephyrus G15 GA502DU
GeForce GTX 1660 Ti Max-Q, R7 3750H, Intel SSD 660p SSDPEKNW512G8
4956 Points -16%
Asus ROG Zephyrus Duo 15 GX550LXS
GeForce RTX 2080 Super Max-Q, i9-10980HK, 2x Samsung PM981a MZVLB1T0HBLR (RAID 0)
4762 Points -19%
PCMark 8 Home Score Accelerated v2
4913 points
PCMark 8 Work Score Accelerated v2
5901 points
PCMark 10 Score
5291 points
Aide

Latence DPC

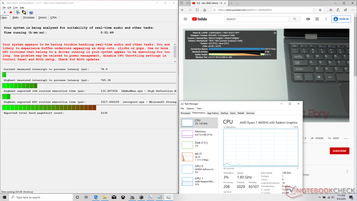
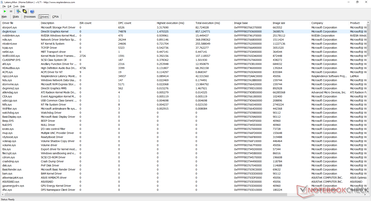
LatencyMon révèle des problèmes de latence DPC liés à storport.sys. Le visionnage vidéo 4K à 60 FPS est autrement fluide, sans perte d'images.

DPC Latencies / LatencyMon - interrupt to process latency (max), Web, Youtube, Prime95
Asus ROG Zephyrus Duo 15 GX550LXS
GeForce RTX 2080 Super Max-Q, i9-10980HK, 2x Samsung PM981a MZVLB1T0HBLR (RAID 0)
3375 μs * -366%
Razer Blade 15 RTX 2070 Super Max-Q
GeForce RTX 2070 Super Max-Q, i7-10875H, Samsung SSD PM981a MZVLB512HBJQ
1768 μs * -144%
MSI GS66 Stealth 10SE-045
GeForce RTX 2060 Mobile, i7-10750H, Samsung SSD PM981 MZVLB1T0HALR
1154 μs * -59%
Asus ROG Zephyrus G15 GA502IU-ES76
GeForce GTX 1660 Ti Max-Q, R7 4800HS, Intel SSD 660p 1TB SSDPEKNW010T8
725 μs *
Lenovo Legion 5 15IMH05H
GeForce RTX 2060 Mobile, i5-10300H, Samsung PM991 MZALQ512HALU
723 μs * -0%
Eluktronics RP-15
GeForce RTX 2060 Mobile, R7 4800H, Phison PM81000GPMQCN28BTF-E12S4 M.2 NVM SSD
515 μs * +29%

* ... Moindre est la valeur, meilleures sont les performances

Stockage

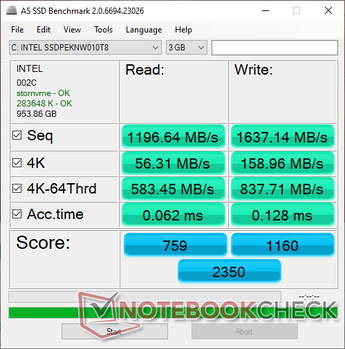
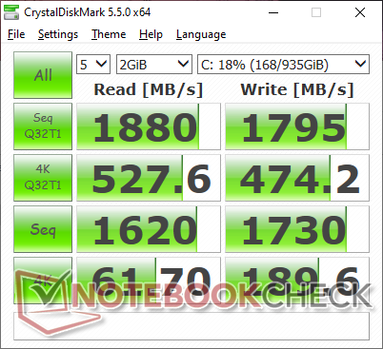
Asus s'en tient aux SSD NVMe Intel 660p du milieu de gamme pour sa série intermédiaire G1502, alors que des portables Asus ROG plus chers, comme le Zephyrus Duo, sont proposés avec des disques Samsung plus rapides. Le SSD Intel de 1 To de notre machine possède une vitesse maximale en lecture et en écriture de 1 800 Mo/s, contre 3000 ou plus pour la série Samsung PM981.

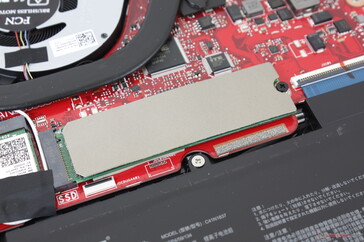
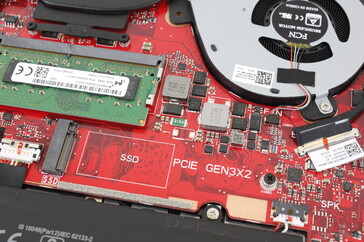
L'on a accès à deux emplacements de stockage (M.2 2280 + M.2 2242). A noter, l'emplacement plus petit M.2 2242 est en PCIe x2 seulement.

Asus Zephyrus G15 GA502IU - AS SSD.
Asus Zephyrus G15 GA502IU - CDM 5.5.
Asus Zephyrus G15 GA502IU - Emplacement principal M.2 2280.
Asus Zephyrus G15 GA502IU - Emplacement secondaire M.2 2242 vide, pour ajout.
Asus ROG Zephyrus G15 GA502IU-ES76
Intel SSD 660p 1TB SSDPEKNW010T8
Asus ROG Zephyrus Duo 15 GX550LXS
2x Samsung PM981a MZVLB1T0HBLR (RAID 0)
Asus ROG Zephyrus G15 GA502DU
Intel SSD 660p SSDPEKNW512G8
Razer Blade 15 RTX 2070 Super Max-Q
Samsung SSD PM981a MZVLB512HBJQ
Lenovo Legion 5 15IMH05H
Samsung PM991 MZALQ512HALU
MSI GS66 Stealth 10SE-045
Samsung SSD PM981 MZVLB1T0HALR
AS SSD
60%
-20%
56%
1%
72%
Seq Read
1197
2981
149%
907
-24%
1957
63%
2012
68%
2612
118%
Seq Write
1637
2783
70%
926
-43%
2092
28%
1261
-23%
2368
45%
4K Read
56.3
43.98
-22%
47.26
-16%
50.2
-11%
43.66
-22%
51.1
-9%
4K Write
159
113.9
-28%
98.7
-38%
96.5
-39%
109.3
-31%
135.9
-15%
4K-64 Read
583
1519
161%
321.5
-45%
1594
173%
851
46%
1635
180%
4K-64 Write
838
1296
55%
736
-12%
2005
139%
780
-7%
1831
118%
Access Time Read *
0.062
0.062
-0%
0.064
-3%
0.057
8%
0.117
-89%
0.042
32%
Access Time Write *
0.128
0.033
74%
0.045
65%
0.112
12%
0.036
72%
0.028
78%
Score Read
759
1861
145%
459
-40%
1840
142%
1096
44%
1947
157%
Score Write
1160
1688
46%
927
-20%
2310
99%
1016
-12%
2204
90%
Score Total
2350
4492
91%
1641
-30%
5103
117%
2643
12%
5138
119%
Copy ISO MB/s
1376
2438
77%
905
-34%
1793
30%
1481
8%
2334
70%
Copy Program MB/s
568
604
6%
496.9
-13%
573
1%
467.5
-18%
569
0%
Copy Game MB/s
1180
1404
19%
819
-31%
1418
20%
734
-38%
1401
19%
CrystalDiskMark 5.2 / 6
35%
-33%
21%
-14%
16%
Write 4K
189.6
127.6
-33%
132.2
-30%
139.8
-26%
145.4
-23%
156.3
-18%
Read 4K
61.7
48.4
-22%
55.5
-10%
48.62
-21%
51.6
-16%
47.65
-23%
Write Seq
1730
2958
71%
986
-43%
2260
31%
1007
-42%
2374
37%
Read Seq
1620
2984
84%
1318
-19%
2135
32%
1145
-29%
2045
26%
Write 4K Q32T1
474.2
472.7
0%
220.3
-54%
499.3
5%
468.4
-1%
431.3
-9%
Read 4K Q32T1
528
529
0%
315.5
-40%
552
5%
528
0%
509
-4%
Write Seq Q32T1
1795
3431
91%
987
-45%
2960
65%
1381
-23%
2385
33%
Read Seq Q32T1
1880
3536
88%
1416
-25%
3269
74%
2291
22%
3505
86%
Moyenne finale (programmes/paramètres)
48% / 51%
-27% / -25%
39% / 43%
-7% / -5%
44% / 51%

* ... Moindre est la valeur, meilleures sont les performances

Intel SSD 660p 1TB SSDPEKNW010T8
CDM 5/6 Read Seq Q32T1: 1880 MB/s
CDM 5/6 Write Seq Q32T1: 1795 MB/s
CDM 5/6 Read 4K Q32T1: 528 MB/s
CDM 5/6 Write 4K Q32T1: 474.2 MB/s
CDM 5 Read Seq: 1620 MB/s
CDM 5 Write Seq: 1730 MB/s
CDM 5/6 Read 4K: 61.7 MB/s
CDM 5/6 Write 4K: 189.6 MB/s

Disk Throttling: DiskSpd Read Loop, Queue Depth 8

No graph data

Performances graphiques

La GTX 1660 Ti Max-Q n'est que de 10 % moins puissante que la GTX 1660 Ti mobile classique. Venir de la RTX 2060 mobile va permettre un gain de performances de 15 à 20 %, sans prendre en compte le RT.

Consultez notre page dédiée à la GeForce GTX 1660 Ti Max-Q, avec plus d'informations techniques et de tests.

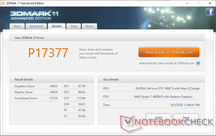
Asus Zephyrus G15 GA502IU - 3DMark 11.
Asus Zephyrus G15 GA502IU - Cloud Gate.
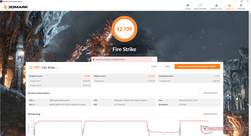
Asus Zephyrus G15 GA502IU - Fire Strike.
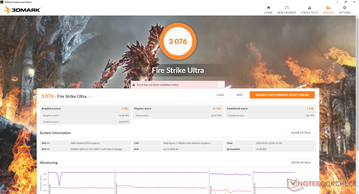
Asus Zephyrus G15 GA502IU - Fire Strike Ultra.
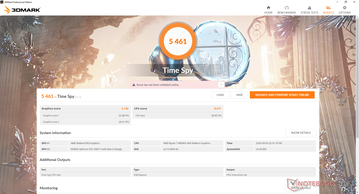
Asus Zephyrus G15 GA502IU - Time Spy.
 
3DMark
1920x1080 Fire Strike Graphics
Razer Blade 15 RTX 2080 Super Max-Q
NVIDIA GeForce RTX 2080 Super Max-Q, i7-10875H
21479 Points +55%
Aorus 15G XB
NVIDIA GeForce RTX 2070 Super Max-Q, i7-10875H
21150 Points +52%
MSI RTX 2060 Gaming Z 6G
NVIDIA GeForce RTX 2060 (Desktop), R7 2700X
19338 Points +39%
Dell G5 15 SE 5505 P89F
AMD Radeon RX 5600M, R7 4800H
18807 Points +36%
Acer Predator Helios 500 PH517-51-79BY
NVIDIA GeForce GTX 1070 Mobile, i7-8750H
17649 Points +27%
MSI GS66 Stealth 10SE-045
NVIDIA GeForce RTX 2060 Mobile, i7-10750H
15704 Points +13%
Asus TUF A17 FA706IU-AS76
NVIDIA GeForce GTX 1660 Ti Mobile, R7 4800H
15334 Points +11%
Asus ROG Zephyrus G15 GA502IU-ES76
NVIDIA GeForce GTX 1660 Ti Max-Q, R7 4800HS
13870 Points
Moyenne NVIDIA GeForce GTX 1660 Ti Max-Q
  (12903 - 13870, n=7)
13356 Points -4%
Asus ROG Zephyrus G15 GA502DU
NVIDIA GeForce GTX 1660 Ti Max-Q, R7 3750H
13355 Points -4%
MSI Bravo 17 A4DDR
AMD Radeon RX 5500M, R7 4800H
12753 Points -8%
Asus Zephyrus S GX531GM
NVIDIA GeForce GTX 1060 Mobile, i7-8750H
11332 Points -18%
Asus ROG Strix G15 G512LI
NVIDIA GeForce GTX 1650 Ti Mobile, i7-10750H
10663 Points -23%
Lenovo IdeaPad Gaming 3i 15IMH05
NVIDIA GeForce GTX 1650 Mobile, i5-10300H
9480 Points -32%
2560x1440 Time Spy Graphics
Razer Blade 15 RTX 2080 Super Max-Q
NVIDIA GeForce RTX 2080 Super Max-Q, i7-10875H
7766 Points +51%
MSI RTX 2060 Gaming Z 6G
NVIDIA GeForce RTX 2060 (Desktop), R7 2700X
7732 Points +51%
Aorus 15G XB
NVIDIA GeForce RTX 2070 Super Max-Q, i7-10875H
7343 Points +43%
Dell G5 15 SE 5505 P89F
AMD Radeon RX 5600M, R7 4800H
6312 Points +23%
MSI GS66 Stealth 10SE-045
NVIDIA GeForce RTX 2060 Mobile, i7-10750H
5979 Points +17%
Asus TUF A17 FA706IU-AS76
NVIDIA GeForce GTX 1660 Ti Mobile, R7 4800H
5744 Points +12%
Acer Predator Helios 500 PH517-51-79BY
NVIDIA GeForce GTX 1070 Mobile, i7-8750H
5730 Points +12%
Asus ROG Zephyrus G15 GA502IU-ES76
NVIDIA GeForce GTX 1660 Ti Max-Q, R7 4800HS
5130 Points
Moyenne NVIDIA GeForce GTX 1660 Ti Max-Q
  (4867 - 5440, n=8)
5089 Points -1%
Asus ROG Zephyrus G15 GA502DU
NVIDIA GeForce GTX 1660 Ti Max-Q, R7 3750H
4867 Points -5%
MSI Bravo 17 A4DDR
AMD Radeon RX 5500M, R7 4800H
4331 Points -16%
Asus ROG Strix G15 G512LI
NVIDIA GeForce GTX 1650 Ti Mobile, i7-10750H
3841 Points -25%
Asus Zephyrus S GX531GM
NVIDIA GeForce GTX 1060 Mobile, i7-8750H
3626 Points -29%
Lenovo IdeaPad Gaming 3i 15IMH05
NVIDIA GeForce GTX 1650 Mobile, i5-10300H
3475 Points -32%
2560x1440 Time Spy Score
MSI RTX 2060 Gaming Z 6G
NVIDIA GeForce RTX 2060 (Desktop), R7 2700X
7878 Points +44%
Razer Blade 15 RTX 2080 Super Max-Q
NVIDIA GeForce RTX 2080 Super Max-Q, i7-10875H
7683 Points +41%
Aorus 15G XB
NVIDIA GeForce RTX 2070 Super Max-Q, i7-10875H
7590 Points +39%
Dell G5 15 SE 5505 P89F
AMD Radeon RX 5600M, R7 4800H
6610 Points +21%
Asus TUF A17 FA706IU-AS76
NVIDIA GeForce GTX 1660 Ti Mobile, R7 4800H
6045 Points +11%
MSI GS66 Stealth 10SE-045
NVIDIA GeForce RTX 2060 Mobile, i7-10750H
6038 Points +11%
Acer Predator Helios 500 PH517-51-79BY
NVIDIA GeForce GTX 1070 Mobile, i7-8750H
5741 Points +5%
Asus ROG Zephyrus G15 GA502IU-ES76
NVIDIA GeForce GTX 1660 Ti Max-Q, R7 4800HS
5461 Points
Moyenne NVIDIA GeForce GTX 1660 Ti Max-Q
  (4547 - 6395, n=7)
5197 Points -5%
MSI Bravo 17 A4DDR
AMD Radeon RX 5500M, R7 4800H
4712 Points -14%
Asus ROG Zephyrus G15 GA502DU
NVIDIA GeForce GTX 1660 Ti Max-Q, R7 3750H
4547 Points -17%
Asus ROG Strix G15 G512LI
NVIDIA GeForce GTX 1650 Ti Mobile, i7-10750H
4131 Points -24%
Asus Zephyrus S GX531GM
NVIDIA GeForce GTX 1060 Mobile, i7-8750H
3795 Points -31%
Lenovo IdeaPad Gaming 3i 15IMH05
NVIDIA GeForce GTX 1650 Mobile, i5-10300H
3621 Points -34%
3DMark 11
1280x720 Performance GPU
Razer Blade 15 RTX 2080 Super Max-Q
NVIDIA GeForce RTX 2080 Super Max-Q, i7-10875H
28200 Points +51%
Aorus 15G XB
NVIDIA GeForce RTX 2070 Super Max-Q, i7-10875H
27715 Points +49%
MSI RTX 2060 Gaming Z 6G
NVIDIA GeForce RTX 2060 (Desktop), R7 2700X
26413 Points +42%
Dell G5 15 SE 5505 P89F
AMD Radeon RX 5600M, R7 4800H
25706 Points +38%
MSI GS66 Stealth 10SE-045
NVIDIA GeForce RTX 2060 Mobile, i7-10750H
21102 Points +13%
Asus TUF A17 FA706IU-AS76
NVIDIA GeForce GTX 1660 Ti Mobile, R7 4800H
20793 Points +11%
Asus ROG Zephyrus G15 GA502IU-ES76
NVIDIA GeForce GTX 1660 Ti Max-Q, R7 4800HS
18653 Points
Moyenne NVIDIA GeForce GTX 1660 Ti Max-Q
  (17010 - 18653, n=8)
17711 Points -5%
Asus ROG Zephyrus G15 GA502DU
NVIDIA GeForce GTX 1660 Ti Max-Q, R7 3750H
17170 Points -8%
MSI Bravo 17 A4DDR
AMD Radeon RX 5500M, R7 4800H
16937 Points -9%
Asus ROG Strix G15 G512LI
NVIDIA GeForce GTX 1650 Ti Mobile, i7-10750H
14231 Points -24%
Asus Zephyrus S GX531GM
NVIDIA GeForce GTX 1060 Mobile, i7-8750H
12620 Points -32%
Lenovo IdeaPad Gaming 3i 15IMH05
NVIDIA GeForce GTX 1650 Mobile, i5-10300H
12585 Points -33%
1280x720 Performance Combined
MSI RTX 2060 Gaming Z 6G
NVIDIA GeForce RTX 2060 (Desktop), R7 2700X
13742 Points 0%
Asus ROG Zephyrus G15 GA502IU-ES76
NVIDIA GeForce GTX 1660 Ti Max-Q, R7 4800HS
13724 Points
Asus TUF A17 FA706IU-AS76
NVIDIA GeForce GTX 1660 Ti Mobile, R7 4800H
13311 Points -3%
MSI Bravo 17 A4DDR
AMD Radeon RX 5500M, R7 4800H
13223 Points -4%
Dell G5 15 SE 5505 P89F
AMD Radeon RX 5600M, R7 4800H
13126 Points -4%
Asus ROG Strix G15 G512LI
NVIDIA GeForce GTX 1650 Ti Mobile, i7-10750H
12993 Points -5%
MSI GS66 Stealth 10SE-045
NVIDIA GeForce RTX 2060 Mobile, i7-10750H
12854 Points -6%
Razer Blade 15 RTX 2080 Super Max-Q
NVIDIA GeForce RTX 2080 Super Max-Q, i7-10875H
11707 Points -15%
Moyenne NVIDIA GeForce GTX 1660 Ti Max-Q
  (6644 - 14112, n=7)
10910 Points -21%
Lenovo IdeaPad Gaming 3i 15IMH05
NVIDIA GeForce GTX 1650 Mobile, i5-10300H
9855 Points -28%
Asus Zephyrus S GX531GM
NVIDIA GeForce GTX 1060 Mobile, i7-8750H
6839 Points -50%
Asus ROG Zephyrus G15 GA502DU
NVIDIA GeForce GTX 1660 Ti Max-Q, R7 3750H
6644 Points -52%
3DMark 06 Standard Score
25384 points
3DMark 11 Performance
17377 points
3DMark Cloud Gate Standard Score
38220 points
3DMark Fire Strike Score
12739 points
3DMark Time Spy Score
5461 points
Aide

Gaming Performance

Le Dell G5 15 SE avec la Radeon RX 5600M est de 10 à 10 % plus rapide en jeu que notre Asus, mais avec une consommation bien plus élevée. Les taux d'image sont de 5 à 35 % plus rapides qu'avec l'ancien GA502DU, en fonction des exigences processeur du jeu, bien que le GA502IU utilise le même GPU. Metro Exodus à un réglage bas 720p, par exemple, est de 26 % plus rapide avec le GA502IU, ce qui va certainement à tirer parti au mieux du taux de rafraîchissement élevé de l'écran.

Borderlands 3
1280x720 Very Low Overall Quality (DX11)
Razer Blade 15 RTX 2080 Super Max-Q
Intel Core i7-10875H, NVIDIA GeForce RTX 2080 Super Max-Q
128.3 fps +10%
Eluktronics RP-15
AMD Ryzen 7 4800H, NVIDIA GeForce RTX 2060 Mobile
118.1 fps +1%
Asus Zephyrus G14 GA401IV
AMD Ryzen 9 4900HS, NVIDIA GeForce RTX 2060 Max-Q
117 fps 0%
Asus ROG Zephyrus G15 GA502IU-ES76
AMD Ryzen 7 4800HS, NVIDIA GeForce GTX 1660 Ti Max-Q
116.5 fps
Lenovo IdeaPad Gaming 3i 15IMH05
Intel Core i5-10300H, NVIDIA GeForce GTX 1650 Mobile
115.7 fps -1%
Asus TUF A17 FA706IU-AS76
AMD Ryzen 7 4800H, NVIDIA GeForce GTX 1660 Ti Mobile
107.9 fps -7%
Dell G5 15 SE 5505 P89F
AMD Ryzen 7 4800H, AMD Radeon RX 5600M
105.2 fps -10%
Moyenne NVIDIA GeForce GTX 1660 Ti Max-Q
  (87 - 116.5, n=2)
101.8 fps -13%
1920x1080 Medium Overall Quality (DX11)
Razer Blade 15 RTX 2080 Super Max-Q
Intel Core i7-10875H, NVIDIA GeForce RTX 2080 Super Max-Q
101.6 fps +25%
Asus Zephyrus G14 GA401IV
AMD Ryzen 9 4900HS, NVIDIA GeForce RTX 2060 Max-Q
89.5 fps +10%
Eluktronics RP-15
AMD Ryzen 7 4800H, NVIDIA GeForce RTX 2060 Mobile
88.1 fps +8%
Asus TUF A17 FA706IU-AS76
AMD Ryzen 7 4800H, NVIDIA GeForce GTX 1660 Ti Mobile
87.5 fps +7%
Dell G5 15 SE 5505 P89F
AMD Ryzen 7 4800H, AMD Radeon RX 5600M
81.7 fps 0%
Asus ROG Zephyrus G15 GA502IU-ES76
AMD Ryzen 7 4800HS, NVIDIA GeForce GTX 1660 Ti Max-Q
81.5 fps
Moyenne NVIDIA GeForce GTX 1660 Ti Max-Q
  (72.1 - 81.5, n=2)
76.8 fps -6%
Lenovo IdeaPad Gaming 3i 15IMH05
Intel Core i5-10300H, NVIDIA GeForce GTX 1650 Mobile
60.1 fps -26%
1920x1080 High Overall Quality (DX11)
Razer Blade 15 RTX 2080 Super Max-Q
Intel Core i7-10875H, NVIDIA GeForce RTX 2080 Super Max-Q
78.2 fps +42%
Asus Zephyrus G14 GA401IV
AMD Ryzen 9 4900HS, NVIDIA GeForce RTX 2060 Max-Q
61.9 fps +13%
Asus TUF A17 FA706IU-AS76
AMD Ryzen 7 4800H, NVIDIA GeForce GTX 1660 Ti Mobile
61.7 fps +12%
Dell G5 15 SE 5505 P89F
AMD Ryzen 7 4800H, AMD Radeon RX 5600M
61.2 fps +11%
Eluktronics RP-15
AMD Ryzen 7 4800H, NVIDIA GeForce RTX 2060 Mobile
61 fps +11%
Asus ROG Zephyrus G15 GA502IU-ES76
AMD Ryzen 7 4800HS, NVIDIA GeForce GTX 1660 Ti Max-Q
54.9 fps
Moyenne NVIDIA GeForce GTX 1660 Ti Max-Q
  (52.9 - 54.9, n=2)
53.9 fps -2%
MSI Bravo 17 A4DDR
AMD Ryzen 7 4800H, AMD Radeon RX 5500M
47.9 fps -13%
Lenovo IdeaPad Gaming 3i 15IMH05
Intel Core i5-10300H, NVIDIA GeForce GTX 1650 Mobile
39.2 fps -29%
1920x1080 Badass Overall Quality (DX11)
Razer Blade 15 RTX 2080 Super Max-Q
Intel Core i7-10875H, NVIDIA GeForce RTX 2080 Super Max-Q
62.5 fps +48%
Asus Zephyrus G14 GA401IV
AMD Ryzen 9 4900HS, NVIDIA GeForce RTX 2060 Max-Q
48.3 fps +14%
Asus TUF A17 FA706IU-AS76
AMD Ryzen 7 4800H, NVIDIA GeForce GTX 1660 Ti Mobile
47.8 fps +13%
Dell G5 15 SE 5505 P89F
AMD Ryzen 7 4800H, AMD Radeon RX 5600M
47.8 fps +13%
Eluktronics RP-15
AMD Ryzen 7 4800H, NVIDIA GeForce RTX 2060 Mobile
47.5 fps +12%
Asus ROG Zephyrus G15 GA502IU-ES76
AMD Ryzen 7 4800HS, NVIDIA GeForce GTX 1660 Ti Max-Q
42.3 fps
Moyenne NVIDIA GeForce GTX 1660 Ti Max-Q
  (41.5 - 42.3, n=2)
41.9 fps -1%
MSI Bravo 17 A4DDR
AMD Ryzen 7 4800H, AMD Radeon RX 5500M
35.9 fps -15%
Lenovo IdeaPad Gaming 3i 15IMH05
Intel Core i5-10300H, NVIDIA GeForce GTX 1650 Mobile
34.6 fps -18%
Metro Exodus
1280x720 Low Quality AF:4x
Dell G5 15 SE 5505 P89F
AMD Ryzen 7 4800H, AMD Radeon RX 5600M
146.4 (79.7min - 221.4max) fps +13%
MSI GS66 Stealth 10SE-045
Intel Core i7-10750H, NVIDIA GeForce RTX 2060 Mobile
140.9 fps +9%
Eluktronics RP-15
AMD Ryzen 7 4800H, NVIDIA GeForce RTX 2060 Mobile
132.8 (77min - 191.7max) fps +3%
Razer Blade 15 RTX 2080 Super Max-Q
Intel Core i7-10875H, NVIDIA GeForce RTX 2080 Super Max-Q
131 fps +1%
Asus Zephyrus G14 GA401IV
AMD Ryzen 9 4900HS, NVIDIA GeForce RTX 2060 Max-Q
129.6 (75.5min - 186.7max) fps 0%
Asus ROG Zephyrus G15 GA502IU-ES76
AMD Ryzen 7 4800HS, NVIDIA GeForce GTX 1660 Ti Max-Q
129.5 (68.5min - 198.1max) fps
MSI RTX 2060 Gaming Z 6G
AMD Ryzen 7 2700X, NVIDIA GeForce RTX 2060 (Desktop)
127.8 (72min - 189max) fps -1%
Dell G5 15 5590
Intel Core i7-8750H, NVIDIA GeForce RTX 2060 Mobile
113.2 fps -13%
Asus TUF A17 FA706IU-AS76
AMD Ryzen 7 4800H, NVIDIA GeForce GTX 1660 Ti Mobile
112.4 (57min - 159.5max) fps -13%
Moyenne NVIDIA GeForce GTX 1660 Ti Max-Q
  (83.5 - 129.5, n=3)
103.2 fps -20%
Lenovo IdeaPad Gaming 3i 15IMH05
Intel Core i5-10300H, NVIDIA GeForce GTX 1650 Mobile
98.9 fps -24%
Asus ROG Zephyrus G15 GA502DU
AMD Ryzen 7 3750H, NVIDIA GeForce GTX 1660 Ti Max-Q
96.6 fps -25%
1920x1080 Medium Quality AF:4x
Razer Blade 15 RTX 2080 Super Max-Q
Intel Core i7-10875H, NVIDIA GeForce RTX 2080 Super Max-Q
93.2 fps +40%
MSI RTX 2060 Gaming Z 6G
AMD Ryzen 7 2700X, NVIDIA GeForce RTX 2060 (Desktop)
85.4 (41min - 145max) fps +28%
Dell G5 15 SE 5505 P89F
AMD Ryzen 7 4800H, AMD Radeon RX 5600M
75.5 (35.7min - 108max) fps +14%
Asus TUF A17 FA706IU-AS76
AMD Ryzen 7 4800H, NVIDIA GeForce GTX 1660 Ti Mobile
73.7 (34.3min - 120.6max) fps +11%
Asus Zephyrus G14 GA401IV
AMD Ryzen 9 4900HS, NVIDIA GeForce RTX 2060 Max-Q
72.7 (37.3min - 116.3max) fps +9%
Eluktronics RP-15
AMD Ryzen 7 4800H, NVIDIA GeForce RTX 2060 Mobile
71.8 (36.2min - 113.4max) fps +8%
Dell G5 15 5590
Intel Core i7-8750H, NVIDIA GeForce RTX 2060 Mobile
70 fps +5%
MSI GS66 Stealth 10SE-045
Intel Core i7-10750H, NVIDIA GeForce RTX 2060 Mobile
69.9 fps +5%
Asus ROG Zephyrus G15 GA502IU-ES76
AMD Ryzen 7 4800HS, NVIDIA GeForce GTX 1660 Ti Max-Q
66.5 (31.4min - 99.5max) fps
Moyenne NVIDIA GeForce GTX 1660 Ti Max-Q
  (53.9 - 66.5, n=3)
60.1 fps -10%
Asus ROG Zephyrus G15 GA502DU
AMD Ryzen 7 3750H, NVIDIA GeForce GTX 1660 Ti Max-Q
53.9 fps -19%
Lenovo IdeaPad Gaming 3i 15IMH05
Intel Core i5-10300H, NVIDIA GeForce GTX 1650 Mobile
46.1 fps -31%
1920x1080 High Quality AF:16x
Razer Blade 15 RTX 2080 Super Max-Q
Intel Core i7-10875H, NVIDIA GeForce RTX 2080 Super Max-Q
70.3 fps +43%
MSI RTX 2060 Gaming Z 6G
AMD Ryzen 7 2700X, NVIDIA GeForce RTX 2060 (Desktop)
63.9 (33min - 104max) fps +30%
Asus Zephyrus G14 GA401IV
AMD Ryzen 9 4900HS, NVIDIA GeForce RTX 2060 Max-Q
55.2 (29.6min - 83max) fps +12%
Dell G5 15 SE 5505 P89F
AMD Ryzen 7 4800H, AMD Radeon RX 5600M
55.2 (27.3min - 85.2max) fps +12%
Asus TUF A17 FA706IU-AS76
AMD Ryzen 7 4800H, NVIDIA GeForce GTX 1660 Ti Mobile
54.4 (26.8min - 83max) fps +11%
Eluktronics RP-15
AMD Ryzen 7 4800H, NVIDIA GeForce RTX 2060 Mobile
54.3 (29.2min - 82.4max) fps +11%
MSI GS66 Stealth 10SE-045
Intel Core i7-10750H, NVIDIA GeForce RTX 2060 Mobile
53.4 fps +9%
Dell G5 15 5590
Intel Core i7-8750H, NVIDIA GeForce RTX 2060 Mobile
53.3 fps +9%
Asus ROG Zephyrus G15 GA502IU-ES76
AMD Ryzen 7 4800HS, NVIDIA GeForce GTX 1660 Ti Max-Q
49.1 (25.5min - 72.9max) fps
Moyenne NVIDIA GeForce GTX 1660 Ti Max-Q
  (45.1 - 49.1, n=3)
46.9 fps -4%
Asus ROG Zephyrus G15 GA502DU
AMD Ryzen 7 3750H, NVIDIA GeForce GTX 1660 Ti Max-Q
46.6 fps -5%
Lenovo IdeaPad Gaming 3i 15IMH05
Intel Core i5-10300H, NVIDIA GeForce GTX 1650 Mobile
34.2 fps -30%
1920x1080 Ultra Quality AF:16x
Razer Blade 15 RTX 2080 Super Max-Q
Intel Core i7-10875H, NVIDIA GeForce RTX 2080 Super Max-Q
57.2 fps +49%
MSI RTX 2060 Gaming Z 6G
AMD Ryzen 7 2700X, NVIDIA GeForce RTX 2060 (Desktop)
52.7 (29min - 82max) fps +38%
Dell G5 15 SE 5505 P89F
AMD Ryzen 7 4800H, AMD Radeon RX 5600M
44.9 (24.5min - 66.6max) fps +17%
Asus Zephyrus G14 GA401IV
AMD Ryzen 9 4900HS, NVIDIA GeForce RTX 2060 Max-Q
43.8 (26.3min - 63.1max) fps +14%
Dell G5 15 5590
Intel Core i7-8750H, NVIDIA GeForce RTX 2060 Mobile
43.7 fps +14%
Eluktronics RP-15
AMD Ryzen 7 4800H, NVIDIA GeForce RTX 2060 Mobile
43 (25.6min - 62.3max) fps +12%
Asus TUF A17 FA706IU-AS76
AMD Ryzen 7 4800H, NVIDIA GeForce GTX 1660 Ti Mobile
42.6 (24min - 62.8max) fps +11%
MSI GS66 Stealth 10SE-045
Intel Core i7-10750H, NVIDIA GeForce RTX 2060 Mobile
42.2 fps +10%
Asus ROG Zephyrus G15 GA502IU-ES76
AMD Ryzen 7 4800HS, NVIDIA GeForce GTX 1660 Ti Max-Q
38.3 (22.1min, 56.1P1) fps
Moyenne NVIDIA GeForce GTX 1660 Ti Max-Q
  (35.1 - 38.3, n=3)
36.7 fps -4%
Asus ROG Zephyrus G15 GA502DU
AMD Ryzen 7 3750H, NVIDIA GeForce GTX 1660 Ti Max-Q
35.1 fps -8%
Lenovo IdeaPad Gaming 3i 15IMH05
Intel Core i5-10300H, NVIDIA GeForce GTX 1650 Mobile
26.6 fps -31%
Shadow of the Tomb Raider
1280x720 Lowest Preset
Eurocom Sky X4C i9-9900KS
Intel Core i9-9900KS, NVIDIA GeForce RTX 2080 Mobile
178 fps +58%
MSI GS75 10SF-609US
Intel Core i7-10875H, NVIDIA GeForce RTX 2070 Max-Q
161 fps +42%
Alienware m15 R3 P87F
Intel Core i7-10750H, NVIDIA GeForce RTX 2070 Mobile
138 fps +22%
MSI RTX 2060 Gaming Z 6G
AMD Ryzen 7 2700X, NVIDIA GeForce RTX 2060 (Desktop)
133 fps +18%
Walmart EVOO Gaming 17
Intel Core i7-9750H, NVIDIA GeForce RTX 2060 Mobile
133 fps +18%
Aorus 15G XB
Intel Core i7-10875H, NVIDIA GeForce RTX 2070 Super Max-Q
133 fps +18%
Lenovo Legion 5 15IMH05H
Intel Core i5-10300H, NVIDIA GeForce RTX 2060 Mobile
125 fps +11%
Dell G5 15 SE 5505 P89F
AMD Ryzen 7 4800H, AMD Radeon RX 5600M
122 fps +8%
Asus Zephyrus G14 GA401IV
AMD Ryzen 9 4900HS, NVIDIA GeForce RTX 2060 Max-Q
118 (85min - 177max) fps +4%
Eluktronics RP-15
AMD Ryzen 7 4800H, NVIDIA GeForce RTX 2060 Mobile
118 fps +4%
Razer Blade 15 RTX 2080 Super Max-Q
Intel Core i7-10875H, NVIDIA GeForce RTX 2080 Super Max-Q
117 fps +4%
MSI GS66 Stealth 10SE-045
Intel Core i7-10750H, NVIDIA GeForce RTX 2060 Mobile
114 fps +1%
Asus ROG Zephyrus G15 GA502IU-ES76
AMD Ryzen 7 4800HS, NVIDIA GeForce GTX 1660 Ti Max-Q
113 (85min - 167max) fps
Asus Zephyrus S GX531GM
Intel Core i7-8750H, NVIDIA GeForce GTX 1060 Mobile
111 fps -2%
Asus TUF A17 FA706IU-AS76
AMD Ryzen 7 4800H, NVIDIA GeForce GTX 1660 Ti Mobile
108 fps -4%
Asus ROG Zephyrus Duo 15 GX550LXS
Intel Core i9-10980HK, NVIDIA GeForce RTX 2080 Super Max-Q
103 fps -9%
Lenovo IdeaPad Gaming 3i 15IMH05
Intel Core i5-10300H, NVIDIA GeForce GTX 1650 Mobile
101 fps -11%
Moyenne NVIDIA GeForce GTX 1660 Ti Max-Q
  (62 - 126, n=4)
95.8 fps -15%
HP Pavilion Gaming 15-ec1206ng
AMD Ryzen 5 4600H, NVIDIA GeForce GTX 1650 Mobile
95 fps -16%
Asus ROG Zephyrus G15 GA502DU
AMD Ryzen 7 3750H, NVIDIA GeForce GTX 1660 Ti Max-Q
62 fps -45%
1920x1080 Medium Preset
Eurocom Sky X4C i9-9900KS
Intel Core i9-9900KS, NVIDIA GeForce RTX 2080 Mobile
141 fps +66%
Aorus 15G XB
Intel Core i7-10875H, NVIDIA GeForce RTX 2070 Super Max-Q
112 fps +32%
Alienware m15 R3 P87F
Intel Core i7-10750H, NVIDIA GeForce RTX 2070 Mobile
111 fps +31%
MSI GS75 10SF-609US
Intel Core i7-10875H, NVIDIA GeForce RTX 2070 Max-Q
110 fps +29%
MSI RTX 2060 Gaming Z 6G
AMD Ryzen 7 2700X, NVIDIA GeForce RTX 2060 (Desktop)
107 fps +26%
Razer Blade 15 RTX 2080 Super Max-Q
Intel Core i7-10875H, NVIDIA GeForce RTX 2080 Super Max-Q
104 fps +22%
Walmart EVOO Gaming 17
Intel Core i7-9750H, NVIDIA GeForce RTX 2060 Mobile
100 fps +18%
Lenovo Legion 5 15IMH05H
Intel Core i5-10300H, NVIDIA GeForce RTX 2060 Mobile
97 fps +14%
Asus ROG Zephyrus Duo 15 GX550LXS
Intel Core i9-10980HK, NVIDIA GeForce RTX 2080 Super Max-Q
95 fps +12%
MSI GS66 Stealth 10SE-045
Intel Core i7-10750H, NVIDIA GeForce RTX 2060 Mobile
93 fps +9%
Eluktronics RP-15
AMD Ryzen 7 4800H, NVIDIA GeForce RTX 2060 Mobile
91 fps +7%
Asus Zephyrus G14 GA401IV
AMD Ryzen 9 4900HS, NVIDIA GeForce RTX 2060 Max-Q
90 (74min - 136max) fps +6%
Dell G5 15 SE 5505 P89F
AMD Ryzen 7 4800H, AMD Radeon RX 5600M
89 fps +5%
Asus TUF A17 FA706IU-AS76
AMD Ryzen 7 4800H, NVIDIA GeForce GTX 1660 Ti Mobile
87 fps +2%
Asus ROG Zephyrus G15 GA502IU-ES76
AMD Ryzen 7 4800HS, NVIDIA GeForce GTX 1660 Ti Max-Q
85 (66min - 132max) fps
Moyenne NVIDIA GeForce GTX 1660 Ti Max-Q
  (53 - 85, n=4)
69.5 fps -18%
Lenovo IdeaPad Gaming 3i 15IMH05
Intel Core i5-10300H, NVIDIA GeForce GTX 1650 Mobile
63 fps -26%
HP Pavilion Gaming 15-ec1206ng
AMD Ryzen 5 4600H, NVIDIA GeForce GTX 1650 Mobile
62 fps -27%
Asus ROG Zephyrus G15 GA502DU
AMD Ryzen 7 3750H, NVIDIA GeForce GTX 1660 Ti Max-Q
57 fps -33%
Asus Zephyrus S GX531GM
Intel Core i7-8750H, NVIDIA GeForce GTX 1060 Mobile
56 fps -34%
1920x1080 High Preset AA:SM
Eurocom Sky X4C i9-9900KS
Intel Core i9-9900KS, NVIDIA GeForce RTX 2080 Mobile
134 fps +79%
Aorus 15G XB
Intel Core i7-10875H, NVIDIA GeForce RTX 2070 Super Max-Q
106 fps +41%
Alienware m15 R3 P87F
Intel Core i7-10750H, NVIDIA GeForce RTX 2070 Mobile
103 fps +37%
MSI RTX 2060 Gaming Z 6G
AMD Ryzen 7 2700X, NVIDIA GeForce RTX 2060 (Desktop)
101 fps +35%
Razer Blade 15 RTX 2080 Super Max-Q
Intel Core i7-10875H, NVIDIA GeForce RTX 2080 Super Max-Q
100 fps +33%
MSI GS75 10SF-609US
Intel Core i7-10875H, NVIDIA GeForce RTX 2070 Max-Q
98 fps +31%
Walmart EVOO Gaming 17
Intel Core i7-9750H, NVIDIA GeForce RTX 2060 Mobile
94 fps +25%
Asus ROG Zephyrus Duo 15 GX550LXS
Intel Core i9-10980HK, NVIDIA GeForce RTX 2080 Super Max-Q
93 fps +24%
Lenovo Legion 5 15IMH05H
Intel Core i5-10300H, NVIDIA GeForce RTX 2060 Mobile
90 fps +20%
MSI GS66 Stealth 10SE-045
Intel Core i7-10750H, NVIDIA GeForce RTX 2060 Mobile
86 fps +15%
Asus Zephyrus G14 GA401IV
AMD Ryzen 9 4900HS, NVIDIA GeForce RTX 2060 Max-Q
84 (79min - 138max) fps +12%
Eluktronics RP-15
AMD Ryzen 7 4800H, NVIDIA GeForce RTX 2060 Mobile
84 fps +12%
Dell G5 15 SE 5505 P89F
AMD Ryzen 7 4800H, AMD Radeon RX 5600M
83 fps +11%
Asus TUF A17 FA706IU-AS76
AMD Ryzen 7 4800H, NVIDIA GeForce GTX 1660 Ti Mobile
81 fps +8%
Asus ROG Zephyrus G15 GA502IU-ES76
AMD Ryzen 7 4800HS, NVIDIA GeForce GTX 1660 Ti Max-Q
75 (61min - 120max) fps
MSI Bravo 17 A4DDR
AMD Ryzen 7 4800H, AMD Radeon RX 5500M
65 (52min) fps -13%
Moyenne NVIDIA GeForce GTX 1660 Ti Max-Q
  (52 - 75, n=4)
63.5 fps -15%
Asus ROG Zephyrus G15 GA502DU
AMD Ryzen 7 3750H, NVIDIA GeForce GTX 1660 Ti Max-Q
53 fps -29%
Lenovo IdeaPad Gaming 3i 15IMH05
Intel Core i5-10300H, NVIDIA GeForce GTX 1650 Mobile
53 fps -29%
HP Pavilion Gaming 15-ec1206ng
AMD Ryzen 5 4600H, NVIDIA GeForce GTX 1650 Mobile
52 fps -31%
Asus Zephyrus S GX531GM
Intel Core i7-8750H, NVIDIA GeForce GTX 1060 Mobile
51 fps -32%
1920x1080 Highest Preset AA:T
Eurocom Sky X4C i9-9900KS
Intel Core i9-9900KS, NVIDIA GeForce RTX 2080 Mobile
124 fps +85%
Aorus 15G XB
Intel Core i7-10875H, NVIDIA GeForce RTX 2070 Super Max-Q
96 fps +43%
Razer Blade 15 RTX 2080 Super Max-Q
Intel Core i7-10875H, NVIDIA GeForce RTX 2080 Super Max-Q
93 fps +39%
Alienware m15 R3 P87F
Intel Core i7-10750H, NVIDIA GeForce RTX 2070 Mobile
93 fps +39%
MSI RTX 2060 Gaming Z 6G
AMD Ryzen 7 2700X, NVIDIA GeForce RTX 2060 (Desktop)
90 fps +34%
Asus ROG Zephyrus Duo 15 GX550LXS
Intel Core i9-10980HK, NVIDIA GeForce RTX 2080 Super Max-Q
89 fps +33%
MSI GS75 10SF-609US
Intel Core i7-10875H, NVIDIA GeForce RTX 2070 Max-Q
89 fps +33%
Walmart EVOO Gaming 17
Intel Core i7-9750H, NVIDIA GeForce RTX 2060 Mobile
83 fps +24%
Lenovo Legion 5 15IMH05H
Intel Core i5-10300H, NVIDIA GeForce RTX 2060 Mobile
81 fps +21%
MSI GS66 Stealth 10SE-045
Intel Core i7-10750H, NVIDIA GeForce RTX 2060 Mobile
77 fps +15%
Eluktronics RP-15
AMD Ryzen 7 4800H, NVIDIA GeForce RTX 2060 Mobile
75 fps +12%
Asus Zephyrus G14 GA401IV
AMD Ryzen 9 4900HS, NVIDIA GeForce RTX 2060 Max-Q
74 fps +10%
Asus TUF A17 FA706IU-AS76
AMD Ryzen 7 4800H, NVIDIA GeForce GTX 1660 Ti Mobile
73 fps +9%
Dell G5 15 SE 5505 P89F
AMD Ryzen 7 4800H, AMD Radeon RX 5600M
68 fps +1%
Asus ROG Zephyrus G15 GA502IU-ES76
AMD Ryzen 7 4800HS, NVIDIA GeForce GTX 1660 Ti Max-Q
67 (51min - 110max) fps
Moyenne NVIDIA GeForce GTX 1660 Ti Max-Q
  (49 - 67, n=4)
57.3 fps -14%
MSI Bravo 17 A4DDR
AMD Ryzen 7 4800H, AMD Radeon RX 5500M
54 (43min) fps -19%
Asus ROG Zephyrus G15 GA502DU
AMD Ryzen 7 3750H, NVIDIA GeForce GTX 1660 Ti Max-Q
49 fps -27%
Lenovo IdeaPad Gaming 3i 15IMH05
Intel Core i5-10300H, NVIDIA GeForce GTX 1650 Mobile
47 fps -30%
HP Pavilion Gaming 15-ec1206ng
AMD Ryzen 5 4600H, NVIDIA GeForce GTX 1650 Mobile
45 fps -33%
Asus Zephyrus S GX531GM
Intel Core i7-8750H, NVIDIA GeForce GTX 1060 Mobile
43 fps -36%
The Witcher 3
1024x768 Low Graphics & Postprocessing
Eurocom Sky X4C i9-9900KS
Intel Core i9-9900KS, NVIDIA GeForce RTX 2080 Mobile
414.3 fps +61%
Alienware m17 R3 P45E
Intel Core i9-10980HK, NVIDIA GeForce RTX 2080 Super Mobile
389.7 (366min - 449max) fps +51%
Alienware m15 R3 P87F
Intel Core i7-10750H, NVIDIA GeForce RTX 2070 Mobile
356.7 (330min - 384max) fps +39%
MSI GS75 10SF-609US
Intel Core i7-10875H, NVIDIA GeForce RTX 2070 Max-Q
349.7 (309min - 373max) fps +36%
Razer Blade 15 RTX 2070 Super Max-Q
Intel Core i7-10875H, NVIDIA GeForce RTX 2070 Super Max-Q
348.3 (324min - 370max) fps +35%
Asus ROG Zephyrus Duo 15 GX550LXS
Intel Core i9-10980HK, NVIDIA GeForce RTX 2080 Super Max-Q
330.5 fps +28%
Aorus 15G XB
Intel Core i7-10875H, NVIDIA GeForce RTX 2070 Super Max-Q
323.7 fps +26%
Razer Blade 15 RTX 2080 Super Max-Q
Intel Core i7-10875H, NVIDIA GeForce RTX 2080 Super Max-Q
308.4 fps +20%
Walmart EVOO Gaming 17
Intel Core i7-9750H, NVIDIA GeForce RTX 2060 Mobile
295.3 fps +15%
MSI RTX 2060 Gaming Z 6G
AMD Ryzen 7 2700X, NVIDIA GeForce RTX 2060 (Desktop)
286.7 (265min - 336max) fps +11%
MSI GS66 Stealth 10SE-045
Intel Core i7-10750H, NVIDIA GeForce RTX 2060 Mobile
280.6 fps +9%
Eluktronics RP-15
AMD Ryzen 7 4800H, NVIDIA GeForce RTX 2060 Mobile
275.4 fps +7%
Lenovo Legion 5 15IMH05H
Intel Core i5-10300H, NVIDIA GeForce RTX 2060 Mobile
275.4 fps +7%
Eluktronics RP-17
AMD Ryzen 7 4800H, NVIDIA GeForce RTX 2060 Mobile
266.5 (243min - 287max) fps +3%
Dell G5 15 SE 5505 P89F
AMD Ryzen 7 4800H, AMD Radeon RX 5600M
266.4 (247min - 284max) fps +3%
Asus ROG Zephyrus G15 GA502IU-ES76
AMD Ryzen 7 4800HS, NVIDIA GeForce GTX 1660 Ti Max-Q
257.5 (235min - 272max) fps
Asus TUF A17 FA706IU-AS76
AMD Ryzen 7 4800H, NVIDIA GeForce GTX 1660 Ti Mobile
254 (230min - 280max) fps -1%
Dell G5 15 5590
Intel Core i7-8750H, NVIDIA GeForce RTX 2060 Mobile
235.1 fps -9%
Asus Zephyrus G14 GA401IV
AMD Ryzen 9 4900HS, NVIDIA GeForce RTX 2060 Max-Q
232.2 fps -10%
Asus ROG Strix G15 G512LI
Intel Core i7-10750H, NVIDIA GeForce GTX 1650 Ti Mobile
223.5 (198min - 240max) fps -13%
Moyenne NVIDIA GeForce GTX 1660 Ti Max-Q
  (138.4 - 258, n=7)
212 fps -18%
Asus Zephyrus S GX531GM
Intel Core i7-8750H, NVIDIA GeForce GTX 1060 Mobile
197.6 fps -23%
HP Pavilion Gaming 15-ec1206ng
AMD Ryzen 5 4600H, NVIDIA GeForce GTX 1650 Mobile
189.4 fps -26%
Lenovo IdeaPad Gaming 3i 15IMH05
Intel Core i5-10300H, NVIDIA GeForce GTX 1650 Mobile
184.5 fps -28%
Asus ROG Zephyrus G15 GA502DU
AMD Ryzen 7 3750H, NVIDIA GeForce GTX 1660 Ti Max-Q
138.4 fps -46%
Apple MacBook 12 (Early 2016) 1.1 GHz
Intel Core m3-6Y30, Intel HD Graphics 515
7.4 fps -97%
1366x768 Medium Graphics & Postprocessing
Eurocom Sky X4C i9-9900KS
Intel Core i9-9900KS, NVIDIA GeForce RTX 2080 Mobile
284.2 fps +71%
Alienware m17 R3 P45E
Intel Core i9-10980HK, NVIDIA GeForce RTX 2080 Super Mobile
274.2 (253min - 290max) fps +65%
Alienware m15 R3 P87F
Intel Core i7-10750H, NVIDIA GeForce RTX 2070 Mobile
249.9 (218min - 263max) fps +50%
Razer Blade 15 RTX 2080 Super Max-Q
Intel Core i7-10875H, NVIDIA GeForce RTX 2080 Super Max-Q
239.9 fps +44%
Asus ROG Zephyrus Duo 15 GX550LXS
Intel Core i9-10980HK, NVIDIA GeForce RTX 2080 Super Max-Q
237 fps +42%
Razer Blade 15 RTX 2070 Super Max-Q
Intel Core i7-10875H, NVIDIA GeForce RTX 2070 Super Max-Q
235.4 (219min - 257max) fps +41%
Aorus 15G XB
Intel Core i7-10875H, NVIDIA GeForce RTX 2070 Super Max-Q
232 fps +39%
MSI GS75 10SF-609US
Intel Core i7-10875H, NVIDIA GeForce RTX 2070 Max-Q
231.3 (215min - 244max) fps +39%
Walmart EVOO Gaming 17
Intel Core i7-9750H, NVIDIA GeForce RTX 2060 Mobile
215.4 fps +29%
Lenovo Legion 5 15IMH05H
Intel Core i5-10300H, NVIDIA GeForce RTX 2060 Mobile
204.8 fps +23%
MSI RTX 2060 Gaming Z 6G
AMD Ryzen 7 2700X, NVIDIA GeForce RTX 2060 (Desktop)
204.5 (163min - 231max) fps +23%
MSI GS66 Stealth 10SE-045
Intel Core i7-10750H, NVIDIA GeForce RTX 2060 Mobile
196.7 fps +18%
Asus TUF A17 FA706IU-AS76
AMD Ryzen 7 4800H, NVIDIA GeForce GTX 1660 Ti Mobile
175.1 (170min - 183max) fps +5%
Dell G5 15 5590
Intel Core i7-8750H, NVIDIA GeForce RTX 2060 Mobile
173.7 fps +4%
Asus Zephyrus G14 GA401IV
AMD Ryzen 9 4900HS, NVIDIA GeForce RTX 2060 Max-Q
168.2 fps +1%
Asus ROG Zephyrus G15 GA502IU-ES76
AMD Ryzen 7 4800HS, NVIDIA GeForce GTX 1660 Ti Max-Q
166.5 (156min - 175max) fps
Moyenne NVIDIA GeForce GTX 1660 Ti Max-Q
  (111.4 - 173.3, n=6)
153.8 fps -8%
Asus ROG Strix G15 G512LI
Intel Core i7-10750H, NVIDIA GeForce GTX 1650 Ti Mobile
135.5 (127min - 143max) fps -19%
Asus Zephyrus S GX531GM
Intel Core i7-8750H, NVIDIA GeForce GTX 1060 Mobile
129.5 fps -22%
Lenovo IdeaPad Gaming 3i 15IMH05
Intel Core i5-10300H, NVIDIA GeForce GTX 1650 Mobile
119.2 fps -28%
HP Pavilion Gaming 15-ec1206ng
AMD Ryzen 5 4600H, NVIDIA GeForce GTX 1650 Mobile
118.5 fps -29%
1920x1080 High Graphics & Postprocessing (Nvidia HairWorks Off)
Alienware m17 R3 P45E
Intel Core i9-10980HK, NVIDIA GeForce RTX 2080 Super Mobile
186.2 (179min - 197max) fps +97%
Eurocom Sky X4C i9-9900KS
Intel Core i9-9900KS, NVIDIA GeForce RTX 2080 Mobile
175.9 fps +86%
Razer Blade 15 RTX 2080 Super Max-Q
Intel Core i7-10875H, NVIDIA GeForce RTX 2080 Super Max-Q
153.2 fps +62%
Alienware m15 R3 P87F
Intel Core i7-10750H, NVIDIA GeForce RTX 2070 Mobile
149.8 (139min - 156max) fps +59%
Asus ROG Zephyrus Duo 15 GX550LXS
Intel Core i9-10980HK, NVIDIA GeForce RTX 2080 Super Max-Q
143.4 fps +52%
Razer Blade 15 RTX 2070 Super Max-Q
Intel Core i7-10875H, NVIDIA GeForce RTX 2070 Super Max-Q
141.4 (134min - 152max) fps +50%
Aorus 15G XB
Intel Core i7-10875H, NVIDIA GeForce RTX 2070 Super Max-Q
136.2 fps +44%
MSI RTX 2060 Gaming Z 6G
AMD Ryzen 7 2700X, NVIDIA GeForce RTX 2060 (Desktop)
135.7 (113min - 150max) fps +44%
MSI GS75 10SF-609US
Intel Core i7-10875H, NVIDIA GeForce RTX 2070 Max-Q
131.3 (122min - 141max) fps +39%
Walmart EVOO Gaming 17
Intel Core i7-9750H, NVIDIA GeForce RTX 2060 Mobile
131 fps +39%
Lenovo Legion 5 15IMH05H
Intel Core i5-10300H, NVIDIA GeForce RTX 2060 Mobile
124.8 fps +32%
Eluktronics RP-17
AMD Ryzen 7 4800H, NVIDIA GeForce RTX 2060 Mobile
121.9 (115min - 131max) fps +29%
MSI GS66 Stealth 10SE-045
Intel Core i7-10750H, NVIDIA GeForce RTX 2060 Mobile
117.7 fps +25%
Eluktronics RP-15
AMD Ryzen 7 4800H, NVIDIA GeForce RTX 2060 Mobile
113.6 fps +20%
Acer Predator Helios 500 PH517-51-79BY
Intel Core i7-8750H, NVIDIA GeForce GTX 1070 Mobile
110 fps +16%
Dell G5 15 5590
Intel Core i7-8750H, NVIDIA GeForce RTX 2060 Mobile
105.2 fps +11%
Dell G5 15 SE 5505 P89F
AMD Ryzen 7 4800H, AMD Radeon RX 5600M
103.6 (92min - 110max) fps +10%
Asus TUF A17 FA706IU-AS76
AMD Ryzen 7 4800H, NVIDIA GeForce GTX 1660 Ti Mobile
103 (98min - 108max) fps +9%
Asus Zephyrus G14 GA401IV
AMD Ryzen 9 4900HS, NVIDIA GeForce RTX 2060 Max-Q
100.6 fps +6%
Asus ROG Zephyrus G15 GA502IU-ES76
AMD Ryzen 7 4800HS, NVIDIA GeForce GTX 1660 Ti Max-Q
94.5 (85min - 105max) fps
Moyenne NVIDIA GeForce GTX 1660 Ti Max-Q
  (64.4 - 95.3, n=7)
87.9 fps -7%
Asus ROG Zephyrus G15 GA502DU
AMD Ryzen 7 3750H, NVIDIA GeForce GTX 1660 Ti Max-Q
83.9 fps -11%
Asus ROG Strix G15 G512LI
Intel Core i7-10750H, NVIDIA GeForce GTX 1650 Ti Mobile
76.1 (71min - 80max) fps -19%
MSI Bravo 17 A4DDR
AMD Ryzen 7 4800H, AMD Radeon RX 5500M
72 (55min) fps -24%
Asus Zephyrus S GX531GM
Intel Core i7-8750H, NVIDIA GeForce GTX 1060 Mobile
70.9 fps -25%
HP Pavilion Gaming 15-ec1206ng
AMD Ryzen 5 4600H, NVIDIA GeForce GTX 1650 Mobile
68.9 fps -27%
Lenovo IdeaPad Gaming 3i 15IMH05
Intel Core i5-10300H, NVIDIA GeForce GTX 1650 Mobile
66 fps -30%
1920x1080 Ultra Graphics & Postprocessing (HBAO+)
Alienware m17 R3 P45E
Intel Core i9-10980HK, NVIDIA GeForce RTX 2080 Super Mobile
97.7 (93min - 103max) fps +90%
Eurocom Sky X4C i9-9900KS
Intel Core i9-9900KS, NVIDIA GeForce RTX 2080 Mobile
95.5 fps +86%
Razer Blade 15 RTX 2080 Super Max-Q
Intel Core i7-10875H, NVIDIA GeForce RTX 2080 Super Max-Q
87.7 fps +71%
Alienware m15 R3 P87F
Intel Core i7-10750H, NVIDIA GeForce RTX 2070 Mobile
81 (77min - 86max) fps +58%
Asus ROG Zephyrus Duo 15 GX550LXS
Intel Core i9-10980HK, NVIDIA GeForce RTX 2080 Super Max-Q
75.8 (63min) fps +48%
Aorus 15G XB
Intel Core i7-10875H, NVIDIA GeForce RTX 2070 Super Max-Q
75.5 (63min) fps +47%
Razer Blade 15 RTX 2070 Super Max-Q
Intel Core i7-10875H, NVIDIA GeForce RTX 2070 Super Max-Q
74 (70min - 78max) fps +44%
MSI RTX 2060 Gaming Z 6G
AMD Ryzen 7 2700X, NVIDIA GeForce RTX 2060 (Desktop)
72.7 (61min - 82max) fps +42%
Walmart EVOO Gaming 17
Intel Core i7-9750H, NVIDIA GeForce RTX 2060 Mobile
68.9 fps +34%
Lenovo Legion 5 15IMH05H
Intel Core i5-10300H, NVIDIA GeForce RTX 2060 Mobile
68.3 fps +33%
MSI GS75 10SF-609US
Intel Core i7-10875H, NVIDIA GeForce RTX 2070 Max-Q
67.5 (61min - 75max) fps +32%
Dell G5 15 SE 5505 P89F
AMD Ryzen 7 4800H, AMD Radeon RX 5600M
66.1 (62min - 70max) fps +29%
MSI GS66 Stealth 10SE-045
Intel Core i7-10750H, NVIDIA GeForce RTX 2060 Mobile
63.4 (48min) fps +24%
Eluktronics RP-15
AMD Ryzen 7 4800H, NVIDIA GeForce RTX 2060 Mobile
62.4 fps +22%
Eluktronics RP-17
AMD Ryzen 7 4800H, NVIDIA GeForce RTX 2060 Mobile
62.1 (56min - 70max) fps +21%
Dell G5 15 5590
Intel Core i7-8750H, NVIDIA GeForce RTX 2060 Mobile
60 fps +17%
Asus Zephyrus G14 GA401IV
AMD Ryzen 9 4900HS, NVIDIA GeForce RTX 2060 Max-Q
58.4 fps +14%
Acer Predator Helios 500 PH517-51-79BY
Intel Core i7-8750H, NVIDIA GeForce GTX 1070 Mobile
57 fps +11%
Asus TUF A17 FA706IU-AS76
AMD Ryzen 7 4800H, NVIDIA GeForce GTX 1660 Ti Mobile
55.6 (53min - 60max) fps +8%
Asus ROG Zephyrus G15 GA502IU-ES76
AMD Ryzen 7 4800HS, NVIDIA GeForce GTX 1660 Ti Max-Q
51.3 (47min - 56max) fps
Moyenne NVIDIA GeForce GTX 1660 Ti Max-Q
  (44.8 - 53.2, n=7)
50.3 fps -2%
Asus ROG Zephyrus G15 GA502DU
AMD Ryzen 7 3750H, NVIDIA GeForce GTX 1660 Ti Max-Q
48.8 fps -5%
MSI Bravo 17 A4DDR
AMD Ryzen 7 4800H, AMD Radeon RX 5500M
45.4 (38min) fps -12%
Asus ROG Strix G15 G512LI
Intel Core i7-10750H, NVIDIA GeForce GTX 1650 Ti Mobile
40.1 (37min - 44max) fps -22%
Asus Zephyrus S GX531GM
Intel Core i7-8750H, NVIDIA GeForce GTX 1060 Mobile
40 fps -22%
HP Pavilion Gaming 15-ec1206ng
AMD Ryzen 5 4600H, NVIDIA GeForce GTX 1650 Mobile
39.8 (28min) fps -22%
Lenovo IdeaPad Gaming 3i 15IMH05
Intel Core i5-10300H, NVIDIA GeForce GTX 1650 Mobile
37.4 fps -27%