Critiques du Intel Core i5-10300H processeur
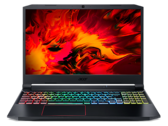
Test de l'Acer Nitro 5 AN515-55 : champion du rapport prix/performances avec RTX 3060
Si les ordinateurs portables équipés d'une RTX 3080 offrent de très bonnes performances, ils sont souvent encombrants et peuvent chauffer, ce qui n'est pas du goût de tout le monde. L'Acer Nitro 5, quant à lui, est destiné à ceux qui recherchent un ordinateur portable de jeu à bas prix
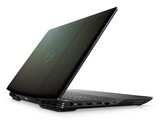
Intel Core i5-10300H, NVIDIA GeForce RTX 3060 Laptop GPU, 15.6", 2.3 kgTest du Dell G5 15 5500 : un PC portable milieu de gamme à l'écran décevant
La nouvelle variante du G5 15 5500 de Dell vise à séduire le joueur de milieu de gamme. Avec un Core i5-10300H, une GTX 1650 Ti et un écran de 120 Hz, le G5 15 5500 répond aux besoins de base. Cependant, pour le prix demandé de ₹87 990 (1 195 dollars US), le G5 15 5500 fait des économies, surtout en ce qui concerne l'écran. Le Dell G5 15 5500 peut-il combler ces lacunes sur le plan des performances ? Nous allons le découvrir.
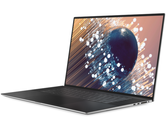
Intel Core i5-10300H, NVIDIA GeForce GTX 1650 Ti Mobile, 15.6", 2.3 kgTest du Dell XPS 17 9700 (i5-10300H, UHD 630, FHD+) : PC portable multimédia avec écran mat FHD lumineux et une bonne autonomie
Dell est l'un des rares fabricants à proposer de grands PC portables multimédias sans carte graphique dédiée. Ceux qui ne sont pas intéressés par le jeu peuvent toujours avoir un PC portable multimédia haut de gamme pour un prix moins élevé. Cependant, le XPS 17 9700 sans carte graphique dédiée et le petit Core i5 n'a rien de pas cher...
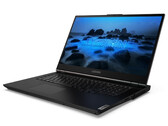
Intel Core i5-10300H, UHD Graphics 630, 17.3", 2.3 kgTest du Lenovo Legion 5 17IMH (i5-10300H, GTX 1650, FHD) : autonomie sans fin
Malgré les composants de jeu d'entrée de gamme, il n'y a pas à s'inquiéter des performances. Le Legion 5 permet de faire tourner tous les jeux récents sur son écran mat (Full HD, IPS). Le point fort du portable est son autonomie impressionnante.
Intel Core i5-10300H, NVIDIA GeForce GTX 1650 Mobile, 17.3", 2.9 kgTest du HP Omen 15 (i5-10300H, GTX 1660 Ti, FHD, 144 Hz) : portable de jeu avec une bonne autonomie
Avec la série Omen, HP propose des PC de jeu qui ciblent directement les joueurs. Elle permet à HP de couvrir le secteur haut de gamme, mais également de proposer des machines réussies en entrée de gamme. Avec l'actuel Omen 15, nous avons très certainement une machine intéressante, qui n'a pas à avoir honte de son rapport performances / prix.
Intel Core i5-10300H, NVIDIA GeForce GTX 1660 Ti Mobile, 15.6", 2.1 kgHP Pavilion Gaming 16-a0242ng: NVIDIA GeForce GTX 1650 Ti Mobile, 16.10", 2.2 kg
Critique » Test du HP Pavilion Gaming 16 (i5-10300H, GTX 1650 Ti Mobile, FHD) : 16 pouces à petit prix avec GeForce
Lenovo IdeaPad Gaming 3i 15IMH05: NVIDIA GeForce GTX 1650 Mobile, 15.60", 2.2 kg
Critique » Test du Lenovo IdeaPad Gaming 3i 15IMH05 (i5-10300H, GTX 1650, FHD, 120 Hz) : Core i5 à plein régime
Lenovo Legion 5 15IMH05H: NVIDIA GeForce RTX 2060 Mobile, 15.60", 2.5 kg
Critique » Test du Lenovo Legion 5 15IMH05H (i5-10300H, RTX 2060, FHD, 120 Hz) : performances et autonomie
Dell XPS 15 9500 Core i5: Intel UHD Graphics 630, 15.60", 1.8 kg
Critique » Test du Dell XPS 15 9500 (i5-10300H, UHD 630, FHD) : encore plus proche du MacBook Pro
MSI GF75 Thin 10SCXR: NVIDIA GeForce GTX 1650 Mobile, 17.30", 2.2 kg
Critique » Test du MSI GF75 Thin 10SCXR (i5-10300H, GTX 1650, FHD, 120 Hz) : les débuts de l'i5 Comet Lake H
Acer Aspire Nitro 5 AN515-55-57GF: NVIDIA GeForce RTX 3060 Laptop GPU, 15.60", 2.3 kg
Autres tests » Acer Aspire Nitro 5 AN515-55-57GF
Asus TUF Gaming F15 FX506LHB-HN324: NVIDIA GeForce GTX 1650 Mobile, 15.60", 2.3 kg
Autres tests » Asus TUF Gaming F15 FX506LHB-HN324
Asus TUF Gaming F15 FX506LH-AS51: NVIDIA GeForce GTX 1650 Mobile, 15.60", 2.3 kg
Autres tests » Asus TUF Gaming F15 FX506LH-AS51
Acer Nitro 5 AN515-55-5560: NVIDIA GeForce RTX 3060 Laptop GPU, 15.60", 2.3 kg
Autres tests » Acer Nitro 5 AN515-55-5560
Medion Erazer Deputy P10-MD62132: NVIDIA GeForce GTX 1660 Ti Mobile, 15.60", 2.3 kg
Autres tests » Medion Erazer Deputy P10-MD62132
Asus TUF Gaming F17 FX706LI-ES53: NVIDIA GeForce GTX 1650 Ti Mobile, 17.30", 2.6 kg
Autres tests » Asus TUF Gaming F17 FX706LI-ES53
MSI GF75 Thin 10SCXR: NVIDIA GeForce GTX 1650 Mobile, 17.30", 2.2 kg
Autres tests » MSI GF75 Thin 10SCXR
Acer Nitro 5 AN515-55-53E5: NVIDIA GeForce RTX 3050 4GB Laptop GPU, 15.60", 2.3 kg
Autres tests » Acer Nitro 5 AN515-55-53E5
Acer Nitro 5 AN515-55-56F5: NVIDIA GeForce GTX 1650 Mobile, 15.60", 2.3 kg
Autres tests » Acer Nitro 5 AN515-55-56F5
HP Pavilion Gaming 16-a0046ns: NVIDIA GeForce GTX 1650 Ti Mobile, 16.10", 2.4 kg
Autres tests » HP Pavilion Gaming 16-a0046ns
Acer Nitro 5 AN515-55-524P: NVIDIA GeForce RTX 2060 Mobile, 15.60", 2.3 kg
Autres tests » Acer Nitro 5 AN515-55-524P
Asus TUF Gaming F15 FX506LH-HN042T: NVIDIA GeForce GTX 1650 Mobile, 15.60", 2.3 kg
Autres tests » Asus TUF Gaming F15 FX506LH-HN042T
Asus ZenBook Pro 15 UX535LH-BN024T: NVIDIA GeForce GTX 1650 Max-Q, 15.60", 1.8 kg
Autres tests » Asus ZenBook Pro 15 UX535LH-BN024T
Acer Aspire Nitro 5 AN517-52-58NB: NVIDIA GeForce RTX 3060 Laptop GPU, 17.30", 2.2 kg
Autres tests » Acer Aspire Nitro 5 AN517-52-58NB
Lenovo ThinkBook 15p IMH-20V30007GE: NVIDIA GeForce GTX 1650 Max-Q, 15.60", 1.9 kg
Autres tests » Lenovo ThinkBook 15p IMH-20V30007GE
Acer Nitro 5 AN515-55-59KS: NVIDIA GeForce GTX 1650 Ti Mobile, 15.60", 2.3 kg
Autres tests » Acer Nitro 5 AN515-55-59KS
HP Pavilion Gaming 16-a0044ns: NVIDIA GeForce GTX 1650 Ti Mobile, 16.10", 2.5 kg
Autres tests » HP Pavilion Gaming 16-a0044ns
Acer Predator Helios 300 PH315-53-527E: NVIDIA GeForce RTX 3060 Laptop GPU, 15.60", 2.3 kg
Autres tests » Acer Predator Helios 300 PH315-53-527E
Dell G3 15 3500-H5JDG: NVIDIA GeForce GTX 1650 Ti Mobile, 15.60", 2.6 kg
Autres tests » Dell G3 15 3500-H5JDG
Medion Erazer Crawler E10: NVIDIA GeForce GTX 1650 Mobile, 15.60", 2.2 kg
Autres tests » Medion Erazer Crawler E10
MSI GF63 Thin 10SC-206: NVIDIA GeForce GTX 1650 Max-Q, 15.60", 1.9 kg
Autres tests » MSI GF63 Thin 10SC-206
HP Pavilion Gaming 16-a0042ns: NVIDIA GeForce RTX 2060 Max-Q, 16.10", 2.4 kg
Autres tests » HP Pavilion Gaming 16-a0042ns
Medion Erazer Defender P10 : NVIDIA GeForce RTX 3060 Laptop GPU, 17.30", 2.5 kg
Autres tests » Medion Erazer Defender P10
Lenovo Legion 5 15IMH05H-81Y60043GE: NVIDIA GeForce RTX 2060 Mobile, 15.60", 2.5 kg
Autres tests » Lenovo Legion 5 15IMH05H-81Y60043GE
Lenovo IdeaPad 3 15IMH05-81Y400DWMH: NVIDIA GeForce GTX 1650 Mobile, 15.60", 2.2 kg
Autres tests » Lenovo IdeaPad 3 15IMH05-81Y400DWMH
Lenovo Legion Slim 7i-82BC002FGE: NVIDIA GeForce GTX 1650 Ti Mobile, 15.60", 1.9 kg
Autres tests » Lenovo Legion Slim 7i-82BC002FGE
HP Pavilion Gaming 16-A0008NS: NVIDIA GeForce GTX 1050 Mobile, 16.10", 2.4 kg
Autres tests » HP Pavilion Gaming 16-A0008NS
HP Pavilion Gaming 16-A0023NS: NVIDIA GeForce GTX 1050 Mobile, 16.10", 2.4 kg
Autres tests » HP Pavilion Gaming 16-A0023NS
Lenovo Ideapad Creator 5 15IMH05-82D4003UCK: NVIDIA GeForce GTX 1650 Mobile, 15.60", 2.2 kg
Autres tests » Lenovo Ideapad Creator 5 15IMH05-82D4003UCK
HP Pavilion Gaming 16-a0031ns: NVIDIA GeForce GTX 1650 Mobile, 16.10", 2.4 kg
Autres tests » HP Pavilion Gaming 16-a0031ns
Acer Aspire 7 A715-75G-59MG: NVIDIA GeForce GTX 1650 Mobile, 15.60", 2.2 kg
Autres tests » Acer Aspire 7 A715-75G-59MG
Lenovo Legion 5 17IMH05: NVIDIA GeForce GTX 1650 Mobile, 17.30", 2.9 kg
Autres tests » Lenovo Legion 5 17IMH05
Gateway Creator Series 15.6 GWTN156-3BK: NVIDIA GeForce RTX 2060 Mobile, 15.60", 2 kg
Autres tests » Gateway Creator Series 15.6 GWTN156-3BK
MSI GL65 10SER, i5-10300H RTX 2060: NVIDIA GeForce RTX 2060 Mobile, 15.60", 2.3 kg
Autres tests » MSI GL65 10SER, i5-10300H RTX 2060
Xiaomi Redmi G, i5-10300H 1650Ti: NVIDIA GeForce GTX 1650 Ti Mobile, 16.10", 2.5 kg
Autres tests » Xiaomi Redmi G, i5-10300H 1650Ti
Acer Predator Helios 300 PH315-53-5507: NVIDIA GeForce GTX 1650 Ti Mobile, 15.60", 2.3 kg
Autres tests » Acer Predator Helios 300 PH315-53-5507
HP Pavilion Gaming 16-a0006ns: NVIDIA GeForce GTX 1650 Mobile, 15.60", 2.4 kg
Autres tests » HP Pavilion Gaming 16-a0006ns
HP Pavilion Gaming 16-a0005ns: NVIDIA GeForce GTX 1050 Mobile, 15.60", 2.4 kg
Autres tests » HP Pavilion Gaming 16-a0005ns
Asus TUF Gaming F15 FX506LH-BQ034: NVIDIA GeForce GTX 1650 Mobile, 15.60", 2.3 kg
Autres tests » Asus TUF FX506LH-BQ034
HP Pavilion Gaming 16-a0022ns: NVIDIA GeForce GTX 1650 Mobile, 16.10", 2.4 kg
Autres tests » HP Pavilion Gaming 16-a0022ns
HP Envy 15-ep0003ns: NVIDIA GeForce GTX 1650 Ti Mobile, 15.60", 2.1 kg
Autres tests » HP Envy 15-ep0003ns
Lenovo Yoga Slim 7 15IMH05-82AB002WMH: NVIDIA GeForce GTX 1650 Mobile, 15.60", 1.8 kg
Autres tests » Lenovo Yoga Slim 7 15IMH05-82AB002WMH
HP Omen 15-ek0456ng: NVIDIA GeForce GTX 1660 Ti Mobile, 15.60", 2.1 kg
Autres tests » HP Omen 15-ek0456ng
HP Gaming Pavilion 15-dk1064tx: NVIDIA GeForce RTX 2060 Max-Q, 15.60", 2.2 kg
Autres tests » HP Gaming Pavilion 15-dk1064tx
Acer Nitro 5 AN517-52: NVIDIA GeForce RTX 2060 Mobile, 17.30", 2.2 kg
Autres tests » Acer Nitro 5 AN517-52
Lenovo Ideapad Creator 5 15IMH05, i5-10300H GTX 1650 Ti: NVIDIA GeForce GTX 1650 Ti Mobile, 15.60", 2.2 kg
Autres tests » Lenovo Ideapad Creator 5 15IMH05, i5-10300H GTX 1650 Ti
HP Pavilion Gaming 16-a0000ns: NVIDIA GeForce GTX 1650 Mobile, 16.10", 2.4 kg
Autres tests » HP Pavilion Gaming 16-a0000ns
Dell XPS 17 9700 i5-10300H: Intel UHD Graphics 630, 17.30", 2.3 kg
Autres tests » Dell XPS 17 9700 i5-10300H
Acer Nitro 5 AN515-55-52HQ: NVIDIA GeForce GTX 1650 Ti Mobile, 15.60", 2.3 kg
Autres tests » Acer Nitro 5 AN515-55-52HQ
Acer Nitro 5 AN515-55-598S: NVIDIA GeForce GTX 1650 Mobile, 15.60", 2.3 kg
Autres tests » Acer Nitro 5 AN515-55-598S
Acer Nitro 7 AN715, i5-10300H: NVIDIA GeForce GTX 1660 Ti Mobile, 15.60", 2.5 kg
Autres tests » Acer Nitro 7 AN715, i5-10300H
Dell G3 15 3500-3KJ99: NVIDIA GeForce GTX 1650 Mobile, 15.60", 2.6 kg
Autres tests » Dell G3 15 3500-3KJ99
Dell XPS 15 9500 Core i5: Intel UHD Graphics 630, 15.60", 1.8 kg
Autres tests » Dell XPS 15 9500 Core i5
Lenovo IdeaPad Gaming 3i 15IMH05: NVIDIA GeForce GTX 1650 Mobile, 15.60", 2.2 kg
Autres tests » Lenovo IdeaPad Gaming 3i 15IMH05
Dell G5 15 5500-9T6CF: NVIDIA GeForce GTX 1650 Ti Mobile, 15.60", 2.4 kg
Autres tests » Dell G5 15 5500-9T6CF
Acer Predator Triton 300 PT315-52, i5-10300H GTX 1650 Ti: NVIDIA GeForce GTX 1650 Ti Mobile, 15.60", 2.3 kg
Autres tests » Acer Predator Triton 300 PT315-52, i5-10300H GTX 1650 Ti
HP Omen 15t-ek000: NVIDIA GeForce GTX 1650 Ti Mobile, 15.60", 2.4 kg
Autres tests » HP Omen 15t-ek000
Acer Predator Triton 300 PT315-52-51U8: NVIDIA GeForce GTX 1660 Ti Mobile, 15.60", 2.3 kg
Autres tests » Acer Predator Triton 300 PT315-52-51U8
MSI GL75 10SCSR-003XPL: NVIDIA GeForce GTX 1650 Ti Mobile, 17.30", 2.5 kg
Autres tests » MSI GL75 10SCSR-003XPL
Acer Nitro 5 AN515-55-53YW: NVIDIA GeForce GTX 1650 Mobile, 15.60", 2.3 kg
Autres tests » Acer Nitro 5 AN515-55-53YW
Acer Nitro 5 AN515-55-52DV: NVIDIA GeForce GTX 1650 Ti Mobile, 15.60", 2.3 kg
Autres tests » Acer Nitro 5 AN515-55-52DV
Dell XPS 17 9700 i5-10300H: Intel UHD Graphics 630, 17.30", 2.3 kg
» Le modèle de base du XPS 17 9700 est tout simplement trop cher
Lenovo IdeaPad Gaming 3i 15IMH05: NVIDIA GeForce GTX 1650 Mobile, 15.60", 2.2 kg
» Le Lenovo IdeaPad Gaming 3i 15IMH05 exploite pleinement son CPU et son GPU