Test du Lenovo ThinkPad L13 Yoga G4 Intel : autonomie inférieure à celle de l'AMD
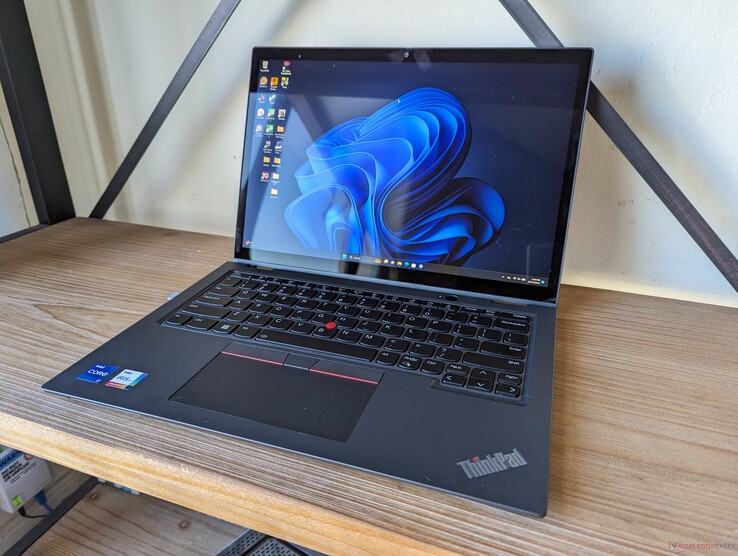
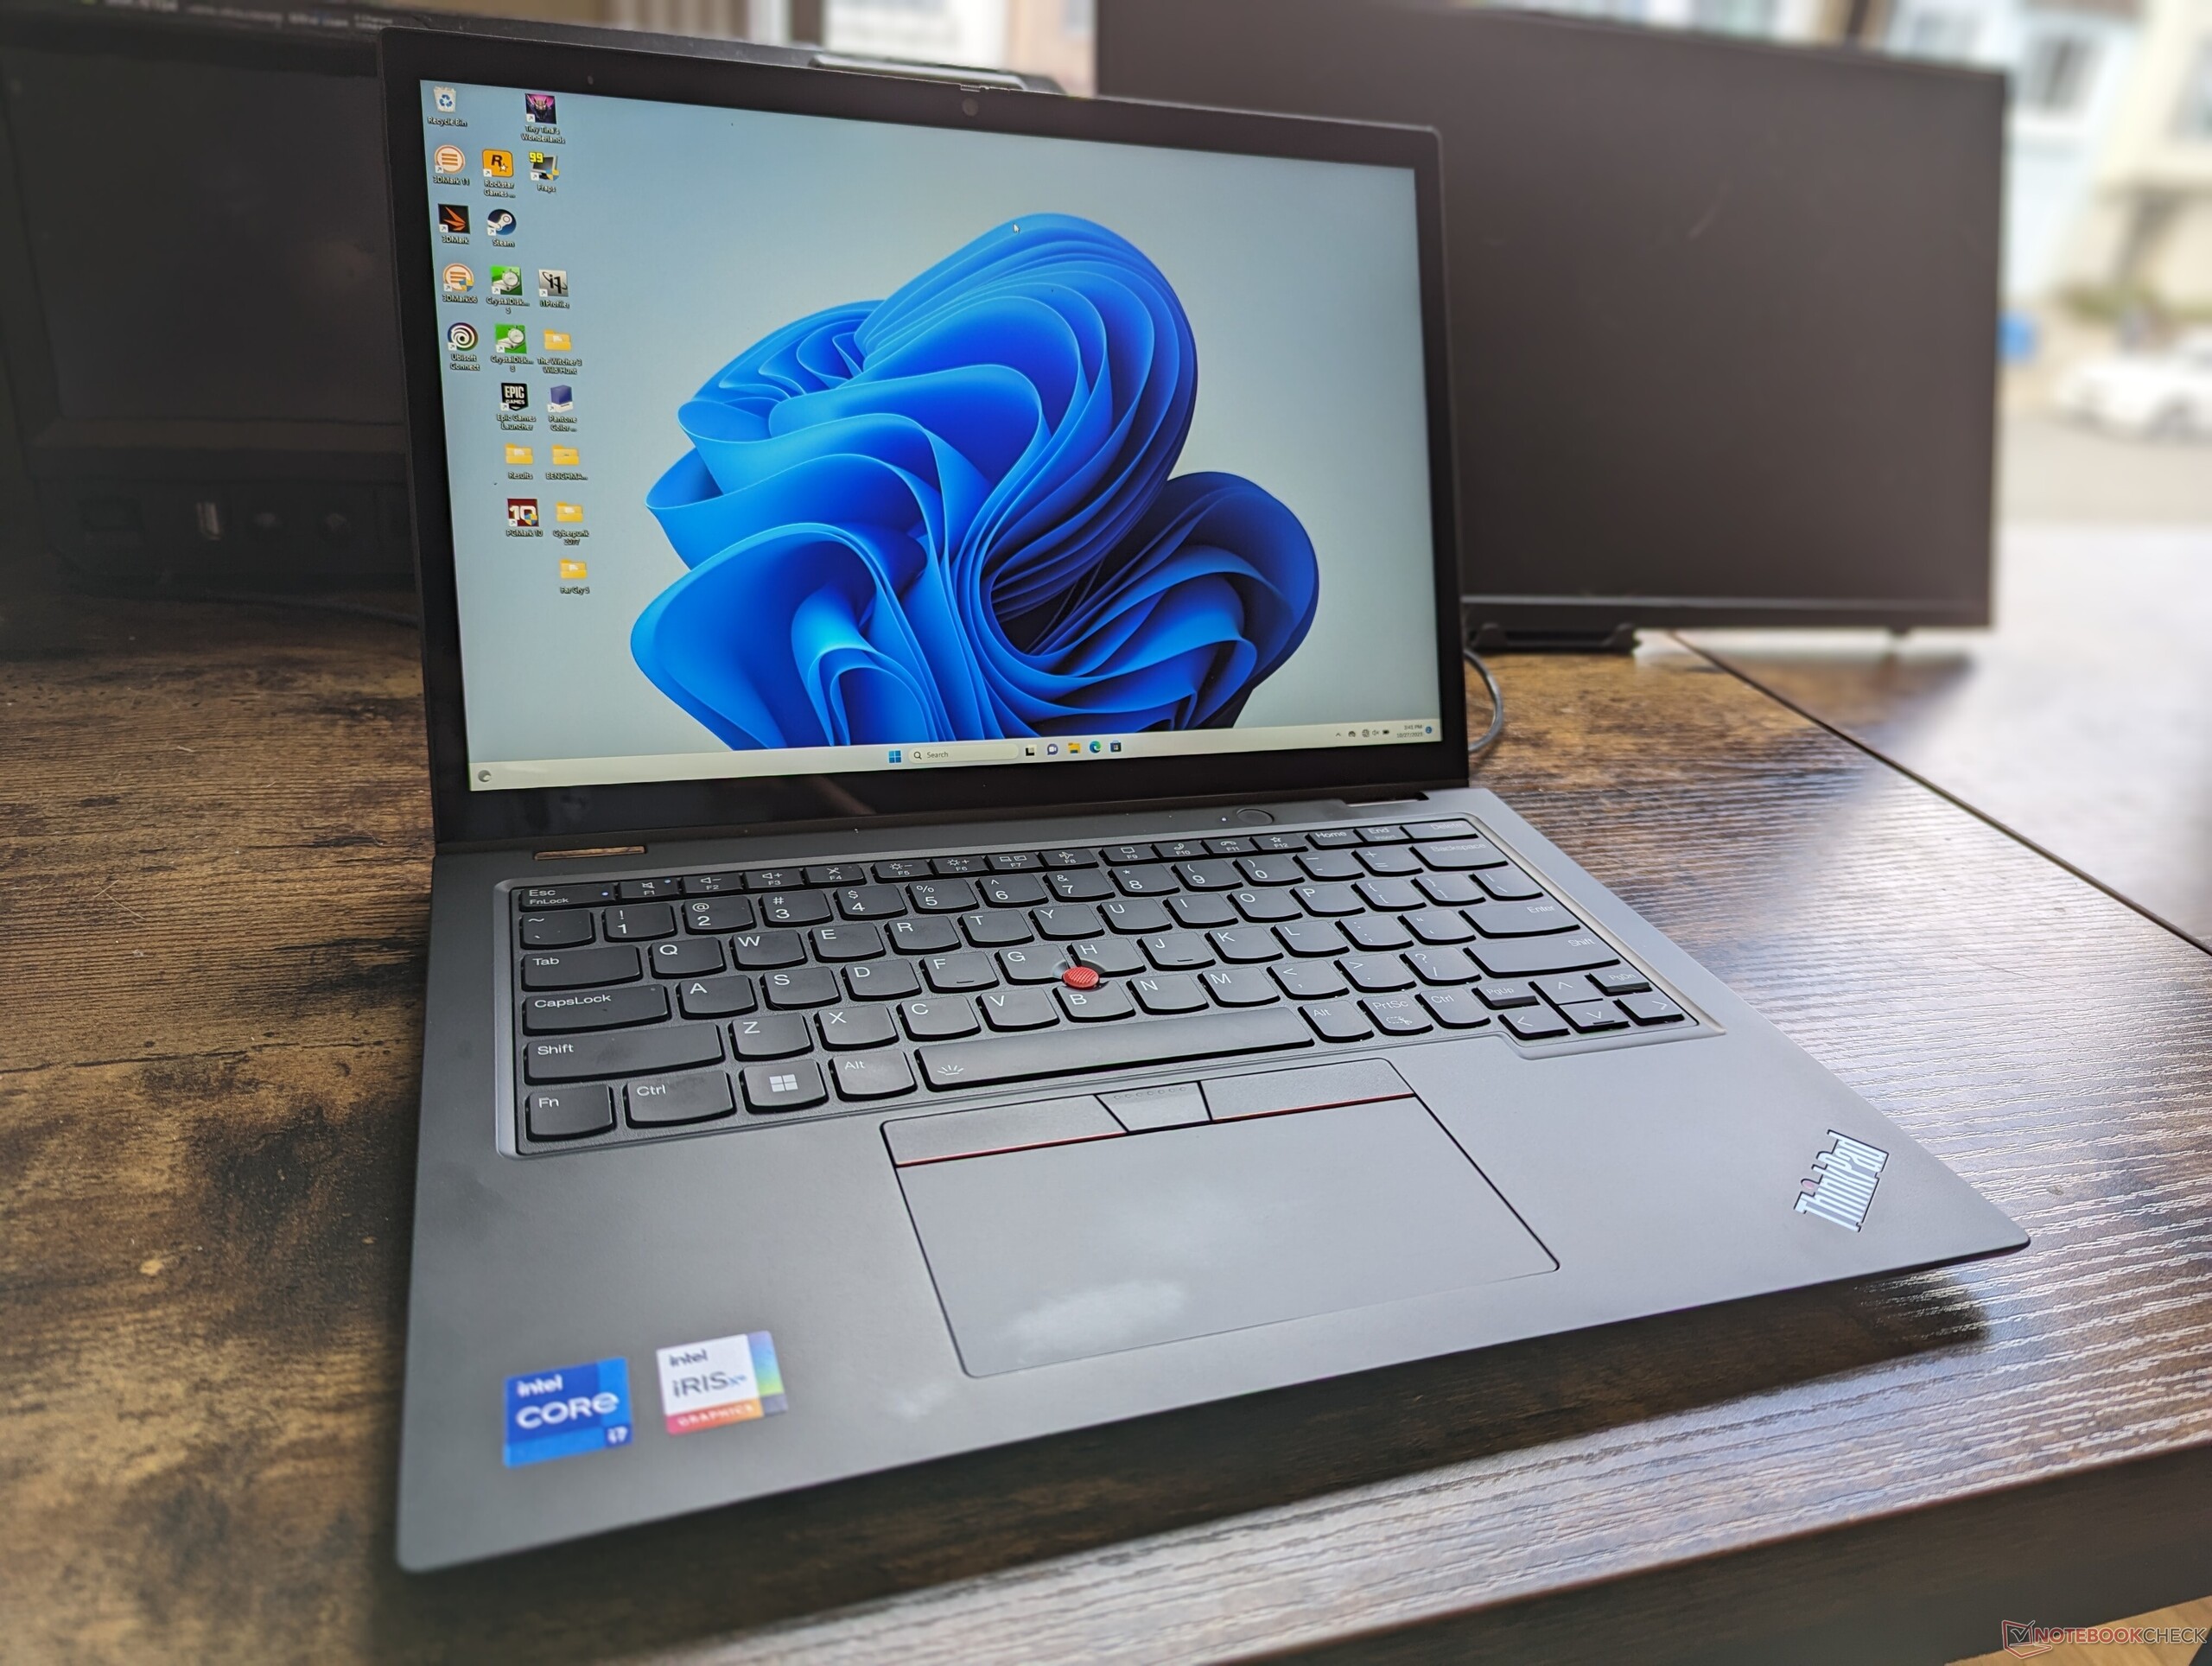
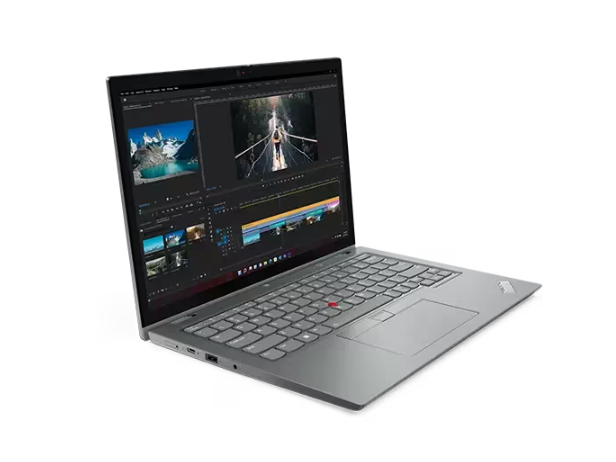
Le ThinkPad L13 Yoga Gen 4 est disponible en versions Intel et AMD pour attirer les utilisateurs des deux côtés de la barrière. Cette page d'évaluation se concentre sur la version Intel, car nous avons récemment évalué la version AMD en août dernier AMD en août dernier. Tous nos commentaires sur les caractéristiques physiques de la version AMD s'appliquent ici puisque les deux versions sont visuellement identiques.
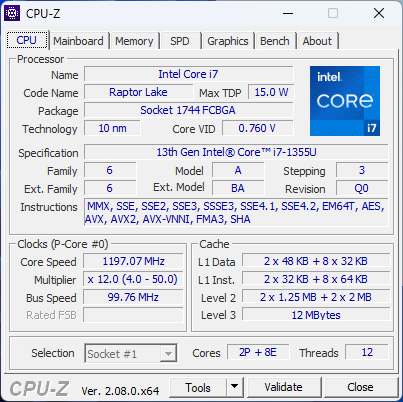
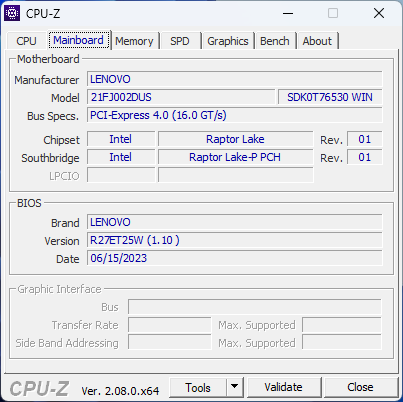
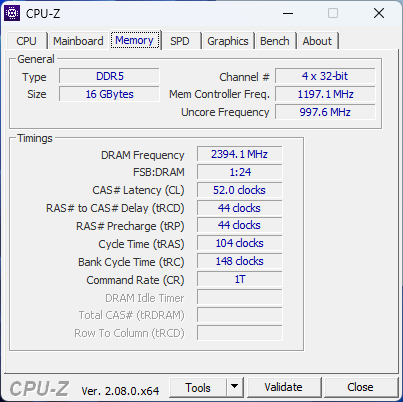
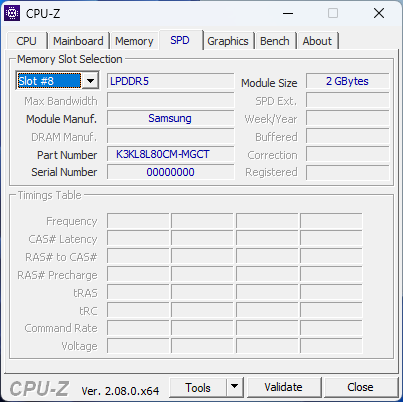
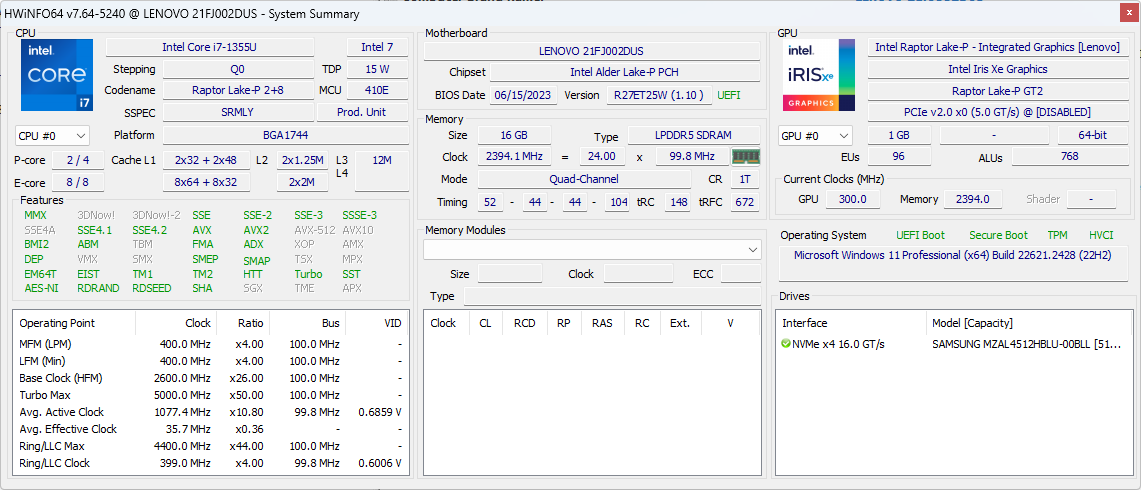
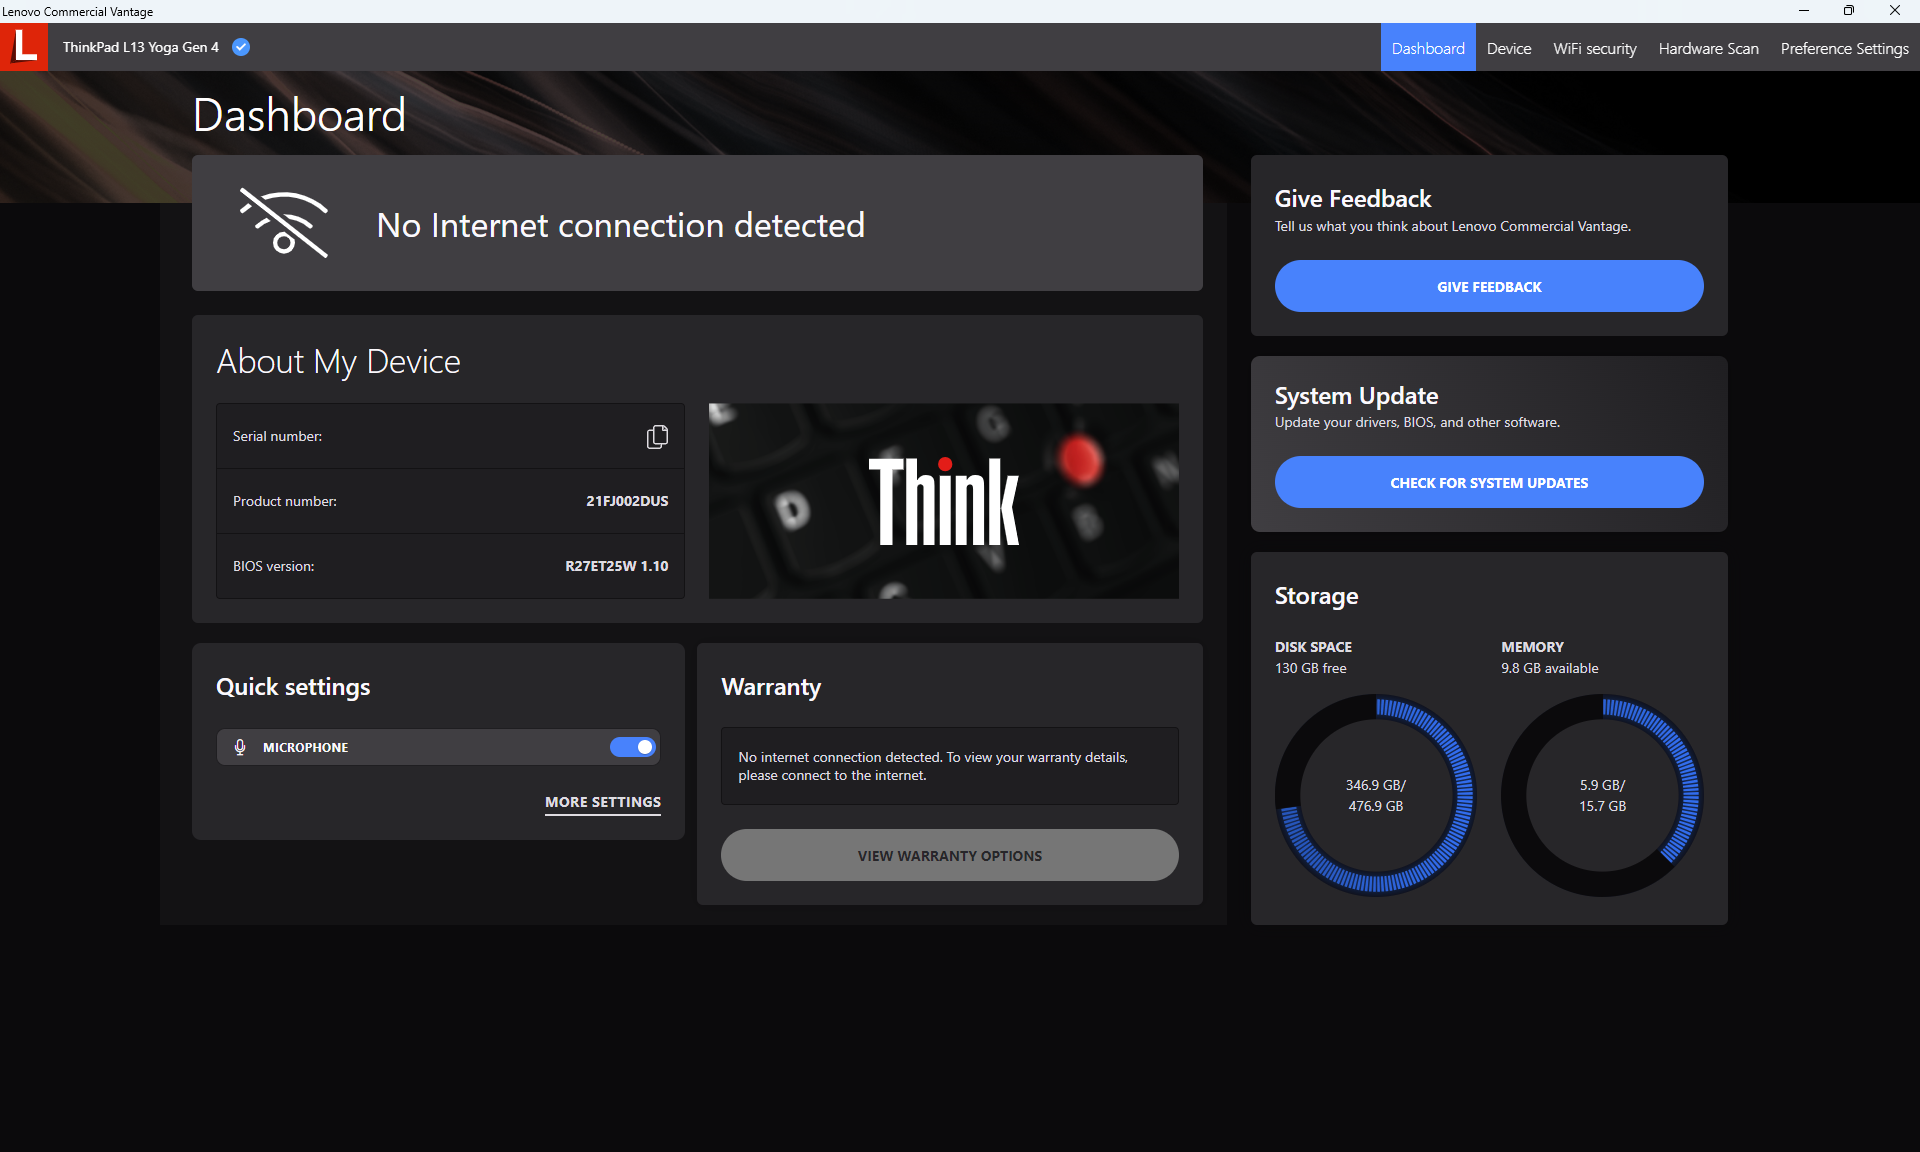
Notre modèle Intel est une configuration haut de gamme avec le processeur Core i7-1355U Raptor Lake-U de 13e génération, 16 Go de RAM et un écran tactile IPS 1200p pour un prix de détail d'environ 1400 à 600 USD. Les autres configurations vont du Core i3-1315U au Core i7-1365U avec vPro, mais toutes les options se limitent à des graphiques intégrés et à un écran 1200p.
Les alternatives au ThinkPad L13 Yoga G4 comprennent d'autres ordinateurs convertibles centrés sur l'entreprise, comme le MSI Summit E13 Flip Evo,HP Elite Dragonfly Folio 13.5ou le Dell Latitude 7330 2-en-1.
Plus de commentaires sur Lenovo :
Comparaison avec les concurrents potentiels
Note | Date | Modèle | Poids | Épaisseur | Taille | Résolution | Prix |
|---|---|---|---|---|---|---|---|
| 88.1 % v7 (old) | 11/23 | Lenovo ThinkPad L13 Yoga G4 i7-1355U i7-1355U, Iris Xe G7 96EUs | 1.4 kg | 17.1 mm | 13.30" | 1920x1200 | |
| 88.7 % v7 (old) | 08/23 | Lenovo ThinkPad L13 Yoga G4 21FSS00100 R5 7530U, Vega 7 | 1.4 kg | 17.1 mm | 13.30" | 1920x1200 | |
| 90.3 % v7 (old) | 12/22 | HP Elite Dragonfly Folio 13.5 G3 i7-1265U, Iris Xe G7 96EUs | 1.4 kg | 17.8 mm | 13.50" | 1920x1280 | |
| 89 % v7 (old) | 11/22 | Dell Latitude 9330 i7-1260U, Iris Xe G7 96EUs | 1.2 kg | 14.1 mm | 13.30" | 2560x1600 | |
| 86.9 % v7 (old) | 04/21 | MSI Summit E13 Flip Evo A11MT i7-1185G7, Iris Xe G7 96EUs | 1.4 kg | 14.9 mm | 13.40" | 1920x1200 | |
| 87.5 % v7 (old) | 10/23 | Framework Laptop 13.5 Ryzen 7 7840U R7 7840U, Radeon 780M | 1.3 kg | 15.85 mm | 13.50" | 2256x1504 |
Cas
Comme sur le récent ThinkPad E14 G5, le moyen le plus rapide d'identifier la version Intel de la version AMD est de rechercher le logo Thunderbolt le long du bord gauche, car les options AMD sont dépourvues de cette fonctionnalité. Notez que si le modèle est livré avec deux ports USB-C, seul le port de gauche est compatible avec les périphériques Thunderbolt comme les eGPU.
Communication
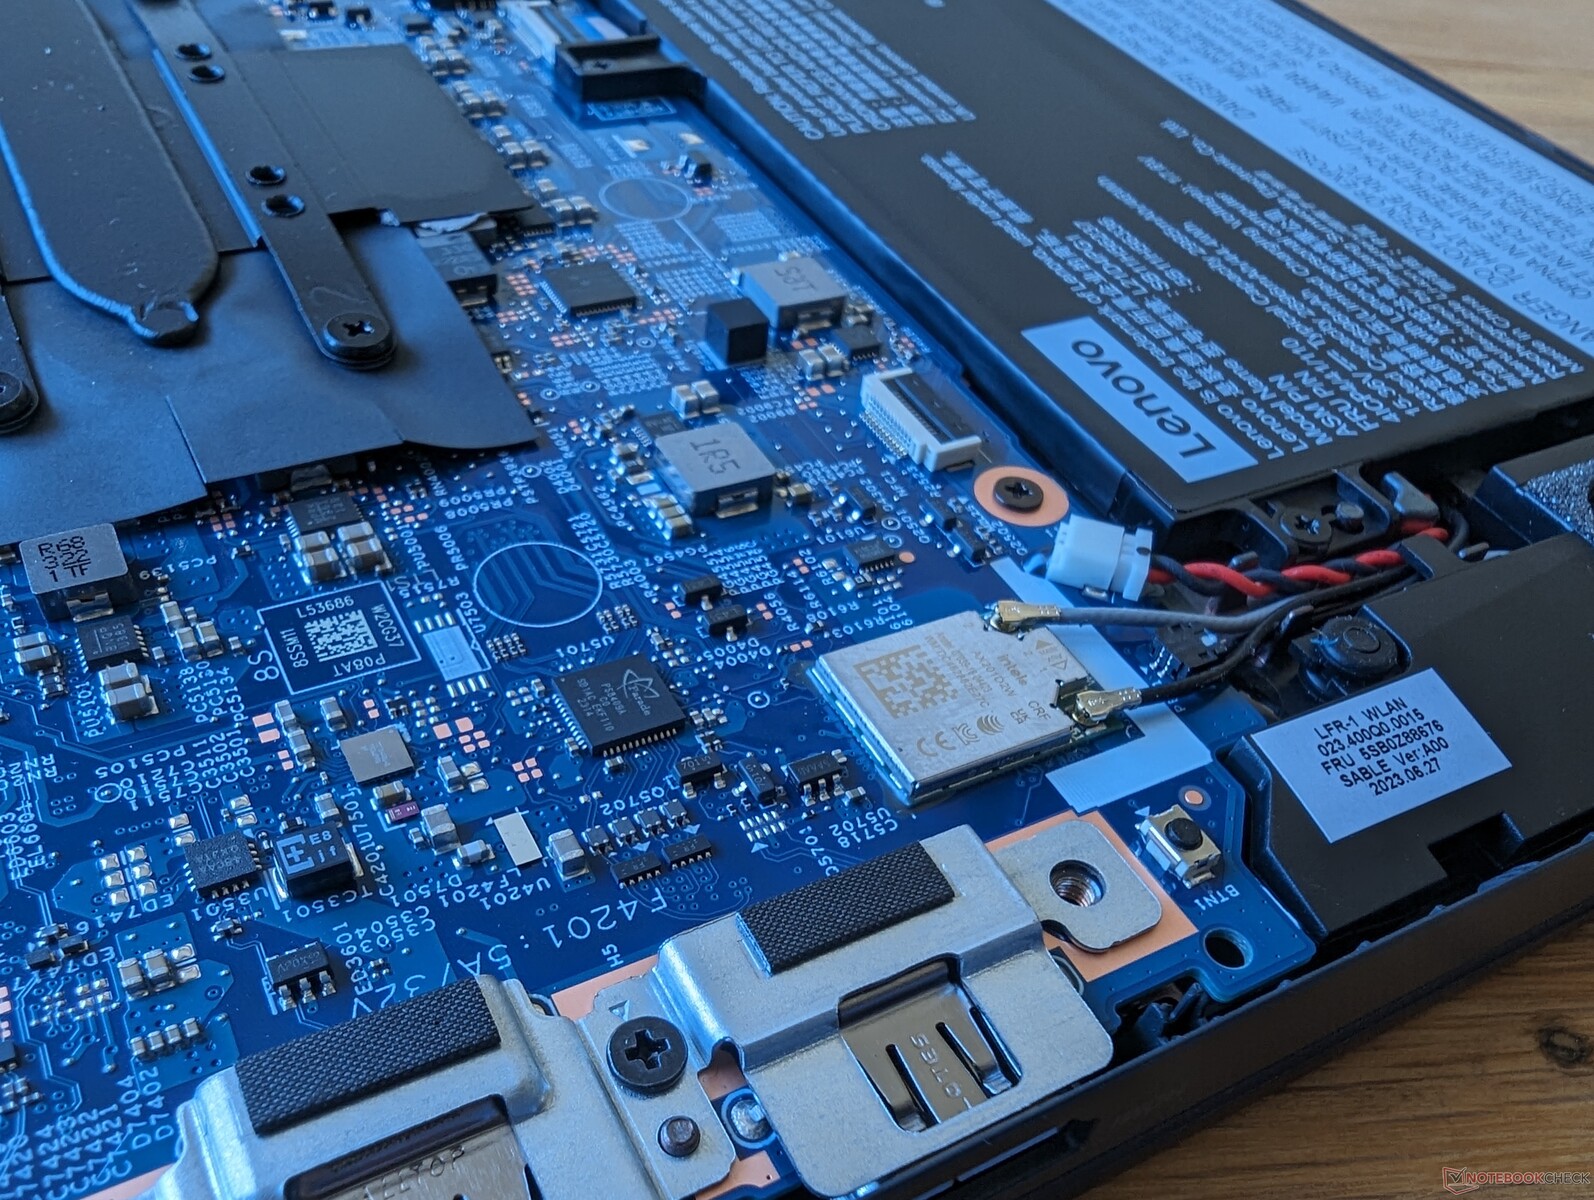
L'Intel AX201 est livré en standard avec la prise en charge du Wi-Fi 6 et du Bluetooth 5.1, tandis que l'Intel AX211 avec le Wi-Fi 6E est en option.
| Networking | |
| iperf3 transmit AX12 | |
| MSI Summit E13 Flip Evo A11MT | |
| iperf3 receive AX12 | |
| MSI Summit E13 Flip Evo A11MT | |
| iperf3 transmit AXE11000 | |
| Framework Laptop 13.5 Ryzen 7 7840U | |
| Lenovo ThinkPad L13 Yoga G4 i7-1355U | |
| HP Elite Dragonfly Folio 13.5 G3 | |
| Dell Latitude 9330 | |
| Lenovo ThinkPad L13 Yoga G4 21FSS00100 | |
| iperf3 receive AXE11000 | |
| Lenovo ThinkPad L13 Yoga G4 21FSS00100 | |
| Framework Laptop 13.5 Ryzen 7 7840U | |
| Lenovo ThinkPad L13 Yoga G4 i7-1355U | |
| HP Elite Dragonfly Folio 13.5 G3 | |
| Dell Latitude 9330 | |
| iperf3 transmit AXE11000 6GHz | |
| Framework Laptop 13.5 Ryzen 7 7840U | |
| HP Elite Dragonfly Folio 13.5 G3 | |
| Dell Latitude 9330 | |
| Lenovo ThinkPad L13 Yoga G4 21FSS00100 | |
| iperf3 receive AXE11000 6GHz | |
| Lenovo ThinkPad L13 Yoga G4 21FSS00100 | |
| HP Elite Dragonfly Folio 13.5 G3 | |
| Framework Laptop 13.5 Ryzen 7 7840U | |
| Dell Latitude 9330 | |
Webcam
L'infrarouge est optionnel, tandis que l'obturateur de confidentialité est standard. Les modèles bas de gamme sont équipés d'une webcam 720p, tandis que les modèles haut de gamme offrent une webcam 1080p.


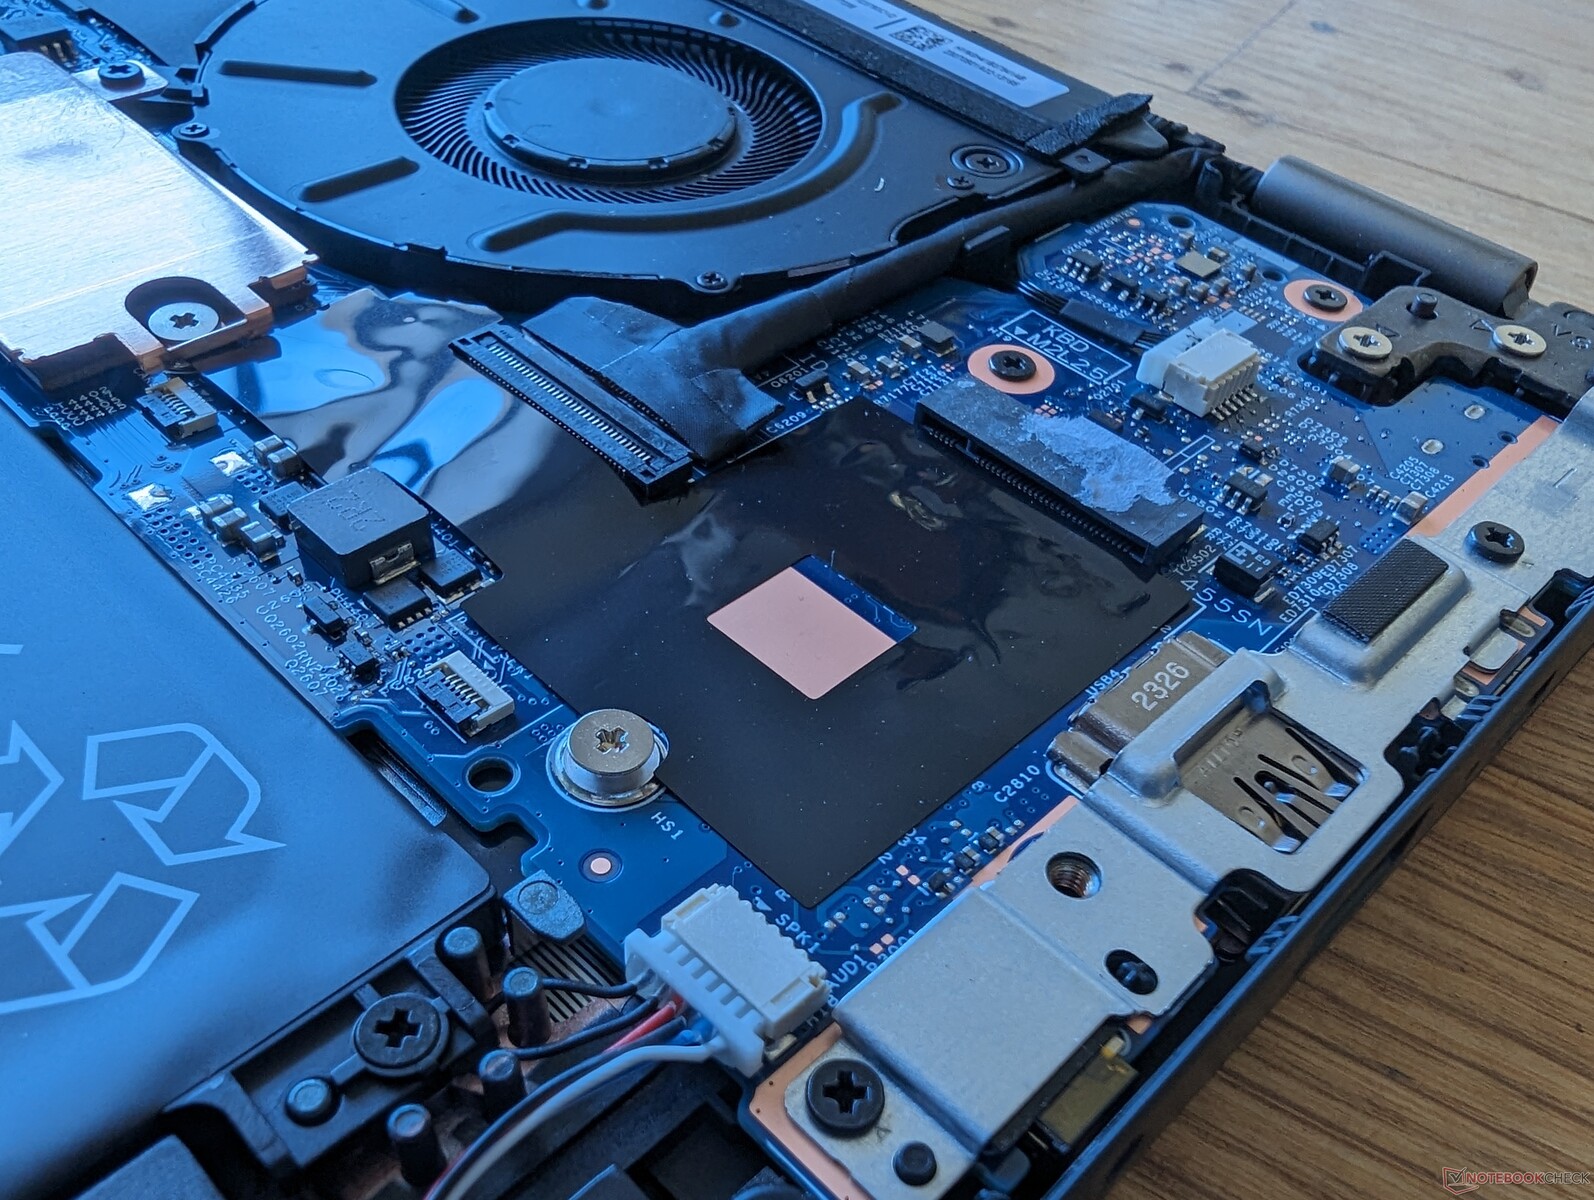
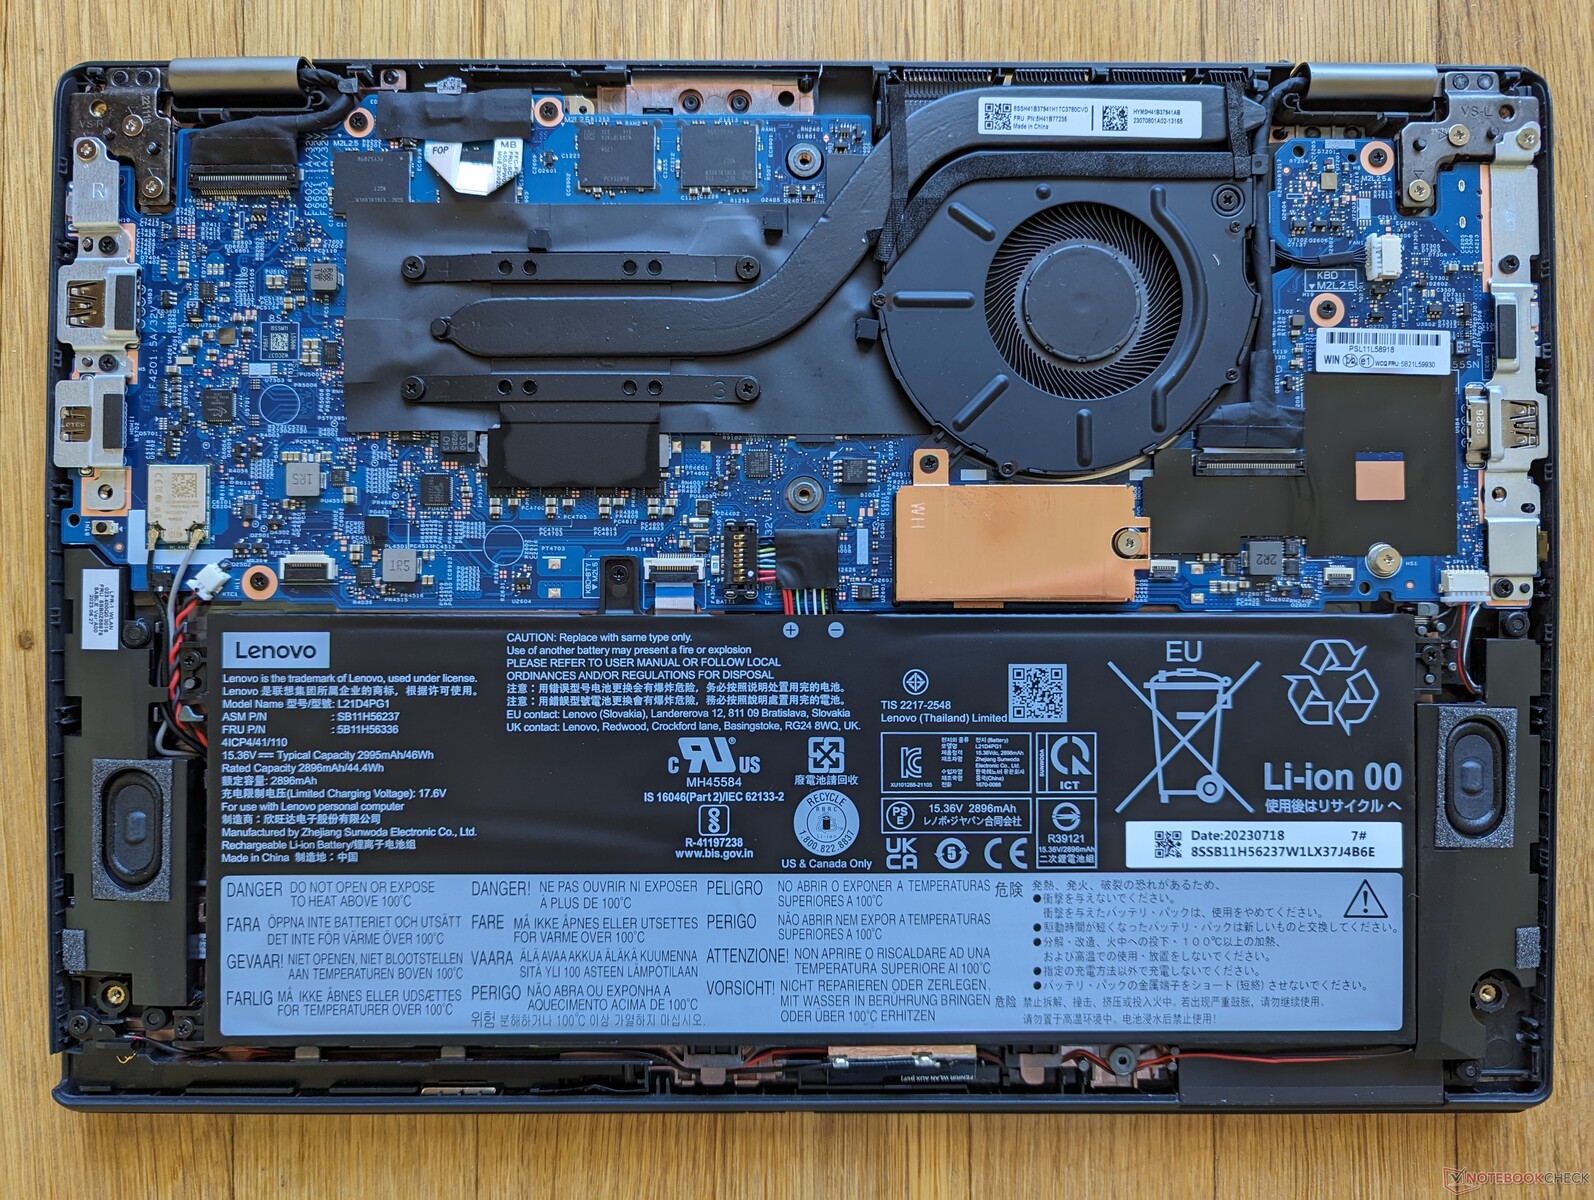
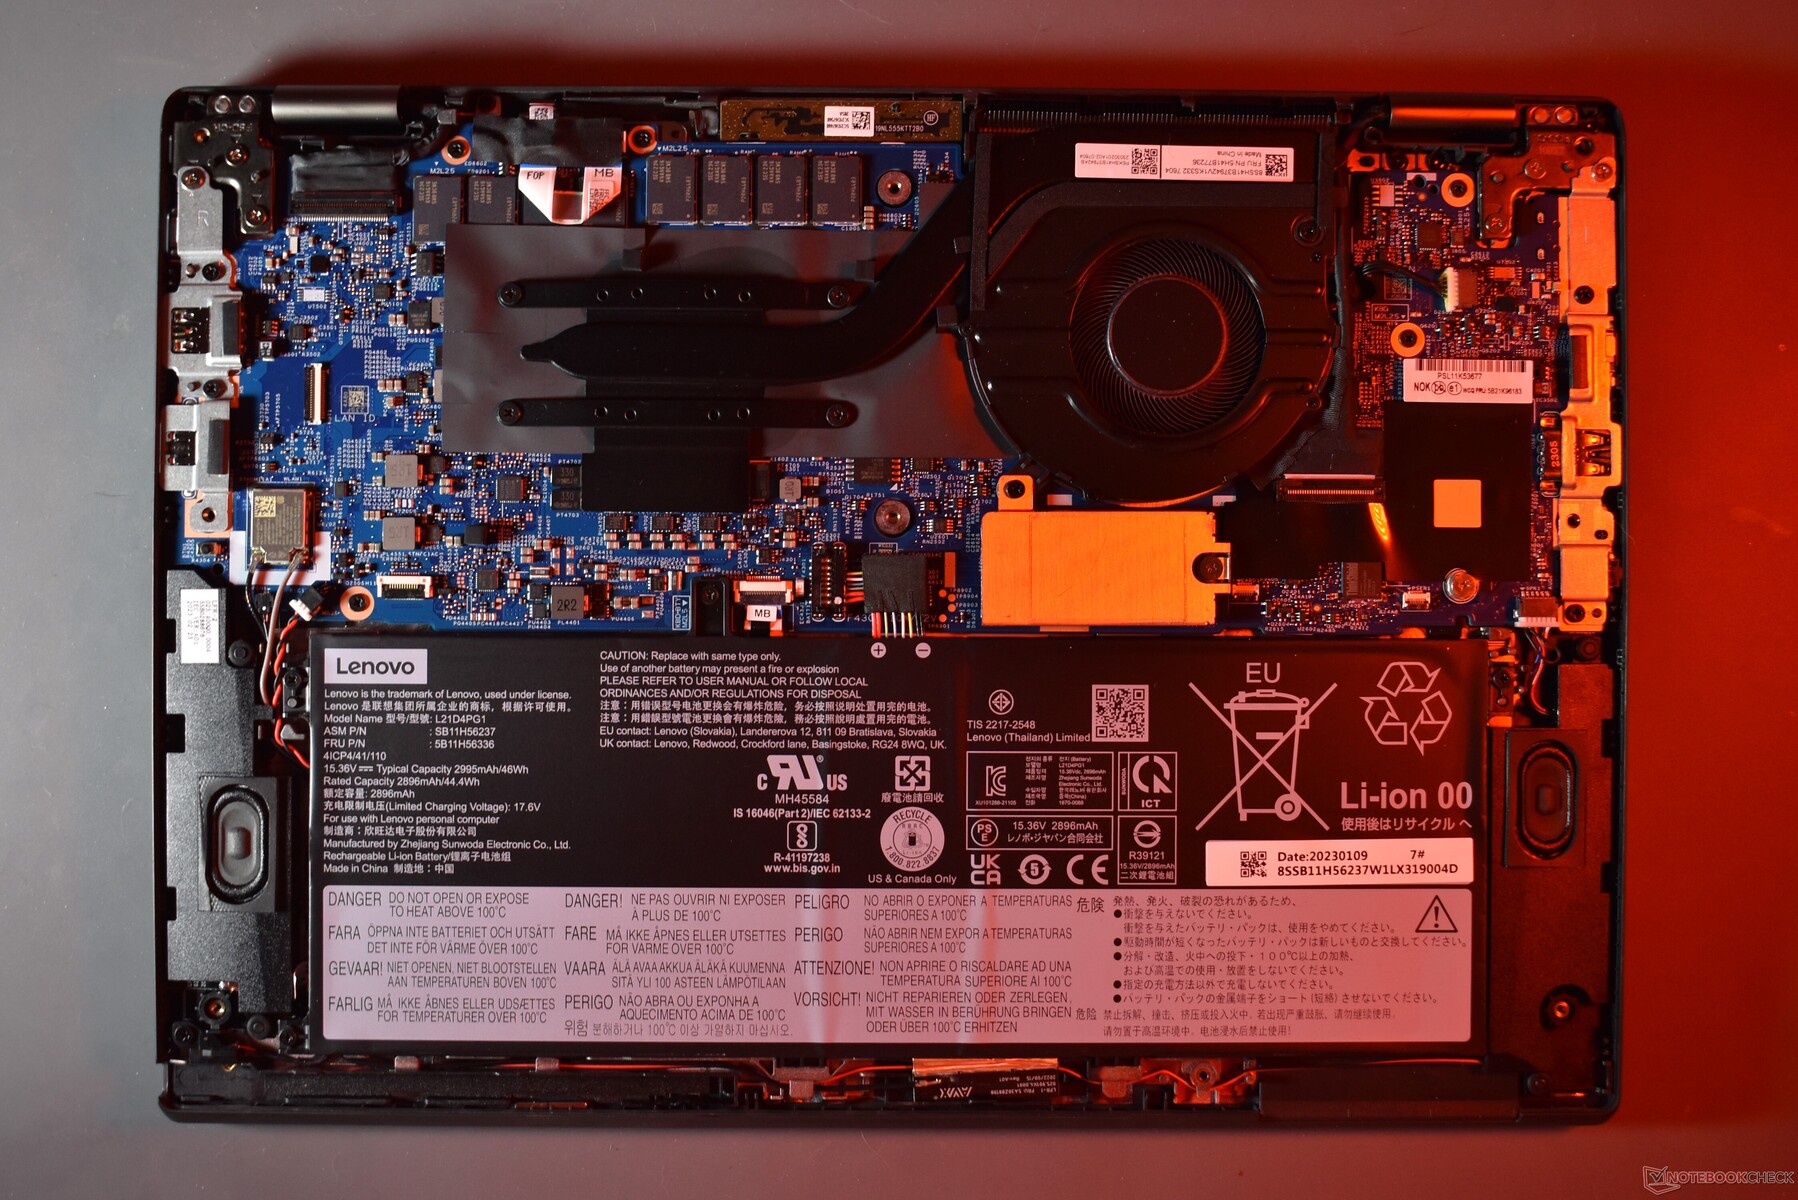
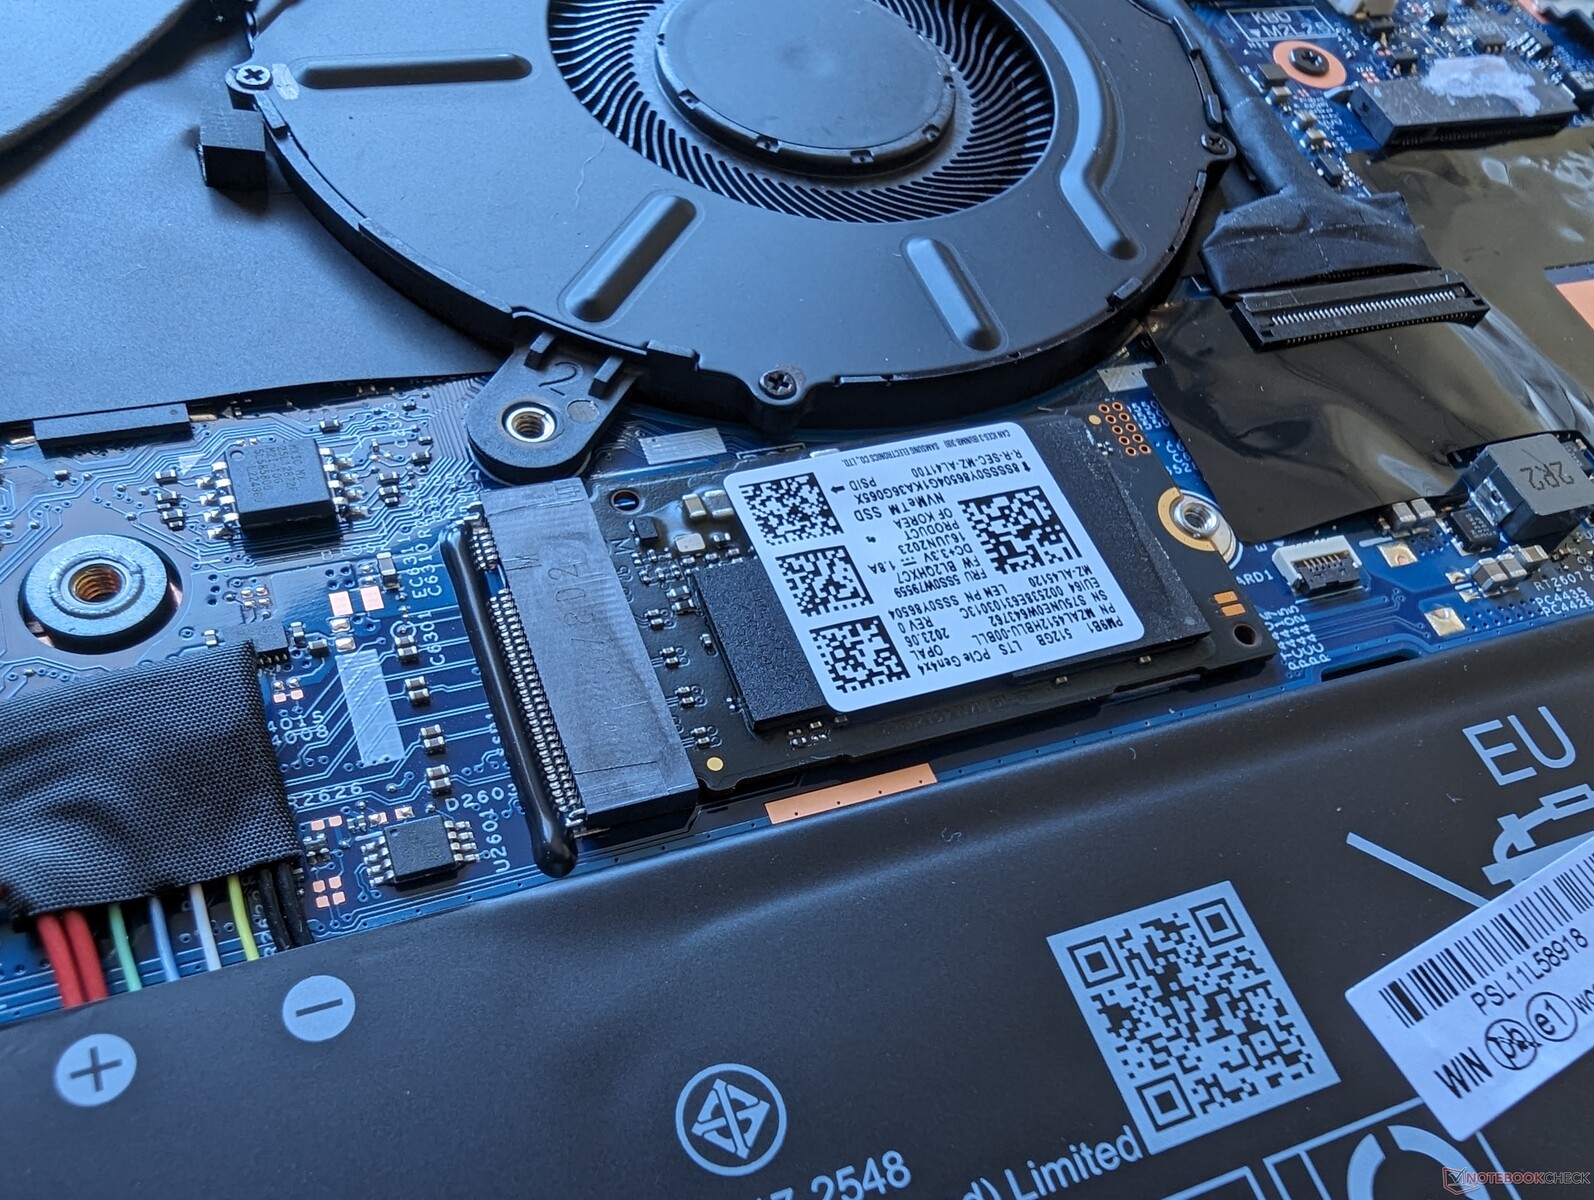
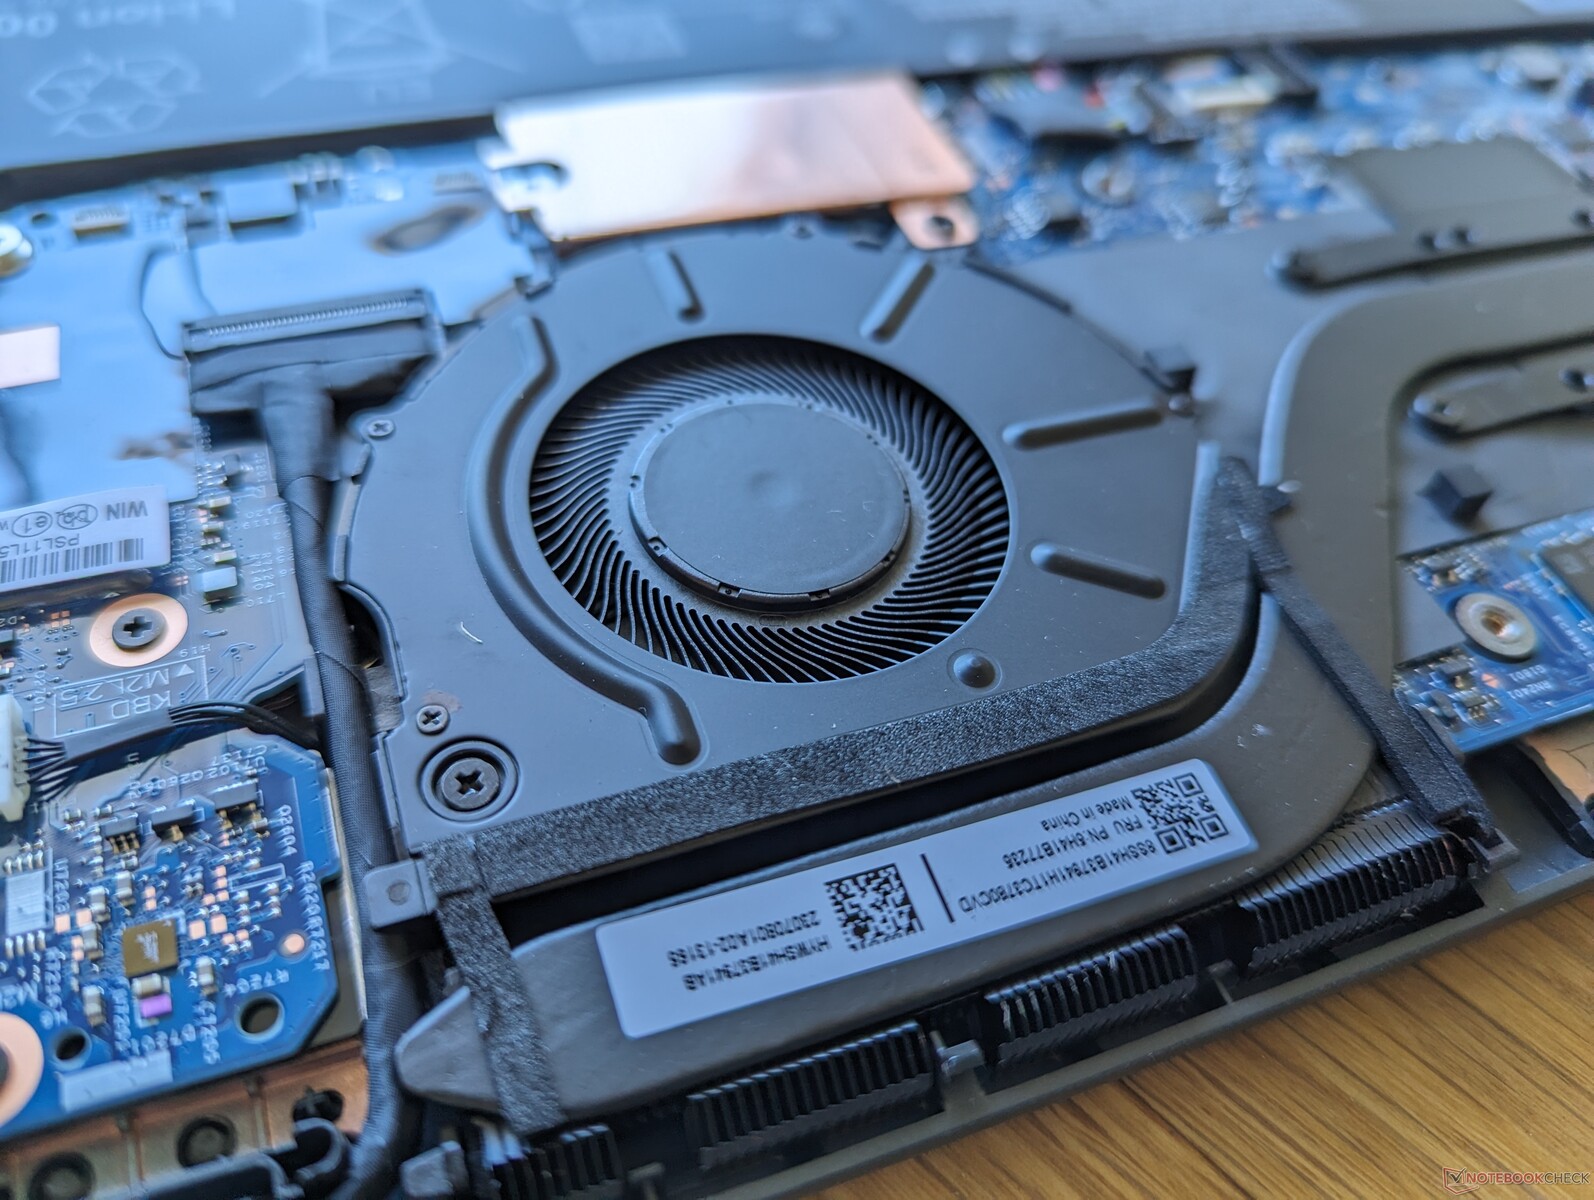
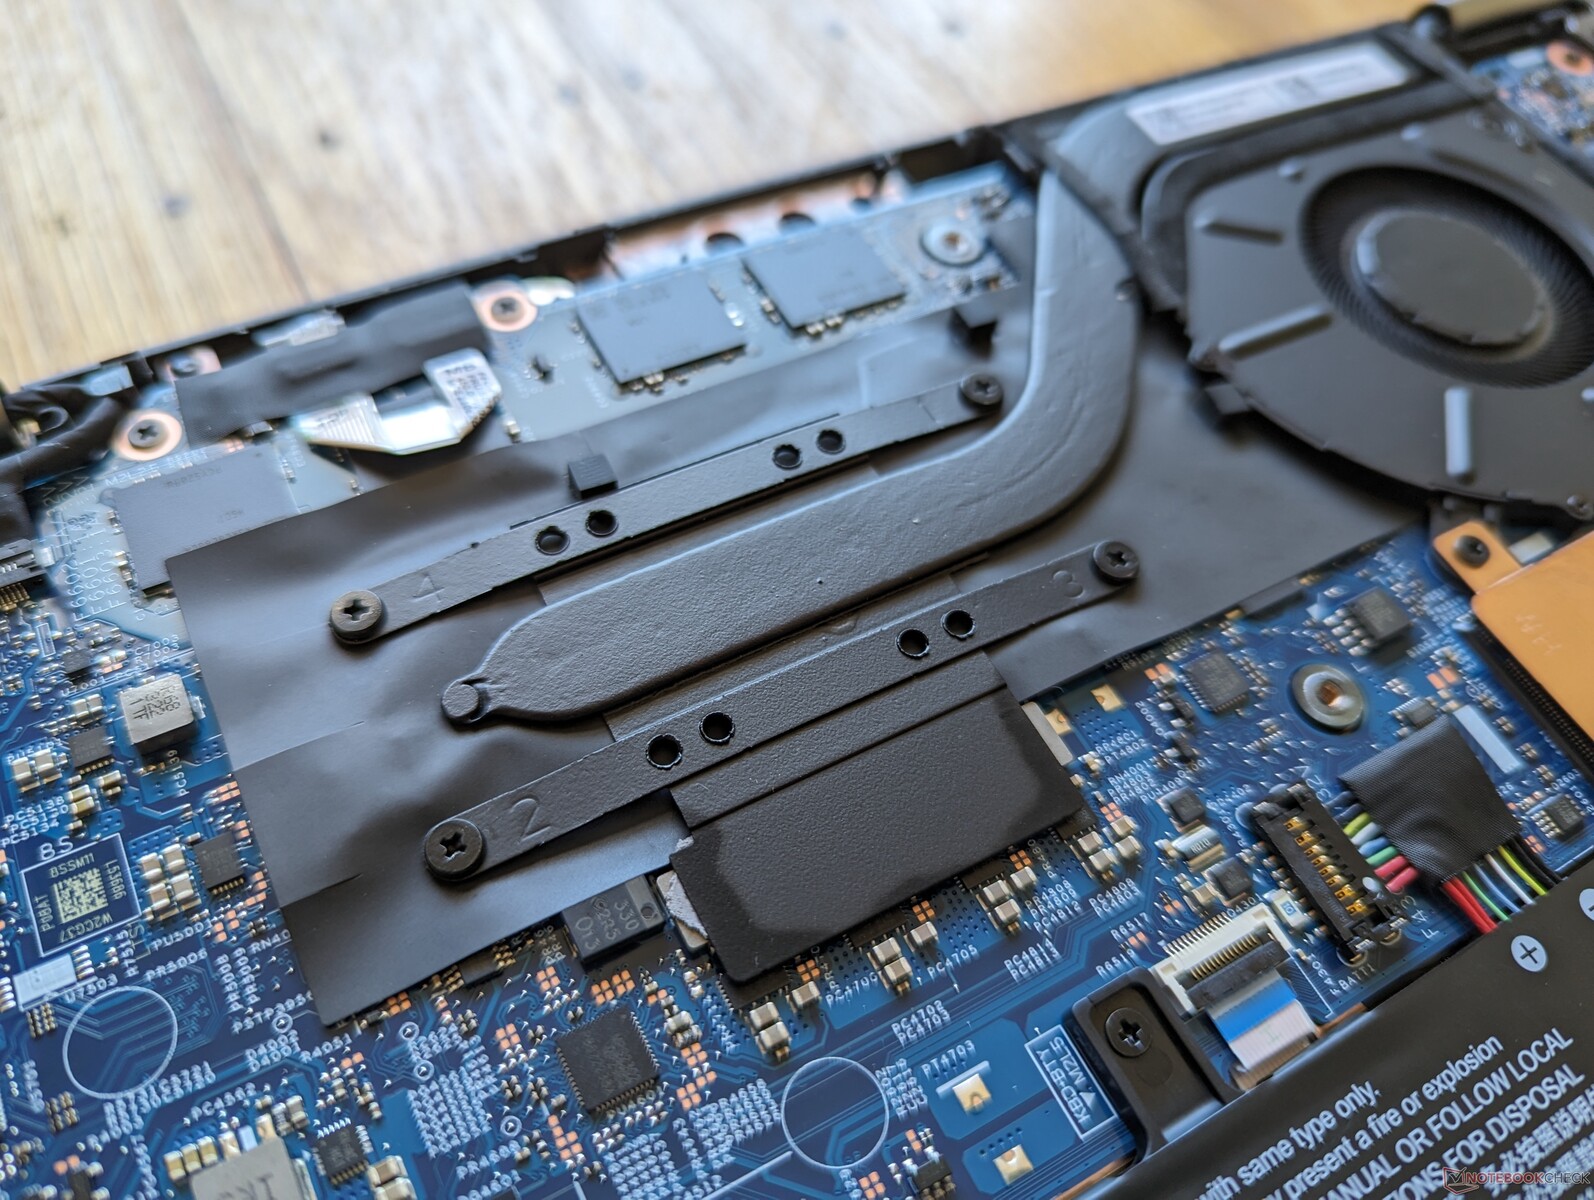
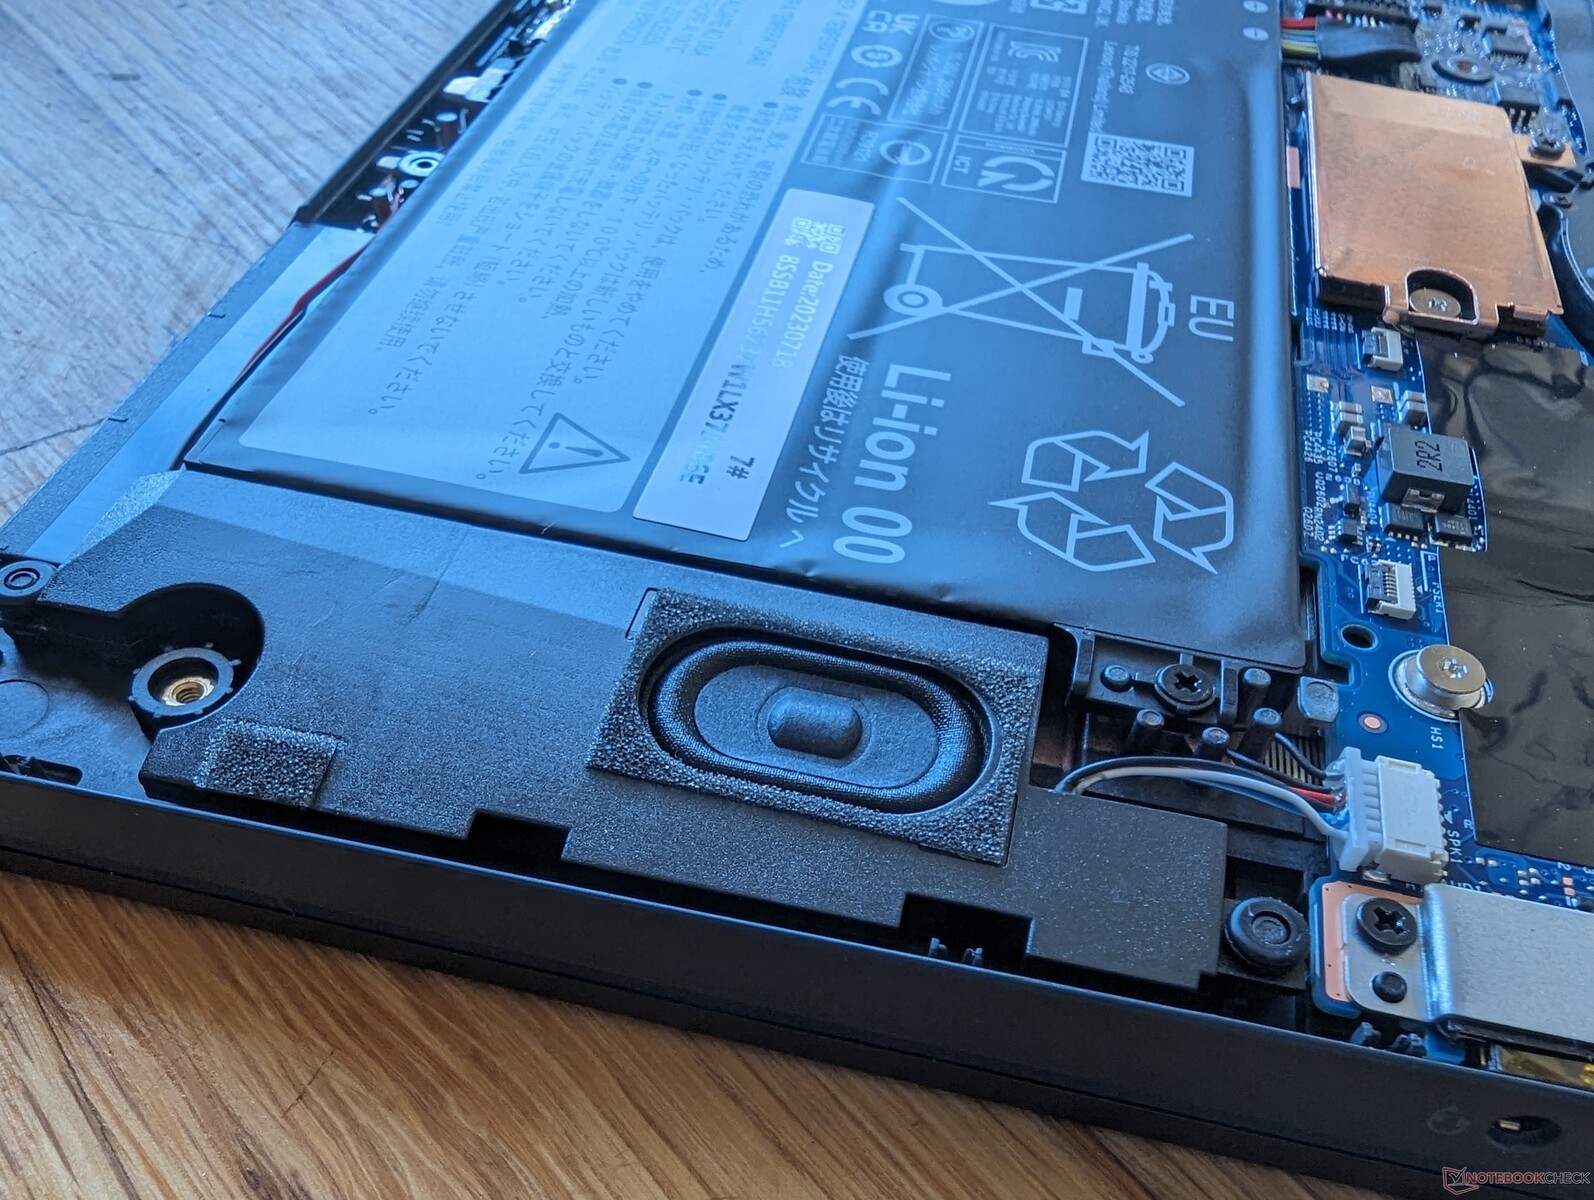
Maintenance
Il n'y a pas de différences internes majeures en termes d'évolutivité entre les versions AMD et Intel, comme le montrent les images comparatives ci-dessous.
Accessoires et garantie
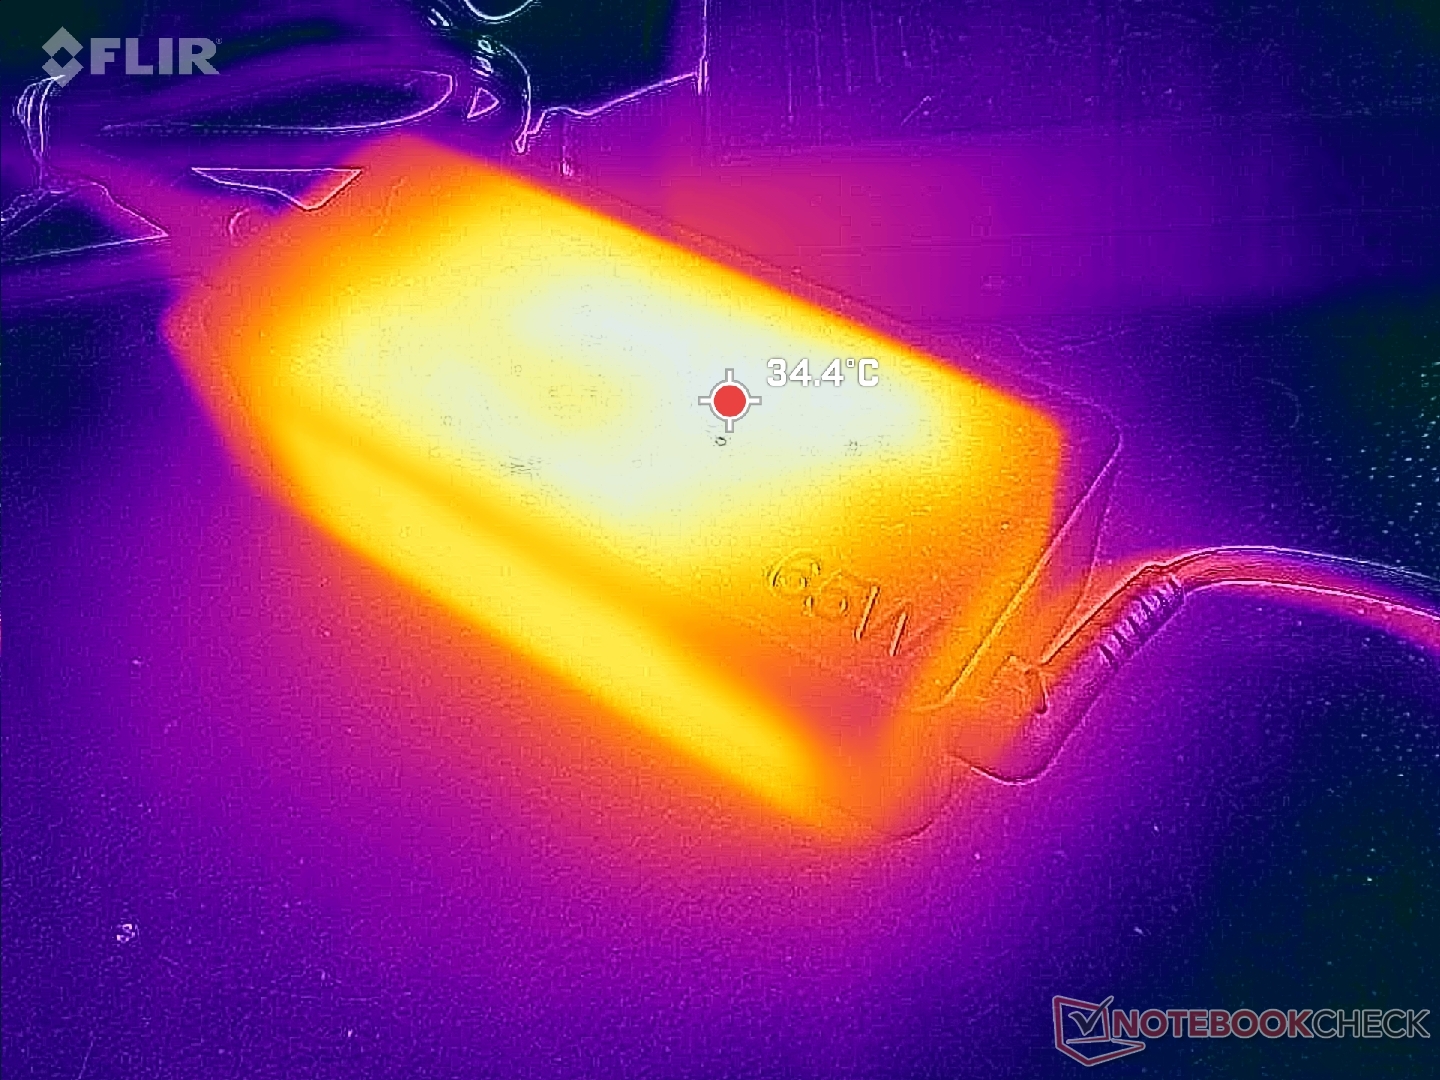
La boîte contient un adaptateur secteur et un stylet actif. Le stylet est logé dans l'ordinateur portable lui-même pour des raisons de commodité et de chargement.
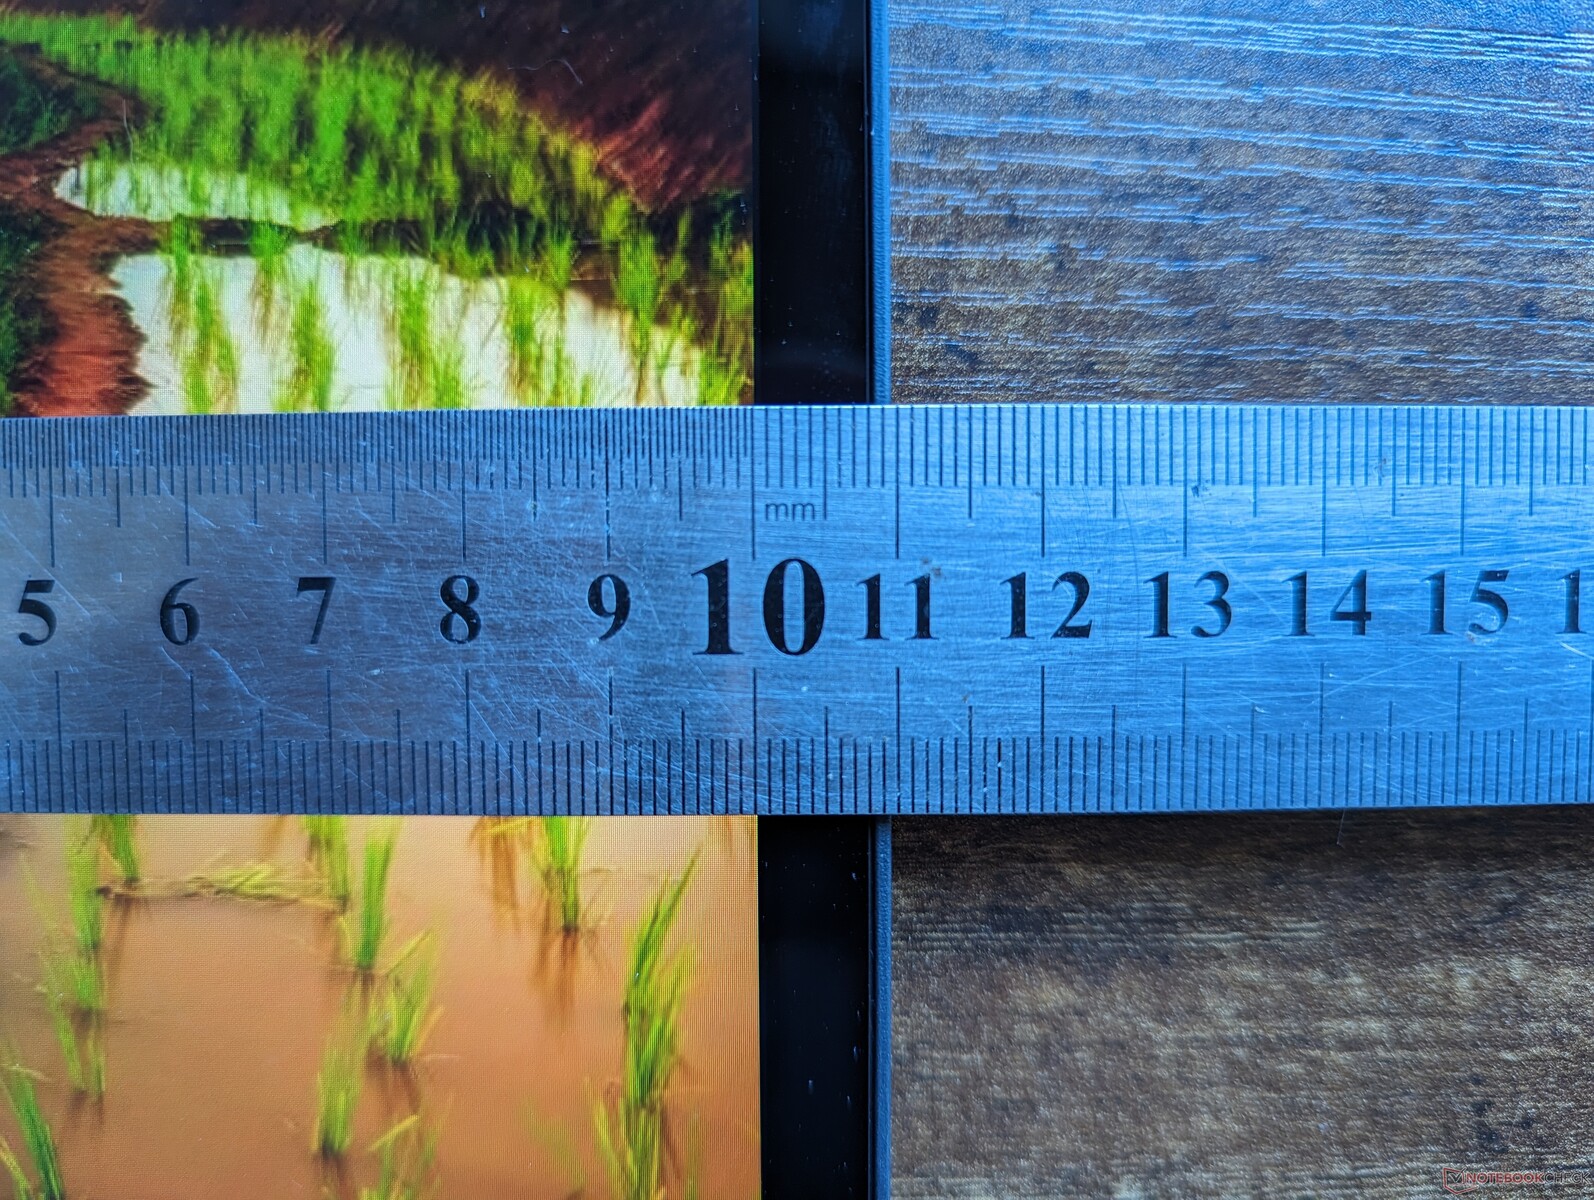
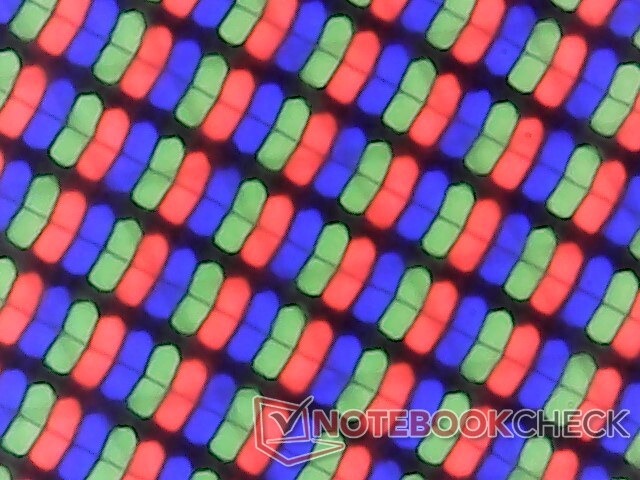
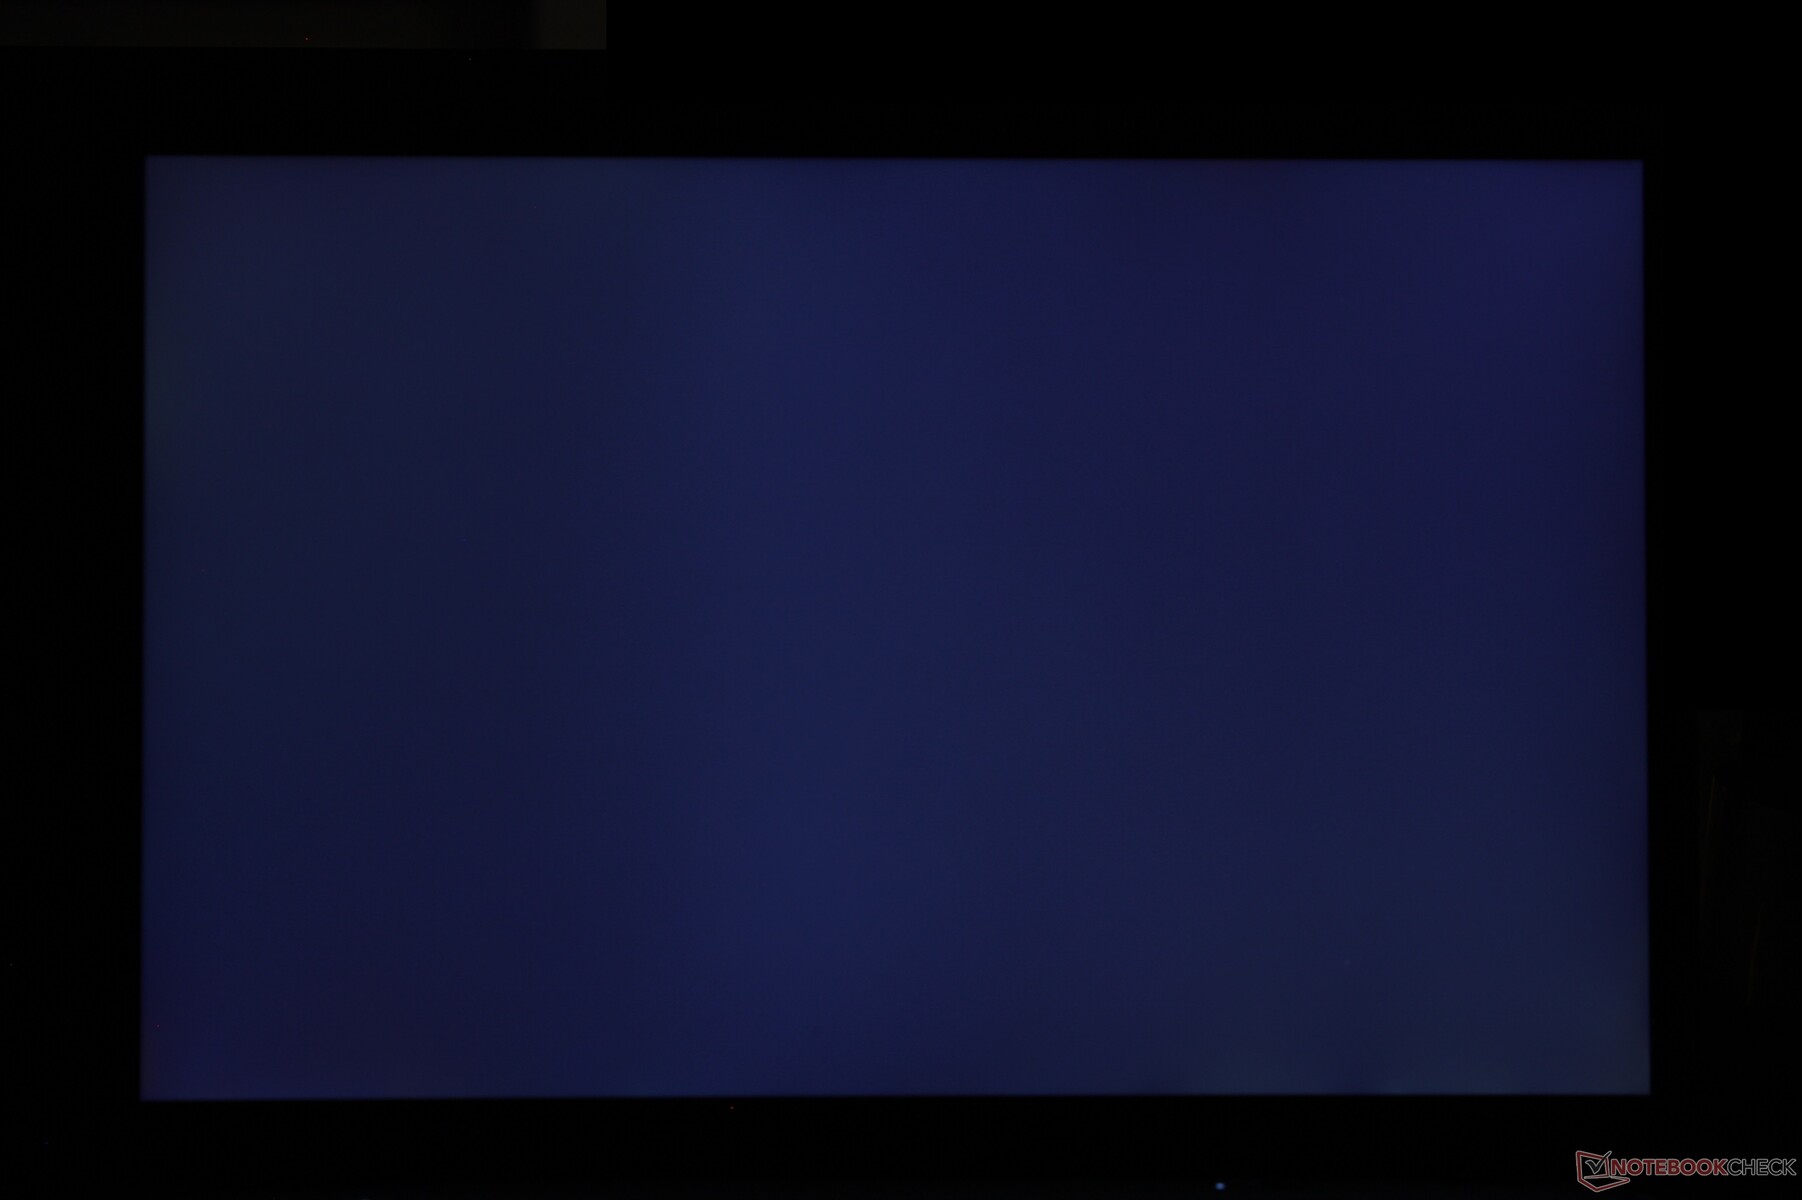
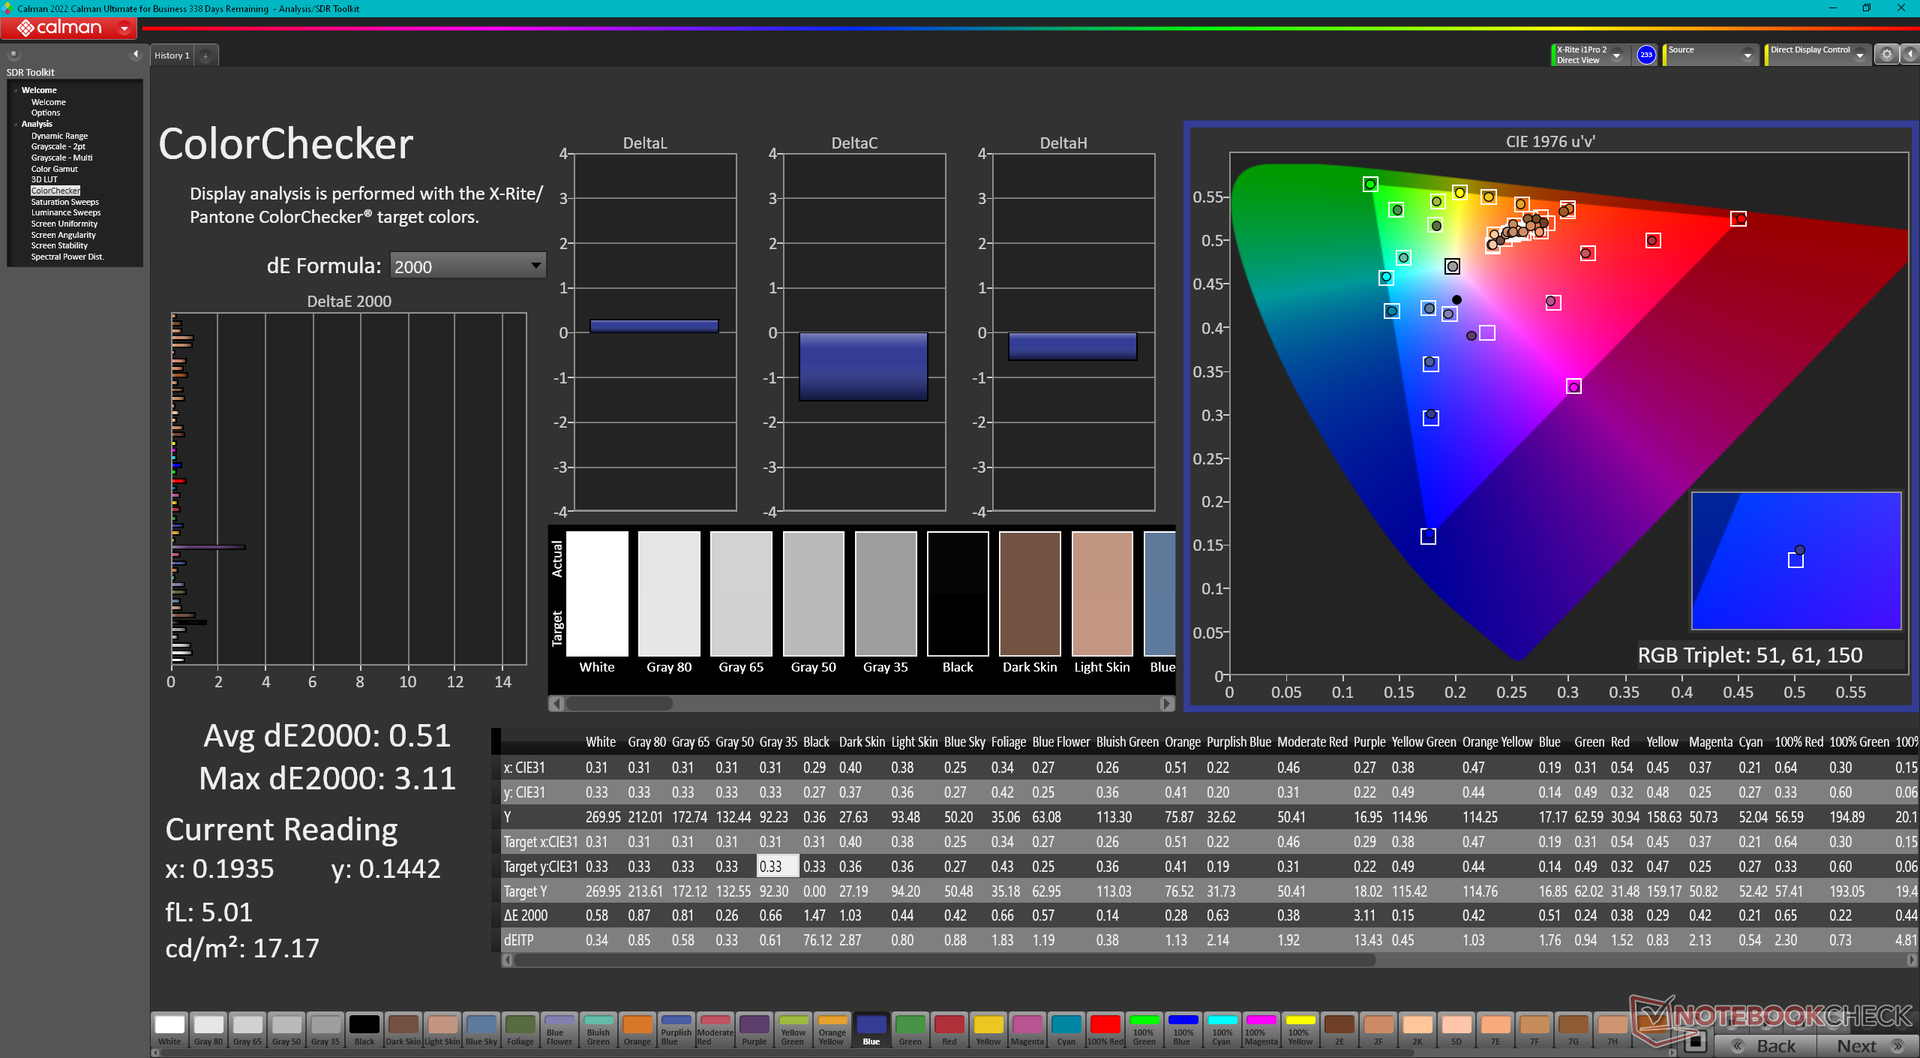
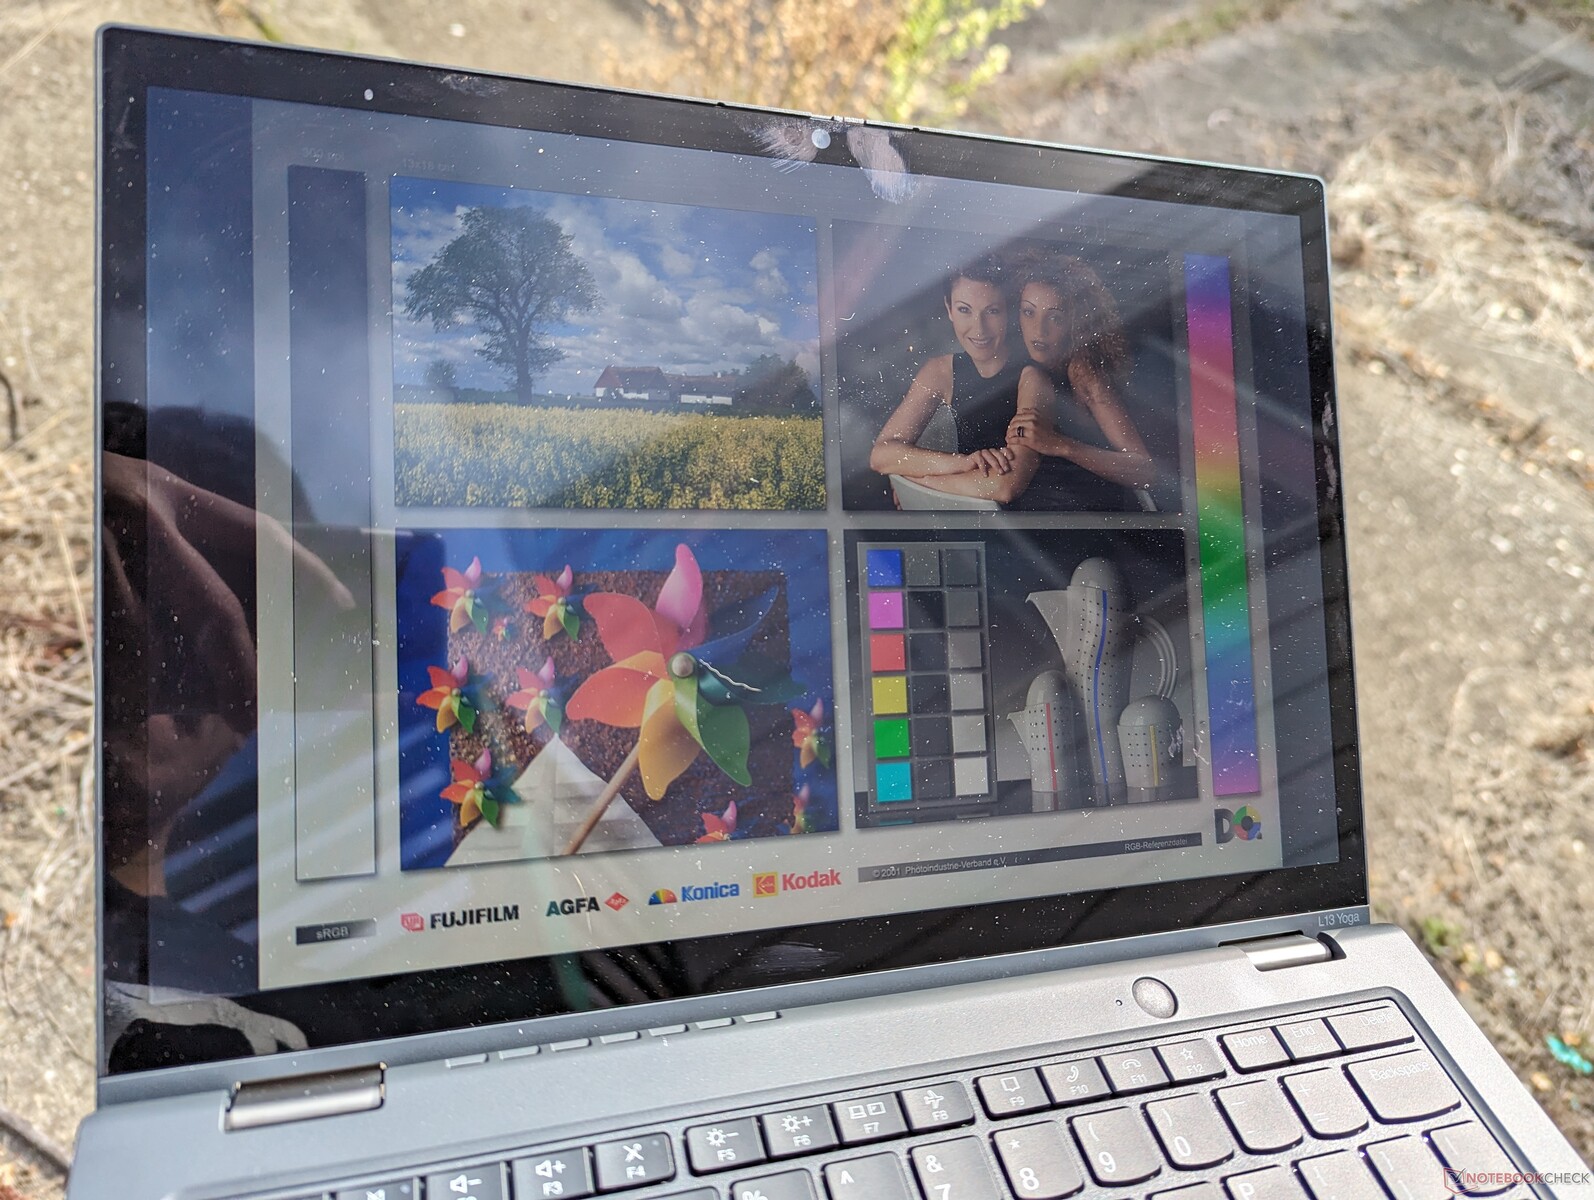
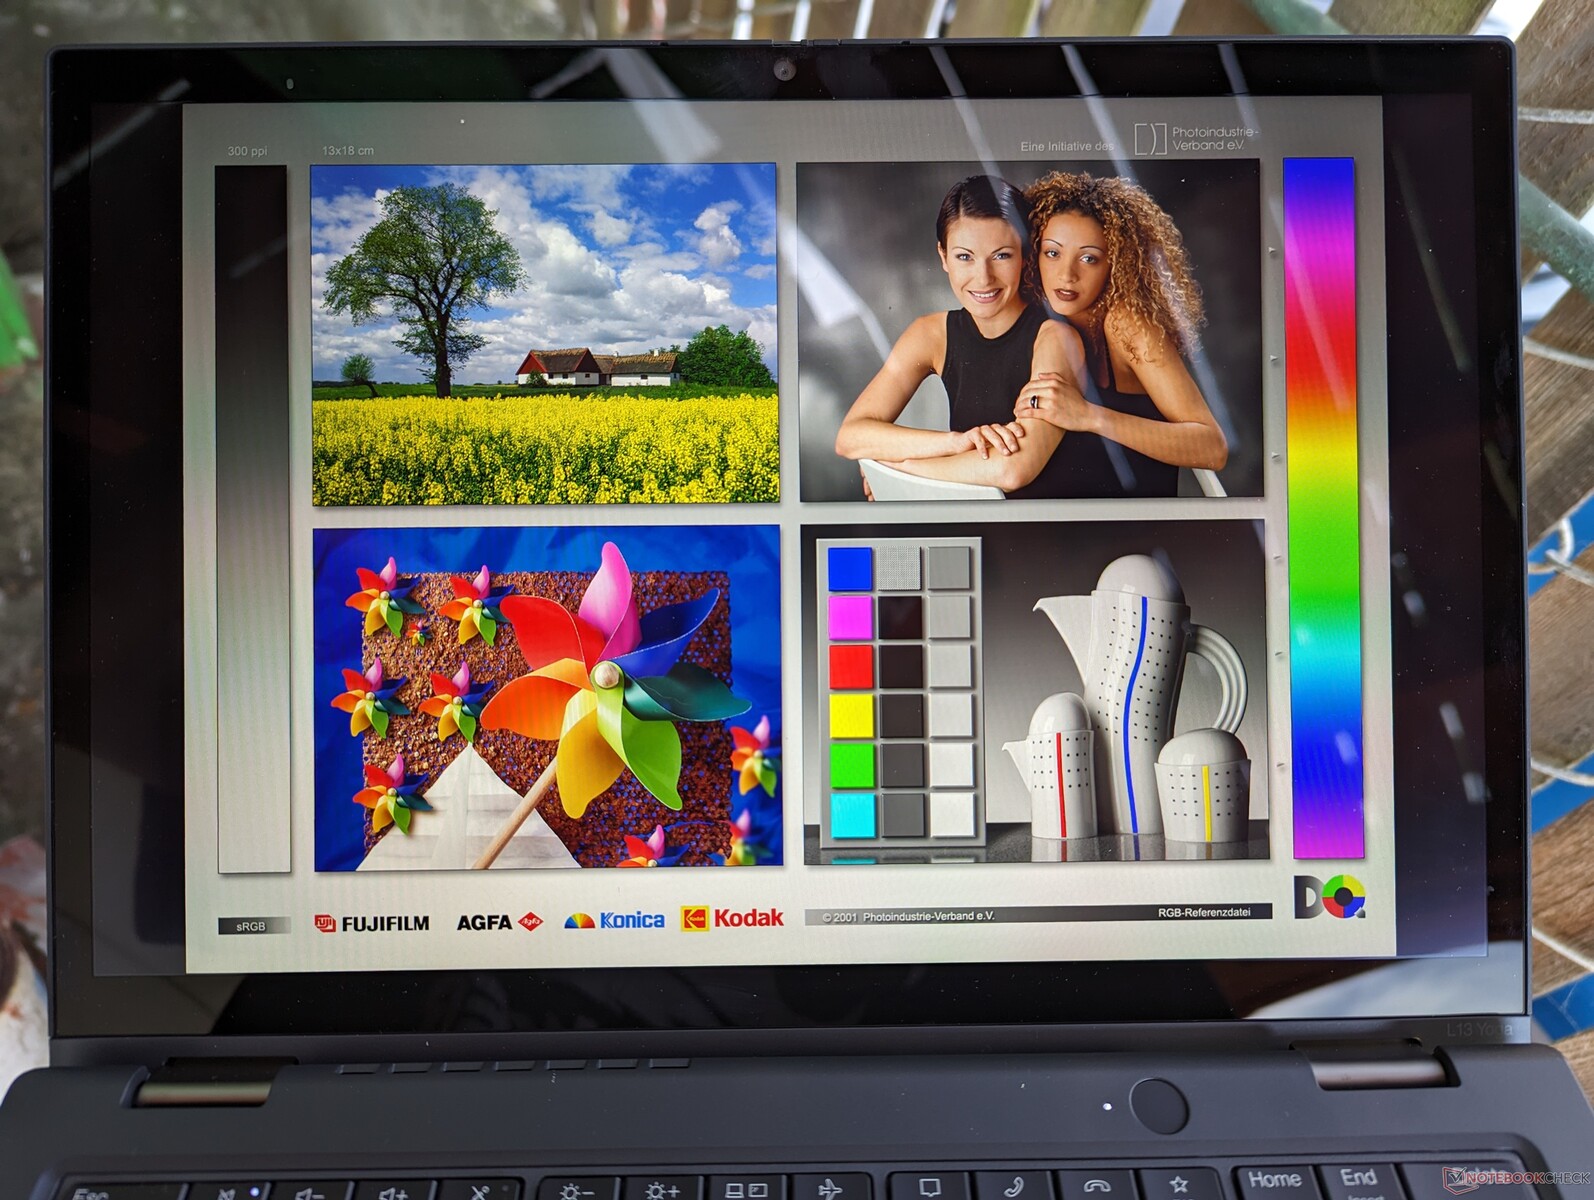
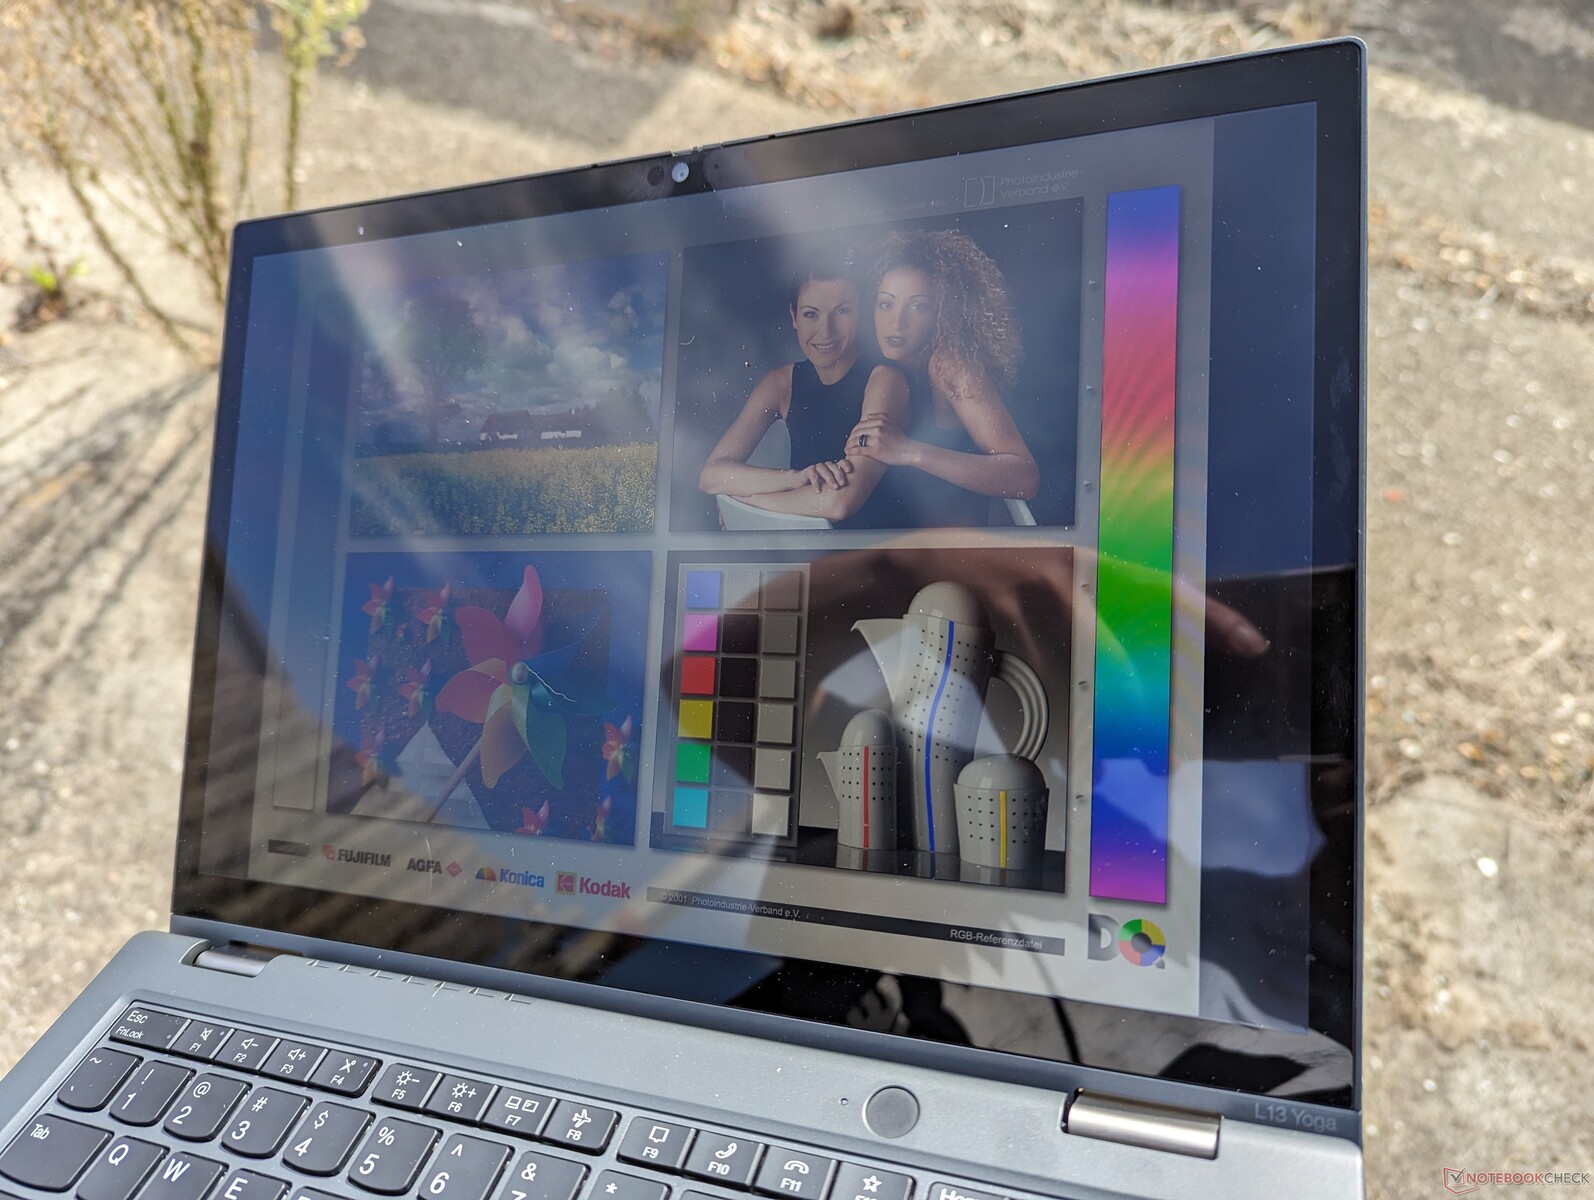
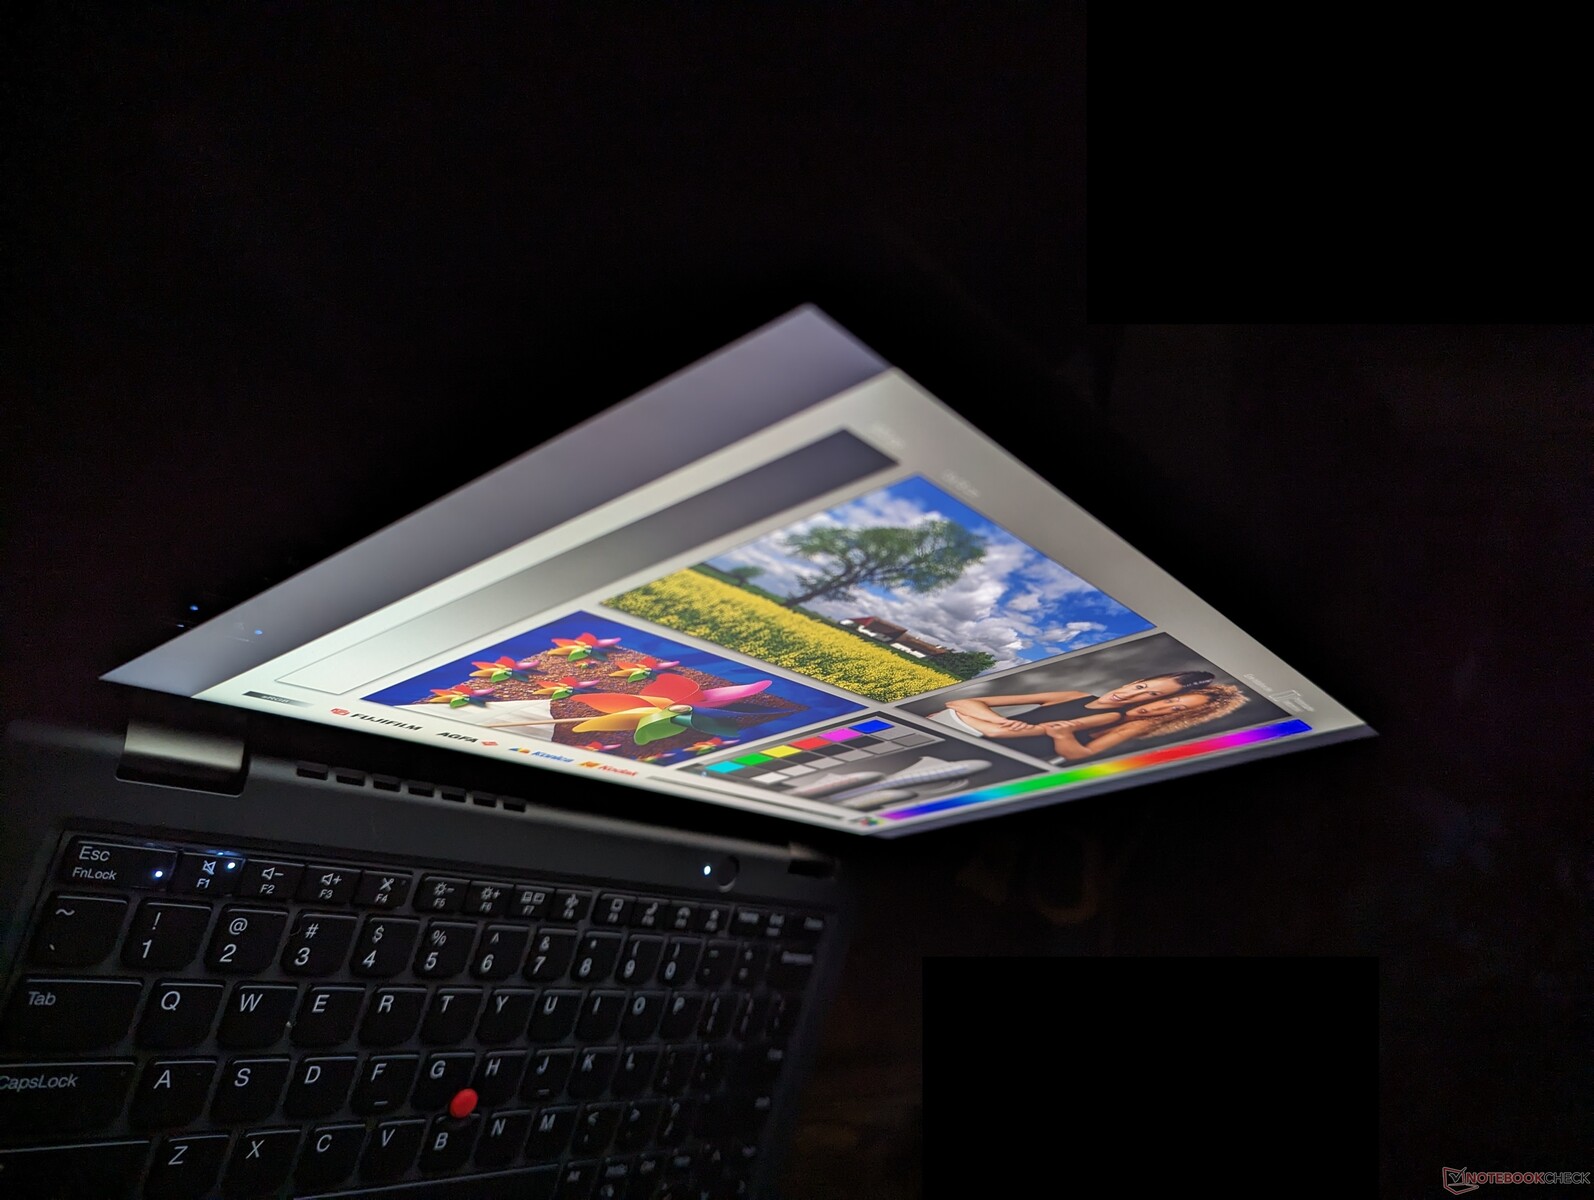
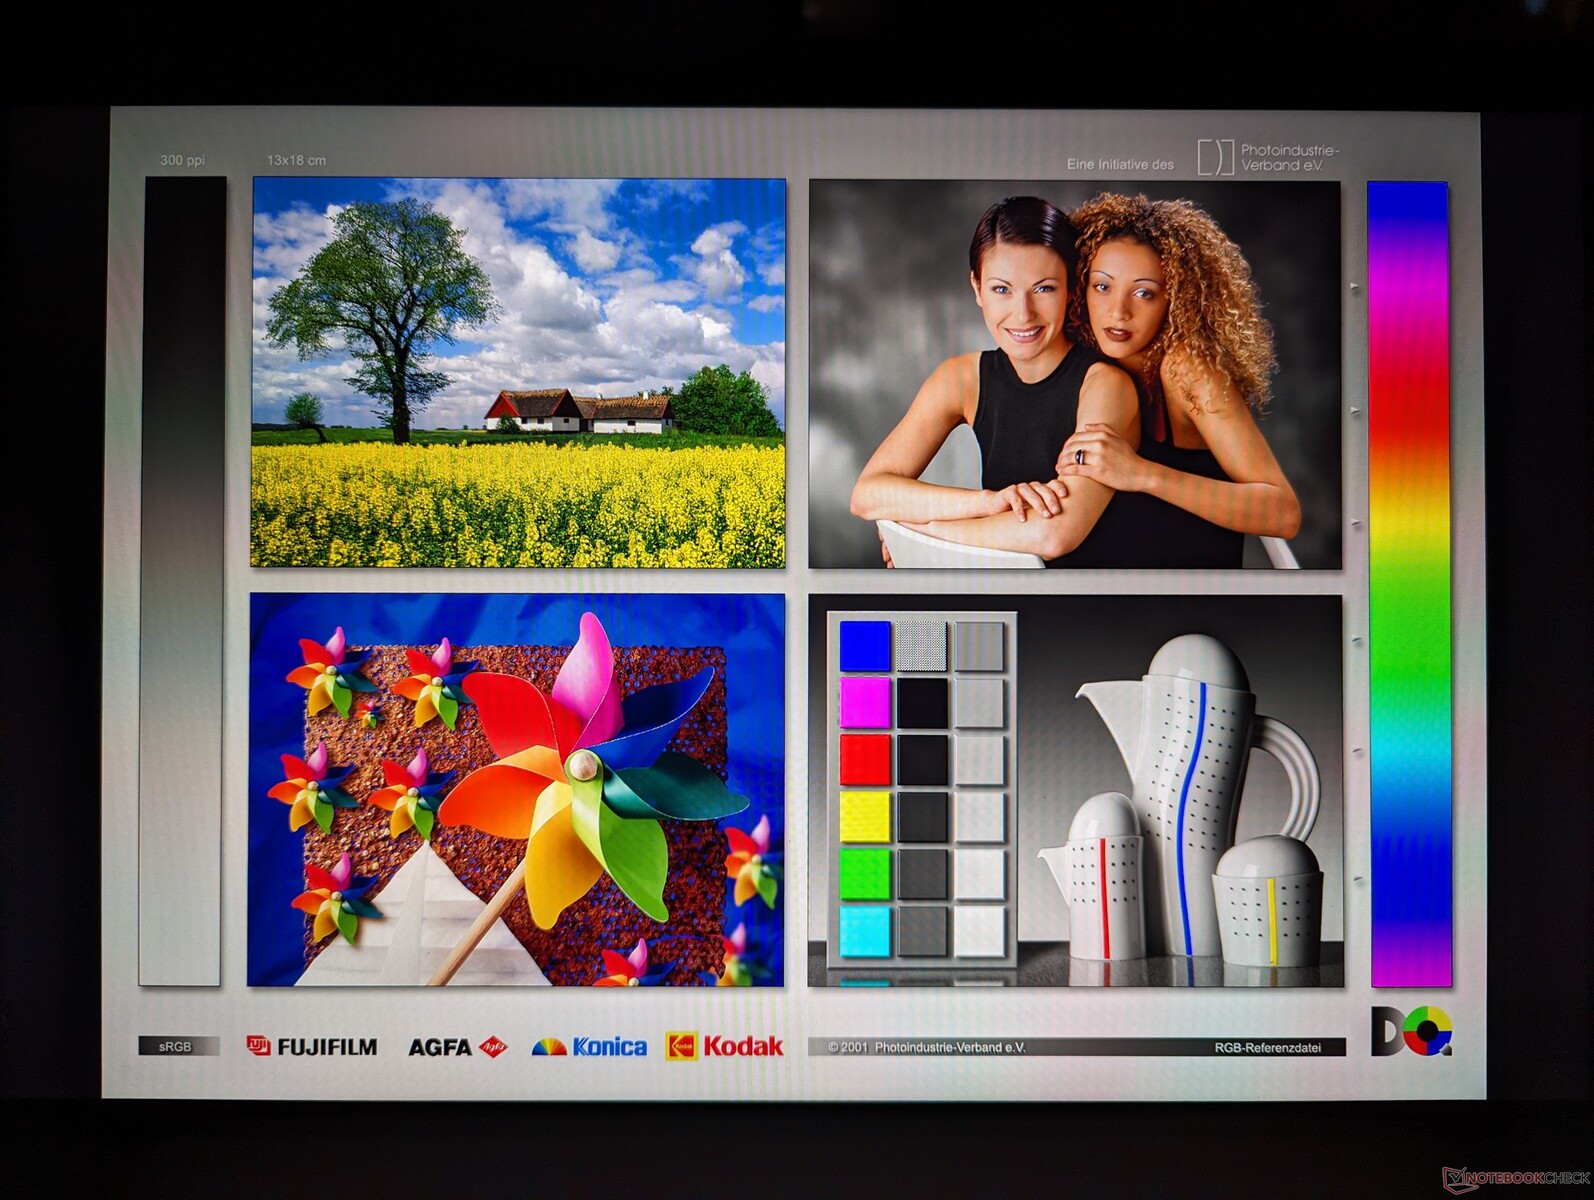
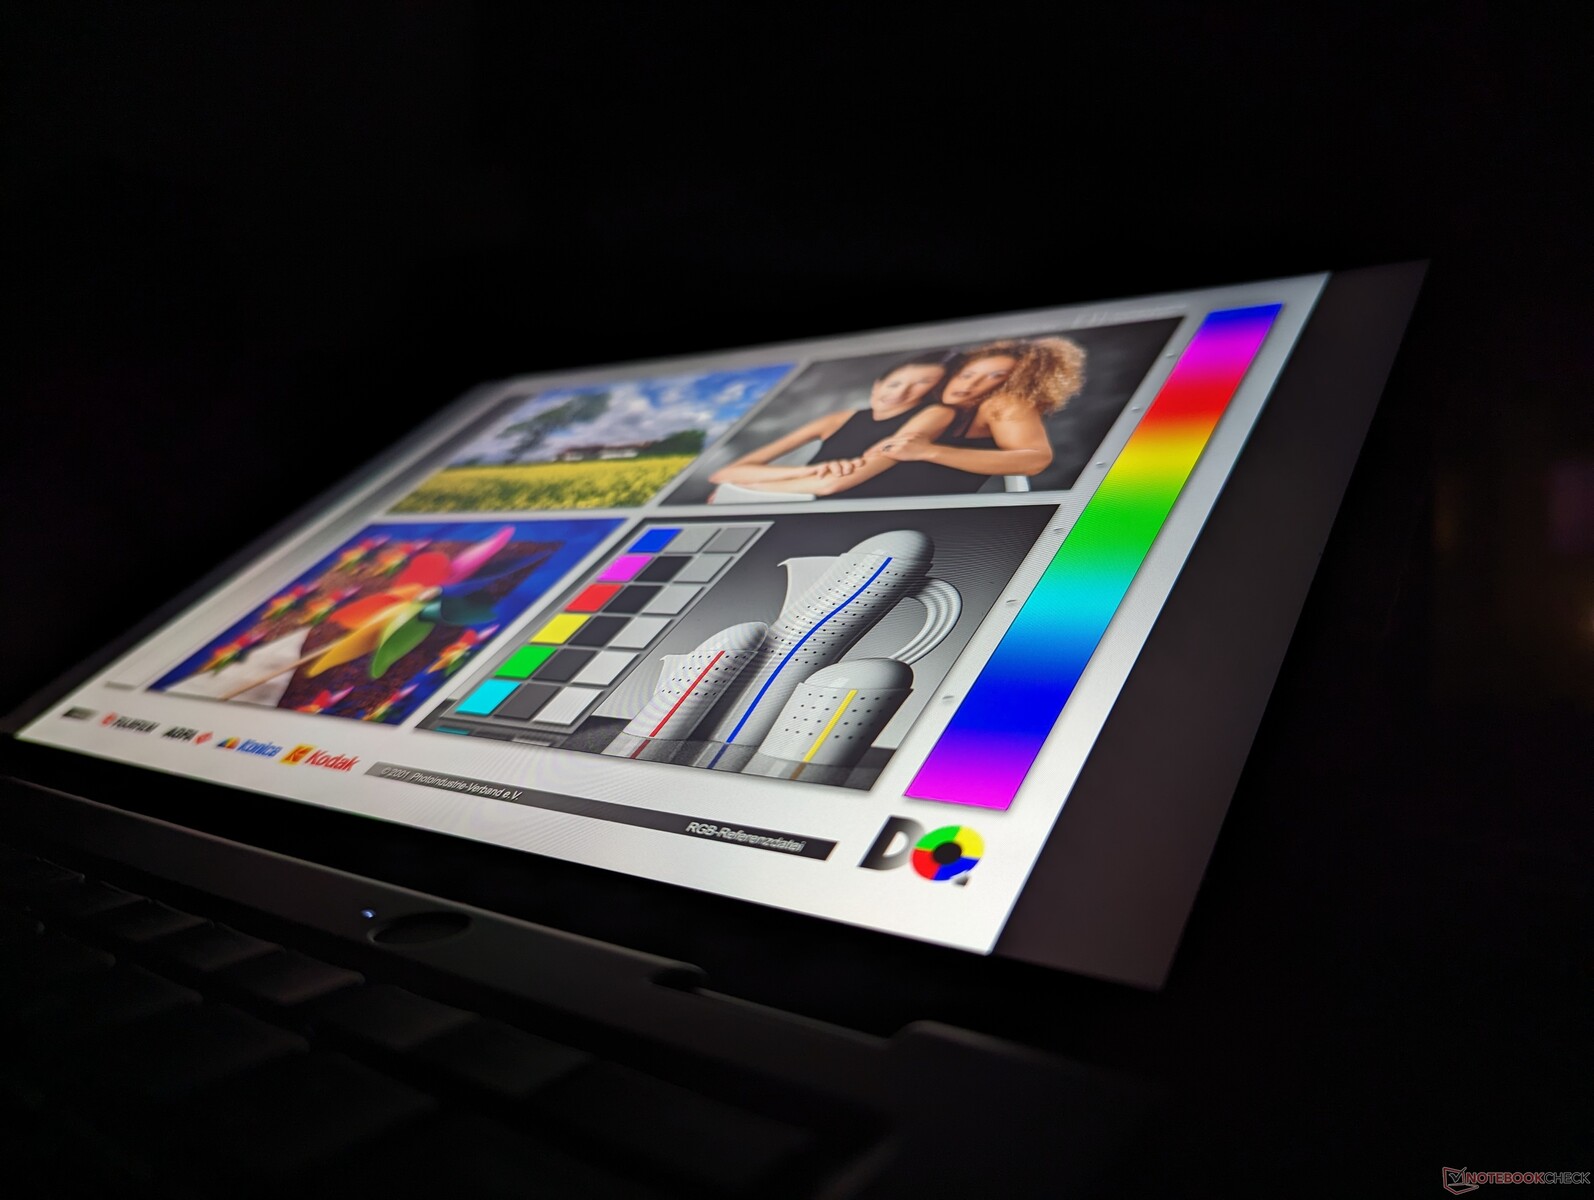
Affichage
Notre appareil Intel est équipé d'une dalle IPS 1200p différente de celle de notre appareil AMD (NV133WUM-N61 vs. B133UAN01.2). Ce panneau particulier semble être légèrement plus faible d'environ 50 à 60 nits tout en offrant des temps de réponse noir-blanc et gris-gris plus rapides pour minimiser les images fantômes. Les couleurs et la qualité de l'image sont par ailleurs très similaires entre les deux modèles.
Il est regrettable que Lenovo n'offre pas d'options de taux de rafraîchissement de 90 Hz ou 120 Hz, compte tenu du prix élevé de plus de 1500 $.

| |||||||||||||||||||||||||
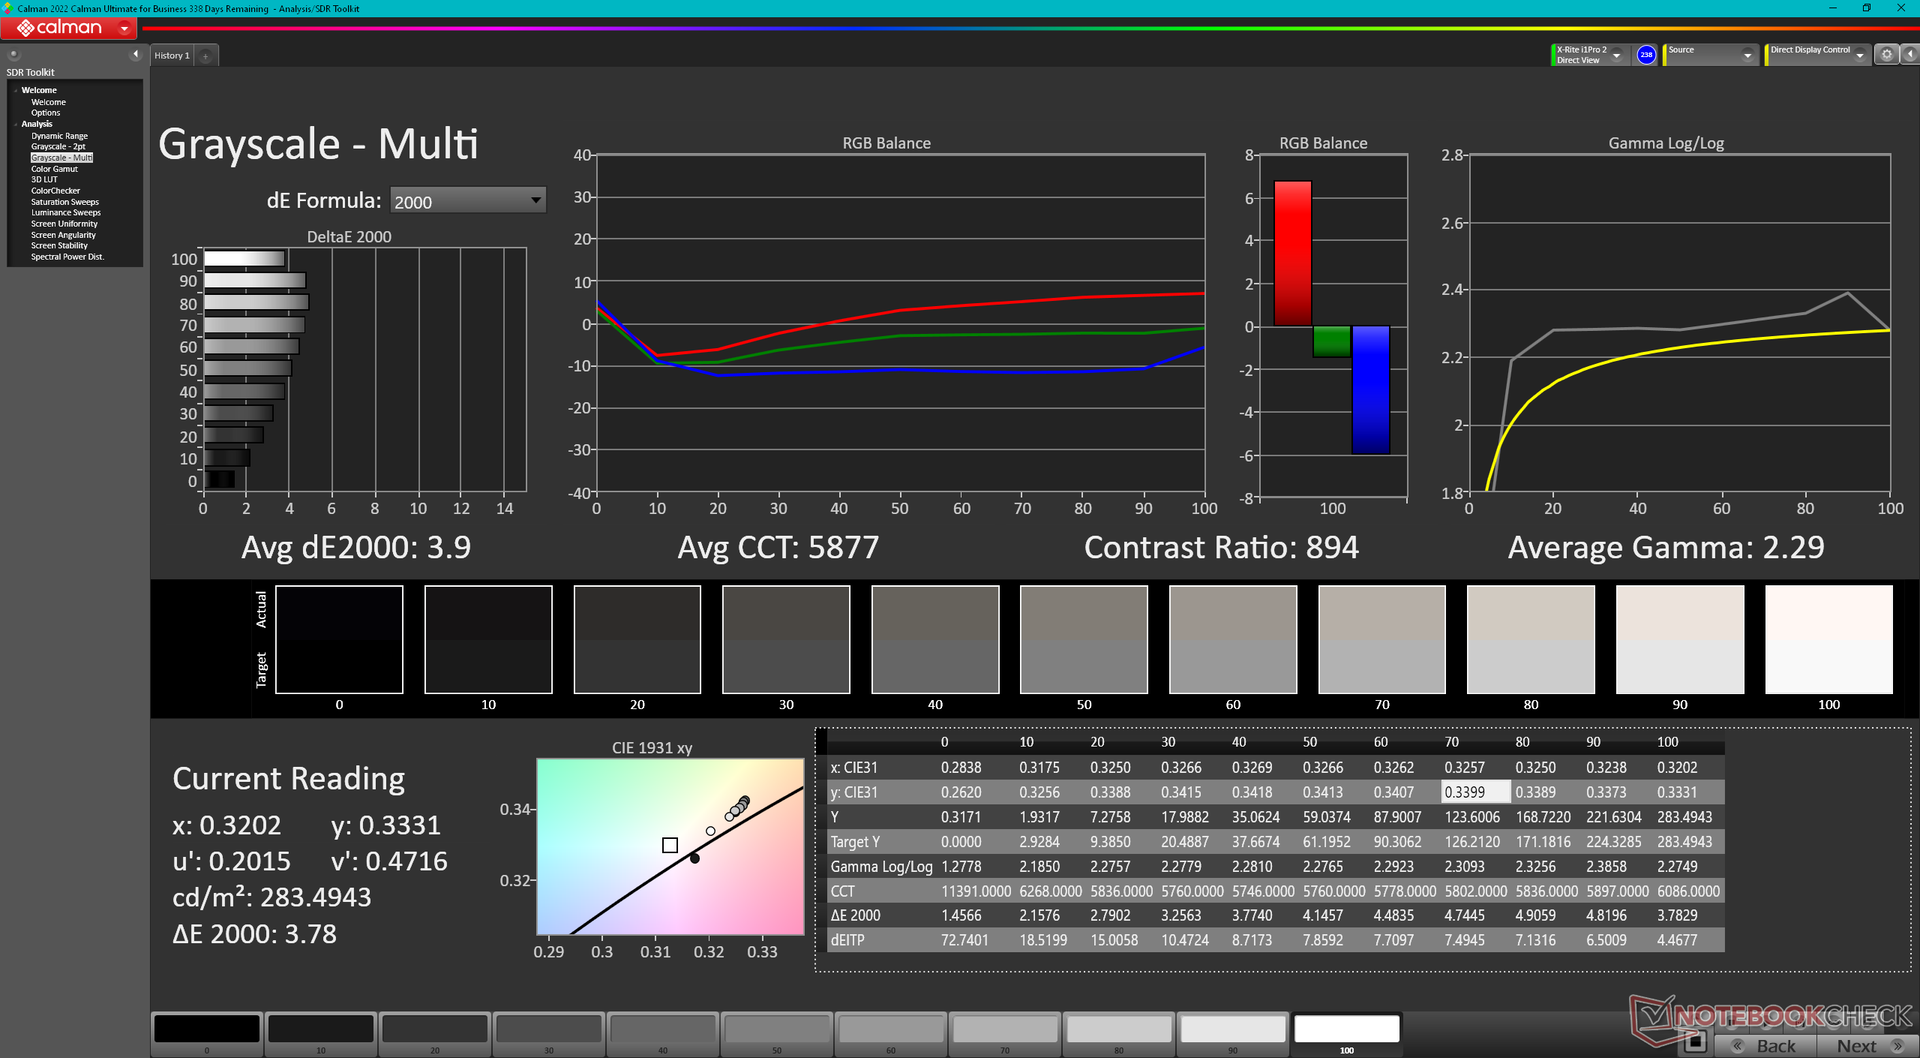
Homogénéité de la luminosité: 92 %
Valeur mesurée au centre, sur batterie: 278.1 cd/m²
Contraste: 818:1 (Valeurs des noirs: 0.34 cd/m²)
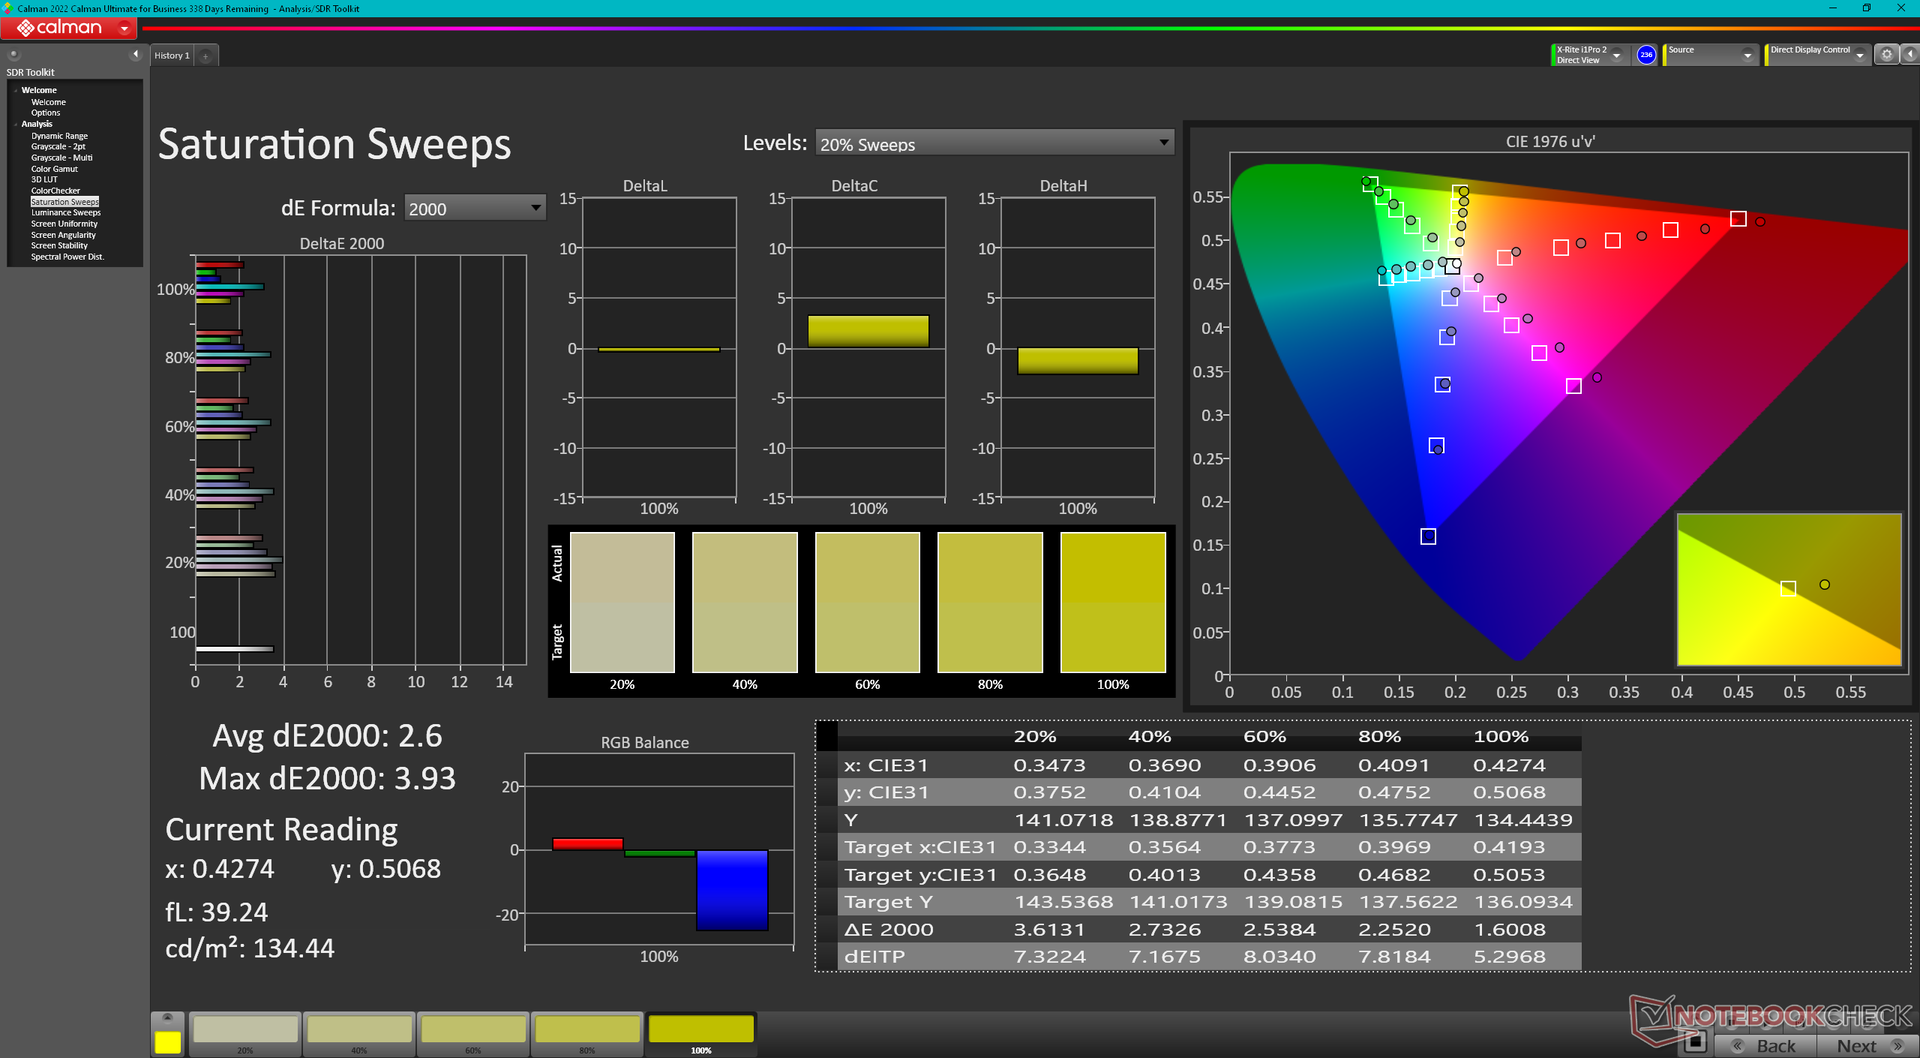
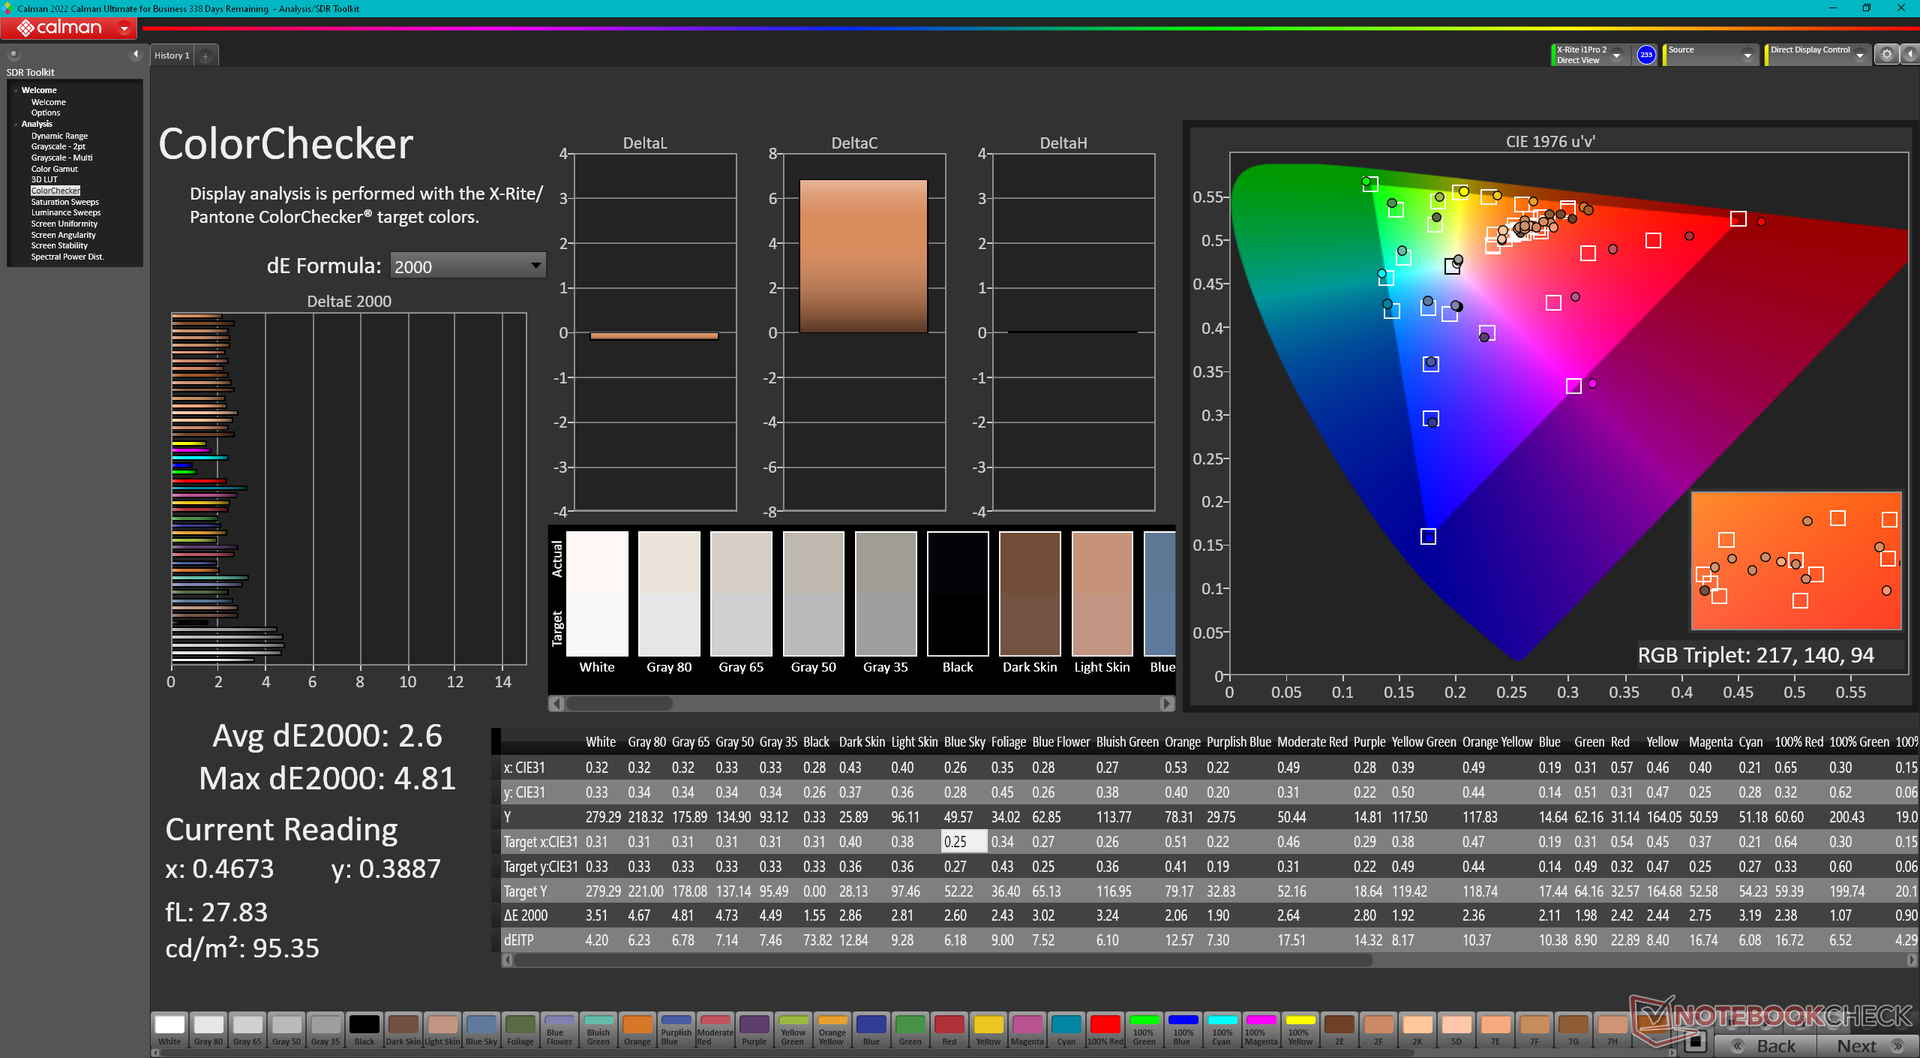
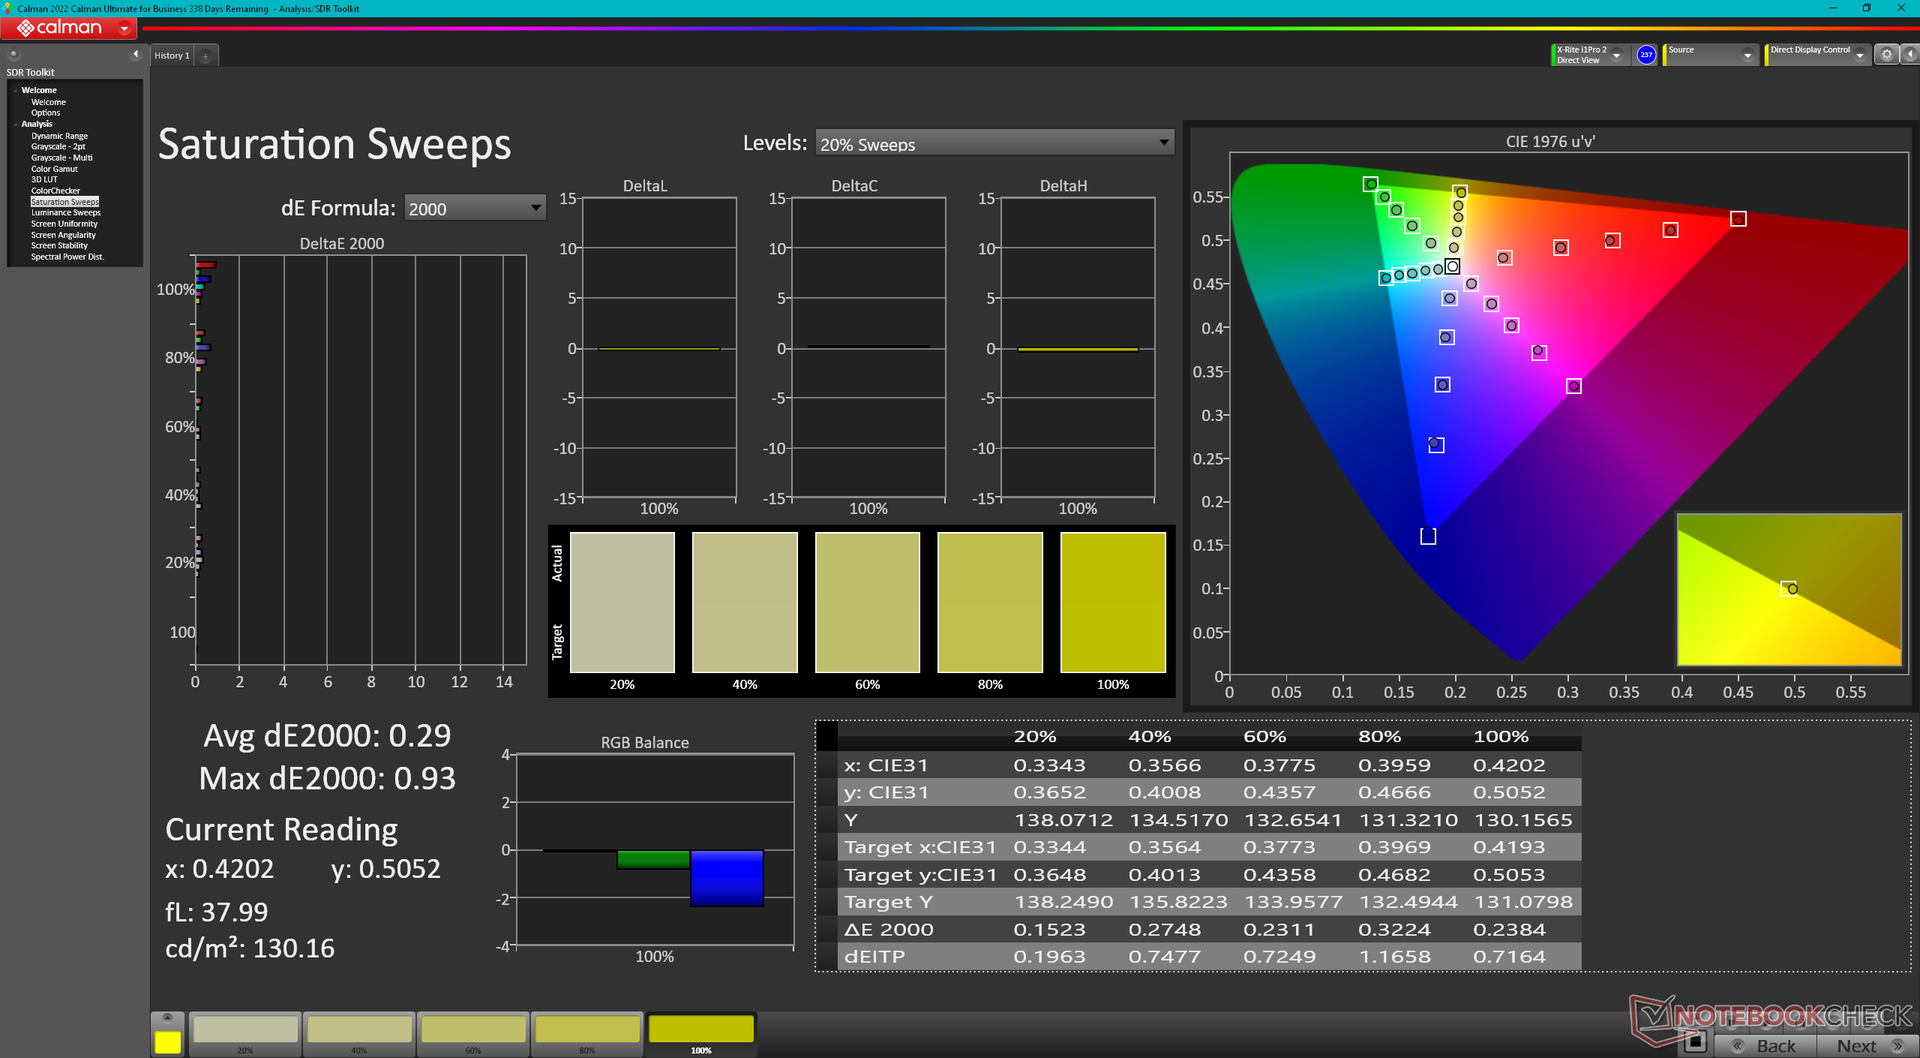
ΔE ColorChecker Calman: 2.6 | ∀{0.5-29.43 Ø4.72}
calibrated: 0.51
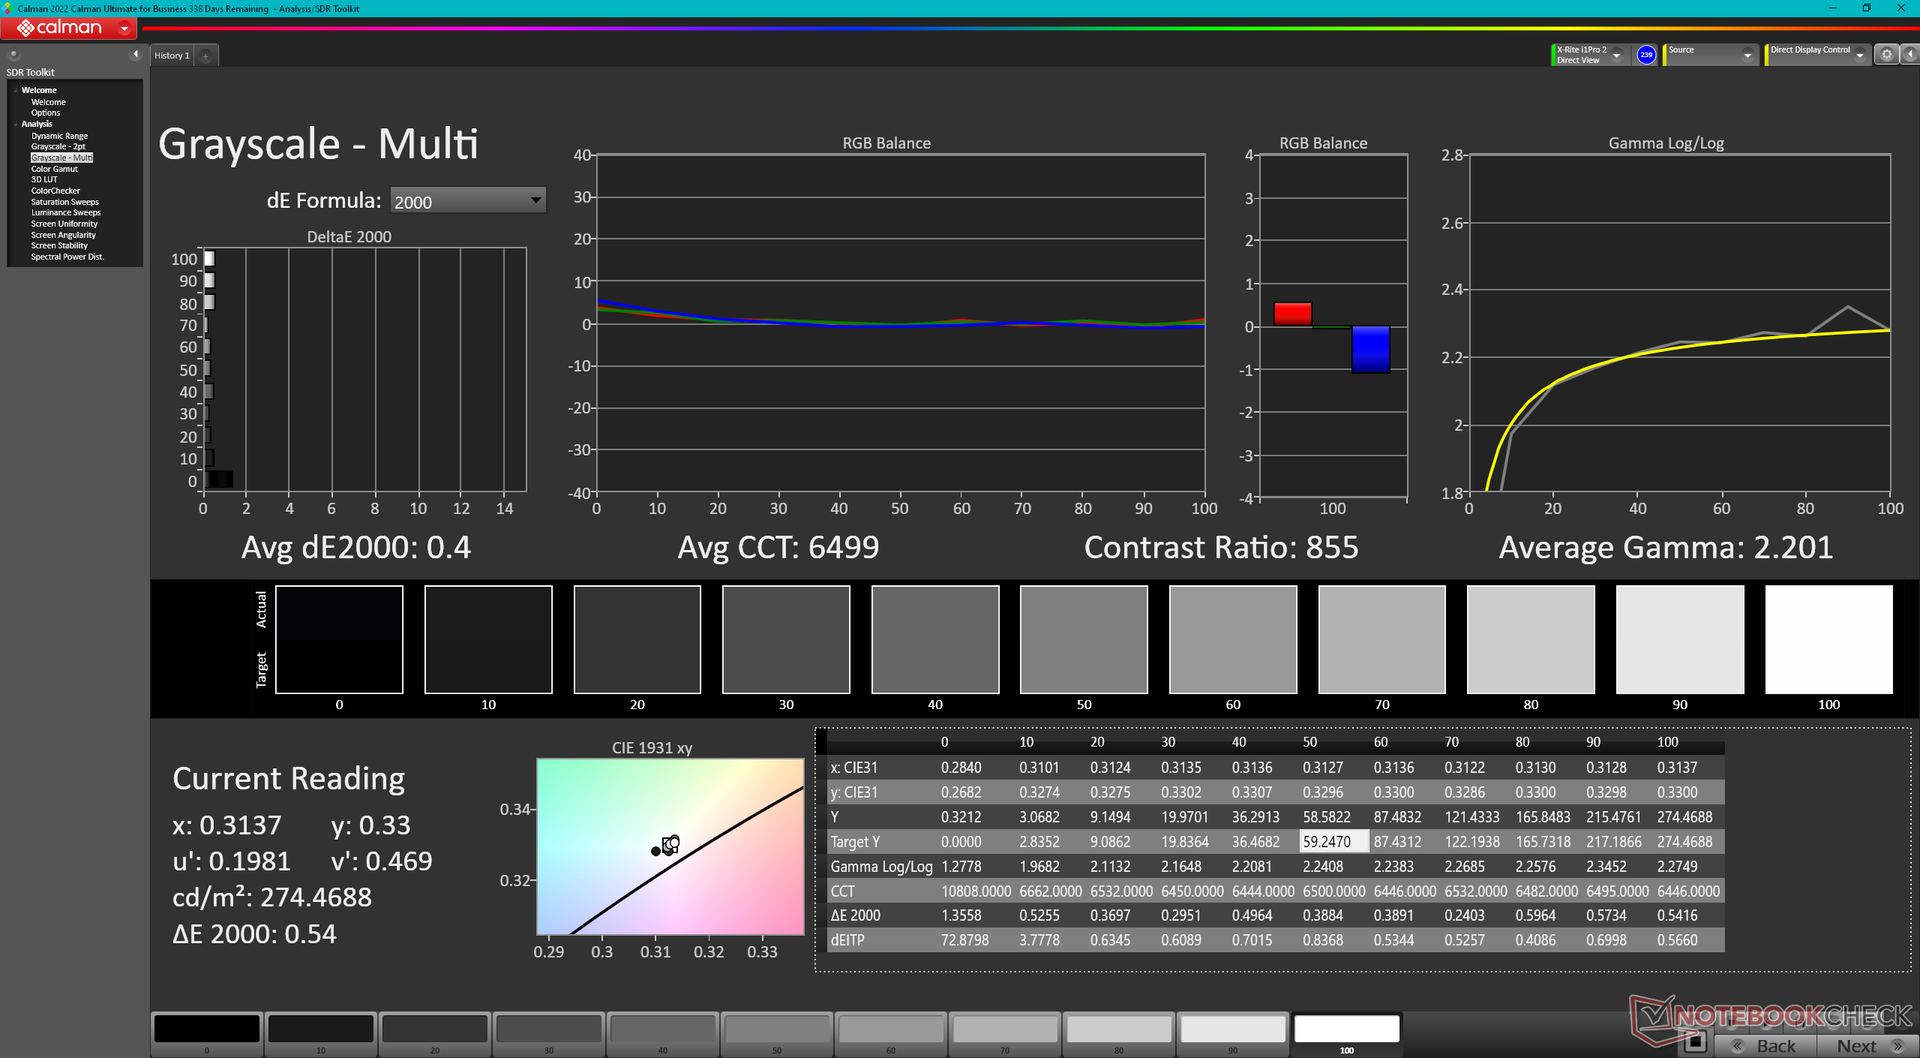
ΔE Greyscale Calman: 3.9 | ∀{0.09-98 Ø4.97}
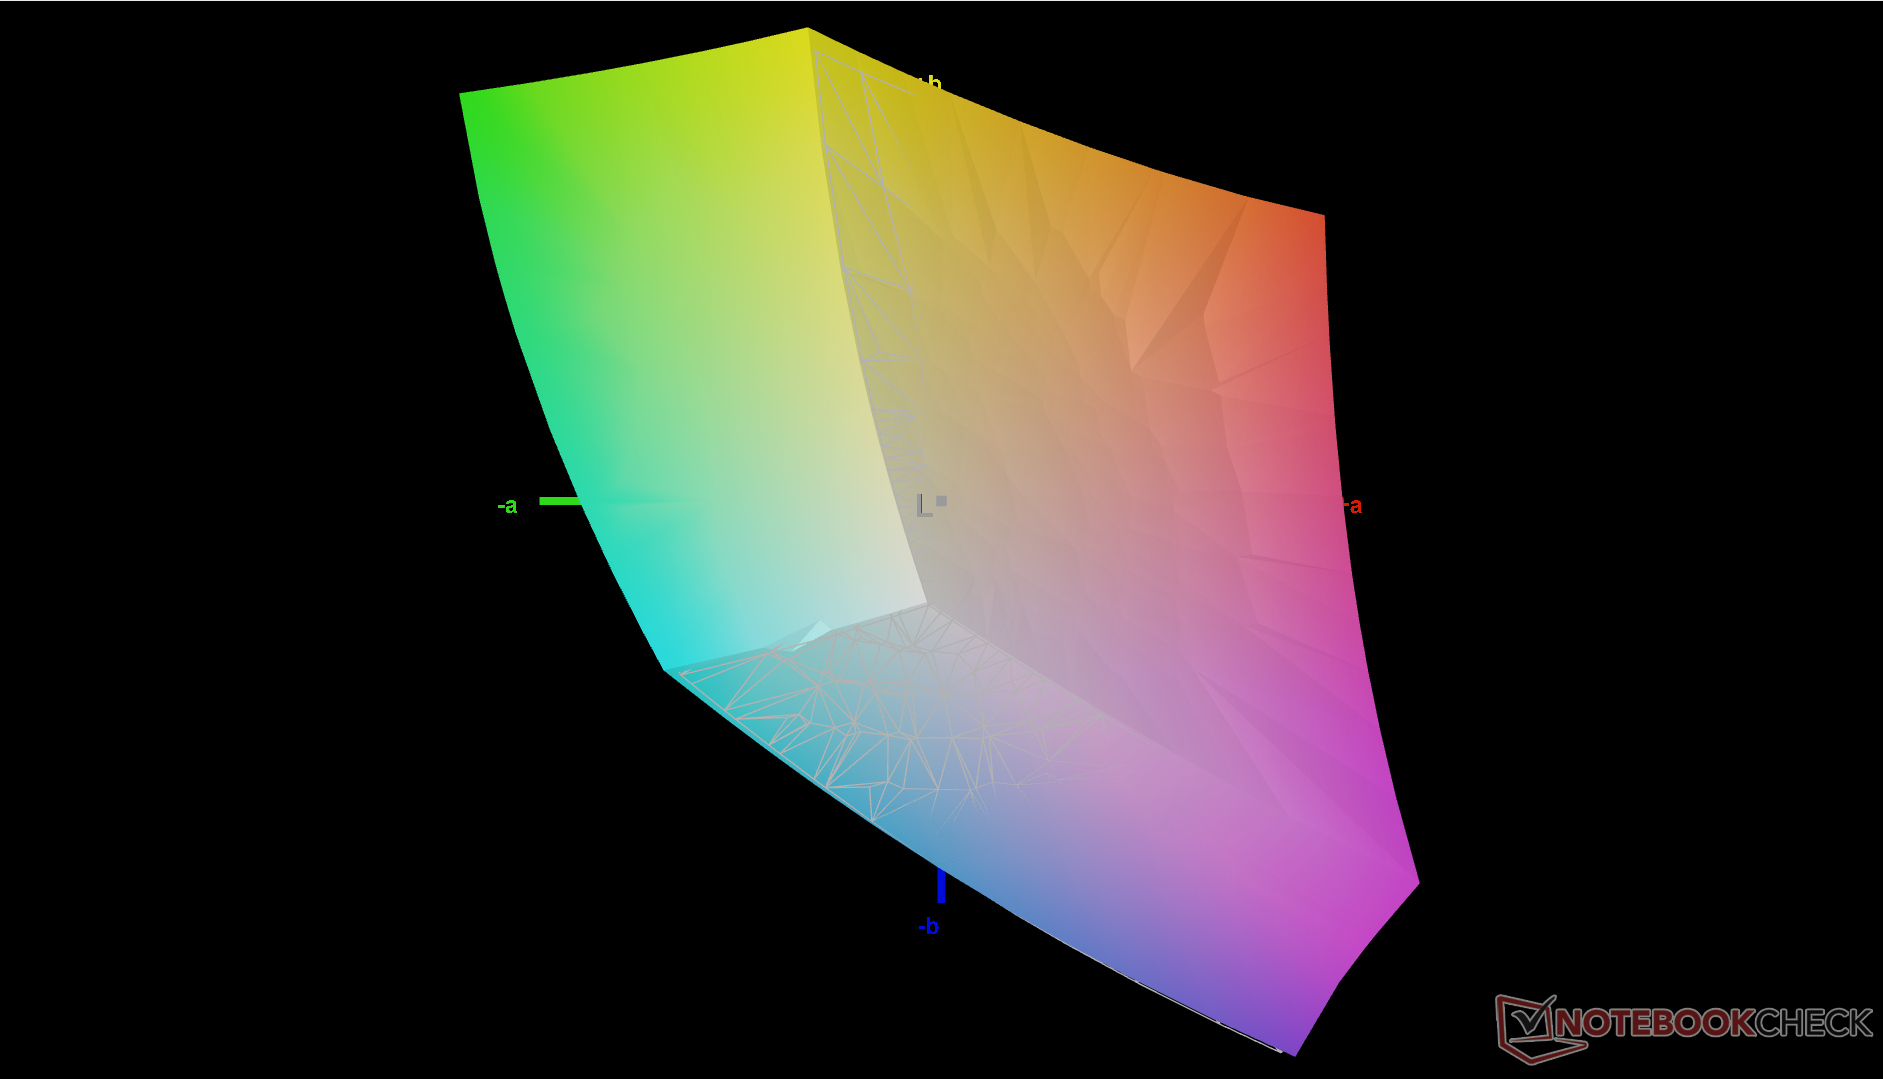
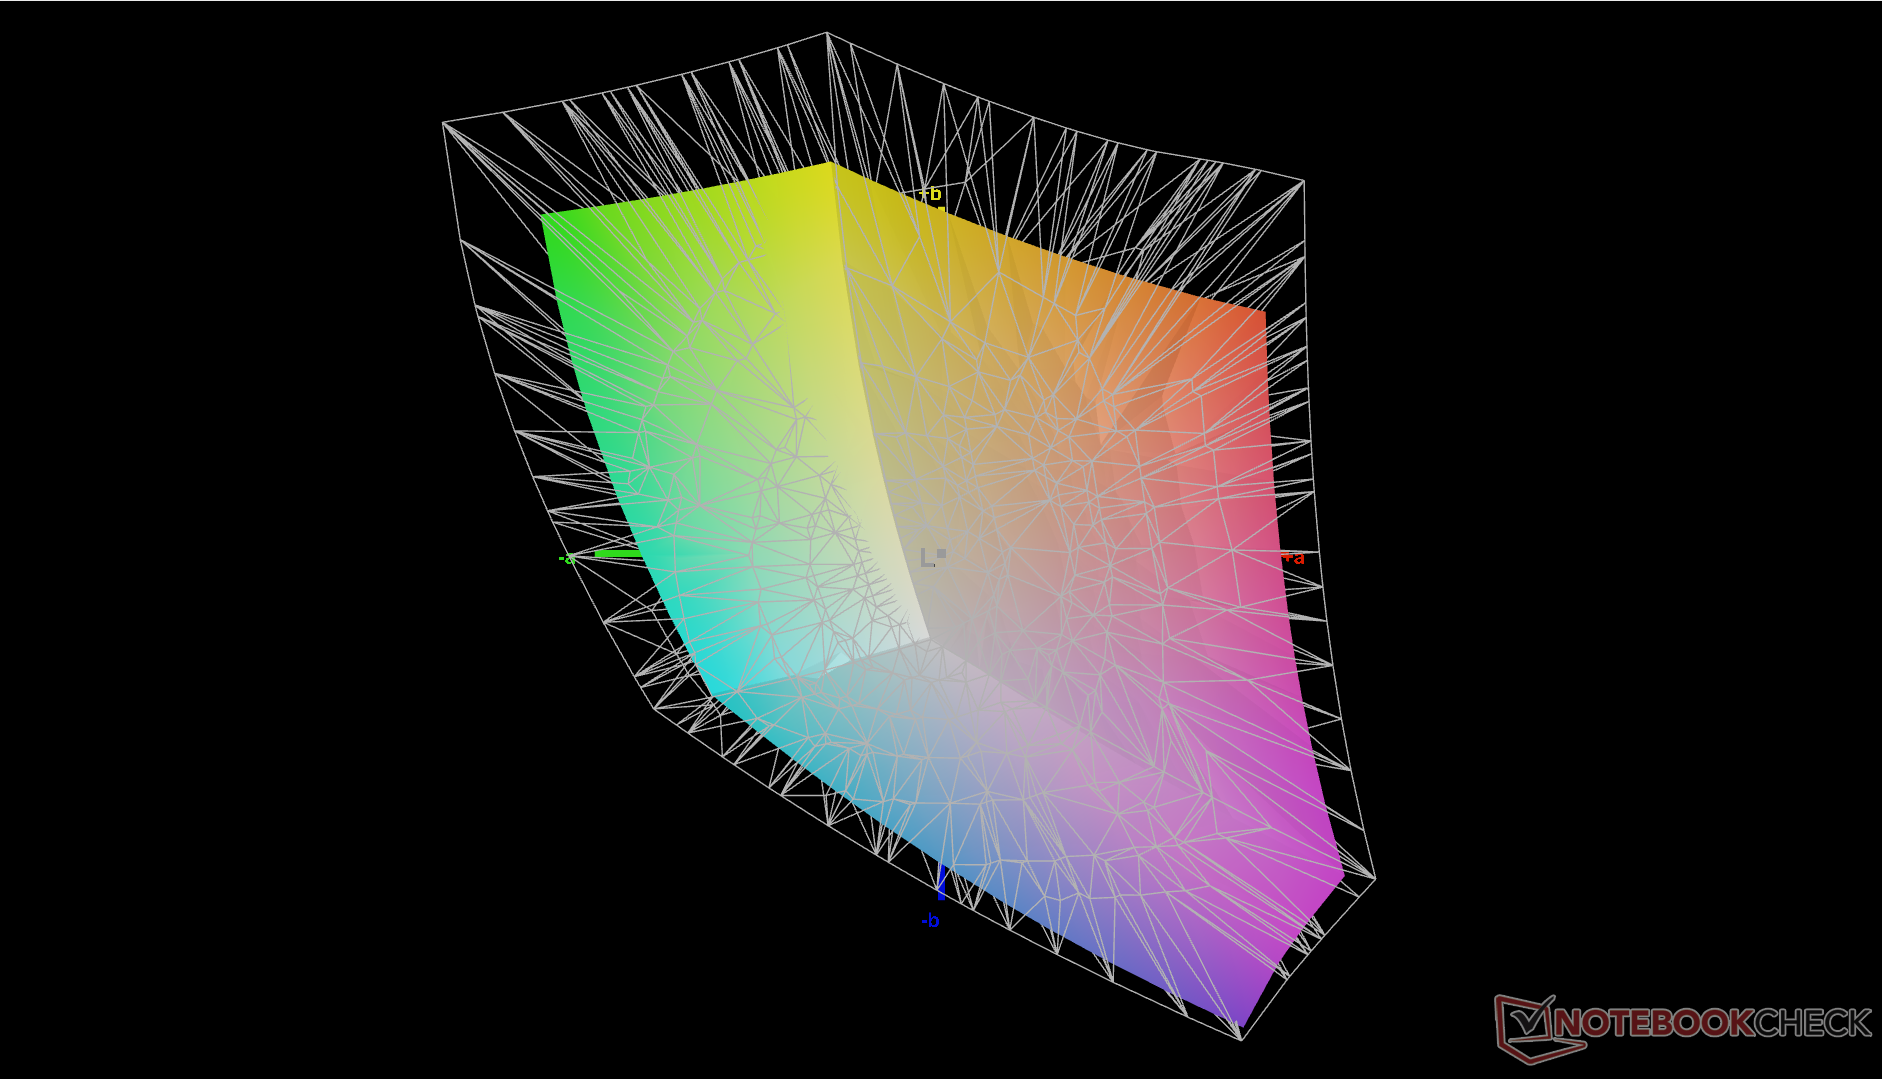
71.9% AdobeRGB 1998 (Argyll 3D)
99.8% sRGB (Argyll 3D)
71.6% Display P3 (Argyll 3D)
Gamma: 2.29
CCT: 5877 K
| Lenovo ThinkPad L13 Yoga G4 i7-1355U NV133WUM-N61, IPS, 1920x1200, 13.3" | Lenovo ThinkPad L13 Yoga G4 21FSS00100 B133UAN01.2 , IPS LED, 1920x1200, 13.3" | HP Elite Dragonfly Folio 13.5 G3 Chi Mei CMN13C0, IPS, 1920x1280, 13.5" | Dell Latitude 9330 AU Optronics B133QAA, IPS, 2560x1600, 13.3" | MSI Summit E13 Flip Evo A11MT Sharp LQ134N1JW53, IPS, 1920x1200, 13.4" | Framework Laptop 13.5 Ryzen 7 7840U BOE CQ NE135FBM-N41, IPS, 2256x1504, 13.5" | |
|---|---|---|---|---|---|---|
| Display | 2% | -3% | 6% | -2% | -2% | |
| Display P3 Coverage (%) | 71.6 | 74.1 3% | 68.3 -5% | 77.8 9% | 69.8 -3% | 69 -4% |
| sRGB Coverage (%) | 99.8 | 99.3 -1% | 98.6 -1% | 99.9 0% | 98.8 -1% | 99.1 -1% |
| AdobeRGB 1998 Coverage (%) | 71.9 | 74.5 4% | 70.2 -2% | 77.5 8% | 70.6 -2% | 71.1 -1% |
| Response Times | -58% | -147% | -165% | -140% | -81% | |
| Response Time Grey 50% / Grey 80% * (ms) | 27.3 ? | 43.3 ? -59% | 66.8 ? -145% | 67.6 ? -148% | 64 ? -134% | 50.4 ? -85% |
| Response Time Black / White * (ms) | 17.9 ? | 28 ? -56% | 44.4 ? -148% | 50.4 ? -182% | 44 ? -146% | 31.5 ? -76% |
| PWM Frequency (Hz) | ||||||
| Screen | -8% | 22% | 19% | 19% | 24% | |
| Brightness middle (cd/m²) | 278.1 | 336 21% | 369.5 33% | 542.3 95% | 551.3 98% | 436 57% |
| Brightness (cd/m²) | 280 | 321 15% | 350 25% | 516 84% | 517 85% | 416 49% |
| Brightness Distribution (%) | 92 | 88 -4% | 87 -5% | 85 -8% | 91 -1% | 89 -3% |
| Black Level * (cd/m²) | 0.34 | 0.22 35% | 0.24 29% | 0.38 -12% | 0.37 -9% | 0.36 -6% |
| Contrast (:1) | 818 | 1527 87% | 1540 88% | 1427 74% | 1490 82% | 1211 48% |
| Colorchecker dE 2000 * | 2.6 | 2.8 -8% | 2.3 12% | 3.18 -22% | 1.45 44% | 1.81 30% |
| Colorchecker dE 2000 max. * | 4.81 | 6.9 -43% | 4.34 10% | 6.05 -26% | 2.86 41% | 4.73 2% |
| Colorchecker dE 2000 calibrated * | 0.51 | 1.4 -175% | 0.6 -18% | 0.67 -31% | 1.7 -233% | 0.45 12% |
| Greyscale dE 2000 * | 3.9 | 3.8 3% | 3.1 21% | 3.1 21% | 1.3 67% | 2.9 26% |
| Gamma | 2.29 96% | 2.15 102% | 2.1 105% | 2.08 106% | 2.14 103% | 2.27 97% |
| CCT | 5877 111% | 6664 98% | 6248 104% | 6140 106% | 6580 99% | 6784 96% |
| Color Space (Percent of AdobeRGB 1998) (%) | 65 | |||||
| Color Space (Percent of sRGB) (%) | 99 | |||||
| Moyenne finale (programmes/paramètres) | -21% /
-13% | -43% /
-8% | -47% /
-10% | -41% /
-8% | -20% /
3% |
* ... Moindre est la valeur, meilleures sont les performances
En calibrant nous-mêmes le panneau à l'aide d'un colorimètre X-Rite, les valeurs moyennes de DeltaE en niveaux de gris et en couleurs passeraient de 3,9 et 2,6 à seulement 0,4 et 0,51, respectivement. Notre profil ICM calibré est disponible ci-dessus et peut être téléchargé gratuitement.
Temps de réponse de l'écran
| ↔ Temps de réponse noir à blanc | ||
|---|---|---|
| 17.9 ms ... hausse ↗ et chute ↘ combinées | ↗ 9 ms hausse | 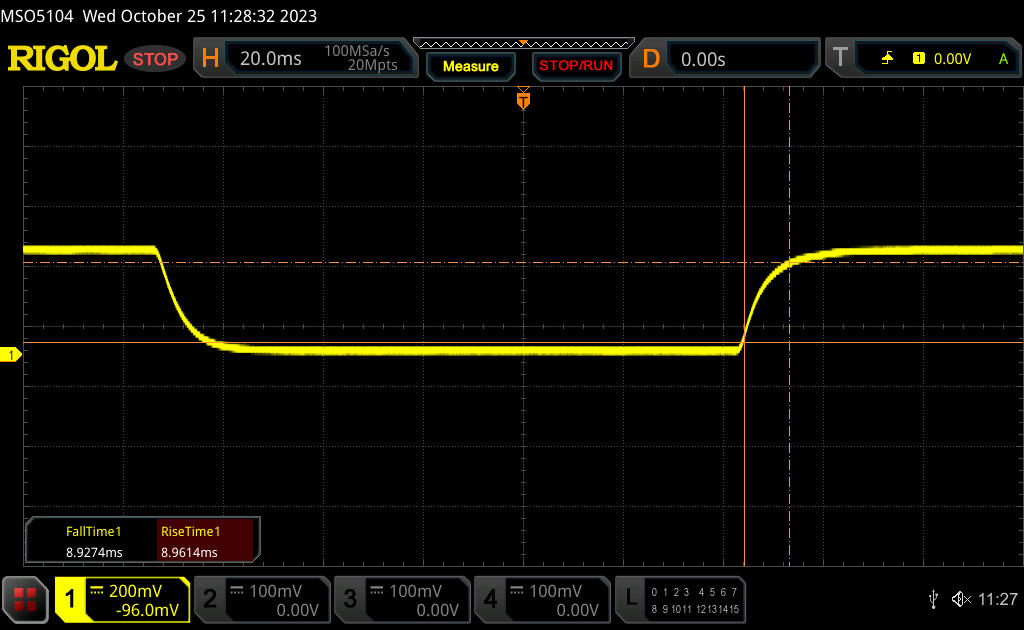 |
| ↘ 8.9 ms chute | ||
| L'écran montre de bons temps de réponse, mais insuffisant pour du jeu compétitif. En comparaison, tous les appareils testés affichent entre 0.1 (minimum) et 240 (maximum) ms. » 40 % des appareils testés affichent de meilleures performances. Cela signifie que les latences relevées sont meilleures que la moyenne (19.9 ms) de tous les appareils testés. | ||
| ↔ Temps de réponse gris 50% à gris 80% | ||
| 27.3 ms ... hausse ↗ et chute ↘ combinées | ↗ 12.7 ms hausse | 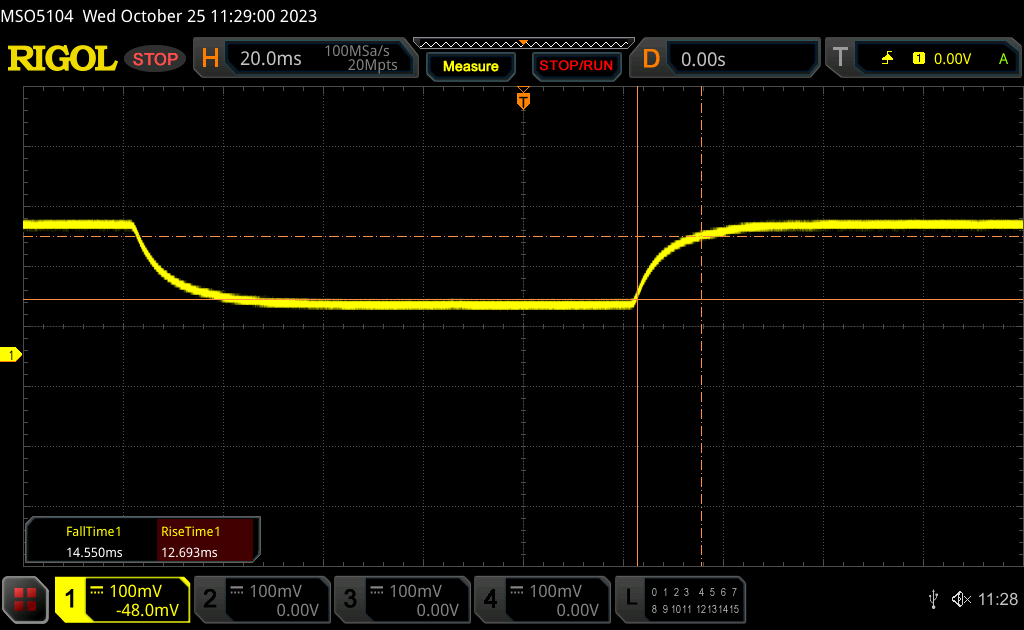 |
| ↘ 14.6 ms chute | ||
| L'écran souffre de latences relativement élevées, insuffisant pour le jeu. En comparaison, tous les appareils testés affichent entre 0.165 (minimum) et 636 (maximum) ms. » 37 % des appareils testés affichent de meilleures performances. Cela signifie que les latences relevées sont meilleures que la moyenne (31.1 ms) de tous les appareils testés. | ||
Scintillement / MLI (Modulation de largeur d'impulsion)
| Scintillement / MLI (Modulation de largeur d'impulsion) non décelé | 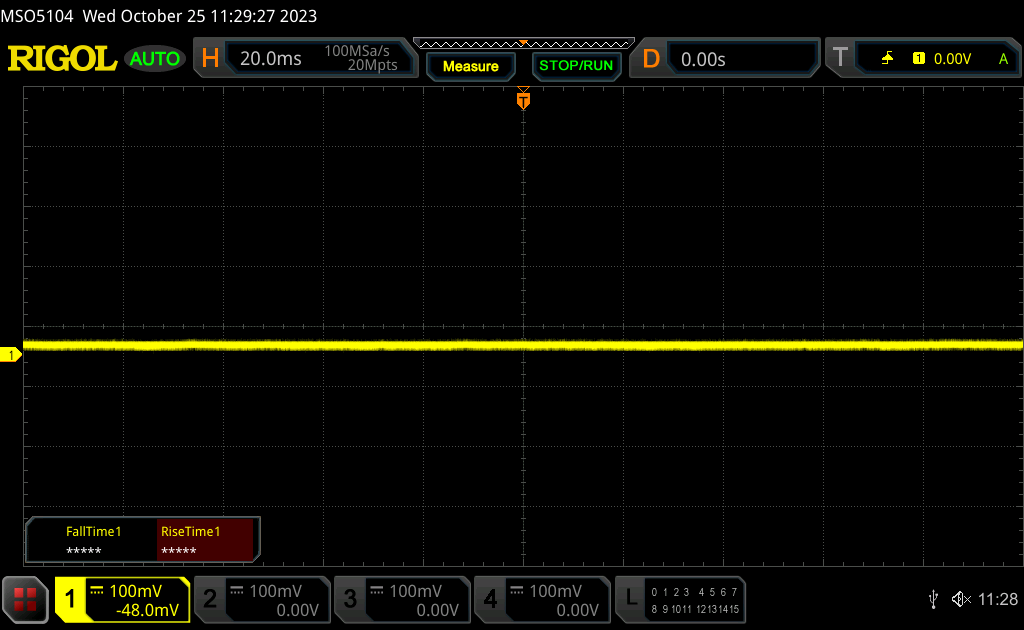 | ||
En comparaison, 52 % des appareils testés n'emploient pas MDI pour assombrir leur écran. Nous avons relevé une moyenne à 7784 (minimum : 5 - maximum : 343500) Hz dans le cas où une MDI était active. | |||
Performance
Conditions d'essai
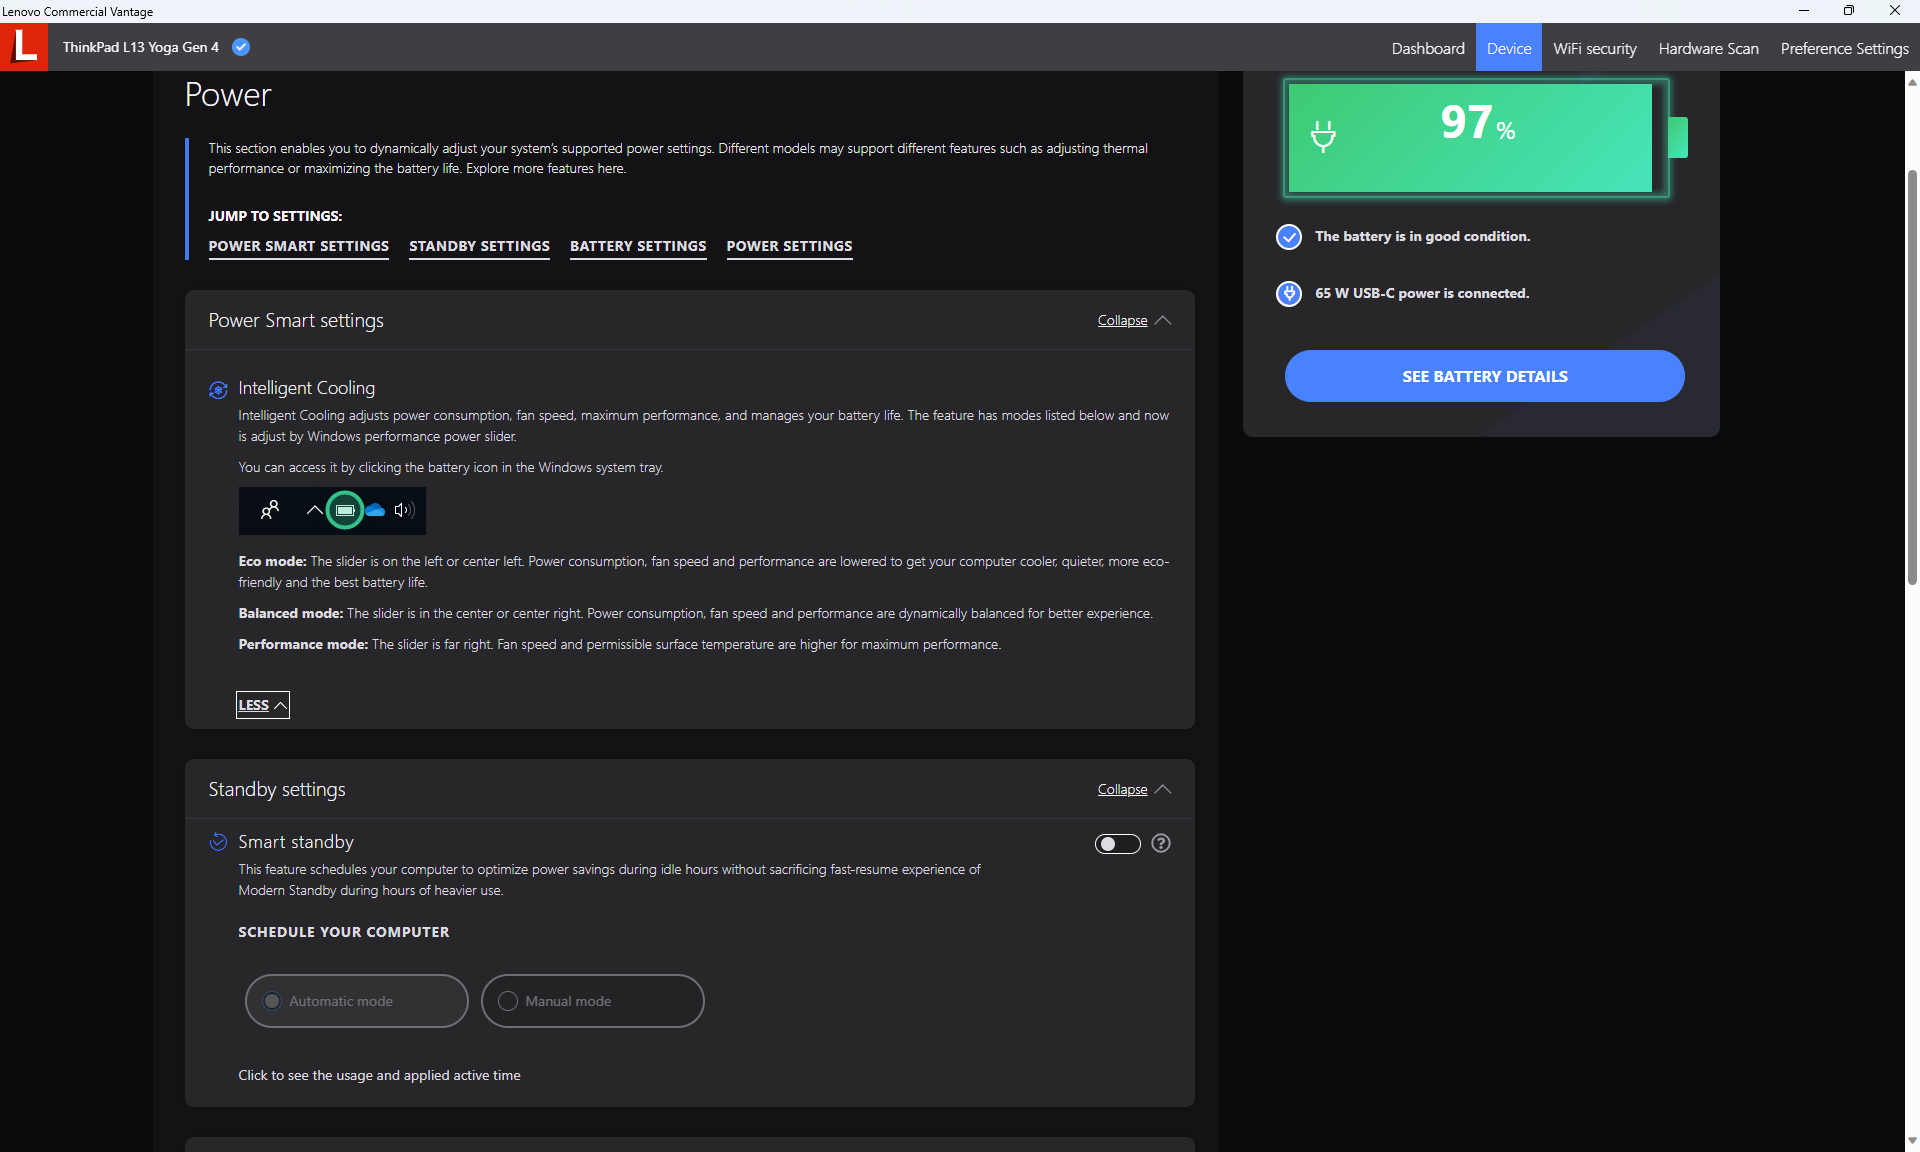
Nous avons réglé Windows sur le mode Performance avant d'effectuer les tests de référence ci-dessous. Il n'y a pas d'autres profils d'alimentation que les profils standard de Windows (Economiseur d'énergie, Équilibré et Performance).
Processeur
Les performances du processeur sont légèrement inférieures à celles de la plupart des autres ordinateurs portables dotés du même processeur Core i7-1355U en raison de l'étranglement. Lorsque vous exécutez CineBench R15 xT en boucle, par exemple, le score initial de 1274 points diminue de 35 % au fil du temps, comme le montre le graphique ci-dessous. Les performances multithread ne sont donc que légèrement supérieures à celles de la machine concurrente, la Ryzen 5 7530U après avoir pris en compte l'étranglement plus important de la version Intel.
Le principal avantage d'Intel réside dans les performances monofilaires, où notre Core i7 a une avance de 20 à 25 % sur le Ryzen 5 7530U.
Cinebench R15 Multi Loop
Cinebench R23: Multi Core | Single Core
Cinebench R20: CPU (Multi Core) | CPU (Single Core)
Cinebench R15: CPU Multi 64Bit | CPU Single 64Bit
Blender: v2.79 BMW27 CPU
7-Zip 18.03: 7z b 4 | 7z b 4 -mmt1
Geekbench 5.5: Multi-Core | Single-Core
HWBOT x265 Benchmark v2.2: 4k Preset
LibreOffice : 20 Documents To PDF
R Benchmark 2.5: Overall mean
| CPU Performance rating | |
| Framework Laptop 13.5 Ryzen 7 7840U | |
| Dell XPS 13 Plus 9320 Core i7-1360P | |
| Moyenne Intel Core i7-1355U | |
| Lenovo ThinkPad L13 Yoga G4 i7-1355U | |
| HP Elite Dragonfly Folio 13.5 G3 | |
| Lenovo ThinkBook 13s G3 20YA0005GE | |
| Lenovo Yoga 6 13 83B2001SGE | |
| Dell Latitude 9330 | |
| Lenovo ThinkPad L13 Yoga G4 21FSS00100 | |
| Lenovo Yoga 6 13ALC6 -2! | |
| MSI Summit E13 Flip Evo A11MT | |
| Cinebench R23 / Multi Core | |
| Framework Laptop 13.5 Ryzen 7 7840U | |
| Dell XPS 13 Plus 9320 Core i7-1360P | |
| Moyenne Intel Core i7-1355U (6936 - 10252, n=18) | |
| Lenovo ThinkPad L13 Yoga G4 i7-1355U | |
| Lenovo ThinkBook 13s G3 20YA0005GE | |
| HP Elite Dragonfly Folio 13.5 G3 | |
| Lenovo Yoga 6 13ALC6 | |
| Dell Latitude 9330 | |
| Lenovo Yoga 6 13 83B2001SGE | |
| Lenovo ThinkPad L13 Yoga G4 21FSS00100 | |
| MSI Summit E13 Flip Evo A11MT | |
| Cinebench R23 / Single Core | |
| Dell XPS 13 Plus 9320 Core i7-1360P | |
| Moyenne Intel Core i7-1355U (1687 - 1889, n=18) | |
| Lenovo ThinkPad L13 Yoga G4 i7-1355U | |
| HP Elite Dragonfly Folio 13.5 G3 | |
| Framework Laptop 13.5 Ryzen 7 7840U | |
| Dell Latitude 9330 | |
| MSI Summit E13 Flip Evo A11MT | |
| Lenovo ThinkBook 13s G3 20YA0005GE | |
| Lenovo ThinkPad L13 Yoga G4 21FSS00100 | |
| Lenovo Yoga 6 13 83B2001SGE | |
| Lenovo Yoga 6 13ALC6 | |
| Cinebench R20 / CPU (Multi Core) | |
| Framework Laptop 13.5 Ryzen 7 7840U | |
| Dell XPS 13 Plus 9320 Core i7-1360P | |
| Moyenne Intel Core i7-1355U (2849 - 3907, n=18) | |
| Lenovo ThinkPad L13 Yoga G4 i7-1355U | |
| Lenovo ThinkBook 13s G3 20YA0005GE | |
| HP Elite Dragonfly Folio 13.5 G3 | |
| Lenovo Yoga 6 13ALC6 | |
| Lenovo Yoga 6 13 83B2001SGE | |
| Dell Latitude 9330 | |
| Lenovo ThinkPad L13 Yoga G4 21FSS00100 | |
| MSI Summit E13 Flip Evo A11MT | |
| Cinebench R20 / CPU (Single Core) | |
| Dell XPS 13 Plus 9320 Core i7-1360P | |
| Moyenne Intel Core i7-1355U (654 - 725, n=18) | |
| Lenovo ThinkPad L13 Yoga G4 i7-1355U | |
| HP Elite Dragonfly Folio 13.5 G3 | |
| Framework Laptop 13.5 Ryzen 7 7840U | |
| Dell Latitude 9330 | |
| Lenovo ThinkBook 13s G3 20YA0005GE | |
| MSI Summit E13 Flip Evo A11MT | |
| Lenovo Yoga 6 13 83B2001SGE | |
| Lenovo ThinkPad L13 Yoga G4 21FSS00100 | |
| Lenovo Yoga 6 13ALC6 | |
| Cinebench R15 / CPU Multi 64Bit | |
| Framework Laptop 13.5 Ryzen 7 7840U | |
| Dell XPS 13 Plus 9320 Core i7-1360P | |
| Lenovo ThinkBook 13s G3 20YA0005GE | |
| Lenovo ThinkBook 13s G3 20YA0005GE | |
| Lenovo Yoga 6 13 83B2001SGE | |
| Moyenne Intel Core i7-1355U (1206 - 1735, n=18) | |
| HP Elite Dragonfly Folio 13.5 G3 | |
| Lenovo ThinkPad L13 Yoga G4 21FSS00100 | |
| Lenovo ThinkPad L13 Yoga G4 i7-1355U | |
| Lenovo Yoga 6 13ALC6 | |
| Dell Latitude 9330 | |
| MSI Summit E13 Flip Evo A11MT | |
| Cinebench R15 / CPU Single 64Bit | |
| Dell XPS 13 Plus 9320 Core i7-1360P | |
| Moyenne Intel Core i7-1355U (237 - 267, n=18) | |
| Framework Laptop 13.5 Ryzen 7 7840U | |
| HP Elite Dragonfly Folio 13.5 G3 | |
| Lenovo ThinkPad L13 Yoga G4 i7-1355U | |
| Lenovo ThinkBook 13s G3 20YA0005GE | |
| Dell Latitude 9330 | |
| Lenovo Yoga 6 13 83B2001SGE | |
| MSI Summit E13 Flip Evo A11MT | |
| Lenovo ThinkPad L13 Yoga G4 21FSS00100 | |
| Lenovo Yoga 6 13ALC6 | |
| Blender / v2.79 BMW27 CPU | |
| MSI Summit E13 Flip Evo A11MT | |
| Lenovo ThinkPad L13 Yoga G4 i7-1355U | |
| Lenovo ThinkPad L13 Yoga G4 21FSS00100 | |
| Dell Latitude 9330 | |
| HP Elite Dragonfly Folio 13.5 G3 | |
| Moyenne Intel Core i7-1355U (328 - 503, n=18) | |
| Lenovo ThinkBook 13s G3 20YA0005GE | |
| Lenovo Yoga 6 13ALC6 | |
| Lenovo Yoga 6 13 83B2001SGE | |
| Dell XPS 13 Plus 9320 Core i7-1360P | |
| Framework Laptop 13.5 Ryzen 7 7840U | |
| 7-Zip 18.03 / 7z b 4 | |
| Framework Laptop 13.5 Ryzen 7 7840U | |
| Dell XPS 13 Plus 9320 Core i7-1360P | |
| Lenovo Yoga 6 13 83B2001SGE | |
| Lenovo ThinkBook 13s G3 20YA0005GE | |
| Lenovo Yoga 6 13ALC6 | |
| Moyenne Intel Core i7-1355U (30255 - 42092, n=18) | |
| HP Elite Dragonfly Folio 13.5 G3 | |
| Lenovo ThinkPad L13 Yoga G4 i7-1355U | |
| Lenovo ThinkPad L13 Yoga G4 21FSS00100 | |
| Dell Latitude 9330 | |
| MSI Summit E13 Flip Evo A11MT | |
| 7-Zip 18.03 / 7z b 4 -mmt1 | |
| Framework Laptop 13.5 Ryzen 7 7840U | |
| Moyenne Intel Core i7-1355U (5301 - 5911, n=18) | |
| Dell XPS 13 Plus 9320 Core i7-1360P | |
| Lenovo ThinkPad L13 Yoga G4 i7-1355U | |
| Lenovo ThinkBook 13s G3 20YA0005GE | |
| Lenovo Yoga 6 13 83B2001SGE | |
| HP Elite Dragonfly Folio 13.5 G3 | |
| MSI Summit E13 Flip Evo A11MT | |
| Lenovo ThinkPad L13 Yoga G4 21FSS00100 | |
| Dell Latitude 9330 | |
| Lenovo Yoga 6 13ALC6 | |
| Geekbench 5.5 / Multi-Core | |
| Dell XPS 13 Plus 9320 Core i7-1360P | |
| Framework Laptop 13.5 Ryzen 7 7840U | |
| HP Elite Dragonfly Folio 13.5 G3 | |
| Moyenne Intel Core i7-1355U (7507 - 9328, n=18) | |
| Lenovo ThinkPad L13 Yoga G4 i7-1355U | |
| Lenovo Yoga 6 13 83B2001SGE | |
| Dell Latitude 9330 | |
| Lenovo ThinkBook 13s G3 20YA0005GE | |
| Lenovo ThinkPad L13 Yoga G4 21FSS00100 | |
| MSI Summit E13 Flip Evo A11MT | |
| Geekbench 5.5 / Single-Core | |
| Framework Laptop 13.5 Ryzen 7 7840U | |
| Lenovo ThinkPad L13 Yoga G4 i7-1355U | |
| Dell XPS 13 Plus 9320 Core i7-1360P | |
| Moyenne Intel Core i7-1355U (1678 - 1872, n=18) | |
| HP Elite Dragonfly Folio 13.5 G3 | |
| Dell Latitude 9330 | |
| MSI Summit E13 Flip Evo A11MT | |
| Lenovo Yoga 6 13 83B2001SGE | |
| Lenovo ThinkBook 13s G3 20YA0005GE | |
| Lenovo ThinkPad L13 Yoga G4 21FSS00100 | |
| HWBOT x265 Benchmark v2.2 / 4k Preset | |
| Framework Laptop 13.5 Ryzen 7 7840U | |
| Dell XPS 13 Plus 9320 Core i7-1360P | |
| Lenovo Yoga 6 13 83B2001SGE | |
| Lenovo ThinkBook 13s G3 20YA0005GE | |
| Moyenne Intel Core i7-1355U (7.83 - 11.4, n=18) | |
| Lenovo ThinkPad L13 Yoga G4 i7-1355U | |
| Lenovo Yoga 6 13ALC6 | |
| HP Elite Dragonfly Folio 13.5 G3 | |
| Dell Latitude 9330 | |
| Lenovo ThinkPad L13 Yoga G4 21FSS00100 | |
| MSI Summit E13 Flip Evo A11MT | |
| LibreOffice / 20 Documents To PDF | |
| Lenovo Yoga 6 13ALC6 | |
| Lenovo ThinkPad L13 Yoga G4 21FSS00100 | |
| Moyenne Intel Core i7-1355U (41.1 - 108.6, n=18) | |
| Dell Latitude 9330 | |
| Lenovo ThinkBook 13s G3 20YA0005GE | |
| HP Elite Dragonfly Folio 13.5 G3 | |
| Lenovo Yoga 6 13 83B2001SGE | |
| Lenovo ThinkPad L13 Yoga G4 i7-1355U | |
| MSI Summit E13 Flip Evo A11MT | |
| Dell XPS 13 Plus 9320 Core i7-1360P | |
| Framework Laptop 13.5 Ryzen 7 7840U | |
| R Benchmark 2.5 / Overall mean | |
| MSI Summit E13 Flip Evo A11MT | |
| Lenovo Yoga 6 13ALC6 | |
| Lenovo ThinkPad L13 Yoga G4 21FSS00100 | |
| Lenovo ThinkBook 13s G3 20YA0005GE | |
| Lenovo Yoga 6 13 83B2001SGE | |
| Dell Latitude 9330 | |
| Moyenne Intel Core i7-1355U (0.4481 - 0.832, n=18) | |
| HP Elite Dragonfly Folio 13.5 G3 | |
| Lenovo ThinkPad L13 Yoga G4 i7-1355U | |
| Dell XPS 13 Plus 9320 Core i7-1360P | |
| Framework Laptop 13.5 Ryzen 7 7840U | |
* ... Moindre est la valeur, meilleures sont les performances
AIDA64: FP32 Ray-Trace | FPU Julia | CPU SHA3 | CPU Queen | FPU SinJulia | FPU Mandel | CPU AES | CPU ZLib | FP64 Ray-Trace | CPU PhotoWorxx
| AIDA64 / FP32 Ray-Trace | |
| Framework Laptop 13.5 Ryzen 7 7840U | |
| Lenovo ThinkPad L13 Yoga G4 21FSS00100 | |
| Moyenne Intel Core i7-1355U (5673 - 8424, n=18) | |
| MSI Summit E13 Flip Evo A11MT | |
| Dell Latitude 9330 | |
| HP Elite Dragonfly Folio 13.5 G3 | |
| Lenovo ThinkPad L13 Yoga G4 i7-1355U | |
| AIDA64 / FPU SinJulia | |
| Framework Laptop 13.5 Ryzen 7 7840U | |
| Lenovo ThinkPad L13 Yoga G4 21FSS00100 | |
| MSI Summit E13 Flip Evo A11MT | |
| Moyenne Intel Core i7-1355U (4045 - 5426, n=18) | |
| HP Elite Dragonfly Folio 13.5 G3 | |
| Lenovo ThinkPad L13 Yoga G4 i7-1355U | |
| Dell Latitude 9330 | |
| AIDA64 / FP64 Ray-Trace | |
| Framework Laptop 13.5 Ryzen 7 7840U | |
| Lenovo ThinkPad L13 Yoga G4 21FSS00100 | |
| MSI Summit E13 Flip Evo A11MT | |
| Moyenne Intel Core i7-1355U (2991 - 4453, n=18) | |
| Dell Latitude 9330 | |
| HP Elite Dragonfly Folio 13.5 G3 | |
| Lenovo ThinkPad L13 Yoga G4 i7-1355U | |
| AIDA64 / CPU PhotoWorxx | |
| HP Elite Dragonfly Folio 13.5 G3 | |
| MSI Summit E13 Flip Evo A11MT | |
| Dell Latitude 9330 | |
| Lenovo ThinkPad L13 Yoga G4 i7-1355U | |
| Moyenne Intel Core i7-1355U (21800 - 46154, n=18) | |
| Framework Laptop 13.5 Ryzen 7 7840U | |
| Lenovo ThinkPad L13 Yoga G4 21FSS00100 | |
Performance du système
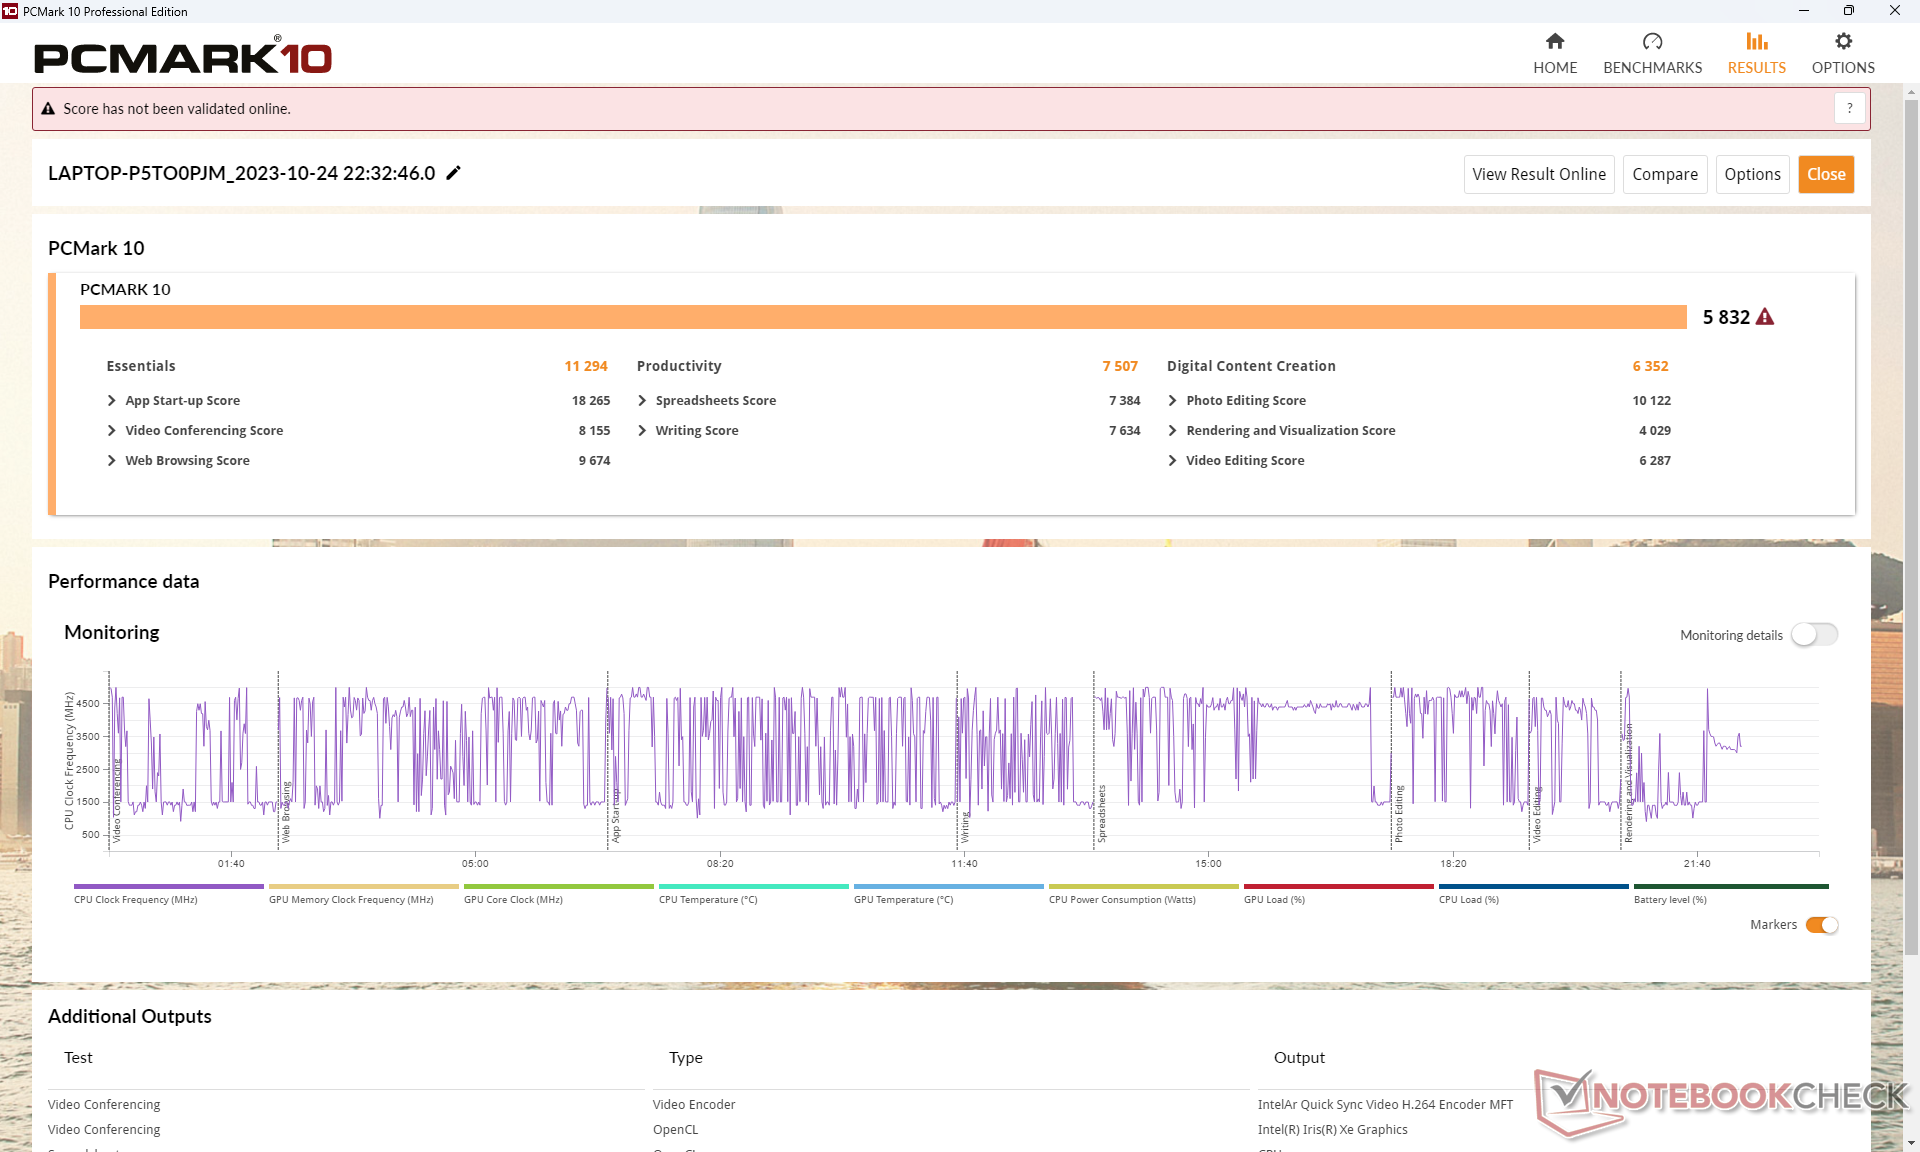
Les scores de PCMark sont plus élevés dans le sous-test de création de contenu numérique, très gourmand en GPU, tandis que le test de productivité, très gourmand en CPU, favorise la version AMD. Cela suggère que notre version Intel offre de meilleures performances graphiques intégrées mais des performances multithread plus lentes que la version AMD.
CrossMark: Overall | Productivity | Creativity | Responsiveness
| PCMark 10 / Score | |
| Framework Laptop 13.5 Ryzen 7 7840U | |
| Lenovo ThinkPad L13 Yoga G4 i7-1355U | |
| HP Elite Dragonfly Folio 13.5 G3 | |
| Moyenne Intel Core i7-1355U, Intel Iris Xe Graphics G7 96EUs (5455 - 5933, n=15) | |
| Lenovo ThinkPad L13 Yoga G4 21FSS00100 | |
| Dell Latitude 9330 | |
| MSI Summit E13 Flip Evo A11MT | |
| PCMark 10 / Essentials | |
| HP Elite Dragonfly Folio 13.5 G3 | |
| Lenovo ThinkPad L13 Yoga G4 i7-1355U | |
| Lenovo ThinkPad L13 Yoga G4 21FSS00100 | |
| Framework Laptop 13.5 Ryzen 7 7840U | |
| Moyenne Intel Core i7-1355U, Intel Iris Xe Graphics G7 96EUs (10203 - 11822, n=15) | |
| Dell Latitude 9330 | |
| MSI Summit E13 Flip Evo A11MT | |
| PCMark 10 / Productivity | |
| Framework Laptop 13.5 Ryzen 7 7840U | |
| Lenovo ThinkPad L13 Yoga G4 21FSS00100 | |
| Lenovo ThinkPad L13 Yoga G4 i7-1355U | |
| HP Elite Dragonfly Folio 13.5 G3 | |
| Moyenne Intel Core i7-1355U, Intel Iris Xe Graphics G7 96EUs (6763 - 7536, n=15) | |
| Dell Latitude 9330 | |
| MSI Summit E13 Flip Evo A11MT | |
| PCMark 10 / Digital Content Creation | |
| Framework Laptop 13.5 Ryzen 7 7840U | |
| Lenovo ThinkPad L13 Yoga G4 i7-1355U | |
| Moyenne Intel Core i7-1355U, Intel Iris Xe Graphics G7 96EUs (5723 - 6712, n=15) | |
| HP Elite Dragonfly Folio 13.5 G3 | |
| Dell Latitude 9330 | |
| MSI Summit E13 Flip Evo A11MT | |
| Lenovo ThinkPad L13 Yoga G4 21FSS00100 | |
| CrossMark / Overall | |
| Framework Laptop 13.5 Ryzen 7 7840U | |
| HP Elite Dragonfly Folio 13.5 G3 | |
| Moyenne Intel Core i7-1355U, Intel Iris Xe Graphics G7 96EUs (1478 - 1643, n=15) | |
| Lenovo ThinkPad L13 Yoga G4 i7-1355U | |
| Lenovo ThinkPad L13 Yoga G4 21FSS00100 | |
| CrossMark / Productivity | |
| Framework Laptop 13.5 Ryzen 7 7840U | |
| HP Elite Dragonfly Folio 13.5 G3 | |
| Moyenne Intel Core i7-1355U, Intel Iris Xe Graphics G7 96EUs (1444 - 1665, n=15) | |
| Lenovo ThinkPad L13 Yoga G4 i7-1355U | |
| Lenovo ThinkPad L13 Yoga G4 21FSS00100 | |
| CrossMark / Creativity | |
| Framework Laptop 13.5 Ryzen 7 7840U | |
| HP Elite Dragonfly Folio 13.5 G3 | |
| Lenovo ThinkPad L13 Yoga G4 i7-1355U | |
| Moyenne Intel Core i7-1355U, Intel Iris Xe Graphics G7 96EUs (1563 - 1732, n=15) | |
| Lenovo ThinkPad L13 Yoga G4 21FSS00100 | |
| CrossMark / Responsiveness | |
| HP Elite Dragonfly Folio 13.5 G3 | |
| Framework Laptop 13.5 Ryzen 7 7840U | |
| Moyenne Intel Core i7-1355U, Intel Iris Xe Graphics G7 96EUs (1217 - 1681, n=15) | |
| Lenovo ThinkPad L13 Yoga G4 i7-1355U | |
| Lenovo ThinkPad L13 Yoga G4 21FSS00100 | |
| PCMark 10 Score | 5823 points | |
Aide | ||
| AIDA64 / Memory Write | |
| Framework Laptop 13.5 Ryzen 7 7840U | |
| HP Elite Dragonfly Folio 13.5 G3 | |
| Lenovo ThinkPad L13 Yoga G4 i7-1355U | |
| Moyenne Intel Core i7-1355U (35910 - 93342, n=18) | |
| Dell Latitude 9330 | |
| MSI Summit E13 Flip Evo A11MT | |
| Lenovo ThinkPad L13 Yoga G4 21FSS00100 | |
| AIDA64 / Memory Latency | |
| HP Elite Dragonfly Folio 13.5 G3 | |
| Lenovo ThinkPad L13 Yoga G4 21FSS00100 | |
| Moyenne Intel Core i7-1355U (72.2 - 346, n=18) | |
| Dell Latitude 9330 | |
| Lenovo ThinkPad L13 Yoga G4 i7-1355U | |
| MSI Summit E13 Flip Evo A11MT | |
| Framework Laptop 13.5 Ryzen 7 7840U | |
* ... Moindre est la valeur, meilleures sont les performances
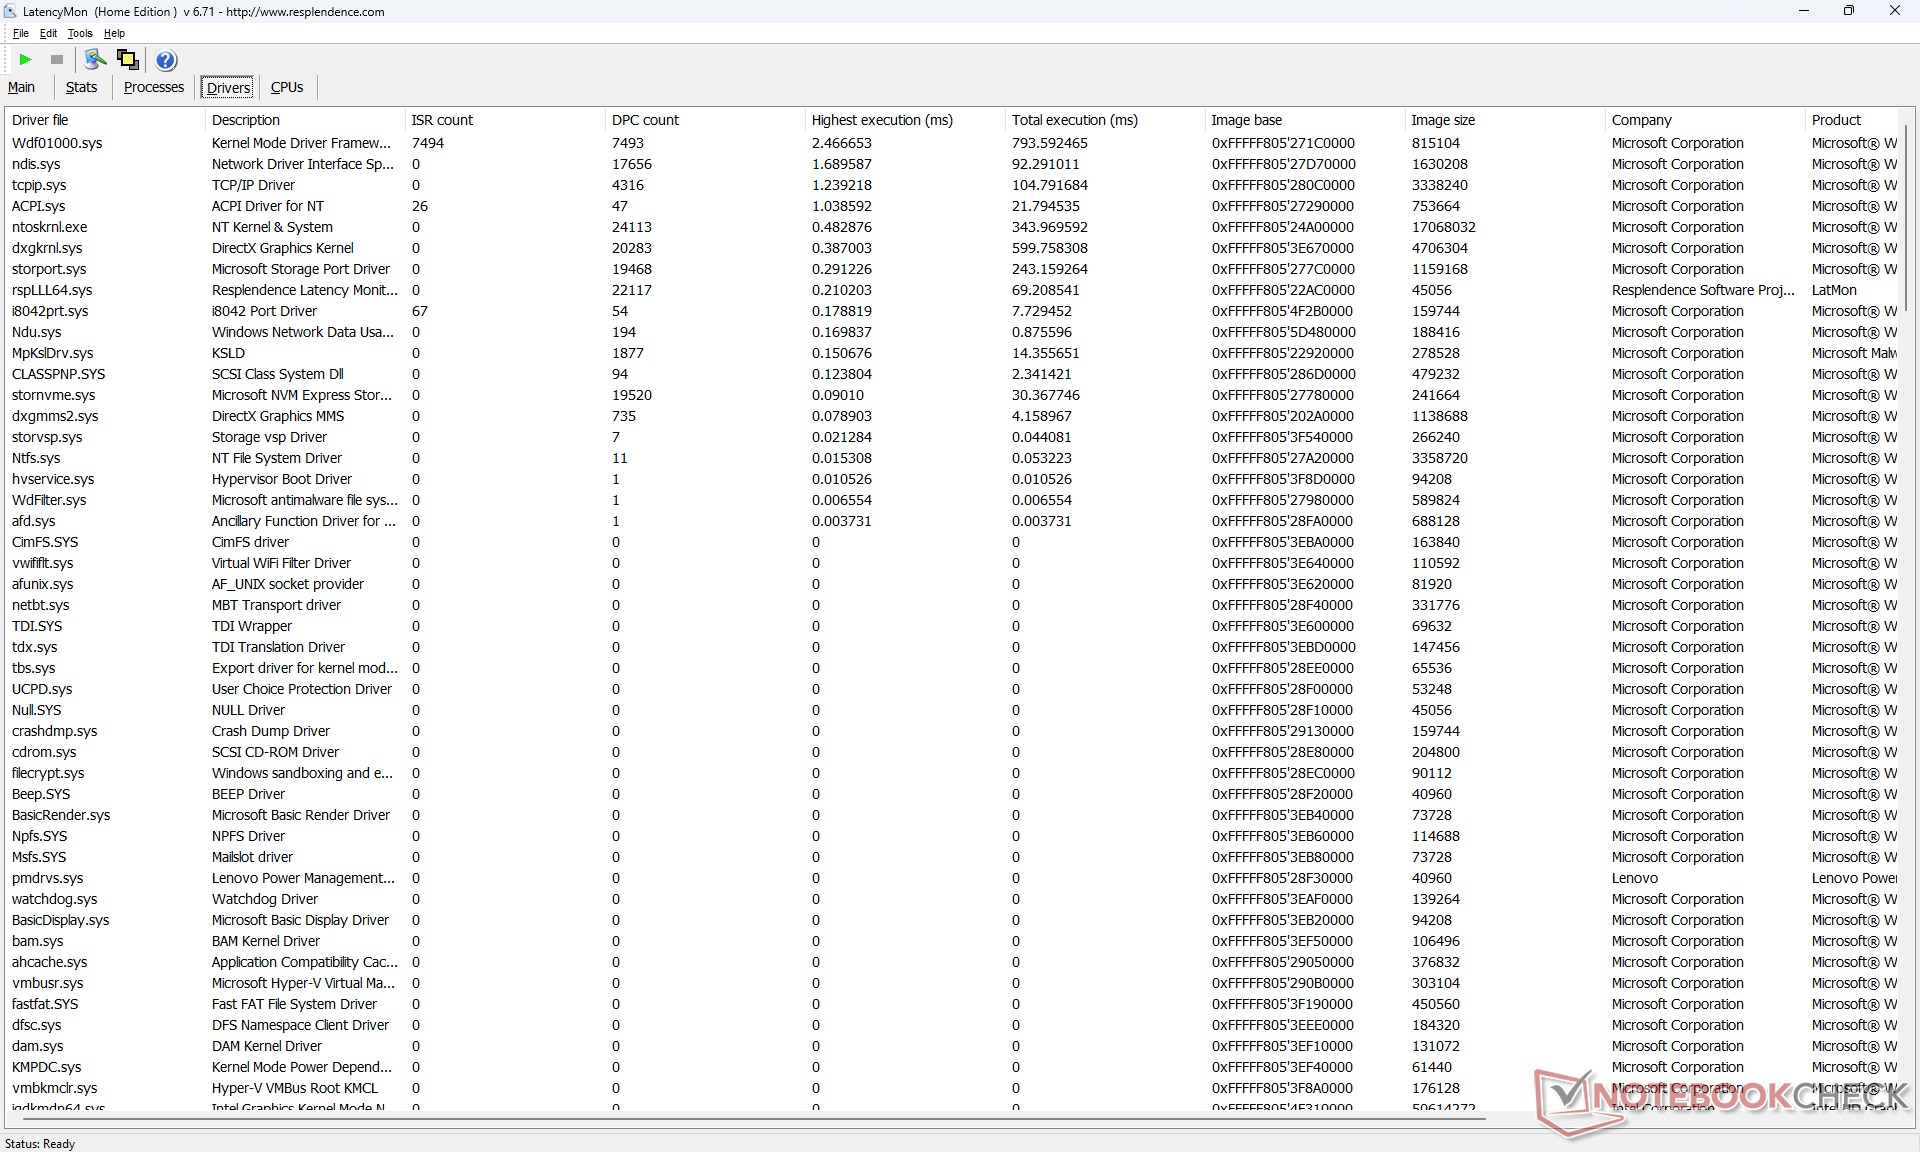
Latence DPC
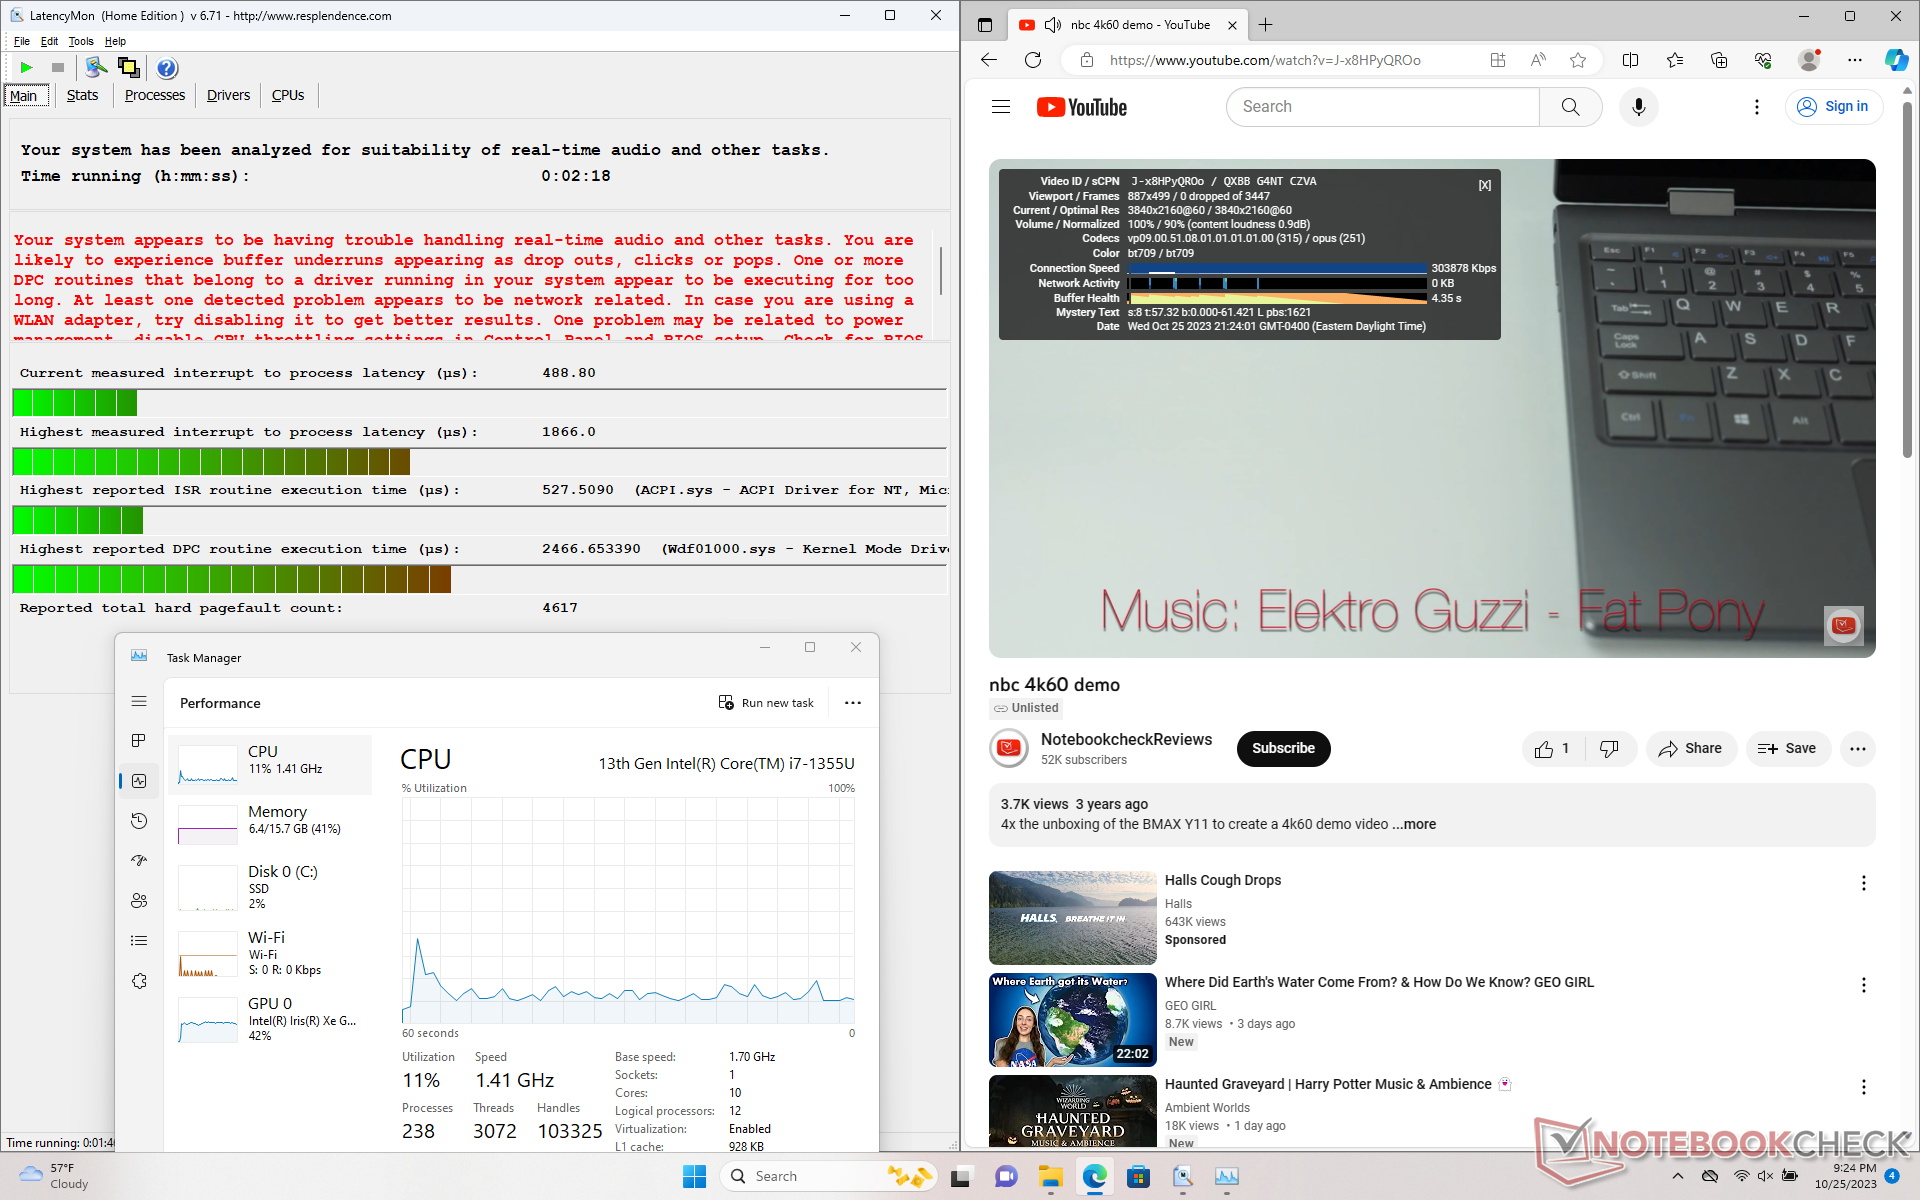
LatencyMon révèle de légers problèmes de DPC lors de l'ouverture de plusieurs onglets de notre page d'accueil. la lecture de vidéos 4K à 60 FPS est par ailleurs fluide et ne présente aucune perte d'images.
| DPC Latencies / LatencyMon - interrupt to process latency (max), Web, Youtube, Prime95 | |
| Dell Latitude 9330 | |
| HP Elite Dragonfly Folio 13.5 G3 | |
| MSI Summit E13 Flip Evo A11MT | |
| Lenovo ThinkPad L13 Yoga G4 i7-1355U | |
| Framework Laptop 13.5 Ryzen 7 7840U | |
| Lenovo ThinkPad L13 Yoga G4 21FSS00100 | |
* ... Moindre est la valeur, meilleures sont les performances
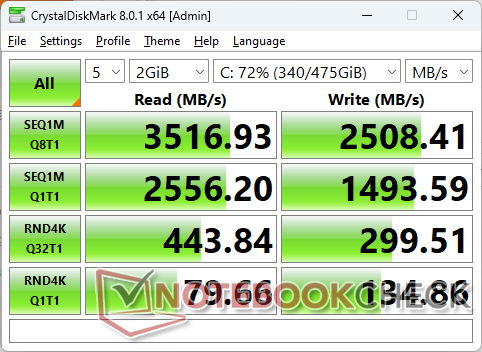
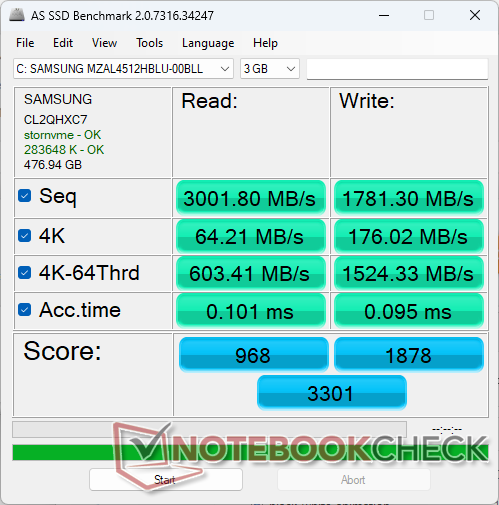
Dispositifs de stockage
Notre appareil est livré avec un appareil de milieu de gamme de 512 GoSamsung PM9B1 au lieu du Kioxia BG5 qui équipe notre version AMD. Les taux de transfert atteignent environ 3600 Mo/s avant que l'étranglement n'intervienne après quelques minutes de stress, auquel cas les taux de transfert peuvent descendre jusqu'à 2200 Mo/s.

| Drive Performance rating - Percent | |
| HP Elite Dragonfly Folio 13.5 G3 -11! | |
| MSI Summit E13 Flip Evo A11MT | |
| Framework Laptop 13.5 Ryzen 7 7840U -11! | |
| Dell Latitude 9330 | |
| Lenovo ThinkPad L13 Yoga G4 21FSS00100 | |
| Lenovo ThinkPad L13 Yoga G4 i7-1355U | |
* ... Moindre est la valeur, meilleures sont les performances
Disk Throttling: DiskSpd Read Loop, Queue Depth 8
Performance du GPU
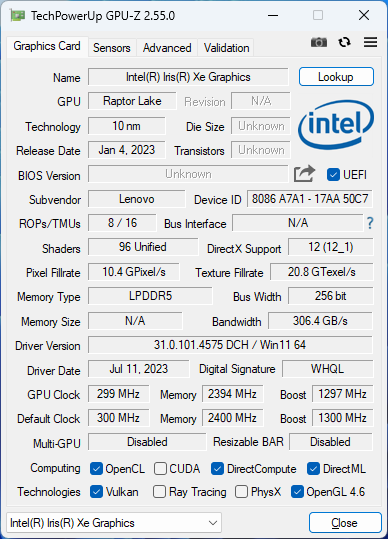
Notre Iris Xe 96 EUs a un net avantage sur laRadeon RX Vega 7 dans la Ryzen 5 7530U dans les applications DX11 et DX12. les résultats de 3DMark Fire Strike et Time Spy, par exemple, sont 50 à 60 % plus rapides avec notre configuration Intel.
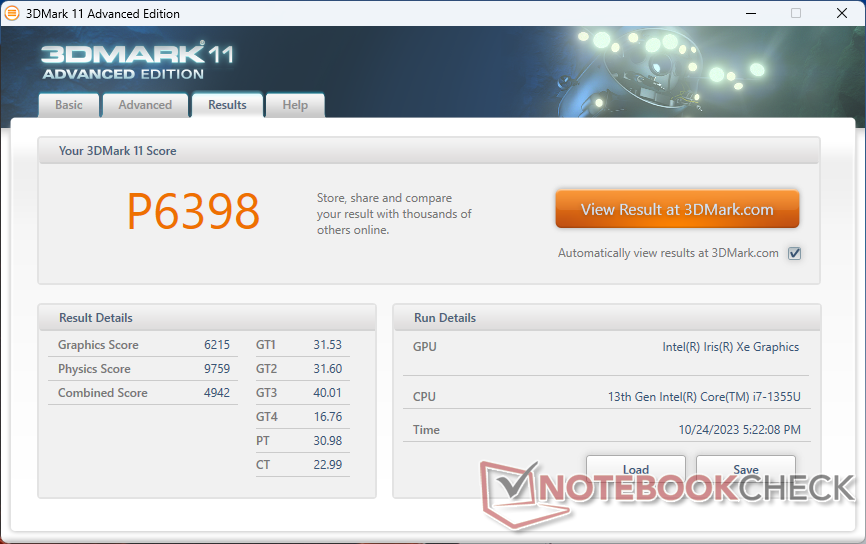
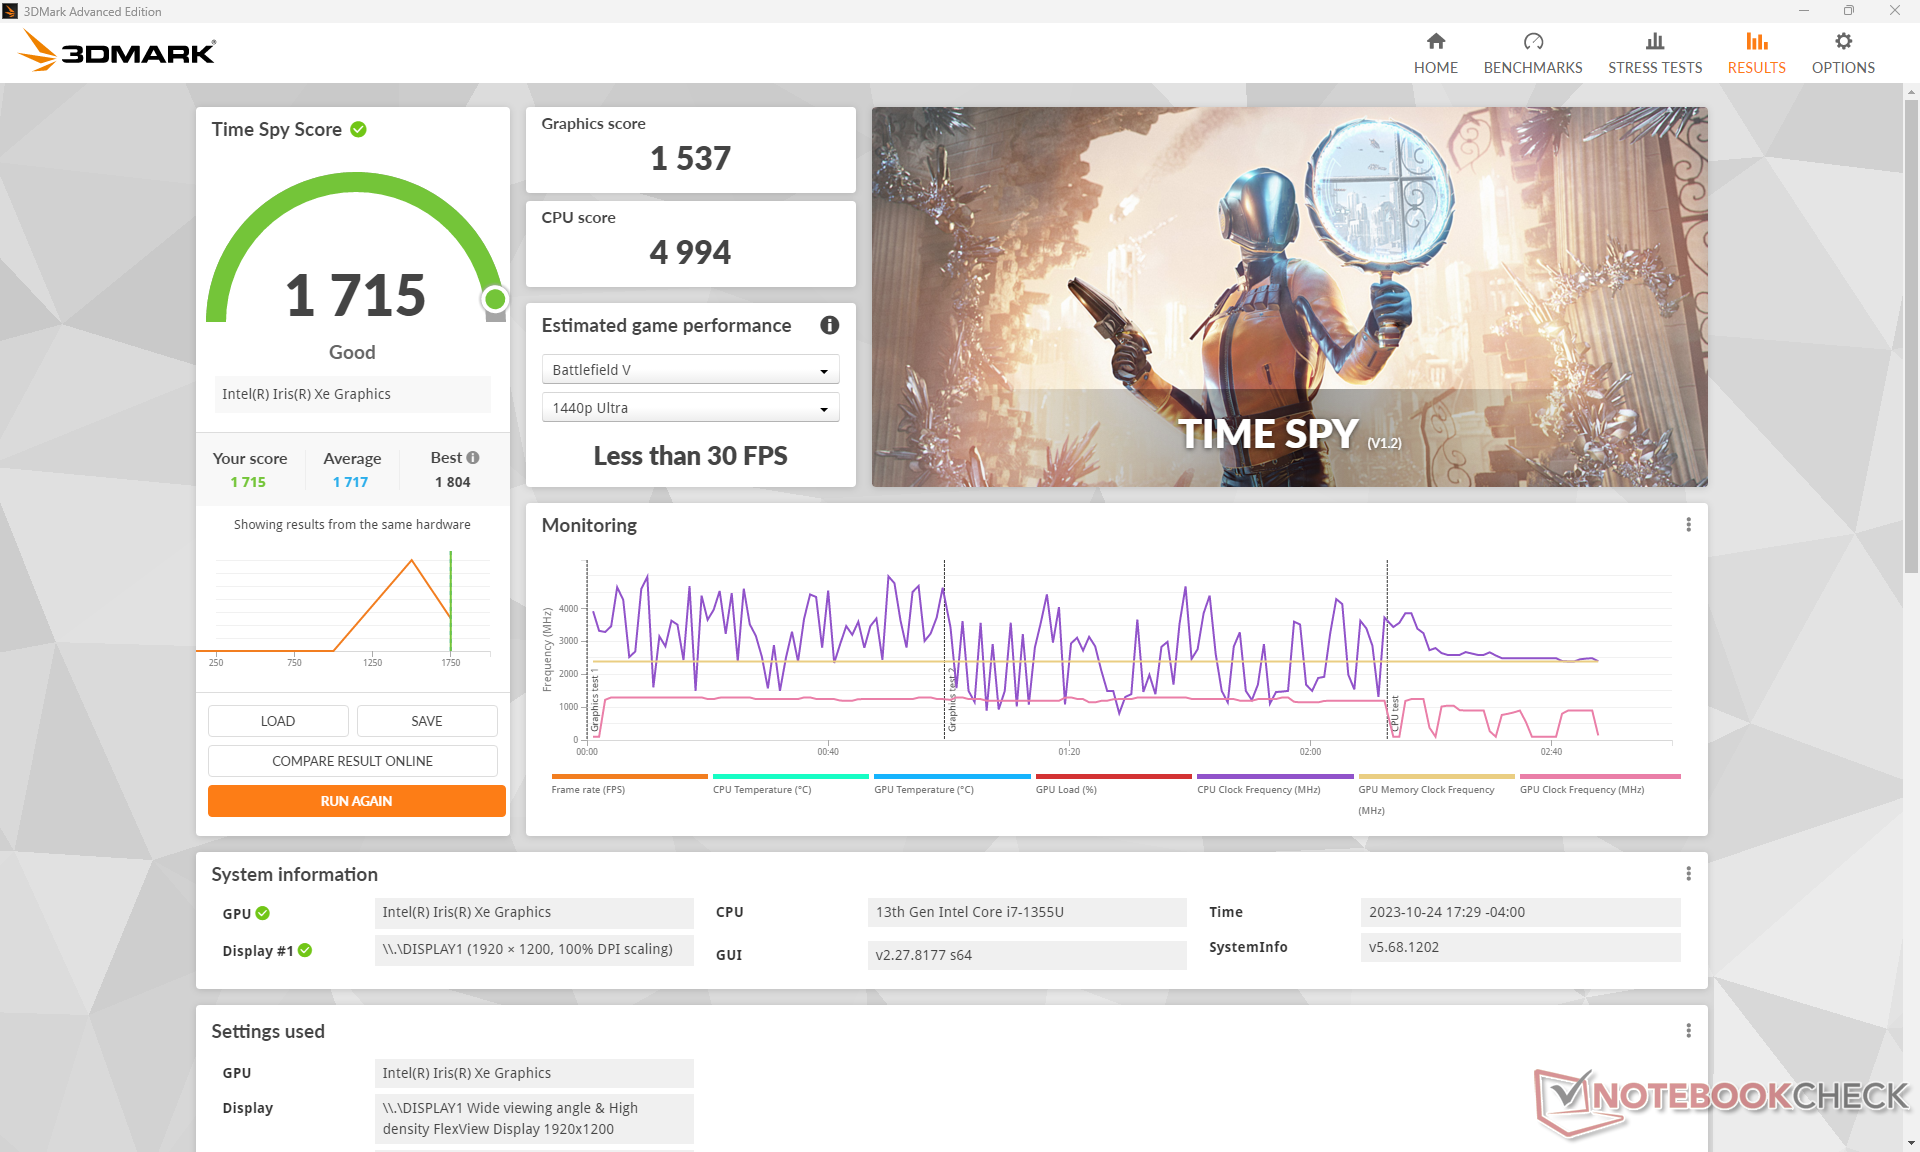
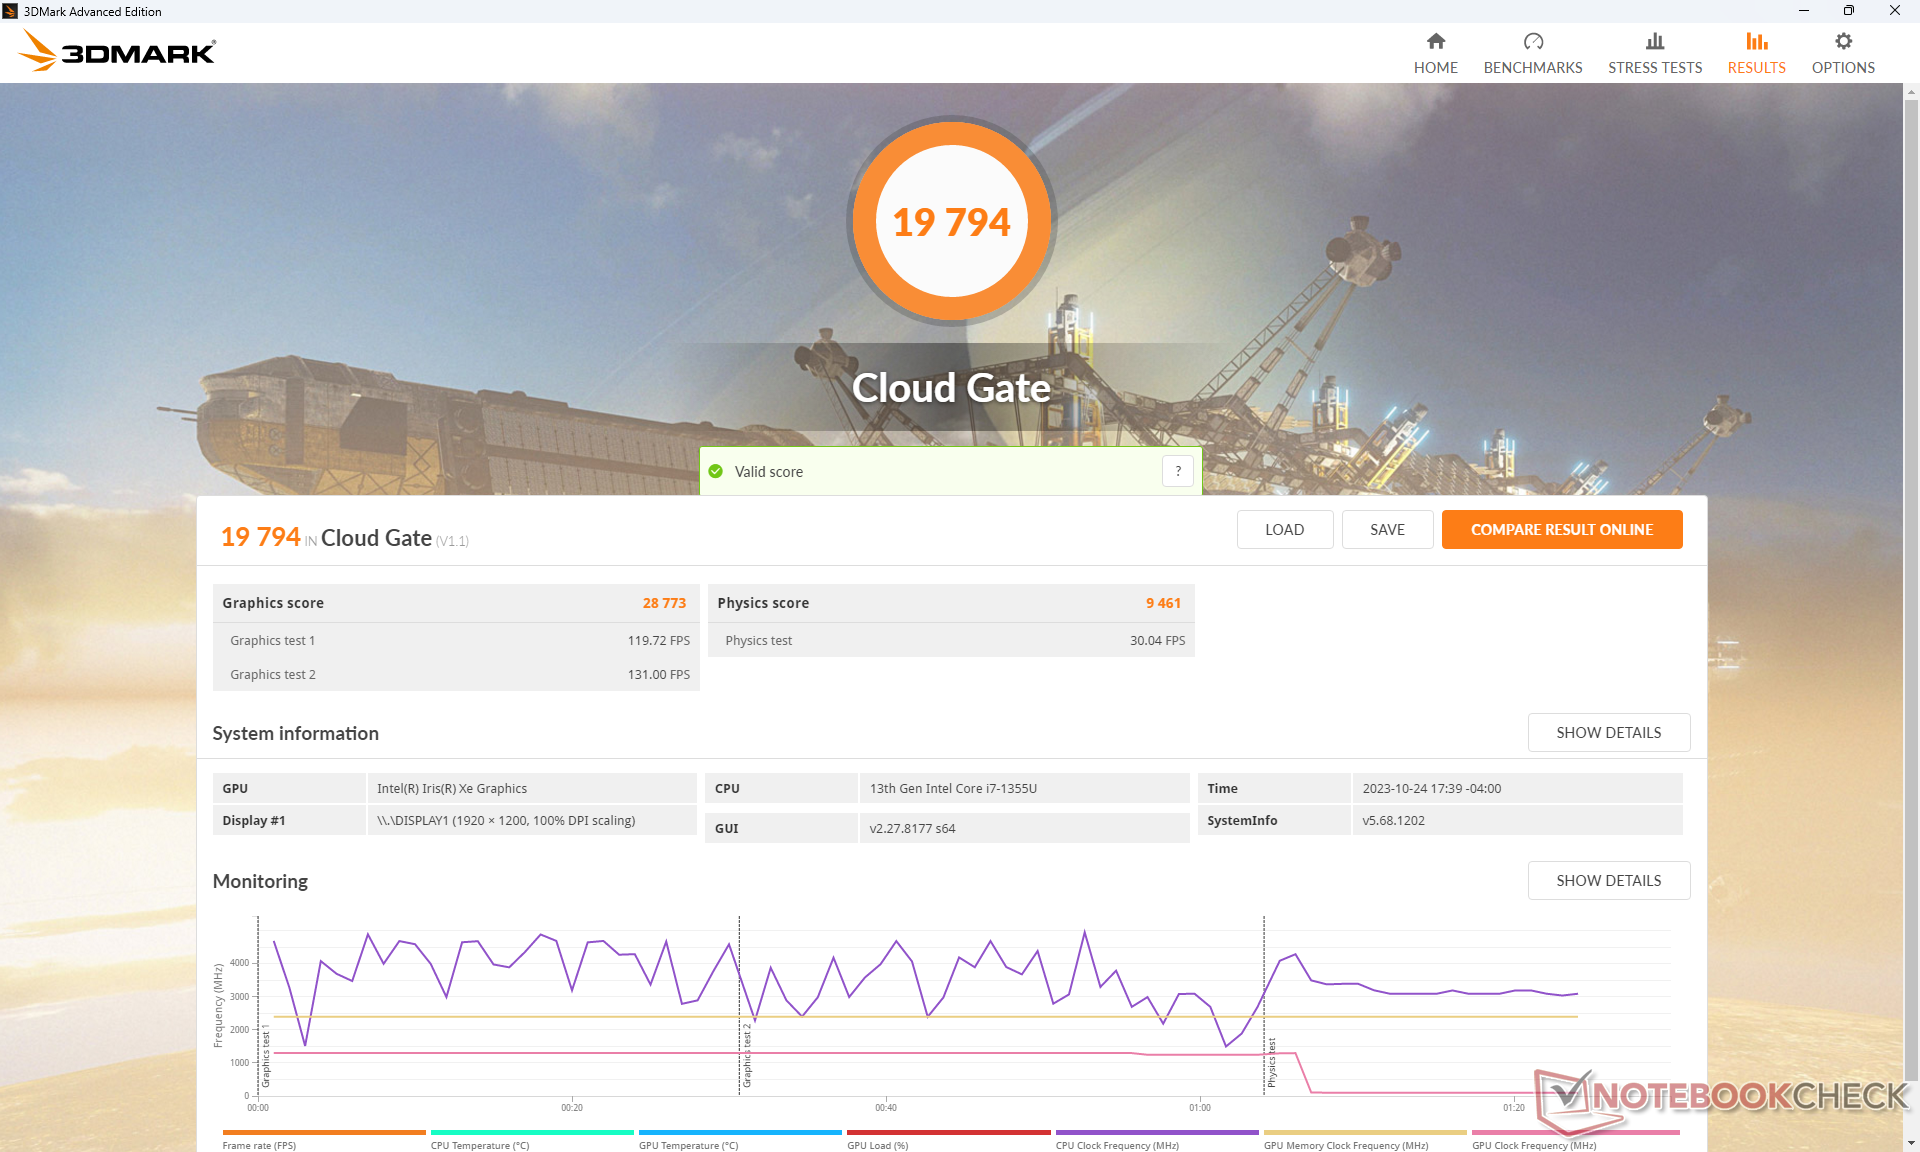
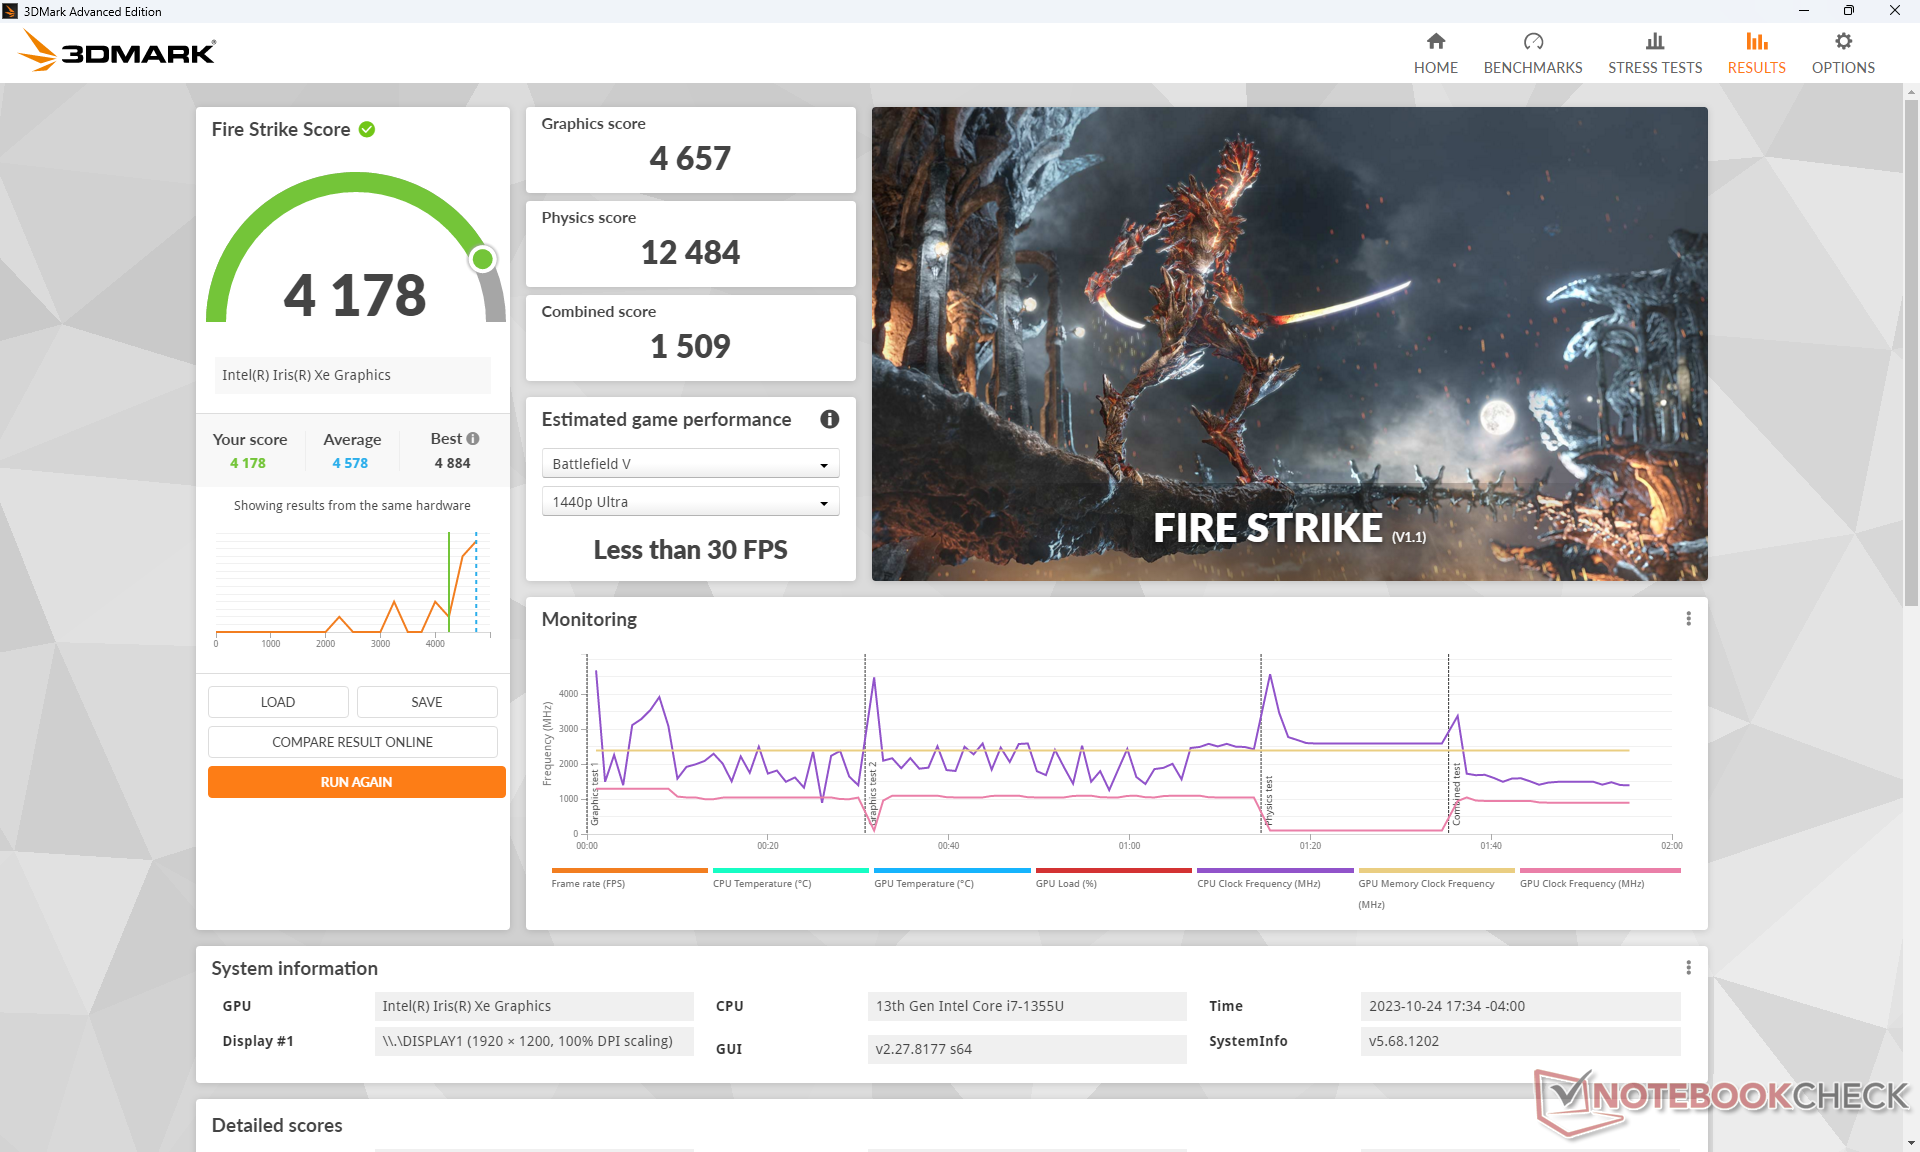
| 3DMark 11 Performance | 6398 points | |
| 3DMark Cloud Gate Standard Score | 19794 points | |
| 3DMark Fire Strike Score | 4178 points | |
| 3DMark Time Spy Score | 1715 points | |
Aide | ||
* ... Moindre est la valeur, meilleures sont les performances
La stabilité du taux de rafraîchissement dans les jeux est malheureusement instable. Lorsque le jeu tourne au ralenti sur Witcher 3 sur les paramètres bas, par exemple, le taux de rafraîchissement fluctue entre 70 et 85 FPS, comme le montre le graphique ci-dessous, ce qui suggère une fluctuation de la fréquence d'horloge au fil du temps. Heureusement, le ThinkPad L13 n'est pas un ordinateur portable de jeu et cet inconvénient spécifique ne devrait pas être un frein pour le public cible. Les applications de streaming s'exécutent toujours sans problème sur la machine.
Witcher 3 FPS Chart
| Bas | Moyen | Élevé | Ultra | |
|---|---|---|---|---|
| GTA V (2015) | 106.7 | 84.1 | 9.99 | |
| The Witcher 3 (2015) | 92.8 | 56.7 | 31 | 13.8 |
| Dota 2 Reborn (2015) | 94.3 | 65.3 | 52.4 | 46.2 |
| Final Fantasy XV Benchmark (2018) | 36.6 | 20.1 | 15 | |
| X-Plane 11.11 (2018) | 39.8 | 27.3 | 25.1 | |
| Far Cry 5 (2018) | 45 | 24 | 22 | 21 |
| Strange Brigade (2018) | 87.2 | 38.1 | 30.5 | 23 |
| Cyberpunk 2077 1.6 (2022) | 17.8 | |||
| Tiny Tina's Wonderlands (2022) | 23.3 | 17.7 | 10.9 | 8.6 |
| F1 22 (2022) | 45 | 41.1 | 29.8 | 22.6 |
Émissions
Bruit du système
Le bruit du ventilateur peut être plus fort sur la version Intel que sur la version AMD lors de l'exécution de charges exigeantes comme 3DMark, ce qui peut être attribué aux performances graphiques plus rapides et à la consommation d'énergie globale de la version Intel. Sinon, le bruit du ventilateur se situe généralement autour de 30 dB(A) lors de la navigation sur le web ou de la lecture en continu, ce qui permet de l'ignorer dans la plupart des bureaux ou des salles de conférence.
Degré de la nuisance sonore
| Au repos |
| 23.4 / 23.4 / 23.4 dB(A) |
| Fortement sollicité |
| 33.9 / 36.9 dB(A) |
 | ||
30 dB silencieux 40 dB(A) audible 50 dB(A) bruyant |
||
min: | ||
| Lenovo ThinkPad L13 Yoga G4 i7-1355U Iris Xe G7 96EUs, i7-1355U, Samsung PM9B1 512GB MZAL4512HBLU | Lenovo ThinkPad L13 Yoga G4 21FSS00100 Vega 7, R5 7530U, Kioxia BG5 KBG5AZNT512G | HP Elite Dragonfly Folio 13.5 G3 Iris Xe G7 96EUs, i7-1265U, Samsung PM9A1 MZVL2512HCJQ | Dell Latitude 9330 Iris Xe G7 96EUs, i7-1260U | MSI Summit E13 Flip Evo A11MT Iris Xe G7 96EUs, i7-1185G7, Phison 1TB SM2801T24GKBB4S-E162 | Framework Laptop 13.5 Ryzen 7 7840U Radeon 780M, R7 7840U, WD PC SN740 512GB SDDPNQD-512G | |
|---|---|---|---|---|---|---|
| Noise | 9% | 2% | -4% | -12% | -9% | |
| arrêt / environnement * (dB) | 23.1 | 23.4 -1% | 24.6 -6% | 23 -0% | 24.5 -6% | 22.6 2% |
| Idle Minimum * (dB) | 23.4 | 23.4 -0% | 24.6 -5% | 23 2% | 24.7 -6% | 22.6 3% |
| Idle Average * (dB) | 23.4 | 23.4 -0% | 24.6 -5% | 23.1 1% | 24.7 -6% | 22.6 3% |
| Idle Maximum * (dB) | 23.4 | 23.4 -0% | 24.6 -5% | 23.1 1% | 26.4 -13% | 24.2 -3% |
| Load Average * (dB) | 33.9 | 24 29% | 27.8 18% | 37.1 -9% | 37.8 -12% | 35.8 -6% |
| Witcher 3 ultra * (dB) | 36.9 | 30.8 17% | 33.4 9% | 40.6 -10% | 41.4 -12% | 46.5 -26% |
| Load Maximum * (dB) | 36.9 | 30.1 18% | 33.4 9% | 40.5 -10% | 48.8 -32% | 48.9 -33% |
* ... Moindre est la valeur, meilleures sont les performances
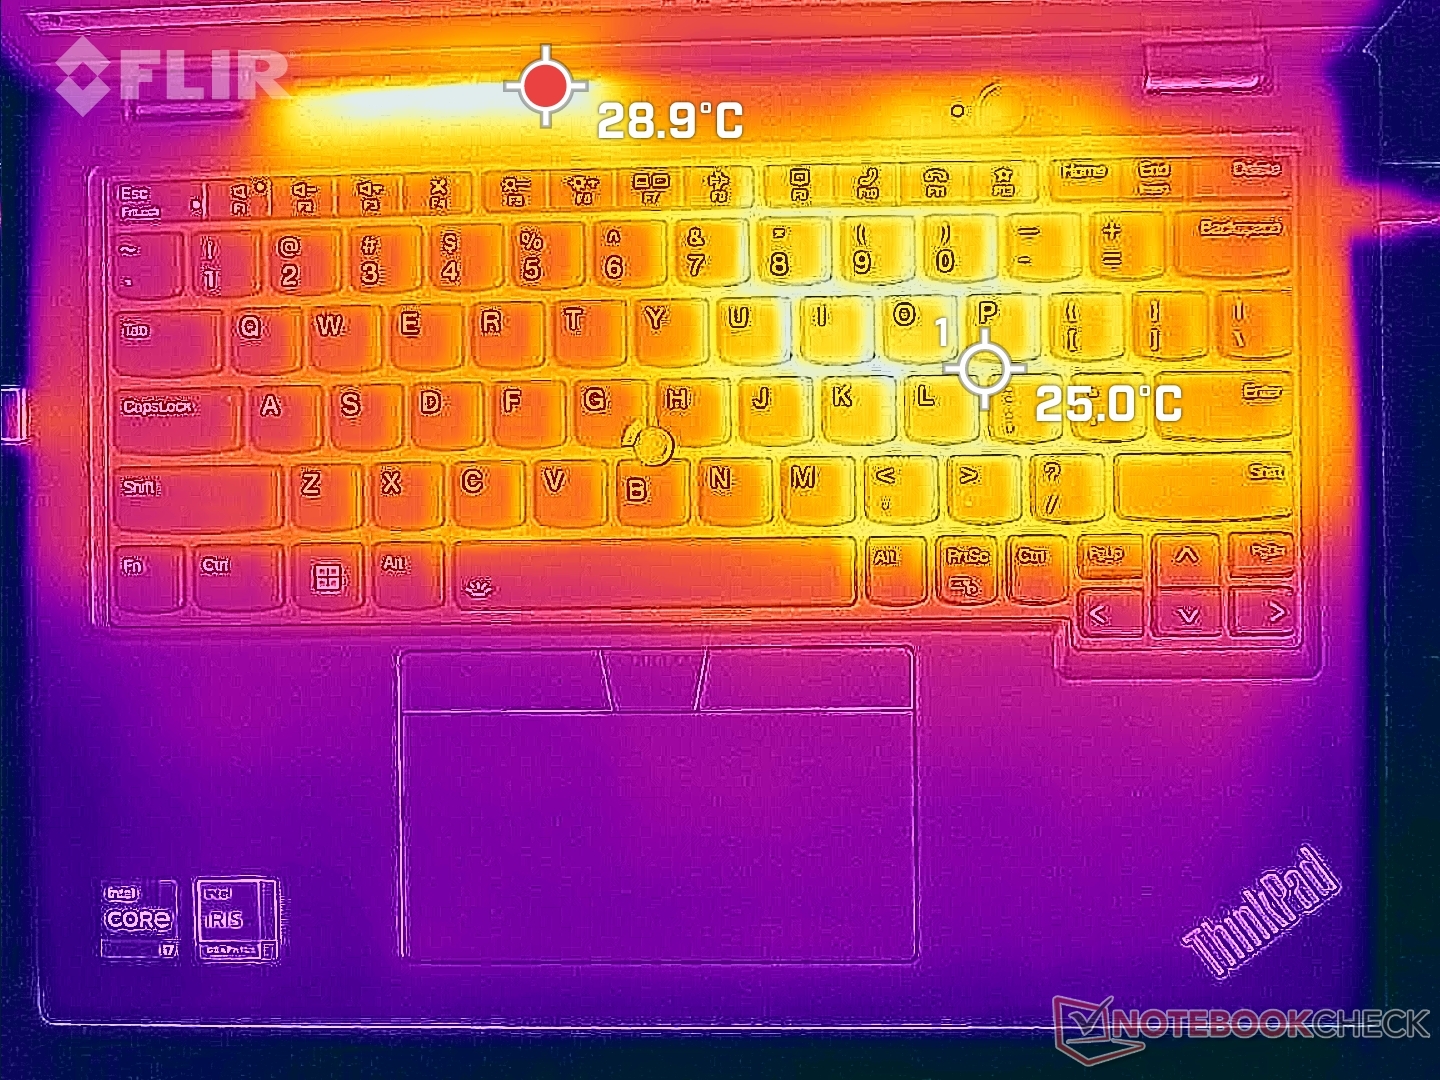
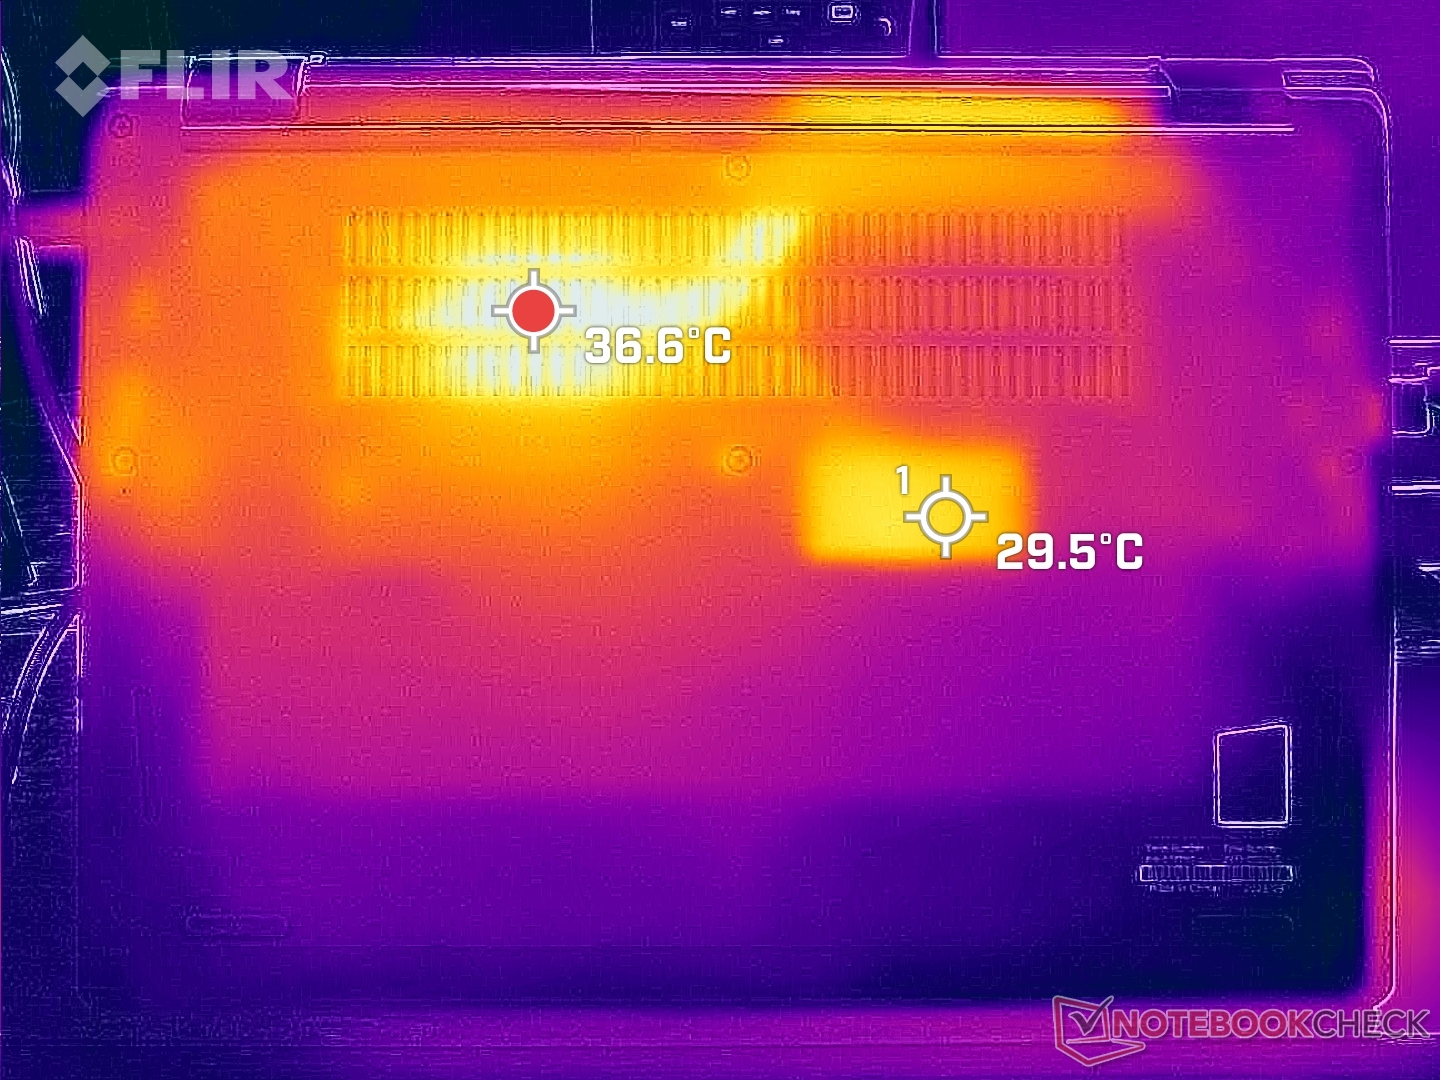
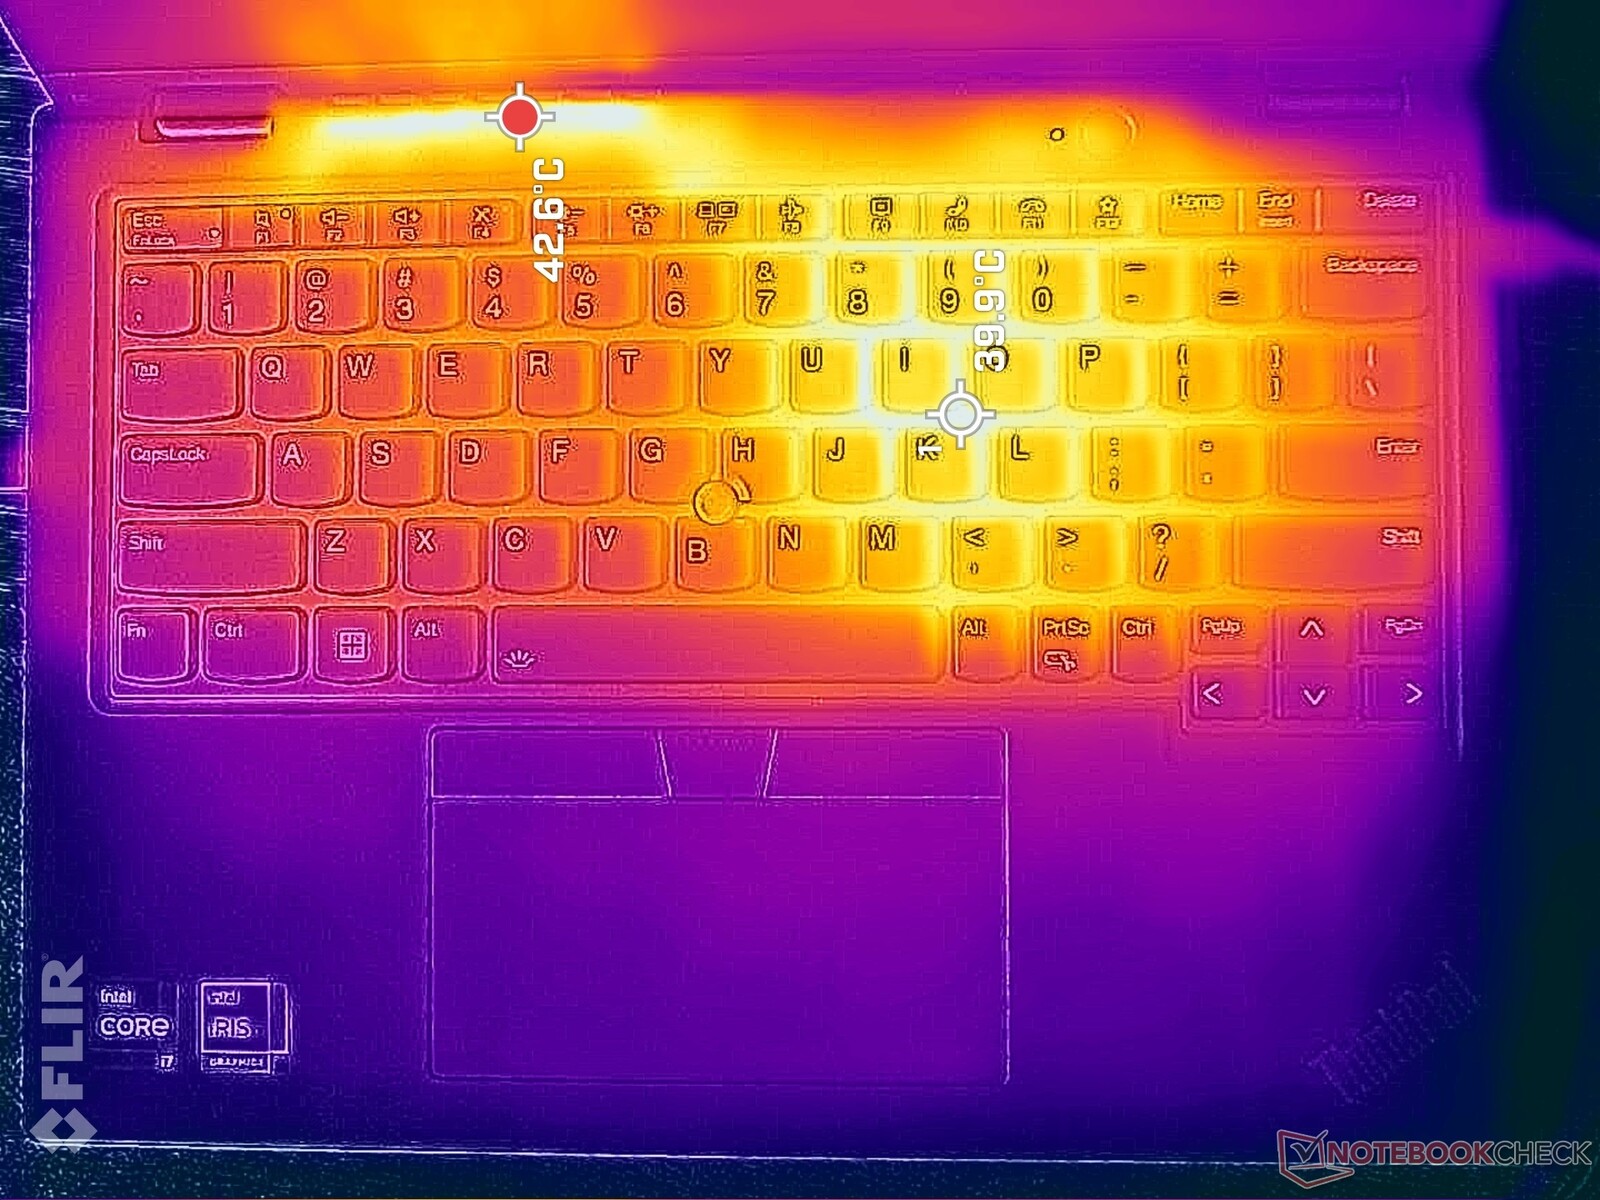
Température
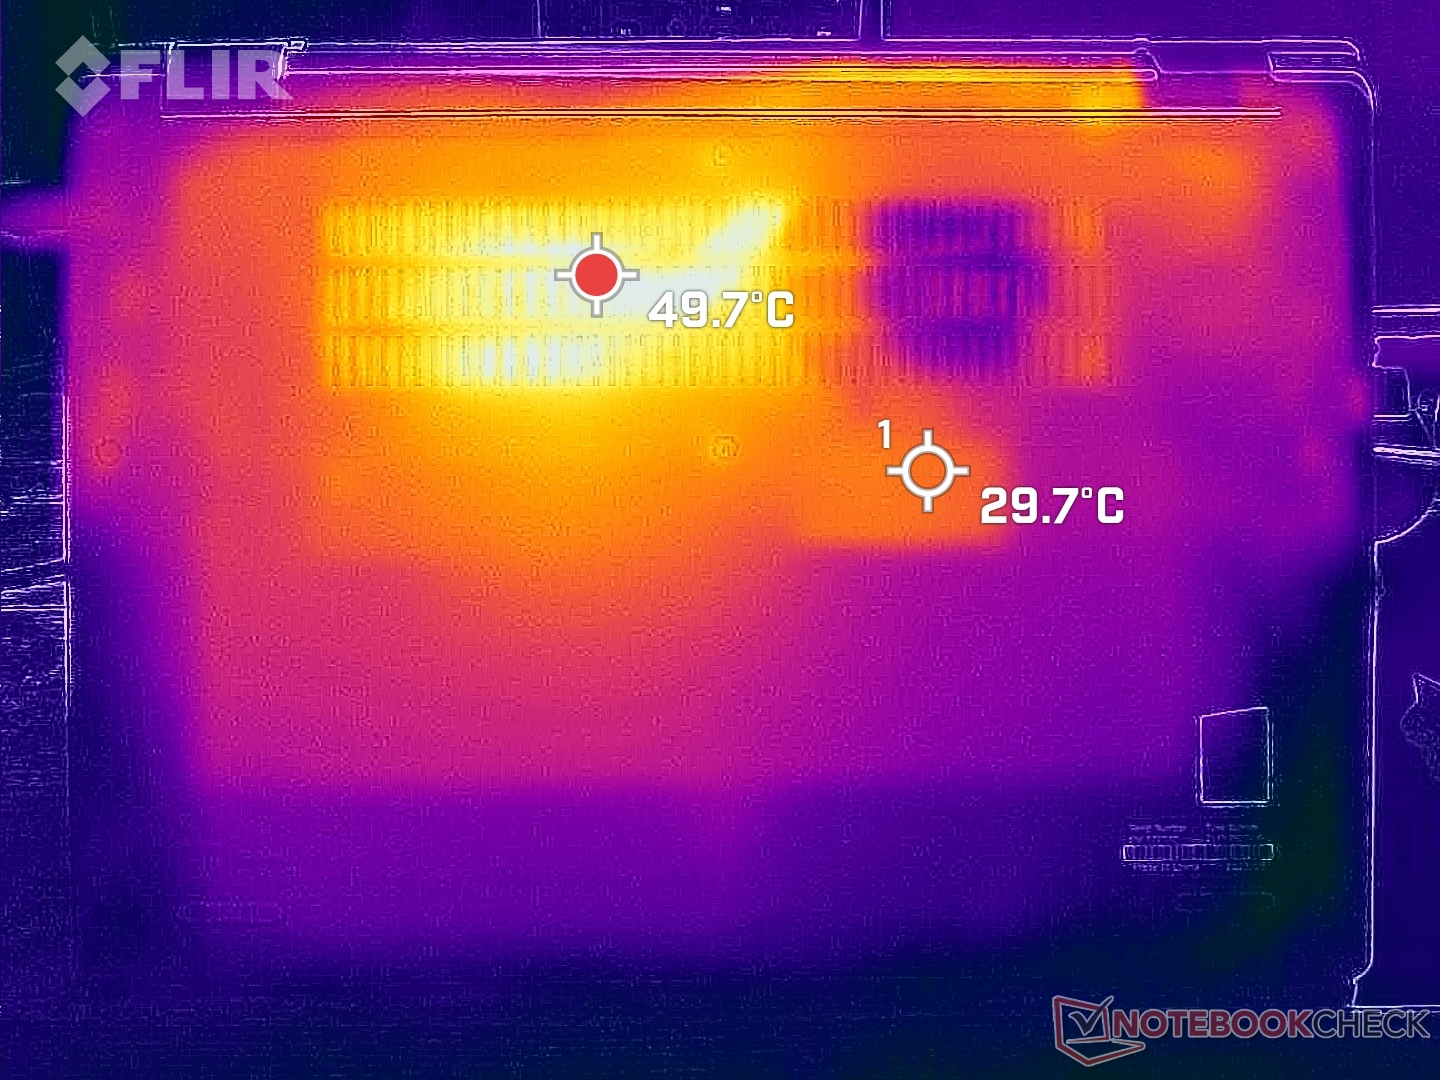
Les points chauds peuvent atteindre 40°C sur le côté droit du clavier, comme sur la configuration AMD. Ainsi, l'unité Intel ne fonctionne pas de manière significativement plus froide ou plus chaude malgré les différences de performances.
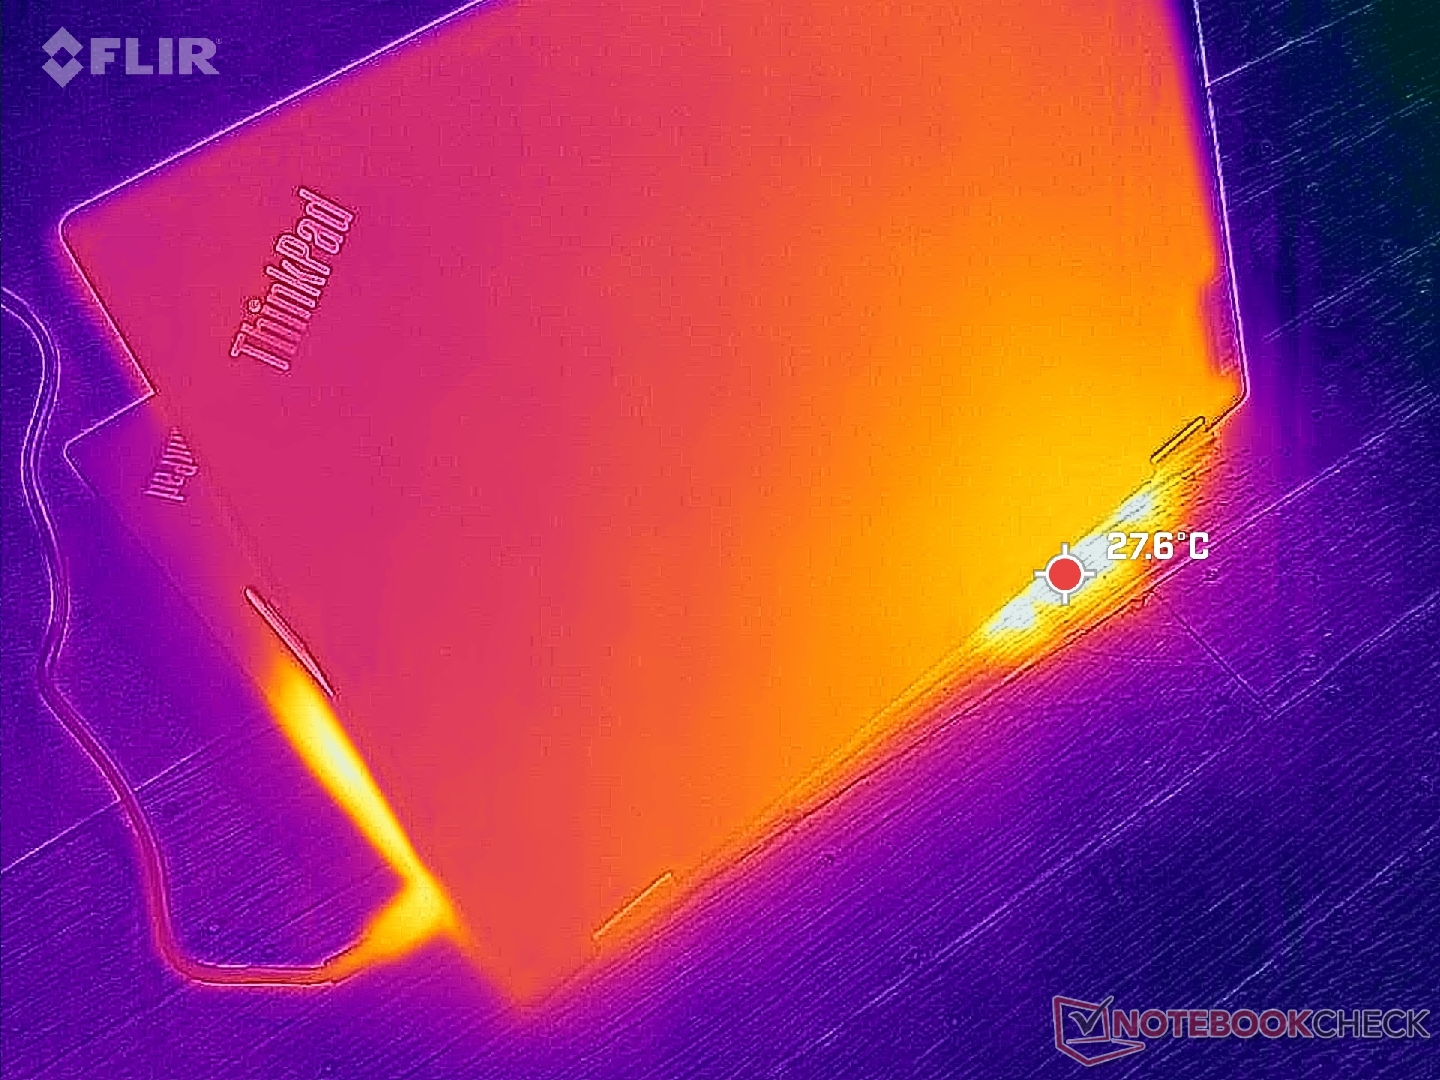
(+) La température maximale du côté supérieur est de 38.4 °C / 101 F, par rapport à la moyenne de 35.4 °C / 96 F, allant de 19.6 à 60 °C pour la classe Convertible.
(-) Le fond chauffe jusqu'à un maximum de 46 °C / 115 F, contre une moyenne de 36.9 °C / 98 F
(+) En utilisation inactive, la température moyenne du côté supérieur est de 27.2 °C / 81 F, par rapport à la moyenne du dispositif de 30.3 °C / 87 F.
(+) Les repose-poignets et le pavé tactile sont plus froids que la température de la peau avec un maximum de 23.6 °C / 74.5 F et sont donc froids au toucher.
(+) La température moyenne de la zone de l'appui-paume de dispositifs similaires était de 28 °C / 82.4 F (+4.4 °C / #7.9 F).
| Lenovo ThinkPad L13 Yoga G4 i7-1355U Intel Core i7-1355U, Intel Iris Xe Graphics G7 96EUs | Lenovo ThinkPad L13 Yoga G4 21FSS00100 AMD Ryzen 5 7530U, AMD Radeon RX Vega 7 | HP Elite Dragonfly Folio 13.5 G3 Intel Core i7-1265U, Intel Iris Xe Graphics G7 96EUs | Dell Latitude 9330 Intel Core i7-1260U, Intel Iris Xe Graphics G7 96EUs | MSI Summit E13 Flip Evo A11MT Intel Core i7-1185G7, Intel Iris Xe Graphics G7 96EUs | Framework Laptop 13.5 Ryzen 7 7840U AMD Ryzen 7 7840U, AMD Radeon 780M | |
|---|---|---|---|---|---|---|
| Heat | -3% | 23% | 7% | -14% | 3% | |
| Maximum Upper Side * (°C) | 38.4 | 43.3 -13% | 32.8 15% | 40.6 -6% | 52 -35% | 42 -9% |
| Maximum Bottom * (°C) | 46 | 46.5 -1% | 33.4 27% | 50.2 -9% | 57.4 -25% | 47.4 -3% |
| Idle Upper Side * (°C) | 31.2 | 31.9 -2% | 24.6 21% | 25 20% | 30.4 3% | 28.8 8% |
| Idle Bottom * (°C) | 34.8 | 33.1 5% | 24.6 29% | 27.6 21% | 34.2 2% | 29.6 15% |
* ... Moindre est la valeur, meilleures sont les performances
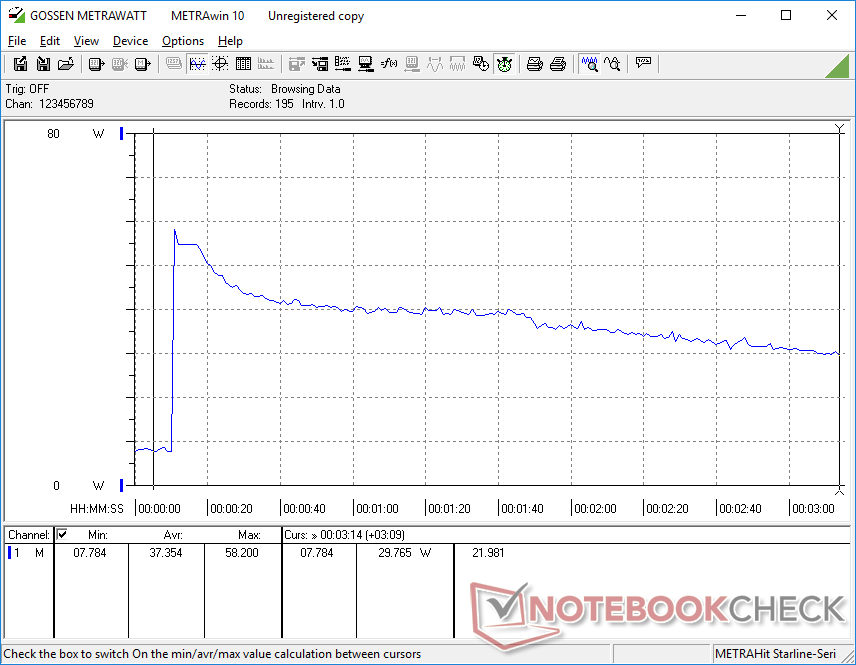
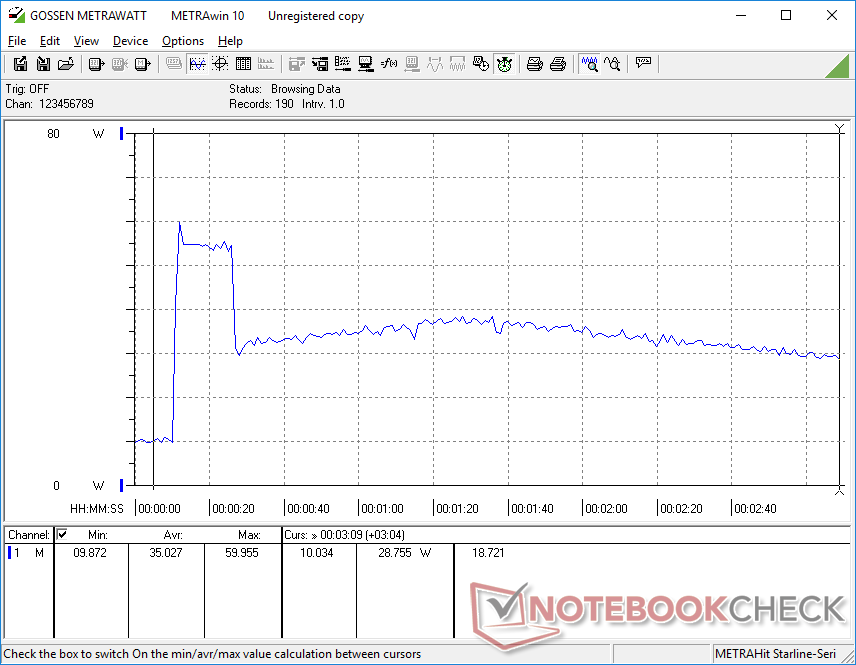
Test de stress
Lors de l'initialisation du stress Prime95, le CPU atteignait 3 GHz, 89 C et 35 W pendant les premières secondes avant de diminuer régulièrement et de se stabiliser à 2,2 GHz, 75 C et 19 W. Ce comportement s'aligne sur nos observations CineBench R15 xT ci-dessus où les performances étaient les plus élevées au début du test avant de s'essouffler.
Les fréquences d'horloge du GPU en fonctionnement Witcher 3 oscillent entre 950 et 1150 MHz, ce qui contribue aux taux de rafraîchissement mentionnés ci-dessus.
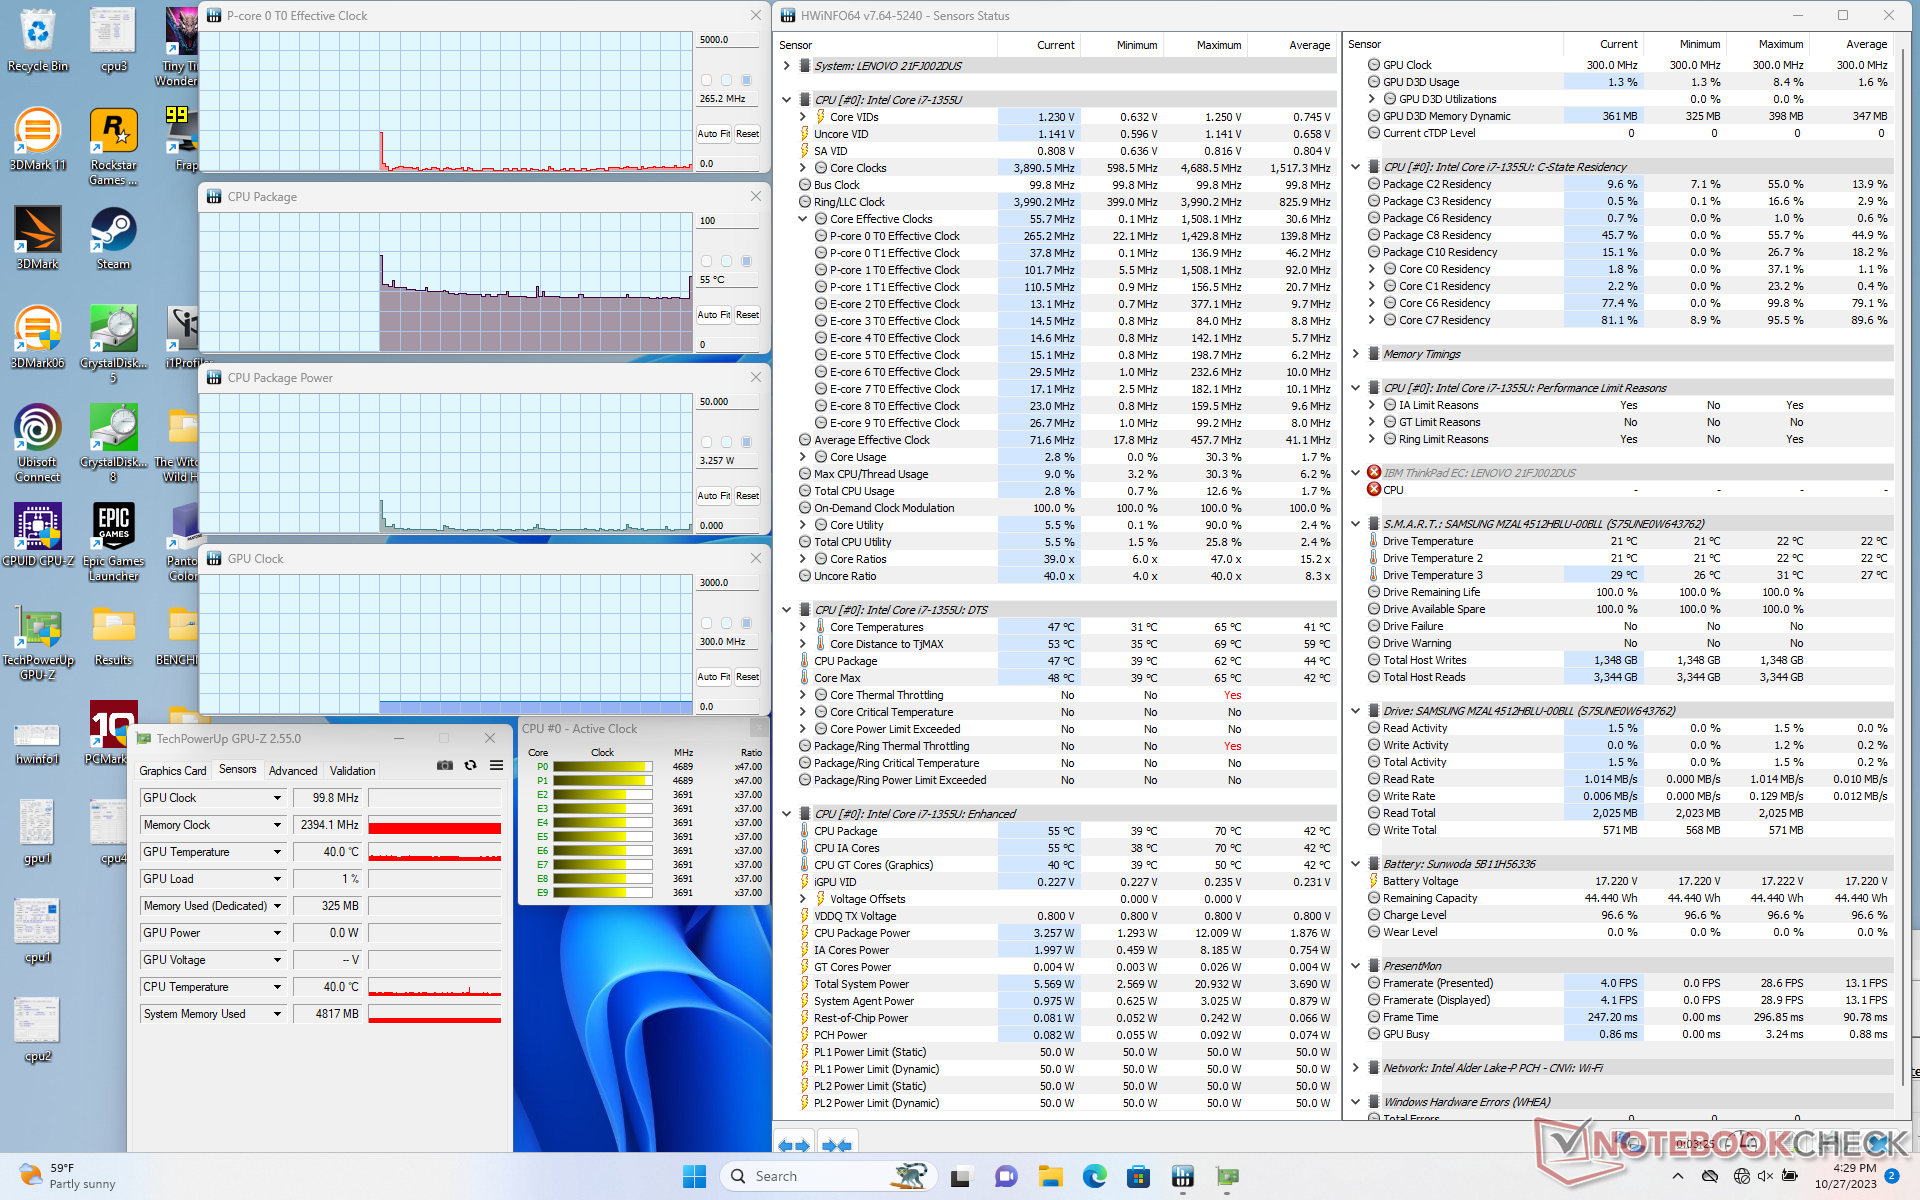
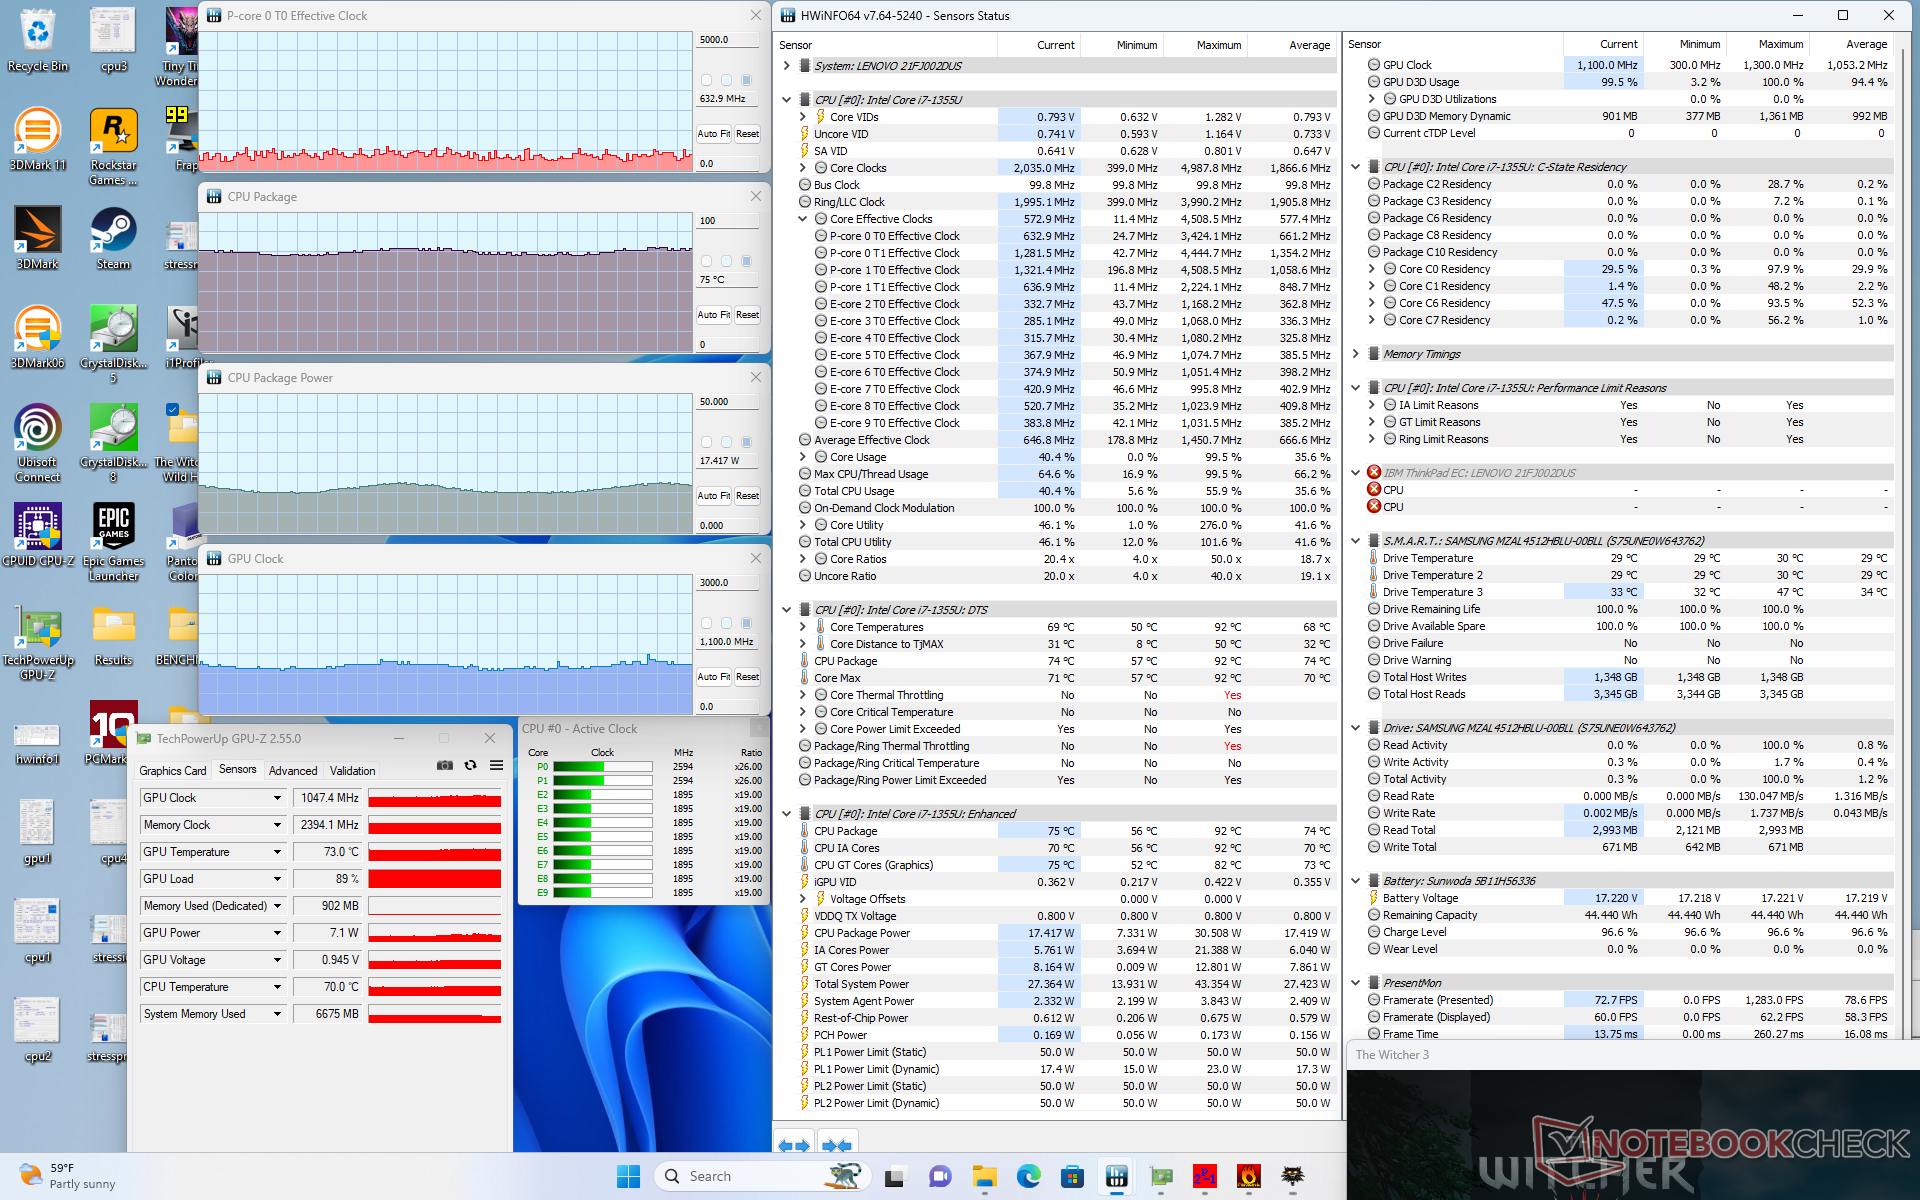
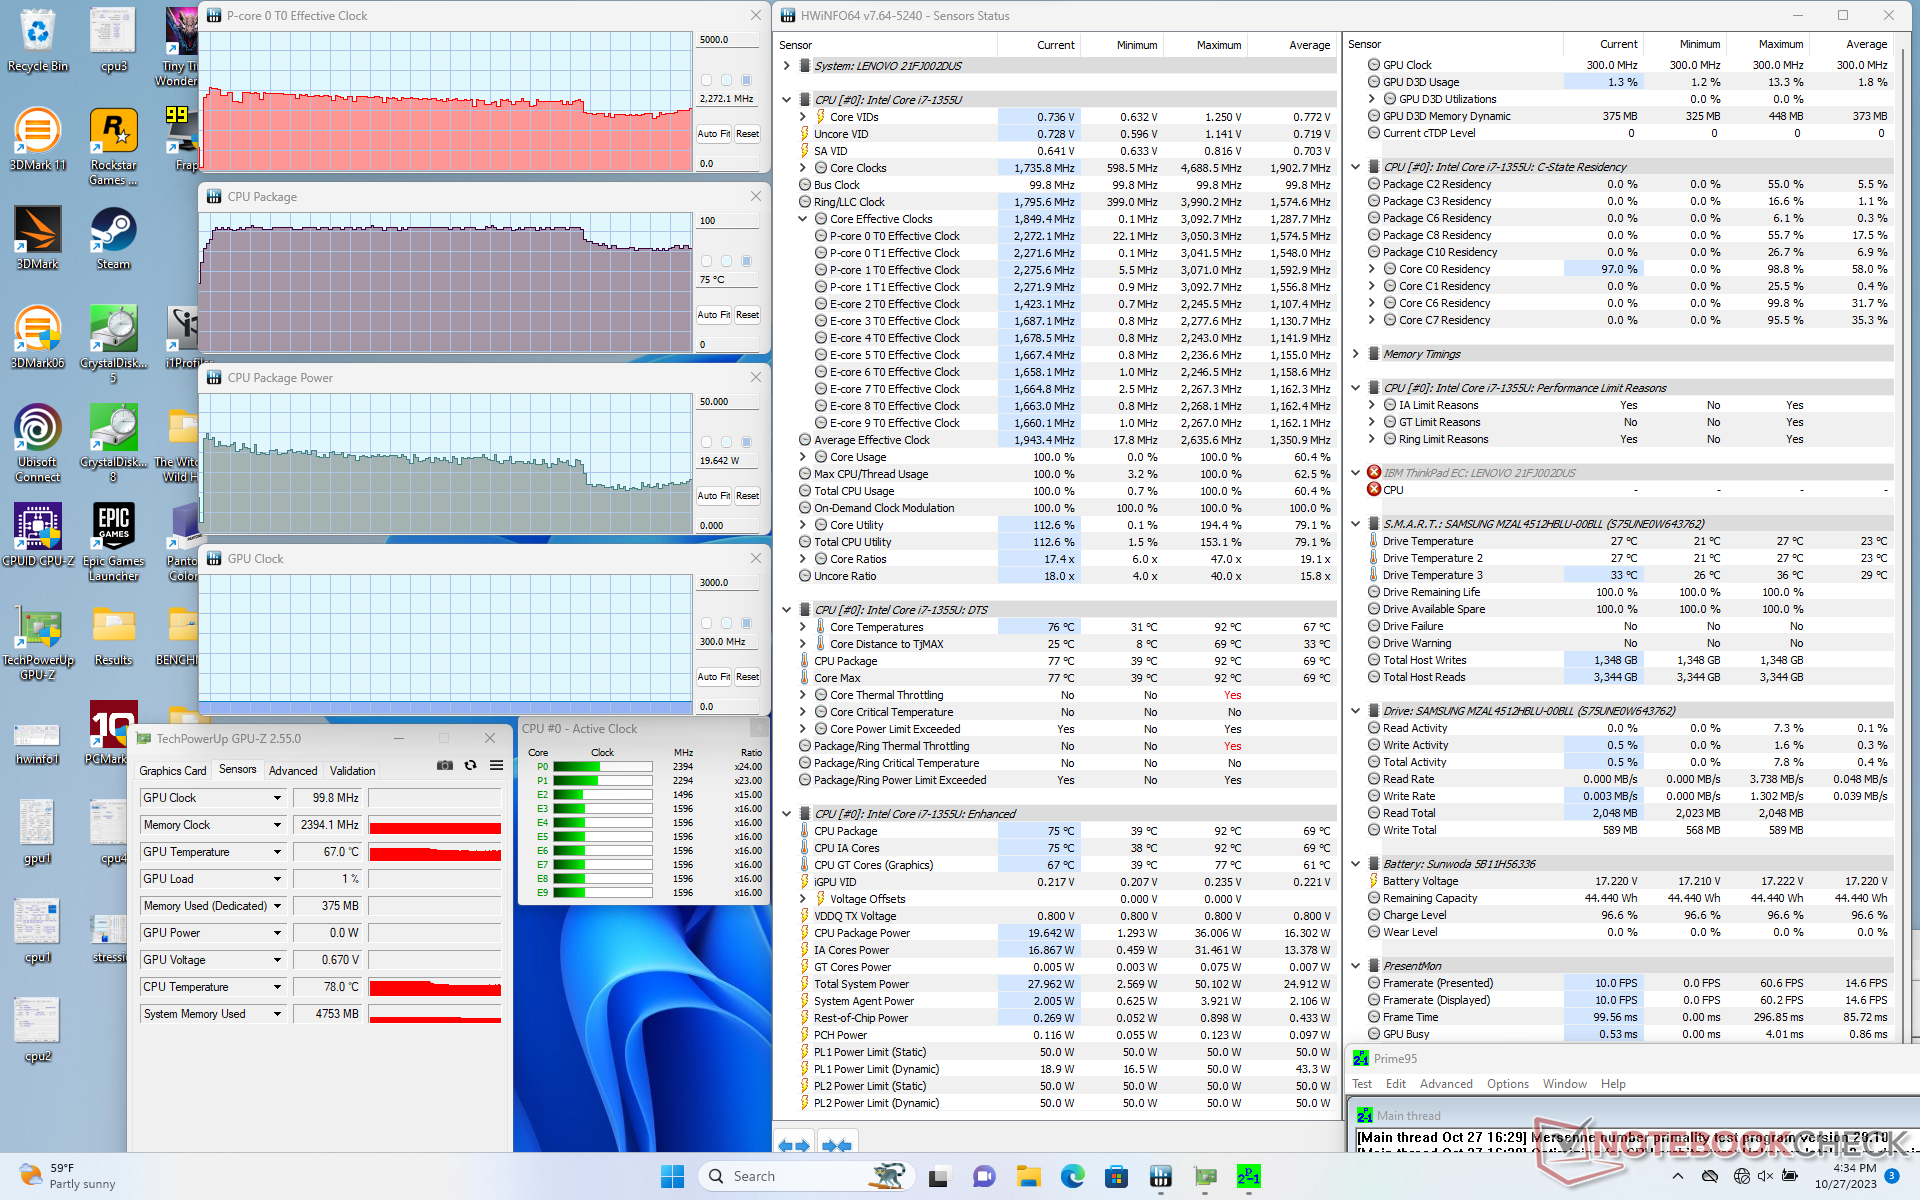
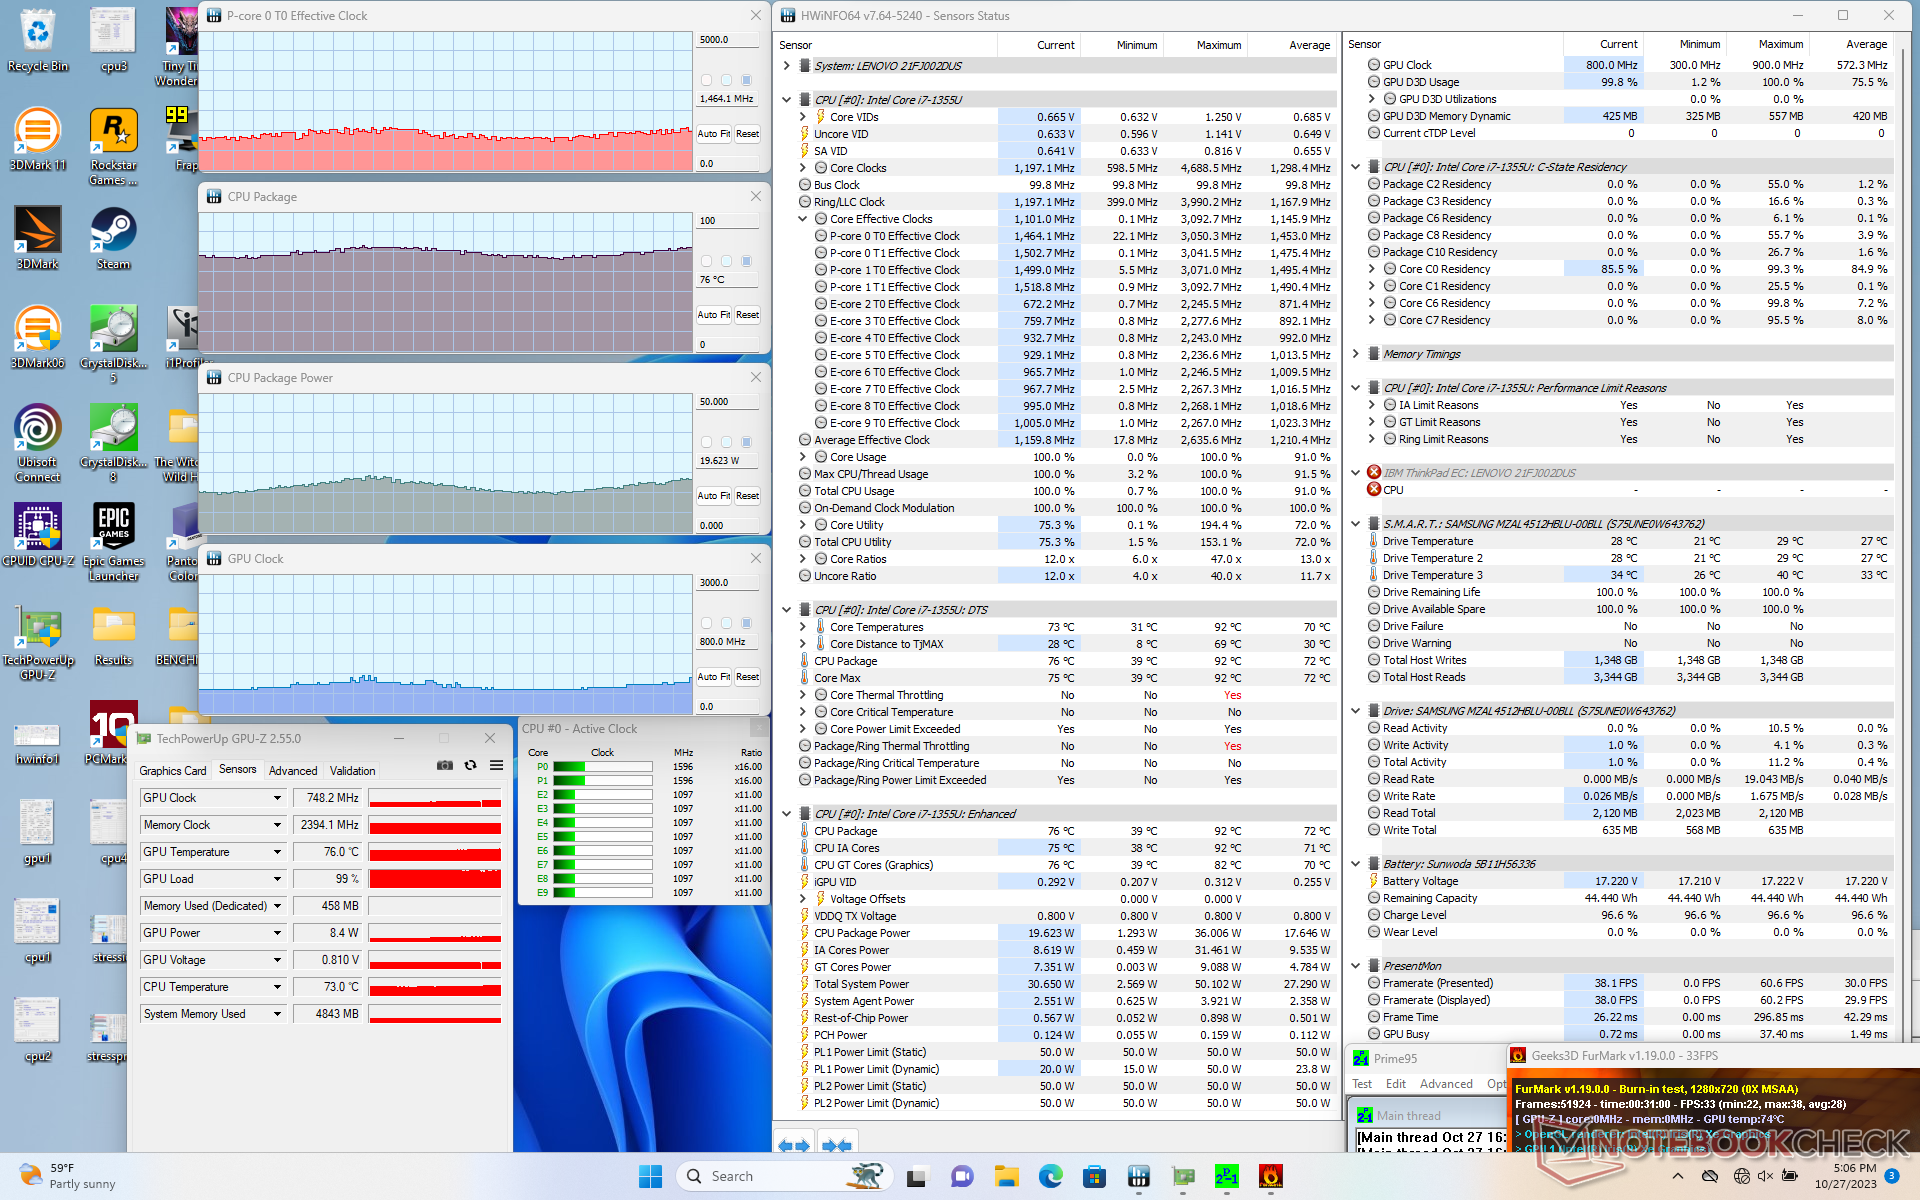
| Horloge du CPU (GHz) | Horloge du GPU (MHz) | Température moyenne du CPU (°C) | |
| Système au repos | -- | -- | 36 |
| Prime95 Stress | 2.2 | -- | 75 |
| Prime95 + FurMark Stress | 1.0 - 1.5 | 550 - 850 | 68 - 79 |
| Witcher 3 Stress | ~0.6 | 950 - 1150 | 75 |
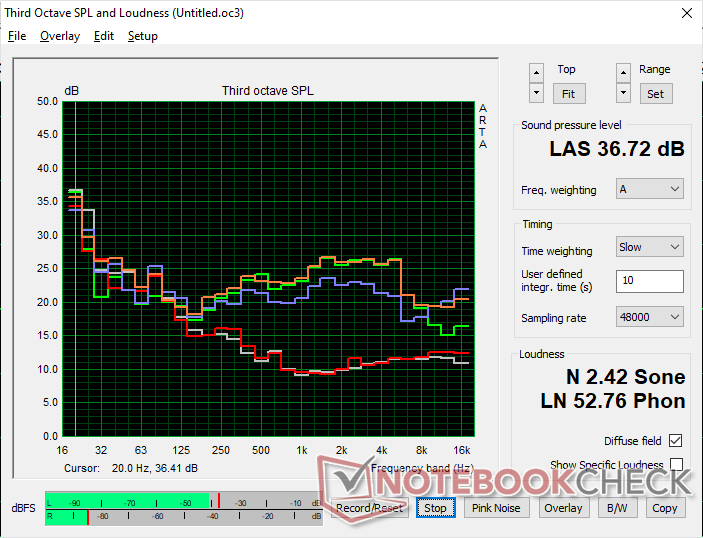
Intervenants
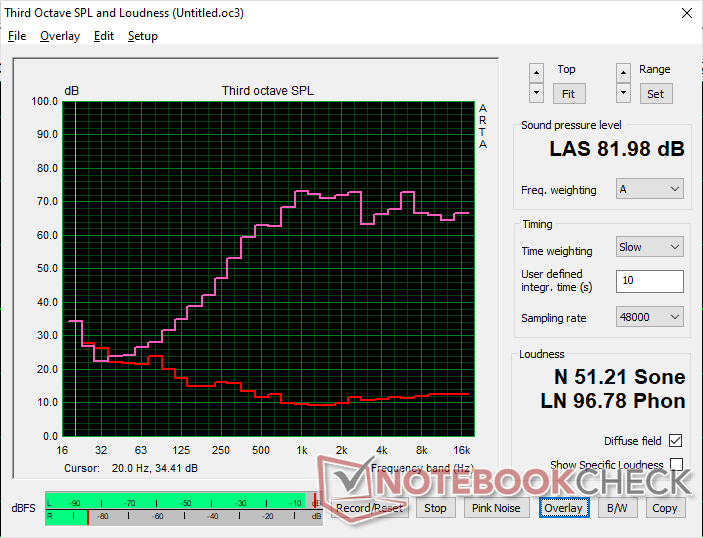
Lenovo ThinkPad L13 Yoga G4 i7-1355U analyse audio
(+) | les haut-parleurs peuvent jouer relativement fort (82# dB)
Basses 100 - 315 Hz
(-) | presque aucune basse - en moyenne 24.7% plus bas que la médiane
(±) | la linéarité des basses est moyenne (7.7% delta à la fréquence précédente)
Médiums 400 - 2000 Hz
(+) | médiane équilibrée - seulement 4.9% de la médiane
(+) | les médiums sont linéaires (5.4% delta à la fréquence précédente)
Aiguës 2 - 16 kHz
(+) | des sommets équilibrés - à seulement 2.7% de la médiane
(±) | la linéarité des aigus est moyenne (7% delta à la fréquence précédente)
Globalement 100 - 16 000 Hz
(±) | la linéarité du son global est moyenne (17.7% de différence avec la médiane)
Par rapport à la même classe
» 35% de tous les appareils testés de cette catégorie étaient meilleurs, 10% similaires, 56% pires
» Le meilleur avait un delta de 6%, la moyenne était de 20%, le pire était de 57%.
Par rapport à tous les appareils testés
» 35% de tous les appareils testés étaient meilleurs, 8% similaires, 57% pires
» Le meilleur avait un delta de 4%, la moyenne était de 24%, le pire était de 134%.
Apple MacBook Pro 16 2021 M1 Pro analyse audio
(+) | les haut-parleurs peuvent jouer relativement fort (84.7# dB)
Basses 100 - 315 Hz
(+) | bonne basse - seulement 3.8% loin de la médiane
(+) | les basses sont linéaires (5.2% delta à la fréquence précédente)
Médiums 400 - 2000 Hz
(+) | médiane équilibrée - seulement 1.3% de la médiane
(+) | les médiums sont linéaires (2.1% delta à la fréquence précédente)
Aiguës 2 - 16 kHz
(+) | des sommets équilibrés - à seulement 1.9% de la médiane
(+) | les aigus sont linéaires (2.7% delta à la fréquence précédente)
Globalement 100 - 16 000 Hz
(+) | le son global est linéaire (4.6% différence à la médiane)
Par rapport à la même classe
» 0% de tous les appareils testés de cette catégorie étaient meilleurs, 0% similaires, 100% pires
» Le meilleur avait un delta de 5%, la moyenne était de 17%, le pire était de 45%.
Par rapport à tous les appareils testés
» 0% de tous les appareils testés étaient meilleurs, 0% similaires, 100% pires
» Le meilleur avait un delta de 4%, la moyenne était de 24%, le pire était de 134%.
Gestion de l'énergie
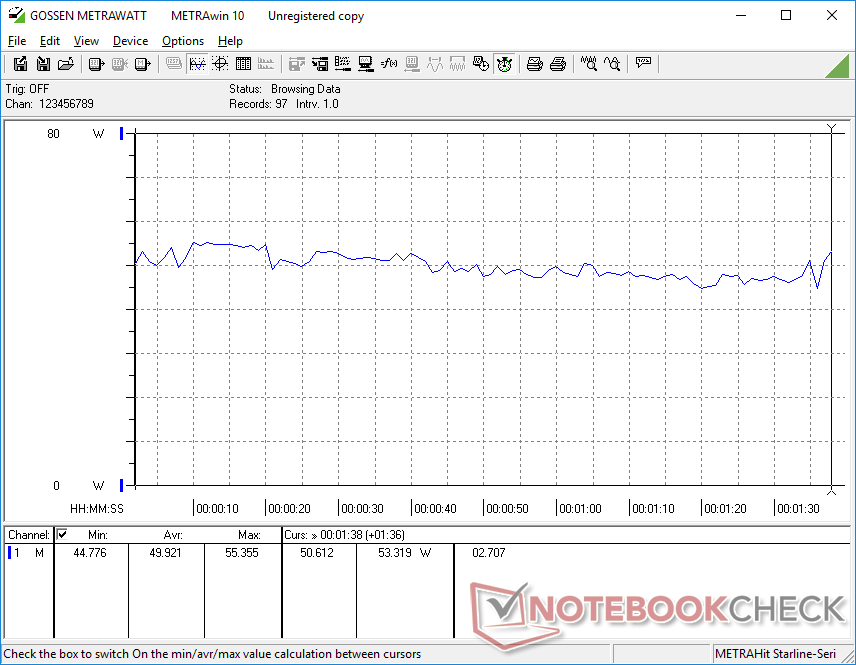
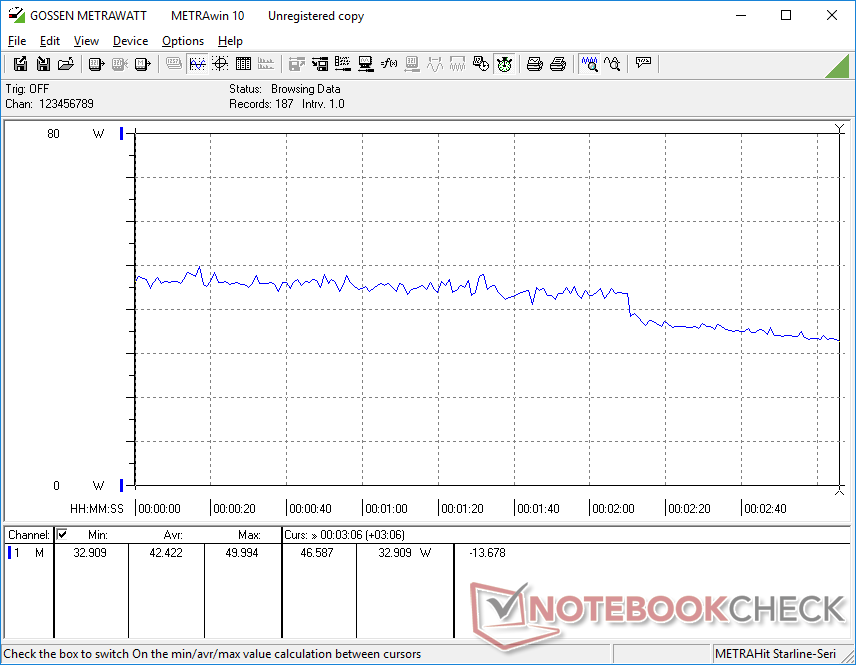
Consommation électrique
La consommation d'énergie est plus élevée sur la configuration Intel que sur la configuration AMD, en particulier lorsque les charges sont plus élevées. Ces différences pourraient être dues à la fois au potentiel Turbo Boost initial plus élevé du CPU Core i7 par rapport au Ryzen 5 et aux performances graphiques intégrées plus rapides par rapport à la Radeon RX Vega 7. Exécution Witcher 3par exemple, consommerait environ 30 % d'énergie en plus sur notre unité Intel.
| Éteint/en veille | |
| Au repos | |
| Fortement sollicité |
|
Légende:
min: | |
| Lenovo ThinkPad L13 Yoga G4 i7-1355U i7-1355U, Iris Xe G7 96EUs, Samsung PM9B1 512GB MZAL4512HBLU, IPS, 1920x1200, 13.3" | Lenovo ThinkPad L13 Yoga G4 21FSS00100 R5 7530U, Vega 7, Kioxia BG5 KBG5AZNT512G, IPS LED, 1920x1200, 13.3" | HP Elite Dragonfly Folio 13.5 G3 i7-1265U, Iris Xe G7 96EUs, Samsung PM9A1 MZVL2512HCJQ, IPS, 1920x1280, 13.5" | Dell Latitude 9330 i7-1260U, Iris Xe G7 96EUs, , IPS, 2560x1600, 13.3" | MSI Summit E13 Flip Evo A11MT i7-1185G7, Iris Xe G7 96EUs, Phison 1TB SM2801T24GKBB4S-E162, IPS, 1920x1200, 13.4" | Framework Laptop 13.5 Ryzen 7 7840U R7 7840U, Radeon 780M, WD PC SN740 512GB SDDPNQD-512G, IPS, 2256x1504, 13.5" | |
|---|---|---|---|---|---|---|
| Power Consumption | 24% | 16% | 16% | -2% | 11% | |
| Idle Minimum * (Watt) | 5.5 | 4.4 20% | 3.4 38% | 4.7 15% | 4.8 13% | 4 27% |
| Idle Average * (Watt) | 8.3 | 7.2 13% | 4.9 41% | 8.2 1% | 8.4 -1% | 6.5 22% |
| Idle Maximum * (Watt) | 9.1 | 8.3 9% | 9.3 -2% | 8.4 8% | 8.6 5% | 6.8 25% |
| Load Average * (Watt) | 49.9 | 21.6 57% | 41.9 16% | 36.8 26% | 47.1 6% | 48 4% |
| Witcher 3 ultra * (Watt) | 42.4 | 32.1 24% | 36.4 14% | 30.4 28% | 51.6 -22% | 52.3 -23% |
| Load Maximum * (Watt) | 60 | 49.3 18% | 67.5 -13% | 49.9 17% | 65.9 -10% | 55.2 8% |
* ... Moindre est la valeur, meilleures sont les performances
Power Consumption Witcher 3 / Stresstest
Power Consumption external Monitor
Autonomie de la batterie
La consommation d'énergie généralement plus élevée mentionnée ci-dessus se répercute sur l'autonomie de la batterie. La navigation web sur notre unité Intel dure un peu plus de 6 heures, contre 7,5 heures sur l'unité AMD, les deux étant sur le même profil d'alimentation équilibré. Le chargement est également plus lent que prévu, environ 2 heures, même lorsque la fonction Lenovo Rapid Charge est activée.
| Lenovo ThinkPad L13 Yoga G4 i7-1355U i7-1355U, Iris Xe G7 96EUs, 46 Wh | Lenovo ThinkPad L13 Yoga G4 21FSS00100 R5 7530U, Vega 7, 46 Wh | HP Elite Dragonfly Folio 13.5 G3 i7-1265U, Iris Xe G7 96EUs, 53 Wh | Dell Latitude 9330 i7-1260U, Iris Xe G7 96EUs, 50 Wh | MSI Summit E13 Flip Evo A11MT i7-1185G7, Iris Xe G7 96EUs, 70 Wh | Framework Laptop 13.5 Ryzen 7 7840U R7 7840U, Radeon 780M, 61 Wh | |
|---|---|---|---|---|---|---|
| Autonomie de la batterie | 24% | 52% | 52% | 81% | 95% | |
| WiFi v1.3 (h) | 6.2 | 7.7 24% | 9.4 52% | 9.4 52% | 11.2 81% | 12.1 95% |
| Load (h) | 1.5 | 2.6 | 2.3 | 1.8 | ||
| Reader / Idle (h) | 27.3 | 15.4 | 21.1 |
Points positifs
Points négatifs
Verdict - Échange de l'autonomie de la batterie et des ventilateurs silencieux contre Thunderbolt et des graphiques plus rapides
La découverte la plus surprenante concernant la version Intel du ThinkPad L13 Yoga G4 est sans doute l'étranglement des performances du processeur, plus important que prévu. Alors que nous ne nous attendons pas à ce qu'un processeur Core U maintienne une fréquence d'horloge Turbo Boost élevée pendant de longues périodes, le Core i7 de ce modèle Lenovo en particulier s'essouffle davantage que sur la plupart des autres ordinateurs portables dotés du même processeur. Ce déficit de performance atténue un avantage clé d'Intel par rapport à AMD, d'autant plus que le problème d'étranglement n'est pas aussi grave sur la configuration AMD.
Un autre aspect qui mérite d'être mentionné est la consommation d'énergie plus élevée de la version Intel, qui se traduit par des durées de fonctionnement plus courtes de 1 à 2 heures. Les utilisateurs qui accordent de l'importance à l'autonomie de la batterie peuvent donc choisir la version AMD du ThinkPad L13 Yoga G4.
À moins que vous n'ayez vraiment besoin des performances graphiques supplémentaires et du support Thunderbolt d'Intel, la version AMD du ThinkPad L13 Yoga G4 devrait suffire à la majorité des utilisateurs intéressés.
Les principales raisons de choisir la version Intel du modèle plutôt qu'AMD sont vPro (au lieu d'AMD PRO), la prise en charge de Thunderbolt, les performances graphiques plus rapides et les performances du processeur à un seul thread. Sinon, les UGS AMD ont l'avantage en ce qui concerne les performances du CPU multithread, l'autonomie de la batterie et le prix.
Prix et disponibilité
Lenovo n'a pas encore livré le ThinkPad L13 Yoga Gen 4 au moment de la publication. Cependant, CDW livre actuellement notre configuration Core i7 pour $1419 USD.
Lenovo ThinkPad L13 Yoga G4 i7-1355U
- 10/30/2023 v7 (old)
Allen Ngo
Transparency
La sélection des appareils à examiner est effectuée par notre équipe éditoriale. L'échantillon de test a été prêté à l'auteur par le fabricant ou le détaillant pour les besoins de cet examen. Le prêteur n'a pas eu d'influence sur cette évaluation et le fabricant n'a pas reçu de copie de cette évaluation avant sa publication. Il n'y avait aucune obligation de publier cet article. En tant que média indépendant, Notebookcheck n'est pas soumis à l'autorité des fabricants, des détaillants ou des éditeurs.
Voici comment Notebookcheck teste
Chaque année, Notebookcheck examine de manière indépendante des centaines d'ordinateurs portables et de smartphones en utilisant des procédures standardisées afin de garantir que tous les résultats sont comparables. Nous avons continuellement développé nos méthodes de test depuis environ 20 ans et avons établi des normes industrielles dans le processus. Dans nos laboratoires de test, des équipements de mesure de haute qualité sont utilisés par des techniciens et des rédacteurs expérimentés. Ces tests impliquent un processus de validation en plusieurs étapes. Notre système d'évaluation complexe repose sur des centaines de mesures et de points de référence bien fondés, ce qui garantit l'objectivité.Price comparison

