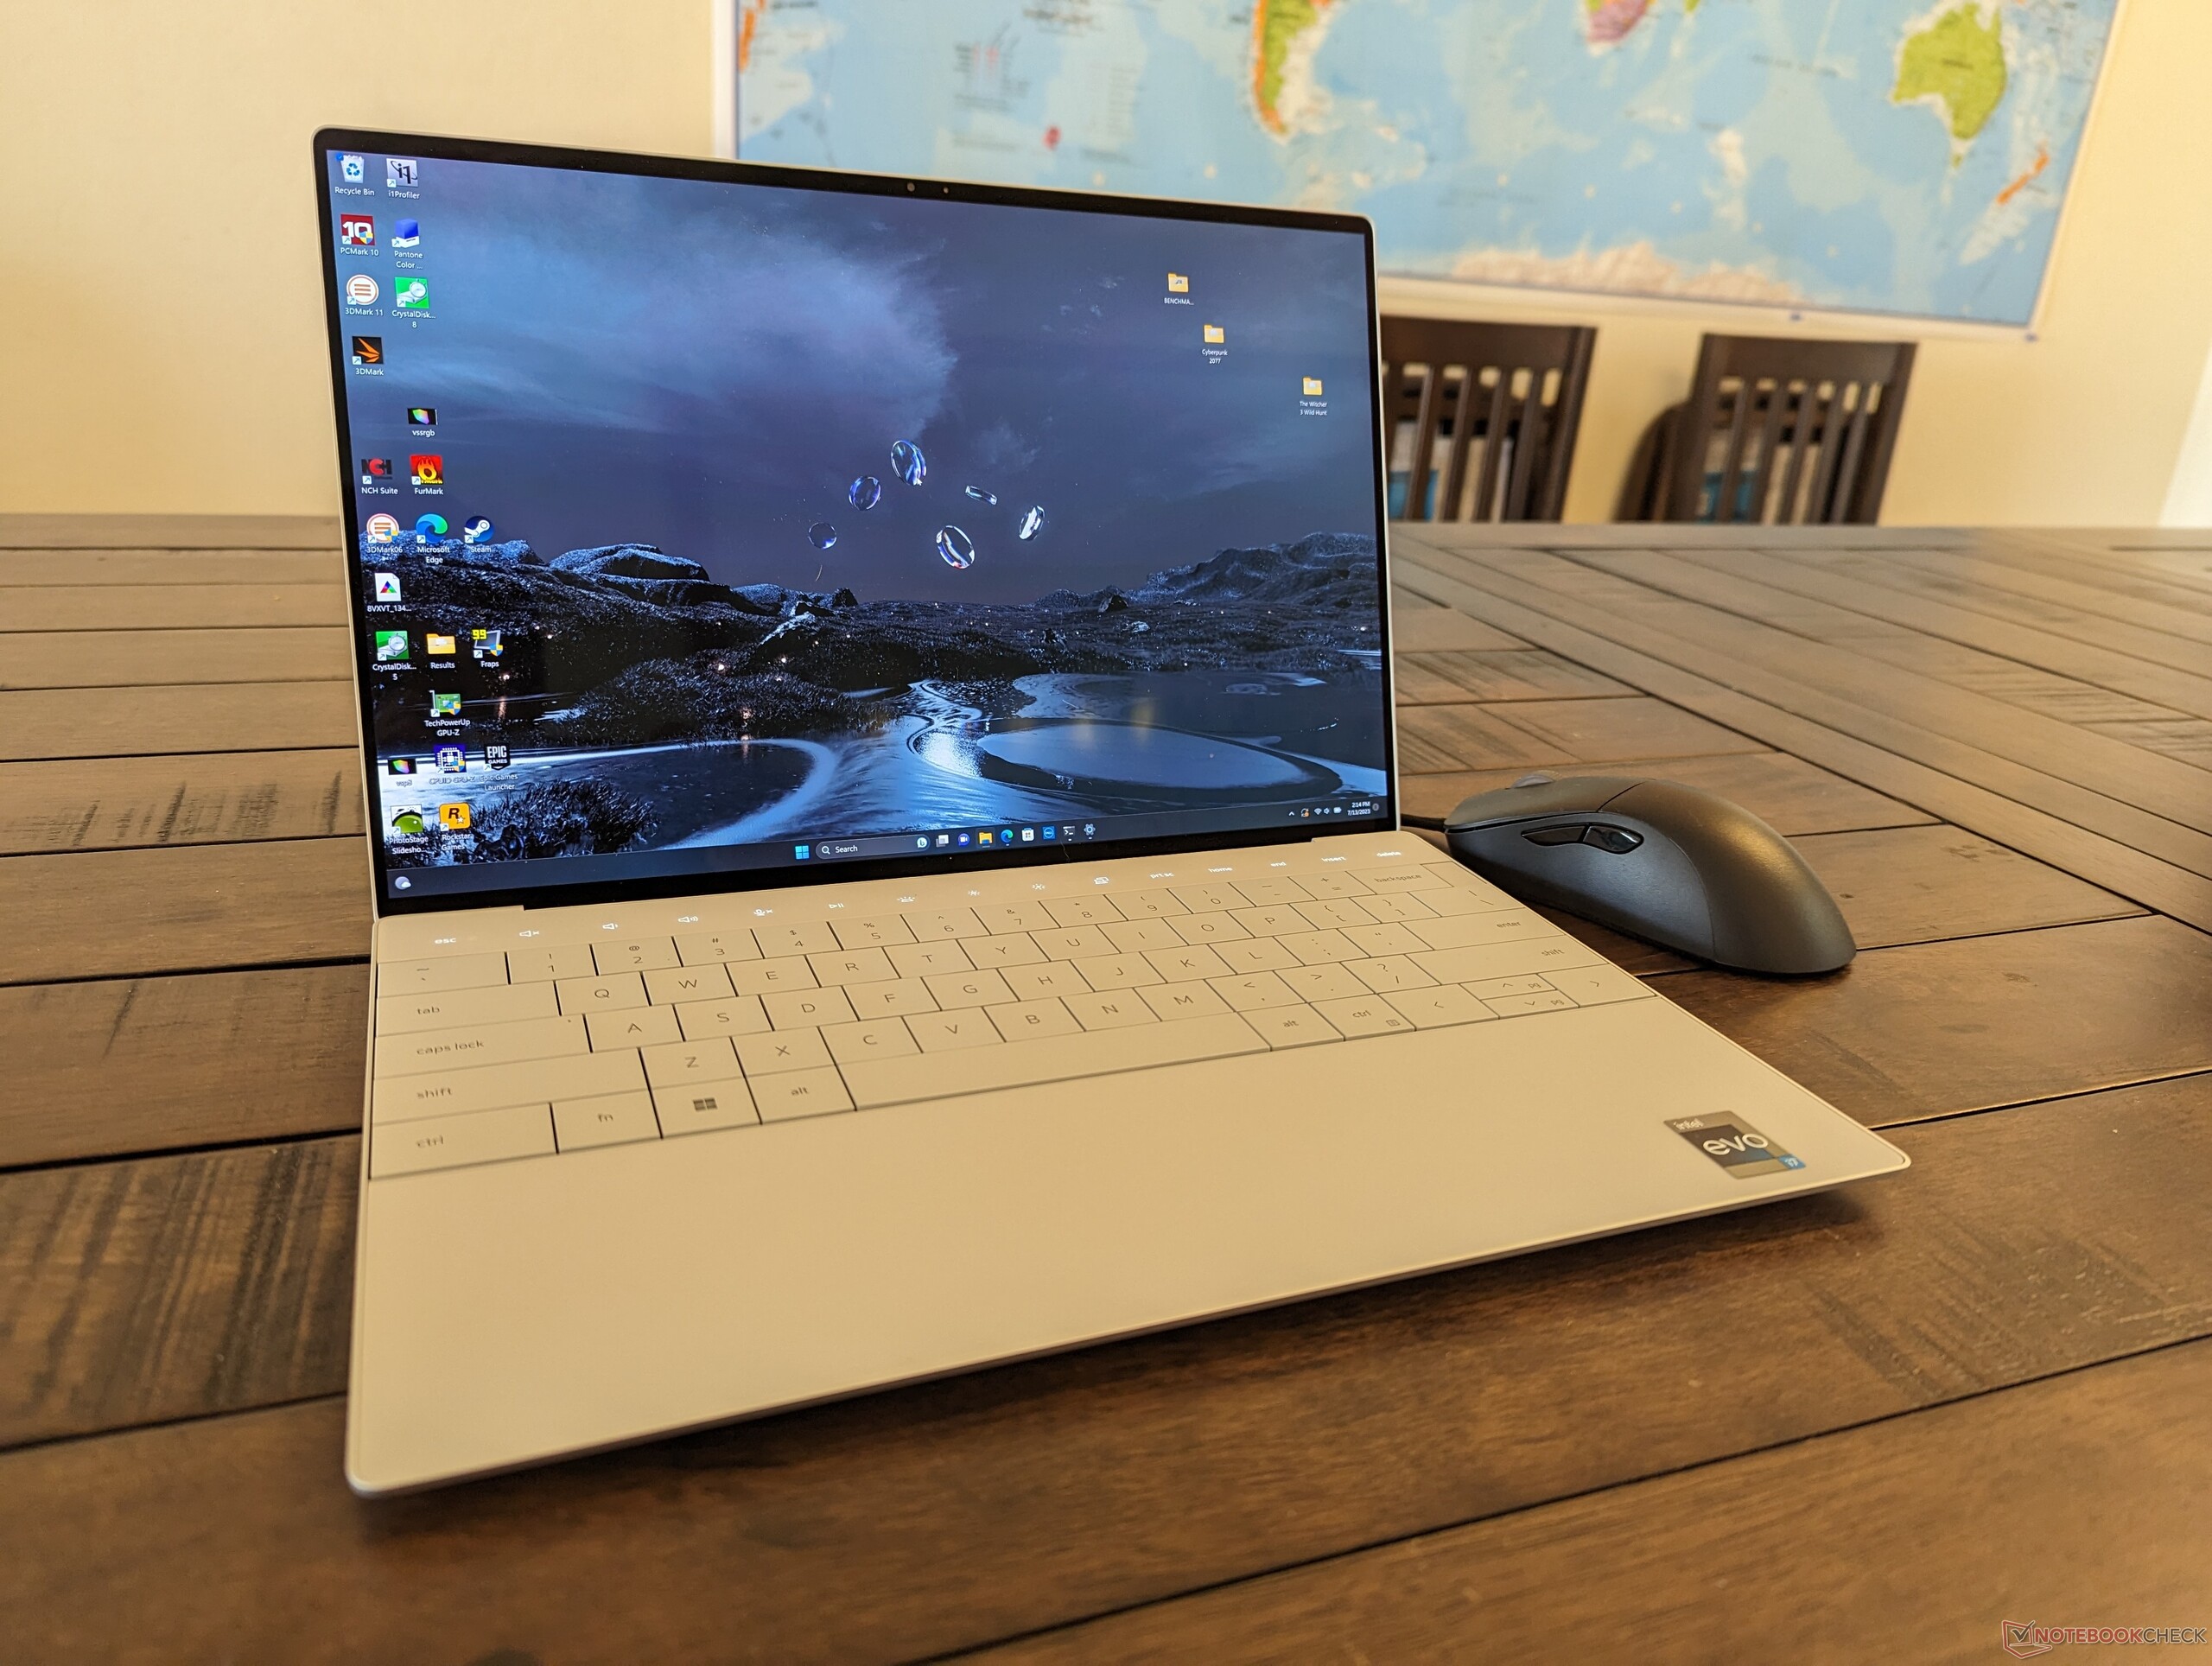
Test du Dell XPS 13 Plus 9320 Core i7-1360P : à peine mieux que l'année passée

Le XPS 13 Plus 9320 de 2023 est la version actualisée du modèle original de 2022. Il utilise le même design de châssis, mais avec de nouvelles options de CPU Raptor Lake de 13ème génération pour remplacer les options Alder Lake de 12ème génération. Il n'y a pas d'autres changements extérieurs et nous vous recommandons de consulter notre avis sur le modèle 2022 pour en savoir plus sur les caractéristiques physiques du XPS 13 Plus.
Notre configuration est un modèle de milieu de gamme avec un écran tactile OLED de 13,4 pouces 3.5K (3456 x 2160) et 16 Go de RAM rapide LPDDR5 6000 MHz pour environ 1300 USD. D'autres modèles peuvent être livrés avec des écrans 1200p ou 2400p, mais tous sont actuellement livrés avec le même processeur Core i7-1360P.
Parmi les alternatives au XPS 13 Plus, on trouve d'autres subnotebooks phares de 13 pouces comme leFramework Laptop 13.5,HP Spectre x360 13.5ou le Lenovo ThinkPad X13 G3.
Plus d'avis sur Dell :
Comparaison avec les concurrents potentiels
Note | Date | Modèle | Poids | Épaisseur | Taille | Résolution | Prix |
|---|---|---|---|---|---|---|---|
| 87.4 % v7 (old) | 07/23 | Dell XPS 13 Plus 9320 Core i7-1360P i7-1360P, Iris Xe G7 96EUs | 1.3 kg | 15.3 mm | 13.40" | 3456x2160 | |
| 87.3 % v7 (old) | 09/22 | Dell XPS 13 Plus 9320 i7-1280P OLED i7-1280P, Iris Xe G7 96EUs | 1.3 kg | 15.28 mm | 13.40" | 3456x2160 | |
| 85.9 % v7 (old) | 11/19 | Dell XPS 13 7390 Core i7-10710U i7-10710U, UHD Graphics 620 | 1.2 kg | 11.6 mm | 13.30" | 3840x2160 | |
| 86.2 % v7 (old) | 05/23 | Framework Laptop 13.5 13th Gen Intel i7-1370P, Iris Xe G7 96EUs | 1.3 kg | 15.85 mm | 13.50" | 2256x1504 | |
| 89.1 % v7 (old) | 06/23 | Lenovo ThinkPad X13 Yoga G3 21AW003UGE i7-1265U, Iris Xe G7 96EUs | 1.2 kg | 15.9 mm | 13.30" | 2560x1600 | |
| 90.3 % v7 (old) | 08/22 | HP Spectre x360 13.5 14t-ef000 i7-1255U, Iris Xe G7 96EUs | 1.4 kg | 17 mm | 13.50" | 3000x2000 |
Cas
Communication
| Networking | |
| iperf3 transmit AX12 | |
| Dell XPS 13 7390 Core i7-10710U | |
| iperf3 receive AX12 | |
| Dell XPS 13 7390 Core i7-10710U | |
| iperf3 transmit AXE11000 | |
| Dell XPS 13 Plus 9320 Core i7-1360P | |
| Framework Laptop 13.5 13th Gen Intel | |
| Lenovo ThinkPad X13 Yoga G3 21AW003UGE | |
| iperf3 receive AXE11000 | |
| Lenovo ThinkPad X13 Yoga G3 21AW003UGE | |
| Dell XPS 13 Plus 9320 Core i7-1360P | |
| Framework Laptop 13.5 13th Gen Intel | |
| iperf3 transmit AXE11000 6GHz | |
| HP Spectre x360 13.5 14t-ef000 | |
| Framework Laptop 13.5 13th Gen Intel | |
| Dell XPS 13 Plus 9320 Core i7-1360P | |
| iperf3 receive AXE11000 6GHz | |
| Framework Laptop 13.5 13th Gen Intel | |
| Dell XPS 13 Plus 9320 Core i7-1360P | |
| HP Spectre x360 13.5 14t-ef000 | |
Webcam
La webcam de 1 mégapixel n'a pas été modifiée, alors que certains modèles concurrents comme la HP Spectre ont déjà adopté des capteurs de 5 MP de meilleure qualité.


Maintenance
Affichage
Quatre options d'affichage sont disponibles :
- 1920 x 1200, 60 Hz, IPS, non tactile, mat, 500 nits
- 1920 x 1200, 60 Hz, IPS, tactile, mat, 500 nits
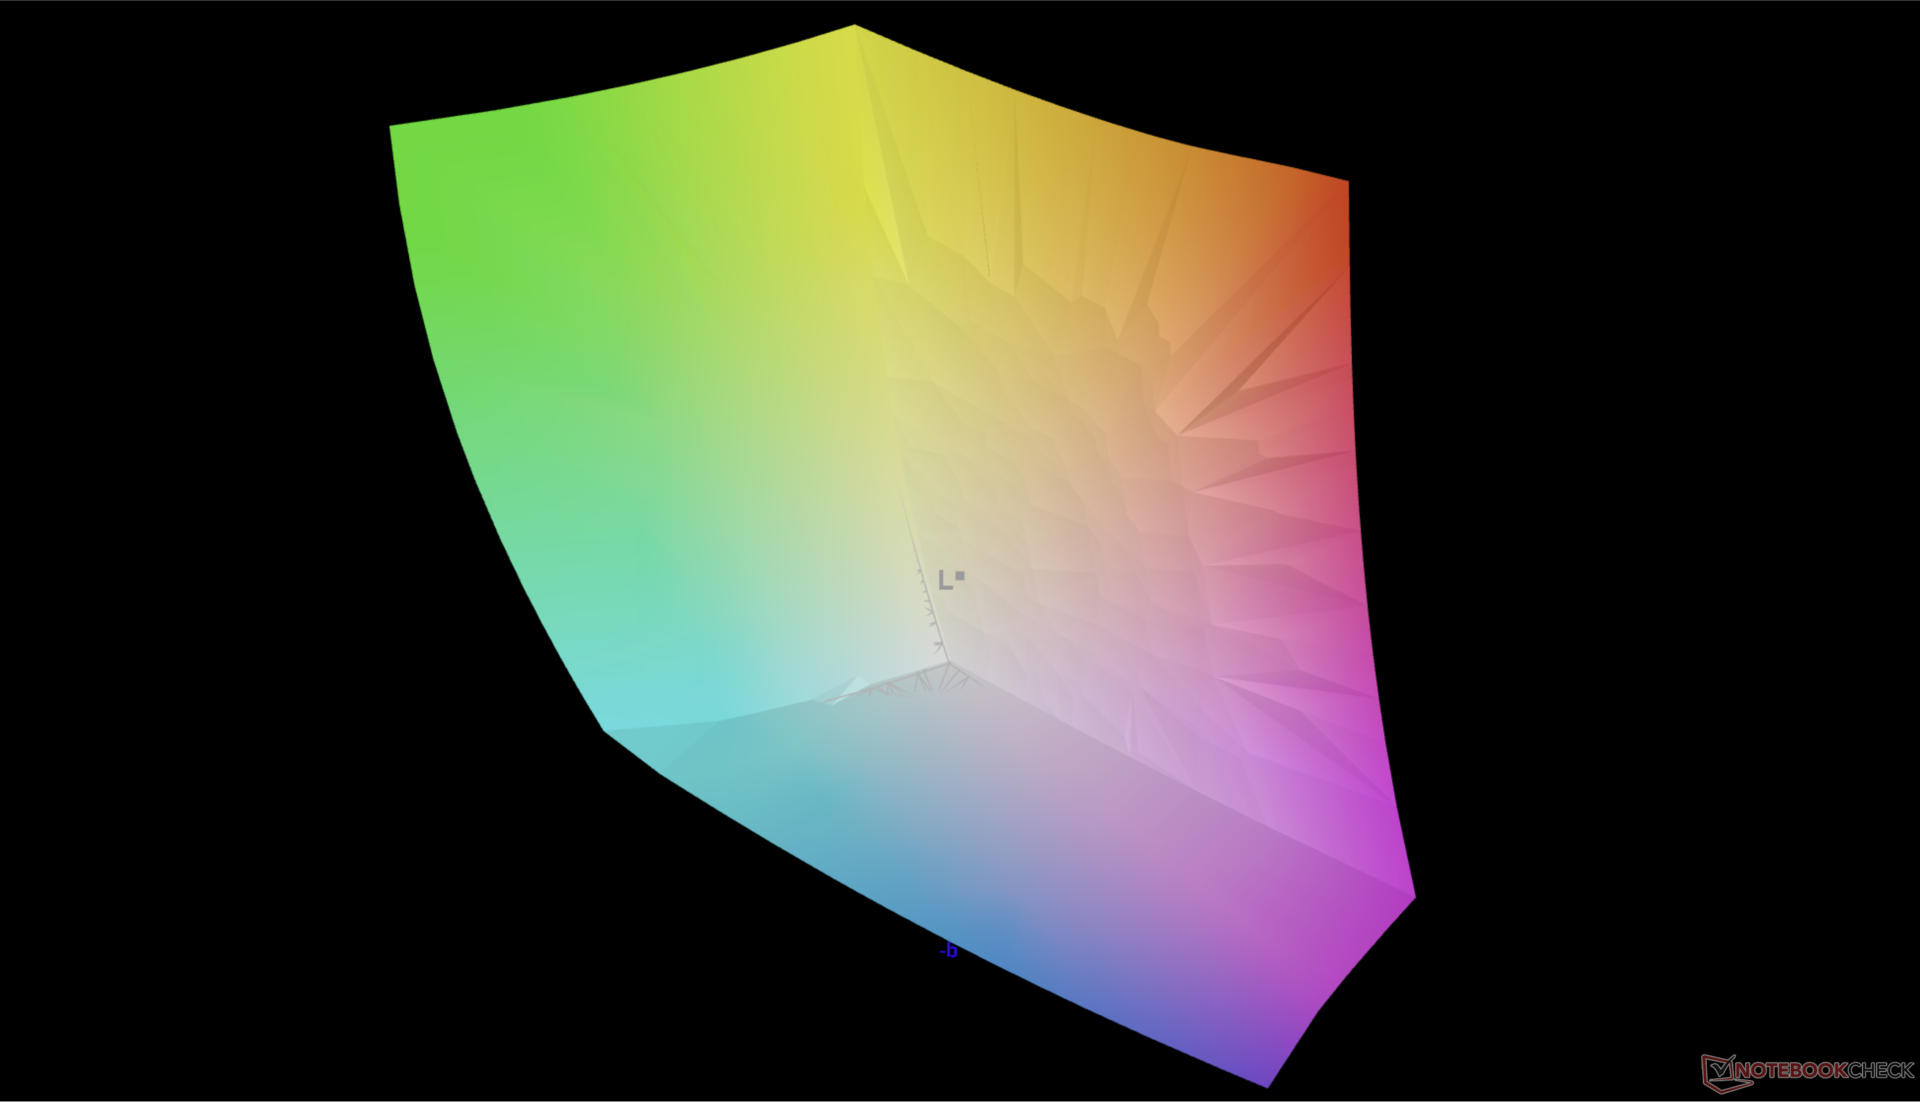
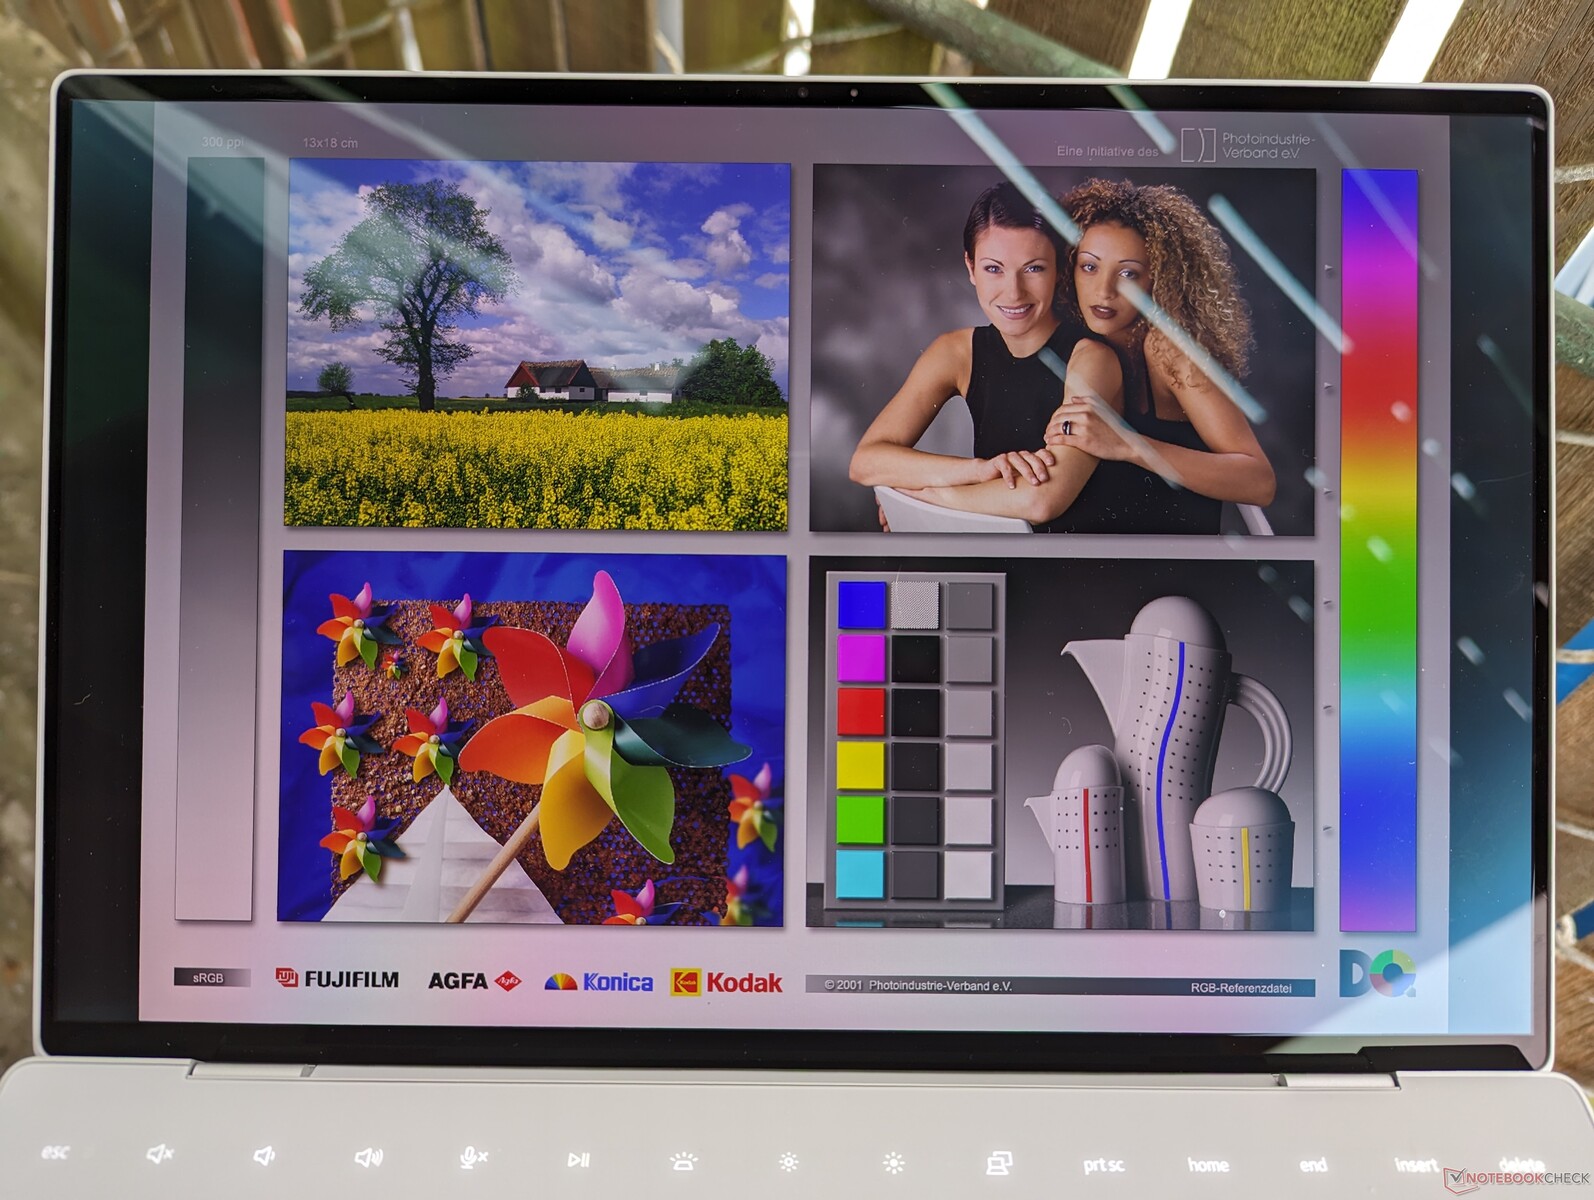
- 3456 x 2160, 60 Hz, OLED, tactile, brillant, 400 nits
- 3840 x 2400, 60 Hz, IPS, tactile, brillant, 500 nits
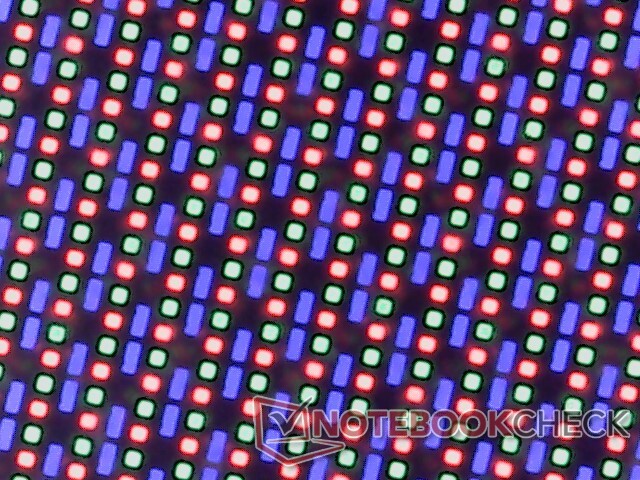
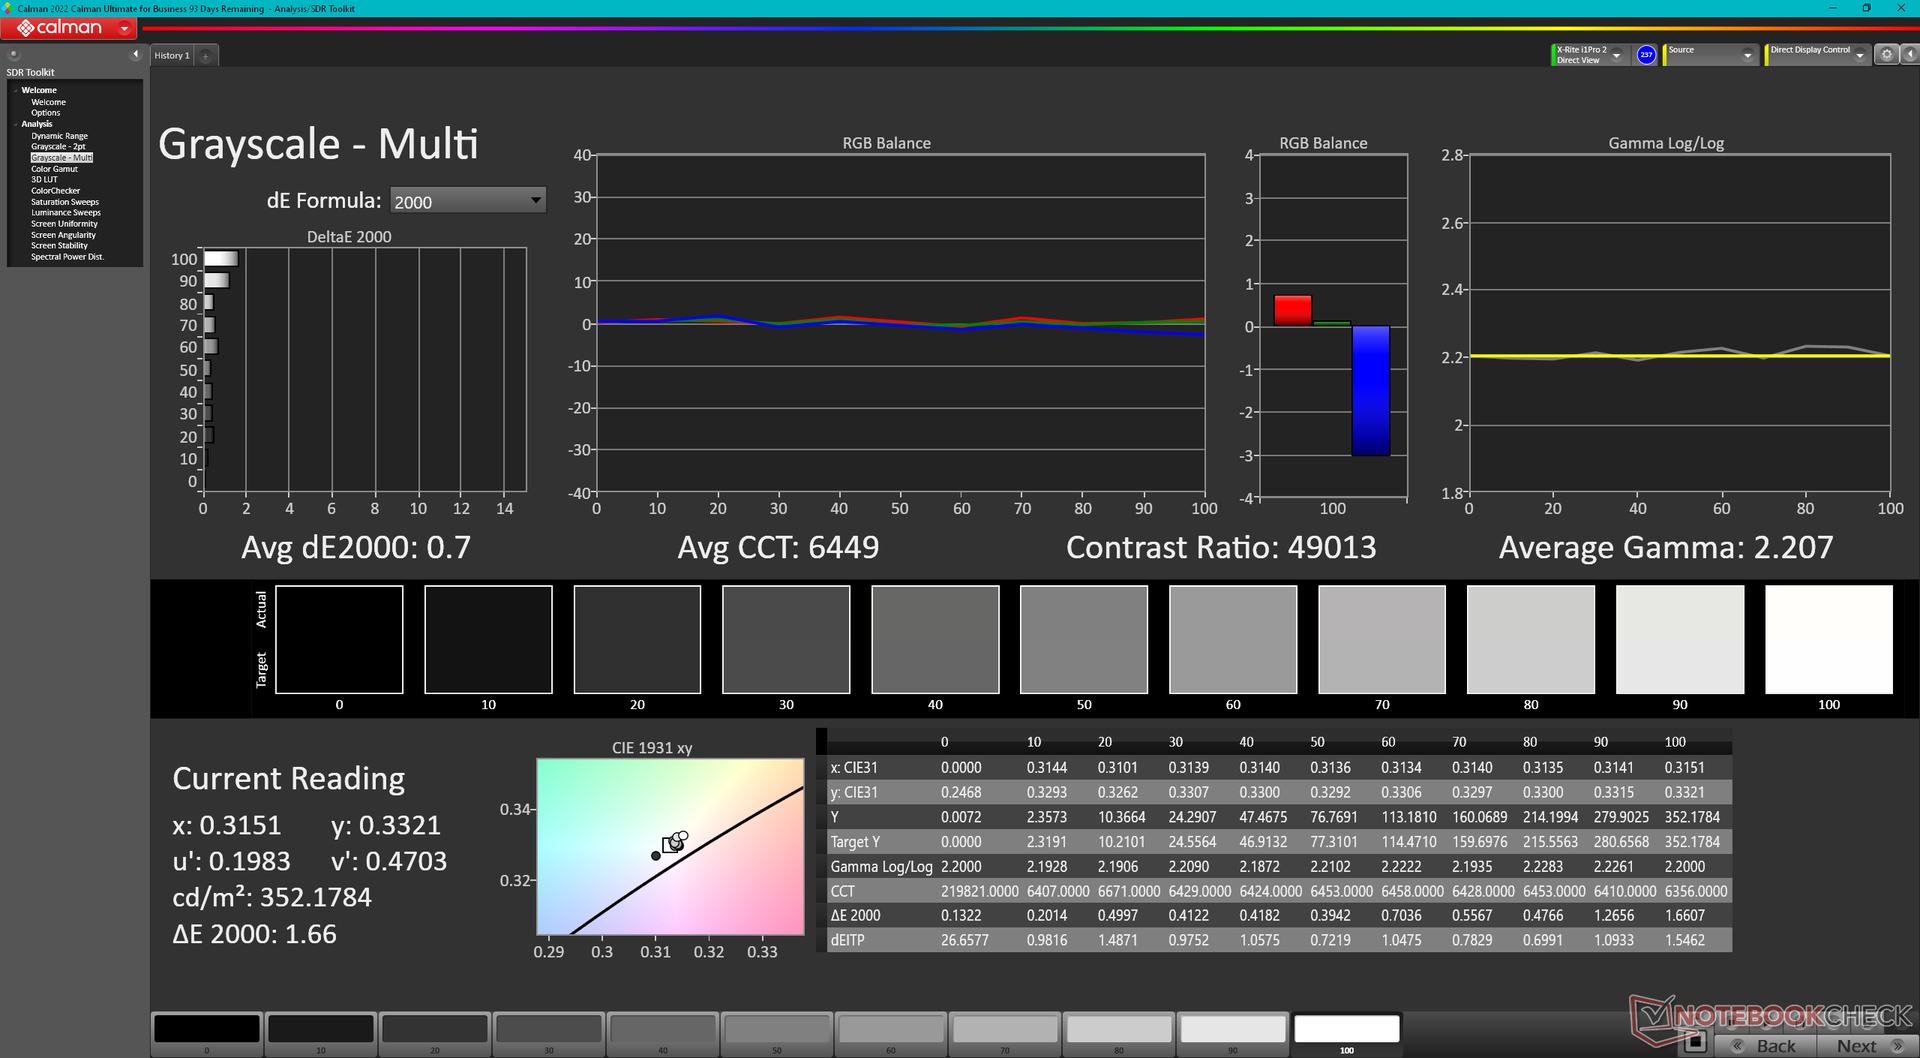
Notre configuration OLED utilise le même panneau Samsung 134XK04 que celui qui équipait sKU OLED de l'année dernière de l'année dernière et l'expérience visuelle reste donc identique. Les utilisateurs bénéficient d'une couverture sRGB de 99 % au minimum, quelle que soit l'option choisie, d'après notre expérience avec les trois modèles suivants les trois résolution résolution.

| |||||||||||||||||||||||||
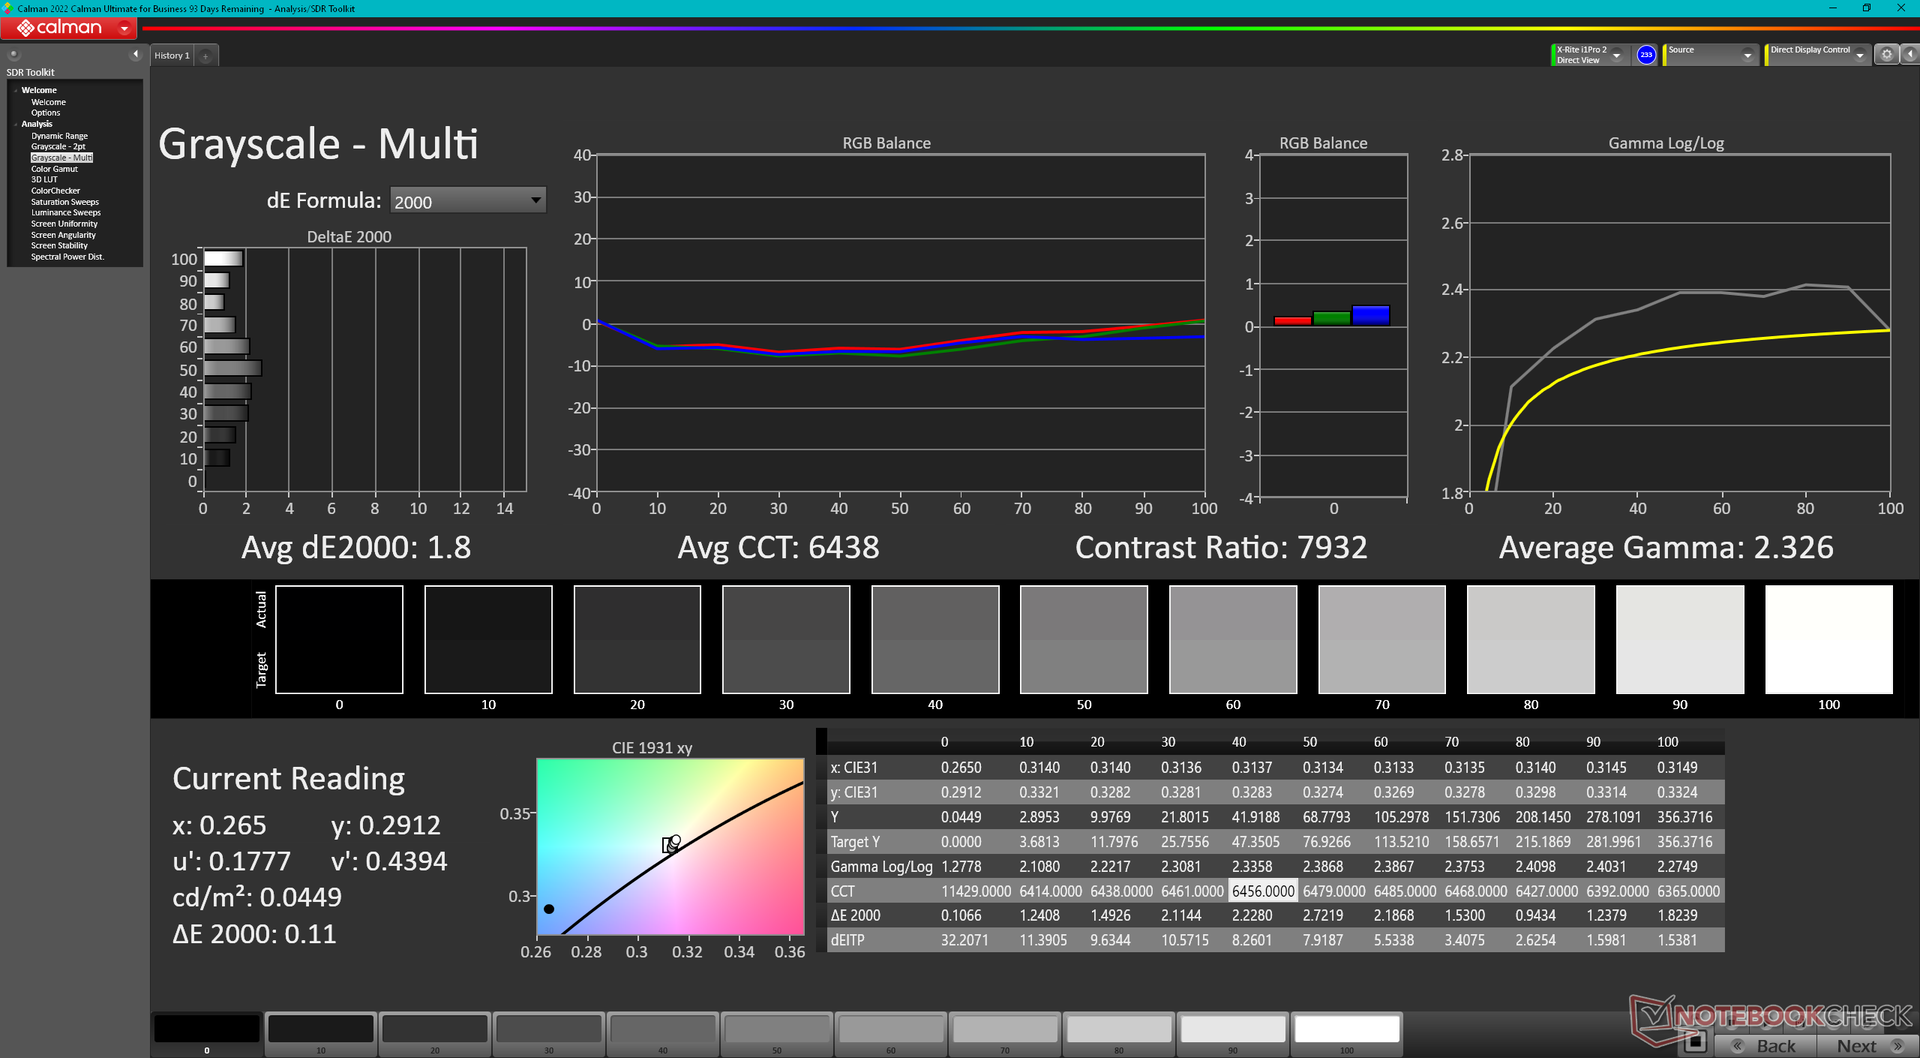
Homogénéité de la luminosité: 96 %
Valeur mesurée au centre, sur batterie: 361.7 cd/m²
Contraste: ∞:1 (Valeurs des noirs: 0 cd/m²)
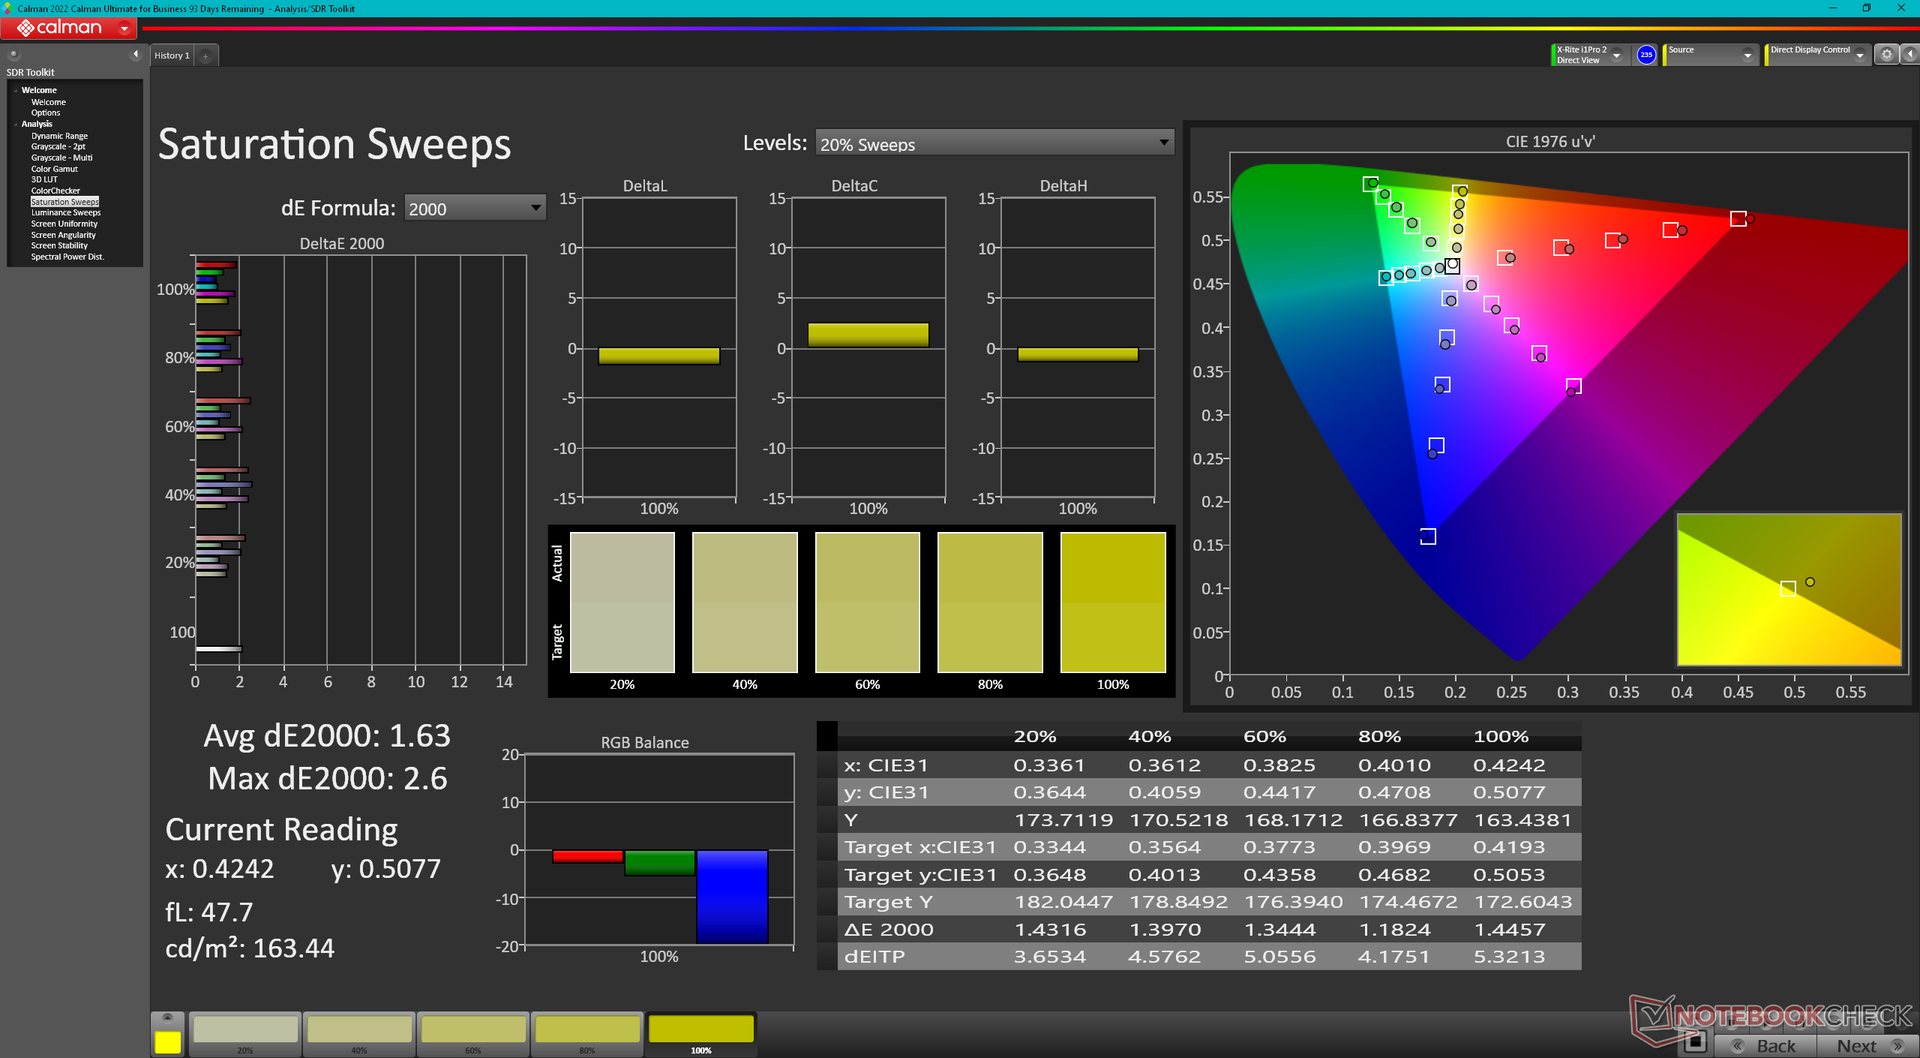
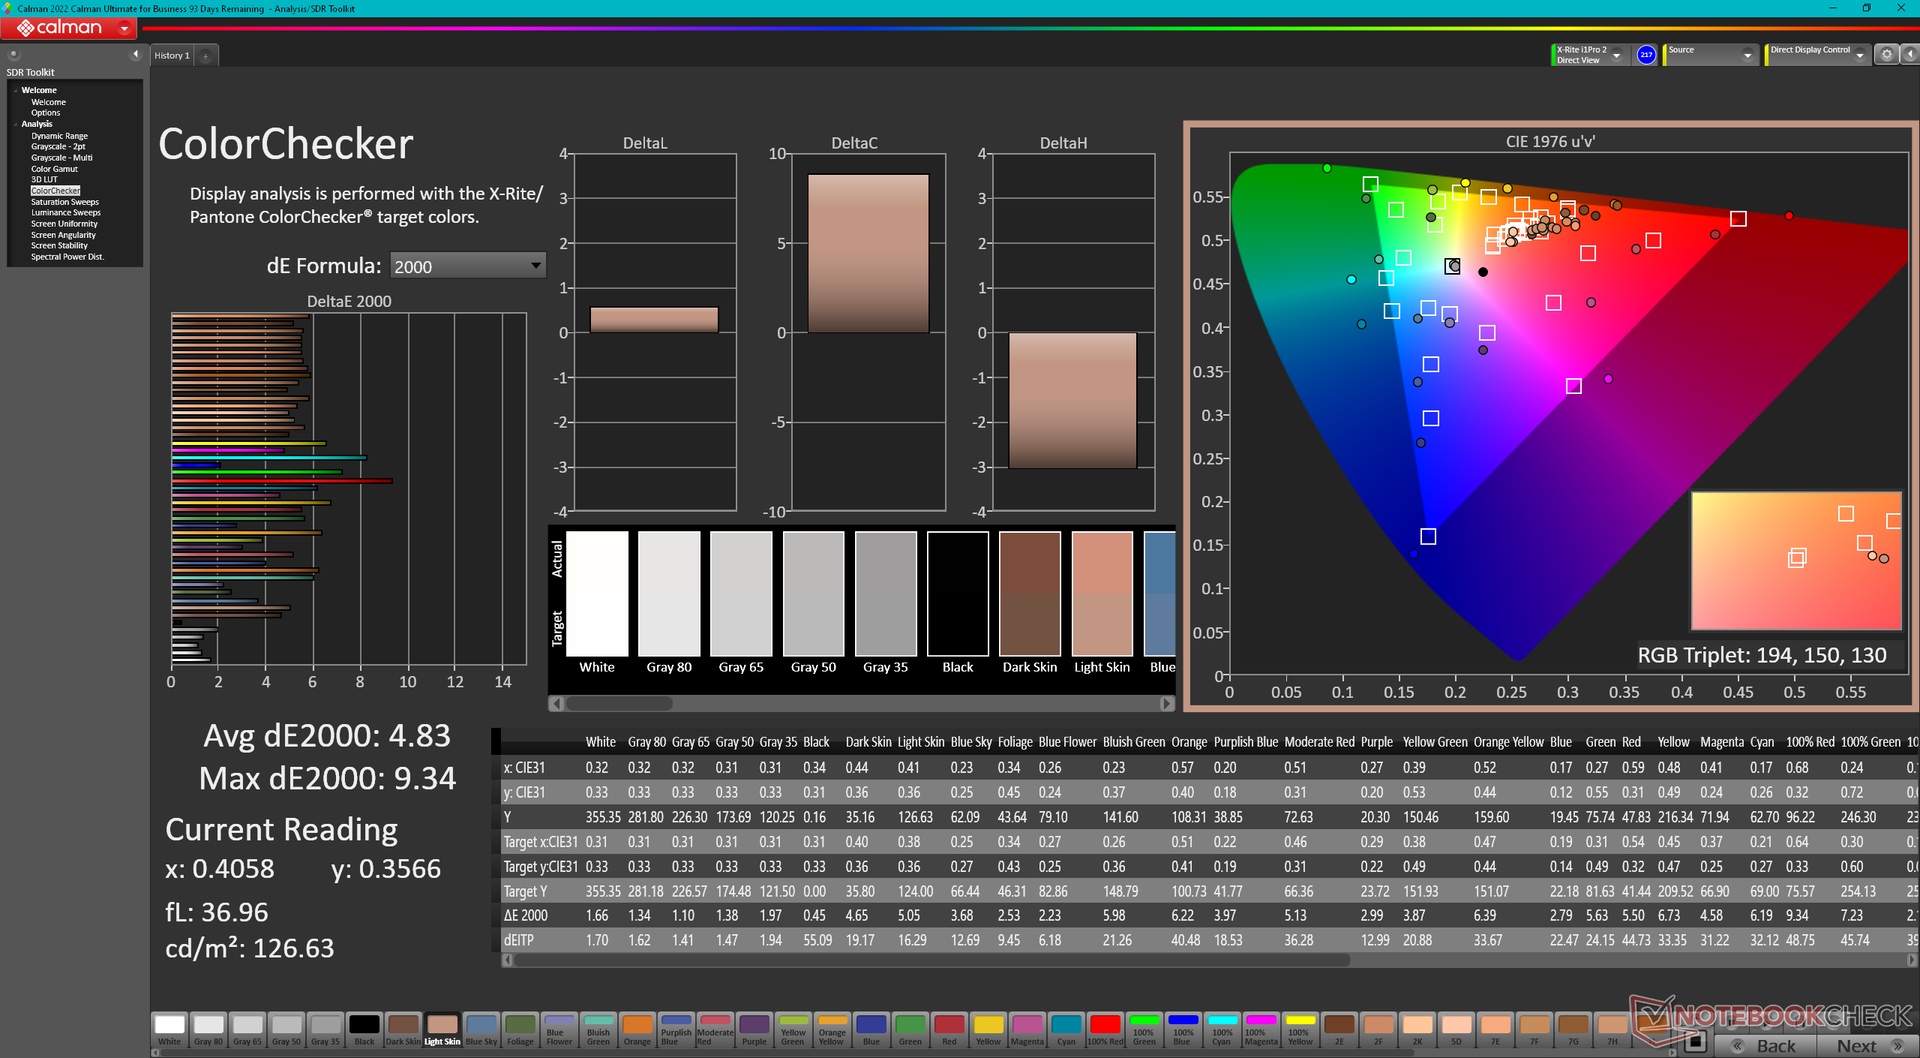
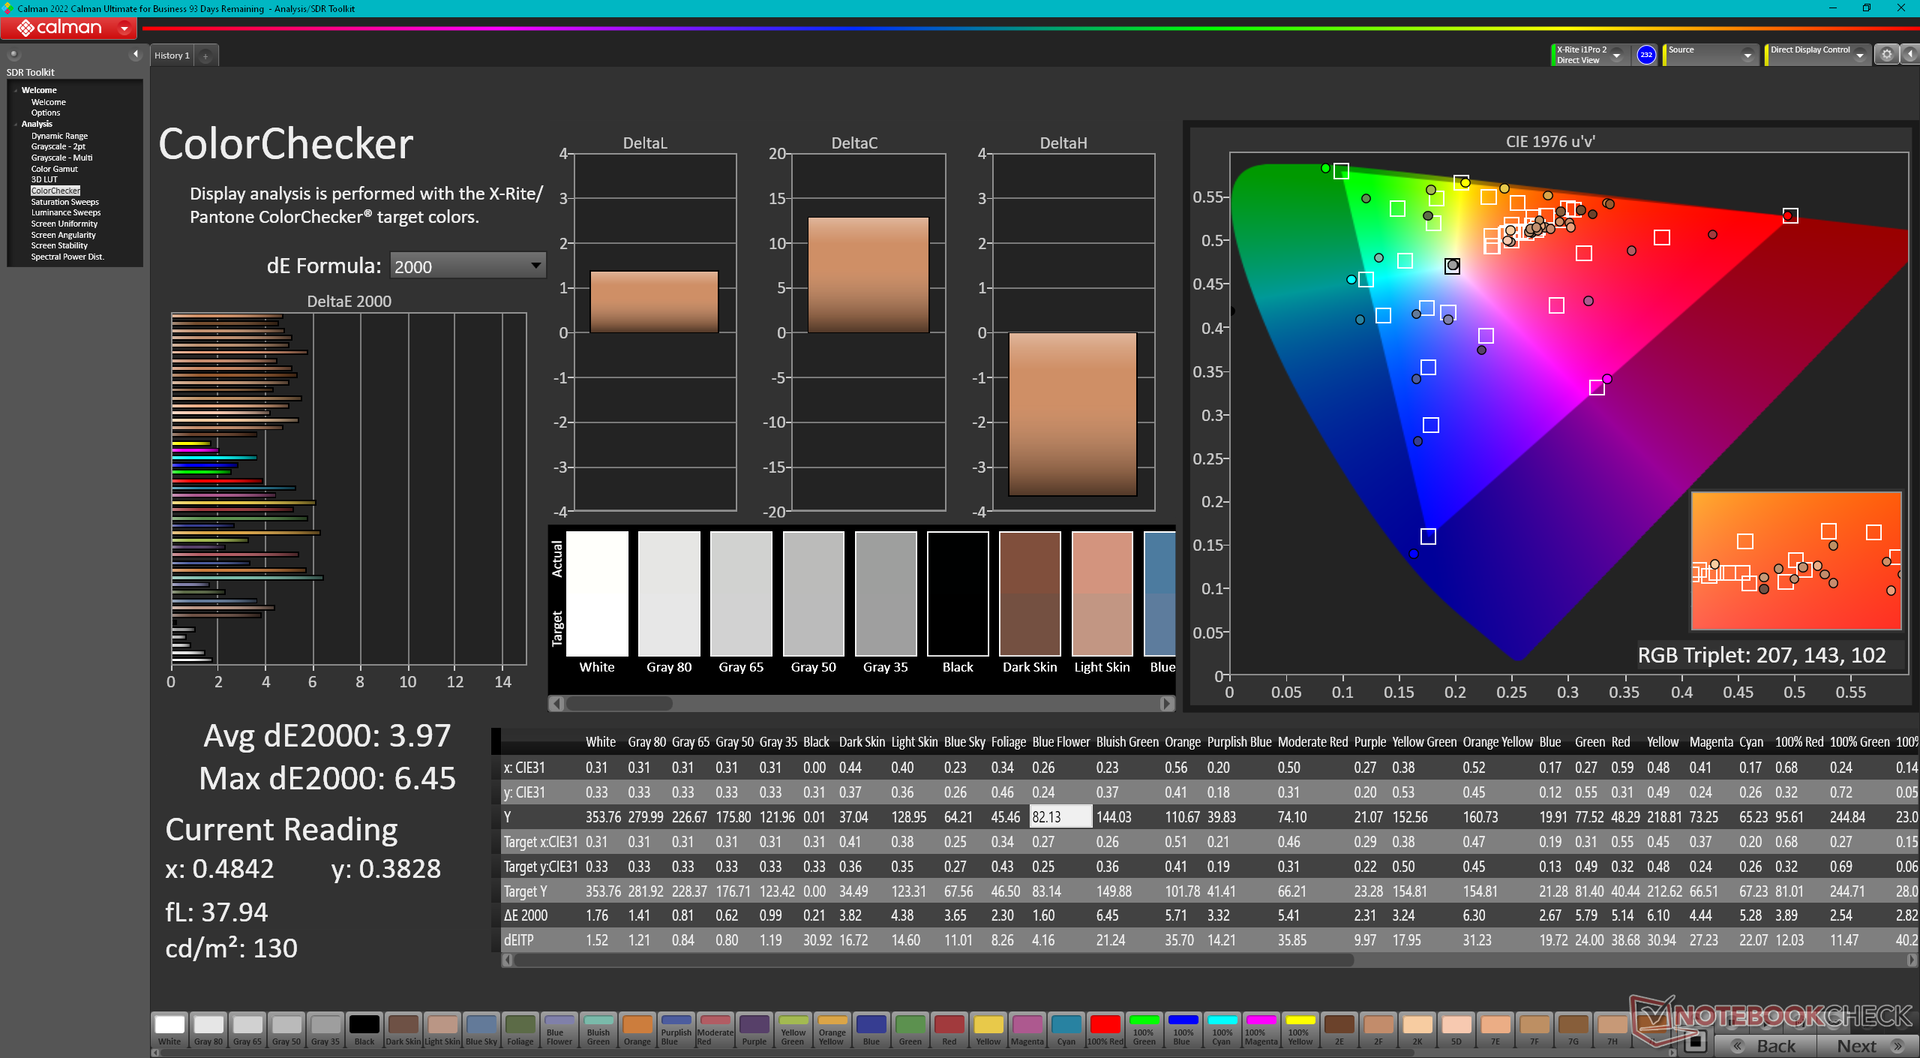
ΔE ColorChecker Calman: 4.83 | ∀{0.5-29.43 Ø4.71}
calibrated: 3.97
ΔE Greyscale Calman: 1.8 | ∀{0.09-98 Ø4.96}
96.8% AdobeRGB 1998 (Argyll 3D)
100% sRGB (Argyll 3D)
99.7% Display P3 (Argyll 3D)
Gamma: 2.33
CCT: 6438 K
| Dell XPS 13 Plus 9320 Core i7-1360P Samsung 134XK04, OLED, 3456x2160, 13.4" | Dell XPS 13 Plus 9320 i7-1280P OLED Samsung 134XK04, OLED, 3456x2160, 13.4" | Dell XPS 13 7390 Core i7-10710U AU Optronics B133ZAN, Dell P/N: 90NTH, IPS, 3840x2160, 13.3" | Framework Laptop 13.5 13th Gen Intel BOE CQ NE135FBM-N41, IPS, 2256x1504, 13.5" | Lenovo ThinkPad X13 Yoga G3 21AW003UGE LP133WQ1-SPF2, IPS LED, 2560x1600, 13.3" | HP Spectre x360 13.5 14t-ef000 SDC4160, OLED, 3000x2000, 13.5" | |
|---|---|---|---|---|---|---|
| Display | 1% | -25% | -20% | -20% | -2% | |
| Display P3 Coverage (%) | 99.7 | 99.5 0% | 63.4 -36% | 68.9 -31% | 68 -32% | 99.9 0% |
| sRGB Coverage (%) | 100 | 100 0% | 93.7 -6% | 97.5 -2% | 98.6 -1% | 100 0% |
| AdobeRGB 1998 Coverage (%) | 96.8 | 98.4 2% | 64.3 -34% | 71.1 -27% | 69.5 -28% | 90.8 -6% |
| Response Times | -10% | -1891% | -1965% | -1617% | 5% | |
| Response Time Grey 50% / Grey 80% * (ms) | 2.18 ? | 2.6 ? -19% | 51.6 ? -2267% | 54.9 ? -2418% | 45.9 ? -2006% | 1.9 ? 13% |
| Response Time Black / White * (ms) | 2.08 ? | 2.1 ? -1% | 33.6 ? -1515% | 33.5 ? -1511% | 27.6 ? -1227% | 2.16 ? -4% |
| PWM Frequency (Hz) | 238.6 ? | 59.5 | 60.2 ? | |||
| Screen | 14% | -39% | 2% | 23% | 9% | |
| Brightness middle (cd/m²) | 361.7 | 371.8 3% | 408.2 13% | 503 39% | 438 21% | 351.7 -3% |
| Brightness (cd/m²) | 367 | 374 2% | 399 9% | 472 29% | 399 9% | 351 -4% |
| Brightness Distribution (%) | 96 | 98 2% | 89 -7% | 87 -9% | 84 -12% | 87 -9% |
| Black Level * (cd/m²) | 0.39 | 0.36 | 0.29 | |||
| Colorchecker dE 2000 * | 4.83 | 2.37 51% | 4.6 5% | 3.38 30% | 1.8 63% | 1.78 63% |
| Colorchecker dE 2000 max. * | 9.34 | 6.1 35% | 11.84 -27% | 7.08 24% | 4 57% | 6.14 34% |
| Colorchecker dE 2000 calibrated * | 3.97 | 2.03 49% | 1.21 70% | 0.8 80% | ||
| Greyscale dE 2000 * | 1.8 | 2 -11% | 7.5 -317% | 4.8 -167% | 2.8 -56% | 2.3 -28% |
| Gamma | 2.33 94% | 2.29 96% | 2.12 104% | 2.13 103% | 2.24 98% | 2.11 104% |
| CCT | 6438 101% | 6261 104% | 7966 82% | 6235 104% | 6785 96% | 6683 97% |
| Contrast (:1) | 1047 | 1397 | 1510 | |||
| Color Space (Percent of AdobeRGB 1998) (%) | 59.5 | |||||
| Color Space (Percent of sRGB) (%) | 93.5 | |||||
| Moyenne finale (programmes/paramètres) | 2% /
6% | -652% /
-344% | -661% /
-331% | -538% /
-261% | 4% /
5% |
* ... Moindre est la valeur, meilleures sont les performances
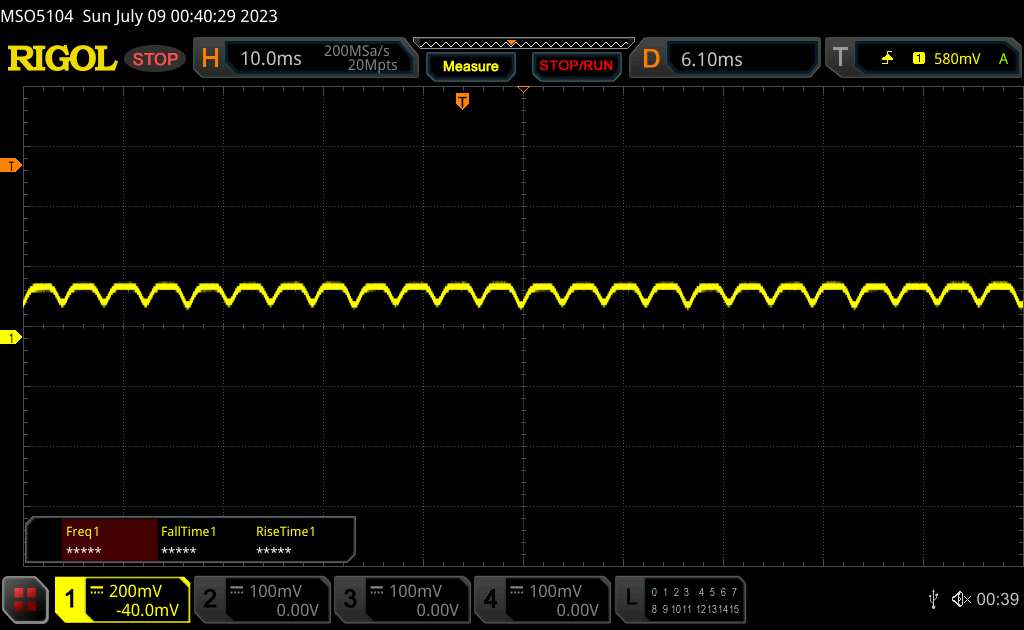
Temps de réponse de l'écran
| ↔ Temps de réponse noir à blanc | ||
|---|---|---|
| 2.08 ms ... hausse ↗ et chute ↘ combinées | ↗ 0.98 ms hausse | 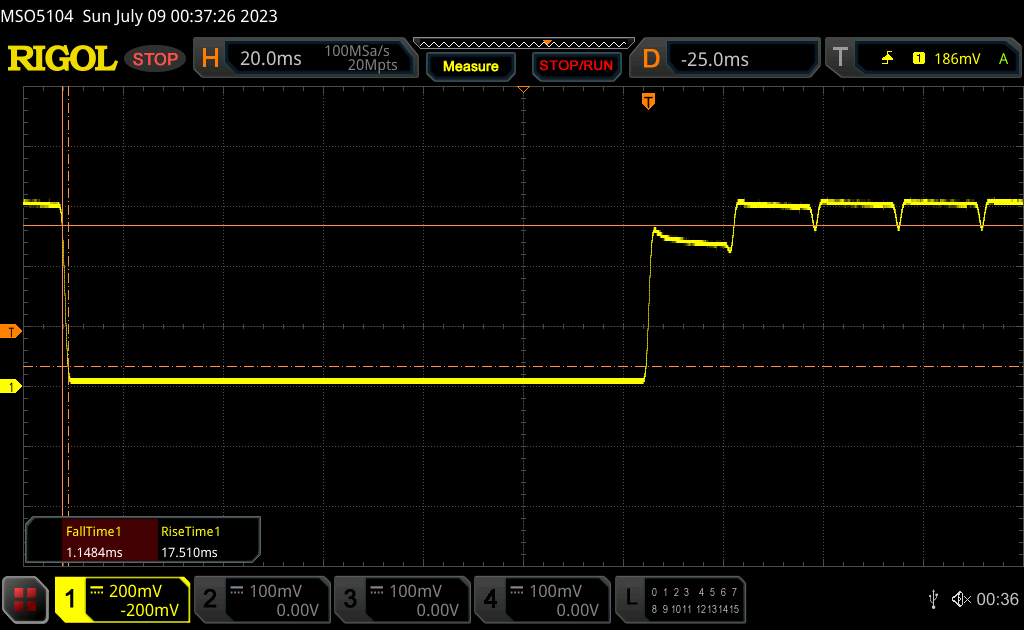 |
| ↘ 1.1 ms chute | ||
| L'écran montre de très faibles temps de réponse, parfait pour le jeu. En comparaison, tous les appareils testés affichent entre 0.1 (minimum) et 240 (maximum) ms. » 12 % des appareils testés affichent de meilleures performances. Cela signifie que les latences relevées sont meilleures que la moyenne (19.8 ms) de tous les appareils testés. | ||
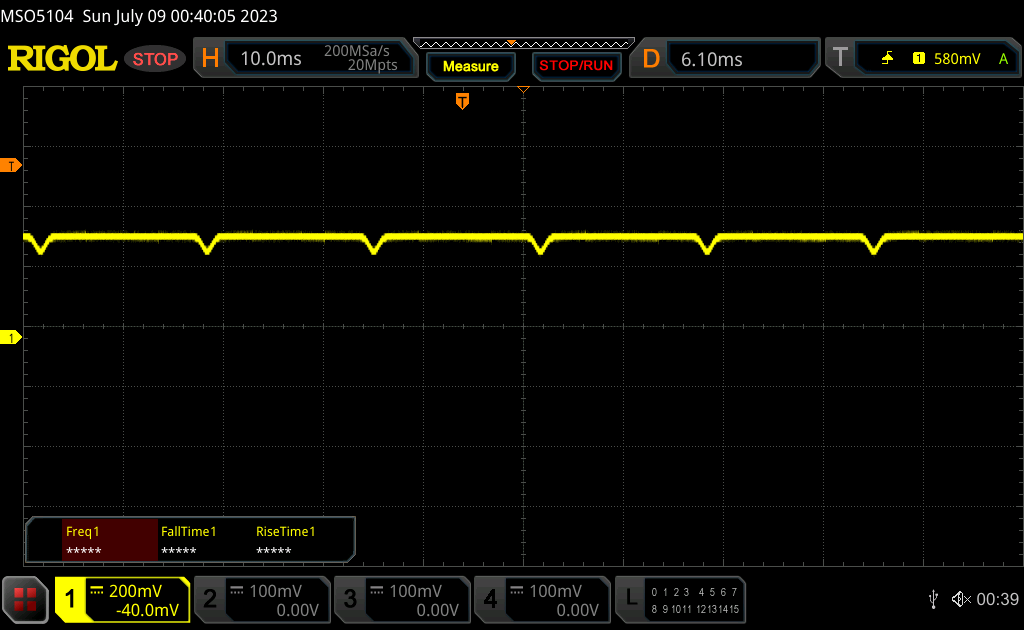
| ↔ Temps de réponse gris 50% à gris 80% | ||
| 2.18 ms ... hausse ↗ et chute ↘ combinées | ↗ 1.2 ms hausse | 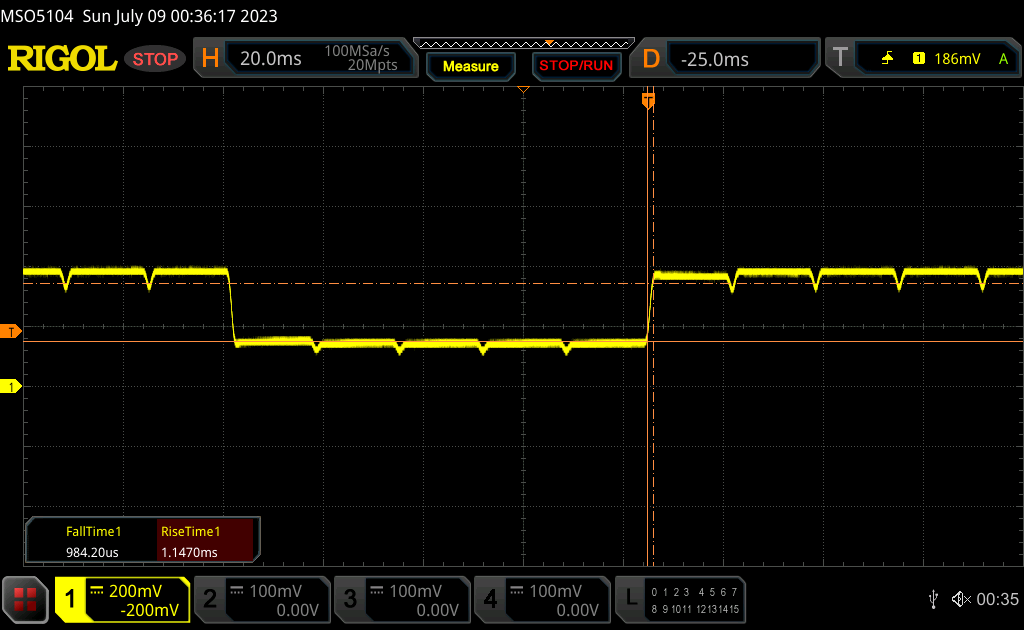 |
| ↘ 0.98 ms chute | ||
| L'écran montre de très faibles temps de réponse, parfait pour le jeu. En comparaison, tous les appareils testés affichent entre 0.165 (minimum) et 636 (maximum) ms. » 11 % des appareils testés affichent de meilleures performances. Cela signifie que les latences relevées sont meilleures que la moyenne (31 ms) de tous les appareils testés. | ||
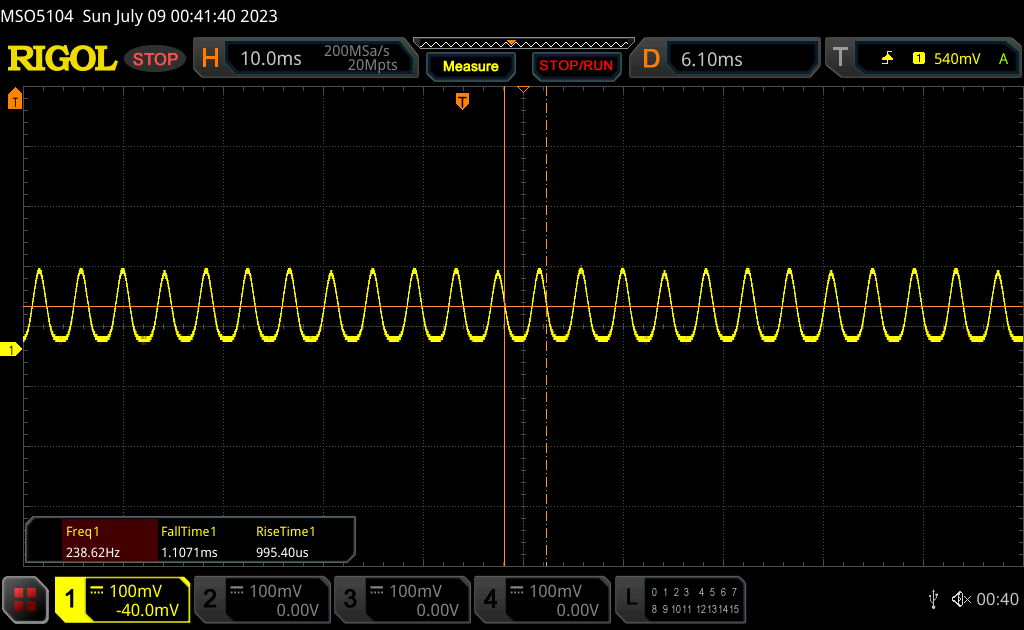
Scintillement / MLI (Modulation de largeur d'impulsion)
| Scintillement / MLI (Modulation de largeur d'impulsion) décelé | 238.6 Hz | ≤ 100 Niveau de luminosité | 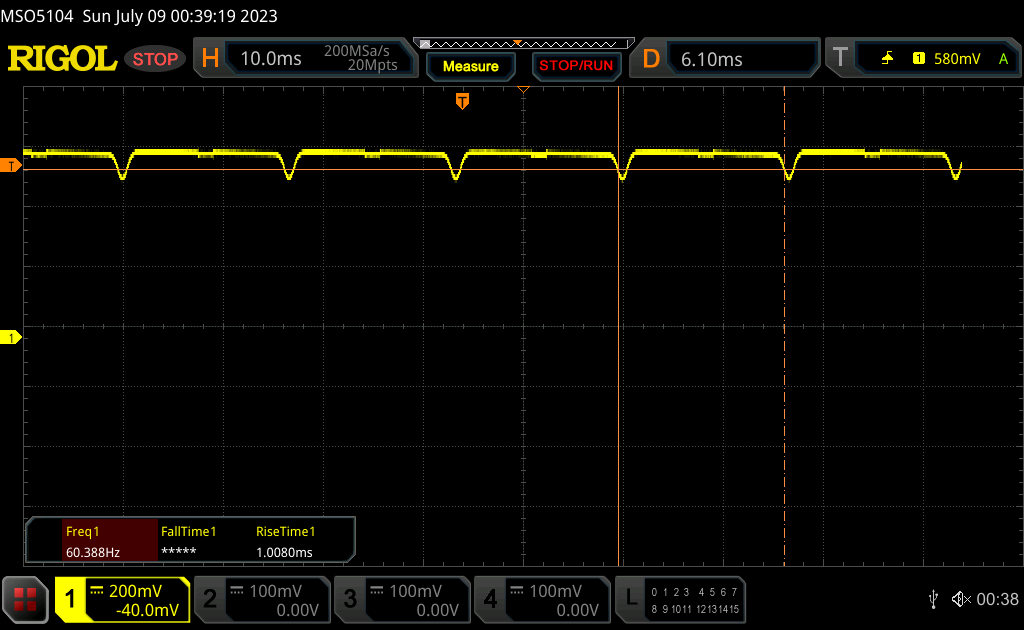 |
Le rétroéclairage de l'écran scintille à la fréquence de 238.6 Hz (certainement du fait de l'utilisation d'une MDI - Modulation de largeur d'impulsion) à un niveau de luminosité inférieur ou égal à 100 % . Aucun scintillement ne devrait être perceptible au-dessus de cette valeur. La fréquence de rafraîchissement de 238.6 Hz est relativement faible, les personnes les plus sensibles devraient percevoir un scintillement et être sujettes à une fatigue oculaire accrue (avec le niveau de luminosité indiqué) En comparaison, 52 % des appareils testés n'emploient pas MDI pour assombrir leur écran. Nous avons relevé une moyenne à 7757 (minimum : 5 - maximum : 343500) Hz dans le cas où une MDI était active. | |||
La modulation de la largeur d'impulsion ou le scintillement est toujours présent à la plupart des niveaux de luminosité. Nous avons pu détecter une fréquence de 238,6 Hz de 0 % à 52 % de luminosité et de 60 Hz de 53 % de luminosité au maximum. Les autres options IPS ne devraient pas présenter de scintillement ou de modulation de largeur de bande.

Performance
Conditions d'essai
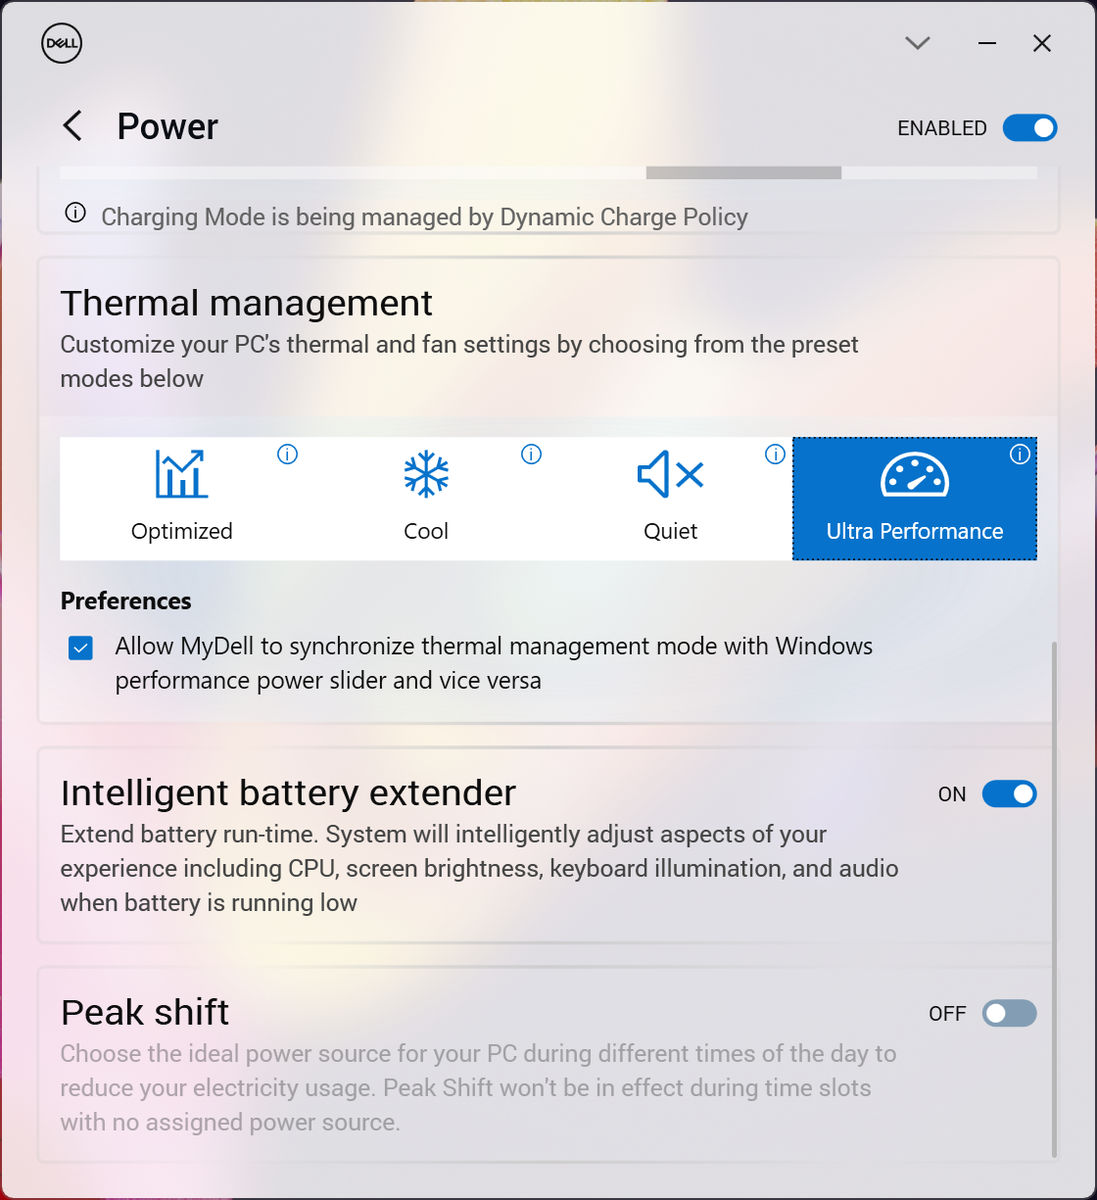
Nous avons réglé notre appareil en mode Ultra Performance via le nouveau logiciel MyDell avant d'effectuer les tests de référence ci-dessous. MyDell est l'équivalent pour le XPS du logiciel Optimizer livré avec de nombreux modèles Latitude. Il intègre donc des fonctionnalités similaires telles que les profils de performance, les habitudes de charge et la détection de présence. Les profils d'alimentation Dell peuvent être synchronisés avec les profils Windows standard, contrairement à la plupart des autres ordinateurs portables.
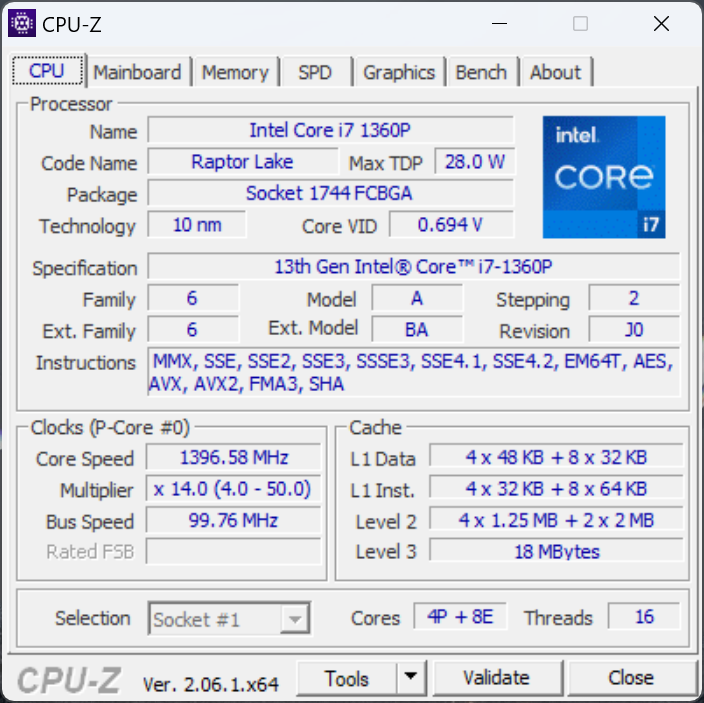
Processeur
Les performances multithread de notre Core i7-1360P de 13e génération Core i7-1360P est presque identique à celle du Core i7-1280P de la 2022 XPS 13 Plus. Même leurs comportements Turbo Boost sont identiques, comme le montrent les résultats du test en boucle CineBench R15 xT ci-dessous. LeLenovo Yoga 9 14IRP G8qui embarque le même Core i7-1360P, est capable de maintenir des fréquences d'horloge Turbo Boost légèrement plus rapides pendant plus longtemps dans le cadre du même test.
Alors que les performances multithread n'ont pas vraiment changé d'une année sur l'autre, les performances single-thread sont en hausse d'environ 10 à 15 % par rapport au Core i7-1280P. Cela ne devrait toutefois pas avoir beaucoup d'impact sur les charges de travail quotidiennes, car la plupart des applications modernes sont multithread.
Cinebench R15 Multi Loop
Cinebench R20: CPU (Multi Core) | CPU (Single Core)
Cinebench R23: Multi Core | Single Core
Cinebench R15: CPU Multi 64Bit | CPU Single 64Bit
Blender: v2.79 BMW27 CPU
7-Zip 18.03: 7z b 4 | 7z b 4 -mmt1
Geekbench 5.5: Multi-Core | Single-Core
HWBOT x265 Benchmark v2.2: 4k Preset
LibreOffice : 20 Documents To PDF
R Benchmark 2.5: Overall mean
* ... Moindre est la valeur, meilleures sont les performances
AIDA64: FP32 Ray-Trace | FPU Julia | CPU SHA3 | CPU Queen | FPU SinJulia | FPU Mandel | CPU AES | CPU ZLib | FP64 Ray-Trace | CPU PhotoWorxx
| Performance rating | |
| Framework Laptop 13.5 13th Gen Intel | |
| Dell XPS 13 Plus 9320 i7-1280P OLED | |
| Dell XPS 13 Plus 9320 Core i7-1360P | |
| HP Spectre x360 13.5 14t-ef000 | |
| Lenovo ThinkPad X13 Yoga G3 21AW003UGE | |
| AIDA64 / FP32 Ray-Trace | |
| Framework Laptop 13.5 13th Gen Intel | |
| Dell XPS 13 Plus 9320 i7-1280P OLED | |
| Dell XPS 13 Plus 9320 Core i7-1360P | |
| Lenovo ThinkPad X13 Yoga G3 21AW003UGE | |
| HP Spectre x360 13.5 14t-ef000 | |
| AIDA64 / FPU Julia | |
| Framework Laptop 13.5 13th Gen Intel | |
| Dell XPS 13 Plus 9320 i7-1280P OLED | |
| Dell XPS 13 Plus 9320 Core i7-1360P | |
| Lenovo ThinkPad X13 Yoga G3 21AW003UGE | |
| HP Spectre x360 13.5 14t-ef000 | |
| AIDA64 / CPU SHA3 | |
| Framework Laptop 13.5 13th Gen Intel | |
| Dell XPS 13 Plus 9320 i7-1280P OLED | |
| Dell XPS 13 Plus 9320 Core i7-1360P | |
| Lenovo ThinkPad X13 Yoga G3 21AW003UGE | |
| HP Spectre x360 13.5 14t-ef000 | |
| AIDA64 / CPU Queen | |
| Framework Laptop 13.5 13th Gen Intel | |
| Dell XPS 13 Plus 9320 i7-1280P OLED | |
| Dell XPS 13 Plus 9320 Core i7-1360P | |
| Lenovo ThinkPad X13 Yoga G3 21AW003UGE | |
| HP Spectre x360 13.5 14t-ef000 | |
| AIDA64 / FPU SinJulia | |
| Framework Laptop 13.5 13th Gen Intel | |
| Dell XPS 13 Plus 9320 i7-1280P OLED | |
| Dell XPS 13 Plus 9320 Core i7-1360P | |
| Lenovo ThinkPad X13 Yoga G3 21AW003UGE | |
| HP Spectre x360 13.5 14t-ef000 | |
| AIDA64 / FPU Mandel | |
| Framework Laptop 13.5 13th Gen Intel | |
| Dell XPS 13 Plus 9320 i7-1280P OLED | |
| Dell XPS 13 Plus 9320 Core i7-1360P | |
| Lenovo ThinkPad X13 Yoga G3 21AW003UGE | |
| HP Spectre x360 13.5 14t-ef000 | |
| AIDA64 / CPU AES | |
| Framework Laptop 13.5 13th Gen Intel | |
| HP Spectre x360 13.5 14t-ef000 | |
| Dell XPS 13 Plus 9320 i7-1280P OLED | |
| Dell XPS 13 Plus 9320 Core i7-1360P | |
| Lenovo ThinkPad X13 Yoga G3 21AW003UGE | |
| AIDA64 / CPU ZLib | |
| Framework Laptop 13.5 13th Gen Intel | |
| Dell XPS 13 Plus 9320 Core i7-1360P | |
| Dell XPS 13 Plus 9320 i7-1280P OLED | |
| Lenovo ThinkPad X13 Yoga G3 21AW003UGE | |
| HP Spectre x360 13.5 14t-ef000 | |
| AIDA64 / FP64 Ray-Trace | |
| Framework Laptop 13.5 13th Gen Intel | |
| Dell XPS 13 Plus 9320 i7-1280P OLED | |
| Dell XPS 13 Plus 9320 Core i7-1360P | |
| HP Spectre x360 13.5 14t-ef000 | |
| Lenovo ThinkPad X13 Yoga G3 21AW003UGE | |
| AIDA64 / CPU PhotoWorxx | |
| Dell XPS 13 Plus 9320 Core i7-1360P | |
| Dell XPS 13 Plus 9320 i7-1280P OLED | |
| HP Spectre x360 13.5 14t-ef000 | |
| Lenovo ThinkPad X13 Yoga G3 21AW003UGE | |
| Framework Laptop 13.5 13th Gen Intel | |
Performance du système
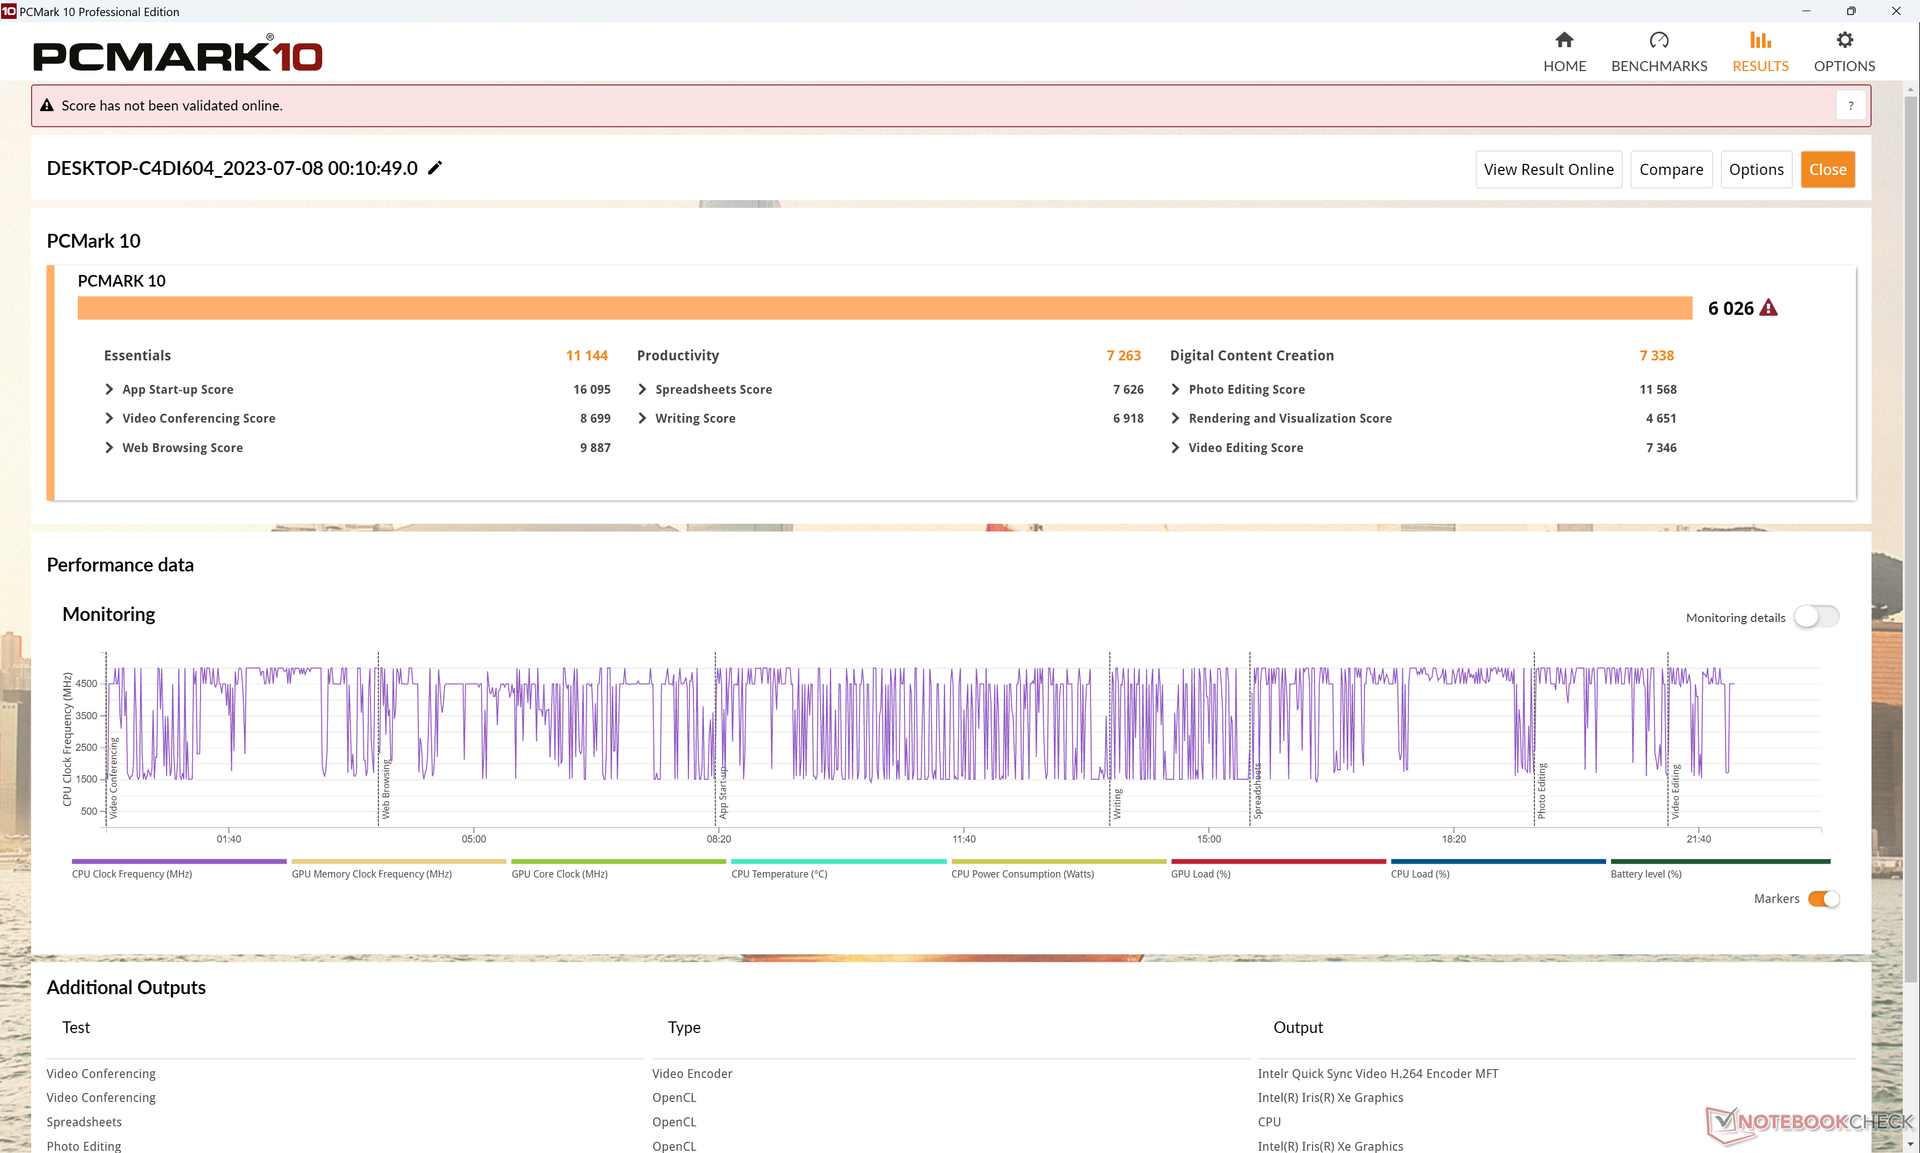
Les résultats de PCMark sont légèrement mais systématiquement supérieurs à ceux du XPS 13 Plus de l'année dernière, avec des points de pourcentage à un chiffre, probablement en raison de la RAM plus rapide et des performances un peu plus rapides des threads uniques.
CrossMark: Overall | Productivity | Creativity | Responsiveness
| PCMark 10 / Digital Content Creation | |
| Framework Laptop 13.5 13th Gen Intel | |
| Dell XPS 13 Plus 9320 Core i7-1360P | |
| Moyenne Intel Core i7-1360P (5723 - 9597, n=16) | |
| Dell XPS 13 Plus 9320 i7-1280P OLED | |
| HP Spectre x360 13.5 14t-ef000 | |
| Lenovo ThinkPad X13 Yoga G3 21AW003UGE | |
| Dell XPS 13 7390 Core i7-10710U | |
| CrossMark / Overall | |
| Dell XPS 13 Plus 9320 Core i7-1360P | |
| Dell XPS 13 Plus 9320 i7-1280P OLED | |
| Framework Laptop 13.5 13th Gen Intel | |
| Moyenne Intel Core i7-1360P (1527 - 1891, n=15) | |
| HP Spectre x360 13.5 14t-ef000 | |
| Lenovo ThinkPad X13 Yoga G3 21AW003UGE | |
| CrossMark / Productivity | |
| Framework Laptop 13.5 13th Gen Intel | |
| Dell XPS 13 Plus 9320 Core i7-1360P | |
| Dell XPS 13 Plus 9320 i7-1280P OLED | |
| Moyenne Intel Core i7-1360P (1503 - 1842, n=15) | |
| HP Spectre x360 13.5 14t-ef000 | |
| Lenovo ThinkPad X13 Yoga G3 21AW003UGE | |
| CrossMark / Creativity | |
| Dell XPS 13 Plus 9320 Core i7-1360P | |
| Dell XPS 13 Plus 9320 i7-1280P OLED | |
| Framework Laptop 13.5 13th Gen Intel | |
| Moyenne Intel Core i7-1360P (1558 - 2003, n=15) | |
| HP Spectre x360 13.5 14t-ef000 | |
| Lenovo ThinkPad X13 Yoga G3 21AW003UGE | |
| CrossMark / Responsiveness | |
| Moyenne Intel Core i7-1360P (1311 - 1899, n=15) | |
| Dell XPS 13 Plus 9320 i7-1280P OLED | |
| Dell XPS 13 Plus 9320 Core i7-1360P | |
| Framework Laptop 13.5 13th Gen Intel | |
| HP Spectre x360 13.5 14t-ef000 | |
| Lenovo ThinkPad X13 Yoga G3 21AW003UGE | |
| PCMark 10 Score | 6026 points | |
Aide | ||
| AIDA64 / Memory Copy | |
| Dell XPS 13 Plus 9320 Core i7-1360P | |
| Dell XPS 13 Plus 9320 i7-1280P OLED | |
| Moyenne Intel Core i7-1360P (44299 - 72748, n=16) | |
| HP Spectre x360 13.5 14t-ef000 | |
| Lenovo ThinkPad X13 Yoga G3 21AW003UGE | |
| Framework Laptop 13.5 13th Gen Intel | |
| AIDA64 / Memory Read | |
| Dell XPS 13 Plus 9320 i7-1280P OLED | |
| Dell XPS 13 Plus 9320 Core i7-1360P | |
| HP Spectre x360 13.5 14t-ef000 | |
| Moyenne Intel Core i7-1360P (44751 - 68945, n=16) | |
| Lenovo ThinkPad X13 Yoga G3 21AW003UGE | |
| Framework Laptop 13.5 13th Gen Intel | |
| AIDA64 / Memory Write | |
| Dell XPS 13 Plus 9320 Core i7-1360P | |
| Moyenne Intel Core i7-1360P (45887 - 93331, n=16) | |
| HP Spectre x360 13.5 14t-ef000 | |
| Dell XPS 13 Plus 9320 i7-1280P OLED | |
| Framework Laptop 13.5 13th Gen Intel | |
| Lenovo ThinkPad X13 Yoga G3 21AW003UGE | |
| AIDA64 / Memory Latency | |
| Dell XPS 13 Plus 9320 i7-1280P OLED | |
| Lenovo ThinkPad X13 Yoga G3 21AW003UGE | |
| Dell XPS 13 Plus 9320 Core i7-1360P | |
| Moyenne Intel Core i7-1360P (85 - 110.5, n=16) | |
| HP Spectre x360 13.5 14t-ef000 | |
| Framework Laptop 13.5 13th Gen Intel | |
* ... Moindre est la valeur, meilleures sont les performances
Latence DPC
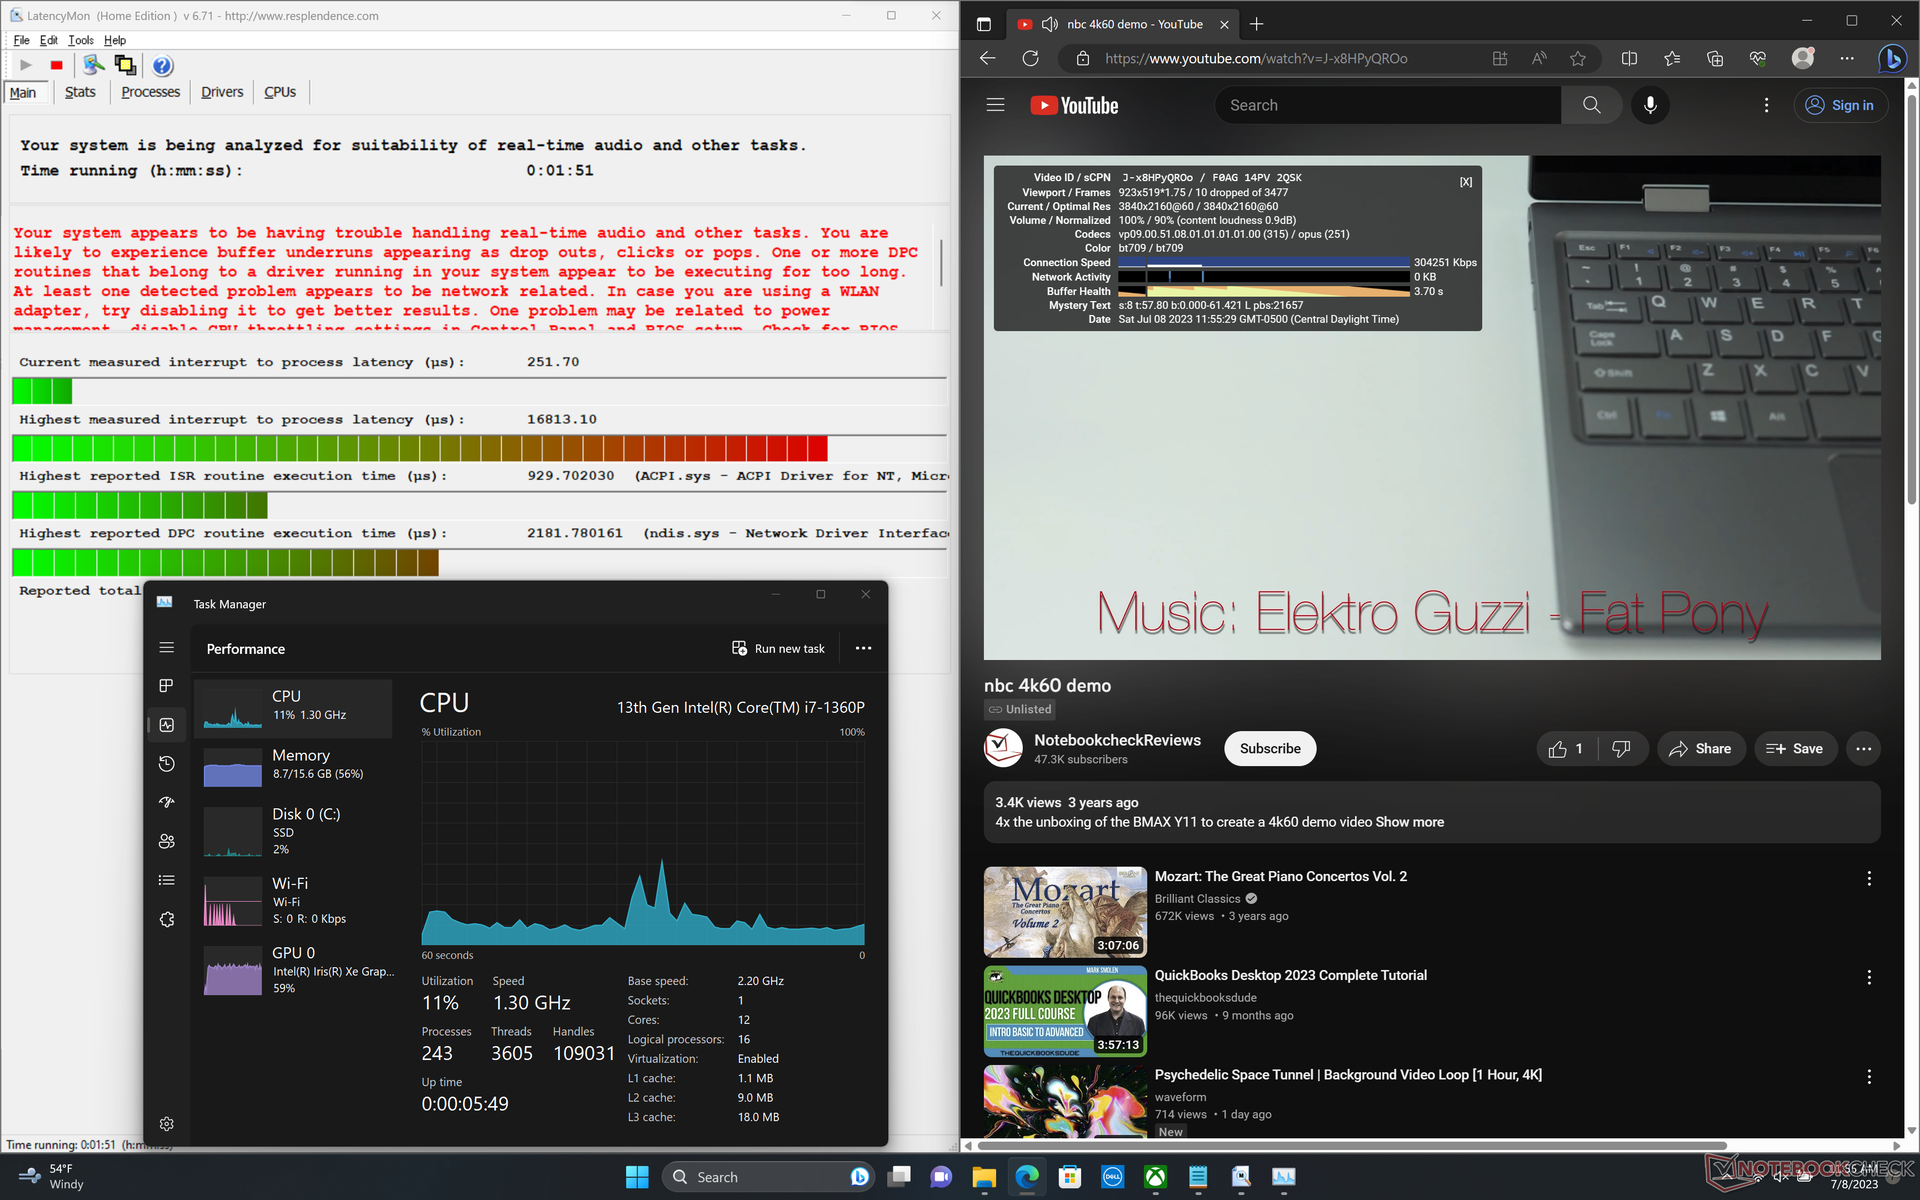
Notre appareil présentait des problèmes de latence lors de l'ouverture de plusieurs onglets de navigateur ou de la page d'accueil, même après plusieurs tentatives. la lecture de vidéos 4K à 60 FPS était également imparfaite, avec 10 images perdues au cours de notre vidéo de test d'une minute. Il pourrait s'agir d'un bogue du nouveau modèle 2023, car aucune de nos trois unités de test 2022 n'a présenté ces problèmes.
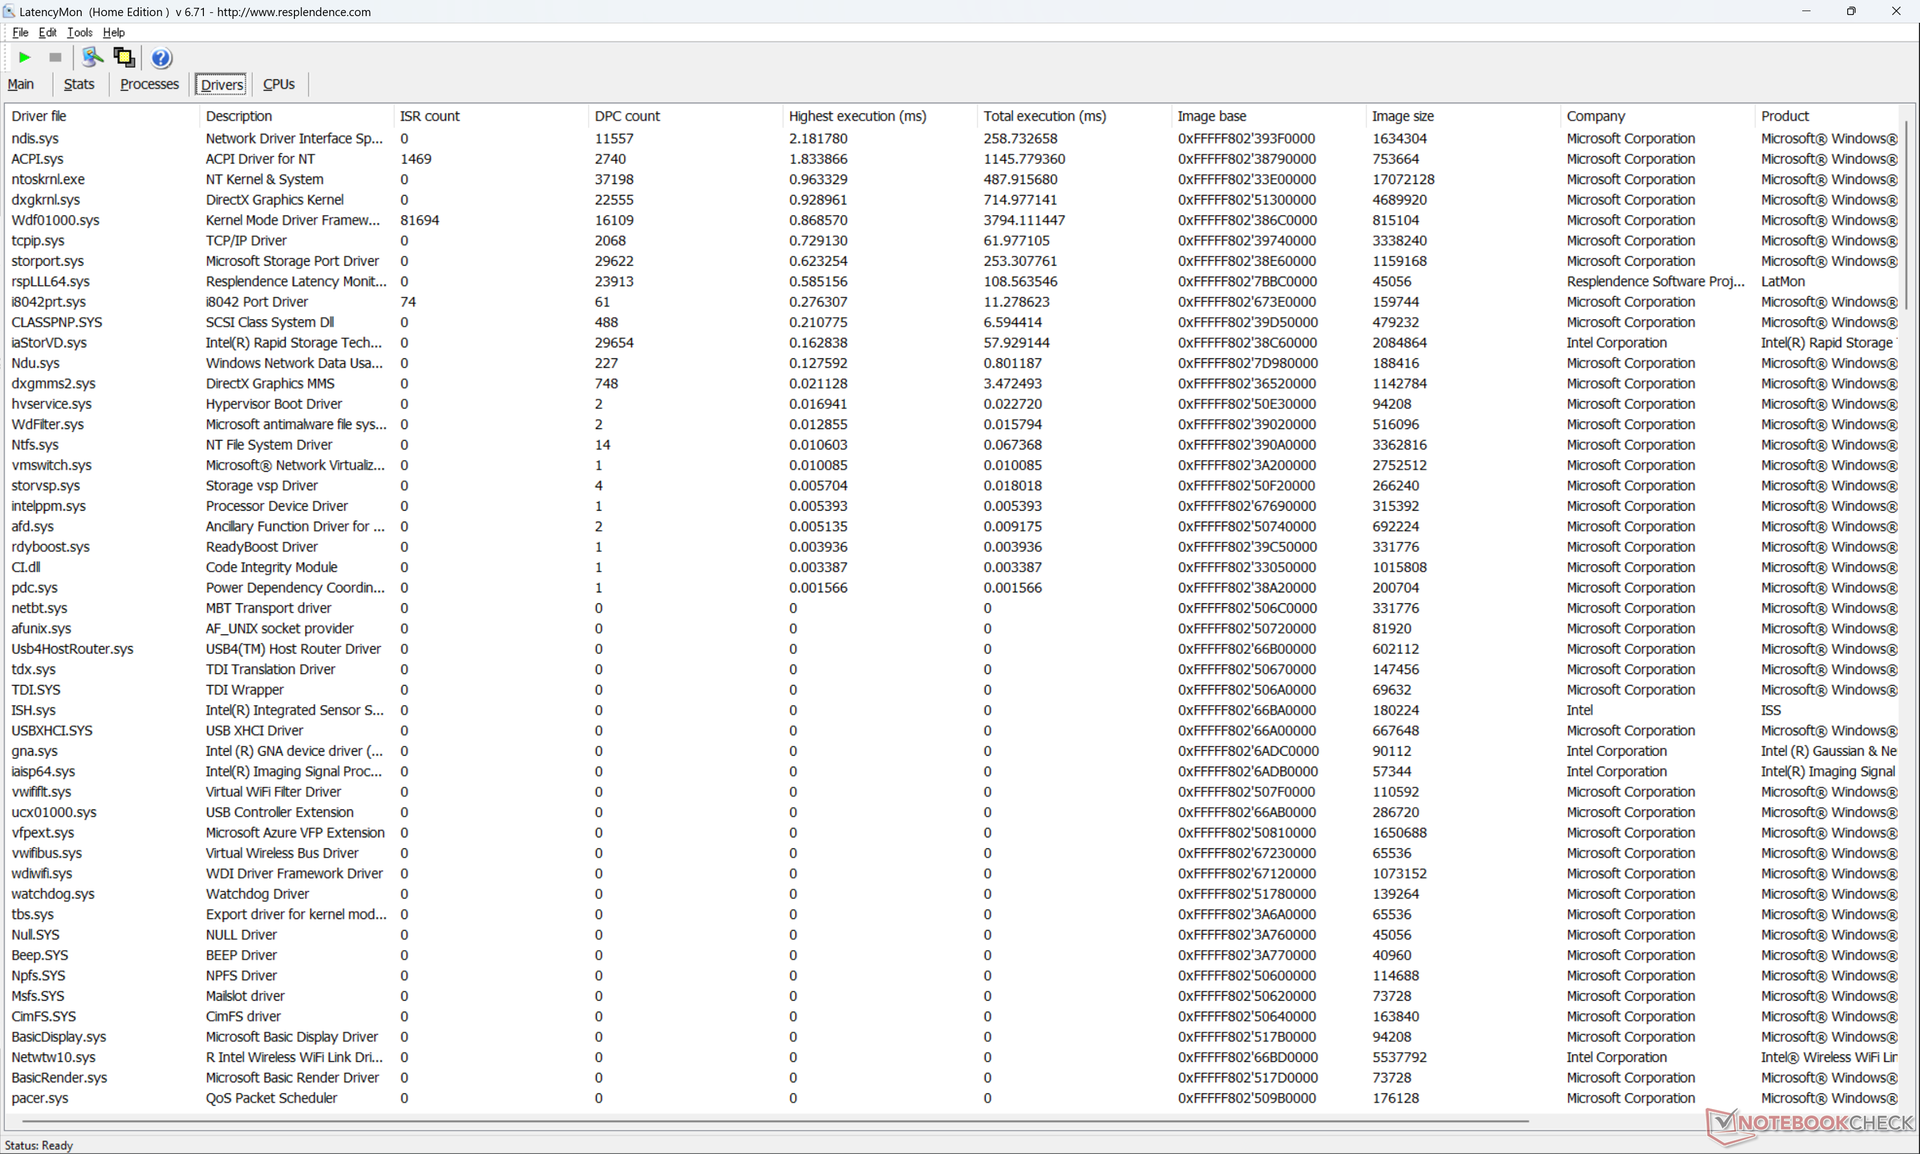
| DPC Latencies / LatencyMon - interrupt to process latency (max), Web, Youtube, Prime95 | |
| Dell XPS 13 Plus 9320 Core i7-1360P | |
| Lenovo ThinkPad X13 Yoga G3 21AW003UGE | |
| Dell XPS 13 Plus 9320 i5-1240p | |
| Dell XPS 13 Plus 9320 4K | |
| HP Spectre x360 13.5 14t-ef000 | |
| Dell XPS 13 Plus 9320 i7-1280P OLED | |
| Framework Laptop 13.5 13th Gen Intel | |
* ... Moindre est la valeur, meilleures sont les performances
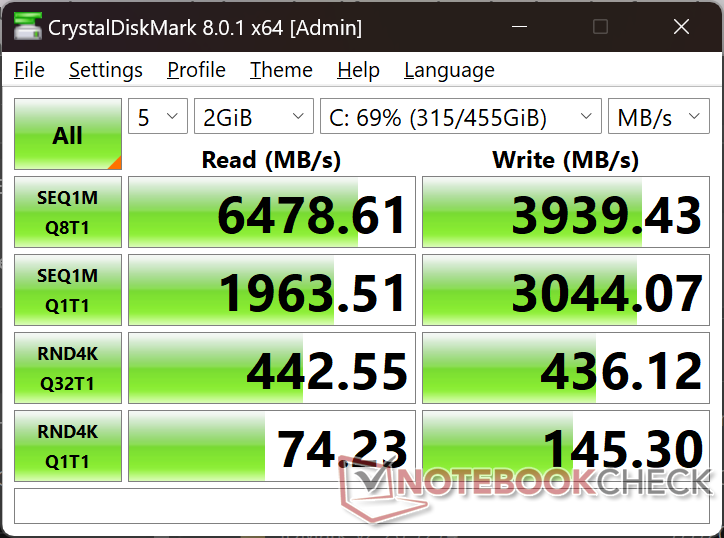
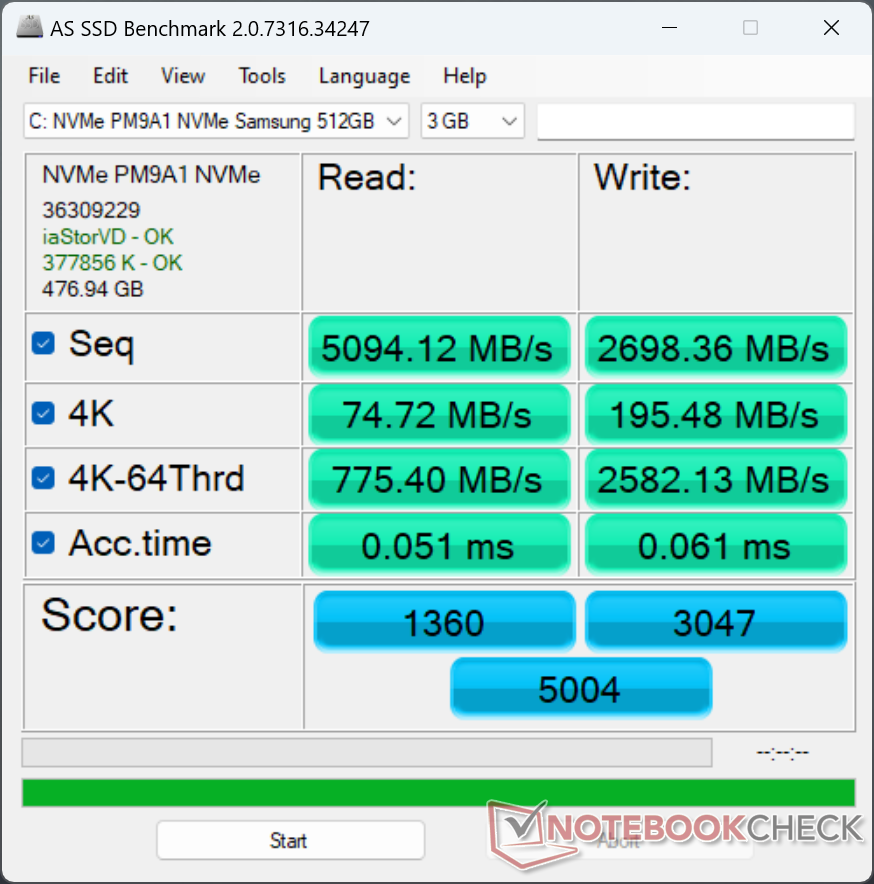
Dispositifs de stockage
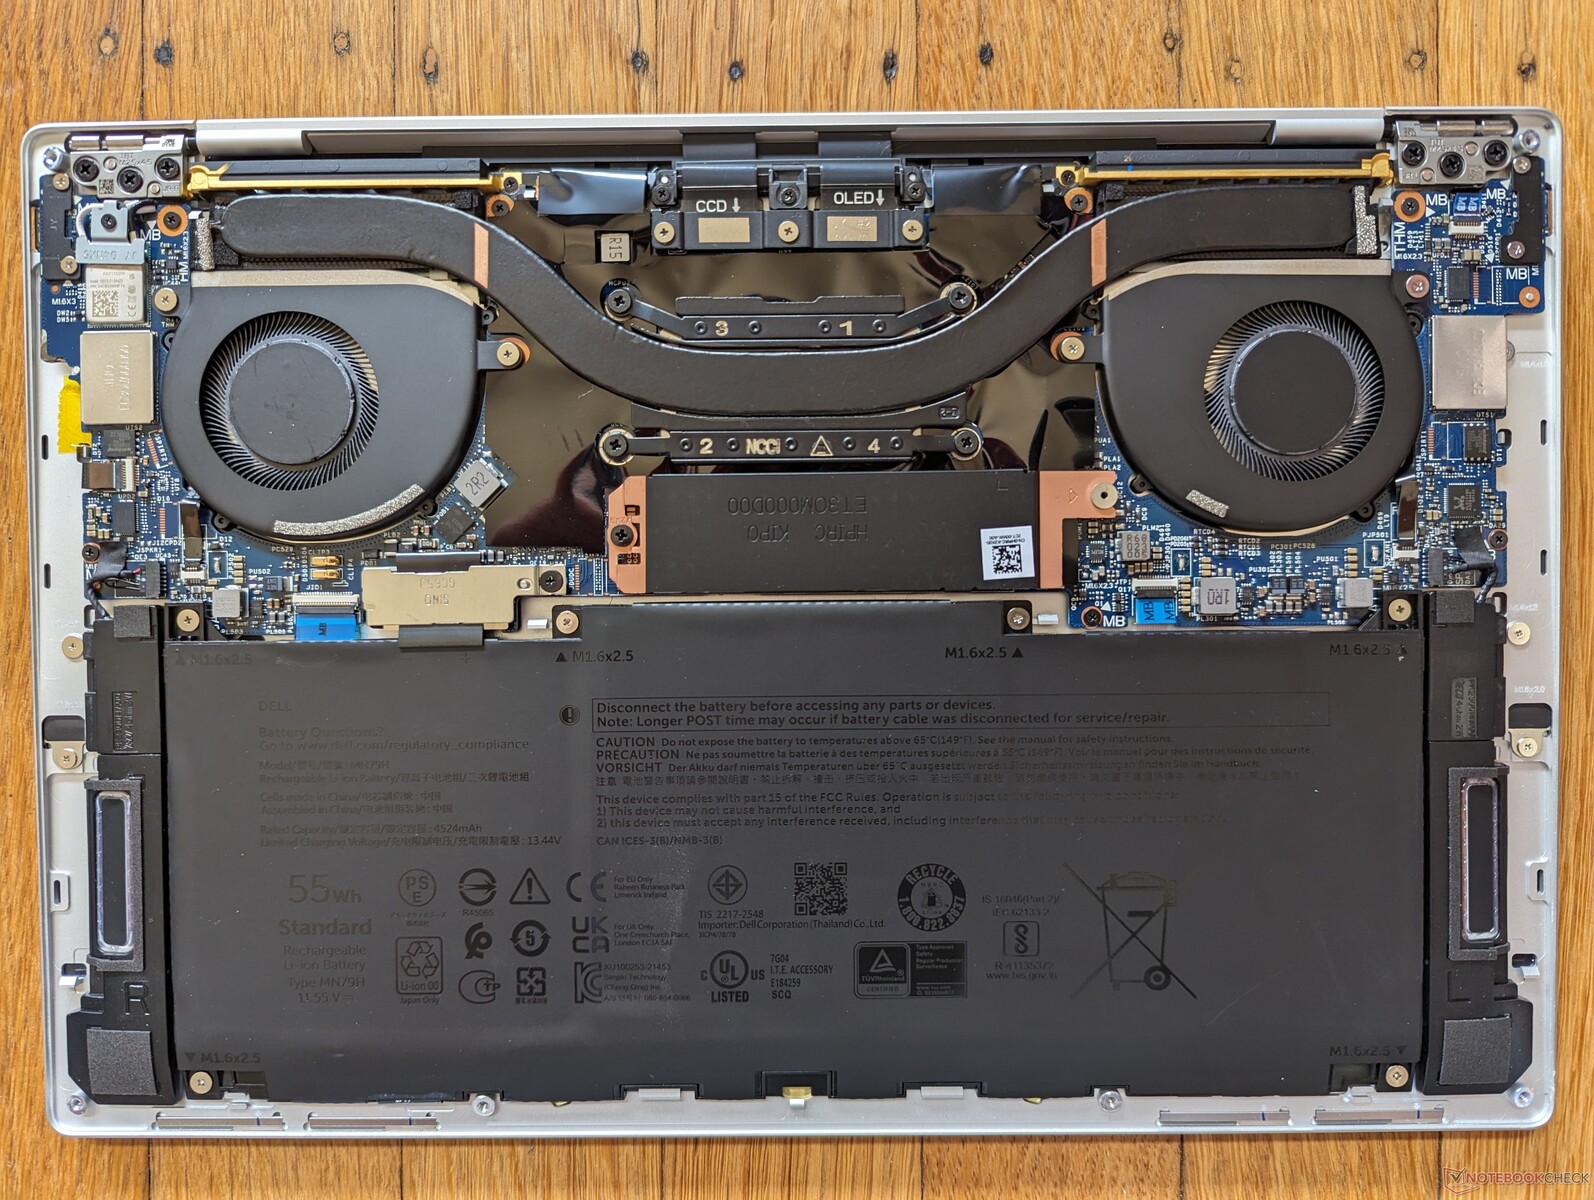
Les disques durs SSD de la série XPS 13 Plus peuvent provenir de Samsung, Micron ou Western Digital. Pour cette unité particulière, notre SSD est le Samsung PM9A1 PCIe4 x4 offrant des taux de lecture séquentielle et d'écriture de près de 7000 Mo/s et 4000 Mo/s, respectivement. Malheureusement, les performances de notre disque tombent à 2000 Mo/s lorsqu'il est sollicité, comme le montrent les résultats de notre test en boucle DiskSpd ci-dessous. La répétition des tests n'a pas permis d'améliorer les performances. En revanche, le même disque de notre XPS 13 Plus 2022 ne présentait aucun ralentissement des performances. Nous ne connaissons pas les causes spécifiques de ce problème, car, à notre connaissance, aucun changement n'a été apporté au dissipateur thermique du disque SSD.

* ... Moindre est la valeur, meilleures sont les performances
Disk Throttling: DiskSpd Read Loop, Queue Depth 8
Performance du GPU
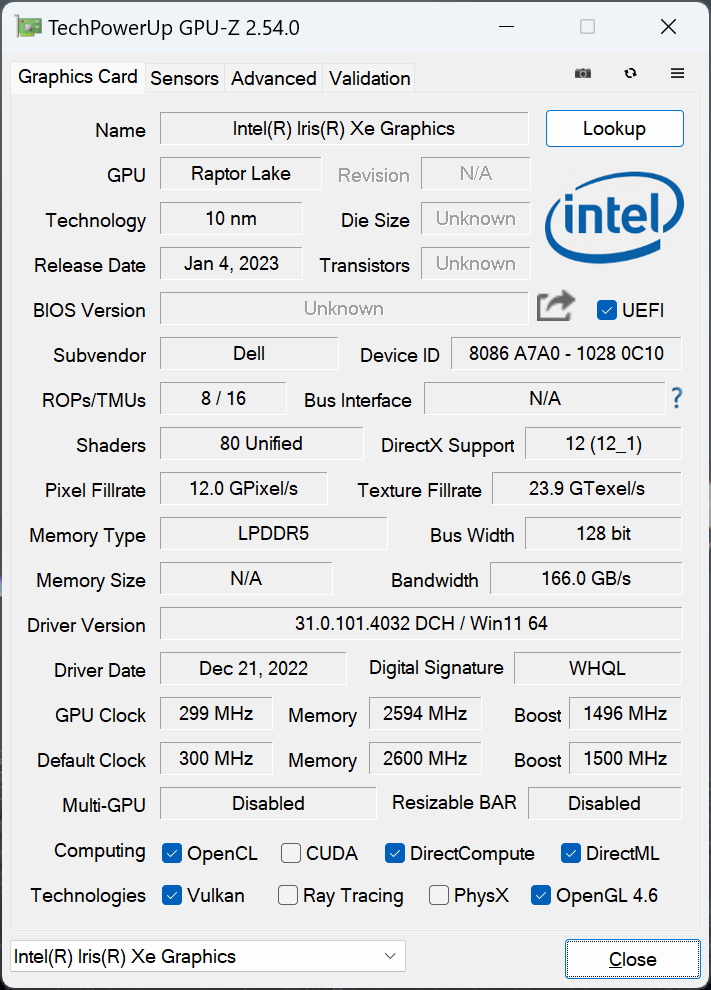
Les Iris Xe 96 EUs reste la solution graphique intégrée la plus rapide d'Intel, bien qu'elle ait quelques années d'existence. La version de cette année est légèrement plus rapide que celle de l'année dernière de quelques points de pourcentage en raison de la légère augmentation de la fréquence d'horloge de la mémoire, mais elle fait toujours pâle figure par rapport à la concurrente Radeon 680M ou 780M.
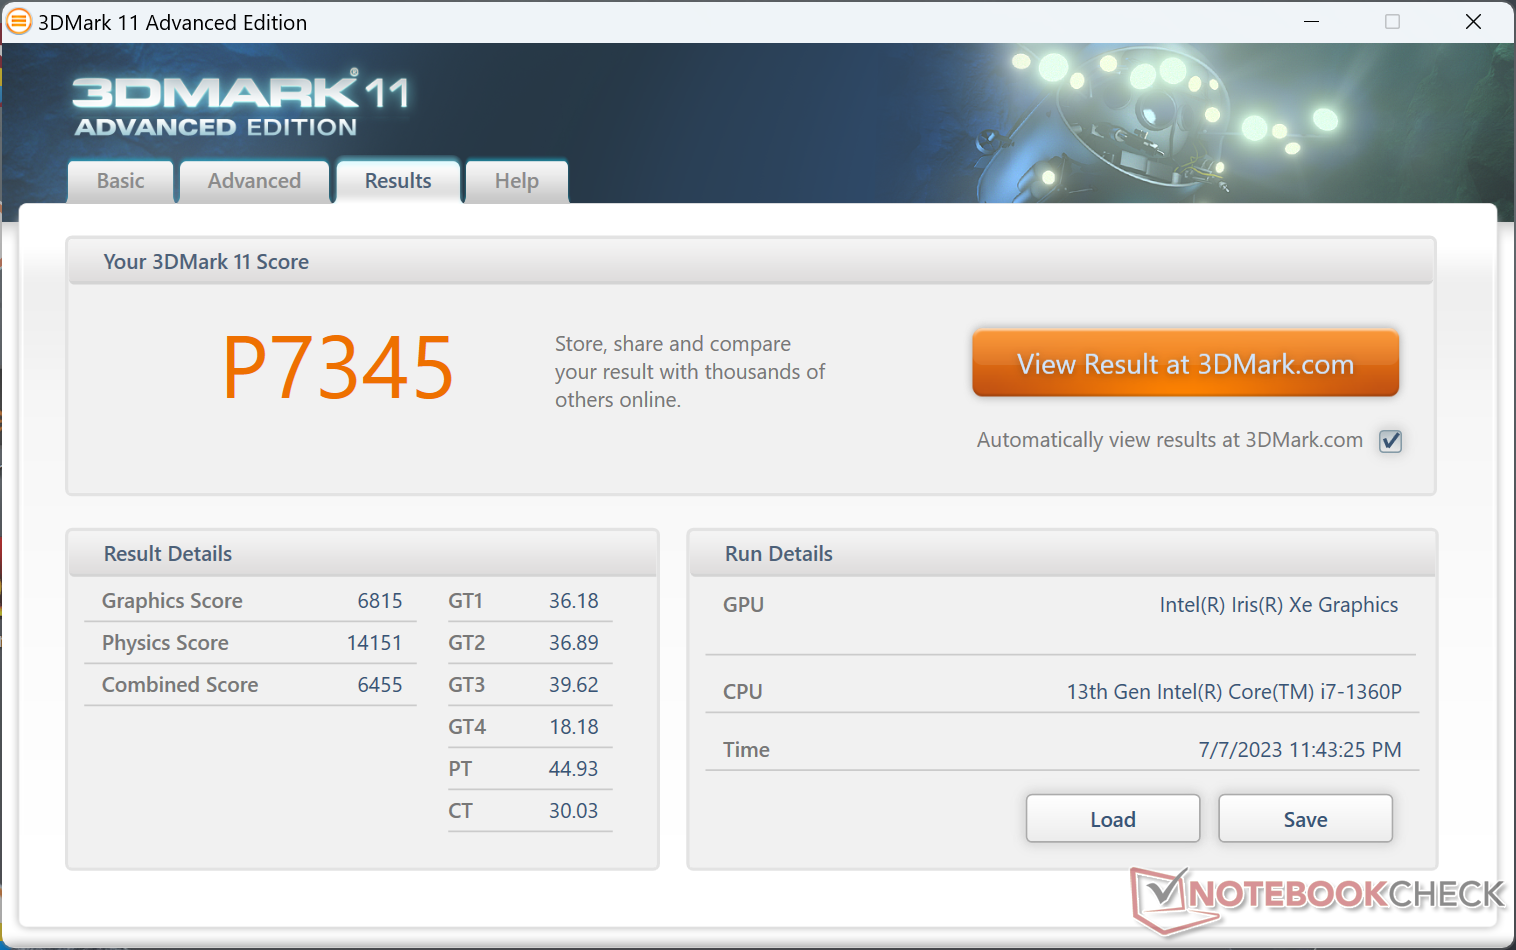
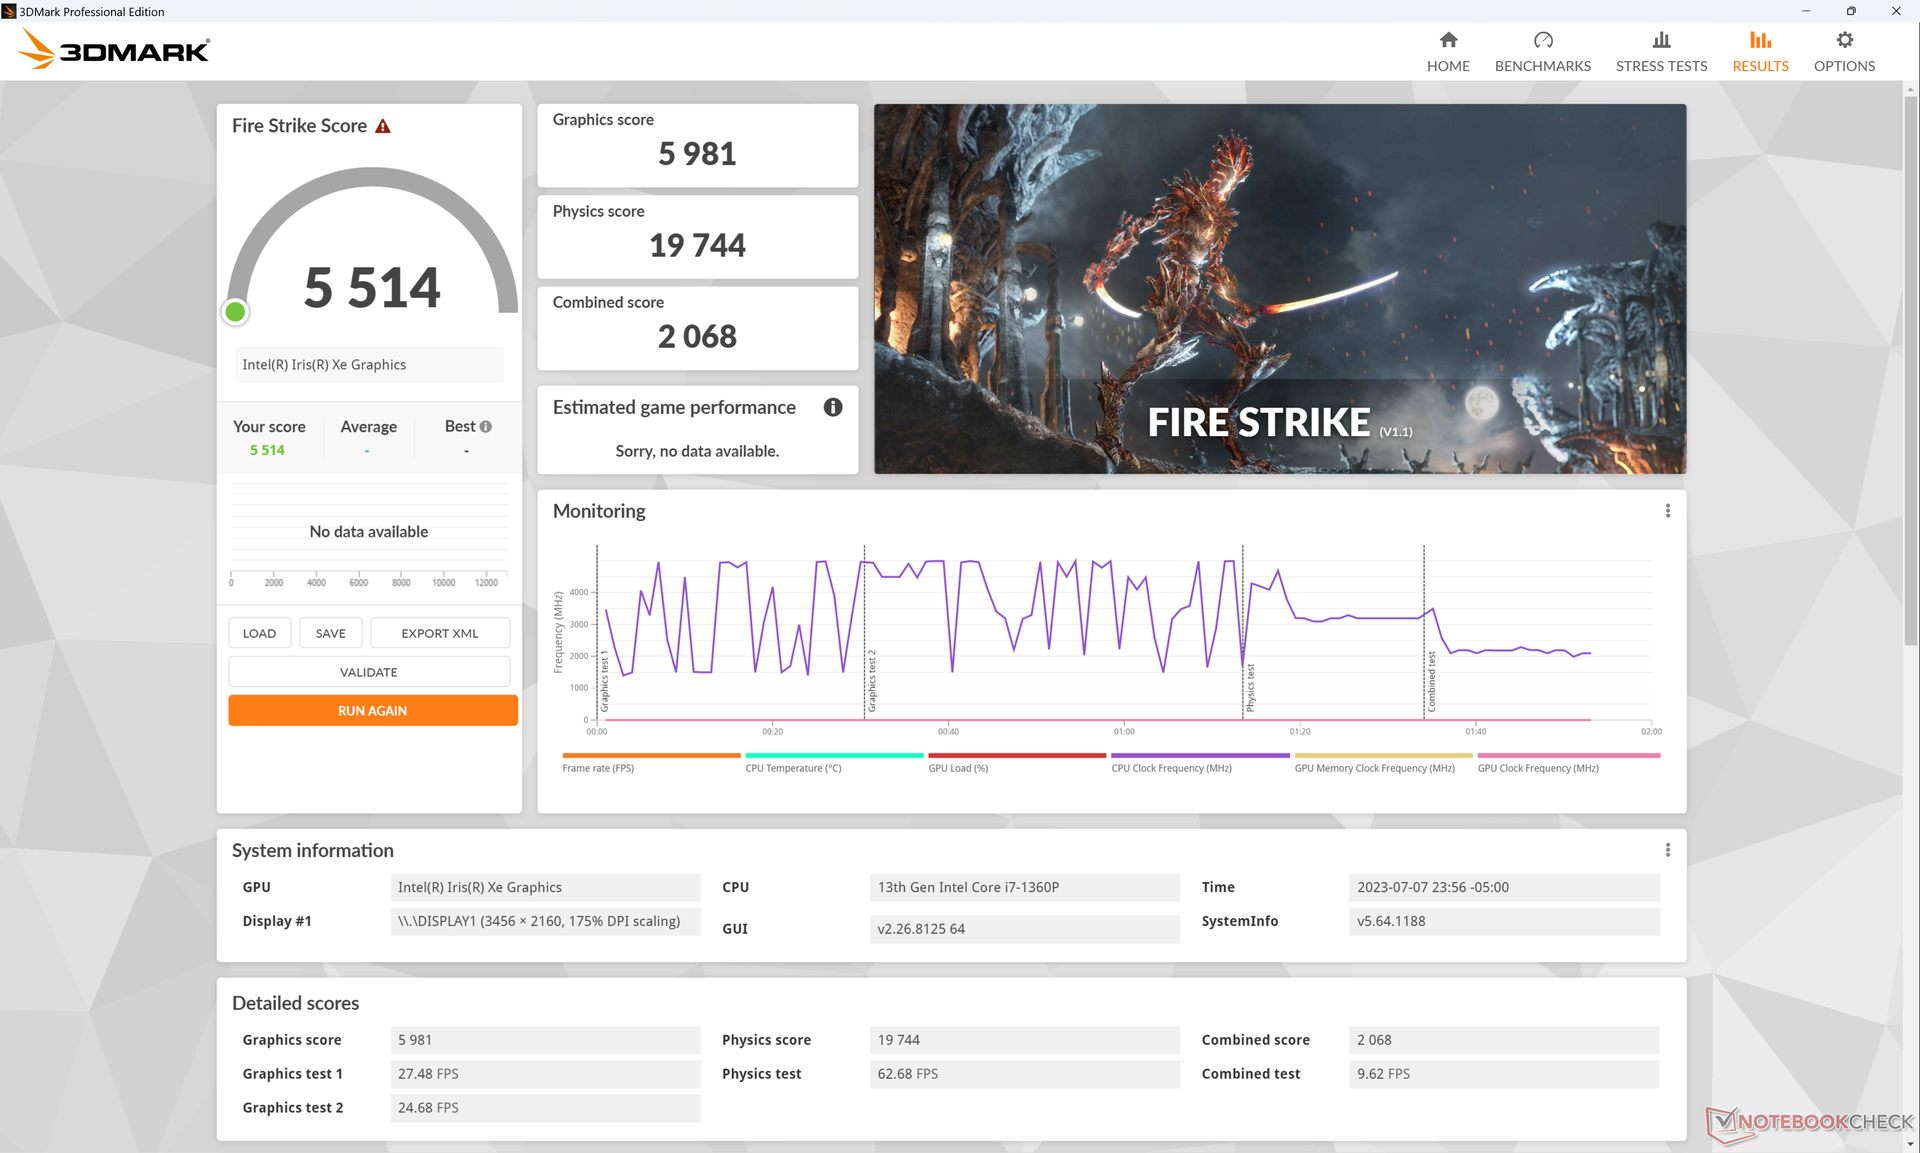
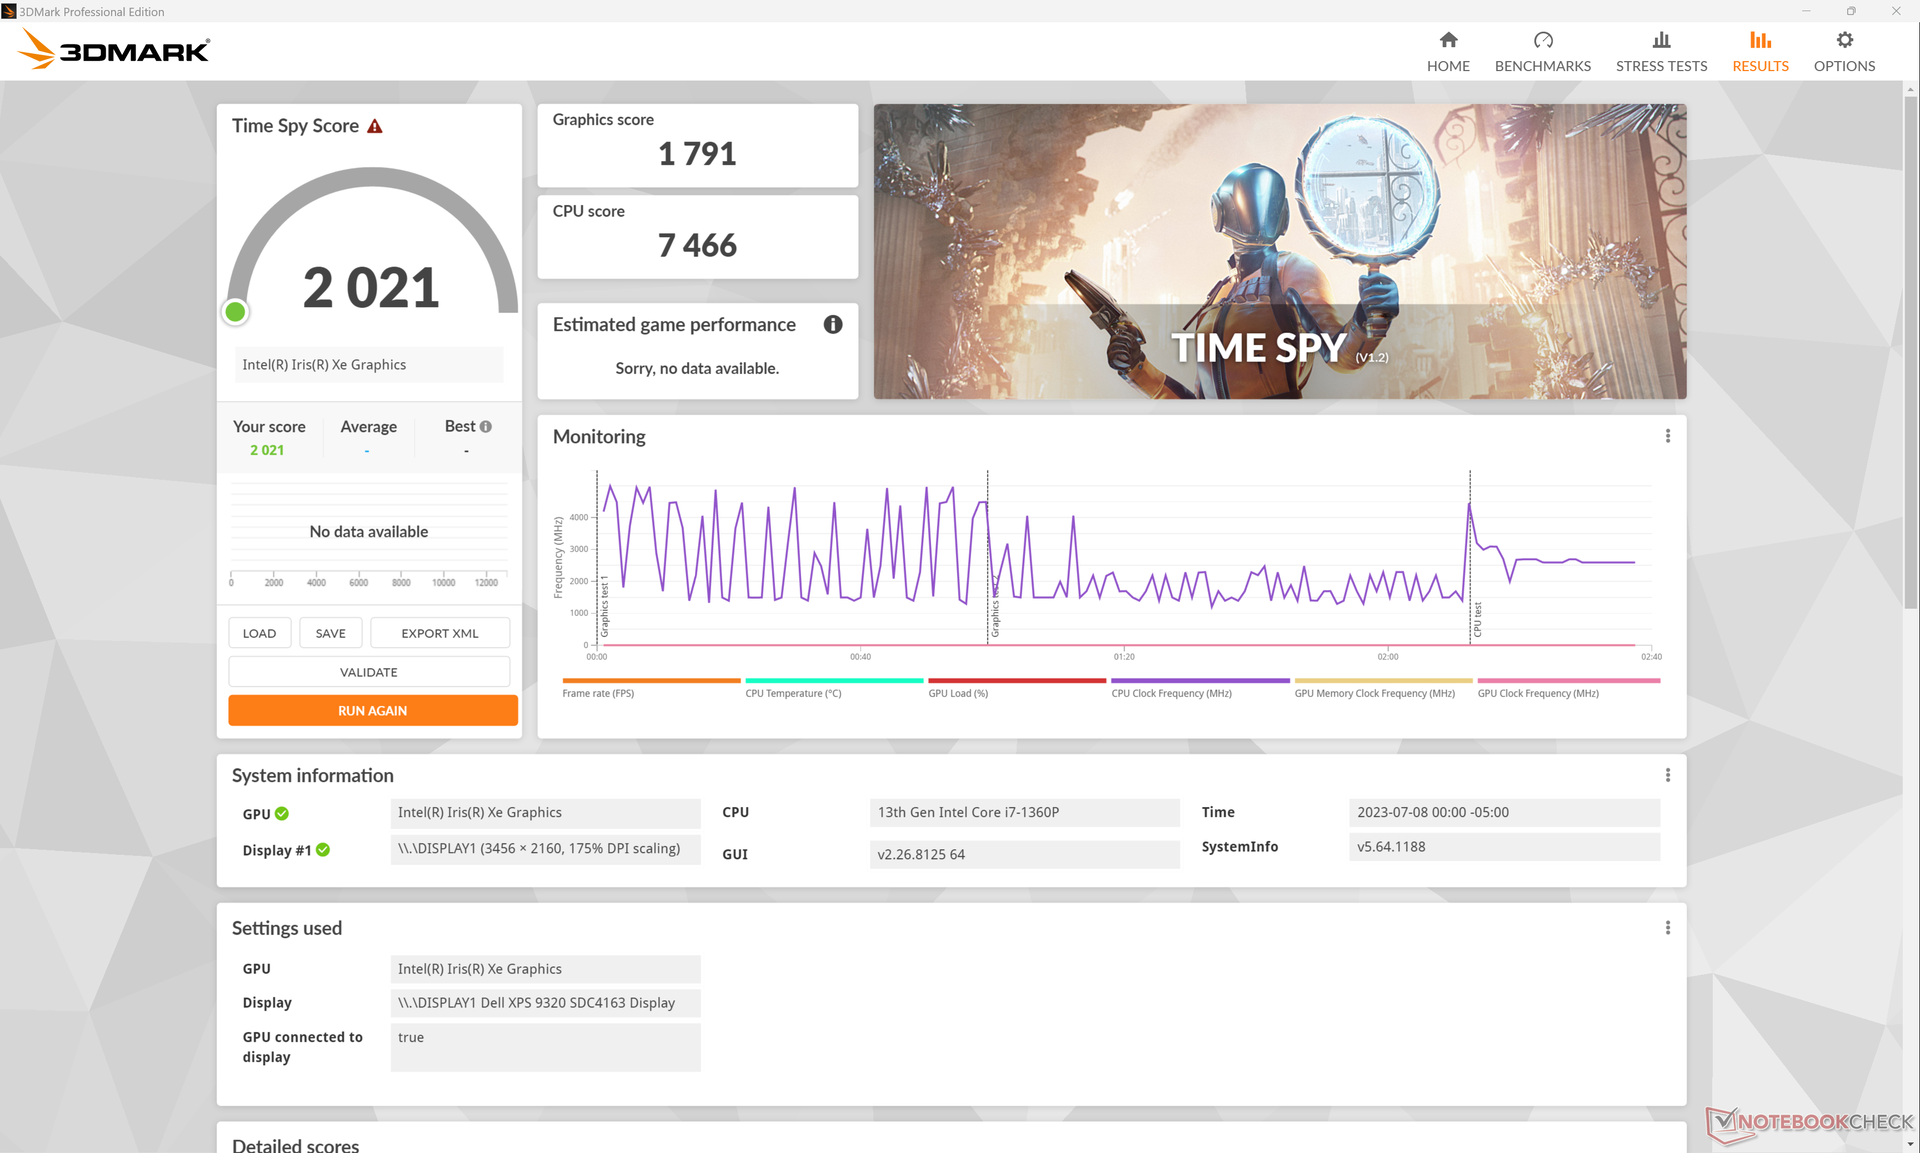
| 3DMark 11 Performance | 7345 points | |
| 3DMark Fire Strike Score | 5514 points | |
| 3DMark Time Spy Score | 2021 points | |
Aide | ||
* ... Moindre est la valeur, meilleures sont les performances
| Tiny Tina's Wonderlands | |
| 1920x1080 Low Preset (DX12) | |
| Framework Laptop 13.5 13th Gen Intel | |
| Moyenne Intel Iris Xe Graphics G7 96EUs (22.3 - 53, n=32) | |
| Dell XPS 13 Plus 9320 Core i7-1360P | |
| 1920x1080 Medium Preset (DX12) | |
| Framework Laptop 13.5 13th Gen Intel | |
| Dell XPS 13 Plus 9320 Core i7-1360P | |
| Moyenne Intel Iris Xe Graphics G7 96EUs (17 - 40.1, n=30) | |
| 1920x1080 High Preset (DX12) | |
| Framework Laptop 13.5 13th Gen Intel | |
| Dell XPS 13 Plus 9320 Core i7-1360P | |
| Moyenne Intel Iris Xe Graphics G7 96EUs (10.6 - 24.1, n=29) | |
| 1920x1080 Badass Preset (DX12) | |
| Framework Laptop 13.5 13th Gen Intel | |
| Dell XPS 13 Plus 9320 Core i7-1360P | |
| Moyenne Intel Iris Xe Graphics G7 96EUs (8.4 - 18.4, n=26) | |
| 1280x720 Lowest Preset (DX12) | |
| Dell XPS 13 Plus 9320 Core i7-1360P | |
| Moyenne Intel Iris Xe Graphics G7 96EUs (25.9 - 67.3, n=32) | |
Witcher 3 FPS Chart
| Bas | Moyen | Élevé | Ultra | QHD | |
|---|---|---|---|---|---|
| GTA V (2015) | 130.6 | 105.3 | 26.6 | 11.6 | 7.35 |
| The Witcher 3 (2015) | 86.7 | 56.1 | 33.9 | 15.4 | |
| Dota 2 Reborn (2015) | 125.6 | 97.7 | 68.7 | 61.6 | |
| Final Fantasy XV Benchmark (2018) | 44.5 | 25.2 | 17.5 | ||
| X-Plane 11.11 (2018) | 42.7 | 36.2 | 33.2 | ||
| Strange Brigade (2018) | 93.9 | 43.8 | 35.4 | 27.5 | |
| Cyberpunk 2077 1.6 (2022) | 20.8 | 17.3 | 13.6 | 11 | |
| Tiny Tina's Wonderlands (2022) | 29.6 | 23.7 | 15.2 | 12.2 | |
| F1 22 (2022) | 47.5 | 42.8 | 31.9 | 24.1 |
Émissions
Bruit du système
Bien qu'il n'y ait pas de changement au niveau de la solution de refroidissement ou des niveaux de bruit des ventilateurs, nous avons pu remarquer un léger bruit de bobine sur notre unité de test lorsque nous avons placé une oreille près des touches du clavier. Par ailleurs, les ventilateurs tournent au ralenti ou sont à peine audibles dans la plupart des cas de chargements légers tels que la navigation sur Internet ou le traitement de texte.
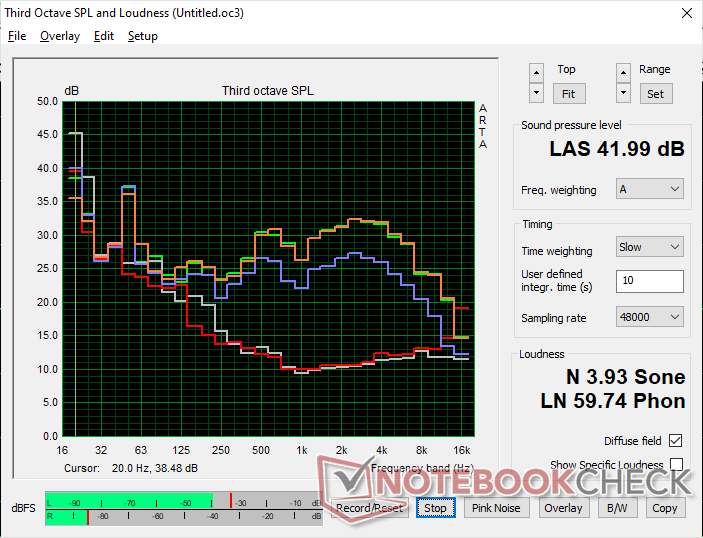
Degré de la nuisance sonore
| Au repos |
| 24 / 24 / 24.4 dB(A) |
| Fortement sollicité |
| 37 / 42 dB(A) |
 | ||
30 dB silencieux 40 dB(A) audible 50 dB(A) bruyant |
||
min: | ||
| Dell XPS 13 Plus 9320 Core i7-1360P Iris Xe G7 96EUs, i7-1360P, Samsung PM9A1 MZVL2512HCJQ | Dell XPS 13 Plus 9320 i7-1280P OLED Iris Xe G7 96EUs, i7-1280P, WDC PC SN810 512GB | Dell XPS 13 7390 Core i7-10710U UHD Graphics 620, i7-10710U, SK Hynix PC601 NVMe 512 GB | Framework Laptop 13.5 13th Gen Intel Iris Xe G7 96EUs, i7-1370P, WD PC SN740 SDDPNQD-1T00 | Lenovo ThinkPad X13 Yoga G3 21AW003UGE Iris Xe G7 96EUs, i7-1265U, Samsung PM9A1 MZVL2512HCJQ | HP Spectre x360 13.5 14t-ef000 Iris Xe G7 96EUs, i7-1255U, Micron 3400 1TB MTFDKBA1T0TFH | |
|---|---|---|---|---|---|---|
| Noise | 3% | -12% | -6% | -2% | 7% | |
| arrêt / environnement * (dB) | 23.7 | 23.4 1% | 28 -18% | 23.2 2% | 23.22 2% | 23.5 1% |
| Idle Minimum * (dB) | 24 | 23.4 2% | 28 -17% | 23.2 3% | 23.2 3% | 23.5 2% |
| Idle Average * (dB) | 24 | 23.4 2% | 28 -17% | 23.2 3% | 23.2 3% | 23.5 2% |
| Idle Maximum * (dB) | 24.4 | 23.4 4% | 28 -15% | 23.2 5% | 28.6 -17% | 23.5 4% |
| Load Average * (dB) | 37 | 35 5% | 33.7 9% | 45.3 -22% | 39.8 -8% | 27 27% |
| Witcher 3 ultra * (dB) | 42.1 | 41.6 1% | 47.9 -14% | 41.8 1% | 36.2 14% | |
| Load Maximum * (dB) | 42 | 39.9 5% | 46.5 -11% | 49.2 -17% | 40.6 3% | 42.4 -1% |
* ... Moindre est la valeur, meilleures sont les performances
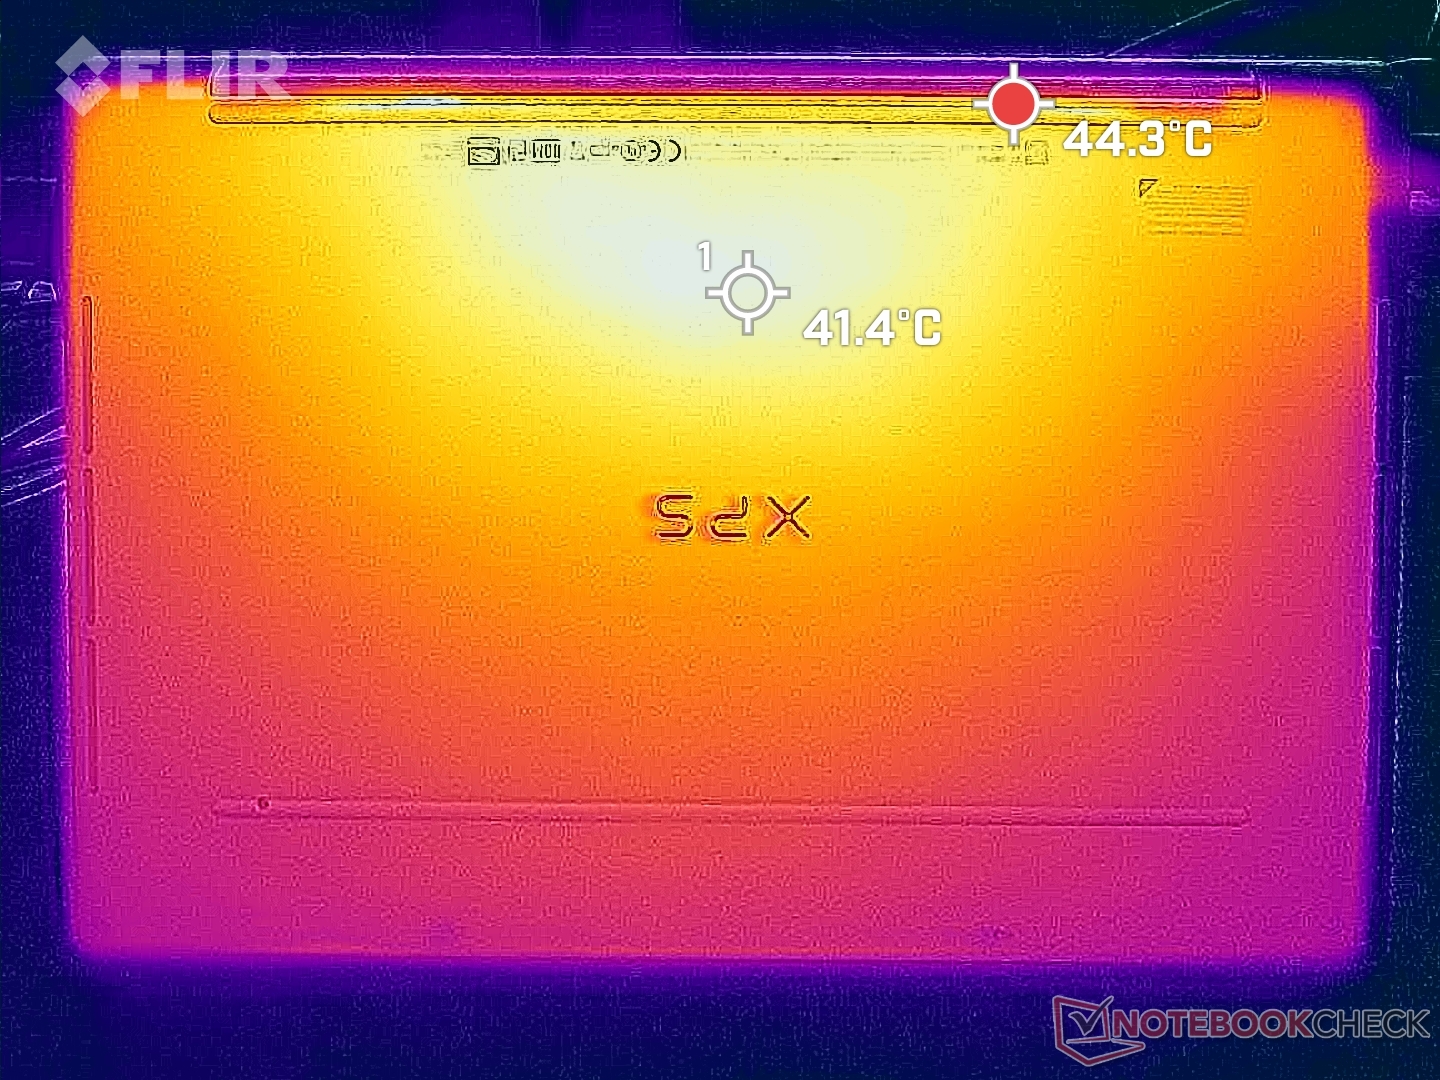
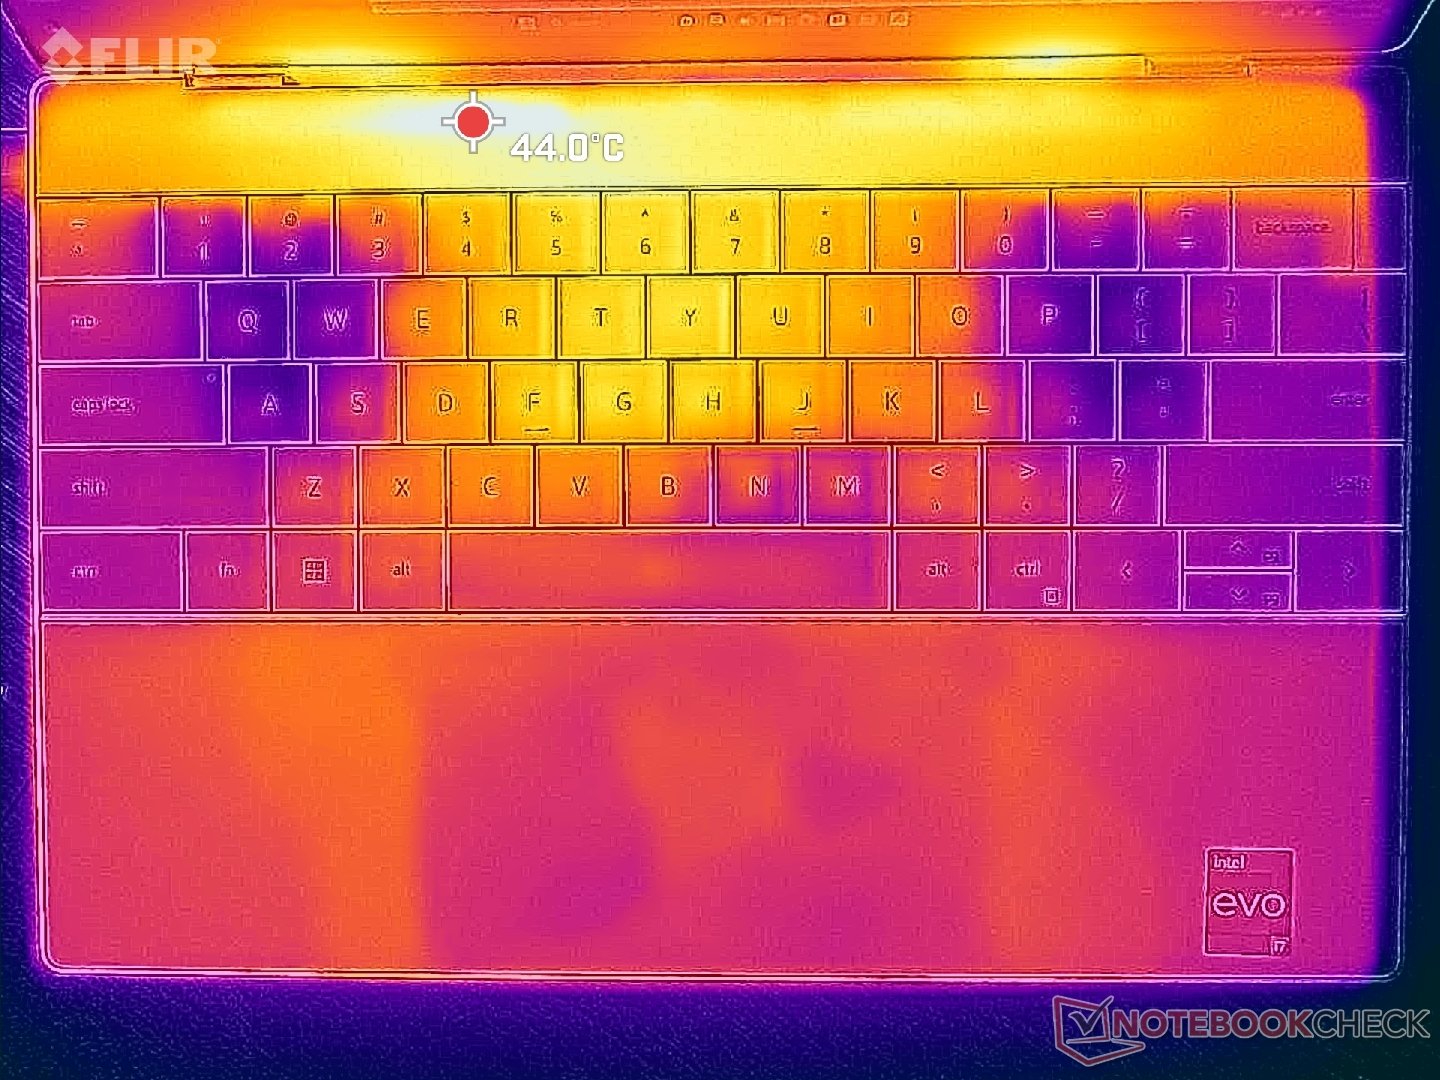
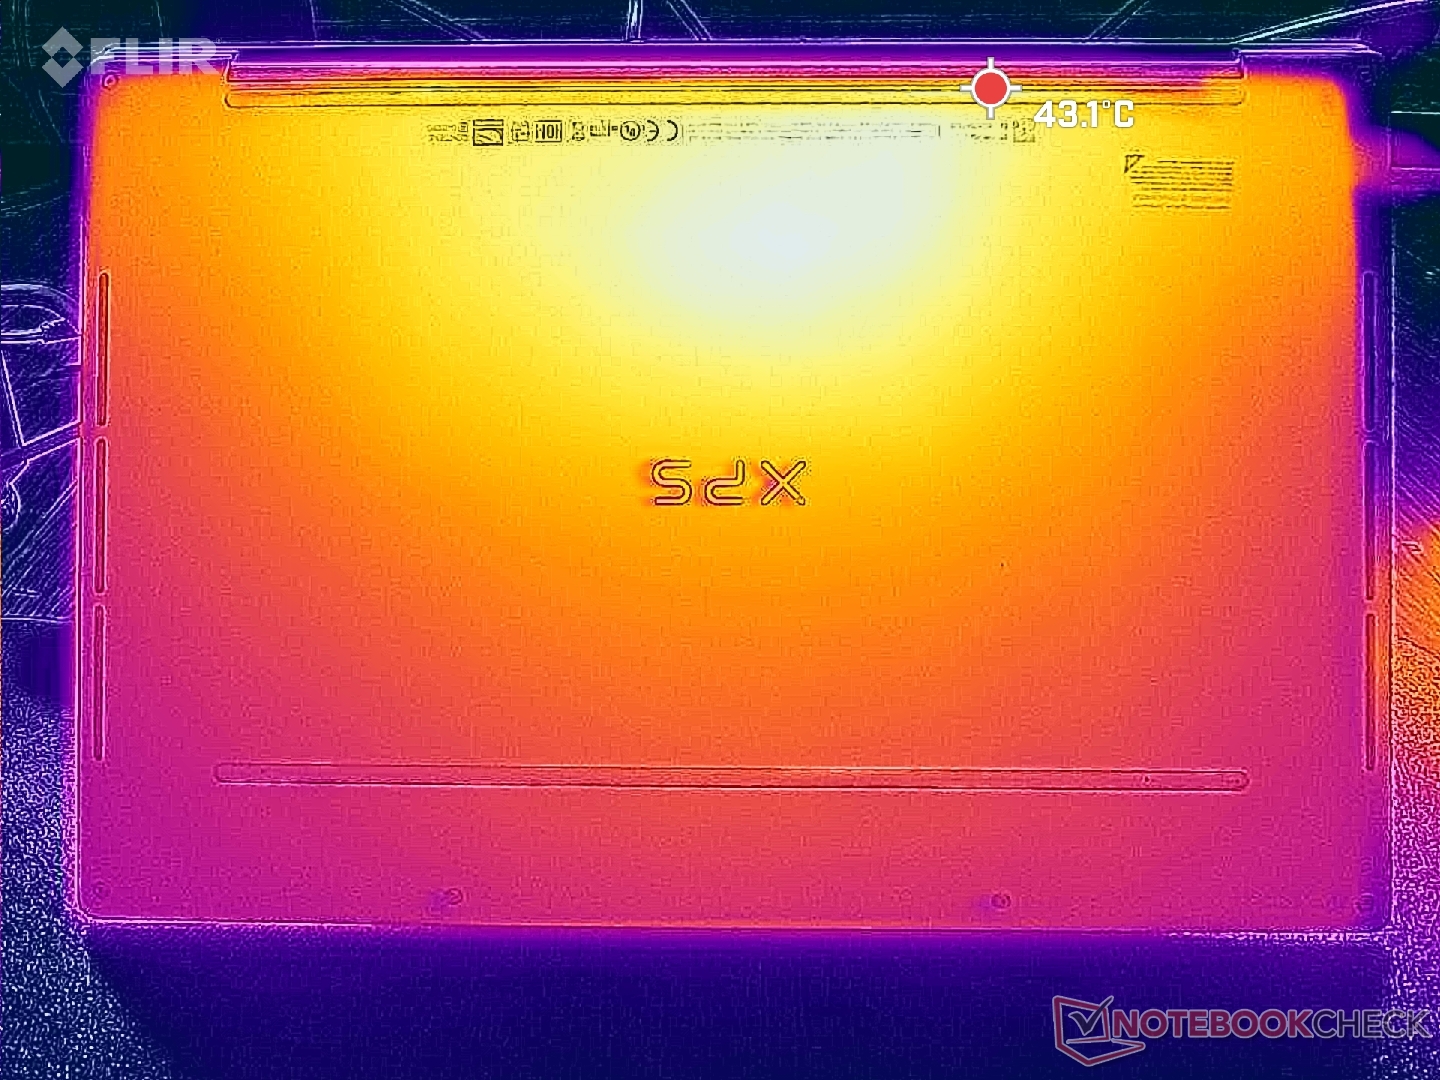
Température
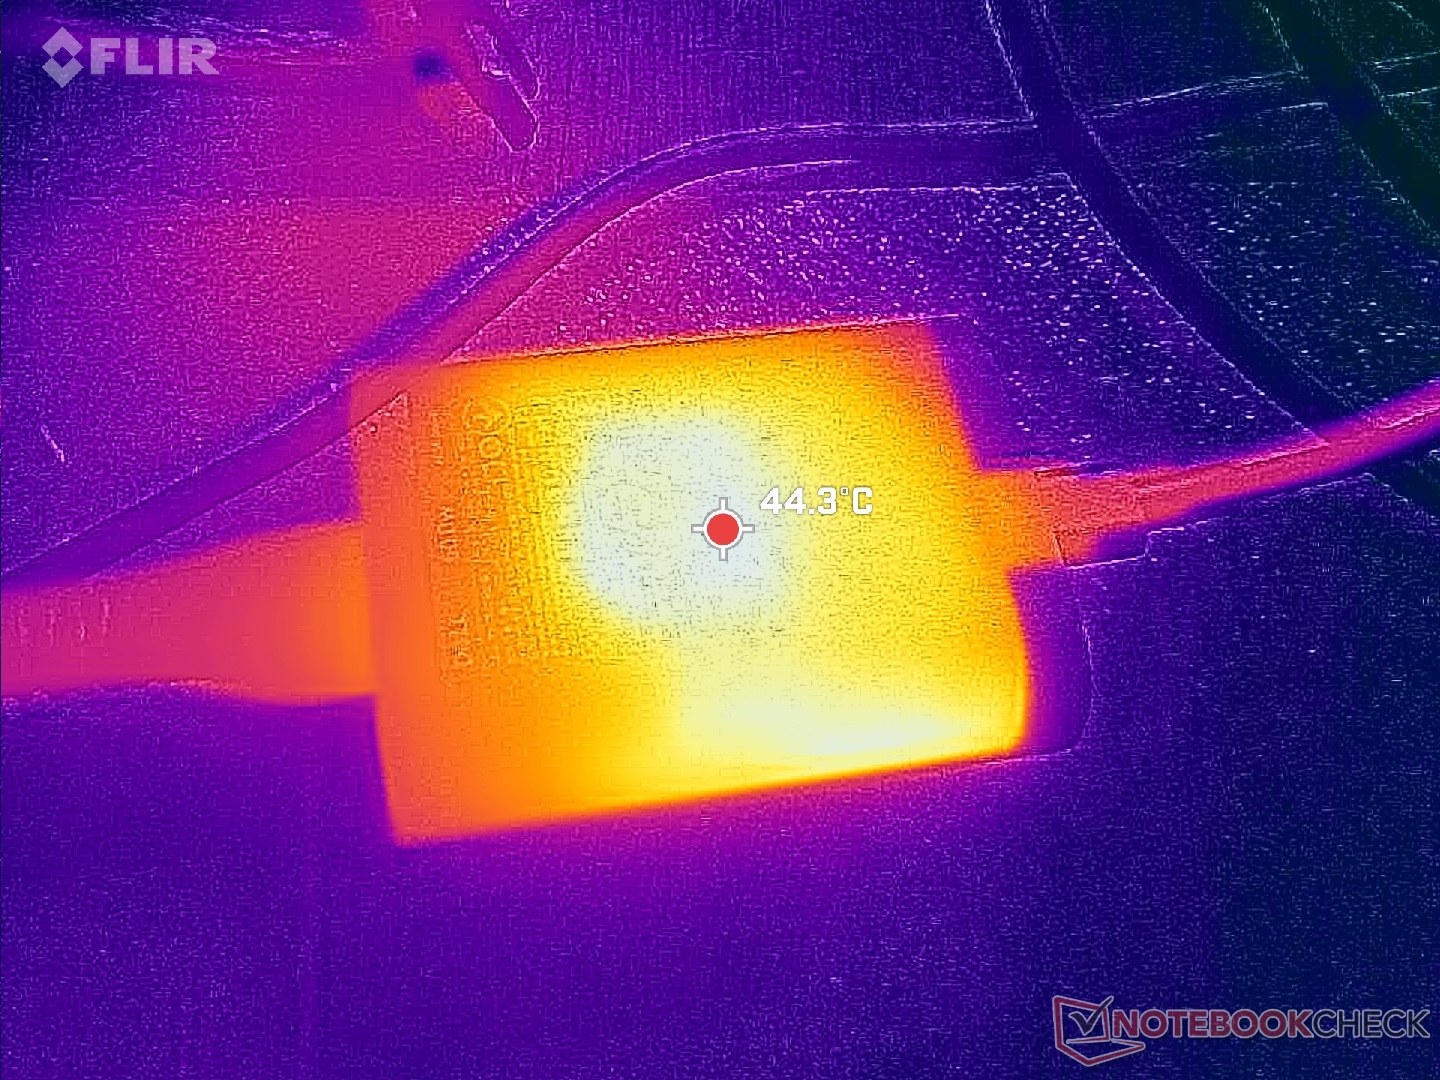
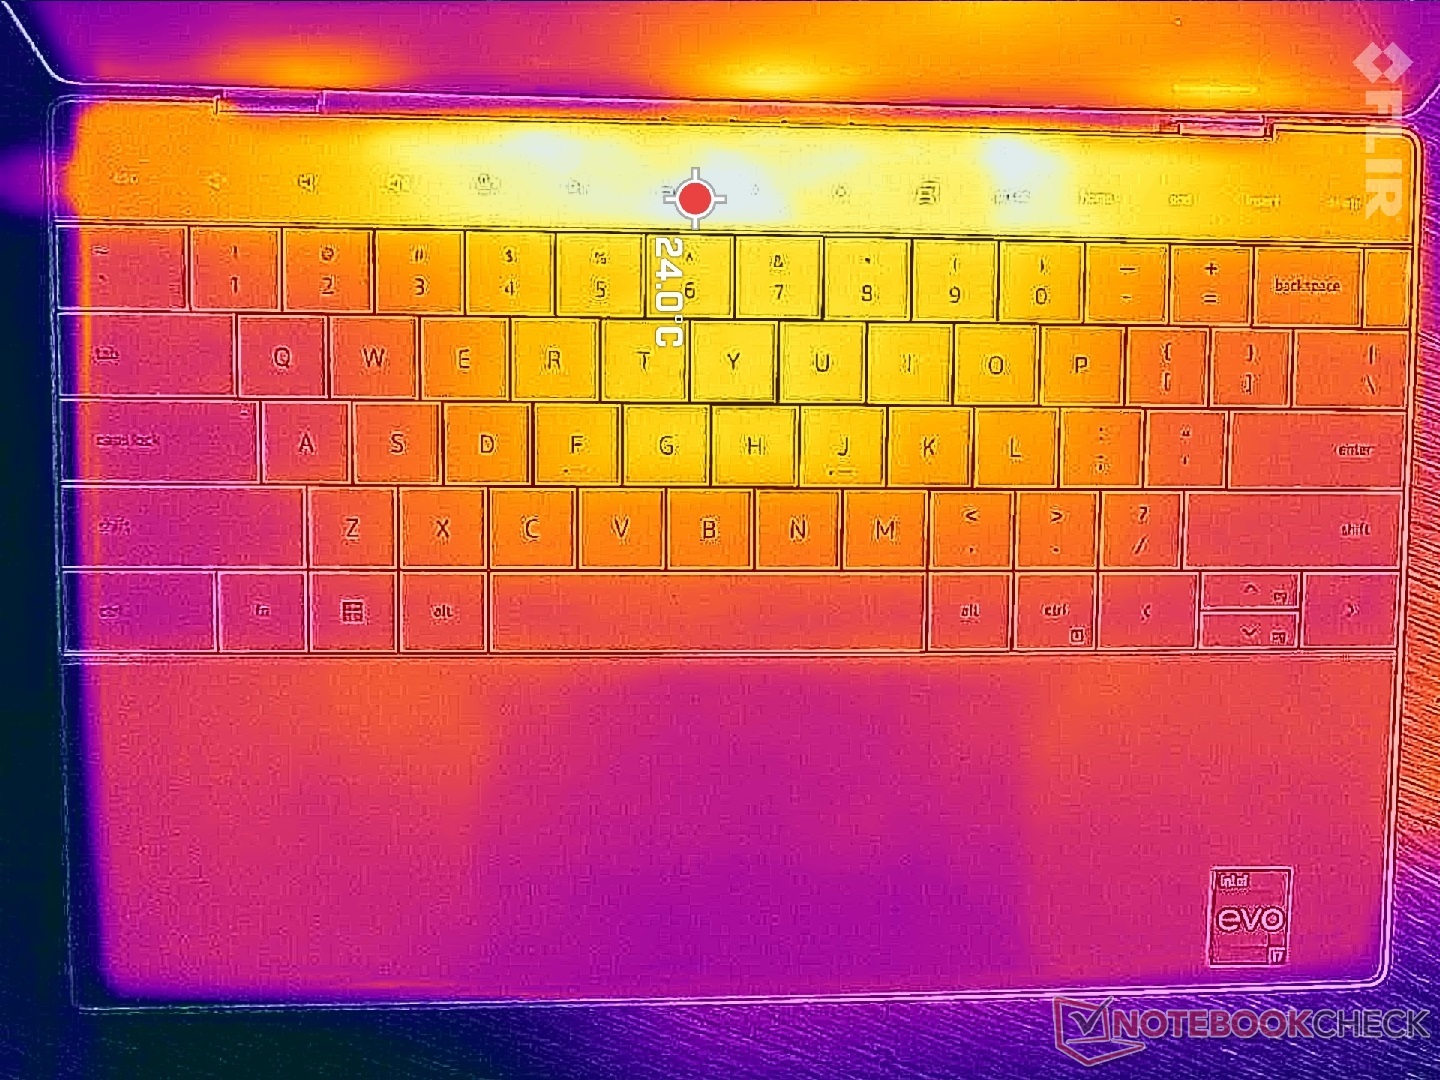
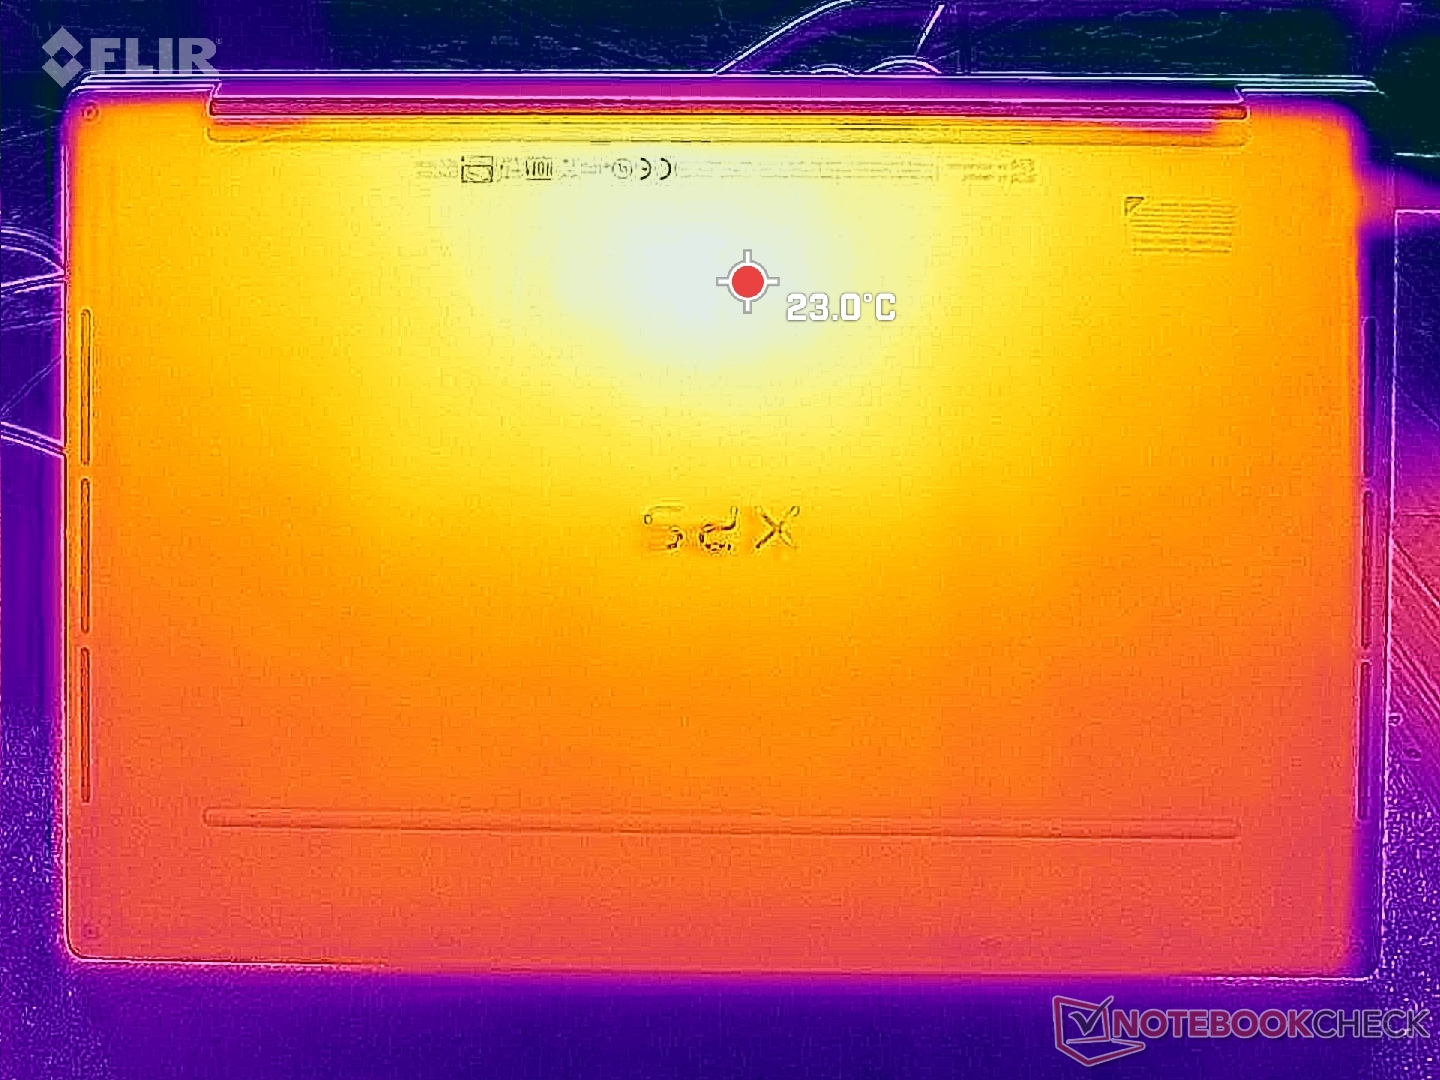
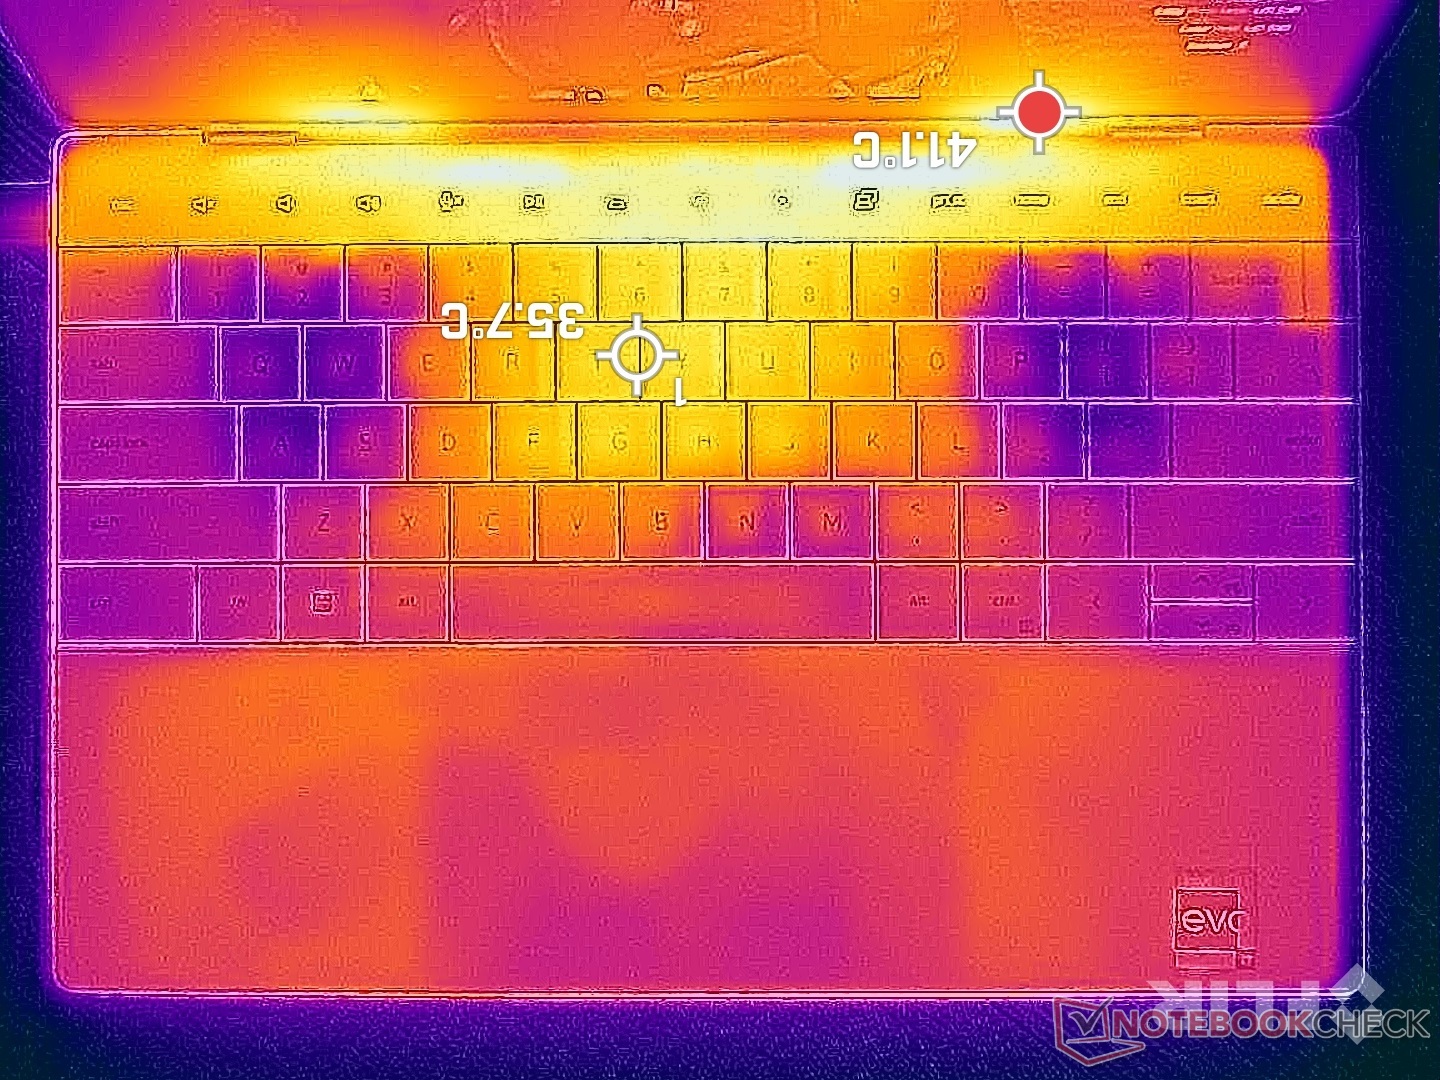
Les températures de surface peuvent être très élevées en raison de la finesse du profil, du processeur Core-P et de l'absence de grilles d'aération sur le panneau inférieur. Les points chauds peuvent atteindre jusqu'à 45°C, contre 35°C pour l'ordinateur plus lent HP Dragonfly Folio 13.5 G3.
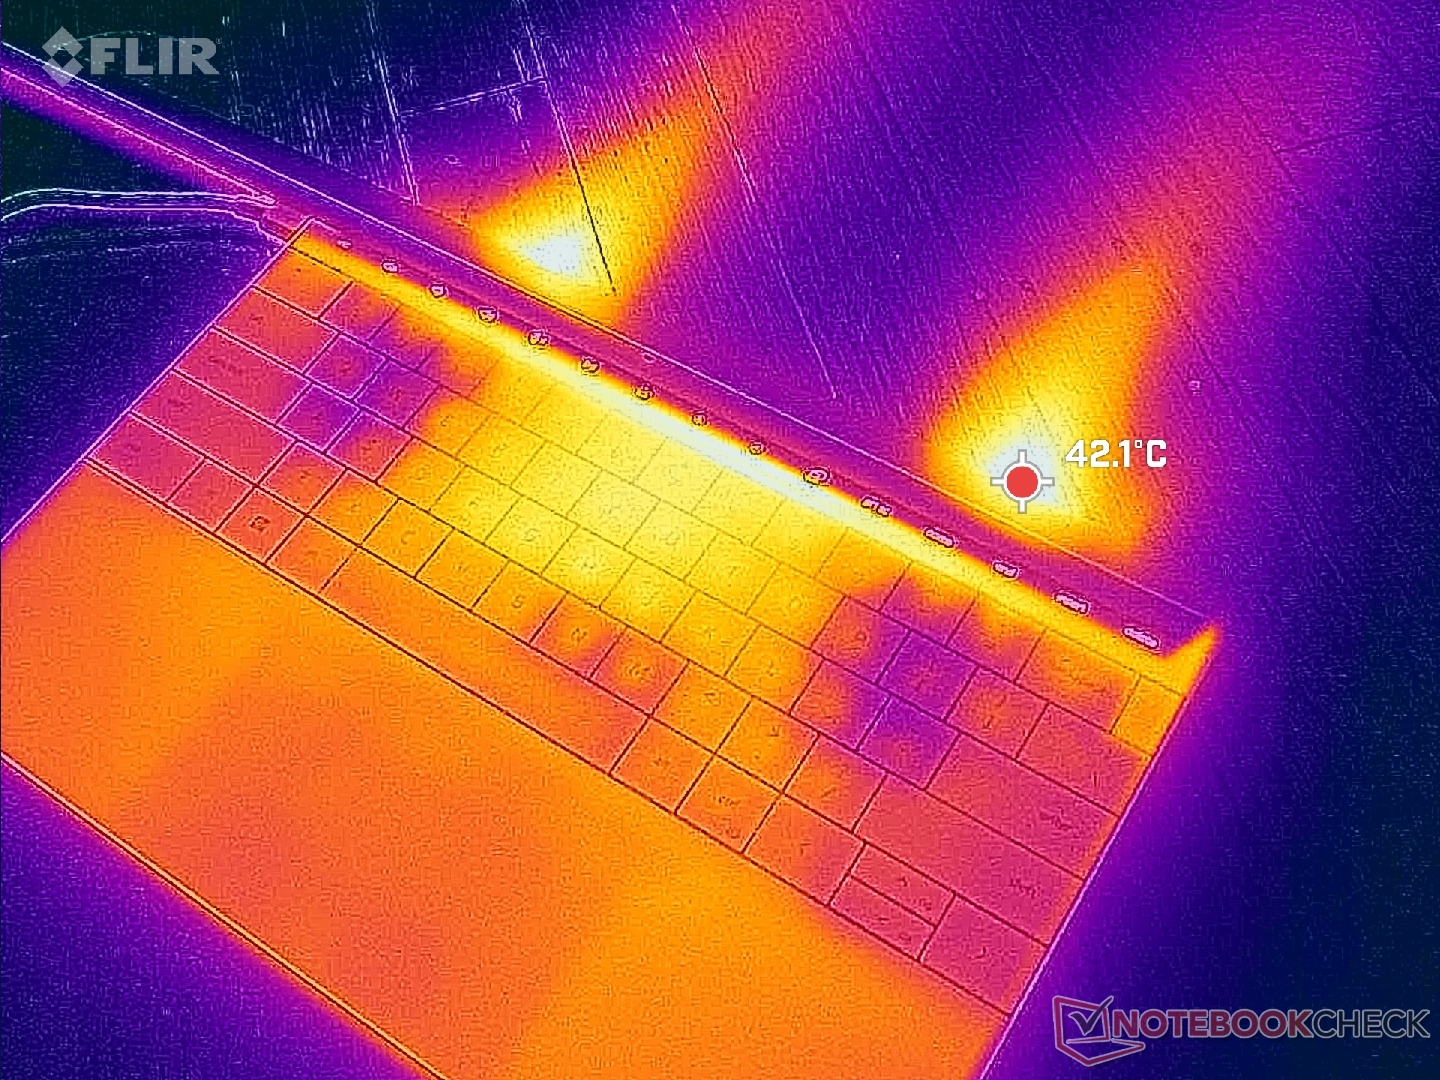
(±) La température maximale du côté supérieur est de 43.8 °C / 111 F, par rapport à la moyenne de 35.9 °C / 97 F, allant de 21.4 à 59 °C pour la classe Subnotebook.
(±) Le fond chauffe jusqu'à un maximum de 44.4 °C / 112 F, contre une moyenne de 39.2 °C / 103 F
(+) En utilisation inactive, la température moyenne du côté supérieur est de 22.4 °C / 72 F, par rapport à la moyenne du dispositif de 30.8 °C / 87 F.
(±) En jouant à The Witcher 3, la température moyenne du côté supérieur est de 32.9 °C / 91 F, alors que la moyenne de l'appareil est de 30.8 °C / 87 F.
(+) Les repose-poignets et le pavé tactile atteignent la température maximale de la peau (32.6 °C / 90.7 F) et ne sont donc pas chauds.
(-) La température moyenne de la zone de l'appui-paume de dispositifs similaires était de 28.2 °C / 82.8 F (-4.4 °C / #-7.9 F).
| Dell XPS 13 Plus 9320 Core i7-1360P Intel Core i7-1360P, Intel Iris Xe Graphics G7 96EUs | Dell XPS 13 Plus 9320 i5-1240p Intel Core i5-1240P, Intel Iris Xe Graphics G7 80EUs | Dell XPS 13 7390 Core i7-10710U Intel Core i7-10710U, Intel UHD Graphics 620 | Framework Laptop 13.5 13th Gen Intel Intel Core i7-1370P, Intel Iris Xe Graphics G7 96EUs | Lenovo ThinkPad X13 Yoga G3 21AW003UGE Intel Core i7-1265U, Intel Iris Xe Graphics G7 96EUs | HP Spectre x360 13.5 14t-ef000 Intel Core i7-1255U, Intel Iris Xe Graphics G7 96EUs | |
|---|---|---|---|---|---|---|
| Heat | -41% | -13% | 1% | -25% | 14% | |
| Maximum Upper Side * (°C) | 43.8 | 47.6 -9% | 44.6 -2% | 38.2 13% | 52.2 -19% | 36.4 17% |
| Maximum Bottom * (°C) | 44.4 | 57 -28% | 49.2 -11% | 41.4 7% | 50.2 -13% | 37 17% |
| Idle Upper Side * (°C) | 24 | 38.8 -62% | 28.2 -18% | 25.8 -8% | 32 -33% | 20.8 13% |
| Idle Bottom * (°C) | 25.2 | 41 -63% | 30.2 -20% | 27.6 -10% | 33.6 -33% | 22.6 10% |
* ... Moindre est la valeur, meilleures sont les performances
Test de stress
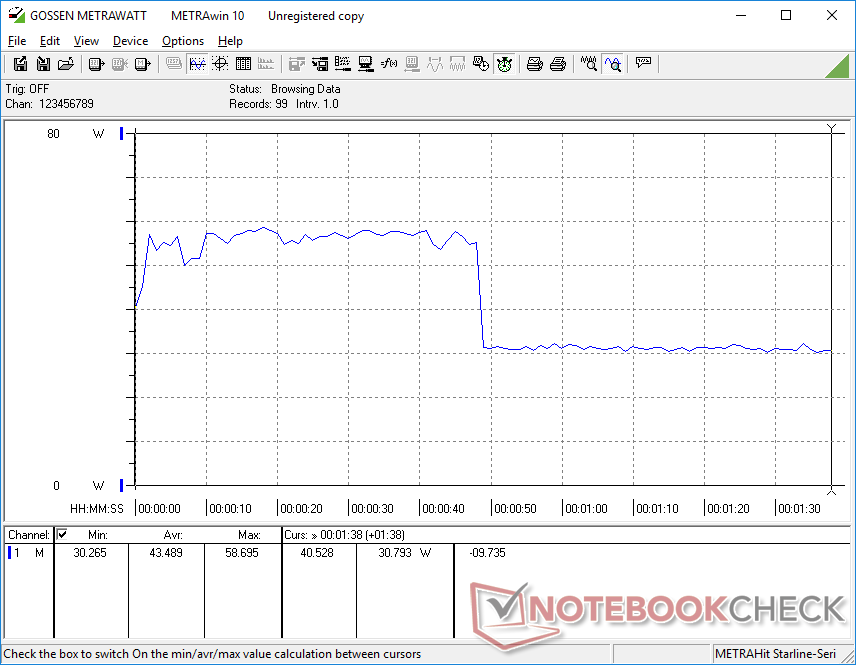
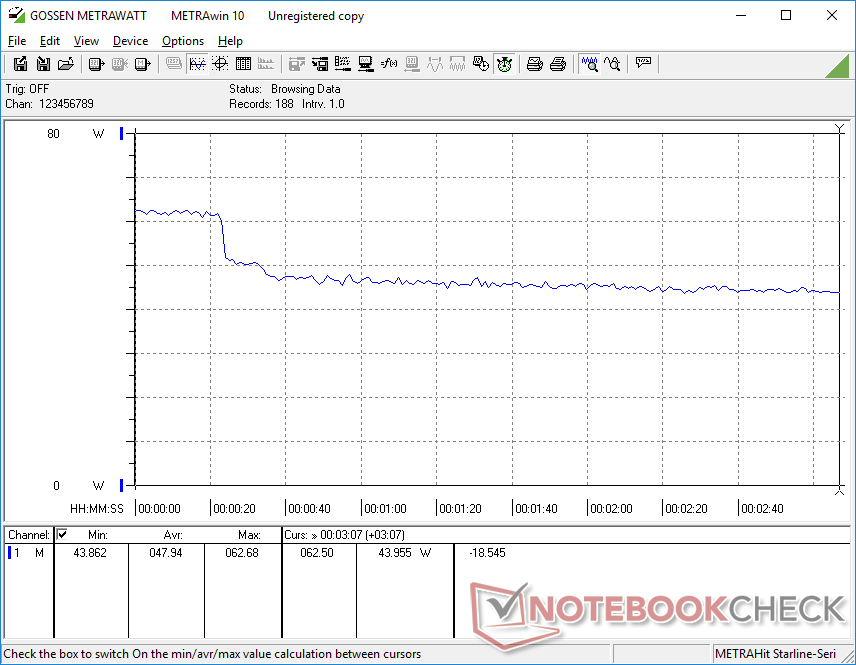
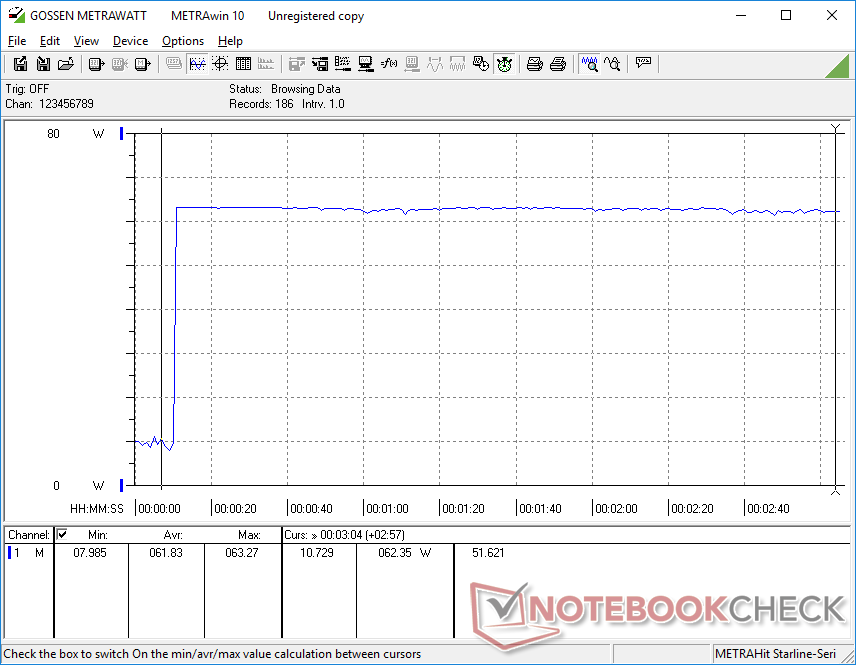
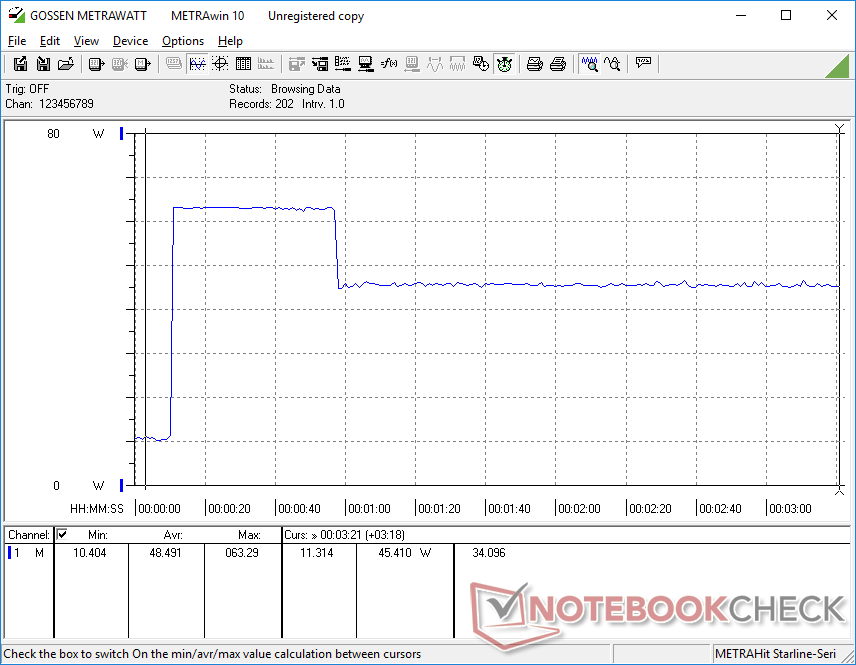
Sous Prime95, les limites PL2 et PL1 du Core i7-1360P sont exactement les mêmes que celles que nous avons observées sur le XPS 13 Plus équipé du Core i7-1280P de l'année dernière, à savoir 64 W et 34 W, respectivement. Les fréquences d'horloge montaient jusqu'à 3,6 GHz pendant la première seconde environ avant de redescendre et de se stabiliser à 2,3 GHz et 90 C. La température très élevée du processeur est en partie responsable des températures de surface élevées mentionnées plus haut.
Le fonctionnement sur batterie n'a pas d'incidence sur les performances. Un test 3DMark 11 sur batterie donnerait essentiellement les mêmes résultats que sur secteur.
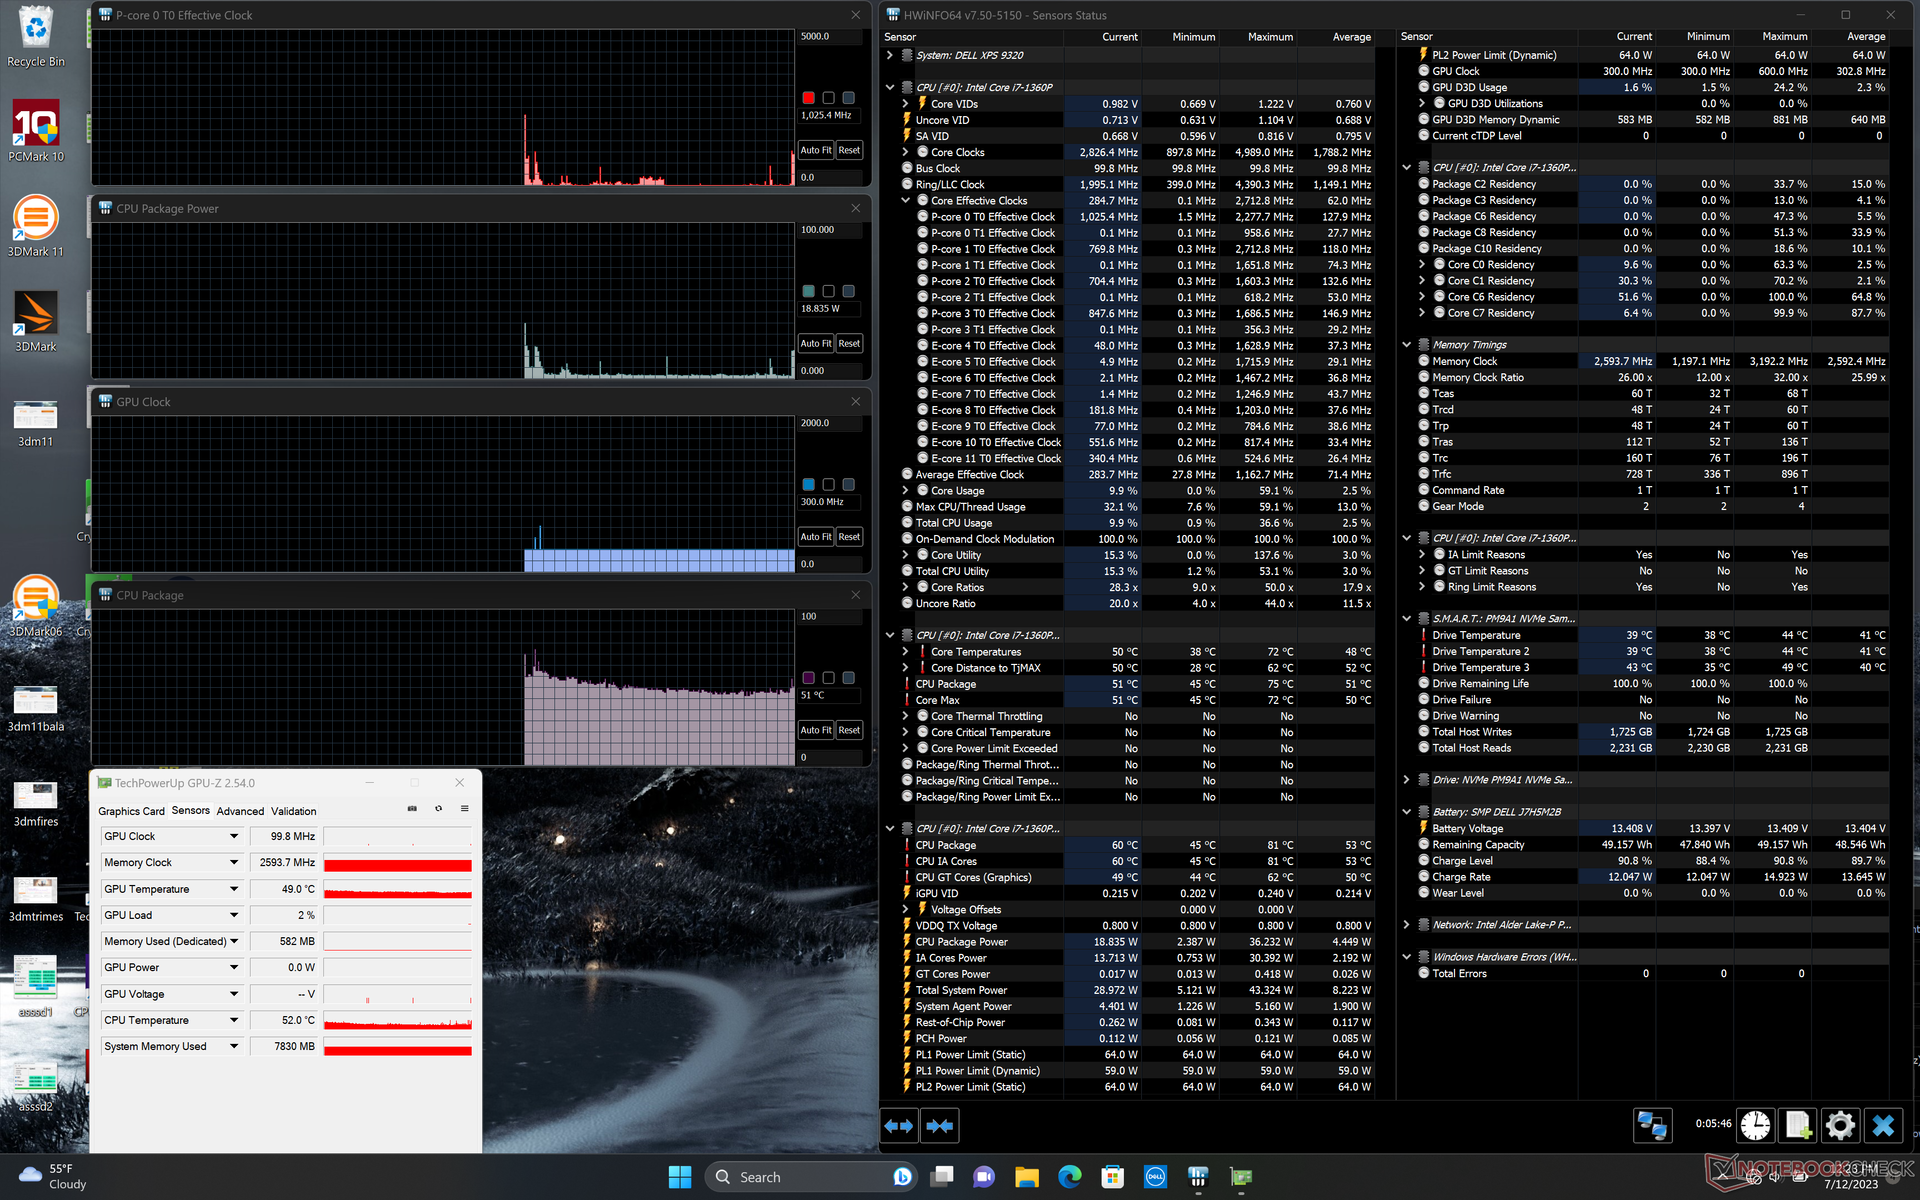
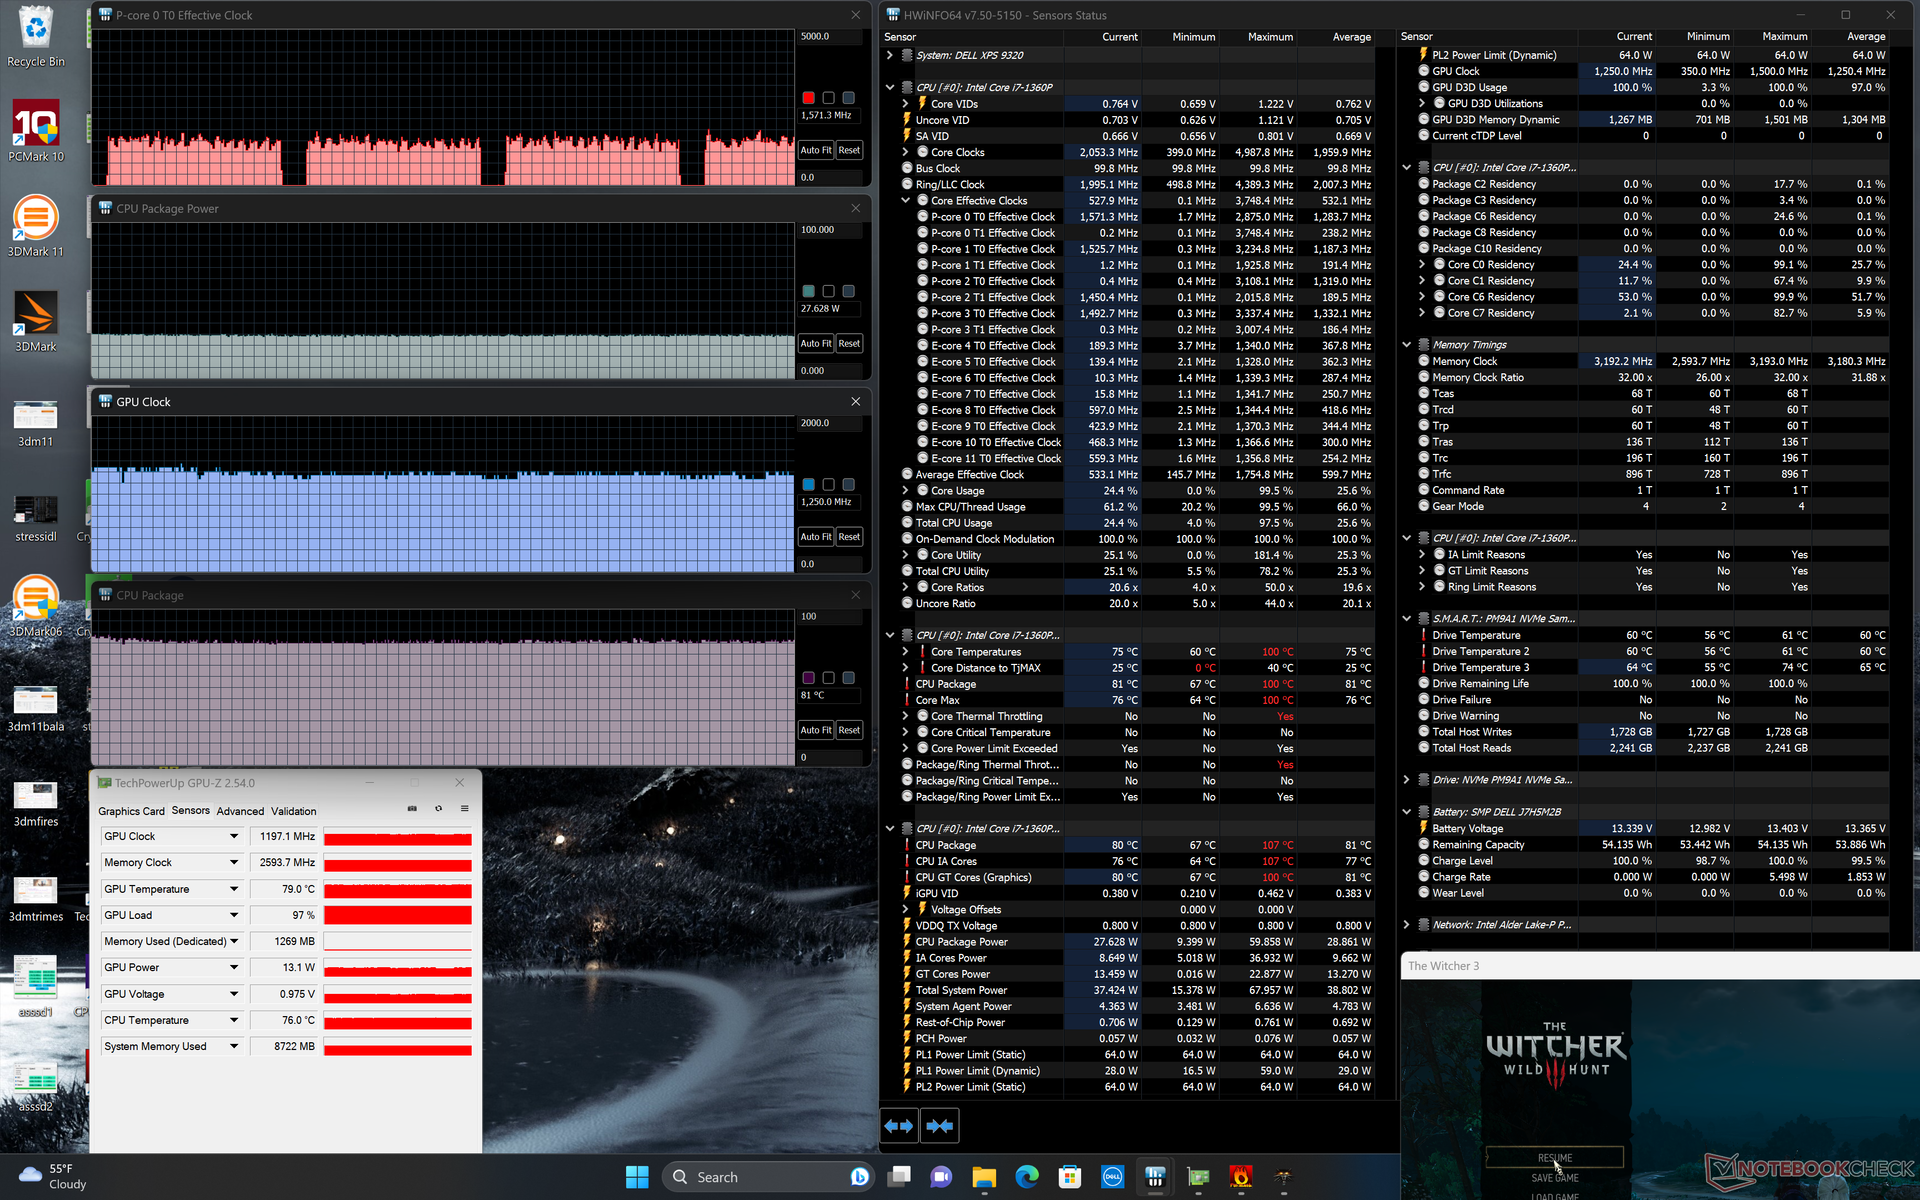
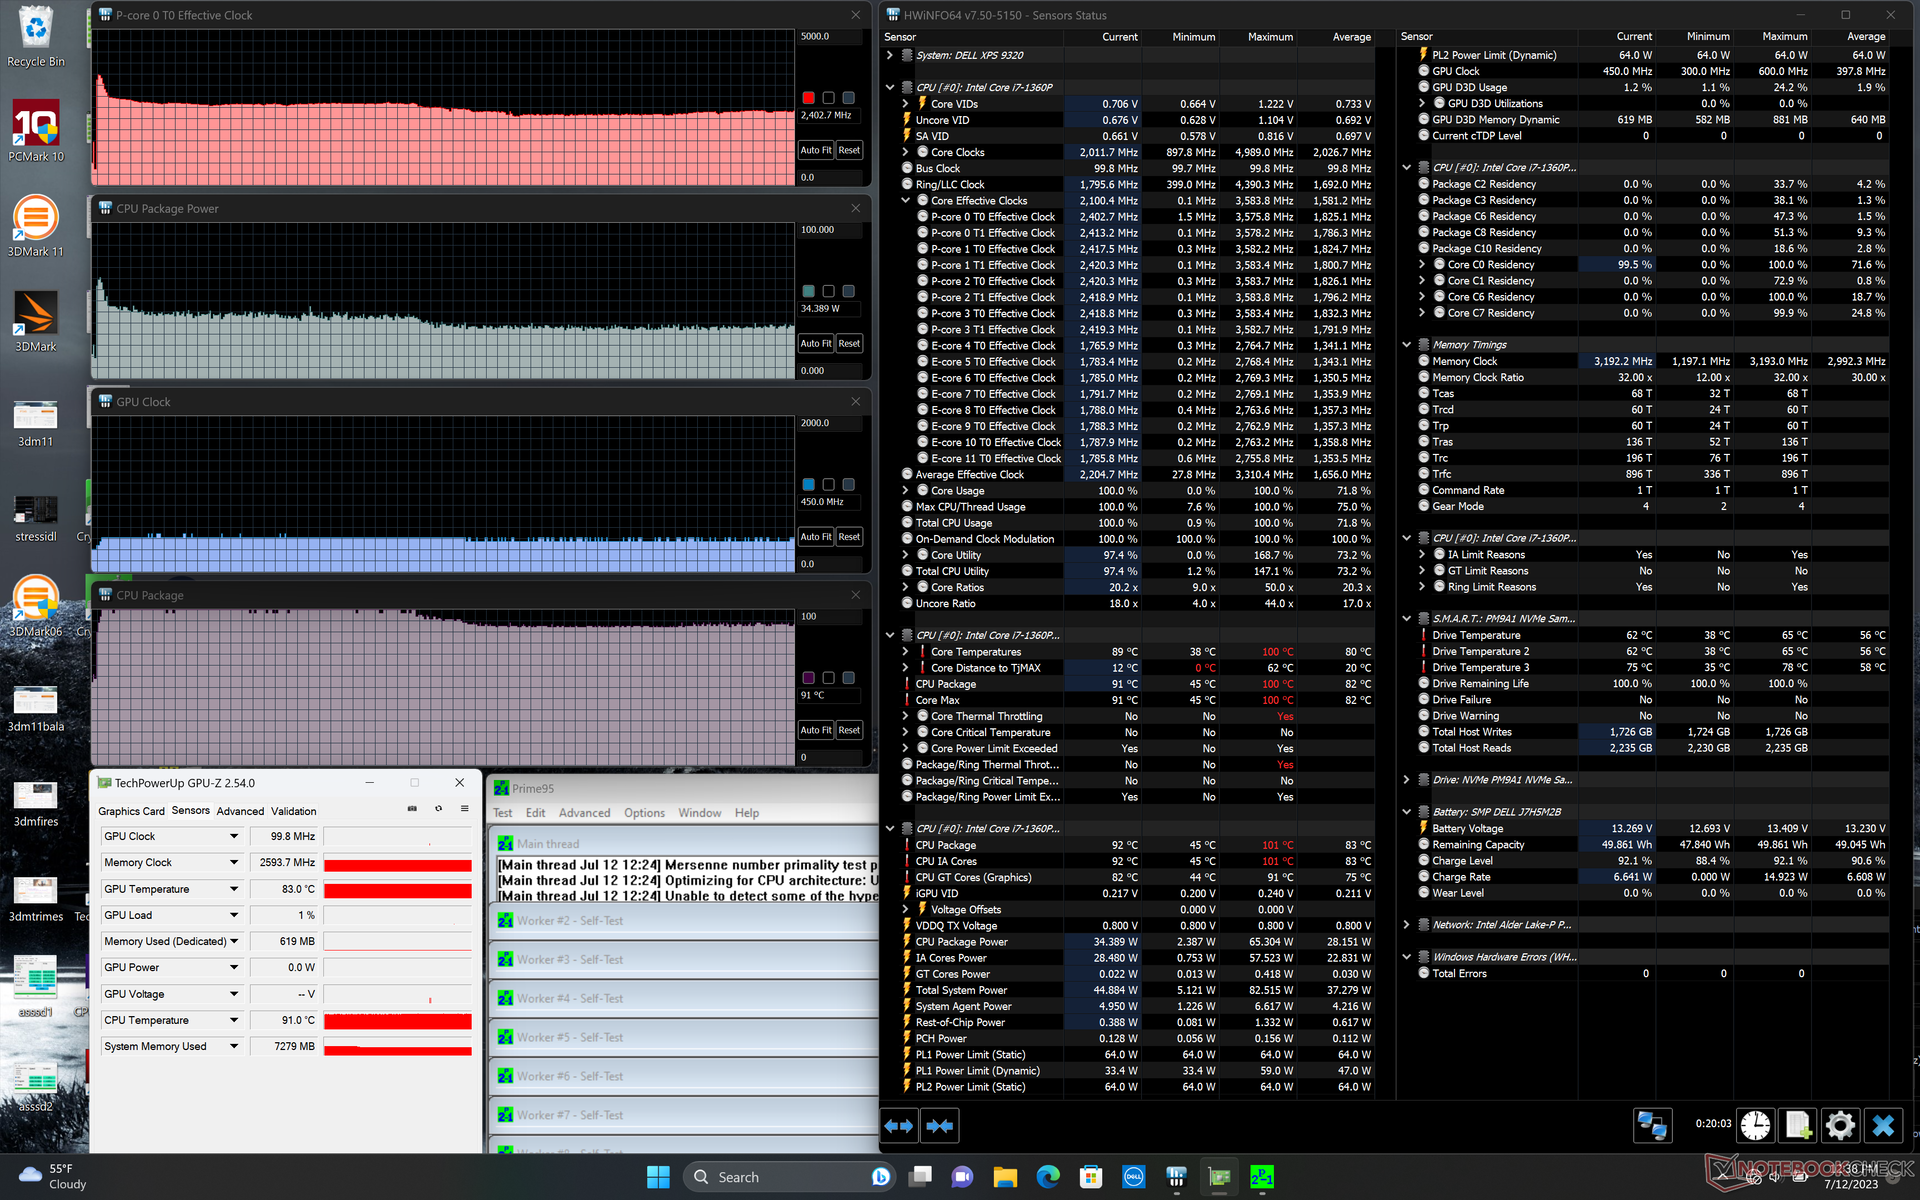
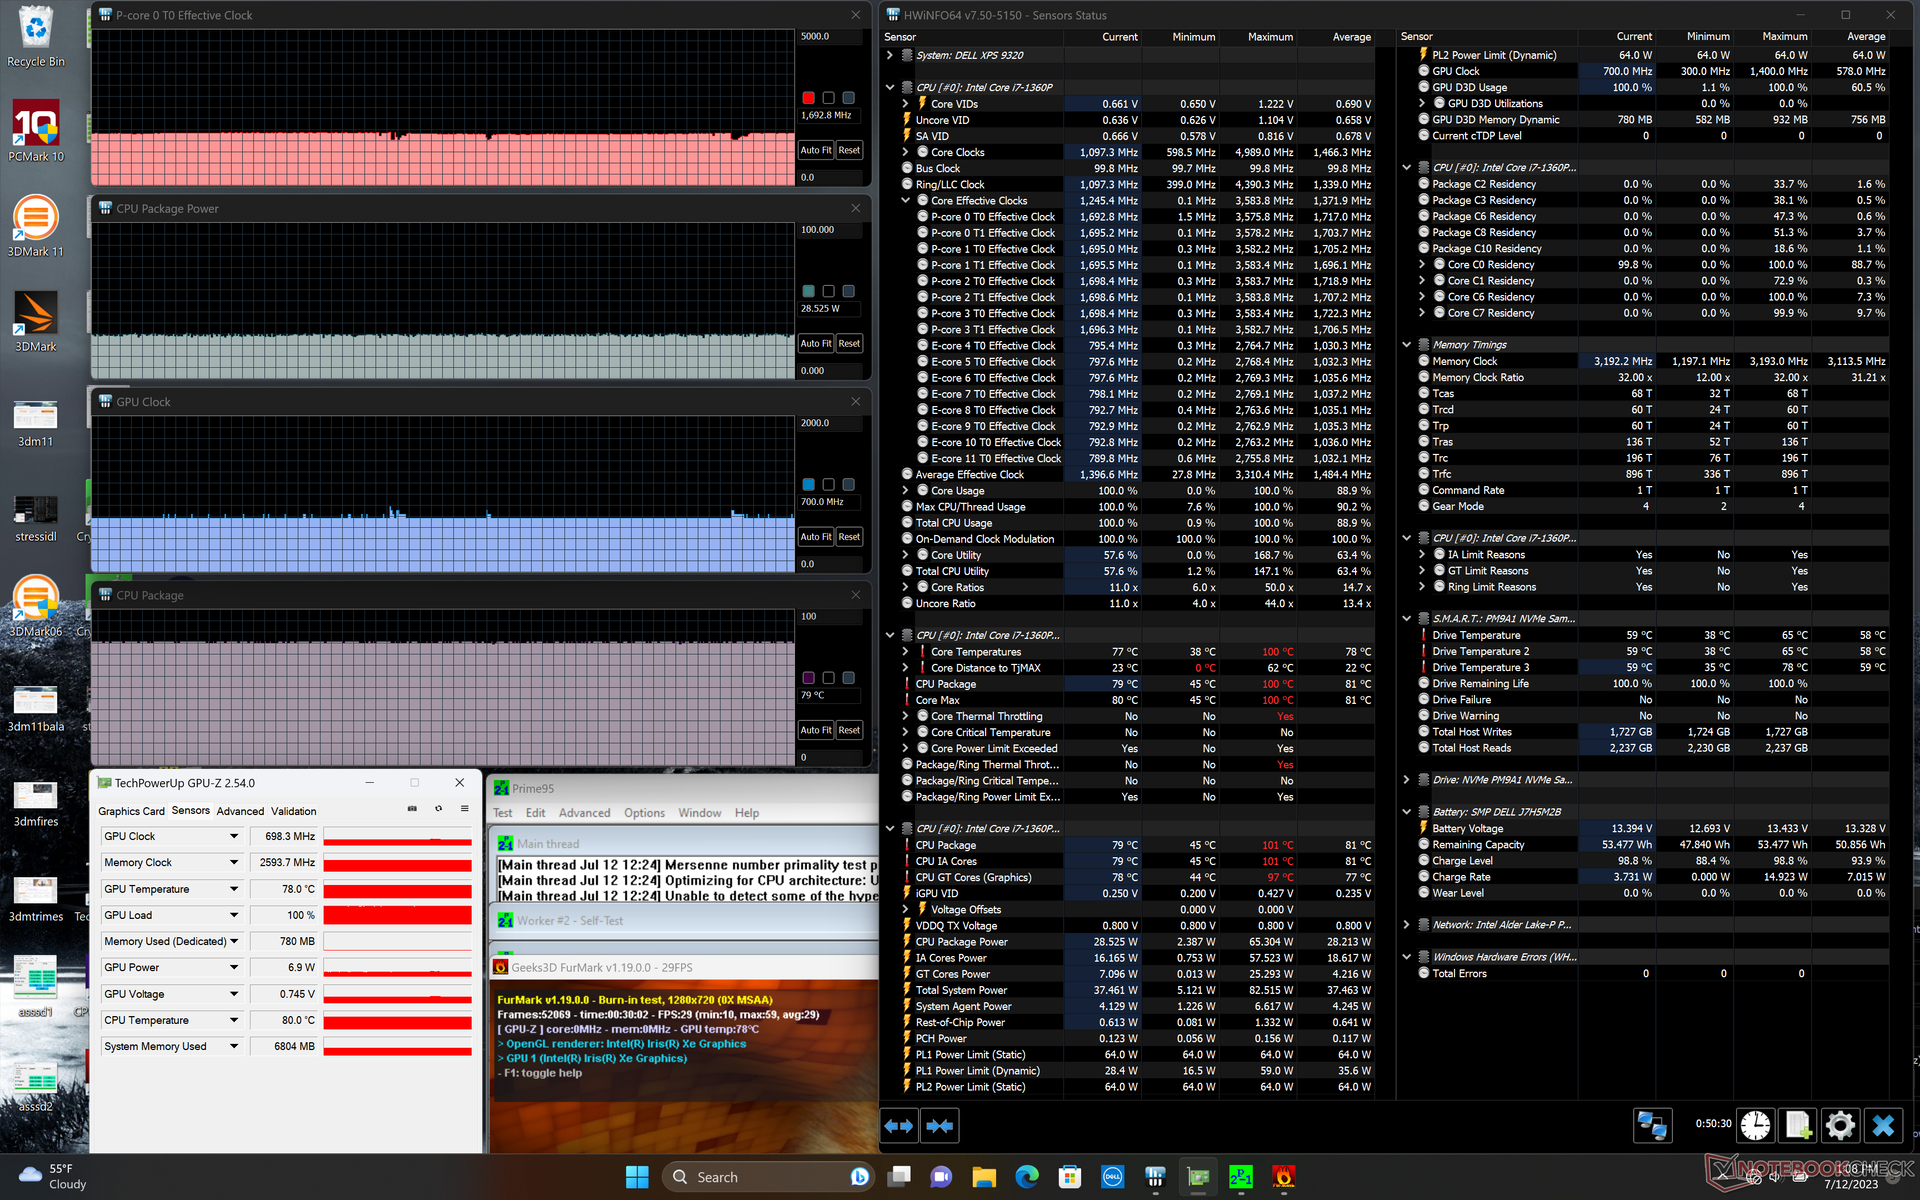
| Horloge du CPU (GHz) | Horloge du GPU (MHz) | Température moyenne du CPU (°C) | |
| Système au repos | -- | -- | 51 |
| Prime95 Stress | 2.4 | -- | 91 |
| Prime95 + FurMark Stress | 1.7 | 700 | 79 |
| Witcher 3 Stress | ~1.6 | 1250 | 81 |
Intervenants
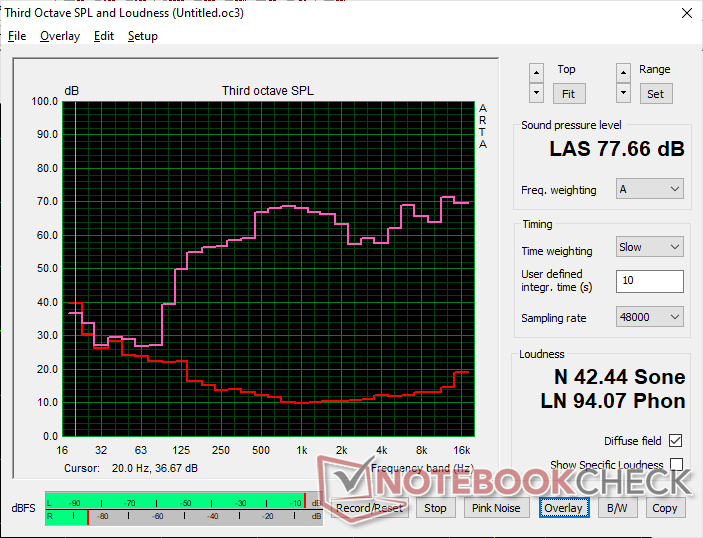
Dell XPS 13 Plus 9320 Core i7-1360P analyse audio
(±) | le niveau sonore du haut-parleur est moyen mais bon (77.7# dB)
Basses 100 - 315 Hz
(±) | basse réduite - en moyenne 10.8% inférieure à la médiane
(±) | la linéarité des basses est moyenne (10.2% delta à la fréquence précédente)
Médiums 400 - 2000 Hz
(+) | médiane équilibrée - seulement 3.6% de la médiane
(+) | les médiums sont linéaires (3.8% delta à la fréquence précédente)
Aiguës 2 - 16 kHz
(+) | des sommets équilibrés - à seulement 3.6% de la médiane
(±) | la linéarité des aigus est moyenne (7.4% delta à la fréquence précédente)
Globalement 100 - 16 000 Hz
(+) | le son global est linéaire (13.2% différence à la médiane)
Par rapport à la même classe
» 22% de tous les appareils testés de cette catégorie étaient meilleurs, 5% similaires, 74% pires
» Le meilleur avait un delta de 5%, la moyenne était de 18%, le pire était de 53%.
Par rapport à tous les appareils testés
» 13% de tous les appareils testés étaient meilleurs, 3% similaires, 84% pires
» Le meilleur avait un delta de 4%, la moyenne était de 23%, le pire était de 134%.
Apple MacBook Pro 16 2021 M1 Pro analyse audio
(+) | les haut-parleurs peuvent jouer relativement fort (84.7# dB)
Basses 100 - 315 Hz
(+) | bonne basse - seulement 3.8% loin de la médiane
(+) | les basses sont linéaires (5.2% delta à la fréquence précédente)
Médiums 400 - 2000 Hz
(+) | médiane équilibrée - seulement 1.3% de la médiane
(+) | les médiums sont linéaires (2.1% delta à la fréquence précédente)
Aiguës 2 - 16 kHz
(+) | des sommets équilibrés - à seulement 1.9% de la médiane
(+) | les aigus sont linéaires (2.7% delta à la fréquence précédente)
Globalement 100 - 16 000 Hz
(+) | le son global est linéaire (4.6% différence à la médiane)
Par rapport à la même classe
» 0% de tous les appareils testés de cette catégorie étaient meilleurs, 0% similaires, 100% pires
» Le meilleur avait un delta de 5%, la moyenne était de 17%, le pire était de 45%.
Par rapport à tous les appareils testés
» 0% de tous les appareils testés étaient meilleurs, 0% similaires, 100% pires
» Le meilleur avait un delta de 4%, la moyenne était de 23%, le pire était de 134%.
Gestion de l'énergie
Consommation électrique
Le ralenti sur le bureau peut consommer entre 6 W et 14 W, ce qui est une plage plus large que sur la plupart des autres subnotebooks, en raison de l'écran OLED plus exigeant. Comme détaillé dans notre article icicertaines couleurs demanderont plus d'énergie sur un écran OLED alors que la consommation d'énergie est indépendante de la couleur sur un écran IPS.
La consommation d'énergie globale est similaire à celle du modèle de l'année dernière malgré la nouvelle génération de CPU. L'exécution de Prime95, par exemple, demanderait environ 63 W à chaque système, ce qui signifie que les performances par watt du Core i7-1360P de 13ème génération ne sont pas meilleures que celles du Core i7-1280P de 12ème génération.
| Éteint/en veille | |
| Au repos | |
| Fortement sollicité |
|
Légende:
min: | |
| Dell XPS 13 Plus 9320 Core i7-1360P i7-1360P, Iris Xe G7 96EUs, Samsung PM9A1 MZVL2512HCJQ, OLED, 3456x2160, 13.4" | Dell XPS 13 Plus 9320 i7-1280P OLED i7-1280P, Iris Xe G7 96EUs, WDC PC SN810 512GB, OLED, 3456x2160, 13.4" | Dell XPS 13 7390 Core i7-10710U i7-10710U, UHD Graphics 620, SK Hynix PC601 NVMe 512 GB, IPS, 3840x2160, 13.3" | Framework Laptop 13.5 13th Gen Intel i7-1370P, Iris Xe G7 96EUs, WD PC SN740 SDDPNQD-1T00, IPS, 2256x1504, 13.5" | Lenovo ThinkPad X13 Yoga G3 21AW003UGE i7-1265U, Iris Xe G7 96EUs, Samsung PM9A1 MZVL2512HCJQ, IPS LED, 2560x1600, 13.3" | HP Spectre x360 13.5 14t-ef000 i7-1255U, Iris Xe G7 96EUs, Micron 3400 1TB MTFDKBA1T0TFH, OLED, 3000x2000, 13.5" | |
|---|---|---|---|---|---|---|
| Power Consumption | -5% | 16% | 10% | 7% | 16% | |
| Idle Minimum * (Watt) | 6.9 | 6.5 6% | 4.7 32% | 2.9 58% | 4.6 33% | 4 42% |
| Idle Average * (Watt) | 7.4 | 7.8 -5% | 8.3 -12% | 6.3 15% | 7.9 -7% | 4.9 34% |
| Idle Maximum * (Watt) | 13.6 | 13 4% | 9 34% | 9.9 27% | 8.9 35% | 12.5 8% |
| Load Average * (Watt) | 43.5 | 56.6 -30% | 42 3% | 56.2 -29% | 56.1 -29% | 48.1 -11% |
| Witcher 3 ultra * (Watt) | 48 | 49.2 -3% | 56.6 -18% | 40.4 16% | 35.8 25% | |
| Load Maximum * (Watt) | 63.3 | 63 -0% | 49 23% | 60.8 4% | 66.1 -4% | 65.2 -3% |
* ... Moindre est la valeur, meilleures sont les performances
Power Consumption Witcher 3 / Stresstest
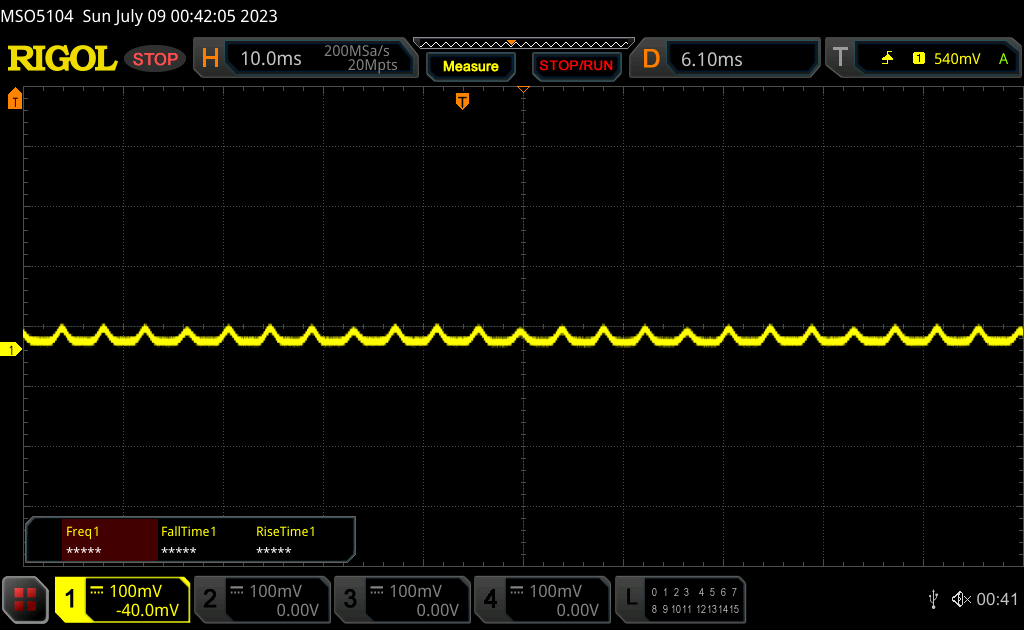
Power Consumption external Monitor
Autonomie de la batterie
Les durées d'utilisation sont pratiquement identiques à celles de la configuration Core i7-1260P de l'année dernière, avec environ 7,5 heures de navigation dans le monde réel.
Le chargement de la batterie à pleine capacité avec l'adaptateur fourni prend un peu plus de 2 heures.
| Dell XPS 13 Plus 9320 Core i7-1360P i7-1360P, Iris Xe G7 96EUs, 55 Wh | Dell XPS 13 Plus 9320 i7-1280P OLED i7-1280P, Iris Xe G7 96EUs, 55 Wh | Dell XPS 13 7390 Core i7-10710U i7-10710U, UHD Graphics 620, 52 Wh | Framework Laptop 13.5 13th Gen Intel i7-1370P, Iris Xe G7 96EUs, 61 Wh | Lenovo ThinkPad X13 Yoga G3 21AW003UGE i7-1265U, Iris Xe G7 96EUs, 52.8 Wh | HP Spectre x360 13.5 14t-ef000 i7-1255U, Iris Xe G7 96EUs, 66 Wh | |
|---|---|---|---|---|---|---|
| Autonomie de la batterie | -21% | 15% | 21% | 11% | 10% | |
| WiFi v1.3 (h) | 7.3 | 5.8 -21% | 8.4 15% | 8.8 21% | 8.1 11% | 8 10% |
| Load (h) | 1.9 | 2.2 | ||||
| Reader / Idle (h) | 20.4 |
Points positifs
Points négatifs
Verdict - Oubliez la version 2023 et achetez la version 2022
Le XPS 13 Plus a été introduit l'année dernière et le rafraîchissement de cette année est donc mineur. Il serait irréaliste de s'attendre à des mises à jour spectaculaires du châssis ou des composants internes à ce stade, mais le rafraîchissement de 2023 est malheureusement oubliable étant donné qu'il n'offre pratiquement aucun avantage en termes de performance du processeur ou de performance par watt par rapport à l'année précédente. En outre, d'autres aspects semblent incohérents, tels que les sauts d'images lors de la lecture vidéo et le ralentissement du SSD. Tous les principaux avantages et inconvénients du XPS 13 Plus 9320 original s'appliquent toujours à la version 2023.
Le 13ème Core i7-1360P ressemble à un rebranding du Core i7-1280P de 12ème génération. En conséquence, les acheteurs intéressés peuvent envisager de choisir le XPS 13 Plus 9320 original de 2022 plutôt que la nouvelle version de 2023.
Si vous êtes à la recherche d'un XPS 13 Plus 9320, nous vous recommandons d'opter pour le modèle original 2022, qui est moins cher et offre essentiellement les mêmes performances que la version 2023. Les acheteurs peuvent investir l'argent économisé dans des fonctionnalités plus tangibles comme plus de RAM, plus de stockage ou un écran de plus haute résolution.
Prix et disponibilité
Dell livre dès à présent le XPS 13 Plus 9320 à partir de 1150 USD pour la configuration de base FHD et jusqu'à 1750 USD pour la configuration 4K UHD.
Dell XPS 13 Plus 9320 Core i7-1360P
- 07/16/2023 v7 (old)
Allen Ngo
Transparency
La sélection des appareils à examiner est effectuée par notre équipe éditoriale. L'échantillon de test a été prêté à l'auteur par le fabricant ou le détaillant pour les besoins de cet examen. Le prêteur n'a pas eu d'influence sur cette évaluation et le fabricant n'a pas reçu de copie de cette évaluation avant sa publication. Il n'y avait aucune obligation de publier cet article. En tant que média indépendant, Notebookcheck n'est pas soumis à l'autorité des fabricants, des détaillants ou des éditeurs.
Voici comment Notebookcheck teste
Chaque année, Notebookcheck examine de manière indépendante des centaines d'ordinateurs portables et de smartphones en utilisant des procédures standardisées afin de garantir que tous les résultats sont comparables. Nous avons continuellement développé nos méthodes de test depuis environ 20 ans et avons établi des normes industrielles dans le processus. Dans nos laboratoires de test, des équipements de mesure de haute qualité sont utilisés par des techniciens et des rédacteurs expérimentés. Ces tests impliquent un processus de validation en plusieurs étapes. Notre système d'évaluation complexe repose sur des centaines de mesures et de points de référence bien fondés, ce qui garantit l'objectivité.Price comparison

