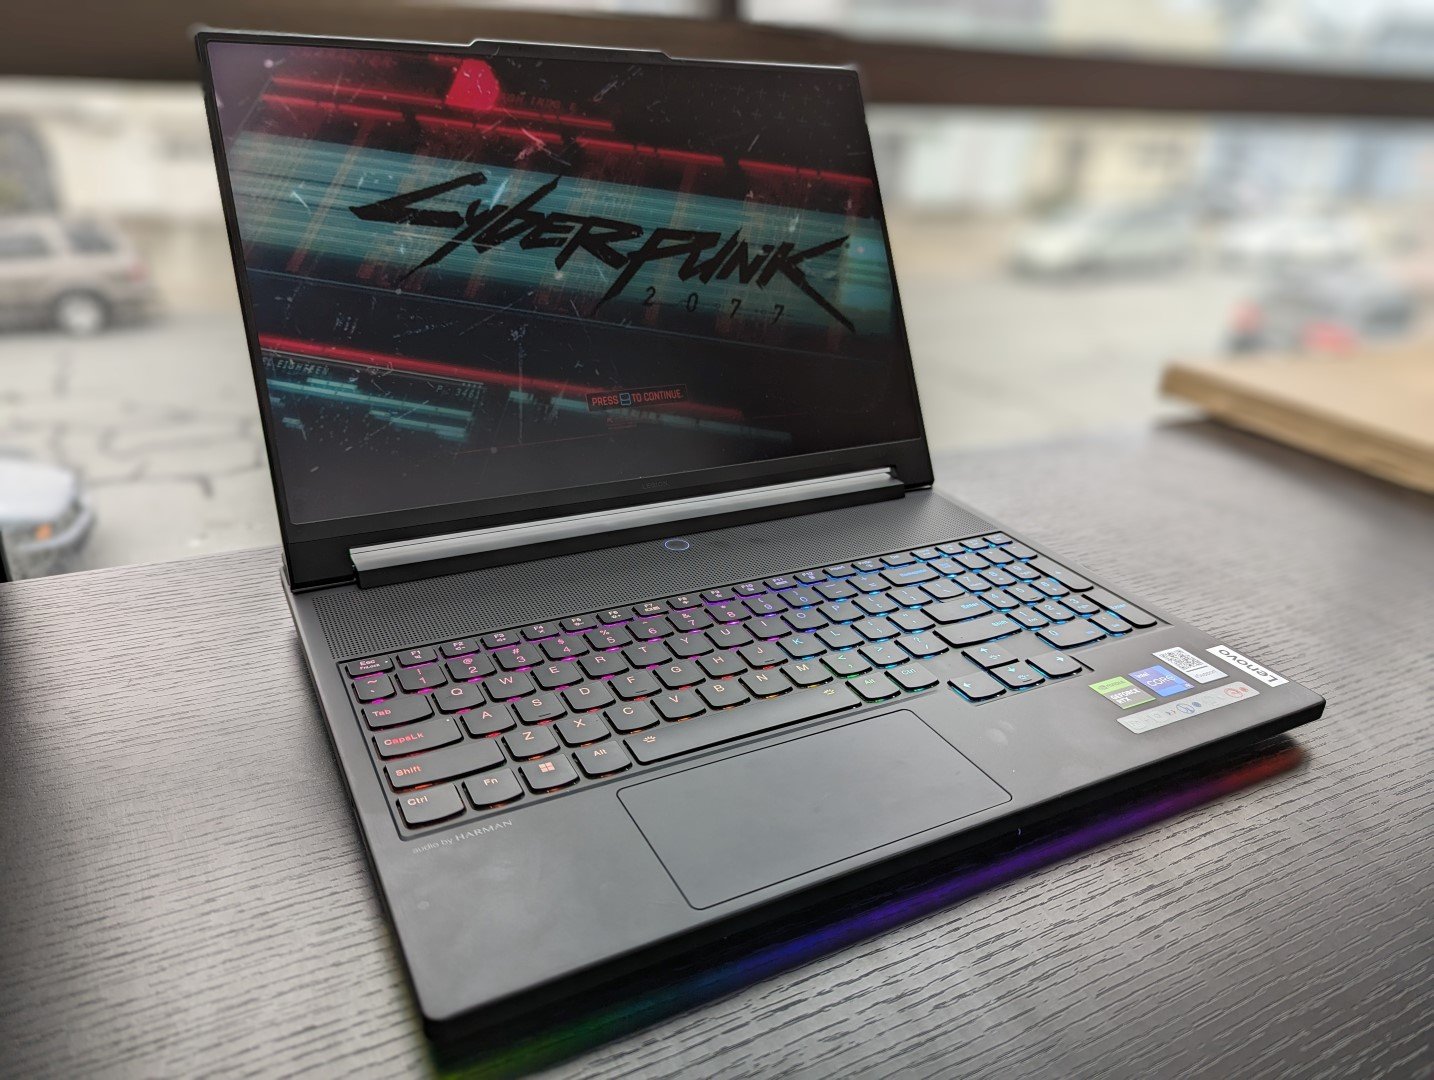
Test du Legion 9i Gen 8 16IRX8 : le PC portable de jeu le plus ambitieux de Lenovo à ce jour

Dévoilé il y a quelques semaines à peine à l'IFA 2023le nouveau Legion 9i 16 est le modèle Legion le plus haut de gamme disponible, dépassant les séries Legion 5 et Legion 7 de milieu de gamme. Il s'agit du premier produit Legion 9 depuis plusieurs années, après le médiocre Legion Y920 en 2017. Le dernier modèle se distingue par son écran mini-LED et son système de refroidissement liquide intégré.
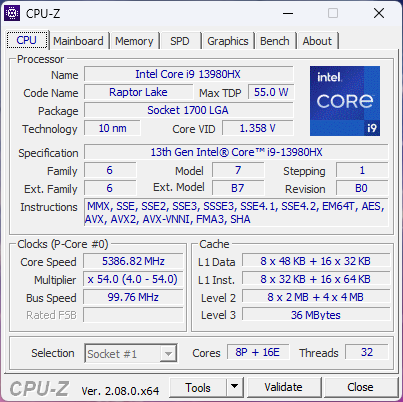
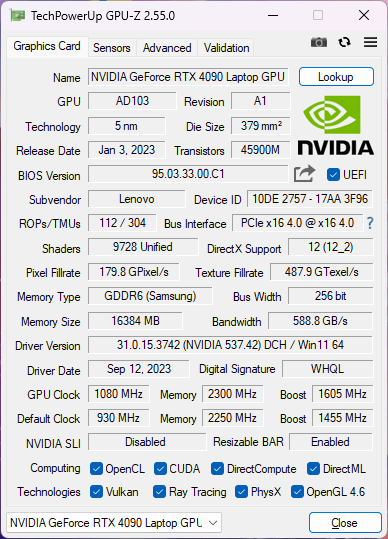
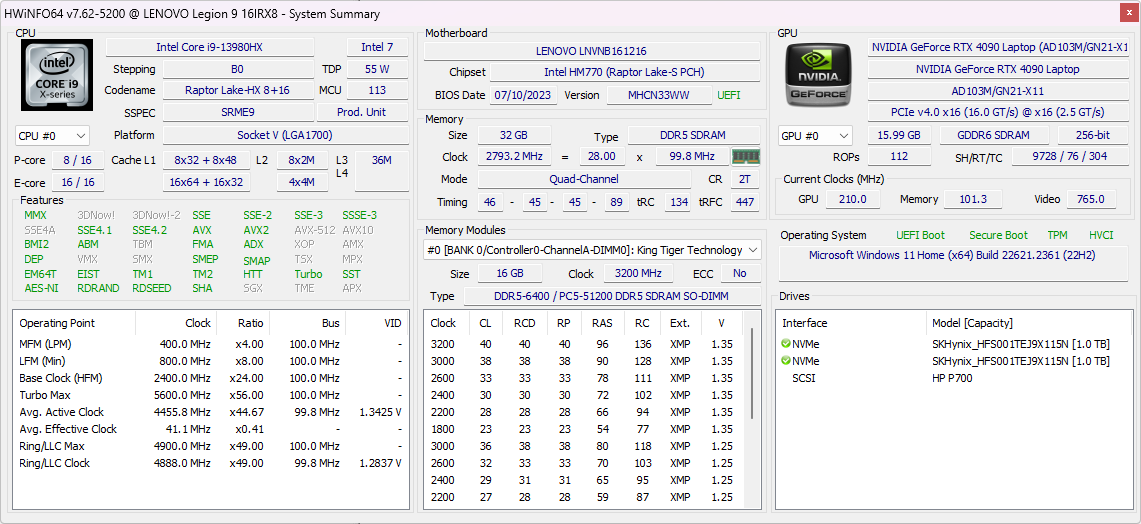
Notre unité en revue a été configurée avec tout et l'évier de cuisine pour inclure un CPU Core i9-13980HX de 13e génération, un GPU RTX 4090 de 175 W GeForce, un SSD NVMe PCIe4 x4 de 1 To en RAID 0, et un écran mini-LED 3,2K (3200 x 2000) de 165 Hz avec des couleurs DCI-P3 pour un peu moins de 4 000 USD au détail. Pour l'instant, toutes les options sont livrées avec le même CPU Core i9 et le même écran mini-LED, tandis que seul le GPU peut être configuré jusqu'à la RTX 4080.
Les alternatives au Legion 9i 16 comprennent d'autres ordinateurs portables de jeu de 16 pouces comme le Razer Blade 16, Asus ROG Strix G16, HP Omen Transcend 16et le Alienware x16 R1.
Plus de commentaires sur Lenovo :
Comparaison avec les concurrents potentiels
Note | Date | Modèle | Poids | Épaisseur | Taille | Résolution | Prix |
|---|---|---|---|---|---|---|---|
| 90.2 % v7 (old) | 10/23 | Lenovo Legion 9 16IRX8 i9-13980HX, GeForce RTX 4090 Laptop GPU | 2.6 kg | 22.7 mm | 16.00" | 3200x2000 | |
| 87.7 % v7 (old) | 08/23 | Lenovo Legion Slim 5 16APH8 R7 7840HS, GeForce RTX 4060 Laptop GPU | 2.4 kg | 25.2 mm | 16.00" | 2560x1600 | |
| 89.8 % v7 (old) | 03/23 | Razer Blade 16 Early 2023 RTX 4090 i9-13950HX, GeForce RTX 4090 Laptop GPU | 2.5 kg | 21.99 mm | 16.00" | 3840x2400 | |
| 88.4 % v7 (old) | 03/23 | Asus ROG Strix G16 G614JZ i9-13980HX, GeForce RTX 4080 Laptop GPU | 2.4 kg | 30.4 mm | 16.00" | 2560x1600 | |
| 87.9 % v7 (old) | 08/23 | HP Omen Transcend 16 i9-13900HX, GeForce RTX 4070 Laptop GPU | 2.3 kg | 19.8 mm | 16.00" | 2560x1600 | |
| 88.4 % v7 (old) | 06/23 | Alienware x16 R1 i9-13900HK, GeForce RTX 4080 Laptop GPU | 2.6 kg | 18.57 mm | 16.00" | 2560x1600 |
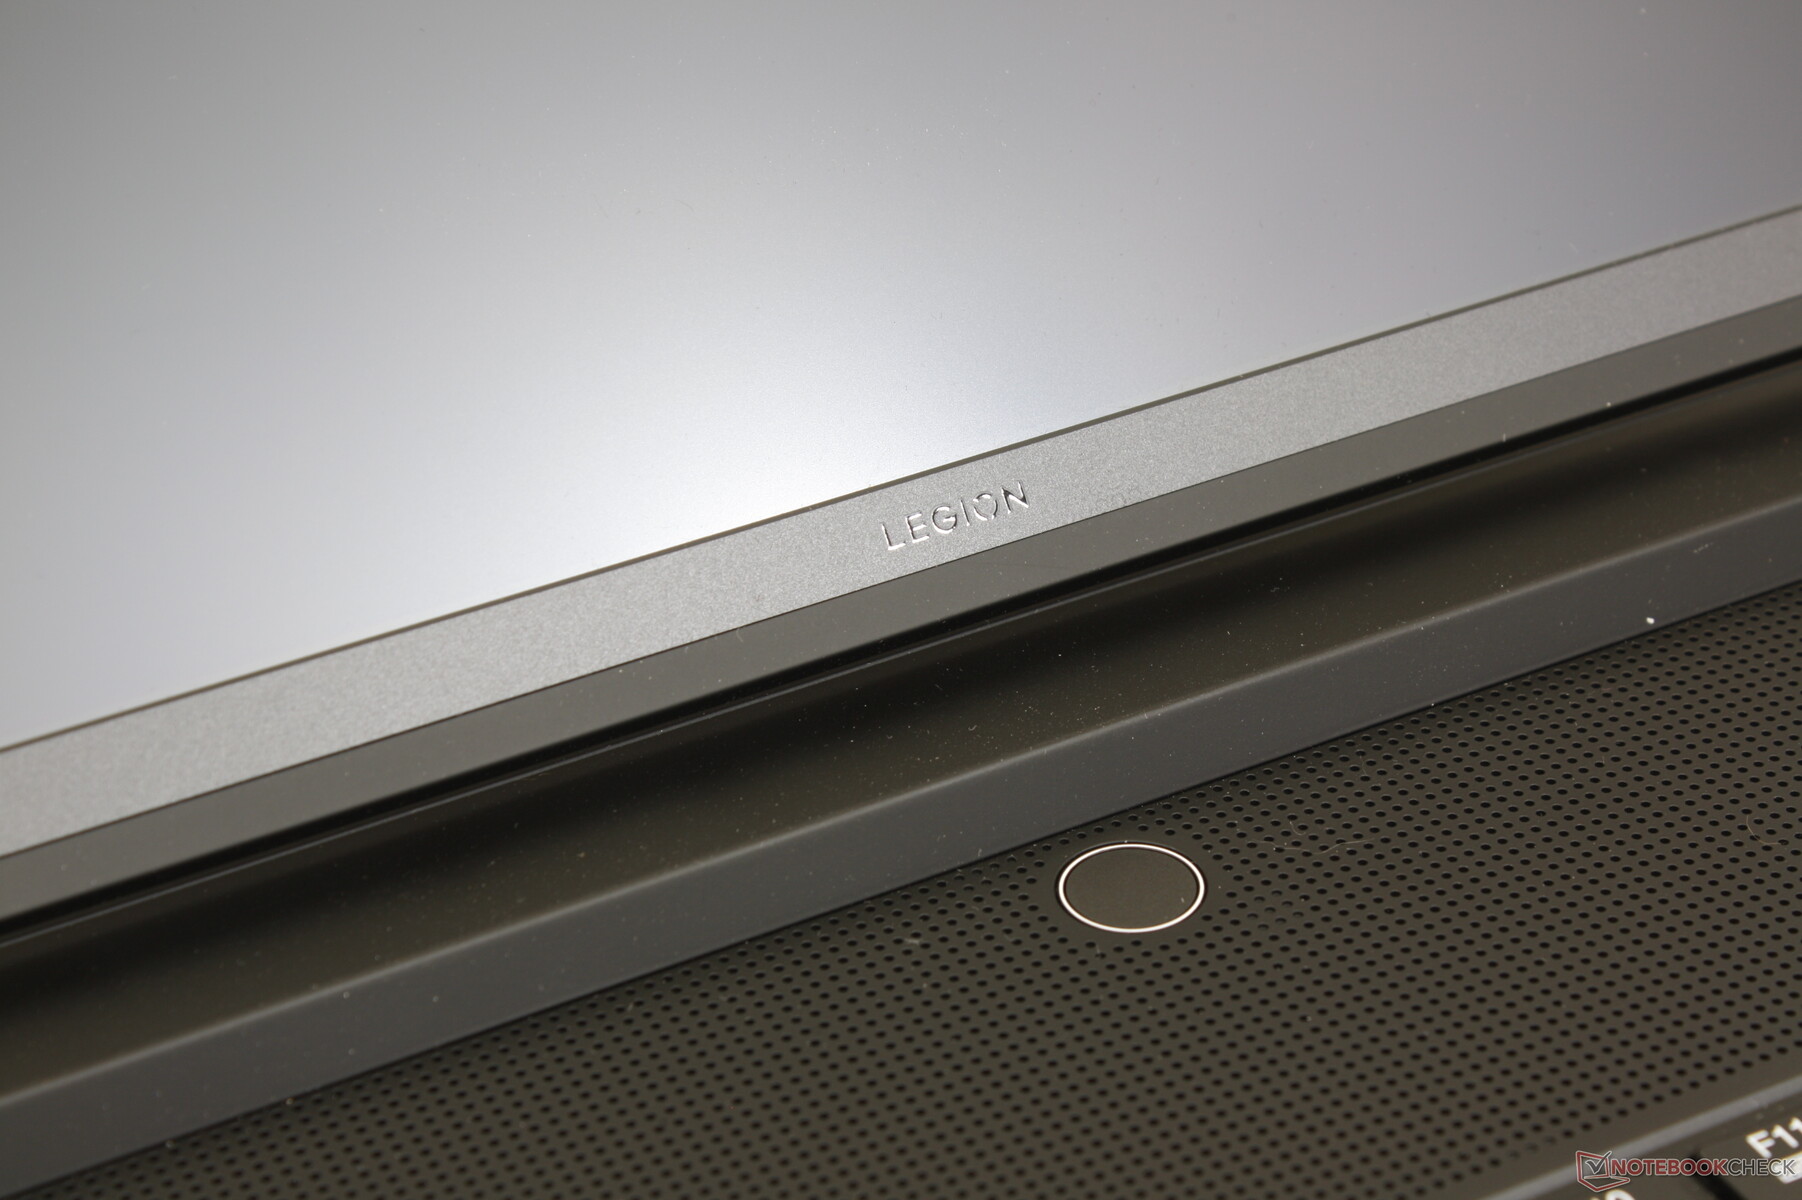
Case - Une conception évoluée de Legion
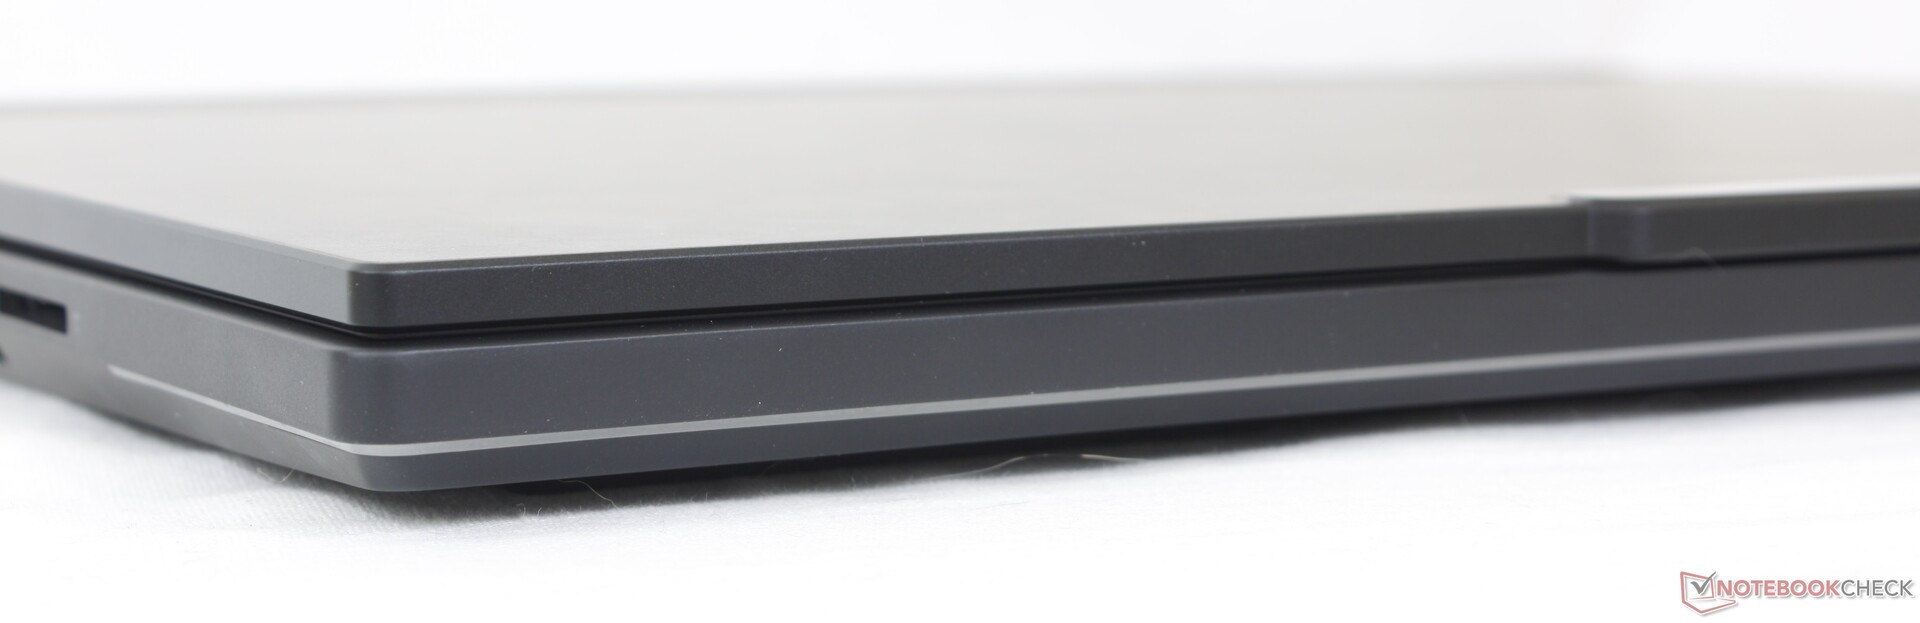
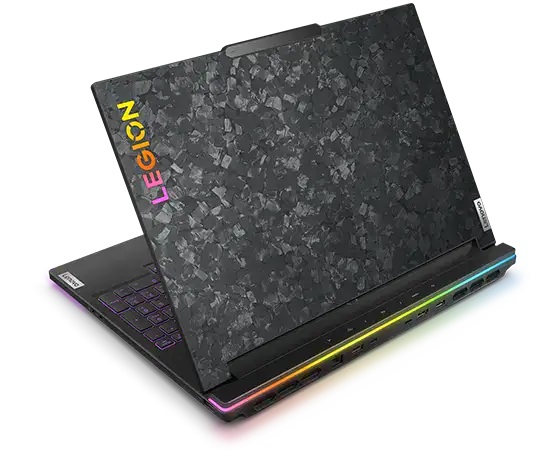
Le Legion 9i 16 utilise des matériaux en magnésium mat similaires à ceux de la Legion 7 series, mais ils sont visuellement très différents. Tout d'abord, le clavier a été poussé vers l'avant pour être plus proche de l'utilisateur, comme sur le Asus Zephyrus S GX531, afin de faire de la place pour plus de grilles d'aération et une solution de refroidissement plus grande. Deuxièmement, un motif unique en carbone autour du couvercle extérieur permet de réduire les traces de doigts tout en contribuant à l'esthétique gamer. Enfin, la partie arrière saillante a été épaissie pour mieux s'adapter à tous les changements internes et à un matériel plus exigeant.
La qualité du châssis est excellente, avec seulement une légère flexion lorsque vous essayez de tourner le couvercle ou d'appuyer sur le centre du clavier ou sur les repose-paumes. Il n'est ni meilleur ni pire que le
Legion 7 16 ou le Alienware x16 R1 en termes de rigidité, d'autant plus qu'ils pèsent à peu près le même poids. Cependant, les charnières restent relativement petites par rapport aux charnières beaucoup plus grandes des modèles de la série Asus Strix ou du récentMSI Raider GE68. Elles peuvent être satisfaisantes à l'état neuf, mais seul l'avenir nous dira ce qu'il en est à long terme.
L'arrière allongé et les composants internes exigeants du Core i9/RTX 4090 ont conduit à un châssis plus grand et plus épais que celui du Legion 7 16. Les différences sont perceptibles car le Legion 9i 16 est plus grand que beaucoup d'autres ordinateurs portables de jeu de 16 pouces comme le ROG Strix G16, Blade 16ou l'Omen Transcend 16. Les performances élevées et les fonctionnalités avancées se font au détriment de la portabilité.
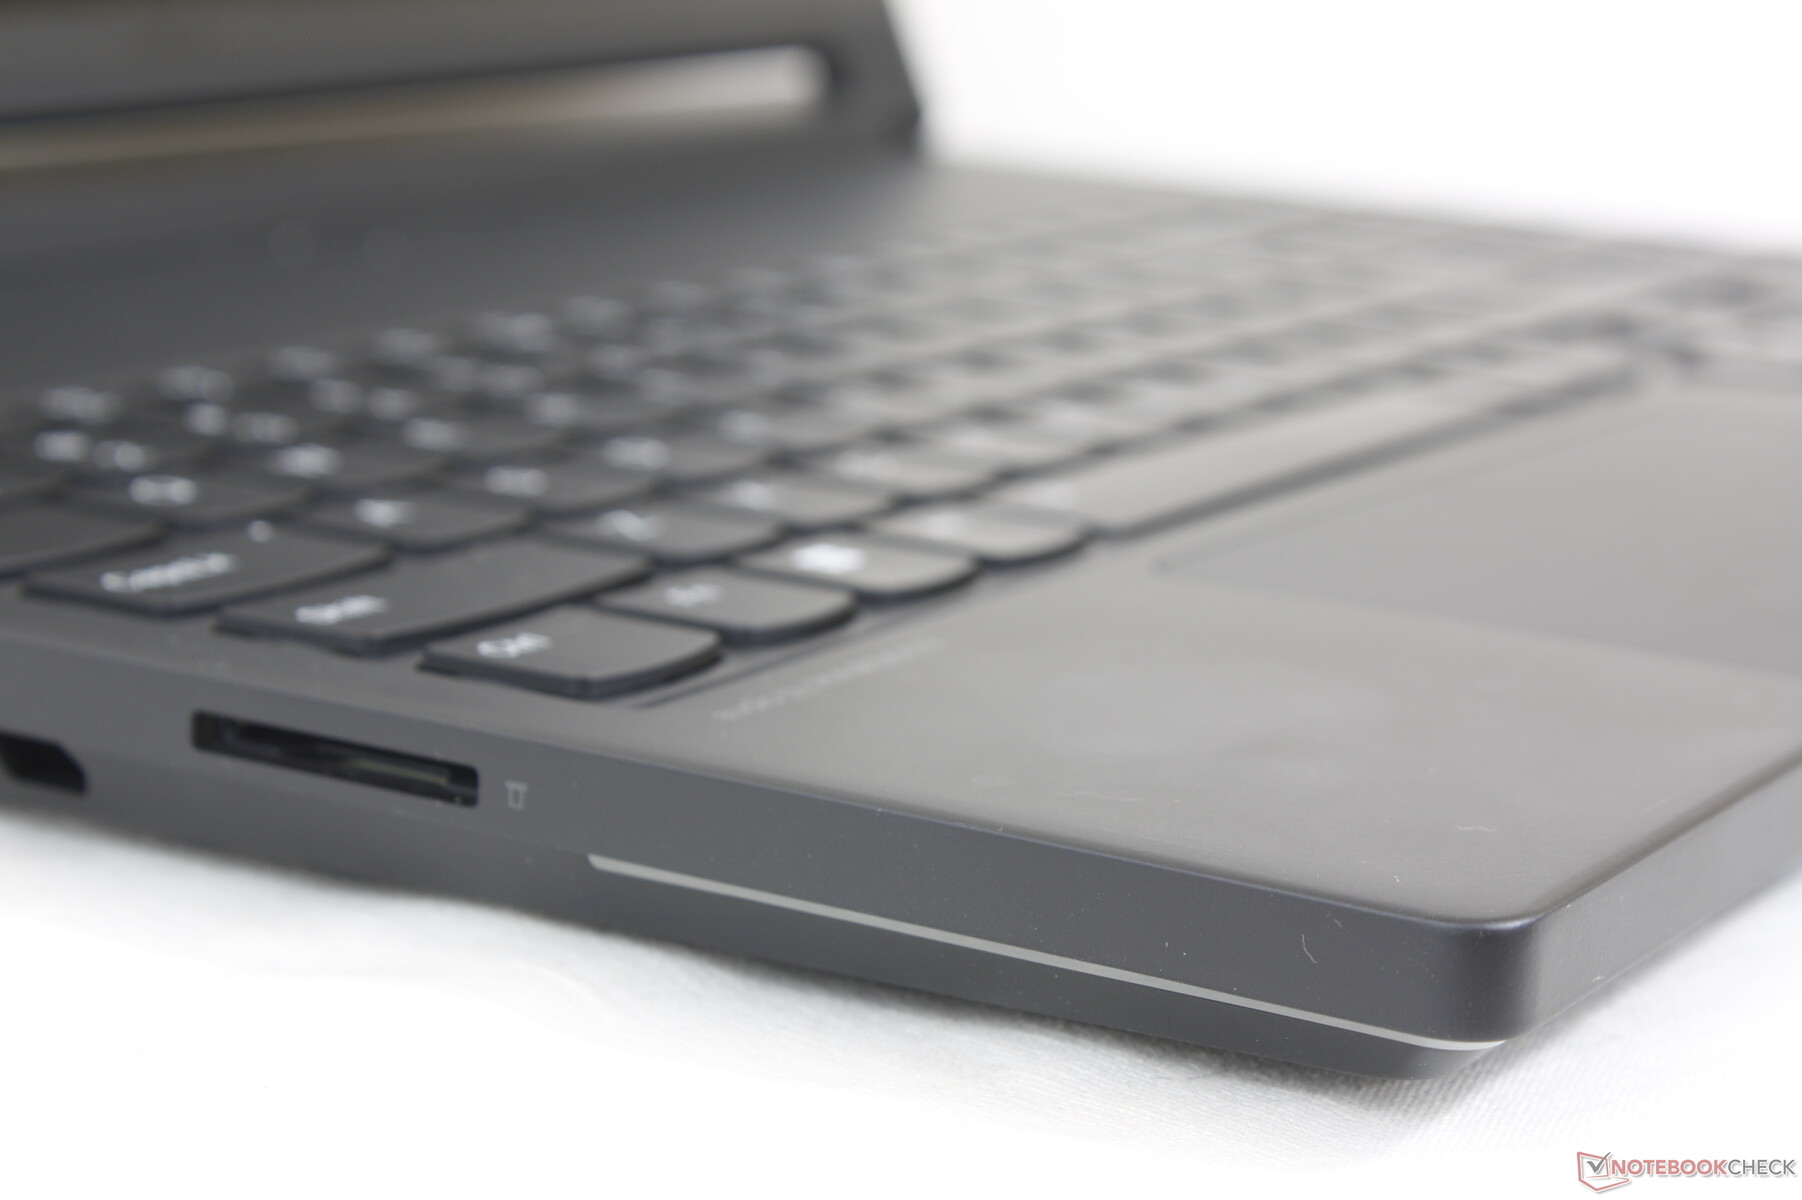
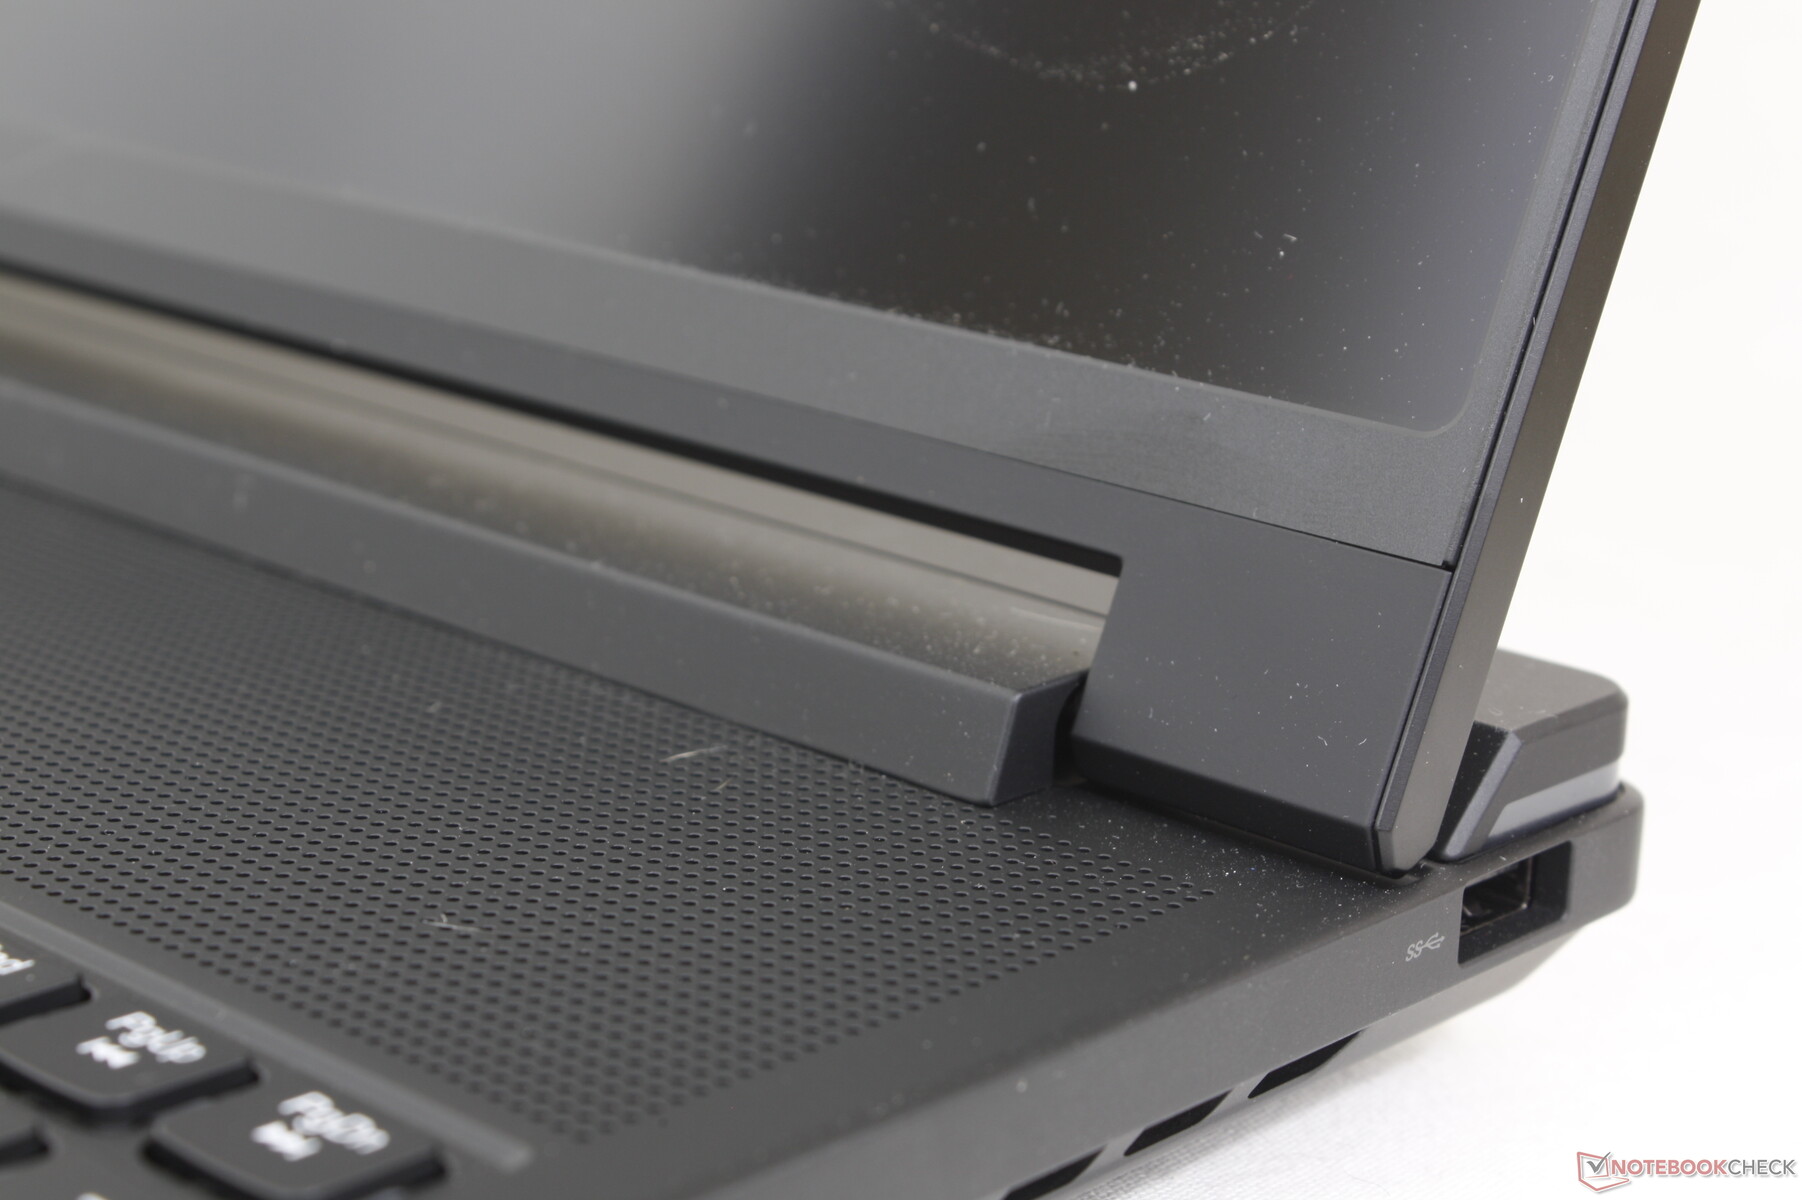
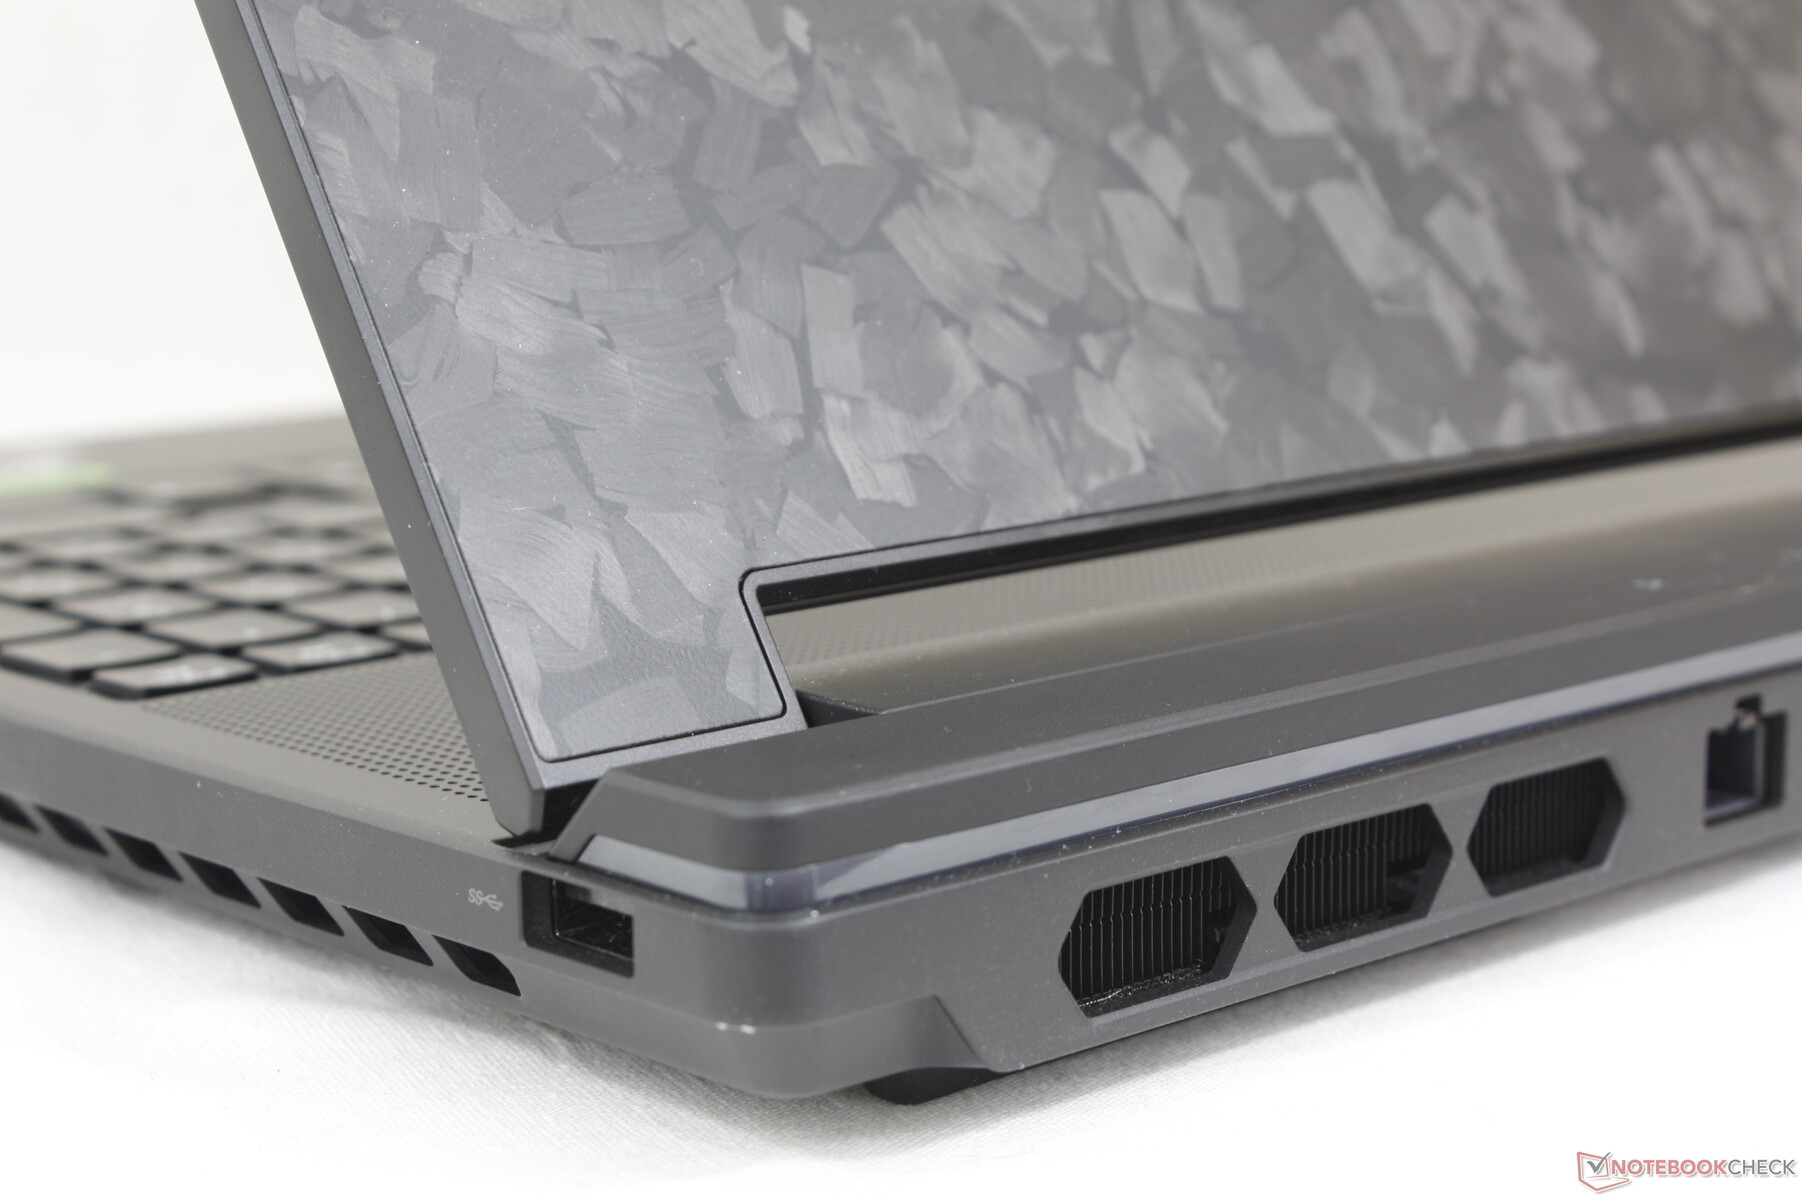
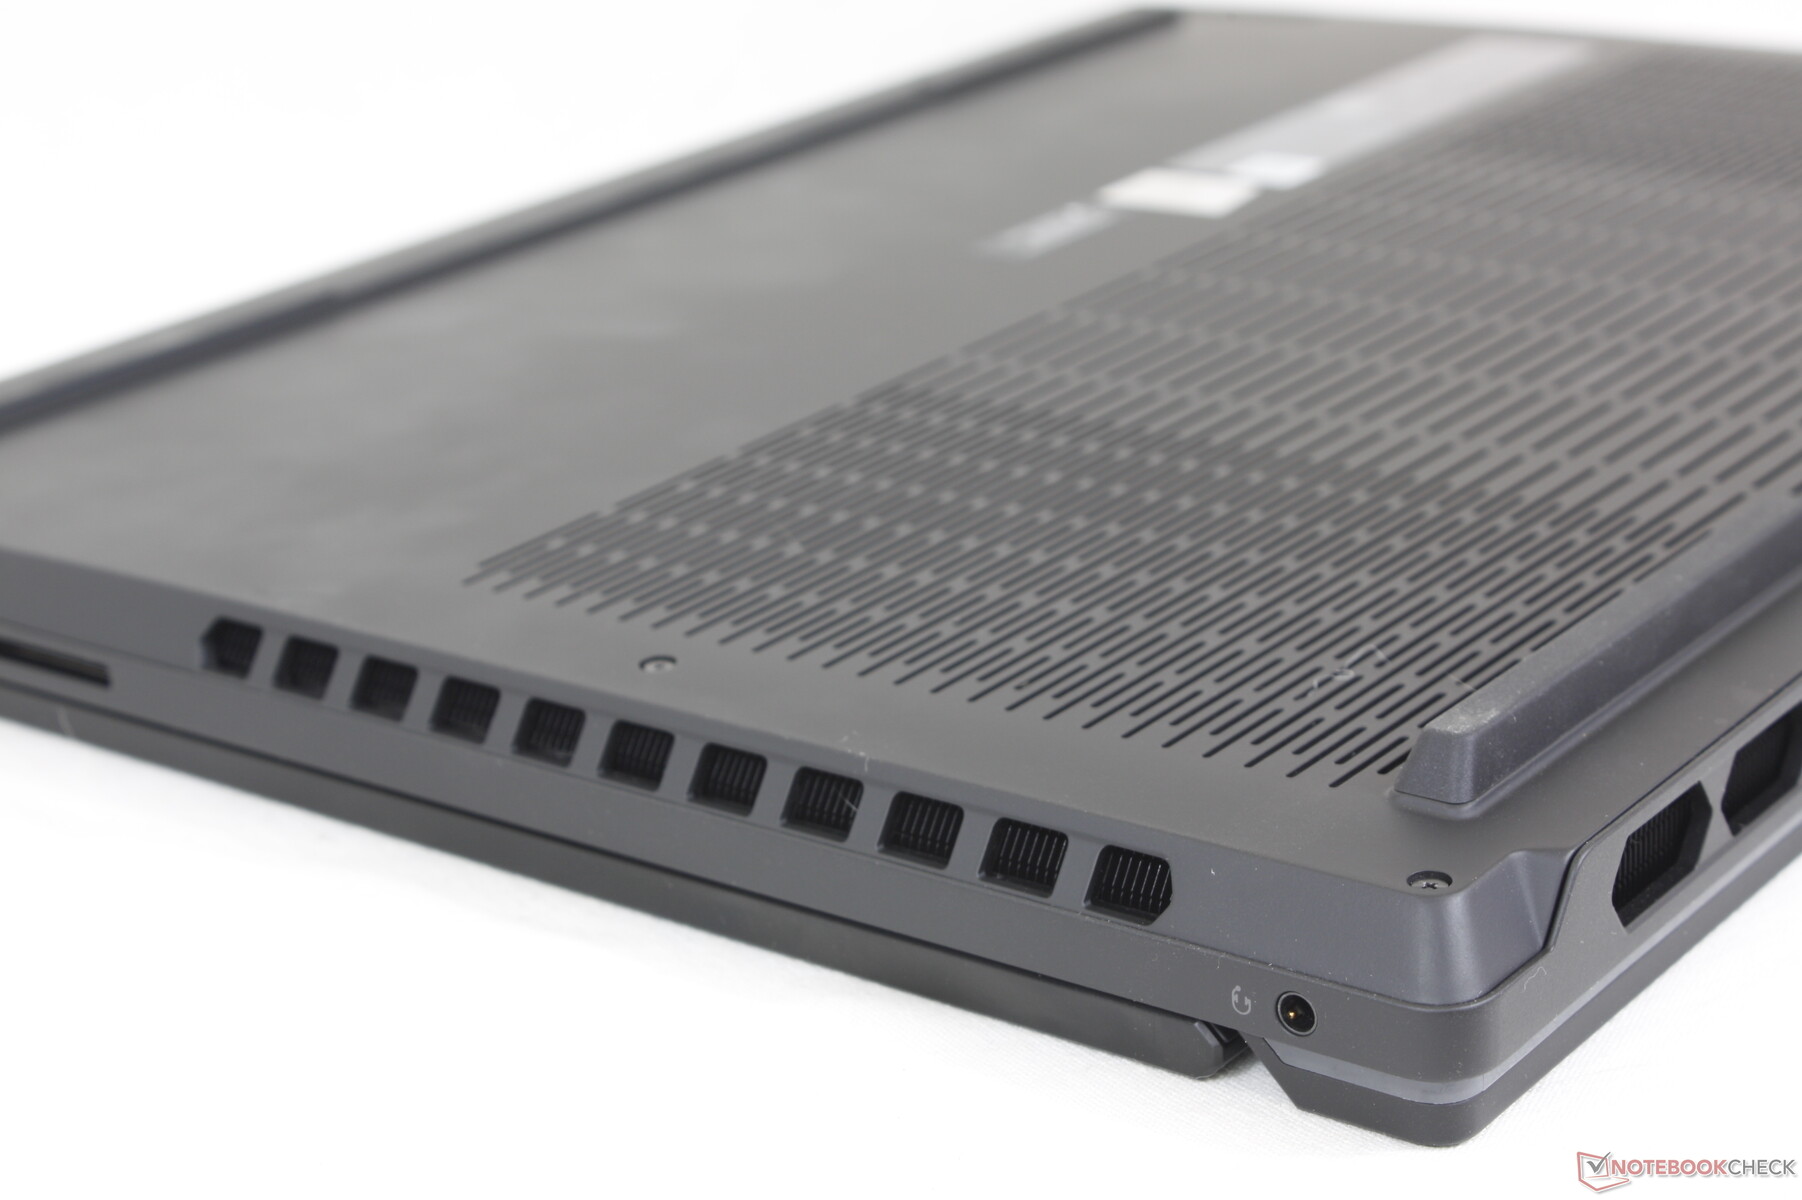
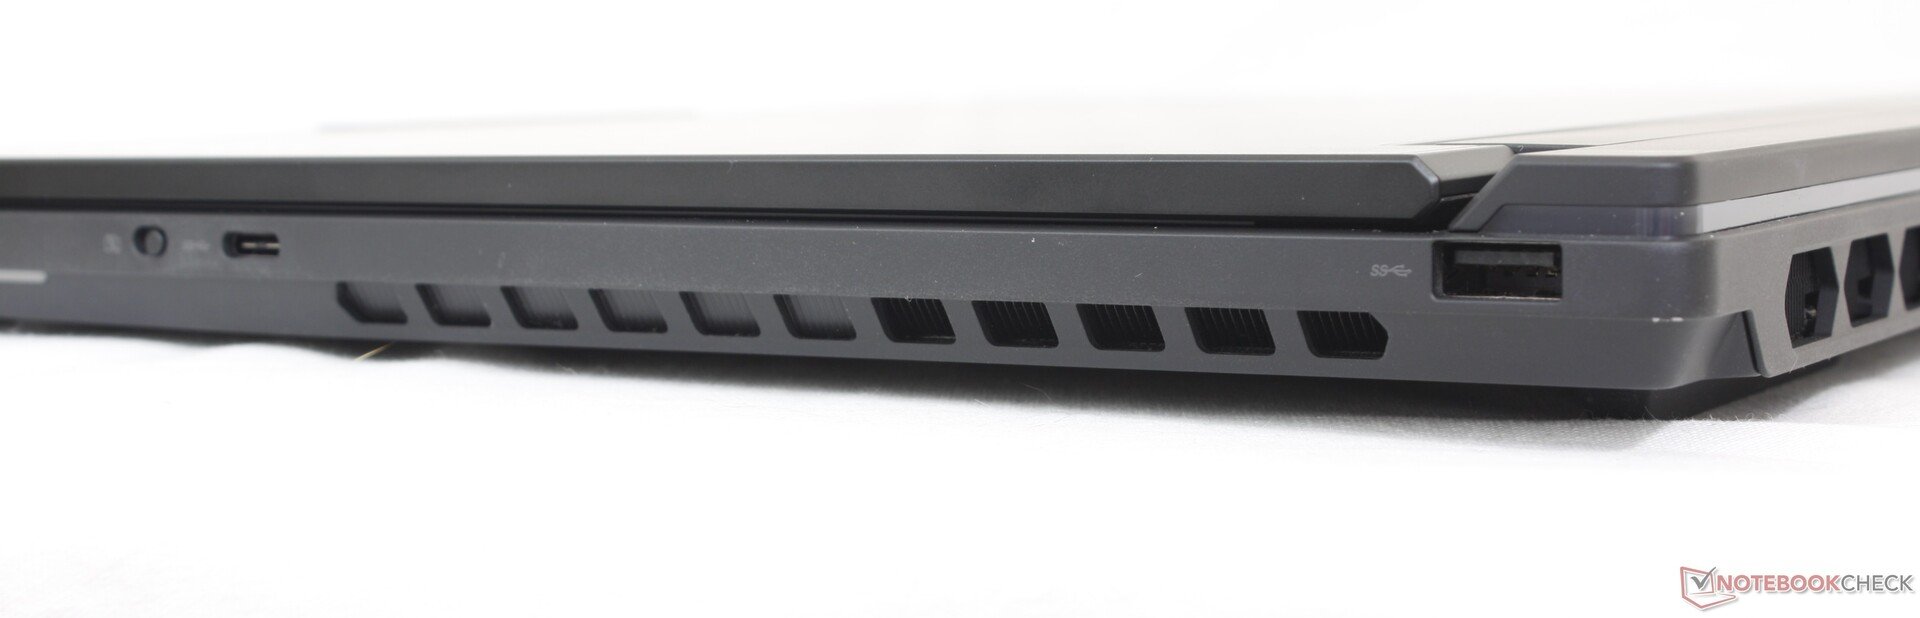
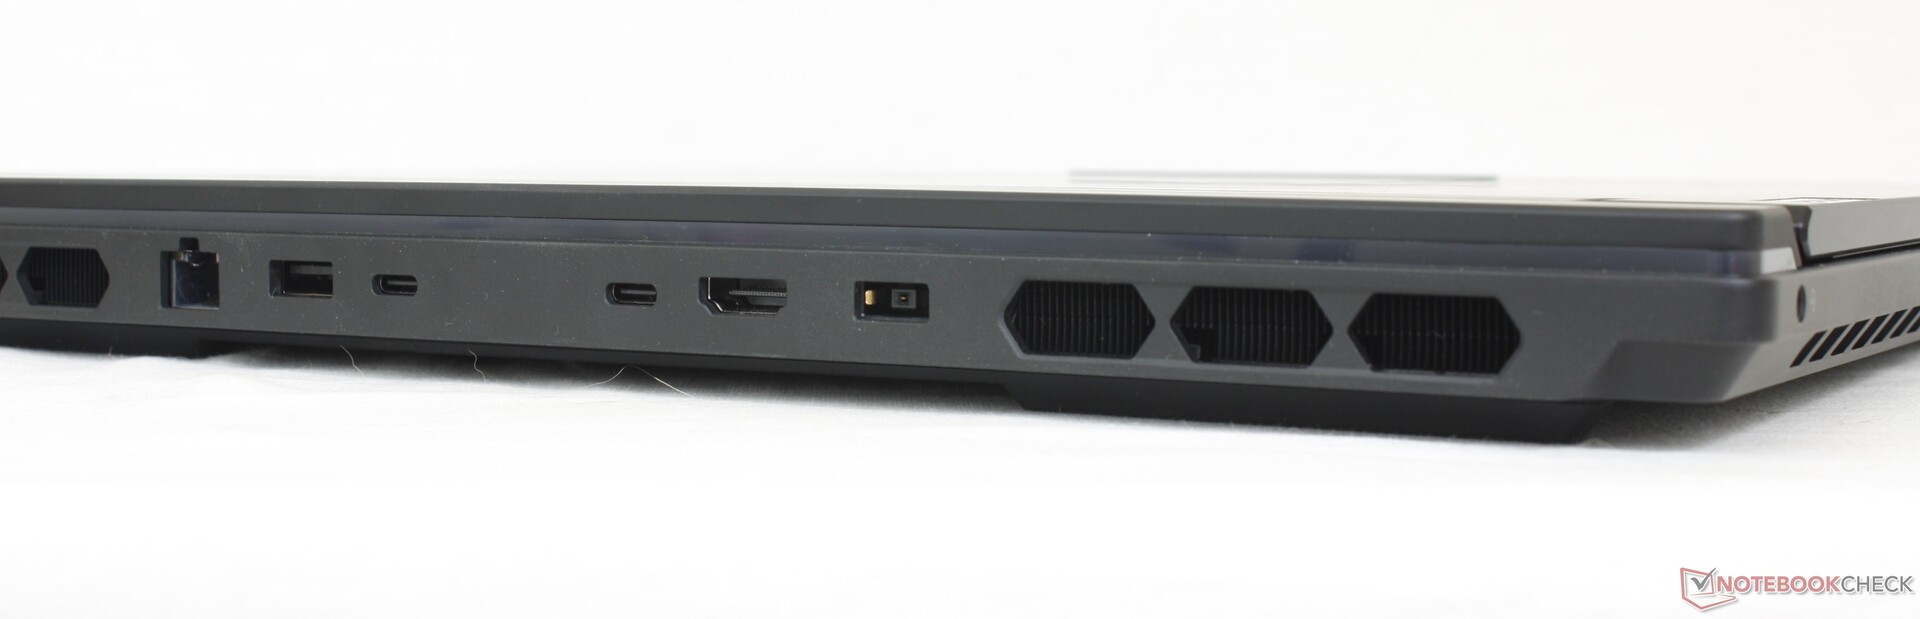
Connectivité - Un large choix
Les ports sont nombreux, la plupart d'entre eux étant situés à l'arrière et non sur les côtés. Contrairement aux ports arrière de l'Alienware X16 R1, les ports du Lenovo sont étiquetés individuellement avec des indicateurs LED pour un accès plus facile.
Seuls les deux ports USB-C arrière peuvent être utilisés pour les moniteurs externes ou pour recharger l'ordinateur portable via Power Delivery. Le troisième port USB-C situé le long du bord droit est réservé aux données et à la recharge d'appareils externes.
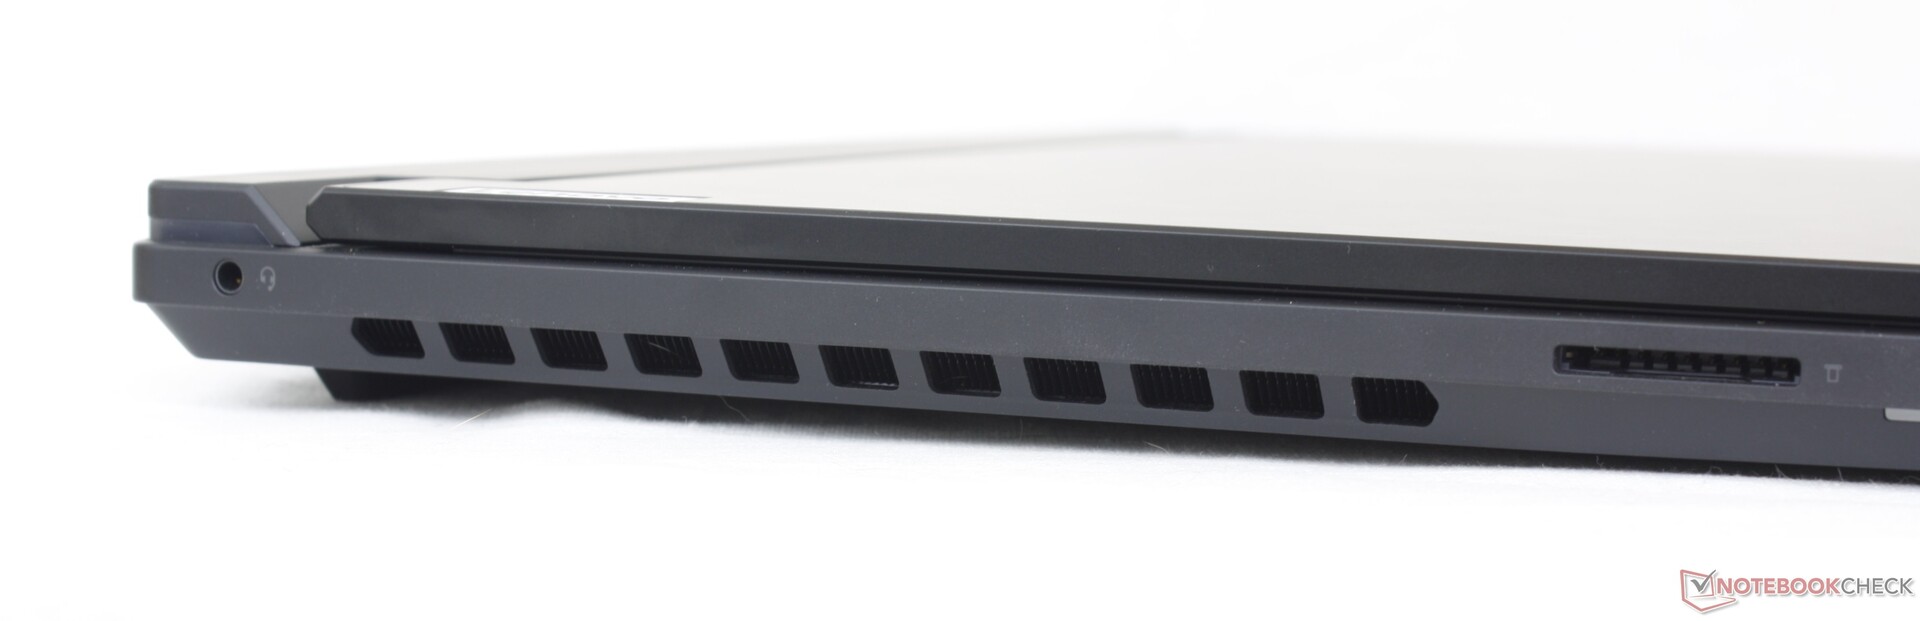
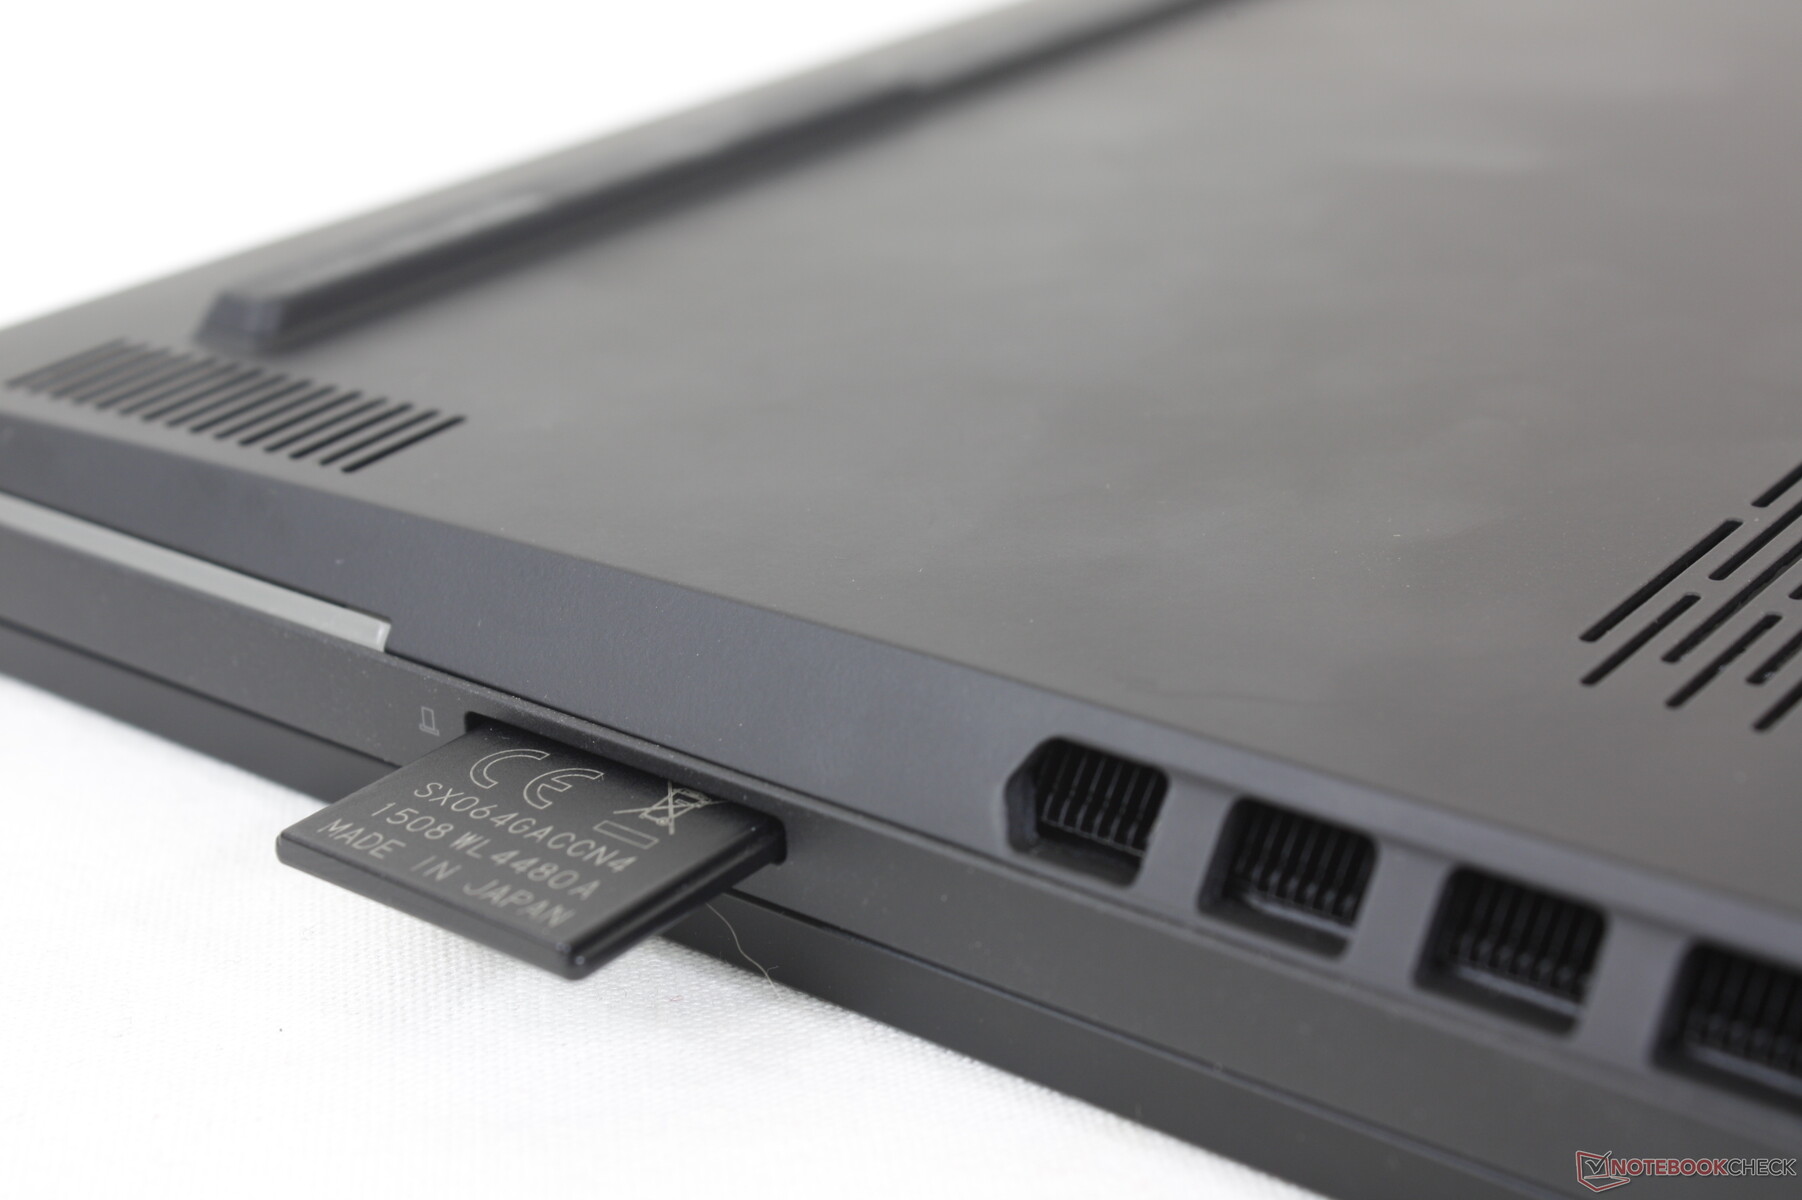
Lecteur de carte SD
Le lecteur SD intégré a pour but d'attirer les créateurs de contenu autant que les joueurs invétérés sur le Legion 9i. Cependant, les taux de transfert ne sont pas très bons, avec moins de la moitié de la vitesse du lecteur SD duRazer Blade 16.
| SD Card Reader | |
| average JPG Copy Test (av. of 3 runs) | |
| Razer Blade 16 Early 2023 RTX 4090 (Angelbird AV PRO 128 GB V60) | |
| Lenovo Legion 9 16IRX8 (Toshiba Exceria Pro SDXC 64 GB UHS-II) | |
| Alienware x16 R1 (AV PRO microSD 128 GB V60) | |
| Lenovo Legion Slim 5 16APH8 (PNY EliteX-Pro60 V60 256 GB) | |
| maximum AS SSD Seq Read Test (1GB) | |
| Alienware x16 R1 (AV PRO microSD 128 GB V60) | |
| Razer Blade 16 Early 2023 RTX 4090 (Angelbird AV PRO 128 GB V60) | |
| Lenovo Legion 9 16IRX8 (Toshiba Exceria Pro SDXC 64 GB UHS-II) | |
| Lenovo Legion Slim 5 16APH8 (PNY EliteX-Pro60 V60 256 GB) | |
Communication
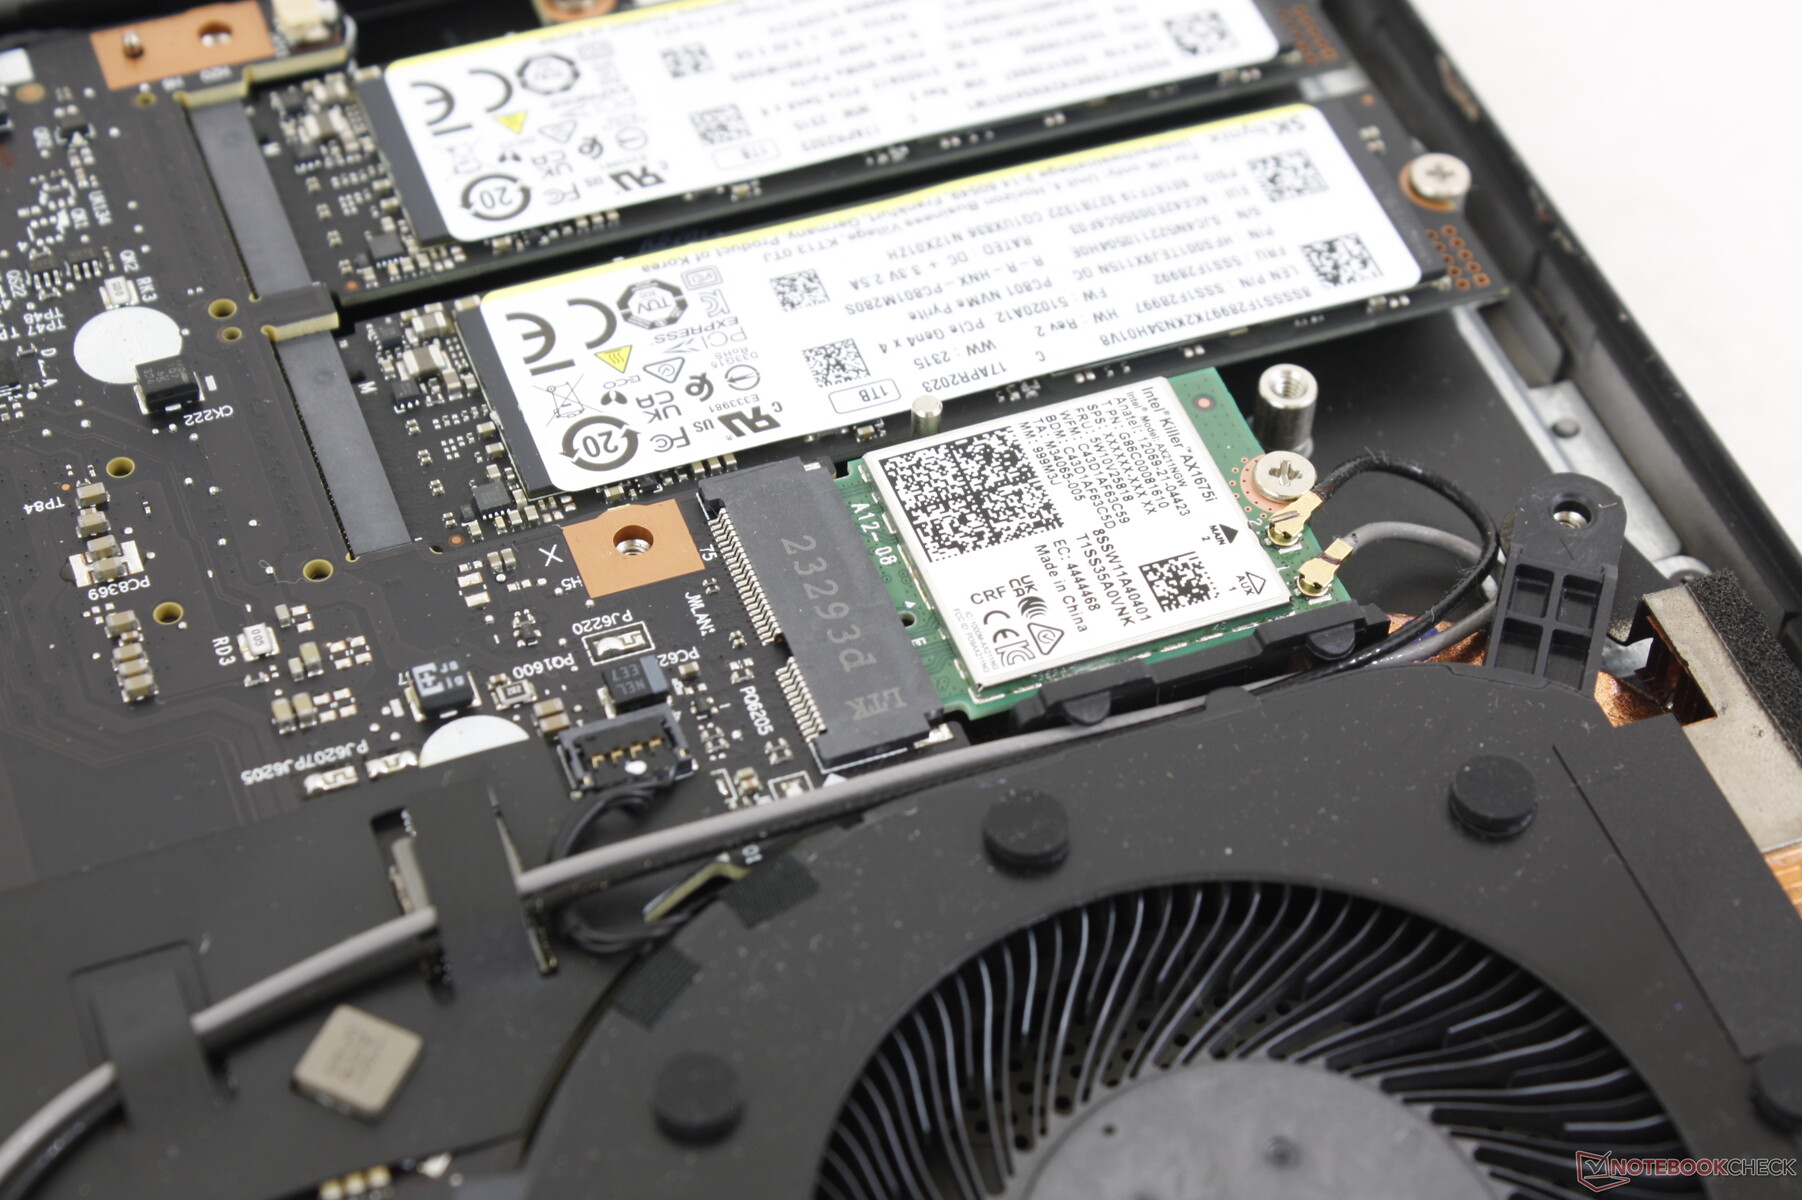
Le Killer AX1675i est livré en standard, ce qui est la marque de jeu de l'AX211 normal. Le Wi-Fi 6E et le Bluetooth 5.3 sont pris en charge et nous n'avons rencontré aucun problème de connectivité lorsque nous l'avons couplé à notre réseau Asus AXE11000 6 GHz.
Webcam
La webcam de 2 mégapixels est standard dans la catégorie des ordinateurs portables de jeu. Bien qu'il y ait un bouton d'arrêt de la caméra intégré, il n'y a pas de capteur infrarouge.

")
")
Maintenance
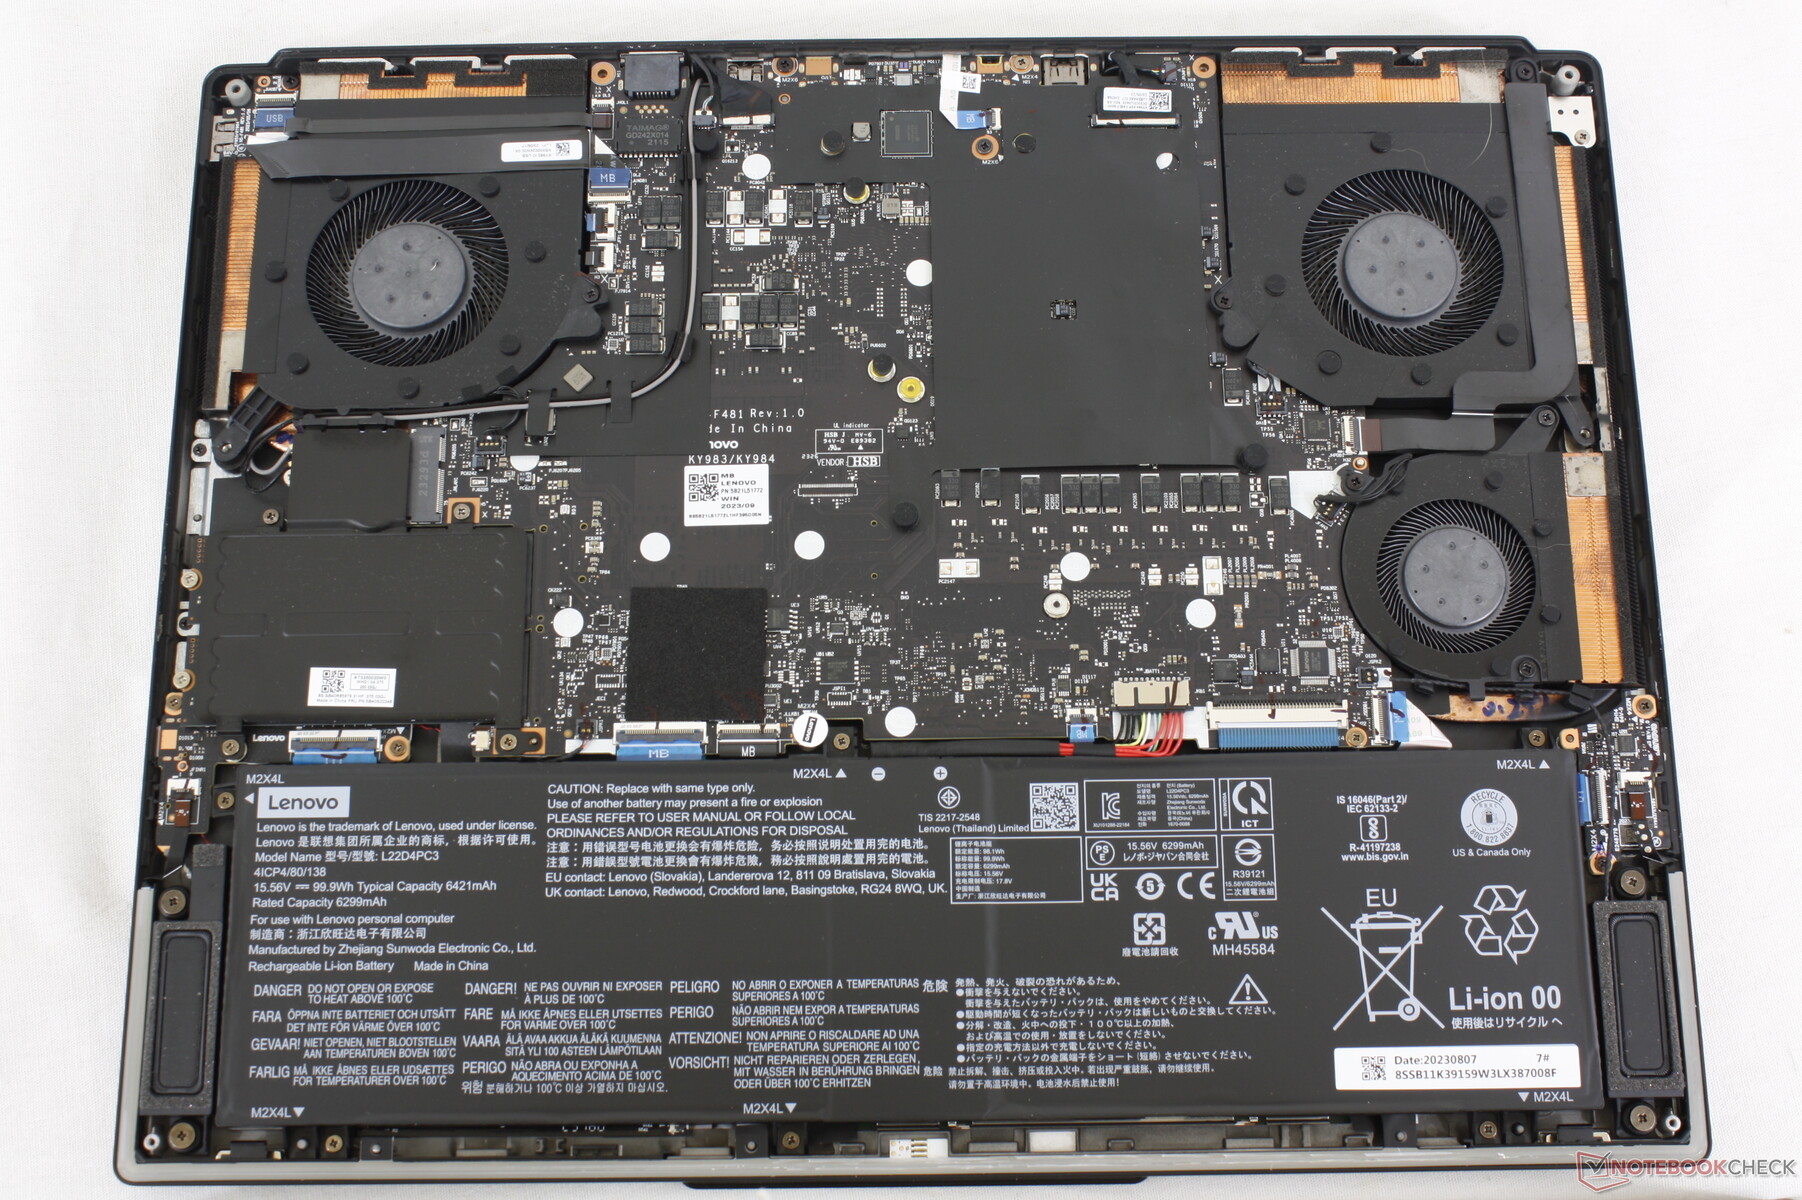
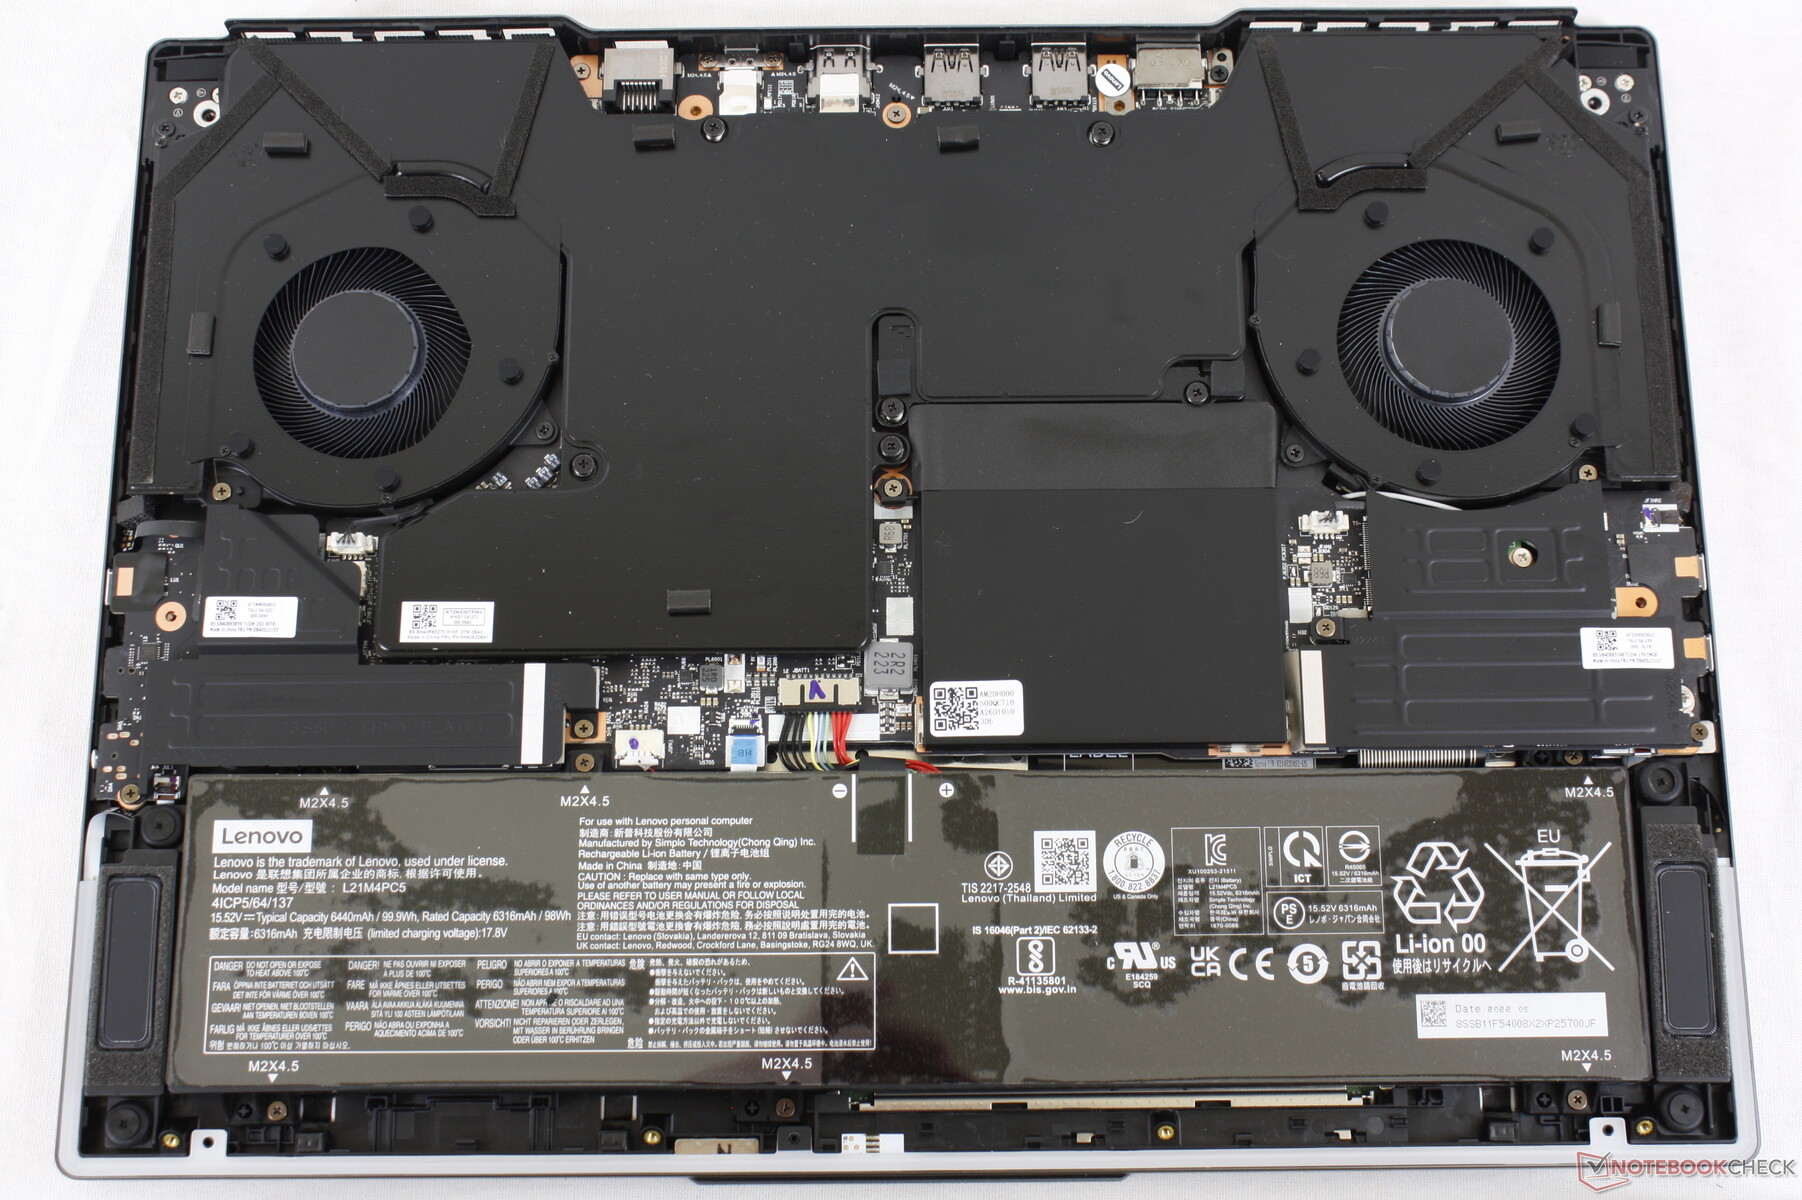
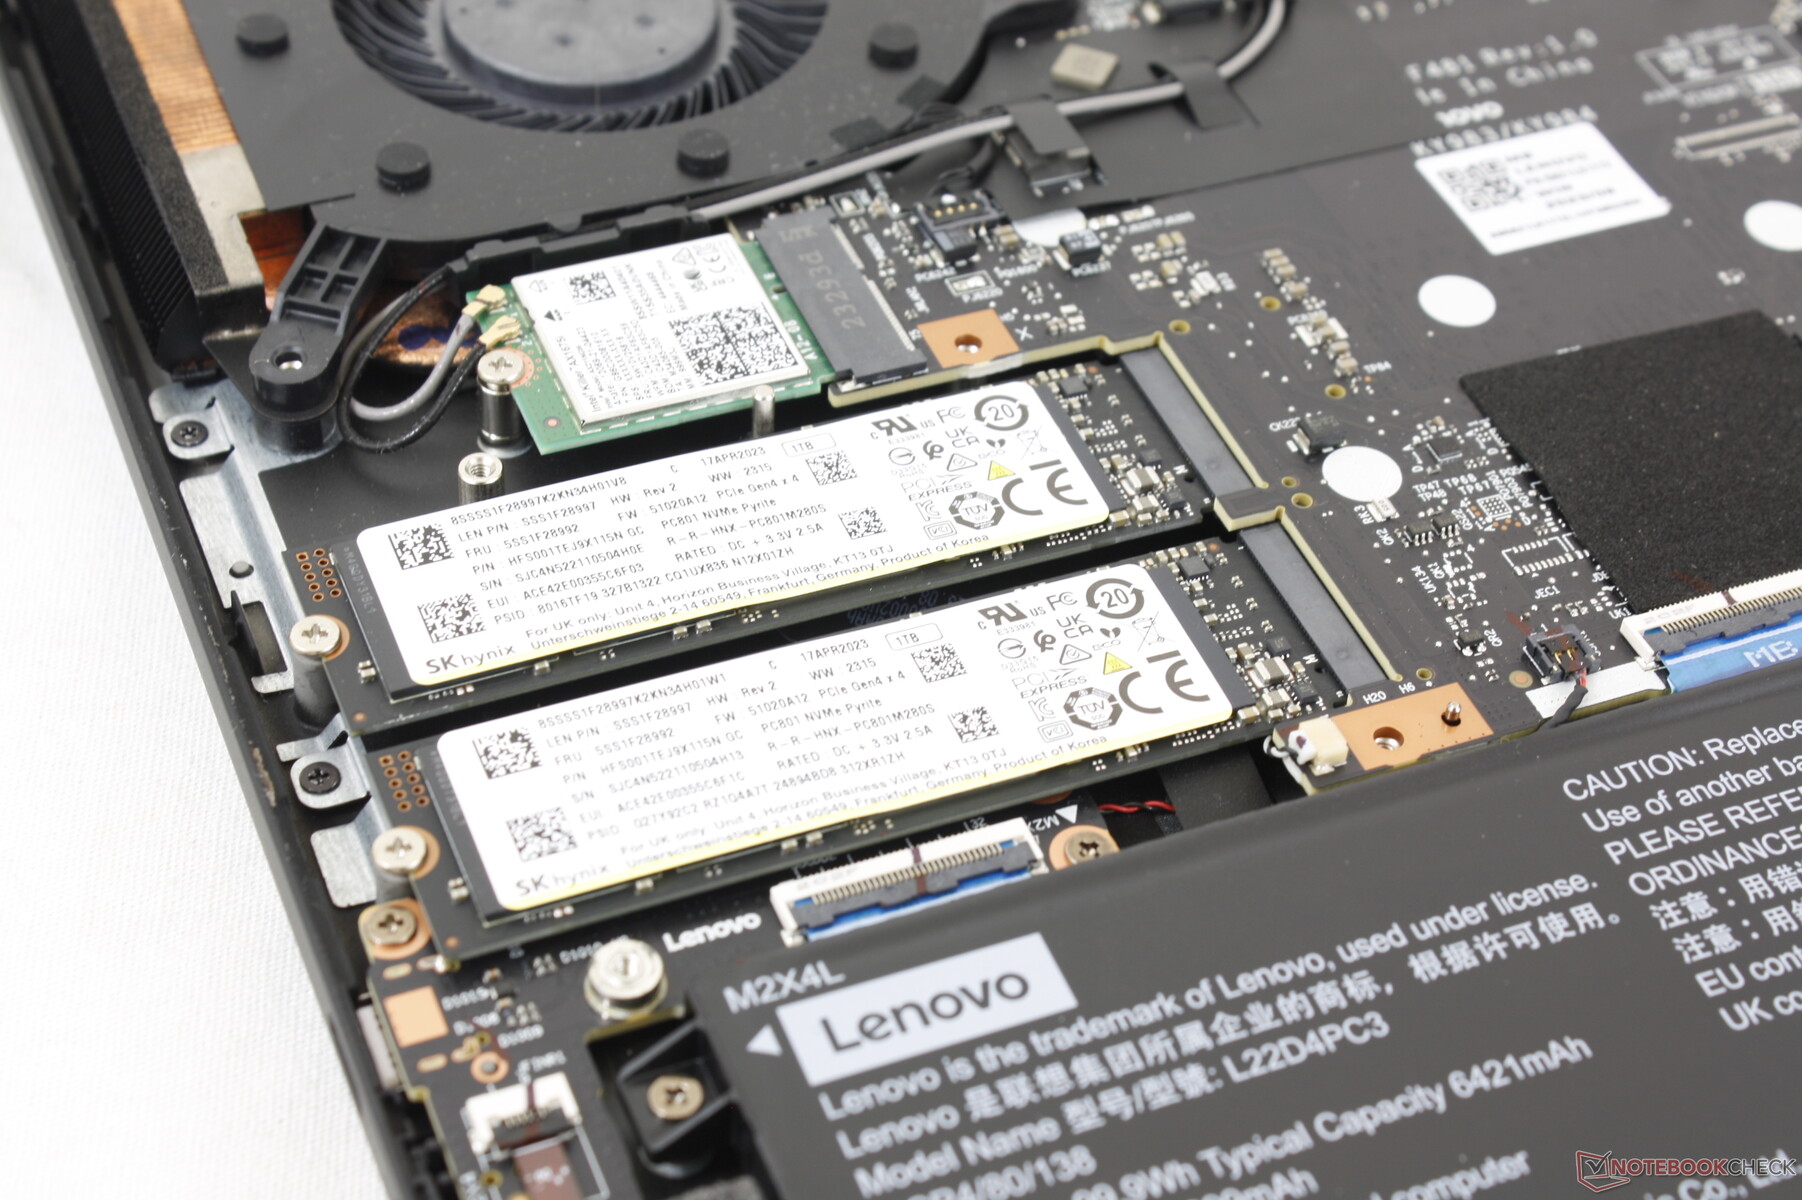
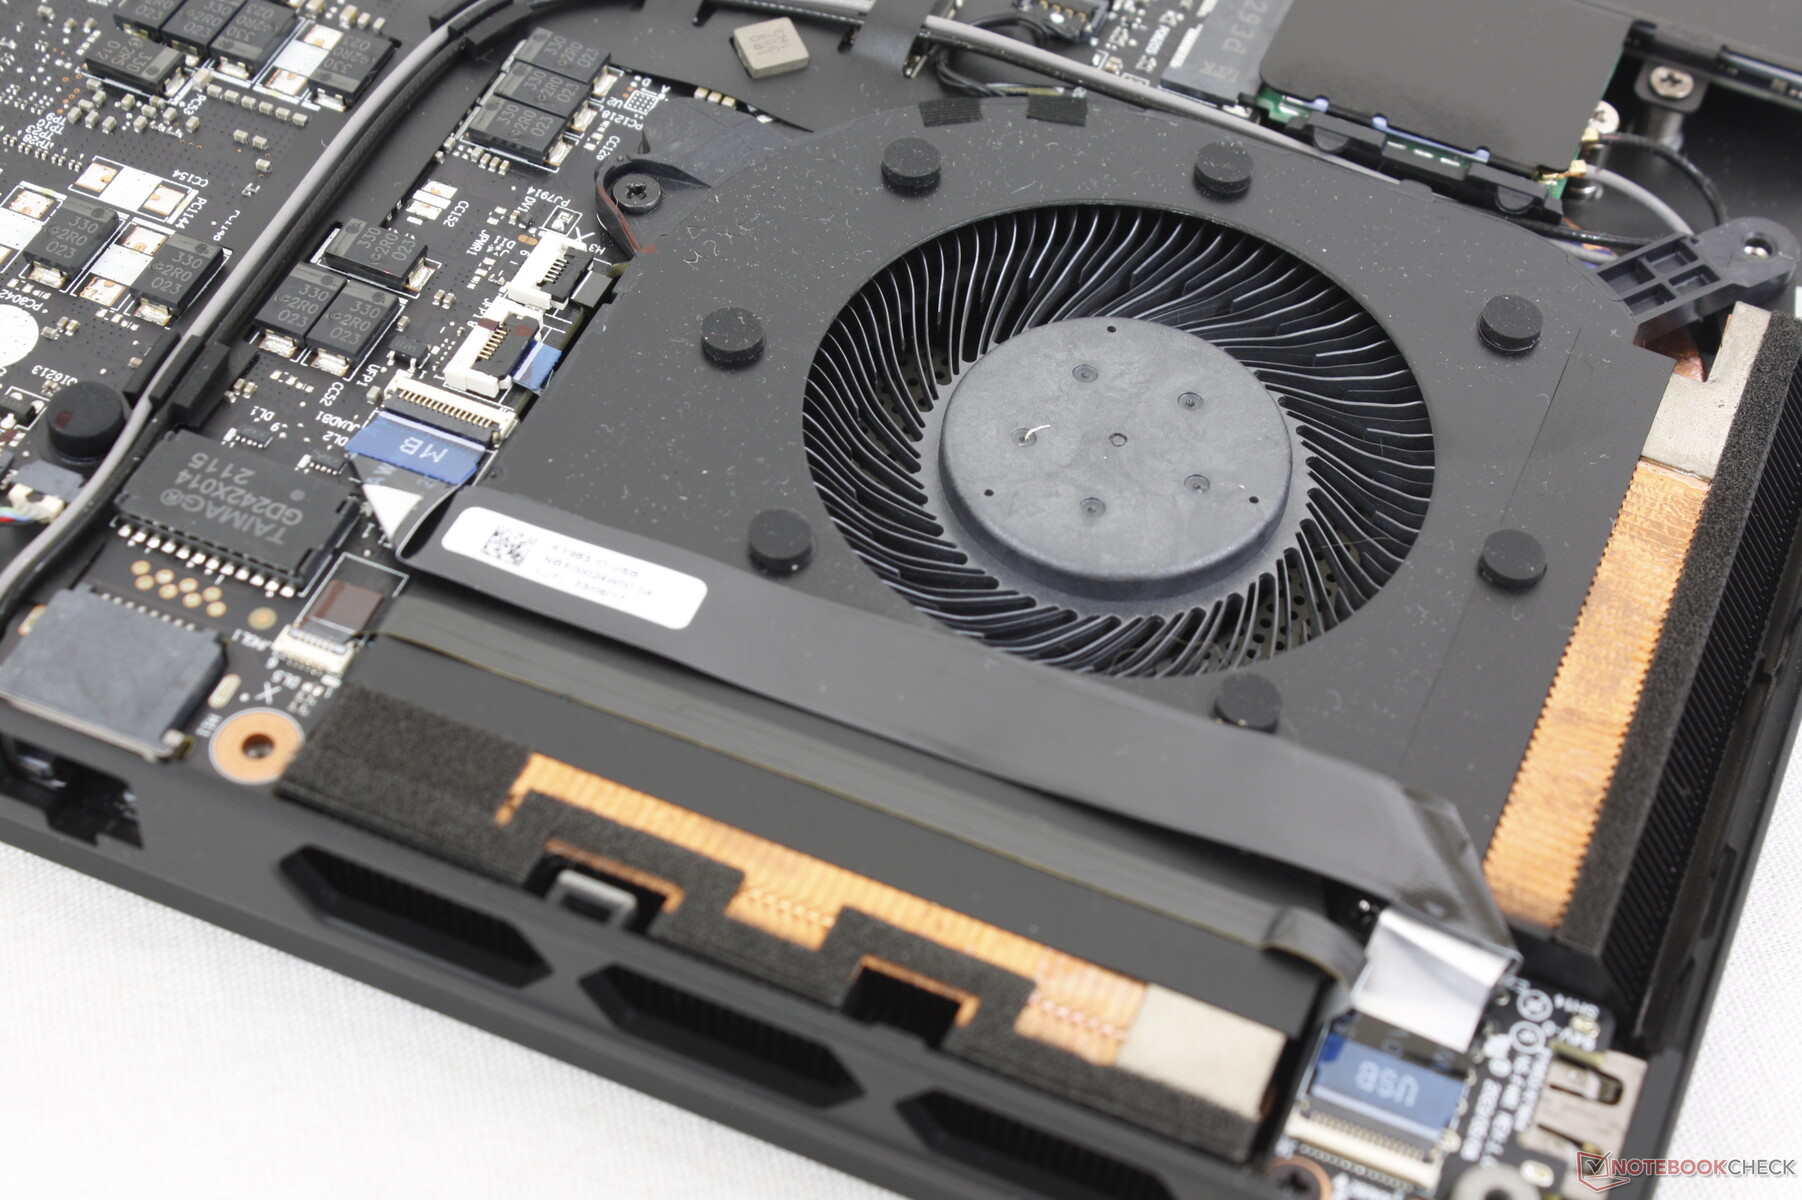
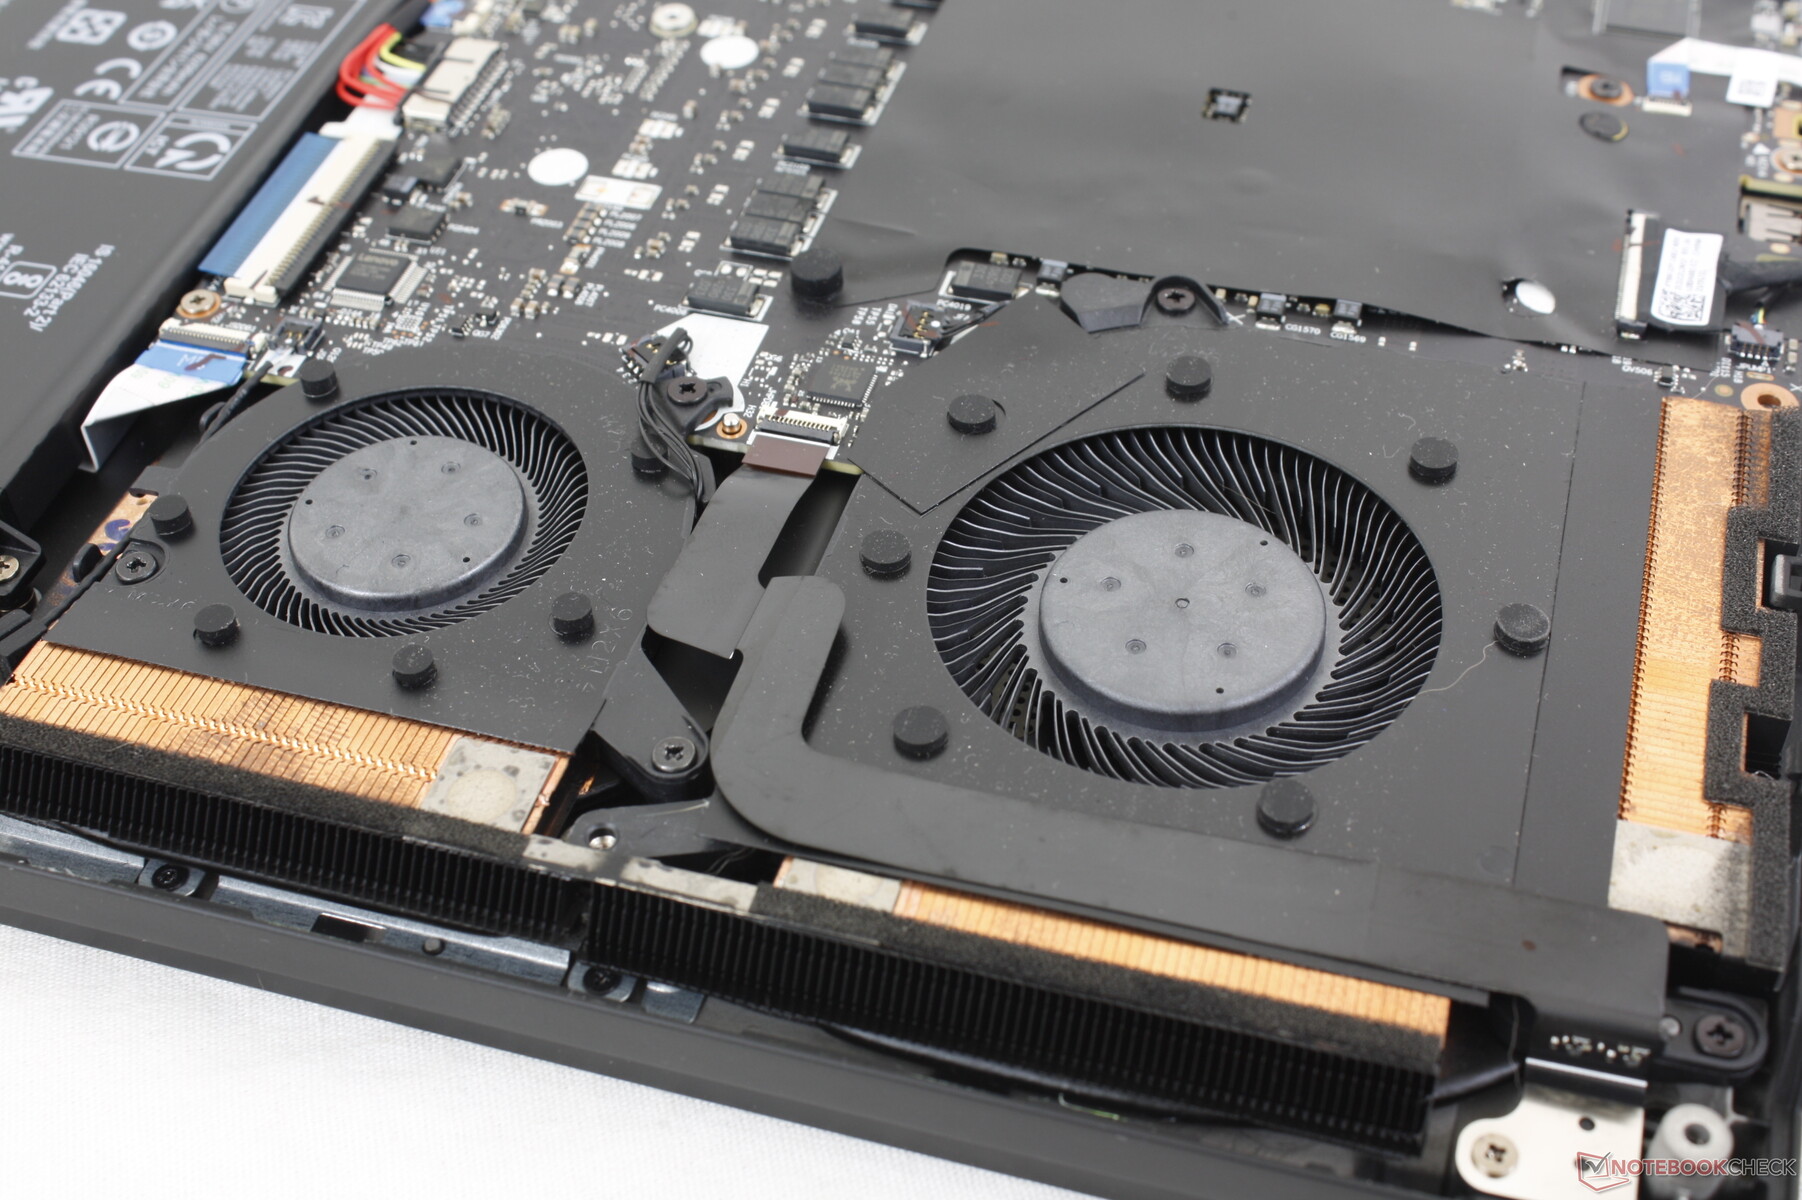
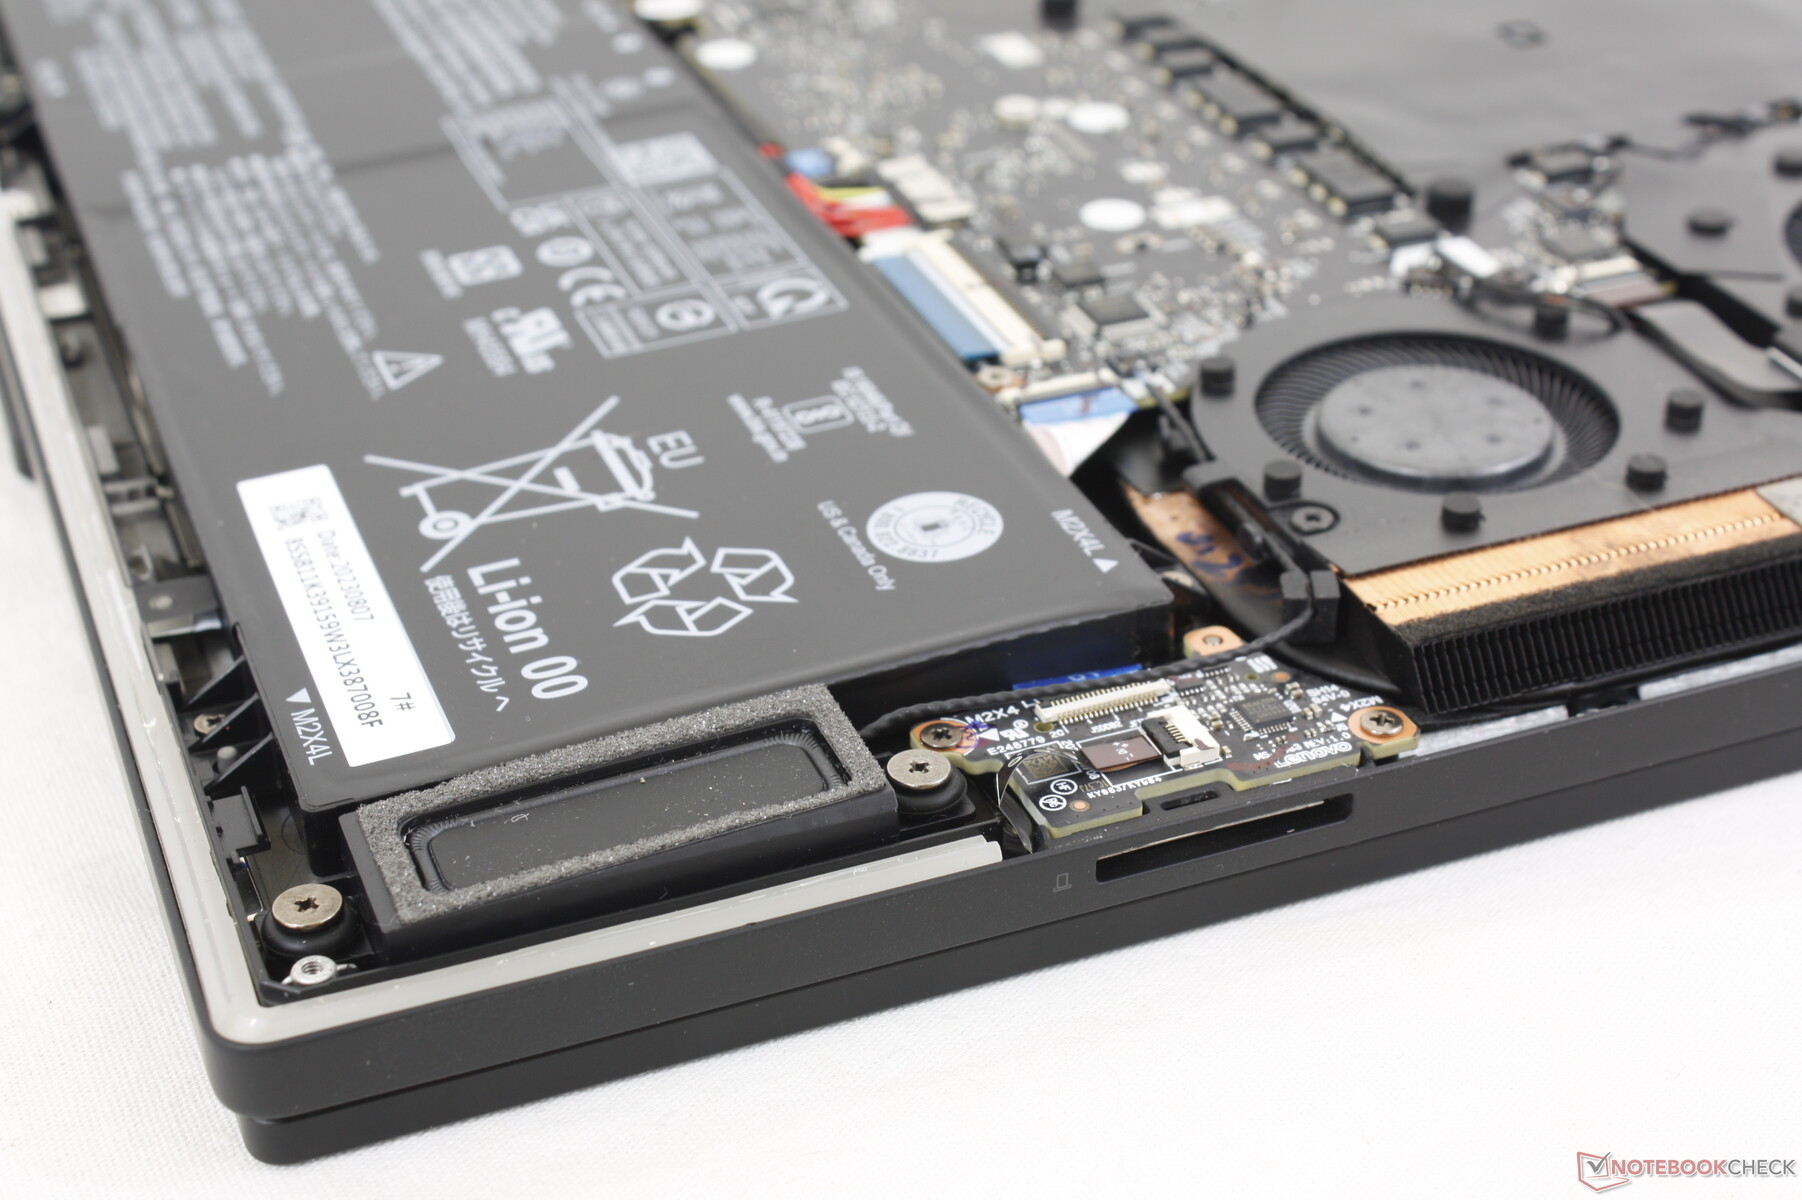
Le panneau inférieur est fixé par 8 vis Phillips pour un démontage relativement facile. Contrairement à la plupart des autres ordinateurs portables, la carte mère du Legion 9 16 est à l'envers et un démontage supplémentaire est donc nécessaire pour accéder aux modules de RAM de la solution de refroidissement. Au moins, les deux emplacements pour SSD M.2 2280 sont facilement accessibles.
Accessoires et garantie
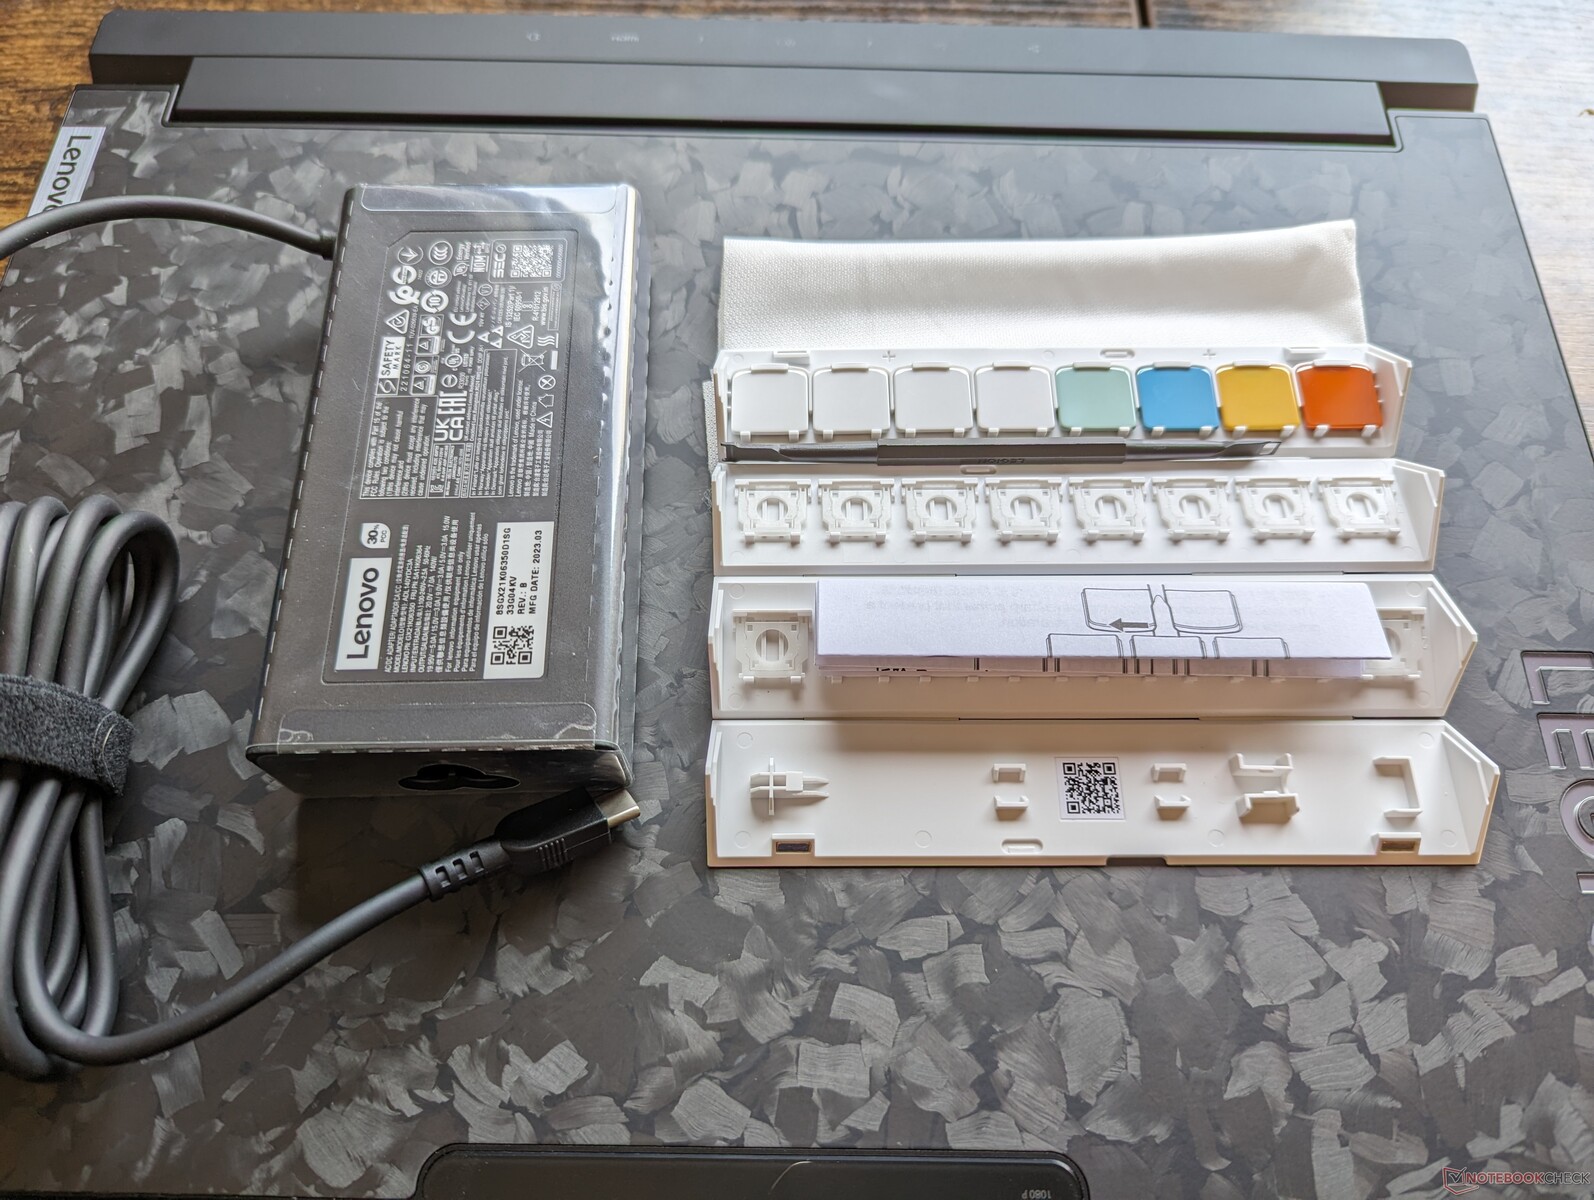
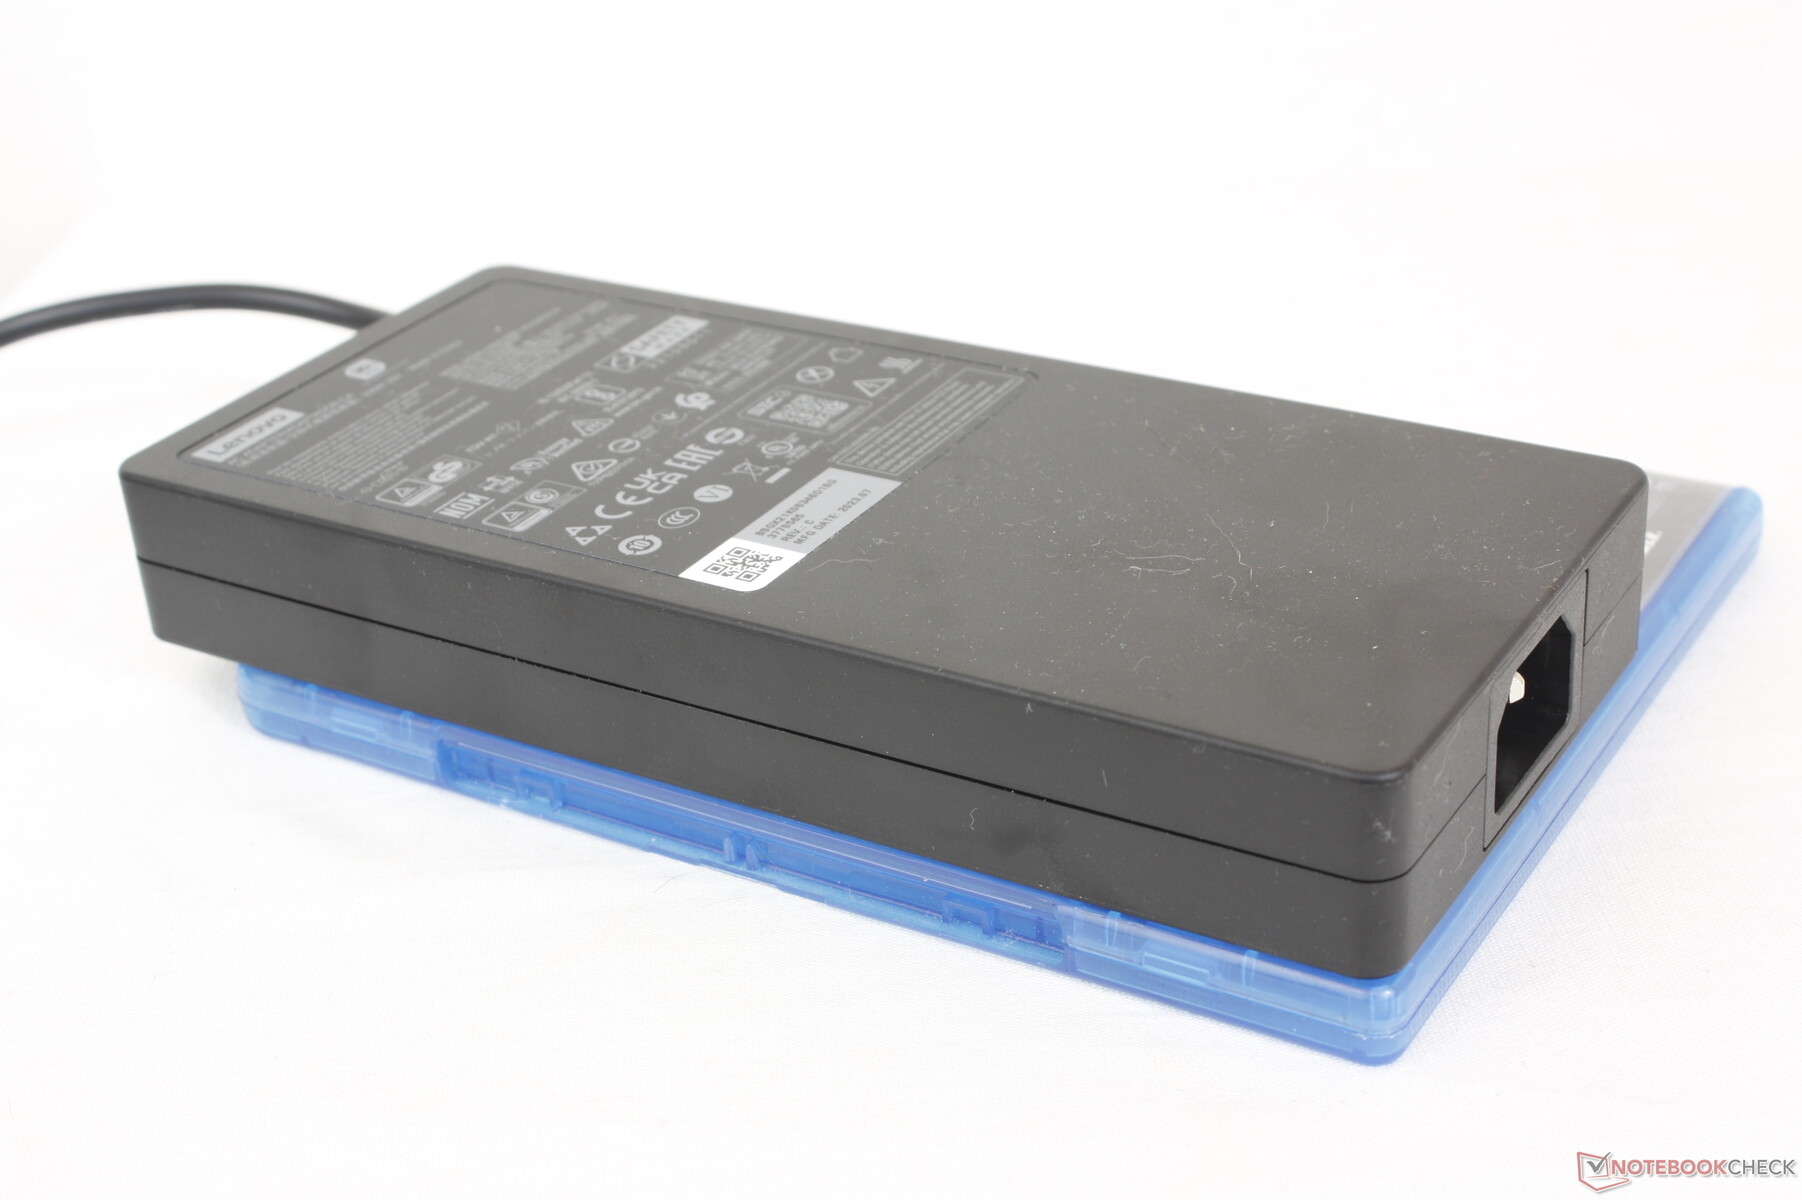
En plus de l'habituel adaptateur secteur propriétaire et de la documentation, la boîte de vente au détail comprend également un adaptateur USB-C universel de 140 W très pratique qui peut être utilisé pour charger cet ordinateur portable et la plupart des autres périphériques USB-C, ainsi que 8 capuchons de touches.
La garantie constructeur limitée standard d'un an s'applique si vous l'achetez aux États-Unis.
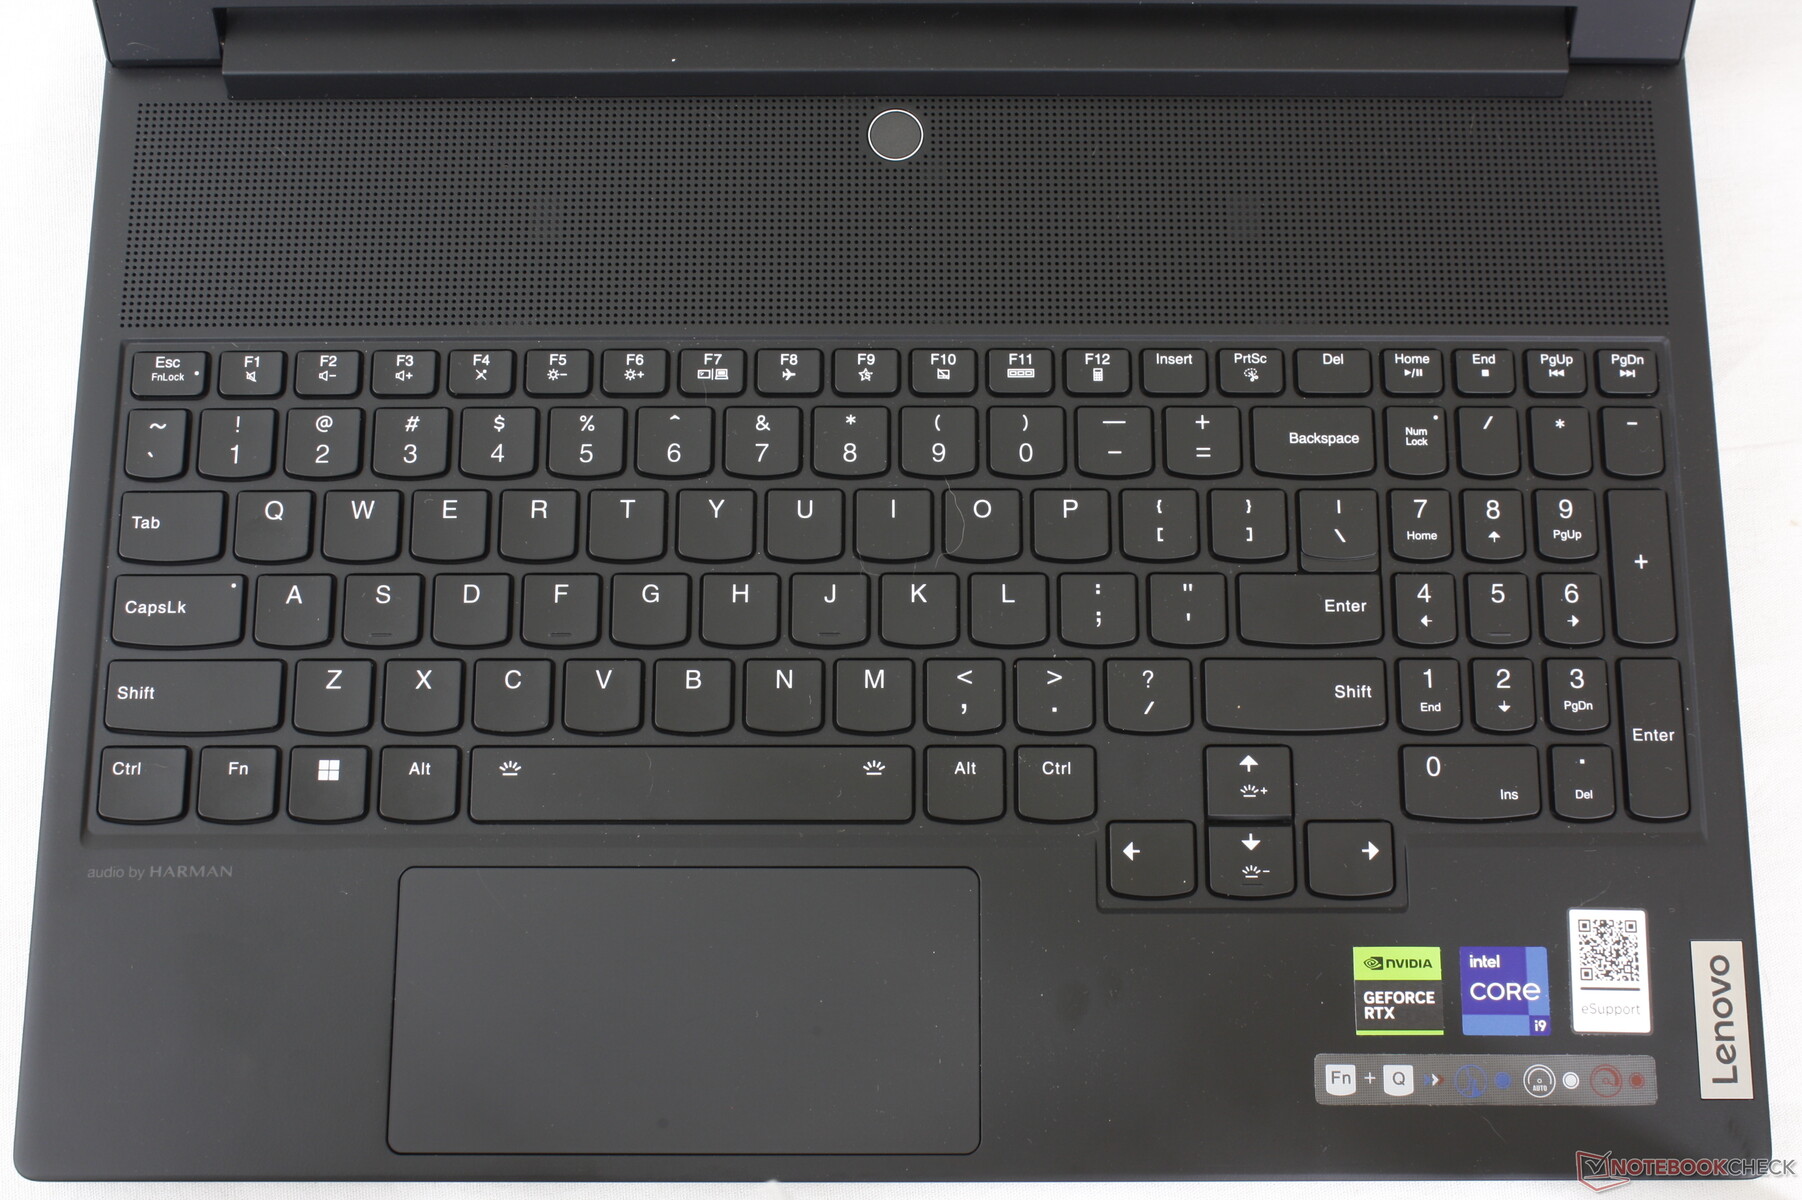
Périphériques d'entrée - Un clavier confortable et un pavé numérique exigu
Clavier
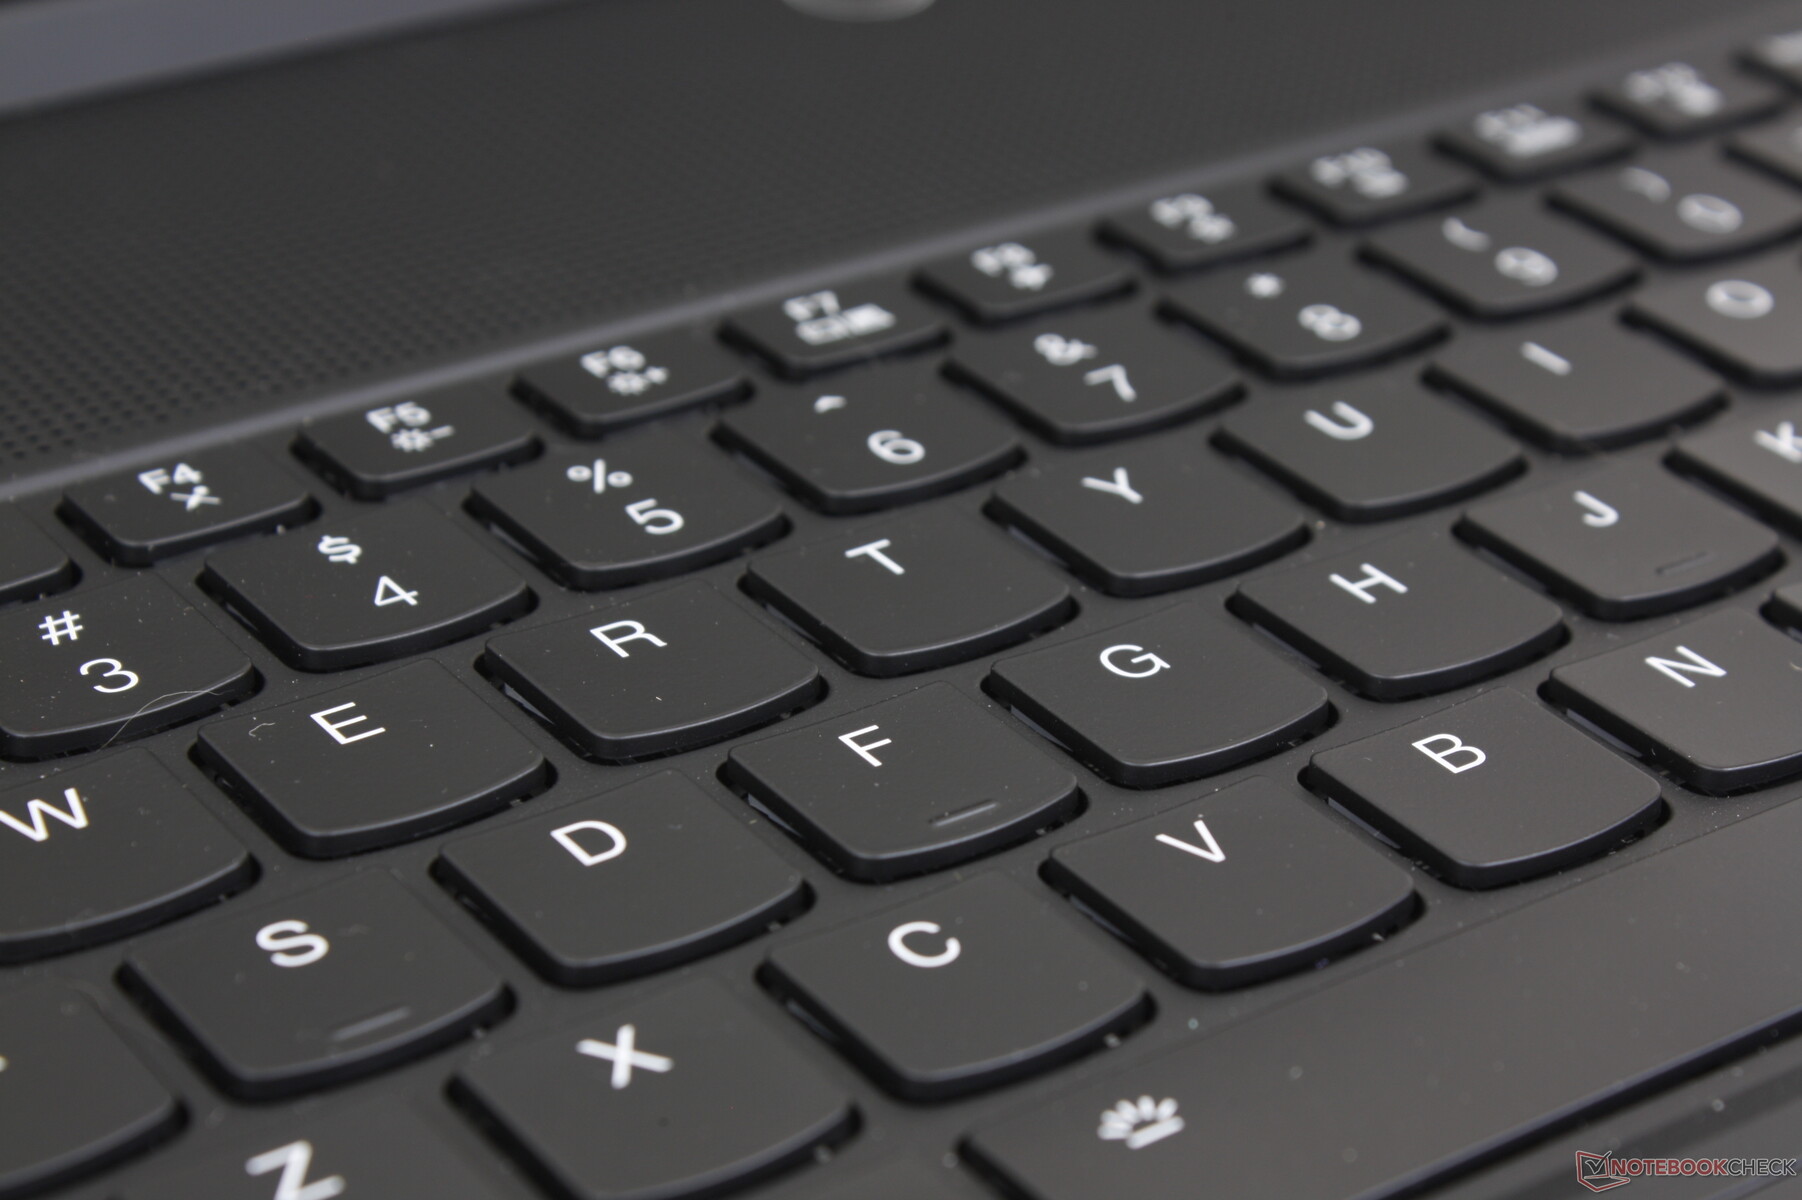
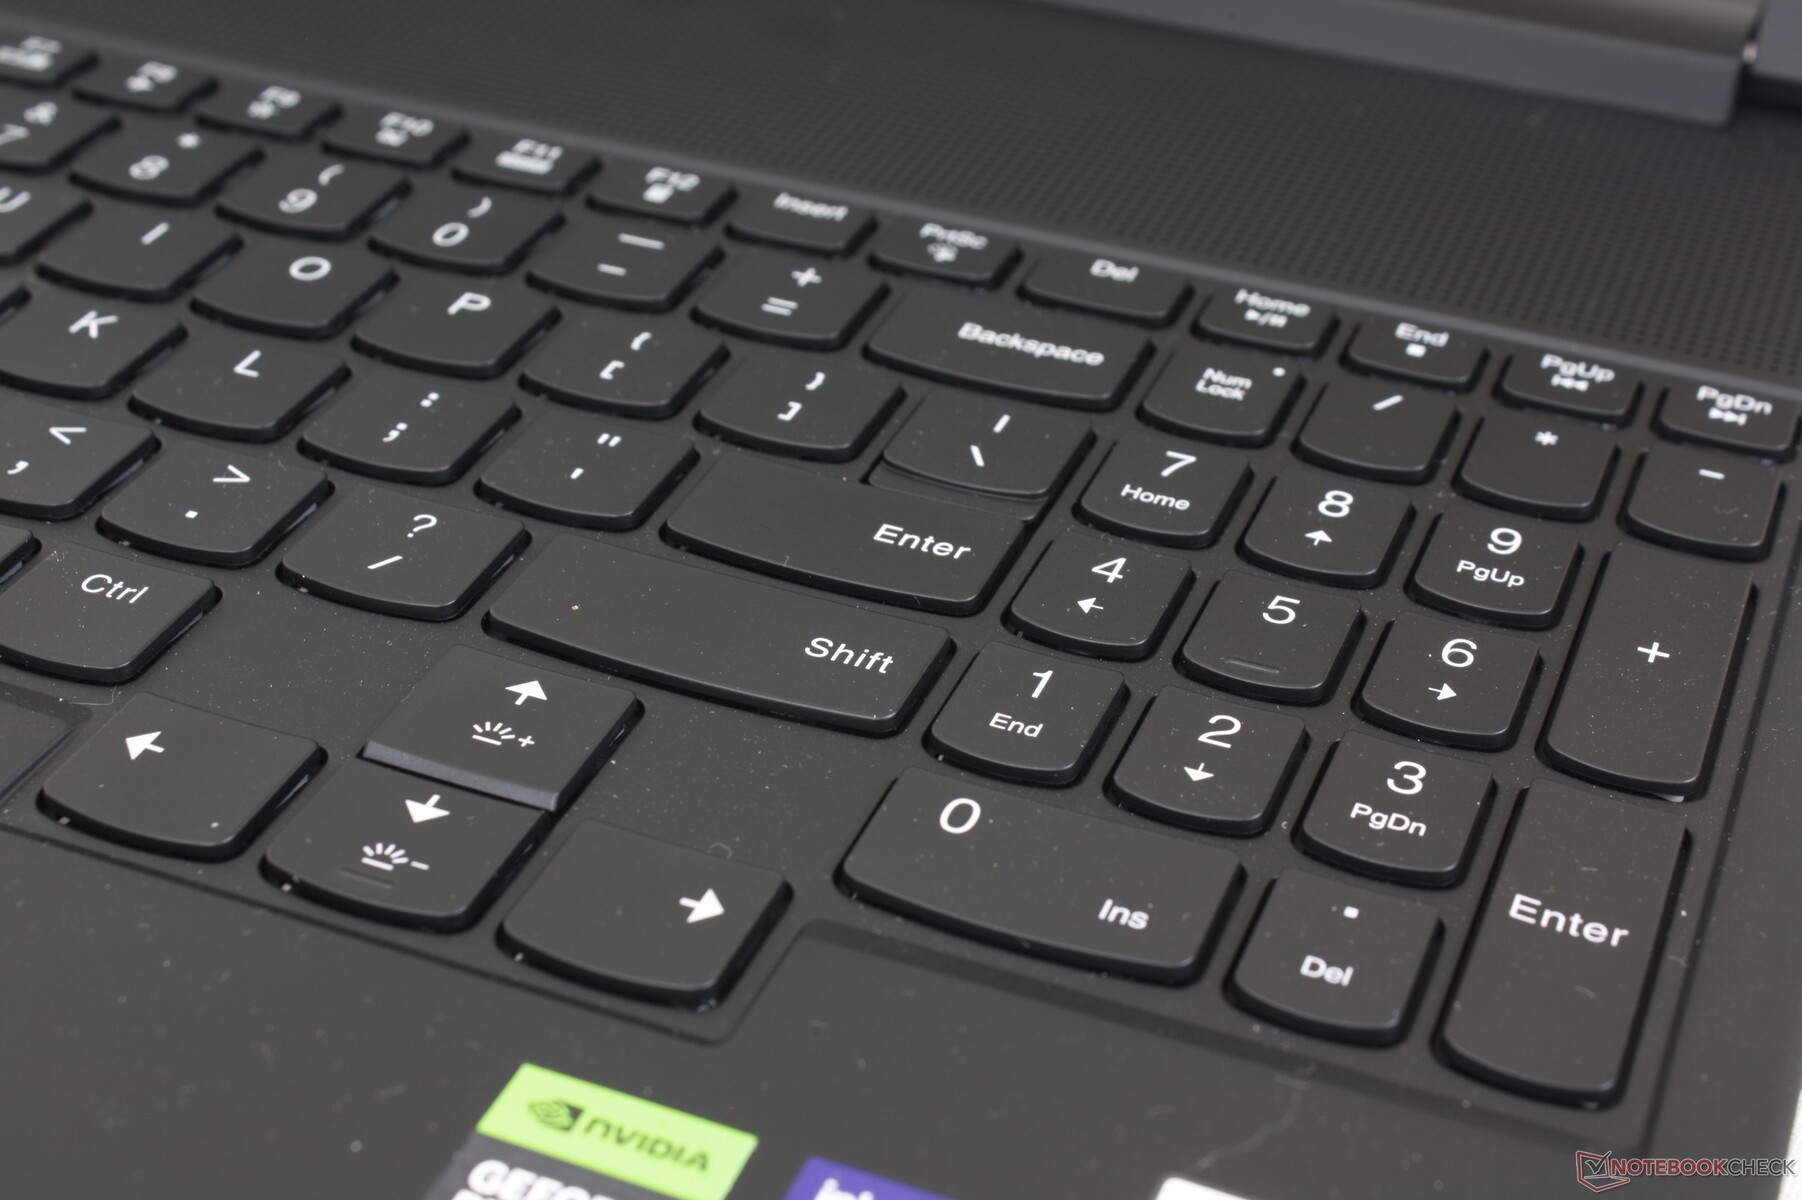
Le clavier TrueStrike offre une course de 1,5 mm, ce qui le rend légèrement plus profond que les touches de la plupart des ultrabooks. Le retour d'information est étonnamment net et confortable pour des touches à membrane, ce qui prouve qu'il n'est pas nécessaire d'avoir des commutateurs mécaniques sophistiqués pour une bonne expérience de frappe. Les touches fermes sont plus bruyantes que celles du Blade 16 ou de l'Asus Zephyrus M16 Asus Zephyrus M16 mais certainement pas aussi bruyantes que les touches mécaniques de modèles comme le Schenker XMG Neo 15 ou le Alienware m18.
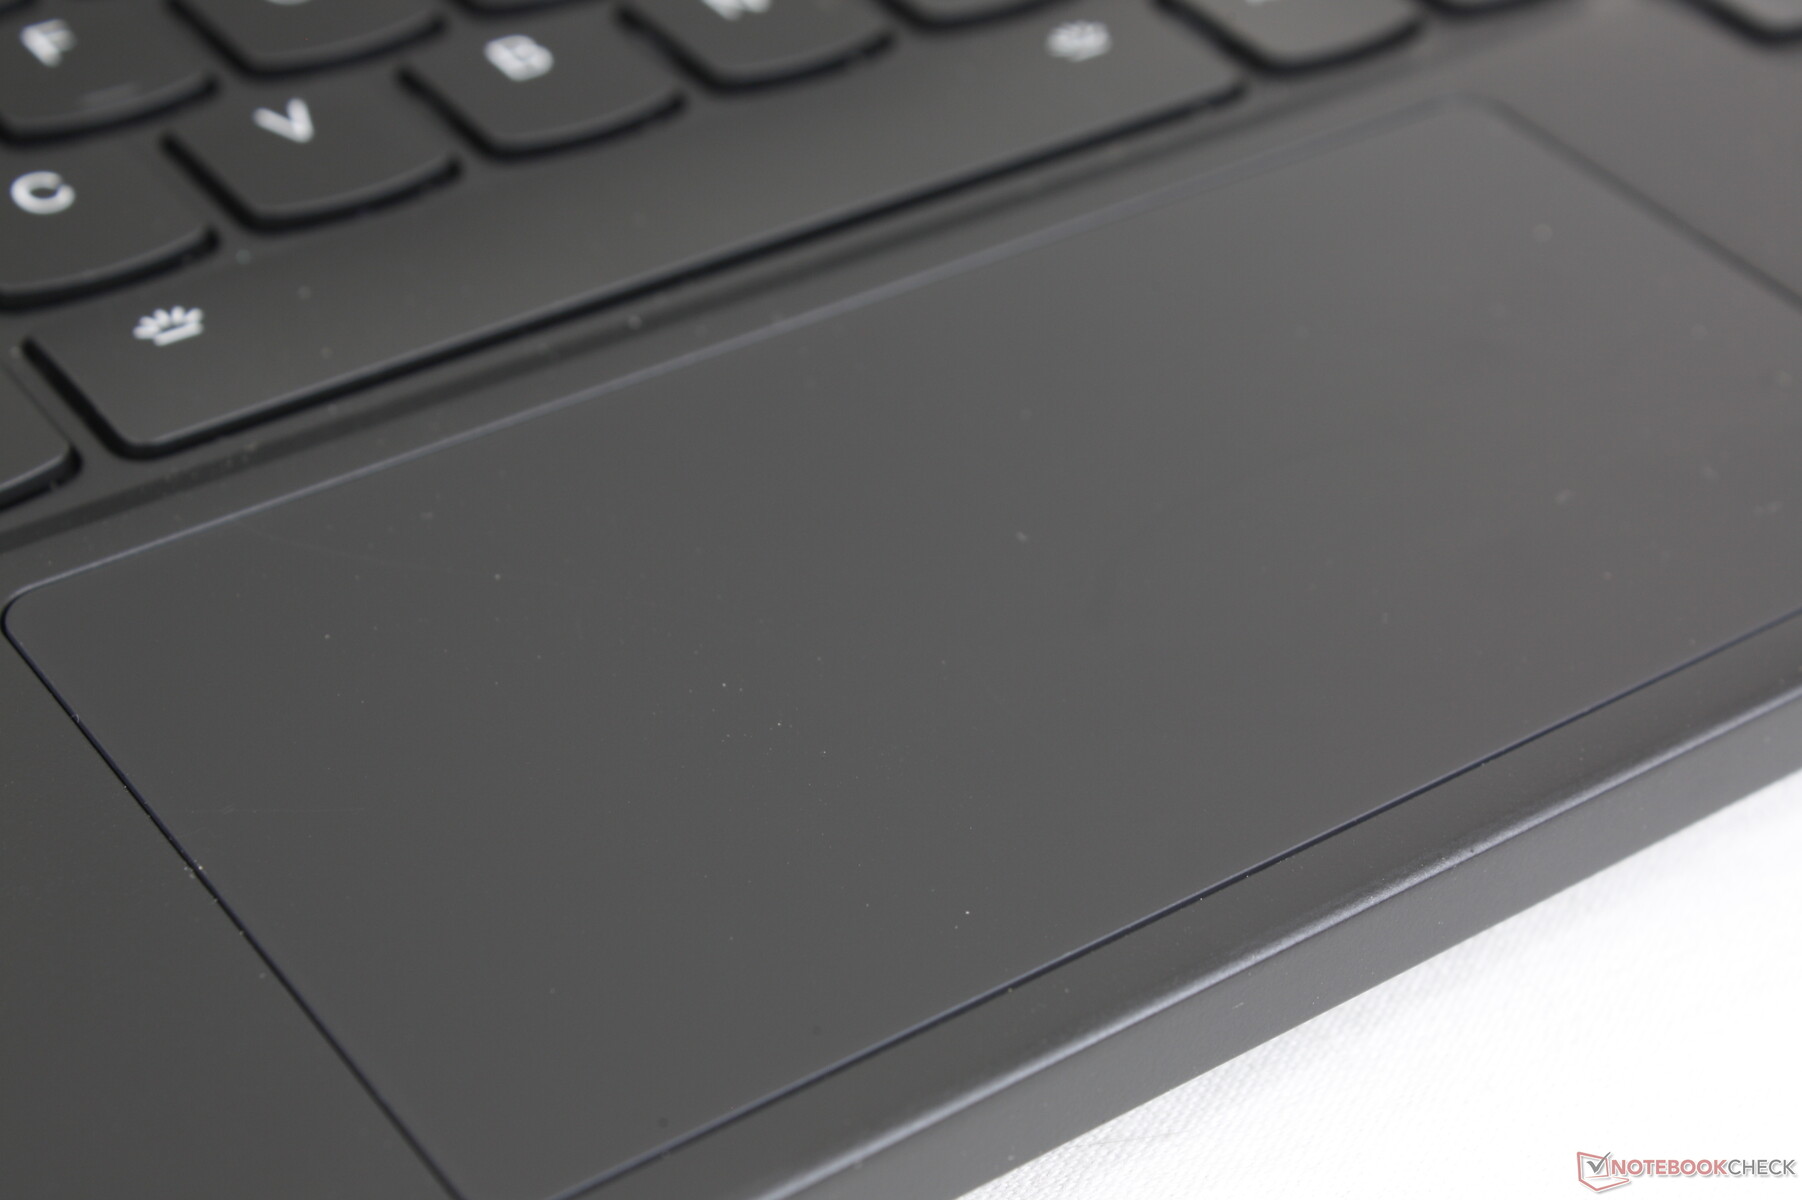
Pavé tactile
La taille du pavé tactile a été réduite à 12 x 5,9 cm en raison du positionnement du clavier. Les mouvements verticaux du curseur sur le grand écran 16:10 se font donc à l'étroit, surtout si l'on compare avec des ordinateurs portables de jeu dotés d'un pavé tactile beaucoup plus grand, comme le Razer Blade 16lenovo compte sur le fait que les joueurs utiliseront leurs propres souris USB ou Bluetooth dans la plupart des cas.
Le glissement et le clic sont fluides et satisfaisants malgré la petite surface. Cependant, les mouvements du curseur se figeaient occasionnellement sur notre appareil lors de l'utilisation du clickpad alors que le même problème ne se produisait pas lors de l'utilisation d'une souris externe. Nous vous recommandons de vérifier le pavé numérique lors de l'achat pour vous assurer qu'il ne présente aucun défaut.
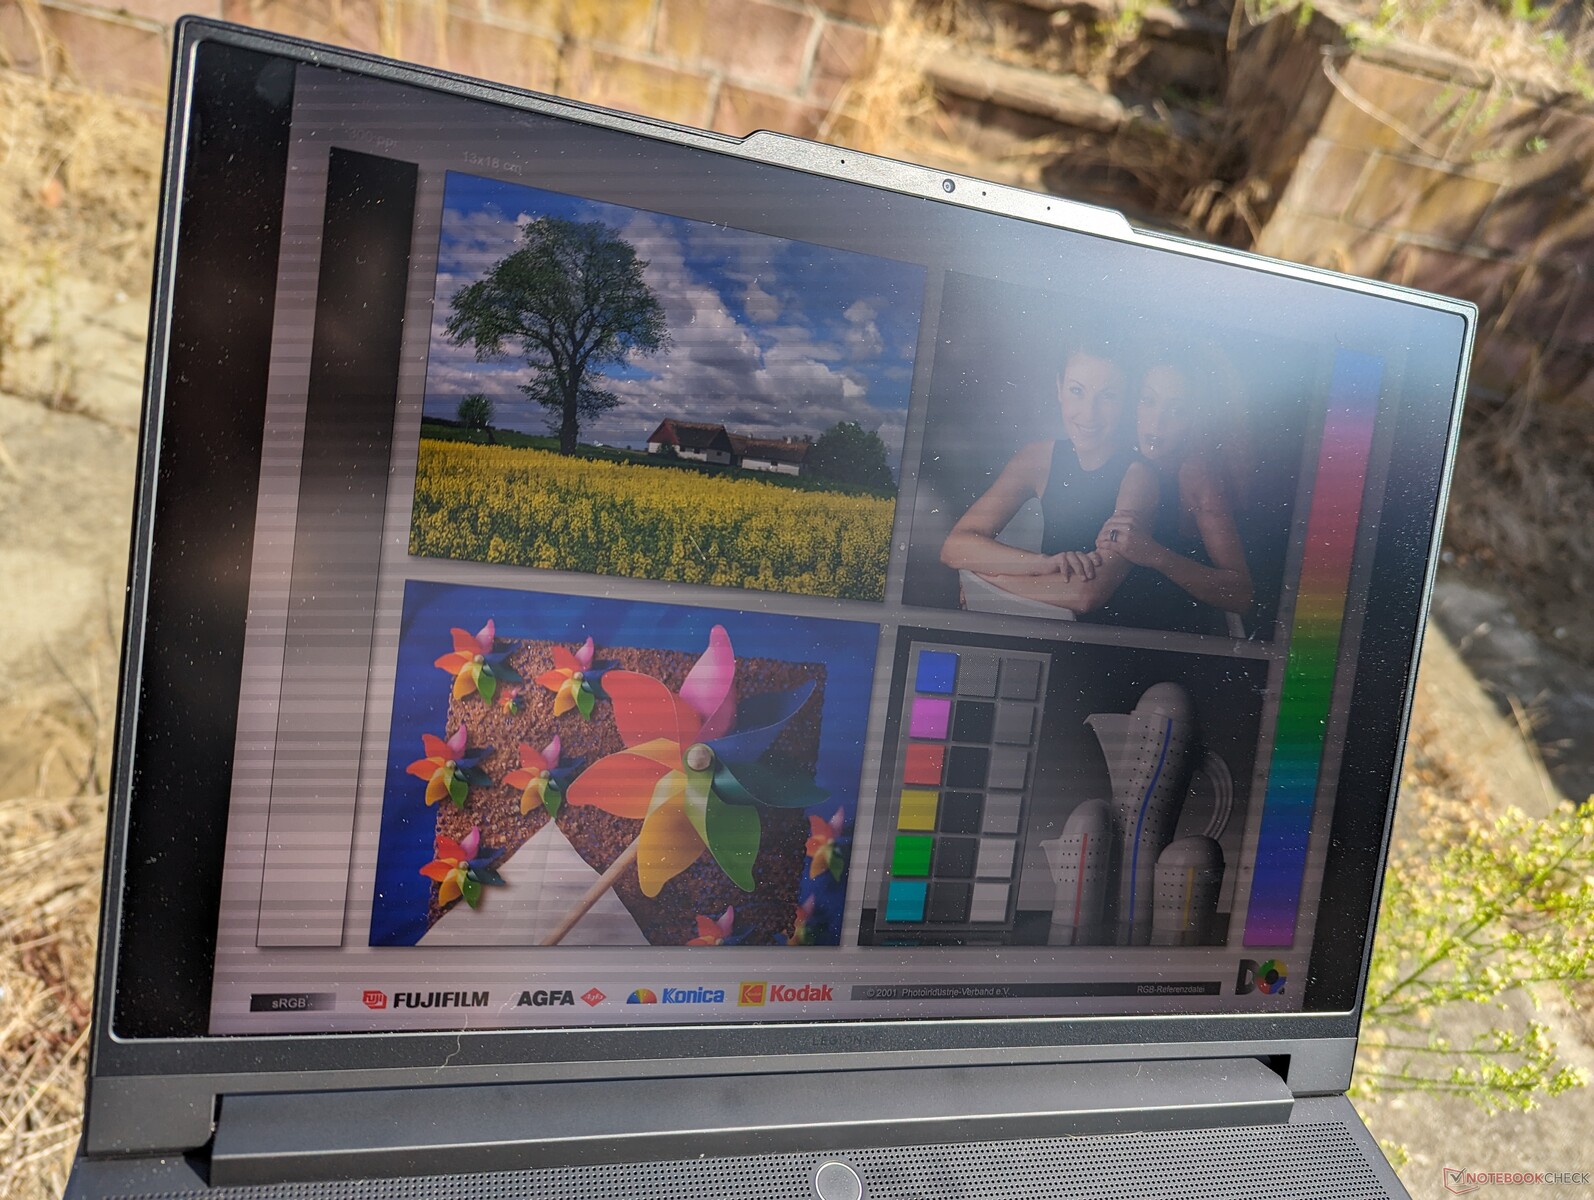
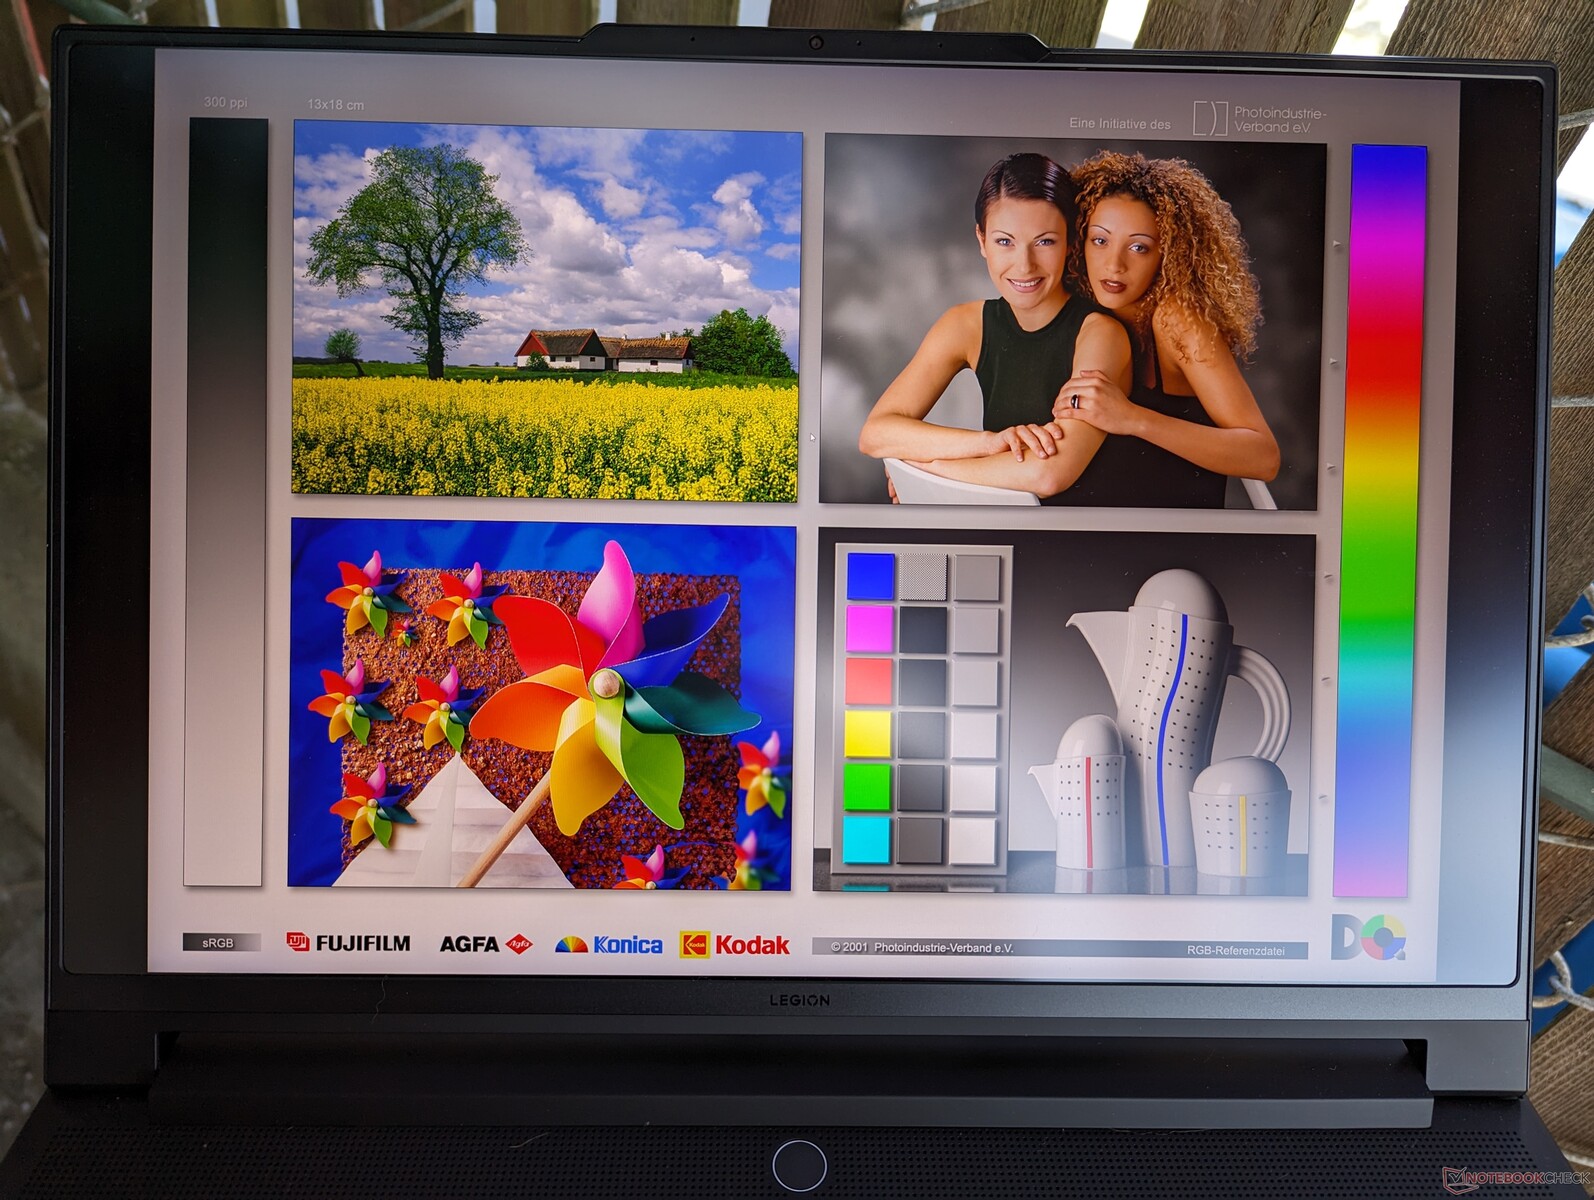
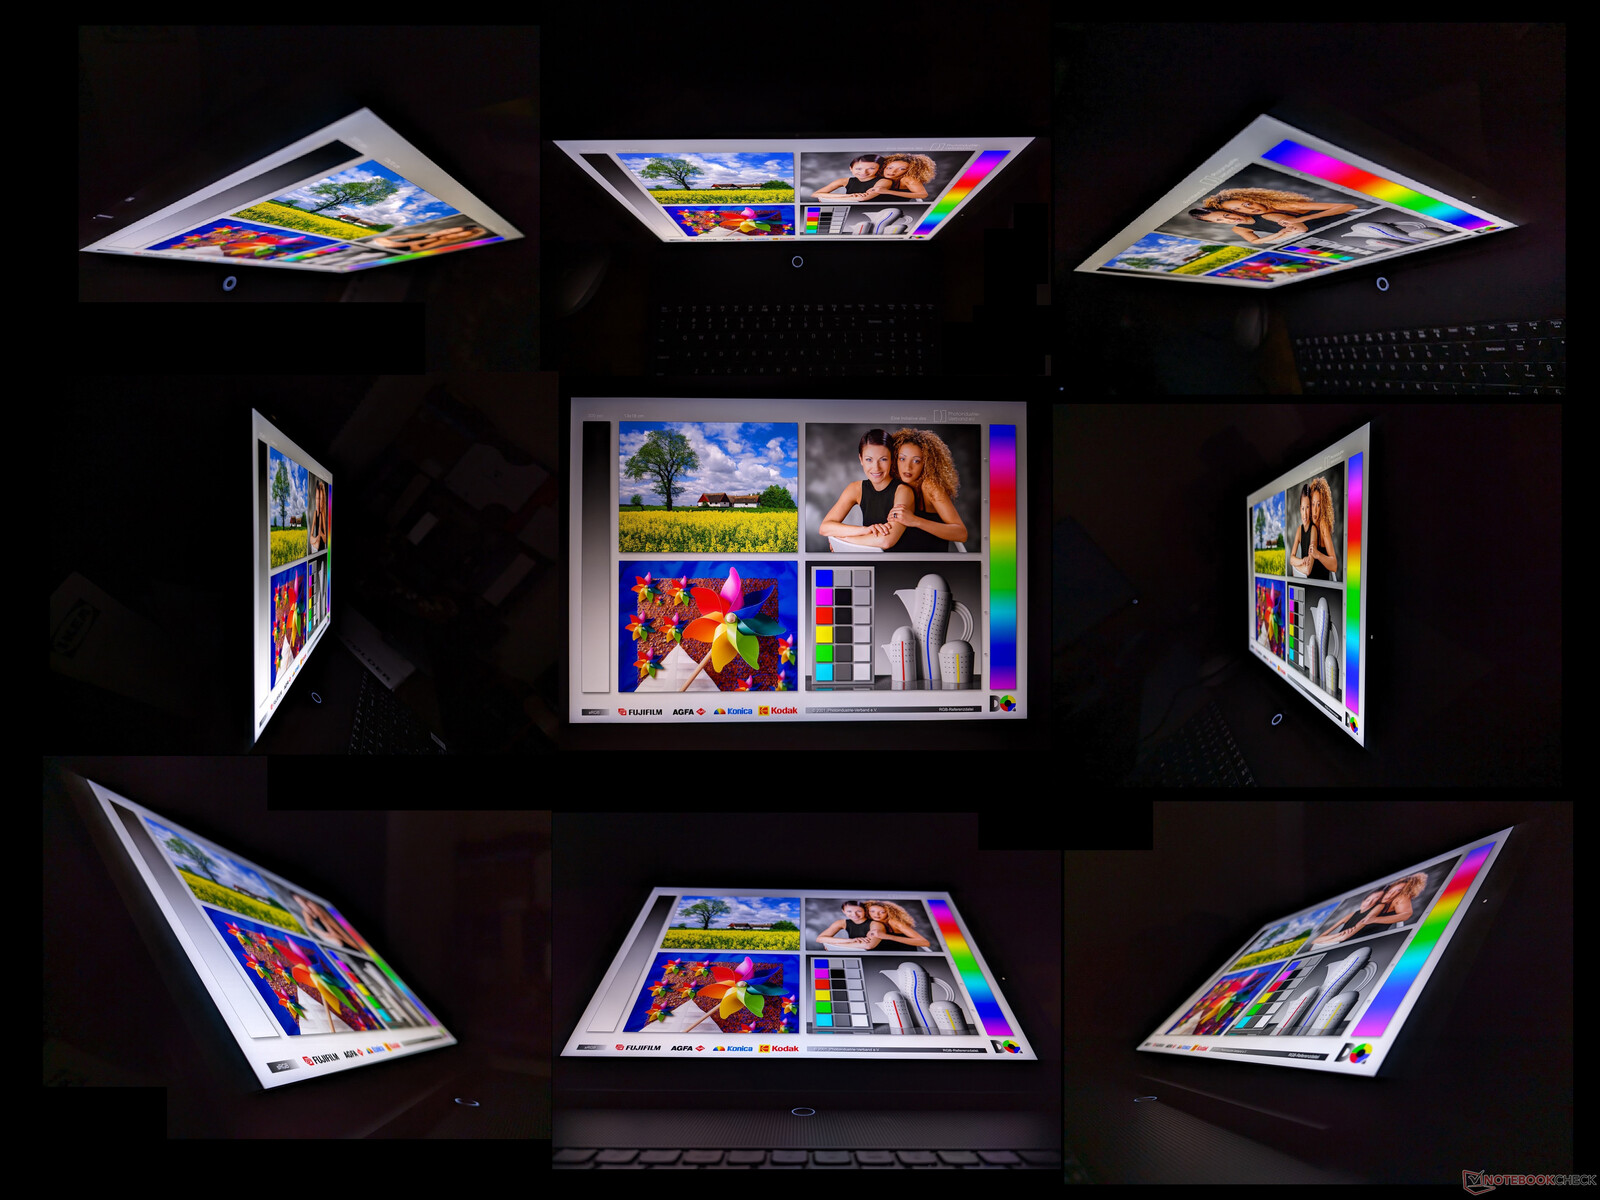
Display - L'attraction principale
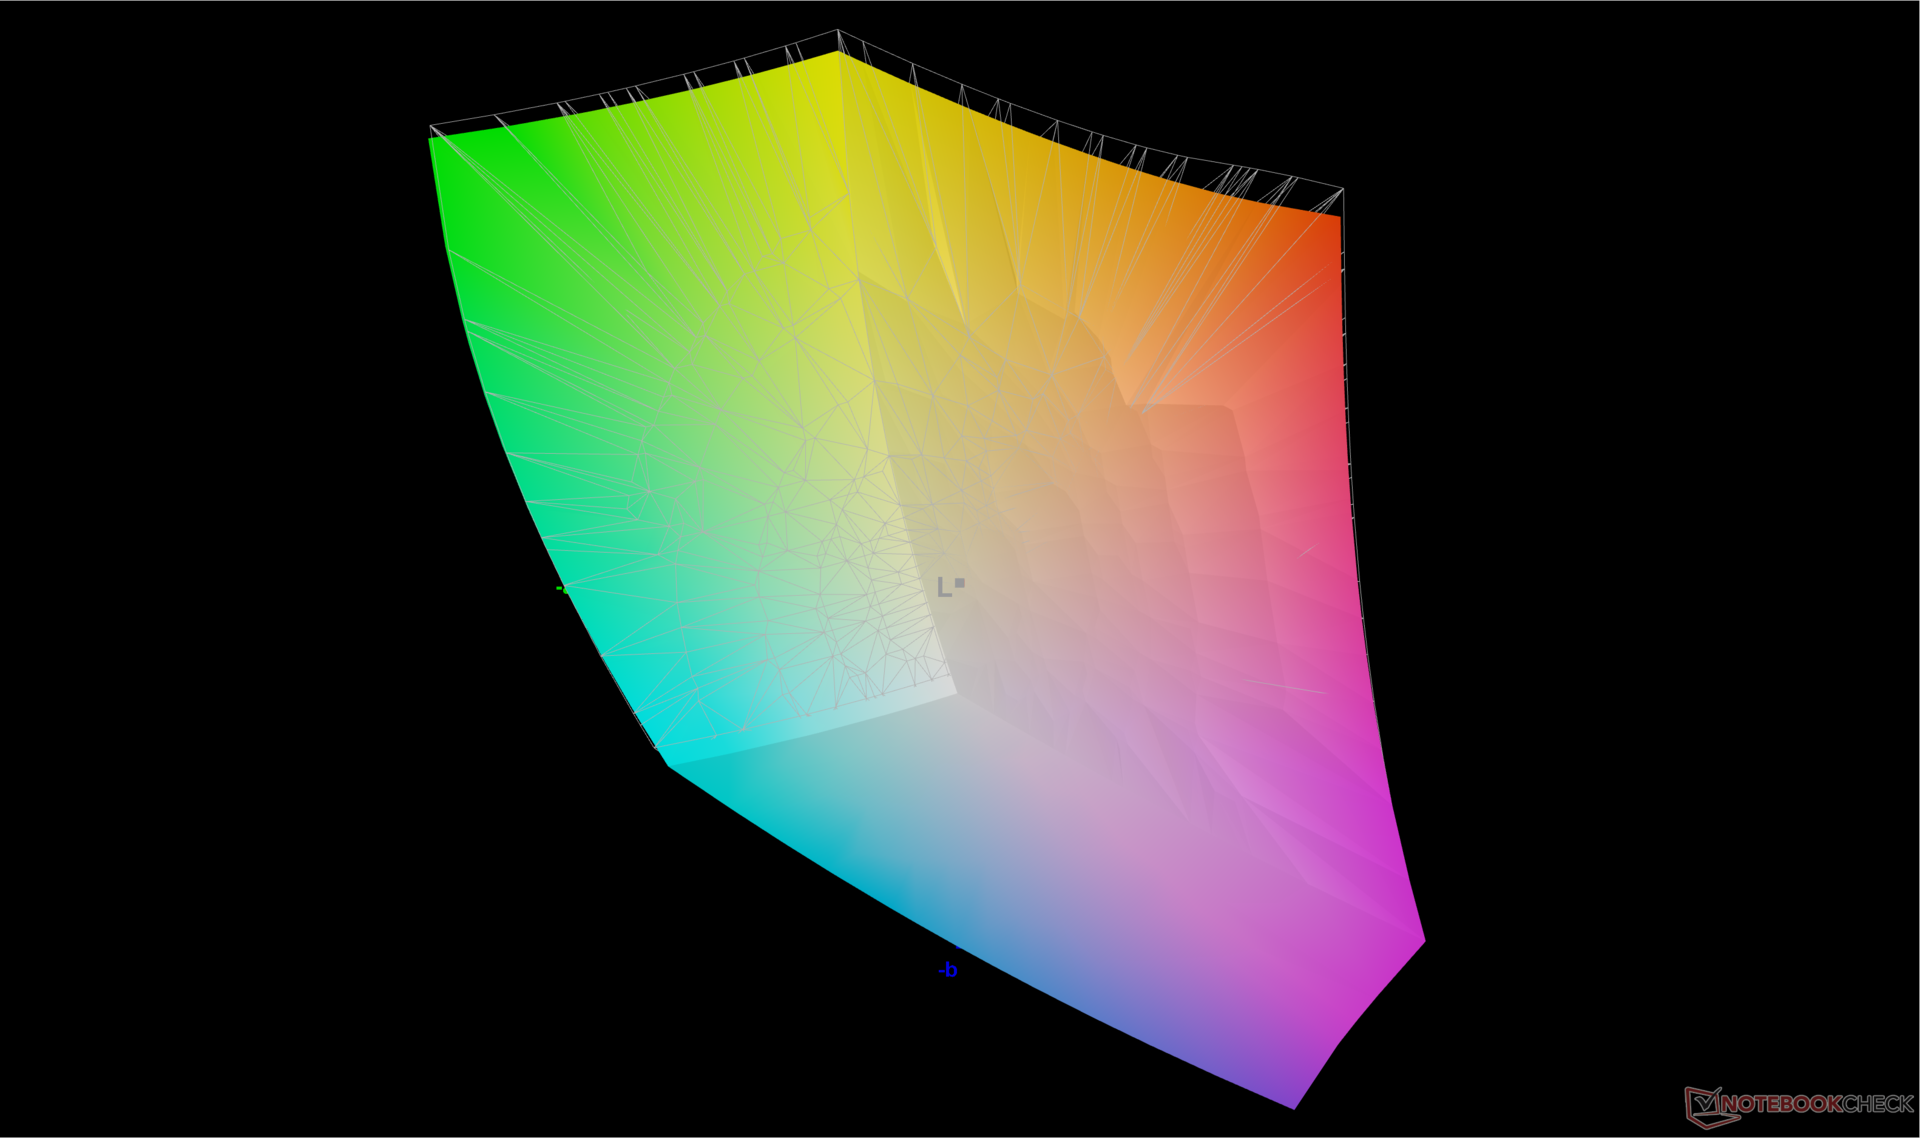
Par rapport aux écrans IPS et OLED traditionnels, le mini-LED offre des niveaux de noir supérieurs aux premiers et des niveaux de luminosité maximale encore plus élevés que les seconds pour une meilleure prise en charge du HDR. Dans ce cas, Lenovo annonce une luminosité maximale de 1200 nits pour la prise en charge du HDR1000, ce qui est rare sur les écrans d'ordinateurs portables. Nous sommes en mesure de confirmer une luminosité maximale réelle de 1025 nits lorsque le mode HDR est activé ou de 675 nits lors de l'affichage de contenu SDR. La plupart des écrans IPS et OLED des ordinateurs portables de jeu ont une luminosité comprise entre 300 et 500 nits. Il est donc préférable d'afficher le contenu en mode HDR dans la mesure du possible pour mieux exploiter les avantages du mini-LED.
Outre les niveaux de luminosité très élevés, l'écran présente également les caractéristiques suivantes : G-Sync, couleurs DCI-P3 complètes, taux de rafraîchissement de 165 Hz et temps de réponse rapides, afin de convenir aussi bien à la création de contenu qu'aux jeux.
| |||||||||||||||||||||||||
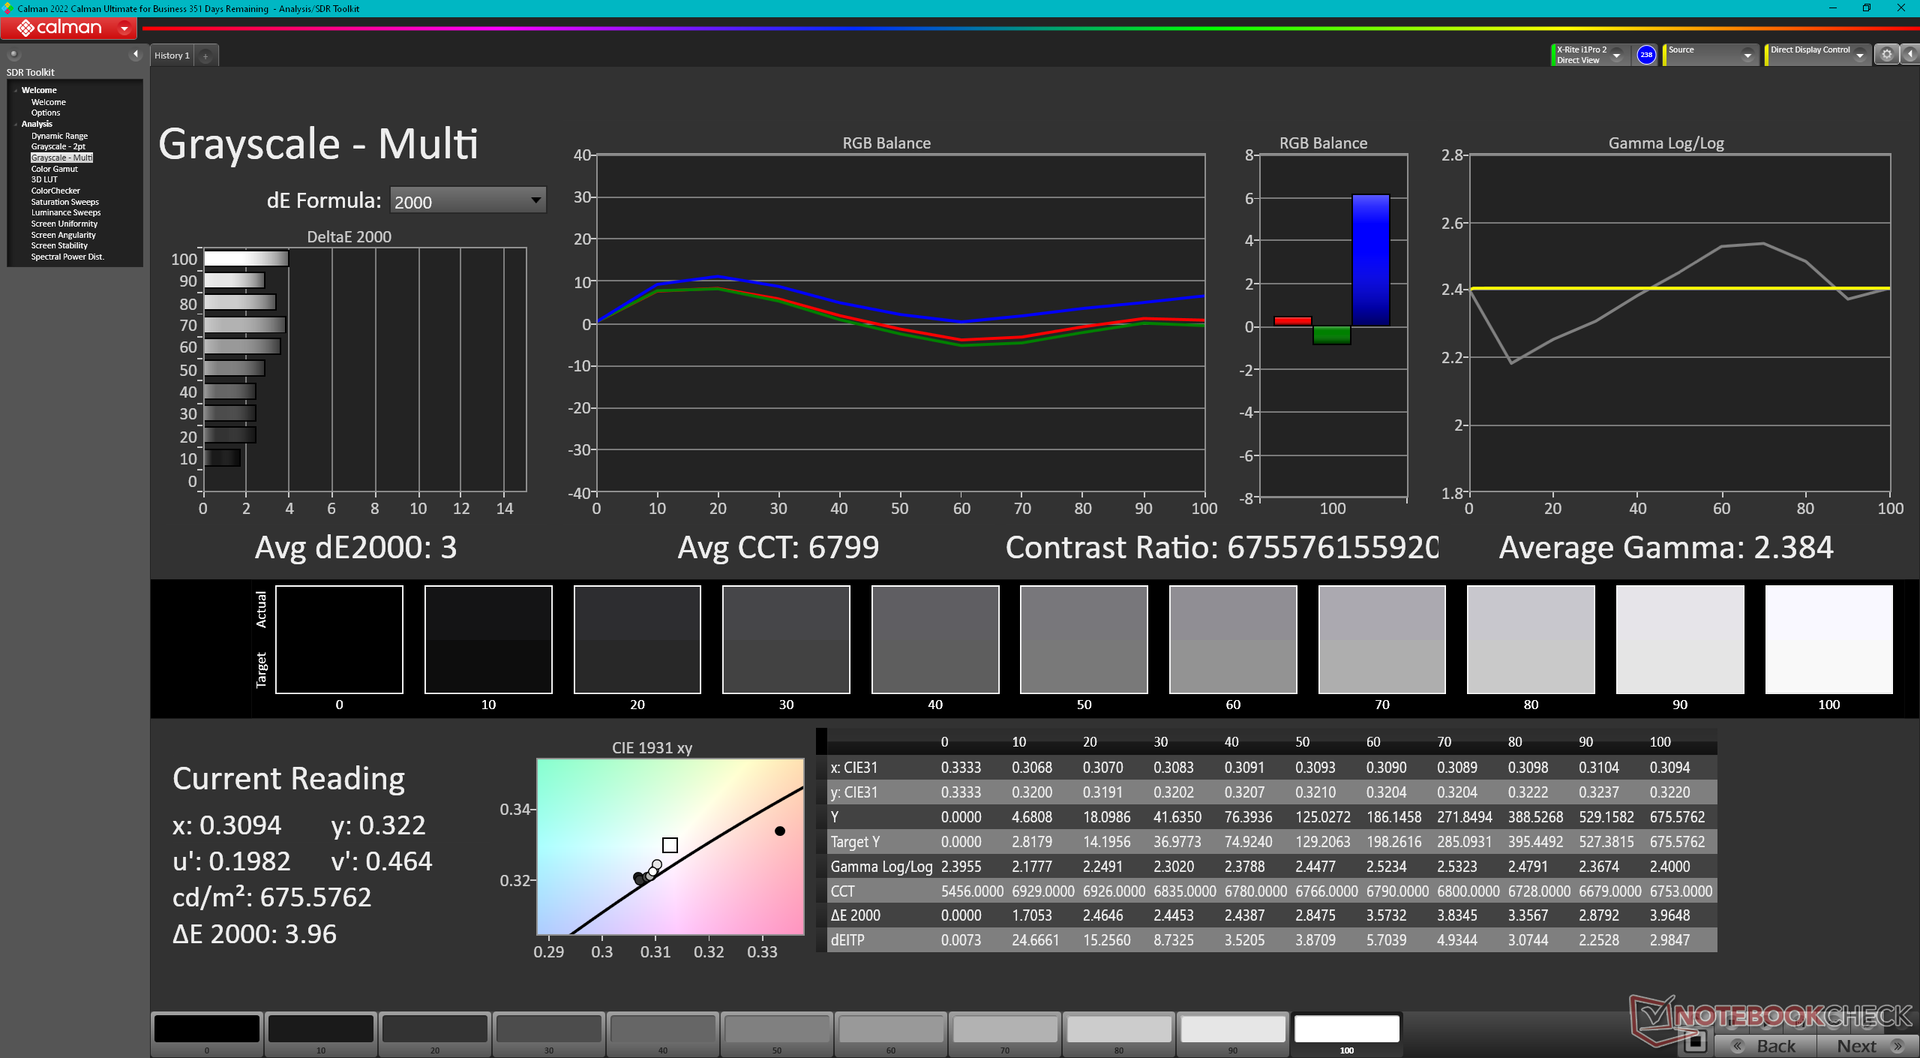
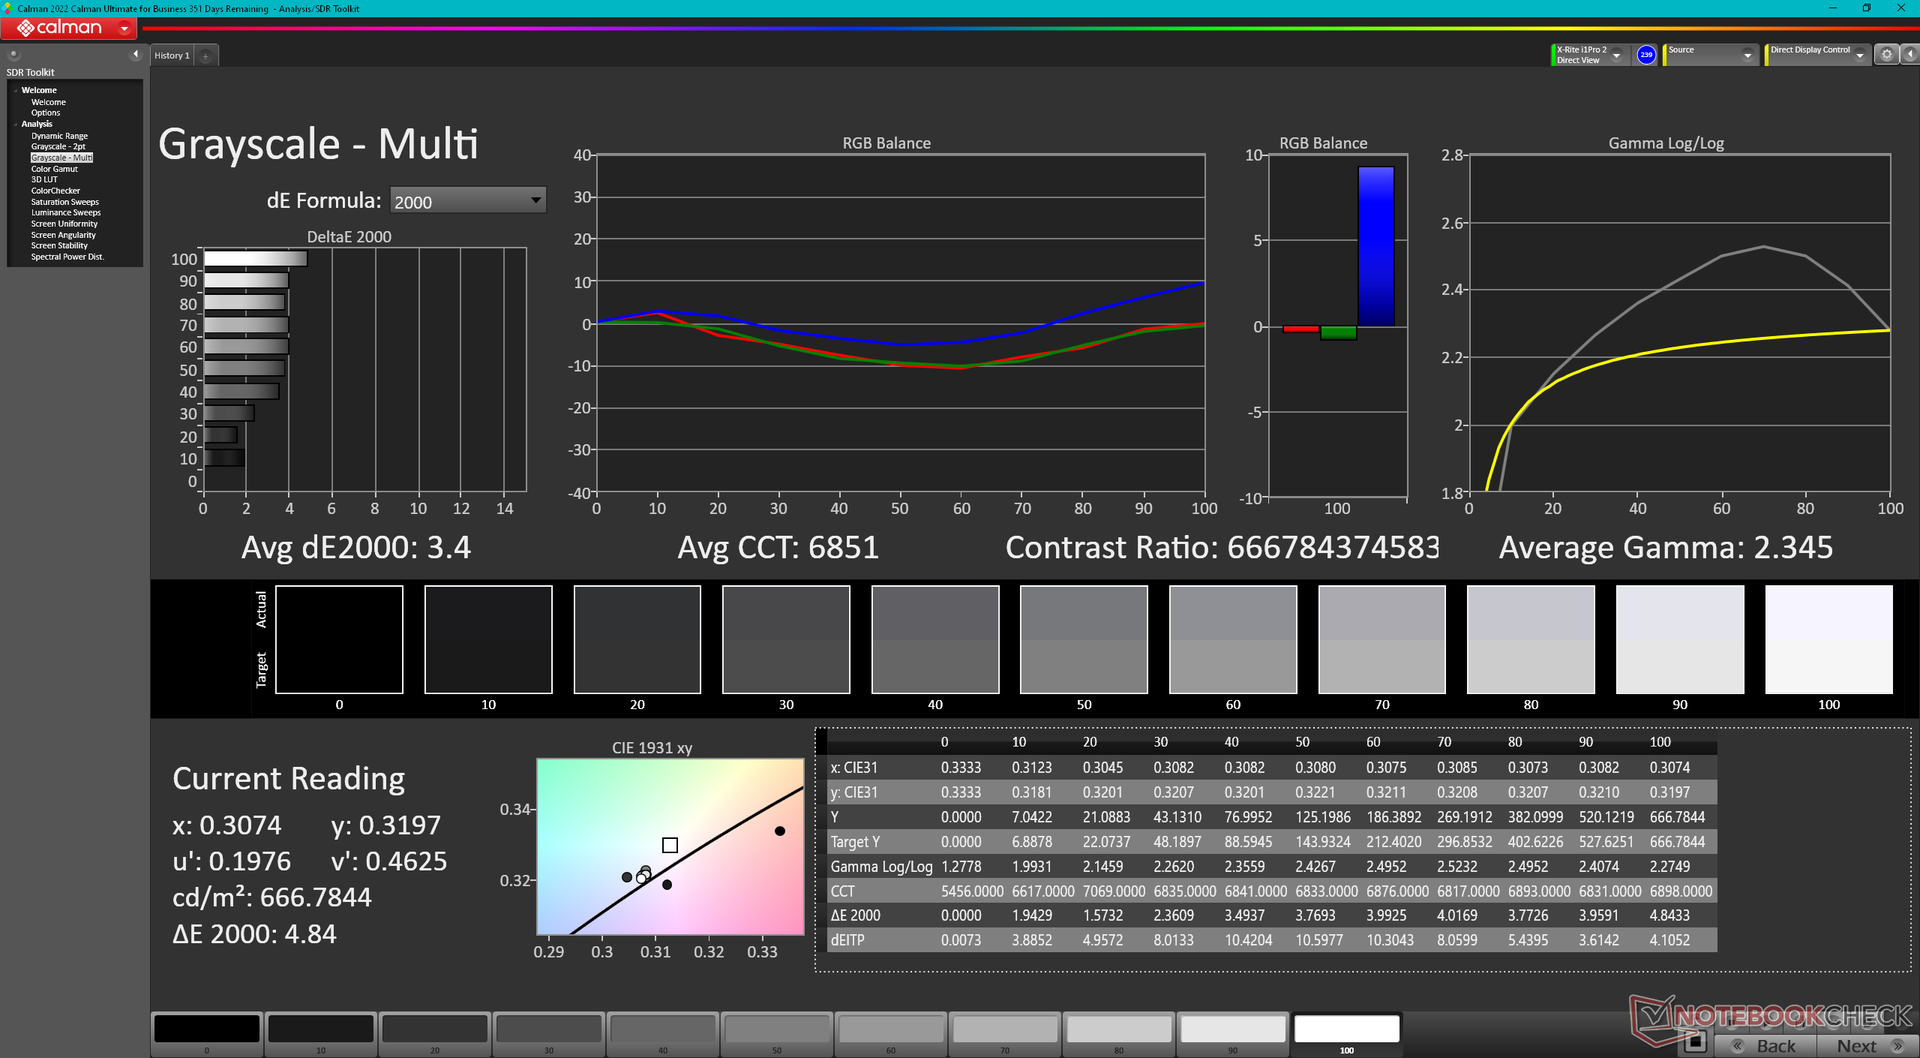
Homogénéité de la luminosité: 96 %
Valeur mesurée au centre, sur batterie: 674.9 cd/m²
Contraste: 16873:1 (Valeurs des noirs: 0.04 cd/m²)
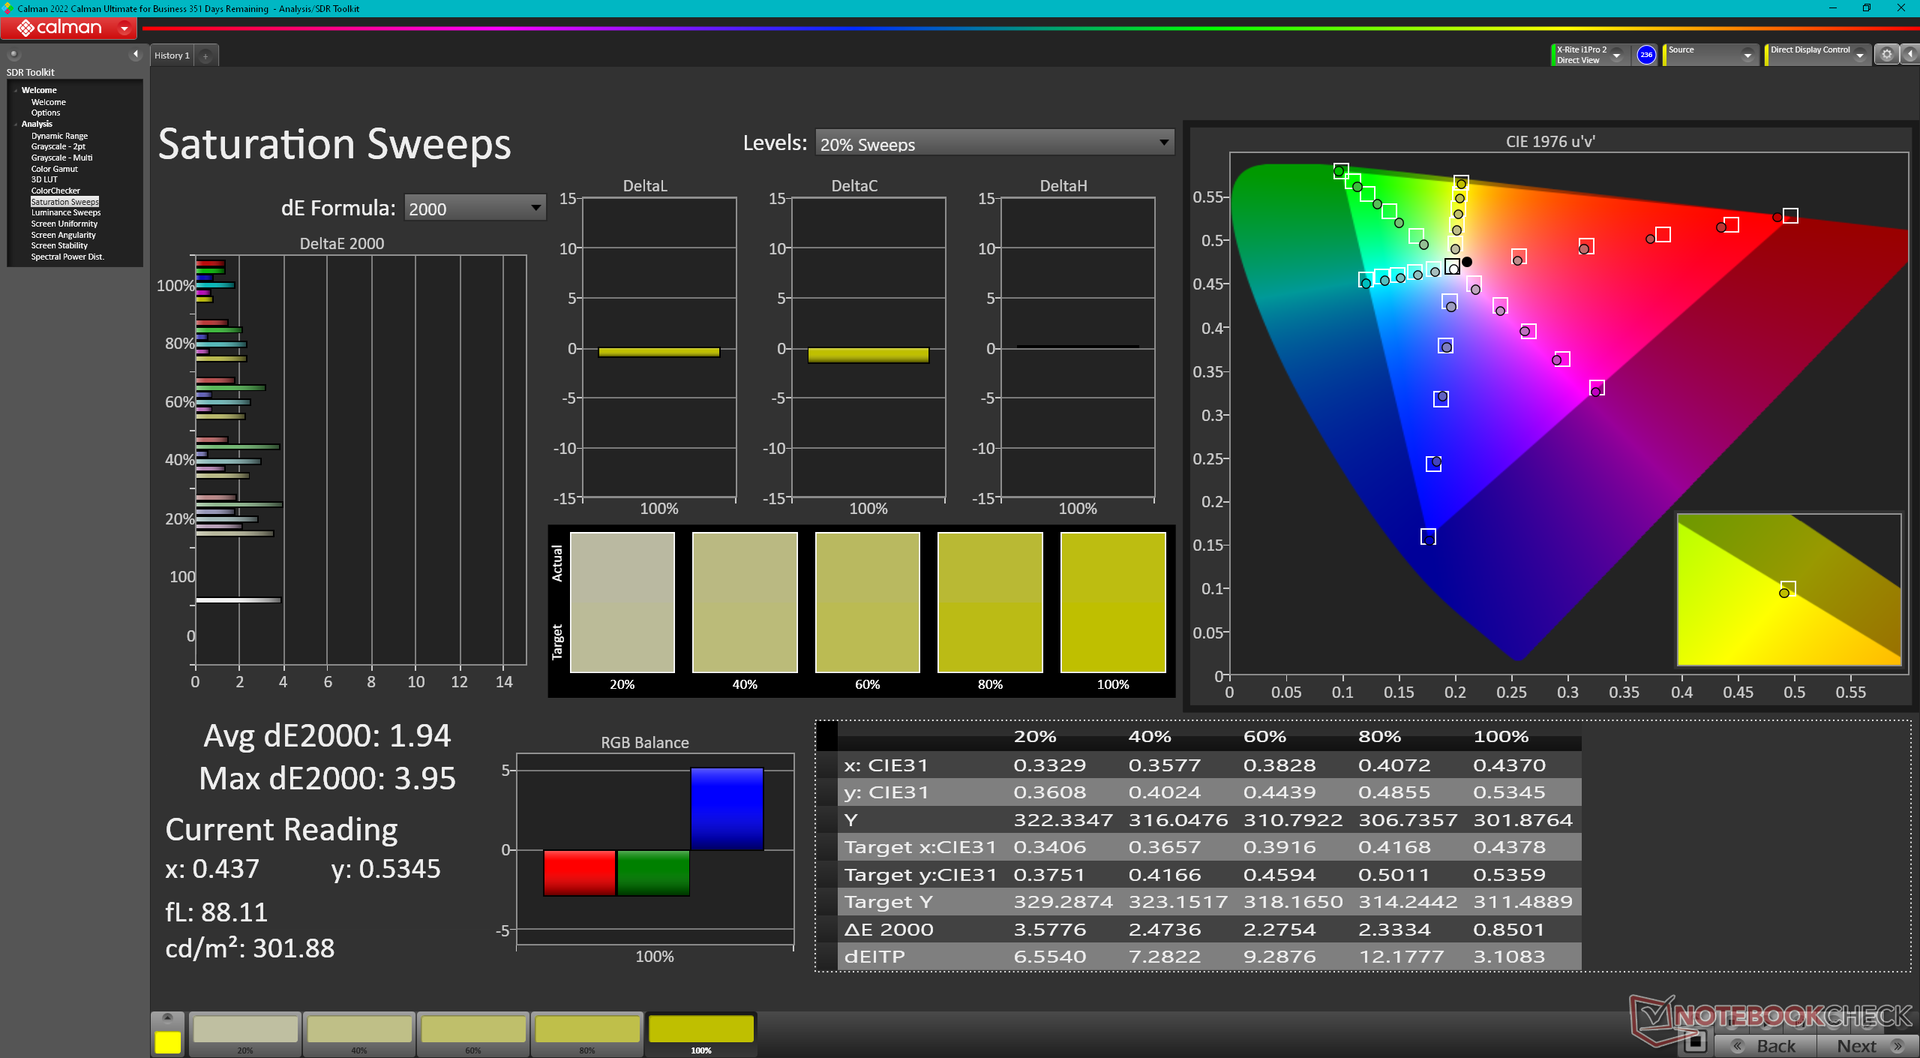
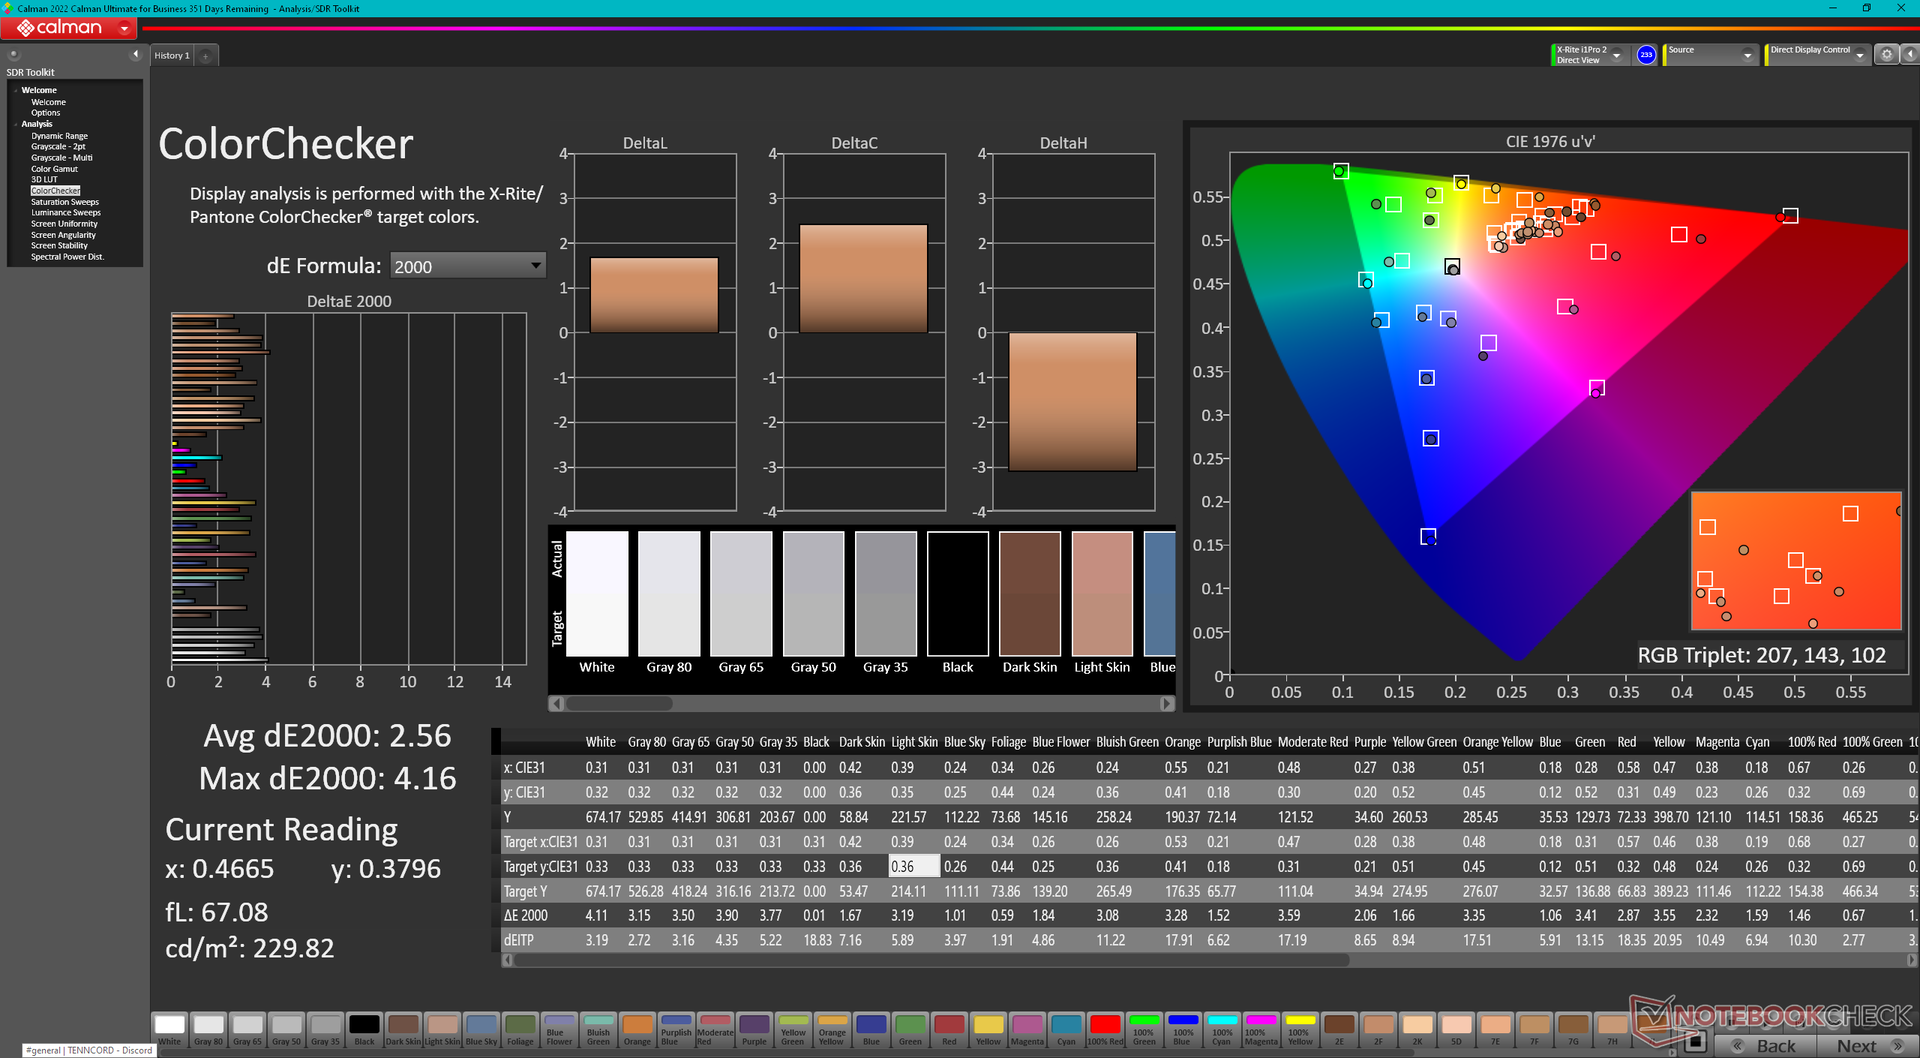
ΔE ColorChecker Calman: 2.56 | ∀{0.5-29.43 Ø4.72}
calibrated: 2.47
ΔE Greyscale Calman: 3 | ∀{0.09-98 Ø4.97}
87% AdobeRGB 1998 (Argyll 3D)
99.9% sRGB (Argyll 3D)
97.2% Display P3 (Argyll 3D)
Gamma: 2.38
CCT: 6799 K
| Lenovo Legion 9 16IRX8 CSOT T3 MNG007ZA2-2, Mini-LED, 3200x2000, 16" | Lenovo Legion Slim 5 16APH8 BOE NJ NE160QDM-NYC, IPS, 2560x1600, 16" | Razer Blade 16 Early 2023 RTX 4090 AUO B160ZAN01.U, mini-LED, 3840x2400, 16" | Asus ROG Strix G16 G614JZ TL160ADMP03-0, IPS, 2560x1600, 16" | HP Omen Transcend 16 AUOA3A6, Mini-LED, 2560x1600, 16" | Alienware x16 R1 BOE NE16NZ4, IPS, 2560x1600, 16" | |
|---|---|---|---|---|---|---|
| Display | -16% | 2% | -1% | 1% | 1% | |
| Display P3 Coverage (%) | 97.2 | 69.3 -29% | 99.9 3% | 97 0% | 99.2 2% | 99.2 2% |
| sRGB Coverage (%) | 99.9 | 100 0% | 100 0% | 99.9 0% | 100 0% | 100 0% |
| AdobeRGB 1998 Coverage (%) | 87 | 70 -20% | 90.9 4% | 84.9 -2% | 87.6 1% | 88.6 2% |
| Response Times | 27% | -206% | 53% | -121% | 37% | |
| Response Time Grey 50% / Grey 80% * (ms) | 13.3 ? | 10.7 ? 20% | 10.2 ? 23% | 5.1 ? 62% | 26.4 ? -98% | 5.1 ? 62% |
| Response Time Black / White * (ms) | 11.6 ? | 7.8 ? 33% | 62.04 ? -435% | 6.6 ? 43% | 28.2 ? -143% | 10.3 ? 11% |
| PWM Frequency (Hz) | 4742 | 2420 ? | 3506 ? | |||
| Screen | -109% | 62% | -111% | -26% | -73% | |
| Brightness middle (cd/m²) | 674.9 | 371.6 -45% | 730 8% | 470 -30% | 791.1 17% | 302.2 -55% |
| Brightness (cd/m²) | 682 | 343 -50% | 729 7% | 459 -33% | 800 17% | 285 -58% |
| Brightness Distribution (%) | 96 | 84 -12% | 94 -2% | 93 -3% | 95 -1% | 89 -7% |
| Black Level * (cd/m²) | 0.04 | 0.44 -1000% | 0.0045 89% | 0.42 -950% | 0.04 -0% | 0.26 -550% |
| Contrast (:1) | 16873 | 845 -95% | 162222 861% | 1119 -93% | 19778 17% | 1162 -93% |
| Colorchecker dE 2000 * | 2.56 | 1.52 41% | 5.65 -121% | 1.86 27% | 4.37 -71% | 1.63 36% |
| Colorchecker dE 2000 max. * | 4.16 | 2.68 36% | 10.11 -143% | 3.87 7% | 10.39 -150% | 4.13 1% |
| Colorchecker dE 2000 calibrated * | 2.47 | 0.33 87% | 1.85 25% | 0.93 62% | 1.04 58% | 1.17 53% |
| Greyscale dE 2000 * | 3 | 1.2 60% | 8.1 -170% | 2.7 10% | 6.5 -117% | 2.5 17% |
| Gamma | 2.38 92% | 2.1 105% | 1.98 111% | 2.246 98% | 2.28 96% | 2.23 99% |
| CCT | 6799 96% | 6503 100% | 5874 111% | 6711 97% | 6000 108% | 6590 99% |
| Moyenne finale (programmes/paramètres) | -33% /
-70% | -47% /
11% | -20% /
-64% | -49% /
-33% | -12% /
-41% |
* ... Moindre est la valeur, meilleures sont les performances
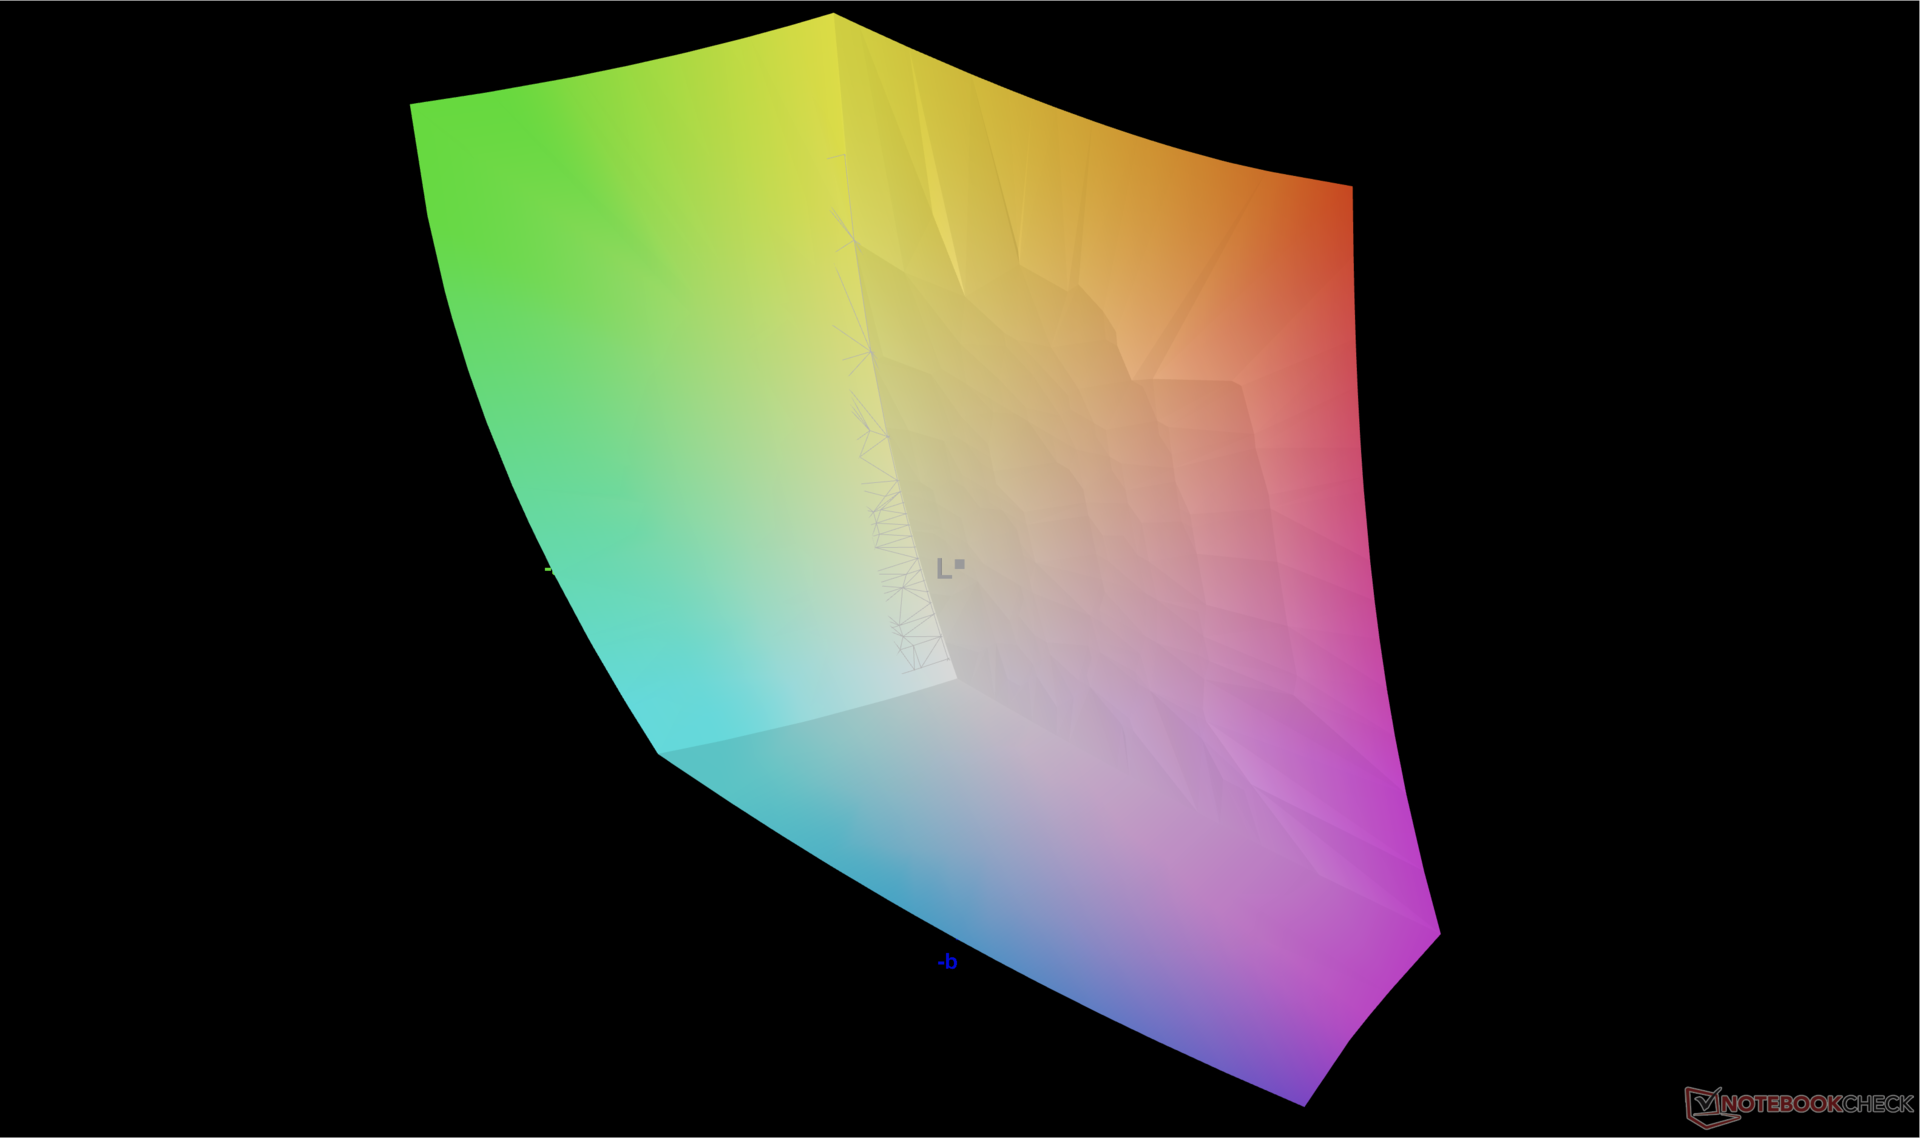
L'écran est bien calibré par rapport à la norme P3, avec des valeurs DeltaE moyennes en niveaux de gris et en couleurs de seulement 3 et 2,56, respectivement.
Temps de réponse de l'écran
| ↔ Temps de réponse noir à blanc | ||
|---|---|---|
| 11.6 ms ... hausse ↗ et chute ↘ combinées | ↗ 5.1 ms hausse |  |
| ↘ 6.5 ms chute | ||
| L'écran montre de bons temps de réponse, mais insuffisant pour du jeu compétitif. En comparaison, tous les appareils testés affichent entre 0.1 (minimum) et 240 (maximum) ms. » 31 % des appareils testés affichent de meilleures performances. Cela signifie que les latences relevées sont meilleures que la moyenne (19.8 ms) de tous les appareils testés. | ||
| ↔ Temps de réponse gris 50% à gris 80% | ||
| 13.3 ms ... hausse ↗ et chute ↘ combinées | ↗ 5.7 ms hausse | 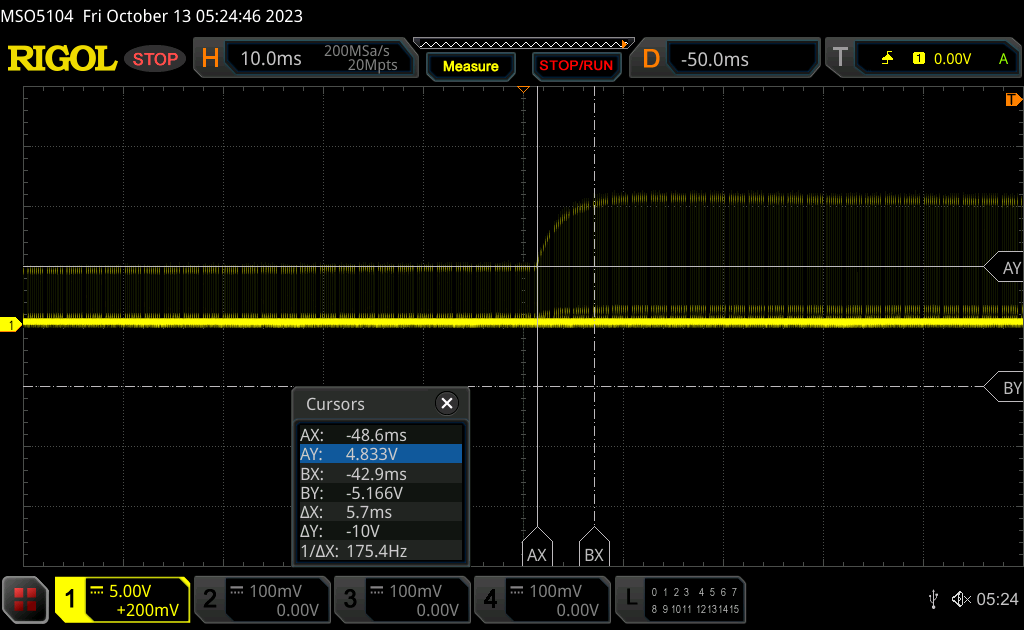 |
| ↘ 7.6 ms chute | ||
| L'écran montre de bons temps de réponse, mais insuffisant pour du jeu compétitif. En comparaison, tous les appareils testés affichent entre 0.165 (minimum) et 636 (maximum) ms. » 27 % des appareils testés affichent de meilleures performances. Cela signifie que les latences relevées sont meilleures que la moyenne (31 ms) de tous les appareils testés. | ||
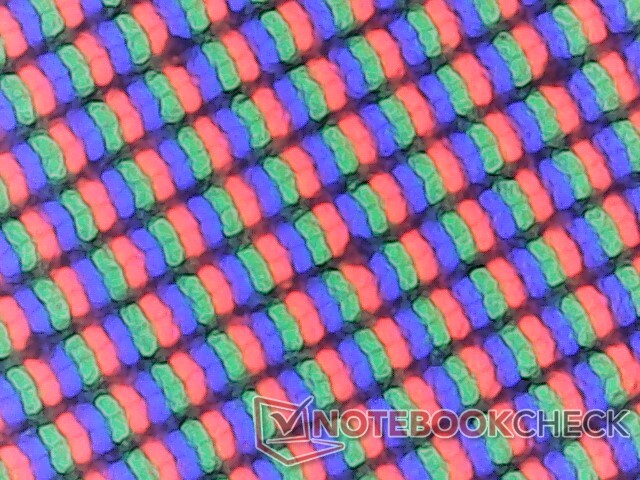
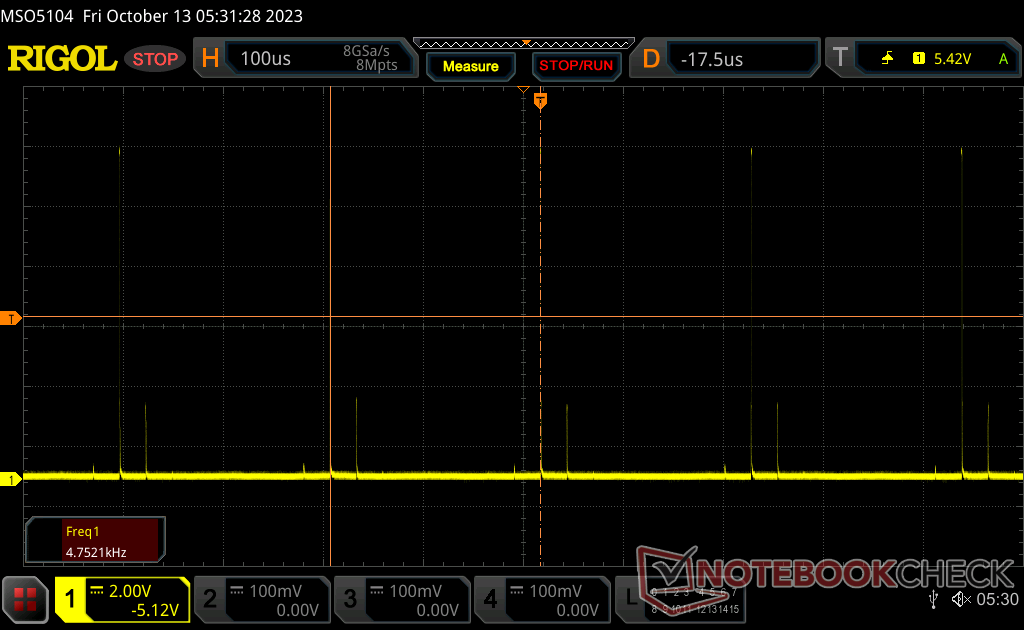
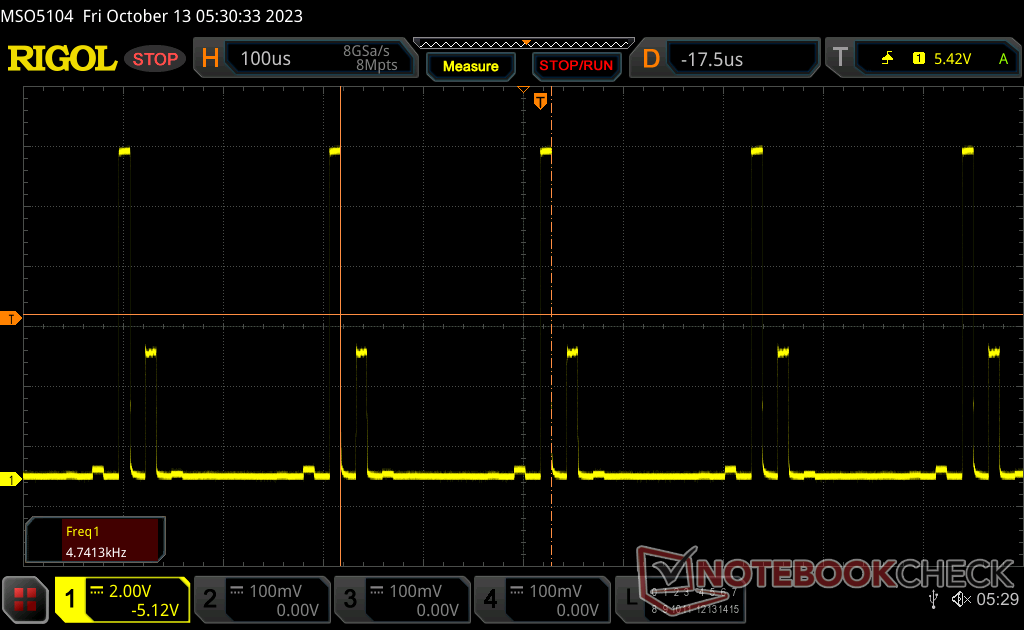
Scintillement / MLI (Modulation de largeur d'impulsion)
| Scintillement / MLI (Modulation de largeur d'impulsion) décelé | 4742 Hz | 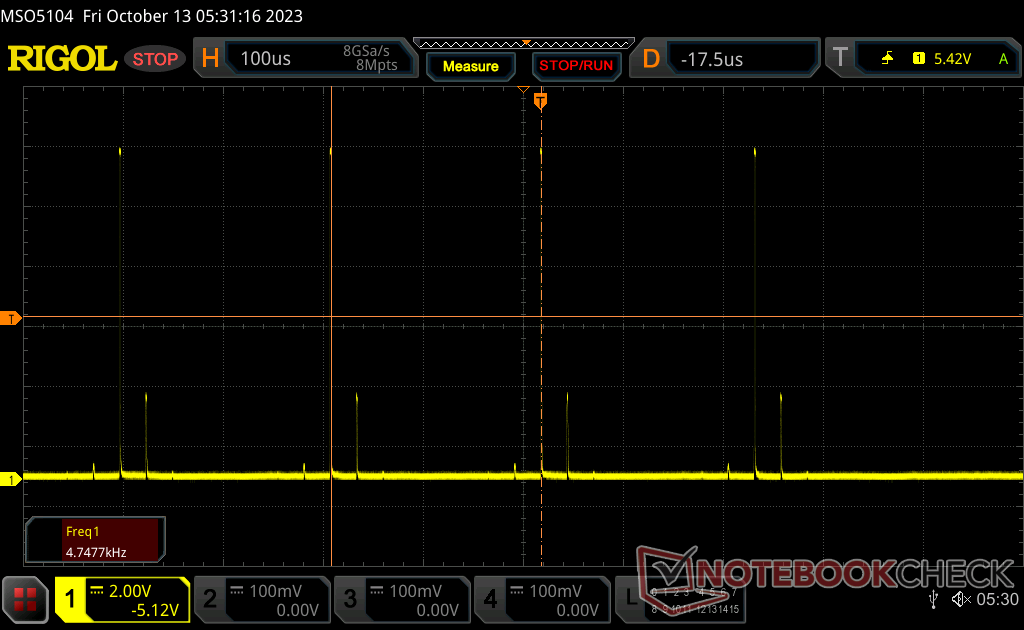 | |
Le rétroéclairage de l'écran scintille à la fréquence de 4742 Hz (certainement du fait de l'utilisation d'une MDI - Modulation de largeur d'impulsion) . La fréquence de rafraîchissement de 4742 Hz est élevée, la grande majorité des utilisateurs ne devrait pas percevoir de scintillements et être sujette à une fatigue oculaire accrue. En comparaison, 52 % des appareils testés n'emploient pas MDI pour assombrir leur écran. Nous avons relevé une moyenne à 7778 (minimum : 5 - maximum : 343500) Hz dans le cas où une MDI était active. | |||
Le scintillement est présent à tous les niveaux de luminosité à une fréquence constante de 4752 Hz.


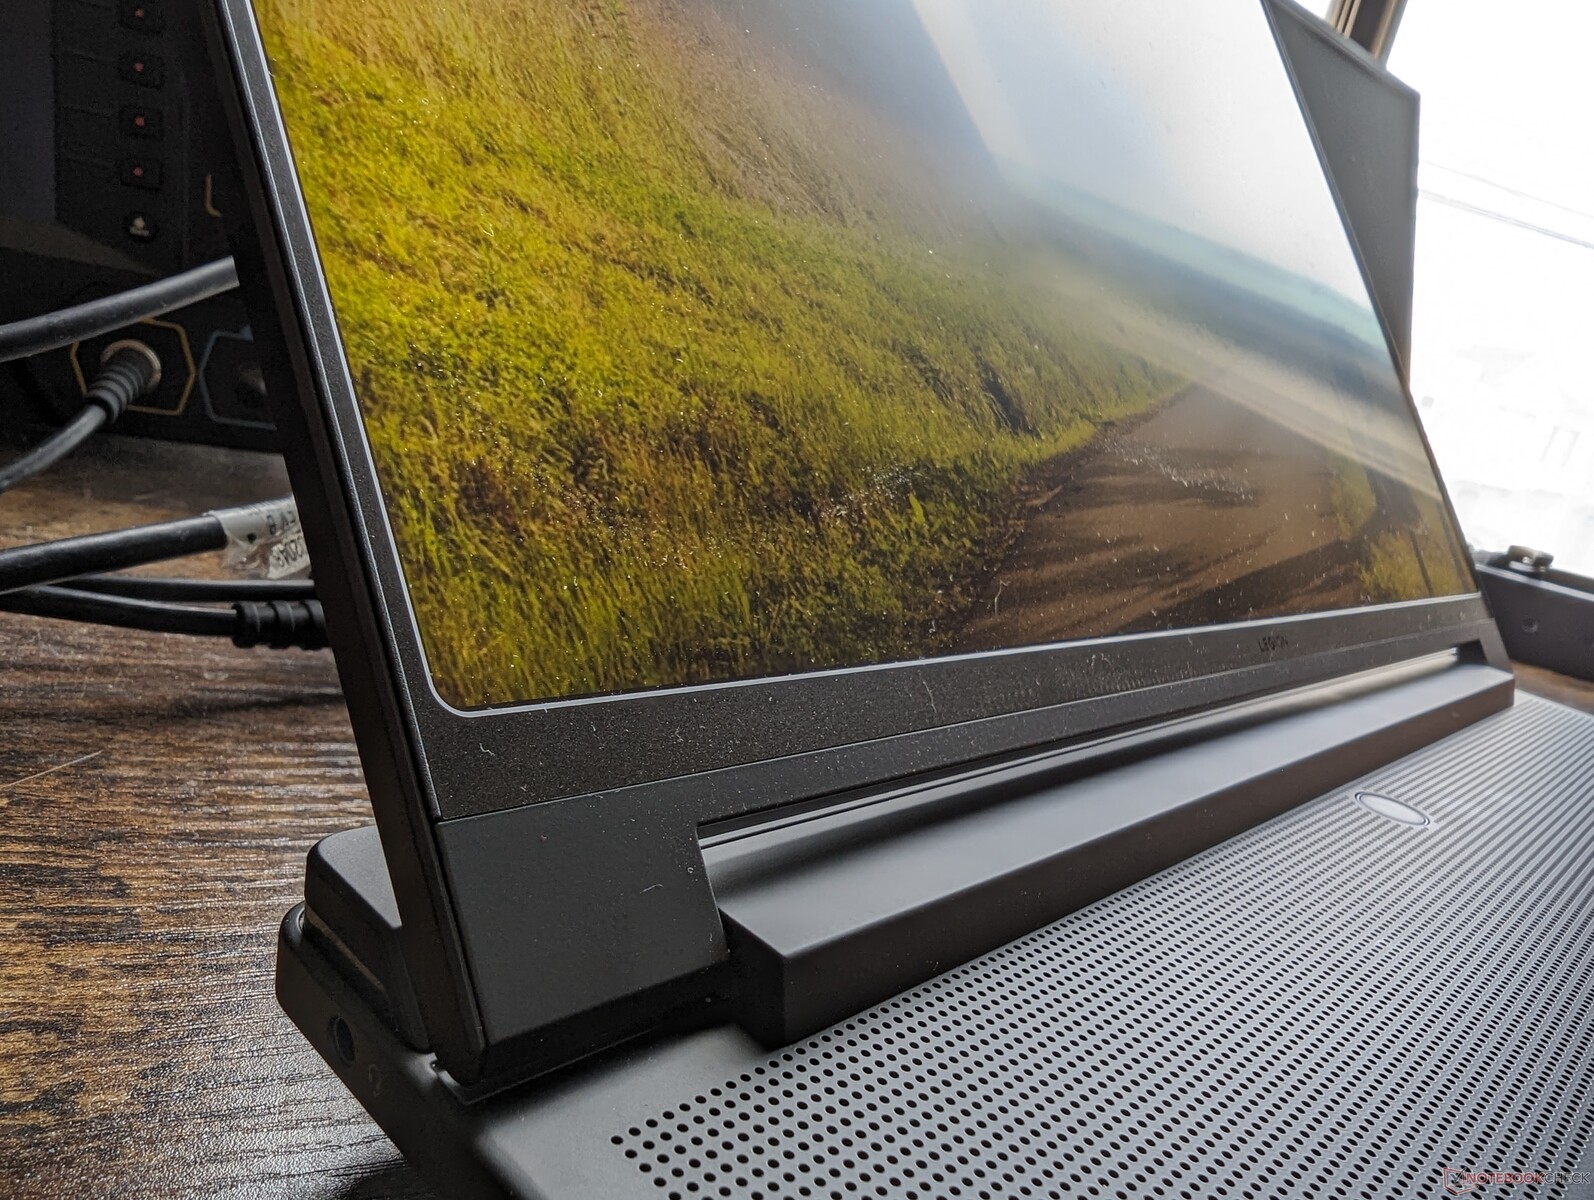
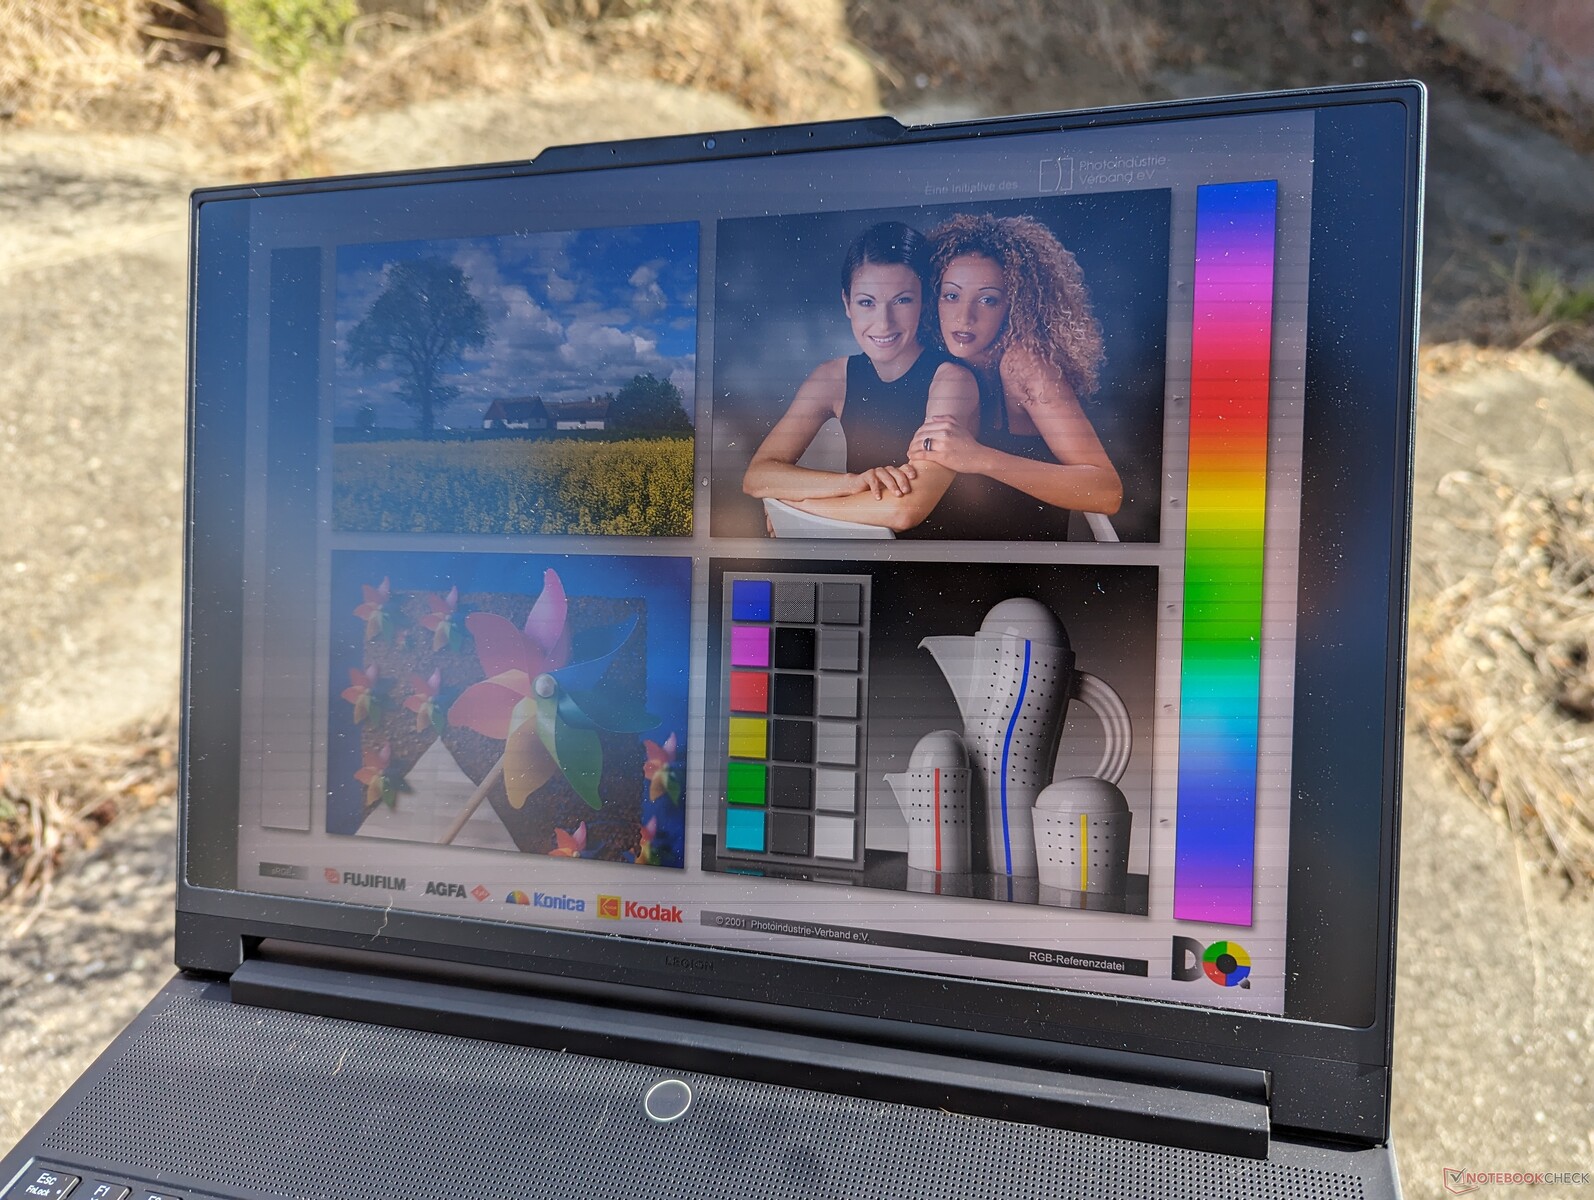
La visibilité en extérieur est excellente pour un ordinateur portable de jeu grâce à la luminosité maximale de la mini-LED mentionnée plus haut. Néanmoins, le poids élevé et la faible autonomie de la batterie limitent encore l'utilisation de cet ordinateur portable à des scénarios d'intérieur.
Performance - Aucun Core i7 n'est autorisé
Conditions d'essai
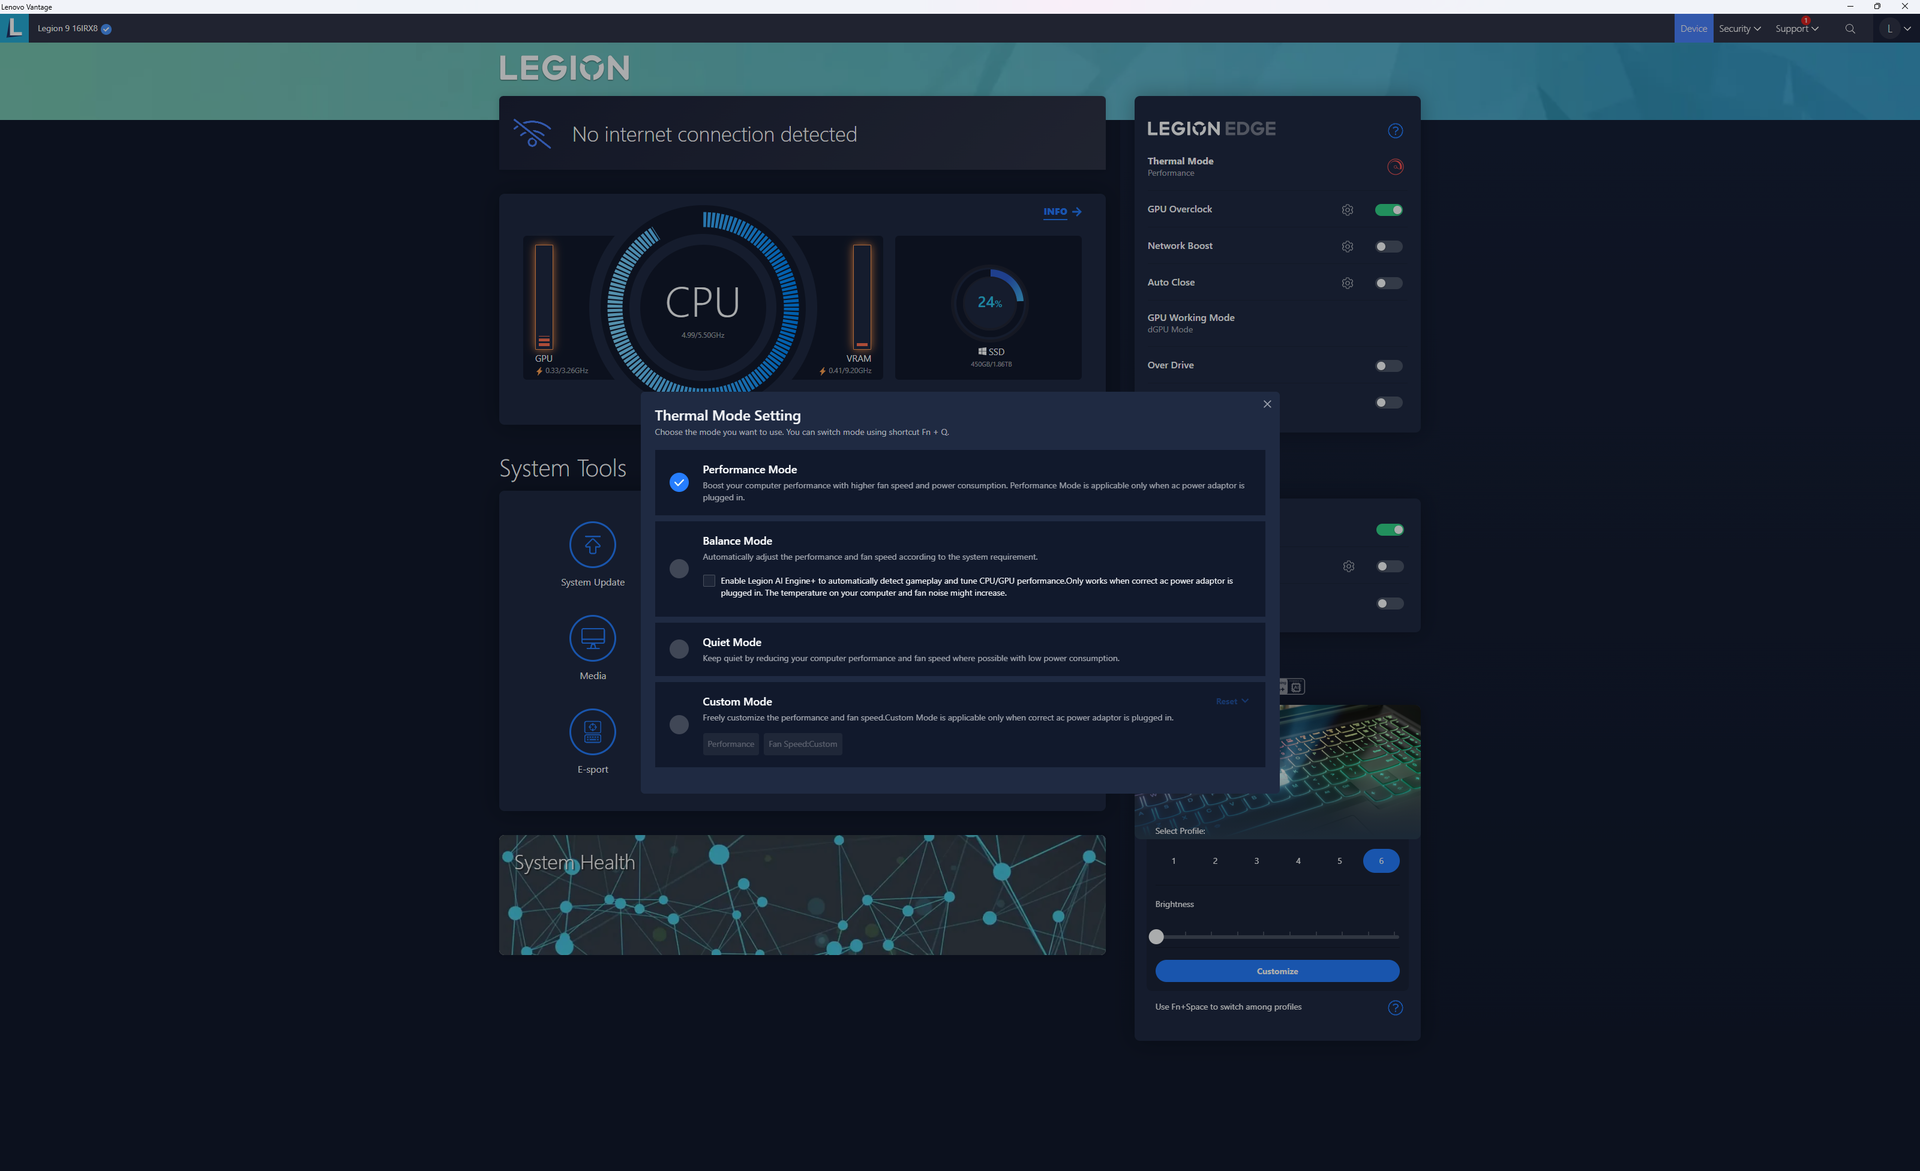
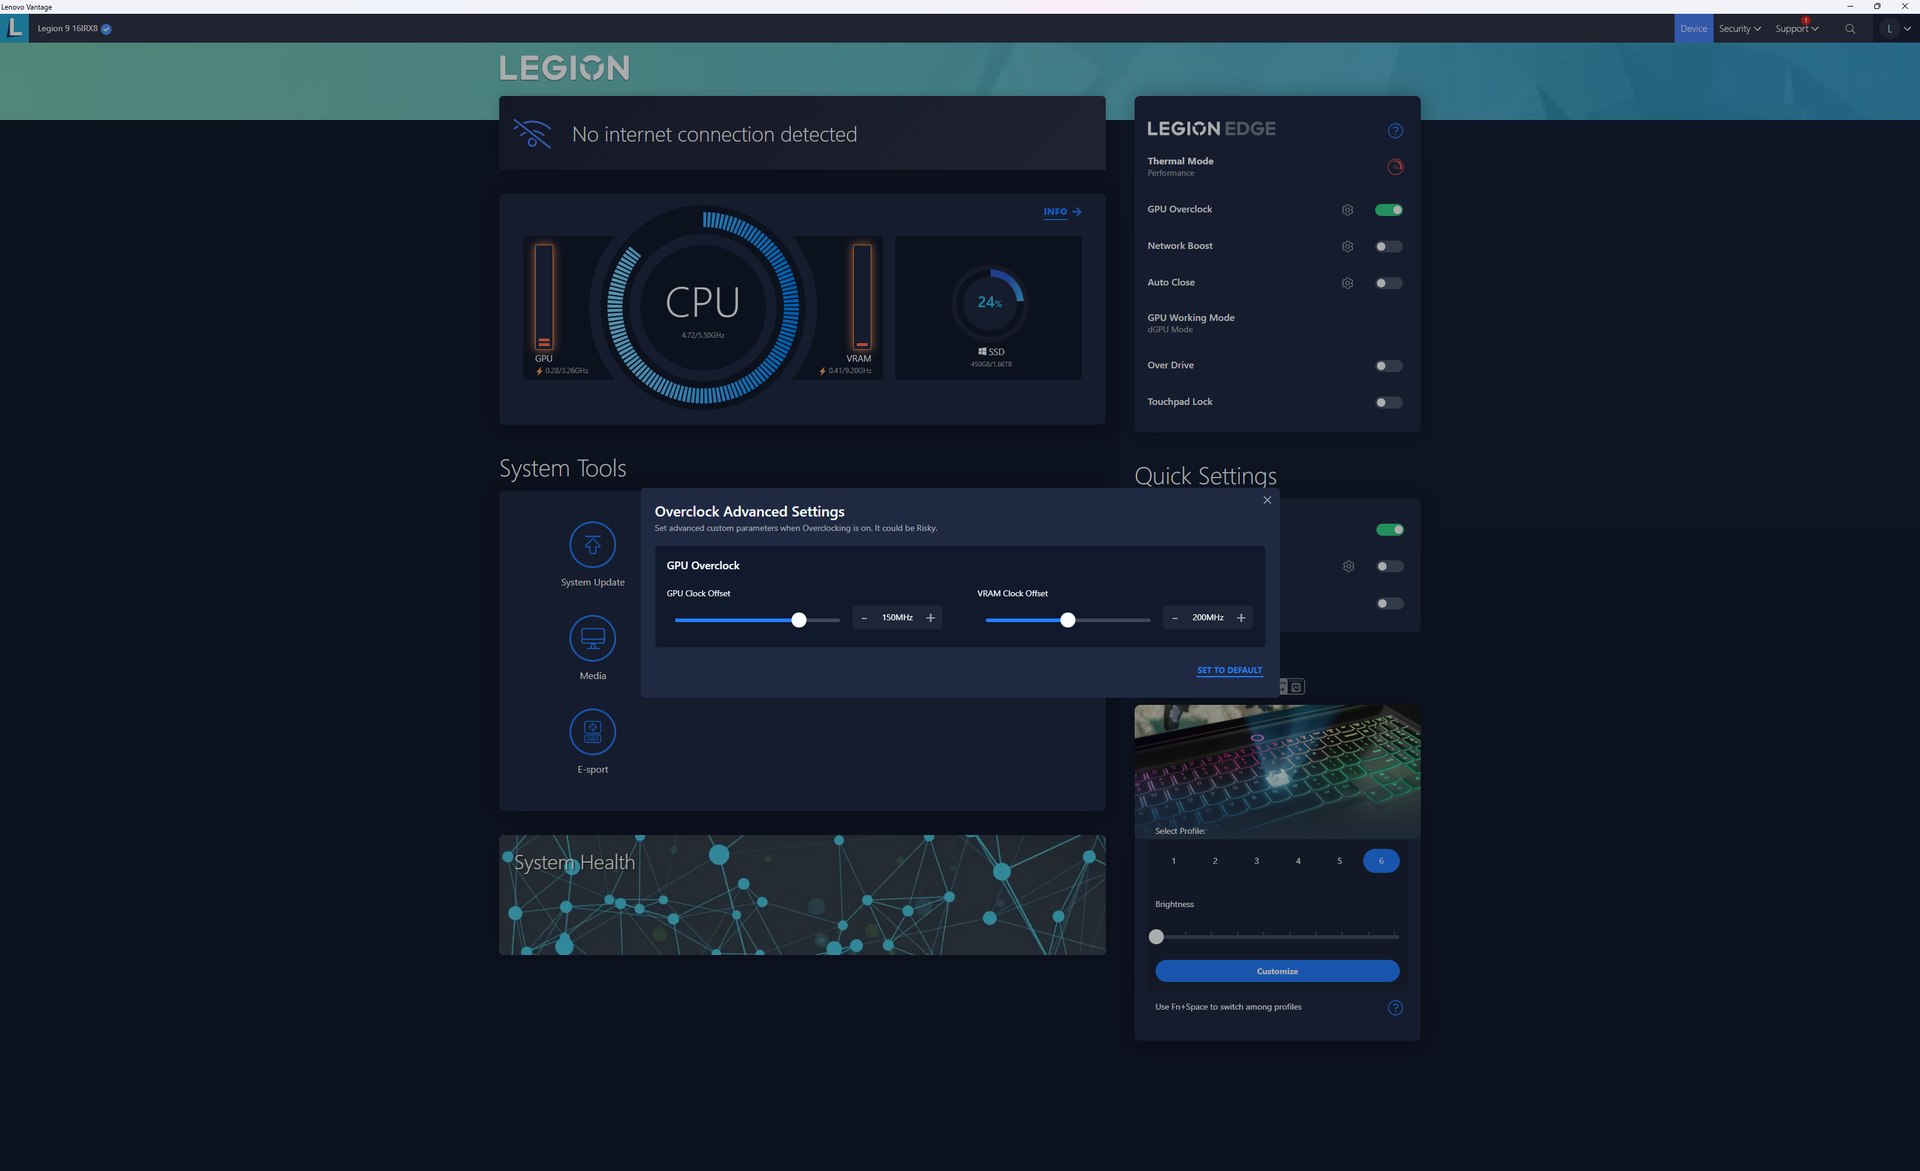
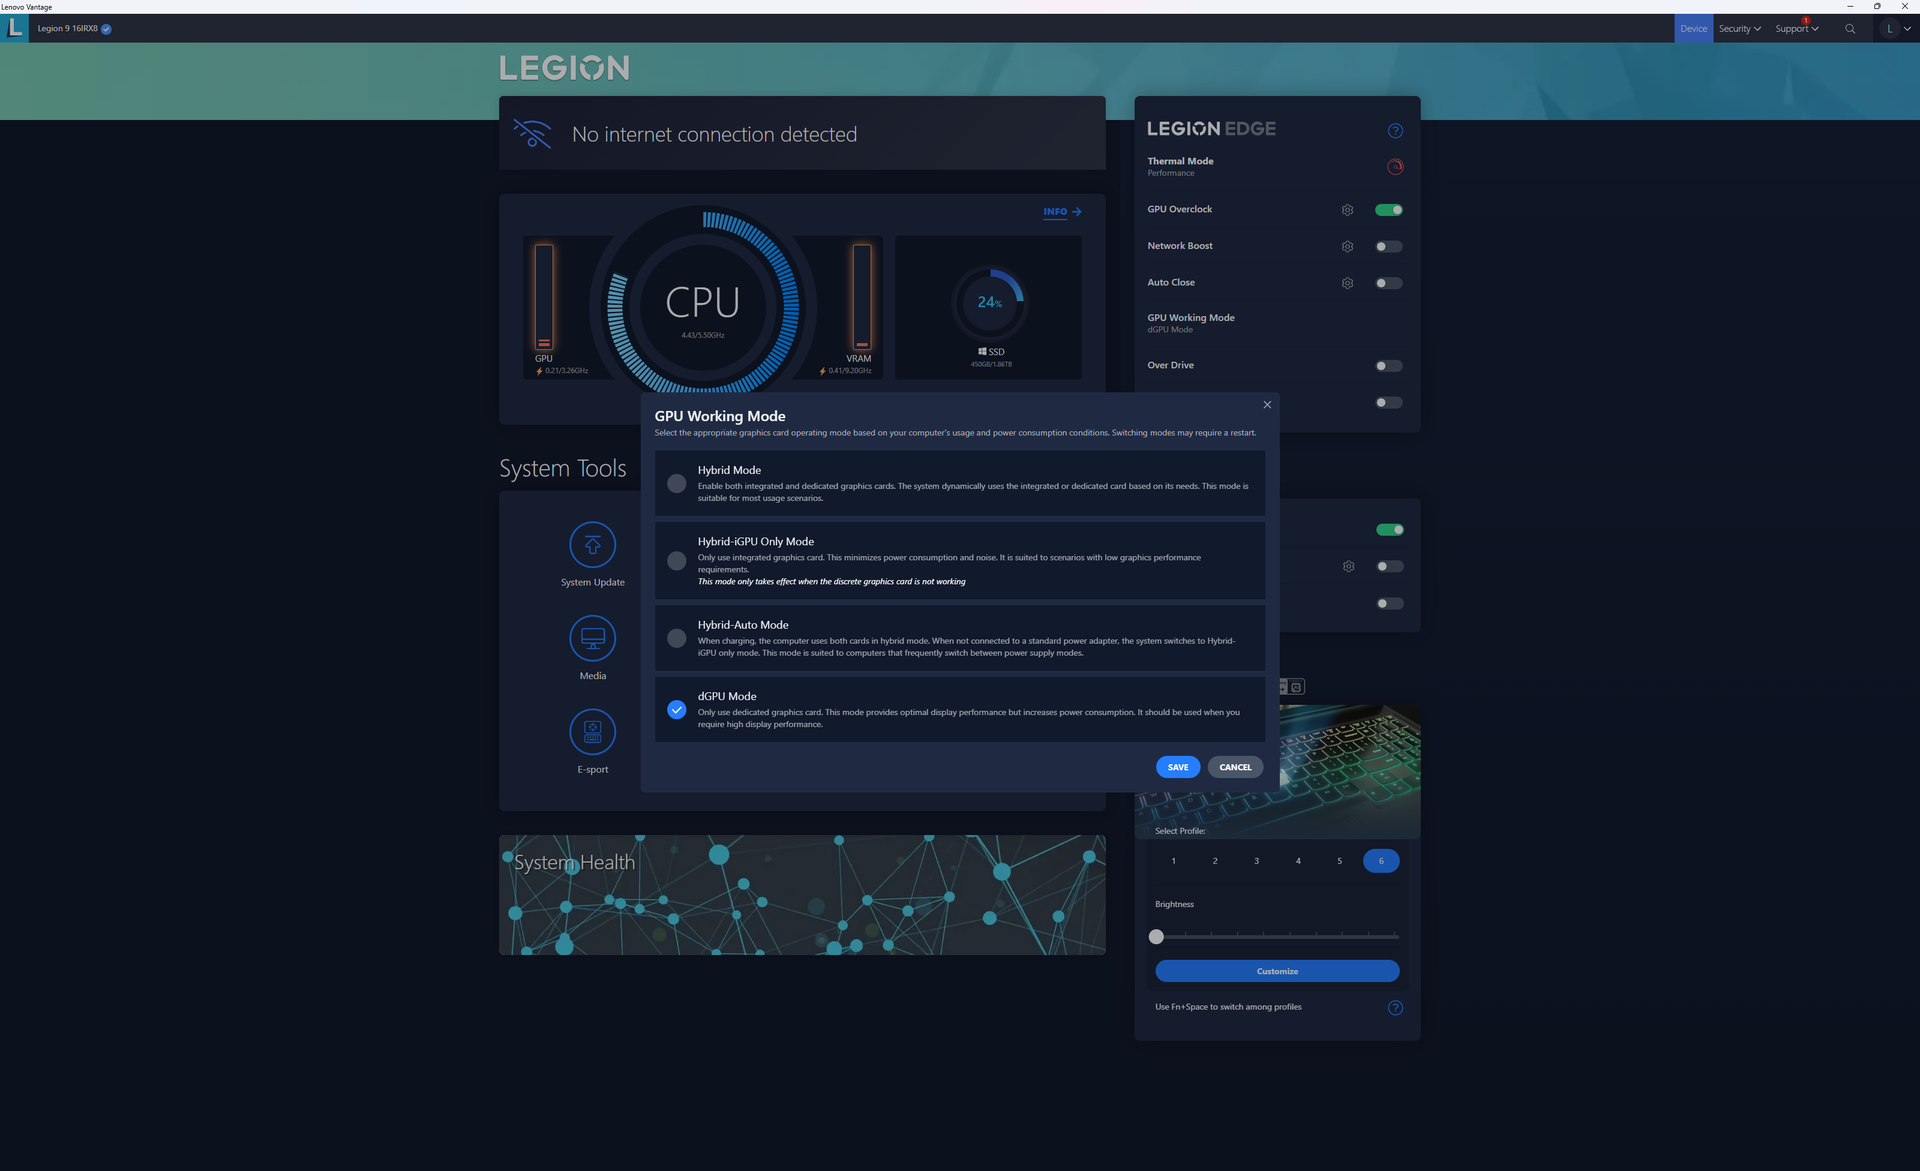
Nous avons réglé notre appareil en mode Performance et en mode dGPU via Lenovo Vantage avant d'effectuer les tests ci-dessous. L'overclockage du GPU est également activé par défaut à +150 MHz pour le GPU et +200 MHz pour la VRAM, comme sur d'autres modèles haut de gamme Legion. Il est recommandé aux propriétaires de se familiariser avec Vantage pour ajuster les profils d'alimentation et d'autres paramètres auxiliaires.
Advanced Optimus, MUX et G-Sync sont tous pris en charge, contrairement aux récents modèles Legion Slim 5 14.
Processeur
Les performances du processeur sont excellentes, avec des résultats de 80 à 90 % plus rapides dans les charges de travail multithreads que le Core i7-13700H. Le Core i9-13980HX est l'un des processeurs mobiles les plus rapides d'Intel à l'heure actuelle, mais il reste en deçà du concurrentRyzen 9 7945HX dans la plupart des benchmarks multithread d'environ 10 %.
Les performances ne sont que de 5 % supérieures à celles du Core i9-13950HX d'après notre expérience avec le Razer Blade 16 2023. Malheureusement, Lenovo ne propose pas d'autres options de CPU que le Core i9-13980HX pour ceux qui auraient voulu économiser quelques centaines d'euros.
Cinebench R15 Multi Loop
Cinebench R23: Multi Core | Single Core
Cinebench R20: CPU (Multi Core) | CPU (Single Core)
Cinebench R15: CPU Multi 64Bit | CPU Single 64Bit
Blender: v2.79 BMW27 CPU
7-Zip 18.03: 7z b 4 | 7z b 4 -mmt1
Geekbench 5.5: Multi-Core | Single-Core
HWBOT x265 Benchmark v2.2: 4k Preset
LibreOffice : 20 Documents To PDF
R Benchmark 2.5: Overall mean
* ... Moindre est la valeur, meilleures sont les performances
AIDA64: FP32 Ray-Trace | FPU Julia | CPU SHA3 | CPU Queen | FPU SinJulia | FPU Mandel | CPU AES | CPU ZLib | FP64 Ray-Trace | CPU PhotoWorxx
| Performance rating | |
| Lenovo Legion 9 16IRX8 | |
| Moyenne Intel Core i9-13980HX | |
| Asus ROG Strix G16 G614JZ | |
| HP Omen Transcend 16 | |
| Razer Blade 16 Early 2023 RTX 4090 | |
| Lenovo Legion Slim 5 16APH8 | |
| Alienware x16 R1 | |
| AIDA64 / FP32 Ray-Trace | |
| Lenovo Legion Slim 5 16APH8 | |
| Asus ROG Strix G16 G614JZ | |
| Lenovo Legion 9 16IRX8 | |
| Moyenne Intel Core i9-13980HX (21332 - 29553, n=9) | |
| HP Omen Transcend 16 | |
| Alienware x16 R1 | |
| Razer Blade 16 Early 2023 RTX 4090 | |
| AIDA64 / FPU Julia | |
| Lenovo Legion 9 16IRX8 | |
| Moyenne Intel Core i9-13980HX (108001 - 148168, n=9) | |
| Asus ROG Strix G16 G614JZ | |
| Lenovo Legion Slim 5 16APH8 | |
| HP Omen Transcend 16 | |
| Razer Blade 16 Early 2023 RTX 4090 | |
| Alienware x16 R1 | |
| AIDA64 / CPU SHA3 | |
| Lenovo Legion 9 16IRX8 | |
| Asus ROG Strix G16 G614JZ | |
| Moyenne Intel Core i9-13980HX (5264 - 7142, n=9) | |
| Razer Blade 16 Early 2023 RTX 4090 | |
| HP Omen Transcend 16 | |
| Lenovo Legion Slim 5 16APH8 | |
| Alienware x16 R1 | |
| AIDA64 / CPU Queen | |
| Asus ROG Strix G16 G614JZ | |
| Moyenne Intel Core i9-13980HX (126758 - 143409, n=9) | |
| Razer Blade 16 Early 2023 RTX 4090 | |
| Lenovo Legion 9 16IRX8 | |
| HP Omen Transcend 16 | |
| Lenovo Legion Slim 5 16APH8 | |
| Alienware x16 R1 | |
| AIDA64 / FPU SinJulia | |
| Asus ROG Strix G16 G614JZ | |
| Moyenne Intel Core i9-13980HX (13785 - 17117, n=9) | |
| Lenovo Legion 9 16IRX8 | |
| Lenovo Legion Slim 5 16APH8 | |
| HP Omen Transcend 16 | |
| Razer Blade 16 Early 2023 RTX 4090 | |
| Alienware x16 R1 | |
| AIDA64 / FPU Mandel | |
| Lenovo Legion 9 16IRX8 | |
| Moyenne Intel Core i9-13980HX (53398 - 73758, n=9) | |
| Asus ROG Strix G16 G614JZ | |
| Lenovo Legion Slim 5 16APH8 | |
| HP Omen Transcend 16 | |
| Razer Blade 16 Early 2023 RTX 4090 | |
| Alienware x16 R1 | |
| AIDA64 / CPU AES | |
| Razer Blade 16 Early 2023 RTX 4090 | |
| Asus ROG Strix G16 G614JZ | |
| Lenovo Legion 9 16IRX8 | |
| Moyenne Intel Core i9-13980HX (105169 - 136520, n=9) | |
| HP Omen Transcend 16 | |
| Alienware x16 R1 | |
| Lenovo Legion Slim 5 16APH8 | |
| AIDA64 / CPU ZLib | |
| Lenovo Legion 9 16IRX8 | |
| Asus ROG Strix G16 G614JZ | |
| Moyenne Intel Core i9-13980HX (1513 - 2039, n=9) | |
| Razer Blade 16 Early 2023 RTX 4090 | |
| HP Omen Transcend 16 | |
| Alienware x16 R1 | |
| Lenovo Legion Slim 5 16APH8 | |
| AIDA64 / FP64 Ray-Trace | |
| Lenovo Legion Slim 5 16APH8 | |
| Lenovo Legion 9 16IRX8 | |
| Asus ROG Strix G16 G614JZ | |
| Moyenne Intel Core i9-13980HX (11431 - 16325, n=9) | |
| HP Omen Transcend 16 | |
| Alienware x16 R1 | |
| Razer Blade 16 Early 2023 RTX 4090 | |
| AIDA64 / CPU PhotoWorxx | |
| Razer Blade 16 Early 2023 RTX 4090 | |
| Lenovo Legion 9 16IRX8 | |
| HP Omen Transcend 16 | |
| Alienware x16 R1 | |
| Moyenne Intel Core i9-13980HX (37069 - 52949, n=9) | |
| Asus ROG Strix G16 G614JZ | |
| Lenovo Legion Slim 5 16APH8 | |
Performance du système
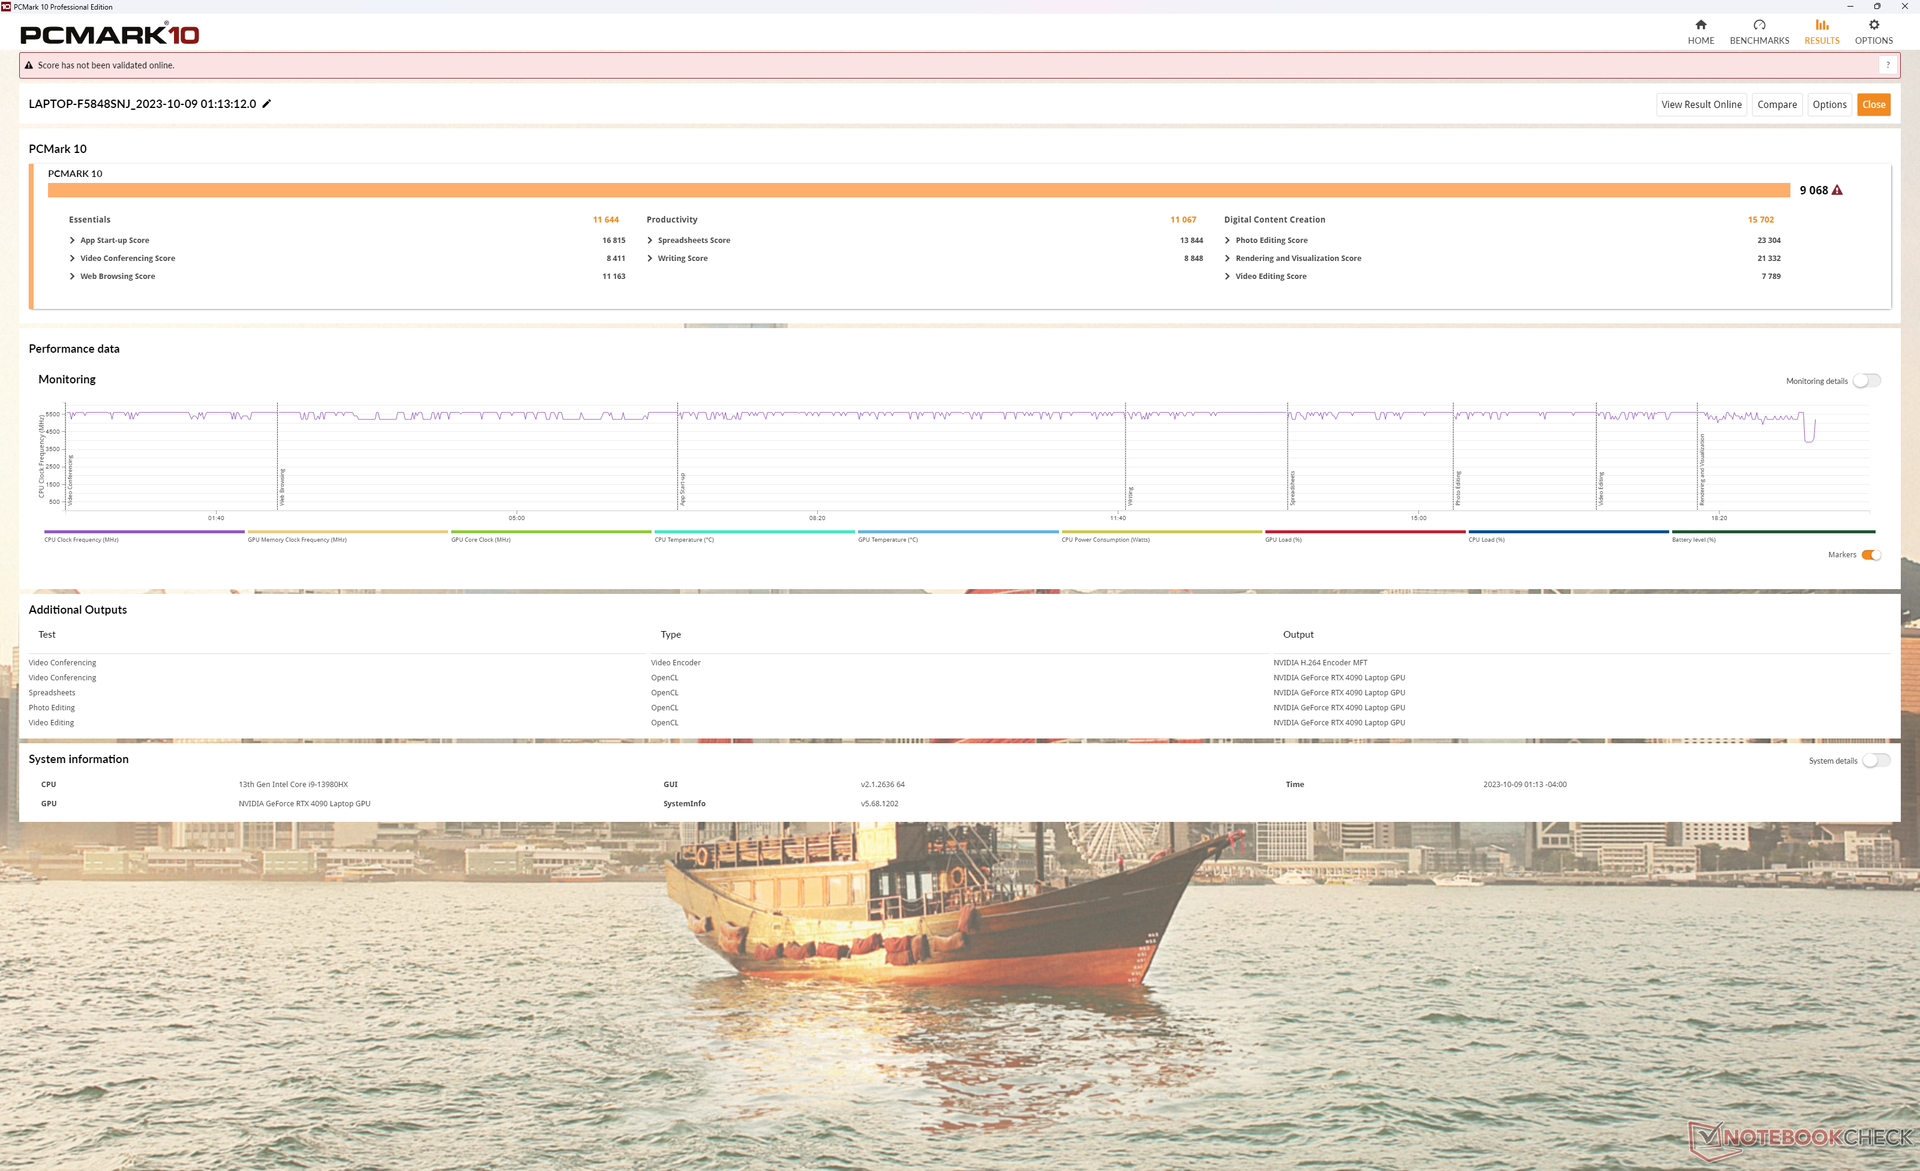
Les scores PCMark sont parmi les plus élevés de tous les ordinateurs portables de jeu, quelle que soit leur taille, en grande partie grâce à notre processeur Core HX de 13ème génération, au GPU RTX 4090 et surtout à la configuration RAID 0 PCIe4 x4. Néanmoins, nous avons encore rencontré des problèmes de réveil, l'écran restant parfois vide et "gelé" pendant des périodes anormalement longues. Nous pensons que cela est dû à la façon dont le modèle jongle entre les différents modes GPU.
CrossMark: Overall | Productivity | Creativity | Responsiveness
| PCMark 10 / Score | |
| Lenovo Legion 9 16IRX8 | |
| Moyenne Intel Core i9-13980HX, NVIDIA GeForce RTX 4090 Laptop GPU (8650 - 9068, n=4) | |
| Alienware x16 R1 | |
| HP Omen Transcend 16 | |
| Lenovo Legion Slim 5 16APH8 | |
| Razer Blade 16 Early 2023 RTX 4090 | |
| Asus ROG Strix G16 G614JZ | |
| PCMark 10 / Essentials | |
| Asus ROG Strix G16 G614JZ | |
| Lenovo Legion 9 16IRX8 | |
| Moyenne Intel Core i9-13980HX, NVIDIA GeForce RTX 4090 Laptop GPU (11215 - 11644, n=3) | |
| HP Omen Transcend 16 | |
| Lenovo Legion Slim 5 16APH8 | |
| Alienware x16 R1 | |
| Razer Blade 16 Early 2023 RTX 4090 | |
| PCMark 10 / Productivity | |
| Lenovo Legion 9 16IRX8 | |
| Moyenne Intel Core i9-13980HX, NVIDIA GeForce RTX 4090 Laptop GPU (10125 - 11067, n=3) | |
| Lenovo Legion Slim 5 16APH8 | |
| Alienware x16 R1 | |
| HP Omen Transcend 16 | |
| Razer Blade 16 Early 2023 RTX 4090 | |
| Asus ROG Strix G16 G614JZ | |
| PCMark 10 / Digital Content Creation | |
| Lenovo Legion 9 16IRX8 | |
| Moyenne Intel Core i9-13980HX, NVIDIA GeForce RTX 4090 Laptop GPU (15052 - 16012, n=3) | |
| Alienware x16 R1 | |
| HP Omen Transcend 16 | |
| Razer Blade 16 Early 2023 RTX 4090 | |
| Lenovo Legion Slim 5 16APH8 | |
| Asus ROG Strix G16 G614JZ | |
| CrossMark / Overall | |
| Asus ROG Strix G16 G614JZ | |
| Moyenne Intel Core i9-13980HX, NVIDIA GeForce RTX 4090 Laptop GPU (1935 - 2176, n=4) | |
| Razer Blade 16 Early 2023 RTX 4090 | |
| HP Omen Transcend 16 | |
| Alienware x16 R1 | |
| Lenovo Legion 9 16IRX8 | |
| Lenovo Legion Slim 5 16APH8 | |
| CrossMark / Productivity | |
| Asus ROG Strix G16 G614JZ | |
| Razer Blade 16 Early 2023 RTX 4090 | |
| Moyenne Intel Core i9-13980HX, NVIDIA GeForce RTX 4090 Laptop GPU (1764 - 2005, n=4) | |
| Alienware x16 R1 | |
| HP Omen Transcend 16 | |
| Lenovo Legion 9 16IRX8 | |
| Lenovo Legion Slim 5 16APH8 | |
| CrossMark / Creativity | |
| Asus ROG Strix G16 G614JZ | |
| Moyenne Intel Core i9-13980HX, NVIDIA GeForce RTX 4090 Laptop GPU (2267 - 2469, n=4) | |
| HP Omen Transcend 16 | |
| Lenovo Legion 9 16IRX8 | |
| Razer Blade 16 Early 2023 RTX 4090 | |
| Alienware x16 R1 | |
| Lenovo Legion Slim 5 16APH8 | |
| CrossMark / Responsiveness | |
| Asus ROG Strix G16 G614JZ | |
| Alienware x16 R1 | |
| Razer Blade 16 Early 2023 RTX 4090 | |
| Moyenne Intel Core i9-13980HX, NVIDIA GeForce RTX 4090 Laptop GPU (1556 - 1904, n=4) | |
| Lenovo Legion 9 16IRX8 | |
| HP Omen Transcend 16 | |
| Lenovo Legion Slim 5 16APH8 | |
| PCMark 10 Score | 9068 points | |
Aide | ||
| AIDA64 / Memory Copy | |
| Razer Blade 16 Early 2023 RTX 4090 | |
| Lenovo Legion 9 16IRX8 | |
| HP Omen Transcend 16 | |
| Alienware x16 R1 | |
| Moyenne Intel Core i9-13980HX (62189 - 80776, n=9) | |
| Lenovo Legion Slim 5 16APH8 | |
| Asus ROG Strix G16 G614JZ | |
| AIDA64 / Memory Read | |
| Lenovo Legion 9 16IRX8 | |
| Razer Blade 16 Early 2023 RTX 4090 | |
| HP Omen Transcend 16 | |
| Moyenne Intel Core i9-13980HX (62624 - 89096, n=9) | |
| Asus ROG Strix G16 G614JZ | |
| Alienware x16 R1 | |
| Lenovo Legion Slim 5 16APH8 | |
| AIDA64 / Memory Write | |
| Alienware x16 R1 | |
| Lenovo Legion Slim 5 16APH8 | |
| Razer Blade 16 Early 2023 RTX 4090 | |
| Lenovo Legion 9 16IRX8 | |
| HP Omen Transcend 16 | |
| Moyenne Intel Core i9-13980HX (59912 - 79917, n=9) | |
| Asus ROG Strix G16 G614JZ | |
| AIDA64 / Memory Latency | |
| Alienware x16 R1 | |
| Lenovo Legion Slim 5 16APH8 | |
| HP Omen Transcend 16 | |
| Asus ROG Strix G16 G614JZ | |
| Moyenne Intel Core i9-13980HX (79.4 - 93.2, n=9) | |
| Razer Blade 16 Early 2023 RTX 4090 | |
| Lenovo Legion 9 16IRX8 | |
* ... Moindre est la valeur, meilleures sont les performances
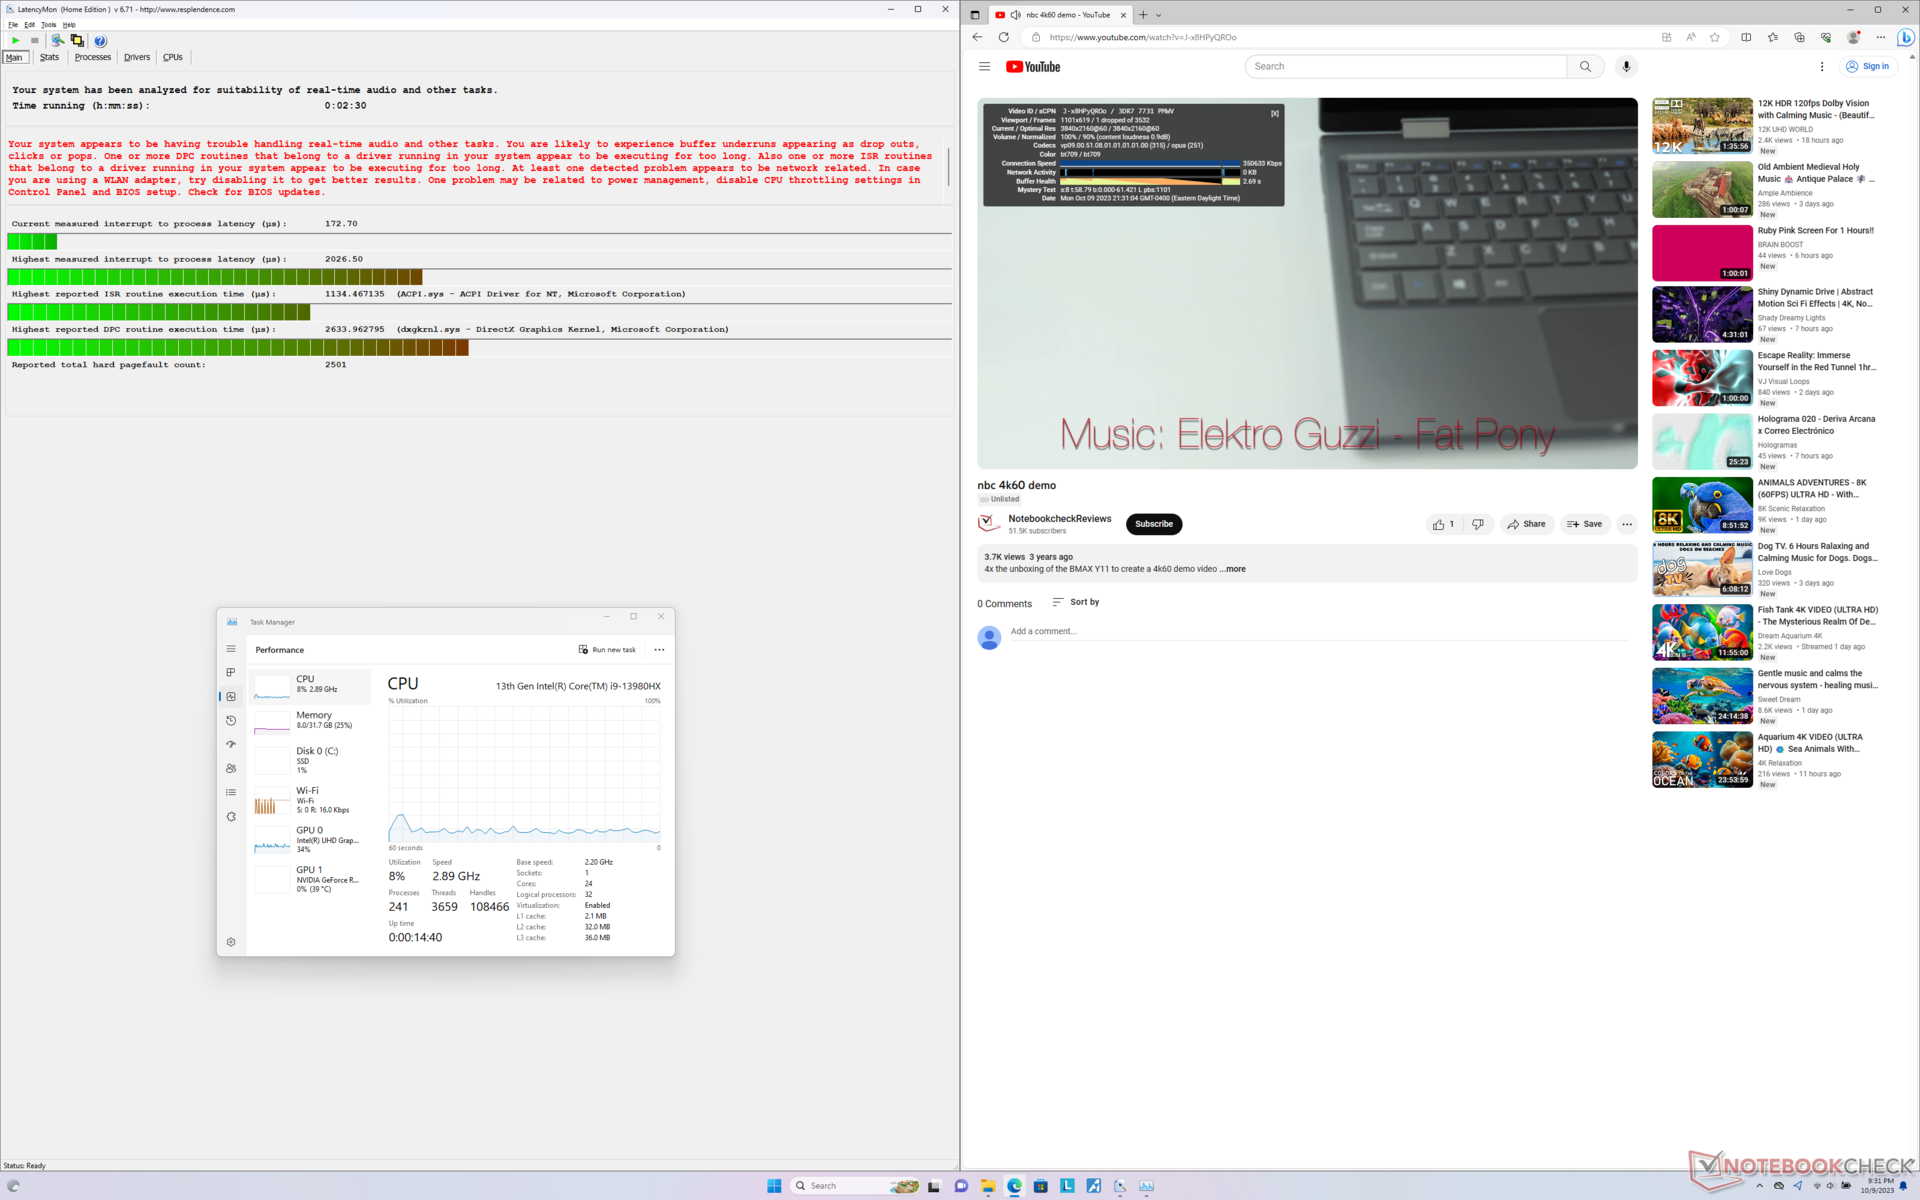
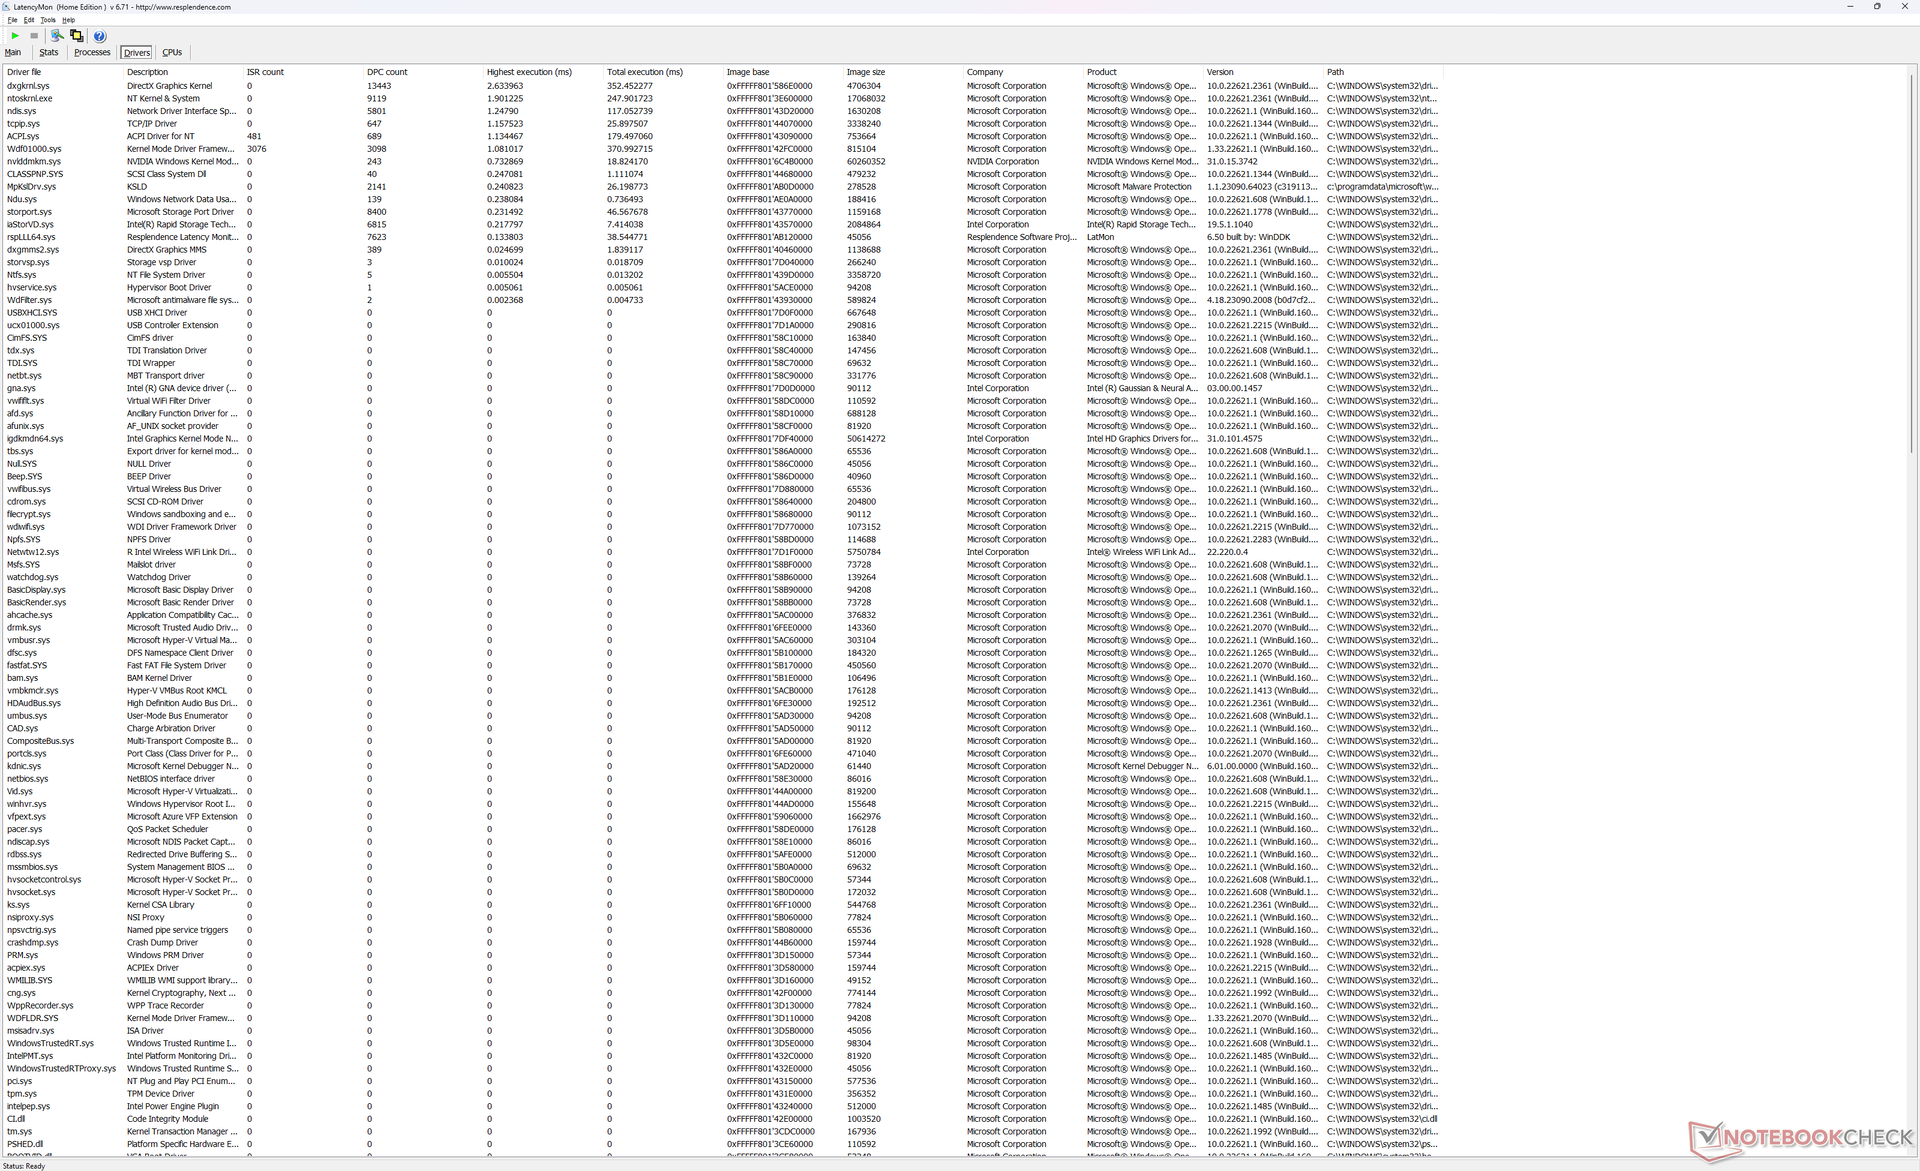
Latence DPC
LatencyMon révèle des problèmes de DPC lors de l'ouverture de plusieurs onglets de notre page d'accueil. la lecture de vidéos 4K à 60 FPS est presque parfaite, avec une seule image perdue enregistrée pendant un intervalle d'une minute.
| DPC Latencies / LatencyMon - interrupt to process latency (max), Web, Youtube, Prime95 | |
| Razer Blade 16 Early 2023 RTX 4090 | |
| Razer Blade 16 Early 2023 RTX 4090 | |
| Asus ROG Strix G16 G614JZ | |
| Lenovo Legion 9 16IRX8 | |
| HP Omen Transcend 16 | |
| Alienware x16 R1 | |
| Lenovo Legion Slim 5 16APH8 | |
* ... Moindre est la valeur, meilleures sont les performances
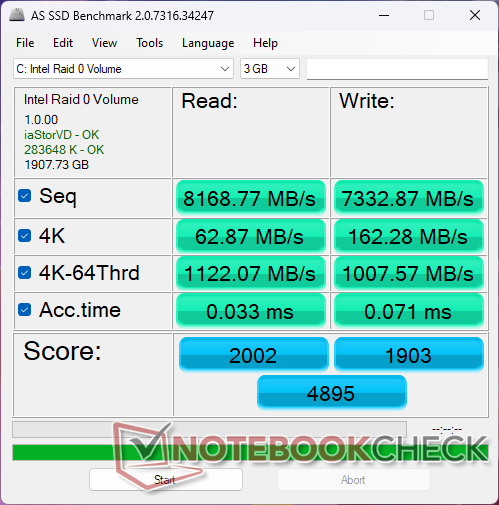
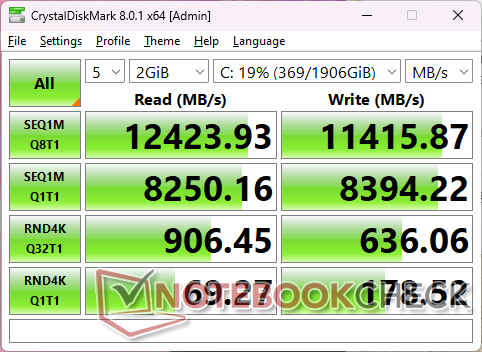
Dispositifs de stockage
Notre unité est configurée avec deux SK hynix HFS001TEJ9X115N PCIe4 x4 NVMe SSD en configuration RAID 0 pour des taux de lecture et d'écriture séquentielles incroyablement rapides de plus de 12 000 Mo/s et 11 000 Mo/s, respectivement. Malheureusement, les disques sont sujets à l'étranglement lorsqu'ils fonctionnent à des vitesses aussi élevées pendant des périodes prolongées. Les résultats de notre test en boucle DiskSpd ci-dessous montrent que les taux de lecture pour l'un des disques tombent à environ 4600 Mo/s après environ 4 minutes.

| Drive Performance rating - Percent | |
| Alienware x16 R1 | |
| Lenovo Legion 9 16IRX8 | |
| Razer Blade 16 Early 2023 RTX 4090 | |
| Asus ROG Strix G16 G614JZ | |
| HP Omen Transcend 16 | |
| Lenovo Legion Slim 5 16APH8 | |
* ... Moindre est la valeur, meilleures sont les performances
Disk Throttling: DiskSpd Read Loop, Queue Depth 8
Performance du GPU - 175 W TGP Graphics
Nos 175 W GeForce RTX 4090 se situe à seulement 1 ou 2 points de pourcentage de la moyenne des ordinateurs portables de notre base de données avec le même GPU. Ces résultats sont impressionnants si l'on considère la taille de certains ordinateurs portables RTX 4090, tels que leMSI Raider GE78 HX 13VI.
Si l'on considère la situation dans son ensemble, la RTX 4090 mobile est environ 40 % plus lente qu'une véritable" RTX 4090. En fait, elle n'offre que des avantages modestes de 5 à 10 % par rapport à la rTX 4080 mobile configuration.
L'utilisation du profil d'alimentation équilibré avec l'overclocking désactivé réduirait les performances graphiques d'environ 17 % selon notre tableau de résultats Fire Strike ci-dessous.
| Profil d'alimentation | Score graphique | Score physique | Score combiné |
| Mode Performance | 46386 | 38687 | 11456 |
| Mode équilibré (avec GPU Overclock désactivé) | 38285 (-17%) | 39020 (-0%) | 12715 (-0%) |
| Puissance de la batterie | 22176 (-52%) | 21072 (-46%) | 6306 (-45%) |
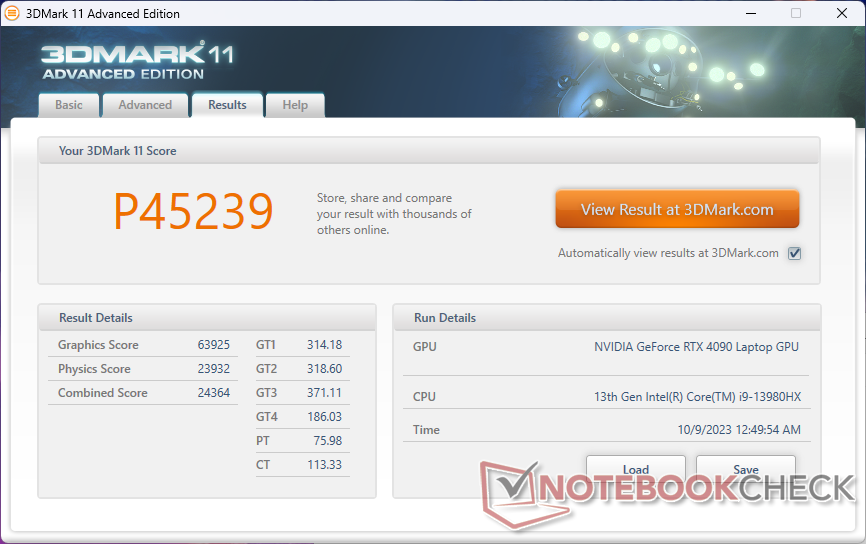
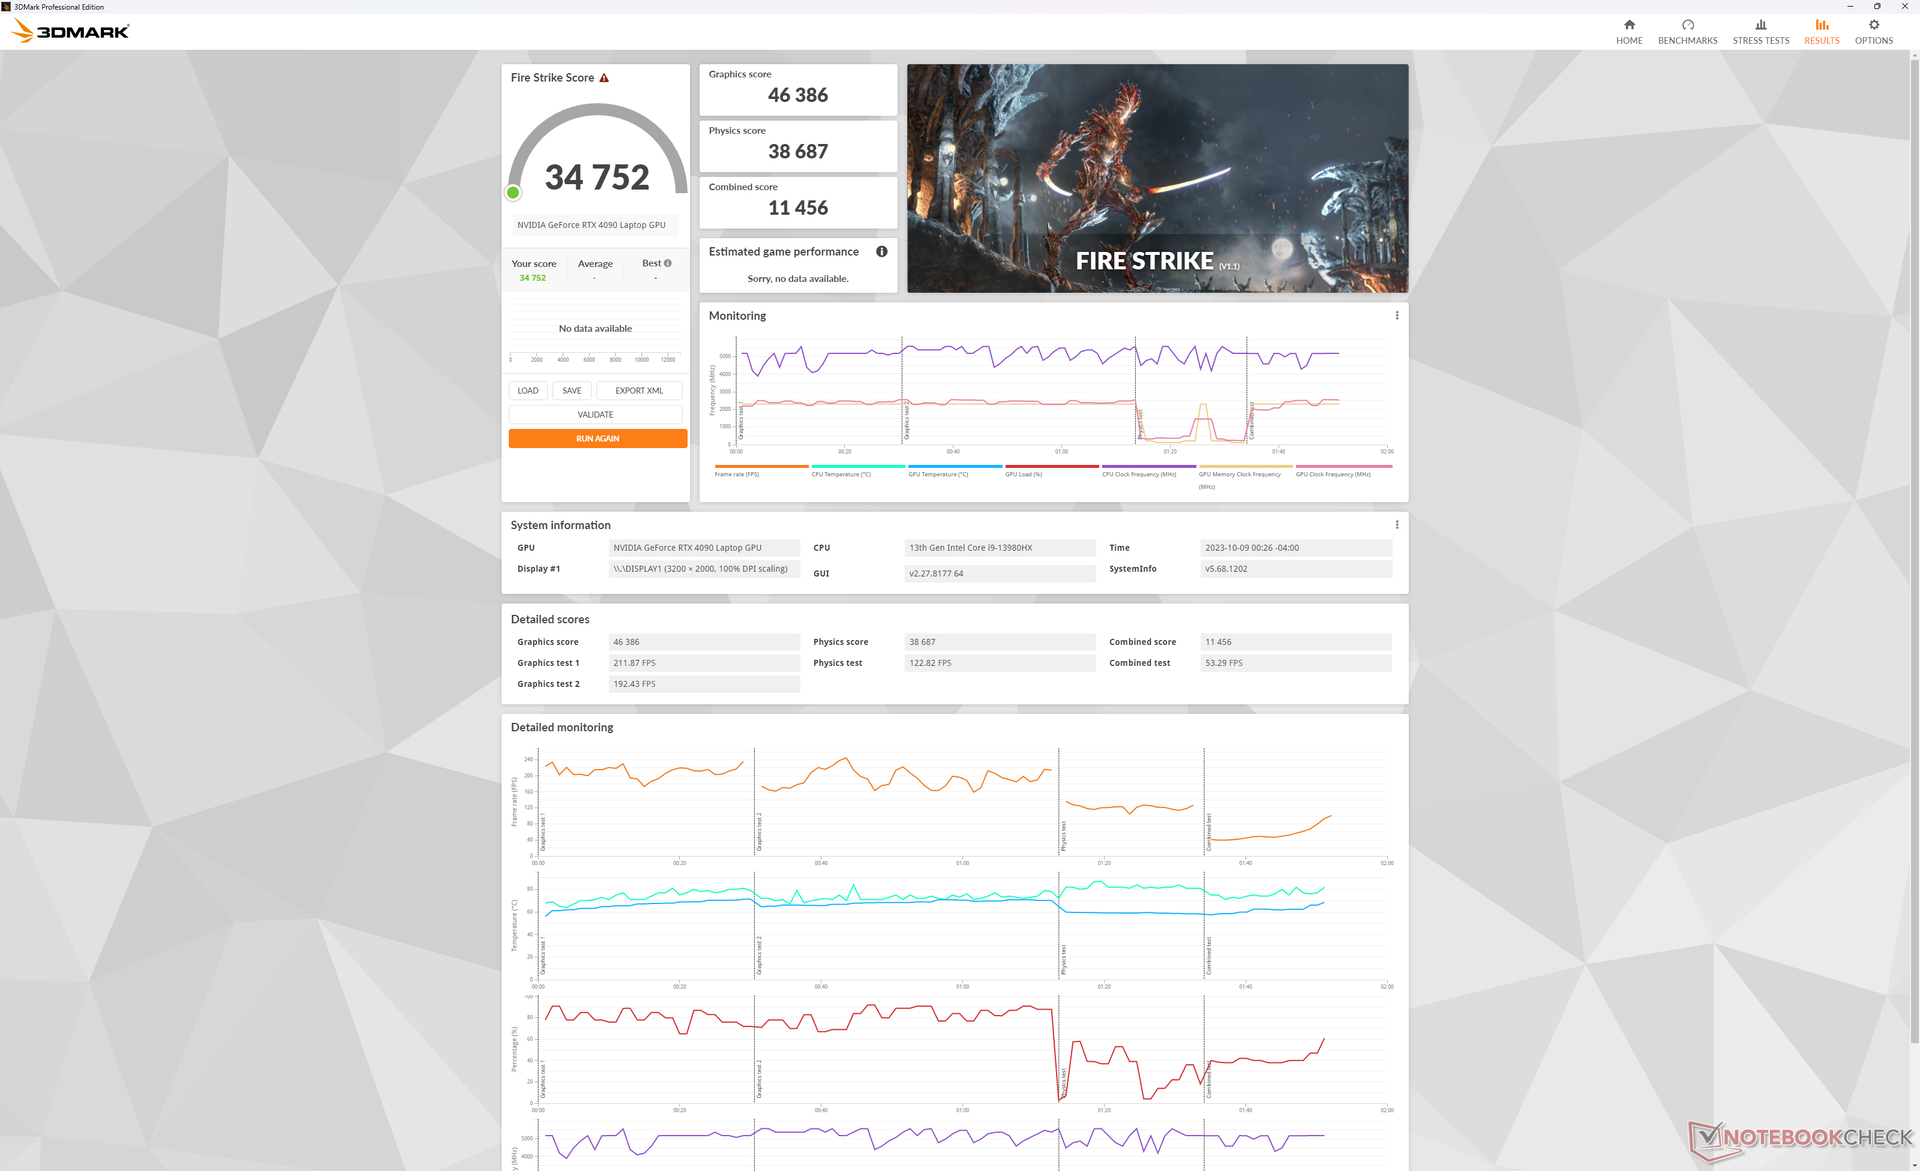
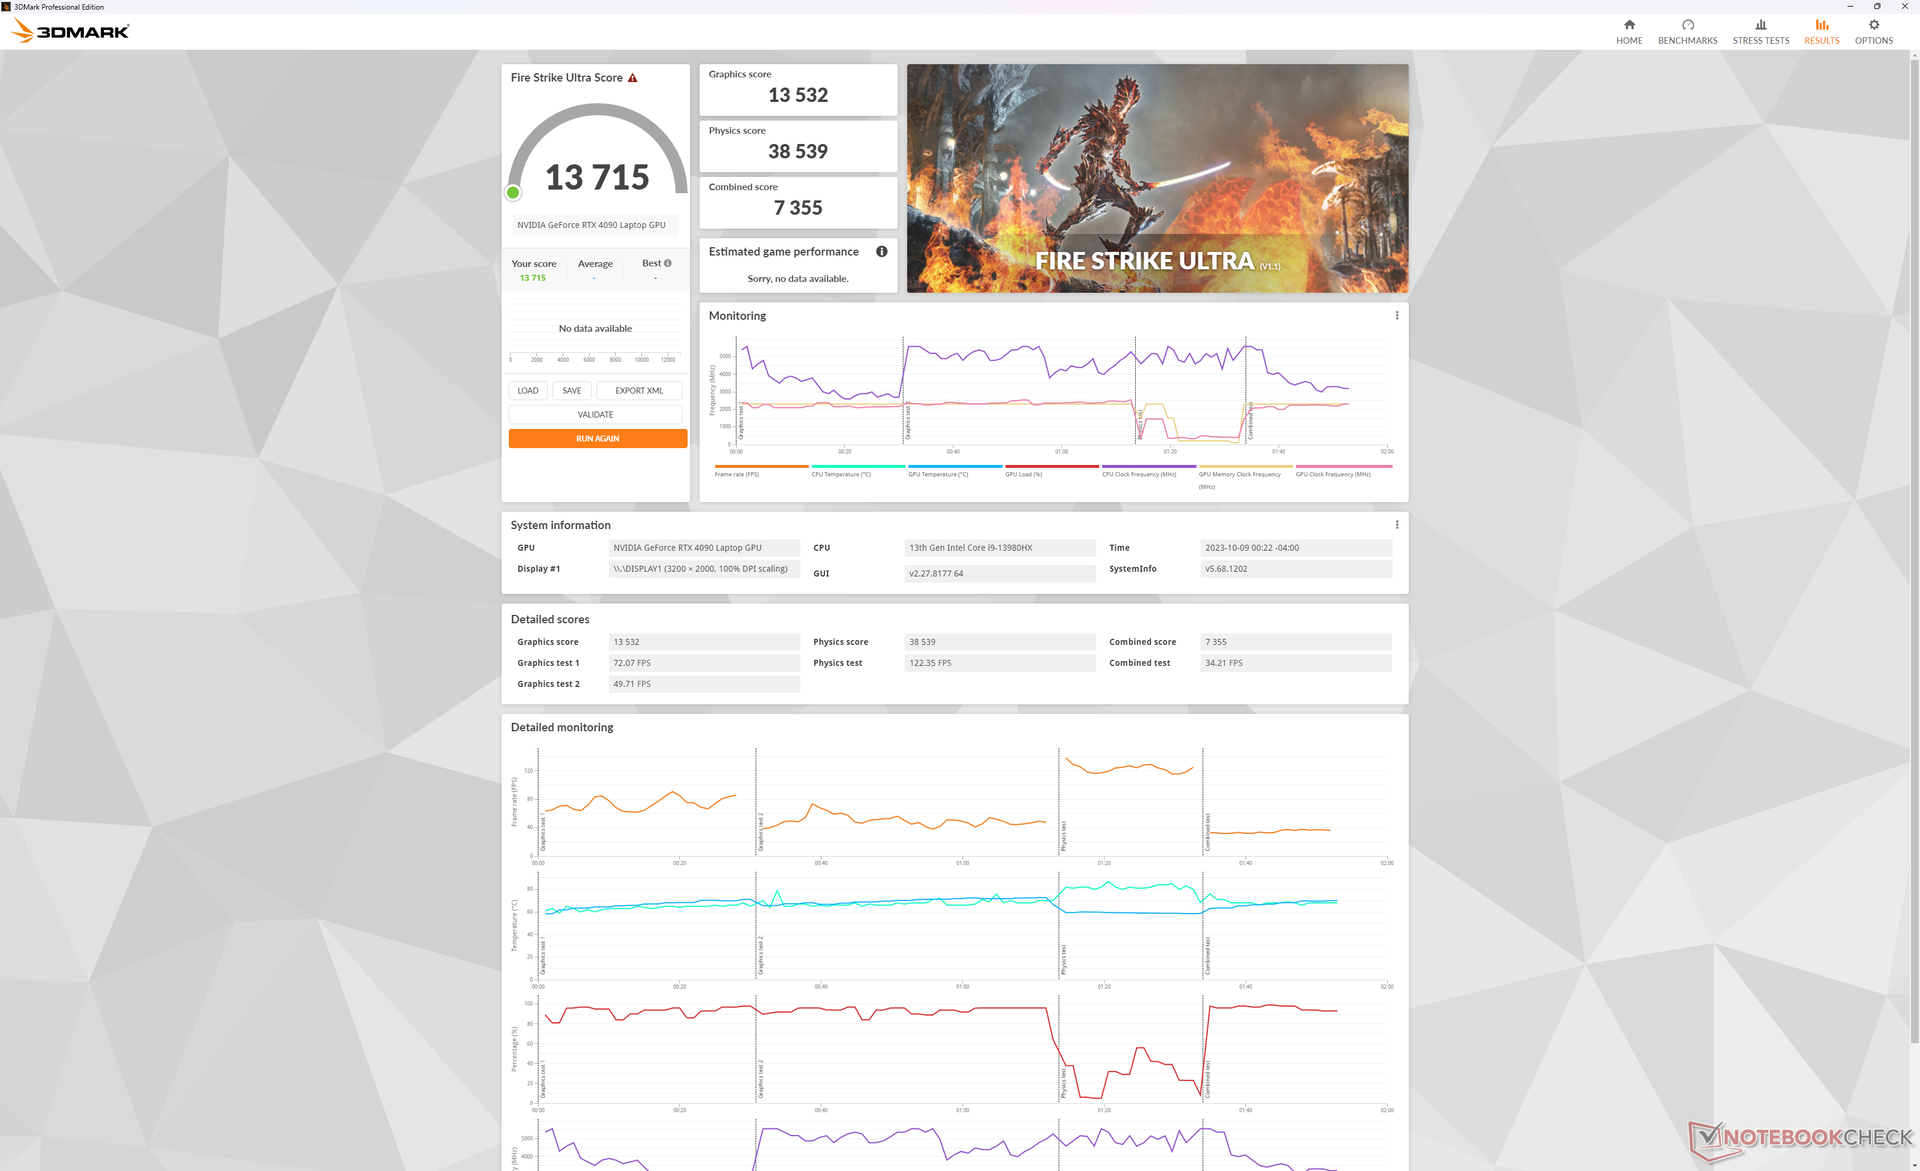
| 3DMark 11 Performance | 45239 points | |
| 3DMark Fire Strike Score | 34752 points | |
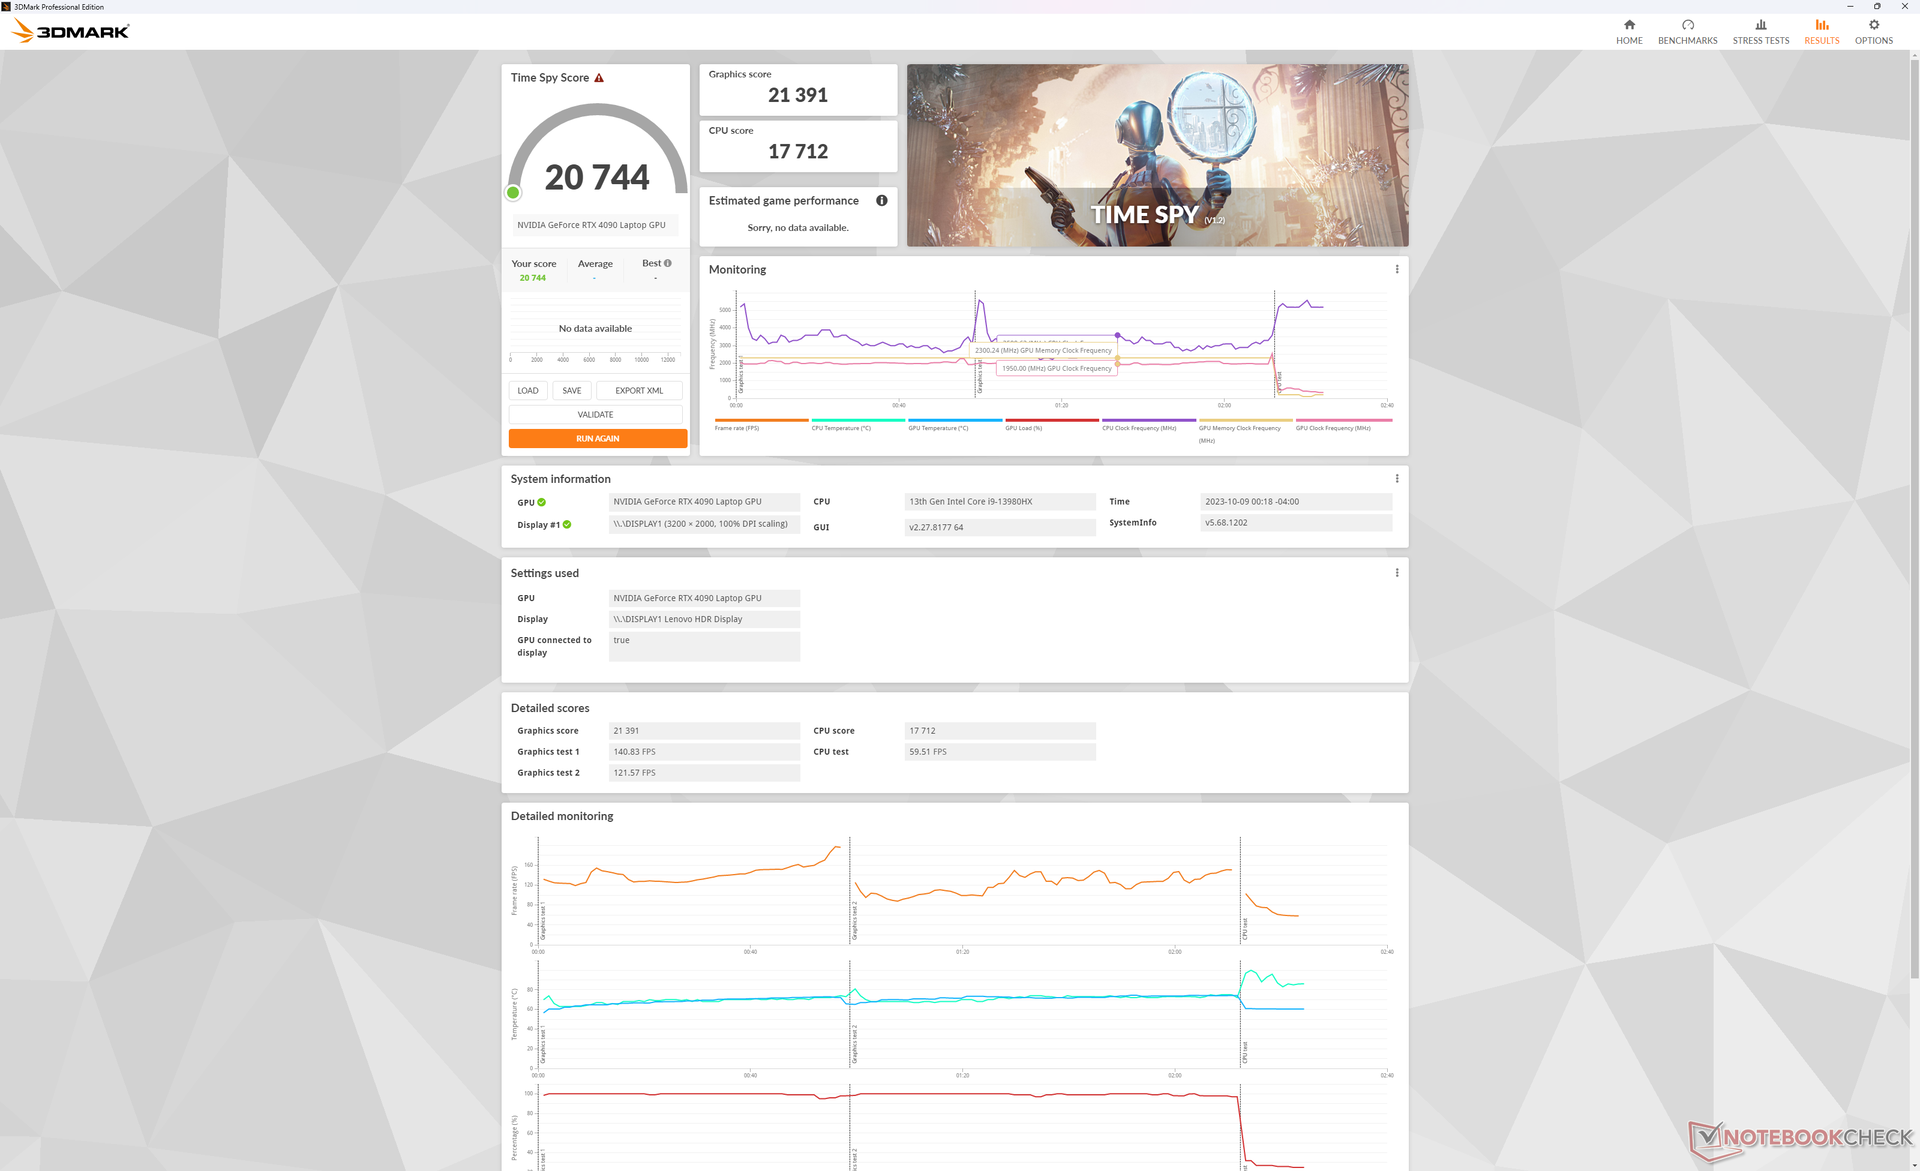
| 3DMark Time Spy Score | 20744 points | |
Aide | ||
* ... Moindre est la valeur, meilleures sont les performances
Performances des jeux
Tous les jeux tournent très bien en QHD ou plus, y compris les titres exigeants comme Cyberpunk 2077 ou Ratchet and Clank. Notez que la fonction G-Sync ne peut être activée qu'en mode dGPU, car elle est désactivée en mode hybride ou intégré.
| Ratchet & Clank Rift Apart | |
| 1920x1080 Low Preset | |
| Lenovo Legion 9 16IRX8 | |
| Moyenne NVIDIA GeForce RTX 4090 Laptop GPU (n=1) | |
| MSI Raider GE68HX 13VF | |
| 1920x1080 Medium Preset AA:T | |
| Moyenne NVIDIA GeForce RTX 4090 Laptop GPU (155.6 - 161.8, n=2) | |
| Lenovo Legion 9 16IRX8 | |
| MSI Raider GE68HX 13VF | |
| 1920x1080 High Preset AA:T | |
| Moyenne NVIDIA GeForce RTX 4090 Laptop GPU (135.4 - 136.6, n=2) | |
| Lenovo Legion 9 16IRX8 | |
| MSI Raider GE68HX 13VF | |
| 1920x1080 Very High Preset AA:T | |
| Moyenne NVIDIA GeForce RTX 4090 Laptop GPU (111.1 - 115.4, n=2) | |
| Lenovo Legion 9 16IRX8 | |
| MSI Raider GE68HX 13VF | |
| 2560x1440 Very High Preset AA:T | |
| Moyenne NVIDIA GeForce RTX 4090 Laptop GPU (98.7 - 107.1, n=2) | |
| Lenovo Legion 9 16IRX8 | |
Witcher 3 FPS Chart
| Bas | Moyen | Élevé | Ultra | QHD | |
|---|---|---|---|---|---|
| GTA V (2015) | 187.1 | 186.3 | 184.8 | 150.7 | 145.3 |
| The Witcher 3 (2015) | 671.8 | 569 | 408.2 | 208.7 | 165 |
| Dota 2 Reborn (2015) | 244 | 217 | 208 | 193.1 | |
| Final Fantasy XV Benchmark (2018) | 231 | 207 | 181.3 | 158.4 | |
| X-Plane 11.11 (2018) | 214 | 185.9 | 140.1 | ||
| Far Cry 5 (2018) | 195 | 176 | 167 | 158 | 157 |
| Strange Brigade (2018) | 487 | 409 | 390 | 387 | 312 |
| Cyberpunk 2077 1.6 (2022) | 146.9 | 142.9 | 129.5 | 131.4 | 98.8 |
| Tiny Tina's Wonderlands (2022) | 377.6 | 290.4 | 226.2 | 186.4 | 137.8 |
| F1 22 (2022) | 336 | 333 | 286 | 130.8 | 90.9 |
| Ratchet & Clank Rift Apart (2023) | 163.4 | 155.6 | 135.4 | 111.1 | 98.7 |
| Cyberpunk 2077 (2023) | 131.22 | 89.55 | |||
| Alan Wake 2 (2023) | 121.1 | 83.7 | |||
| Avatar Frontiers of Pandora (2023) | 100 | 69 |
Émissions
Bruit du système
Les ventilateurs ne tournent pratiquement jamais au ralenti et il faut donc s'attendre à un certain bruit. Ils ont tendance à tourner autour de 30,4 dB(A) sur un fond silencieux de 23,7 dB(A) sous les charges les plus courantes comme la navigation web ou le streaming vidéo, même en mode silencieux. Cette plage est typique de la plupart des autres ordinateurs portables de jeu dans des conditions similaires, mais le Legion 9i 16 ne pulse pas aussi fréquemment à condition que vous fonctionniez en mode iGPU équilibré ou inférieur.
Le bruit du ventilateur augmente de manière significative jusqu'à 52,2 dB(A) lorsque vous jouez en mode Performance, ce qui correspond à la plage attendue pour les ordinateurs portables de jeu haut de gamme. Le bruit diminue légèrement à 49,5 dB(A) si vous jouez en mode équilibré, mais gardez à l'esprit le déficit graphique de 17 % par rapport au mode Performance, comme indiqué ci-dessus. Dans les deux cas, il est recommandé d'utiliser un casque pour jouer.
Degré de la nuisance sonore
| Au repos |
| 24 / 24 / 30.4 dB(A) |
| Fortement sollicité |
| 30.4 / 54.9 dB(A) |
 | ||
30 dB silencieux 40 dB(A) audible 50 dB(A) bruyant |
||
min: | ||
| Lenovo Legion 9 16IRX8 GeForce RTX 4090 Laptop GPU, i9-13980HX, 2x SK Hynix HFS001TEJ9X115N (RAID 0) | Lenovo Legion Slim 5 16APH8 GeForce RTX 4060 Laptop GPU, R7 7840HS, SK hynix PC801 HFS512GEJ9X115N | Razer Blade 16 Early 2023 RTX 4090 GeForce RTX 4090 Laptop GPU, i9-13950HX, SSSTC CA6-8D1024 | Asus ROG Strix G16 G614JZ GeForce RTX 4080 Laptop GPU, i9-13980HX, WD PC SN560 SDDPNQE-1T00 | HP Omen Transcend 16 GeForce RTX 4070 Laptop GPU, i9-13900HX, SK hynix PC801 HFS002TEJ9X101N | Alienware x16 R1 GeForce RTX 4080 Laptop GPU, i9-13900HK, SK hynix PC801 HFS001TEJ9X101N | |
|---|---|---|---|---|---|---|
| Noise | 1% | 3% | -11% | -13% | -1% | |
| arrêt / environnement * (dB) | 23.7 | 22.9 3% | 20.84 12% | 25 -5% | 22.9 3% | 22.7 4% |
| Idle Minimum * (dB) | 24 | 23.1 4% | 23.65 1% | 26 -8% | 29.1 -21% | 23.1 4% |
| Idle Average * (dB) | 24 | 23.1 4% | 23.65 1% | 28 -17% | 29.1 -21% | 25.8 -8% |
| Idle Maximum * (dB) | 30.4 | 27.7 9% | 23.65 22% | 30 1% | 29.1 4% | 25.8 15% |
| Load Average * (dB) | 30.4 | 33.3 -10% | 43.35 -43% | 48 -58% | 45.7 -50% | 39.3 -29% |
| Witcher 3 ultra * (dB) | 52.2 | 54 -3% | 46.7 11% | 49 6% | 54.3 -4% | 49.9 4% |
| Load Maximum * (dB) | 54.9 | 54 2% | 46.72 15% | 52 5% | 54.3 1% | 54.8 -0% |
* ... Moindre est la valeur, meilleures sont les performances
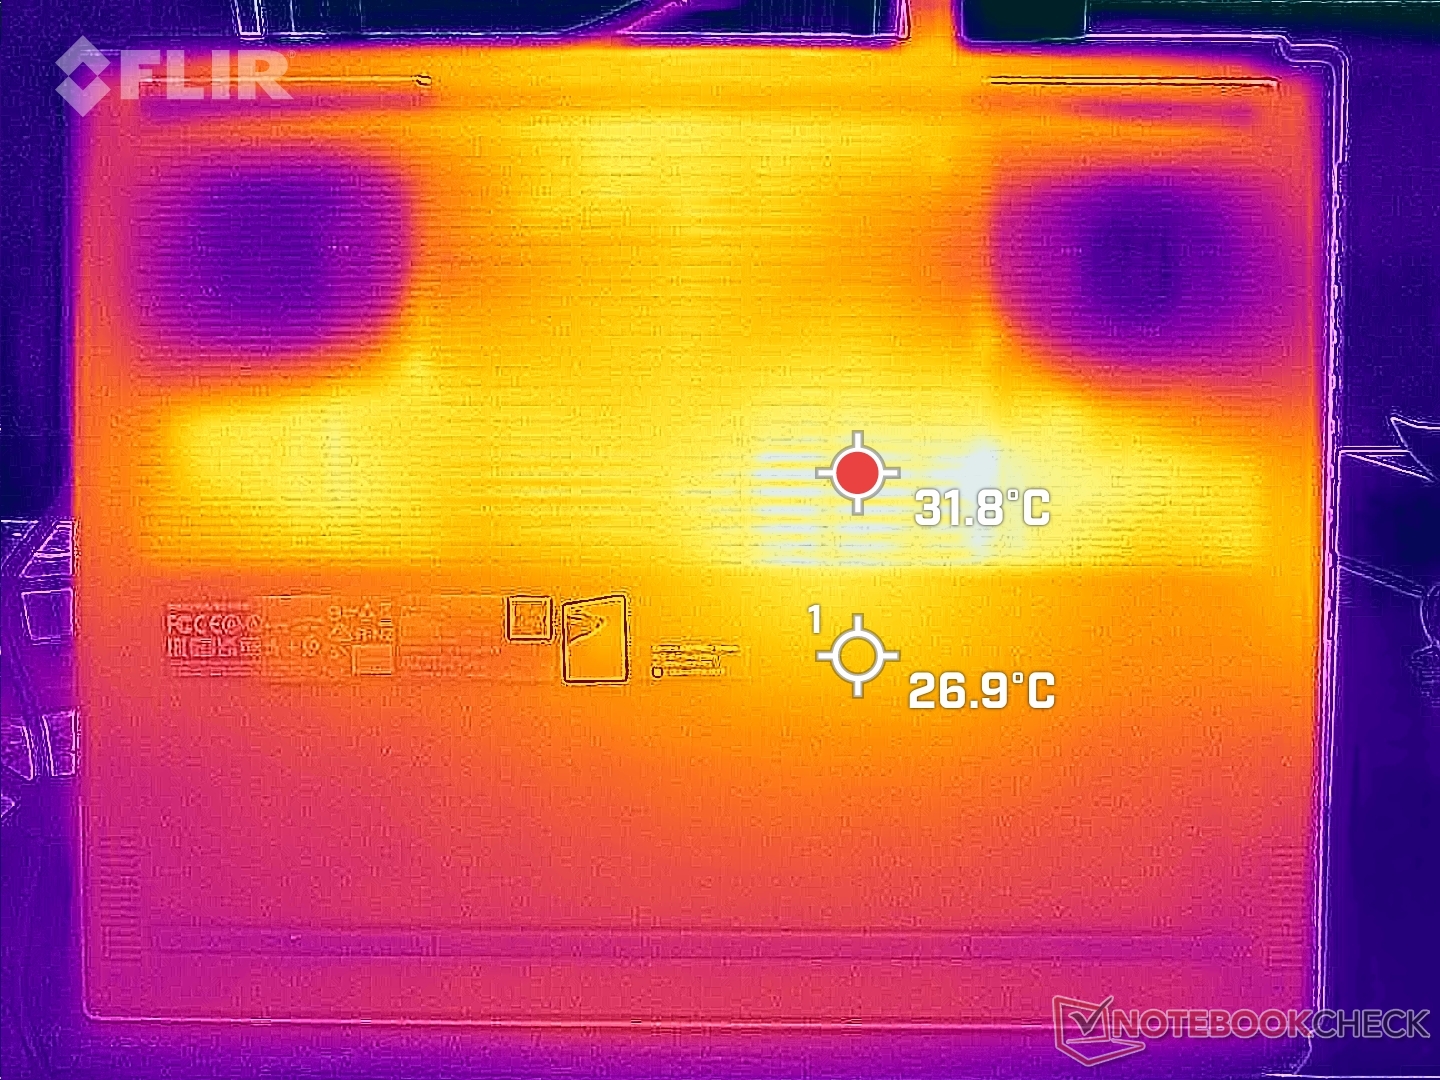
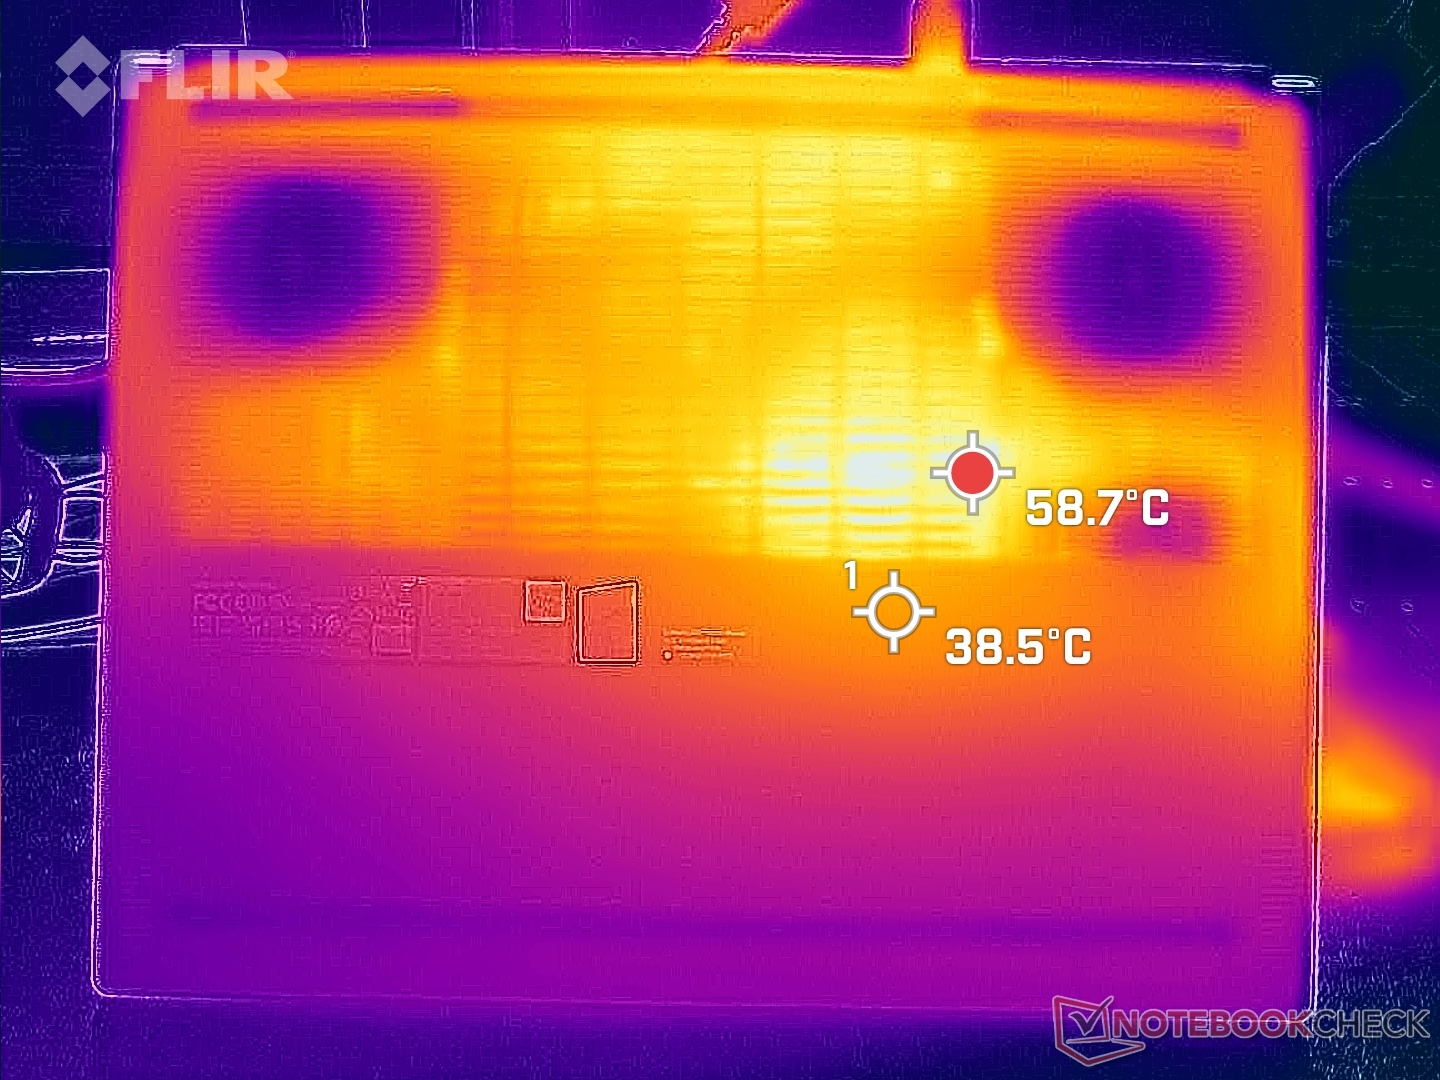
Température
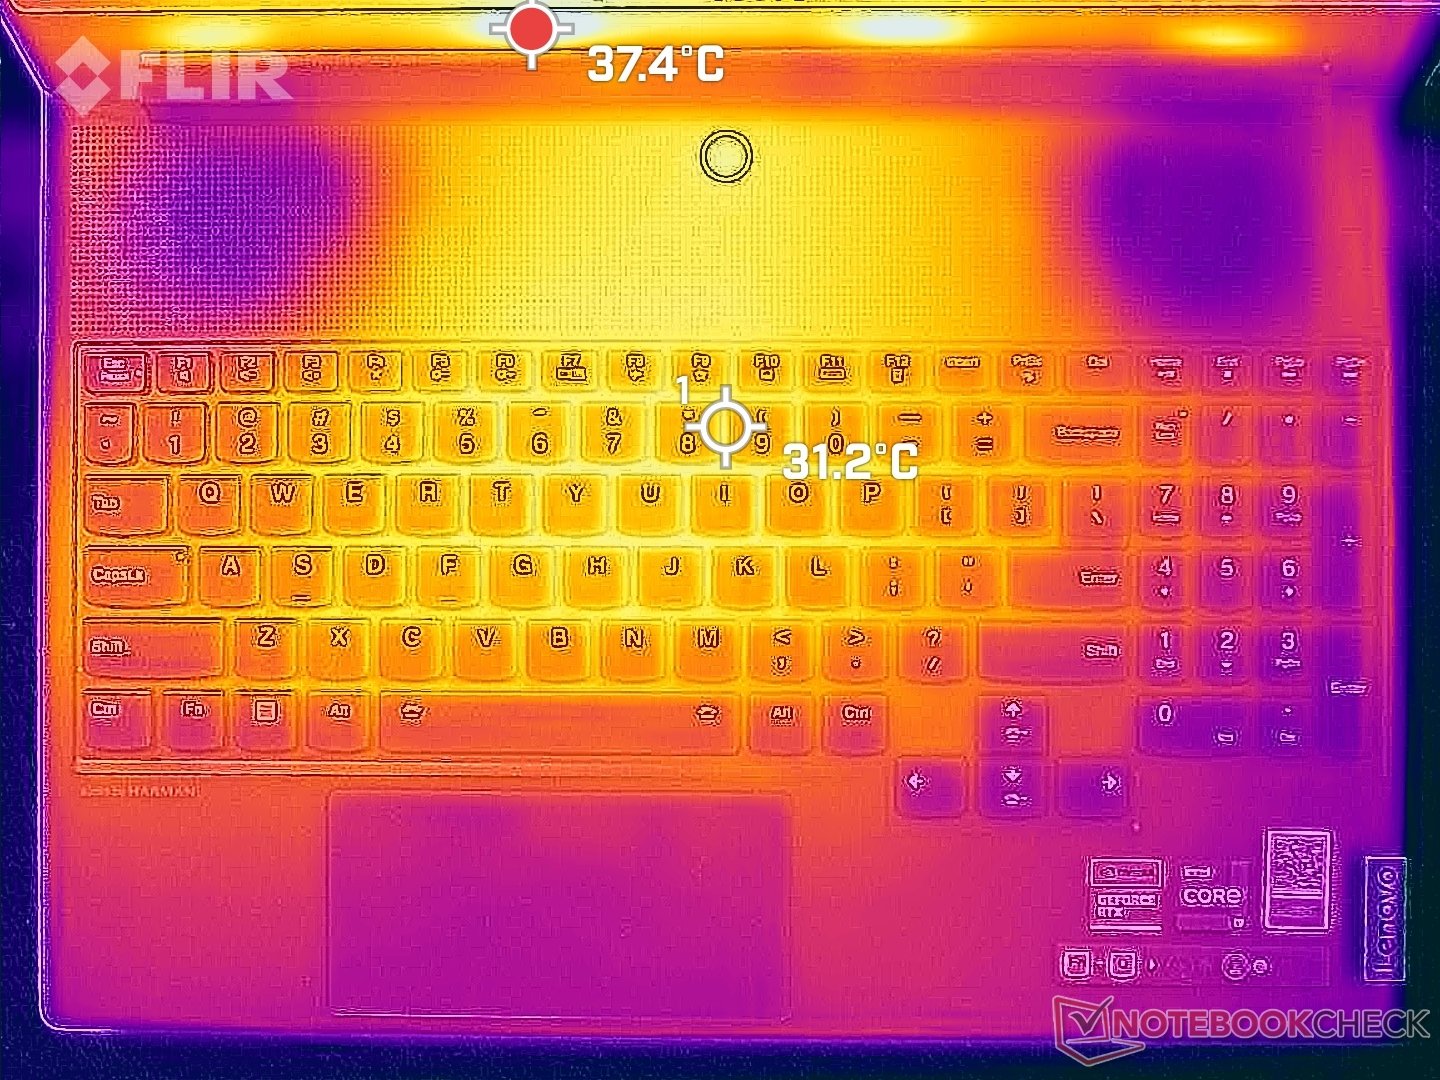
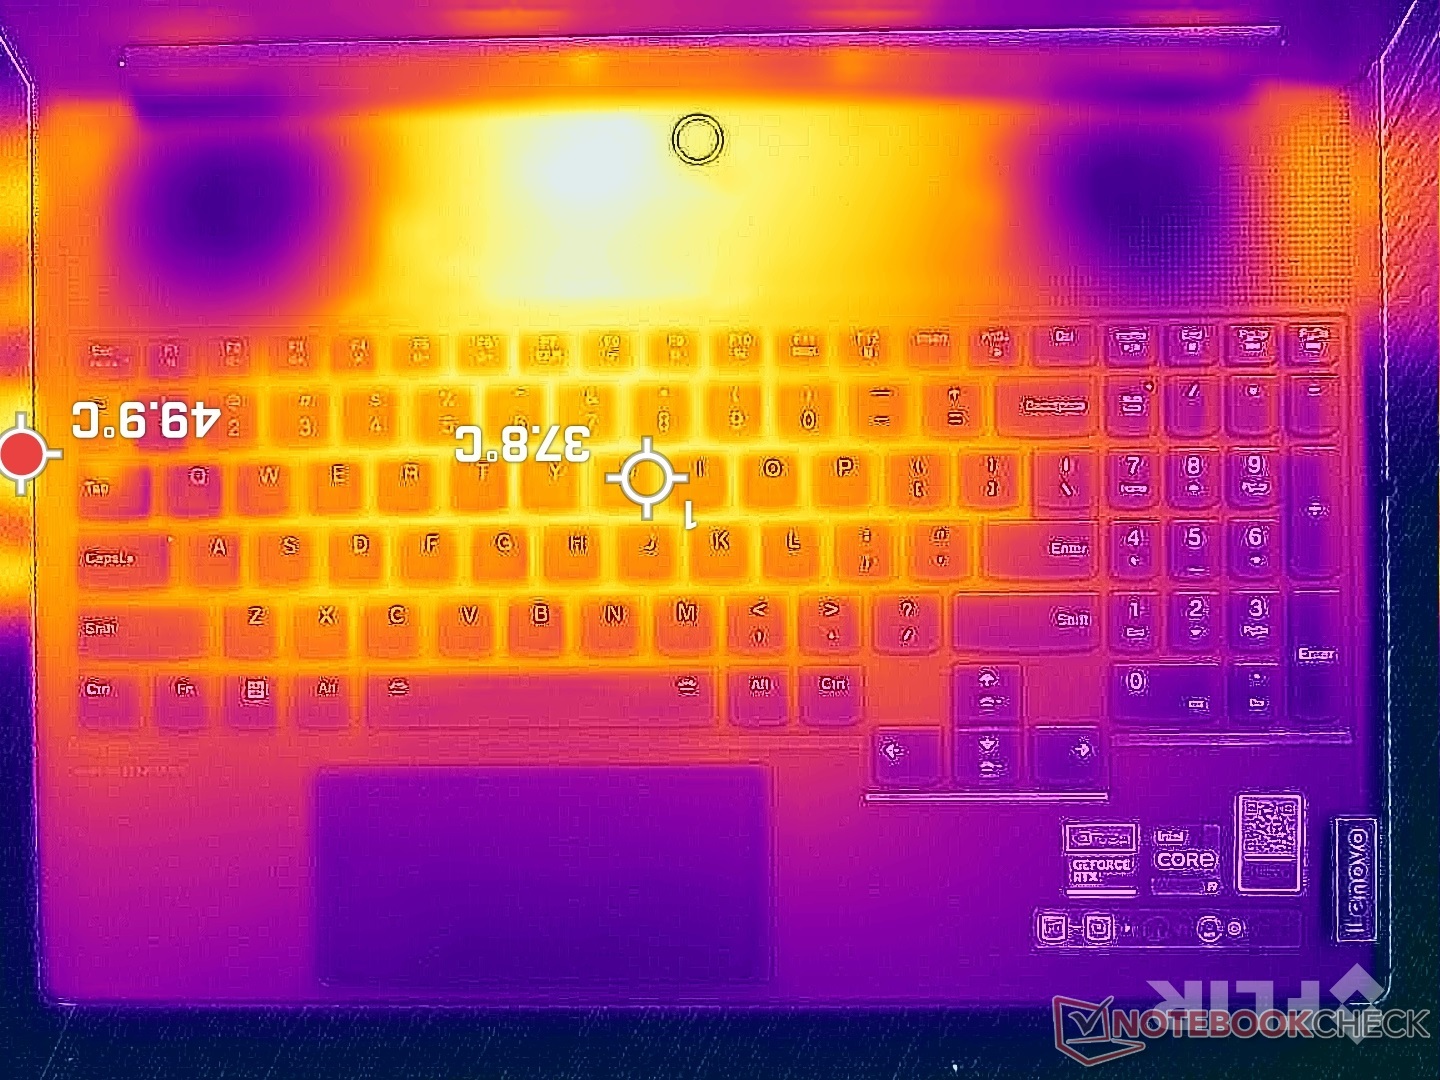
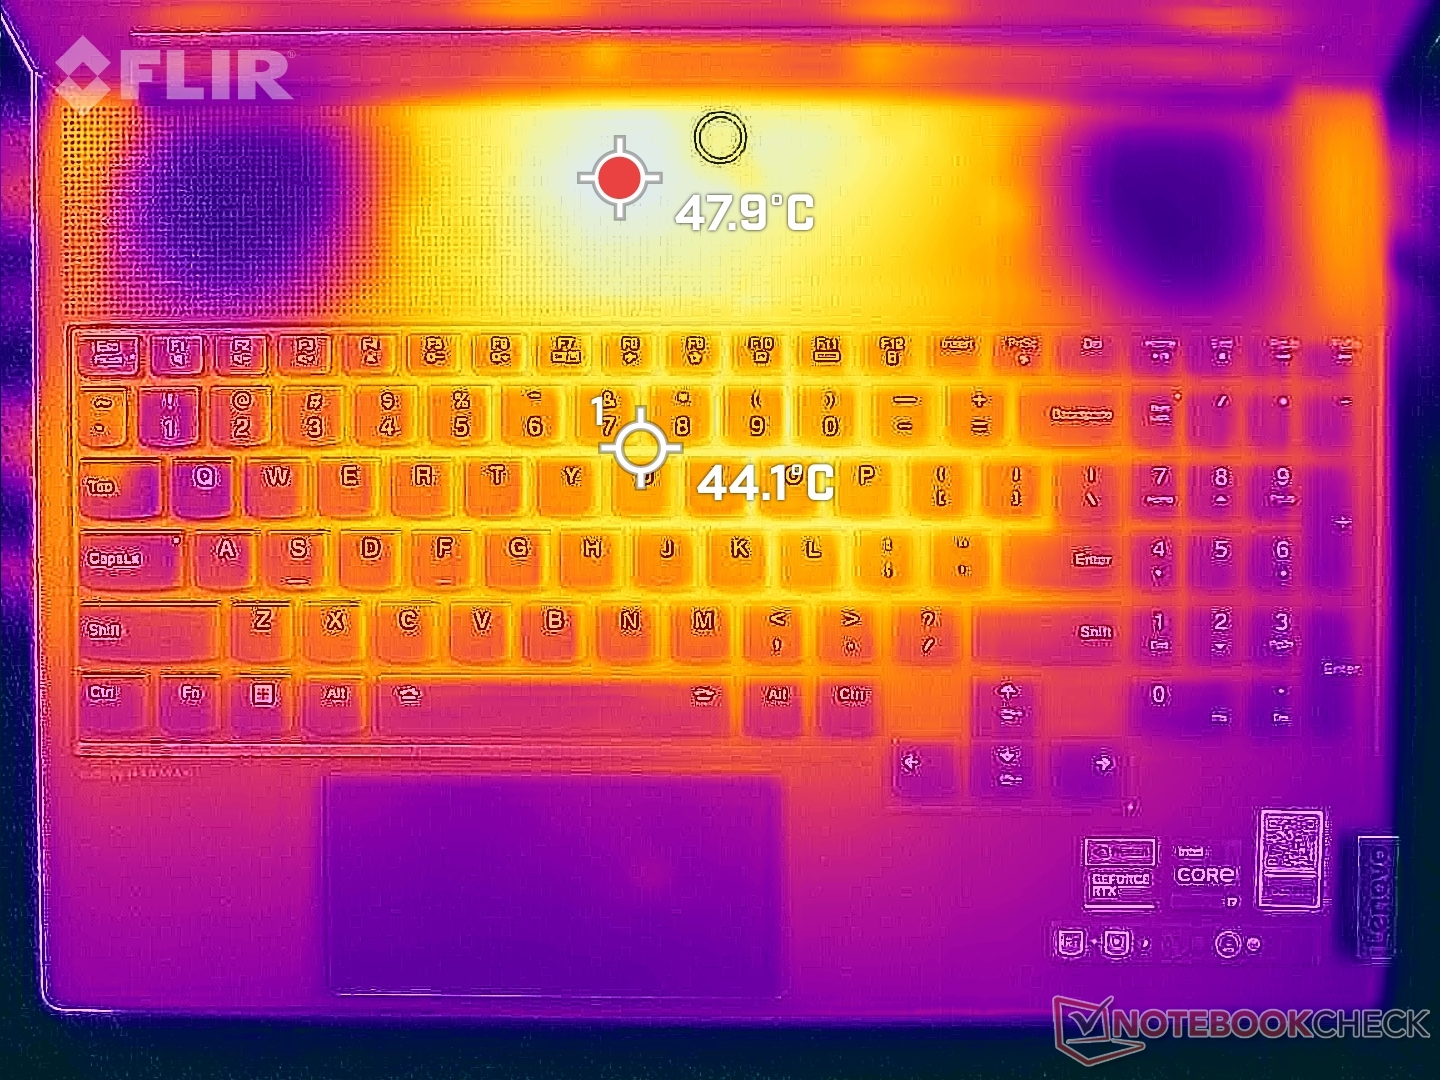
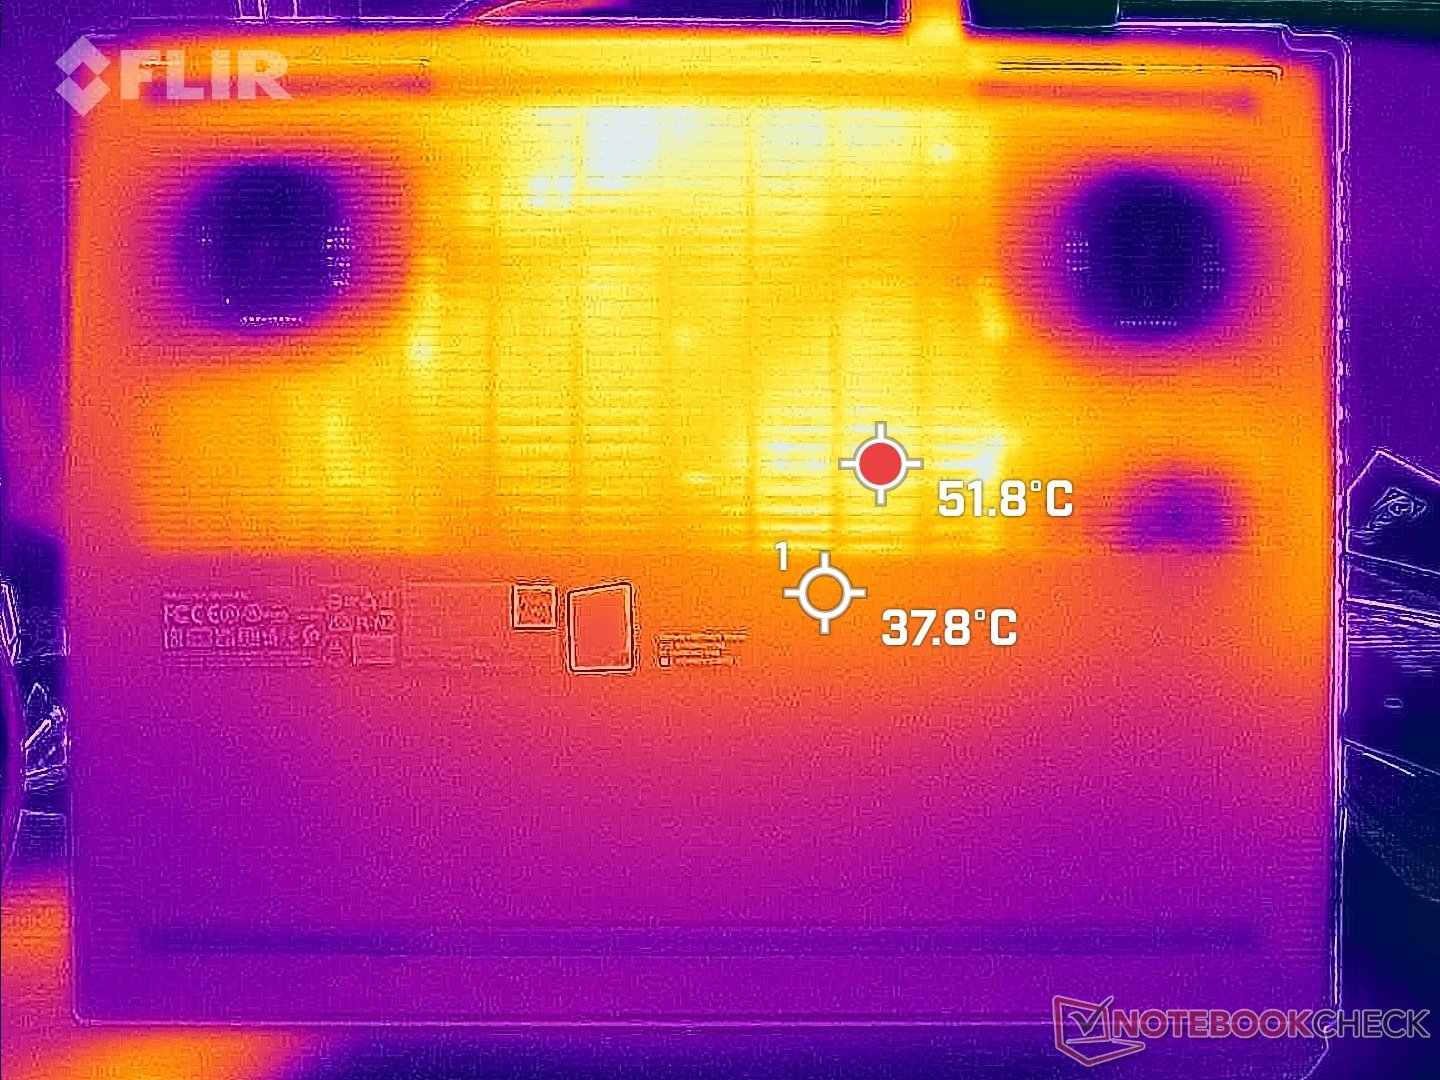
Les températures de surface sont assez chaudes malgré les matériaux thermiques avancés. Lorsque vous jouez, les touches WASD et le centre du clavier peuvent atteindre respectivement 42°C et 46°C, ce qui est légèrement plus chaud que ce que nous avons observé sur le modèle Alienware x16 R1. Beaucoup d'autres ordinateurs portables de jeu, comme le Razer Blade 16, aspirent l'air frais des touches WASD pour maintenir cette partie du clavier au frais et assurer un meilleur confort de jeu, mais ce n'est pas le cas de notre modèle Legion 9 16, comme le montrent les cartes de température ci-dessous.
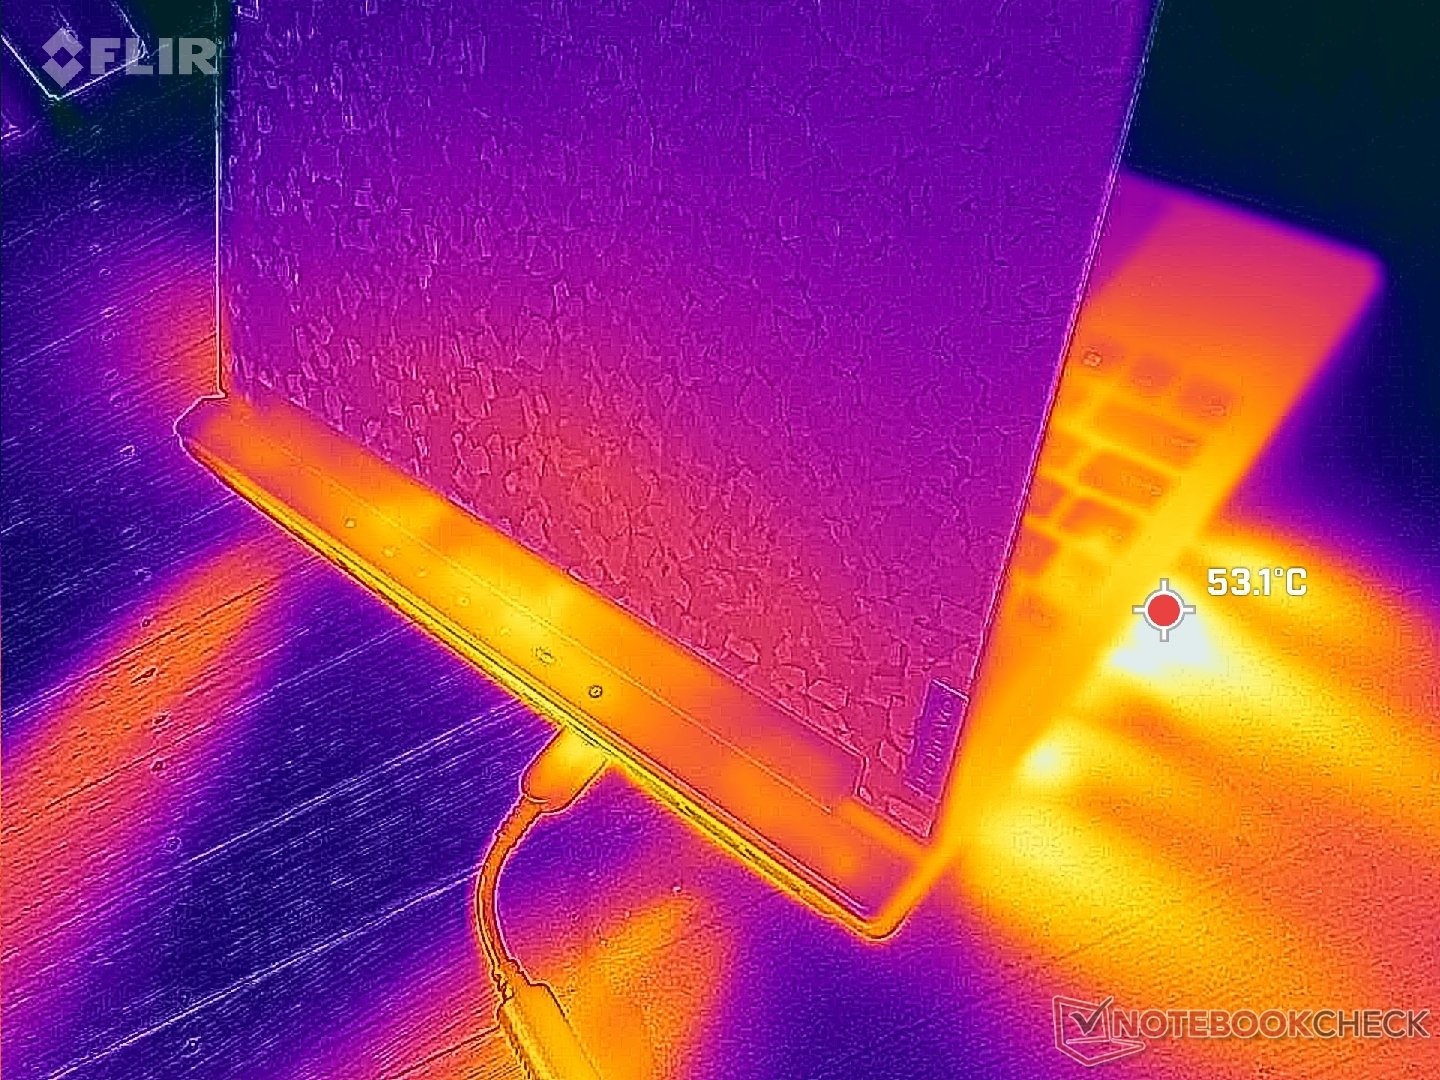
(-) La température maximale du côté supérieur est de 49.6 °C / 121 F, par rapport à la moyenne de 40.4 °C / 105 F, allant de 21.2 à 68.8 °C pour la classe Gaming.
(-) Le fond chauffe jusqu'à un maximum de 48.6 °C / 119 F, contre une moyenne de 43.2 °C / 110 F
(+) En utilisation inactive, la température moyenne du côté supérieur est de 30 °C / 86 F, par rapport à la moyenne du dispositif de 33.9 °C / 93 F.
(-) En jouant à The Witcher 3, la température moyenne du côté supérieur est de 38.1 °C / 101 F, alors que la moyenne de l'appareil est de 33.9 °C / 93 F.
(+) Les repose-poignets et le pavé tactile atteignent la température maximale de la peau (33.6 °C / 92.5 F) et ne sont donc pas chauds.
(-) La température moyenne de la zone de l'appui-paume de dispositifs similaires était de 28.8 °C / 83.8 F (-4.8 °C / #-8.7 F).
| Lenovo Legion 9 16IRX8 Intel Core i9-13980HX, NVIDIA GeForce RTX 4090 Laptop GPU | Lenovo Legion Slim 5 16APH8 AMD Ryzen 7 7840HS, NVIDIA GeForce RTX 4060 Laptop GPU | Razer Blade 16 Early 2023 RTX 4090 Intel Core i9-13950HX, NVIDIA GeForce RTX 4090 Laptop GPU | Asus ROG Strix G16 G614JZ Intel Core i9-13980HX, NVIDIA GeForce RTX 4080 Laptop GPU | HP Omen Transcend 16 Intel Core i9-13900HX, NVIDIA GeForce RTX 4070 Laptop GPU | Alienware x16 R1 Intel Core i9-13900HK, NVIDIA GeForce RTX 4080 Laptop GPU | |
|---|---|---|---|---|---|---|
| Heat | 18% | 2% | -1% | 5% | -2% | |
| Maximum Upper Side * (°C) | 49.6 | 40.6 18% | 52 -5% | 54 -9% | 47.4 4% | 47.2 5% |
| Maximum Bottom * (°C) | 48.6 | 42 14% | 47.6 2% | 55 -13% | 54.4 -12% | 47.8 2% |
| Idle Upper Side * (°C) | 33.2 | 27.8 16% | 33 1% | 29 13% | 28.4 14% | 36.8 -11% |
| Idle Bottom * (°C) | 34.2 | 26.6 22% | 30.6 11% | 33 4% | 29.2 15% | 35.8 -5% |
* ... Moindre est la valeur, meilleures sont les performances
Test de stress
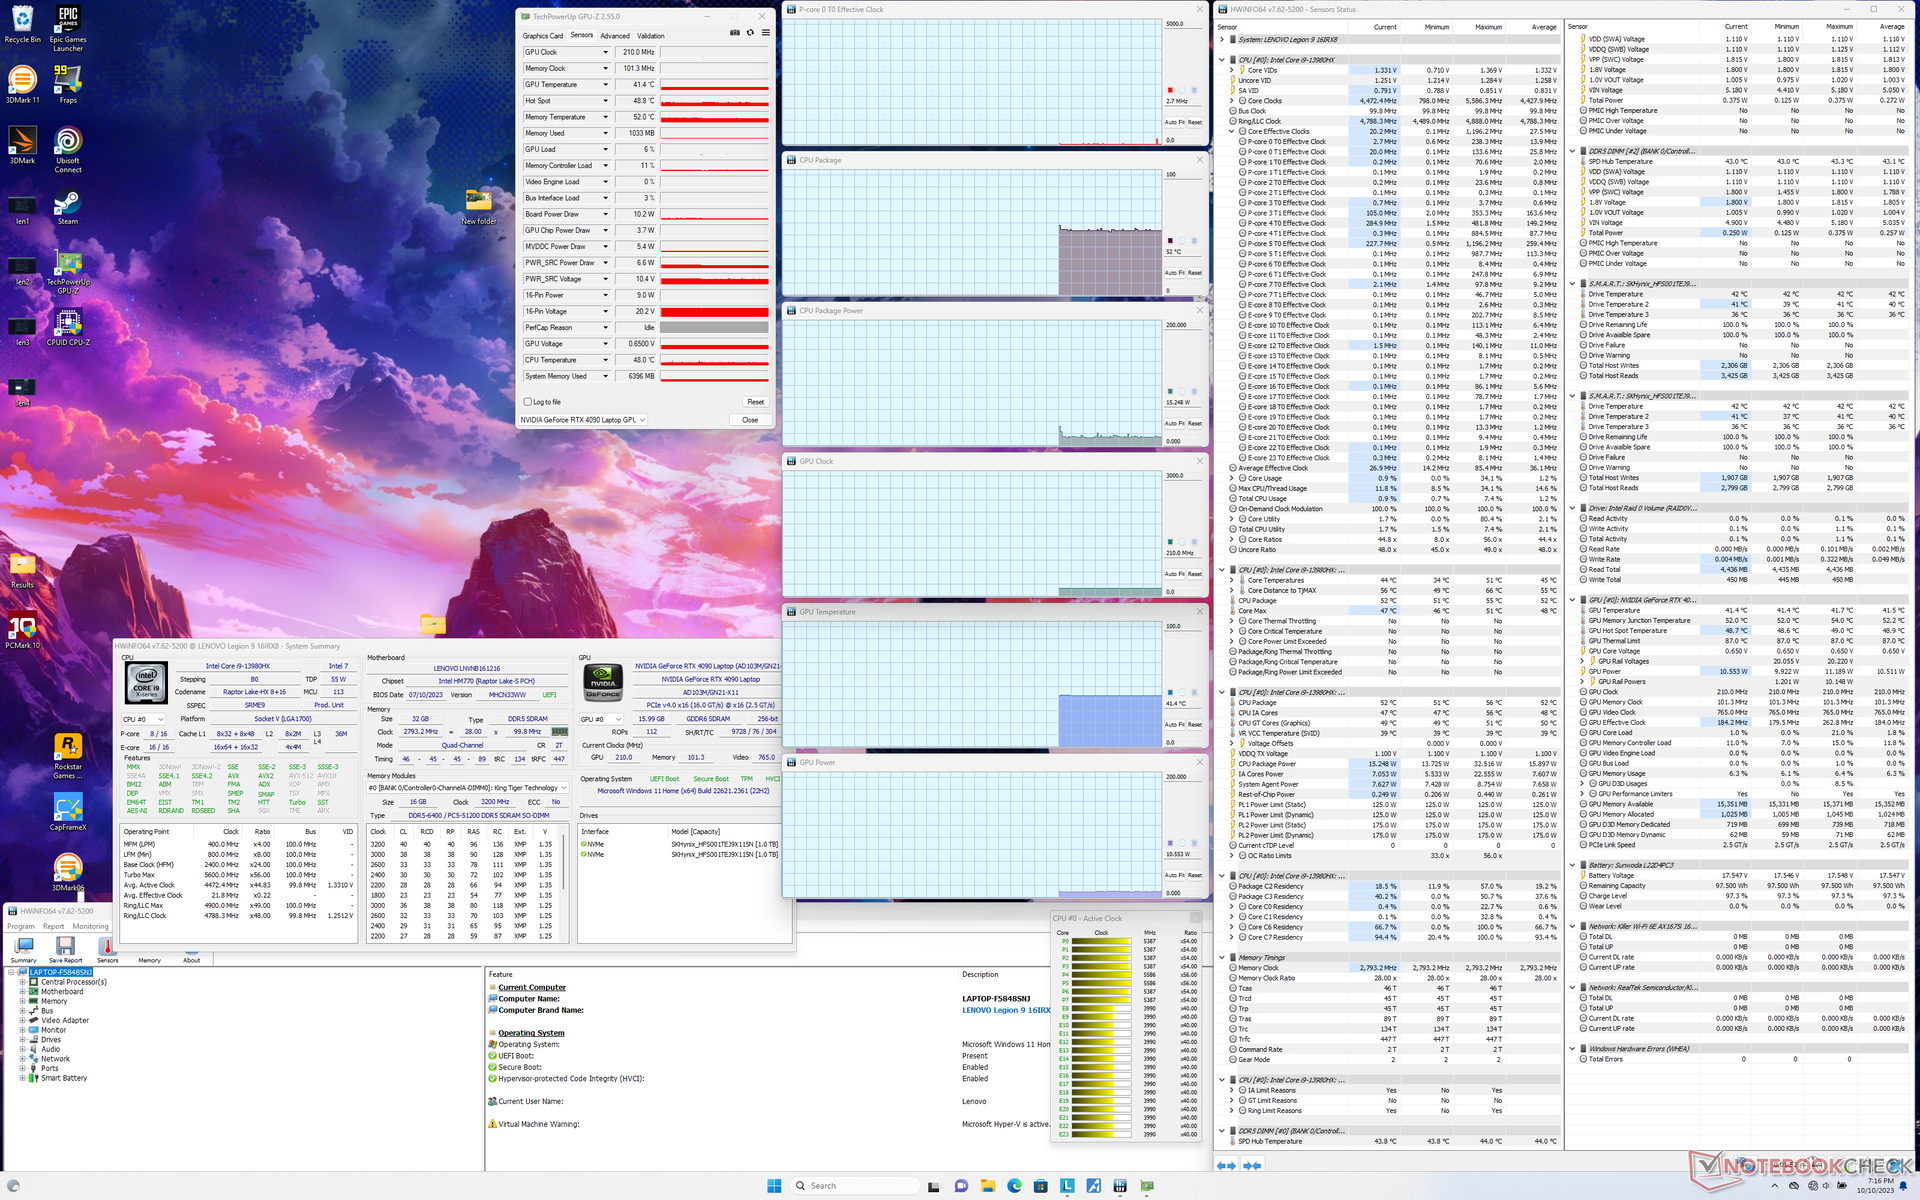
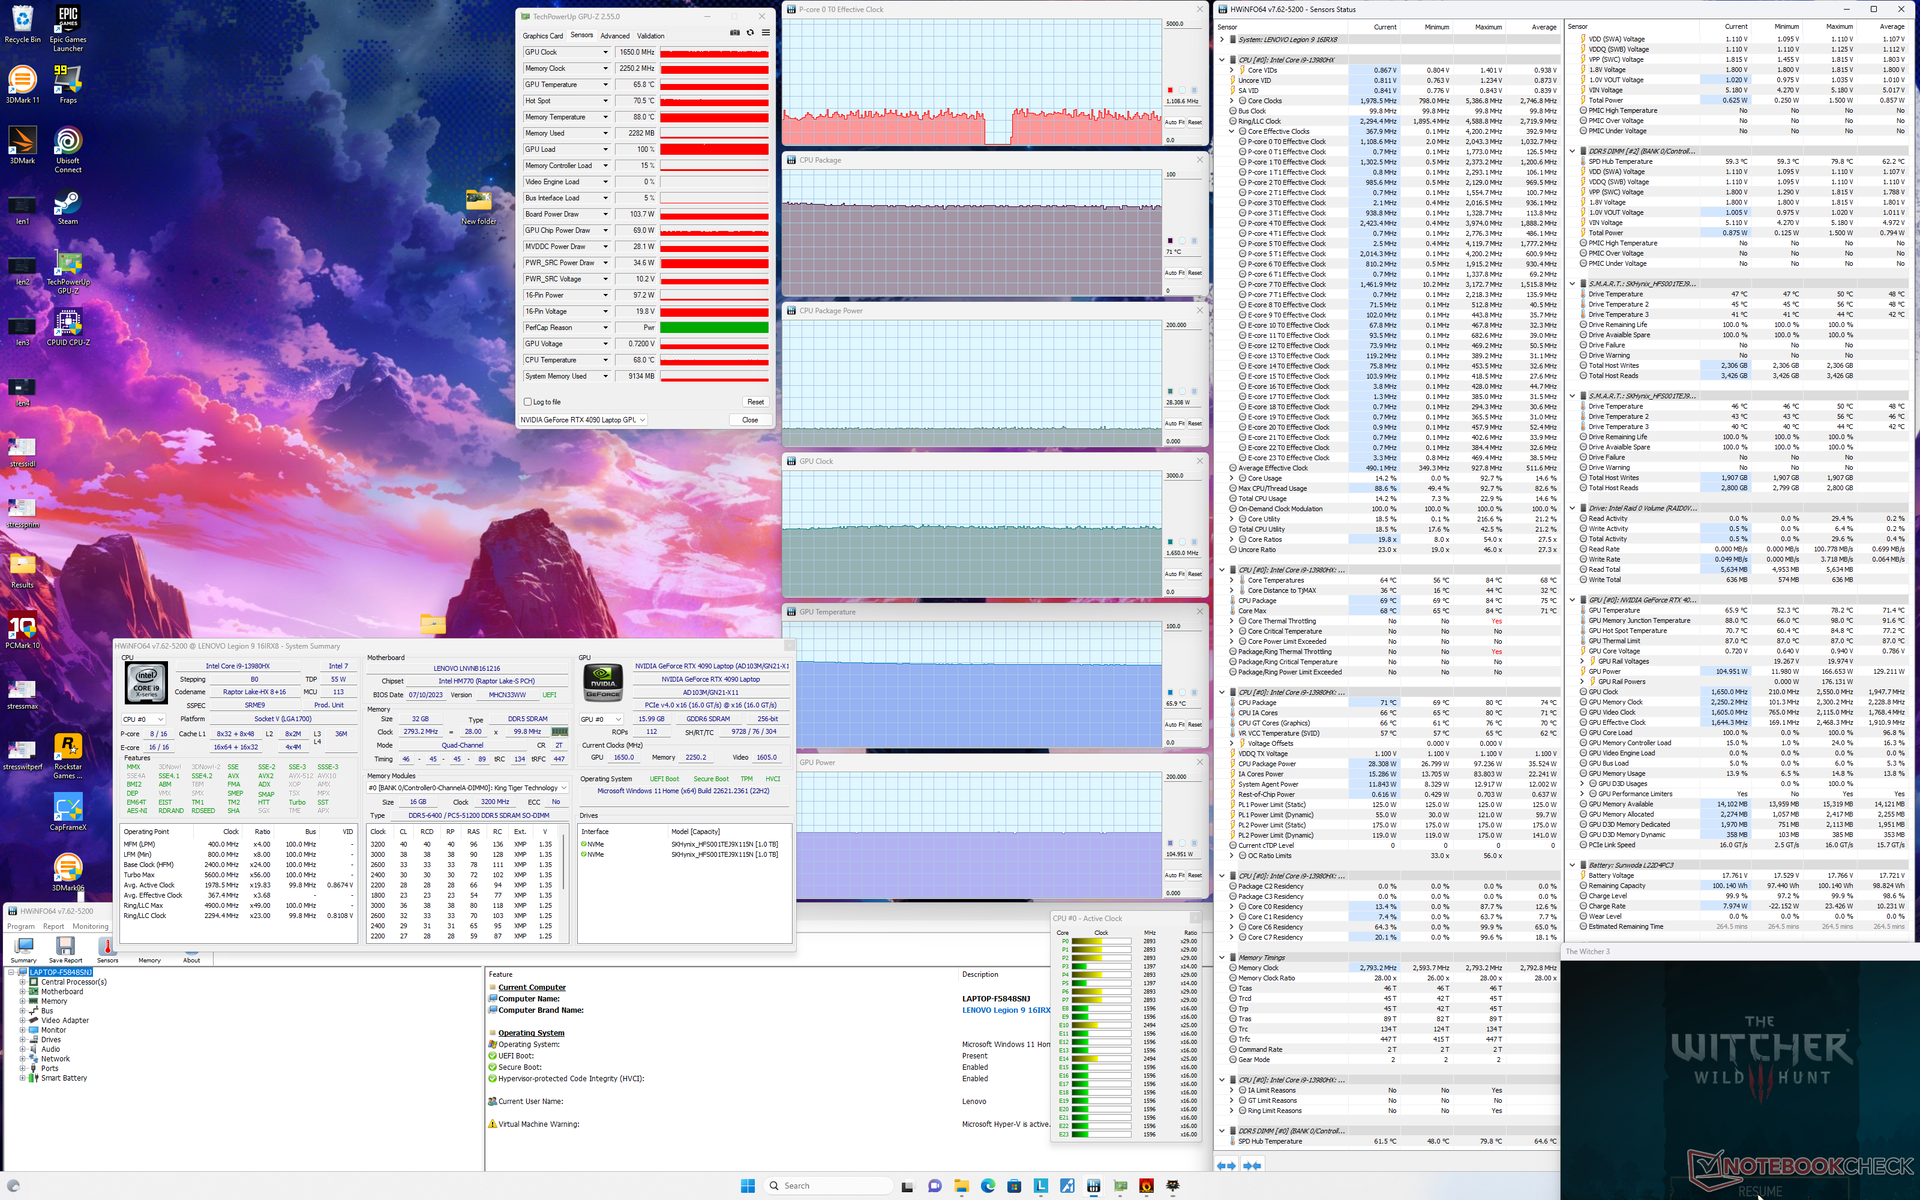
La fréquence d'horloge du processeur et la consommation d'énergie de la carte lors du lancement du test Prime95 atteignaient respectivement 3,6 GHz et 138 W, avant de redescendre et de se stabiliser à 3,0 GHz et 125 W après environ une minute de test. La température du cœur se stabilise à 83 °C, contre 100 °C pour le plus gros des modèles Alienware m18 R1 équipé du même Core i9-13980HX.
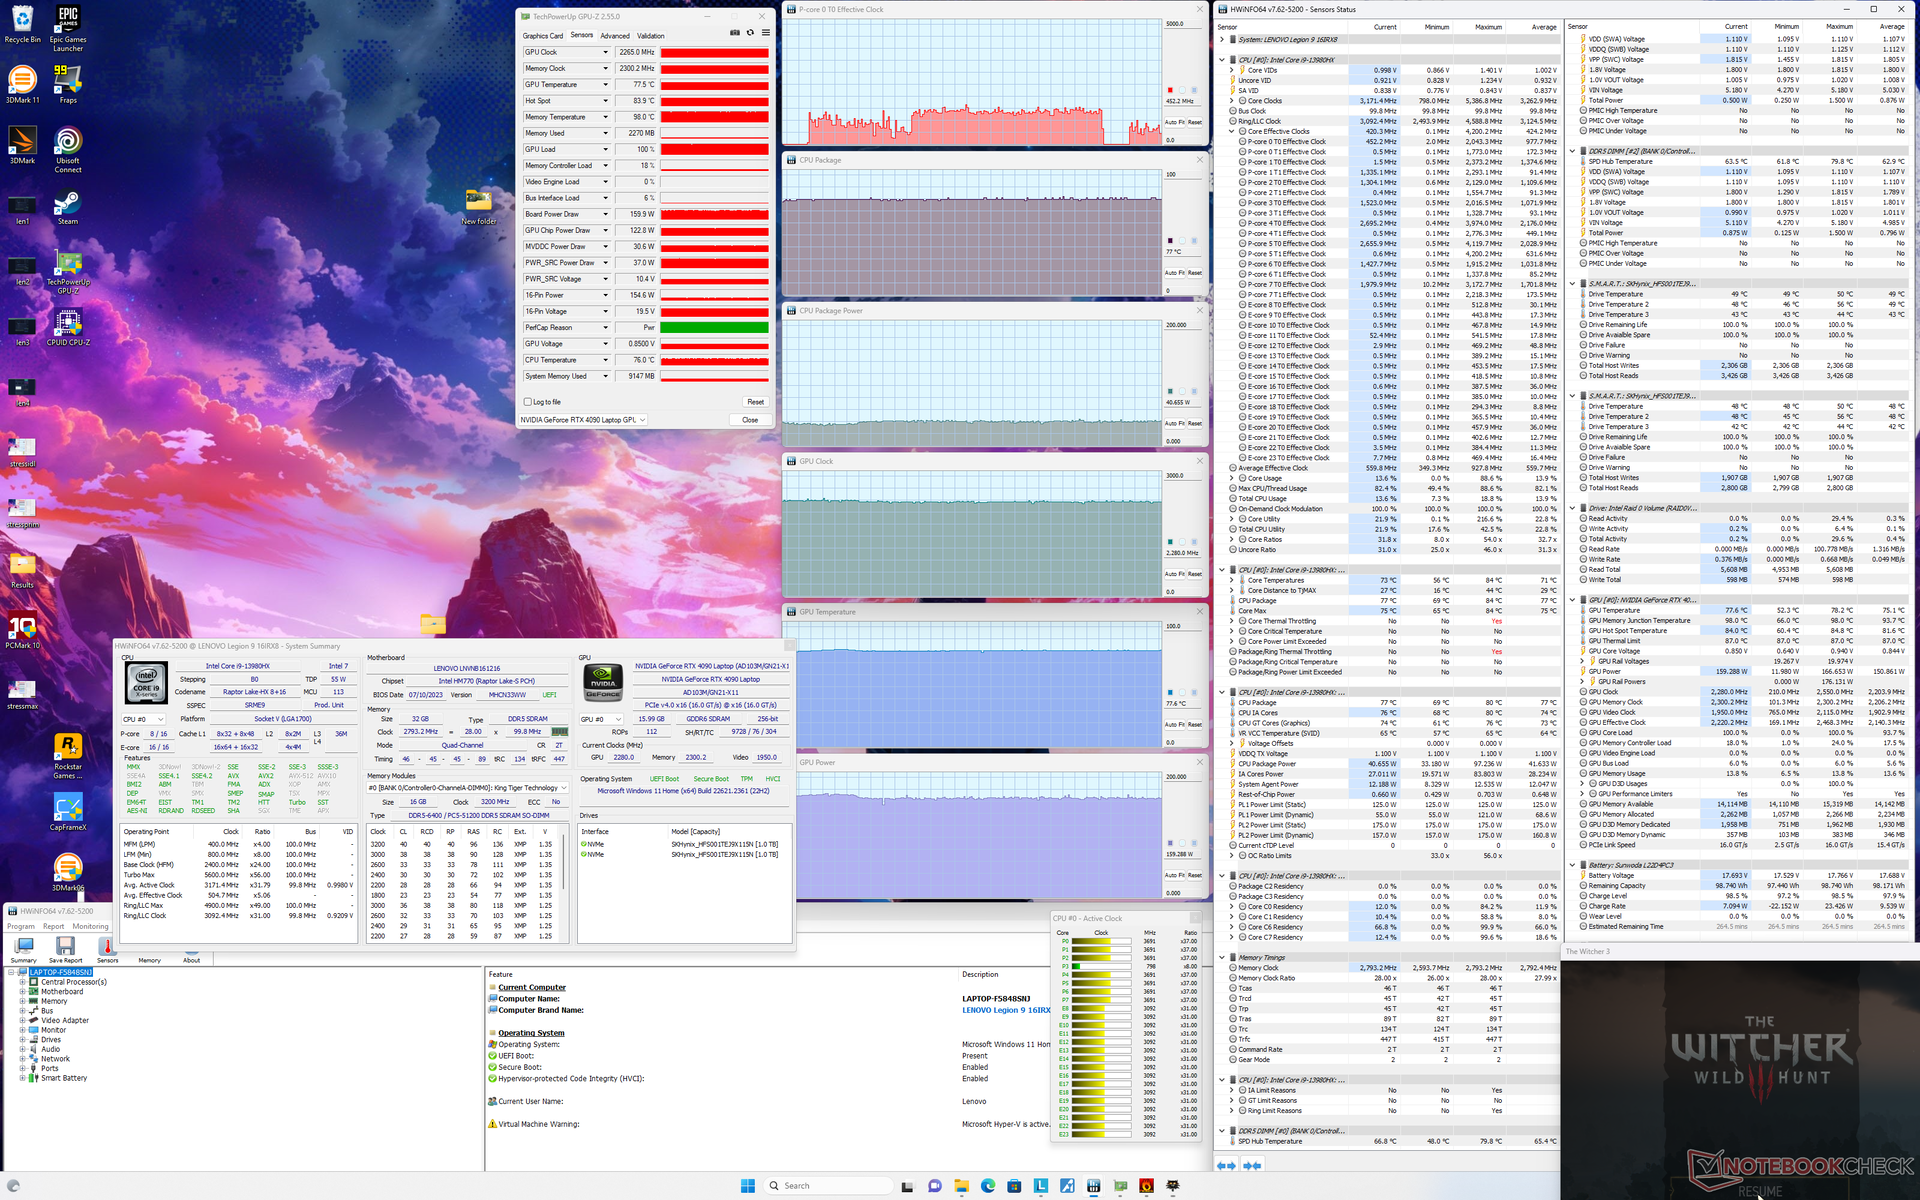
Les performances du GPU dépendent fortement du profil d'alimentation sélectionné, comme indiqué ci-dessus dans la section Performances du GPU. En mode Witcher 3 en mode Performance, par exemple, le GPU Nvidia se stabilise à 2265 MHz et 160 W contre seulement 1650 MHz et 104 W en mode Equilibré avec GPU Overclock désactivé. La température du GPU se stabilise à 78°C contre 71°C sur le Blade 16 avec le même GPU RTX 4090.
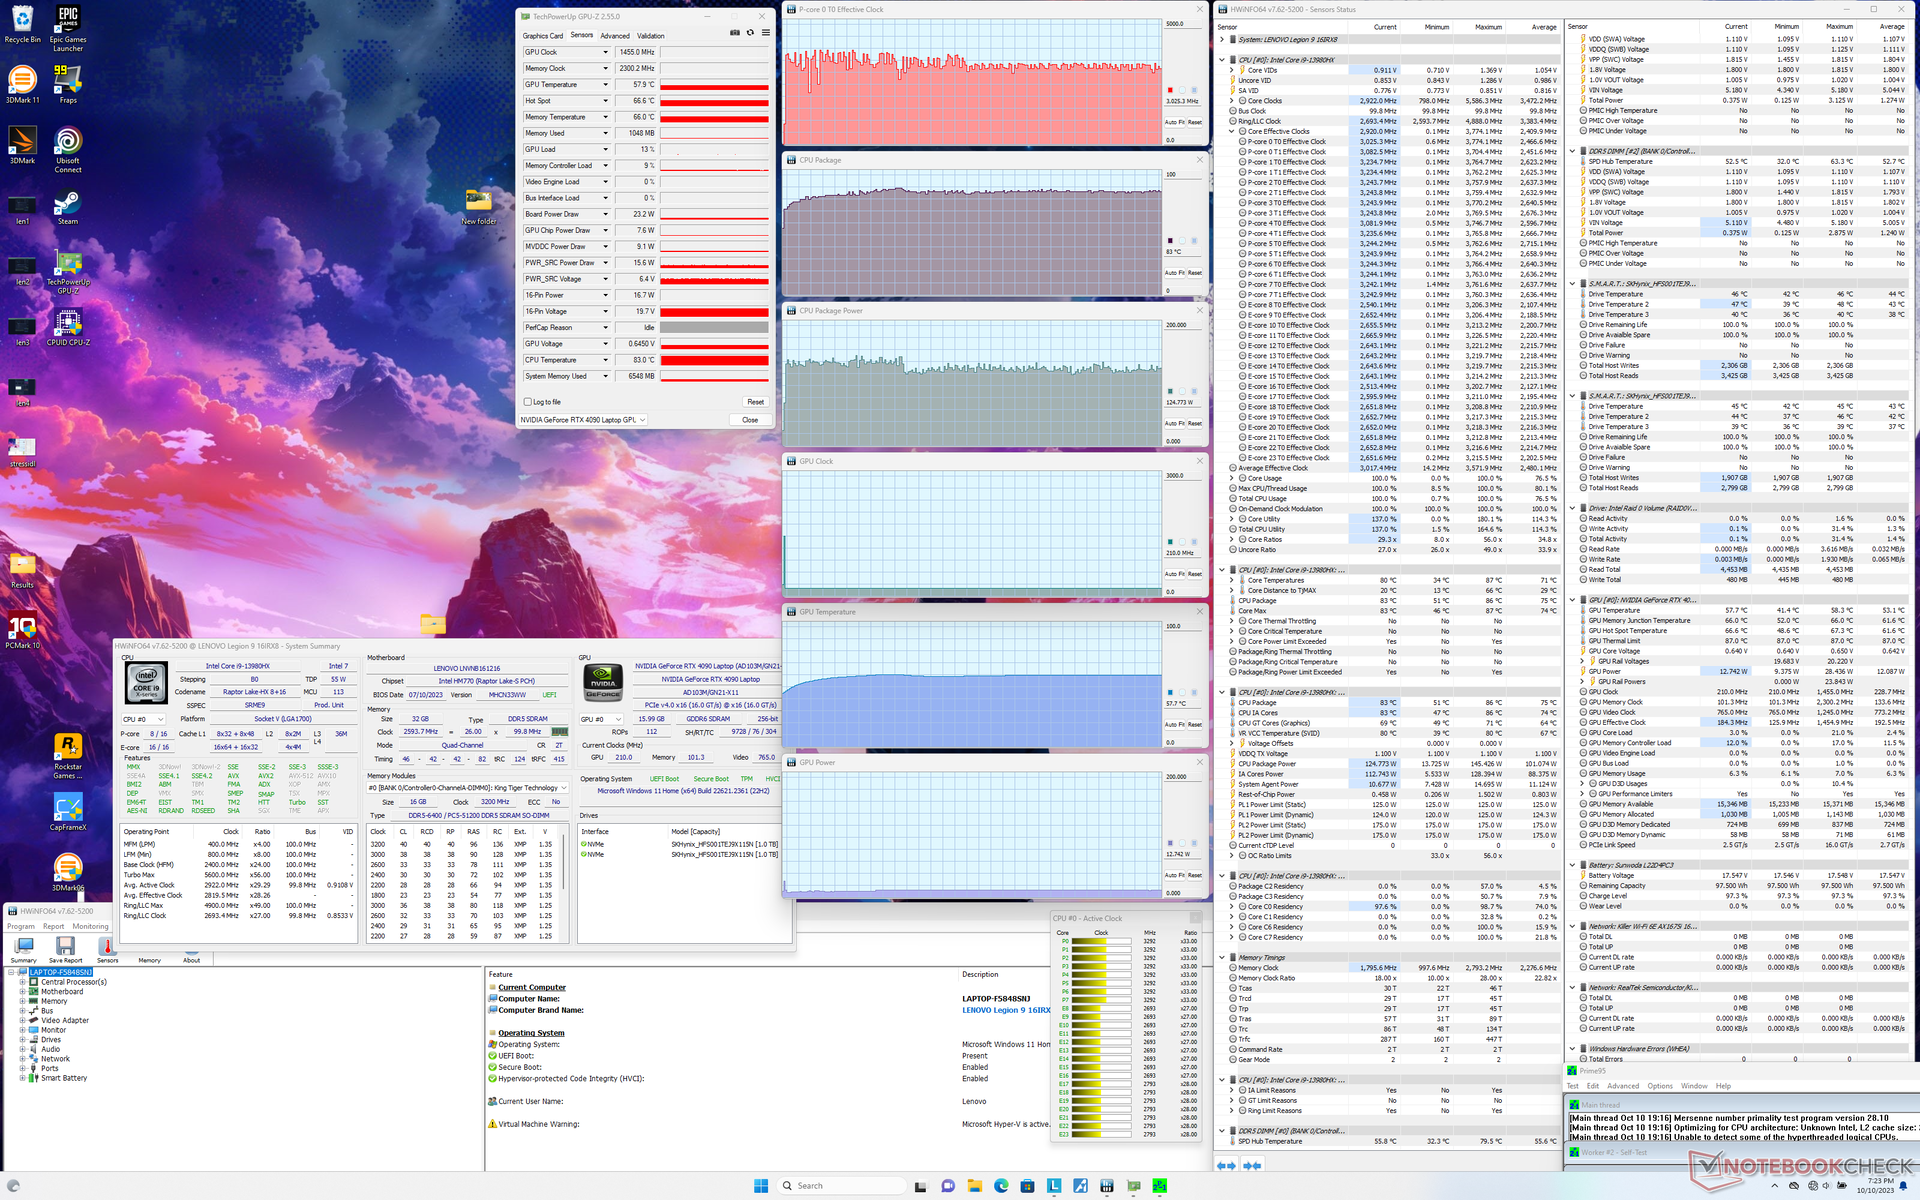
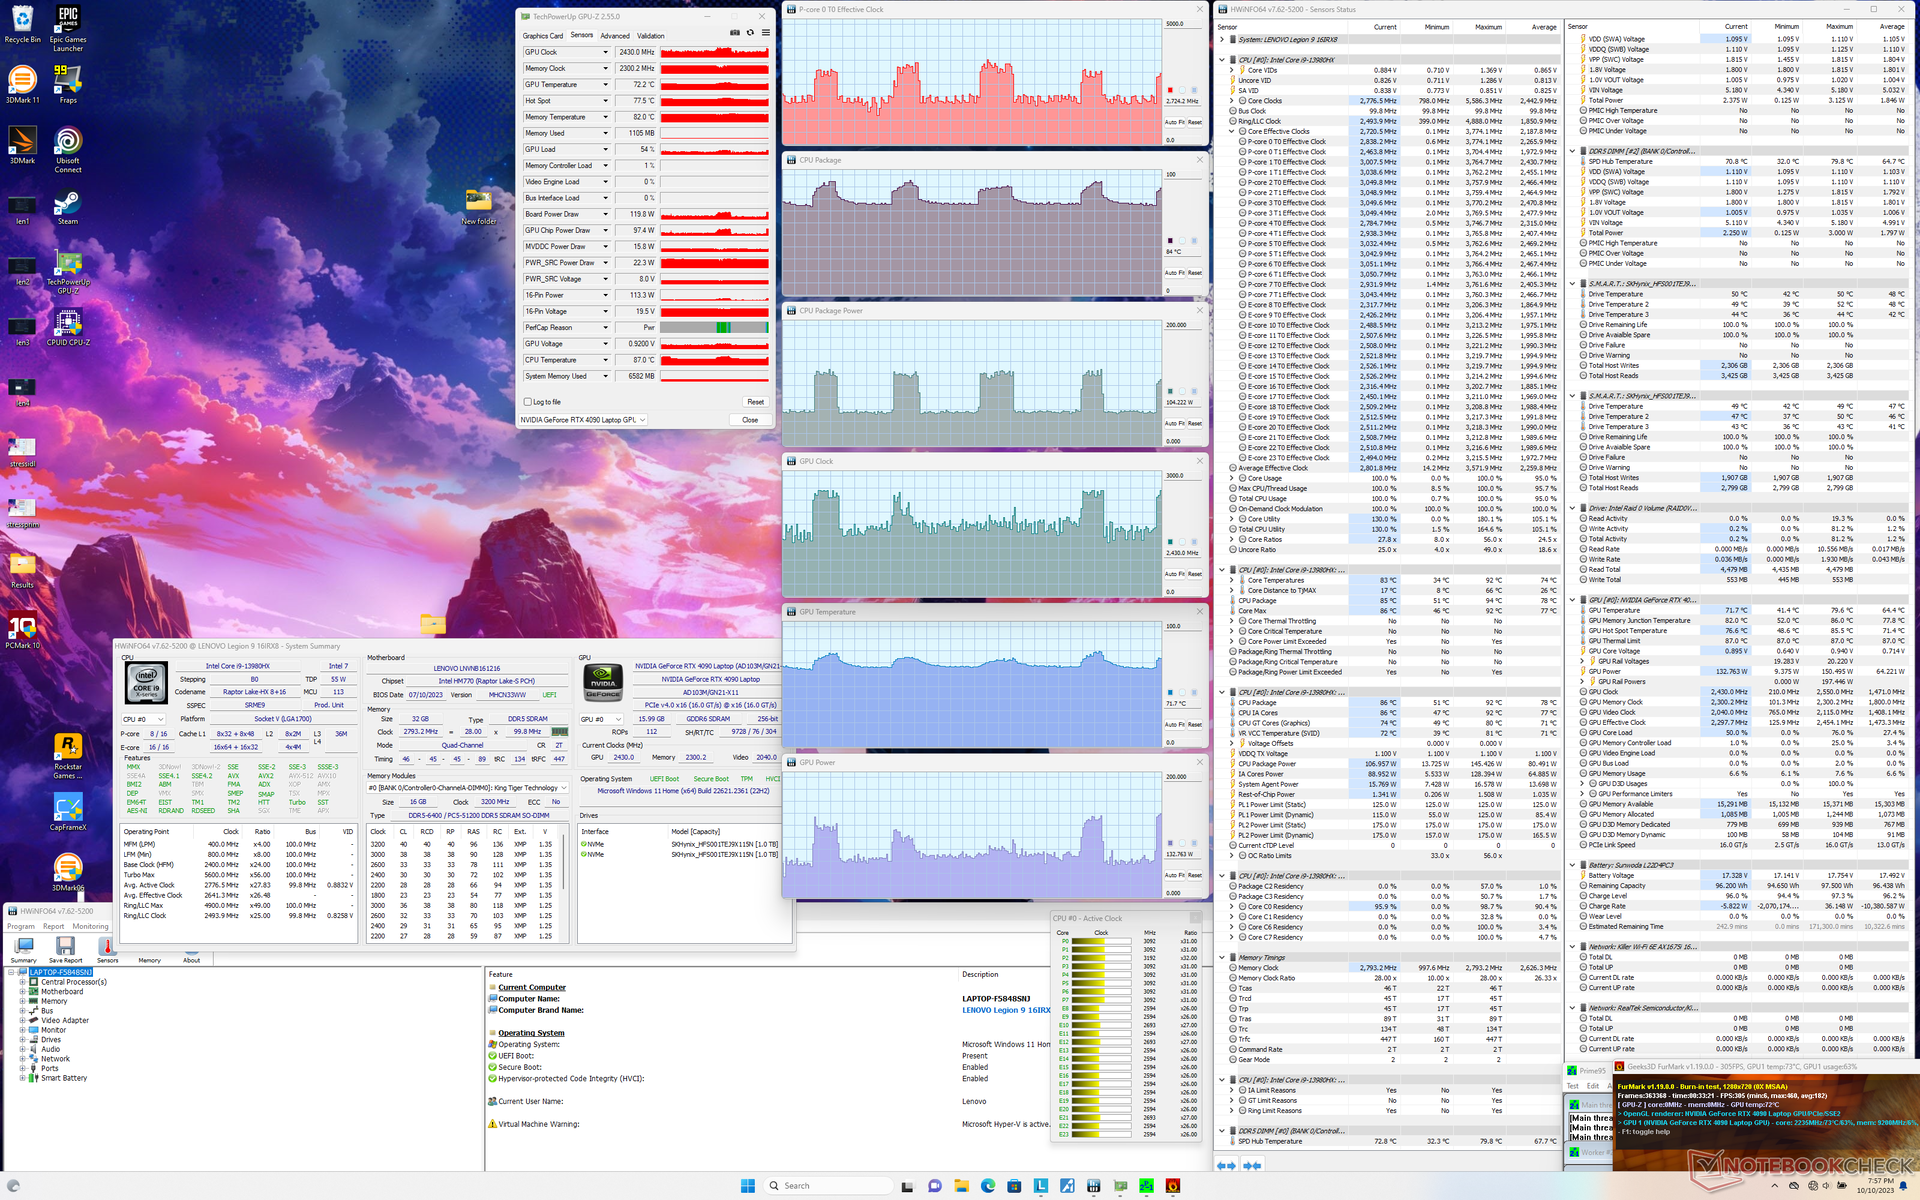
| Horloge du CPU (GHz) | Horloge du GPU (MHz) | Température moyenne du CPU (°C) | Température moyenne du GPU (°C) | |
| Système en veille | -- | -- | 52 | 41 |
| Prime95 Stress | 3.0 | -- | 83 | 58 |
| Prime95 + FurMark Stress | 1.6 - 3.4 | 1365 - 2535 | 74 - 86 | 72 - 78 |
| Witcher 3 Stress (mode équilibré avec GPU Overclock désactivé) | ~1.1 | 1650 | 71 | 66 |
| Witcher 3 Stress (mode Performance) | ~1.1 | 2265 | 77 | 78 |
Intervenants
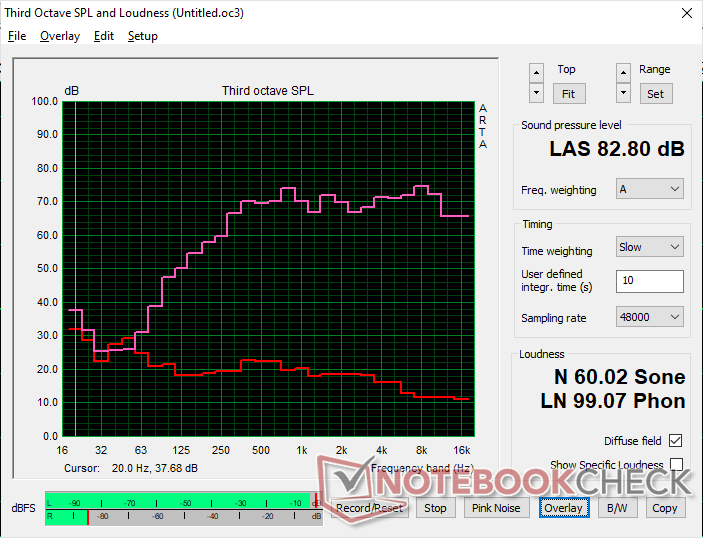
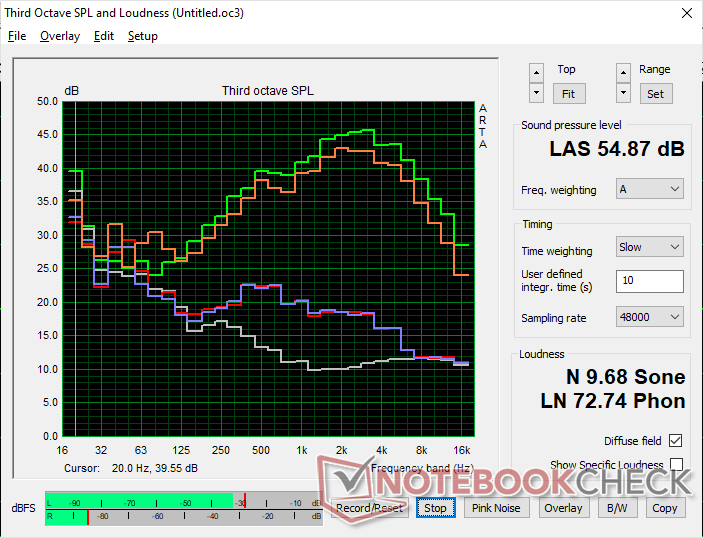
Lenovo Legion 9 16IRX8 analyse audio
(+) | les haut-parleurs peuvent jouer relativement fort (82.8# dB)
Basses 100 - 315 Hz
(±) | basse réduite - en moyenne 13.5% inférieure à la médiane
(±) | la linéarité des basses est moyenne (9% delta à la fréquence précédente)
Médiums 400 - 2000 Hz
(+) | médiane équilibrée - seulement 1.5% de la médiane
(+) | les médiums sont linéaires (5.7% delta à la fréquence précédente)
Aiguës 2 - 16 kHz
(+) | des sommets équilibrés - à seulement 2.4% de la médiane
(+) | les aigus sont linéaires (3.7% delta à la fréquence précédente)
Globalement 100 - 16 000 Hz
(+) | le son global est linéaire (11% différence à la médiane)
Par rapport à la même classe
» 7% de tous les appareils testés de cette catégorie étaient meilleurs, 3% similaires, 89% pires
» Le meilleur avait un delta de 6%, la moyenne était de 18%, le pire était de 132%.
Par rapport à tous les appareils testés
» 6% de tous les appareils testés étaient meilleurs, 2% similaires, 92% pires
» Le meilleur avait un delta de 4%, la moyenne était de 24%, le pire était de 134%.
Apple MacBook Pro 16 2021 M1 Pro analyse audio
(+) | les haut-parleurs peuvent jouer relativement fort (84.7# dB)
Basses 100 - 315 Hz
(+) | bonne basse - seulement 3.8% loin de la médiane
(+) | les basses sont linéaires (5.2% delta à la fréquence précédente)
Médiums 400 - 2000 Hz
(+) | médiane équilibrée - seulement 1.3% de la médiane
(+) | les médiums sont linéaires (2.1% delta à la fréquence précédente)
Aiguës 2 - 16 kHz
(+) | des sommets équilibrés - à seulement 1.9% de la médiane
(+) | les aigus sont linéaires (2.7% delta à la fréquence précédente)
Globalement 100 - 16 000 Hz
(+) | le son global est linéaire (4.6% différence à la médiane)
Par rapport à la même classe
» 0% de tous les appareils testés de cette catégorie étaient meilleurs, 0% similaires, 100% pires
» Le meilleur avait un delta de 5%, la moyenne était de 17%, le pire était de 45%.
Par rapport à tous les appareils testés
» 0% de tous les appareils testés étaient meilleurs, 0% similaires, 100% pires
» Le meilleur avait un delta de 4%, la moyenne était de 24%, le pire était de 134%.
Gestion de l'énergie
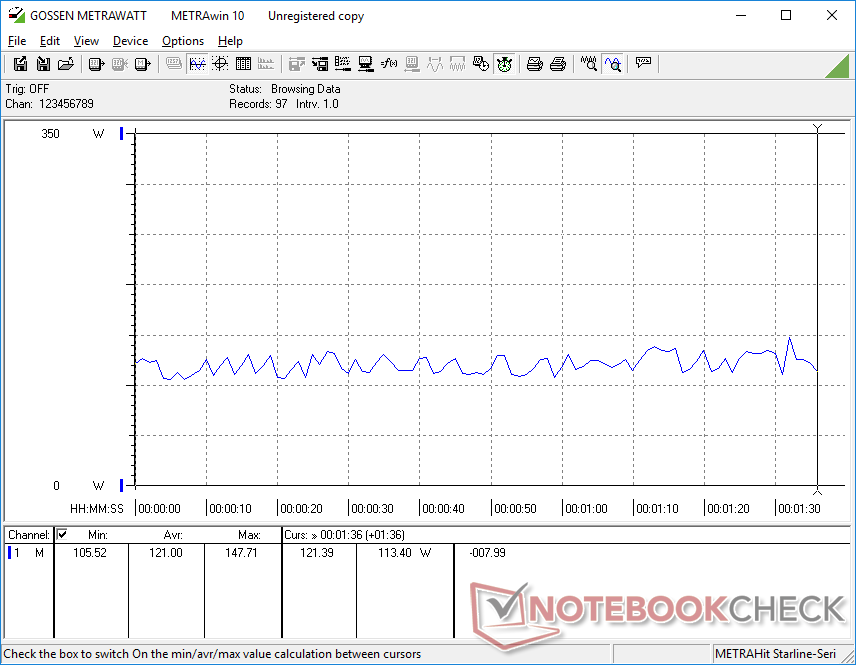
Consommation électrique
La consommation d'énergie est très élevée, quel que soit le réglage. En mode Power Saver iGPU et en réglant la luminosité au minimum, l'ordinateur de bureau consomme 32 W, contre 9 à 10 W pour le Legion Slim 5 16 ou le Asus ROG Strix G16, tous deux dotés d'une dalle IPS. La consommation ne dépend pas seulement de la luminosité, mais aussi de la couleur, comme c'est le cas avec un écran OLED. Un écran entièrement blanc sur notre Legion 9i 16, par exemple, demanderait environ 13 W de plus qu'un écran entièrement noir, même en réglant la luminosité au maximum pour les deux couleurs. Les panneaux IPS ne demanderaient que quelques watts au maximum, quelle que soit la couleur en comparaison.
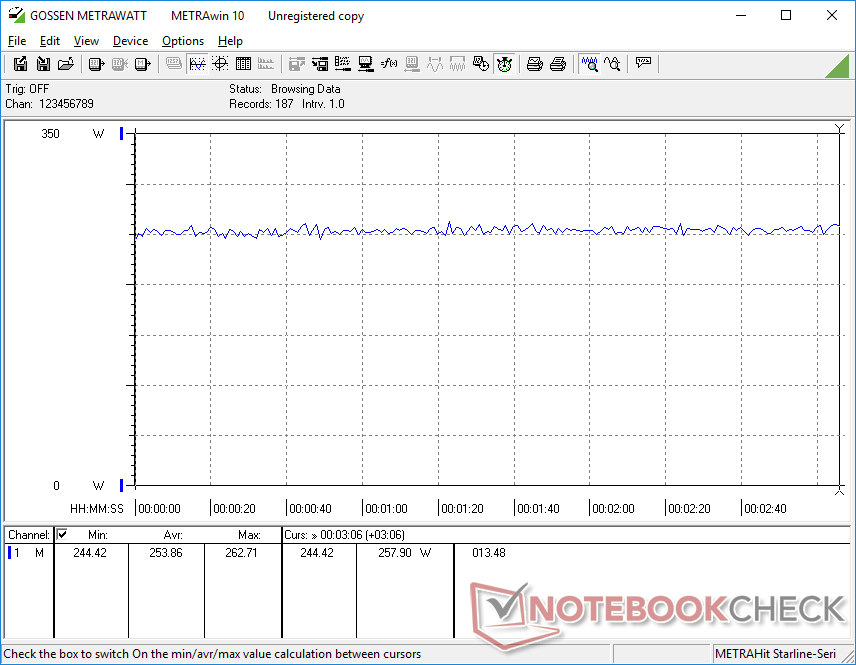
L'exécution de Prime95 sur un moniteur externe montre des niveaux de consommation très similaires entre notre unité Lenovo et le Asus ROG Strix Scar 17 alimenté par le Ryzen 9 7945HX concurrent, comme le montrent les graphiques de comparaison ci-dessous. Les performances par watt sont néanmoins toujours en faveur d'AMD puisque le Ryzen 9 7945HX devance notre Core i9-13980HX dans les charges de travail multithreads malgré une consommation similaire.
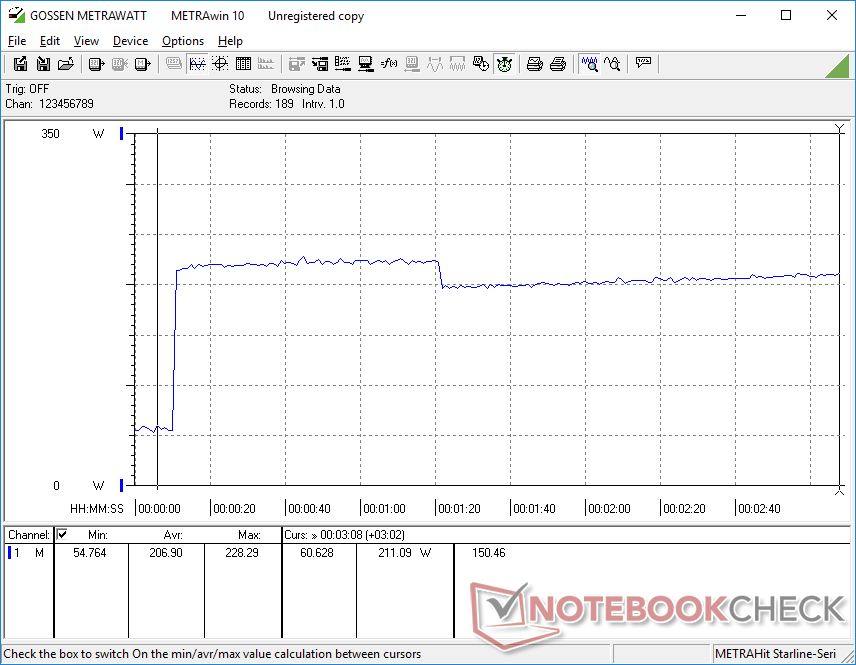
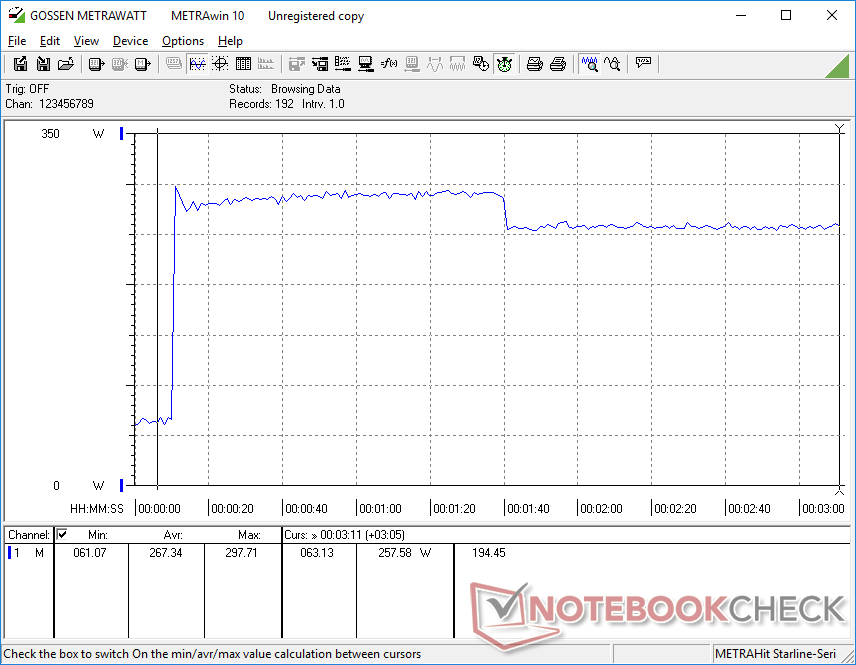
La consommation dans les jeux est légèrement plus élevée d'environ 10 % par rapport à l'Asus ROG Strix Scar 17 Asus ROG Strix Scar 17 SE équipée de l'ancienne RTX 3080 Ti. Cependant, l'augmentation de 40 à 75 % des performances graphiques avec notre RTX 4090 compense largement la faible augmentation de la consommation. Les très hautes performances par watt de la série mobile Ada Lovelace sont impressionnantes et inégalées à l'heure actuelle.
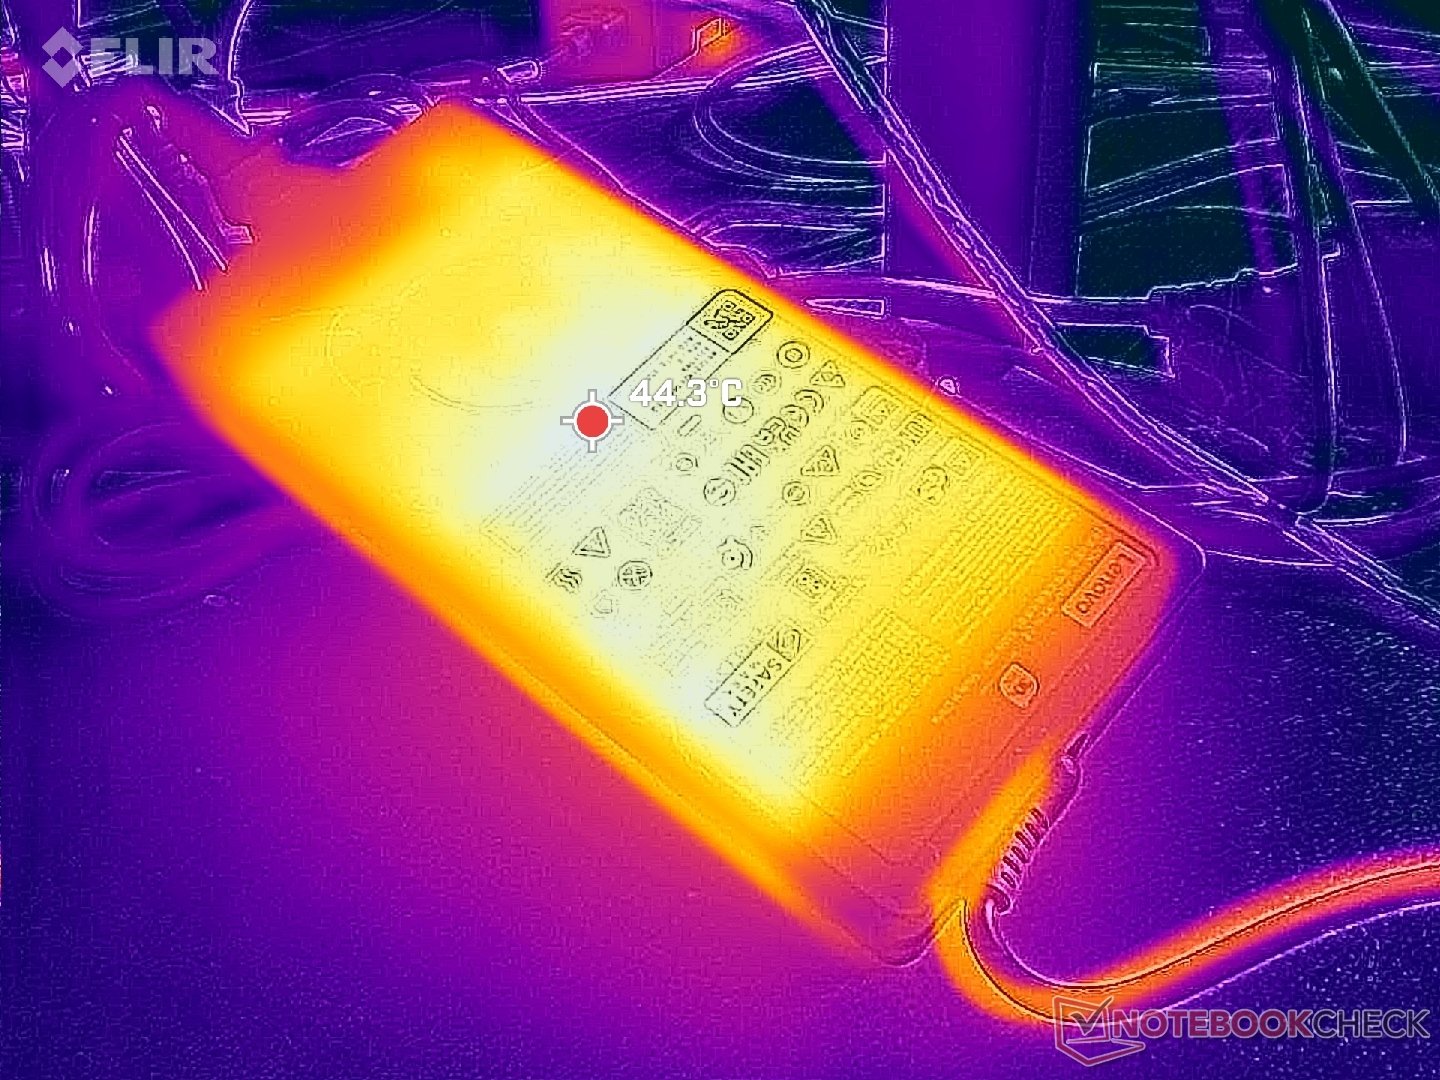
Nous avons pu mesurer une consommation maximale de 298 W sur l'adaptateur secteur de taille moyenne (18,5 x 2,6 x 8,3 cm) de 330 W lorsque le CPU et le GPU sont tous deux utilisés à 100 %. Ce taux n'est que temporaire en raison des limitations thermiques.
| Éteint/en veille | |
| Au repos | |
| Fortement sollicité |
|
Légende:
min: | |
| Lenovo Legion 9 16IRX8 i9-13980HX, GeForce RTX 4090 Laptop GPU, 2x SK Hynix HFS001TEJ9X115N (RAID 0), Mini-LED, 3200x2000, 16" | Lenovo Legion Slim 5 16APH8 R7 7840HS, GeForce RTX 4060 Laptop GPU, SK hynix PC801 HFS512GEJ9X115N, IPS, 2560x1600, 16" | Razer Blade 16 Early 2023 RTX 4090 i9-13950HX, GeForce RTX 4090 Laptop GPU, SSSTC CA6-8D1024, mini-LED, 3840x2400, 16" | Asus ROG Strix G16 G614JZ i9-13980HX, GeForce RTX 4080 Laptop GPU, WD PC SN560 SDDPNQE-1T00, IPS, 2560x1600, 16" | HP Omen Transcend 16 i9-13900HX, GeForce RTX 4070 Laptop GPU, SK hynix PC801 HFS002TEJ9X101N, Mini-LED, 2560x1600, 16" | Alienware x16 R1 i9-13900HK, GeForce RTX 4080 Laptop GPU, SK hynix PC801 HFS001TEJ9X101N, IPS, 2560x1600, 16" | |
|---|---|---|---|---|---|---|
| Power Consumption | 53% | 9% | 28% | 18% | 12% | |
| Idle Minimum * (Watt) | 32.3 | 9.4 71% | 27.5 15% | 10 69% | 19.2 41% | 25.2 22% |
| Idle Average * (Watt) | 42.6 | 15.5 64% | 34.4 19% | 16 62% | 22.7 47% | 29.9 30% |
| Idle Maximum * (Watt) | 57.9 | 24.4 58% | 35.4 39% | 27 53% | 55.4 4% | 49.8 14% |
| Load Average * (Watt) | 121 | 74.1 39% | 147.8 -22% | 129 -7% | 128.4 -6% | 105.4 13% |
| Witcher 3 ultra * (Watt) | 254 | 112.9 56% | 256 -1% | 247 3% | 206 19% | 263 -4% |
| Load Maximum * (Watt) | 297.7 | 206.5 31% | 286.7 4% | 342 -15% | 292 2% | 313.8 -5% |
* ... Moindre est la valeur, meilleures sont les performances
Power Consumption Witcher 3 / Stresstest
Power Consumption external Monitor
Autonomie de la batterie
Les durées d'exécution sont médiocres, ce qui est en corrélation avec les chiffres de consommation d'énergie élevés ci-dessus. Nous n'avons pu naviguer sur Internet que pendant 160 minutes, même en mode iGPU équilibré. D'autres ordinateurs portables à mini-LED, comme le HP Omen Transcend 16ont également des durées d'utilisation très courtes malgré leur batterie de plus de 90 Wh.
Le chargement est au moins très rapide : environ une heure lorsque la fonction Lenovo Rapid Charge est activée, contre 90 minutes ou plus sur la plupart des autres ordinateurs portables de jeu. Les adaptateurs USB-C tiers peuvent également charger le système, mais à un rythme plus lent et avec une compatibilité non garantie.
| Lenovo Legion 9 16IRX8 i9-13980HX, GeForce RTX 4090 Laptop GPU, 99.9 Wh | Lenovo Legion Slim 5 16APH8 R7 7840HS, GeForce RTX 4060 Laptop GPU, 80 Wh | Razer Blade 16 Early 2023 RTX 4090 i9-13950HX, GeForce RTX 4090 Laptop GPU, 95.2 Wh | Asus ROG Strix G16 G614JZ i9-13980HX, GeForce RTX 4080 Laptop GPU, 90 Wh | HP Omen Transcend 16 i9-13900HX, GeForce RTX 4070 Laptop GPU, 97 Wh | Alienware x16 R1 i9-13900HK, GeForce RTX 4080 Laptop GPU, 90 Wh | |
|---|---|---|---|---|---|---|
| Autonomie de la batterie | 86% | 78% | 135% | 23% | -9% | |
| Reader / Idle (h) | 6.7 | 11.7 75% | 6.3 -6% | 7.3 9% | ||
| WiFi v1.3 (h) | 2.7 | 7.1 163% | 5.8 115% | 9.7 259% | 4.2 56% | 2.5 -7% |
| Load (h) | 1 | 1.2 20% | 1.4 40% | 1.1 10% | 1.2 20% | 0.7 -30% |
| H.264 (h) | 8.4 | |||||
| Witcher 3 ultra (h) | 1.6 |
Points positifs
Points négatifs
Verdict - Le meilleur Legion que l'on puisse acheter
Si vous êtes à la recherche d'un processeur Core i9, d'un GPU RTX 4090 et d'un écran mini-LED, le Legion 9i 16 mérite d'être considéré. Comparé à d'autres ordinateurs portables de jeu à écran mini-LED comme le HP Omen Transcend 16, Razer Blade 16ou le Asus Zephyrus M16le Lenovo offre des graphiques plus rapides que le HP, des prix plus bas que le Razer, et une résolution native plus élevée que l'Asus. Les spécifications et le design physique de cette tablette constituent un bon pas en avant par rapport à l'excellente tablette de la série Legion Série Pro 7.
Toutes les améliorations ont naturellement conduit à un châssis plus grand et plus lourd. Si vous souhaitez bénéficier des caractéristiques du processeur et de l'écran du Lenovo, mais dans un format plus portable, le Blade 16, plus onéreux, pourrait être intéressant. Le refroidissement liquide intégré semble intéressant sur le papier, mais il ne semble pas avoir apporté un design plus léger, plus silencieux ou même plus froid. Attendez-vous à ce que le Lenovo fonctionne aussi bruyamment que la plupart des autres ordinateurs portables de jeu dans la même catégorie de taille.
Le Legion 9i 16 dispose de toutes les caractéristiques techniques et d'un nouveau look que les passionnés peuvent apprécier, tant que vous pouvez oublier la faible autonomie de la batterie et le châssis relativement grand.
Vous devrez vraiment vouloir le mini-LED si vous voulez le Legion 9 16 car il n'offre pas d'autres options d'affichage, pour le meilleur ou pour le pire. Le mini-LED est à son meilleur lorsque le HDR est activé pour exploiter sa luminosité maximale de 1000 nits. Sinon, l'écran est très gourmand en batterie et n'offre pas d'autres avantages majeurs par rapport à des écrans moins coûteux comme l'IPS ou l'OLED.
Prix et disponibilité
Lenovo expédie maintenant son modèle Legion 9i Gen 8 à partir de 3420 USD s'il est configuré avec la GeForce RTX 4080 jusqu'à 4000 USD s'il est entièrement configuré avec la RTX 4090 et de l'espace de stockage supplémentaire.
Lenovo Legion 9 16IRX8
- 10/15/2023 v7 (old)
Allen Ngo
Transparency
La sélection des appareils à examiner est effectuée par notre équipe éditoriale. L'échantillon de test a été prêté à l'auteur par le fabricant ou le détaillant pour les besoins de cet examen. Le prêteur n'a pas eu d'influence sur cette évaluation et le fabricant n'a pas reçu de copie de cette évaluation avant sa publication. Il n'y avait aucune obligation de publier cet article. En tant que média indépendant, Notebookcheck n'est pas soumis à l'autorité des fabricants, des détaillants ou des éditeurs.
Voici comment Notebookcheck teste
Chaque année, Notebookcheck examine de manière indépendante des centaines d'ordinateurs portables et de smartphones en utilisant des procédures standardisées afin de garantir que tous les résultats sont comparables. Nous avons continuellement développé nos méthodes de test depuis environ 20 ans et avons établi des normes industrielles dans le processus. Dans nos laboratoires de test, des équipements de mesure de haute qualité sont utilisés par des techniciens et des rédacteurs expérimentés. Ces tests impliquent un processus de validation en plusieurs étapes. Notre système d'évaluation complexe repose sur des centaines de mesures et de points de référence bien fondés, ce qui garantit l'objectivité.Price comparison

