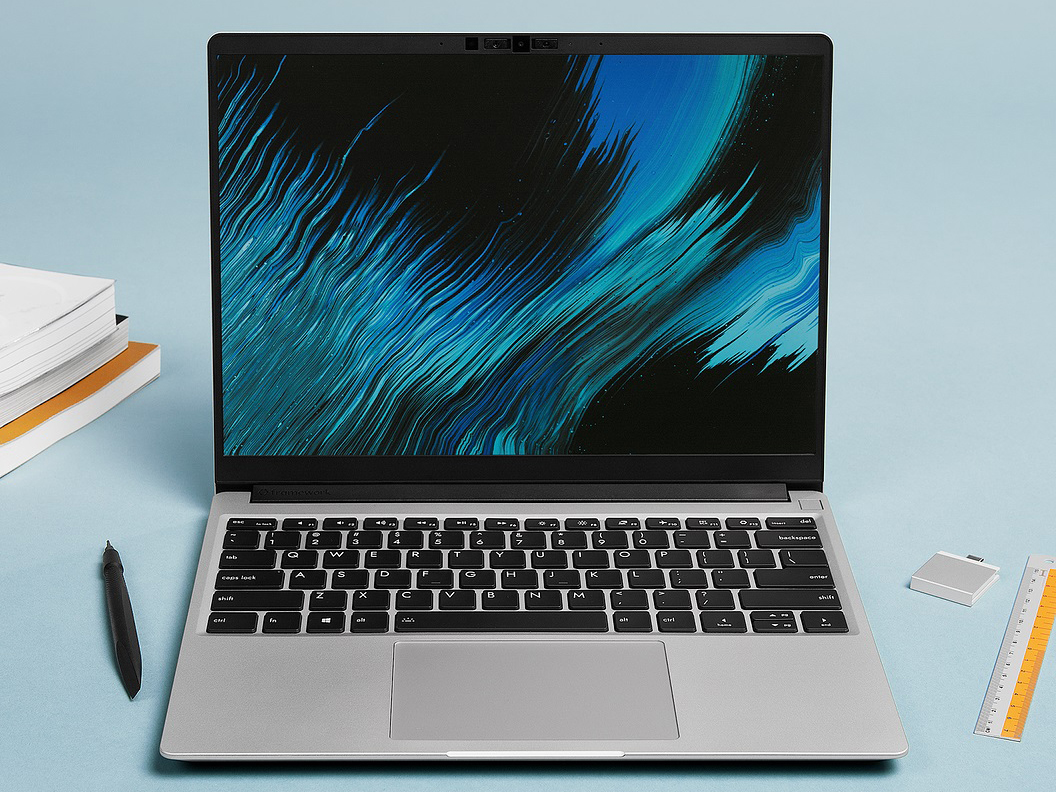
Test du Framework 13.5 Ryzen 7 7840U : bien meilleur que la version Intel

Les utilisateurs réclament une version AMD du Framework Laptop DIY-friendly depuis son introduction en 2021. Les processeurs Ryzen devenant de plus en plus compétitifs par rapport à Intel chaque année, le moment est idéal pour lancer le premier Framework Laptop d'AMD.
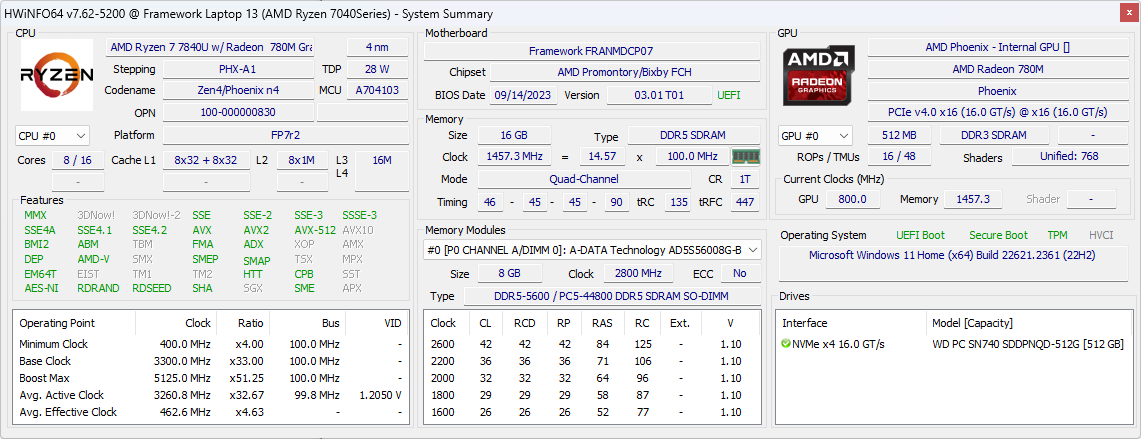
Notre modèle d'essai est une configuration haut de gamme avec le Ryzen 7 7840U pour un peu moins de 1500 USD, tandis que des options bas de gamme sont disponibles avec le Ryzen 5 7640U. Le Framework Laptop 13.5 est l'un des premiers sur le marché à être livré avec le Ryzen 7 7840U.
Nous vous recommandons de consulter nos critiques et vidéos et vidéos sur le Framework Laptop pour plus de détails sur ses caractéristiques physiques puisque le design reste inchangé.
Les concurrents du Framework Laptop 13.5 incluent d'autres subnotebooks phares comme leLenovo ThinkPad X1 Nano Gen 3, HP Dragonfly G4,Dell XPS 13 Plus 9320ou le Asus ZenBook S13.
Plus d'avis sur le cadre :
Comparaison avec les concurrents potentiels
Note | Date | Modèle | Poids | Épaisseur | Taille | Résolution | Prix |
|---|---|---|---|---|---|---|---|
| 87.5 % v7 (old) | 10/23 | Framework Laptop 13.5 Ryzen 7 7840U R7 7840U, Radeon 780M | 1.3 kg | 15.85 mm | 13.50" | 2256x1504 | |
| 85.4 % v7 (old) | 07/21 | Framework Laptop 13.5 i7-1165G7, Iris Xe G7 96EUs | 1.3 kg | 15.85 mm | 13.50" | 2256x1504 | |
| 89.5 % v7 (old) | 08/23 | Lenovo ThinkPad X1 Nano Gen 3 i7-1360P, Iris Xe G7 96EUs | 989 g | 14.8 mm | 13.00" | 2160x1350 | |
| 91.9 % v7 (old) | 07/23 | HP Dragonfly G4 i7-1365U, Iris Xe G7 96EUs | 1.1 kg | 16.3 mm | 13.50" | 1920x1280 | |
| 87.4 % v7 (old) | 07/23 | Dell XPS 13 Plus 9320 Core i7-1360P i7-1360P, Iris Xe G7 96EUs | 1.3 kg | 15.3 mm | 13.40" | 3456x2160 | |
| 85.4 % v7 (old) | 05/23 | Asus ZenBook S13 OLED UX5304 i7-1355U, Iris Xe G7 96EUs | 1 kg | 11.8 mm | 13.30" | 2880x1800 |
Cas
Connectivité
Si les quatre ports USB-C sont toujours présents, les détails sont compliqués car la prise en charge de Thunderbolt est plus nébuleuse parmi les PC AMD. Seuls les deux ports arrière supportent l'USB4, tandis que le port inférieur gauche est uniquement USB-C 3.2 et le port inférieur droit est USB-C 3.2 avec DisplayPort. Nous pouvons le confirmer nous-mêmes puisque notre moniteur externe ne fonctionnait que sur trois des quatre ports USB-C. Le chargement peut être effectué sur n'importe lequel des quatre ports.
Les périphériques Thunderbolt sont pris en charge sur les deux ports USB-C situés à l'arrière.
Communication
Le modèle AMD est livré avec un MediaTek RZ616 pour la prise en charge du Wi-Fi 6E et du Bluetooth 5.2 à la place des habituels Intel AX210 ou AX211. Les taux de transfert sont néanmoins excellents, mais ils auraient pu être un peu plus réguliers.
| Networking | |
| iperf3 transmit AX12 | |
| Framework Laptop 13.5 | |
| iperf3 receive AX12 | |
| Framework Laptop 13.5 | |
| iperf3 transmit AXE11000 | |
| Asus ZenBook S13 OLED UX5304 | |
| Framework Laptop 13.5 Ryzen 7 7840U | |
| Lenovo ThinkPad X1 Nano Gen 3 | |
| Dell XPS 13 Plus 9320 Core i7-1360P | |
| HP Dragonfly G4 | |
| iperf3 receive AXE11000 | |
| Asus ZenBook S13 OLED UX5304 | |
| Framework Laptop 13.5 Ryzen 7 7840U | |
| Lenovo ThinkPad X1 Nano Gen 3 | |
| Dell XPS 13 Plus 9320 Core i7-1360P | |
| HP Dragonfly G4 | |
| iperf3 transmit AXE11000 6GHz | |
| Framework Laptop 13.5 Ryzen 7 7840U | |
| Lenovo ThinkPad X1 Nano Gen 3 | |
| HP Dragonfly G4 | |
| Dell XPS 13 Plus 9320 Core i7-1360P | |
| iperf3 receive AXE11000 6GHz | |
| Lenovo ThinkPad X1 Nano Gen 3 | |
| Framework Laptop 13.5 Ryzen 7 7840U | |
| HP Dragonfly G4 | |
| Dell XPS 13 Plus 9320 Core i7-1360P | |
Webcam


Maintenance
Le cadre est très facile à utiliser en ce qui concerne les réparations et les mises à jour, comme nous l'avons expliqué en détail dans notre revue de l'existant.
Accessoires et garantie
La version AMD utilise les mêmes cartes d'extension de port que la version Intel, y compris les cartes HDMI et DP révisées. Notez qu'aucune carte d'extension n'est incluse gratuitement et qu'il est fortement recommandé d'en avoir au moins une ou deux lors de l'achat d'un ordinateur portable.
La garantie limitée standard d'un an s'applique si l'ordinateur est acheté aux États-Unis.
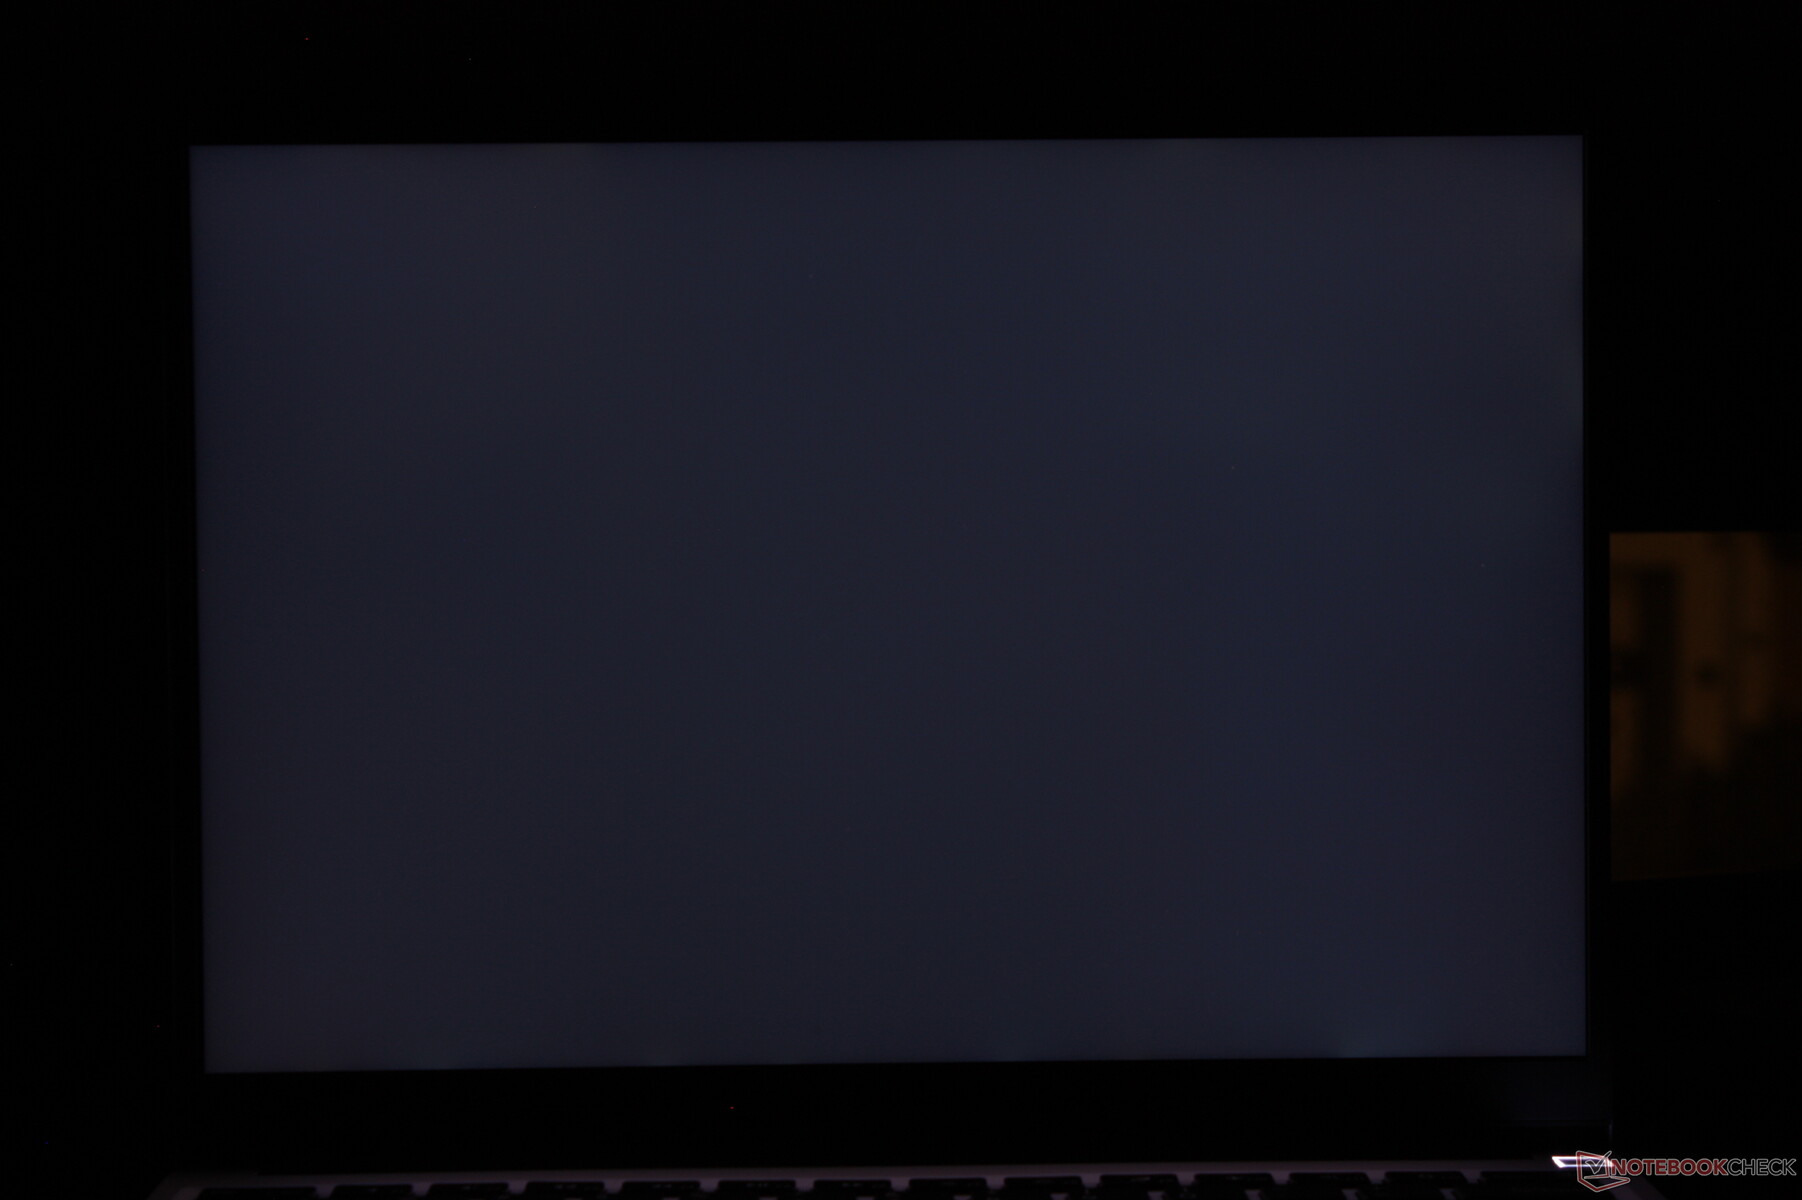
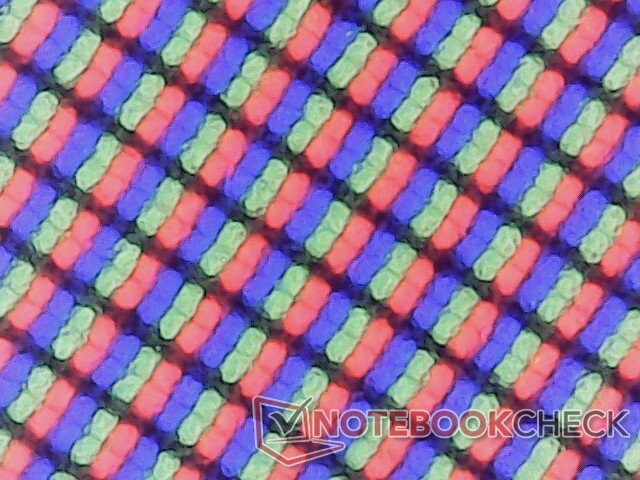
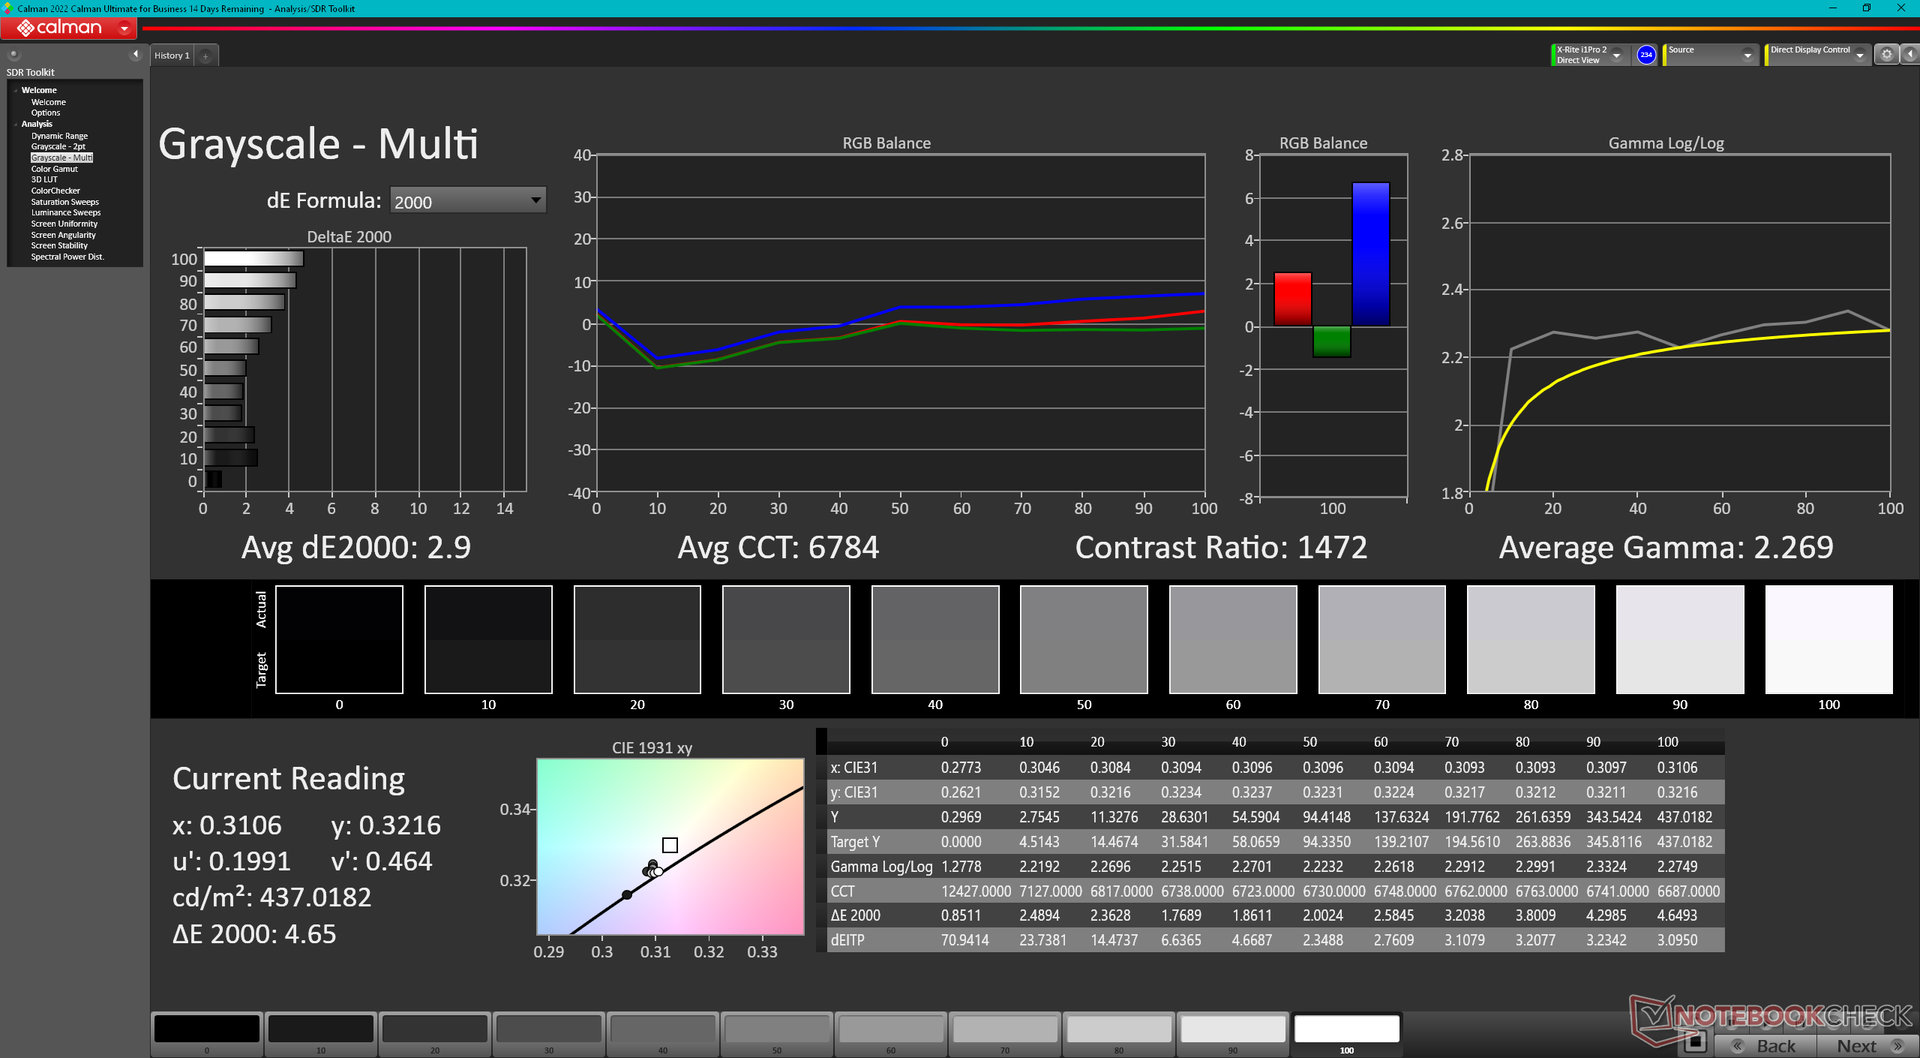
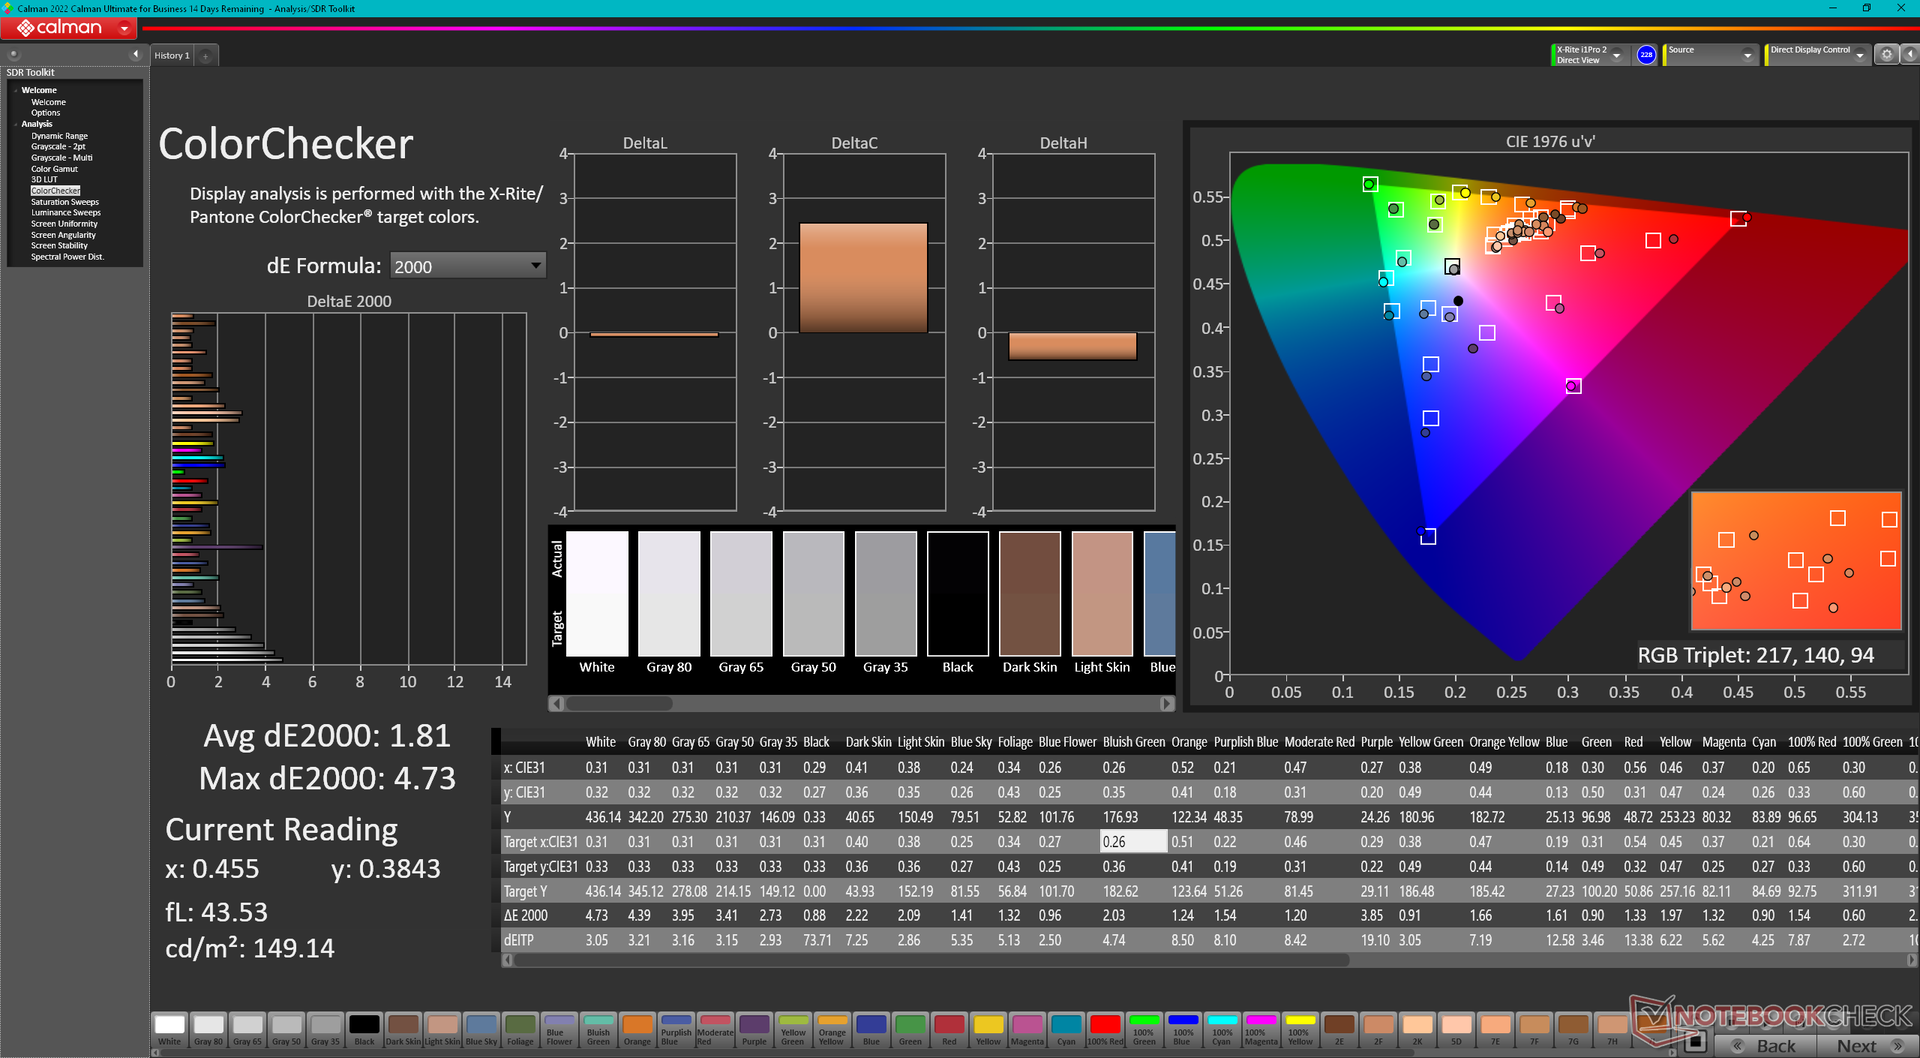
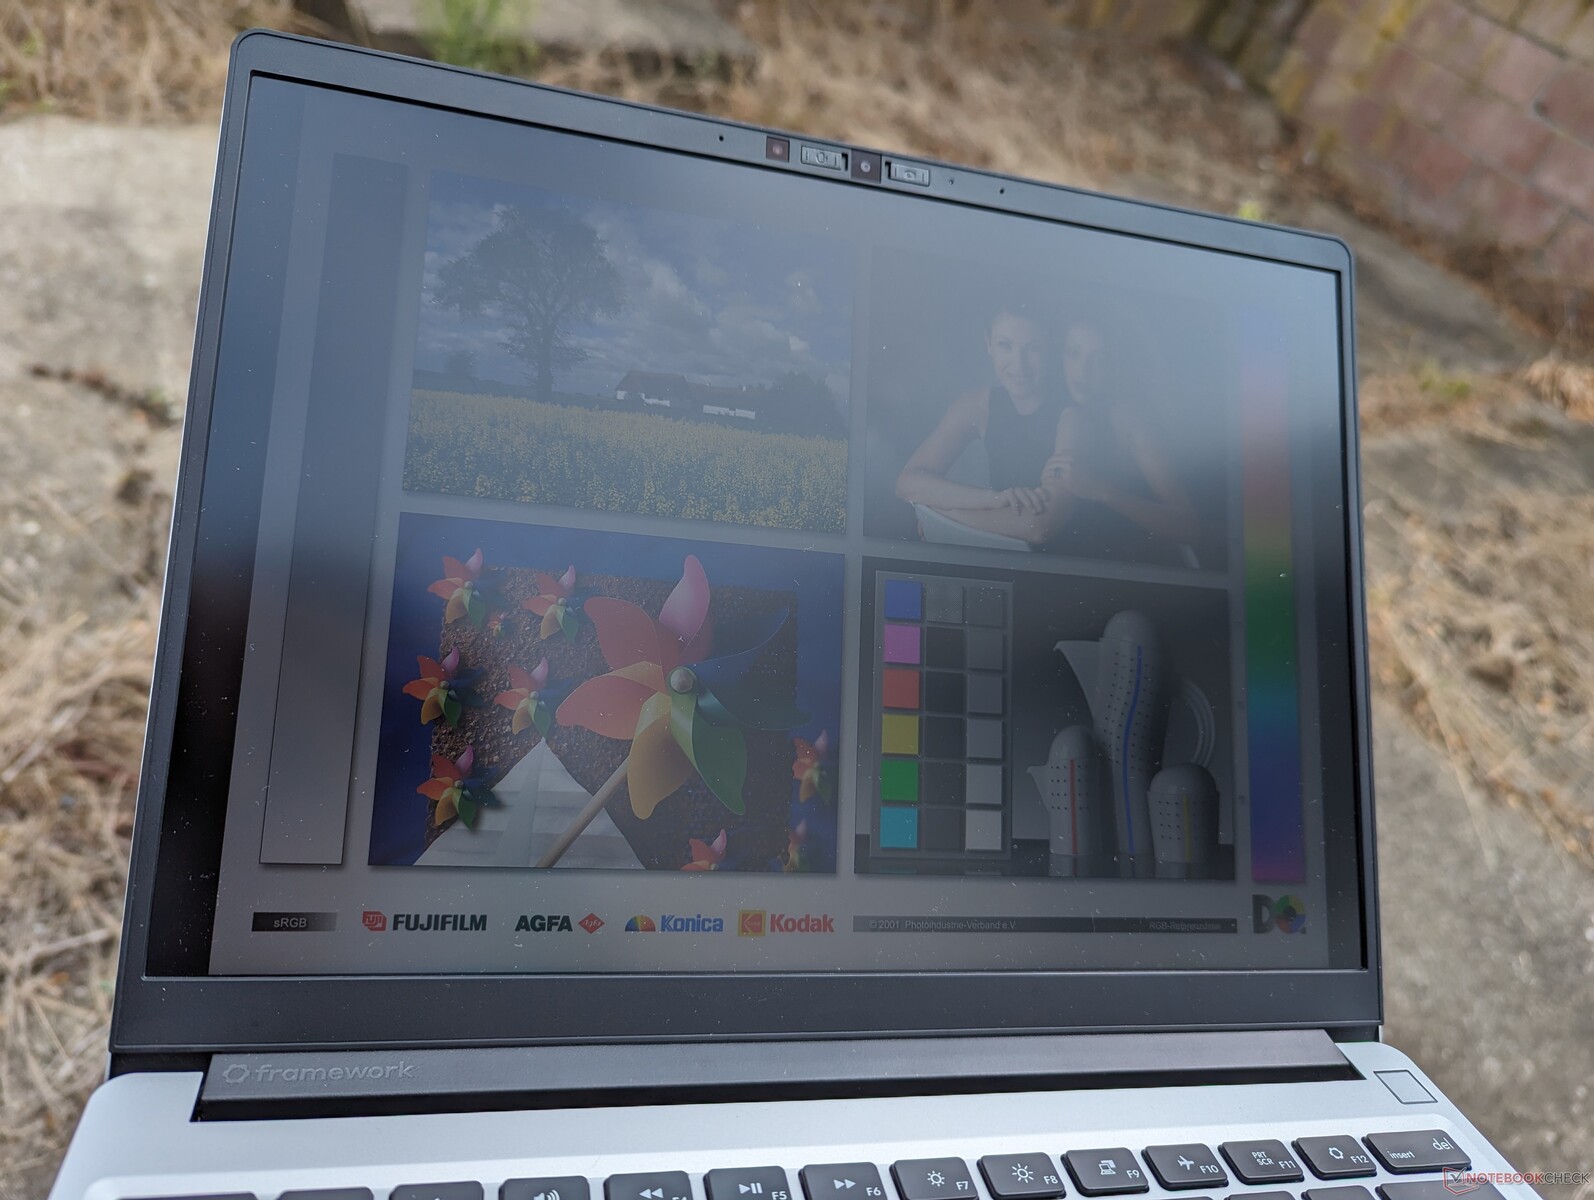
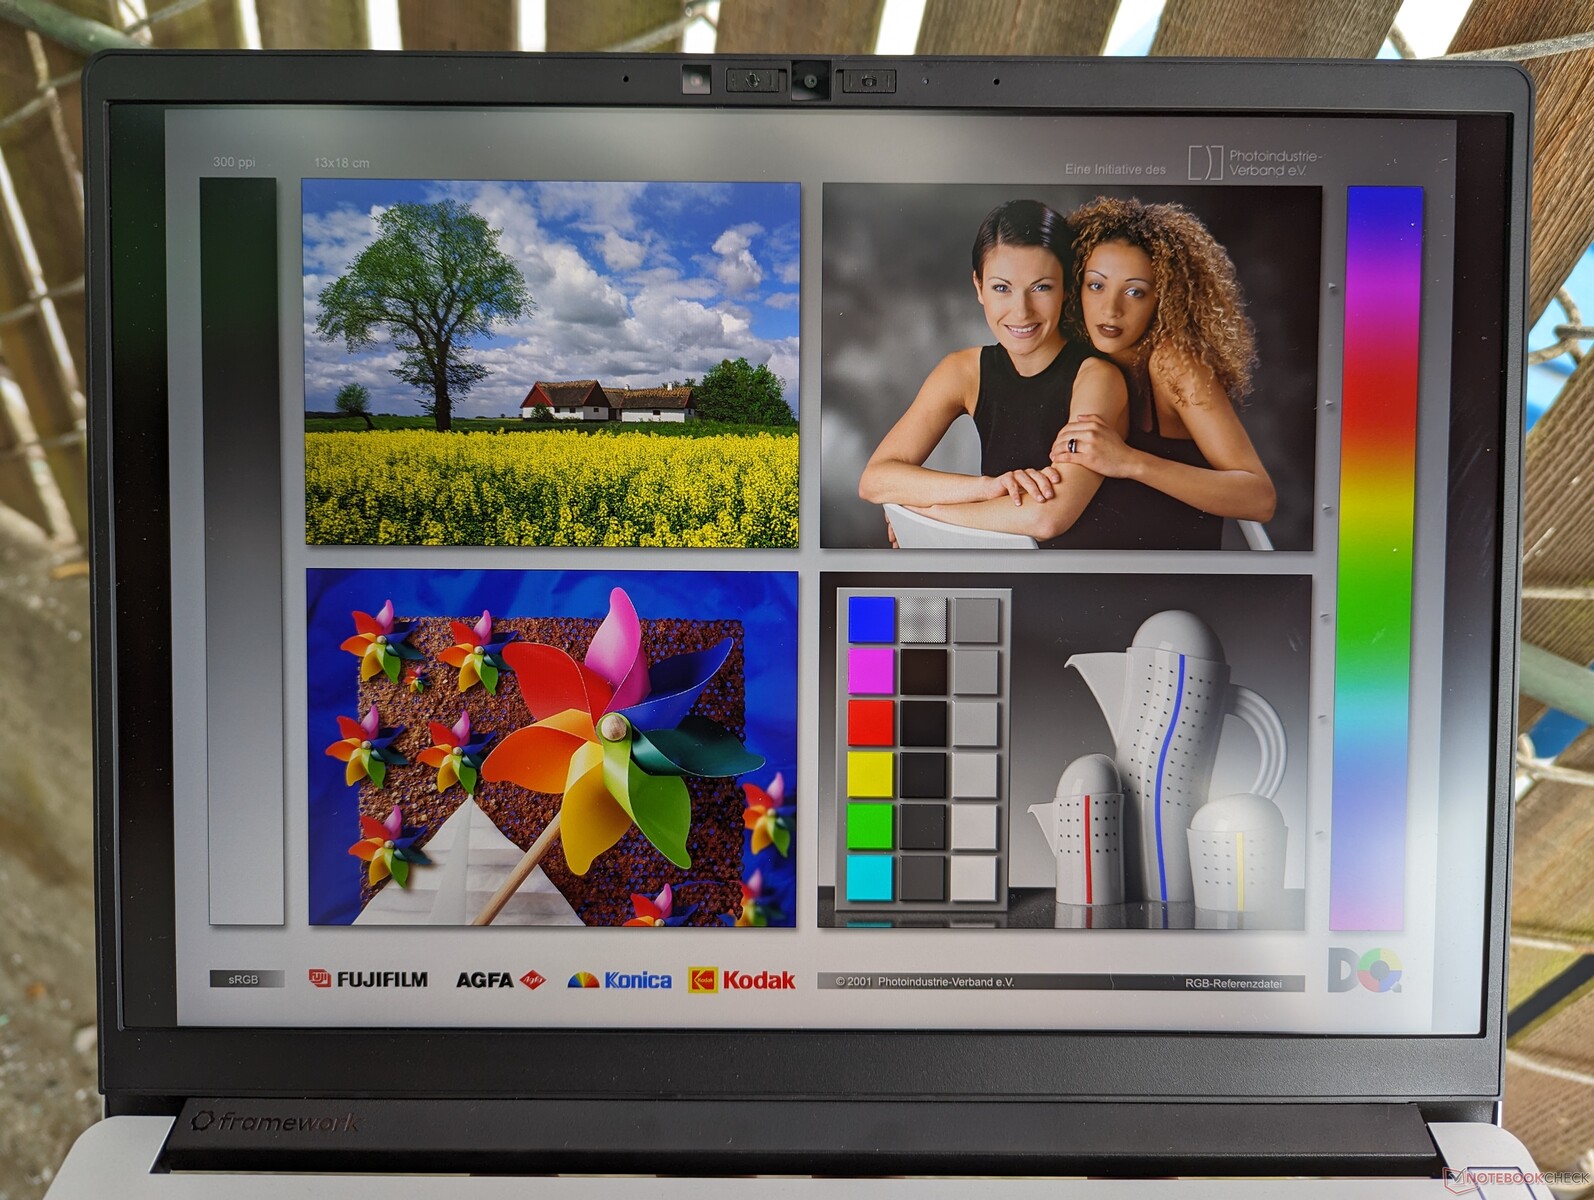
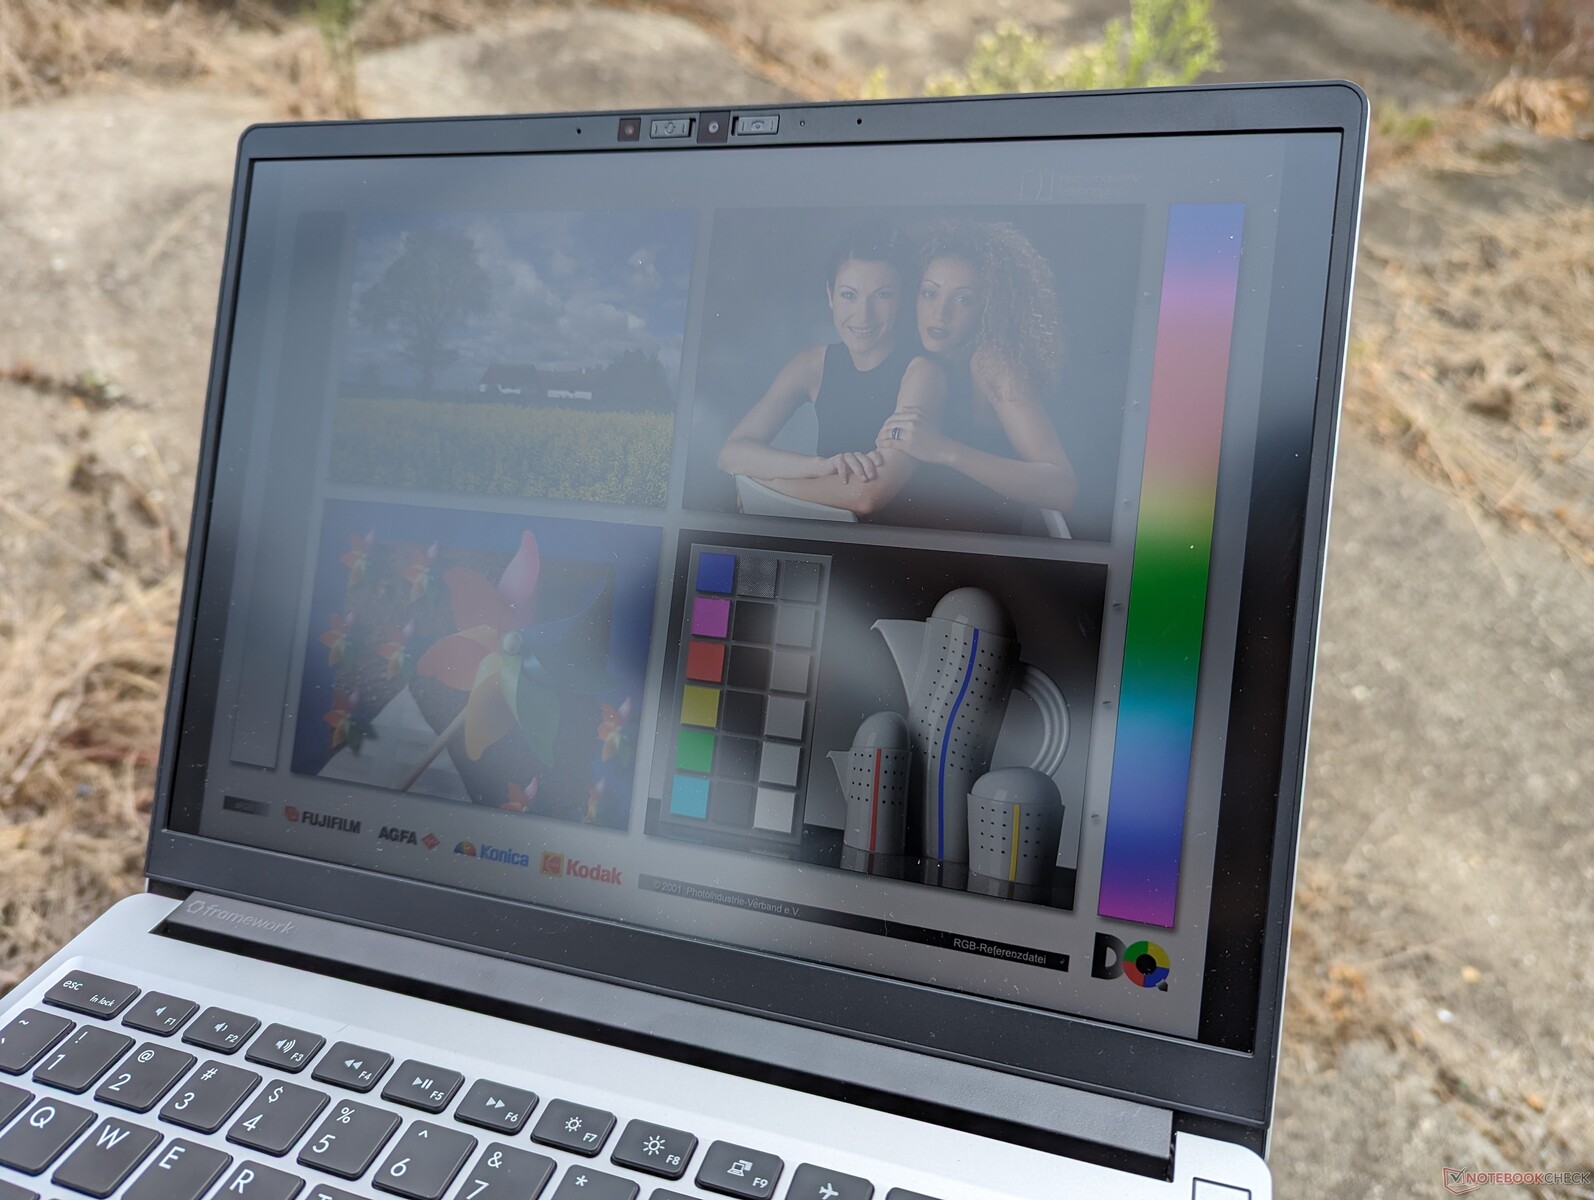
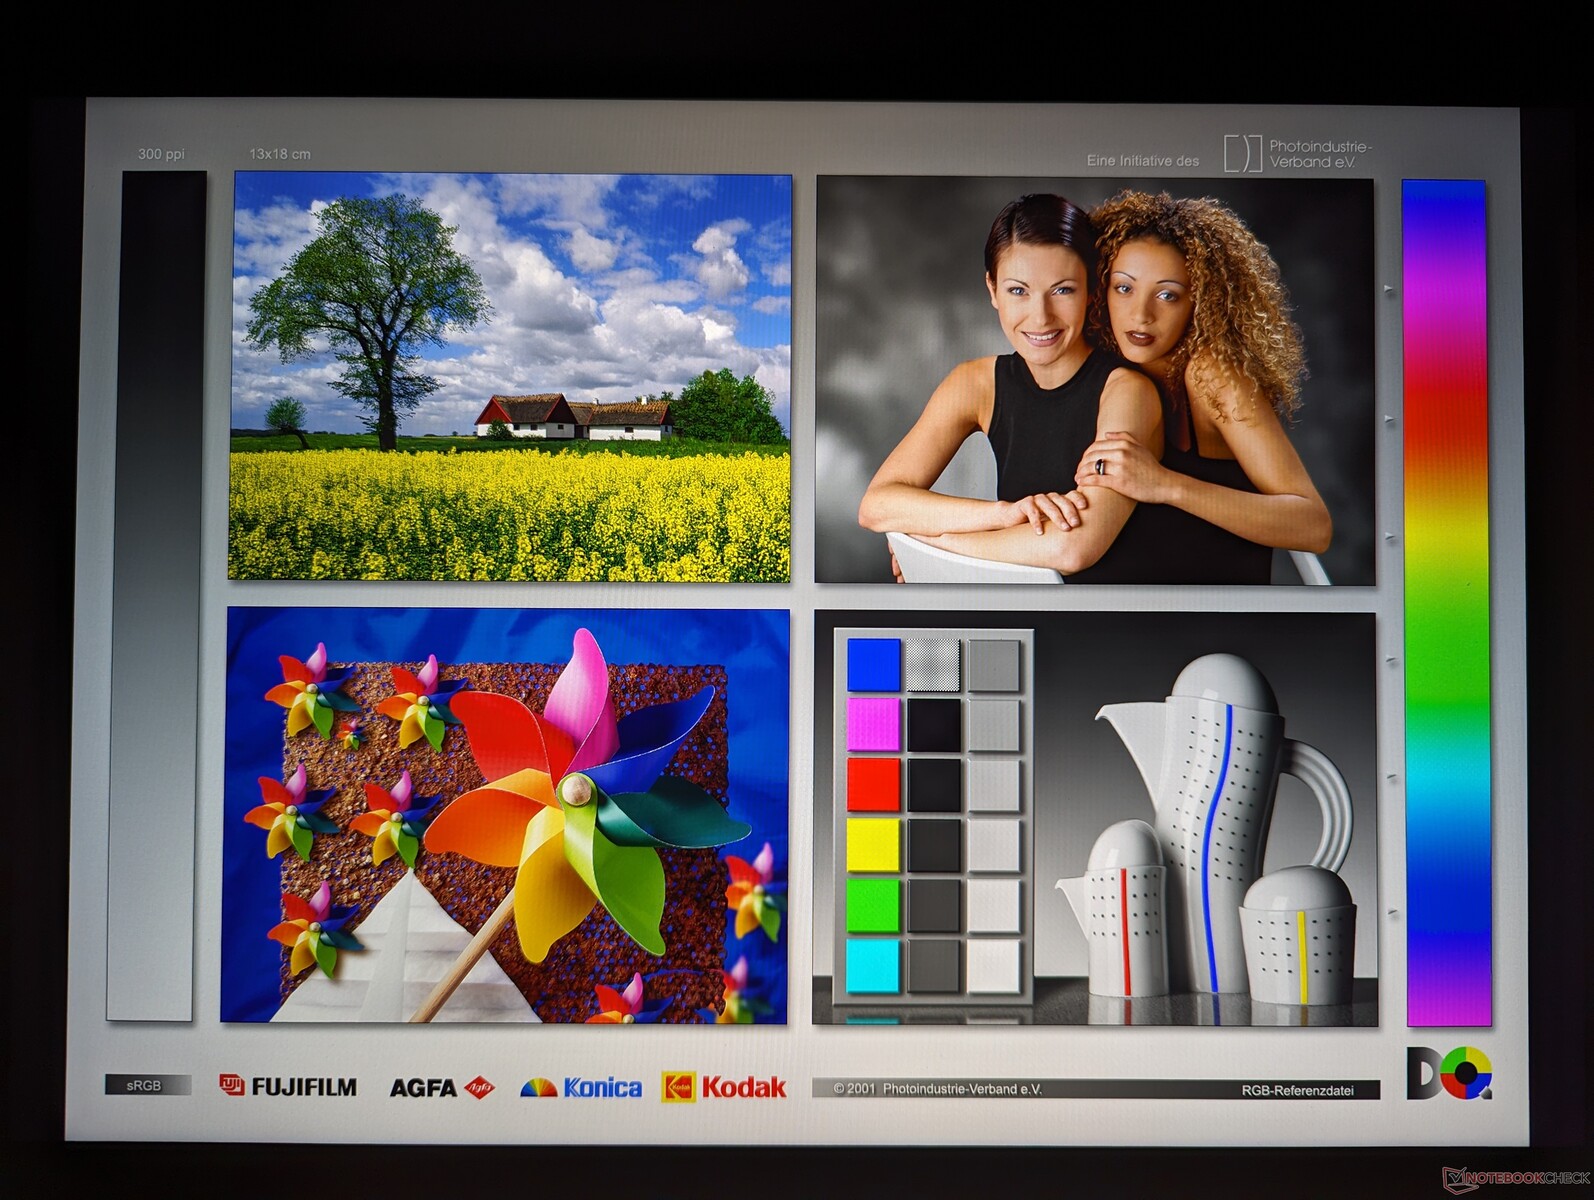
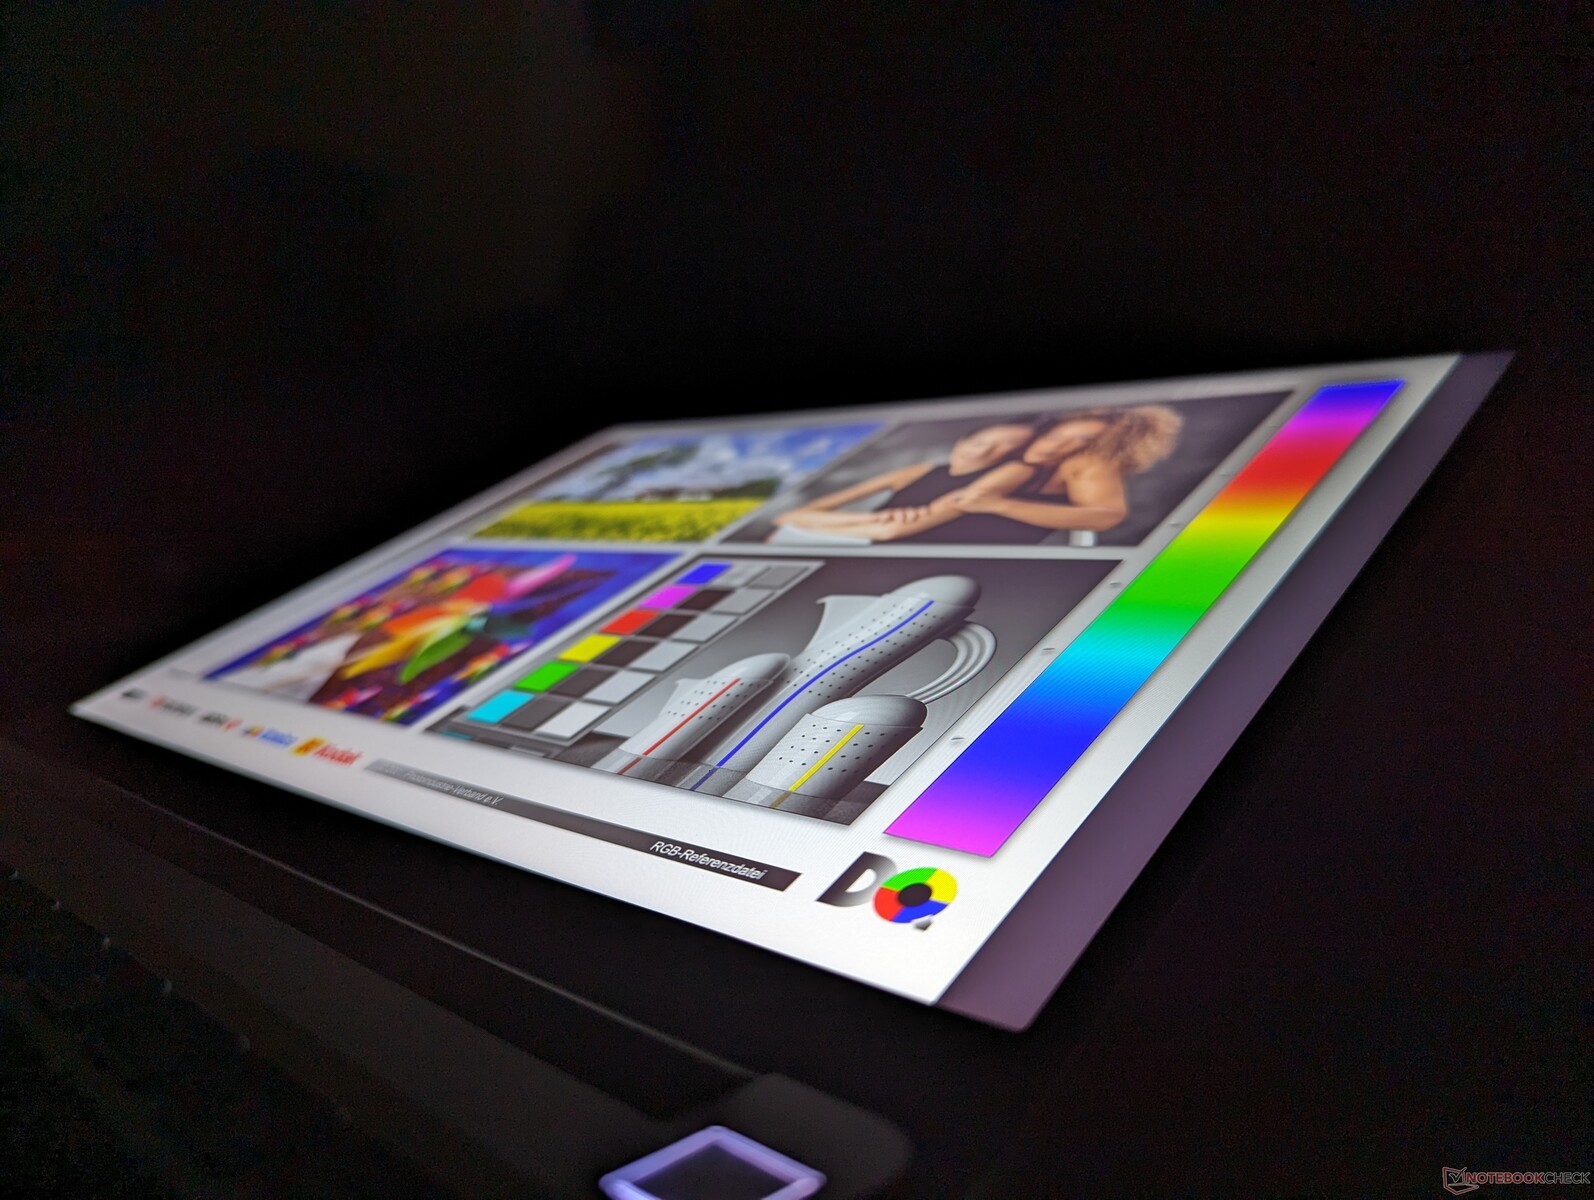
Affichage
L'écran IPS 2256 x 1504 BOE CQ NE135FBM-N41 n'a pas changé depuis l'ordinateur portable Framework 2021 original. Framework n'a pas encore proposé d'autres options d'affichage avec des technologies plus récentes ou meilleures comme l'OLED, le mini-LED, des taux de rafraîchissement >60 Hz ou des temps de réponse plus rapides.
| |||||||||||||||||||||||||
Homogénéité de la luminosité: 89 %
Valeur mesurée au centre, sur batterie: 436 cd/m²
Contraste: 1211:1 (Valeurs des noirs: 0.36 cd/m²)
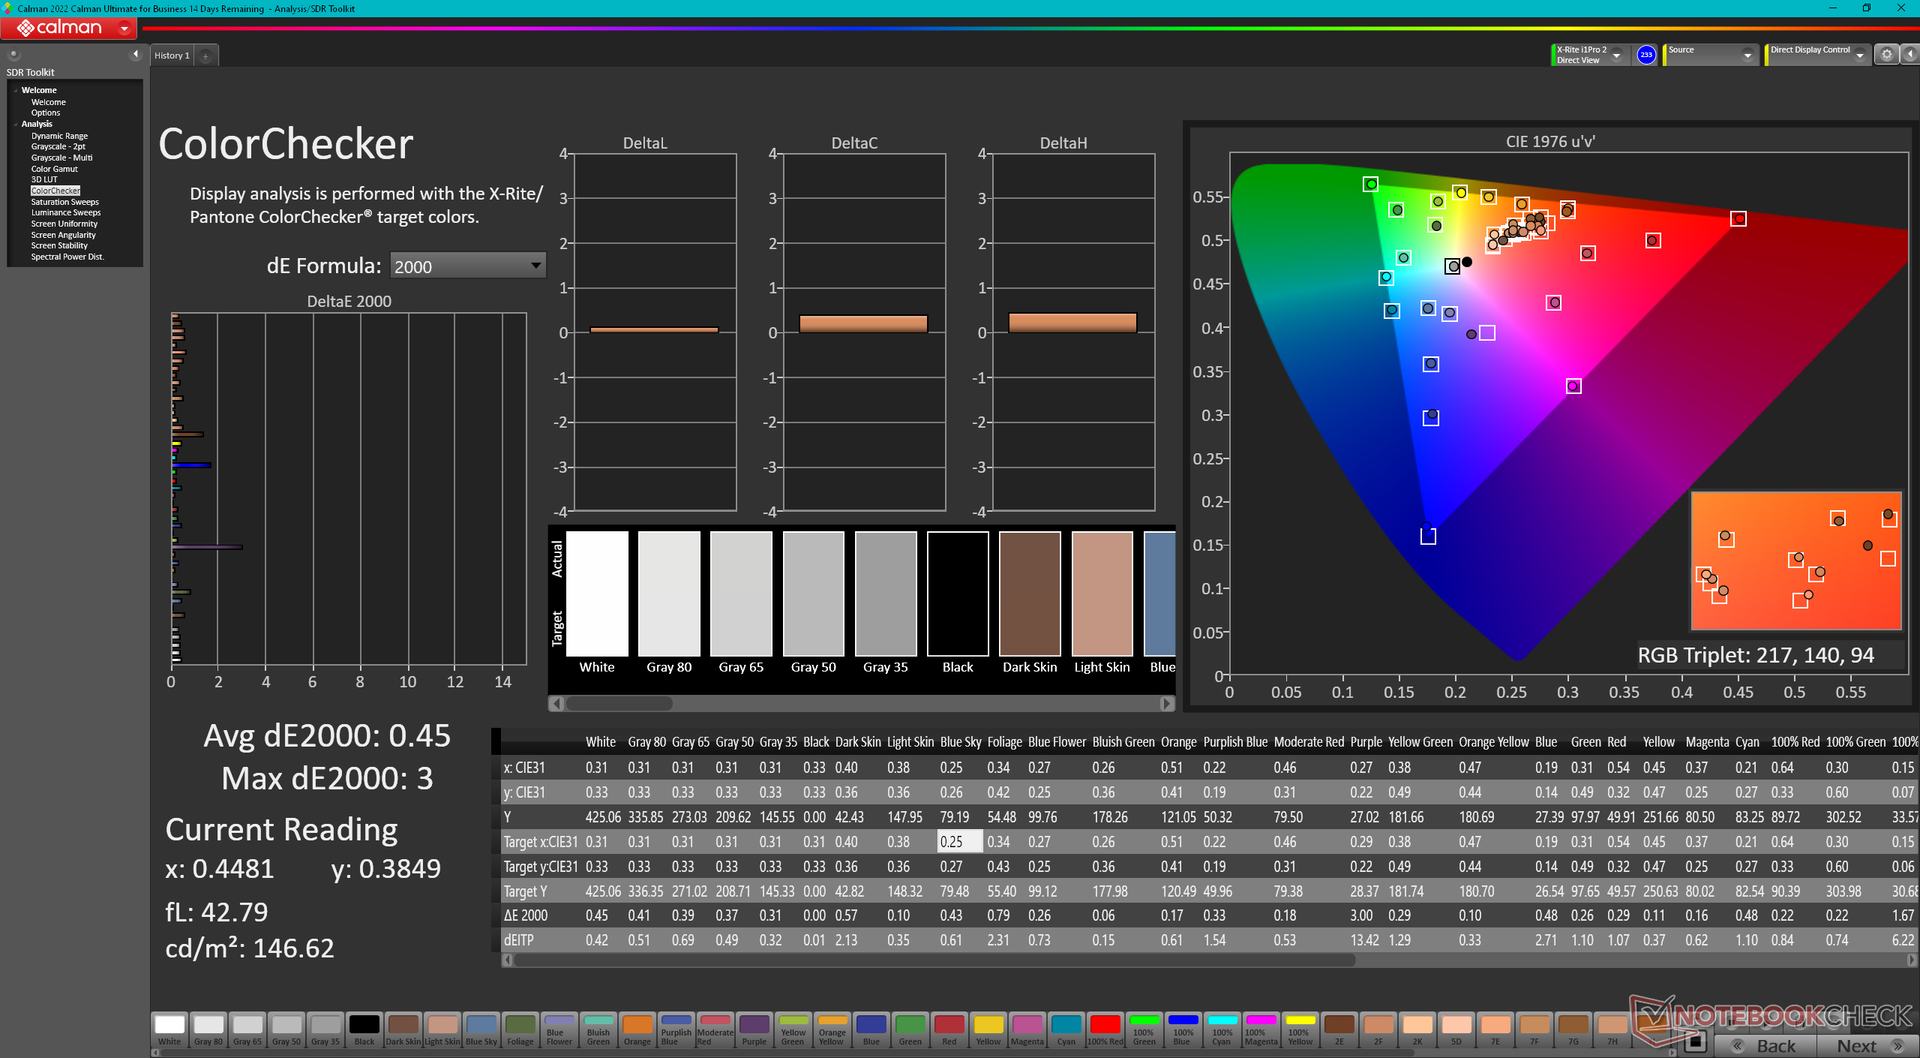
ΔE ColorChecker Calman: 1.81 | ∀{0.5-29.43 Ø4.73}
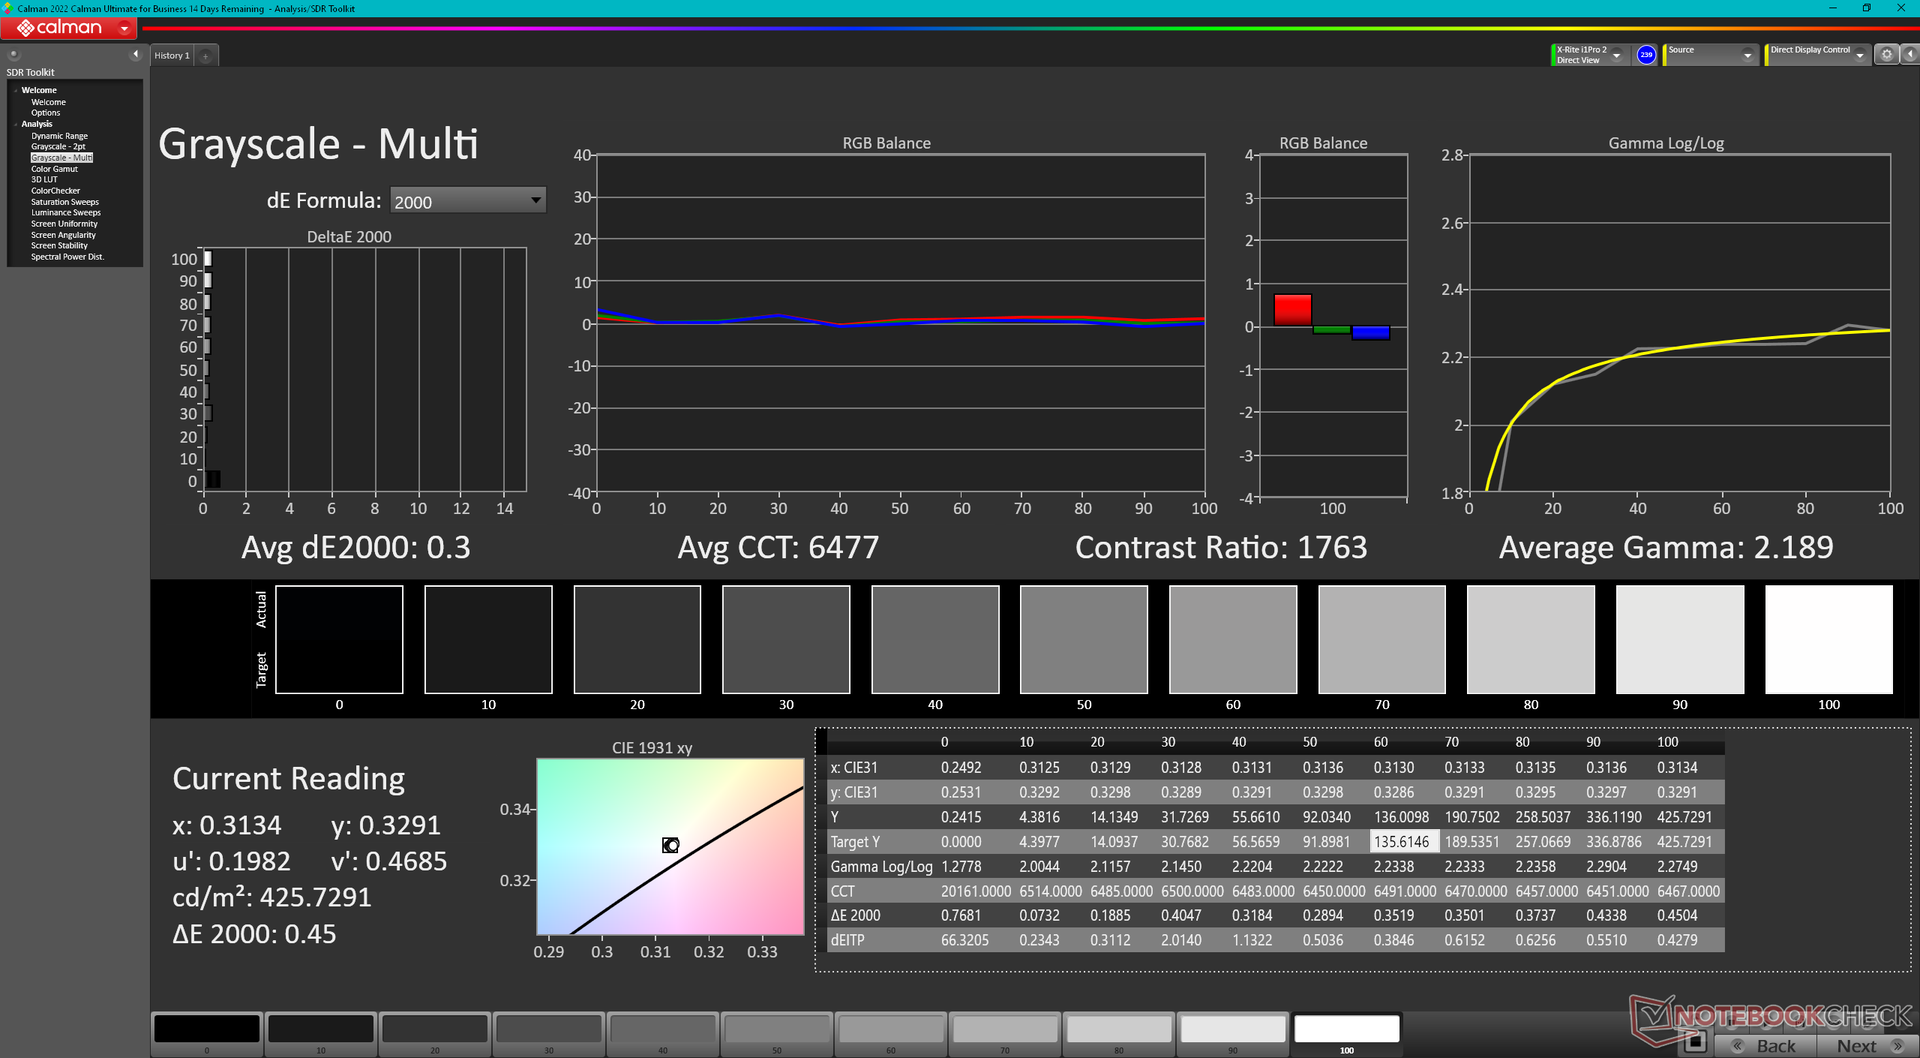
calibrated: 0.45
ΔE Greyscale Calman: 2.9 | ∀{0.09-98 Ø4.97}
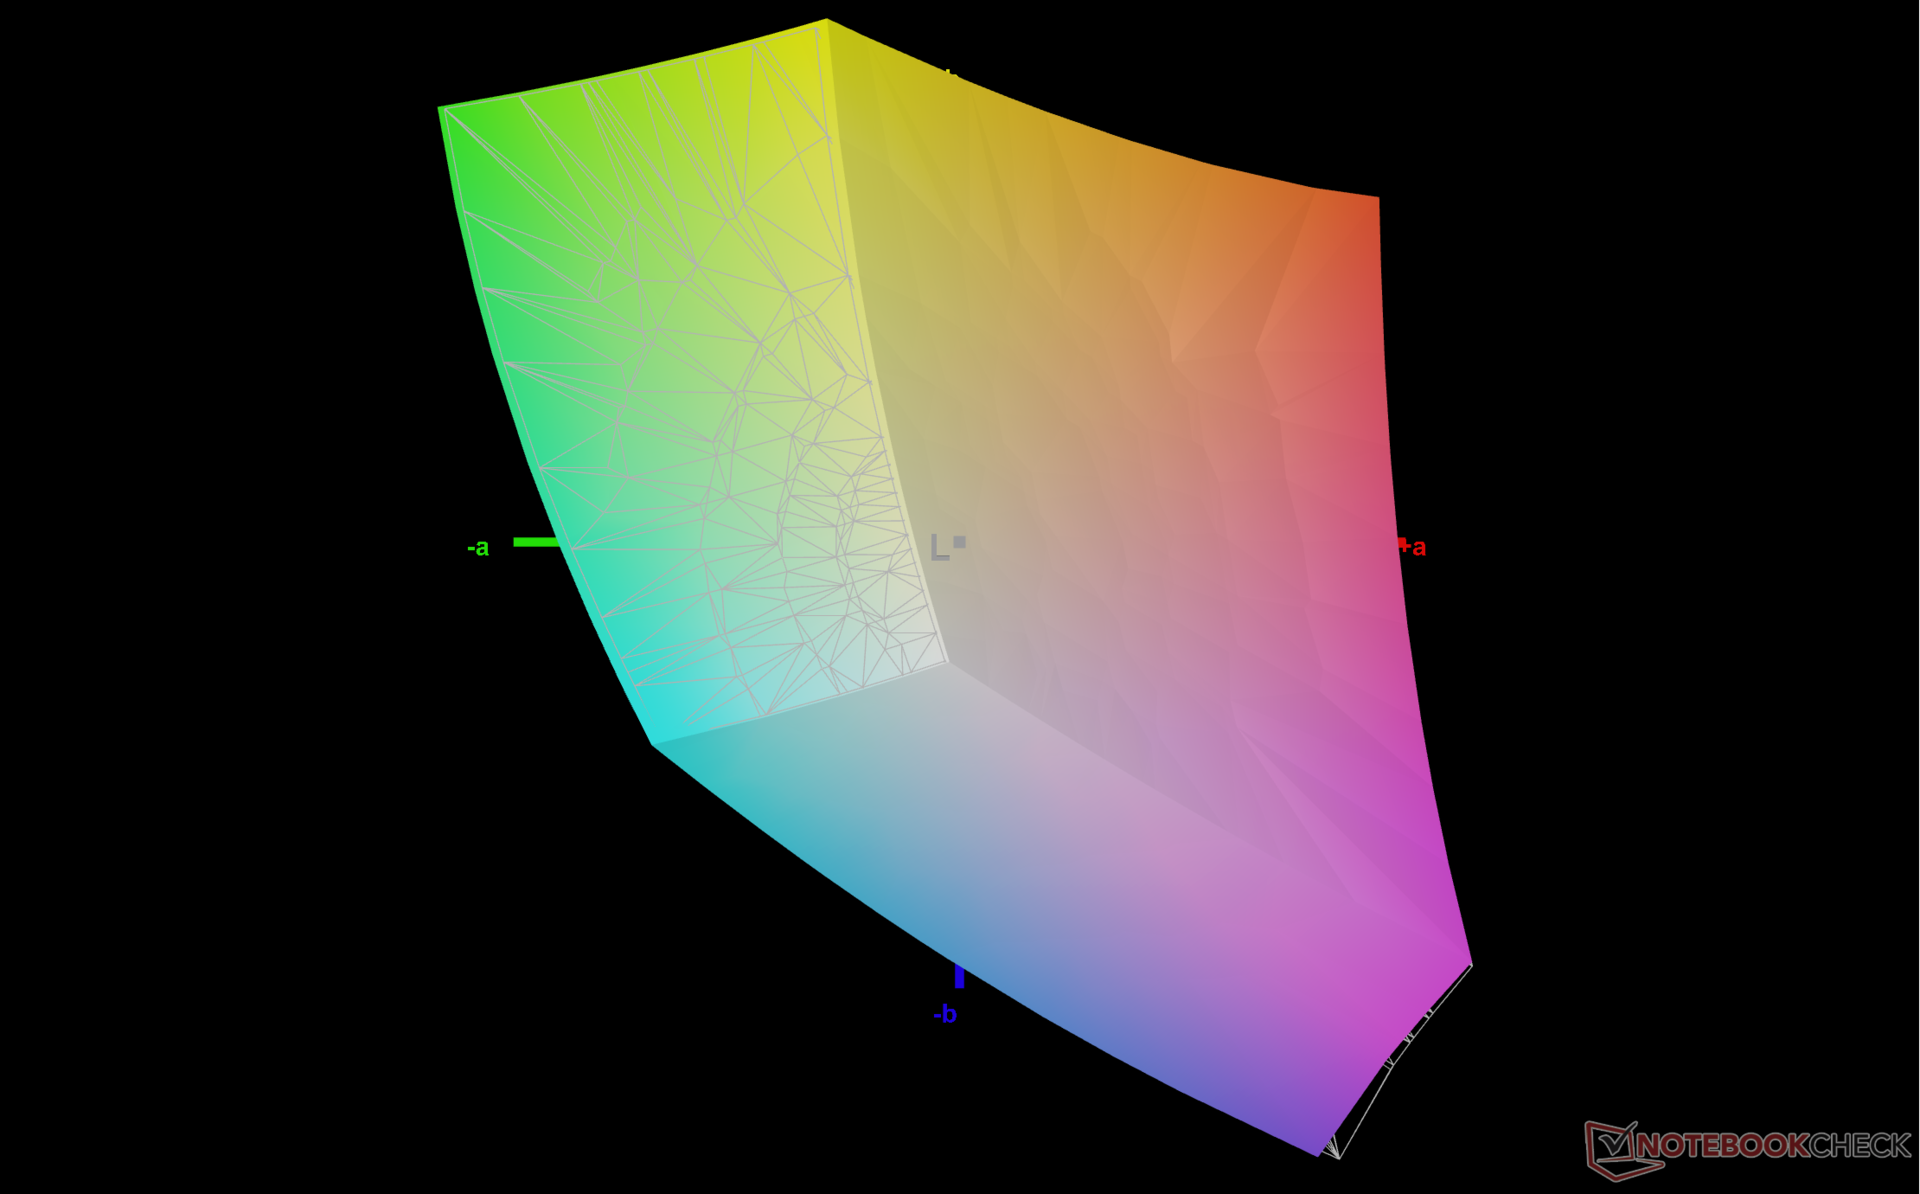
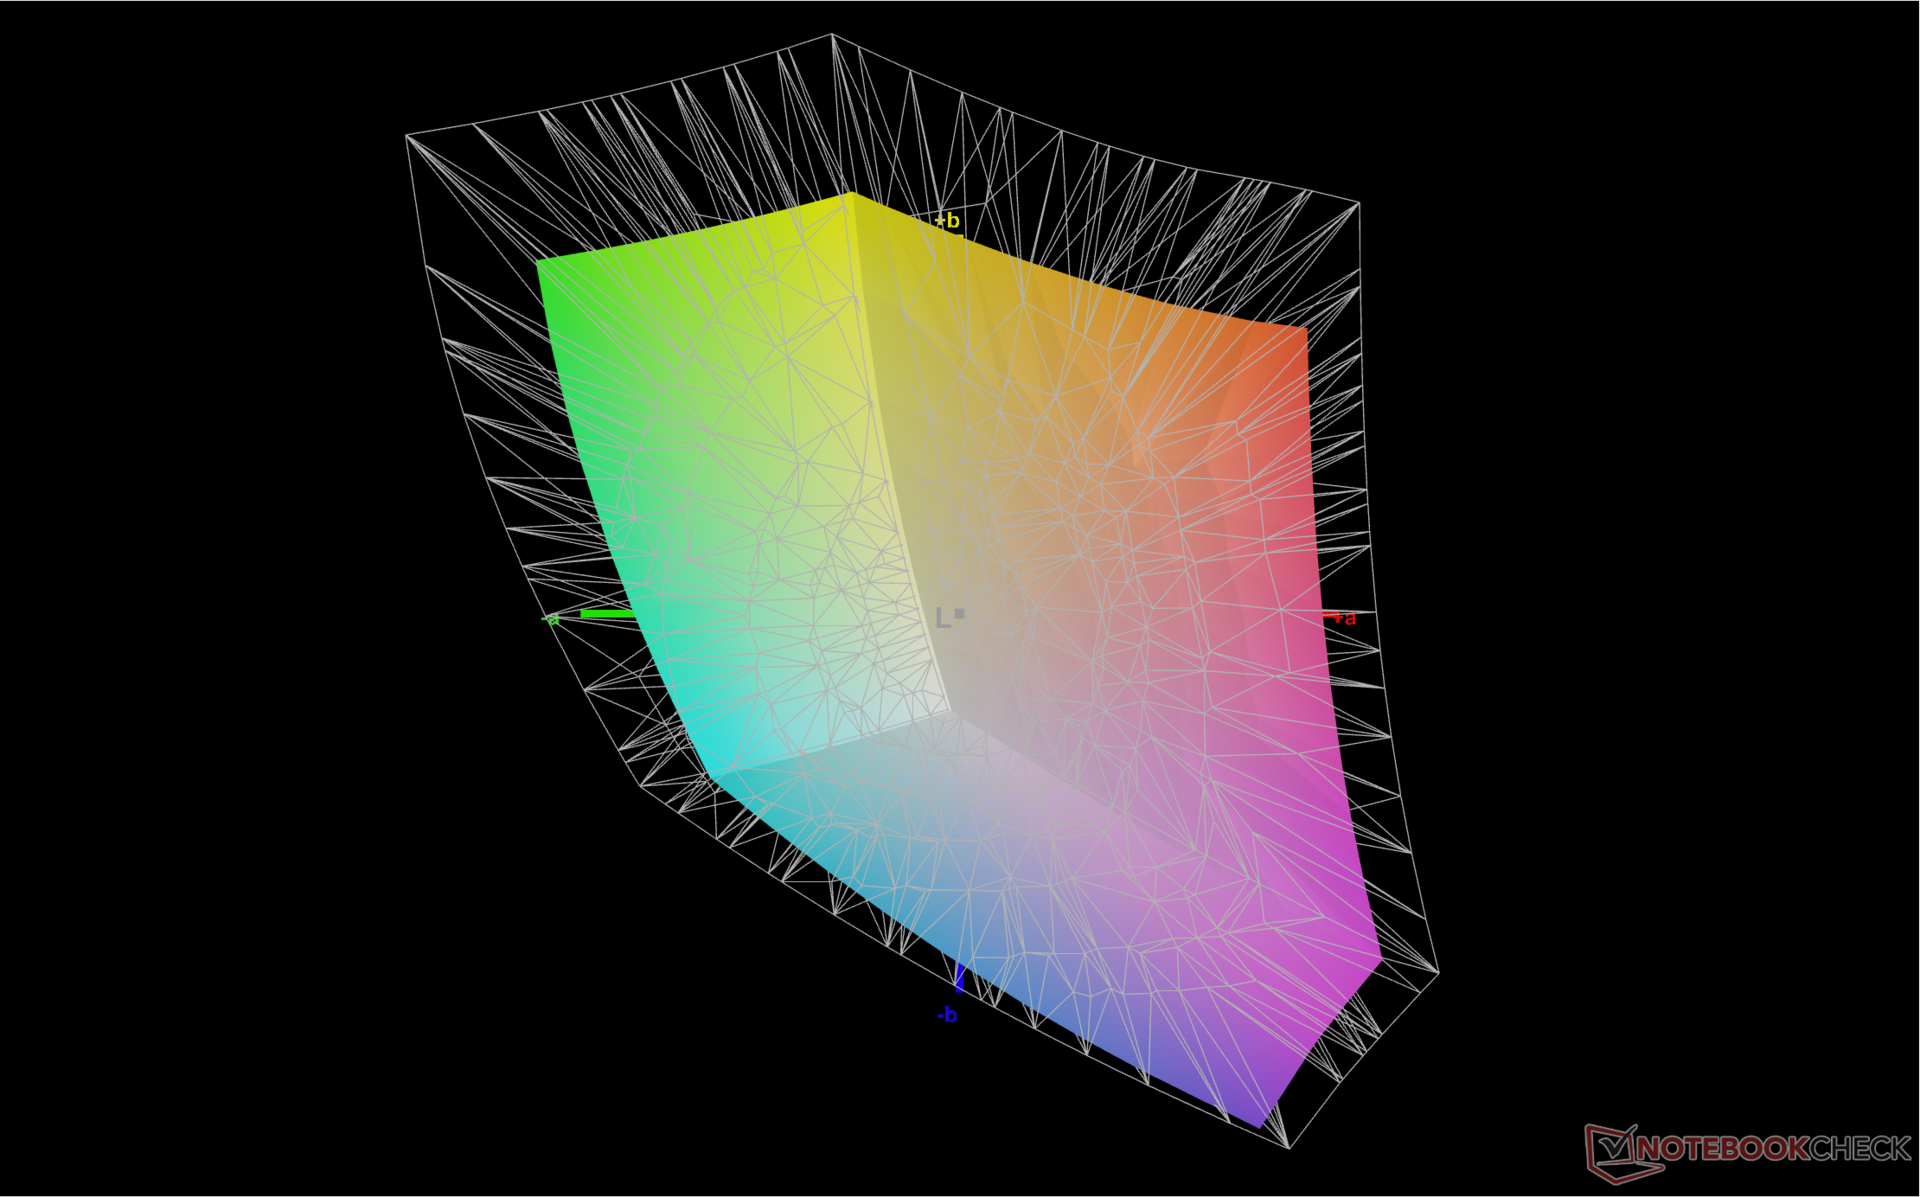
71.1% AdobeRGB 1998 (Argyll 3D)
99.1% sRGB (Argyll 3D)
69% Display P3 (Argyll 3D)
Gamma: 2.27
CCT: 6784 K
| Framework Laptop 13.5 Ryzen 7 7840U BOE CQ NE135FBM-N41, IPS, 2256x1504, 13.5" | Framework Laptop 13.5 13th Gen Intel BOE CQ NE135FBM-N41, IPS, 2256x1504, 13.5" | Framework Laptop 13.5 12th Gen Intel BOE CQ NE135FBM-N41, IPS, 2256x1504, 13.5" | Framework Laptop 13.5 BOE CQ NE135FBM-N41, IPS, 2256x1504, 13.5" | Lenovo ThinkPad X1 Nano Gen 3 MND007ZA1-3, IPS, 2160x1350, 13" | HP Dragonfly G4 Chi Mei CMN13C0, IPS, 1920x1280, 13.5" | |
|---|---|---|---|---|---|---|
| Display | -1% | 0% | -0% | -1% | -1% | |
| Display P3 Coverage (%) | 69 | 68.9 0% | 69.9 1% | 69 0% | 68.5 -1% | 68.4 -1% |
| sRGB Coverage (%) | 99.1 | 97.5 -2% | 99.4 0% | 99.3 0% | 99.5 0% | 98.3 -1% |
| AdobeRGB 1998 Coverage (%) | 71.1 | 71.1 0% | 71.1 0% | 70.3 -1% | 69.7 -2% | 70.4 -1% |
| Response Times | -8% | 22% | -12% | 20% | 2% | |
| Response Time Grey 50% / Grey 80% * (ms) | 50.4 ? | 54.9 ? -9% | 34.7 ? 31% | 55.6 ? -10% | 39.9 ? 21% | 48.8 ? 3% |
| Response Time Black / White * (ms) | 31.5 ? | 33.5 ? -6% | 27.5 ? 13% | 36 ? -14% | 25.8 ? 18% | 31.3 ? 1% |
| PWM Frequency (Hz) | ||||||
| Screen | -37% | -21% | -28% | 13% | 0% | |
| Brightness middle (cd/m²) | 436 | 503 15% | 449.6 3% | 449 3% | 461.2 6% | 408.8 -6% |
| Brightness (cd/m²) | 416 | 472 13% | 431 4% | 435 5% | 428 3% | 399 -4% |
| Brightness Distribution (%) | 89 | 87 -2% | 90 1% | 93 4% | 86 -3% | 90 1% |
| Black Level * (cd/m²) | 0.36 | 0.36 -0% | 0.31 14% | 0.39 -8% | 0.29 19% | 0.32 11% |
| Contrast (:1) | 1211 | 1397 15% | 1450 20% | 1151 -5% | 1590 31% | 1278 6% |
| Colorchecker dE 2000 * | 1.81 | 3.38 -87% | 2.76 -52% | 2.34 -29% | 1.79 1% | 2.02 -12% |
| Colorchecker dE 2000 max. * | 4.73 | 7.08 -50% | 7.96 -68% | 7.07 -49% | 3.3 30% | 3.84 19% |
| Colorchecker dE 2000 calibrated * | 0.45 | 1.21 -169% | 0.58 -29% | 0.96 -113% | 0.47 -4% | 0.61 -36% |
| Greyscale dE 2000 * | 2.9 | 4.8 -66% | 5.2 -79% | 4.7 -62% | 1.8 38% | 2.3 21% |
| Gamma | 2.27 97% | 2.13 103% | 2.23 99% | 2.29 96% | 2.24 98% | 2.2 100% |
| CCT | 6784 96% | 6235 104% | 6475 100% | 6760 96% | 6588 99% | 6203 105% |
| Moyenne finale (programmes/paramètres) | -15% /
-25% | 0% /
-10% | -13% /
-20% | 11% /
11% | 0% /
0% |
* ... Moindre est la valeur, meilleures sont les performances

Temps de réponse de l'écran
| ↔ Temps de réponse noir à blanc | ||
|---|---|---|
| 31.5 ms ... hausse ↗ et chute ↘ combinées | ↗ 17.7 ms hausse | 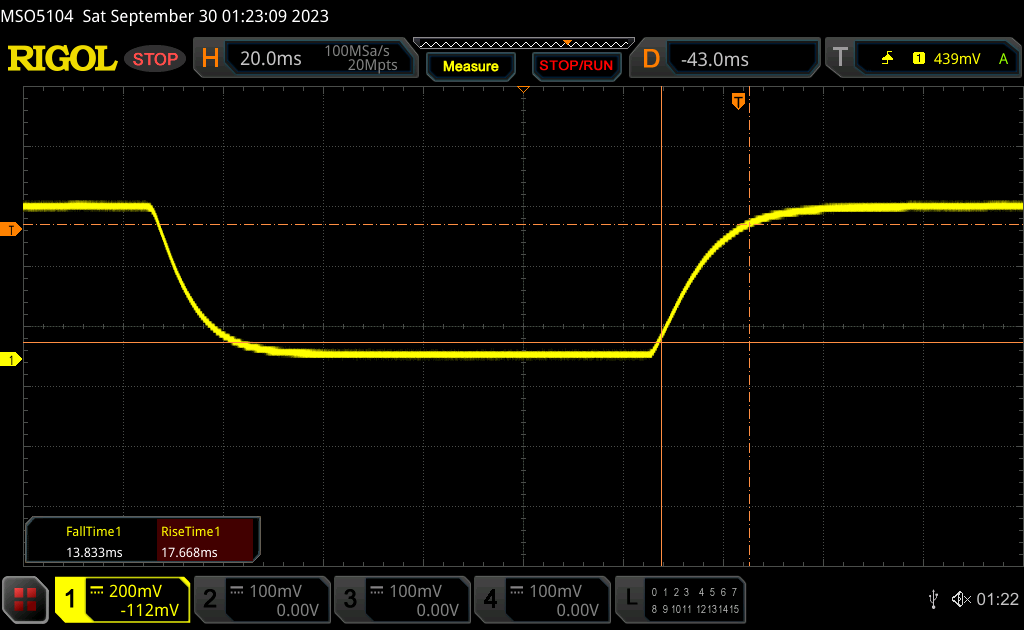 |
| ↘ 13.8 ms chute | ||
| L'écran souffre de latences très élevées, à éviter pour le jeu. En comparaison, tous les appareils testés affichent entre 0.1 (minimum) et 240 (maximum) ms. » 85 % des appareils testés affichent de meilleures performances. Cela signifie que les latences relevées sont moins bonnes que la moyenne (19.9 ms) de tous les appareils testés. | ||
| ↔ Temps de réponse gris 50% à gris 80% | ||
| 50.4 ms ... hausse ↗ et chute ↘ combinées | ↗ 23.8 ms hausse | 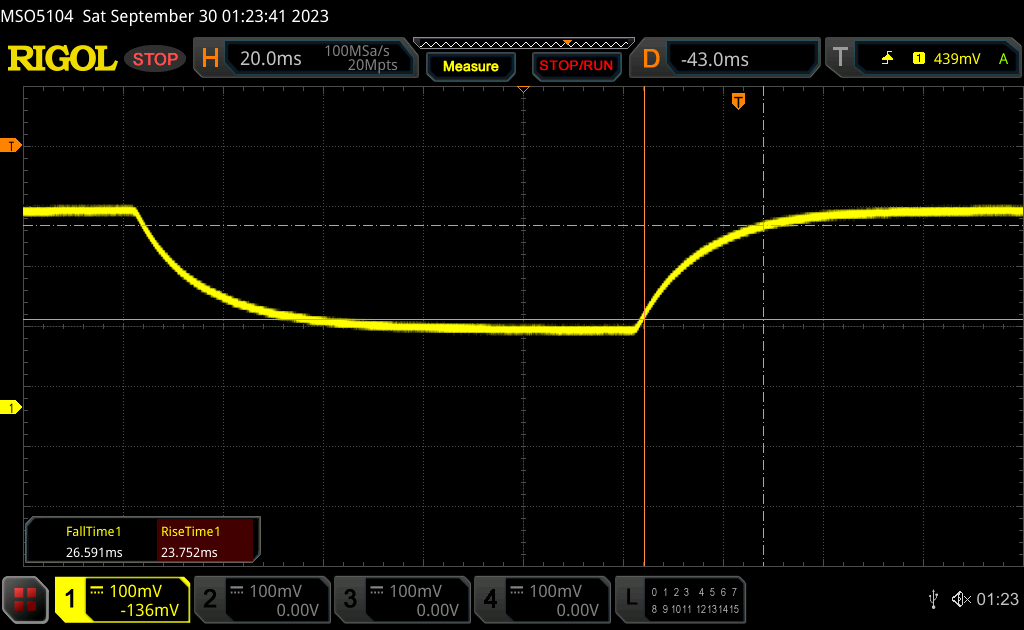 |
| ↘ 26.6 ms chute | ||
| L'écran souffre de latences très élevées, à éviter pour le jeu. En comparaison, tous les appareils testés affichent entre 0.165 (minimum) et 636 (maximum) ms. » 87 % des appareils testés affichent de meilleures performances. Cela signifie que les latences relevées sont moins bonnes que la moyenne (31.1 ms) de tous les appareils testés. | ||
Scintillement / MLI (Modulation de largeur d'impulsion)
| Scintillement / MLI (Modulation de largeur d'impulsion) non décelé | 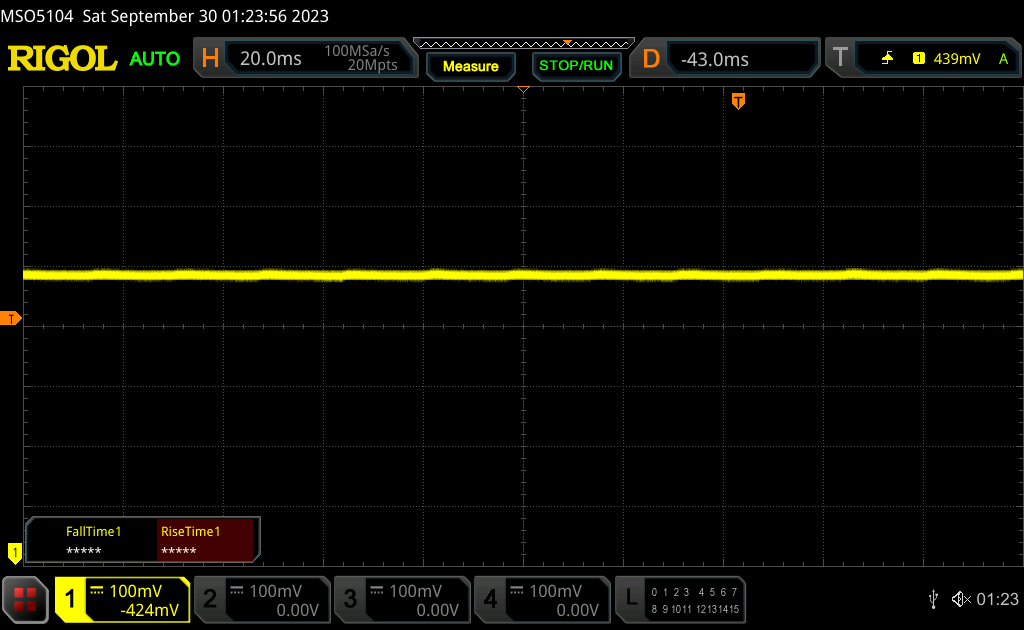 | ||
En comparaison, 52 % des appareils testés n'emploient pas MDI pour assombrir leur écran. Nous avons relevé une moyenne à 7794 (minimum : 5 - maximum : 343500) Hz dans le cas où une MDI était active. | |||

Performance
Conditions d'essai
Nous avons réglé Windows sur le mode Performance avant d'exécuter les tests de référence ci-dessous. Le Framework ne comprend pas de logiciel préinstallé de type centre de contrôle pour ajuster les fonctions spécialisées, mais nous recommandons d'installer AMD Adrenalin pour un meilleur contrôle du GPU intégré.
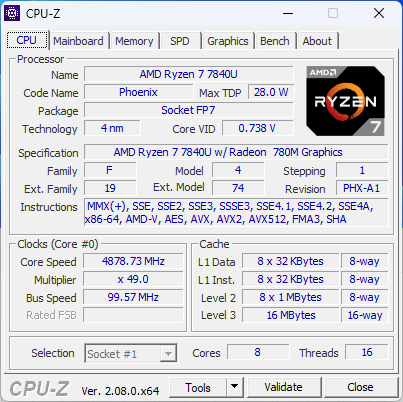
Processeur
Après le décevant Zen 3 Ryzen 7 7730Unous commençons enfin à voir plus d'ordinateurs portables arborant le Zen 4 Ryzen 7 7840U sont disponibles. Ce processeur tant attendu de la série U est au coude à coude avec les processeurs de la série H Core i7-12700H tout en ne nécessitant qu'une fraction de la puissance. Il est également légèrement plus performant que le Core i7-1370P de 13e génération Core i7-1370P de la 13e génération, tel qu'il se trouve sur l'ordinateur portable Framework basé sur Intel, dans les charges de travail multithread.
Néanmoins, les performances à un seul thread sont environ 15 % plus lentes que celles du Core i7-1370P pour être plus en ligne avec un CPU Intel de 12e génération comme le Core i7-1260P. Ce déficit ne devrait pas être une grande surprise étant donné que les CPU AMD sont généralement légèrement en retard à cet égard.
Nous n'avons pas encore testé un portable Ryzen 5 7640U en interne et nous ne pouvons donc pas dire avec certitude quelle est la perte de performance attendue en passant de notre Ryzen 7 7840U au Ryzen 5 7640U à ce jour.
Cinebench R15 Multi Loop
Cinebench R23: Multi Core | Single Core
Cinebench R20: CPU (Multi Core) | CPU (Single Core)
Cinebench R15: CPU Multi 64Bit | CPU Single 64Bit
Blender: v2.79 BMW27 CPU
7-Zip 18.03: 7z b 4 | 7z b 4 -mmt1
Geekbench 5.5: Multi-Core | Single-Core
HWBOT x265 Benchmark v2.2: 4k Preset
LibreOffice : 20 Documents To PDF
R Benchmark 2.5: Overall mean
* ... Moindre est la valeur, meilleures sont les performances
AIDA64: FP32 Ray-Trace | FPU Julia | CPU SHA3 | CPU Queen | FPU SinJulia | FPU Mandel | CPU AES | CPU ZLib | FP64 Ray-Trace | CPU PhotoWorxx
AIDA64: FP32 Ray-Trace | FPU Julia | CPU SHA3 | CPU Queen | FPU SinJulia | FPU Mandel | CPU AES | CPU ZLib | FP64 Ray-Trace | CPU PhotoWorxx
Performance du système
CrossMark: Overall | Productivity | Creativity | Responsiveness
| PCMark 10 / Score | |
| Framework Laptop 13.5 Ryzen 7 7840U | |
| Moyenne AMD Ryzen 7 7840U, AMD Radeon 780M (5866 - 7157, n=10) | |
| Dell XPS 13 Plus 9320 Core i7-1360P | |
| Lenovo ThinkPad X1 Nano Gen 3 | |
| HP Dragonfly G4 | |
| Asus ZenBook S13 OLED UX5304 | |
| Framework Laptop 13.5 | |
| PCMark 10 / Essentials | |
| Dell XPS 13 Plus 9320 Core i7-1360P | |
| Framework Laptop 13.5 Ryzen 7 7840U | |
| HP Dragonfly G4 | |
| Lenovo ThinkPad X1 Nano Gen 3 | |
| Asus ZenBook S13 OLED UX5304 | |
| Framework Laptop 13.5 | |
| Moyenne AMD Ryzen 7 7840U, AMD Radeon 780M (9068 - 11081, n=10) | |
| PCMark 10 / Productivity | |
| Framework Laptop 13.5 Ryzen 7 7840U | |
| Moyenne AMD Ryzen 7 7840U, AMD Radeon 780M (7323 - 10099, n=10) | |
| Lenovo ThinkPad X1 Nano Gen 3 | |
| Dell XPS 13 Plus 9320 Core i7-1360P | |
| HP Dragonfly G4 | |
| Asus ZenBook S13 OLED UX5304 | |
| Framework Laptop 13.5 | |
| PCMark 10 / Digital Content Creation | |
| Framework Laptop 13.5 Ryzen 7 7840U | |
| Moyenne AMD Ryzen 7 7840U, AMD Radeon 780M (7204 - 8987, n=10) | |
| Dell XPS 13 Plus 9320 Core i7-1360P | |
| Lenovo ThinkPad X1 Nano Gen 3 | |
| HP Dragonfly G4 | |
| Asus ZenBook S13 OLED UX5304 | |
| Framework Laptop 13.5 | |
| CrossMark / Overall | |
| Dell XPS 13 Plus 9320 Core i7-1360P | |
| Lenovo ThinkPad X1 Nano Gen 3 | |
| Framework Laptop 13.5 Ryzen 7 7840U | |
| HP Dragonfly G4 | |
| Asus ZenBook S13 OLED UX5304 | |
| Moyenne AMD Ryzen 7 7840U, AMD Radeon 780M (1256 - 1804, n=10) | |
| CrossMark / Productivity | |
| Lenovo ThinkPad X1 Nano Gen 3 | |
| Dell XPS 13 Plus 9320 Core i7-1360P | |
| Framework Laptop 13.5 Ryzen 7 7840U | |
| HP Dragonfly G4 | |
| Asus ZenBook S13 OLED UX5304 | |
| Moyenne AMD Ryzen 7 7840U, AMD Radeon 780M (1261 - 1798, n=10) | |
| CrossMark / Creativity | |
| Dell XPS 13 Plus 9320 Core i7-1360P | |
| Lenovo ThinkPad X1 Nano Gen 3 | |
| Framework Laptop 13.5 Ryzen 7 7840U | |
| HP Dragonfly G4 | |
| Asus ZenBook S13 OLED UX5304 | |
| Moyenne AMD Ryzen 7 7840U, AMD Radeon 780M (1251 - 1835, n=10) | |
| CrossMark / Responsiveness | |
| Dell XPS 13 Plus 9320 Core i7-1360P | |
| Lenovo ThinkPad X1 Nano Gen 3 | |
| Framework Laptop 13.5 Ryzen 7 7840U | |
| Asus ZenBook S13 OLED UX5304 | |
| HP Dragonfly G4 | |
| Moyenne AMD Ryzen 7 7840U, AMD Radeon 780M (1082 - 1775, n=10) | |
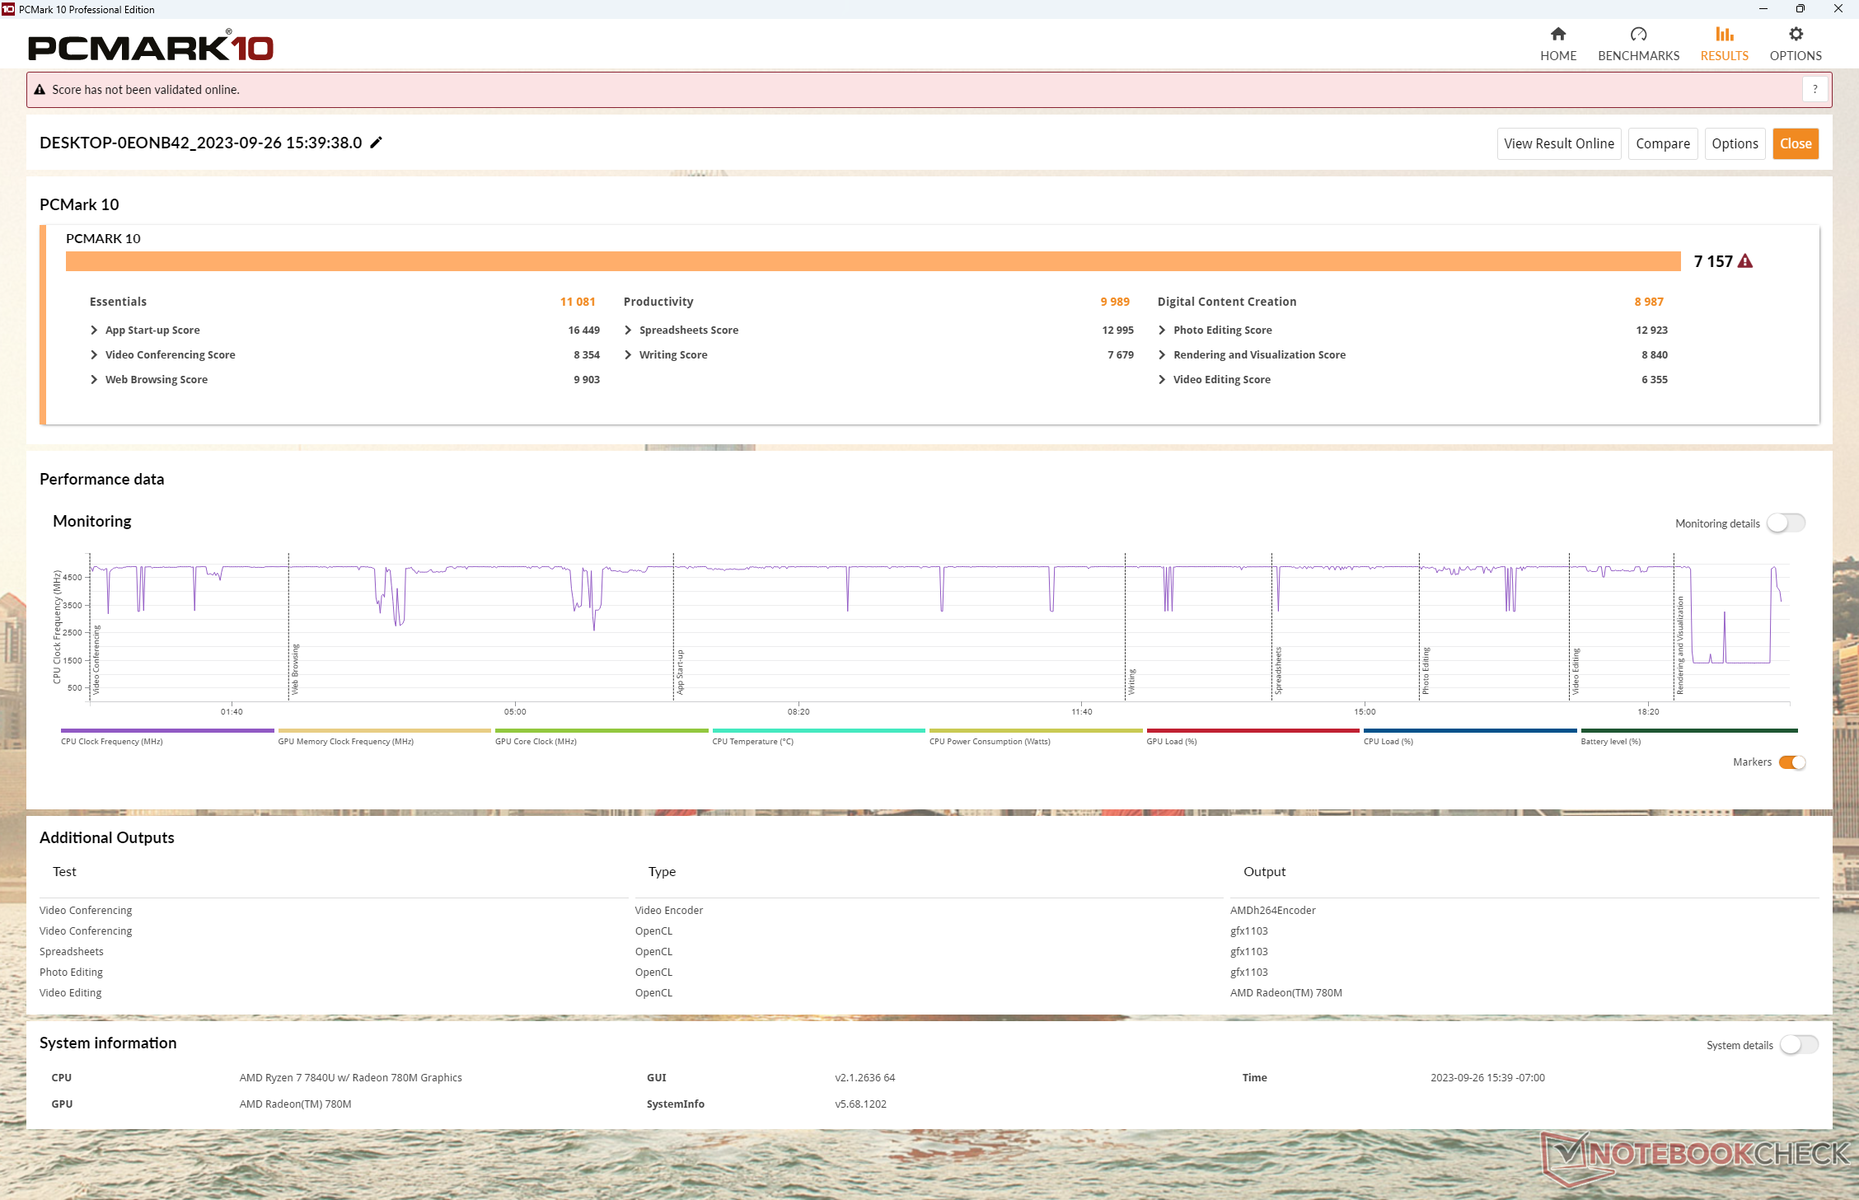
| PCMark 10 Score | 7157 points | |
Aide | ||
| AIDA64 / Memory Copy | |
| Dell XPS 13 Plus 9320 Core i7-1360P | |
| Lenovo ThinkPad X1 Nano Gen 3 | |
| Framework Laptop 13.5 Ryzen 7 7840U | |
| Asus ZenBook S13 OLED UX5304 | |
| HP Dragonfly G4 | |
| Moyenne AMD Ryzen 7 7840U (43255 - 70532, n=12) | |
| Framework Laptop 13.5 | |
| AIDA64 / Memory Read | |
| Dell XPS 13 Plus 9320 Core i7-1360P | |
| Lenovo ThinkPad X1 Nano Gen 3 | |
| Framework Laptop 13.5 Ryzen 7 7840U | |
| Asus ZenBook S13 OLED UX5304 | |
| HP Dragonfly G4 | |
| Moyenne AMD Ryzen 7 7840U (37399 - 61602, n=11) | |
| Framework Laptop 13.5 | |
| AIDA64 / Memory Write | |
| Lenovo ThinkPad X1 Nano Gen 3 | |
| Dell XPS 13 Plus 9320 Core i7-1360P | |
| Framework Laptop 13.5 Ryzen 7 7840U | |
| Asus ZenBook S13 OLED UX5304 | |
| HP Dragonfly G4 | |
| Moyenne AMD Ryzen 7 7840U (46797 - 92289, n=13) | |
| Framework Laptop 13.5 | |
| AIDA64 / Memory Latency | |
| Moyenne AMD Ryzen 7 7840U (90 - 137.2, n=12) | |
| Dell XPS 13 Plus 9320 Core i7-1360P | |
| Lenovo ThinkPad X1 Nano Gen 3 | |
| HP Dragonfly G4 | |
| Asus ZenBook S13 OLED UX5304 | |
| Framework Laptop 13.5 Ryzen 7 7840U | |
| Framework Laptop 13.5 | |
* ... Moindre est la valeur, meilleures sont les performances
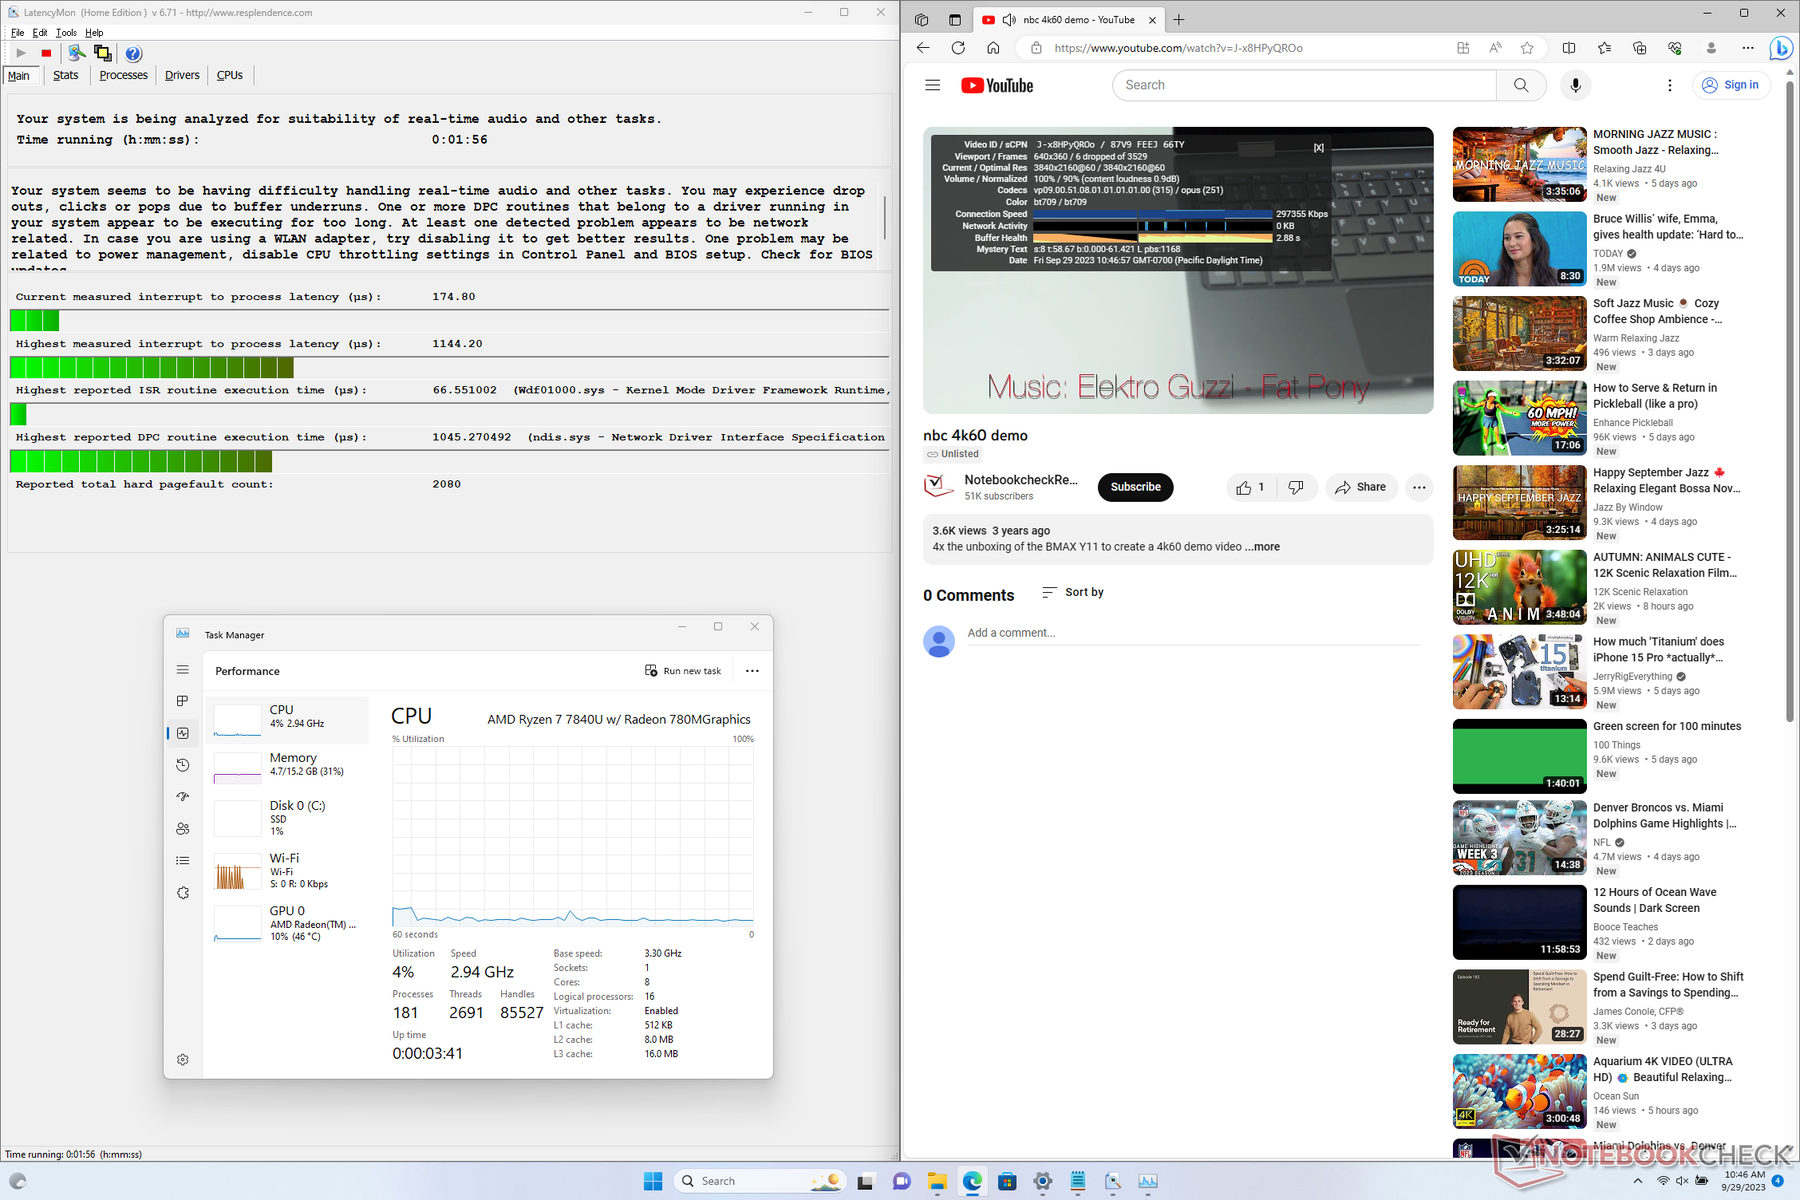
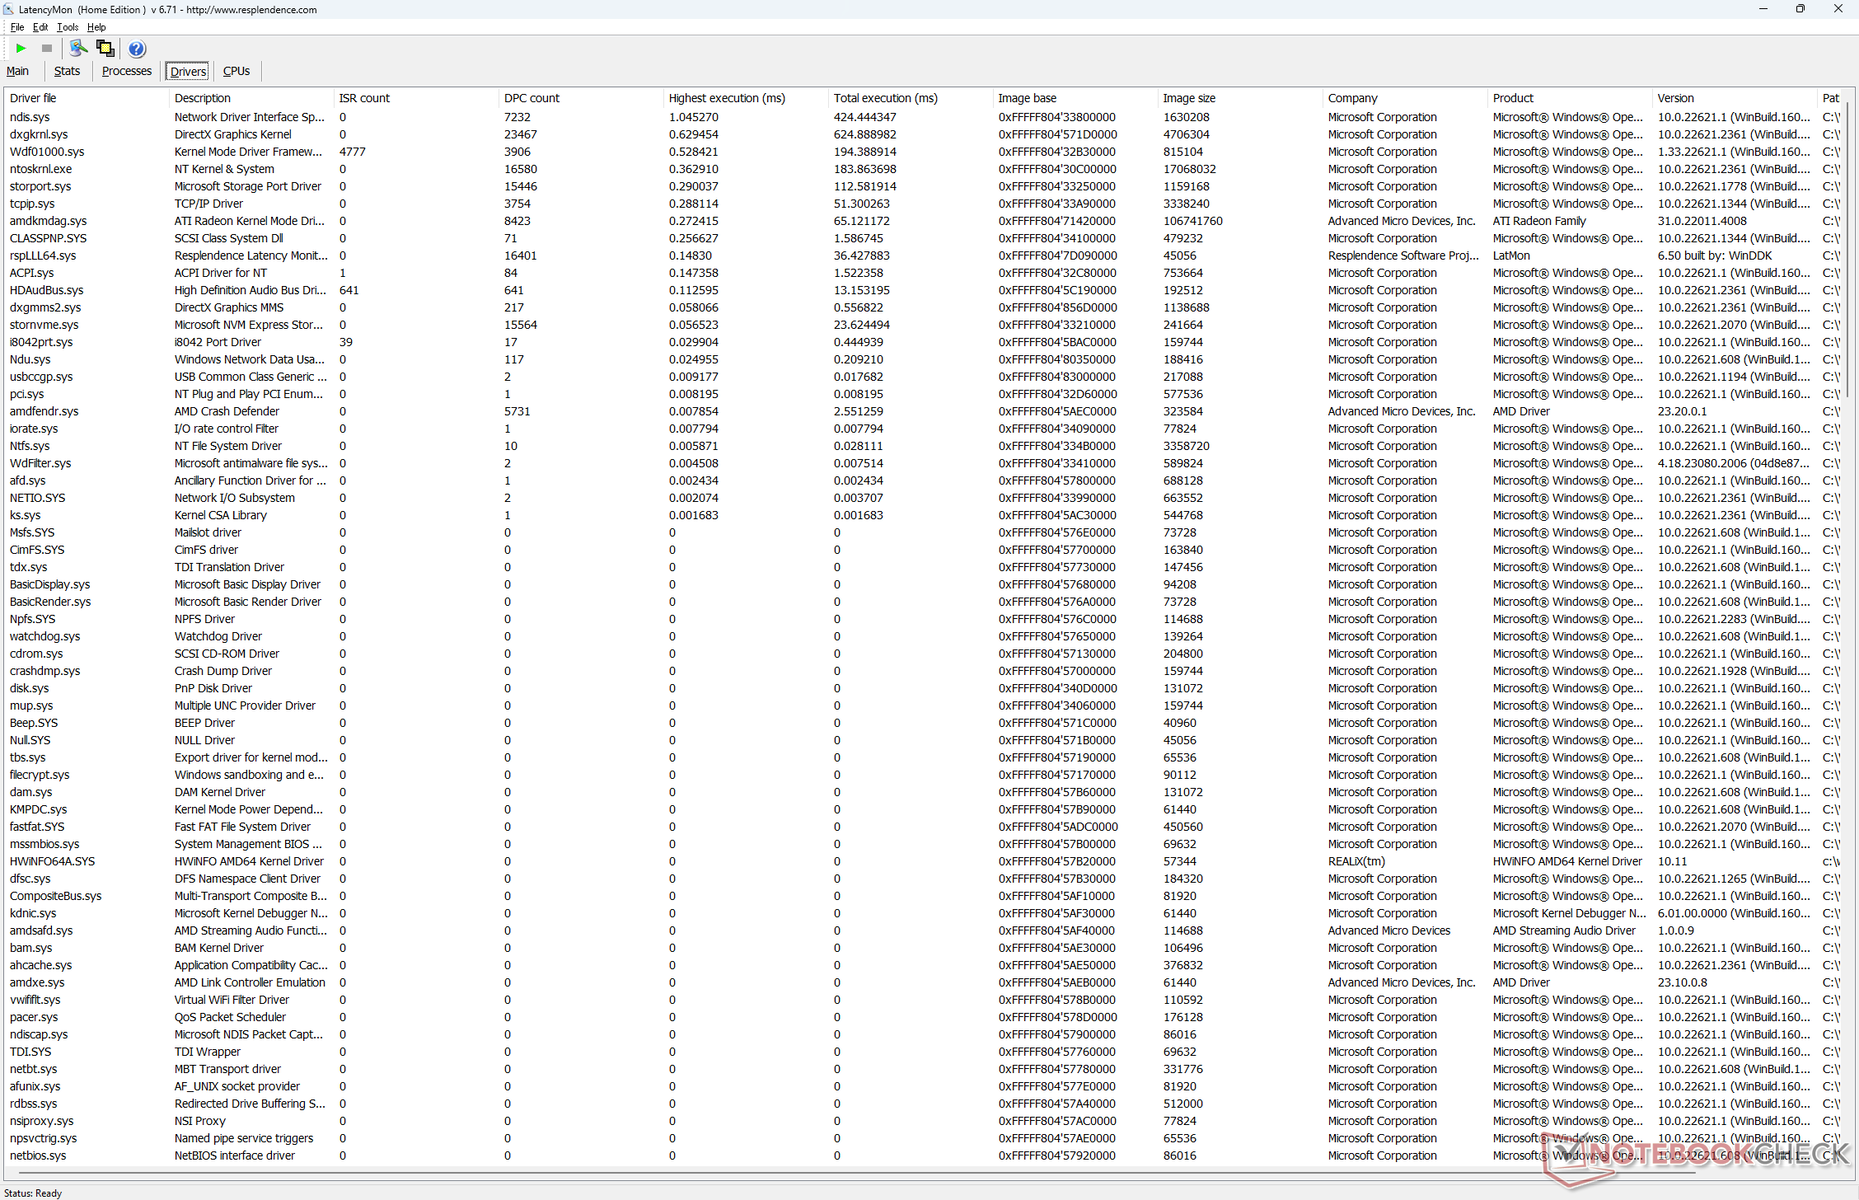
Latence DPC
LatencyMon ne révèle que de légers problèmes de DPC lors de l'ouverture de plusieurs onglets de notre page d'accueil. la lecture de vidéos 4K à 60 FPS est imparfaite avec 6 images perdues enregistrées pendant une minute. Les systèmes AMD tels que le Legion Slim 5 14 ou l'Aokzoe A1 semblent présenter plus de problèmes liés aux sauts d'images qu'Intel jusqu'à présent.
| DPC Latencies / LatencyMon - interrupt to process latency (max), Web, Youtube, Prime95 | |
| Dell XPS 13 Plus 9320 Core i7-1360P | |
| Lenovo ThinkPad X1 Nano Gen 3 | |
| Framework Laptop 13.5 | |
| Asus ZenBook S13 OLED UX5304 | |
| HP Dragonfly G4 | |
| Framework Laptop 13.5 Ryzen 7 7840U | |
* ... Moindre est la valeur, meilleures sont les performances
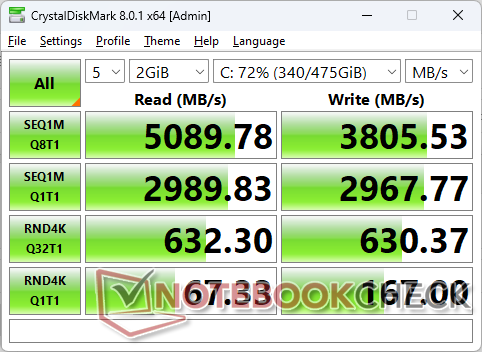
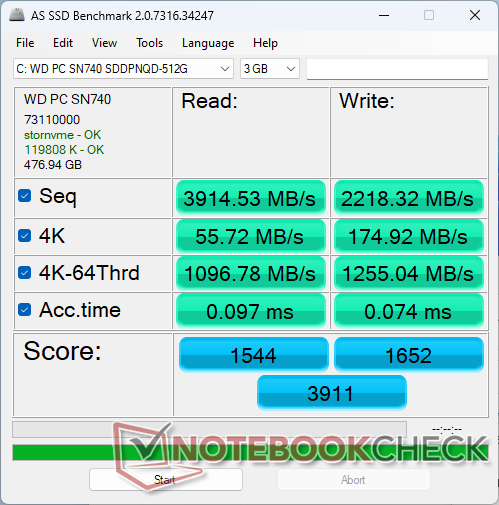
Dispositifs de stockage
Offres cadres uniquement Western Digital probablement en raison d'un accord d'exclusivité avec le fabricant de disques SSD. Bien entendu, les utilisateurs peuvent facilement installer leurs propres disques à la place de ceux qu'ils souhaitent.

* ... Moindre est la valeur, meilleures sont les performances
Disk Throttling: DiskSpd Read Loop, Queue Depth 8
Performance du GPU
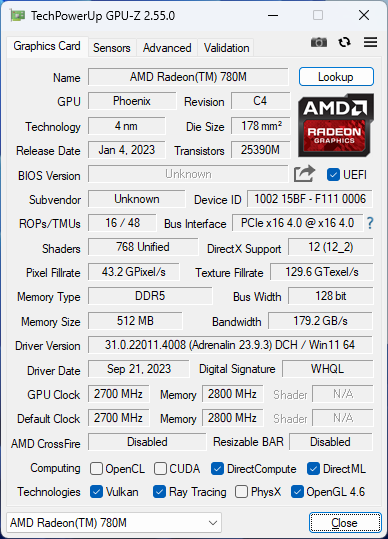
La Radeon 680M était déjà plus rapide que n'importe quelle solution intégrée d'Intel et la Radeon 780M de cette année renforce encore l'avance d'AMD. Les performances graphiques brutes sont de 30 à 50 % plus rapides que celles de la carte Iris Xe 96 EU Iris Xe 96 EU dans la récente version Intel 13e génération du Framework Laptop 13.5. Les avantages en termes de performances sont encore plus prononcés pour les applications compatibles avec DX12.
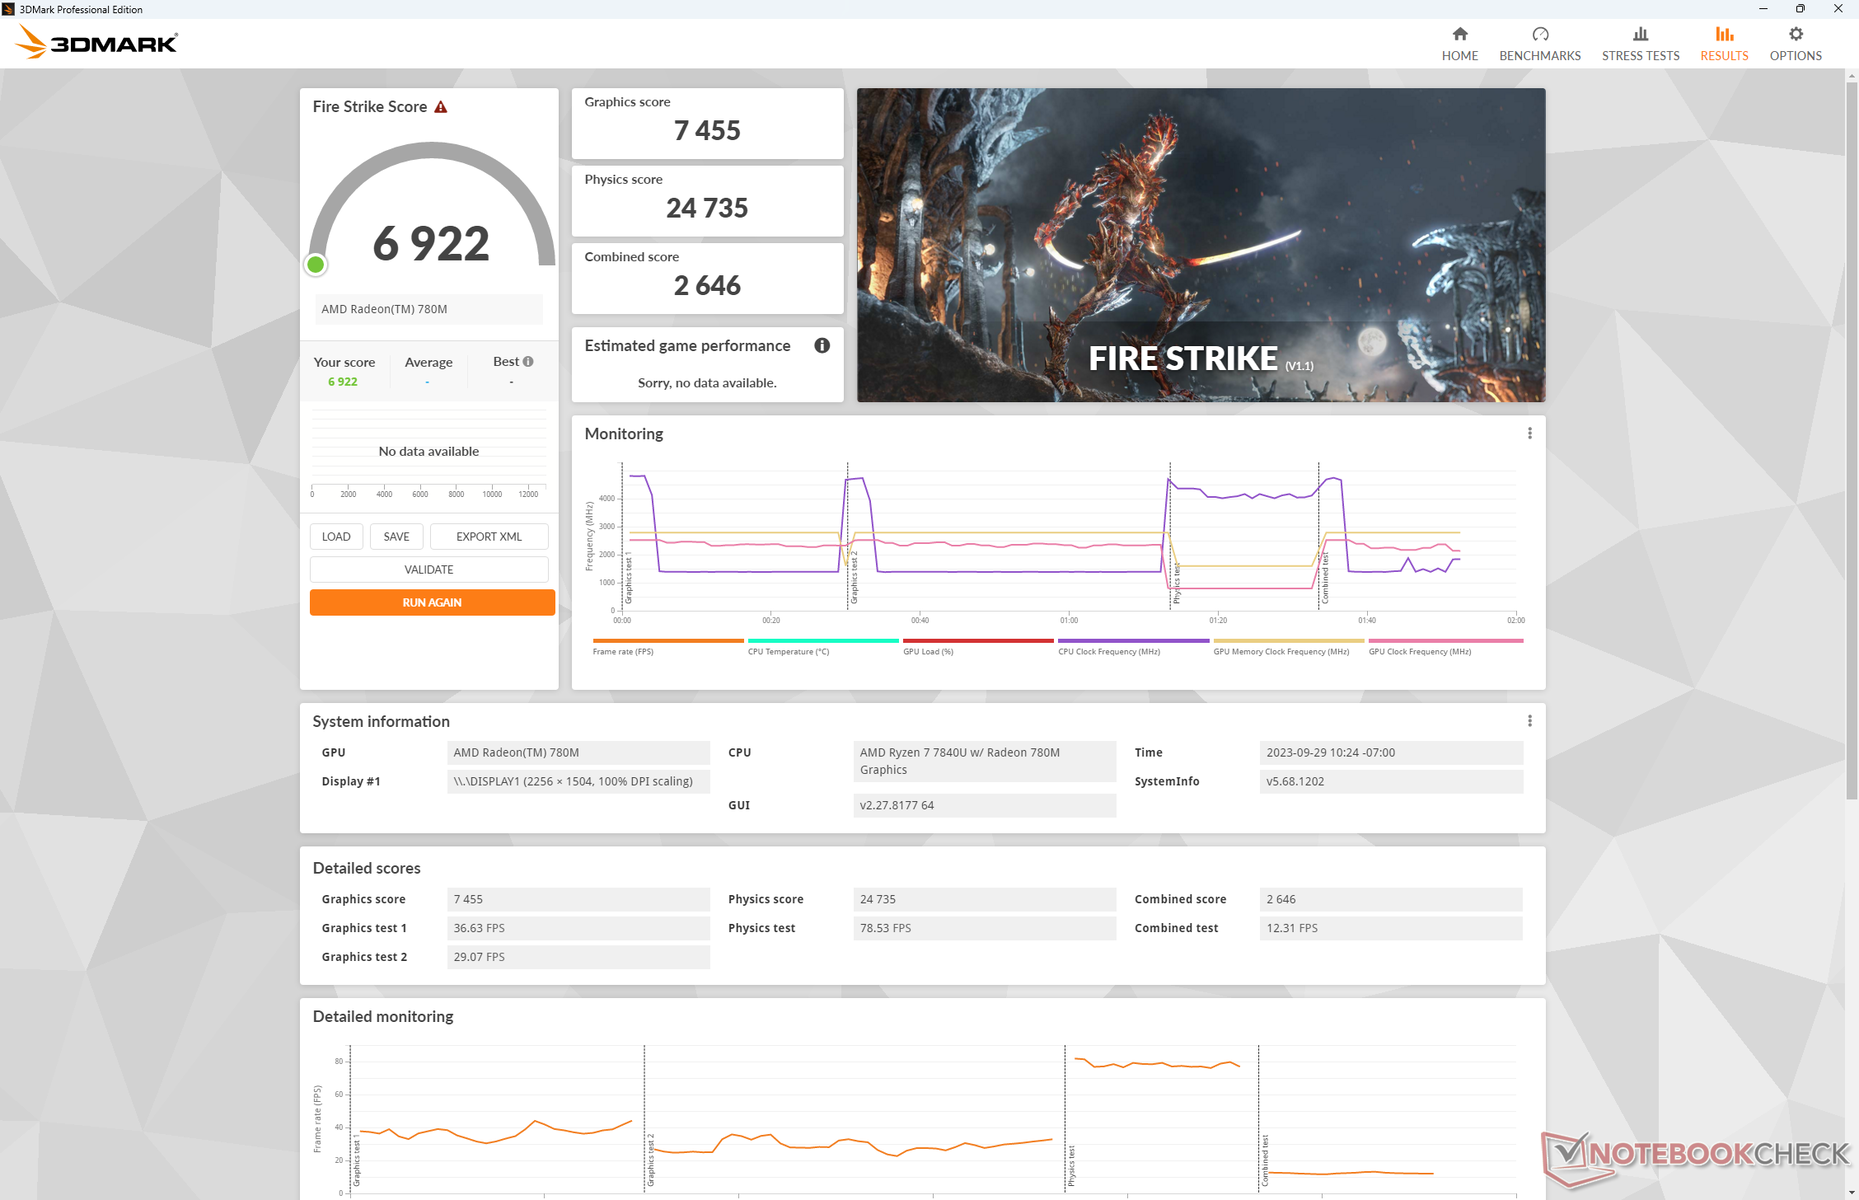
| Profil de puissance | Score graphique | Score physique | Score combiné |
| Mode Performance | 7455 | 24735 | 2646 |
| Mode équilibré | 7426 (-0%) | 24403 (-1%) | 2646 (-0%) |
| Alimentation par batterie | 6591 (-12%) | 24183 (-2%) | 2223 (-16%) |
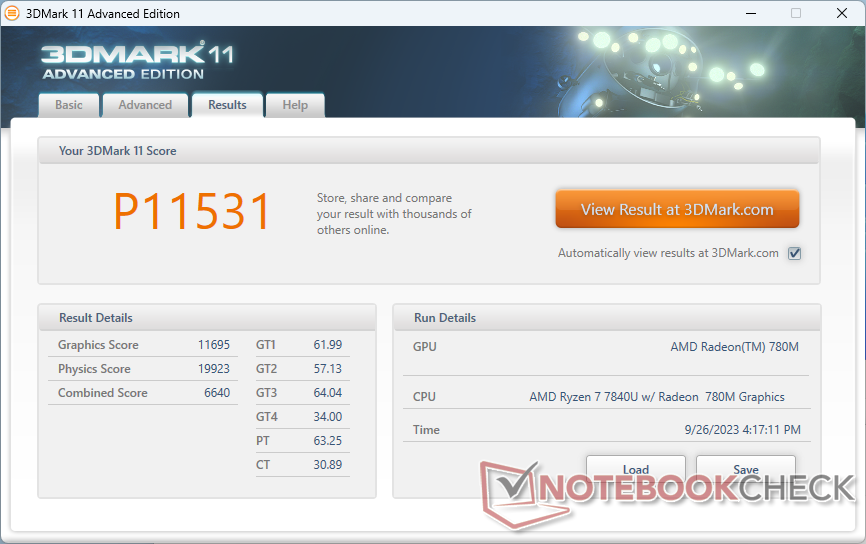
| 3DMark 11 Performance | 11531 points | |
| 3DMark Fire Strike Score | 6922 points | |
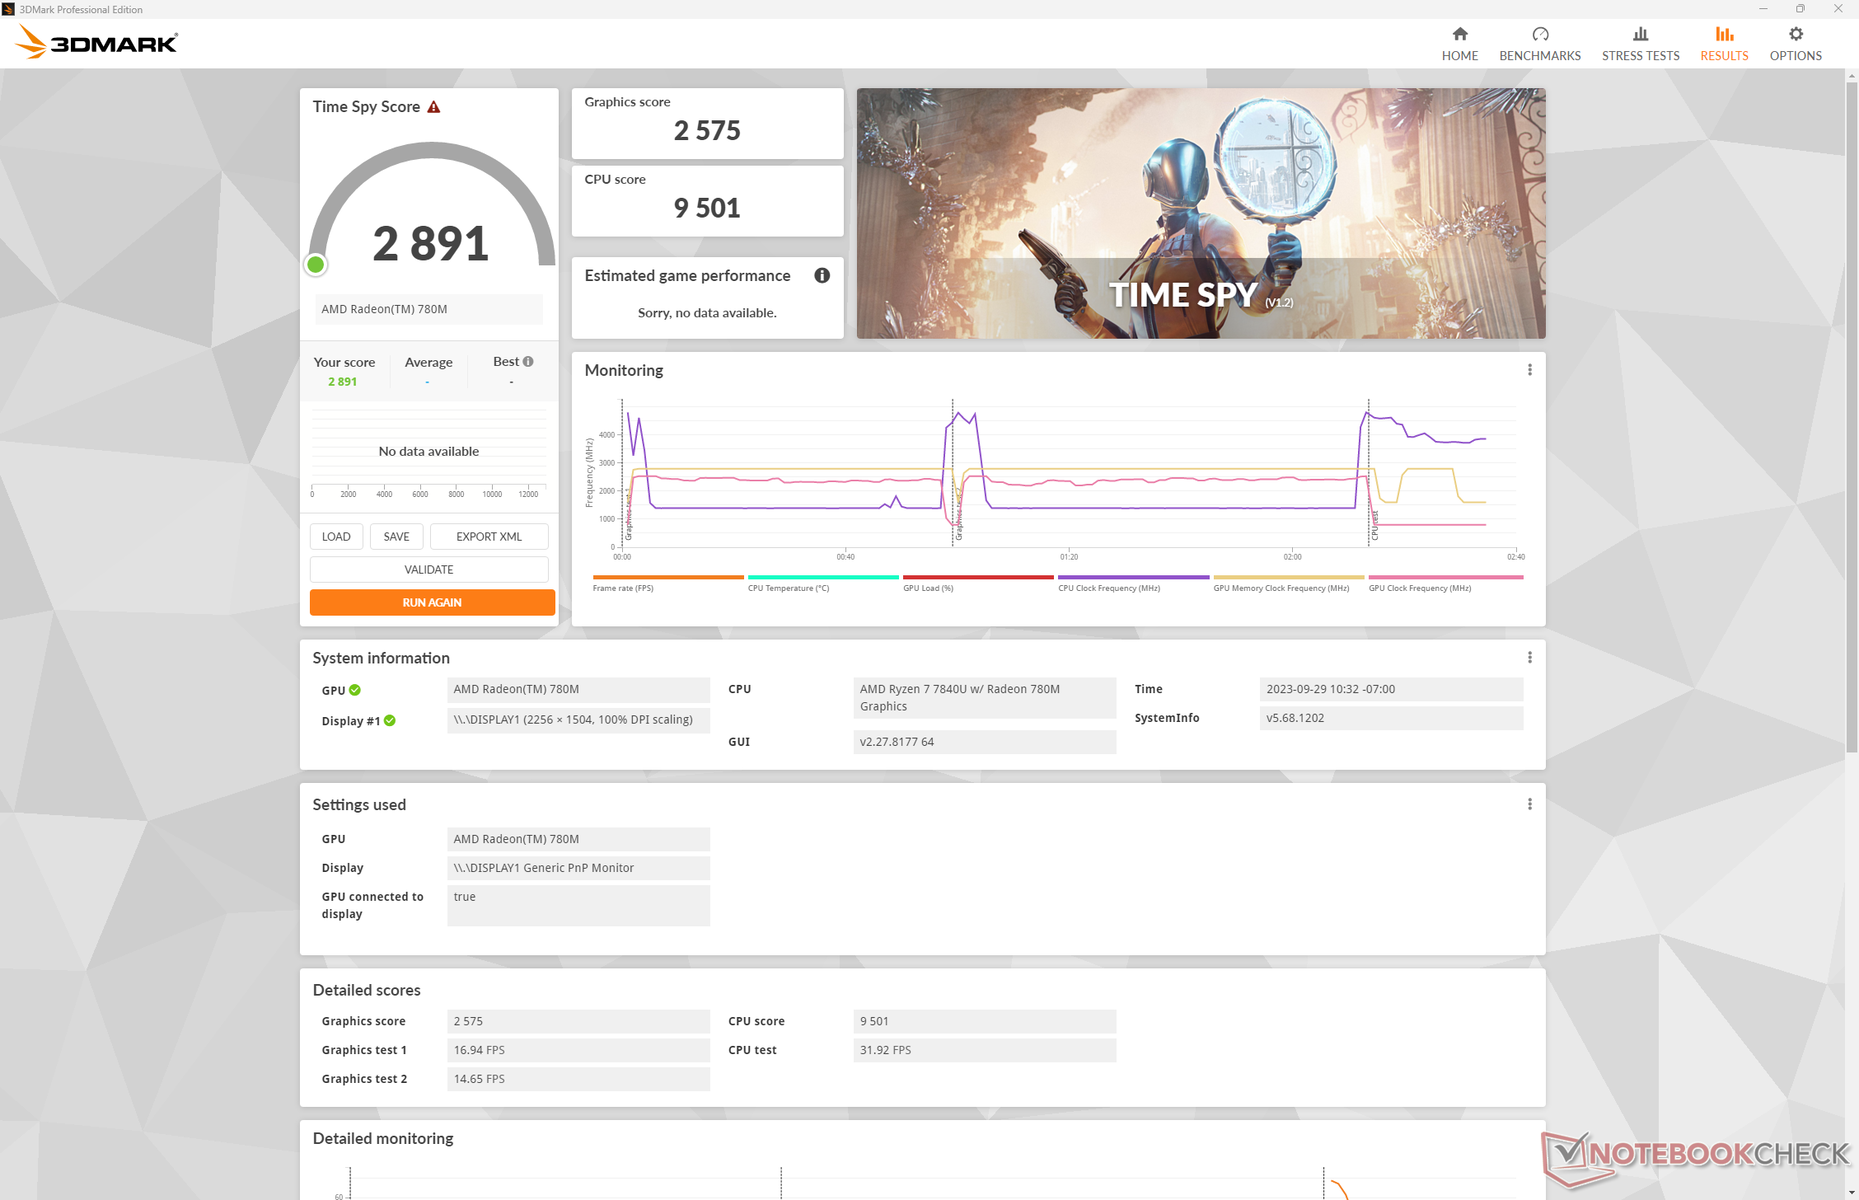
| 3DMark Time Spy Score | 2891 points | |
Aide | ||
* ... Moindre est la valeur, meilleures sont les performances
Performance des jeux
Le Framework Laptop 13.5 n'est pas une machine de jeu, mais le CPU Zen 4 est néanmoins capable de faire tourner la plupart des jeux raisonnablement bien à 1080p, y compris Cyberpunk 2077. Cela dit, nous avons rencontré des plantages lors de l'exécution de quelques titres, notamment F1 22 et Ratchet and Clank Rift Apart.
Witcher 3 FPS Chart
| Bas | Moyen | Élevé | Ultra | |
|---|---|---|---|---|
| The Witcher 3 (2015) | 136.2 | 45.9 | 28.7 | |
| Dota 2 Reborn (2015) | 154.1 | 119.3 | 76.2 | 71.2 |
| Final Fantasy XV Benchmark (2018) | 66.6 | 34.4 | 25.7 | |
| X-Plane 11.11 (2018) | 60 | 44.4 | 37.5 | |
| Far Cry 5 (2018) | 74 | 39 | 37 | 35 |
| Strange Brigade (2018) | 139.8 | 59.7 | 50.5 | 43 |
| Cyberpunk 2077 1.6 (2022) | 39.5 | 30.9 | 24.6 | 23 |
| Tiny Tina's Wonderlands (2022) | 60.4 | 44.8 | 30.4 | 25.2 |
| F1 22 (2022) | 80.6 | 72.5 | 54.2 |
Émissions
Bruit du système
Le bruit du ventilateur lors de l'exécution de charges exigeantes est à peu près le même que celui que nous avons enregistré sur la configuration Intel Core-P. Le Framework reste l'un des subnotebooks les plus bruyants lorsqu'il est soumis à un niveau sonore de 46 à 49 dB(A), comparé aux 40 dB(A) de la plupart des autres subnotebooks. Nous avons également remarqué que le ventilateur émettait des pulsations plus fréquentes.
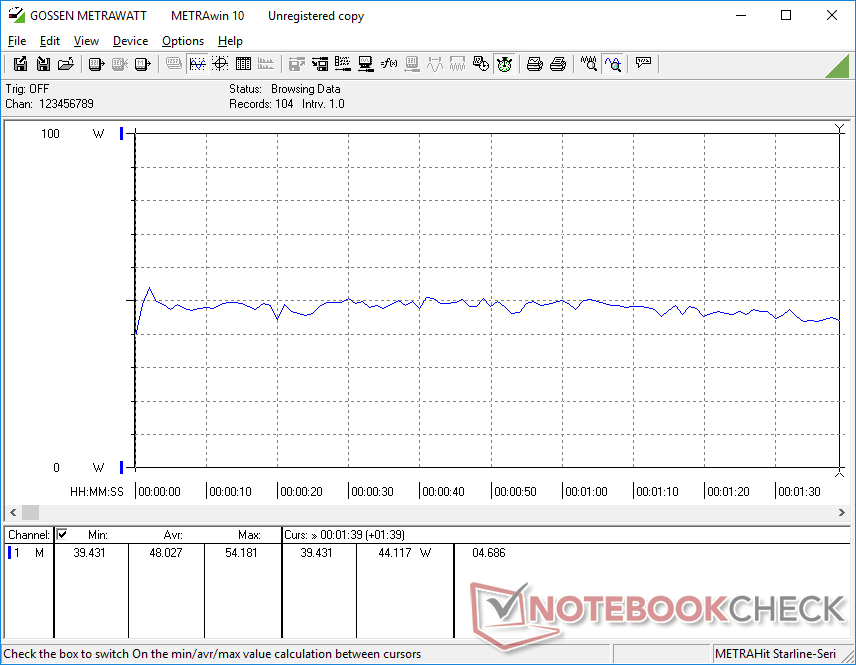
Au crédit de Framework, le temps de montée en puissance du bruit du ventilateur est relativement lent et régulier sur la configuration AMD, ce qui signifie que le système est capable de rester relativement silencieux lorsqu'il fonctionne avec des charges moins exigeantes comme la navigation ou le streaming vidéo.
Degré de la nuisance sonore
| Au repos |
| 22.6 / 22.6 / 24.2 dB(A) |
| Fortement sollicité |
| 35.8 / 48.9 dB(A) |
 | ||
30 dB silencieux 40 dB(A) audible 50 dB(A) bruyant |
||
min: | ||
| Framework Laptop 13.5 Ryzen 7 7840U Radeon 780M, R7 7840U, WD PC SN740 512GB SDDPNQD-512G | Framework Laptop 13.5 Iris Xe G7 96EUs, i7-1165G7, Western Digital WD_BLACK SN850 WDS100T1X0E | Lenovo ThinkPad X1 Nano Gen 3 Iris Xe G7 96EUs, i7-1360P, Lenovo UMIS AM6A0 RPJTJ512MKP1QDQ | HP Dragonfly G4 Iris Xe G7 96EUs, i7-1365U, Micron 3400 MTFDKBA512TFH 512GB | Dell XPS 13 Plus 9320 Core i7-1360P Iris Xe G7 96EUs, i7-1360P, Samsung PM9A1 MZVL2512HCJQ | Asus ZenBook S13 OLED UX5304 Iris Xe G7 96EUs, i7-1355U, Samsung PM9A1 MZVL21T0HCLR | |
|---|---|---|---|---|---|---|
| Noise | -6% | 8% | 9% | 0% | 3% | |
| arrêt / environnement * (dB) | 22.6 | 23.9 -6% | 22.9 -1% | 23.3 -3% | 23.7 -5% | 23.3 -3% |
| Idle Minimum * (dB) | 22.6 | 23.9 -6% | 23 -2% | 23.5 -4% | 24 -6% | 23.3 -3% |
| Idle Average * (dB) | 22.6 | 23.9 -6% | 23 -2% | 23.5 -4% | 24 -6% | 23.3 -3% |
| Idle Maximum * (dB) | 24.2 | 23.9 1% | 23 5% | 26.8 -11% | 24.4 -1% | 23.3 4% |
| Load Average * (dB) | 35.8 | 45.6 -27% | 32.8 8% | 27.2 24% | 37 -3% | 37.7 -5% |
| Witcher 3 ultra * (dB) | 46.5 | 47.1 -1% | 36.9 21% | 32.7 30% | 42.1 9% | 40.1 14% |
| Load Maximum * (dB) | 48.9 | 47.9 2% | 36.9 25% | 35 28% | 42 14% | 40.1 18% |
* ... Moindre est la valeur, meilleures sont les performances
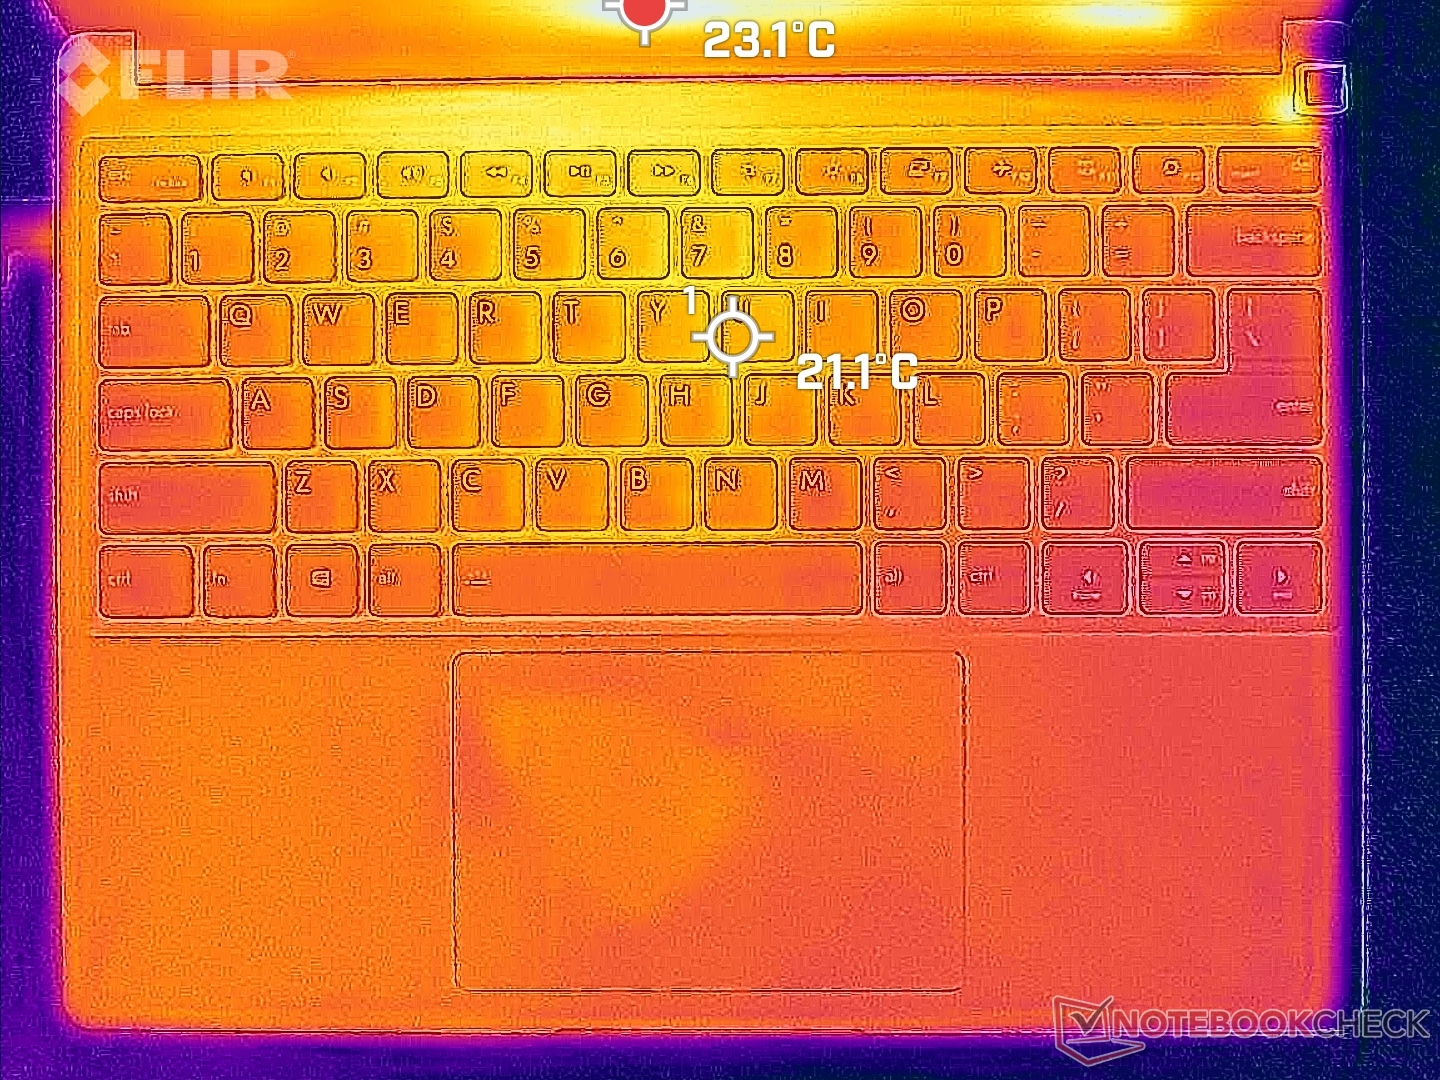
Température
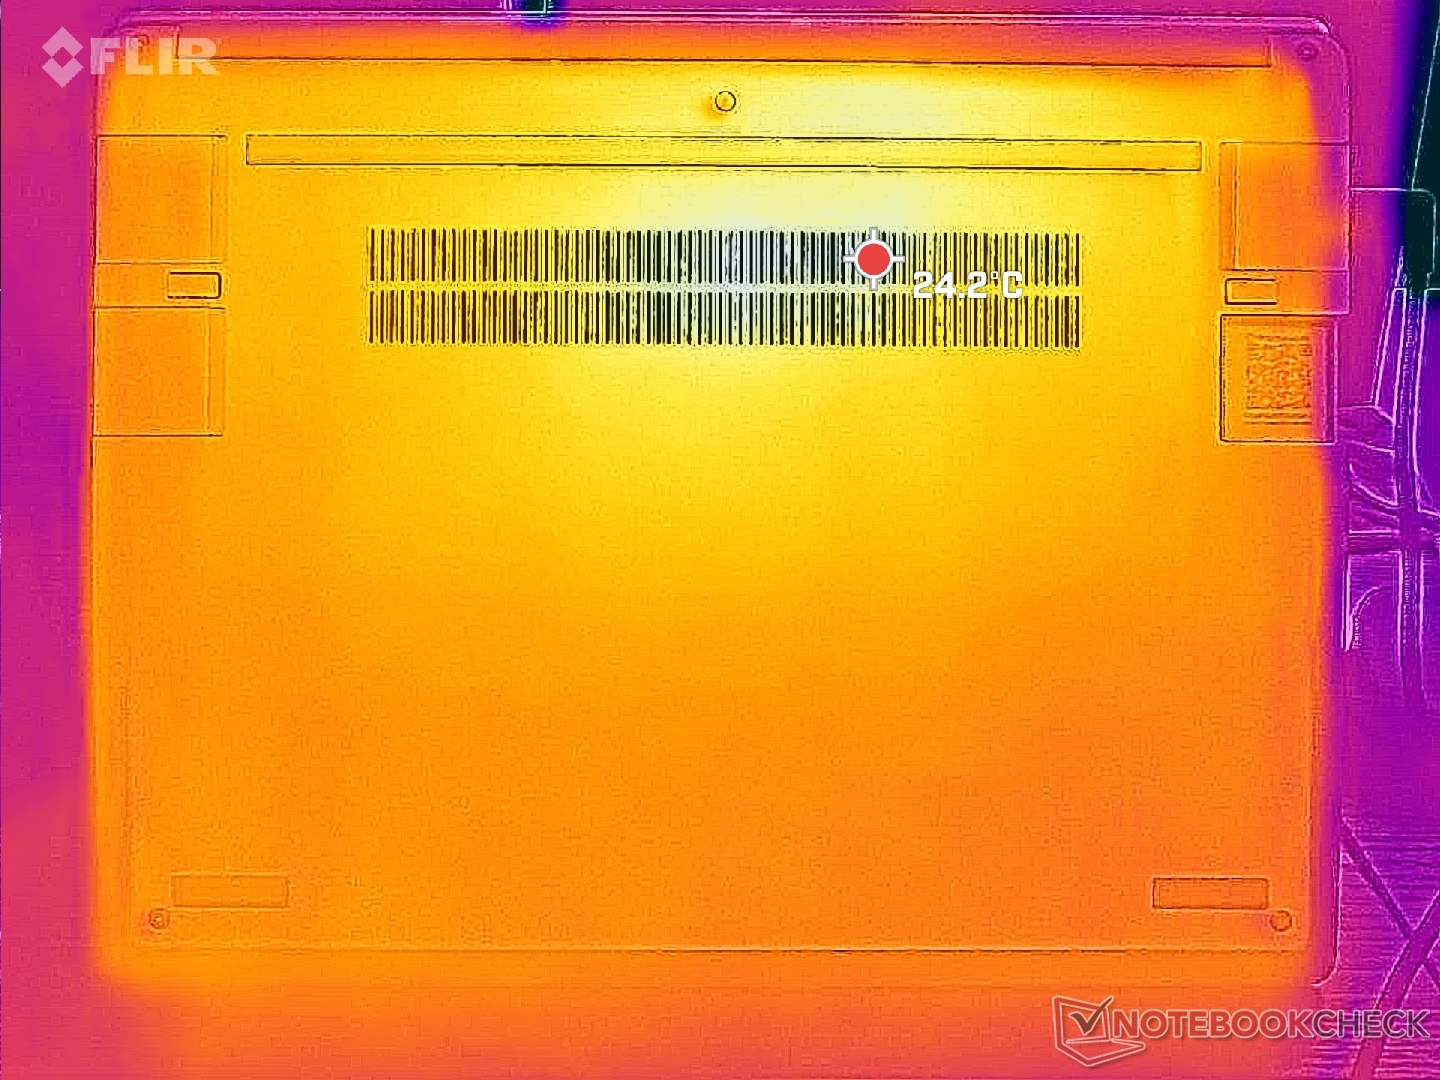
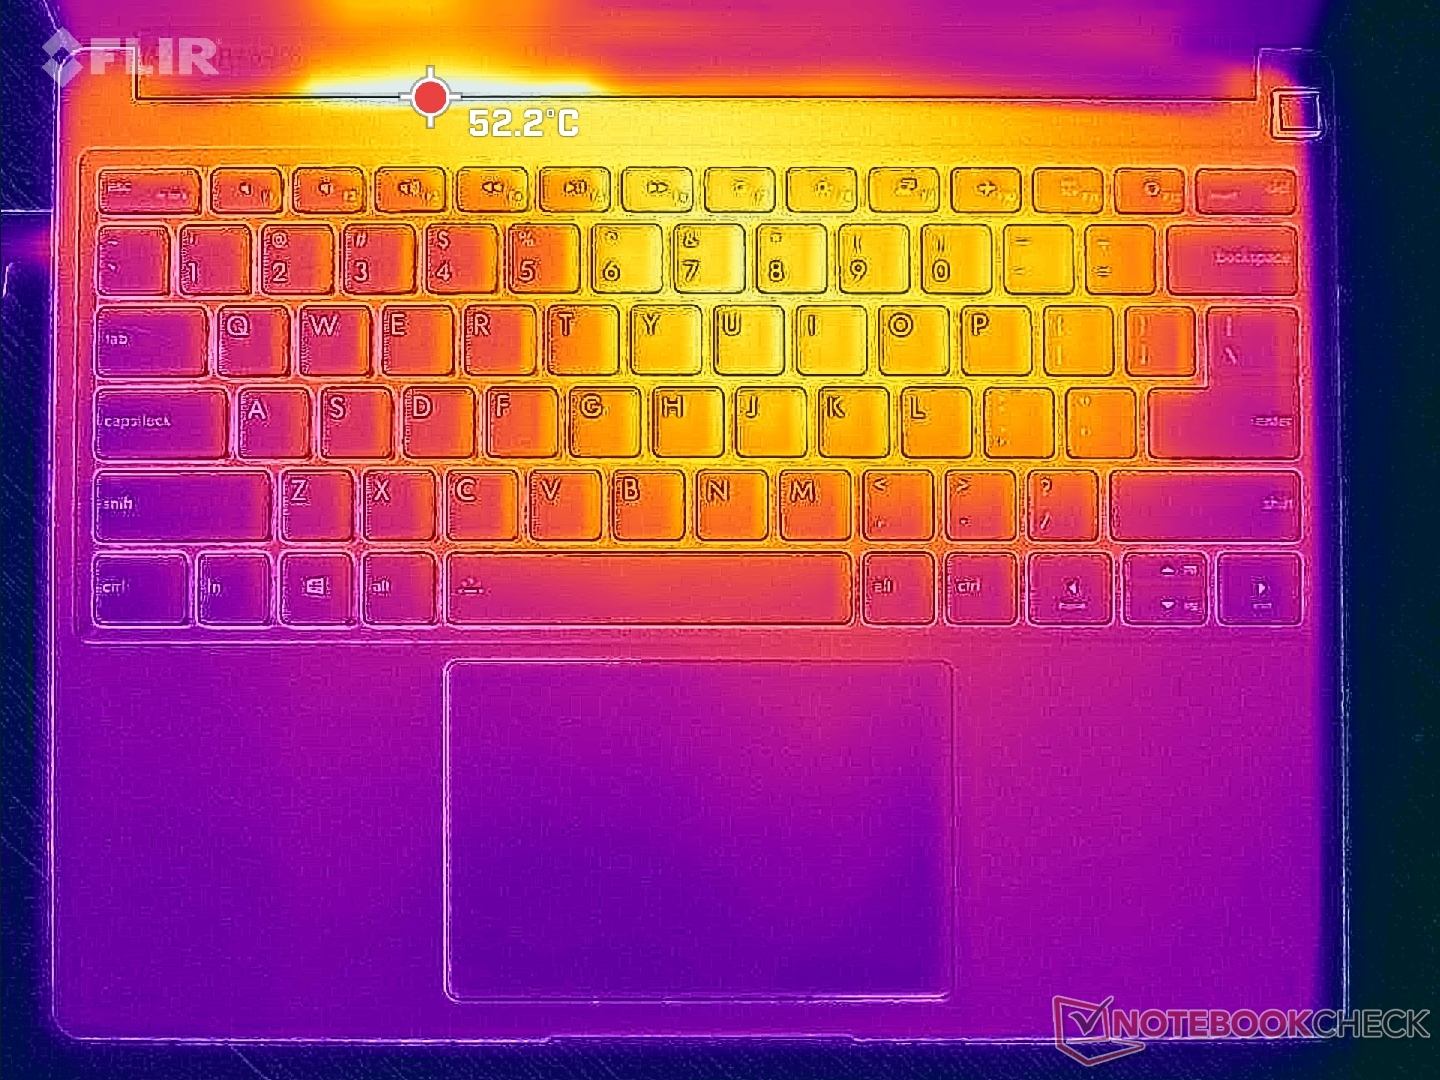
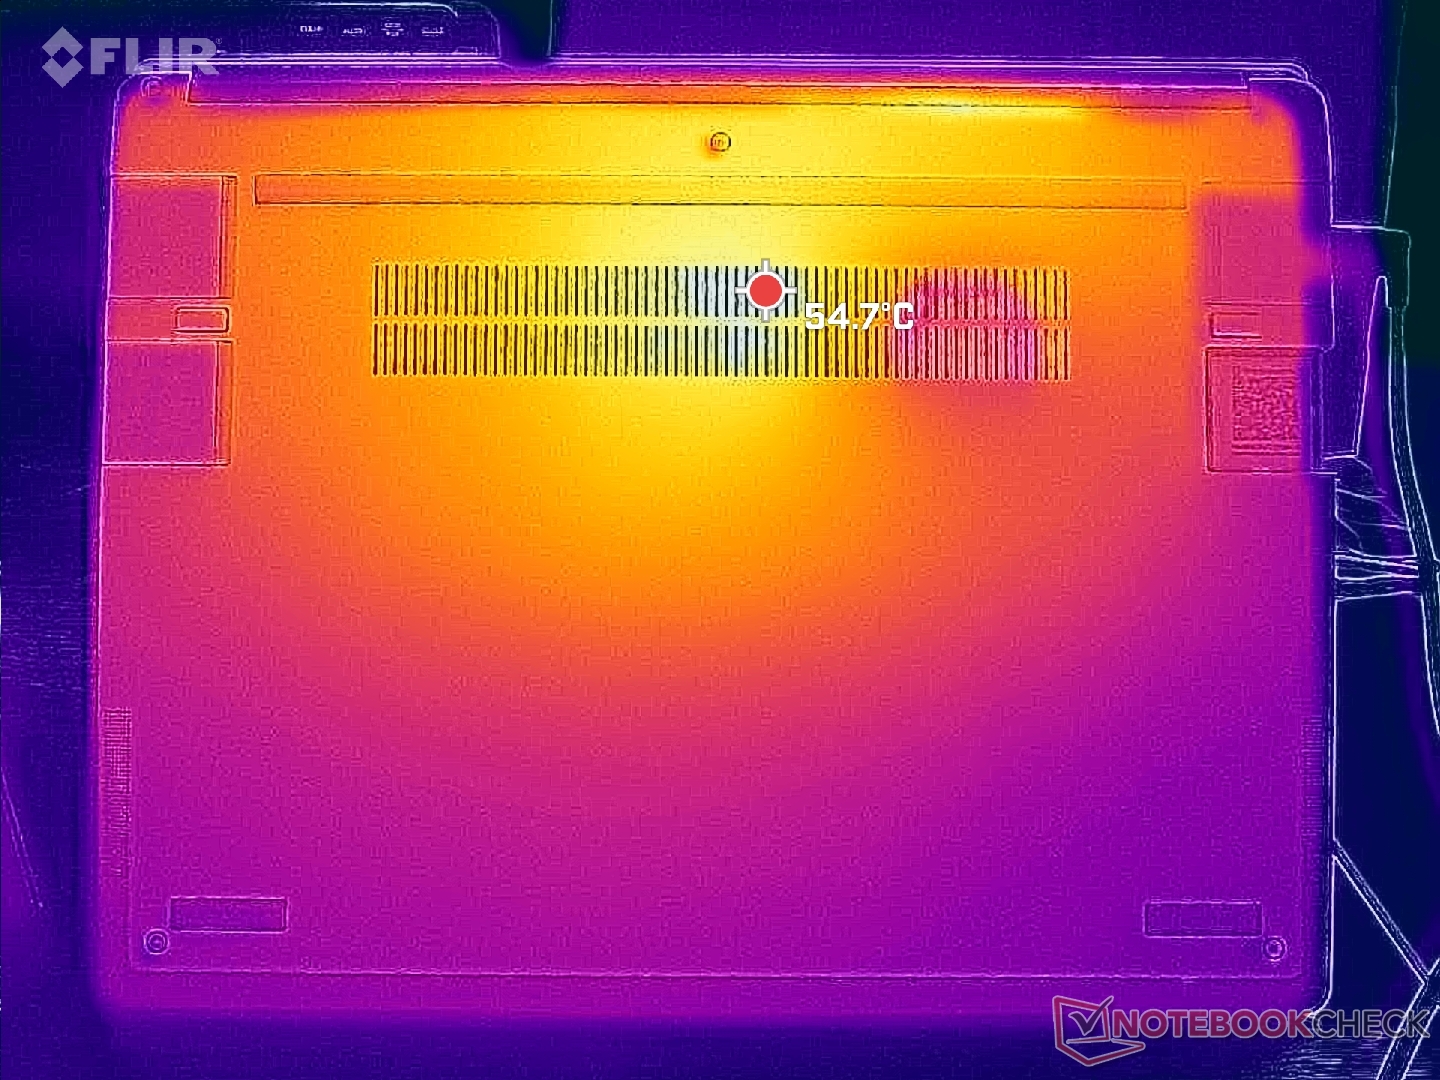
Les températures de surface ne sont pas plus froides que celles de la version Intel et peuvent même être plus chaudes. Les températures moyennes de notre système AMD seraient plus élevées de quelques degrés C sur les faces supérieure et inférieure, mais on ne peut jamais exclure totalement les différences de température d'arrière-plan. Les alternatives avec des processeurs plus lents comme leHP Spectre x360 13.5 fonctionnent plus froidement.
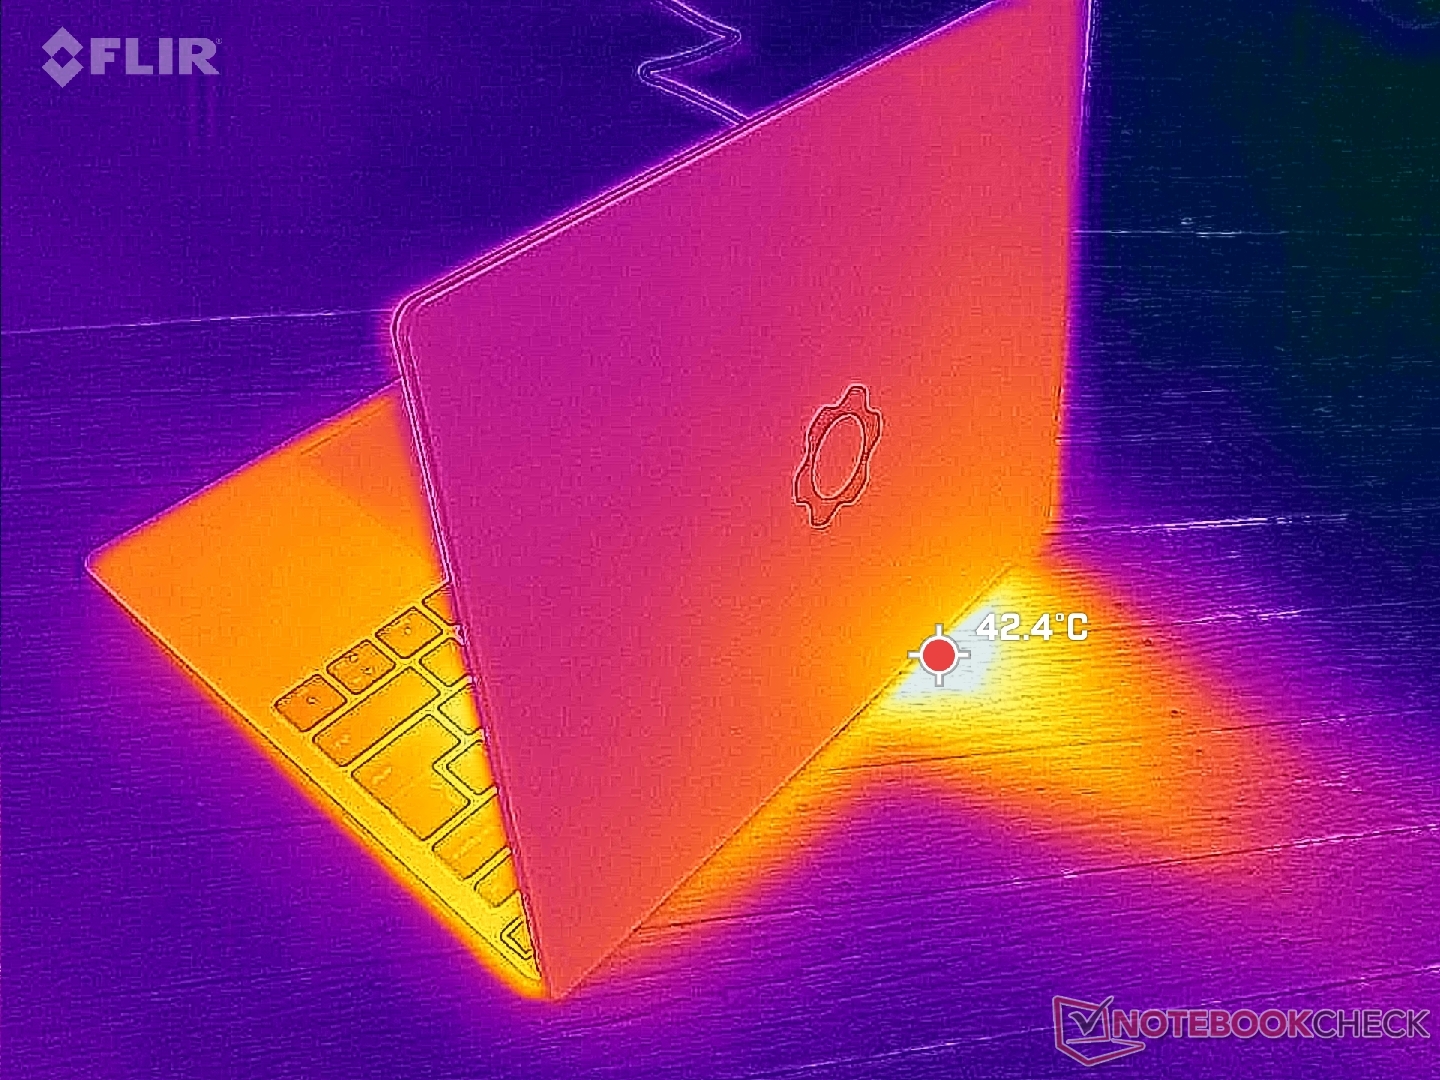
(±) La température maximale du côté supérieur est de 42 °C / 108 F, par rapport à la moyenne de 34.3 °C / 94 F, allant de 21.2 à 62.5 °C pour la classe Office.
(-) Le fond chauffe jusqu'à un maximum de 47.4 °C / 117 F, contre une moyenne de 36.8 °C / 98 F
(+) En utilisation inactive, la température moyenne du côté supérieur est de 27.5 °C / 82 F, par rapport à la moyenne du dispositif de 29.5 °C / 85 F.
(+) Les repose-poignets et le pavé tactile sont plus froids que la température de la peau avec un maximum de 27.8 °C / 82 F et sont donc froids au toucher.
(±) La température moyenne de la zone de l'appui-paume de dispositifs similaires était de 27.5 °C / 81.5 F (-0.3 °C / #-0.5 F).
| Framework Laptop 13.5 Ryzen 7 7840U AMD Ryzen 7 7840U, AMD Radeon 780M | Framework Laptop 13.5 Intel Core i7-1165G7, Intel Iris Xe Graphics G7 96EUs | Lenovo ThinkPad X1 Nano Gen 3 Intel Core i7-1360P, Intel Iris Xe Graphics G7 96EUs | HP Dragonfly G4 Intel Core i7-1365U, Intel Iris Xe Graphics G7 96EUs | Dell XPS 13 Plus 9320 Core i7-1360P Intel Core i7-1360P, Intel Iris Xe Graphics G7 96EUs | Asus ZenBook S13 OLED UX5304 Intel Core i7-1355U, Intel Iris Xe Graphics G7 96EUs | |
|---|---|---|---|---|---|---|
| Heat | 6% | 7% | 7% | 9% | 3% | |
| Maximum Upper Side * (°C) | 42 | 47.2 -12% | 44 -5% | 38.6 8% | 43.8 -4% | 43.1 -3% |
| Maximum Bottom * (°C) | 47.4 | 39.4 17% | 43.2 9% | 40.4 15% | 44.4 6% | 45 5% |
| Idle Upper Side * (°C) | 28.8 | 25.2 12% | 25.6 11% | 28.2 2% | 24 17% | 27.3 5% |
| Idle Bottom * (°C) | 29.6 | 27.8 6% | 25.6 14% | 29 2% | 25.2 15% | 27.8 6% |
* ... Moindre est la valeur, meilleures sont les performances
Test de stress
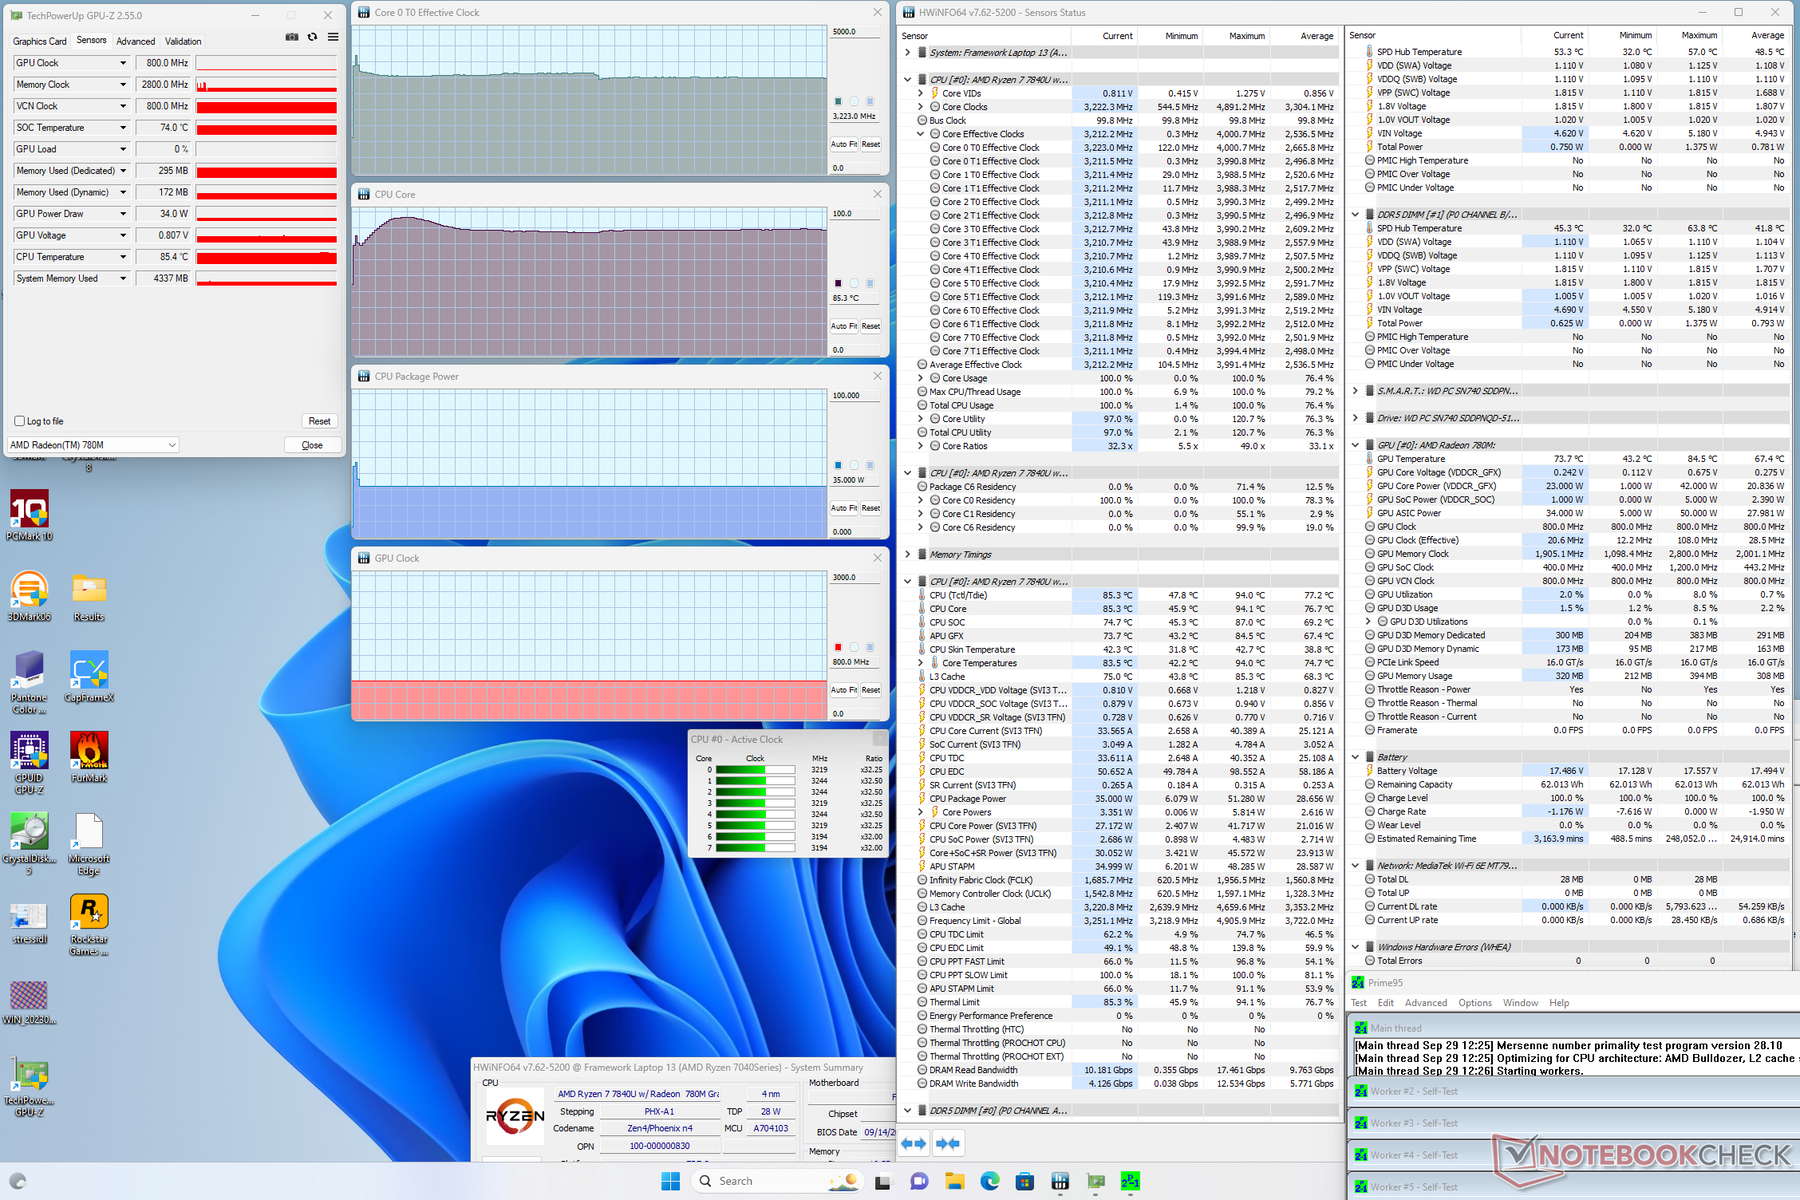
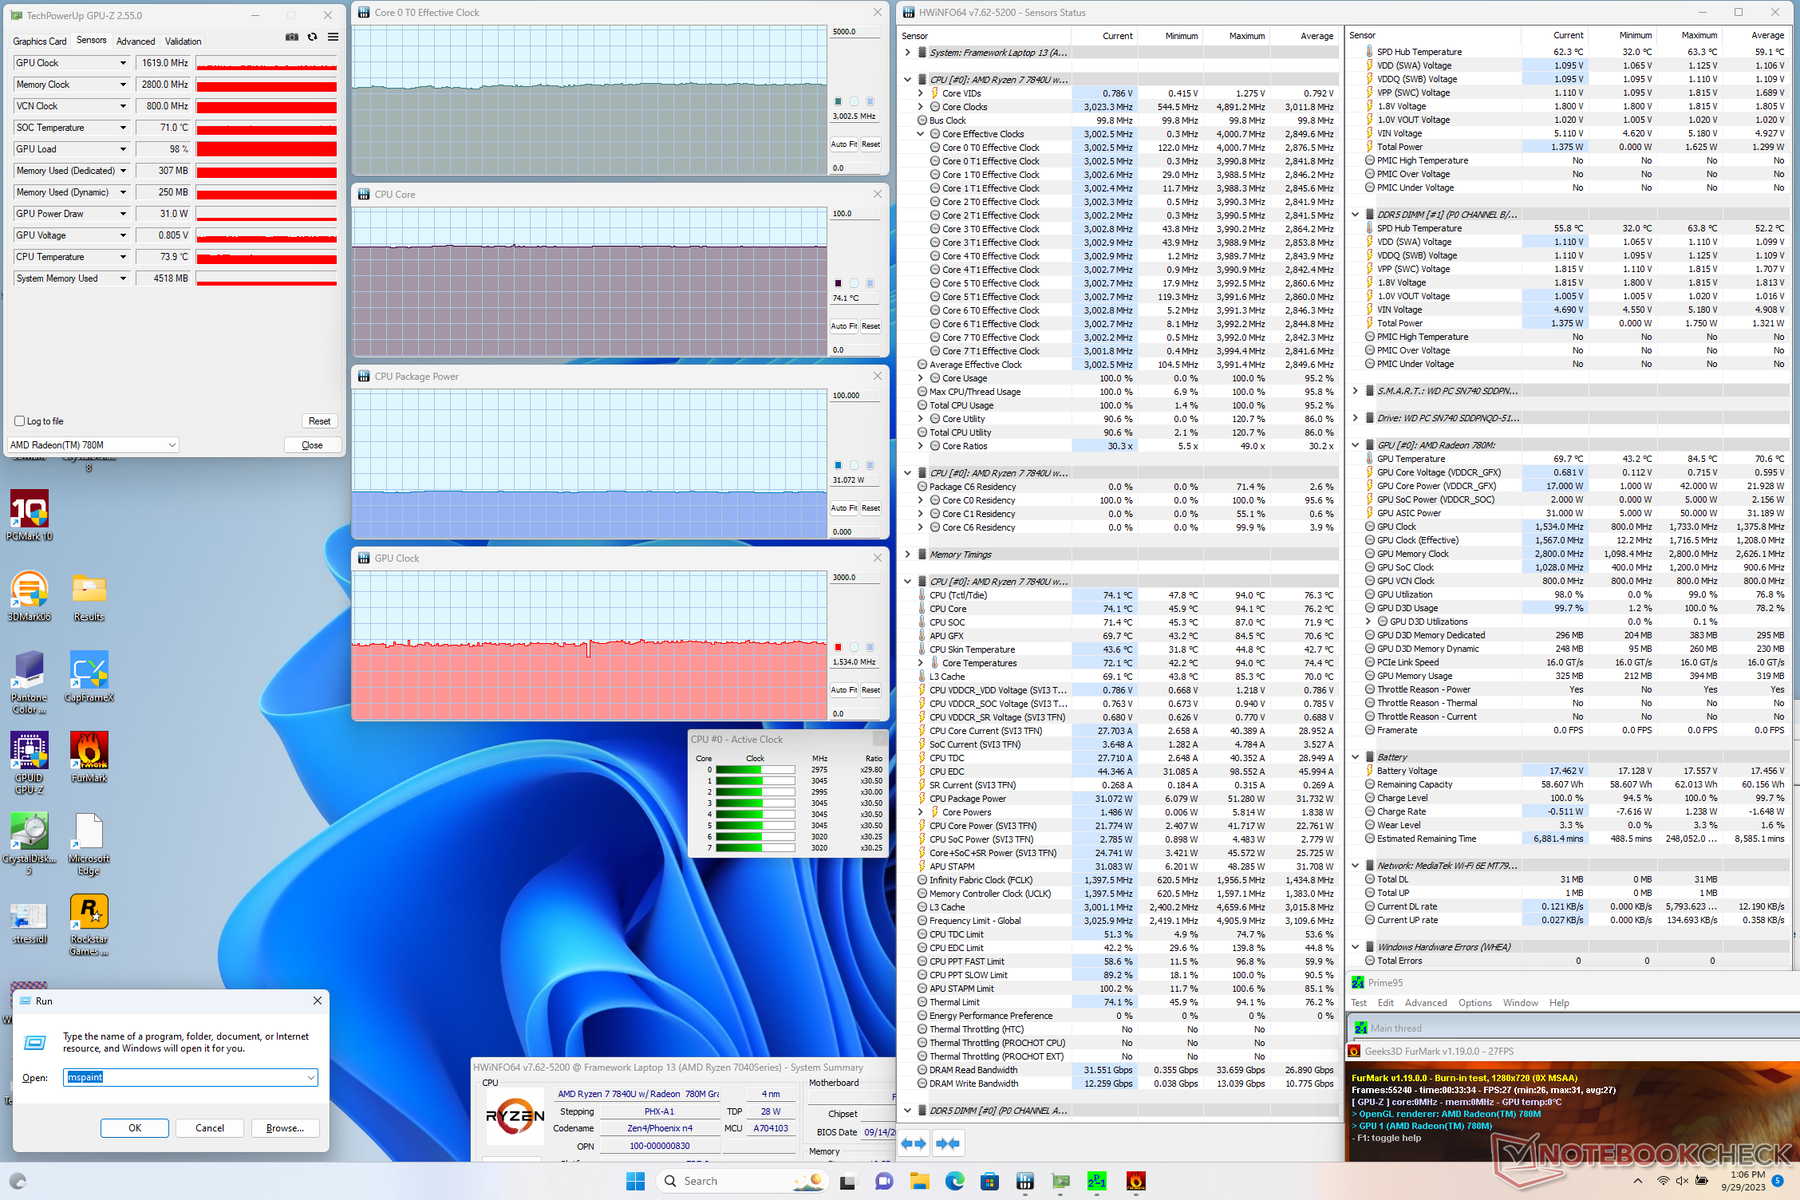
La fréquence d'horloge du processeur et la consommation électrique de la carte atteignent respectivement 4 GHz et 51 W, pendant quelques secondes tout au plus, avant de se stabiliser à 3,2 GHz, 35 W et 85 C. Si l'on répète ce test avec la version Intel du Core i7, on obtient des températures de cœur similaires, mais avec une consommation électrique légèrement inférieure de 30 W.
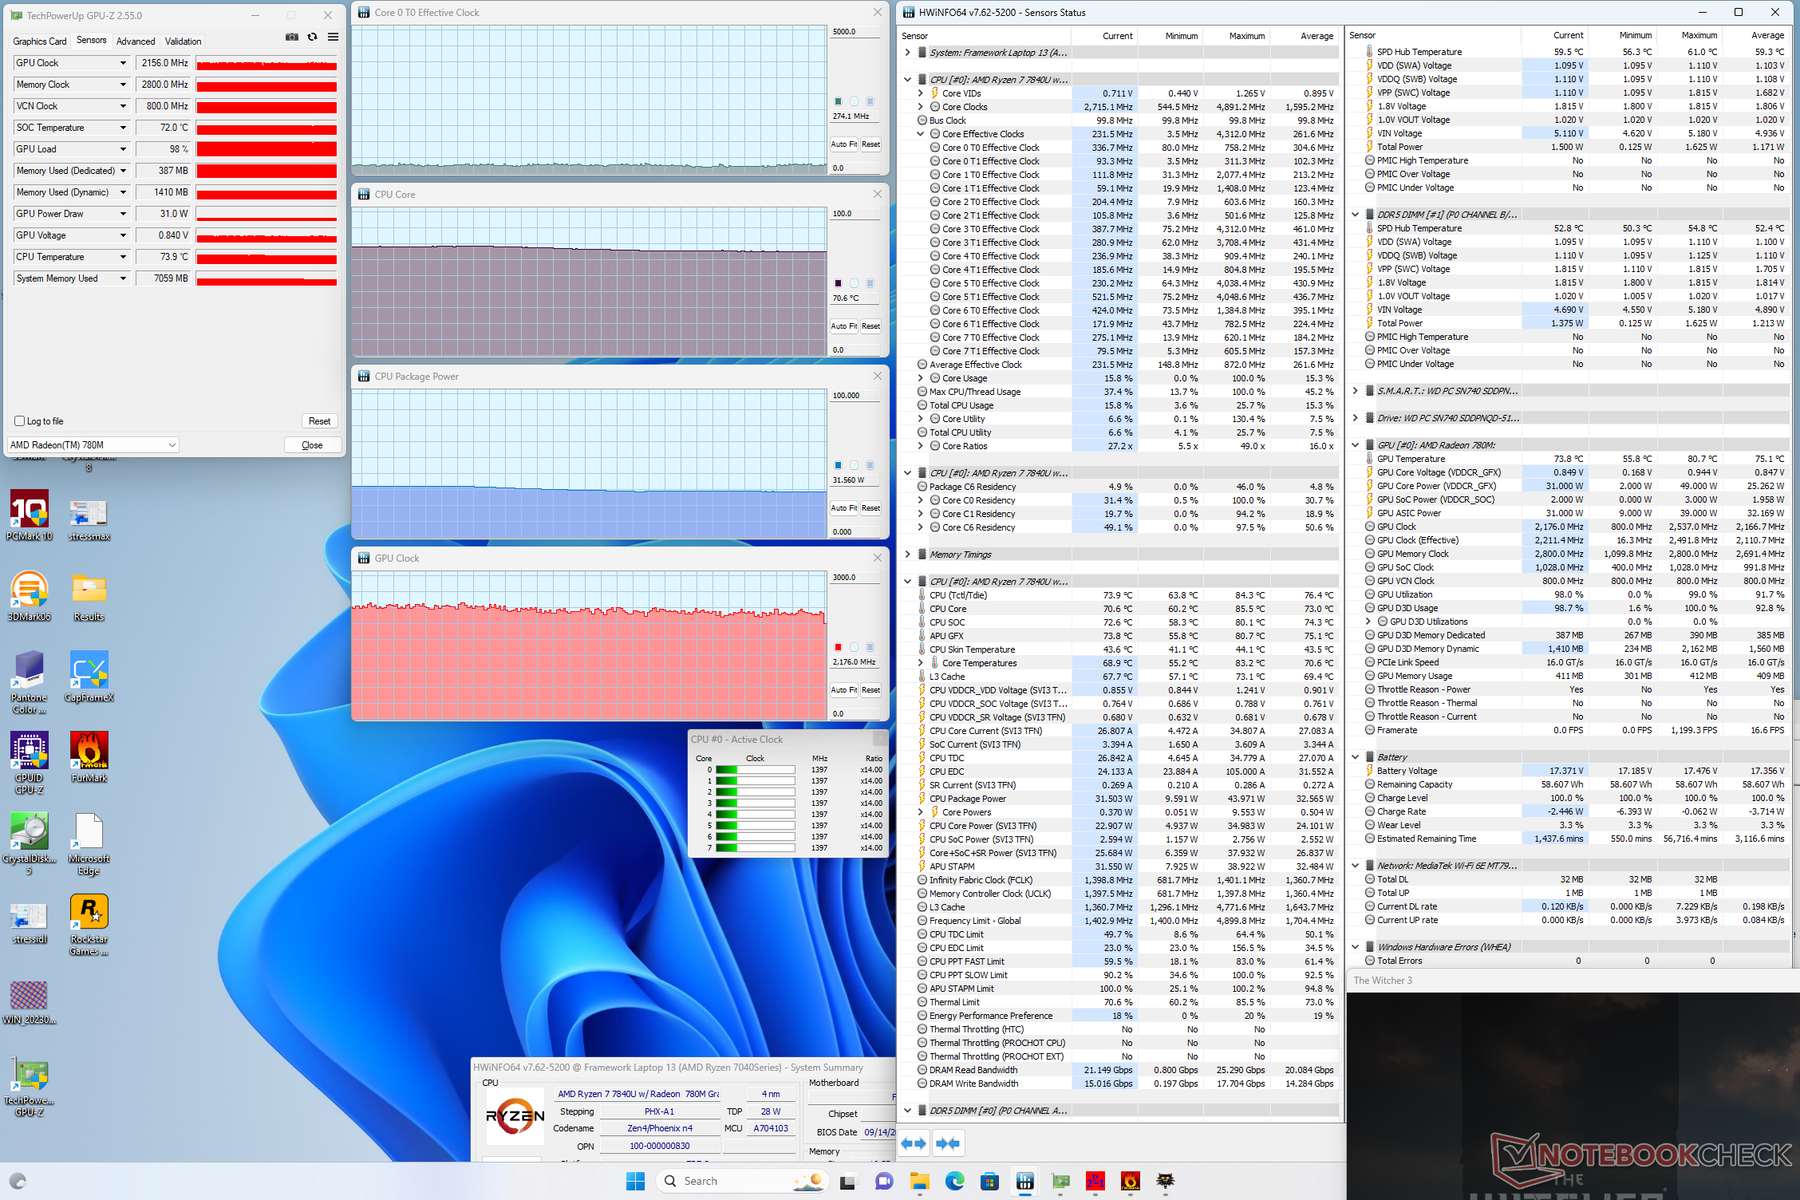
Lors de l'exécution Witcher 3 pour représenter des charges graphiques exigeantes, la température du cœur se stabiliserait à 71 C seulement, contre 93 C pour la version Intel, malgré la rapidité de la Radeon 780M par rapport à l'Iris Xe.
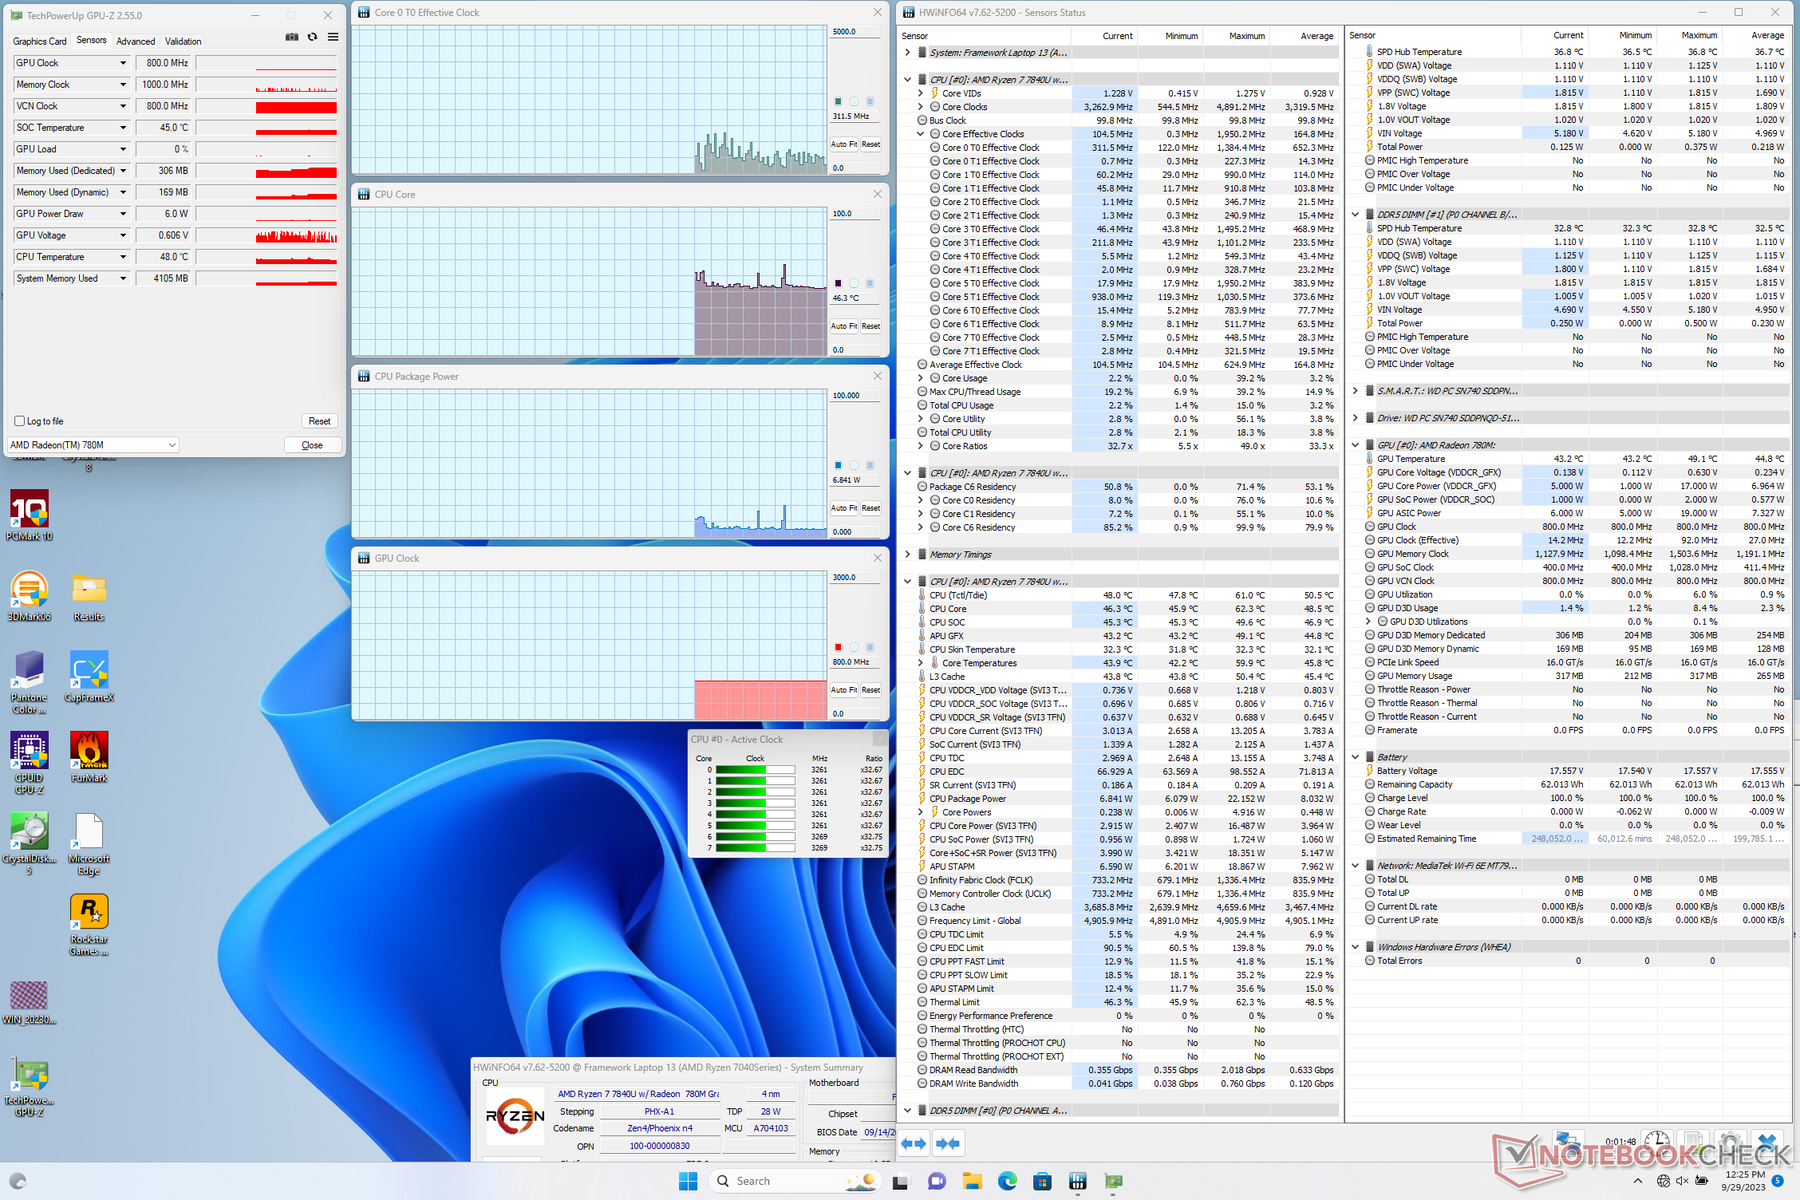
| Horloge du CPU (GHz) | Horloge du GPU (MHz) | Température moyenne du CPU (°C) | |
| Système au repos | -- | -- | 46 |
| Prime95 Stress | 3.2 | -- | 85 |
| Prime95 + FurMark Stress | 3.0 | 1534 | 74 |
| Witcher 3 Stress | ~0.3 | 2176 | 71 |
Intervenants
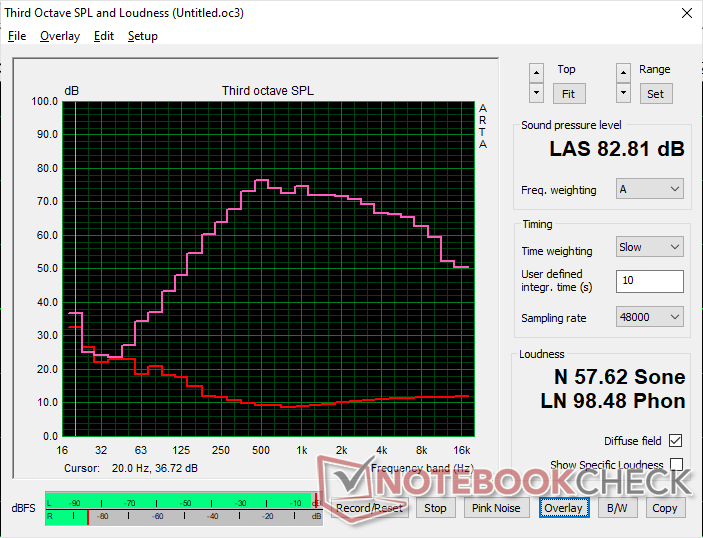
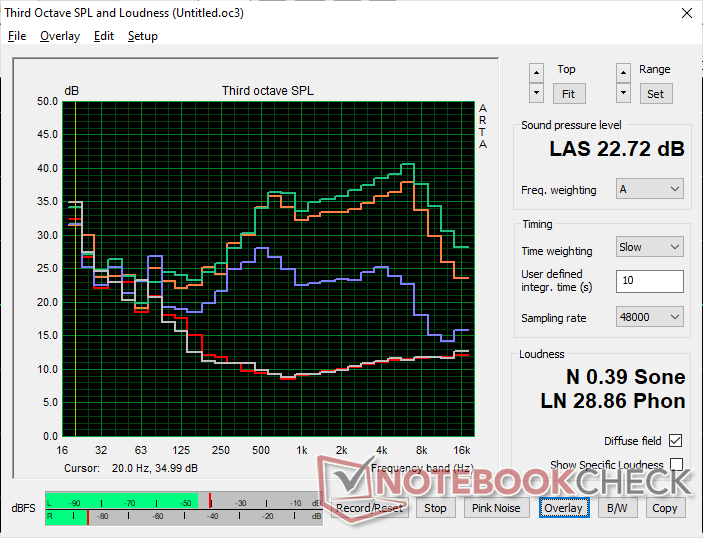
Framework Laptop 13.5 Ryzen 7 7840U analyse audio
(+) | les haut-parleurs peuvent jouer relativement fort (82.8# dB)
Basses 100 - 315 Hz
(±) | basse réduite - en moyenne 10.7% inférieure à la médiane
(±) | la linéarité des basses est moyenne (9.2% delta à la fréquence précédente)
Médiums 400 - 2000 Hz
(±) | médiane supérieure - en moyenne 6.7% supérieure à la médiane
(+) | les médiums sont linéaires (3.9% delta à la fréquence précédente)
Aiguës 2 - 16 kHz
(+) | des sommets équilibrés - à seulement 2.8% de la médiane
(+) | les aigus sont linéaires (3.2% delta à la fréquence précédente)
Globalement 100 - 16 000 Hz
(+) | le son global est linéaire (13.9% différence à la médiane)
Par rapport à la même classe
» 8% de tous les appareils testés de cette catégorie étaient meilleurs, 4% similaires, 87% pires
» Le meilleur avait un delta de 7%, la moyenne était de 21%, le pire était de 53%.
Par rapport à tous les appareils testés
» 16% de tous les appareils testés étaient meilleurs, 4% similaires, 80% pires
» Le meilleur avait un delta de 4%, la moyenne était de 24%, le pire était de 134%.
Apple MacBook Pro 16 2021 M1 Pro analyse audio
(+) | les haut-parleurs peuvent jouer relativement fort (84.7# dB)
Basses 100 - 315 Hz
(+) | bonne basse - seulement 3.8% loin de la médiane
(+) | les basses sont linéaires (5.2% delta à la fréquence précédente)
Médiums 400 - 2000 Hz
(+) | médiane équilibrée - seulement 1.3% de la médiane
(+) | les médiums sont linéaires (2.1% delta à la fréquence précédente)
Aiguës 2 - 16 kHz
(+) | des sommets équilibrés - à seulement 1.9% de la médiane
(+) | les aigus sont linéaires (2.7% delta à la fréquence précédente)
Globalement 100 - 16 000 Hz
(+) | le son global est linéaire (4.6% différence à la médiane)
Par rapport à la même classe
» 0% de tous les appareils testés de cette catégorie étaient meilleurs, 0% similaires, 100% pires
» Le meilleur avait un delta de 5%, la moyenne était de 17%, le pire était de 45%.
Par rapport à tous les appareils testés
» 0% de tous les appareils testés étaient meilleurs, 0% similaires, 100% pires
» Le meilleur avait un delta de 4%, la moyenne était de 24%, le pire était de 134%.
Gestion de l'énergie
Consommation électrique
La consommation d'énergie est toujours inférieure à celle que nous avons enregistrée avec la configuration Core i7-1370P. De plus, notre Ryzen 7 7840U peut surpasser le CPU Intel dans la plupart des applications. Le ralenti sur un ordinateur de bureau ne demande que 4 W à 7 W, contre 3 W à 10 W pour la version Intel.
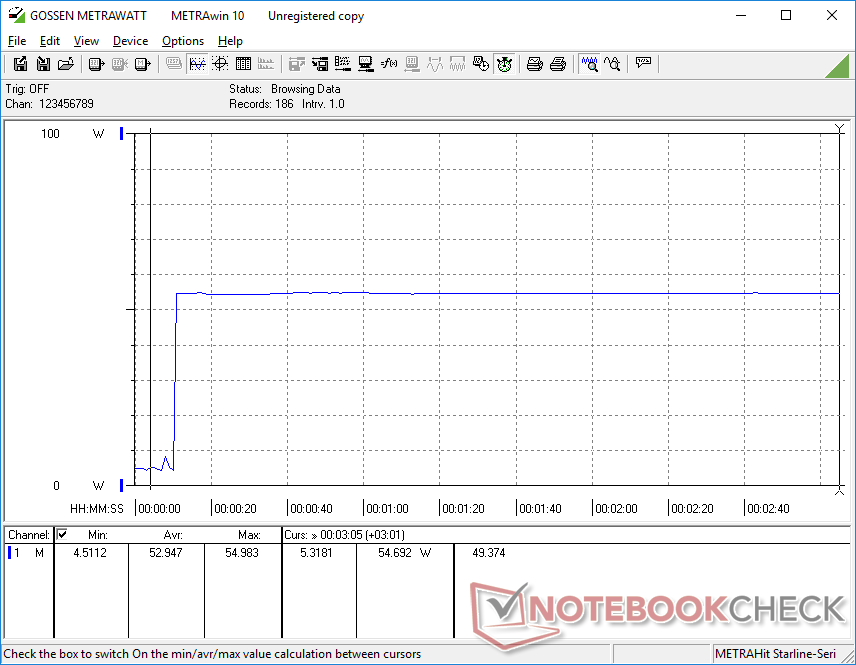
L'exécution de Witcher 3 pour représenter les charges de jeu typiques consommerait environ 8 % d'énergie en moins que la configuration Core i7-1370P pour une augmentation de 30 à 50 % des performances graphiques brutes. Ainsi, non seulement la Radeon 780M est plus rapide que l'Iris Xe 96 EUs, mais elle consomme également moins d'énergie pour des performances par watt plus élevées.
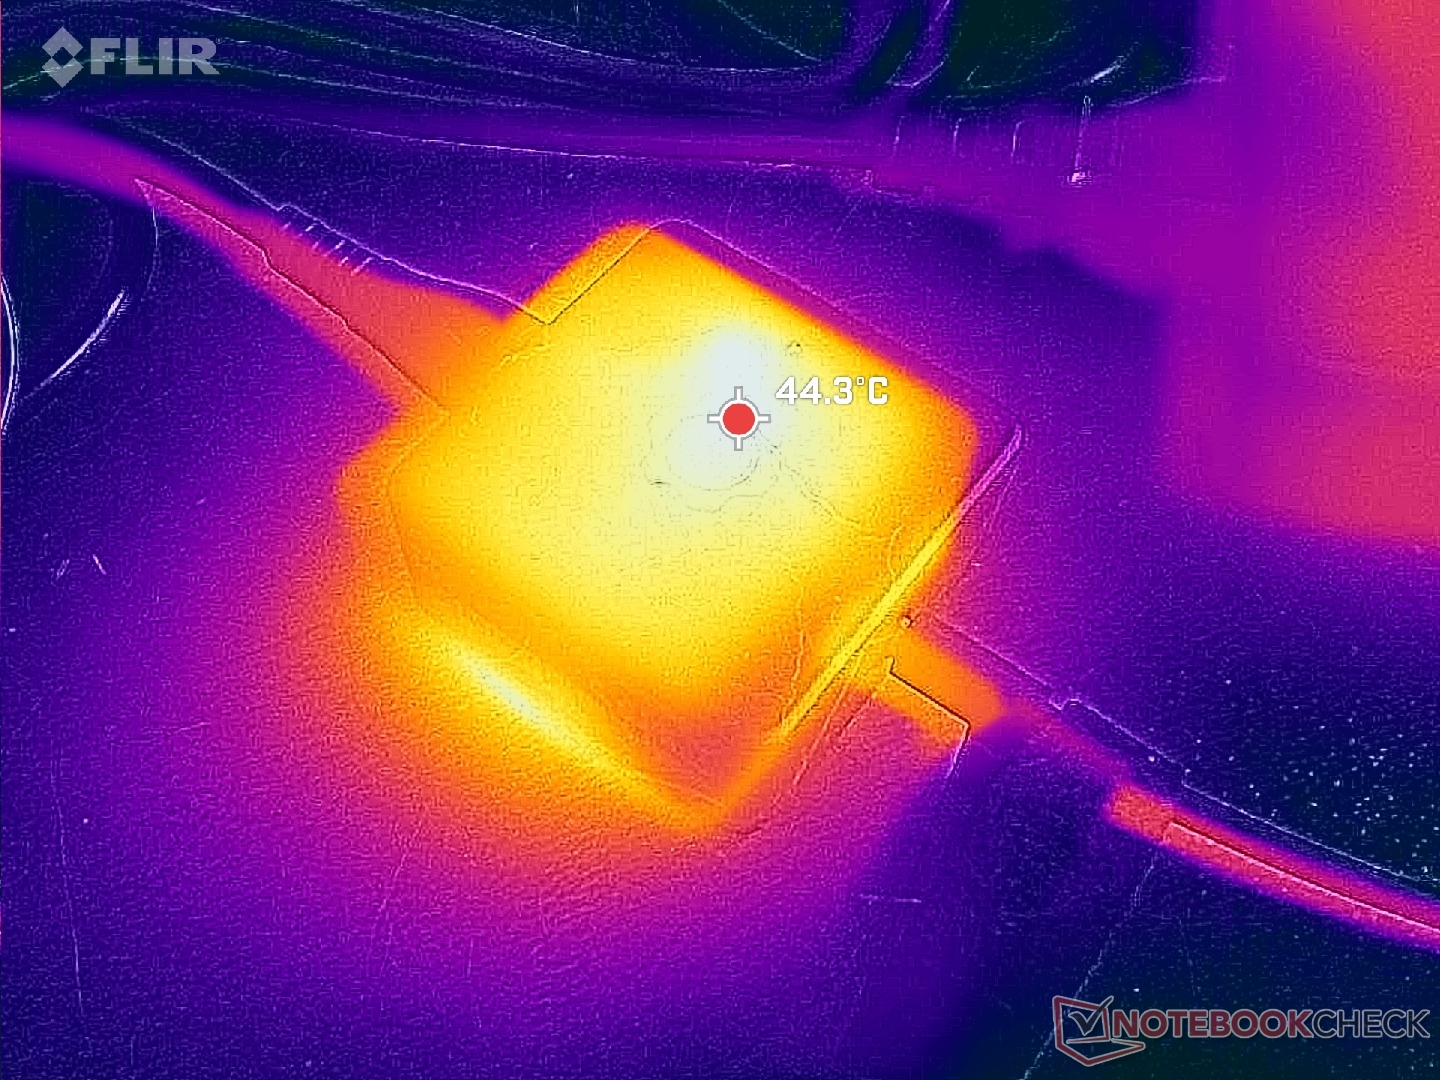
Le petit chargeur GaN USB-C AC de 60 W (~5,8 x 5,8 x 2,6 cm) est le même pour toutes les configurations, quelle que soit l'option du processeur.


| Éteint/en veille | |
| Au repos | |
| Fortement sollicité |
|
Légende:
min: | |
| Framework Laptop 13.5 Ryzen 7 7840U R7 7840U, Radeon 780M, WD PC SN740 512GB SDDPNQD-512G, IPS, 2256x1504, 13.5" | Framework Laptop 13.5 13th Gen Intel i7-1370P, Iris Xe G7 96EUs, WD PC SN740 SDDPNQD-1T00, IPS, 2256x1504, 13.5" | Framework Laptop 13.5 12th Gen Intel i7-1260P, Iris Xe G7 96EUs, WDC PC SN730 SDBPNTY-512G, IPS, 2256x1504, 13.5" | Framework Laptop 13.5 i7-1165G7, Iris Xe G7 96EUs, Western Digital WD_BLACK SN850 WDS100T1X0E, IPS, 2256x1504, 13.5" | Lenovo ThinkPad X1 Nano Gen 3 i7-1360P, Iris Xe G7 96EUs, Lenovo UMIS AM6A0 RPJTJ512MKP1QDQ, IPS, 2160x1350, 13" | HP Dragonfly G4 i7-1365U, Iris Xe G7 96EUs, Micron 3400 MTFDKBA512TFH 512GB, IPS, 1920x1280, 13.5" | |
|---|---|---|---|---|---|---|
| Power Consumption | -9% | -25% | -8% | 9% | -1% | |
| Idle Minimum * (Watt) | 4 | 2.9 27% | 5.3 -33% | 4.3 -8% | 3.3 17% | 4.1 -2% |
| Idle Average * (Watt) | 6.5 | 6.3 3% | 8.4 -29% | 8.2 -26% | 6.5 -0% | 7.5 -15% |
| Idle Maximum * (Watt) | 6.8 | 9.9 -46% | 11.2 -65% | 8.7 -28% | 7.1 -4% | 8.2 -21% |
| Load Average * (Watt) | 48 | 56.2 -17% | 57.4 -20% | 43.5 9% | 40.7 15% | 35.5 26% |
| Witcher 3 ultra * (Watt) | 52.3 | 56.6 -8% | 46.7 11% | 43.5 17% | 37 29% | 37.5 28% |
| Load Maximum * (Watt) | 55.2 | 60.8 -10% | 61.2 -11% | 61.8 -12% | 58.6 -6% | 66.5 -20% |
* ... Moindre est la valeur, meilleures sont les performances
Power Consumption Witcher 3 / Stresstest
Power Consumption external Monitor
Autonomie de la batterie
Les durées d'exécution sont plus longues que celles des configurations basées sur Intel, avec des marges significatives, en raison des niveaux de consommation d'énergie inférieurs mentionnés ci-dessus. Nous avons pu naviguer sur le web pendant plus de 3 heures de plus sur notre modèle AMD par rapport au modèle Core i7-1370P lorsque les deux sont configurés en mode équilibré et avec une luminosité de 150 nit. Cela ne veut pas dire que l'autonomie de la batterie est mauvaise lorsqu'elle est configurée avec Intel, mais AMD a un net avantage à cet égard.
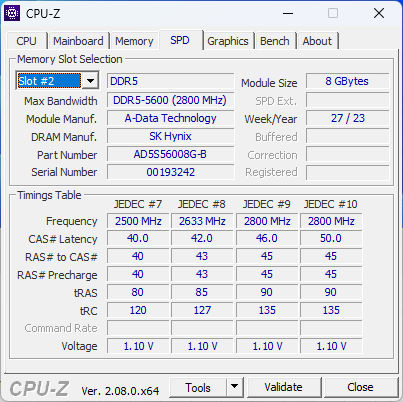
Notez que la configuration Ryzen 5 de base n'est livrée qu'avec une batterie de 55 Wh contre 61 Wh pour notre configuration Ryzen 7 7840U.
| Framework Laptop 13.5 Ryzen 7 7840U R7 7840U, Radeon 780M, 61 Wh | Framework Laptop 13.5 13th Gen Intel i7-1370P, Iris Xe G7 96EUs, 61 Wh | Framework Laptop 13.5 12th Gen Intel i7-1260P, Iris Xe G7 96EUs, 55 Wh | Framework Laptop 13.5 i7-1165G7, Iris Xe G7 96EUs, 55 Wh | Lenovo ThinkPad X1 Nano Gen 3 i7-1360P, Iris Xe G7 96EUs, 49.5 Wh | HP Dragonfly G4 i7-1365U, Iris Xe G7 96EUs, 68 Wh | |
|---|---|---|---|---|---|---|
| Autonomie de la batterie | -27% | -38% | -34% | -36% | 31% | |
| WiFi v1.3 (h) | 12.1 | 8.8 -27% | 7.5 -38% | 8 -34% | 7.8 -36% | 15.9 31% |
| Reader / Idle (h) | 42.5 | |||||
| Load (h) | 3.2 |
Points positifs
Points négatifs
Verdict - Des performances graphiques deux fois supérieures à celles d'Intel
Si vous accordez de l'importance aux performances multithread et aux graphismes, la configuration AMD est sans aucun doute le meilleur choix par rapport à Intel. Le Ryzen 7 7840U et la Radeon 780M sont plus rapides que n'importe quel processeur Intel Core-U ou Core-P de 13e génération, surtout en termes de performance par watt et d'autonomie de la batterie. Le fait que les configurations Ryzen 7 et Core i7 coûtent à peu près le même prix, soit 1500 $ chacune, rend la version AMD encore plus attrayante.
Sauf si vous avez absolument besoin de Ryzen PRO ou d'Intel vPro, le Framework Laptop 13.5 basé sur AMD est plus rapide et beaucoup plus facile à recommander que l'Intel, d'autant plus qu'ils coûtent à peu près le même prix.
Il y a encore quelques raisons de choisir Intel pour le moment. Tout d'abord, les CPU Ryzen PRO Zen 4 ne sont pas encore disponibles chez Framework, ce qui fait d'Intel vPro la seule option. Deuxièmement, la série Core-P a toujours une légère avance sur AMD lorsqu'il s'agit de performance single-thread. Et enfin, les ports USB-C sur le modèle Intel sont uniformes en ce qui concerne les caractéristiques et la compatibilité. De ces trois différences, la première est sans doute la plus précieuse, surtout pour les entreprises ou les utilisateurs qui ont besoin d'une couche supplémentaire de sécurité matérielle. Sinon, il est difficile de passer à côté d'une plus grande autonomie et de performances graphiques deux fois supérieures pour le même prix.
Prix et disponibilité
Le fabricant livre dès à présent sa version AMD du Framework Laptop 13.5 sa version AMD du Framework Laptop 13.5 à partir de $1050 USD pour la configuration Ryzen 5 de base jusqu'à plus de $1600 si elle est entièrement configurée avec le Ryzen 7 7840U.
Framework Laptop 13.5 Ryzen 7 7840U
- 10/02/2023 v7 (old)
Allen Ngo
Transparency
La sélection des appareils à examiner est effectuée par notre équipe éditoriale. L'échantillon de test a été prêté à l'auteur par le fabricant ou le détaillant pour les besoins de cet examen. Le prêteur n'a pas eu d'influence sur cette évaluation et le fabricant n'a pas reçu de copie de cette évaluation avant sa publication. Il n'y avait aucune obligation de publier cet article. En tant que média indépendant, Notebookcheck n'est pas soumis à l'autorité des fabricants, des détaillants ou des éditeurs.
Voici comment Notebookcheck teste
Chaque année, Notebookcheck examine de manière indépendante des centaines d'ordinateurs portables et de smartphones en utilisant des procédures standardisées afin de garantir que tous les résultats sont comparables. Nous avons continuellement développé nos méthodes de test depuis environ 20 ans et avons établi des normes industrielles dans le processus. Dans nos laboratoires de test, des équipements de mesure de haute qualité sont utilisés par des techniciens et des rédacteurs expérimentés. Ces tests impliquent un processus de validation en plusieurs étapes. Notre système d'évaluation complexe repose sur des centaines de mesures et de points de référence bien fondés, ce qui garantit l'objectivité.Price comparison

