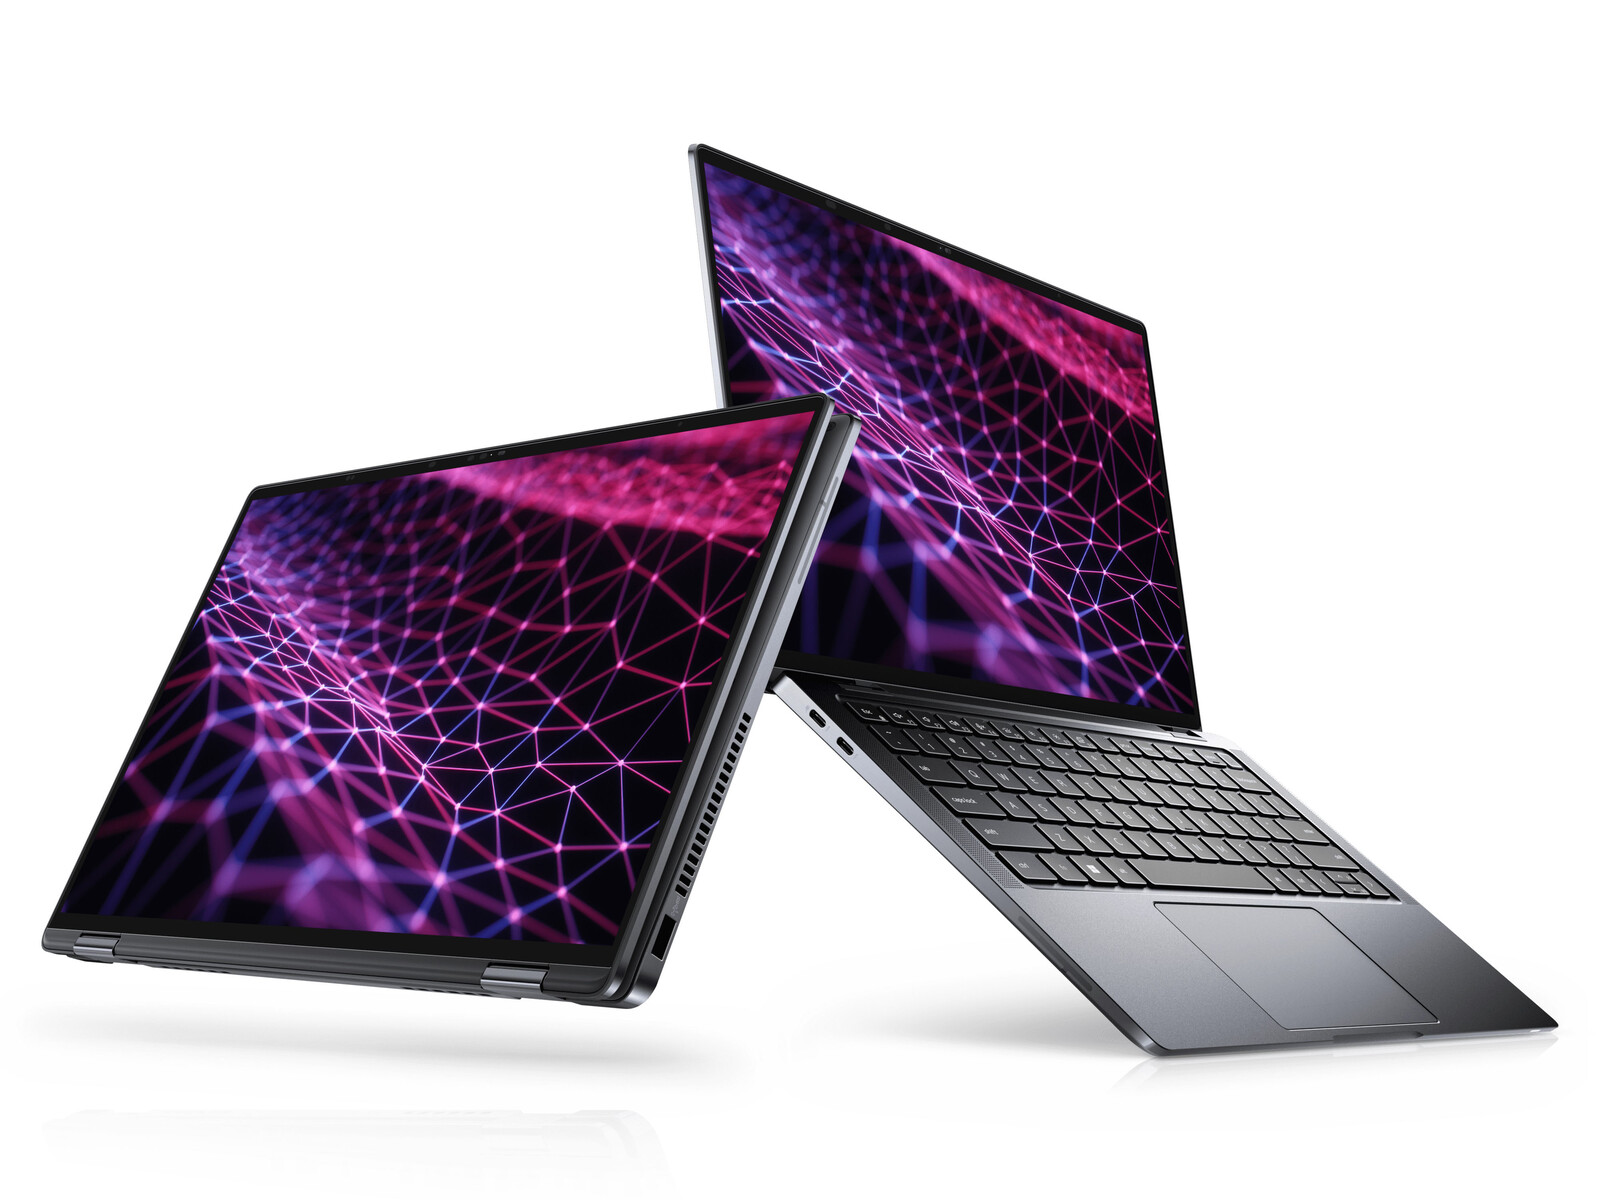
Test du Dell Latitude 13 9330 : les débuts du Core i7-1260U dans ce 2-en-1
La série Latitude 9000 abrite les ordinateurs portables professionnels phares de Dell, qui contrastent avec le milieu de gamme supérieur Latitude 7000 de milieu de gamme, les Latitude 5000 et du bas de gamme Latitude 3000 bas de gamme. Le modèle que nous examinons est le Latitude 9330, qui est le premier convertible de 13,3 pouces de la famille Latitude 9000
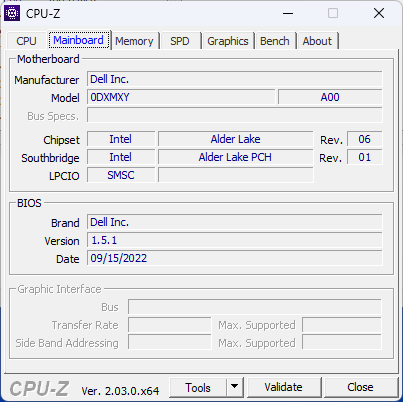
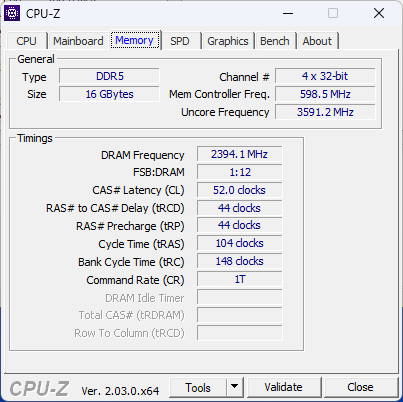
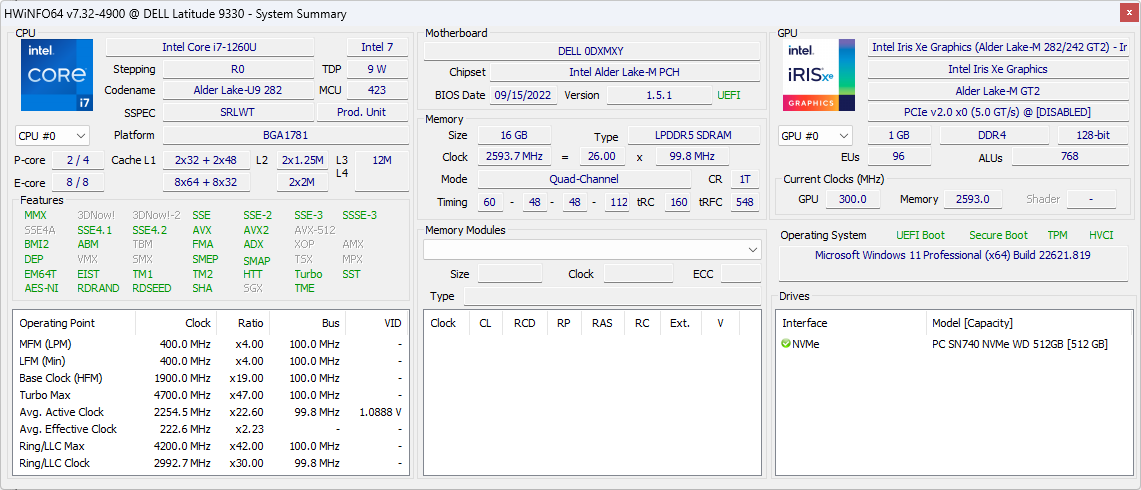
Notre configuration spécifique est l'UGS la plus haut de gamme avec le CPU Core i7-1260U de 12e génération, 32 Go de RAM LPDDR5 et 512 Go de SSD NVMe pour environ 2700 USD. D'autres SKU avec le CPU Core i5-1240U plus lent et la moitié de la RAM et de l'espace de stockage sont également disponibles à partir de 2000 USD, mais toutes les options sont par ailleurs équipées de graphiques intégrés uniquement et du même écran tactile IPS d'une résolution de 2560 x 1600
Parmi les concurrents du Latitude 9330, on trouve d'autres convertibles haut de gamme de 13 pouces destinés aux entreprises, comme le Lenovo ThinkPad X1 Yoga G1, Le Summit E13 Flip de MSIou HP Elite Dragonfly Max.
Plus de commentaires sur Dell
Comparaison avec les concurrents potentiels
Note | Date | Modèle | Poids | Épaisseur | Taille | Résolution | Prix |
|---|---|---|---|---|---|---|---|
| 89 % v7 (old) | 11/22 | Dell Latitude 9330 i7-1260U, Iris Xe G7 96EUs | 1.2 kg | 14.1 mm | 13.30" | 2560x1600 | |
| 88.5 % v7 (old) | Lenovo ThinkPad X1 Titanium Yoga G1 20QB0016GE i5-1140G7, Iris Xe G7 80EUs | 1.2 kg | 11.5 mm | 13.50" | 2256x1504 | ||
| 86.9 % v7 (old) | 04/21 | MSI Summit E13 Flip Evo A11MT i7-1185G7, Iris Xe G7 96EUs | 1.4 kg | 14.9 mm | 13.40" | 1920x1200 | |
| 90 % v7 (old) | 11/20 | HP EliteBook x360 1030 G7 i7-10810U, UHD Graphics 620 | 1.2 kg | 16 mm | 13.30" | 1920x1080 | |
| 90.8 % v7 (old) | 06/21 | HP Elite Dragonfly Max i7-1185G7, Iris Xe G7 96EUs | 1.2 kg | 16 mm | 13.30" | 1920x1080 | |
| 87.2 % v7 (old) | 01/21 | Dell Latitude 5310-23VP6 i5-10310U, UHD Graphics 620 | 1.3 kg | 19.7 mm | 13.30" | 1920x1080 |
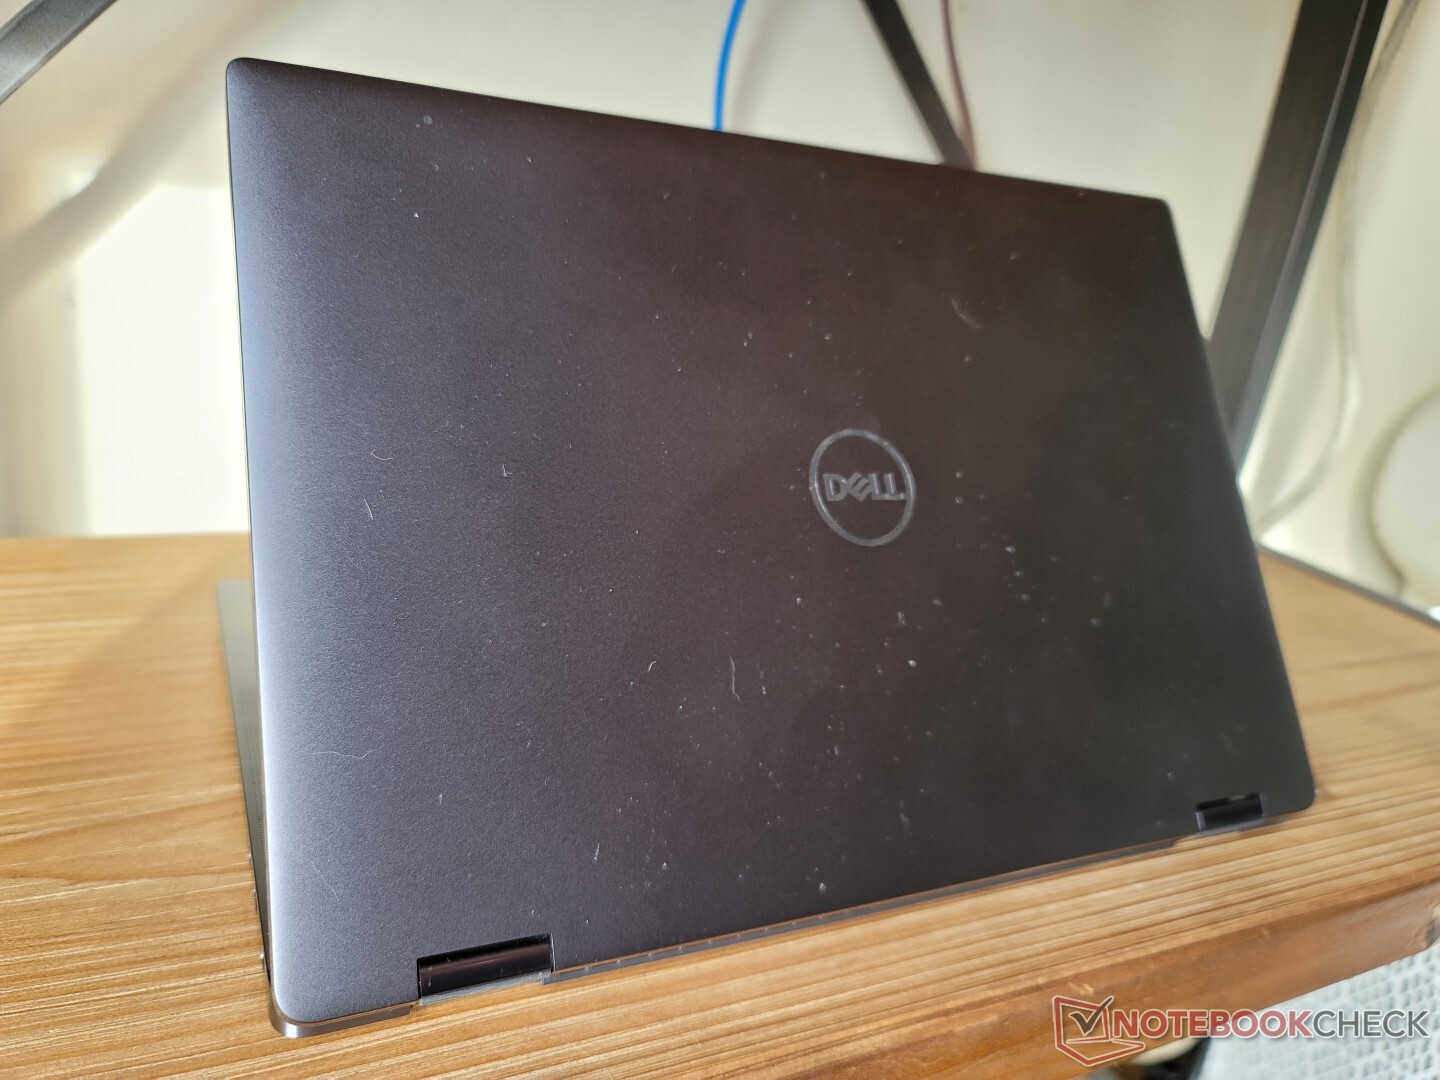
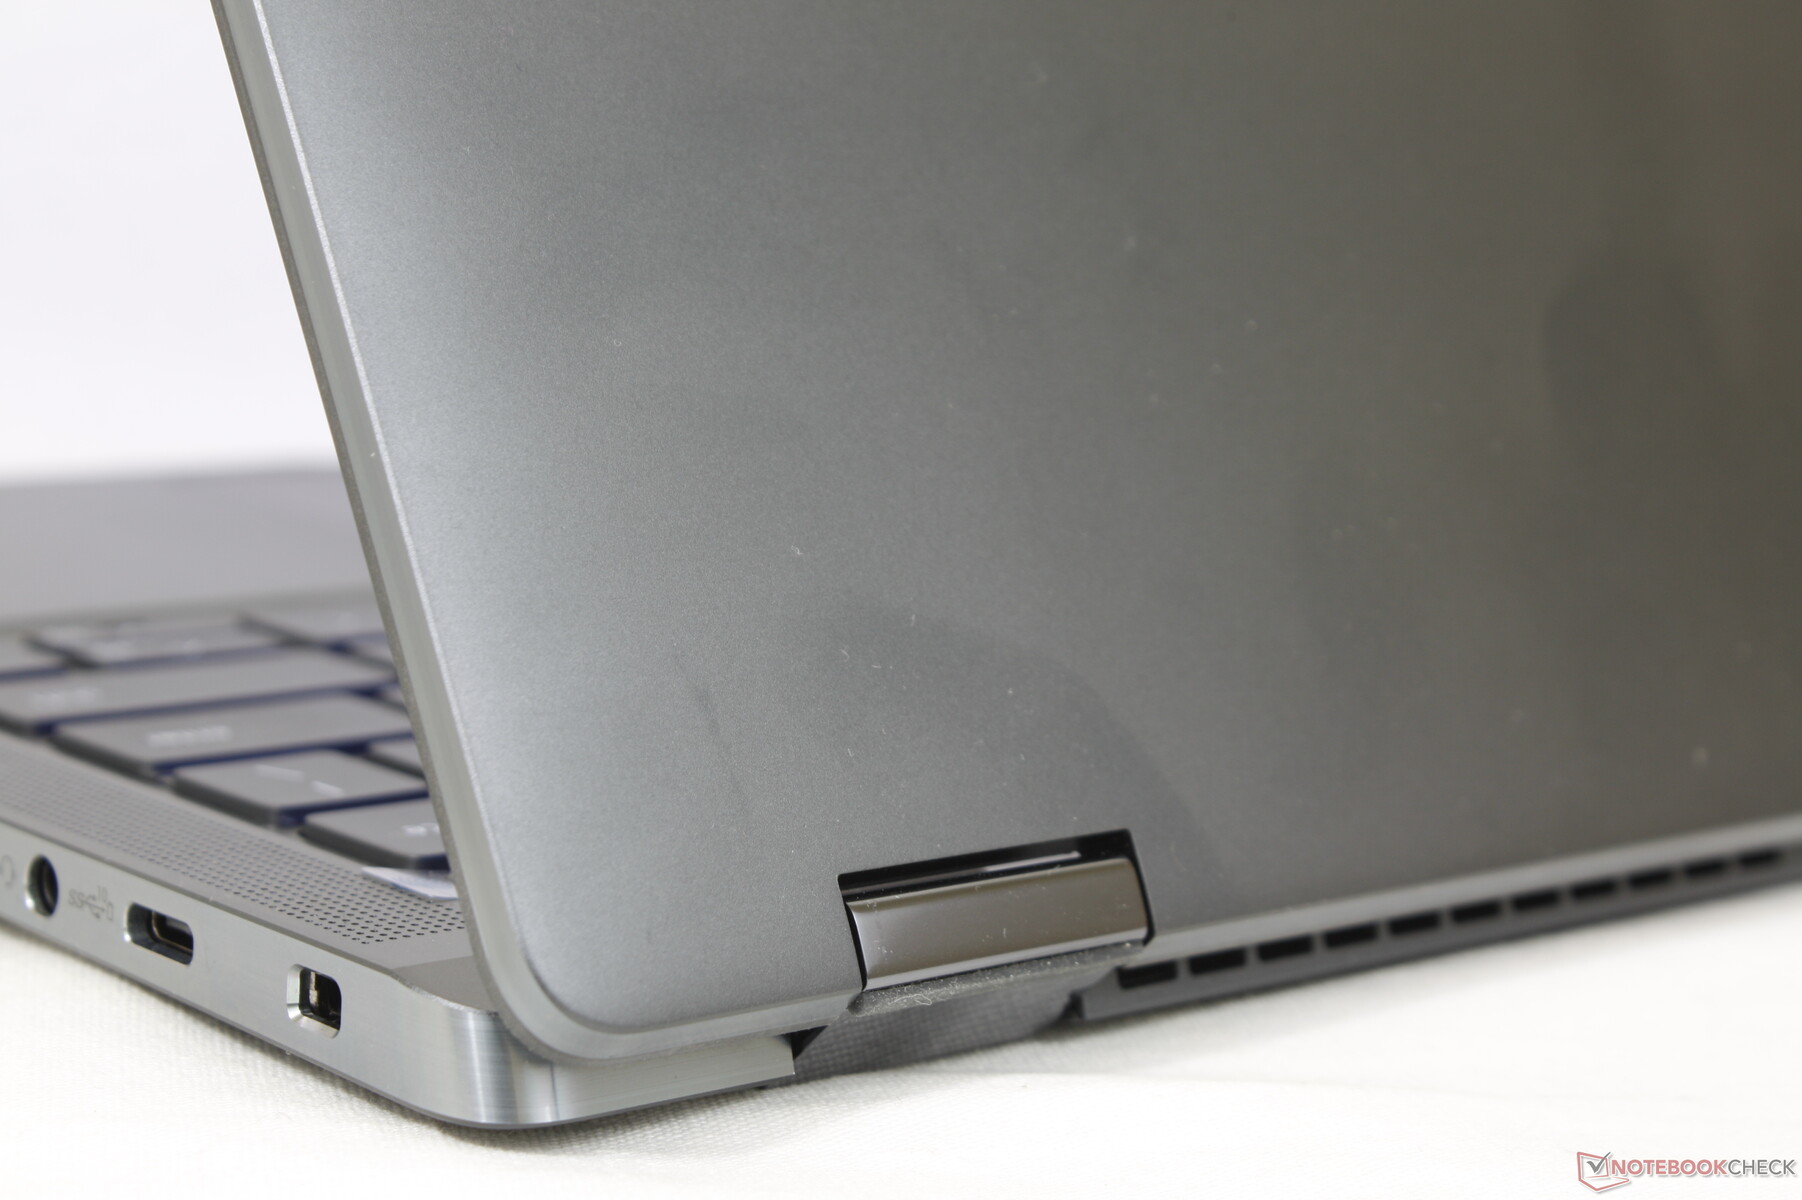
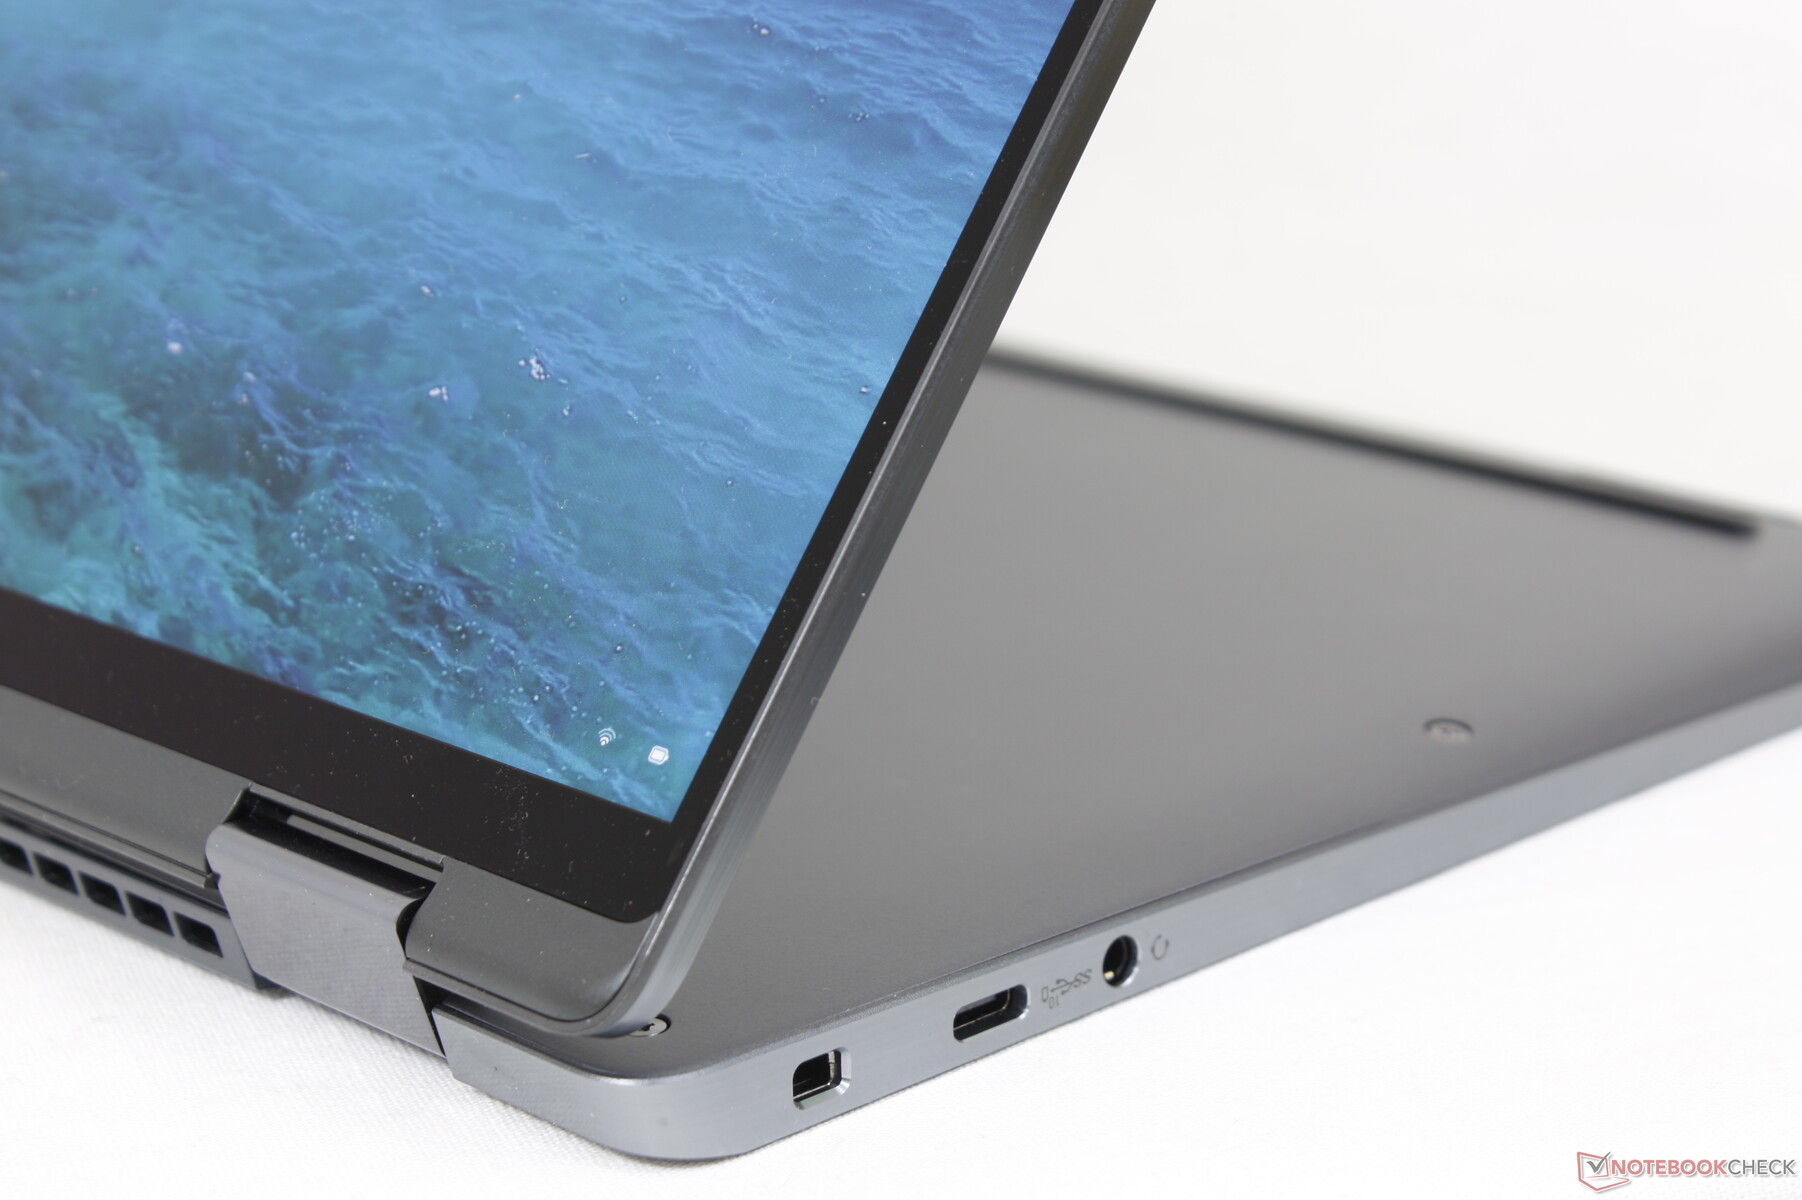
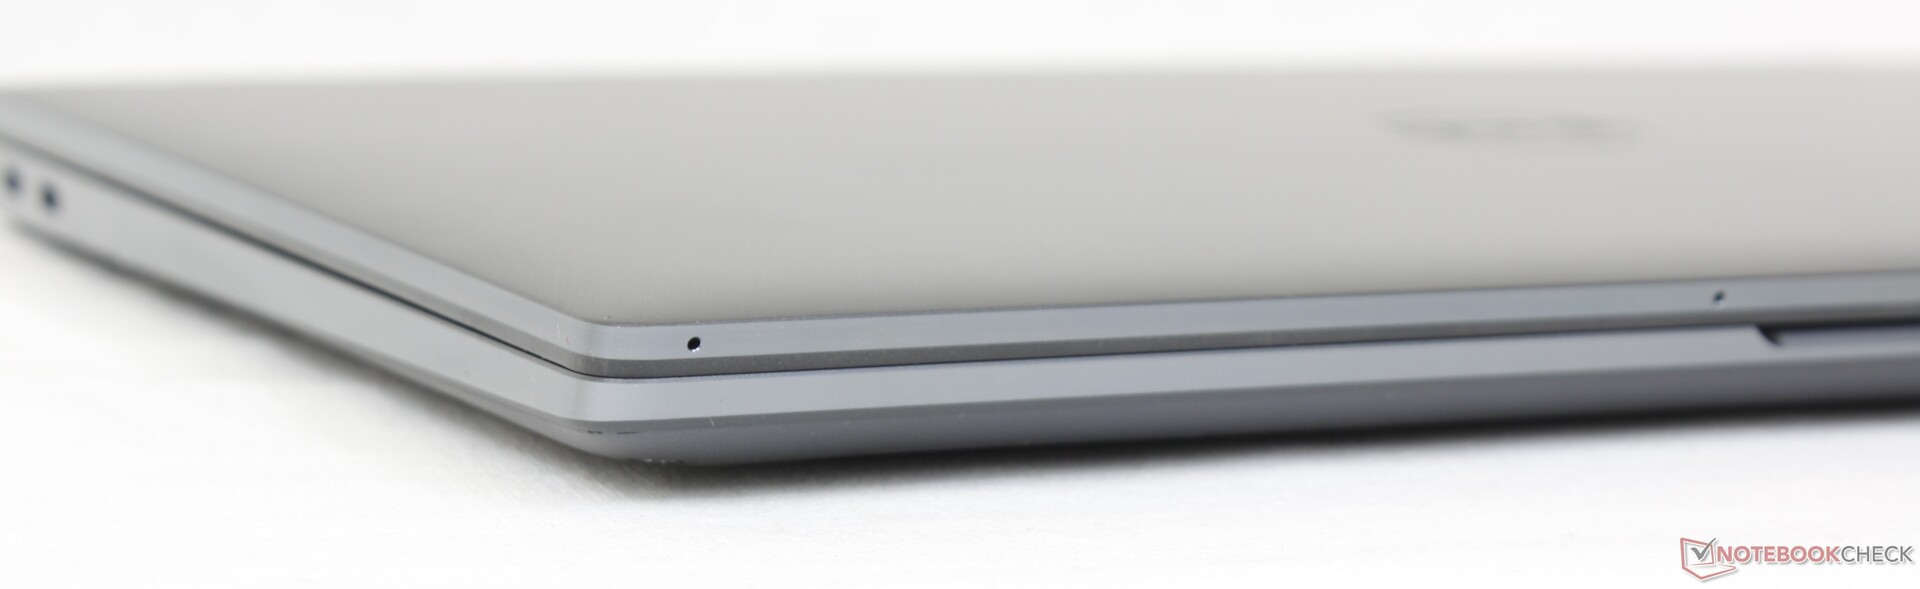
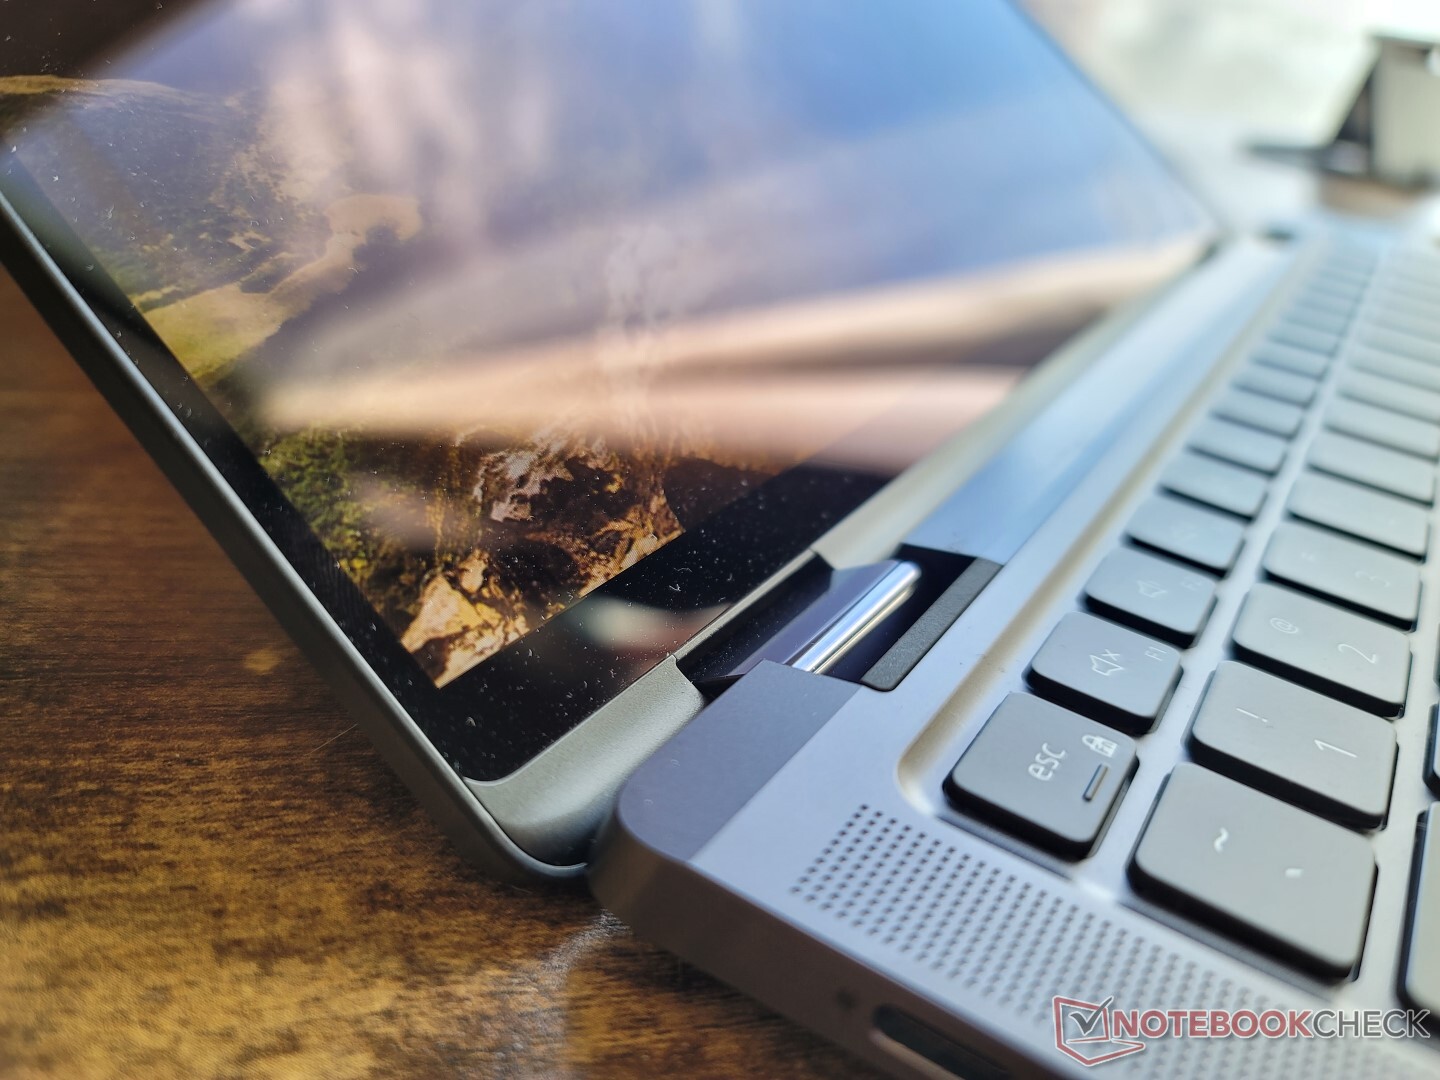
Cas - Apparence ennuyeuse, conception solide
Le squelette métallique gris peut ne pas ressembler à grand chose, surtout lorsqu'il est comparé aux designs dorés flashy du MSI Summit E13 Flip ou du HP Spectre mais il est tout aussi solide, sinon plus. Si vous essayez de tordre la base sur les côtés ou au centre du clavier, vous n'obtiendrez qu'une déformation minime, pour une excellente première impression. Même l'écran résiste à la torsion ou au pliage. La rigidité globale est l'une des meilleures que nous ayons vues sur un convertible ultra-fin pour ordinateur portable.
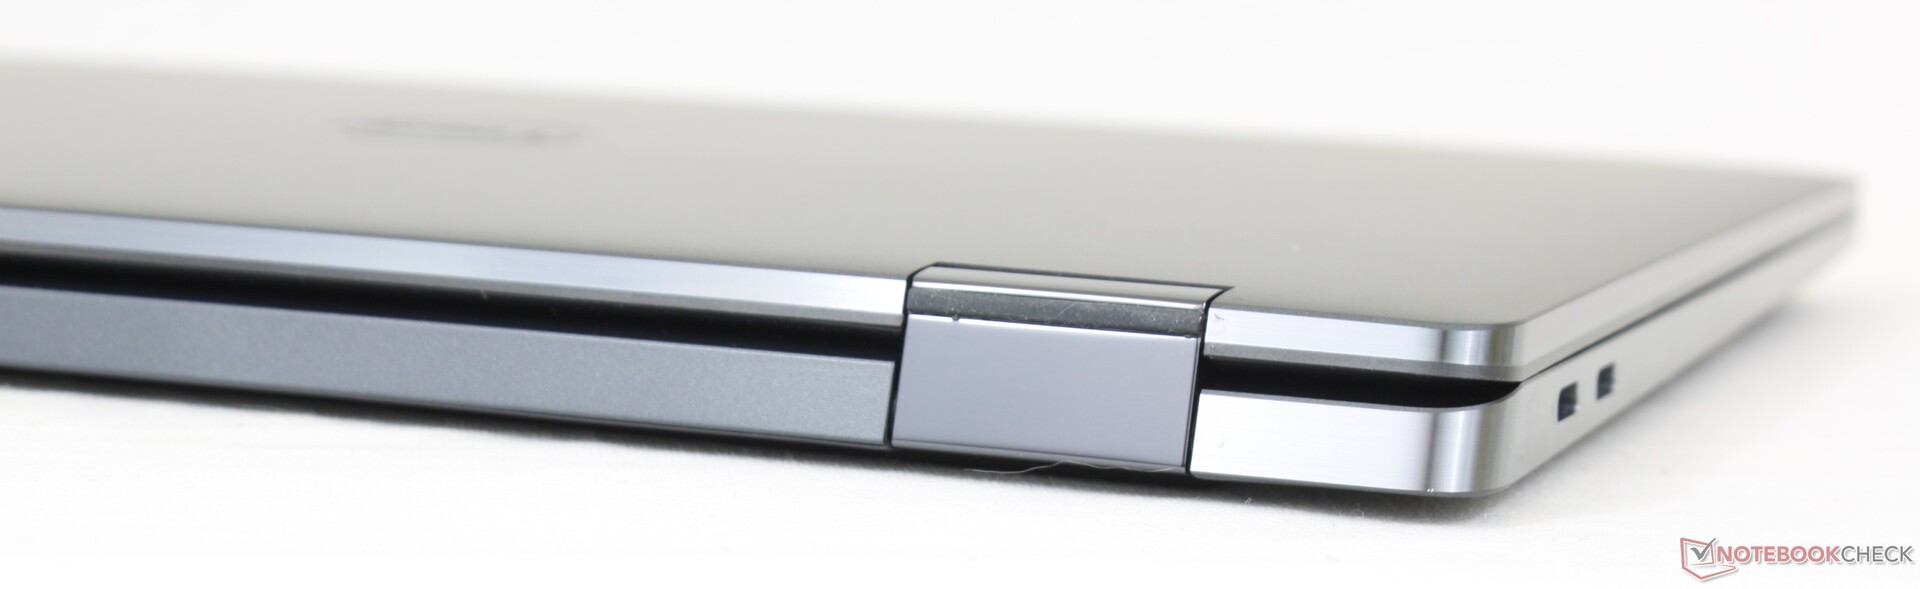
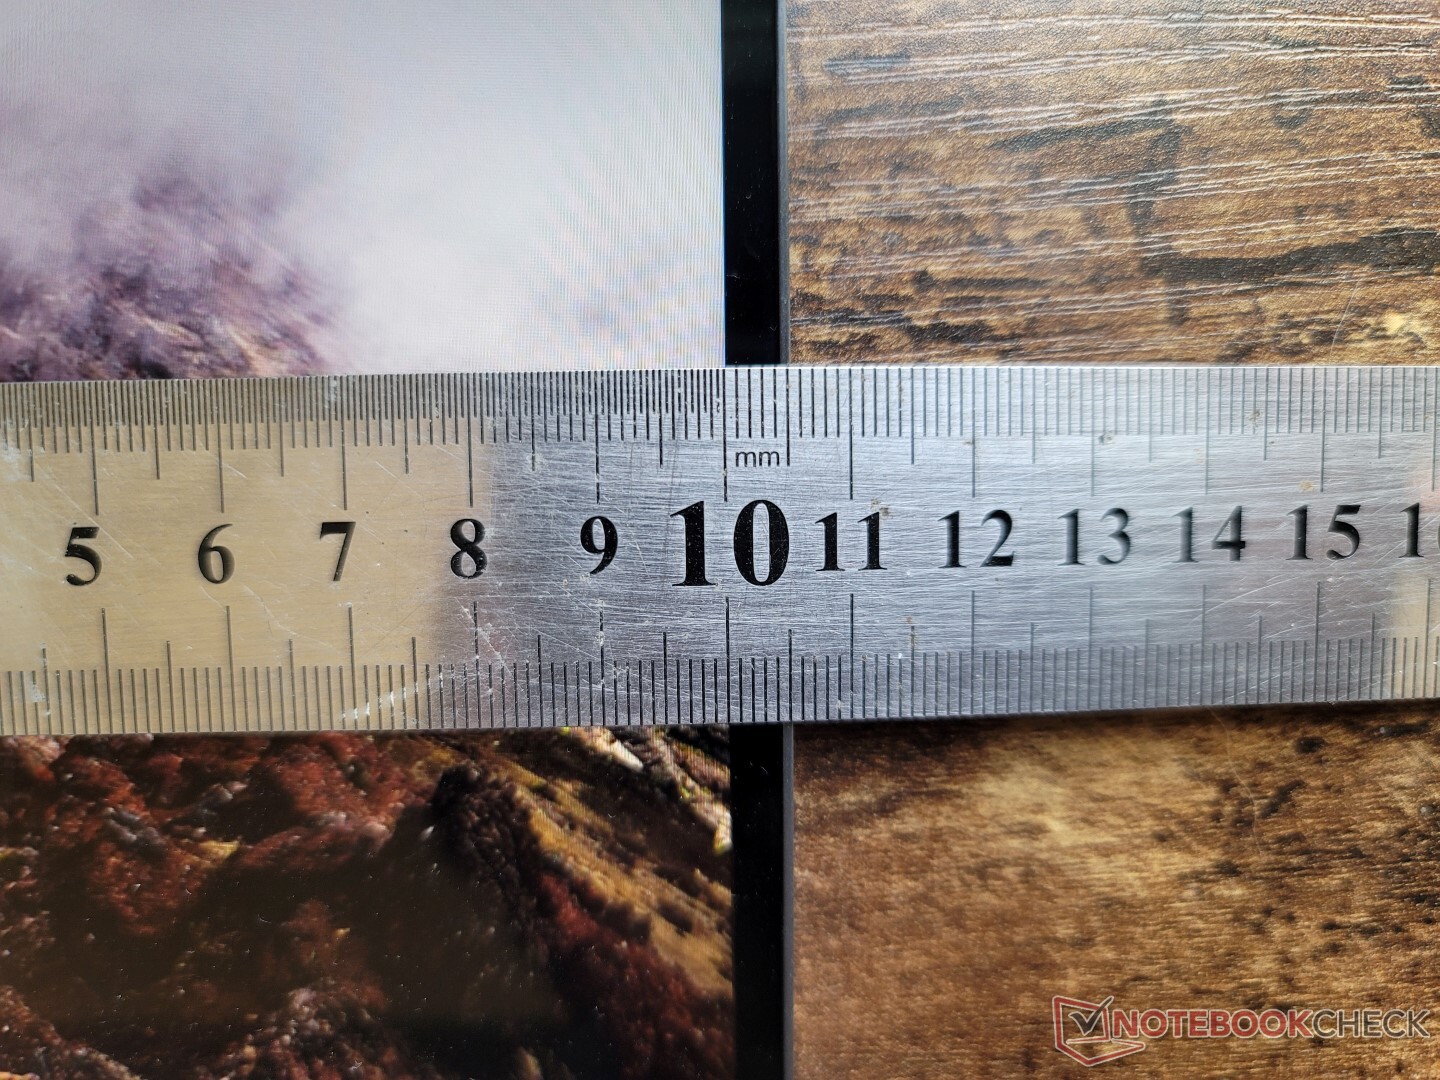
Les dimensions et le poids sont proches de ceux de l'Elite Dragonfly Max. Le modèle Dell est légèrement plus long en raison de son rapport hauteur/largeur 16:10 contre 16:9 pour le HP, mais le design Dell compense avec des bords latéraux plus étroits et un profil plus fin. En revanche, le Summit E13 Flip est un convertible de 13 pouces encore plus grand et plus lourd.
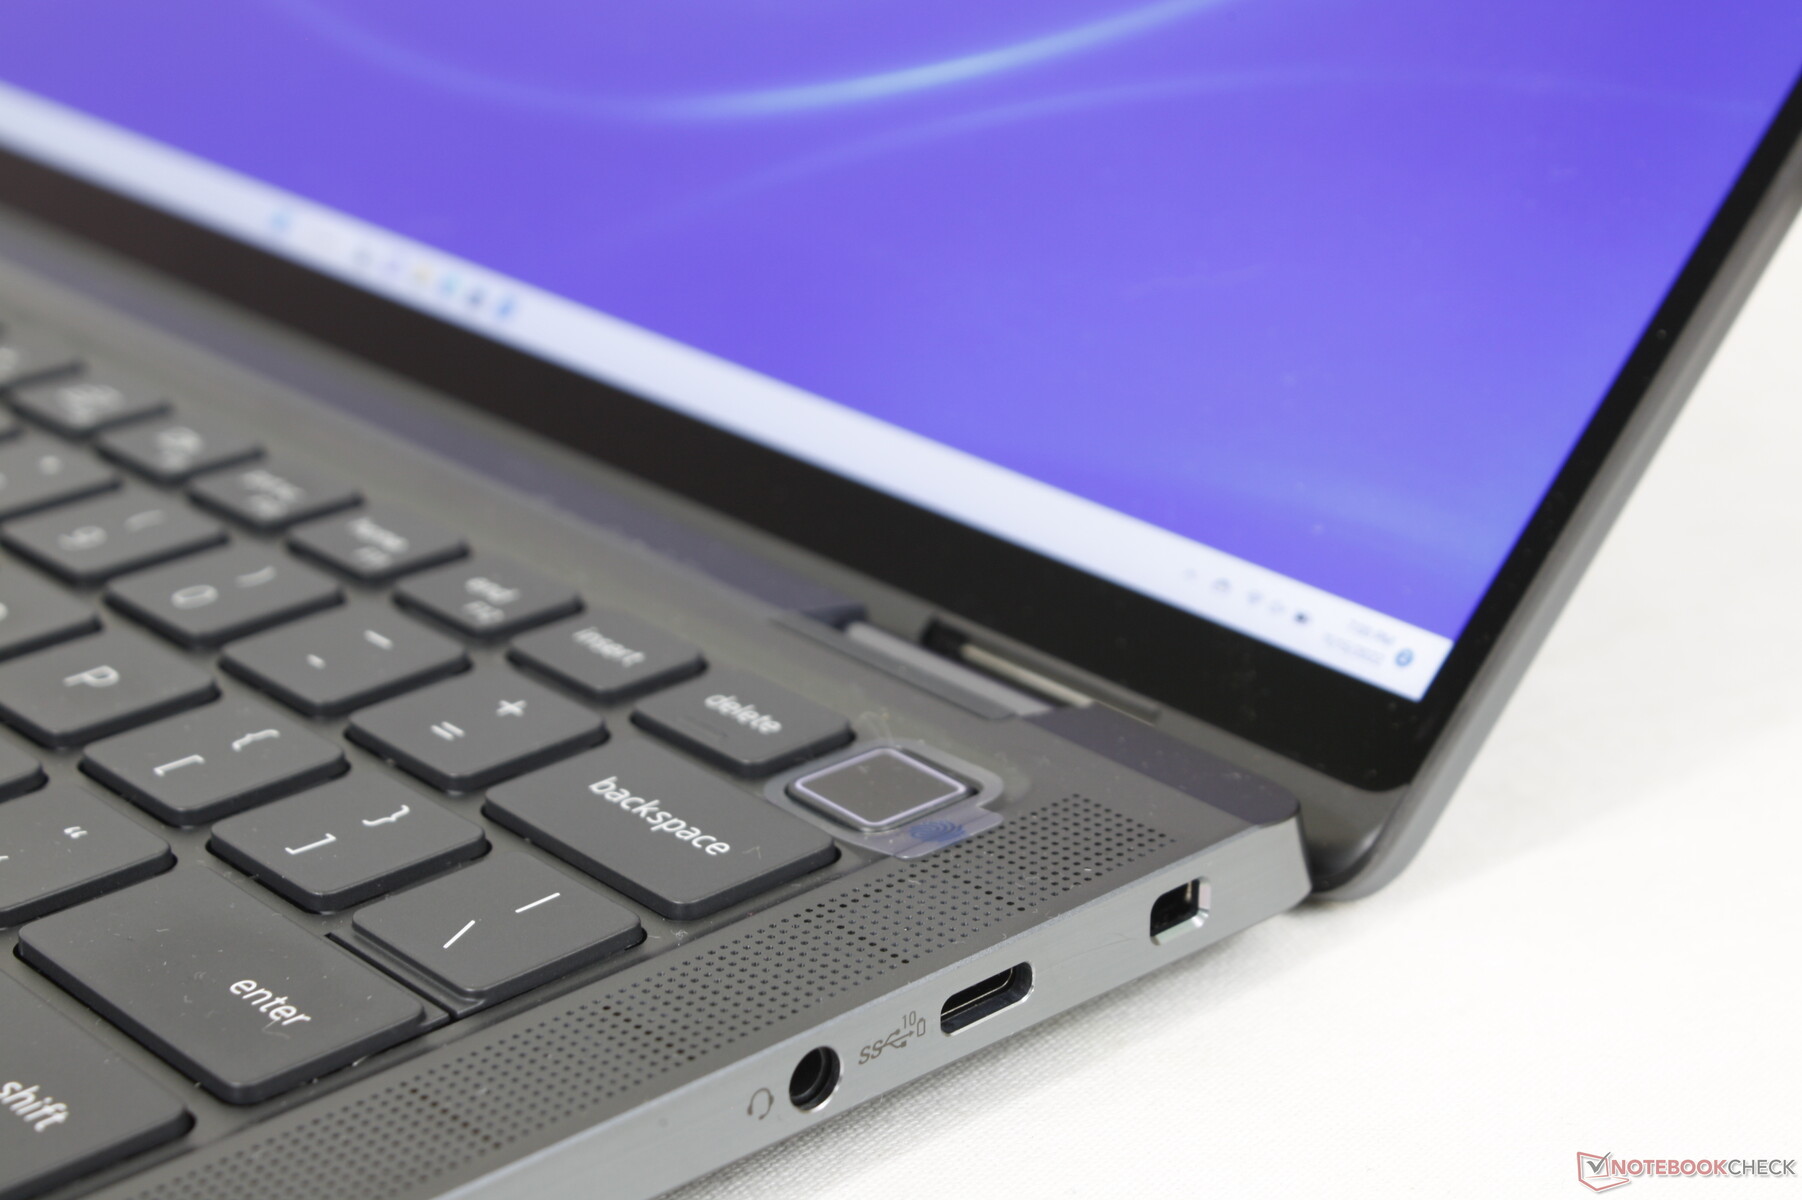
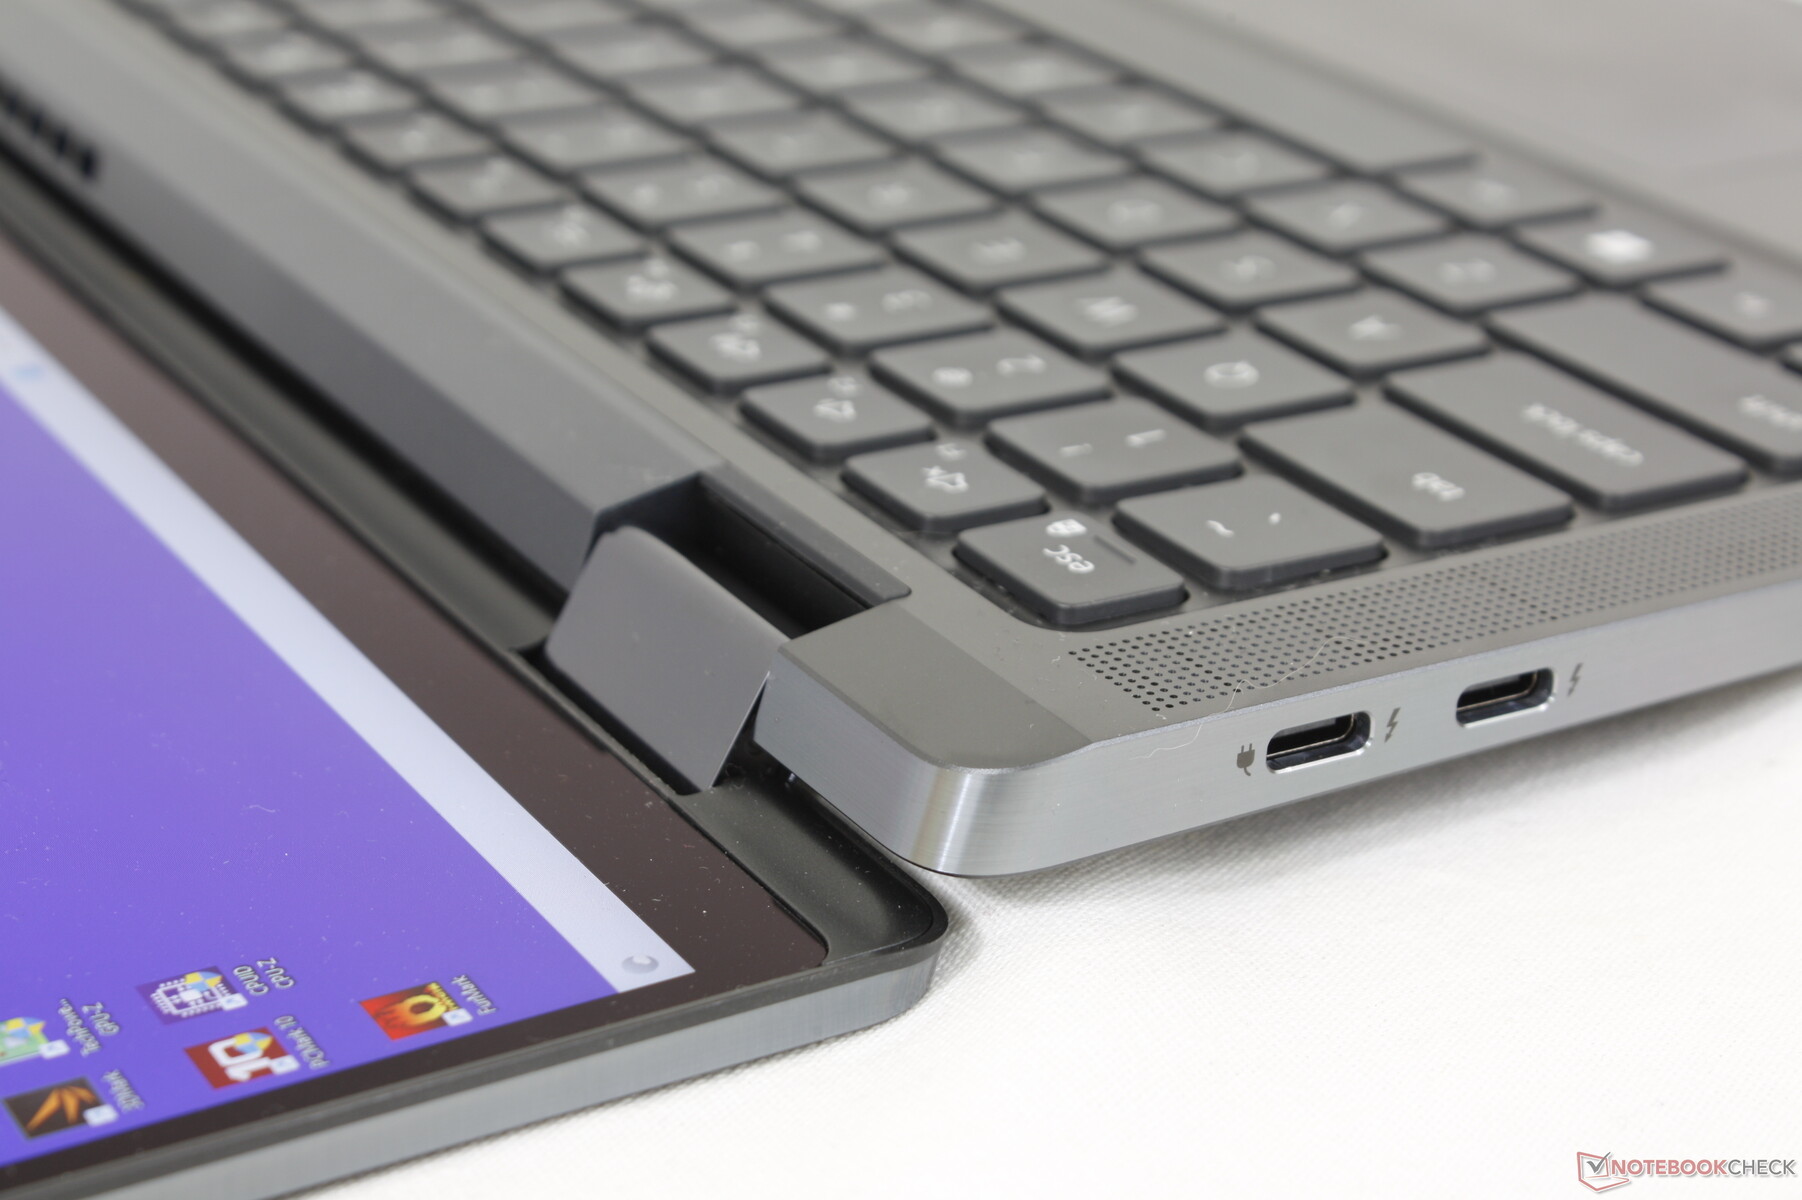
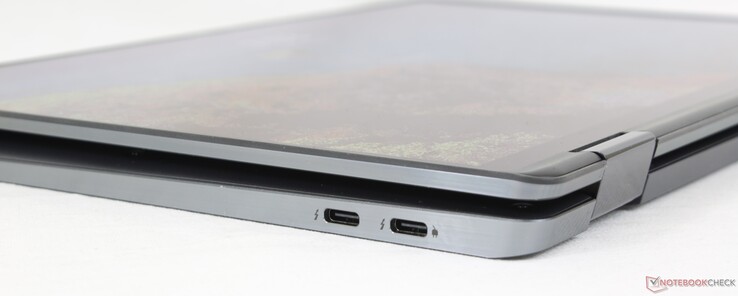
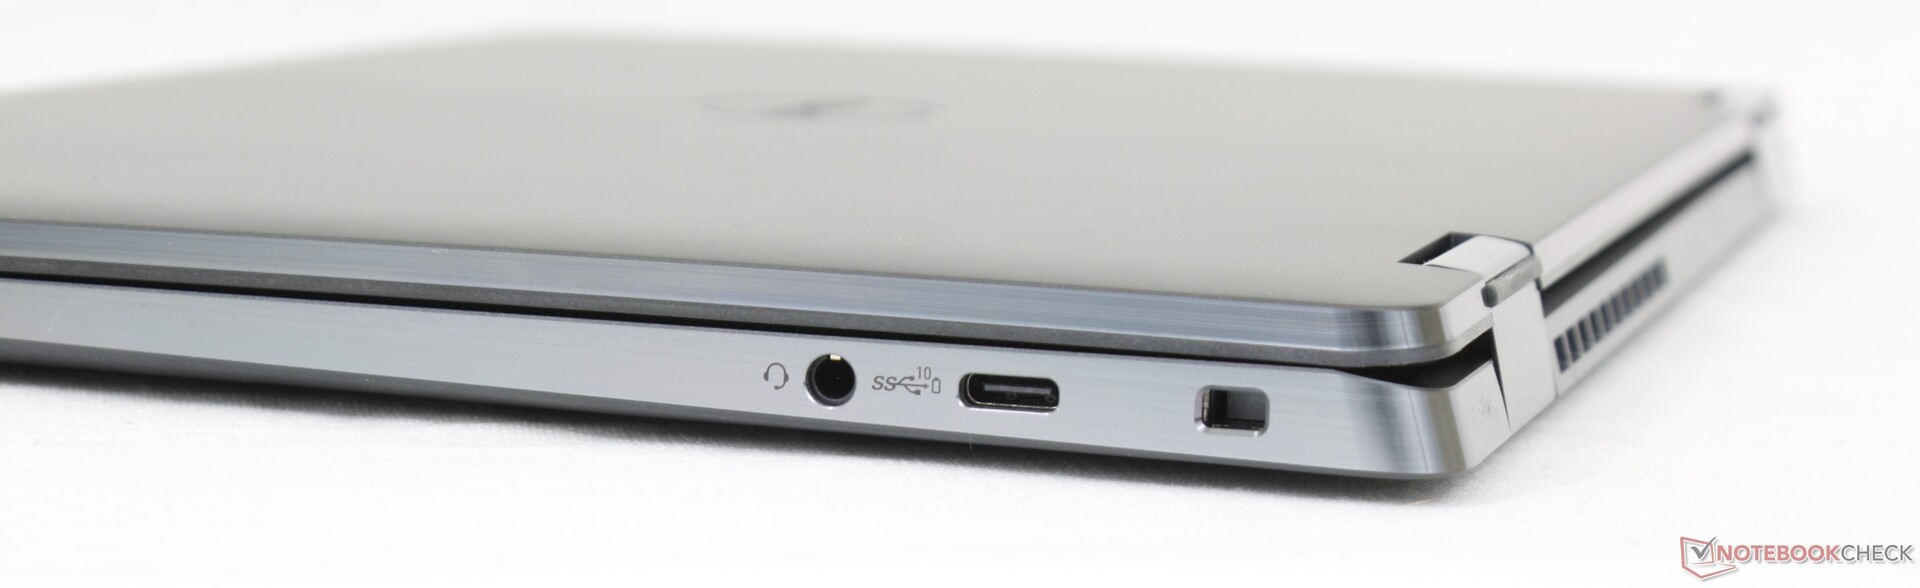
Connectivité - USB-C uniquement
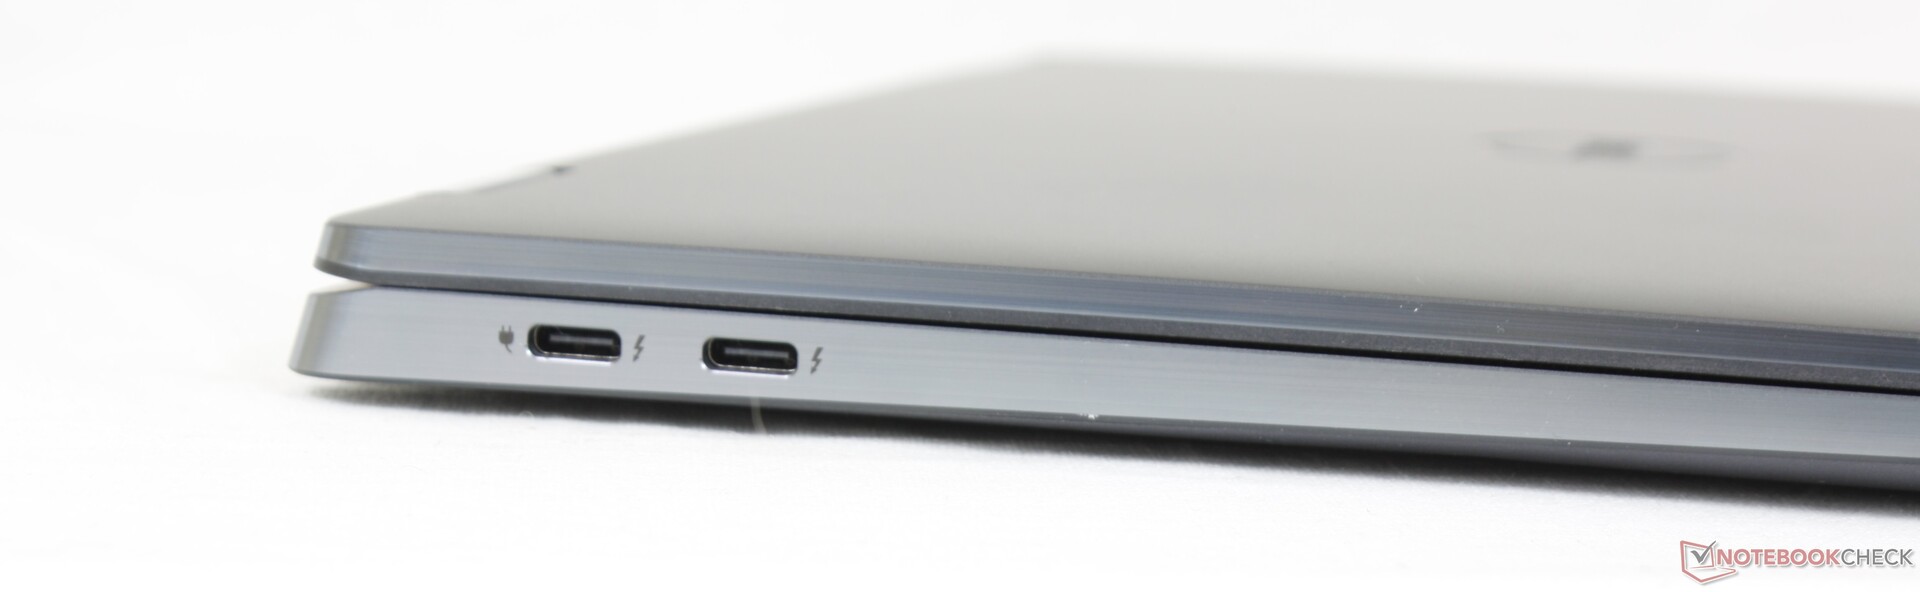
Préparez-vous à transporter des adaptateurs USB-C partout où vous allez car le modèle n'intègre aucun port USB-A ou HDMI. Si de tels ports sont nécessaires, vous pouvez alors envisager le Dragonfly Max à la place ou même le Summit E13 Flip.
N'oubliez pas que seuls les deux ports USB-C de gauche prennent en charge les périphériques Thunderbolt 4. N'importe lequel des trois ports USB-C peut être utilisé pour les moniteurs externes et la recharge.
Il est un peu décevant que le modèle n'intègre pas de lecteur de carte SD, étant donné que le moins cherLatitude 5310 2-en-1 moins cher, en comporte un.
Communication
Un Intel AX211 est fourni en standard pour la connectivité Wi-Fi 6E et Bluetooth 5.2. Les taux de transfert sont légèrement plus rapides sur 6 GHz par rapport à 5 GHz, mais la différence n'est pas aussi importante que ce à quoi on pourrait s'attendre
Le Snapdragon X20 LTE-A ou l'Intel 5000 5G sont en option pour la connectivité WWAN de l'uSIM. Malheureusement, vous ne pouvez pas acheter une SKU non-WAN pour ajouter un module WAN plus tard, car l'antenne n'est pas incluse dans les configurations non-WAN.
| Networking | |
| iperf3 transmit AX12 | |
| Dell Latitude 5310-23VP6 | |
| HP Elite Dragonfly Max | |
| HP EliteBook x360 1030 G7 | |
| MSI Summit E13 Flip Evo A11MT | |
| iperf3 receive AX12 | |
| HP EliteBook x360 1030 G7 | |
| HP Elite Dragonfly Max | |
| MSI Summit E13 Flip Evo A11MT | |
| Dell Latitude 5310-23VP6 | |
| iperf3 receive AXE11000 6GHz | |
| Dell Latitude 9330 | |
| iperf3 receive AXE11000 | |
| Dell Latitude 9330 | |
| iperf3 transmit AXE11000 | |
| Dell Latitude 9330 | |
| iperf3 transmit AXE11000 6GHz | |
| Dell Latitude 9330 | |
Webcam
La webcam de 2 MP avec IR est fournie en standard pour la prise en charge de Windows Hello. En comparaison, les ordinateurs portables HP Elite et Spectre sont équipés de capteurs de 5 MP pour une qualité d'image plus nette. Jusqu'à présent, toutes les webcams des ordinateurs portables Dell Latitude et Lenovo ThinkPad restent limitées à 2 MP.


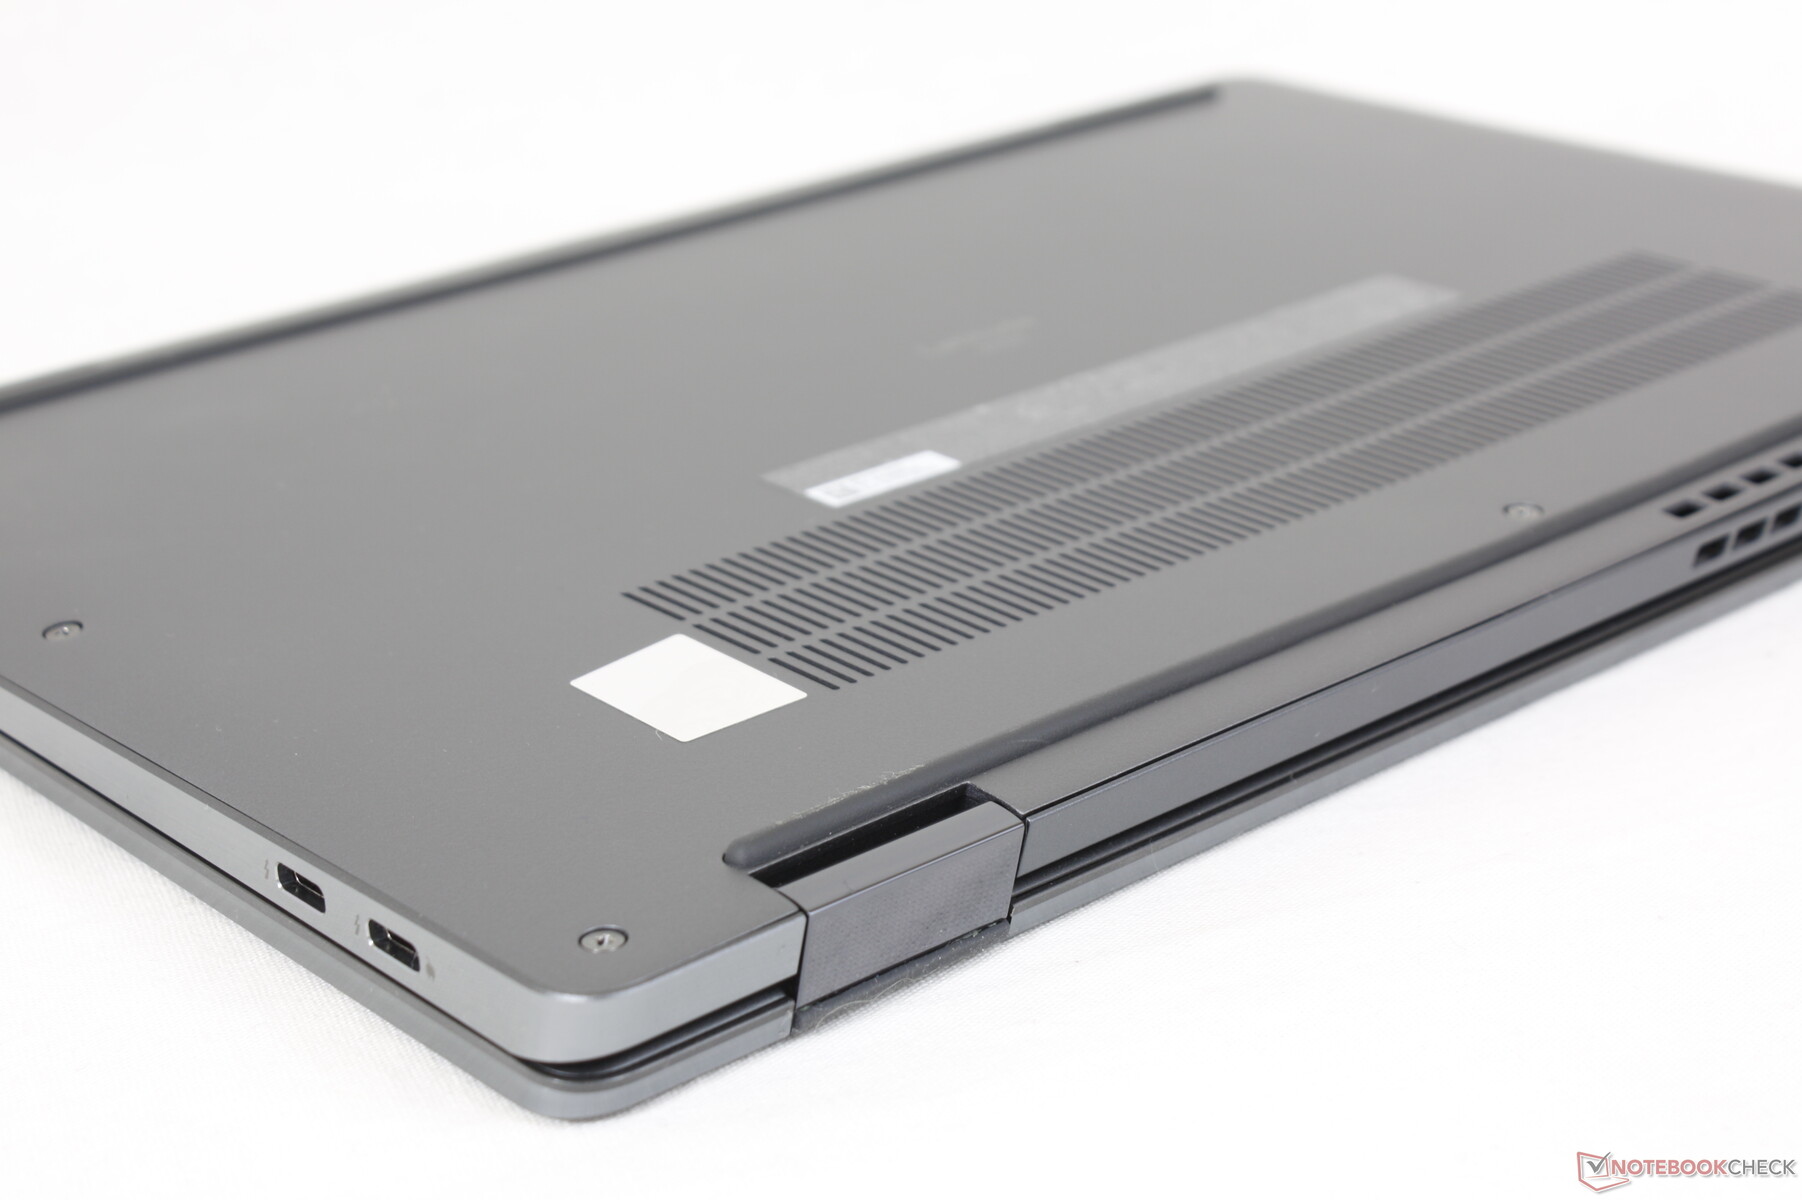
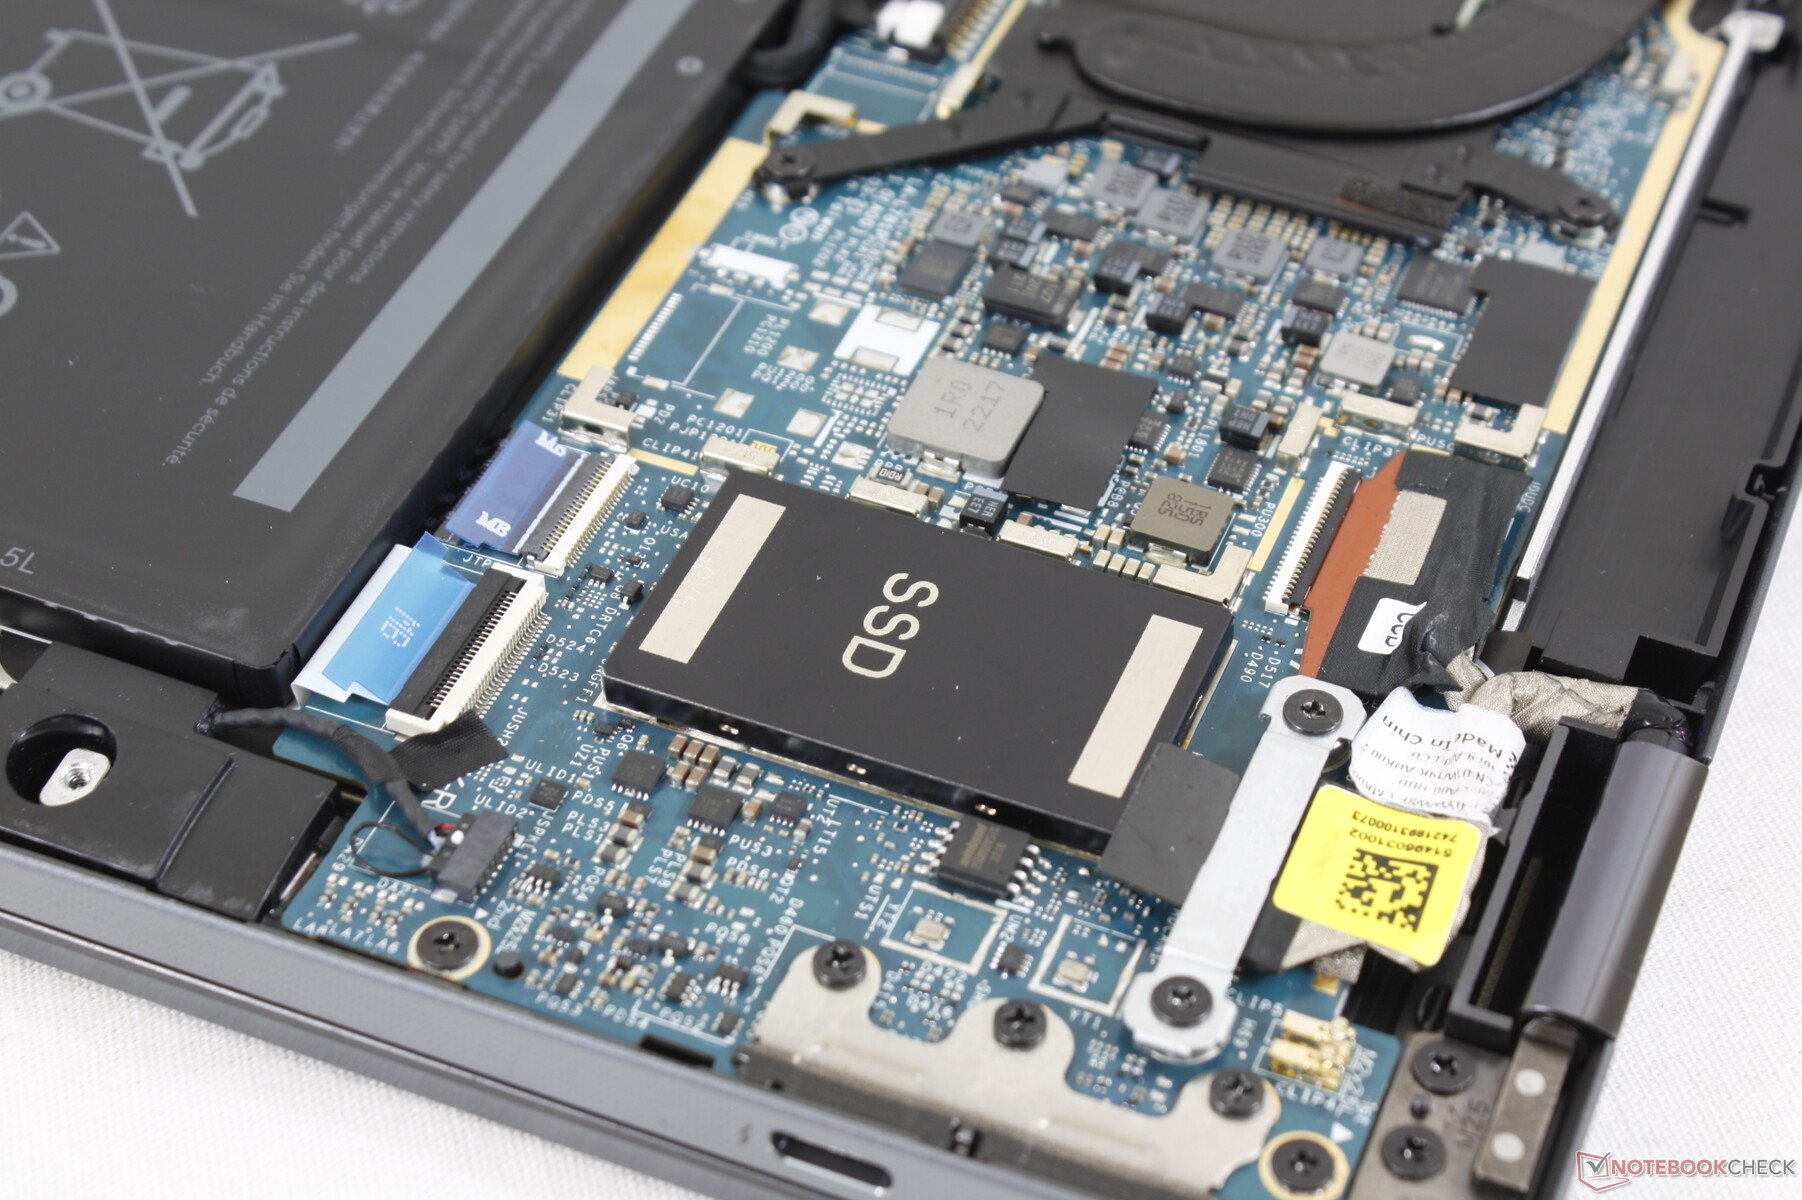
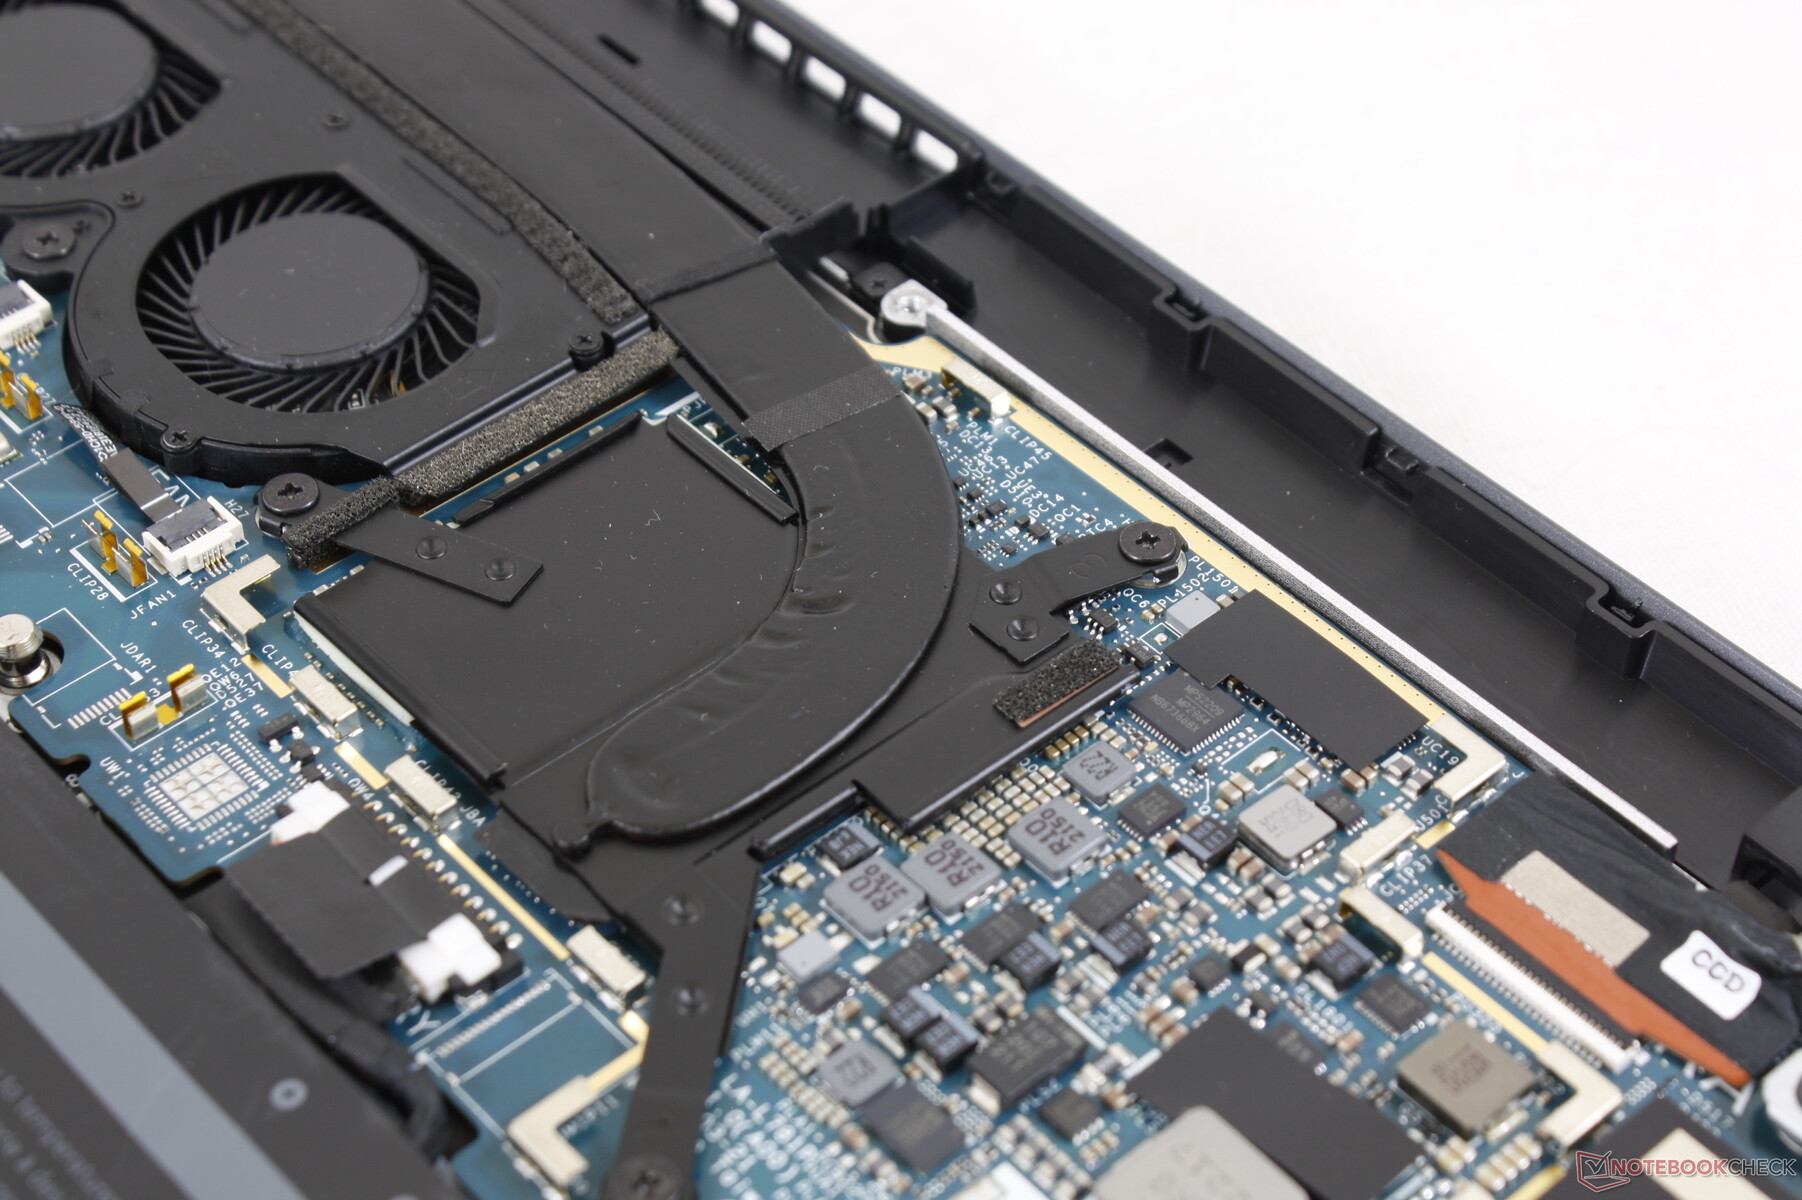
Maintenance
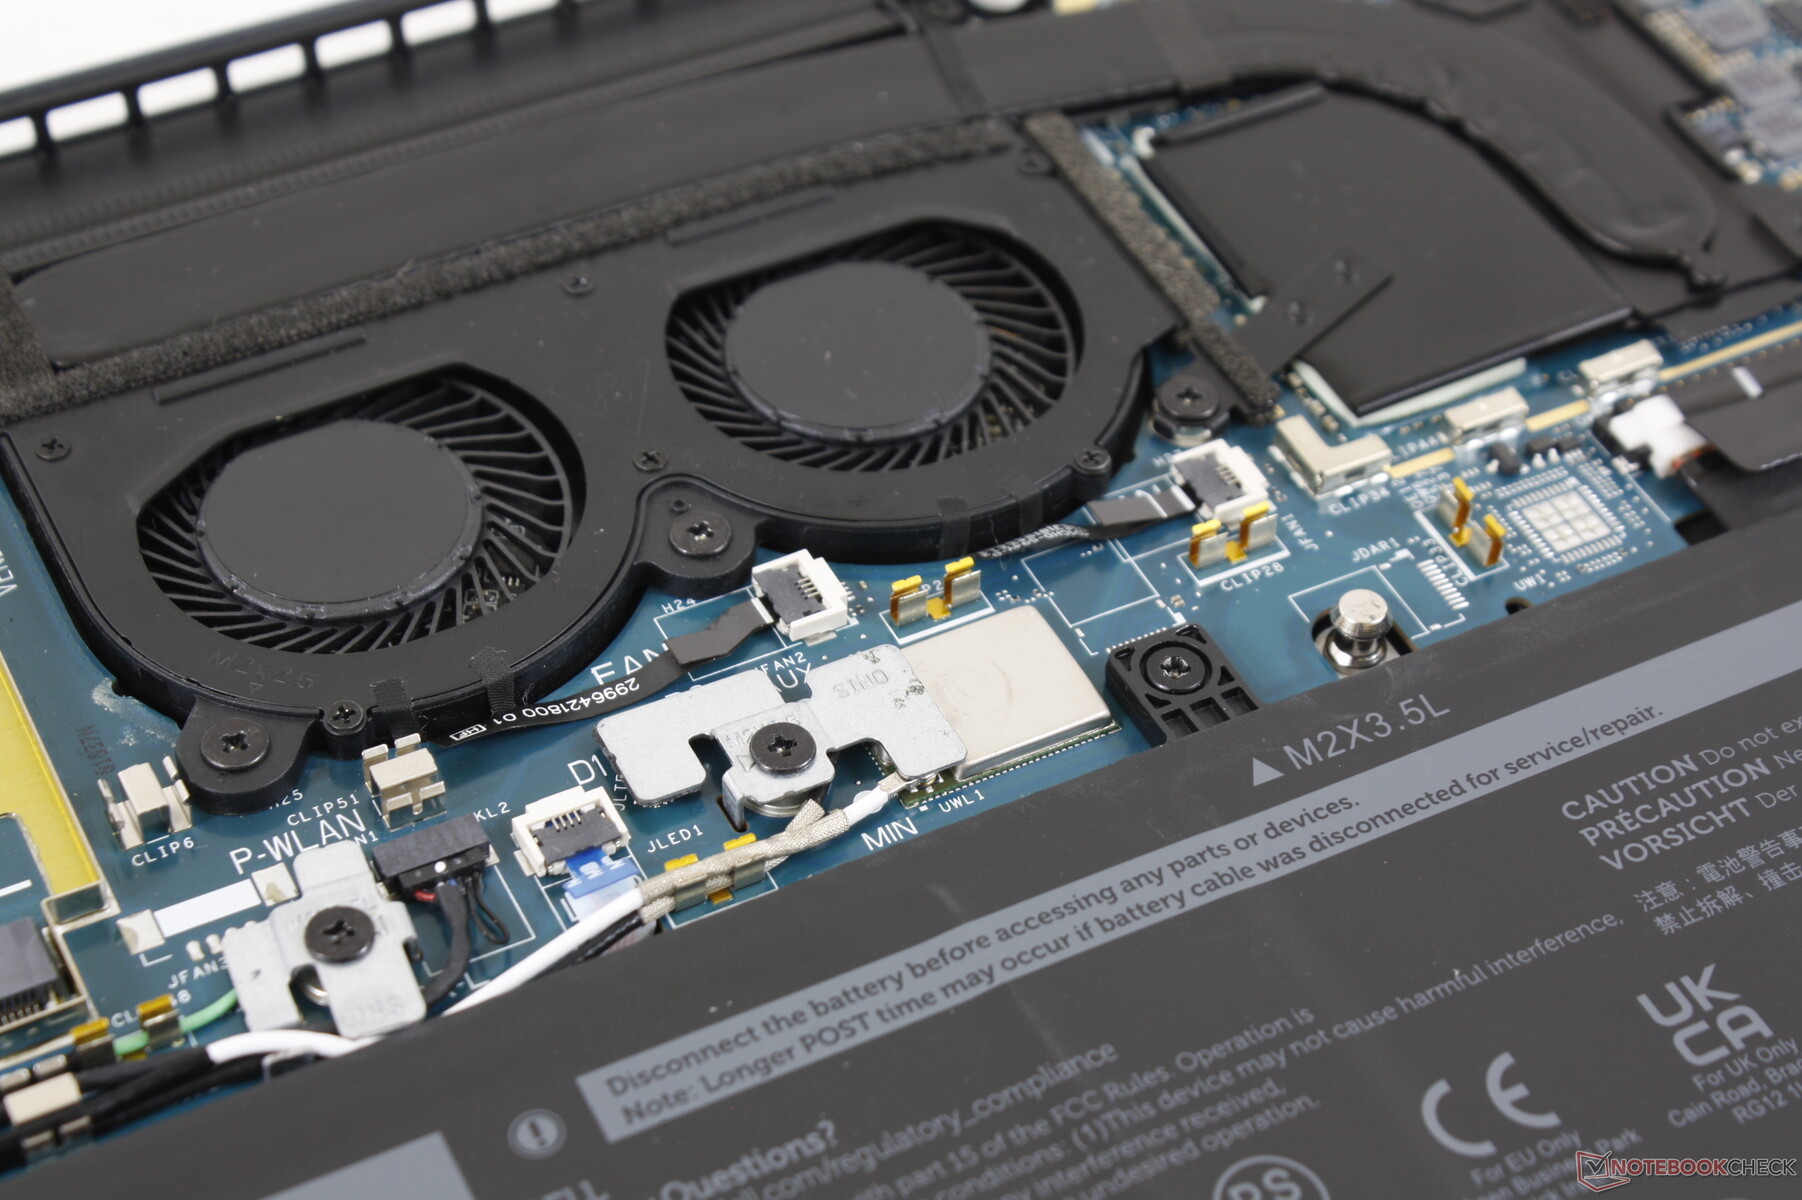
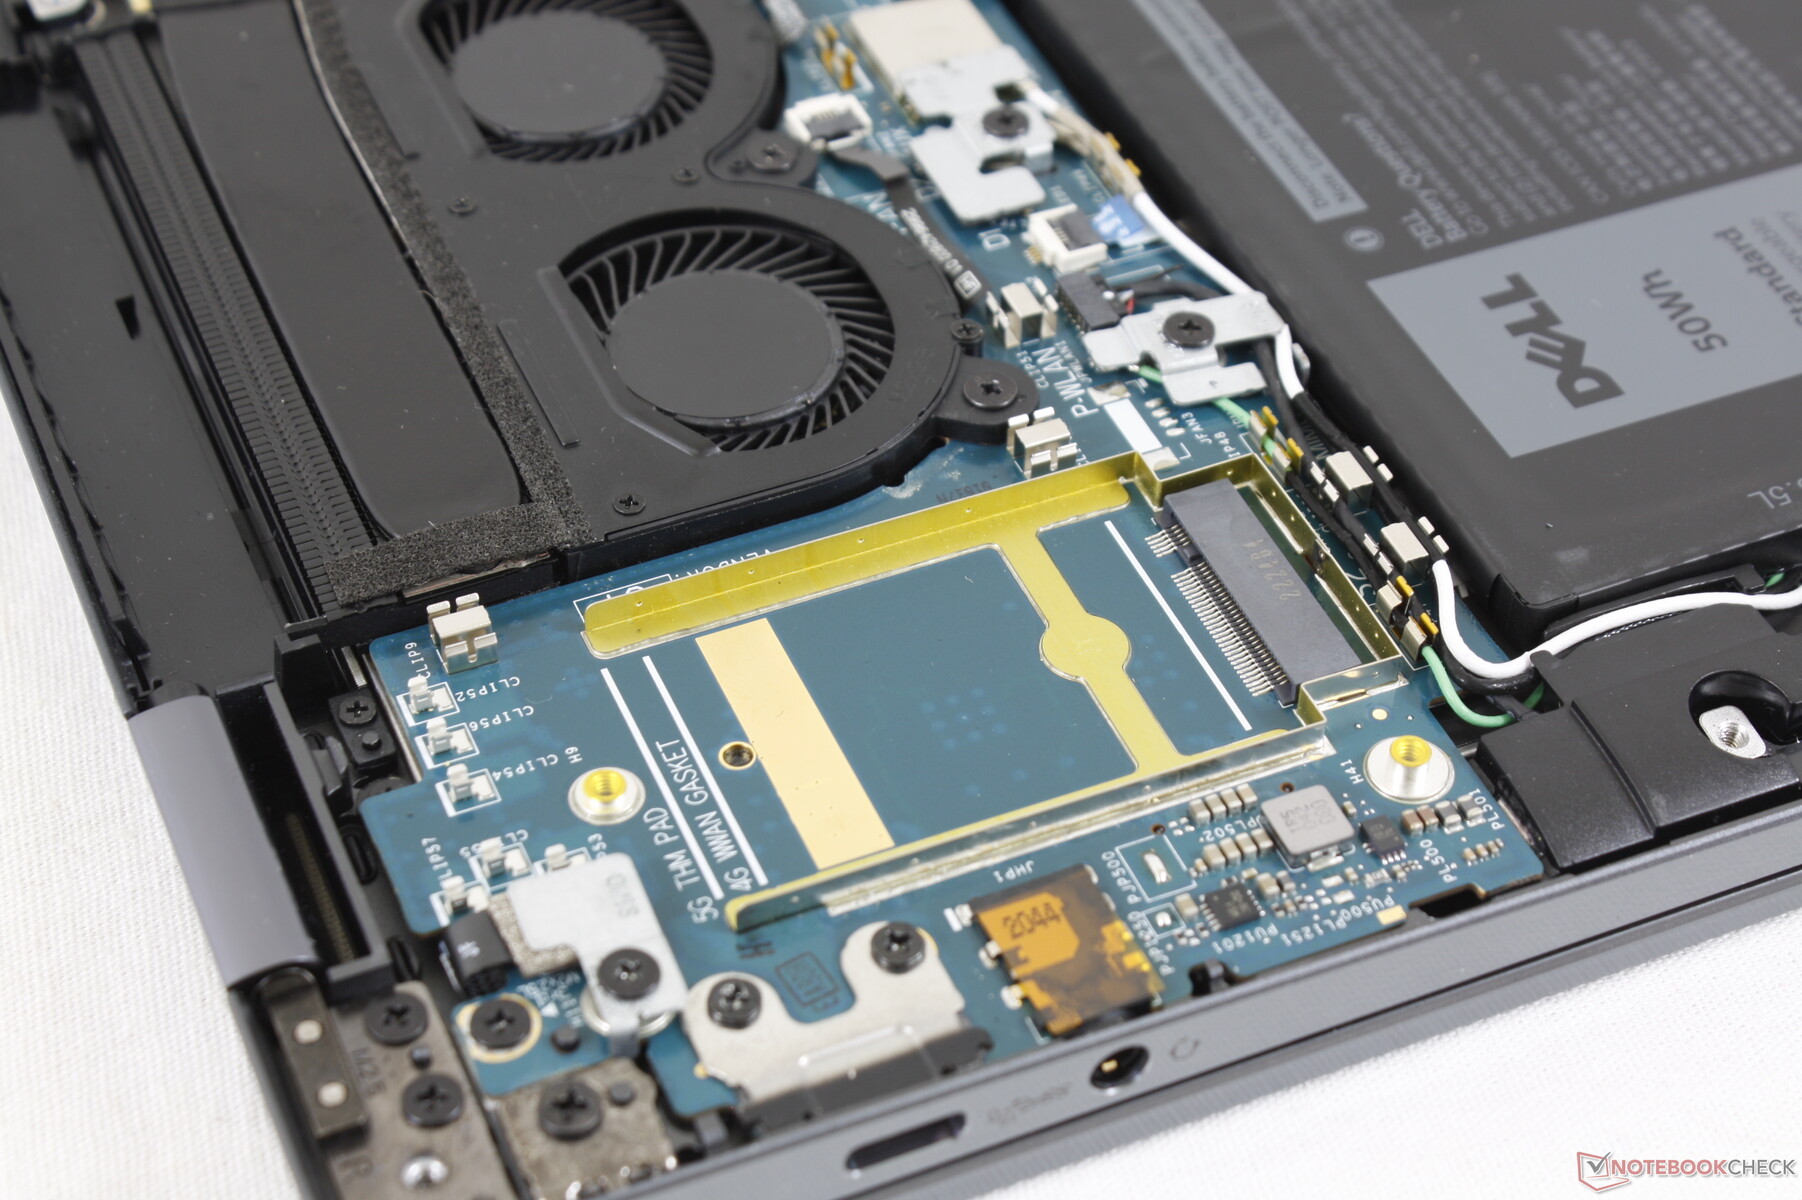
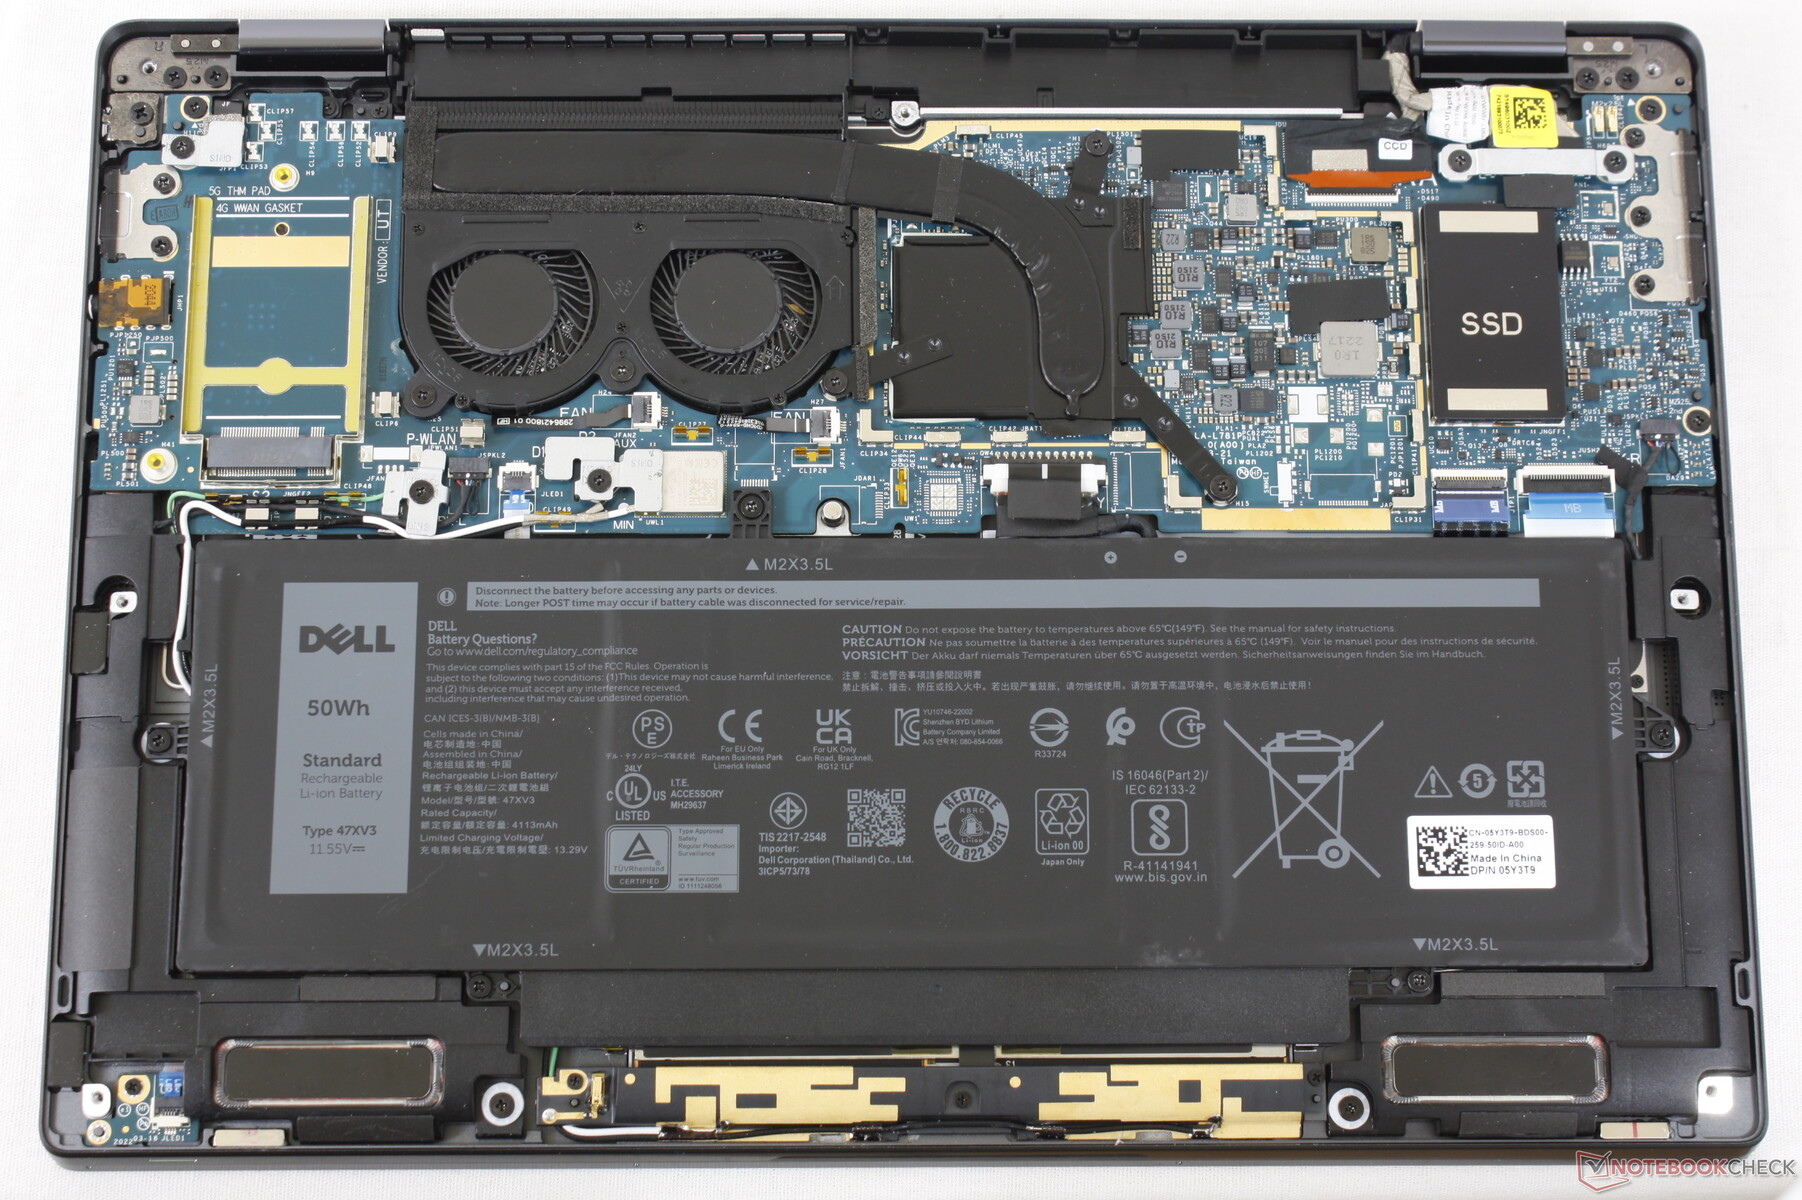
Le panneau inférieur est fixé par seulement 6 vis Philips pour un entretien facile. Les utilisateurs peuvent retirer la batterie, les modules WAN et SSD pendant que les modules WLAN et RAM sont soudés. Les modules WLAN et RAM non évolutifs sont courants sur les ordinateurs portables de 13 pouces.
Accessoires et garantie
La boîte de détail comprend un adaptateur USB-C vers USB-A pour pallier le fait que le Latitude 9330 n'intègre aucun port USB-A. Une garantie limitée du fabricant de trois ans est fournie en standard, ce qui est une pratique courante pour les PC professionnels haut de gamme de Dell ou HP.
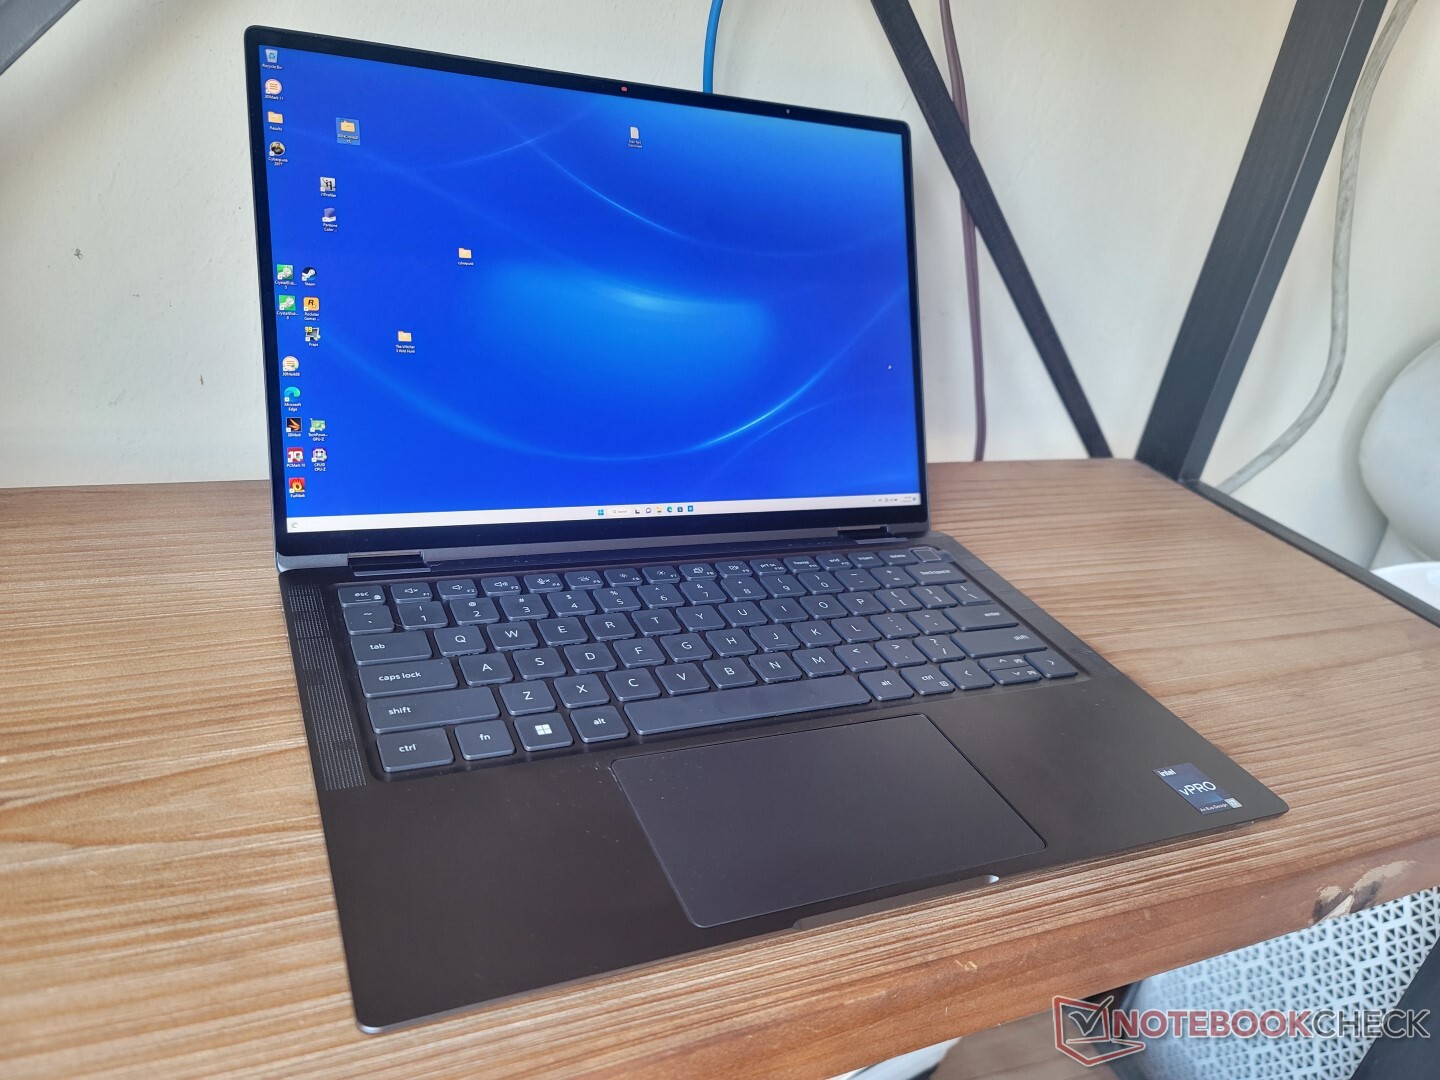
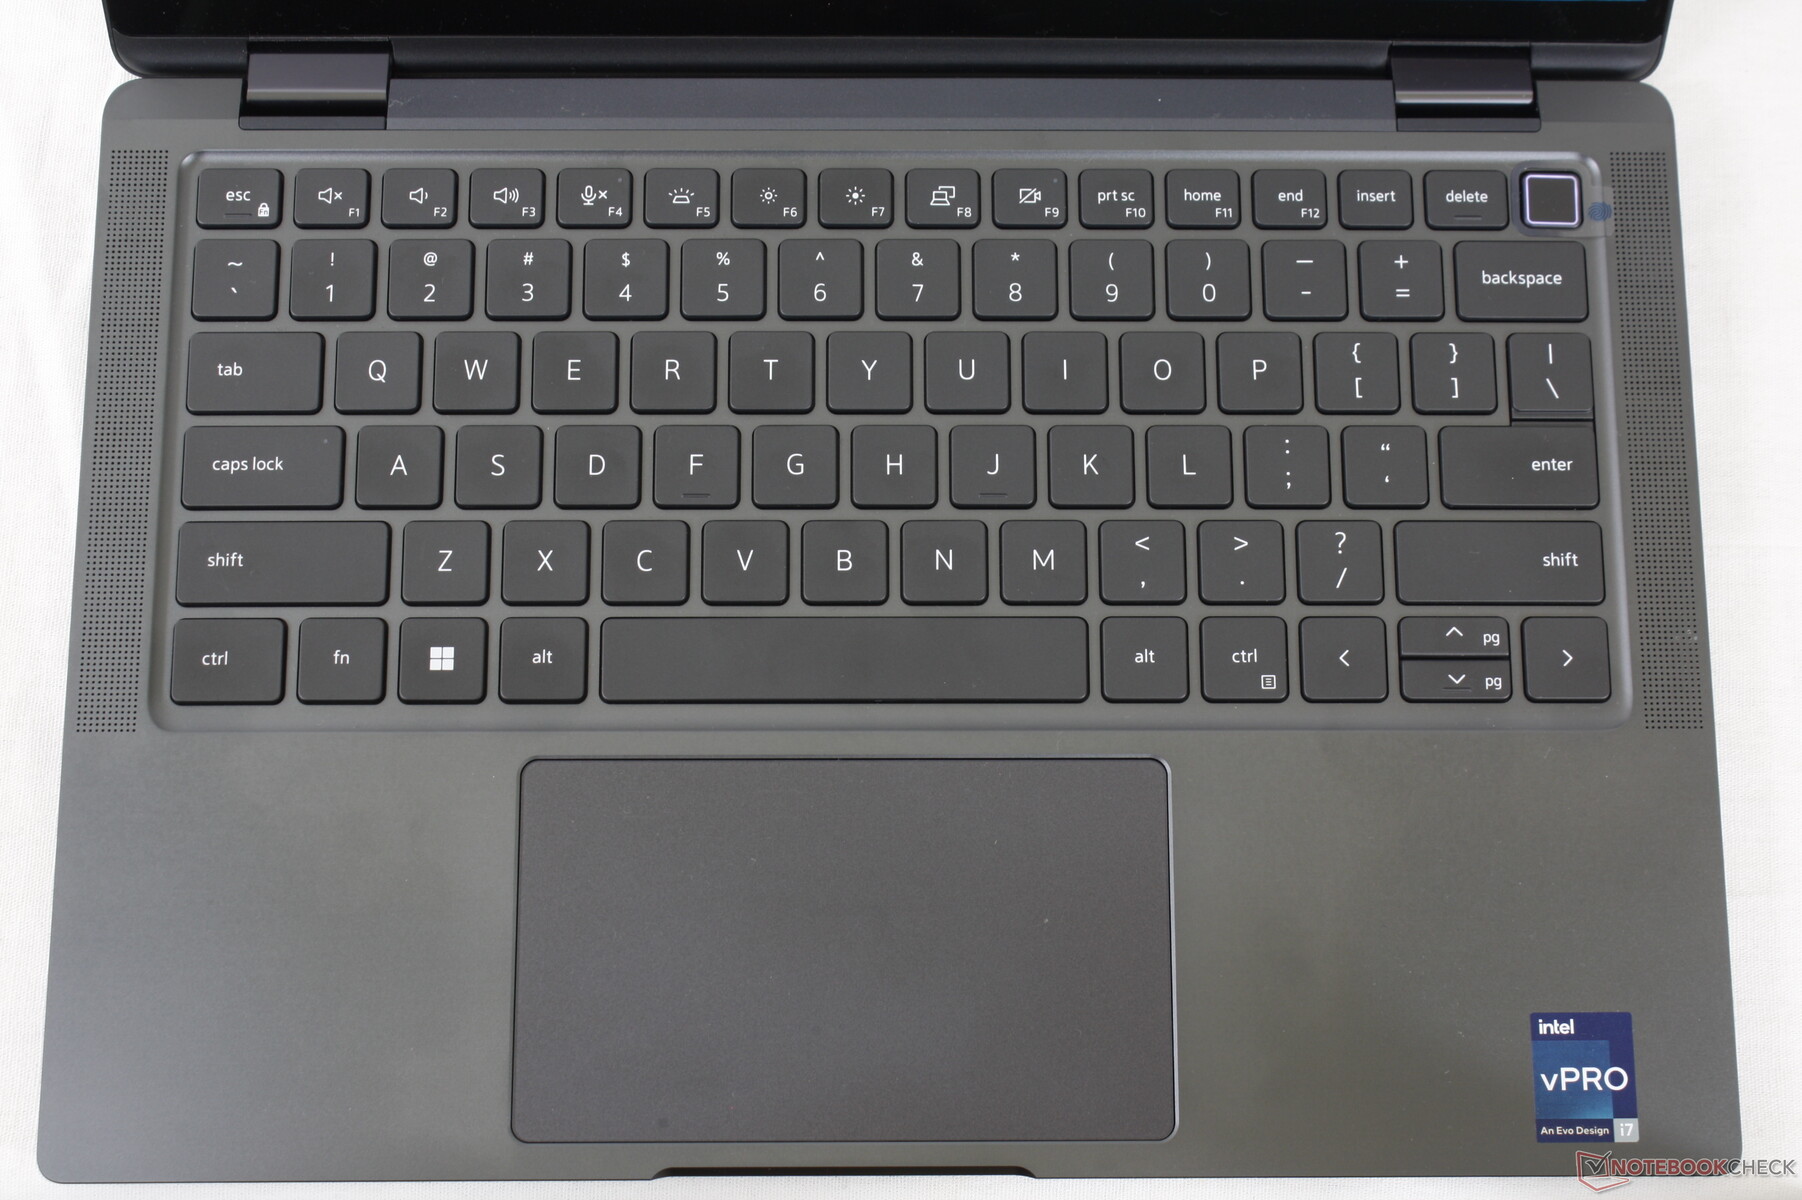
Périphériques d'entrée - Un clavier confortable et un pavé tactile spongieux
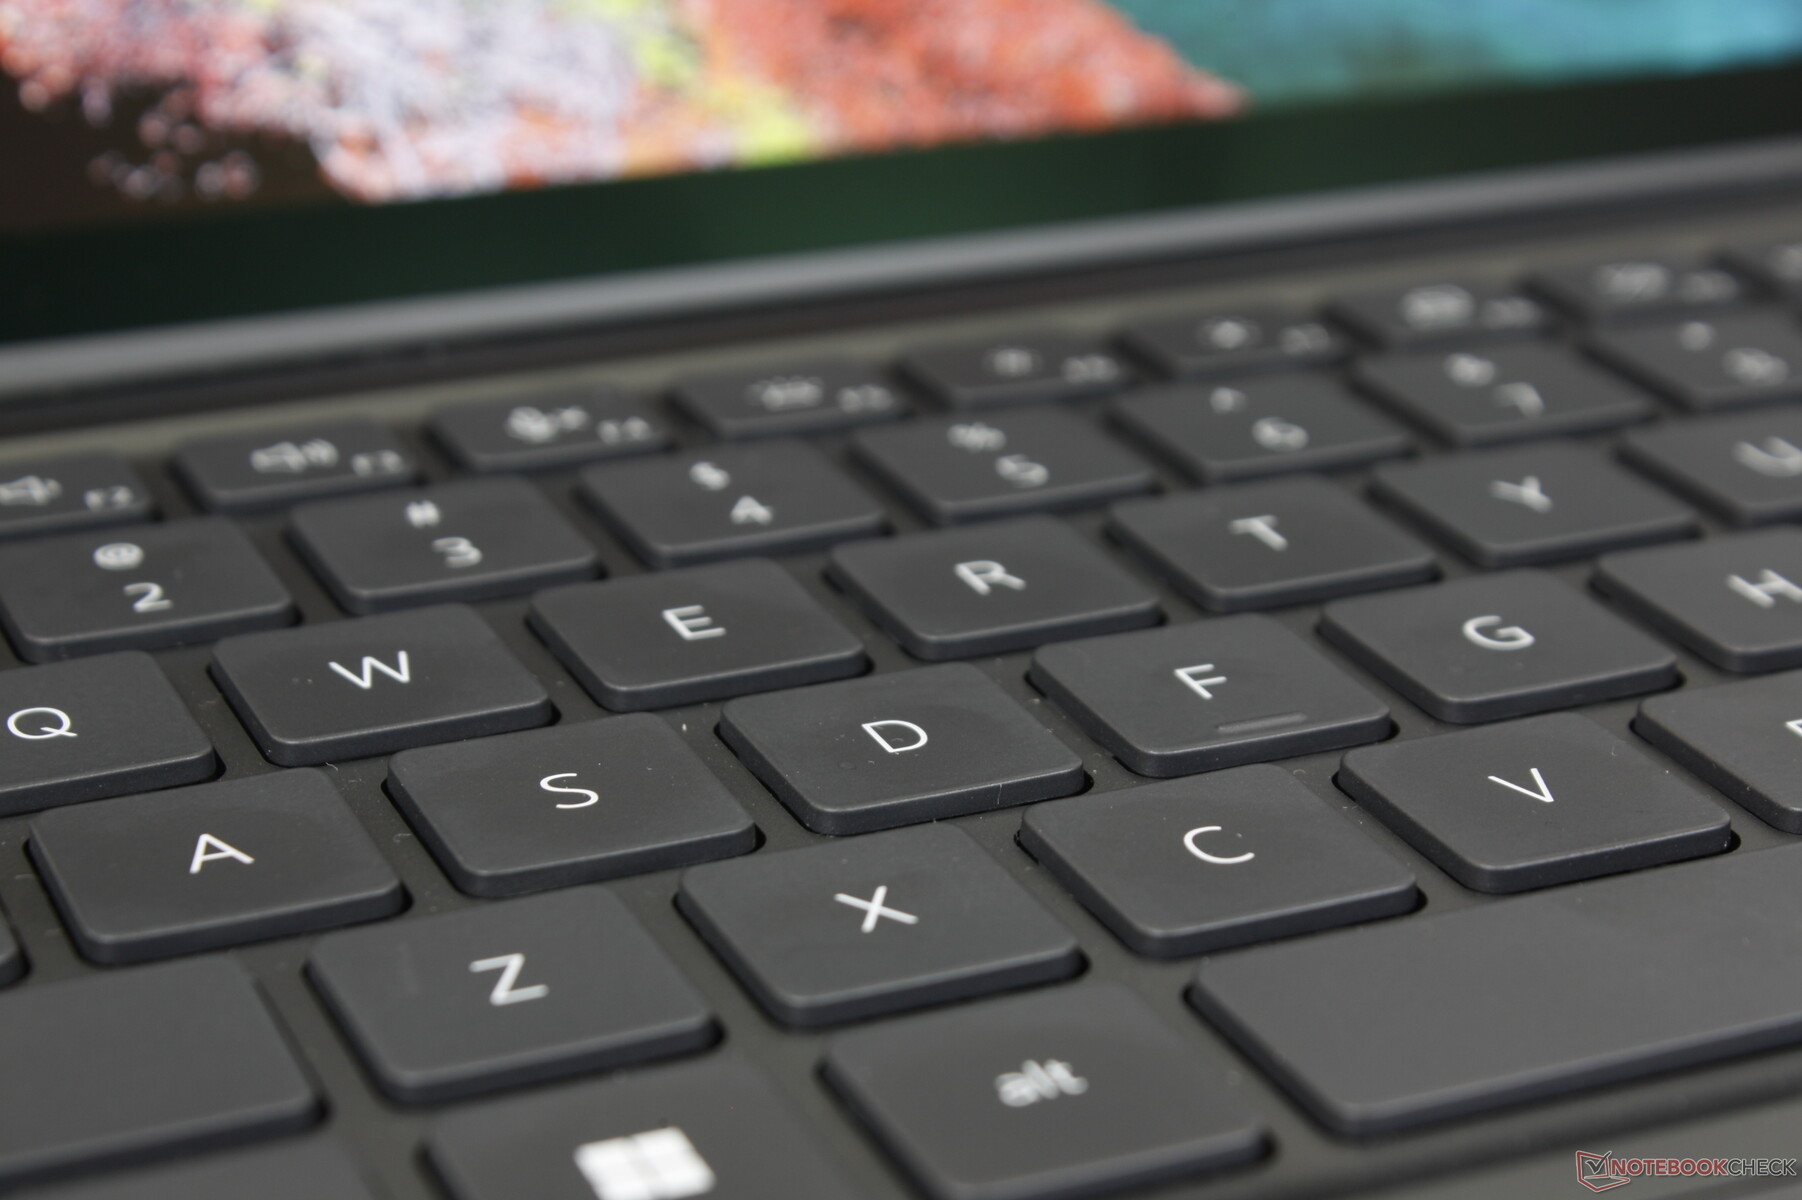
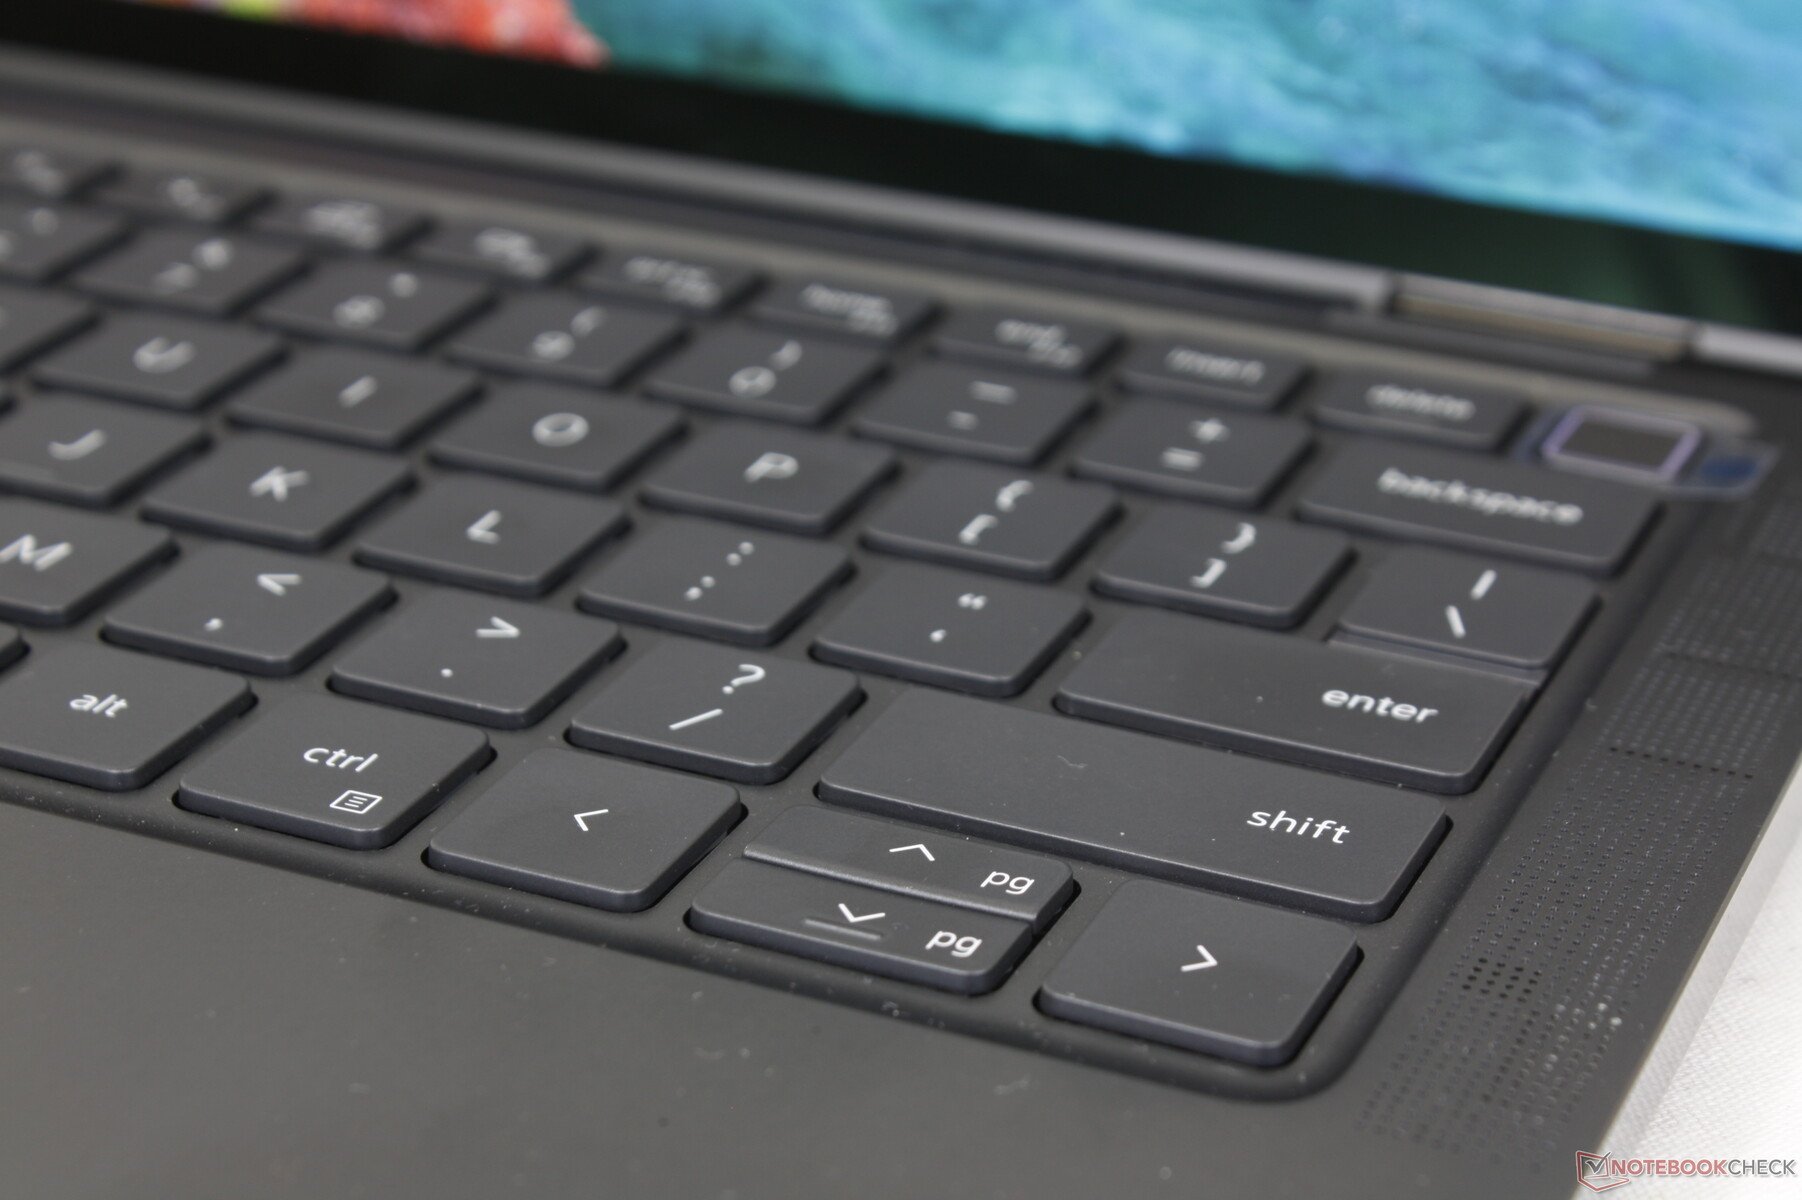
Clavier
Les touches du Latitude 9330 sont plus fermes et offrent une meilleure rétroaction que celles du Série XPS 13 9315 pour une expérience de frappe plus confortable. Elles sont plus comparables aux touches des séries Spectre ou EliteBook qu'à celles des ordinateurs portables grand public moins chers. Le bruit est cependant modérément fort, ce qui est une conséquence de la rétroaction plus nette.
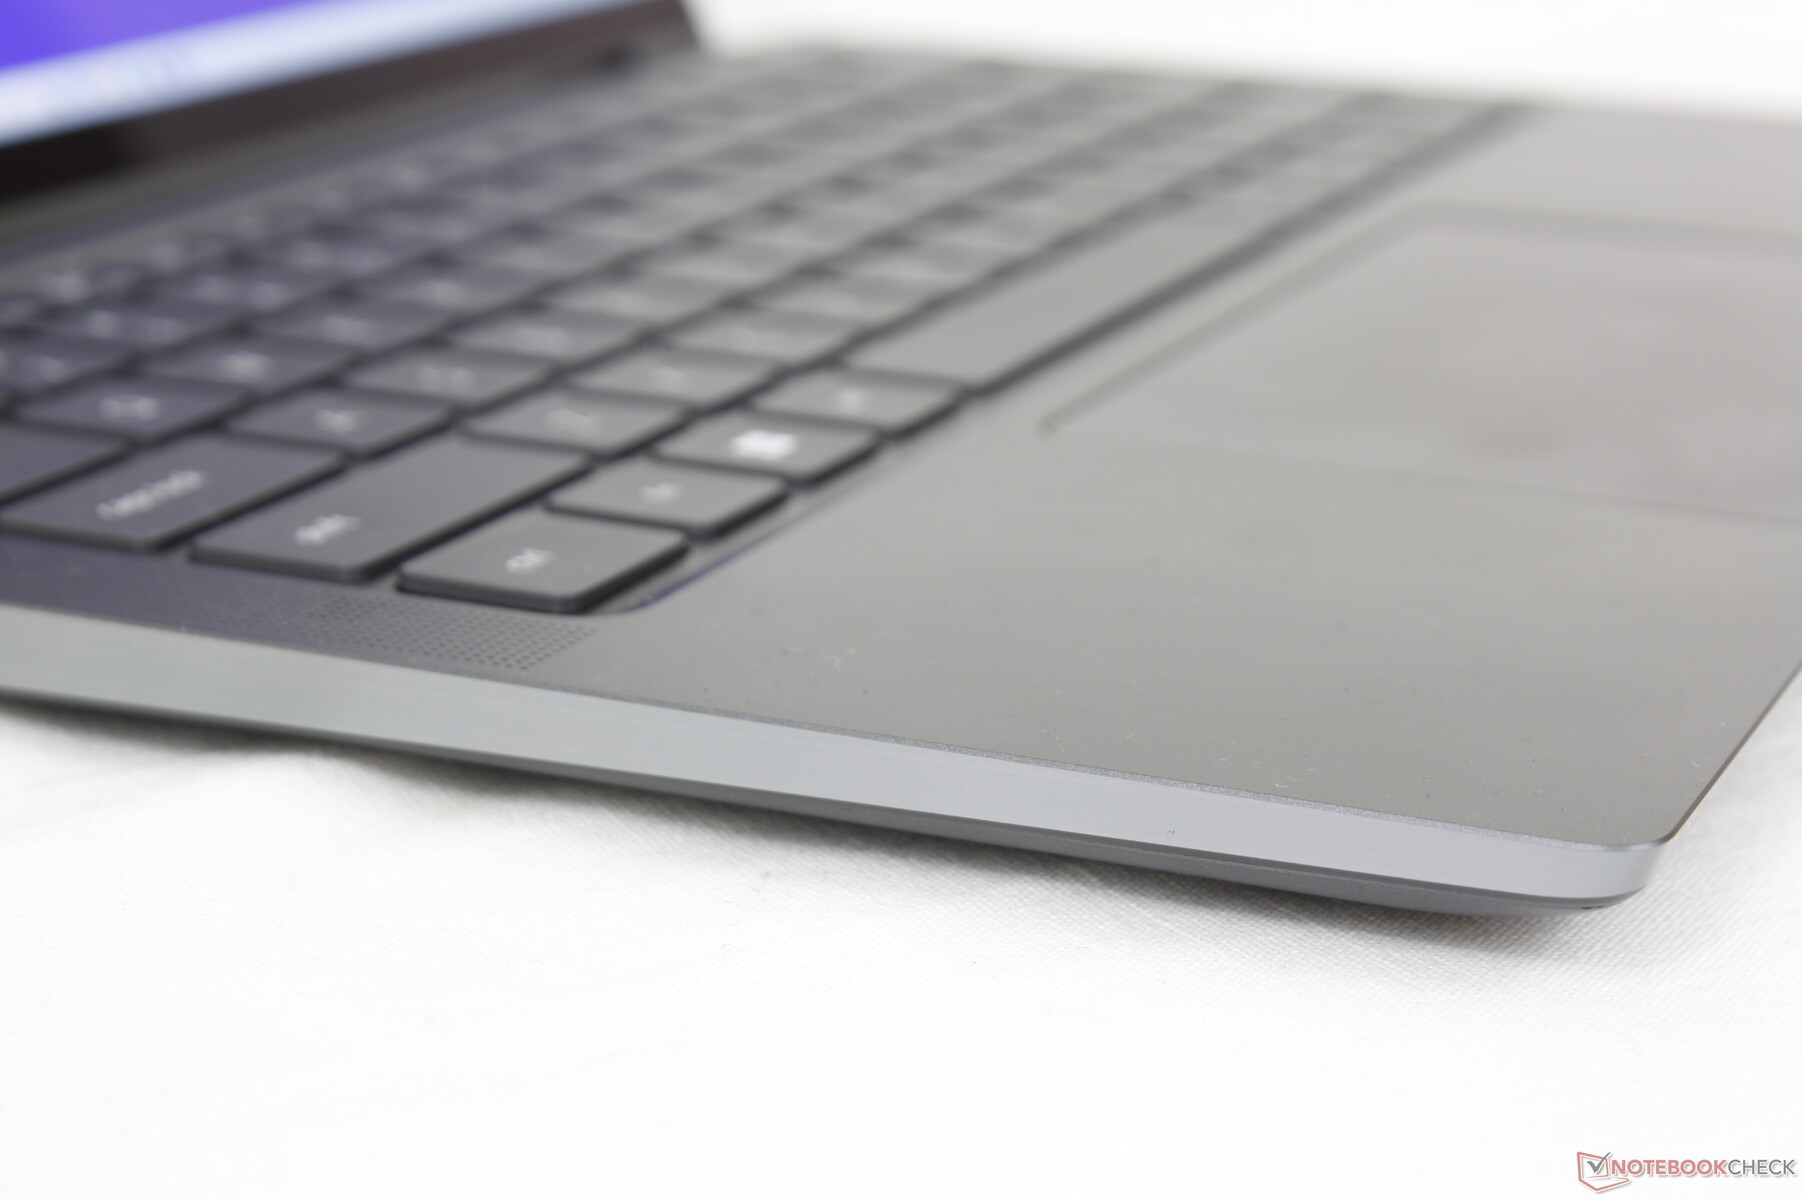
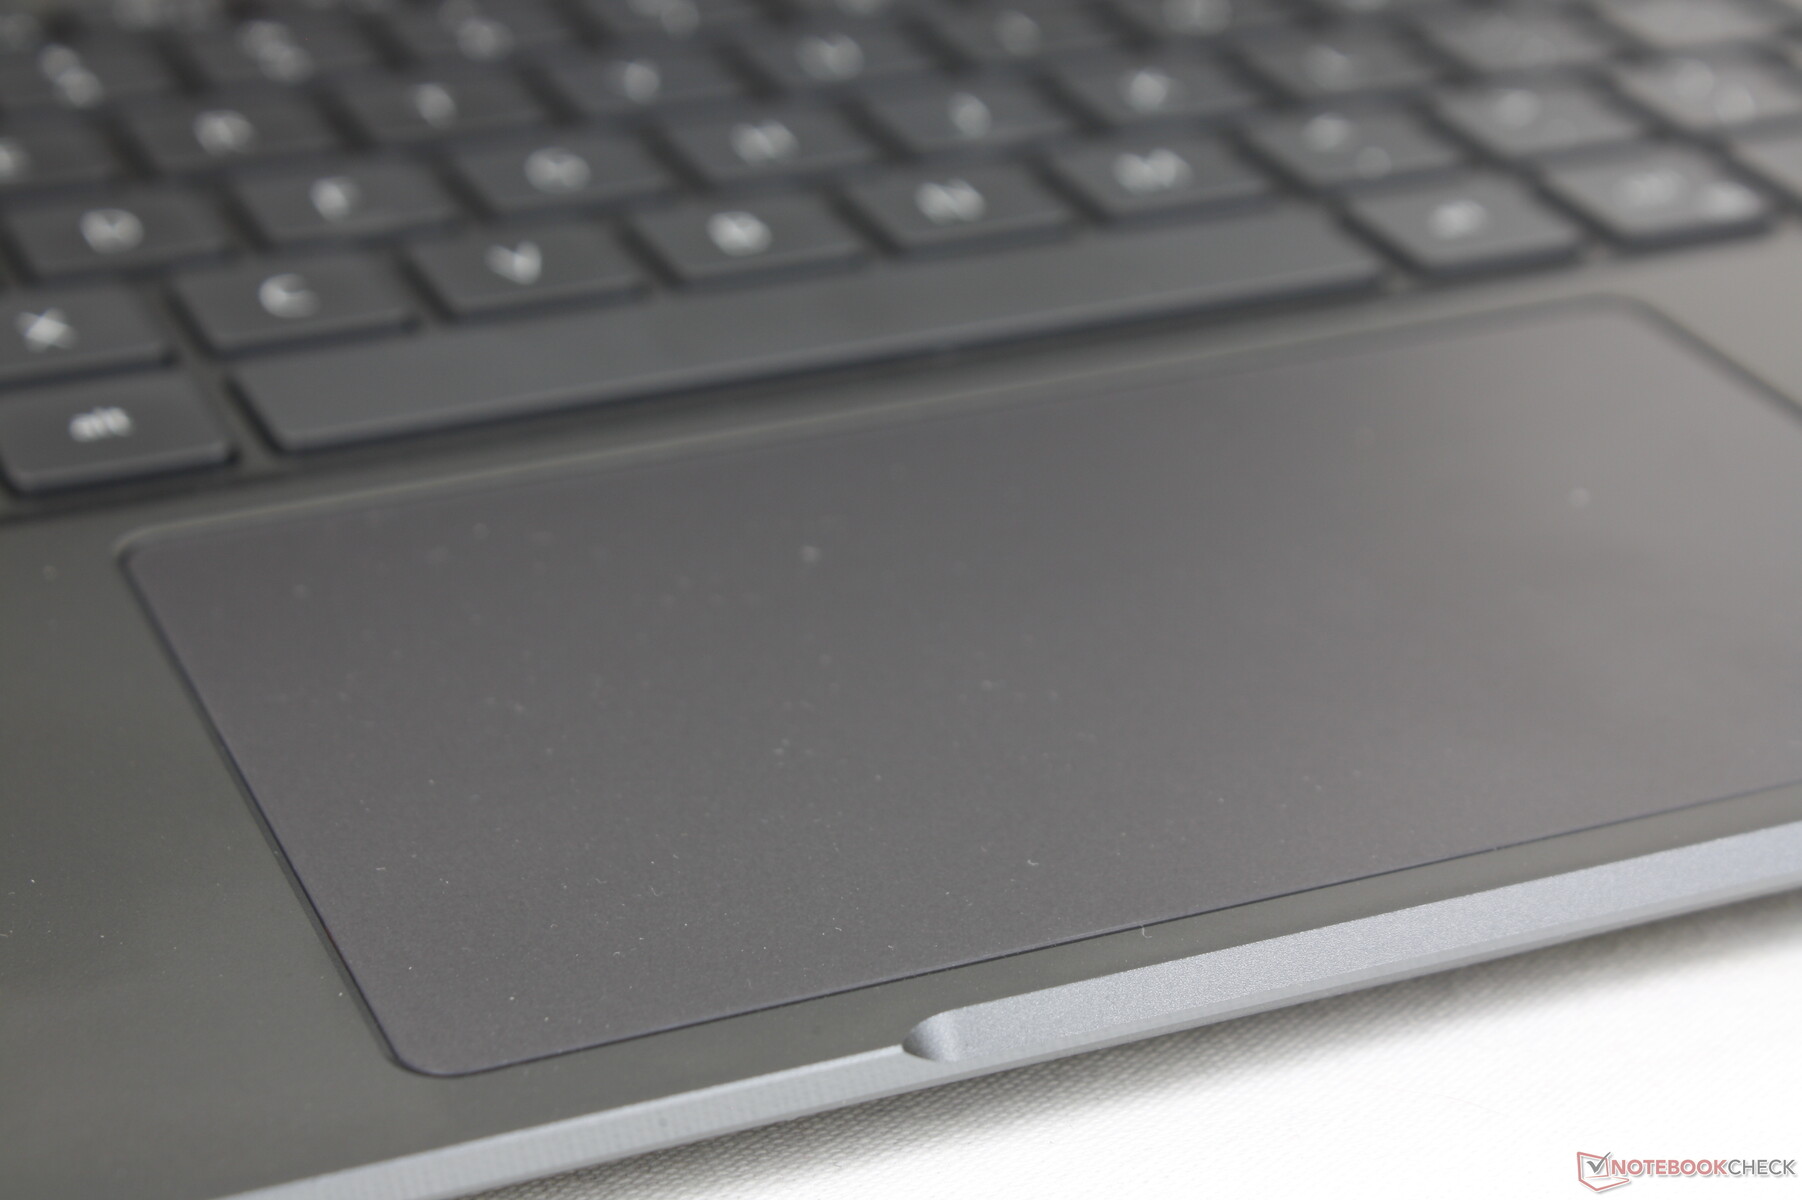
Pavé tactile
Le pavé tactile est plus grand que celui du ThinkPad X1 Titanium Yoga (11,5 x 6,8 cm contre 9 x 6,5 cm) pour faciliter les saisies multi-touch malgré le petit format de 13 pouces. En revanche, il n'y a pas de boutons de souris dédiés et les actions de glisser-déposer sont donc plus difficiles à réaliser. Sa surface est totalement lisse, avec seulement un peu de collage à des vitesses plus lentes pour des clics plus précis.
Le retour d'information lors des clics sur le pavé tactile est plus doux et plus silencieux que sur la plupart des autres ordinateurs portables. Bien que certains puissent apprécier l'absence d'un fort "clic" lors de la pression, le retour spongieux n'est pas très satisfaisant.
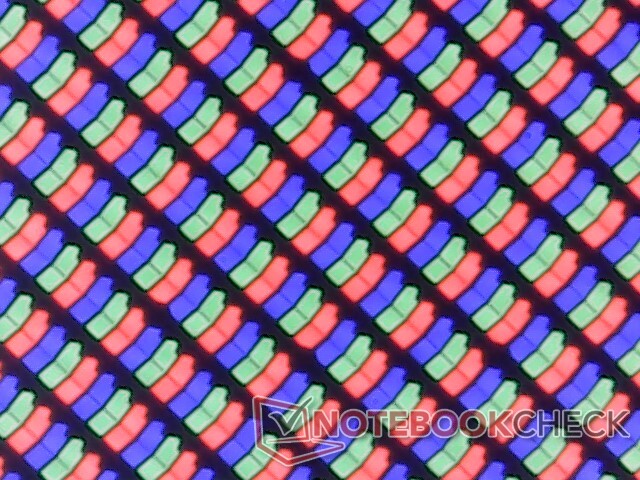
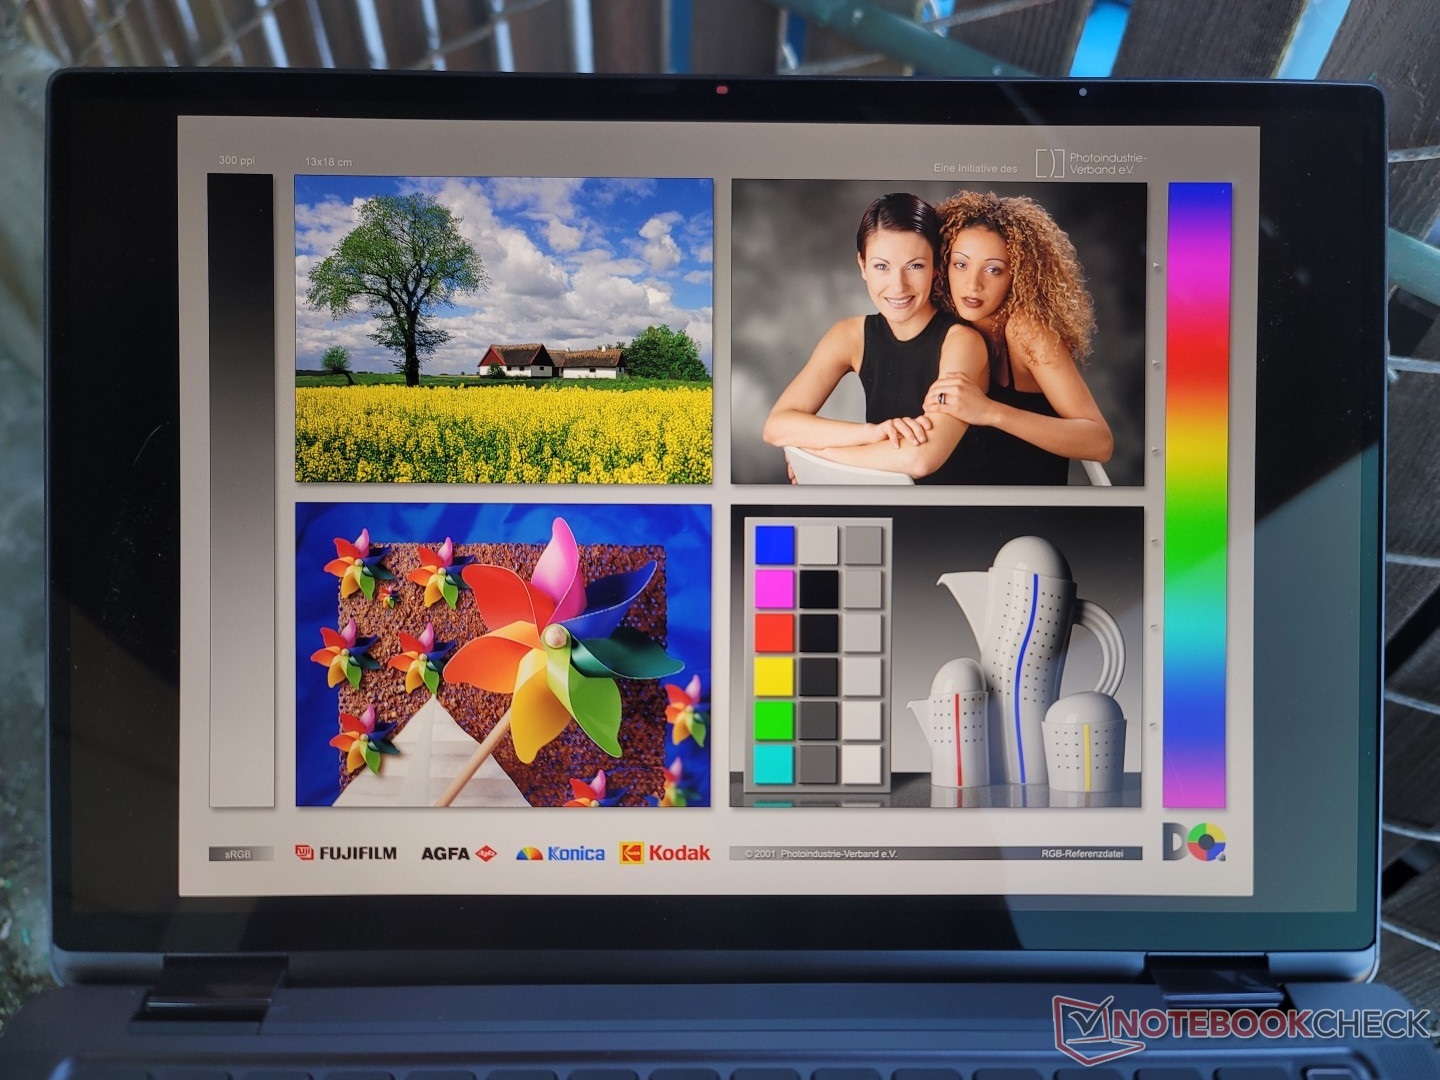
Ecran - 100% sRGB, écran tactile IPS 500-nit
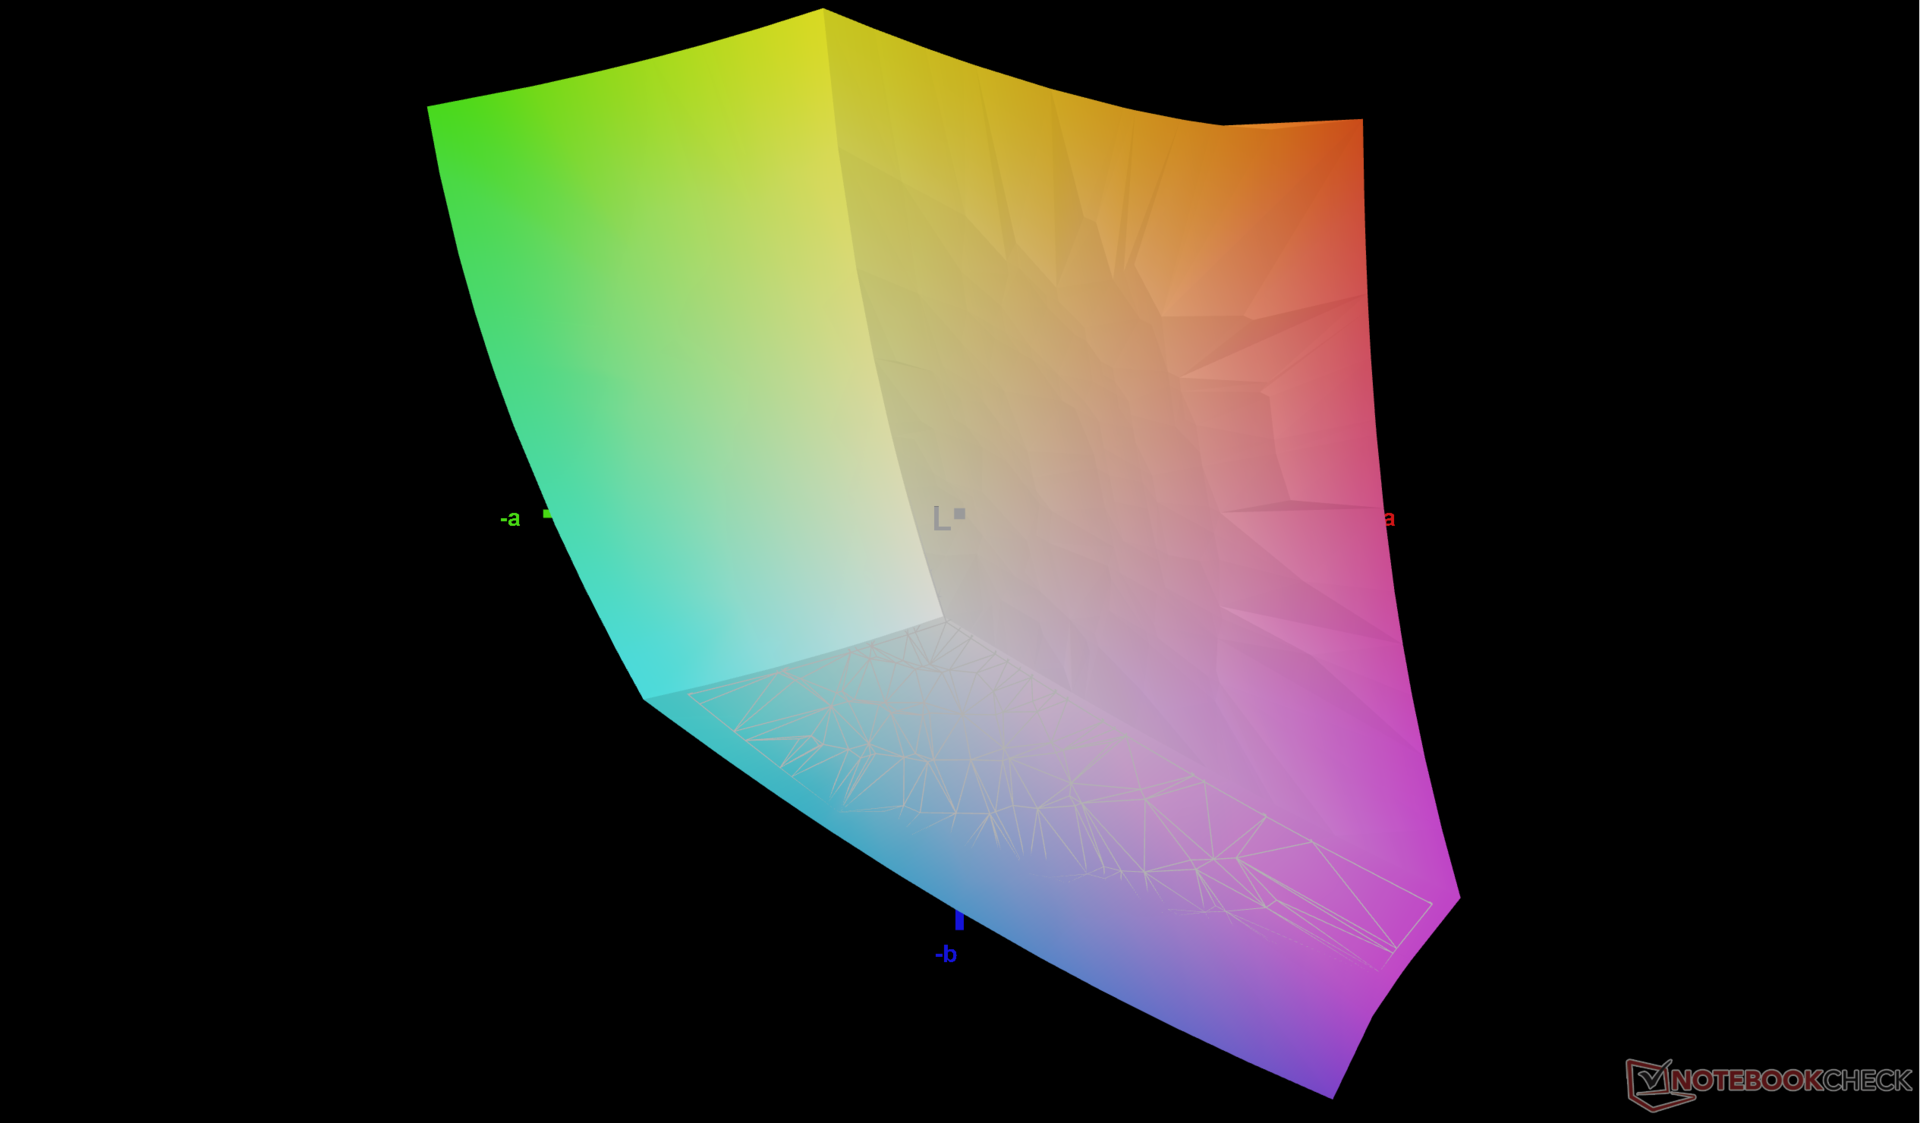
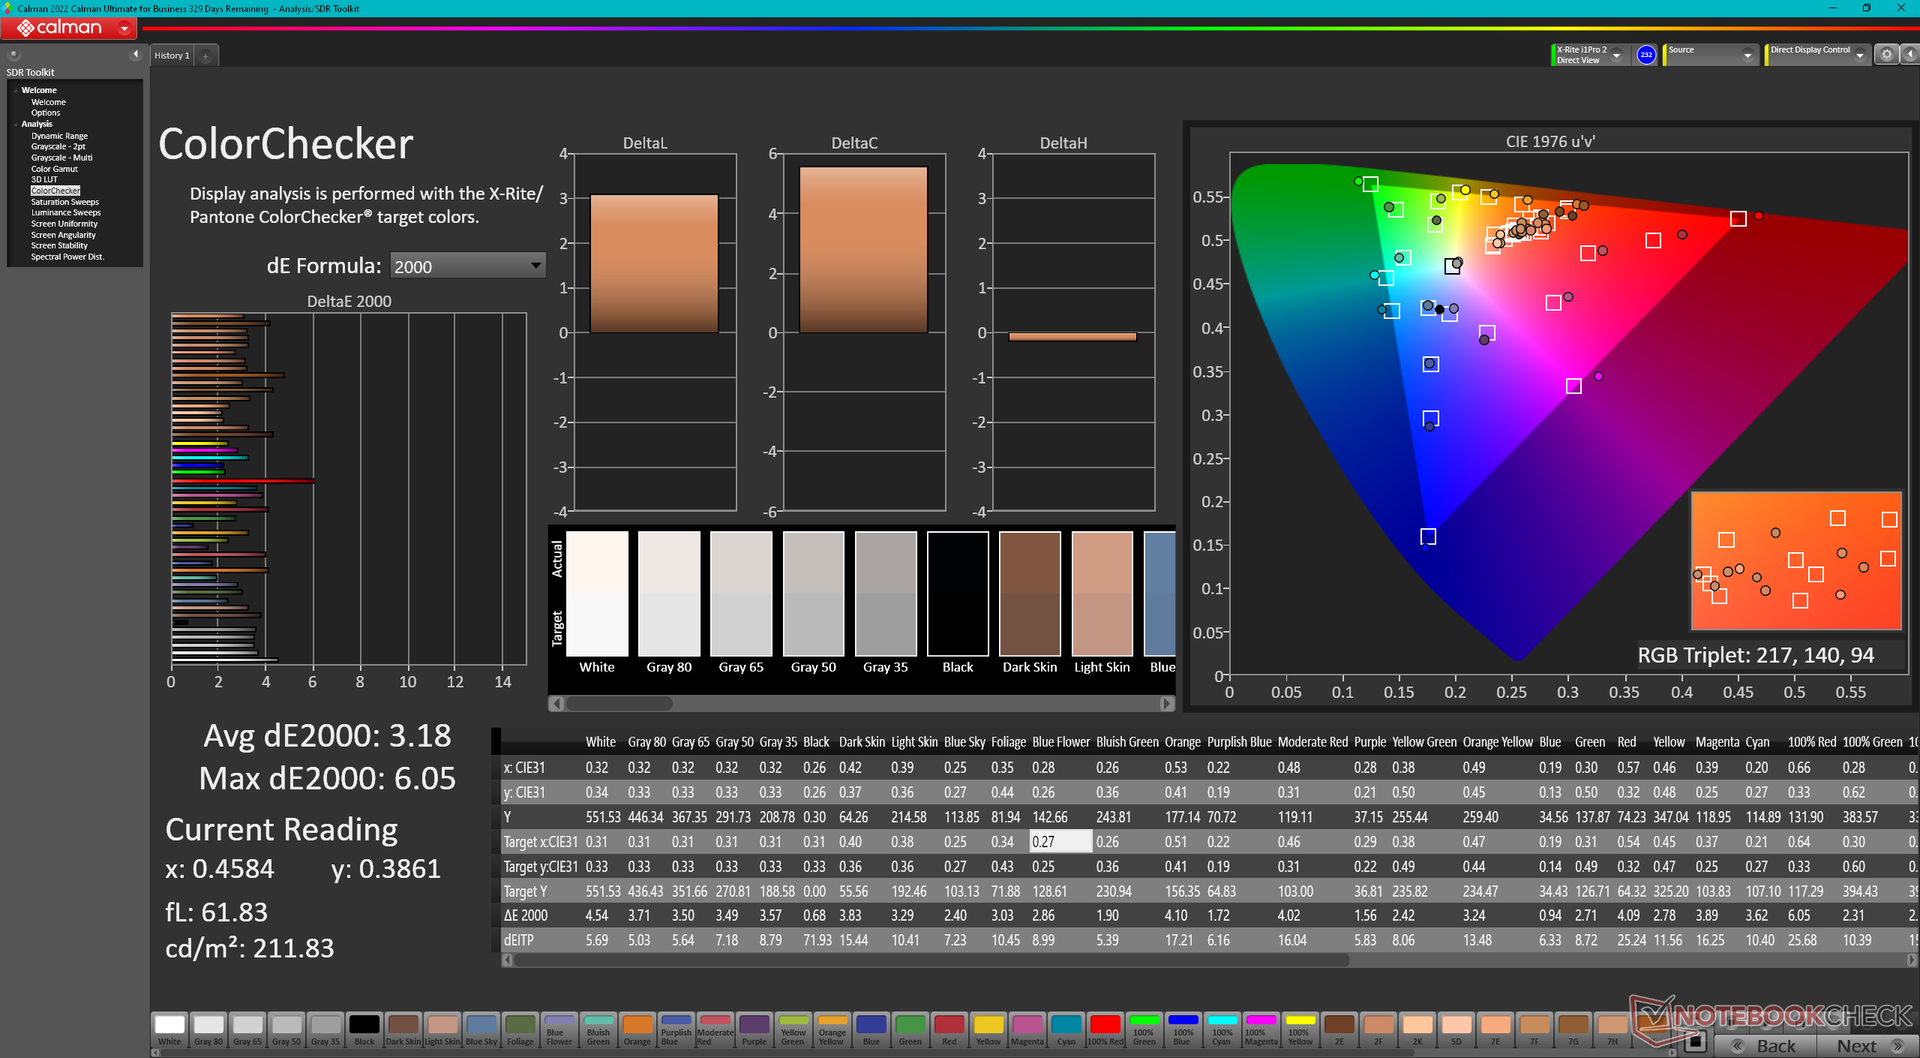
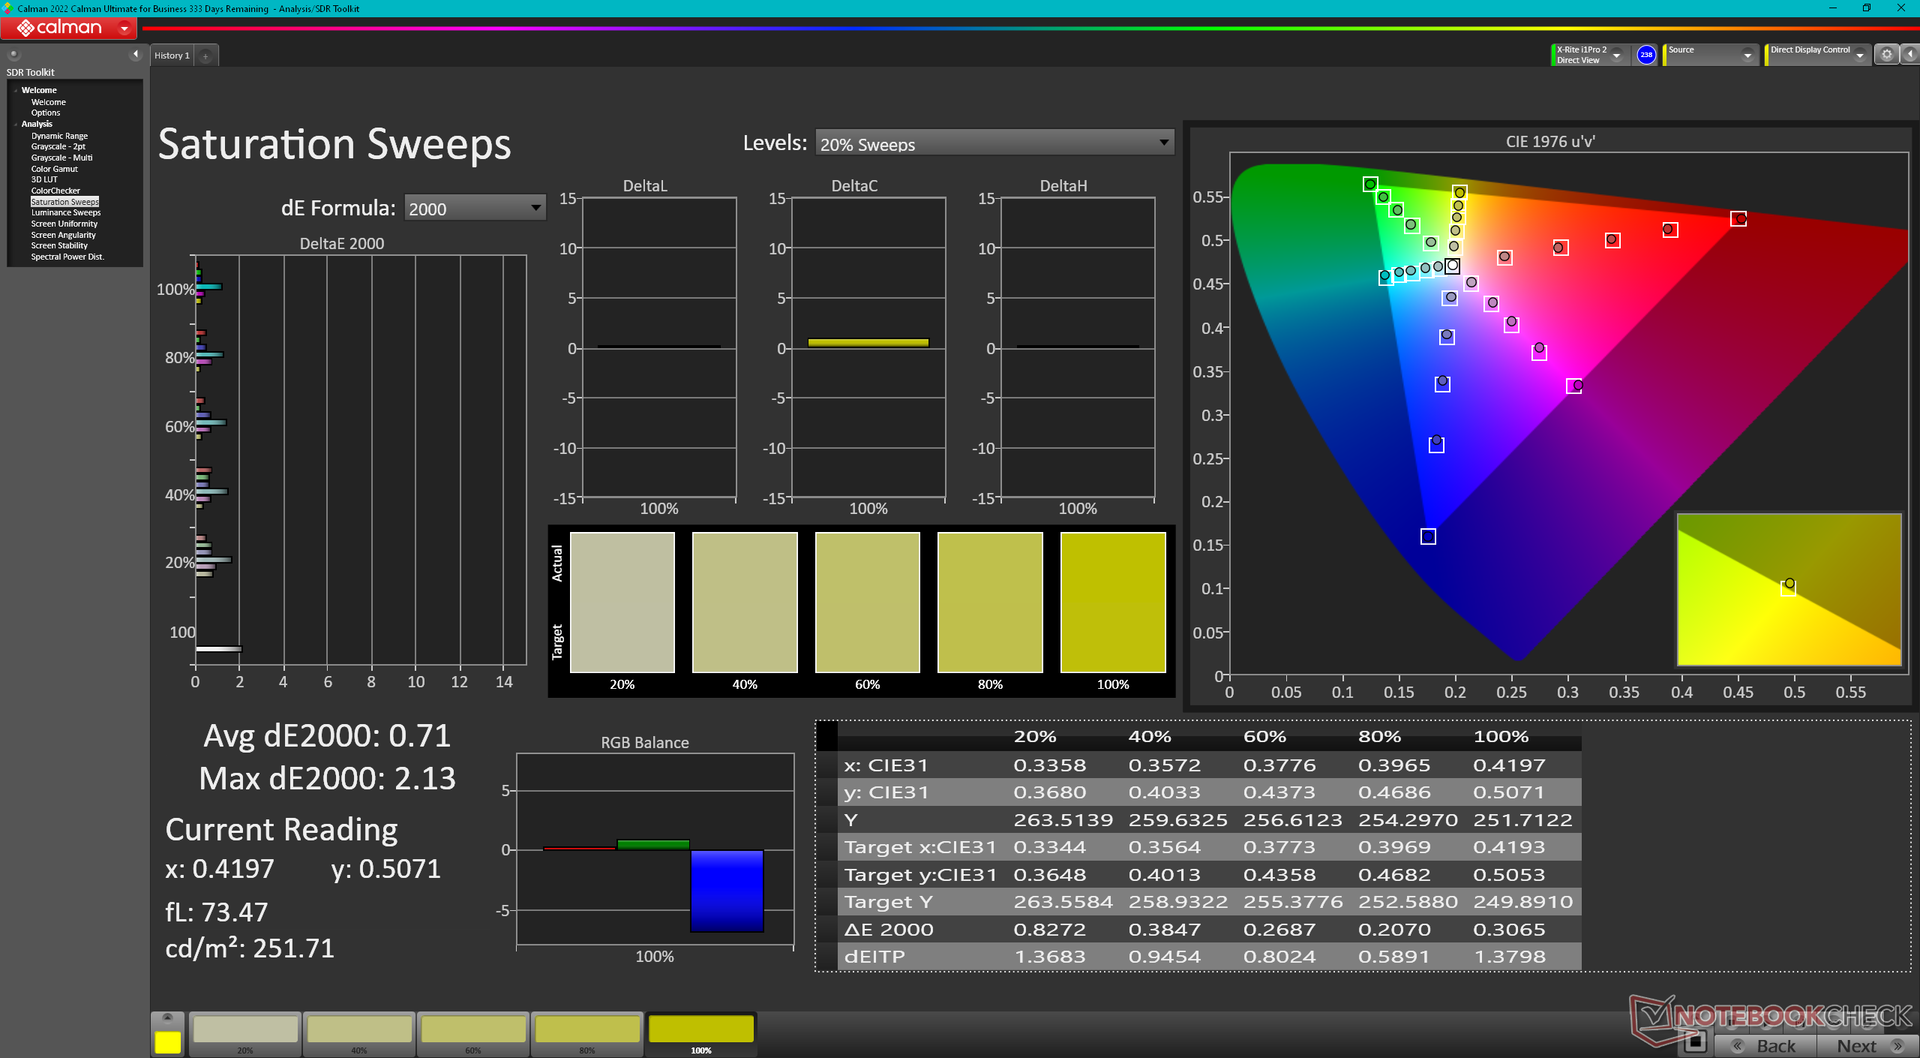
Dell annonce un écran tactile de 500 nits avec une couverture sRGB complète, ce que nous pouvons confirmer grâce à nos mesures indépendantes. Il s'agit d'un écran haut de gamme avec des niveaux de luminosité et de contraste similaires à ceux de l'écran du Summit E13 Flip de MSI.
Les deux plus gros inconvénients de l'écran sont les temps de réponse noir-blanc très lents et le taux de rafraîchissement limité à 60 Hz. Bien qu'il ne s'agisse pas d'une machine de jeu, l'effet fantôme est difficile à ignorer, même lors de la navigation sur Internet, tandis que le taux de rafraîchissement de 60 Hz commence à montrer son âge. Un taux de rafraîchissement plus élevé aurait également amélioré la réactivité de l'écran tactile.
Il n'y a pas d'options pour quelque chose de plus lumineux ou avec des couleurs P3 plus larges puisque tous les SKUs Latitude 9330 viennent avec exactement le même panneau AU Optronics pour le moment.
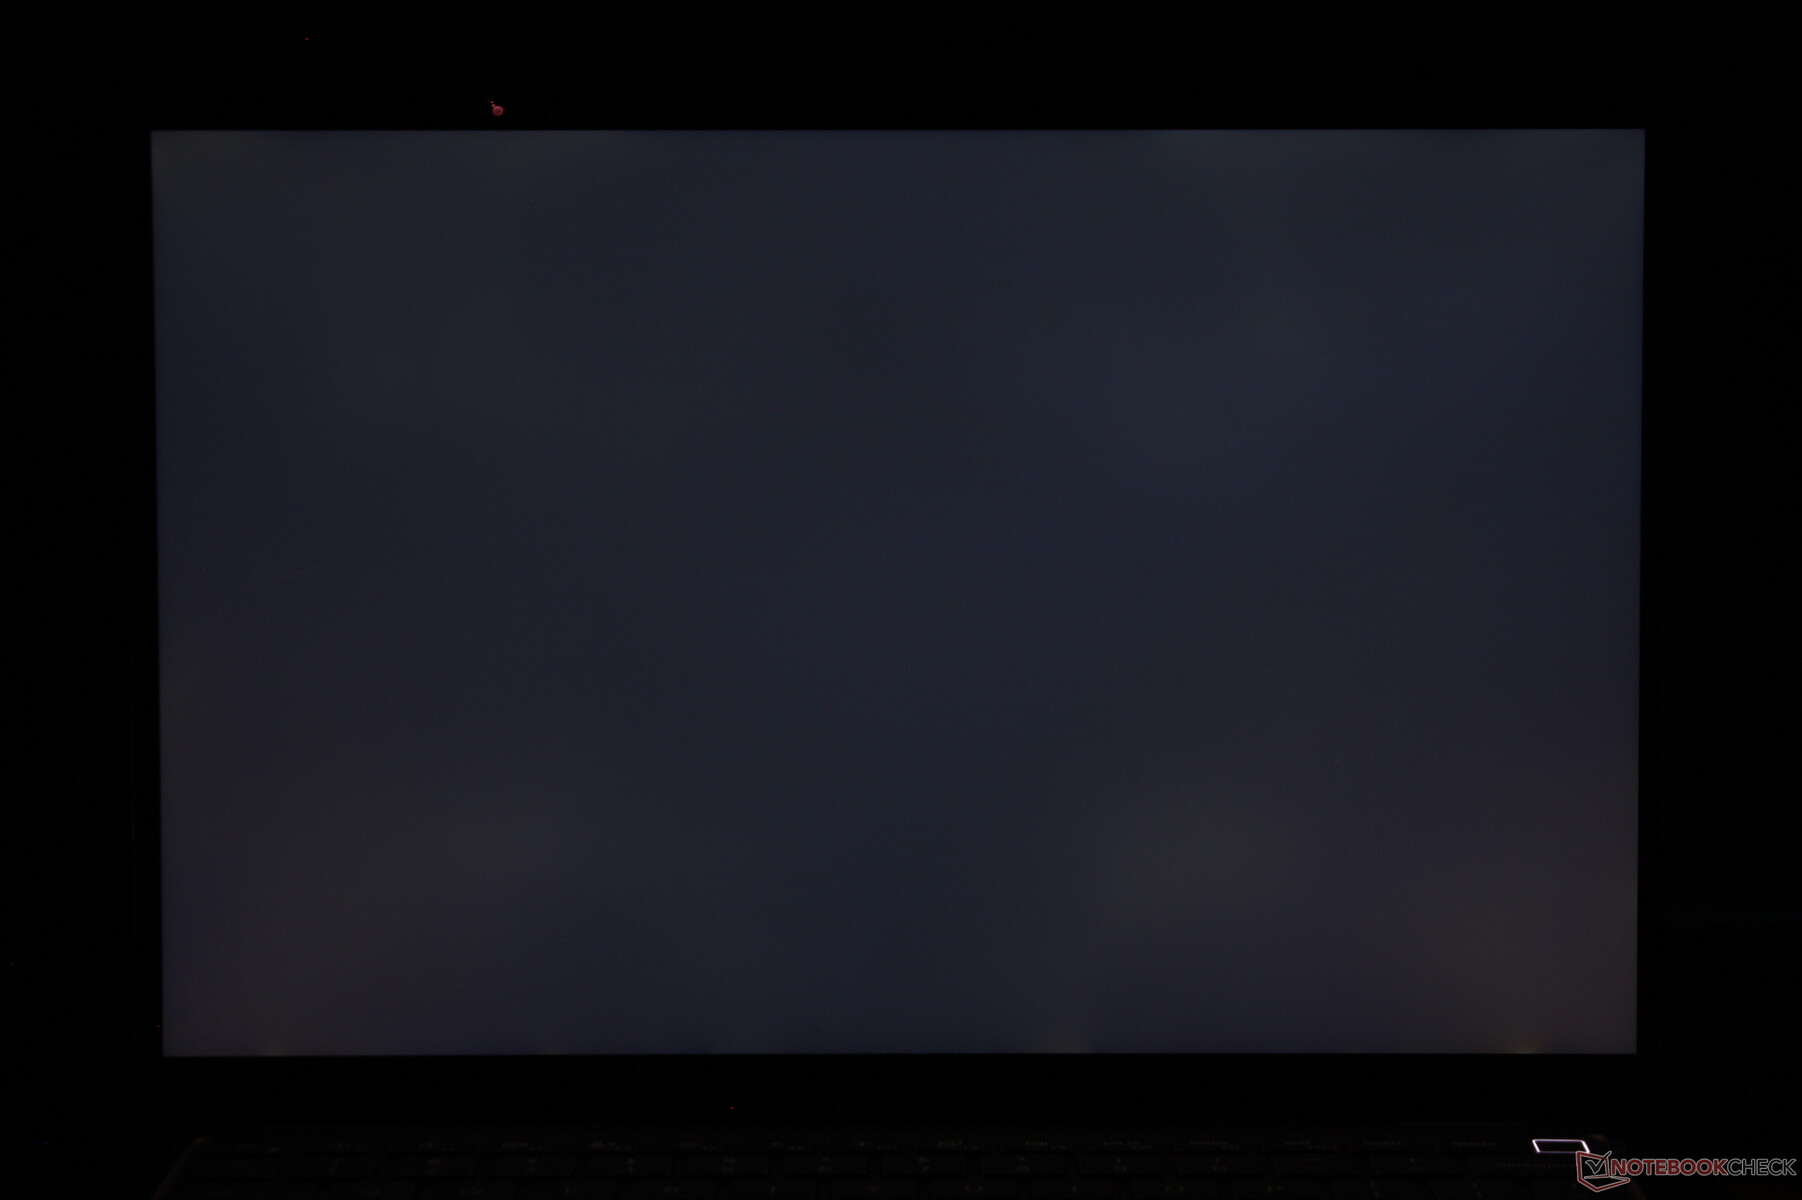
| |||||||||||||||||||||||||
Homogénéité de la luminosité: 85 %
Valeur mesurée au centre, sur batterie: 542.3 cd/m²
Contraste: 1427:1 (Valeurs des noirs: 0.38 cd/m²)
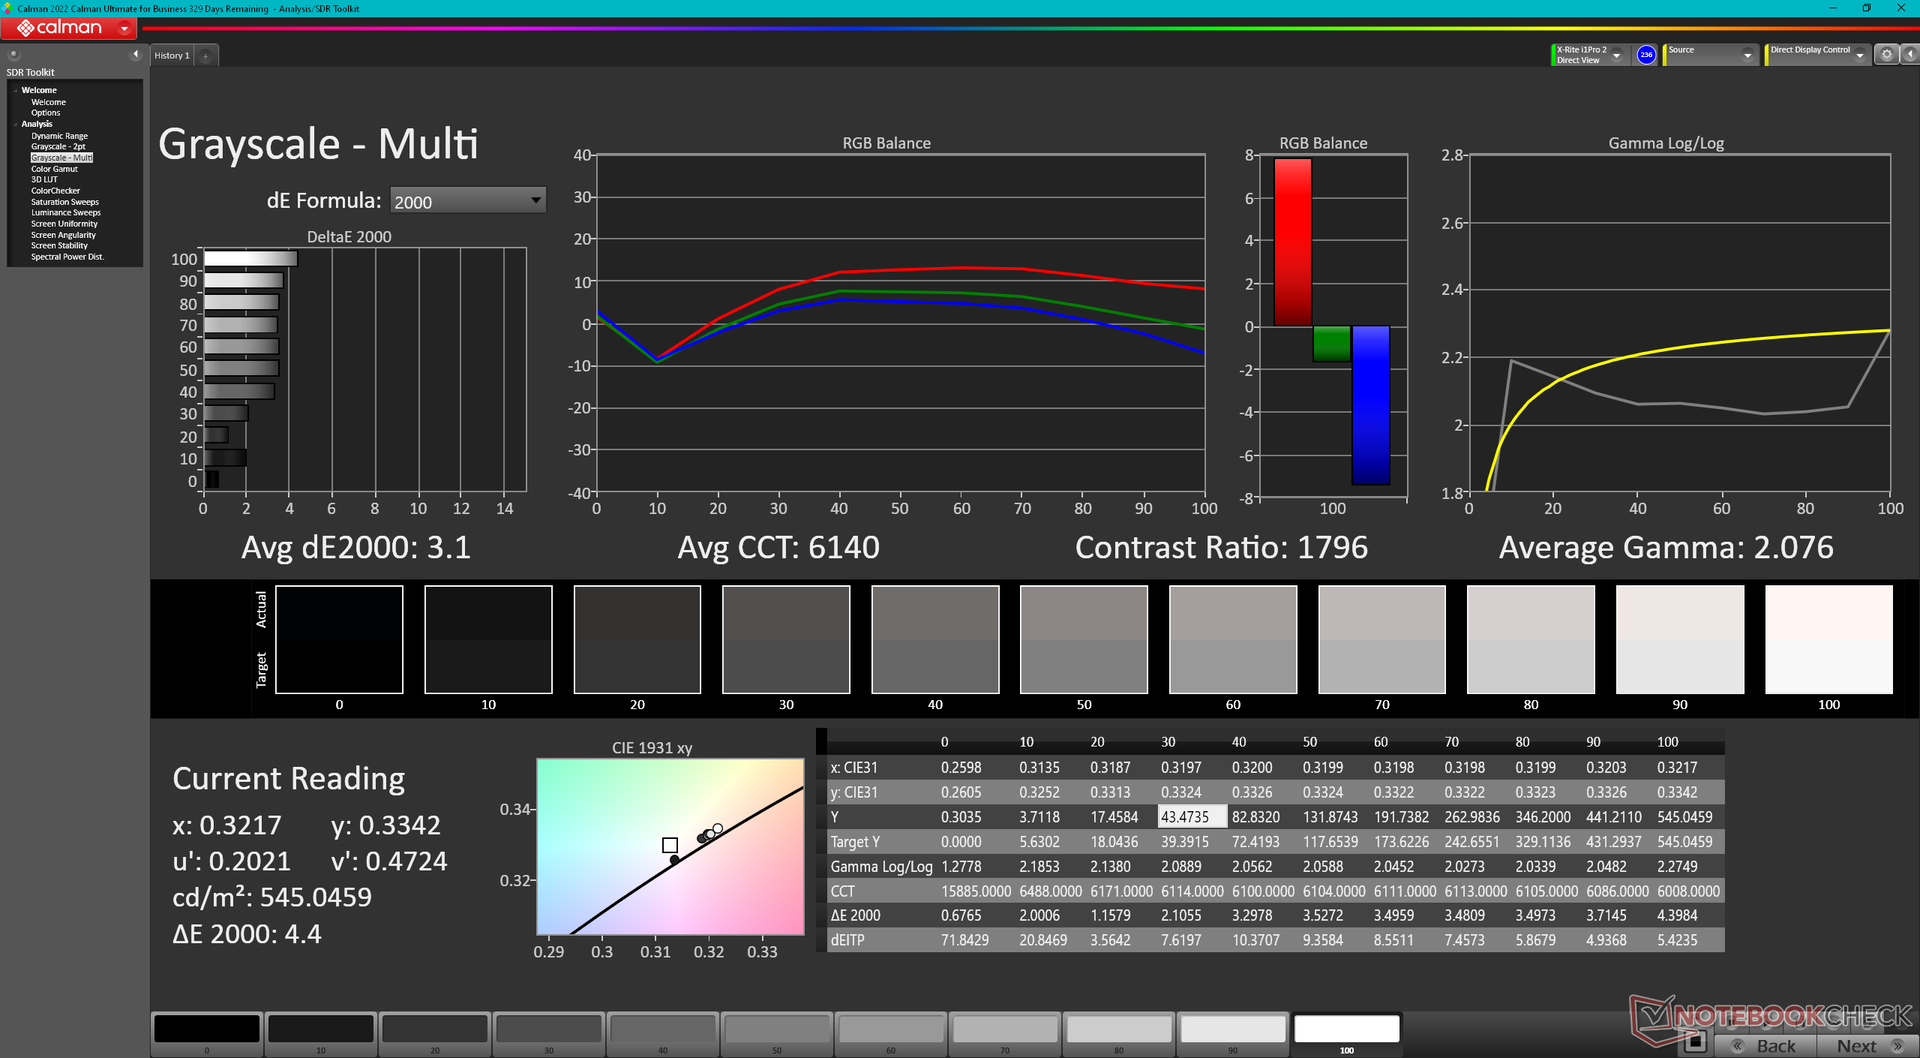
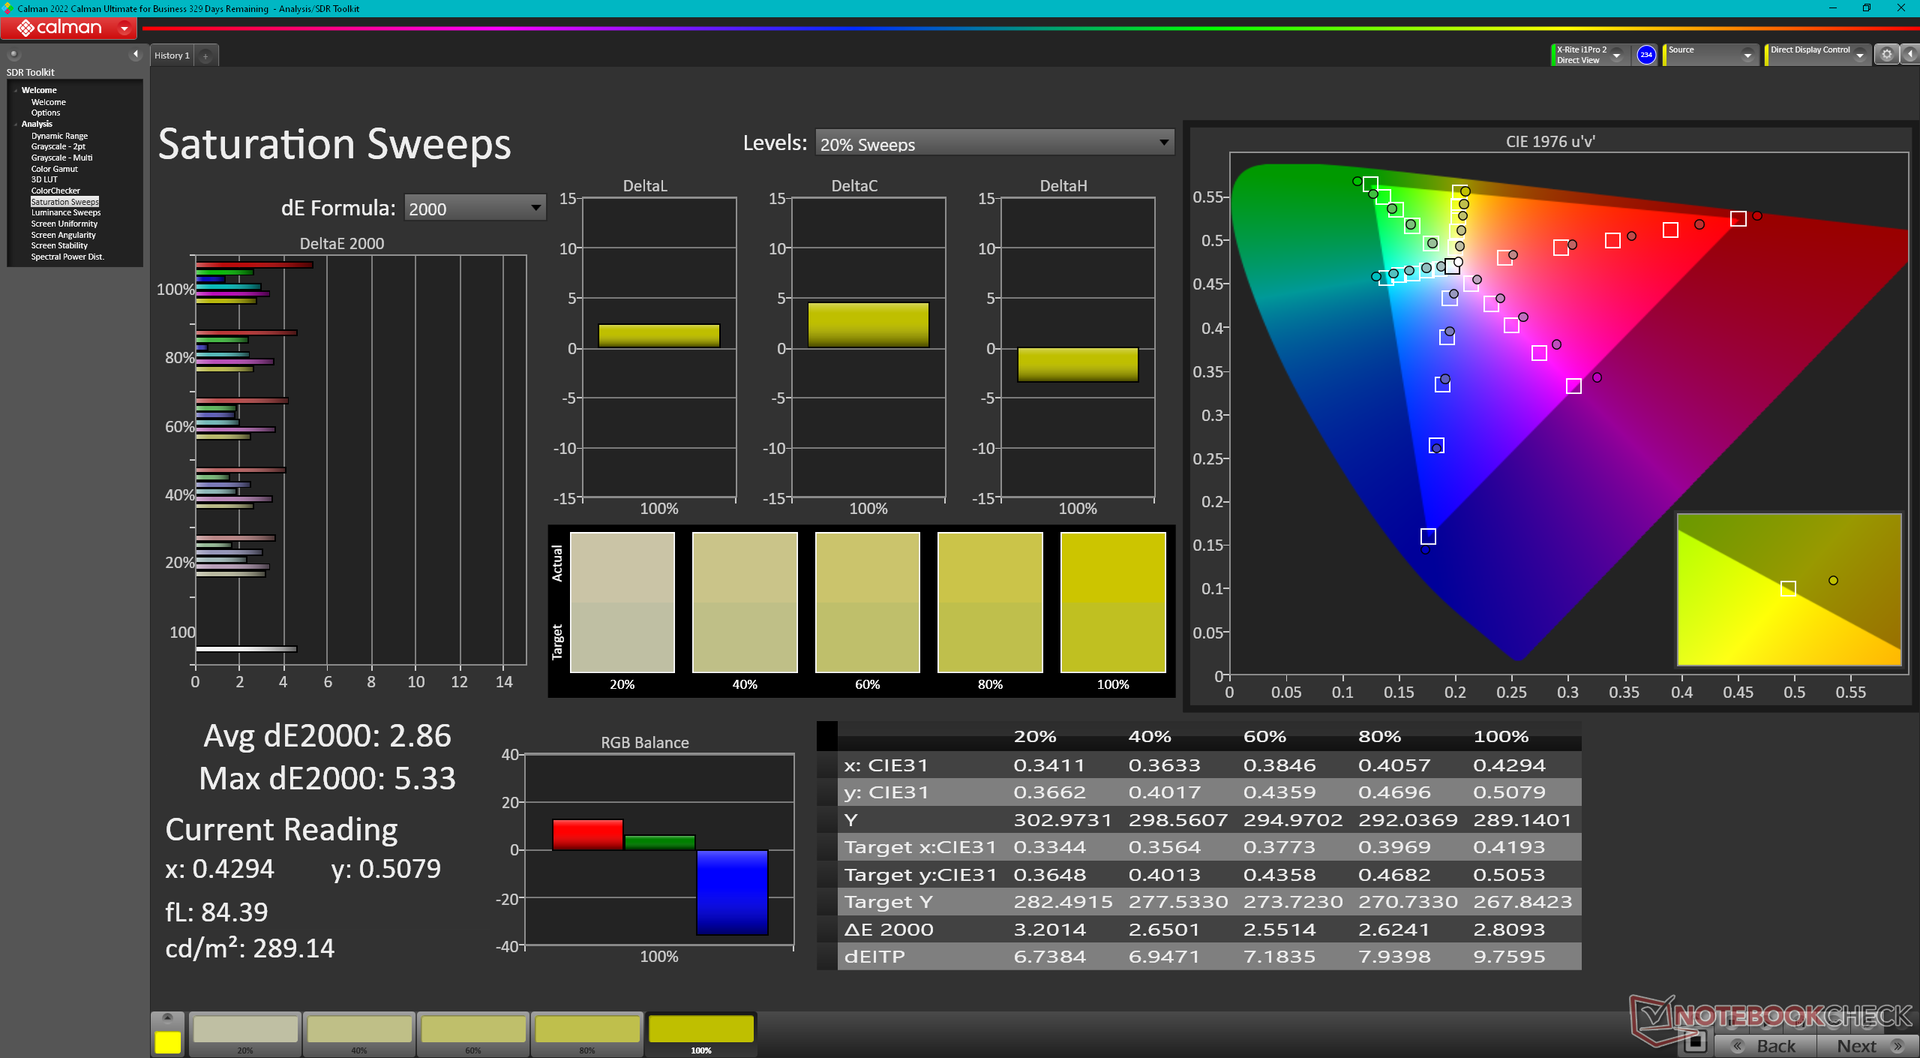
ΔE ColorChecker Calman: 3.18 | ∀{0.5-29.43 Ø4.71}
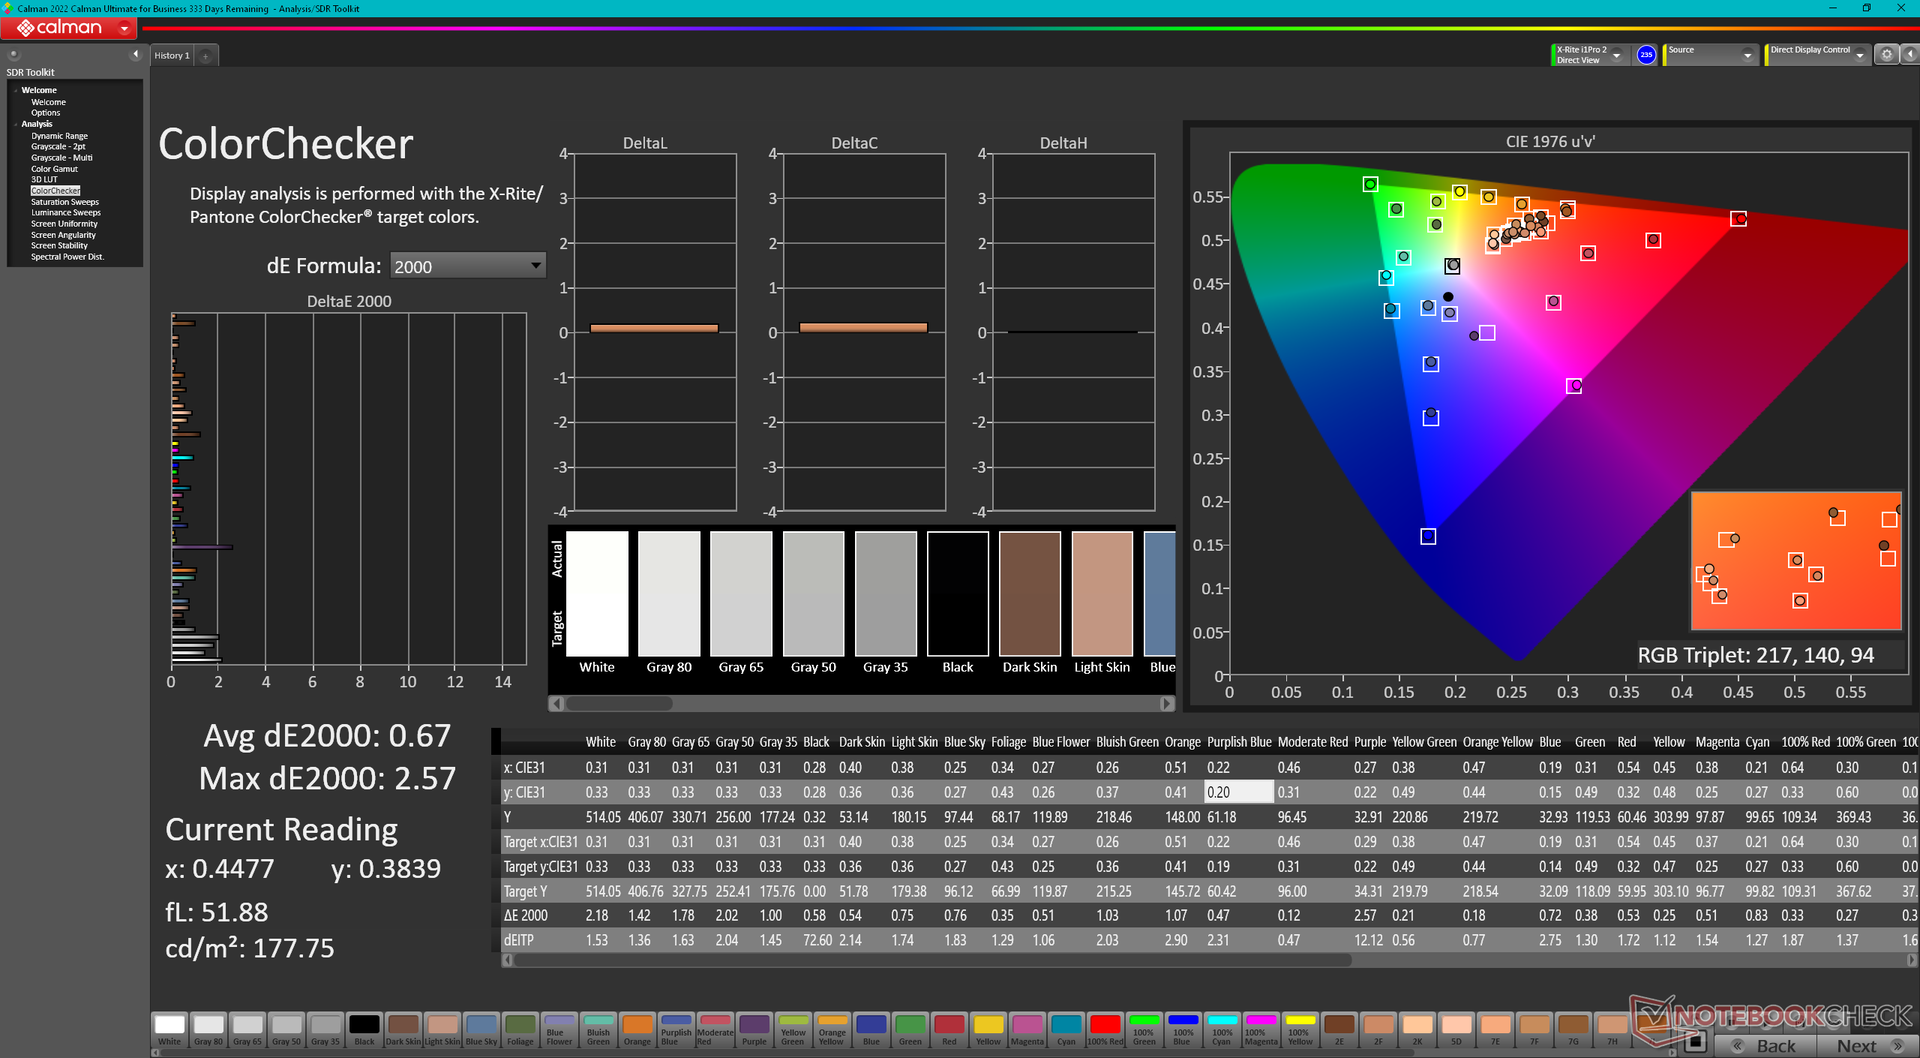
calibrated: 0.67
ΔE Greyscale Calman: 3.1 | ∀{0.09-98 Ø4.96}
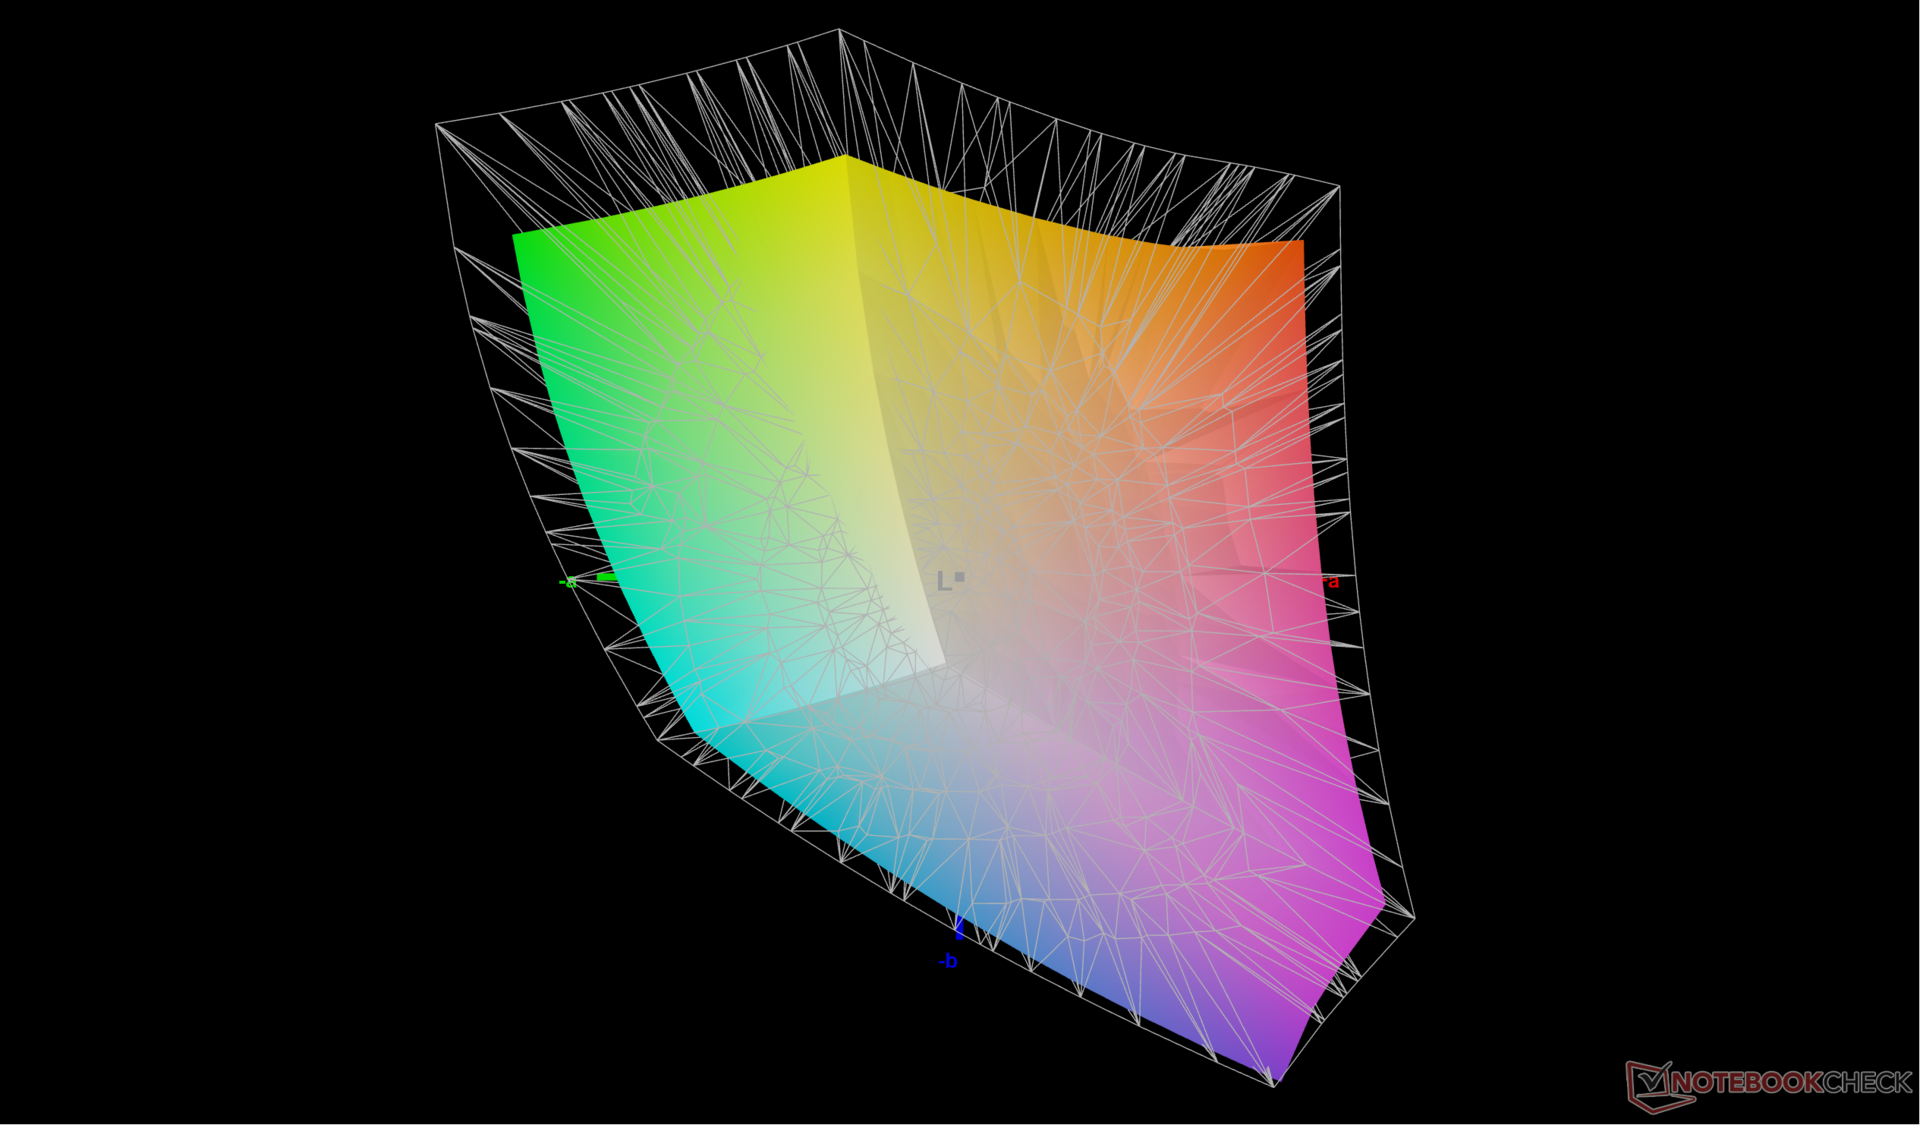
77.5% AdobeRGB 1998 (Argyll 3D)
99.9% sRGB (Argyll 3D)
77.8% Display P3 (Argyll 3D)
Gamma: 2.08
CCT: 6140 K
| Dell Latitude 9330 AU Optronics B133QAA, IPS, 2560x1600, 13.3" | Lenovo ThinkPad X1 Titanium Yoga G1 20QB0016GE LPM135M467, IPS LED, 2256x1504, 13.5" | MSI Summit E13 Flip Evo A11MT Sharp LQ134N1JW53, IPS, 1920x1200, 13.4" | HP EliteBook x360 1030 G7 Chi Mei CMN13A9, IPS, 1920x1080, 13.3" | HP Elite Dragonfly Max InfoVision X133NVFL R0, IPS, 1920x1080, 13.3" | Dell Latitude 5310-23VP6 Chi Mei CMN1382, IPS, 1920x1080, 13.3" | |
|---|---|---|---|---|---|---|
| Display | -9% | -7% | -10% | -8% | ||
| Display P3 Coverage (%) | 77.8 | 66.8 -14% | 69.8 -10% | 66.1 -15% | 67.5 -13% | |
| sRGB Coverage (%) | 99.9 | 98 -2% | 98.8 -1% | 97 -3% | 99 -1% | |
| AdobeRGB 1998 Coverage (%) | 77.5 | 68.6 -11% | 70.6 -9% | 67.7 -13% | 69.2 -11% | |
| Response Times | 9% | 9% | 25% | 36% | 50% | |
| Response Time Grey 50% / Grey 80% * (ms) | 67.6 ? | 64 ? 5% | 64 ? 5% | 56.4 ? 17% | 44.8 ? 34% | 36 ? 47% |
| Response Time Black / White * (ms) | 50.4 ? | 44 ? 13% | 44 ? 13% | 34.4 ? 32% | 32 ? 37% | 24 ? 52% |
| PWM Frequency (Hz) | 26040 ? | 2500 ? | ||||
| Screen | 9% | 3% | -25% | 10% | 2% | |
| Brightness middle (cd/m²) | 542.3 | 465 -14% | 551.3 2% | 425.4 -22% | 777.5 43% | 383 -29% |
| Brightness (cd/m²) | 516 | 451 -13% | 517 0% | 407 -21% | 727 41% | 364 -29% |
| Brightness Distribution (%) | 85 | 92 8% | 91 7% | 89 5% | 75 -12% | 84 -1% |
| Black Level * (cd/m²) | 0.38 | 0.28 26% | 0.37 3% | 0.28 26% | 0.44 -16% | 0.34 11% |
| Contrast (:1) | 1427 | 1661 16% | 1490 4% | 1519 6% | 1767 24% | 1126 -21% |
| Colorchecker dE 2000 * | 3.18 | 2 37% | 1.45 54% | 4.39 -38% | 1.62 49% | 2.24 30% |
| Colorchecker dE 2000 max. * | 6.05 | 4.7 22% | 2.86 53% | 6.73 -11% | 5.26 13% | 3.32 45% |
| Colorchecker dE 2000 calibrated * | 0.67 | 0.7 -4% | 1.7 -154% | 1.65 -146% | 1.32 -97% | 0.72 -7% |
| Greyscale dE 2000 * | 3.1 | 2.9 6% | 1.3 58% | 3.9 -26% | 1.6 48% | 2.42 22% |
| Gamma | 2.08 106% | 2.09 105% | 2.14 103% | 1.87 118% | 2.2 100% | 2.65 83% |
| CCT | 6140 106% | 6181 105% | 6580 99% | 6758 96% | 6538 99% | 6776 96% |
| Color Space (Percent of AdobeRGB 1998) (%) | 65 | 61.7 | 72.3 | 56 | ||
| Color Space (Percent of sRGB) (%) | 99 | 96.6 | 94.8 | 99 | ||
| Moyenne finale (programmes/paramètres) | 3% /
5% | 2% /
2% | -3% /
-15% | 23% /
15% | 15% /
7% |
* ... Moindre est la valeur, meilleures sont les performances
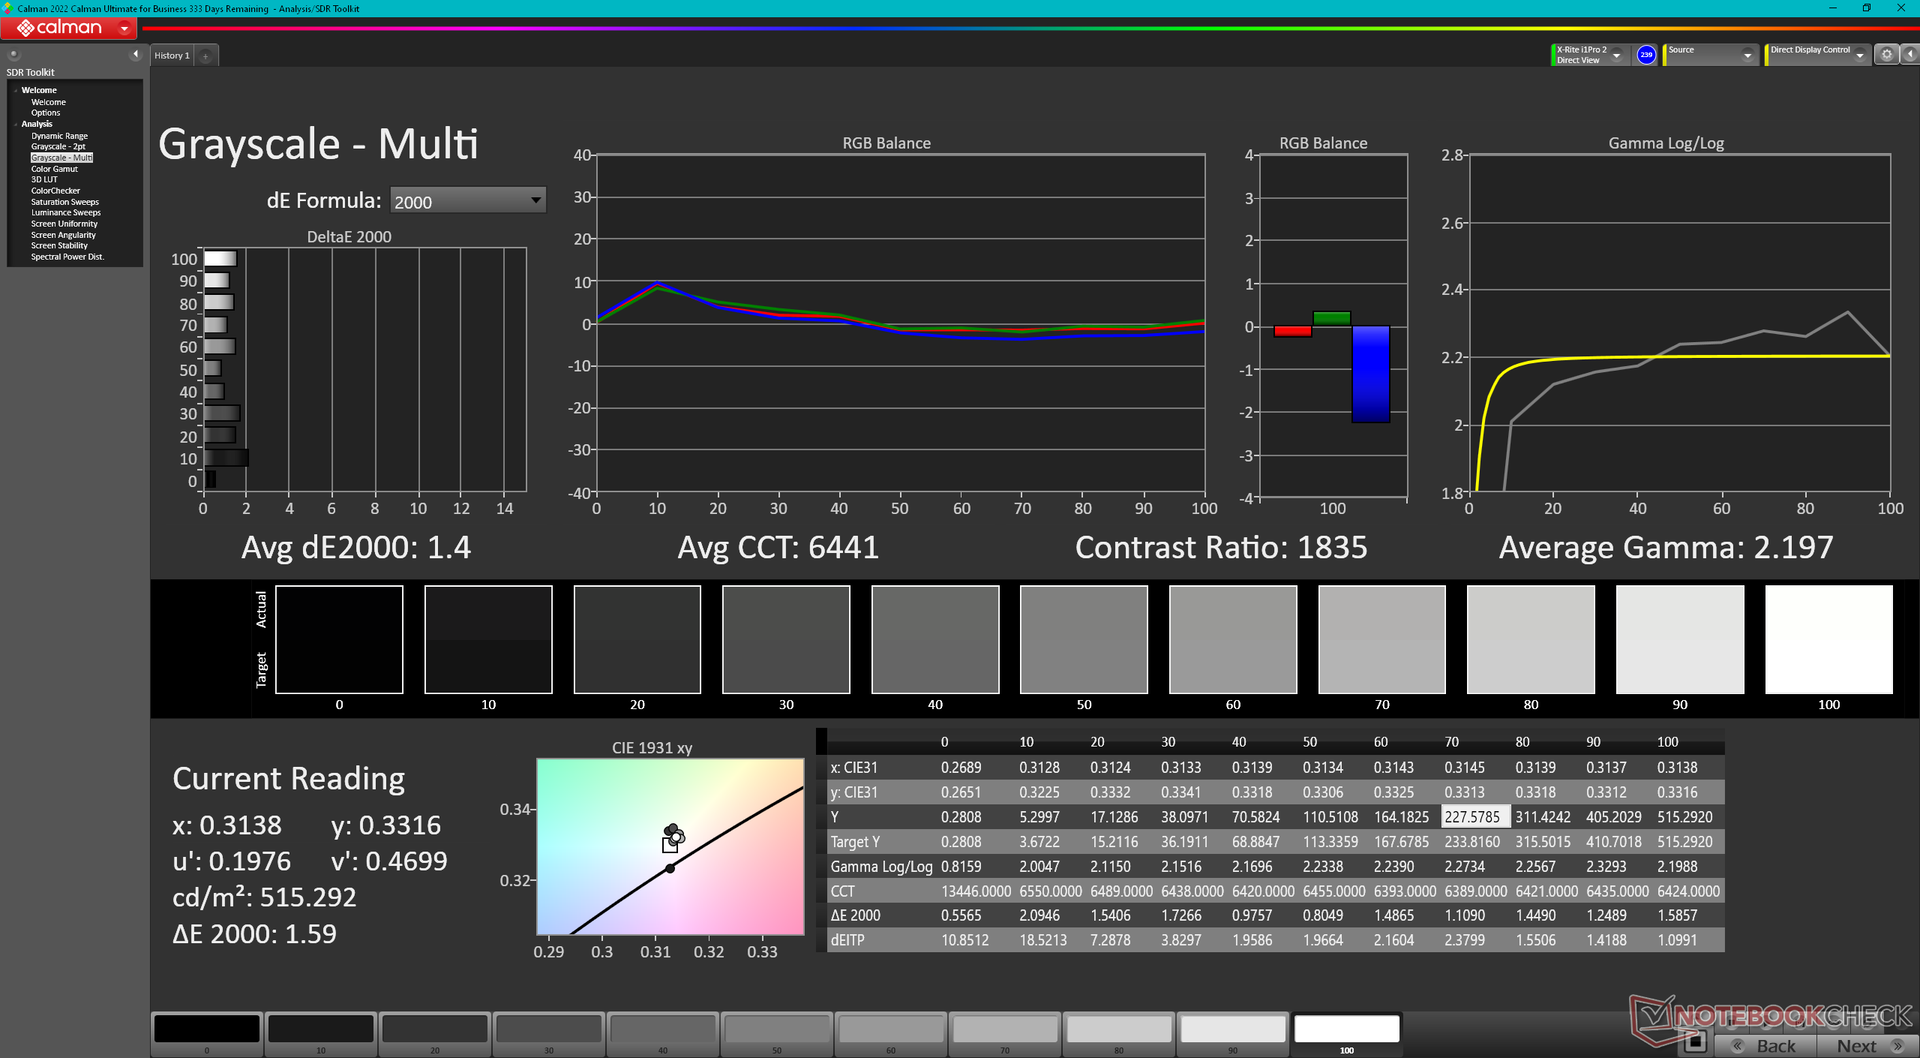
L'écran n'est pas livré pré-calibré, ce qui est décevant pour un ordinateur portable dont le prix de vente dépasse largement les 2 000 dollars américains. En calibrant nous-mêmes l'écran à l'aide d'un colorimètre X-Rite, nous avons pu améliorer les valeurs DeltaE moyennes des niveaux de gris et des couleurs de 3,1 et 3,18 à seulement 1,4 et 0,67, respectivement. Les utilisateurs peuvent appliquer notre profil ICM ci-dessus pour mieux exploiter les couleurs sRGB complètes de l'écran.
Temps de réponse de l'écran
| ↔ Temps de réponse noir à blanc | ||
|---|---|---|
| 50.4 ms ... hausse ↗ et chute ↘ combinées | ↗ 26.8 ms hausse | 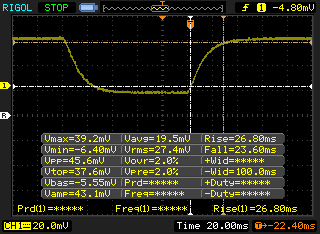 |
| ↘ 23.6 ms chute | ||
| L'écran souffre de latences très élevées, à éviter pour le jeu. En comparaison, tous les appareils testés affichent entre 0.1 (minimum) et 240 (maximum) ms. » 99 % des appareils testés affichent de meilleures performances. Cela signifie que les latences relevées sont moins bonnes que la moyenne (19.8 ms) de tous les appareils testés. | ||
| ↔ Temps de réponse gris 50% à gris 80% | ||
| 67.6 ms ... hausse ↗ et chute ↘ combinées | ↗ 34.8 ms hausse | 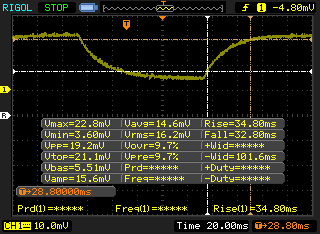 |
| ↘ 32.8 ms chute | ||
| L'écran souffre de latences très élevées, à éviter pour le jeu. En comparaison, tous les appareils testés affichent entre 0.165 (minimum) et 636 (maximum) ms. » 98 % des appareils testés affichent de meilleures performances. Cela signifie que les latences relevées sont moins bonnes que la moyenne (30.9 ms) de tous les appareils testés. | ||
Scintillement / MLI (Modulation de largeur d'impulsion)
| Scintillement / MLI (Modulation de largeur d'impulsion) non décelé | 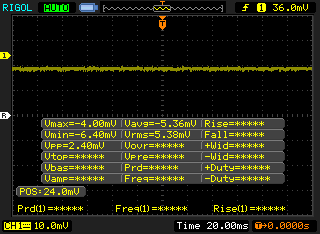 | ||
En comparaison, 52 % des appareils testés n'emploient pas MDI pour assombrir leur écran. Nous avons relevé une moyenne à 7744 (minimum : 5 - maximum : 343500) Hz dans le cas où une MDI était active. | |||
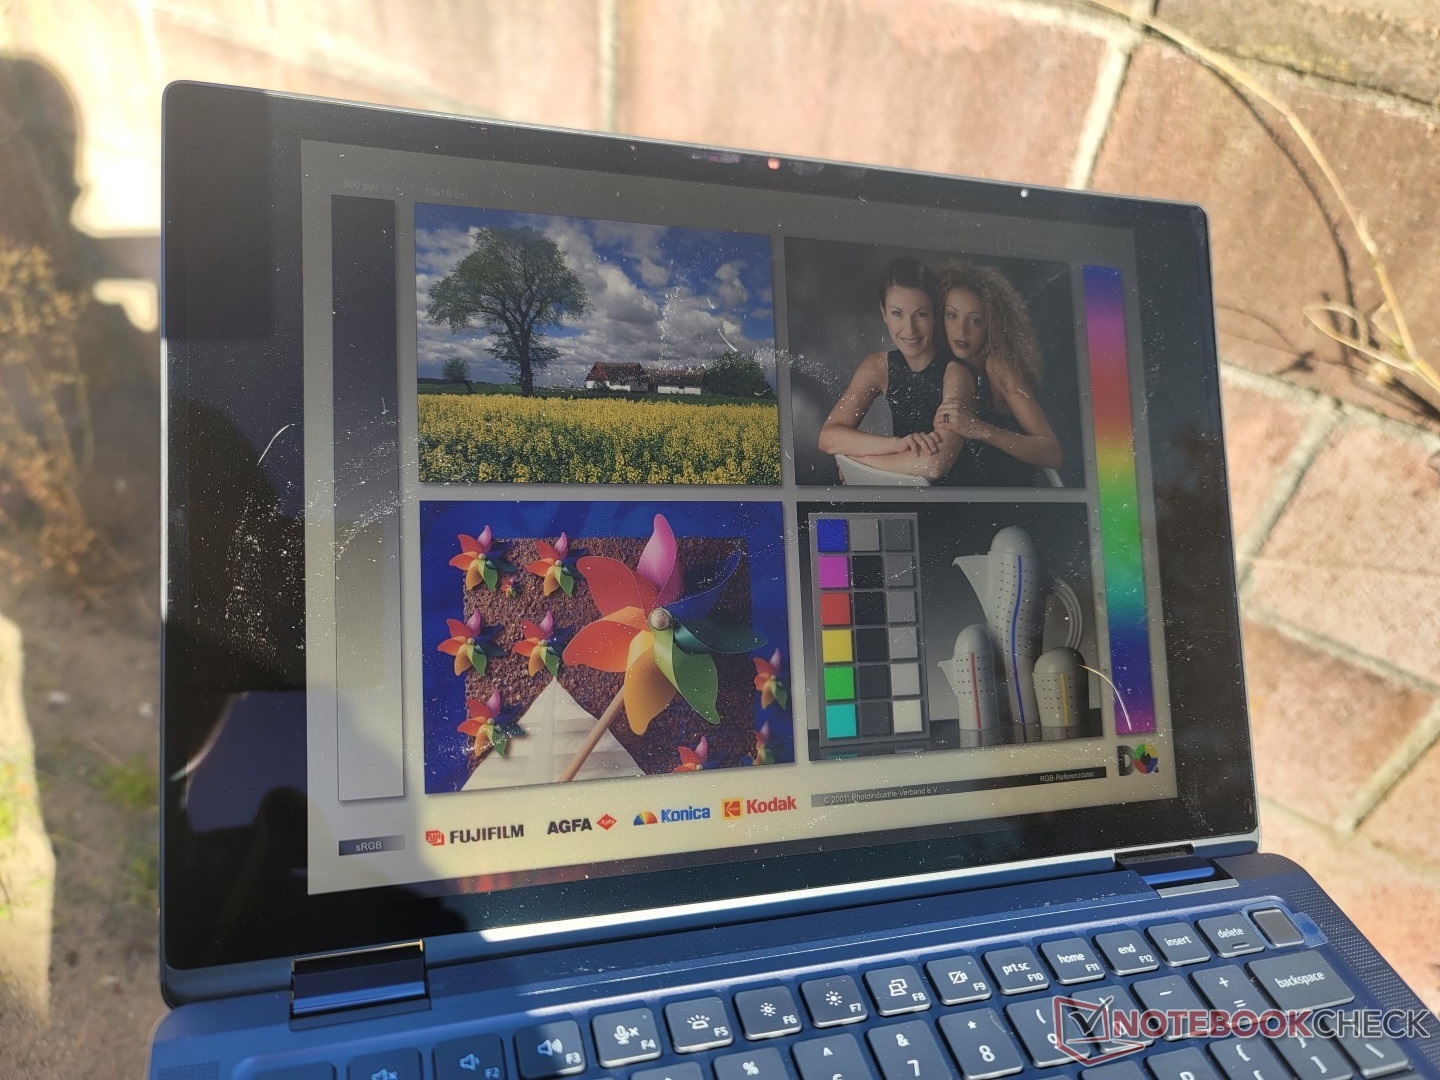
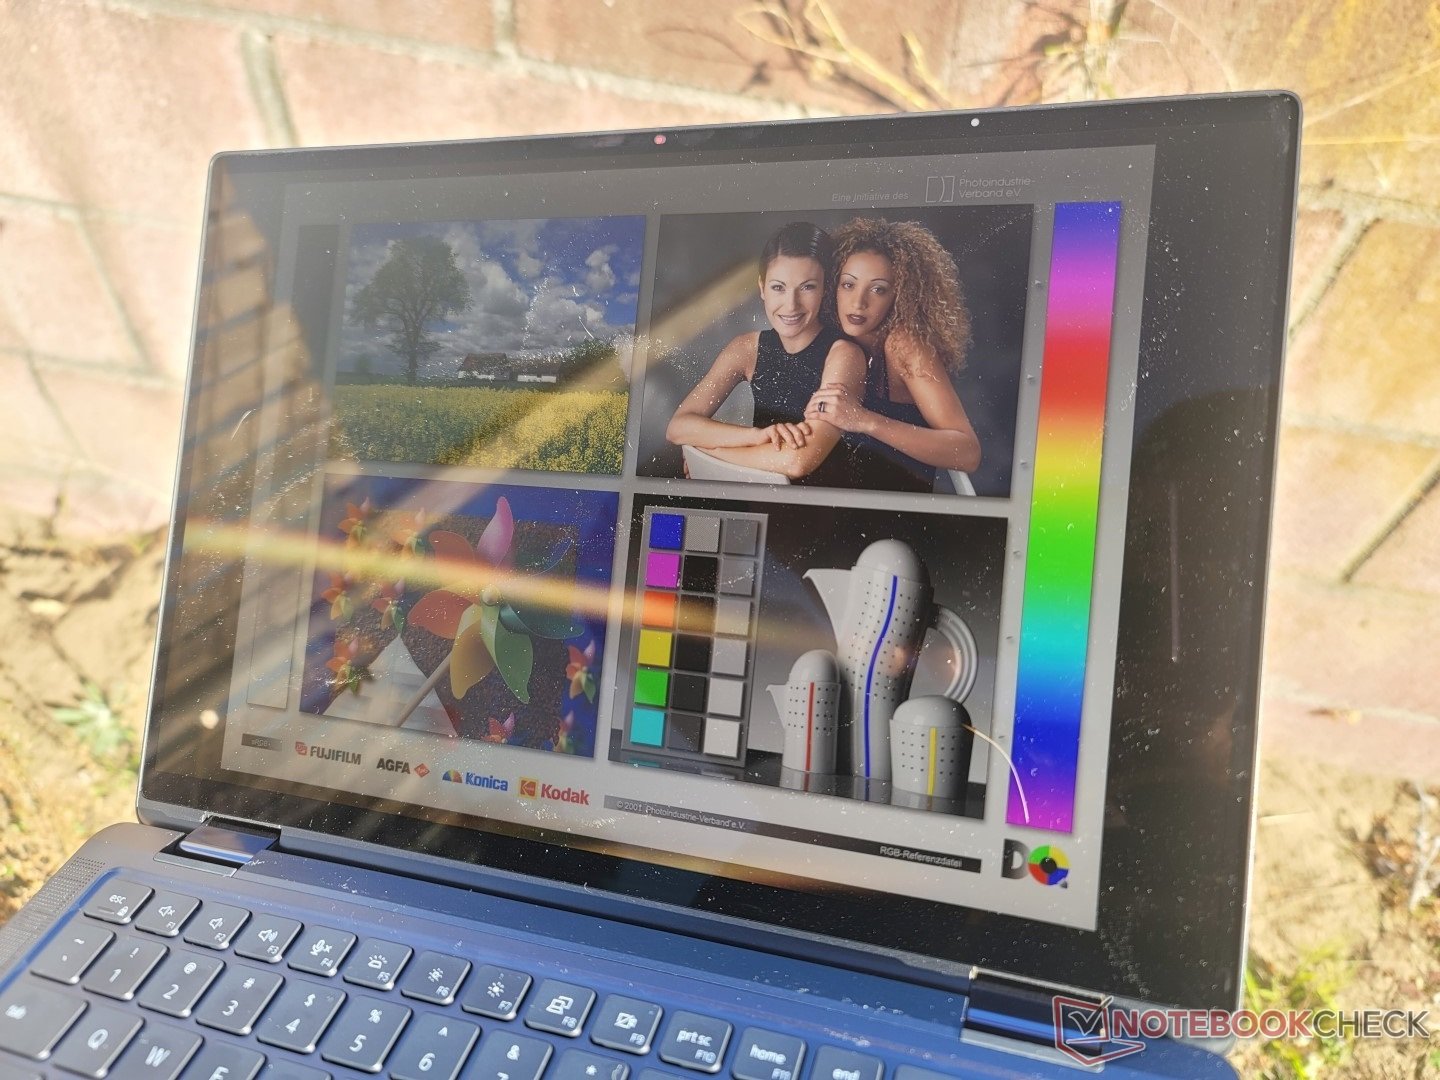
La visibilité en extérieur est bonne à l'ombre, car l'écran est suffisamment lumineux pour surmonter des éblouissements mineurs à modérés. Malgré tout, il convient d'éviter la lumière directe du soleil dans la mesure du possible pour optimiser l'expérience visuelle. La concurrence Dragonfly Max concurrent, offre des options d'affichage encore plus lumineuses que le Latitude 9330 pour une visualisation extérieure plus confortable.
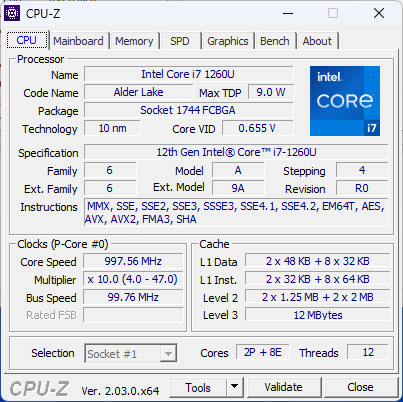
Performance - 12ème génération Alder Lake-U
Conditions d'essai
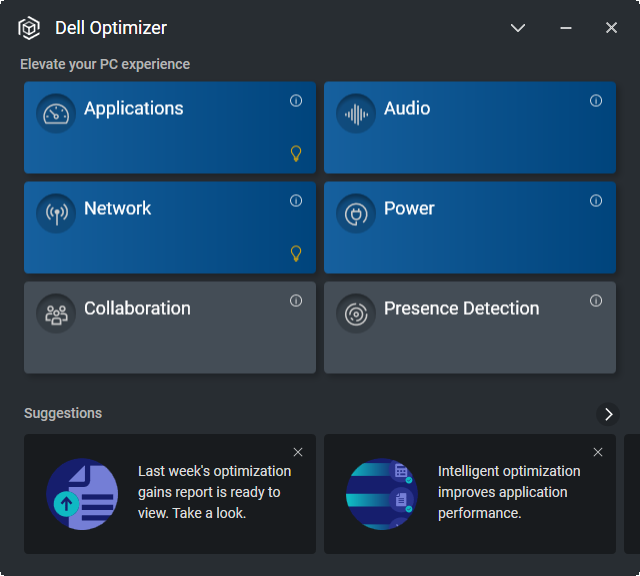
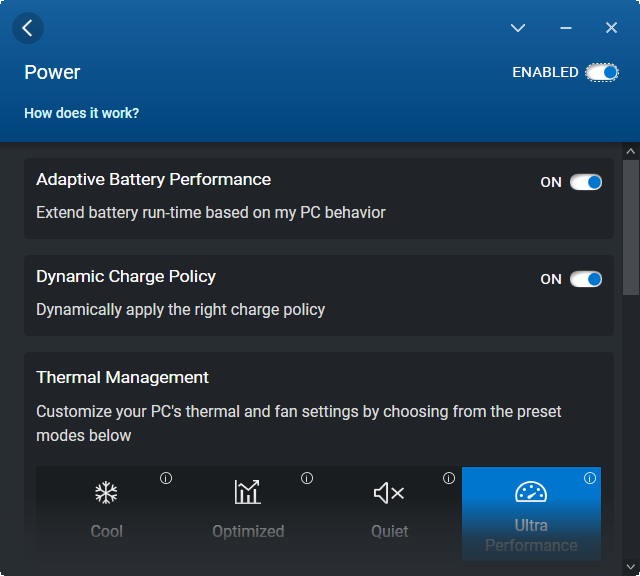
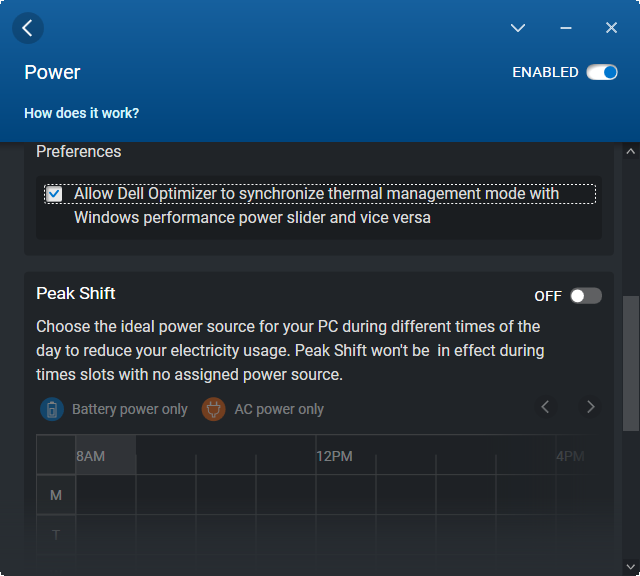
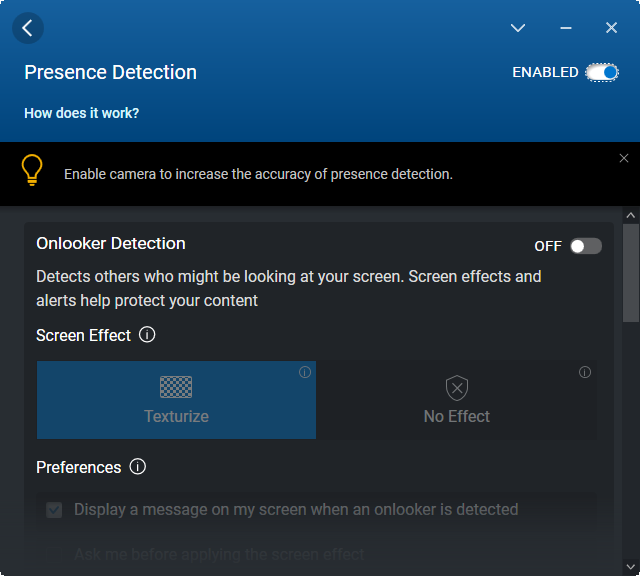
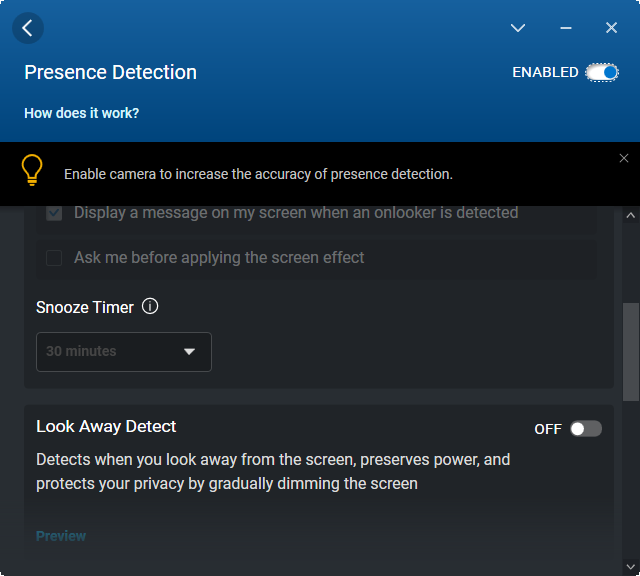
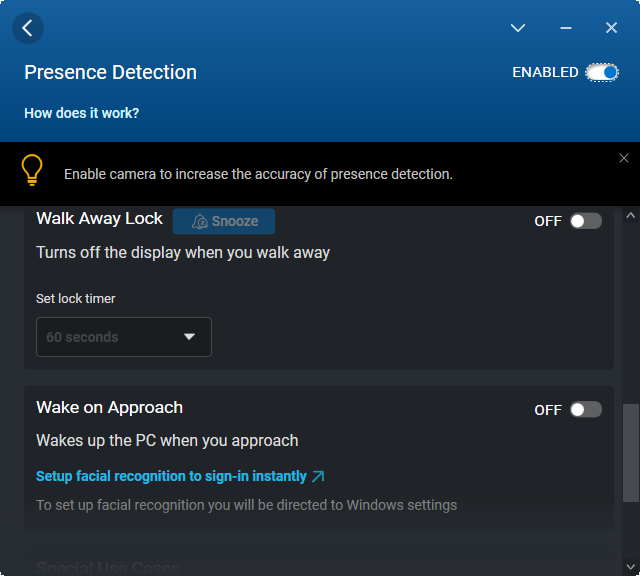
Notre appareil a été réglé en mode Ultra Performance via Windows et le logiciel Dell Optimizer. Il est fortement recommandé aux propriétaires de se familiariser avec le logiciel Optimizer, car il s'agit de la plaque tournante permettant d'activer des fonctions spécifiques à Latitude, comme la détection de présence pour une connexion mains libres ou l'activation de boutons tactiles supplémentaires. Les profils de performance se trouvent également dans le logiciel, comme le montrent les captures d'écran ci-dessous.
Processeur
Les performances du CPU sont globalement excellentes, mais il ne fait pas assez pour se différencier du Core i5-1235U. Par exemple, les résultats des tests de référence se situent tous dans une fourchette de 5 à 10 % par rapport au Core i5-1235U, moins cher, de l'IdeaPad Flex 5i IdeaPad Flex 5i. En revanche, le Core i7-1255U est plus rapide d'environ 10 à 15 % en raison de ses objectifs de TDP plus élevés que notre Core i7-1260U. L'avantage de la performance multithread par rapport à la 11e génération de Core i7-1165G7 est toujours significatif, à environ 35 %, malgré les différences plus faibles entre les Core i5-1235U et i7-1255U de 12e génération
La durabilité des performances est bonne et bien meilleure que ce que nous avons observé sur le concurrent ThinkPad X1 Nano Gen 2 comme le montre le graphique comparatif ci-dessous. Le système Dell est capable d'atteindre ce résultat grâce à des températures de cœur très élevées que notre section sur les tests de stress illustrera.
Cinebench R15 Multi Loop
Cinebench R23: Multi Core | Single Core
Cinebench R15: CPU Multi 64Bit | CPU Single 64Bit
Blender: v2.79 BMW27 CPU
7-Zip 18.03: 7z b 4 | 7z b 4 -mmt1
Geekbench 5.5: Multi-Core | Single-Core
HWBOT x265 Benchmark v2.2: 4k Preset
LibreOffice : 20 Documents To PDF
R Benchmark 2.5: Overall mean
| Cinebench R20 / CPU (Multi Core) | |
| Asus Zenbook S 13 OLED | |
| Lenovo ThinkPad X1 Nano Gen 2 Core i7-1280P | |
| HP Spectre x360 13.5 14t-ef000 | |
| Moyenne Intel Core i7-1260U (2838 - 3165, n=2) | |
| Lenovo ThinkBook 13s G3 20YA0005GE | |
| Lenovo Yoga 6 13ALC6 | |
| Dell Latitude 9330 | |
| Lenovo IdeaPad Flex 5i 14IAU7 | |
| Samsung Galaxy Book2 Pro 13 NP930XED-KA1DE | |
| Framework Laptop 13.5 | |
| MSI Summit E13 Flip Evo A11MT | |
| HP EliteBook x360 1030 G7 | |
| HP Elite Dragonfly Max | |
| Dell Latitude 5310-23VP6 | |
| Lenovo ThinkPad X1 Titanium Yoga G1 20QB0016GE | |
| Cinebench R20 / CPU (Single Core) | |
| HP Spectre x360 13.5 14t-ef000 | |
| Lenovo IdeaPad Flex 5i 14IAU7 | |
| Lenovo ThinkPad X1 Nano Gen 2 Core i7-1280P | |
| Dell Latitude 9330 | |
| Framework Laptop 13.5 | |
| Moyenne Intel Core i7-1260U (566 - 588, n=2) | |
| Asus Zenbook S 13 OLED | |
| Lenovo ThinkBook 13s G3 20YA0005GE | |
| MSI Summit E13 Flip Evo A11MT | |
| HP Elite Dragonfly Max | |
| Lenovo Yoga 6 13ALC6 | |
| HP EliteBook x360 1030 G7 | |
| Lenovo ThinkPad X1 Titanium Yoga G1 20QB0016GE | |
| Dell Latitude 5310-23VP6 | |
| Samsung Galaxy Book2 Pro 13 NP930XED-KA1DE | |
| Cinebench R23 / Multi Core | |
| Asus Zenbook S 13 OLED | |
| Lenovo ThinkPad X1 Nano Gen 2 Core i7-1280P | |
| HP Spectre x360 13.5 14t-ef000 | |
| Lenovo IdeaPad Flex 5i 14IAU7 | |
| Lenovo ThinkBook 13s G3 20YA0005GE | |
| Moyenne Intel Core i7-1260U (7444 - 8381, n=2) | |
| Lenovo Yoga 6 13ALC6 | |
| Dell Latitude 9330 | |
| Samsung Galaxy Book2 Pro 13 NP930XED-KA1DE | |
| MSI Summit E13 Flip Evo A11MT | |
| Framework Laptop 13.5 | |
| HP Elite Dragonfly Max | |
| Lenovo ThinkPad X1 Titanium Yoga G1 20QB0016GE | |
| Cinebench R23 / Single Core | |
| HP Spectre x360 13.5 14t-ef000 | |
| Lenovo ThinkPad X1 Nano Gen 2 Core i7-1280P | |
| Lenovo IdeaPad Flex 5i 14IAU7 | |
| Moyenne Intel Core i7-1260U (1538 - 1664, n=2) | |
| Dell Latitude 9330 | |
| Framework Laptop 13.5 | |
| Asus Zenbook S 13 OLED | |
| MSI Summit E13 Flip Evo A11MT | |
| Lenovo ThinkBook 13s G3 20YA0005GE | |
| HP Elite Dragonfly Max | |
| Lenovo Yoga 6 13ALC6 | |
| Lenovo ThinkPad X1 Titanium Yoga G1 20QB0016GE | |
| Samsung Galaxy Book2 Pro 13 NP930XED-KA1DE | |
| Cinebench R15 / CPU Multi 64Bit | |
| Lenovo ThinkPad X1 Nano Gen 2 Core i7-1280P | |
| Lenovo ThinkBook 13s G3 20YA0005GE | |
| Lenovo ThinkBook 13s G3 20YA0005GE | |
| Asus Zenbook S 13 OLED | |
| HP Spectre x360 13.5 14t-ef000 | |
| Lenovo IdeaPad Flex 5i 14IAU7 | |
| Moyenne Intel Core i7-1260U (1117 - 1289, n=2) | |
| Lenovo Yoga 6 13ALC6 | |
| Dell Latitude 9330 | |
| Samsung Galaxy Book2 Pro 13 NP930XED-KA1DE | |
| MSI Summit E13 Flip Evo A11MT | |
| Framework Laptop 13.5 | |
| HP EliteBook x360 1030 G7 | |
| Lenovo ThinkPad X1 Titanium Yoga G1 20QB0016GE | |
| HP Elite Dragonfly Max | |
| Dell Latitude 5310-23VP6 | |
| Cinebench R15 / CPU Single 64Bit | |
| HP Spectre x360 13.5 14t-ef000 | |
| Lenovo IdeaPad Flex 5i 14IAU7 | |
| Lenovo ThinkPad X1 Nano Gen 2 Core i7-1280P | |
| Asus Zenbook S 13 OLED | |
| Lenovo ThinkBook 13s G3 20YA0005GE | |
| Framework Laptop 13.5 | |
| Dell Latitude 9330 | |
| Moyenne Intel Core i7-1260U (217 - 222, n=2) | |
| MSI Summit E13 Flip Evo A11MT | |
| Lenovo Yoga 6 13ALC6 | |
| HP EliteBook x360 1030 G7 | |
| Lenovo ThinkPad X1 Titanium Yoga G1 20QB0016GE | |
| HP Elite Dragonfly Max | |
| Dell Latitude 5310-23VP6 | |
| Samsung Galaxy Book2 Pro 13 NP930XED-KA1DE | |
| Blender / v2.79 BMW27 CPU | |
| Lenovo ThinkPad X1 Titanium Yoga G1 20QB0016GE | |
| Dell Latitude 5310-23VP6 | |
| HP Elite Dragonfly Max | |
| HP EliteBook x360 1030 G7 | |
| Samsung Galaxy Book2 Pro 13 NP930XED-KA1DE | |
| MSI Summit E13 Flip Evo A11MT | |
| Framework Laptop 13.5 | |
| Dell Latitude 9330 | |
| Moyenne Intel Core i7-1260U (393 - 431, n=2) | |
| Lenovo IdeaPad Flex 5i 14IAU7 | |
| Lenovo ThinkBook 13s G3 20YA0005GE | |
| HP Spectre x360 13.5 14t-ef000 | |
| Lenovo Yoga 6 13ALC6 | |
| Asus Zenbook S 13 OLED | |
| Lenovo ThinkPad X1 Nano Gen 2 Core i7-1280P | |
| 7-Zip 18.03 / 7z b 4 | |
| Asus Zenbook S 13 OLED | |
| Lenovo ThinkPad X1 Nano Gen 2 Core i7-1280P | |
| Lenovo ThinkBook 13s G3 20YA0005GE | |
| Lenovo Yoga 6 13ALC6 | |
| HP Spectre x360 13.5 14t-ef000 | |
| Moyenne Intel Core i7-1260U (32008 - 36480, n=2) | |
| Dell Latitude 9330 | |
| Lenovo IdeaPad Flex 5i 14IAU7 | |
| MSI Summit E13 Flip Evo A11MT | |
| Framework Laptop 13.5 | |
| Samsung Galaxy Book2 Pro 13 NP930XED-KA1DE | |
| HP EliteBook x360 1030 G7 | |
| HP Elite Dragonfly Max | |
| Dell Latitude 5310-23VP6 | |
| Lenovo ThinkPad X1 Titanium Yoga G1 20QB0016GE | |
| 7-Zip 18.03 / 7z b 4 -mmt1 | |
| Lenovo ThinkPad X1 Nano Gen 2 Core i7-1280P | |
| HP Spectre x360 13.5 14t-ef000 | |
| Asus Zenbook S 13 OLED | |
| Framework Laptop 13.5 | |
| Lenovo ThinkBook 13s G3 20YA0005GE | |
| MSI Summit E13 Flip Evo A11MT | |
| HP Elite Dragonfly Max | |
| Lenovo IdeaPad Flex 5i 14IAU7 | |
| Moyenne Intel Core i7-1260U (4746 - 5047, n=2) | |
| Dell Latitude 9330 | |
| Lenovo Yoga 6 13ALC6 | |
| HP EliteBook x360 1030 G7 | |
| Dell Latitude 5310-23VP6 | |
| Lenovo ThinkPad X1 Titanium Yoga G1 20QB0016GE | |
| Samsung Galaxy Book2 Pro 13 NP930XED-KA1DE | |
| Geekbench 5.5 / Multi-Core | |
| Lenovo ThinkPad X1 Nano Gen 2 Core i7-1280P | |
| Lenovo IdeaPad Flex 5i 14IAU7 | |
| HP Spectre x360 13.5 14t-ef000 | |
| Asus Zenbook S 13 OLED | |
| Moyenne Intel Core i7-1260U (7072 - 7444, n=2) | |
| Dell Latitude 9330 | |
| Lenovo ThinkBook 13s G3 20YA0005GE | |
| MSI Summit E13 Flip Evo A11MT | |
| HP Elite Dragonfly Max | |
| HP EliteBook x360 1030 G7 | |
| Samsung Galaxy Book2 Pro 13 NP930XED-KA1DE | |
| Lenovo ThinkPad X1 Titanium Yoga G1 20QB0016GE | |
| Dell Latitude 5310-23VP6 | |
| Geekbench 5.5 / Single-Core | |
| Lenovo ThinkPad X1 Nano Gen 2 Core i7-1280P | |
| HP Spectre x360 13.5 14t-ef000 | |
| Lenovo IdeaPad Flex 5i 14IAU7 | |
| Moyenne Intel Core i7-1260U (1560 - 1662, n=2) | |
| Dell Latitude 9330 | |
| HP Elite Dragonfly Max | |
| Asus Zenbook S 13 OLED | |
| MSI Summit E13 Flip Evo A11MT | |
| Lenovo ThinkBook 13s G3 20YA0005GE | |
| Lenovo ThinkPad X1 Titanium Yoga G1 20QB0016GE | |
| HP EliteBook x360 1030 G7 | |
| Dell Latitude 5310-23VP6 | |
| Samsung Galaxy Book2 Pro 13 NP930XED-KA1DE | |
| HWBOT x265 Benchmark v2.2 / 4k Preset | |
| Asus Zenbook S 13 OLED | |
| HP Spectre x360 13.5 14t-ef000 | |
| Lenovo ThinkBook 13s G3 20YA0005GE | |
| Lenovo ThinkPad X1 Nano Gen 2 Core i7-1280P | |
| Lenovo IdeaPad Flex 5i 14IAU7 | |
| Lenovo Yoga 6 13ALC6 | |
| Moyenne Intel Core i7-1260U (8.54 - 9.58, n=2) | |
| Dell Latitude 9330 | |
| MSI Summit E13 Flip Evo A11MT | |
| Framework Laptop 13.5 | |
| Samsung Galaxy Book2 Pro 13 NP930XED-KA1DE | |
| HP EliteBook x360 1030 G7 | |
| HP Elite Dragonfly Max | |
| Dell Latitude 5310-23VP6 | |
| Lenovo ThinkPad X1 Titanium Yoga G1 20QB0016GE | |
| LibreOffice / 20 Documents To PDF | |
| Samsung Galaxy Book2 Pro 13 NP930XED-KA1DE | |
| HP EliteBook x360 1030 G7 | |
| Dell Latitude 5310-23VP6 | |
| Lenovo Yoga 6 13ALC6 | |
| Asus Zenbook S 13 OLED | |
| Dell Latitude 9330 | |
| Lenovo ThinkPad X1 Titanium Yoga G1 20QB0016GE | |
| Lenovo ThinkBook 13s G3 20YA0005GE | |
| Lenovo IdeaPad Flex 5i 14IAU7 | |
| Moyenne Intel Core i7-1260U (45.9 - 51.4, n=2) | |
| MSI Summit E13 Flip Evo A11MT | |
| HP Elite Dragonfly Max | |
| Lenovo ThinkPad X1 Nano Gen 2 Core i7-1280P | |
| Framework Laptop 13.5 | |
| HP Spectre x360 13.5 14t-ef000 | |
| R Benchmark 2.5 / Overall mean | |
| Samsung Galaxy Book2 Pro 13 NP930XED-KA1DE | |
| Lenovo ThinkPad X1 Titanium Yoga G1 20QB0016GE | |
| Dell Latitude 5310-23VP6 | |
| HP EliteBook x360 1030 G7 | |
| HP Elite Dragonfly Max | |
| MSI Summit E13 Flip Evo A11MT | |
| Lenovo Yoga 6 13ALC6 | |
| Framework Laptop 13.5 | |
| Lenovo ThinkBook 13s G3 20YA0005GE | |
| Dell Latitude 9330 | |
| Asus Zenbook S 13 OLED | |
| Moyenne Intel Core i7-1260U (0.494 - 0.53, n=2) | |
| Lenovo IdeaPad Flex 5i 14IAU7 | |
| HP Spectre x360 13.5 14t-ef000 | |
| Lenovo ThinkPad X1 Nano Gen 2 Core i7-1280P | |
Cinebench R23: Multi Core | Single Core
Cinebench R15: CPU Multi 64Bit | CPU Single 64Bit
Blender: v2.79 BMW27 CPU
7-Zip 18.03: 7z b 4 | 7z b 4 -mmt1
Geekbench 5.5: Multi-Core | Single-Core
HWBOT x265 Benchmark v2.2: 4k Preset
LibreOffice : 20 Documents To PDF
R Benchmark 2.5: Overall mean
* ... Moindre est la valeur, meilleures sont les performances
AIDA64: FP32 Ray-Trace | FPU Julia | CPU SHA3 | CPU Queen | FPU SinJulia | FPU Mandel | CPU AES | CPU ZLib | FP64 Ray-Trace | CPU PhotoWorxx
| Performance rating | |
| MSI Summit E13 Flip Evo A11MT | |
| Moyenne Intel Core i7-1260U | |
| Dell Latitude 9330 | |
| HP Elite Dragonfly Max | |
| Lenovo ThinkPad X1 Titanium Yoga G1 20QB0016GE | |
| Dell Latitude 5310-23VP6 | |
| AIDA64 / FP32 Ray-Trace | |
| MSI Summit E13 Flip Evo A11MT | |
| Moyenne Intel Core i7-1260U (6694 - 7261, n=2) | |
| Dell Latitude 9330 | |
| HP Elite Dragonfly Max | |
| Dell Latitude 5310-23VP6 | |
| Lenovo ThinkPad X1 Titanium Yoga G1 20QB0016GE | |
| AIDA64 / FPU Julia | |
| Moyenne Intel Core i7-1260U (33823 - 37371, n=2) | |
| Dell Latitude 9330 | |
| MSI Summit E13 Flip Evo A11MT | |
| Dell Latitude 5310-23VP6 | |
| HP Elite Dragonfly Max | |
| Lenovo ThinkPad X1 Titanium Yoga G1 20QB0016GE | |
| AIDA64 / CPU SHA3 | |
| MSI Summit E13 Flip Evo A11MT | |
| Moyenne Intel Core i7-1260U (1816 - 1949, n=2) | |
| Dell Latitude 9330 | |
| HP Elite Dragonfly Max | |
| Lenovo ThinkPad X1 Titanium Yoga G1 20QB0016GE | |
| Dell Latitude 5310-23VP6 | |
| AIDA64 / CPU Queen | |
| MSI Summit E13 Flip Evo A11MT | |
| Moyenne Intel Core i7-1260U (50854 - 53090, n=2) | |
| Dell Latitude 9330 | |
| HP Elite Dragonfly Max | |
| Dell Latitude 5310-23VP6 | |
| Lenovo ThinkPad X1 Titanium Yoga G1 20QB0016GE | |
| AIDA64 / FPU SinJulia | |
| MSI Summit E13 Flip Evo A11MT | |
| Dell Latitude 5310-23VP6 | |
| Moyenne Intel Core i7-1260U (4067 - 4155, n=2) | |
| Dell Latitude 9330 | |
| HP Elite Dragonfly Max | |
| Lenovo ThinkPad X1 Titanium Yoga G1 20QB0016GE | |
| AIDA64 / FPU Mandel | |
| MSI Summit E13 Flip Evo A11MT | |
| Moyenne Intel Core i7-1260U (16988 - 17918, n=2) | |
| Dell Latitude 9330 | |
| HP Elite Dragonfly Max | |
| Dell Latitude 5310-23VP6 | |
| Lenovo ThinkPad X1 Titanium Yoga G1 20QB0016GE | |
| AIDA64 / CPU AES | |
| MSI Summit E13 Flip Evo A11MT | |
| HP Elite Dragonfly Max | |
| Lenovo ThinkPad X1 Titanium Yoga G1 20QB0016GE | |
| Moyenne Intel Core i7-1260U (33289 - 35061, n=2) | |
| Dell Latitude 9330 | |
| Dell Latitude 5310-23VP6 | |
| AIDA64 / CPU ZLib | |
| Moyenne Intel Core i7-1260U (506 - 586, n=2) | |
| Dell Latitude 9330 | |
| MSI Summit E13 Flip Evo A11MT | |
| Dell Latitude 5310-23VP6 | |
| HP Elite Dragonfly Max | |
| Lenovo ThinkPad X1 Titanium Yoga G1 20QB0016GE | |
| AIDA64 / FP64 Ray-Trace | |
| MSI Summit E13 Flip Evo A11MT | |
| Moyenne Intel Core i7-1260U (3666 - 3854, n=2) | |
| Dell Latitude 9330 | |
| HP Elite Dragonfly Max | |
| Dell Latitude 5310-23VP6 | |
| Lenovo ThinkPad X1 Titanium Yoga G1 20QB0016GE | |
| AIDA64 / CPU PhotoWorxx | |
| MSI Summit E13 Flip Evo A11MT | |
| HP Elite Dragonfly Max | |
| Moyenne Intel Core i7-1260U (37448 - 37790, n=2) | |
| Dell Latitude 9330 | |
| Lenovo ThinkPad X1 Titanium Yoga G1 20QB0016GE | |
| Dell Latitude 5310-23VP6 | |
Performance du système
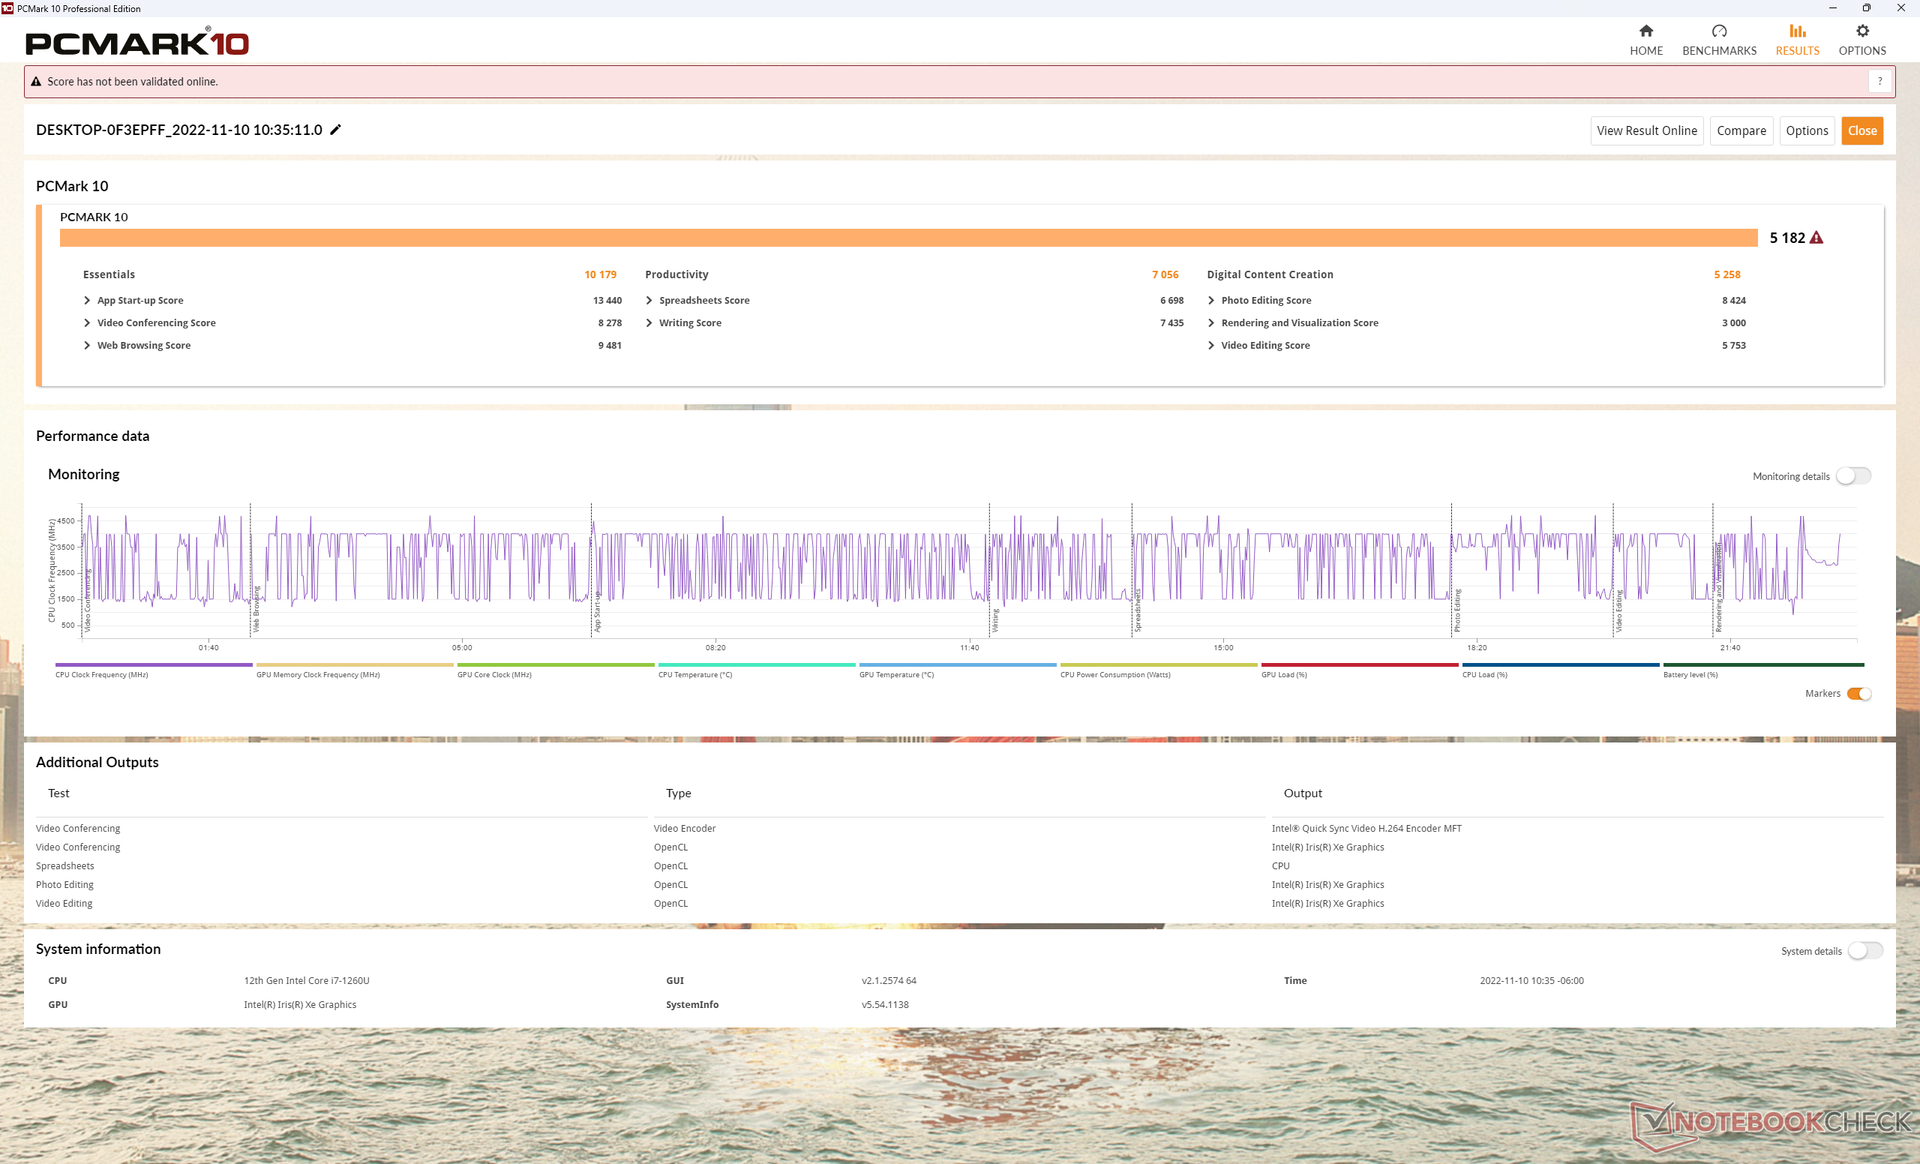
Les résultats de PCMark 10 sont plus élevés que sur la plupart des autres subnotebooks de 13 pouces pour être l'un des plus rapides de la catégorie. De nombreux modèles de cette classe de taille ont tendance à fonctionner avec des processeurs dont le TDP est plus faible, comme le ThinkPad X1 Yoga G1 pour des performances finalement plus lentes.
| PCMark 10 / Score | |
| Moyenne Intel Core i7-1260U, Intel Iris Xe Graphics G7 96EUs (5182 - 5300, n=2) | |
| Dell Latitude 9330 | |
| HP Elite Dragonfly Max | |
| MSI Summit E13 Flip Evo A11MT | |
| Lenovo ThinkPad X1 Titanium Yoga G1 20QB0016GE | |
| HP EliteBook x360 1030 G7 | |
| Dell Latitude 5310-23VP6 | |
| PCMark 10 / Essentials | |
| HP Elite Dragonfly Max | |
| Dell Latitude 9330 | |
| Moyenne Intel Core i7-1260U, Intel Iris Xe Graphics G7 96EUs (9929 - 10179, n=2) | |
| Lenovo ThinkPad X1 Titanium Yoga G1 20QB0016GE | |
| HP EliteBook x360 1030 G7 | |
| Dell Latitude 5310-23VP6 | |
| MSI Summit E13 Flip Evo A11MT | |
| PCMark 10 / Productivity | |
| Moyenne Intel Core i7-1260U, Intel Iris Xe Graphics G7 96EUs (7056 - 7287, n=2) | |
| Dell Latitude 9330 | |
| MSI Summit E13 Flip Evo A11MT | |
| HP Elite Dragonfly Max | |
| Dell Latitude 5310-23VP6 | |
| HP EliteBook x360 1030 G7 | |
| Lenovo ThinkPad X1 Titanium Yoga G1 20QB0016GE | |
| PCMark 10 / Digital Content Creation | |
| Moyenne Intel Core i7-1260U, Intel Iris Xe Graphics G7 96EUs (5258 - 5584, n=2) | |
| Dell Latitude 9330 | |
| MSI Summit E13 Flip Evo A11MT | |
| HP Elite Dragonfly Max | |
| Lenovo ThinkPad X1 Titanium Yoga G1 20QB0016GE | |
| HP EliteBook x360 1030 G7 | |
| Dell Latitude 5310-23VP6 | |
| PCMark 10 Score | 5182 points | |
Aide | ||
| AIDA64 / Memory Copy | |
| Dell Latitude 9330 | |
| Moyenne Intel Core i7-1260U (68849 - 69994, n=2) | |
| HP Elite Dragonfly Max | |
| MSI Summit E13 Flip Evo A11MT | |
| Lenovo ThinkPad X1 Titanium Yoga G1 20QB0016GE | |
| Dell Latitude 5310-23VP6 | |
| AIDA64 / Memory Read | |
| HP Elite Dragonfly Max | |
| Dell Latitude 9330 | |
| Moyenne Intel Core i7-1260U (59219 - 60804, n=2) | |
| MSI Summit E13 Flip Evo A11MT | |
| Lenovo ThinkPad X1 Titanium Yoga G1 20QB0016GE | |
| Dell Latitude 5310-23VP6 | |
| AIDA64 / Memory Write | |
| HP Elite Dragonfly Max | |
| Dell Latitude 9330 | |
| Moyenne Intel Core i7-1260U (62367 - 63786, n=2) | |
| Lenovo ThinkPad X1 Titanium Yoga G1 20QB0016GE | |
| MSI Summit E13 Flip Evo A11MT | |
| Dell Latitude 5310-23VP6 | |
| AIDA64 / Memory Latency | |
| Dell Latitude 9330 | |
| Moyenne Intel Core i7-1260U (107.2 - 107.7, n=2) | |
| HP Elite Dragonfly Max | |
| Dell Latitude 5310-23VP6 | |
| MSI Summit E13 Flip Evo A11MT | |
| Lenovo ThinkPad X1 Titanium Yoga G1 20QB0016GE | |
* ... Moindre est la valeur, meilleures sont les performances
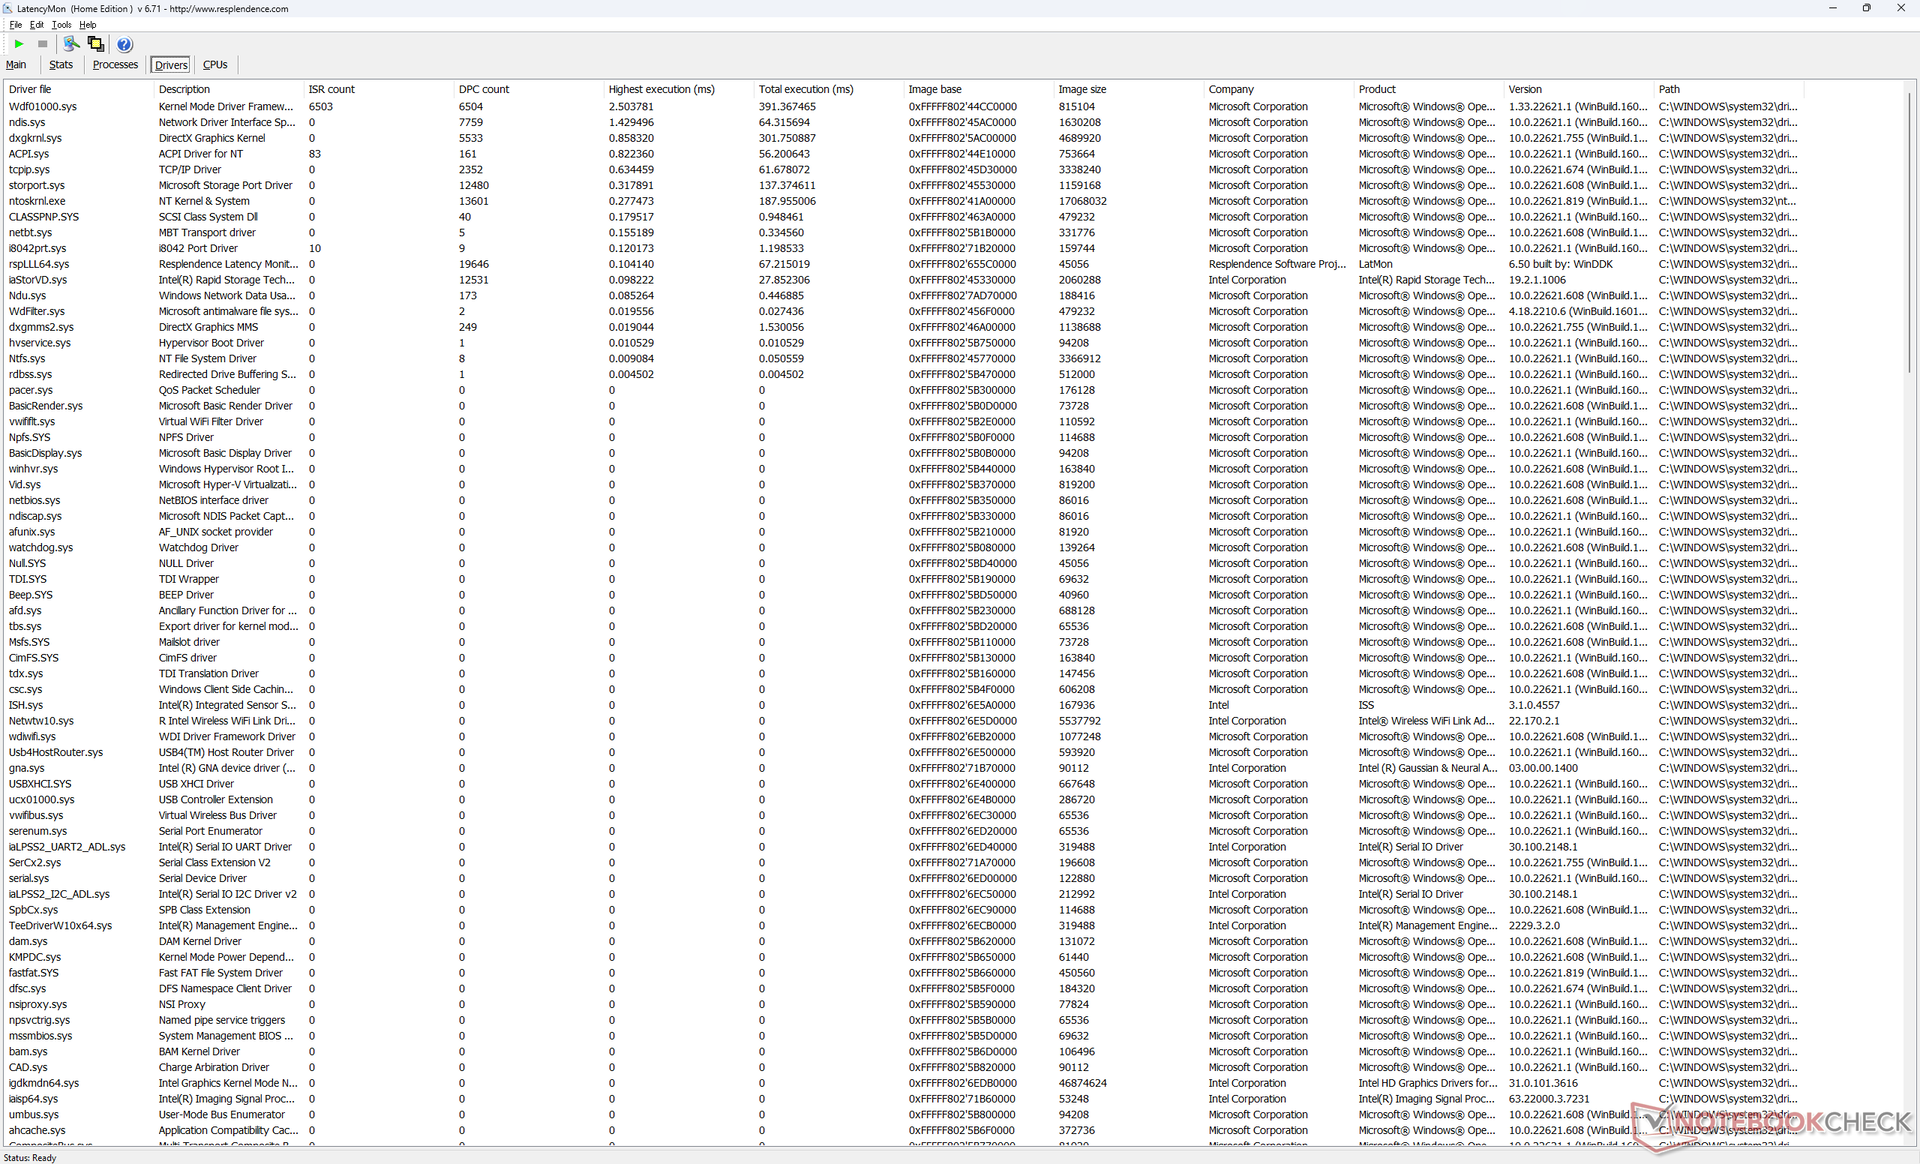
Latence DPC
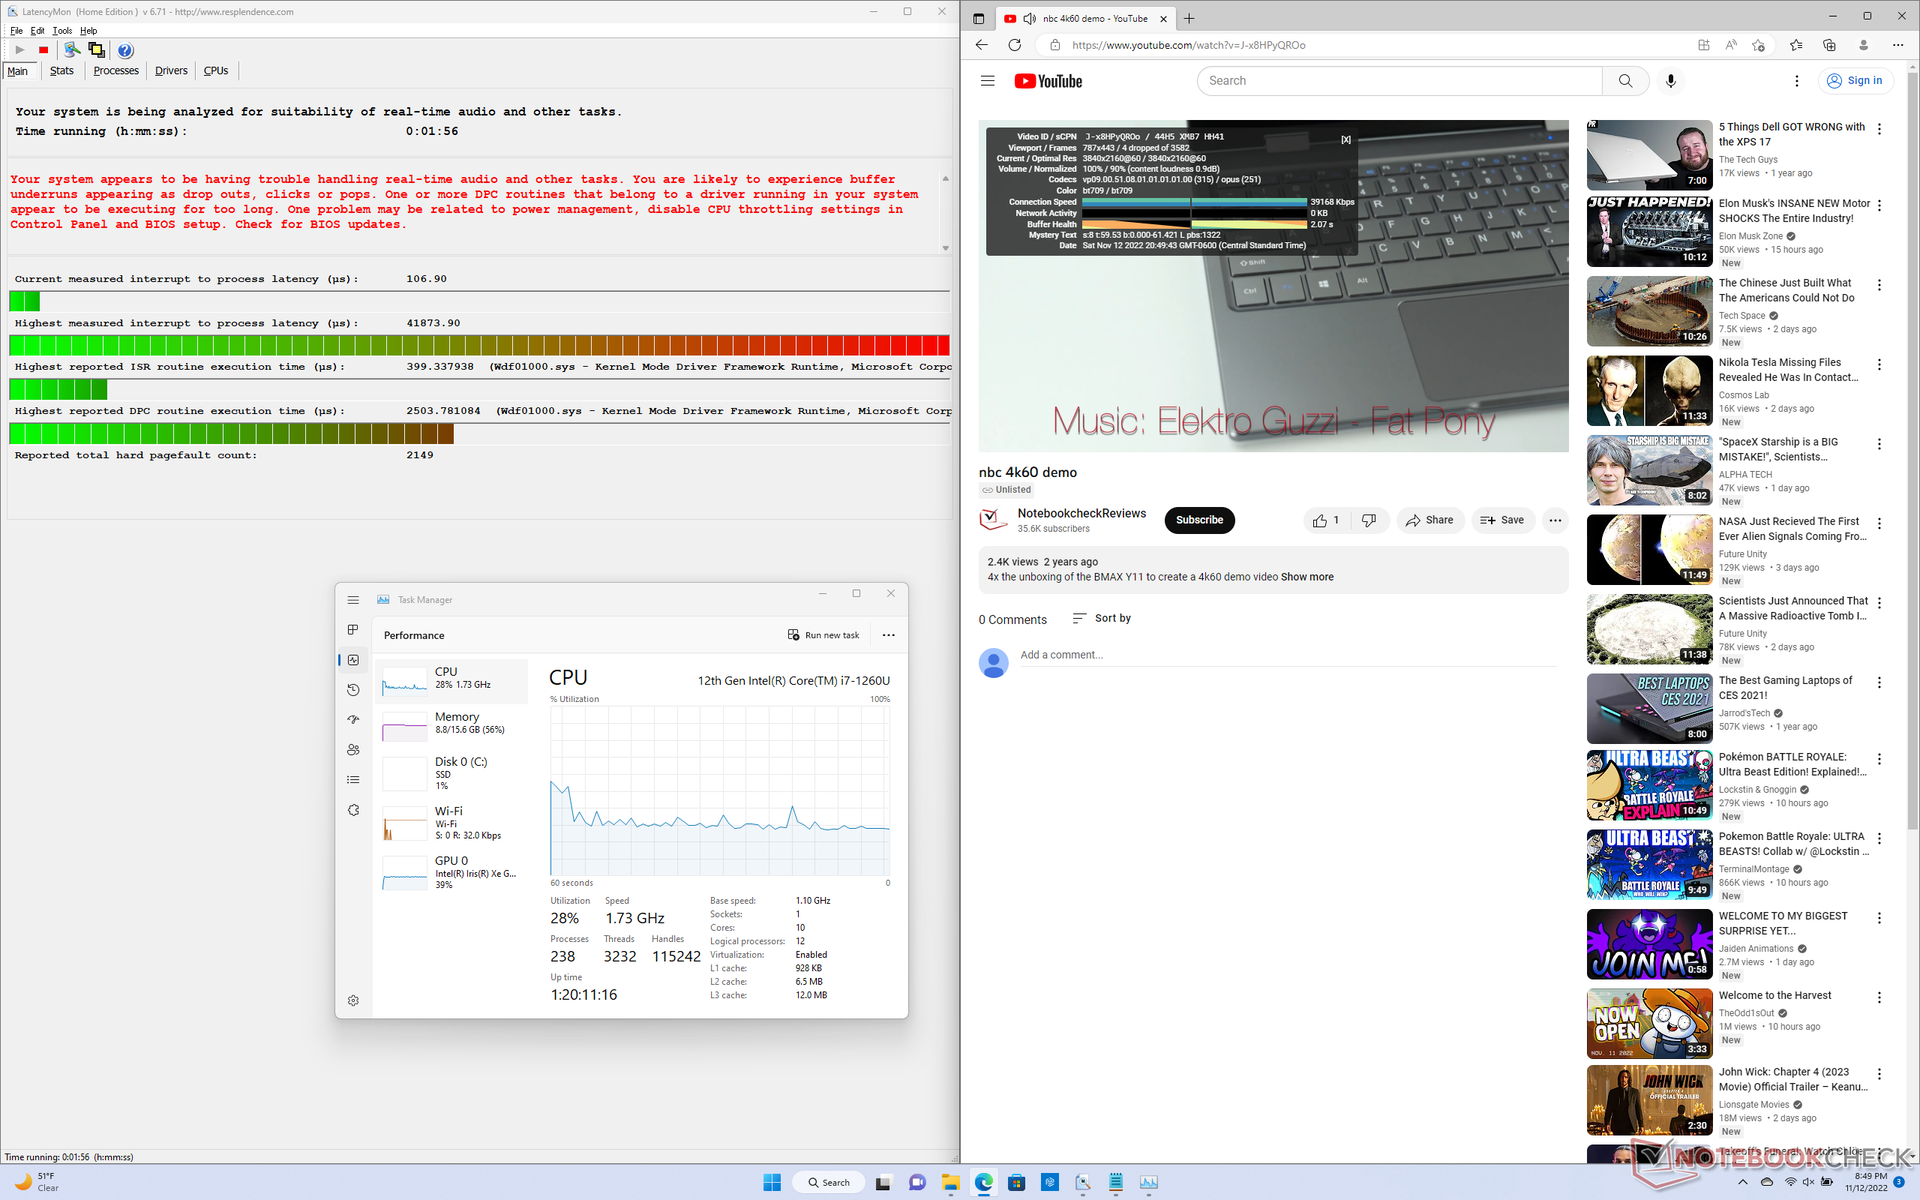
Notre appareil présentait des problèmes majeurs de DPC lors de l'ouverture de plusieurs onglets de navigateur de notre page d'accueil, même après plusieurs retests. la lecture de vidéos 4K à 60 FPS est également imparfaite avec 4 images perdues au cours de la vidéo de test d'une minute. Les résultats sont décevants de la part d'un ordinateur portable professionnel haut de gamme où la constance des performances est importante.
| DPC Latencies / LatencyMon - interrupt to process latency (max), Web, Youtube, Prime95 | |
| Dell Latitude 9330 | |
| HP EliteBook x360 1030 G7 | |
| HP Elite Dragonfly Max | |
| MSI Summit E13 Flip Evo A11MT | |
| Lenovo ThinkPad X1 Titanium Yoga G1 20QB0016GE | |
| Dell Latitude 5310-23VP6 | |
* ... Moindre est la valeur, meilleures sont les performances
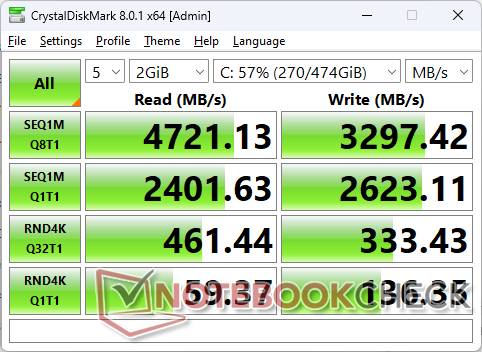
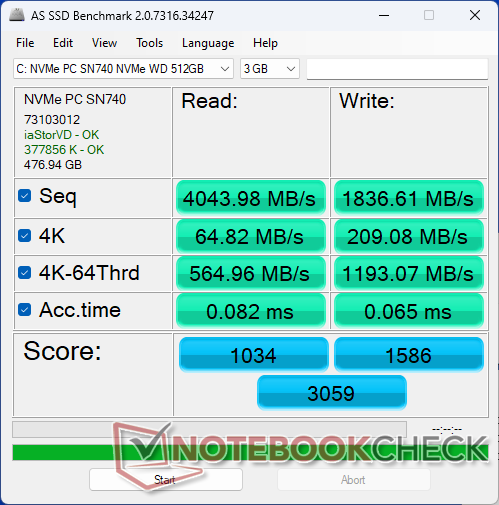
Périphériques de stockage - PCIe4 x4 2230 uniquement
Notre unité de test est livrée avec un disque de 512 Go WD SN740 PCIe4 x4 NVMe SSD de 512 Go offrant des taux de lecture et d'écriture séquentiels stables allant jusqu'à 4700 Mo/s et 3300 Mo/s, respectivement. Il s'agit d'un disque de milieu de gamme si l'on considère que les derniers disques PCIe4 x4 de Samsung peuvent atteindre plus de 7000 Mo/s. Le système ne peut prendre en charge qu'un seul disque interne, sans option secondaire.

| Drive Performance rating - Percent | |
| MSI Summit E13 Flip Evo A11MT | |
| Dell Latitude 9330 | |
| HP EliteBook x360 1030 G7 | |
| HP Elite Dragonfly Max | |
| Lenovo ThinkPad X1 Titanium Yoga G1 20QB0016GE | |
| Dell Latitude 5310-23VP6 | |
* ... Moindre est la valeur, meilleures sont les performances
Disk Throttling: DiskSpd Read Loop, Queue Depth 8
Performances du GPU - bonnes mais pas excellentes
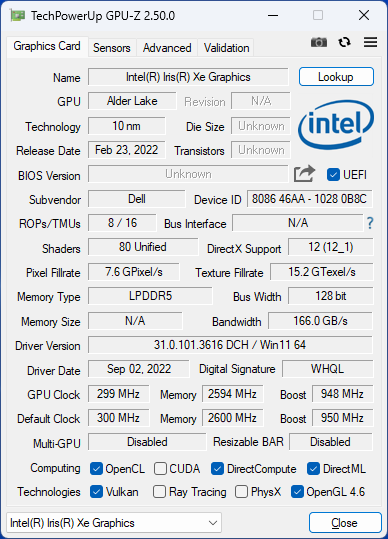
Les performances graphiques sont 15 % plus lentes que celles de l'ordinateur portable moyen de notre base de données avec la même interface intégrée Iris Xe 96 EUs Intégré, malgré les 32 Go de RAM LPDDR5-5200. La série Latitude n'est pas conçue pour le jeu et ce déficit n'est donc pas un gros problème. Les performances globales sont plus proches de celles de l Iris Xe 80 EU que l'on trouve sur de nombreux processeurs Core i5
La plupart des jeux sont encore jouables sur la Latitude 9330, mais seulement avec des réglages bas.
| 3DMark 11 - 1280x720 Performance GPU | |
| Asus Zenbook S 13 OLED | |
| MSI Summit E13 Flip Evo A11MT | |
| Lenovo ThinkPad X1 Nano Gen 2 Core i7-1280P | |
| Moyenne Intel Iris Xe Graphics G7 96EUs (2867 - 7676, n=209) | |
| HP Spectre x360 13.5 14t-ef000 | |
| Lenovo ThinkBook 13s G3 20YA0005GE | |
| Lenovo Yoga 6 13ALC6 | |
| Lenovo IdeaPad Flex 5i 14IAU7 | |
| Samsung Galaxy Book2 Pro 13 NP930XED-KA1DE | |
| HP Elite Dragonfly Max | |
| Dell Latitude 9330 | |
| Lenovo ThinkPad X1 Titanium Yoga G1 20QB0016GE | |
| HP EliteBook x360 1030 G7 | |
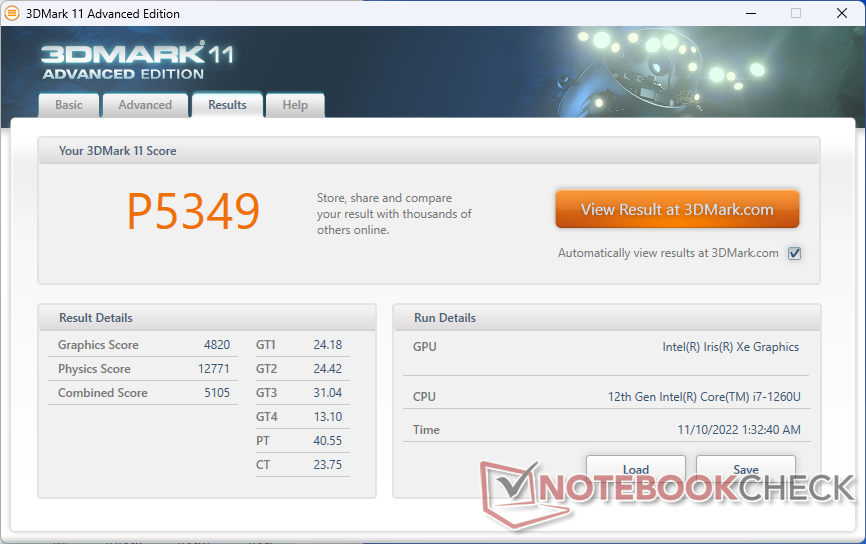
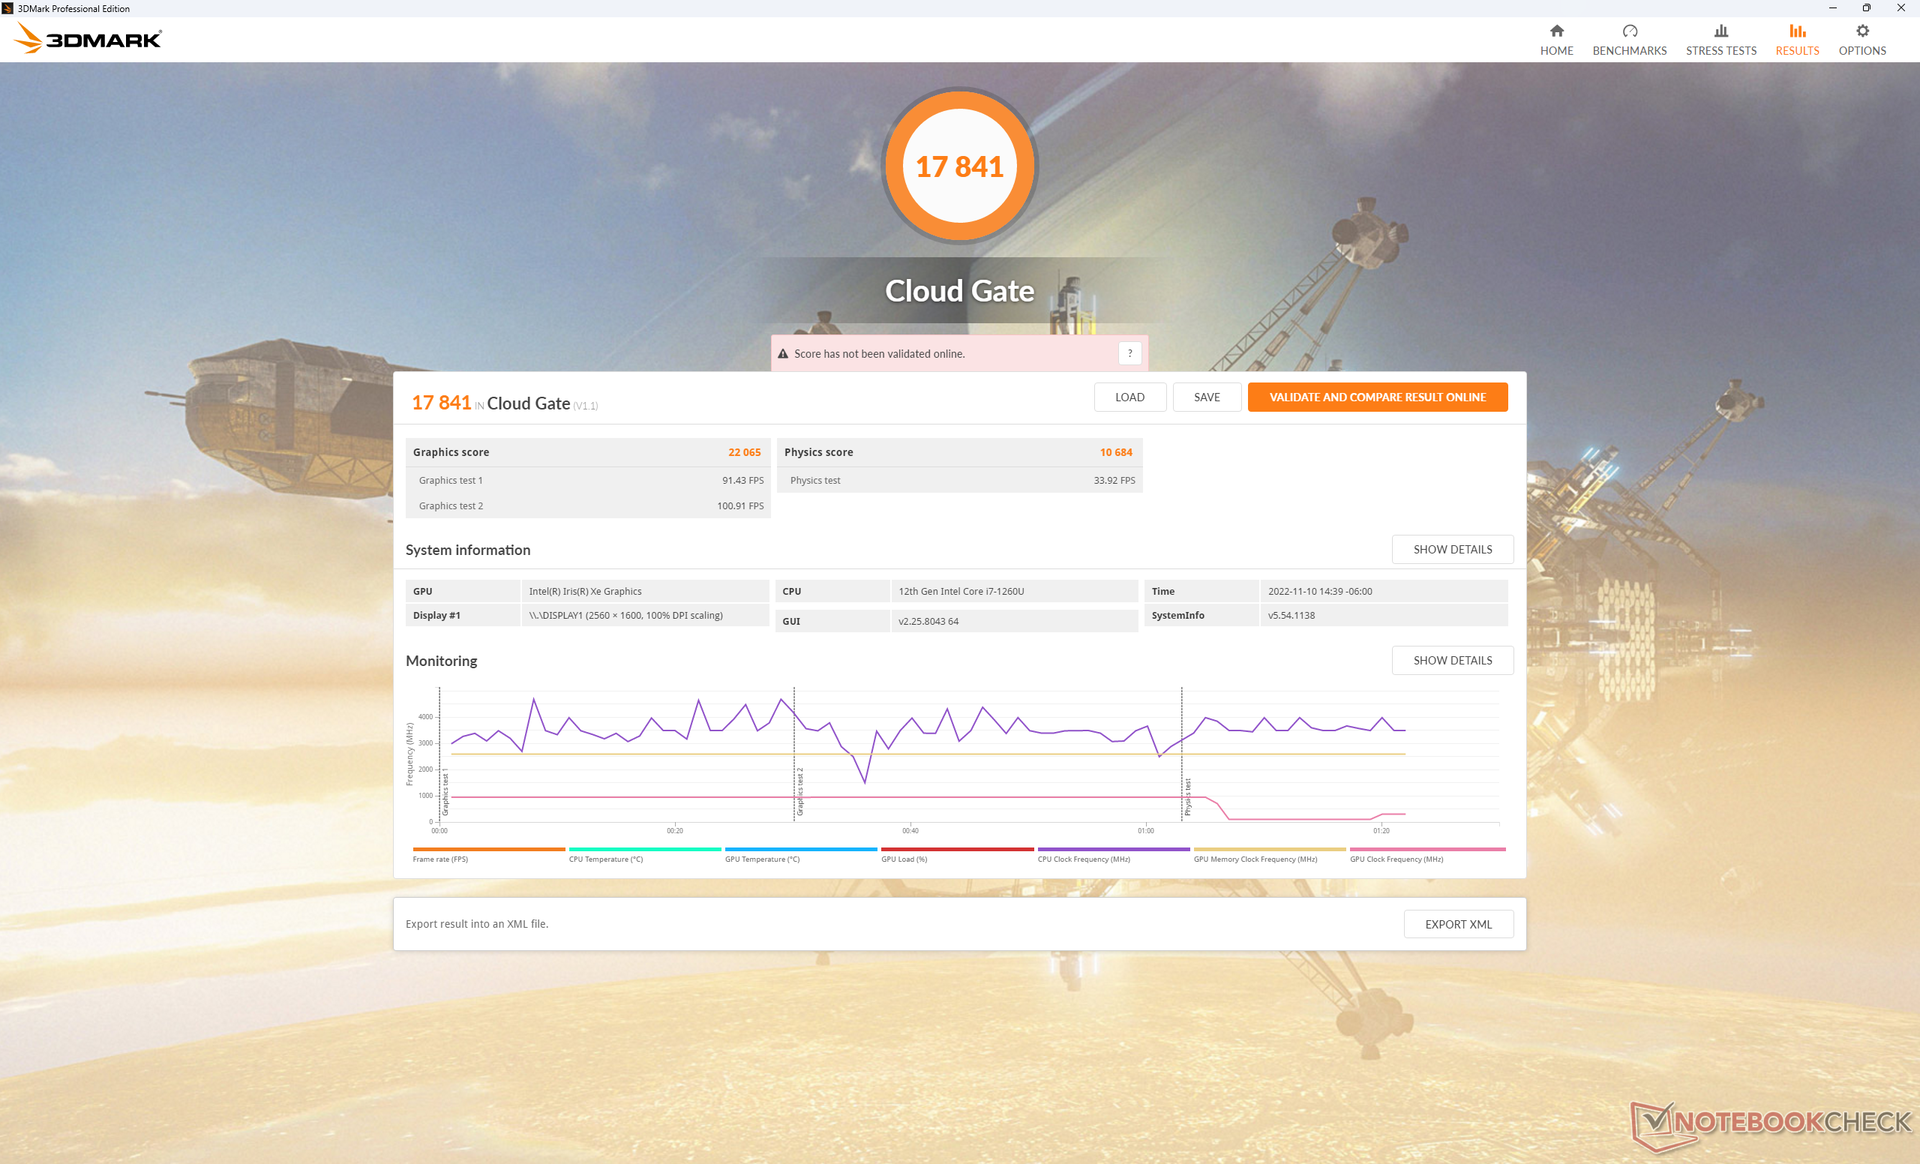
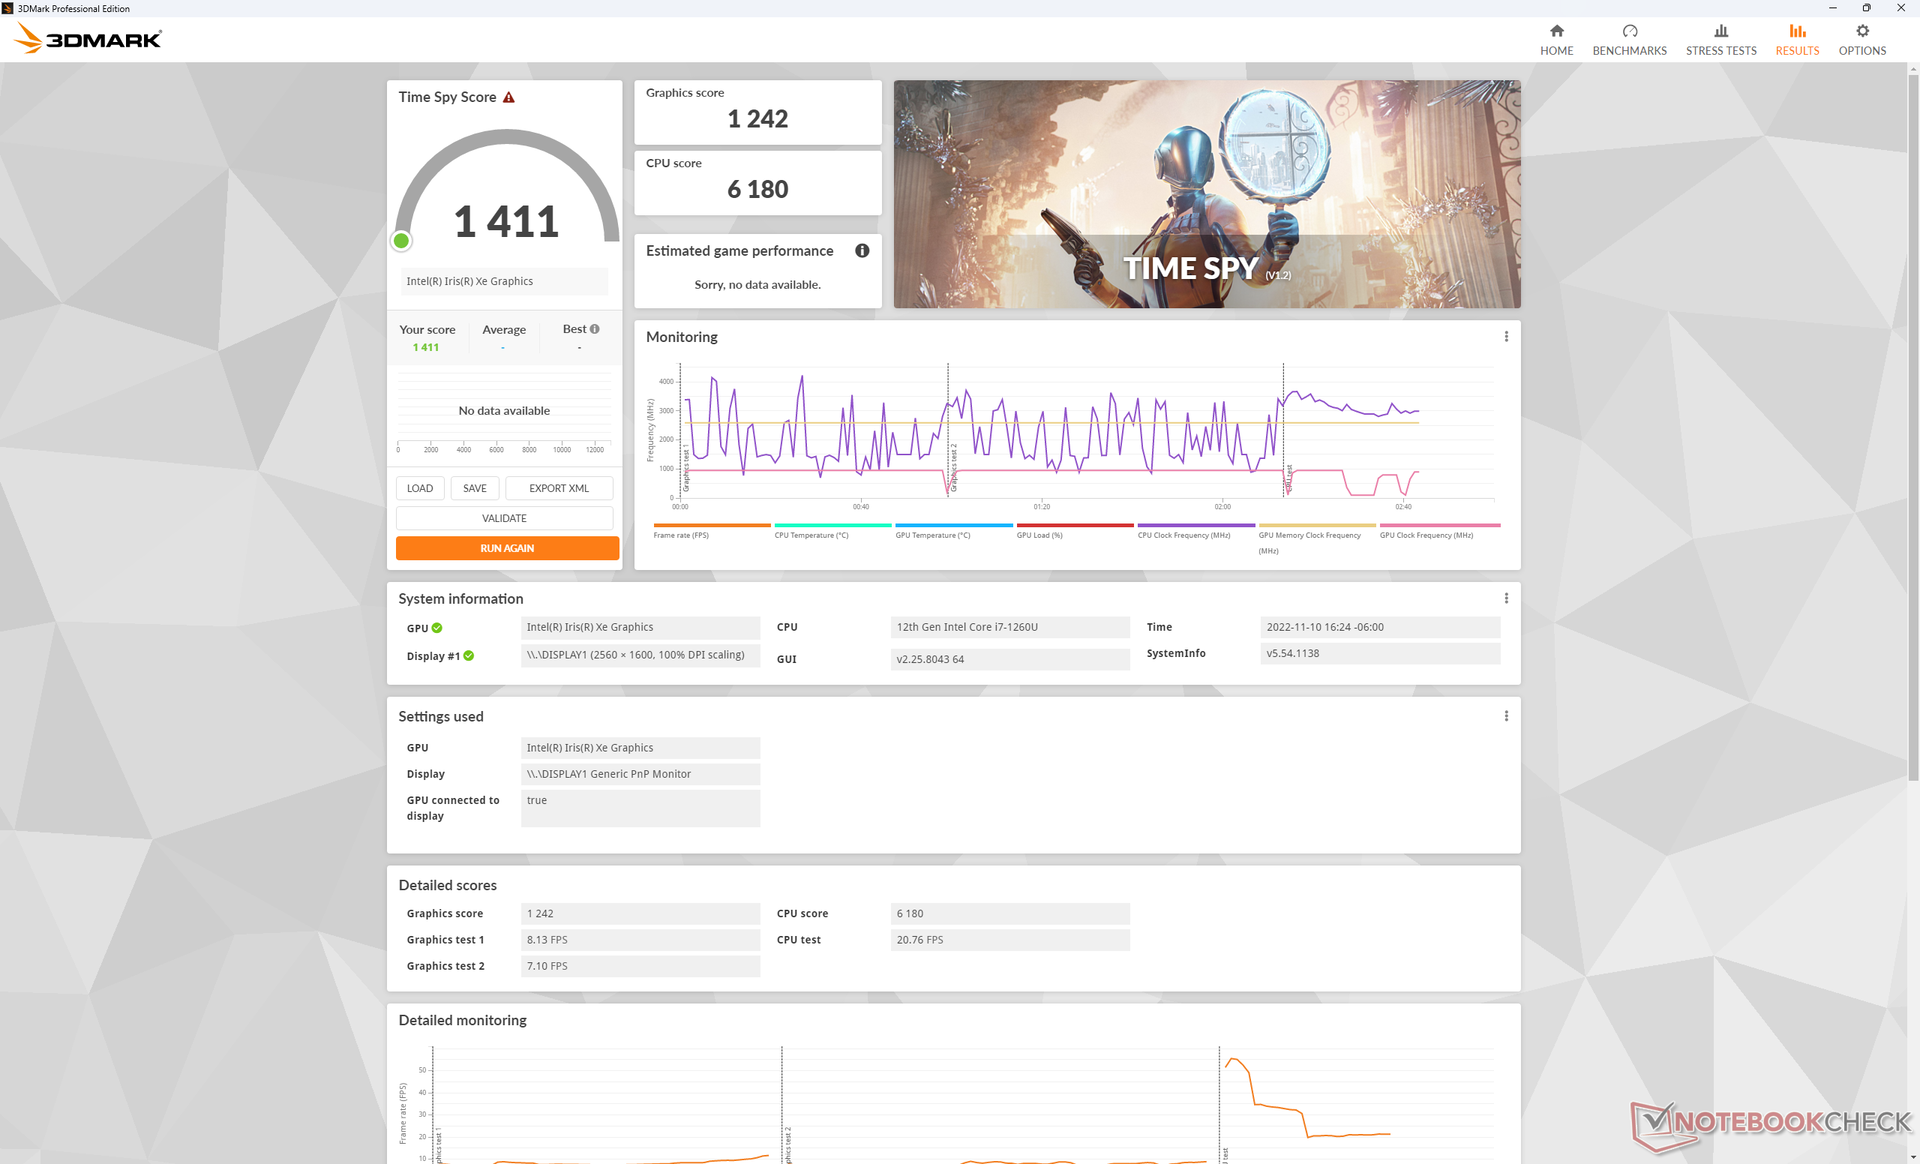
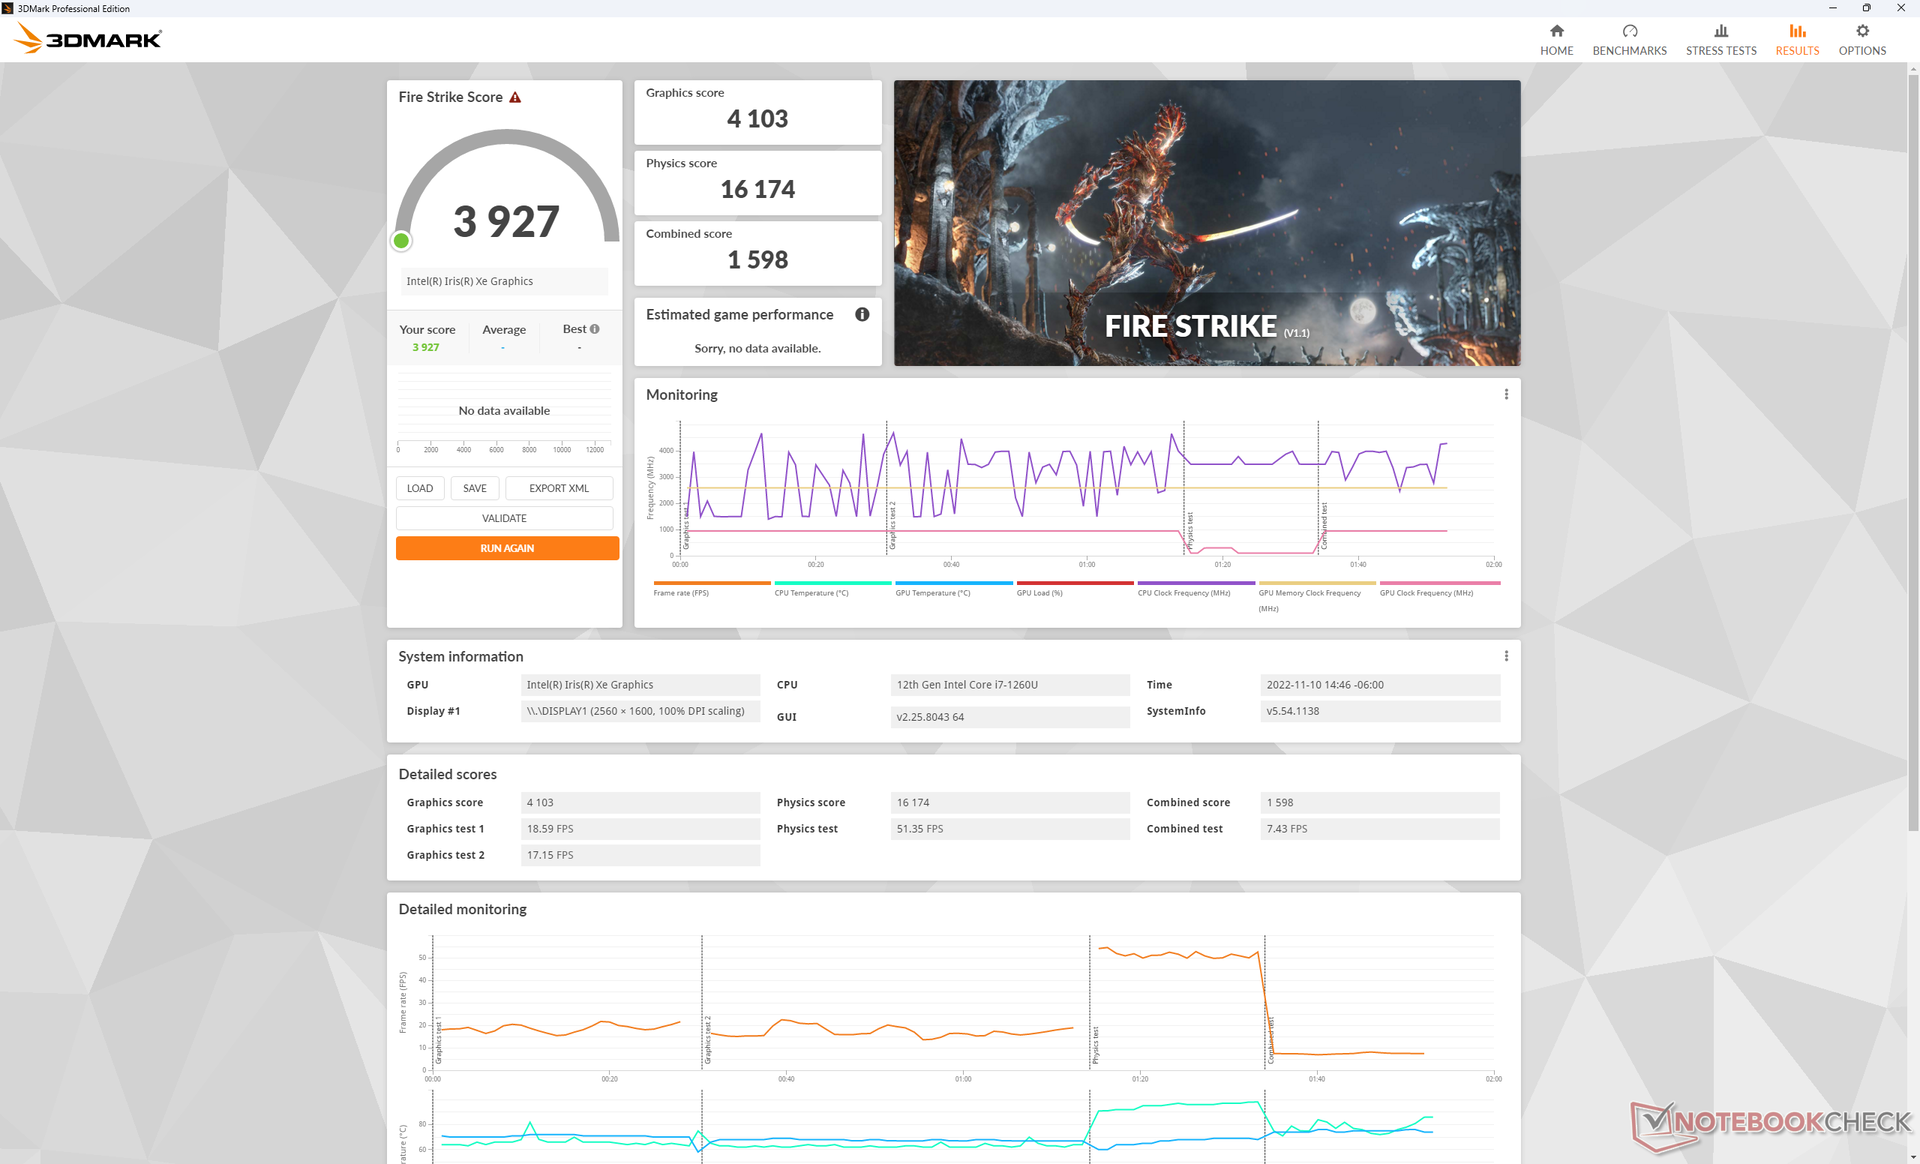
| 3DMark 11 Performance | 5349 points | |
| 3DMark Cloud Gate Standard Score | 17841 points | |
| 3DMark Fire Strike Score | 3927 points | |
| 3DMark Time Spy Score | 1411 points | |
Aide | ||
| Blender - v3.3 Classroom CPU | |
| Dell Latitude 9330 | |
| Moyenne Intel Iris Xe Graphics G7 96EUs (336 - 1259, n=109) | |
* ... Moindre est la valeur, meilleures sont les performances
| Performance rating - Percent | |
| MSI Summit E13 Flip Evo A11MT | |
| Dell Latitude 9330 | |
| HP Elite Dragonfly Max -1! | |
| Lenovo ThinkPad X1 Titanium Yoga G1 20QB0016GE -3! | |
| HP EliteBook x360 1030 G7 -3! | |
| Dell Latitude 5310-23VP6 -4! | |
| The Witcher 3 - 1920x1080 Ultra Graphics & Postprocessing (HBAO+) | |
| MSI Summit E13 Flip Evo A11MT | |
| HP Elite Dragonfly Max | |
| Dell Latitude 9330 | |
| Lenovo ThinkPad X1 Titanium Yoga G1 20QB0016GE | |
| GTA V - 1920x1080 Highest AA:4xMSAA + FX AF:16x | |
| MSI Summit E13 Flip Evo A11MT | |
| Dell Latitude 9330 | |
| Final Fantasy XV Benchmark - 1920x1080 High Quality | |
| MSI Summit E13 Flip Evo A11MT | |
| Dell Latitude 9330 | |
| HP Elite Dragonfly Max | |
| HP EliteBook x360 1030 G7 | |
| Strange Brigade - 1920x1080 ultra AA:ultra AF:16 | |
| MSI Summit E13 Flip Evo A11MT | |
| Dell Latitude 9330 | |
| HP Elite Dragonfly Max | |
| Dota 2 Reborn - 1920x1080 ultra (3/3) best looking | |
| Dell Latitude 9330 | |
| MSI Summit E13 Flip Evo A11MT | |
| Lenovo ThinkPad X1 Titanium Yoga G1 20QB0016GE | |
| HP Elite Dragonfly Max | |
| HP EliteBook x360 1030 G7 | |
| Dell Latitude 5310-23VP6 | |
| X-Plane 11.11 - 1920x1080 high (fps_test=3) | |
| MSI Summit E13 Flip Evo A11MT | |
| Dell Latitude 9330 | |
| HP Elite Dragonfly Max | |
| Lenovo ThinkPad X1 Titanium Yoga G1 20QB0016GE | |
| HP EliteBook x360 1030 G7 | |
| Dell Latitude 5310-23VP6 | |
Witcher 3 FPS Chart
| Bas | Moyen | Élevé | Ultra | |
|---|---|---|---|---|
| GTA V (2015) | 102.1 | 91.1 | 21.7 | 8.94 |
| The Witcher 3 (2015) | 75.8 | 47.2 | 25.9 | 11.4 |
| Dota 2 Reborn (2015) | 100.3 | 80.1 | 58.6 | 53.4 |
| Final Fantasy XV Benchmark (2018) | 37.3 | 21 | 14.6 | |
| X-Plane 11.11 (2018) | 37.1 | 34.4 | 30.8 | |
| Strange Brigade (2018) | 69.1 | 32.4 | 25 | 20.4 |
| Cyberpunk 2077 1.6 (2022) | 17.5 | 14.5 | 11.2 | 8.9 |
Émissions
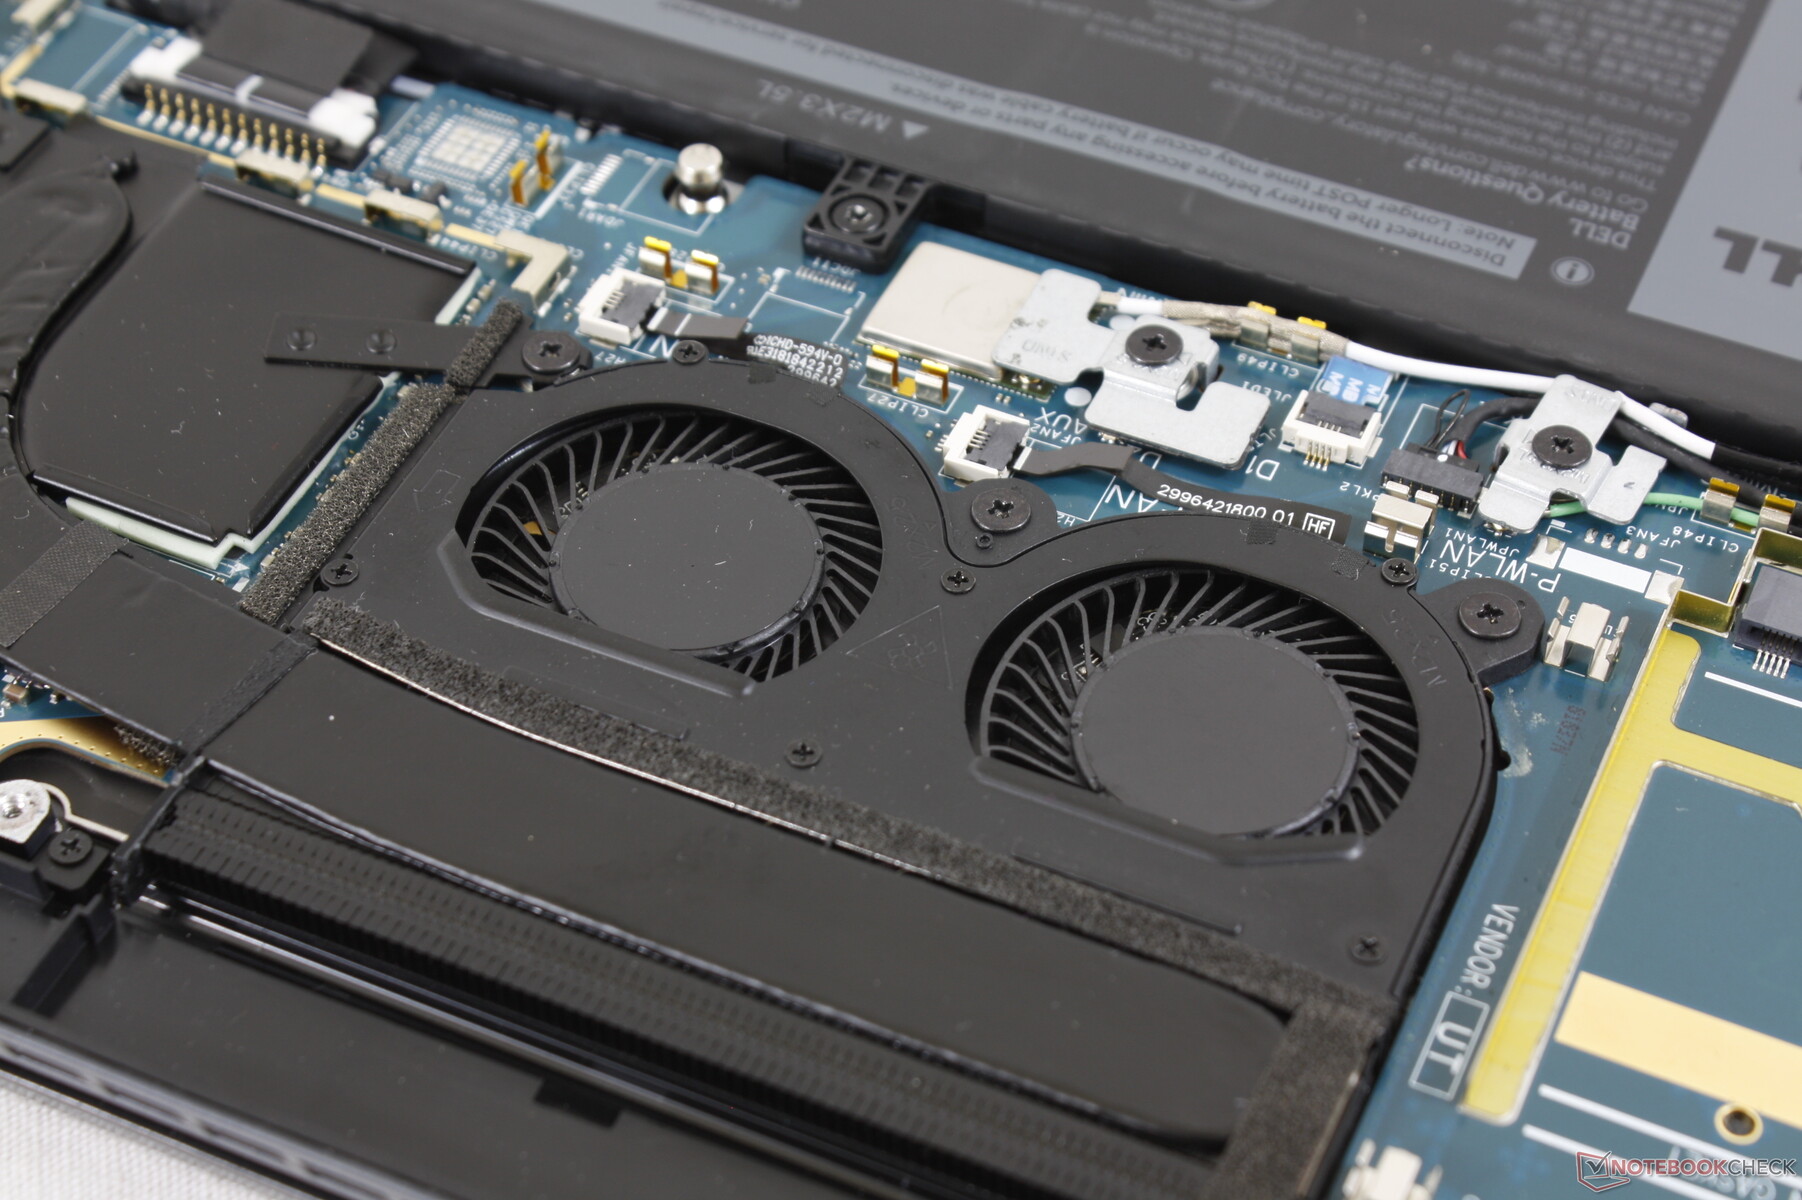
Bruit du système - Ventilateurs à pas élevé
Les deux ventilateurs internes sont assez petits : 30 mm de diamètre chacun, contre 40 mm ou plus sur la plupart des autres ordinateurs portables. Le principal inconvénient des petits ventilateurs est qu'ils sont généralement plus aigus que les plus grands et qu'ils sont donc plus perceptibles lorsqu'ils sont actifs. Nos mesures microphoniques ci-dessous confirment le bruit plus aigu avec un pic relativement net d'environ 3k Hz par rapport aux pics plus larges d'autres subnotebooks de 13 pouces comme le XPS 13 Plus 9320. En d'autres termes, les ventilateurs du Latitude 9330 sont plus susceptibles d'être une source de distraction lors de la navigation sur le Web ou du streaming vidéo.
Lors de l'exécution de 3DMark 06, le bruit du ventilateur passait brusquement du silence à 37 dB(A) à peu près à la moitié de la première scène du benchmark. Le Dell est beaucoup plus bruyant que ce que nous avons enregistré sur leHP Dragonfly Max tout en étant à égalité avec le Summit E13 Flip. Nous recommandons de faire fonctionner le système en mode silencieux ou équilibré pour réduire au minimum les pulsations du ventilateur.
Degré de la nuisance sonore
| Au repos |
| 23 / 23.1 / 23.1 dB(A) |
| Fortement sollicité |
| 37.1 / 40.5 dB(A) |
 | ||
30 dB silencieux 40 dB(A) audible 50 dB(A) bruyant |
||
min: | ||
| Dell Latitude 9330 Iris Xe G7 96EUs, i7-1260U | Lenovo ThinkPad X1 Titanium Yoga G1 20QB0016GE Iris Xe G7 80EUs, i5-1140G7, Lenovo UMIS RPJTJ256MEE1OWX | MSI Summit E13 Flip Evo A11MT Iris Xe G7 96EUs, i7-1185G7, Phison 1TB SM2801T24GKBB4S-E162 | HP EliteBook x360 1030 G7 UHD Graphics 620, i7-10810U, Samsung SSD PM981a MZVLB512HBJQ | HP Elite Dragonfly Max Iris Xe G7 96EUs, i7-1185G7, Toshiba XG6 KXG60ZNV512G | Dell Latitude 5310-23VP6 UHD Graphics 620, i5-10310U, SK hynix BC511 HFM512GDHTNI-87A0B | |
|---|---|---|---|---|---|---|
| Noise | -9% | -8% | -13% | 5% | 1% | |
| arrêt / environnement * (dB) | 23 | 25.61 -11% | 24.5 -7% | 28.1 -22% | 24.9 -8% | 24.9 -8% |
| Idle Minimum * (dB) | 23 | 25.61 -11% | 24.7 -7% | 28.1 -22% | 24.9 -8% | 24.9 -8% |
| Idle Average * (dB) | 23.1 | 25.61 -11% | 24.7 -7% | 28.1 -22% | 24.9 -8% | 24.9 -8% |
| Idle Maximum * (dB) | 23.1 | 25.61 -11% | 26.4 -14% | 28.1 -22% | 24.9 -8% | 24.9 -8% |
| Load Average * (dB) | 37.1 | 40.14 -8% | 37.8 -2% | 35.1 5% | 29.7 20% | 30 19% |
| Witcher 3 ultra * (dB) | 40.6 | 41.4 -2% | 31.3 23% | 36 11% | ||
| Load Maximum * (dB) | 40.5 | 40.14 1% | 48.8 -20% | 37.6 7% | 31.3 23% | 36.3 10% |
* ... Moindre est la valeur, meilleures sont les performances
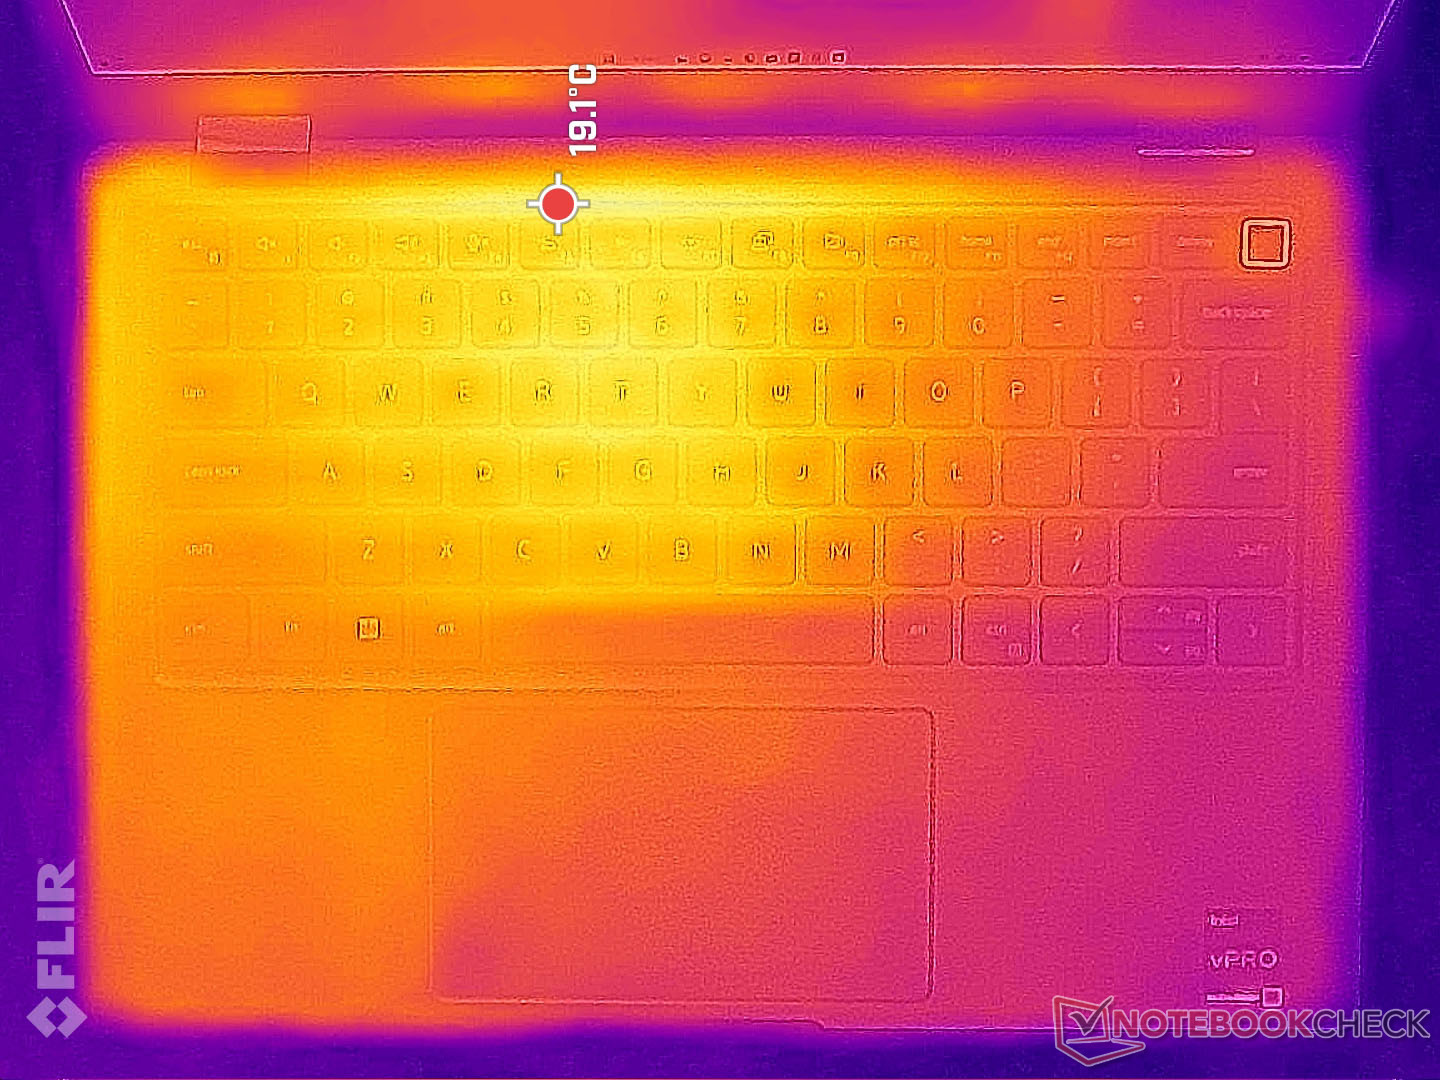
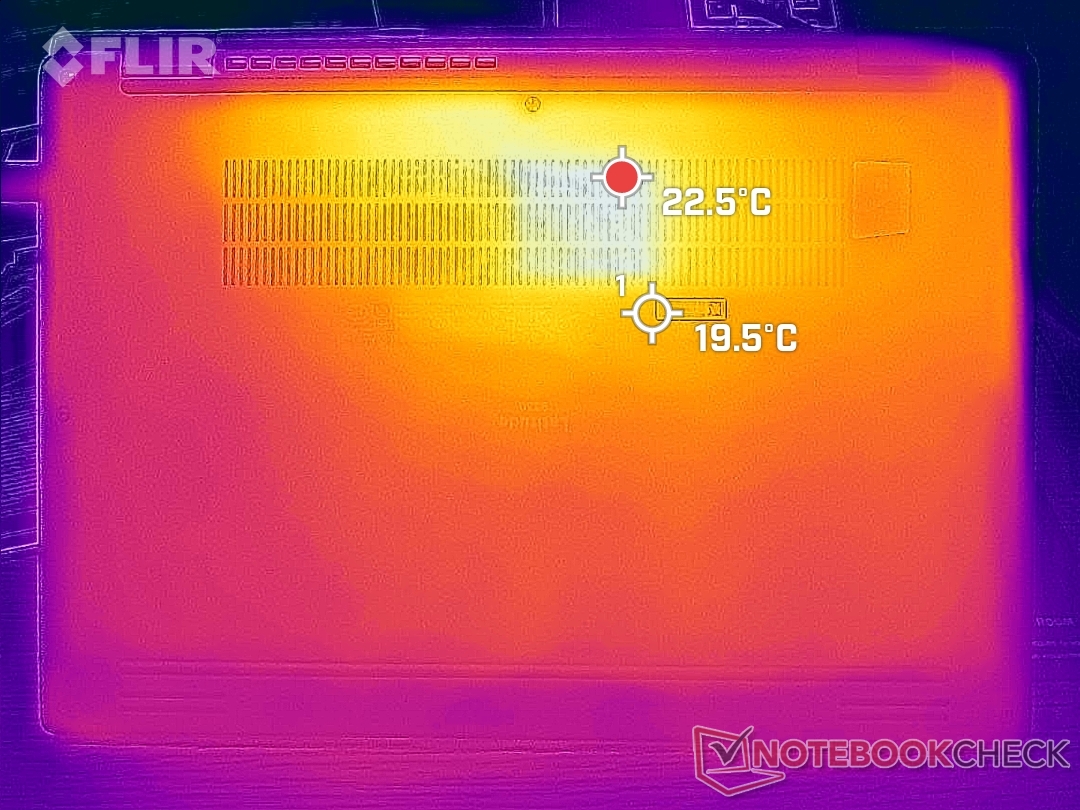
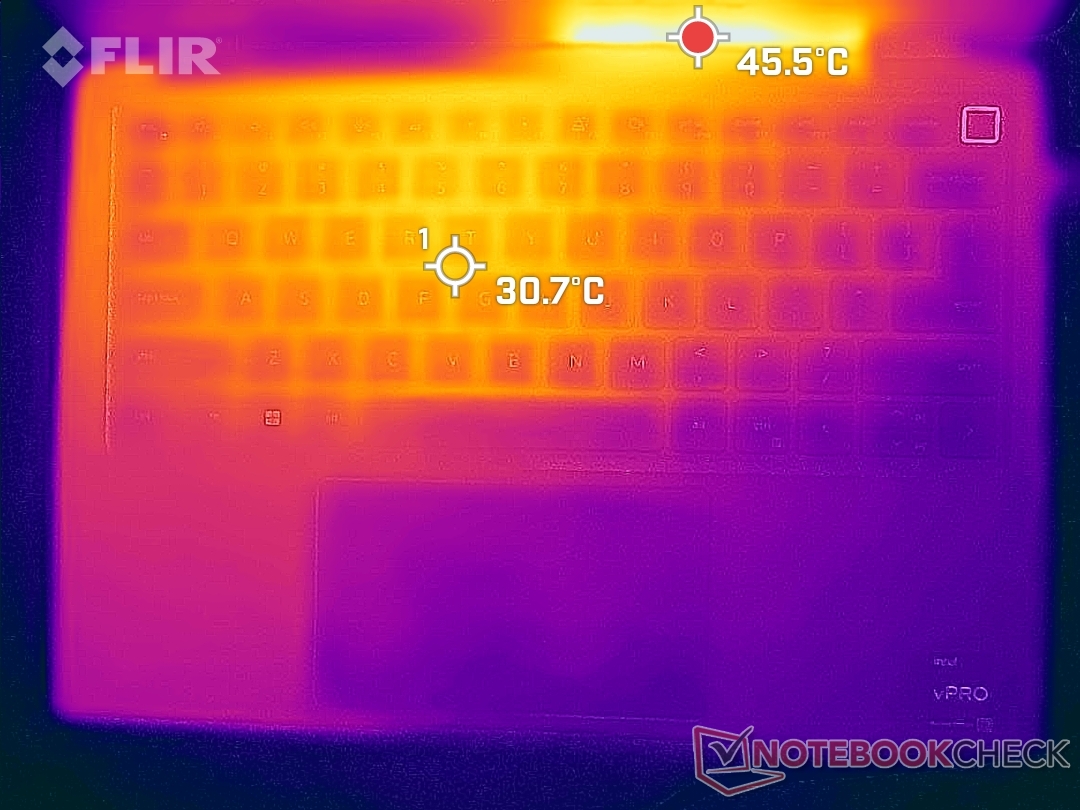
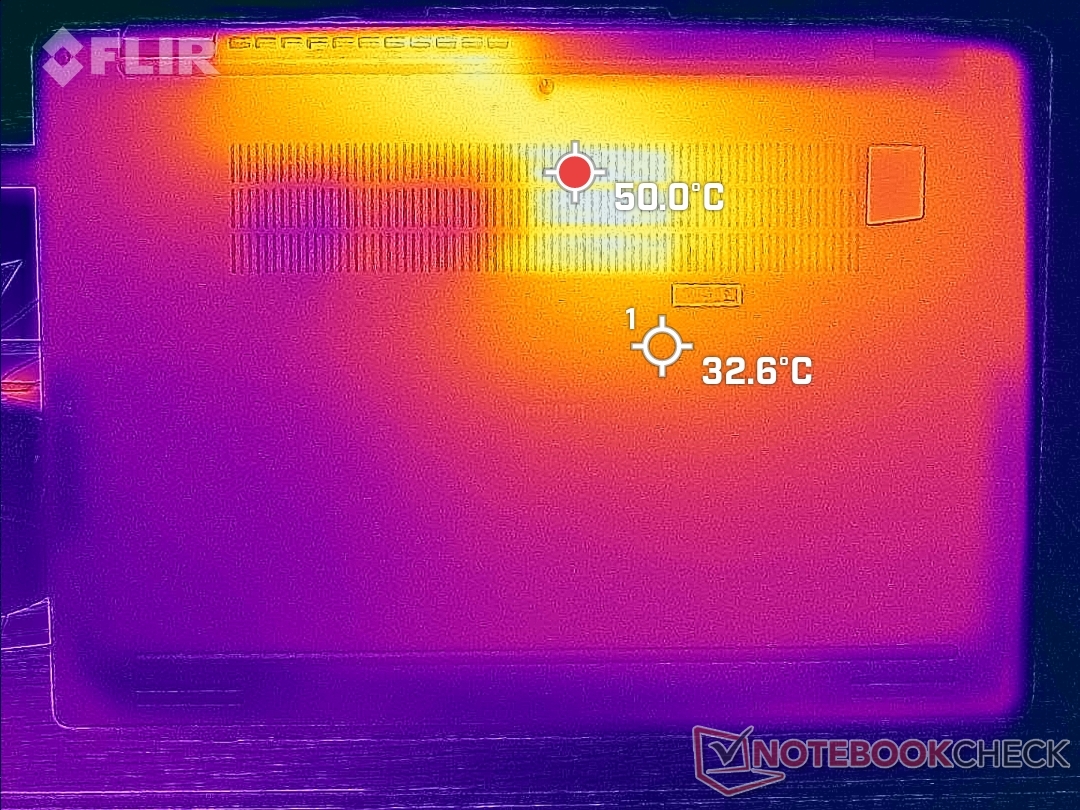
Température
Les températures de surface sont très basses lorsque les charges sont faibles, car la majeure partie du châssis est en métal. Cependant, lorsqu'ils sont soumis à des charges plus élevées, les points chauds peuvent atteindre jusqu'à 41 C et 50 C sur le dessus et le dessous, respectivement. Les points chauds se situent vers l'arrière du châssis, de sorte que le clavier et les repose-paumes restent plus frais pour une frappe confortable. Le concurrent Dragonfly Max concurrent, atteint des maxima similaires, tandis que le Summit E13 Flip peut devenir encore plus chaud, jusqu'à 57 °C.
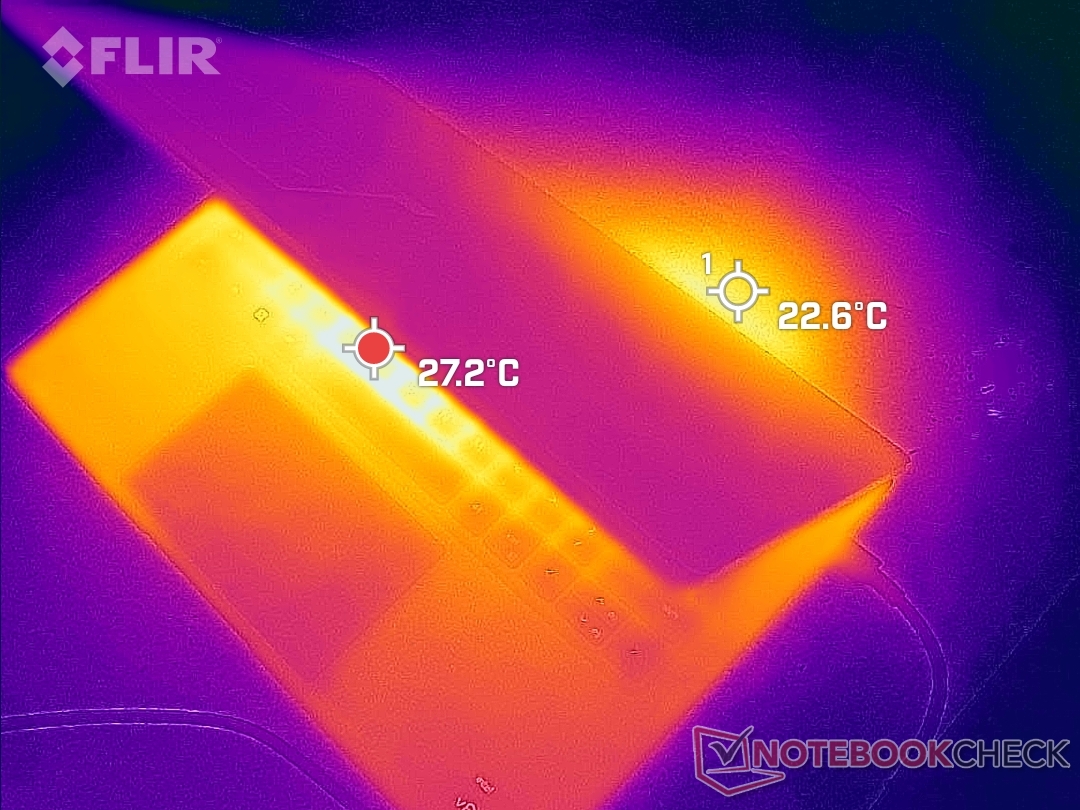
(±) La température maximale du côté supérieur est de 40.6 °C / 105 F, par rapport à la moyenne de 35.4 °C / 96 F, allant de 19.6 à 60 °C pour la classe Convertible.
(-) Le fond chauffe jusqu'à un maximum de 50.2 °C / 122 F, contre une moyenne de 36.9 °C / 98 F
(+) En utilisation inactive, la température moyenne du côté supérieur est de 23.5 °C / 74 F, par rapport à la moyenne du dispositif de 30.3 °C / 87 F.
(+) Les repose-poignets et le pavé tactile sont plus froids que la température de la peau avec un maximum de 28 °C / 82.4 F et sont donc froids au toucher.
(±) La température moyenne de la zone de l'appui-paume de dispositifs similaires était de 28 °C / 82.4 F (0 °C / #0 F).
| Dell Latitude 9330 Intel Core i7-1260U, Intel Iris Xe Graphics G7 96EUs | Lenovo ThinkPad X1 Titanium Yoga G1 20QB0016GE Intel Core i5-1140G7, Intel Iris Xe Graphics G7 80EUs | MSI Summit E13 Flip Evo A11MT Intel Core i7-1185G7, Intel Iris Xe Graphics G7 96EUs | HP EliteBook x360 1030 G7 Intel Core i7-10810U, Intel UHD Graphics 620 | HP Elite Dragonfly Max Intel Core i7-1185G7, Intel Iris Xe Graphics G7 96EUs | Dell Latitude 5310-23VP6 Intel Core i5-10310U, Intel UHD Graphics 620 | |
|---|---|---|---|---|---|---|
| Heat | -3% | -22% | -2% | -11% | 6% | |
| Maximum Upper Side * (°C) | 40.6 | 46.3 -14% | 52 -28% | 37 9% | 39.4 3% | 39 4% |
| Maximum Bottom * (°C) | 50.2 | 43.3 14% | 57.4 -14% | 47.2 6% | 50 -0% | 44.8 11% |
| Idle Upper Side * (°C) | 25 | 26.8 -7% | 30.4 -22% | 25.8 -3% | 31.6 -26% | 24.3 3% |
| Idle Bottom * (°C) | 27.6 | 28.3 -3% | 34.2 -24% | 32.6 -18% | 33.4 -21% | 25.6 7% |
* ... Moindre est la valeur, meilleures sont les performances
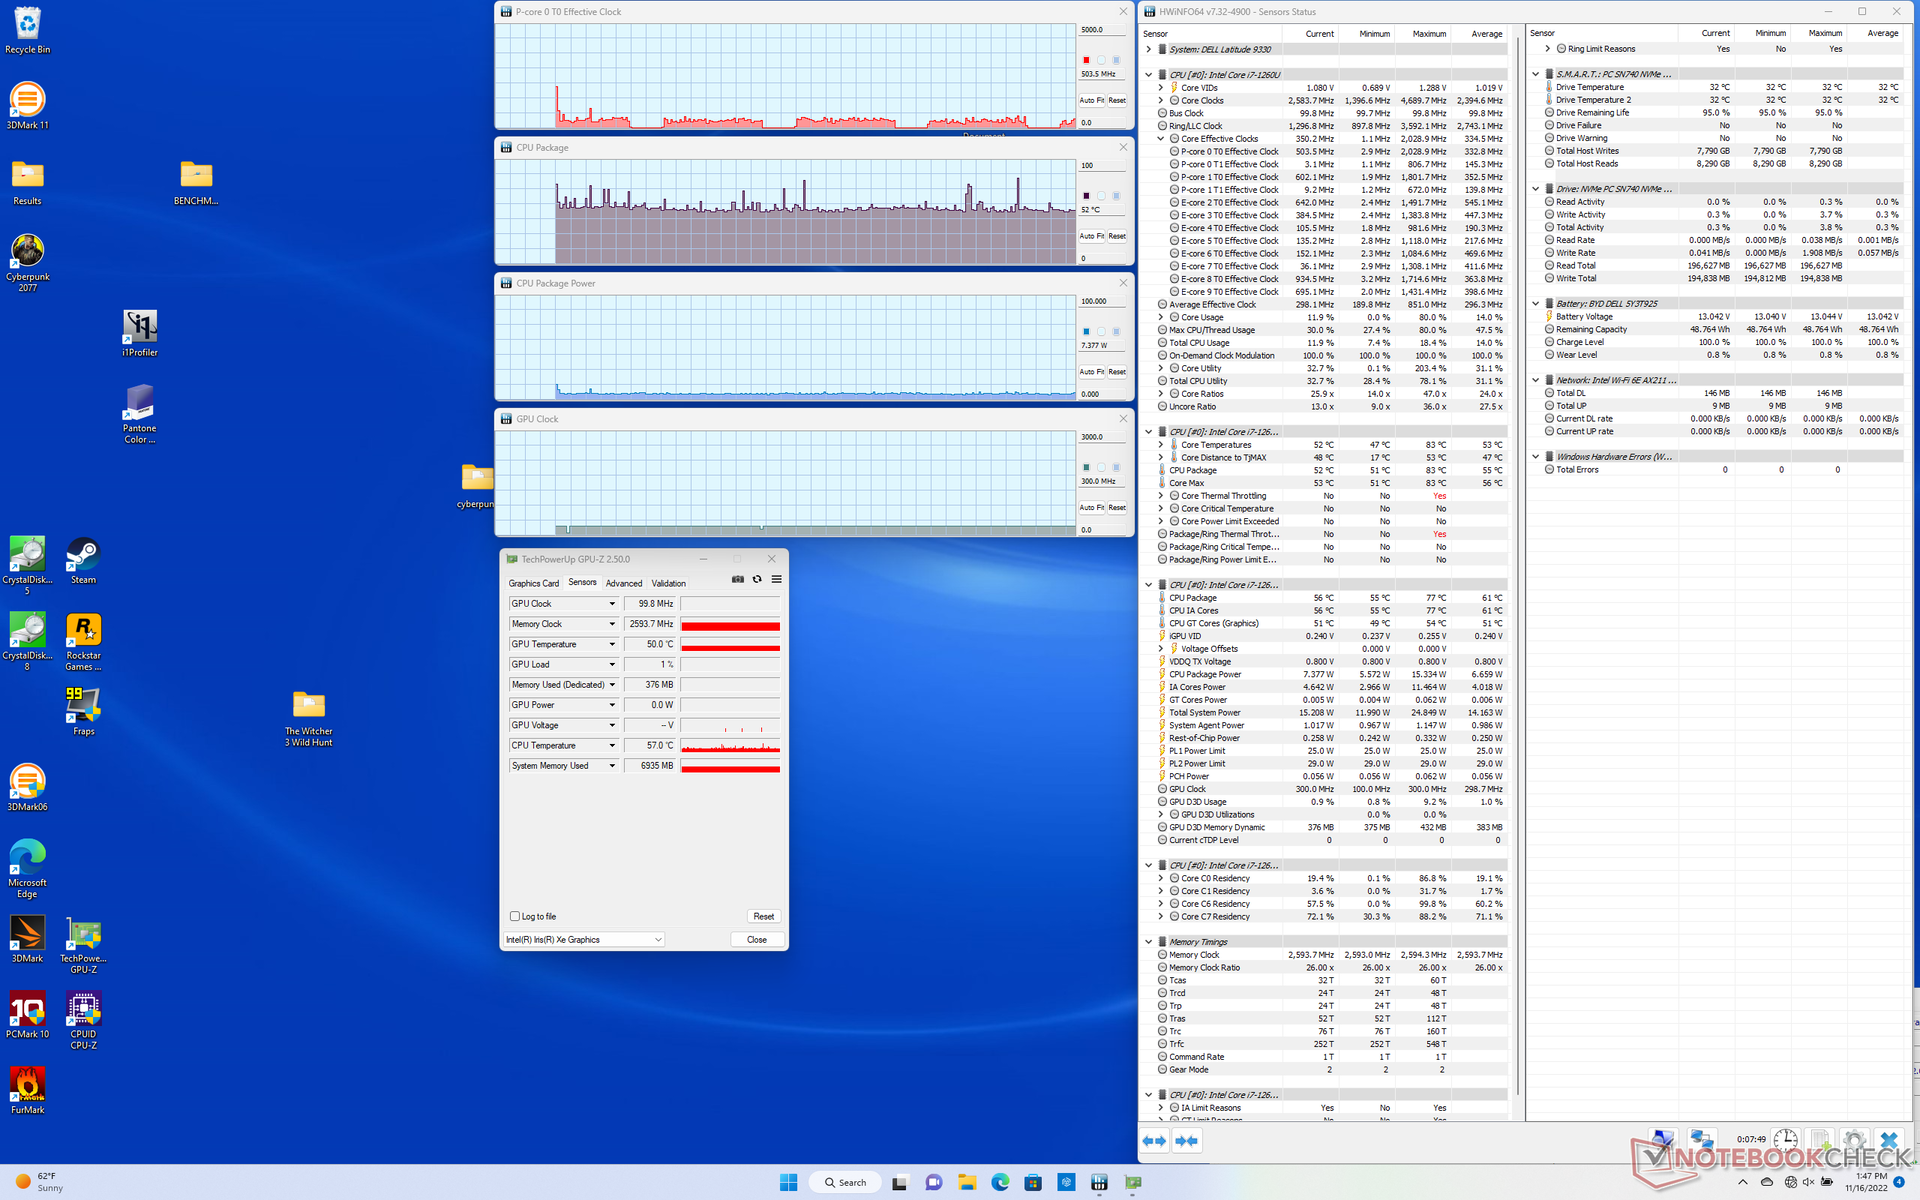
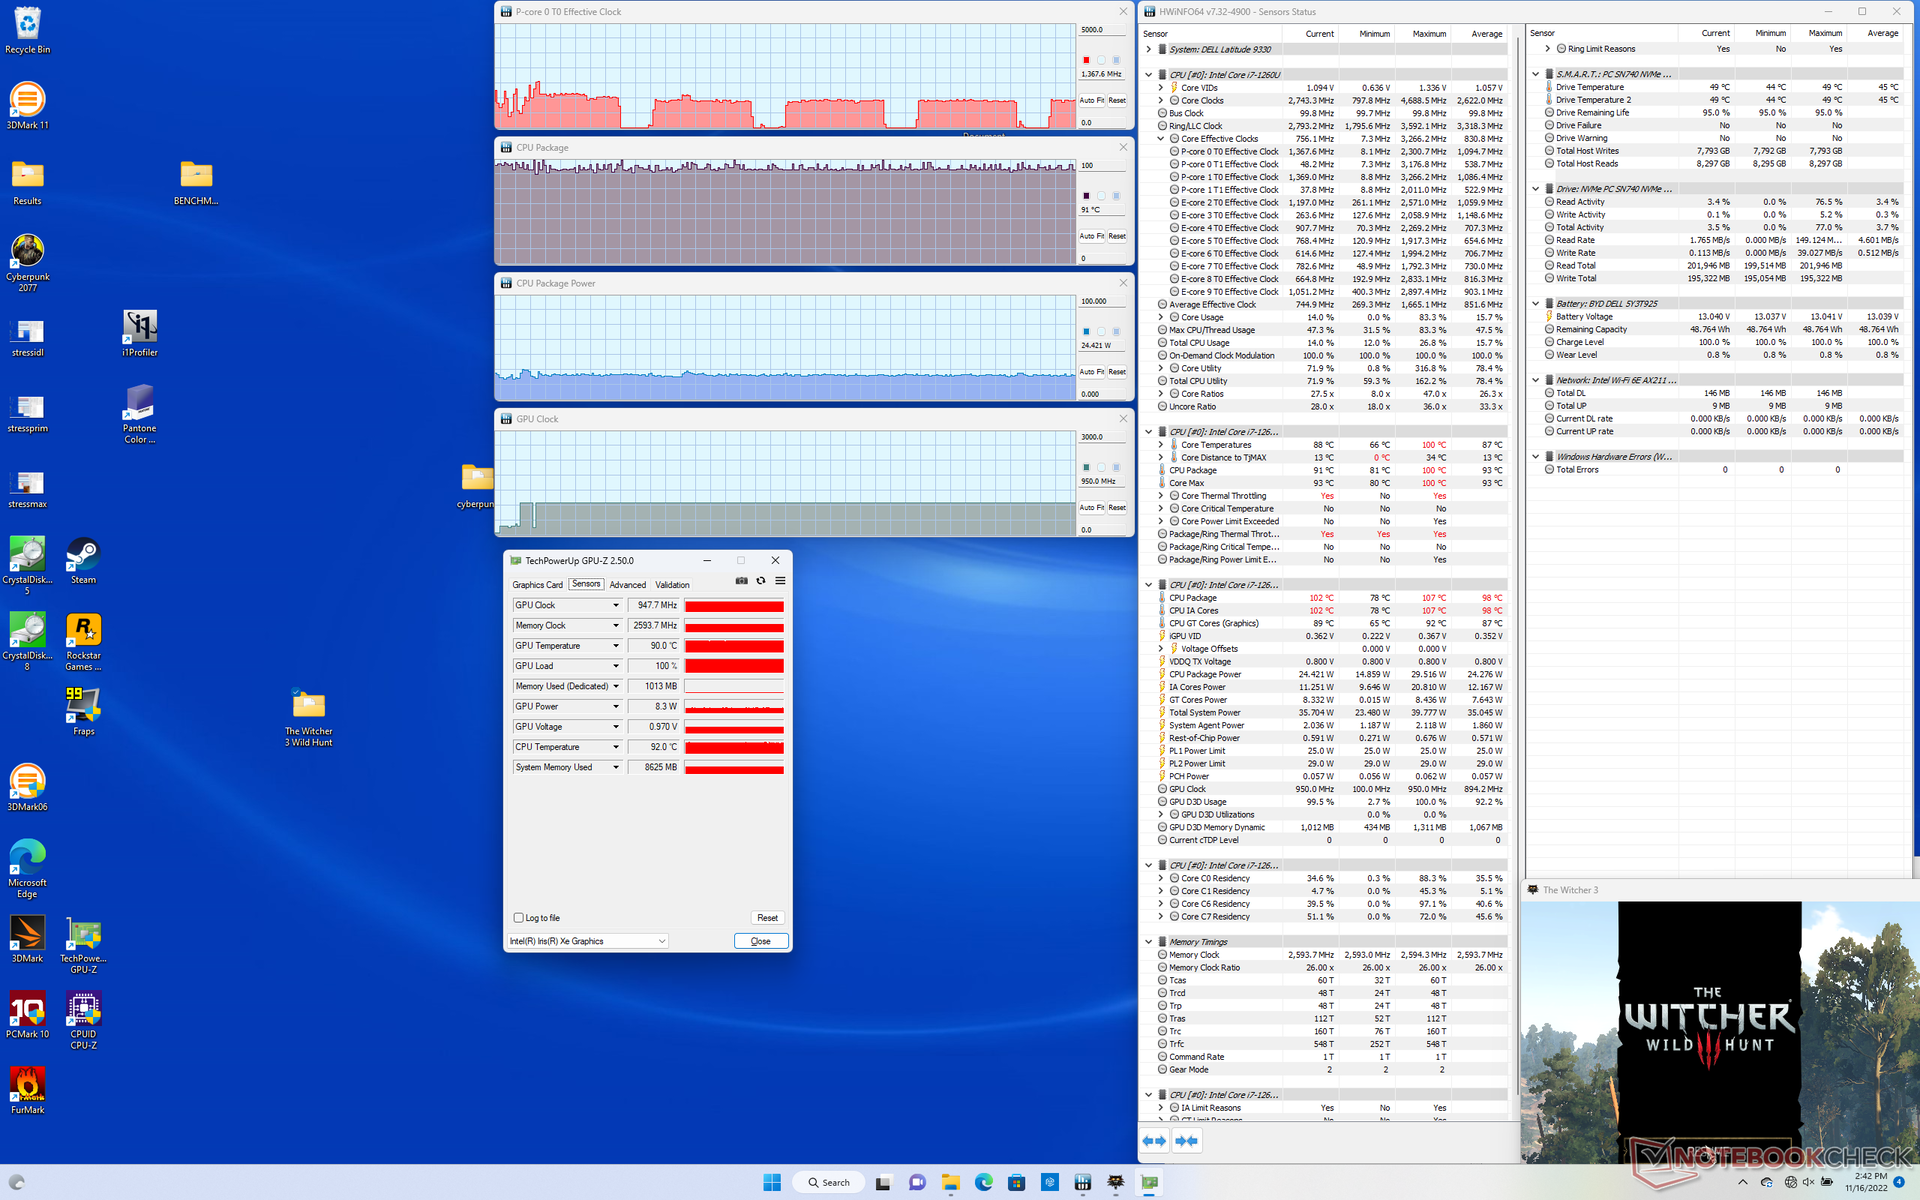
Test de stress
La température du CPU atteint régulièrement 90 C ou plus lors de l'exécution de charges exigeantes. Lors de l'exécution de Prime95, par exemple, le processeur monte presque instantanément à 99 C, 2,8 GHz et 29 W, respectivement, avant de redescendre rapidement et de se stabiliser à 2,4 GHz et 25 W afin de maintenir une température centrale de ~98 C. L'exécution de ce même test sur le Dragonfly Max avec le Core i7-1185G7 se traduirait par des fréquences d'horloge beaucoup plus lentes et une température centrale plus froide de seulement 1,5 GHz et 71 C, respectivement. Dell n'a pas peur de faire fonctionner le processeur à une température plus élevée que sur la plupart des autres modèles afin d'offrir des performances plus rapides.
La fréquence d'horloge et la température du GPU lorsqu'il fonctionne Witcher 3 pour représenter une charge graphique exigeante se stabiliseraient à 948 MHz et 91 C, respectivement, contre seulement 700 MHz et 61 C sur le HP susmentionné.
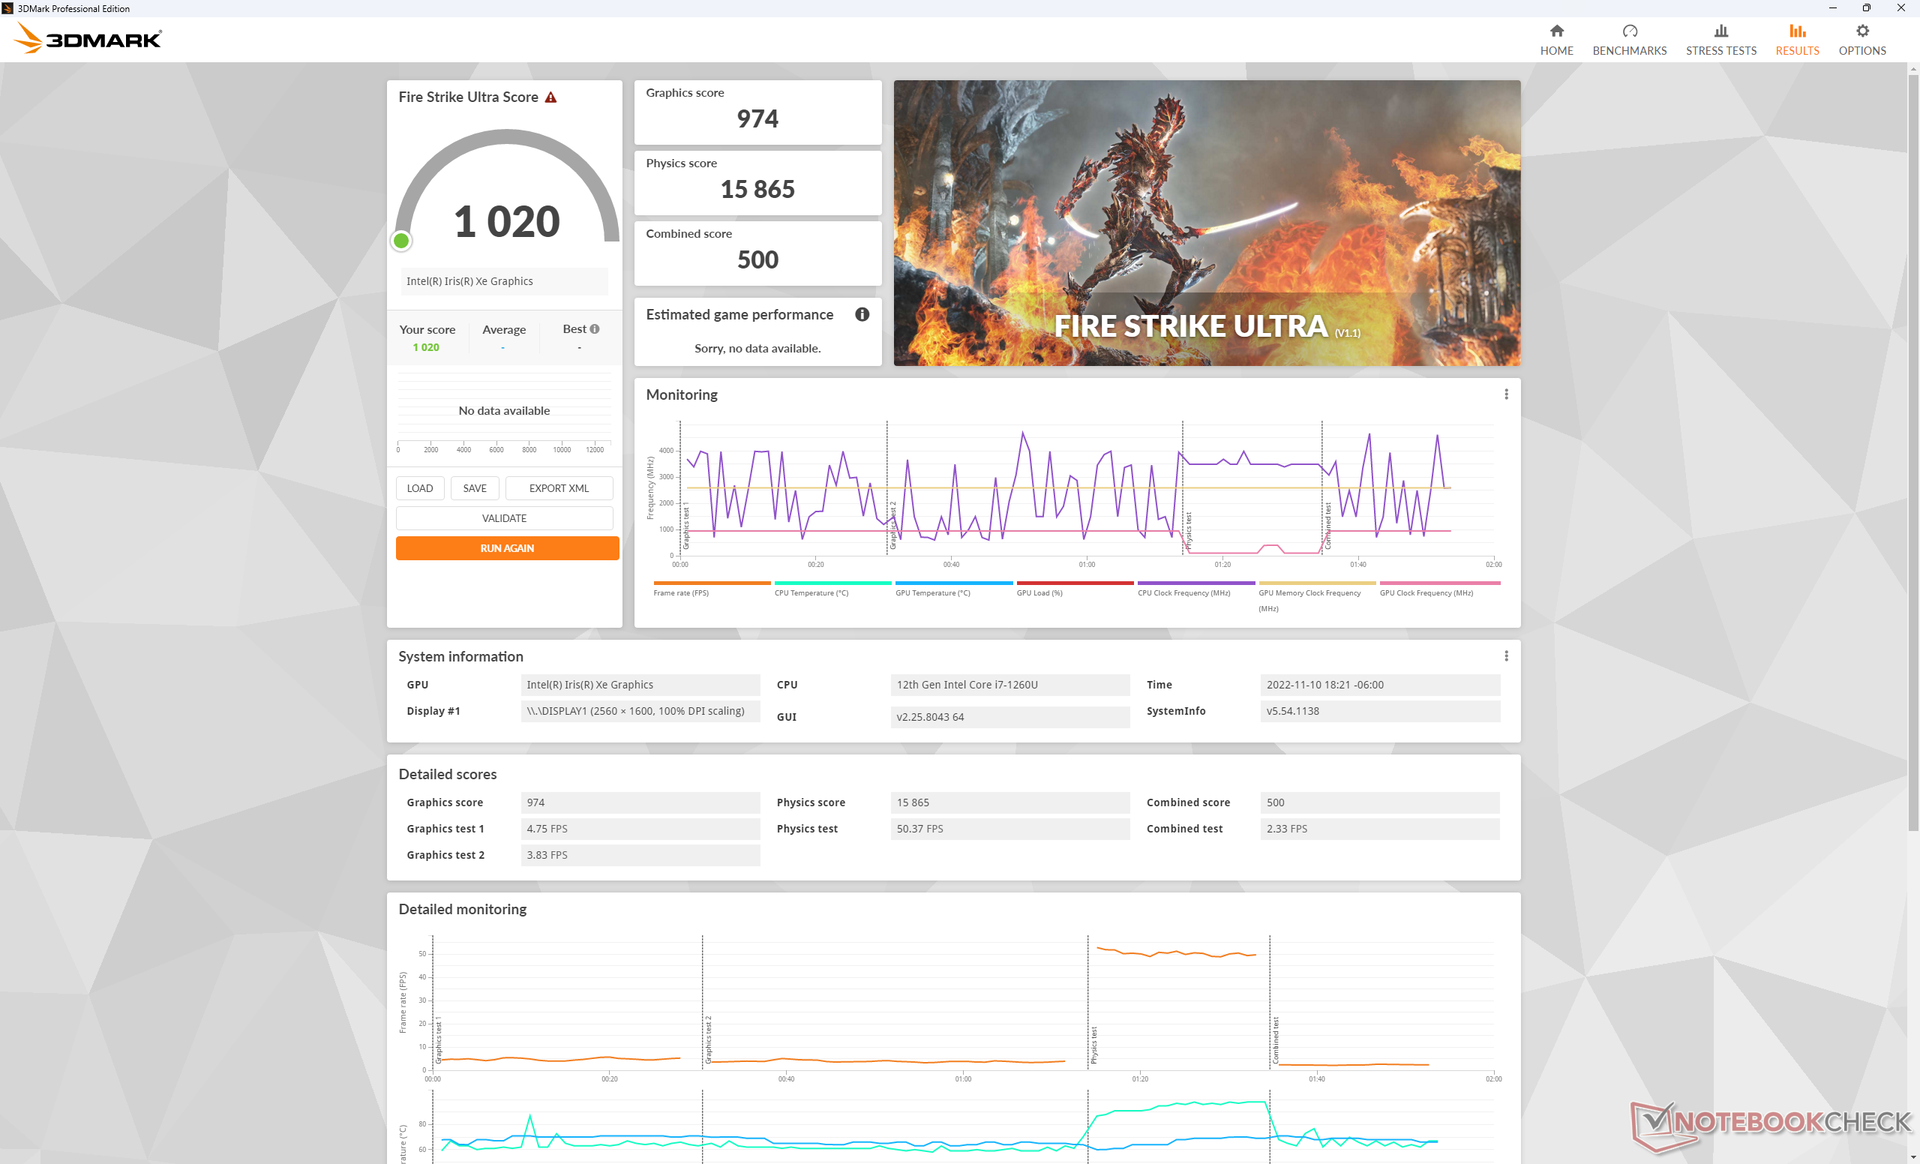
Le fonctionnement sur batterie limite les performances. Un test 3DMark 11 sur batterie donnerait des scores de physique et de graphisme de 7531 et 4193 points, respectivement, contre 12771 et 4820 points sur secteur.
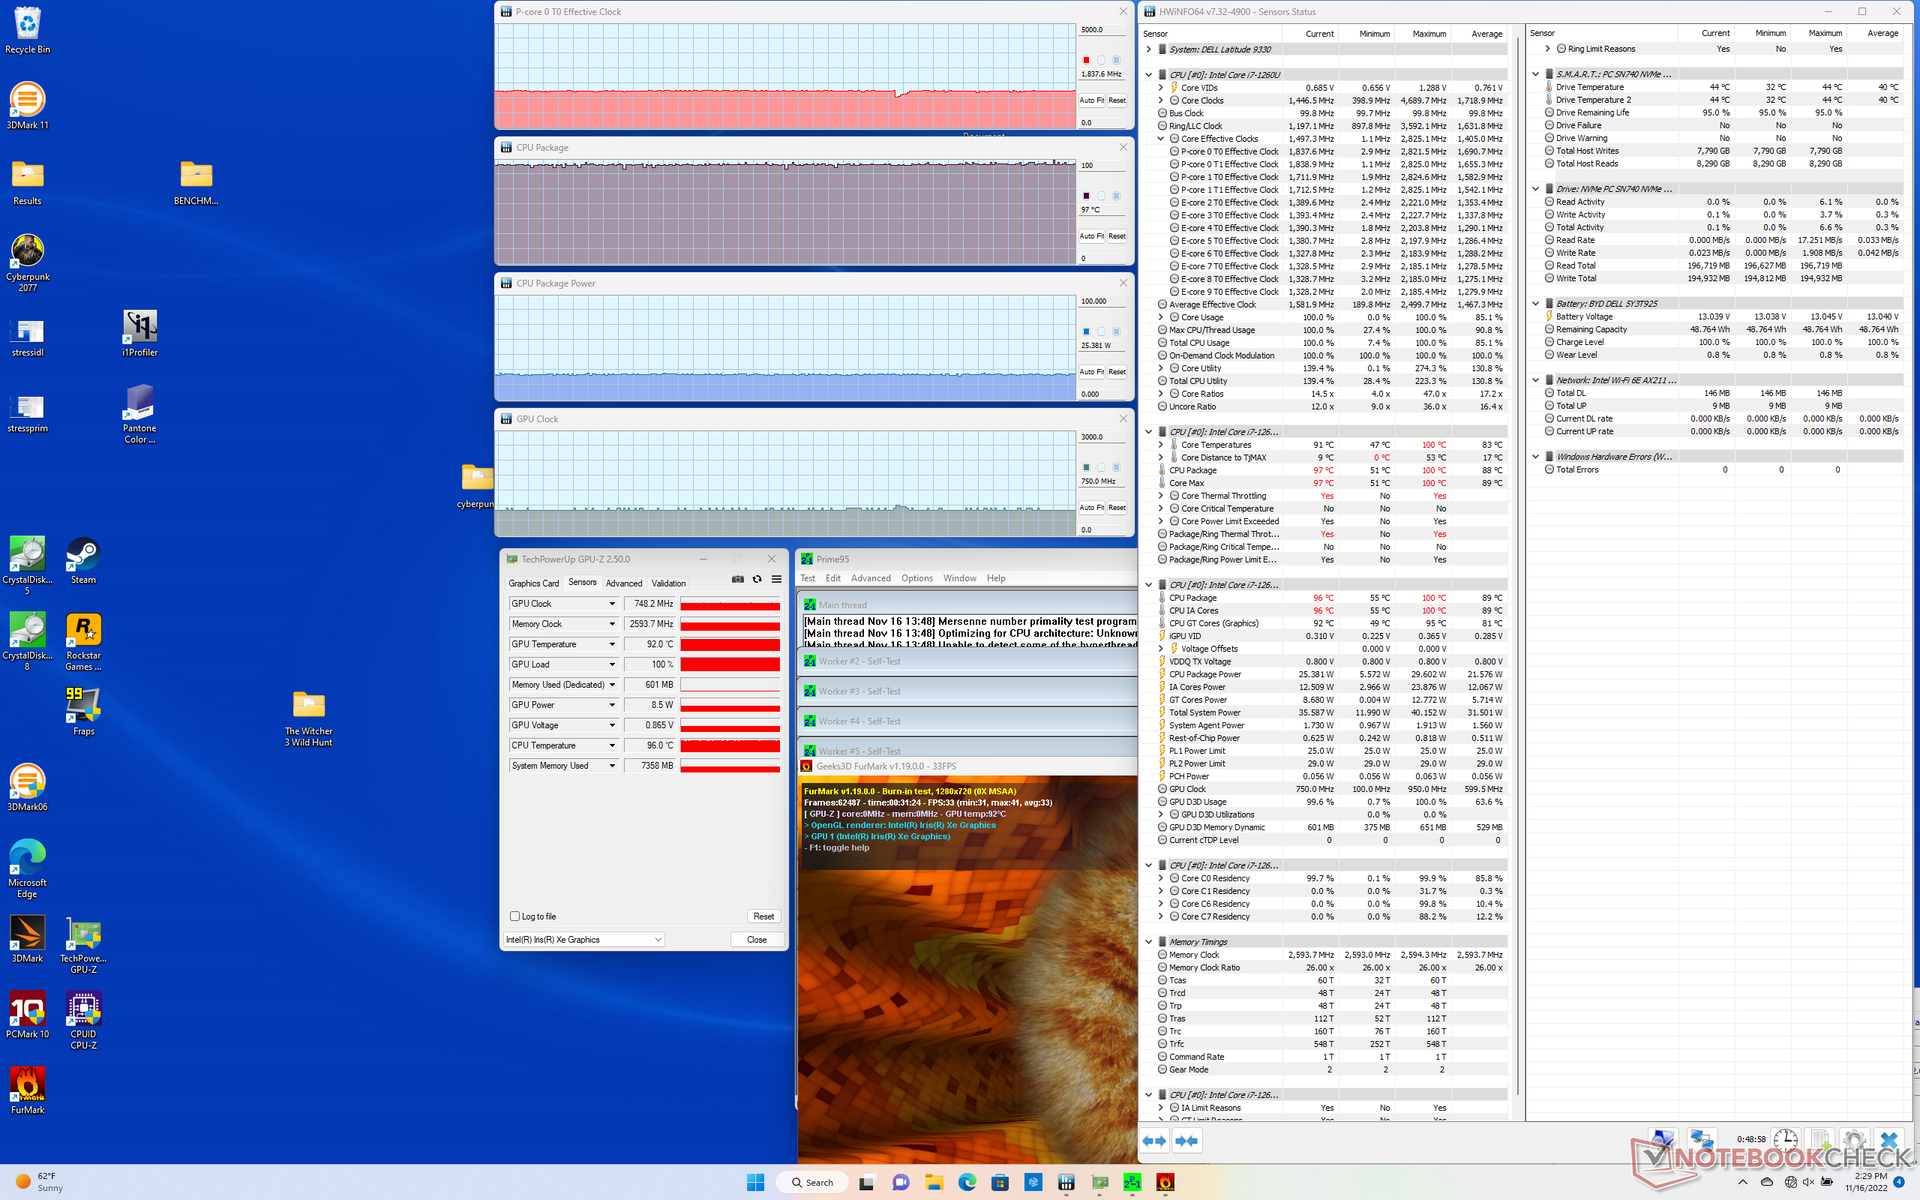
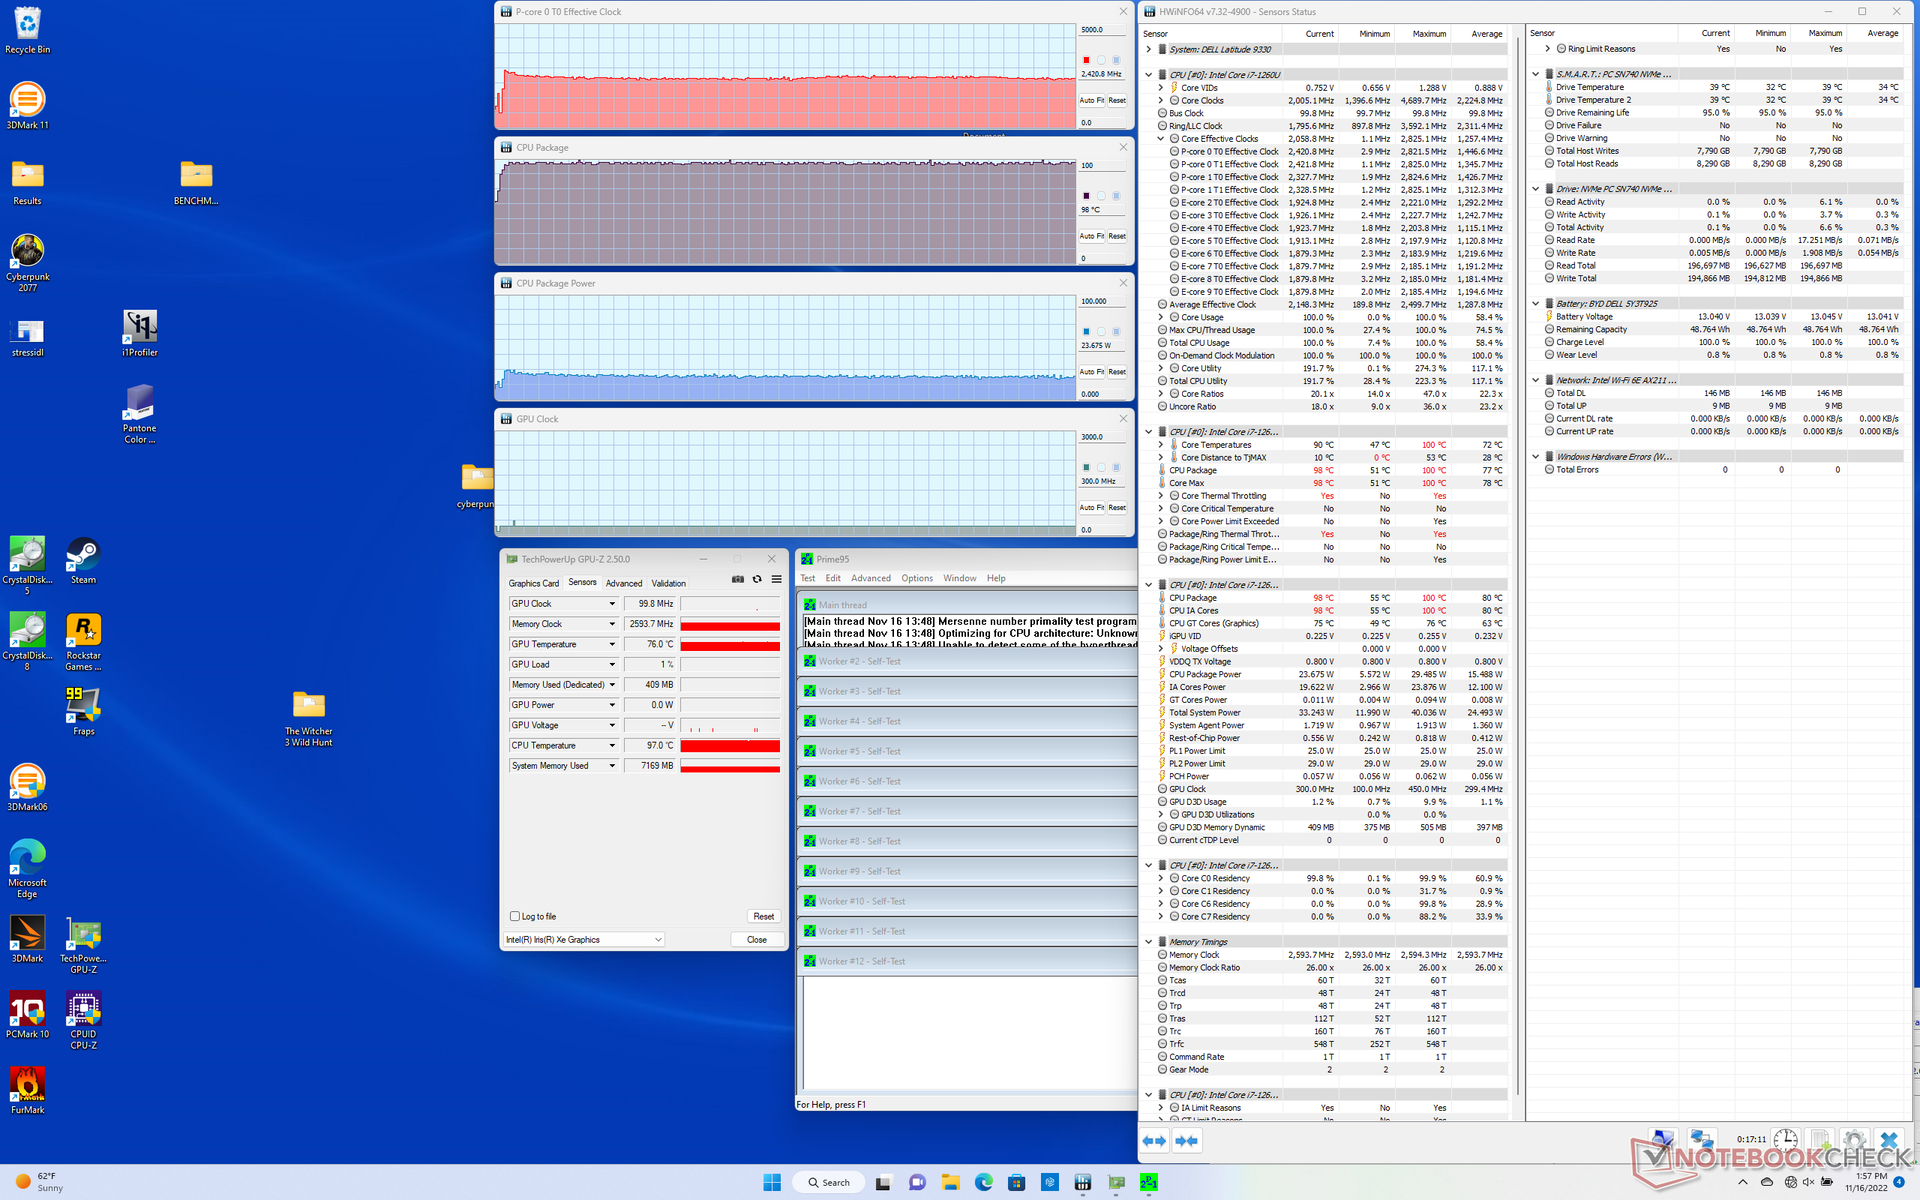
| Fréquence du CPU (GHz) | Fréquence du GPU (MHz) | Température moyenne du CPU (°C) | |
| Système au repos | -- | -- | 52 |
| Prime95 Stress | 2.4 | -- | 98 |
| Prime95 + FurMark Stress | 1.8 | 748 | 97 |
| Witcher 3 Stress | 1.4 | 948 | 91 |
Haut-parleurs
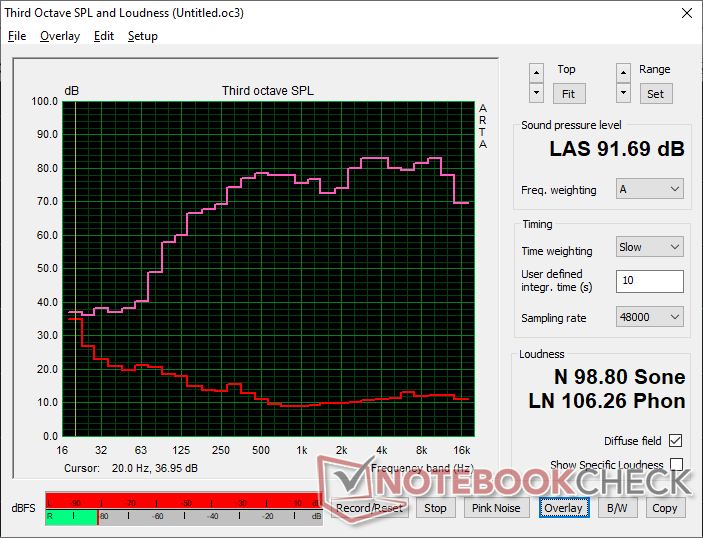
Dell a réussi à intégrer quatre haut-parleurs individuels avec une excellente reproduction audio malgré la petite taille de l'appareil. Le volume maximal est fort et clair, sans statique perceptible. Il est évident que les haut-parleurs internes ont été optimisés pour les conférences audio ou vidéo.
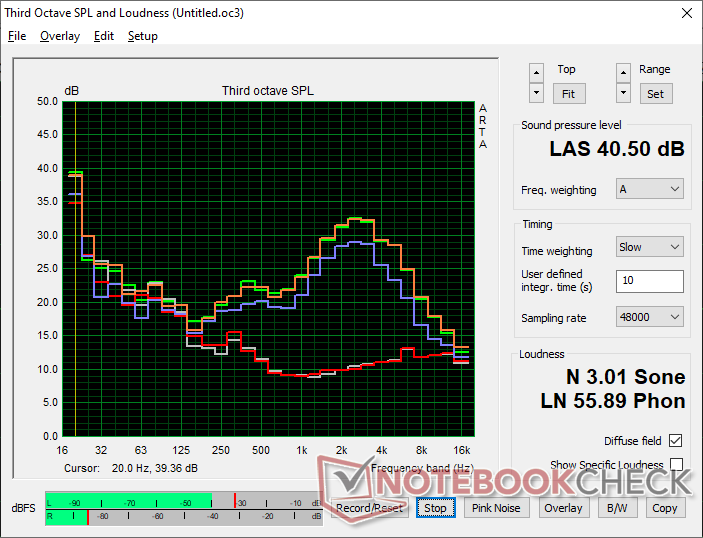
Dell Latitude 9330 analyse audio
(+) | les haut-parleurs peuvent jouer relativement fort (91.7# dB)
Basses 100 - 315 Hz
(±) | basse réduite - en moyenne 11.9% inférieure à la médiane
(+) | les basses sont linéaires (6.3% delta à la fréquence précédente)
Médiums 400 - 2000 Hz
(+) | médiane équilibrée - seulement 1.9% de la médiane
(+) | les médiums sont linéaires (2.7% delta à la fréquence précédente)
Aiguës 2 - 16 kHz
(+) | des sommets équilibrés - à seulement 3.4% de la médiane
(+) | les aigus sont linéaires (3.5% delta à la fréquence précédente)
Globalement 100 - 16 000 Hz
(+) | le son global est linéaire (9.2% différence à la médiane)
Par rapport à la même classe
» 4% de tous les appareils testés de cette catégorie étaient meilleurs, 1% similaires, 95% pires
» Le meilleur avait un delta de 6%, la moyenne était de 20%, le pire était de 57%.
Par rapport à tous les appareils testés
» 3% de tous les appareils testés étaient meilleurs, 1% similaires, 96% pires
» Le meilleur avait un delta de 4%, la moyenne était de 23%, le pire était de 134%.
Apple MacBook Pro 16 2021 M1 Pro analyse audio
(+) | les haut-parleurs peuvent jouer relativement fort (84.7# dB)
Basses 100 - 315 Hz
(+) | bonne basse - seulement 3.8% loin de la médiane
(+) | les basses sont linéaires (5.2% delta à la fréquence précédente)
Médiums 400 - 2000 Hz
(+) | médiane équilibrée - seulement 1.3% de la médiane
(+) | les médiums sont linéaires (2.1% delta à la fréquence précédente)
Aiguës 2 - 16 kHz
(+) | des sommets équilibrés - à seulement 1.9% de la médiane
(+) | les aigus sont linéaires (2.7% delta à la fréquence précédente)
Globalement 100 - 16 000 Hz
(+) | le son global est linéaire (4.6% différence à la médiane)
Par rapport à la même classe
» 0% de tous les appareils testés de cette catégorie étaient meilleurs, 0% similaires, 100% pires
» Le meilleur avait un delta de 5%, la moyenne était de 17%, le pire était de 45%.
Par rapport à tous les appareils testés
» 0% de tous les appareils testés étaient meilleurs, 0% similaires, 100% pires
» Le meilleur avait un delta de 4%, la moyenne était de 23%, le pire était de 134%.
Gestion de l'énergie
Consommation d'énergie - Haute performance par watt
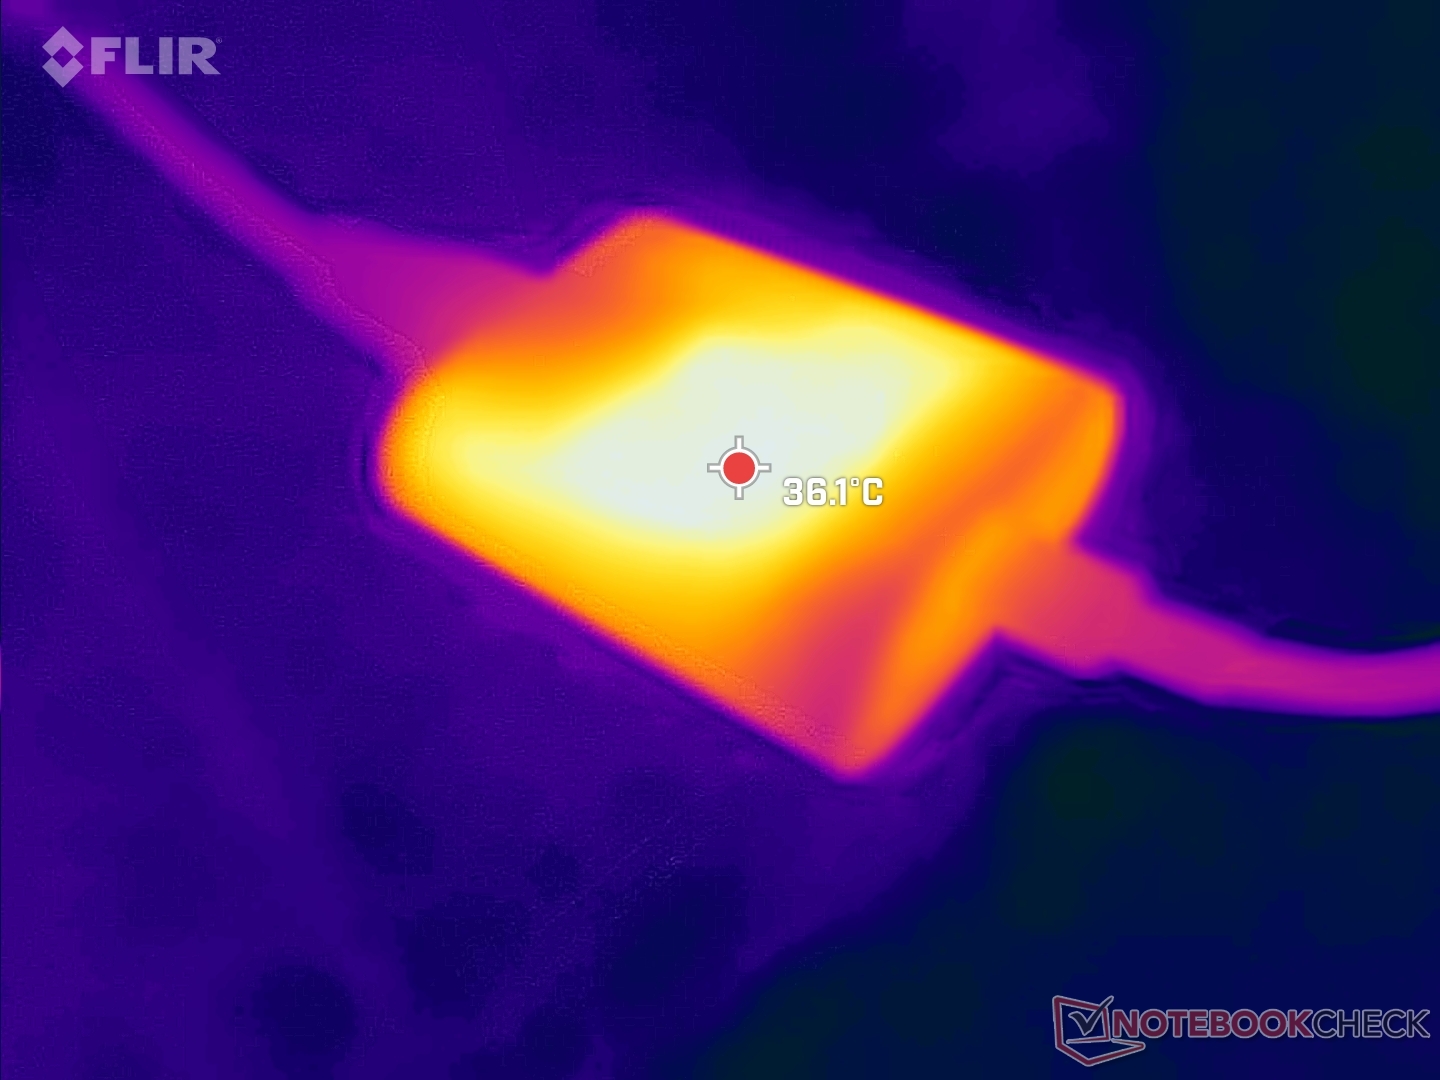
Le système est très économe en énergie, comme on peut l'attendre d'un ordinateur portable équipé d'un processeur Core U-series. Le plus remarquable est le fait que notre Latitude 9330 consomme environ 23 % moins d'énergie que l'ancien modèleLatitude 5310 lors de l'exécution d'applications gourmandes en GPU, tout en offrant des performances graphiques deux à trois fois supérieures. Les utilisateurs qui passent d'un processeur Intel de 10e génération ou d'un processeur plus ancien verront des gains significatifs en termes de performance par watt.
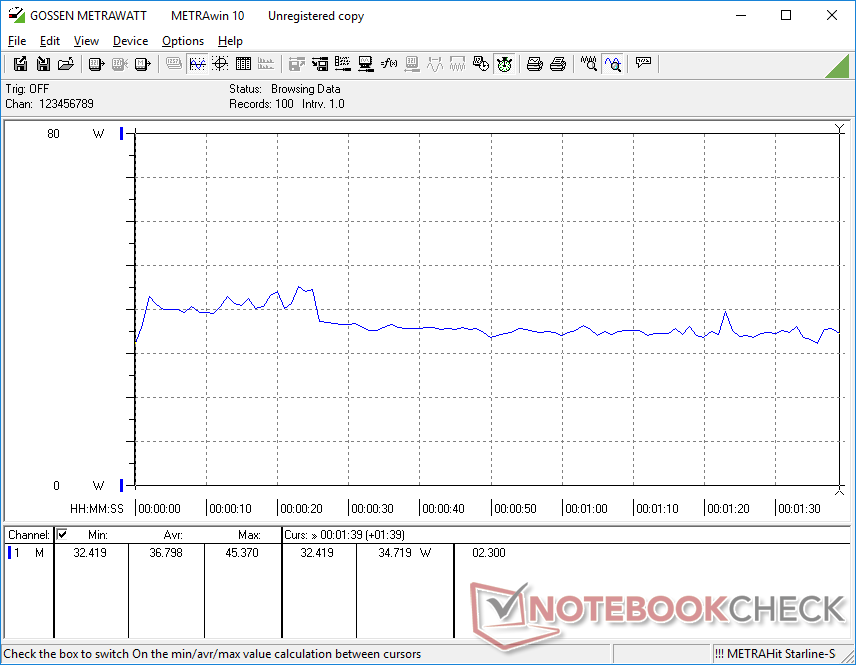
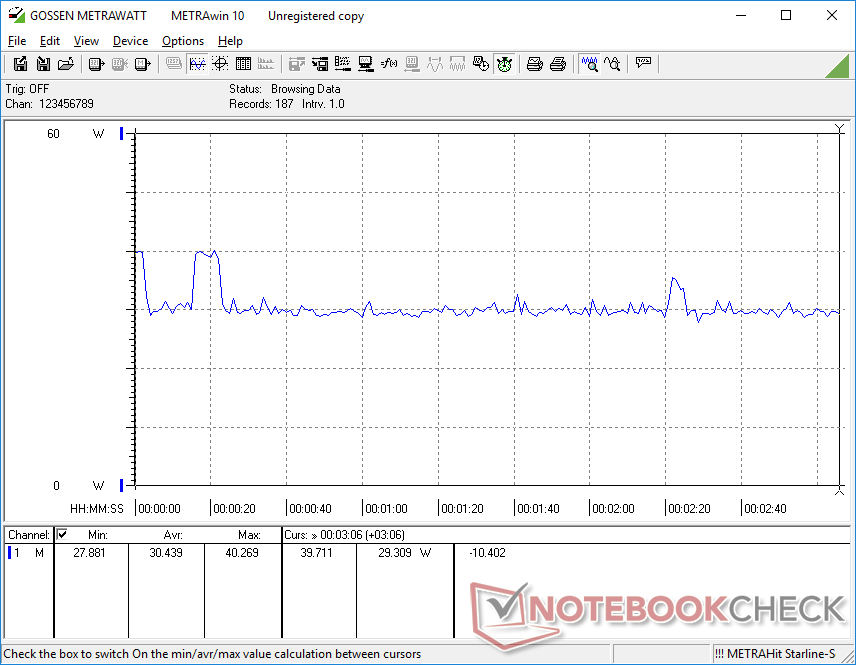
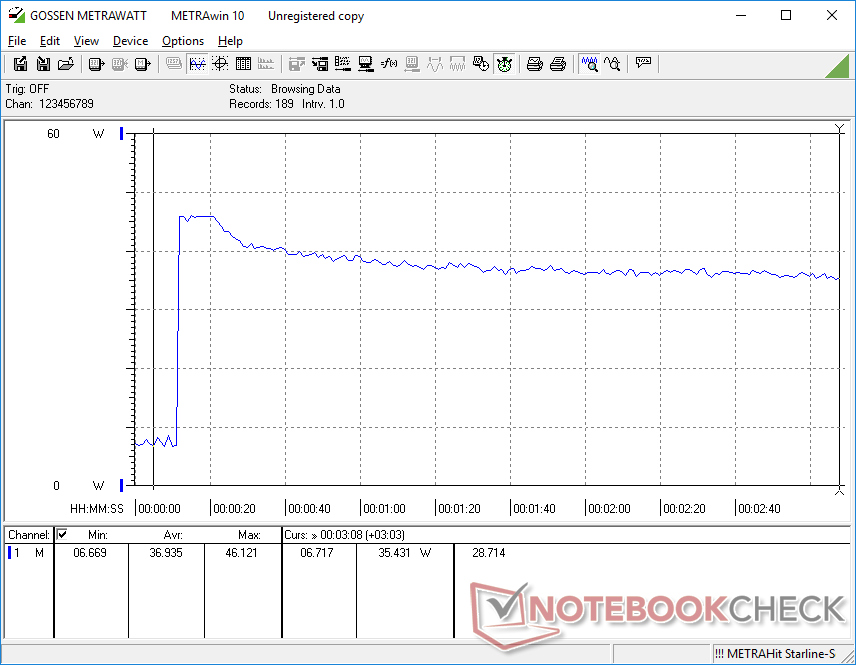
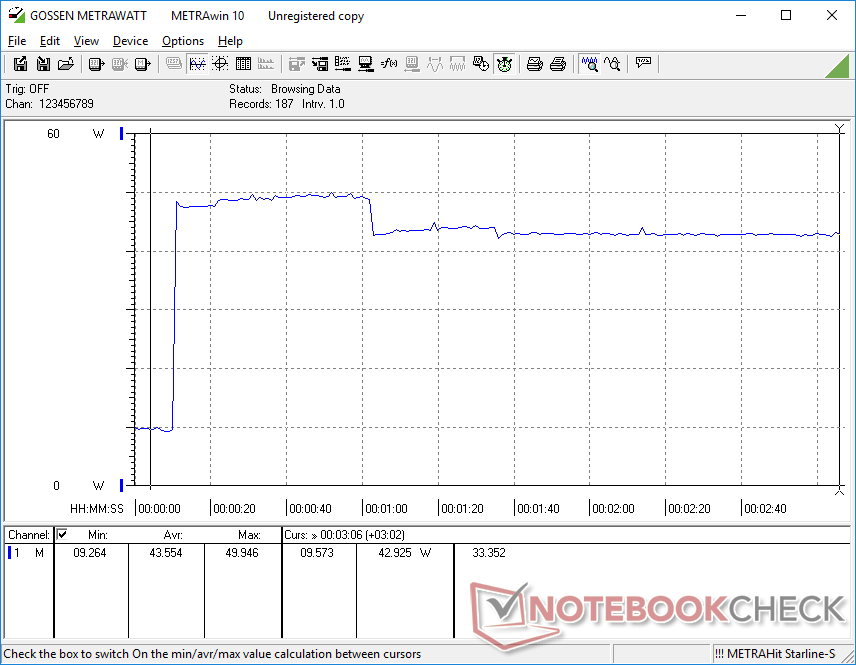
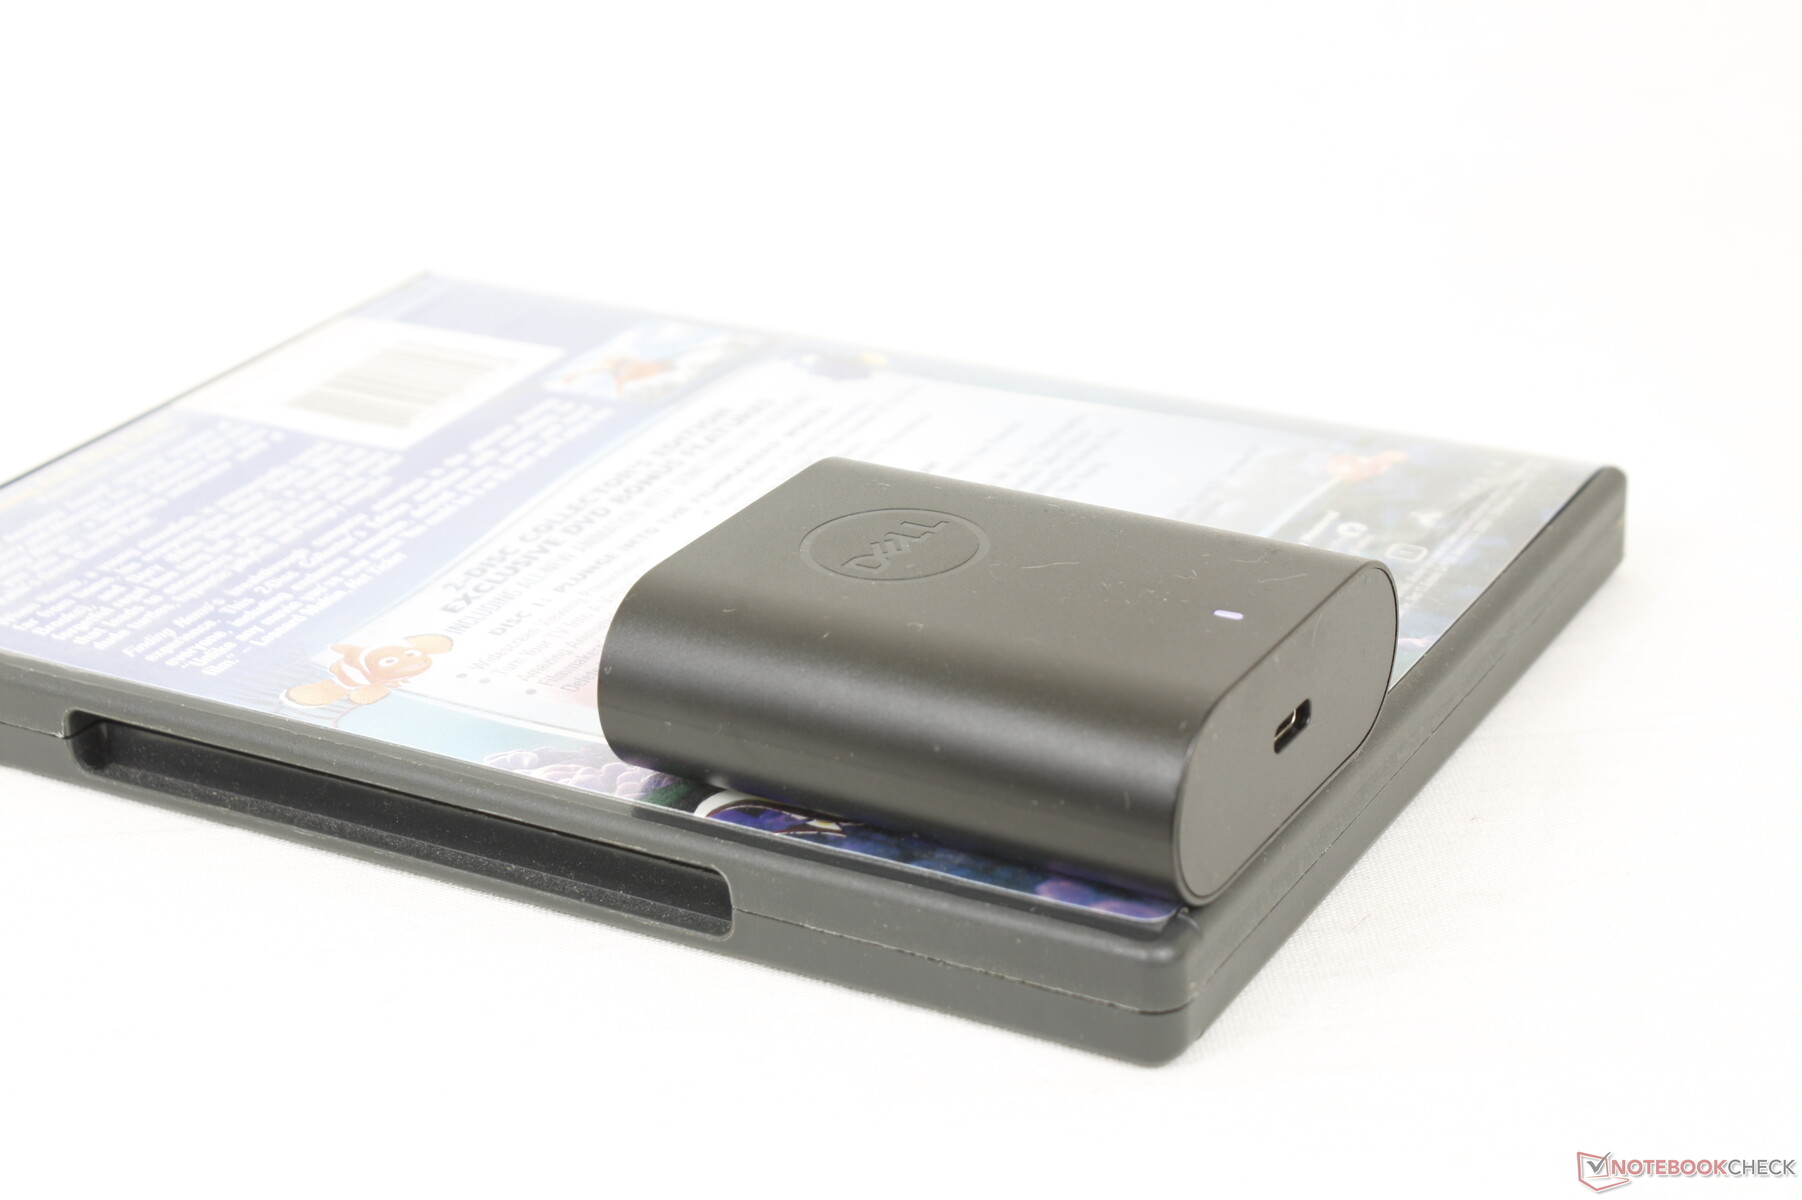
La consommation d'énergie est inférieure d'environ 27 % à celle de l'ordinateur équipé du Core i7-1255U Spectre x360 13.5 équipé du Core i7-1255U, lors de l'exécution du test Prime95. Nous avons pu mesurer un prélèvement maximal temporaire de 50 W sur le petit adaptateur secteur USB-C de 60 W (~6,7 x 5,3 x 2,3 cm) lorsque le processeur est utilisé à 100 %. La consommation d'énergie diminue avec le temps, comme le montrent nos graphiques ci-dessous, car les performances maximales de Turbo Boost ne sont pas indéfinies.
| Éteint/en veille | |
| Au repos | |
| Fortement sollicité |
|
Légende:
min: | |
| Dell Latitude 9330 i7-1260U, Iris Xe G7 96EUs, , IPS, 2560x1600, 13.3" | Lenovo ThinkPad X1 Titanium Yoga G1 20QB0016GE i5-1140G7, Iris Xe G7 80EUs, Lenovo UMIS RPJTJ256MEE1OWX, IPS LED, 2256x1504, 13.5" | MSI Summit E13 Flip Evo A11MT i7-1185G7, Iris Xe G7 96EUs, Phison 1TB SM2801T24GKBB4S-E162, IPS, 1920x1200, 13.4" | HP Elite Dragonfly Max i7-1185G7, Iris Xe G7 96EUs, Toshiba XG6 KXG60ZNV512G, IPS, 1920x1080, 13.3" | Dell Latitude 5310-23VP6 i5-10310U, UHD Graphics 620, SK hynix BC511 HFM512GDHTNI-87A0B, IPS, 1920x1080, 13.3" | Lenovo Yoga Slim 9 14IAP7 i7-1280P, Iris Xe G7 96EUs, Samsung PM9B1 1024GB MZAL41T0HBLB, OLED, 2880x1800, 14" | |
|---|---|---|---|---|---|---|
| Power Consumption | 11% | -23% | -5% | 5% | -98% | |
| Idle Minimum * (Watt) | 4.7 | 3.75 20% | 4.8 -2% | 2.9 38% | 2.9 38% | 11.8 -151% |
| Idle Average * (Watt) | 8.2 | 7.75 5% | 8.4 -2% | 9.9 -21% | 5.9 28% | 17.4 -112% |
| Idle Maximum * (Watt) | 8.4 | 8.69 -3% | 8.6 -2% | 10.4 -24% | 6.7 20% | 22.4 -167% |
| Load Average * (Watt) | 36.8 | 33.12 10% | 47.1 -28% | 37.1 -1% | 42 -14% | 53 -44% |
| Witcher 3 ultra * (Watt) | 30.4 | 28.7 6% | 51.6 -70% | 31.5 -4% | 43 -41% | 52.6 -73% |
| Load Maximum * (Watt) | 49.9 | 35.19 29% | 65.9 -32% | 58.8 -18% | 50 -0% | 71 -42% |
* ... Moindre est la valeur, meilleures sont les performances
Power Consumption Witcher 3 / Stresstest
Power Consumption external Monitor
Autonomie de la batterie - bonne pour une journée de travail
La capacité de la batterie est moyenne pour un subnotebook avec 50 Wh. Les durées d'exécution sont néanmoins bonnes avec près de 9,5 heures d'utilisation réelle du WLAN, soit un peu moins que sur le HP Dragonfly Max ou le MSI Summit E13 Flip.
Le chargement de la batterie vide à la pleine capacité prend environ 90 minutes.
| Dell Latitude 9330 i7-1260U, Iris Xe G7 96EUs, 50 Wh | Lenovo ThinkPad X1 Titanium Yoga G1 20QA001RGE i7-1160G7, Iris Xe G7 96EUs, 44.5 Wh | MSI Summit E13 Flip Evo A11MT i7-1185G7, Iris Xe G7 96EUs, 70 Wh | HP EliteBook x360 1030 G7 i7-10810U, UHD Graphics 620, 54 Wh | HP Elite Dragonfly Max i7-1185G7, Iris Xe G7 96EUs, 56 Wh | Dell Latitude 5310-23VP6 i5-10310U, UHD Graphics 620, 60 Wh | |
|---|---|---|---|---|---|---|
| Autonomie de la batterie | -14% | 11% | 37% | 43% | 18% | |
| Reader / Idle (h) | 15.4 | 21.1 37% | 30.9 101% | 28.7 86% | ||
| WiFi v1.3 (h) | 9.4 | 8.4 -11% | 11.2 19% | 10.3 10% | 11 17% | 11.1 18% |
| Load (h) | 2.3 | 1.9 -17% | 1.8 -22% | 2.3 0% | 2.9 26% | |
| H.264 (h) | 11.4 |
Points positifs
Points négatifs
Verdict - Exceller là où ça compte
Le Latitude 9330 2-en-1 est hautement optimisé pour les environnements de bureau avec des fonctionnalités qui ne sont pas disponibles sur la plupart des modèles centrés sur le consommateur, y compris le XPS 13. La qualité de construction et la rigidité sont parmi les meilleures que nous ayons vues pour un convertible ultrafin de 13 pouces, ce qui nous donne davantage confiance dans la longévité et la fiabilité du modèle. Si vous décidez d'investir dans le Latitude 9330, il est plus que probable qu'il vous durera plusieurs années.
Bien que le système Dell soit bon à excellent dans la plupart des domaines, il commence à prendre du retard dans quelques autres Les modèles concurrents de HP sont livrés avec des options d'affichage de 1000 nits et des webcams de 5 MP alors que le Latitude 9330 est bloqué à 500 nits et 2 MP. L'absence de ports USB-A et HDMI risque également d'irriter de nombreux utilisateurs. Préparez-vous à un bruit de ventilateur sensiblement plus fort si vous avez l'intention de faire tourner des charges exigeantes sur le Dell.
En dehors de quelques spécifications moyennes, le Dell Latitude 9330 2-en-1 est notre meilleur convertible d'affaires à recommander si vous voulez quelque chose qui durera plusieurs années.
Les autres inconvénients, tels que les performances graphiques inférieures, les températures plus élevées du cœur et l'absence de prise en charge des disques SSD M.2 2280, sont relativement mineurs si l'on considère le public cible des utilisateurs professionnels ou des entreprises. Nous aimerions absolument voir des options d'affichage à taux de rafraîchissement plus élevé avec des temps de réponse noir-blanc plus rapides à l'avenir, car le taux de trame plus fluide améliorerait considérablement l'expérience de l'utilisateur de l'écran tactile.
Prix et disponibilité
Delll'ordinateur Latitude 9330 2-en-1 est désormais disponible à partir de 2065 dollars américains et jusqu'à plus de 2700 dollars américains s'il est entièrement configuré.
Dell Latitude 9330
- 11/18/2022 v7 (old)
Allen Ngo
Price comparison

