Test du Lenovo ThinkPad P43s (i7-8565U, Quadro P520, FHD) : écran et performances décevants pour la station de travail
Note | Date | Modèle | Poids | Épaisseur | Taille | Résolution | Prix |
|---|---|---|---|---|---|---|---|
| 80.1 % v7 (old) | 10/19 | Lenovo ThinkPad P43s-20RH001FGE i7-8565U, Quadro P520 | 1.5 kg | 18.9 mm | 14.00" | 1920x1080 | |
| 81 % v7 (old) | 10/19 | HP ZBook 14u G6 6TP71EA i7-8565U, Radeon Pro WX 3200 | 1.5 kg | 17.9 mm | 14.00" | 1920x1080 |

| SD Card Reader | |
| average JPG Copy Test (av. of 3 runs) | |
| Moyenne de la classe Workstation (49.6 - 681, n=14, 2 dernières années) | |
| Dell Precision 5530 2-in-1 (Toshiba Exceria Pro M501 UHS-II) | |
| Lenovo ThinkPad P43s-20RH001FGE (Toshiba Exceria Pro M501 64 GB UHS-II) | |
| Lenovo ThinkPad T490-20N3S02L00 (Toshiba Exceria Pro M501) | |
| maximum AS SSD Seq Read Test (1GB) | |
| Moyenne de la classe Workstation (87.6 - 1455, n=14, 2 dernières années) | |
| Dell Precision 5530 2-in-1 (Toshiba Exceria Pro M501 UHS-II) | |
| Lenovo ThinkPad T490-20N3S02L00 (Toshiba Exceria Pro M501) | |
| Lenovo ThinkPad P43s-20RH001FGE (Toshiba Exceria Pro M501 64 GB UHS-II) | |
| |||||||||||||||||||||||||
Homogénéité de la luminosité: 89 %
Valeur mesurée au centre, sur batterie: 232 cd/m²
Contraste: 1365:1 (Valeurs des noirs: 0.17 cd/m²)
ΔE ColorChecker Calman: 5.9 | ∀{0.5-29.43 Ø4.73}
calibrated: 4.4
ΔE Greyscale Calman: 4.8 | ∀{0.09-98 Ø4.97}
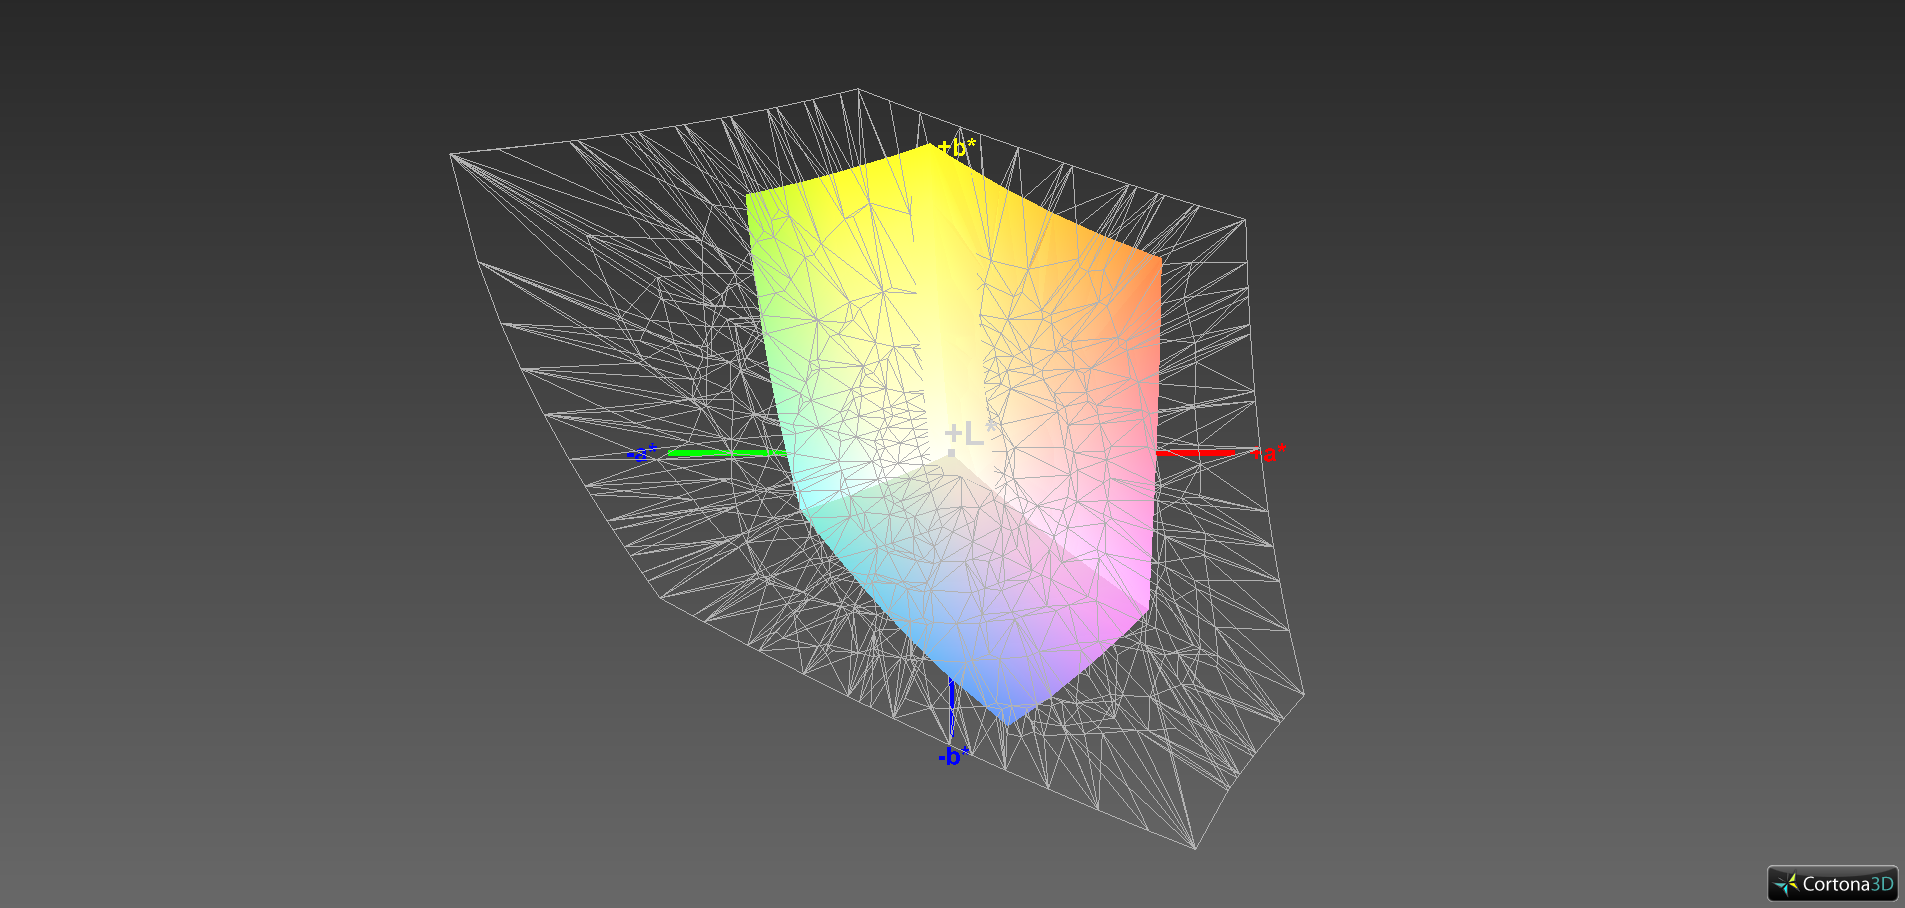
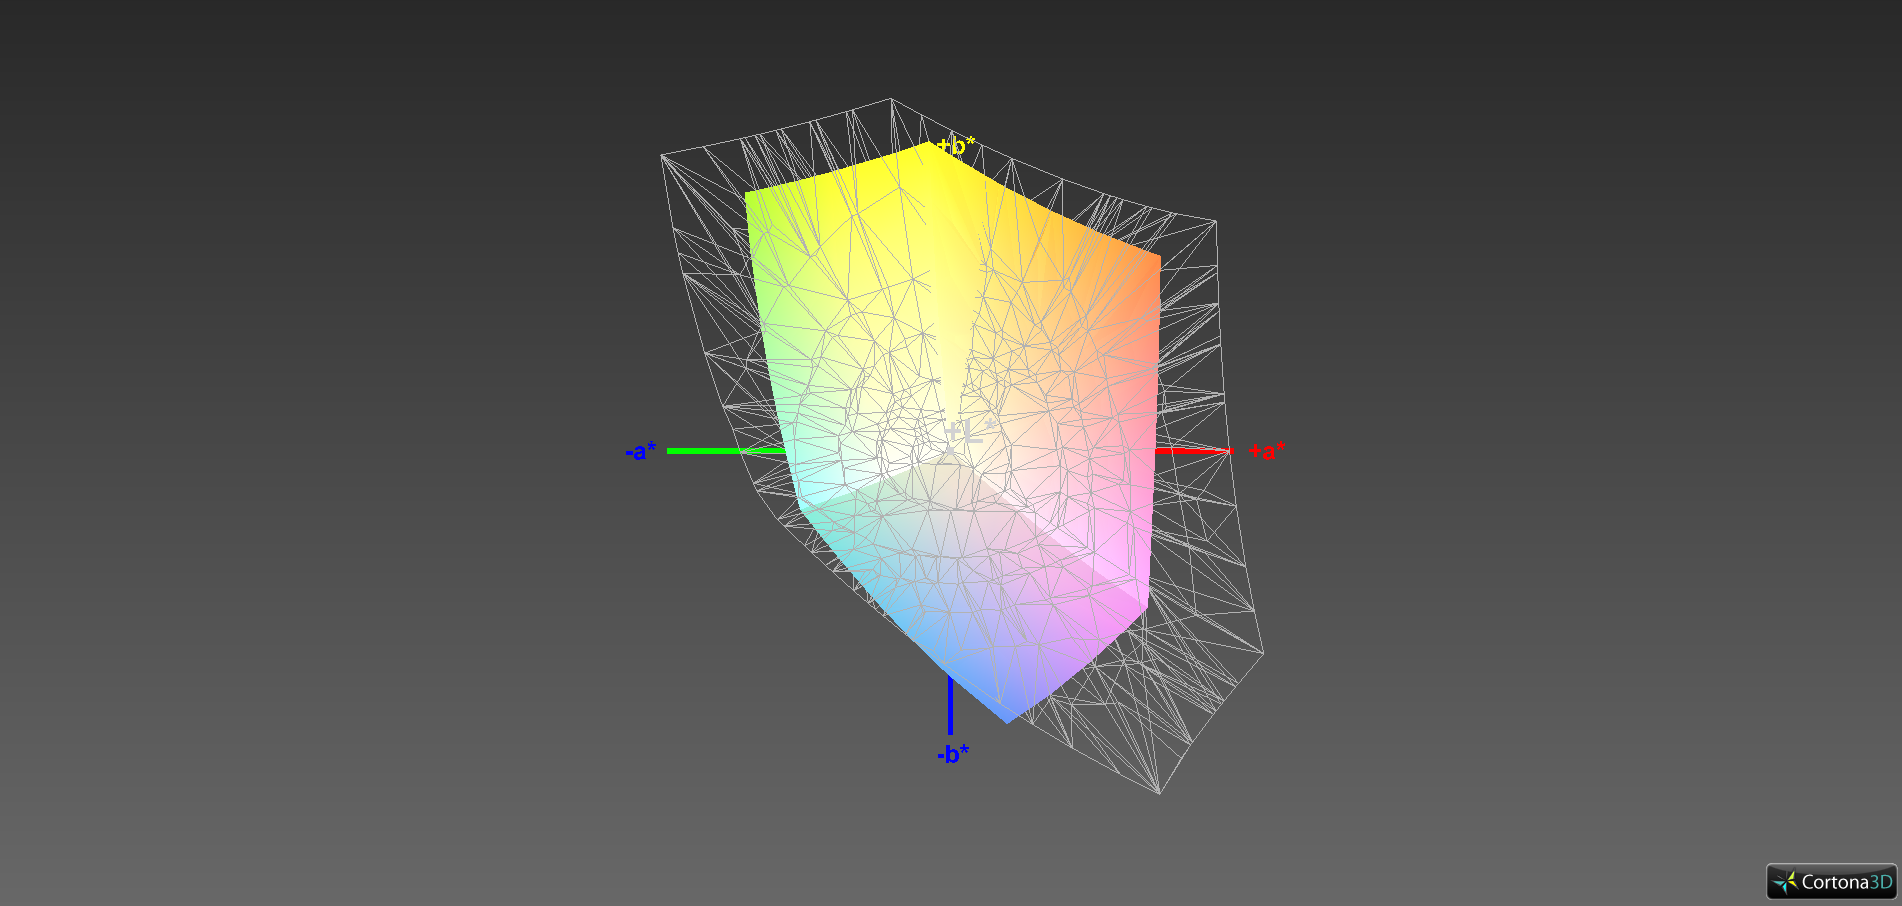
62.8% sRGB (Argyll 1.6.3 3D)
40.2% AdobeRGB 1998 (Argyll 1.6.3 3D)
43.68% AdobeRGB 1998 (Argyll 3D)
63.1% sRGB (Argyll 3D)
42.23% Display P3 (Argyll 3D)
Gamma: 1.98
CCT: 6226 K
| Lenovo ThinkPad P43s-20RH001FGE IPS, 1920x1080, 14" | HP ZBook 14u G6 6TP71EA IPS, 1920x1080, 14" | Lenovo ThinkPad T490-20N3S02L00 IGZO IPS LED, 1920x1080, 14" | Dell Precision 5530 2-in-1 IPS, 3840x2160, 15.6" | |
|---|---|---|---|---|
| Display | 63% | 55% | 101% | |
| Display P3 Coverage (%) | 42.23 | 69.7 65% | 69.3 64% | 91.2 116% |
| sRGB Coverage (%) | 63.1 | 99.6 58% | 92.2 46% | 99.9 58% |
| AdobeRGB 1998 Coverage (%) | 43.68 | 71.9 65% | 67.4 54% | 99.4 128% |
| Response Times | 20% | -64% | -22% | |
| Response Time Grey 50% / Grey 80% * (ms) | 42.6 ? | 40.4 ? 5% | 74 ? -74% | 49.6 ? -16% |
| Response Time Black / White * (ms) | 29.6 ? | 19.2 ? 35% | 45.6 ? -54% | 37.6 ? -27% |
| PWM Frequency (Hz) | 24750 ? | 2451 ? | 990 ? | |
| Screen | 40% | 32% | 36% | |
| Brightness middle (cd/m²) | 232 | 437 88% | 418 80% | 430.9 86% |
| Brightness (cd/m²) | 214 | 420 96% | 400 87% | 398 86% |
| Brightness Distribution (%) | 89 | 92 3% | 88 -1% | 79 -11% |
| Black Level * (cd/m²) | 0.17 | 0.31 -82% | 0.24 -41% | 0.35 -106% |
| Contrast (:1) | 1365 | 1410 3% | 1742 28% | 1231 -10% |
| Colorchecker dE 2000 * | 5.9 | 2.6 56% | 4.7 20% | 3.29 44% |
| Colorchecker dE 2000 max. * | 20.3 | 6.5 68% | 8.7 57% | 7.46 63% |
| Colorchecker dE 2000 calibrated * | 4.4 | 0.8 82% | 2.1 52% | 3.58 19% |
| Greyscale dE 2000 * | 4.8 | 4.5 6% | 5.9 -23% | 2.6 46% |
| Gamma | 1.98 111% | 2.2 100% | 2.06 107% | 2.19 100% |
| CCT | 6226 104% | 6809 95% | 7350 88% | 6870 95% |
| Color Space (Percent of AdobeRGB 1998) (%) | 40.2 | 65.4 63% | 59.9 49% | 87.2 117% |
| Color Space (Percent of sRGB) (%) | 62.8 | 99.6 59% | 92.1 47% | 100 59% |
| Moyenne finale (programmes/paramètres) | 41% /
42% | 8% /
24% | 38% /
41% |
* ... Moindre est la valeur, meilleures sont les performances
Temps de réponse de l'écran
| ↔ Temps de réponse noir à blanc | ||
|---|---|---|
| 29.6 ms ... hausse ↗ et chute ↘ combinées | ↗ 17.2 ms hausse | 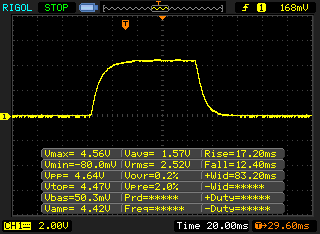 |
| ↘ 12.4 ms chute | ||
| L'écran souffre de latences relativement élevées, insuffisant pour le jeu. En comparaison, tous les appareils testés affichent entre 0.1 (minimum) et 240 (maximum) ms. » 79 % des appareils testés affichent de meilleures performances. Cela signifie que les latences relevées sont moins bonnes que la moyenne (19.9 ms) de tous les appareils testés. | ||
| ↔ Temps de réponse gris 50% à gris 80% | ||
| 42.6 ms ... hausse ↗ et chute ↘ combinées | ↗ 22 ms hausse | 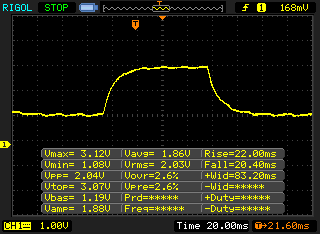 |
| ↘ 20.4 ms chute | ||
| L'écran souffre de latences très élevées, à éviter pour le jeu. En comparaison, tous les appareils testés affichent entre 0.165 (minimum) et 636 (maximum) ms. » 70 % des appareils testés affichent de meilleures performances. Cela signifie que les latences relevées sont moins bonnes que la moyenne (31.1 ms) de tous les appareils testés. | ||
Scintillement / MLI (Modulation de largeur d'impulsion)
| Scintillement / MLI (Modulation de largeur d'impulsion) décelé | 24750 Hz | ≤ 40 Niveau de luminosité | 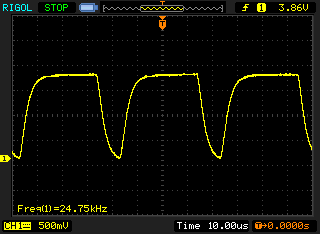 |
Le rétroéclairage de l'écran scintille à la fréquence de 24750 Hz (certainement du fait de l'utilisation d'une MDI - Modulation de largeur d'impulsion) à un niveau de luminosité inférieur ou égal à 40 % . Aucun scintillement ne devrait être perceptible au-dessus de cette valeur. La fréquence de rafraîchissement de 24750 Hz est élevée, la grande majorité des utilisateurs ne devrait pas percevoir de scintillements et être sujette à une fatigue oculaire accrue. En comparaison, 52 % des appareils testés n'emploient pas MDI pour assombrir leur écran. Nous avons relevé une moyenne à 7784 (minimum : 5 - maximum : 343500) Hz dans le cas où une MDI était active. | |||

| Geekbench 3 | |
| 32 Bit Multi-Core Score | |
| HP ZBook 14u G6 6TP71EA | |
| Moyenne Intel Core i7-8565U (10521 - 13703, n=12) | |
| Lenovo ThinkPad P43s-20RH001FGE | |
| 32 Bit Single-Core Score | |
| Moyenne Intel Core i7-8565U (3340 - 4820, n=12) | |
| HP ZBook 14u G6 6TP71EA | |
| Lenovo ThinkPad P43s-20RH001FGE | |
| Mozilla Kraken 1.1 - Total | |
| Lenovo ThinkPad P43s-20RH001FGE (Edge 44) | |
| HP ZBook 14u G6 6TP71EA (Edge 44) | |
| Dell Precision 5530 2-in-1 (Edge 42.17134.1.0) | |
| Moyenne Intel Core i7-8565U (730 - 2622, n=43) | |
| Lenovo ThinkPad T490-20N3S02L00 (Edge) | |
| Moyenne de la classe Workstation (411 - 538, n=25, 2 dernières années) | |
| Octane V2 - Total Score | |
| Moyenne de la classe Workstation (92715 - 129420, n=4, 2 dernières années) | |
| Lenovo ThinkPad T490-20N3S02L00 (Edge) | |
| Moyenne Intel Core i7-8565U (13935 - 49795, n=42) | |
| HP ZBook 14u G6 6TP71EA (Edge 44) | |
| Lenovo ThinkPad P43s-20RH001FGE (Edge 44) | |
| Dell Precision 5530 2-in-1 (Edge 42.17134.1.0) | |
| JetStream 1.1 - 1.1 Total | |
| Dell Precision 5530 2-in-1 (Edge 42.17134.1.0) | |
| HP ZBook 14u G6 6TP71EA (Edge 44) | |
| Moyenne Intel Core i7-8565U (107.6 - 277, n=37) | |
| Lenovo ThinkPad P43s-20RH001FGE (Edge 44) | |
* ... Moindre est la valeur, meilleures sont les performances
| PCMark 8 Home Score Accelerated v2 | 3313 points | |
| PCMark 8 Creative Score Accelerated v2 | 3501 points | |
| PCMark 8 Work Score Accelerated v2 | 4918 points | |
| PCMark 10 Score | 3092 points | |
Aide | ||

| Lenovo ThinkPad P43s-20RH001FGE WDC PC SN720 SDAQNTW-256G | HP ZBook 14u G6 6TP71EA Samsung SSD PM981 MZVLB512HAJQ | Lenovo ThinkPad T490-20N3S02L00 Toshiba XG5 KXG50ZNV512G | Dell Precision 5530 2-in-1 SK Hynix PC401 512GB M.2 (HFS512GD9TNG) | Moyenne WDC PC SN720 SDAQNTW-256G | |
|---|---|---|---|---|---|
| CrystalDiskMark 5.2 / 6 | 16% | 4% | -12% | 0% | |
| Write 4K (MB/s) | 135.3 | 173.7 28% | 126.6 -6% | 128.9 -5% | 135.3 ? 0% |
| Read 4K (MB/s) | 45.09 | 50.6 12% | 43.61 -3% | 45.7 1% | 45.1 ? 0% |
| Write Seq (MB/s) | 1576 | 1100 -30% | 1342 -15% | 635 -60% | 1576 ? 0% |
| Read Seq (MB/s) | 1457 | 1072 -26% | 1251 -14% | 2065 42% | 1457 ? 0% |
| Write 4K Q32T1 (MB/s) | 356.3 | 555 56% | 297.7 -16% | 336.6 -6% | 356 ? 0% |
| Read 4K Q32T1 (MB/s) | 385.4 | 625 62% | 376.4 -2% | 393.6 2% | 385 ? 0% |
| Write Seq Q32T1 (MB/s) | 1613 | 1892 17% | 2969 84% | 662 -59% | 1613 ? 0% |
| Read Seq Q32T1 (MB/s) | 3017 | 3233 7% | 3228 7% | 2664 -12% | 3017 ? 0% |
| 3DMark 06 Standard Score | 15127 points | |
| 3DMark 11 Performance | 3622 points | |
| 3DMark Ice Storm Standard Score | 43462 points | |
| 3DMark Cloud Gate Standard Score | 7839 points | |
| 3DMark Fire Strike Score | 2666 points | |
| 3DMark Time Spy Score | 964 points | |
Aide | ||
| Bas | Moyen | Élevé | Ultra | |
|---|---|---|---|---|
| Tomb Raider (2013) | 154.2 | 112.8 | 76.8 | 35.3 |
| BioShock Infinite (2013) | 115.7 | 88.1 | 78.4 | 31.2 |
| The Witcher 3 (2015) | 47.2 | 32 | 18.9 | 8.4 |
| Dota 2 Reborn (2015) | 114 | 102 | 53.2 | 47.6 |
| X-Plane 11.11 (2018) | 66 | 40.7 | 34.9 | |
| Darksiders III (2018) | 46.1 | 23 | 19.1 | 15.5 |
| Metro Exodus (2019) | 26.4 | 7.3 | 6.3 | 5.3 |
| Total War: Three Kingdoms (2019) | 50.4 | 16.9 | 7.2 | 3.6 |
| F1 2019 (2019) | 30 | 16 | 14 | 9 |
| Control (2019) | 38.2 | 11.9 | 5.5 | |
| Borderlands 3 (2019) | 24.2 | 10.1 | 4.9 |
Degré de la nuisance sonore
| Au repos |
| 29.2 / 29.2 / 29.2 dB(A) |
| Fortement sollicité |
| 33.3 / 33.3 dB(A) |
 | ||
30 dB silencieux 40 dB(A) audible 50 dB(A) bruyant |
||
min: | ||
| Lenovo ThinkPad P43s-20RH001FGE i7-8565U, Quadro P520 | HP ZBook 14u G6 6TP71EA i7-8565U, Radeon Pro WX 3200 | Lenovo ThinkPad T490-20N3S02L00 i7-8565U, GeForce MX250 | Dell Precision 5530 2-in-1 i7-8706G, WX Vega M GL | Moyenne NVIDIA Quadro P520 | Moyenne de la classe Workstation | |
|---|---|---|---|---|---|---|
| Noise | -3% | -3% | -9% | -2% | -3% | |
| arrêt / environnement * (dB) | 29.2 | 29.7 -2% | 29.4 -1% | 28.6 2% | 29.4 ? -1% | 24.1 ? 17% |
| Idle Minimum * (dB) | 29.2 | 29.7 -2% | 29.4 -1% | 28.6 2% | 29.4 ? -1% | 24.8 ? 15% |
| Idle Average * (dB) | 29.2 | 29.7 -2% | 29.4 -1% | 28.6 2% | 29.4 ? -1% | 25.4 ? 13% |
| Idle Maximum * (dB) | 29.2 | 30.4 -4% | 29.4 -1% | 29.1 -0% | 30 ? -3% | 26.7 ? 9% |
| Load Average * (dB) | 33.3 | 32.7 2% | 34.7 -4% | 39.8 -20% | 33.4 ? -0% | 39.2 ? -18% |
| Load Maximum * (dB) | 33.3 | 35.9 -8% | 37.2 -12% | 47 -41% | 34.7 ? -4% | 50.4 ? -51% |
| Witcher 3 ultra * (dB) | 35.3 | 34.7 | 47 |
* ... Moindre est la valeur, meilleures sont les performances
(-) La température maximale du côté supérieur est de 48.9 °C / 120 F, par rapport à la moyenne de 38.2 °C / 101 F, allant de 22.2 à 69.8 °C pour la classe Workstation.
(-) Le fond chauffe jusqu'à un maximum de 58.9 °C / 138 F, contre une moyenne de 41.1 °C / 106 F
(+) En utilisation inactive, la température moyenne du côté supérieur est de 23.5 °C / 74 F, par rapport à la moyenne du dispositif de 32 °C / 90 F.
(+) Les repose-poignets et le pavé tactile atteignent la température maximale de la peau (35.3 °C / 95.5 F) et ne sont donc pas chauds.
(-) La température moyenne de la zone de l'appui-paume de dispositifs similaires était de 27.8 °C / 82 F (-7.5 °C / #-13.5 F).
| Lenovo ThinkPad P43s-20RH001FGE i7-8565U, Quadro P520 | HP ZBook 14u G6 6TP71EA i7-8565U, Radeon Pro WX 3200 | Lenovo ThinkPad T490-20N3S02L00 i7-8565U, GeForce MX250 | Dell Precision 5530 2-in-1 i7-8706G, WX Vega M GL | Moyenne NVIDIA Quadro P520 | Moyenne de la classe Workstation | |
|---|---|---|---|---|---|---|
| Heat | 12% | 8% | -9% | -2% | -5% | |
| Maximum Upper Side * (°C) | 48.9 | 40.8 17% | 45.2 8% | 48.6 1% | 50.5 ? -3% | 43.8 ? 10% |
| Maximum Bottom * (°C) | 58.9 | 43 27% | 56.6 4% | 42.2 28% | 61.5 ? -4% | 45 ? 24% |
| Idle Upper Side * (°C) | 23.7 | 24.1 -2% | 22.1 7% | 31.6 -33% | 23.9 ? -1% | 30.6 ? -29% |
| Idle Bottom * (°C) | 25.6 | 24.4 5% | 22.1 14% | 33.2 -30% | 25 ? 2% | 31.6 ? -23% |
* ... Moindre est la valeur, meilleures sont les performances
Lenovo ThinkPad P43s-20RH001FGE analyse audio
(±) | le niveau sonore du haut-parleur est moyen mais bon (72.7# dB)
Basses 100 - 315 Hz
(±) | basse réduite - en moyenne 14.9% inférieure à la médiane
(±) | la linéarité des basses est moyenne (11.3% delta à la fréquence précédente)
Médiums 400 - 2000 Hz
(±) | médiane supérieure - en moyenne 6.4% supérieure à la médiane
(±) | la linéarité des médiums est moyenne (9% delta à la fréquence précédente)
Aiguës 2 - 16 kHz
(+) | des sommets équilibrés - à seulement 4.2% de la médiane
(+) | les aigus sont linéaires (5% delta à la fréquence précédente)
Globalement 100 - 16 000 Hz
(±) | la linéarité du son global est moyenne (26.1% de différence avec la médiane)
Par rapport à la même classe
» 88% de tous les appareils testés de cette catégorie étaient meilleurs, 6% similaires, 6% pires
» Le meilleur avait un delta de 7%, la moyenne était de 17%, le pire était de 35%.
Par rapport à tous les appareils testés
» 80% de tous les appareils testés étaient meilleurs, 4% similaires, 16% pires
» Le meilleur avait un delta de 4%, la moyenne était de 24%, le pire était de 134%.
| Éteint/en veille | |
| Au repos | |
| Fortement sollicité |
|
Légende:
min: | |
| Lenovo ThinkPad P43s-20RH001FGE i7-8565U, Quadro P520 | HP ZBook 14u G6 6TP71EA i7-8565U, Radeon Pro WX 3200 | Lenovo ThinkPad T490-20N3S02L00 i7-8565U, GeForce MX250 | Dell Precision 5530 2-in-1 i7-8706G, WX Vega M GL | Moyenne NVIDIA Quadro P520 | Moyenne de la classe Workstation | |
|---|---|---|---|---|---|---|
| Power Consumption | -29% | 2% | -89% | -18% | -144% | |
| Idle Minimum * (Watt) | 2.9 | 4.2 -45% | 2.16 26% | 7.4 -155% | 3.14 ? -8% | 8.94 ? -208% |
| Idle Average * (Watt) | 4.94 | 7.93 -61% | 5.04 -2% | 12.4 -151% | 7.3 ? -48% | 13.8 ? -179% |
| Idle Maximum * (Watt) | 7.92 | 10.9 -38% | 8.64 -9% | 13.3 -68% | 10.4 ? -31% | 17.5 ? -121% |
| Load Average * (Watt) | 60.8 | 59.1 3% | 63.2 -4% | 79.2 -30% | 60.7 ? -0% | 95 ? -56% |
| Load Maximum * (Watt) | 68.2 | 70.5 -3% | 67.5 1% | 96.5 -41% | 68.9 ? -1% | 175.2 ? -157% |
| Witcher 3 ultra * (Watt) | 50.4 | 50 | 82.2 |
* ... Moindre est la valeur, meilleures sont les performances
| Lenovo ThinkPad P43s-20RH001FGE i7-8565U, Quadro P520, 51 Wh | HP ZBook 14u G6 6TP71EA i7-8565U, Radeon Pro WX 3200, 50 Wh | Lenovo ThinkPad T490-20N3S02L00 i7-8565U, GeForce MX250, 50 Wh | Dell Precision 5530 2-in-1 i7-8706G, WX Vega M GL, 75 Wh | Moyenne de la classe Workstation | |
|---|---|---|---|---|---|
| Autonomie de la batterie | -16% | -22% | -30% | -20% | |
| H.264 (h) | 12.7 | 11 -13% | 8.7 -31% | 9.51 ? -25% | |
| WiFi v1.3 (h) | 8.5 | 8.5 0% | 9.1 7% | 7.3 -14% | 8.53 ? 0% |
| Load (h) | 2.2 | 1.4 -36% | 1.3 -41% | 1.2 -45% | 1.429 ? -35% |
| Reader / Idle (h) | 17.7 | 12.3 | 26.1 ? |
Points positifs
Points négatifs

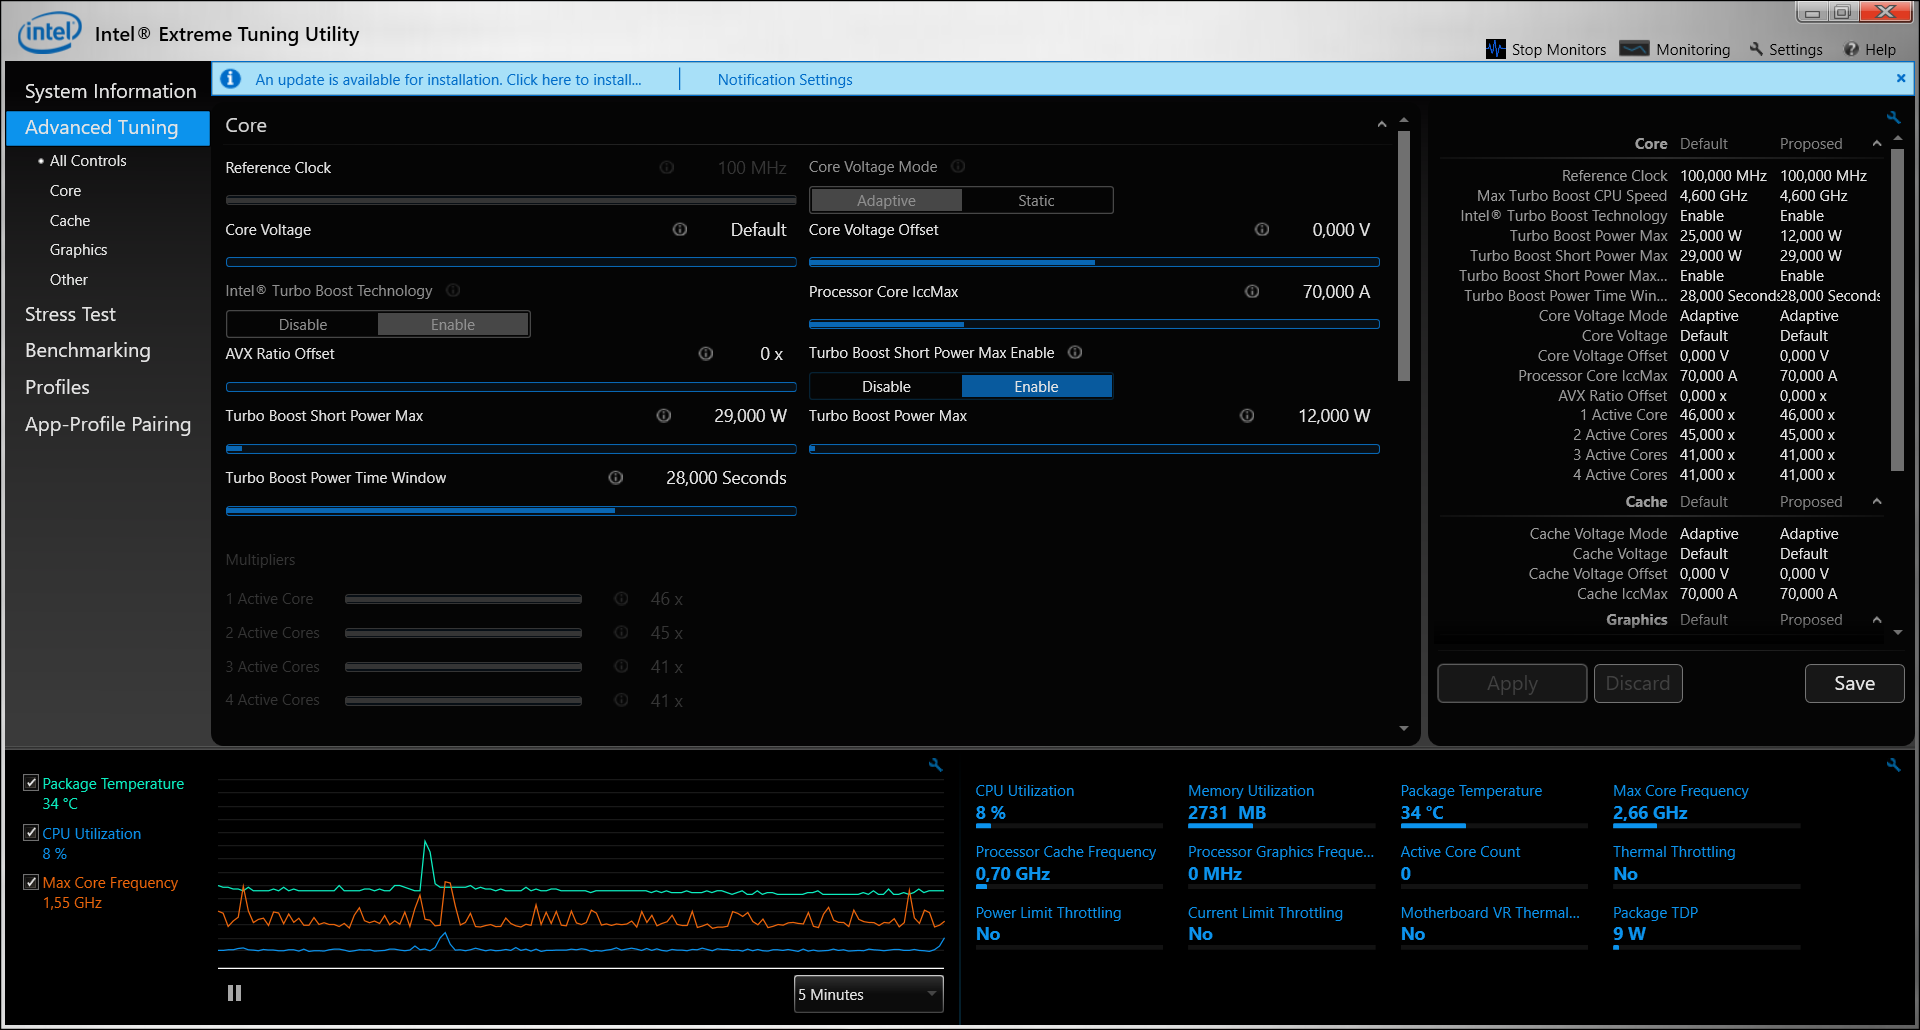
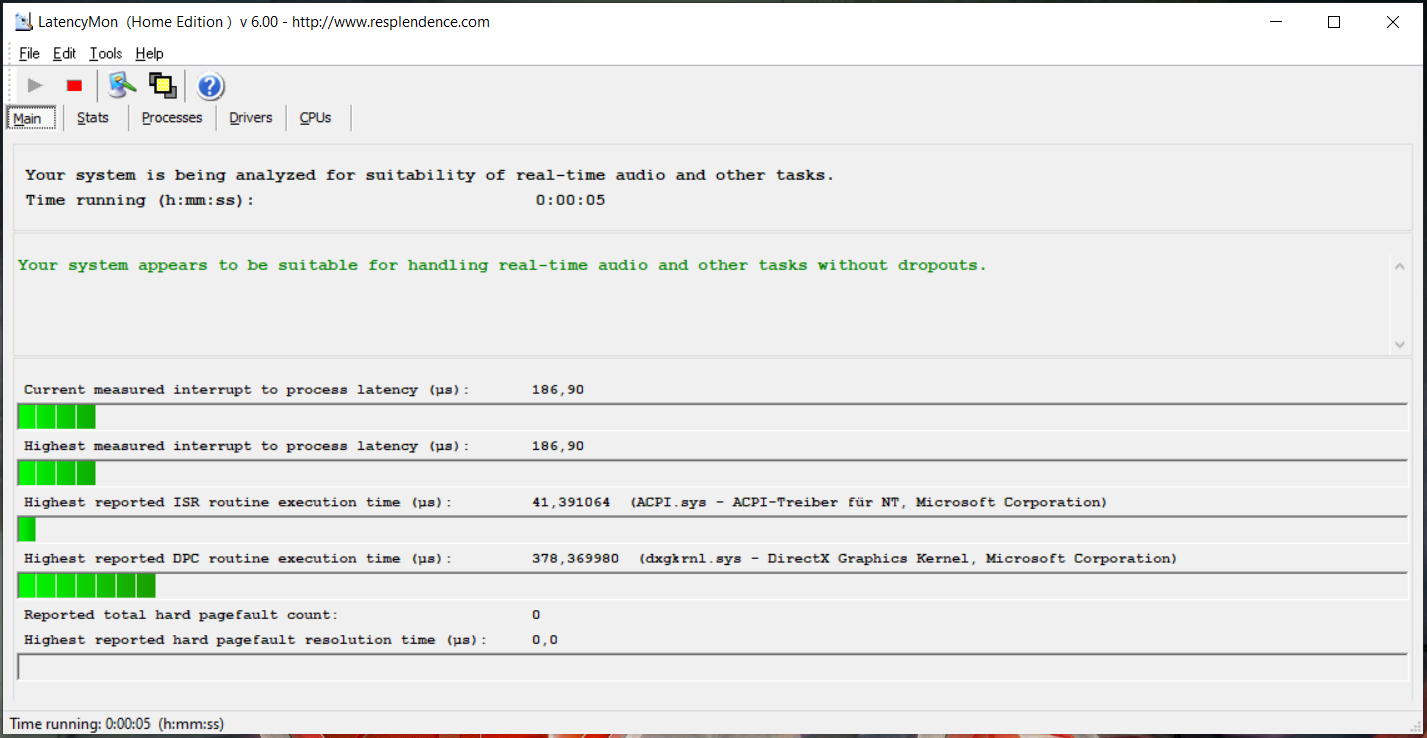
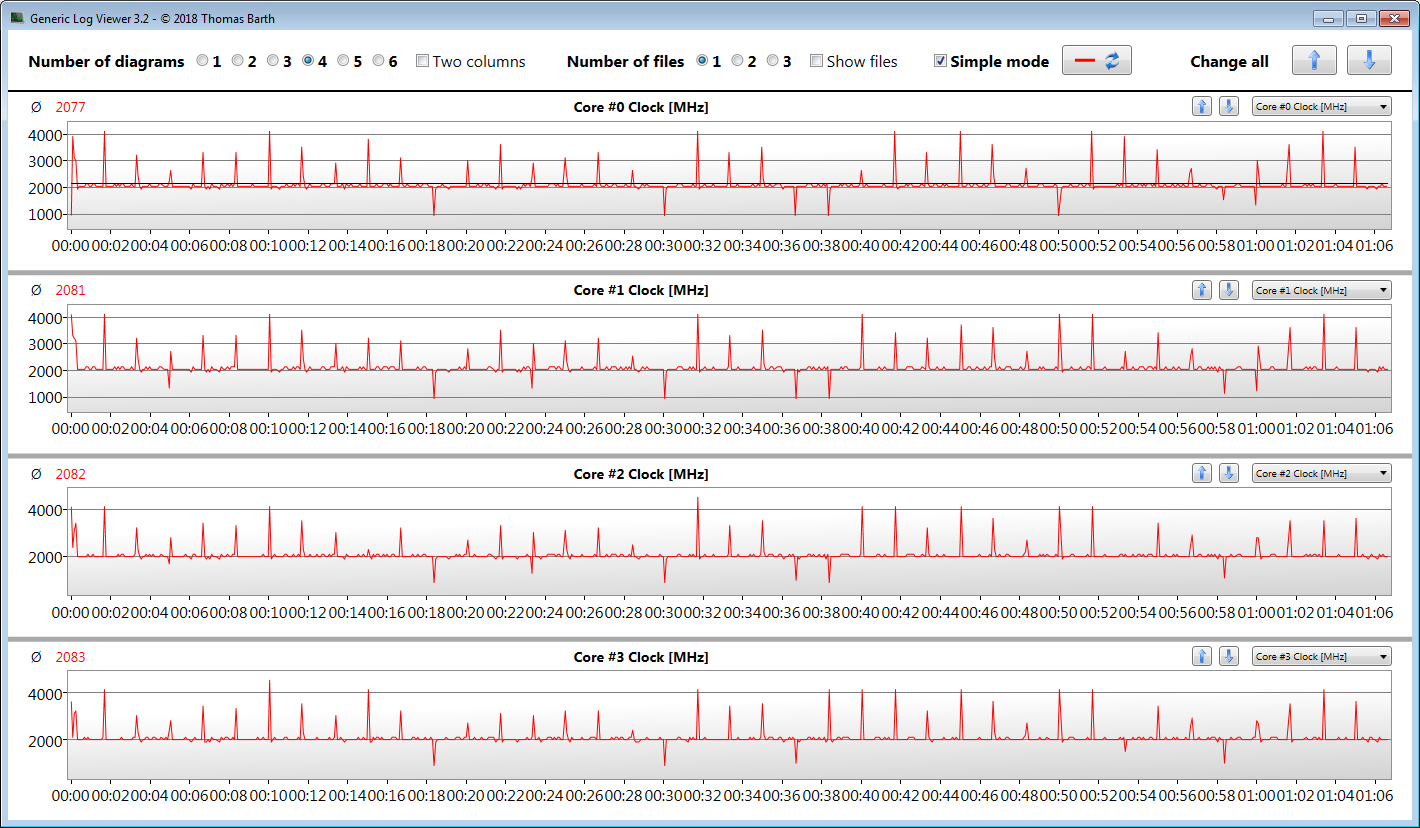
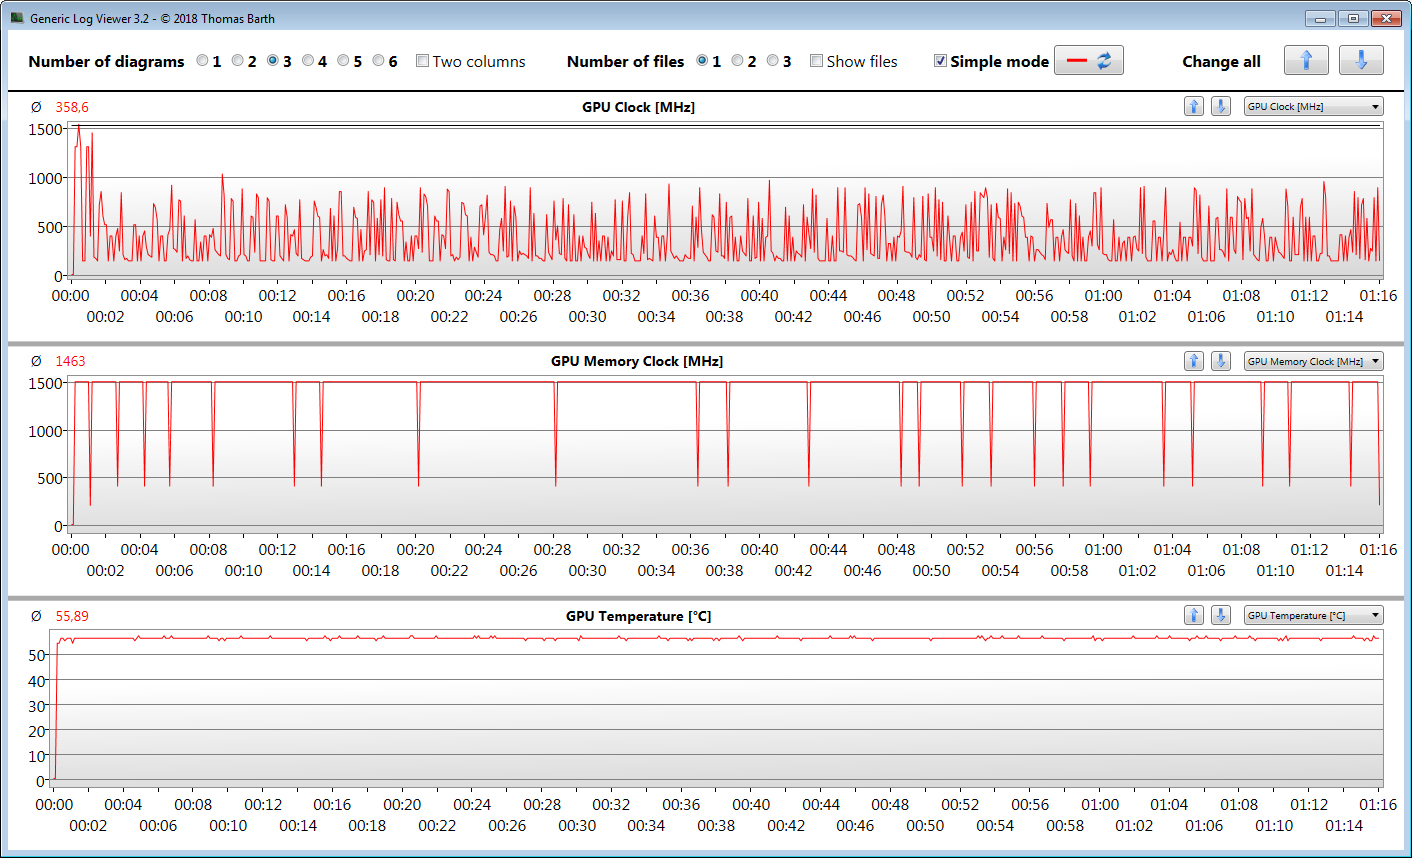
Le ThinkPad P43s ne peut pas exploiter tout le potentiel de ses composants.
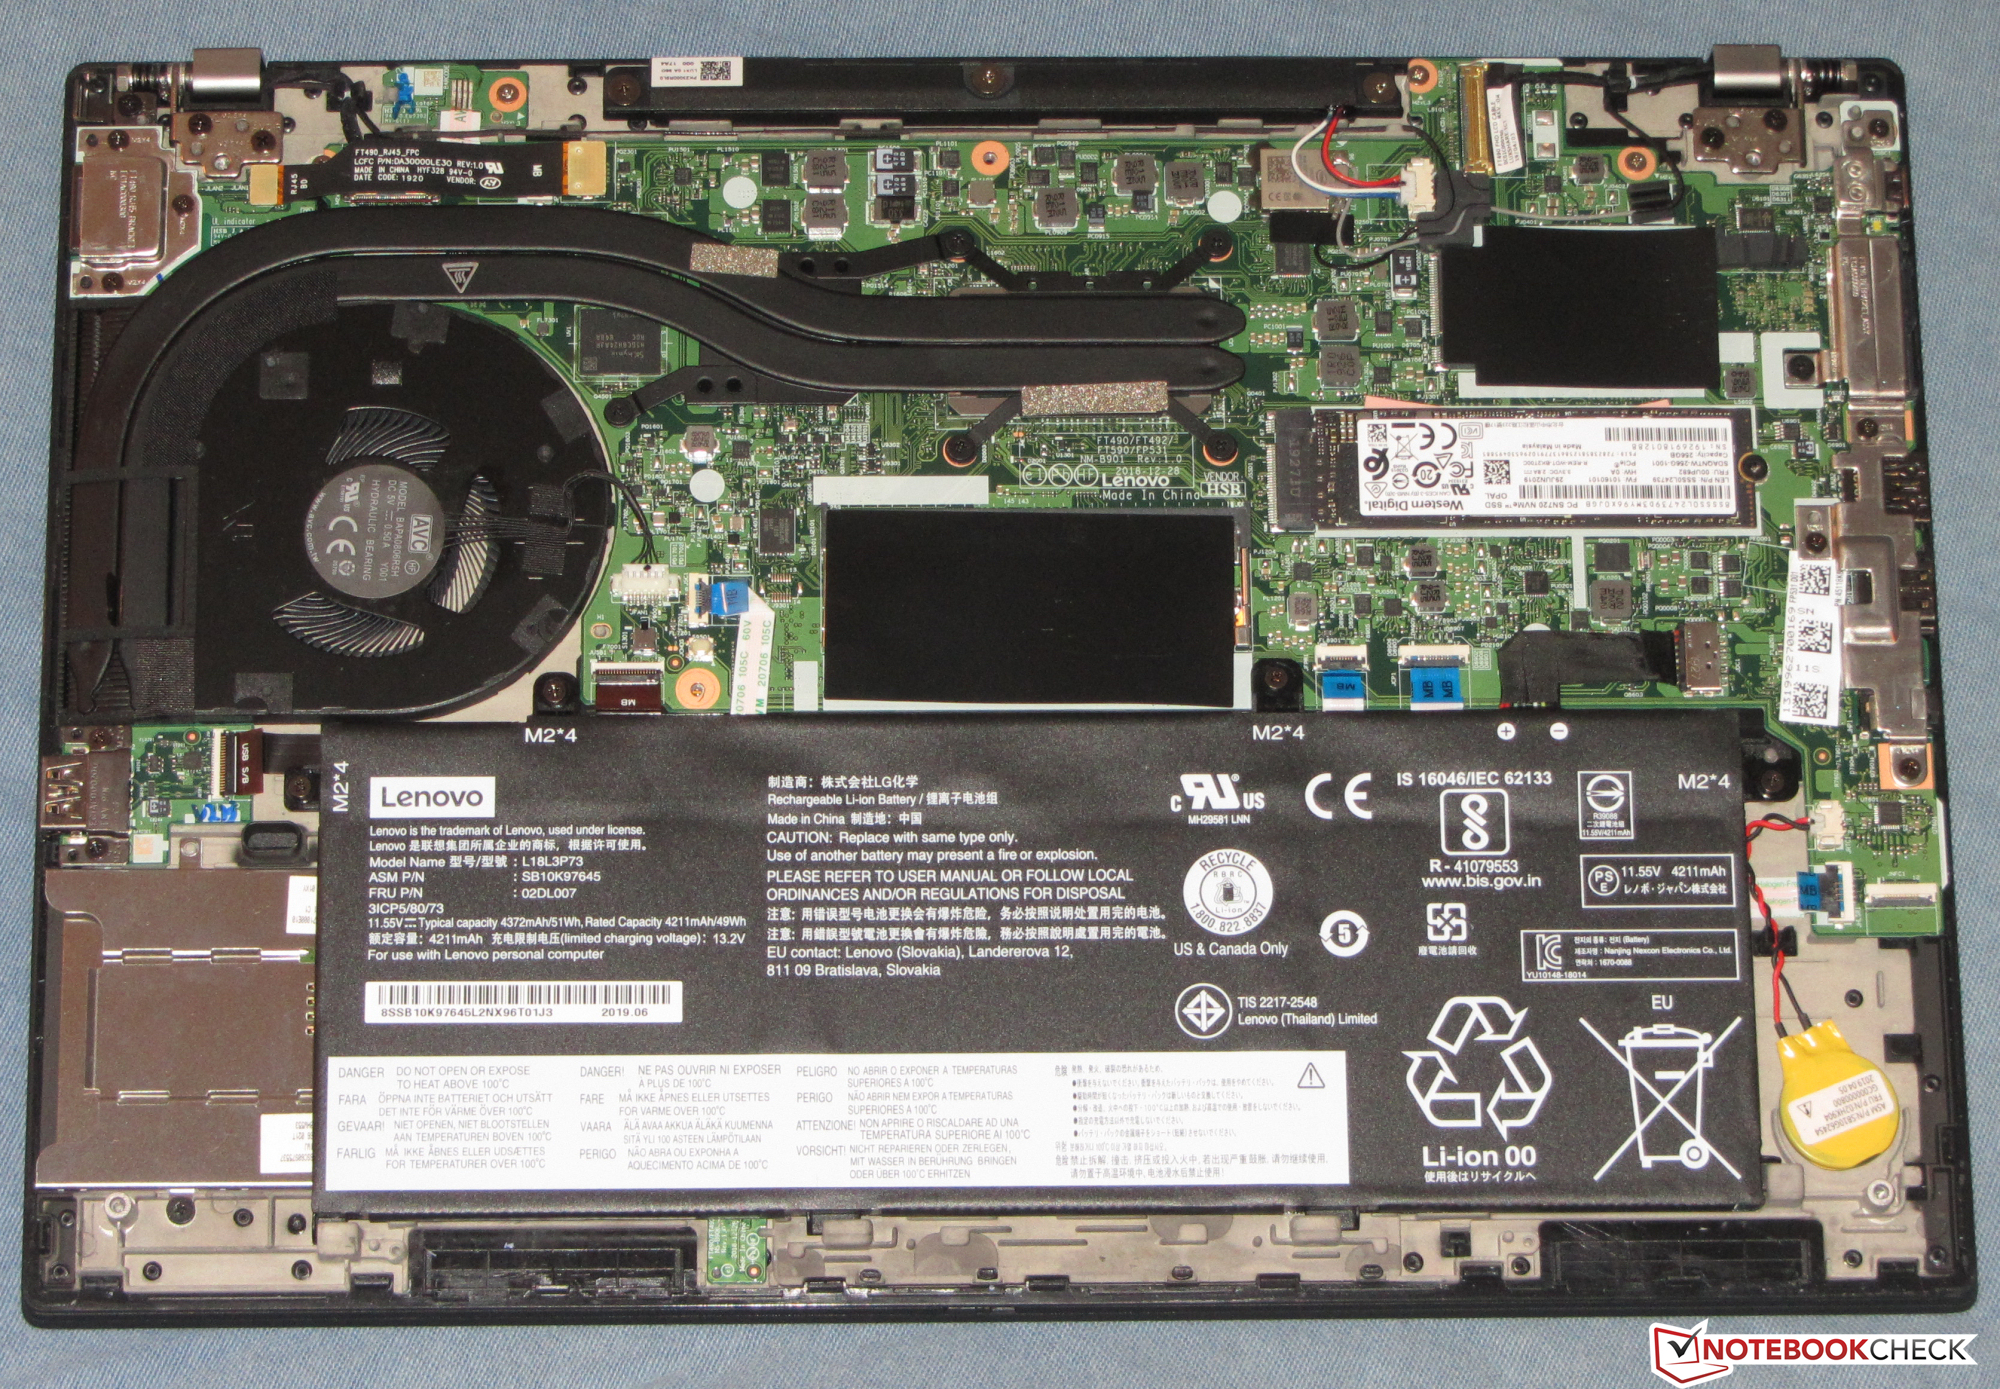
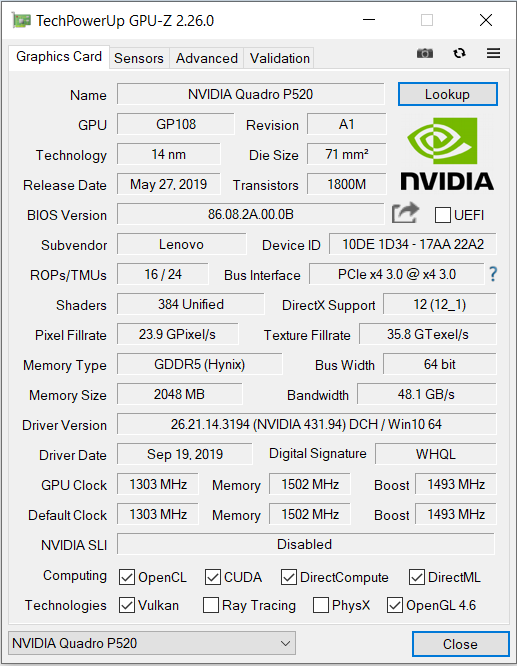
Le processeur Core i7-8565U n’atteint des performance élevées qu’en mode monocœur, le Turbo n’étant que très peu voire pas du tout utilisé en mode multithread. Le processeur graphique Quadro P520 subit du throttling au bout d’un court même, parce que le seuil (la limite de température du GPU, qui ne doit pas dépasser 56 °C) est particulièrement bas. De ce fait, le portable est avant tout adapté aux logiciels qui ne sollicitent que peu le cœur graphique.
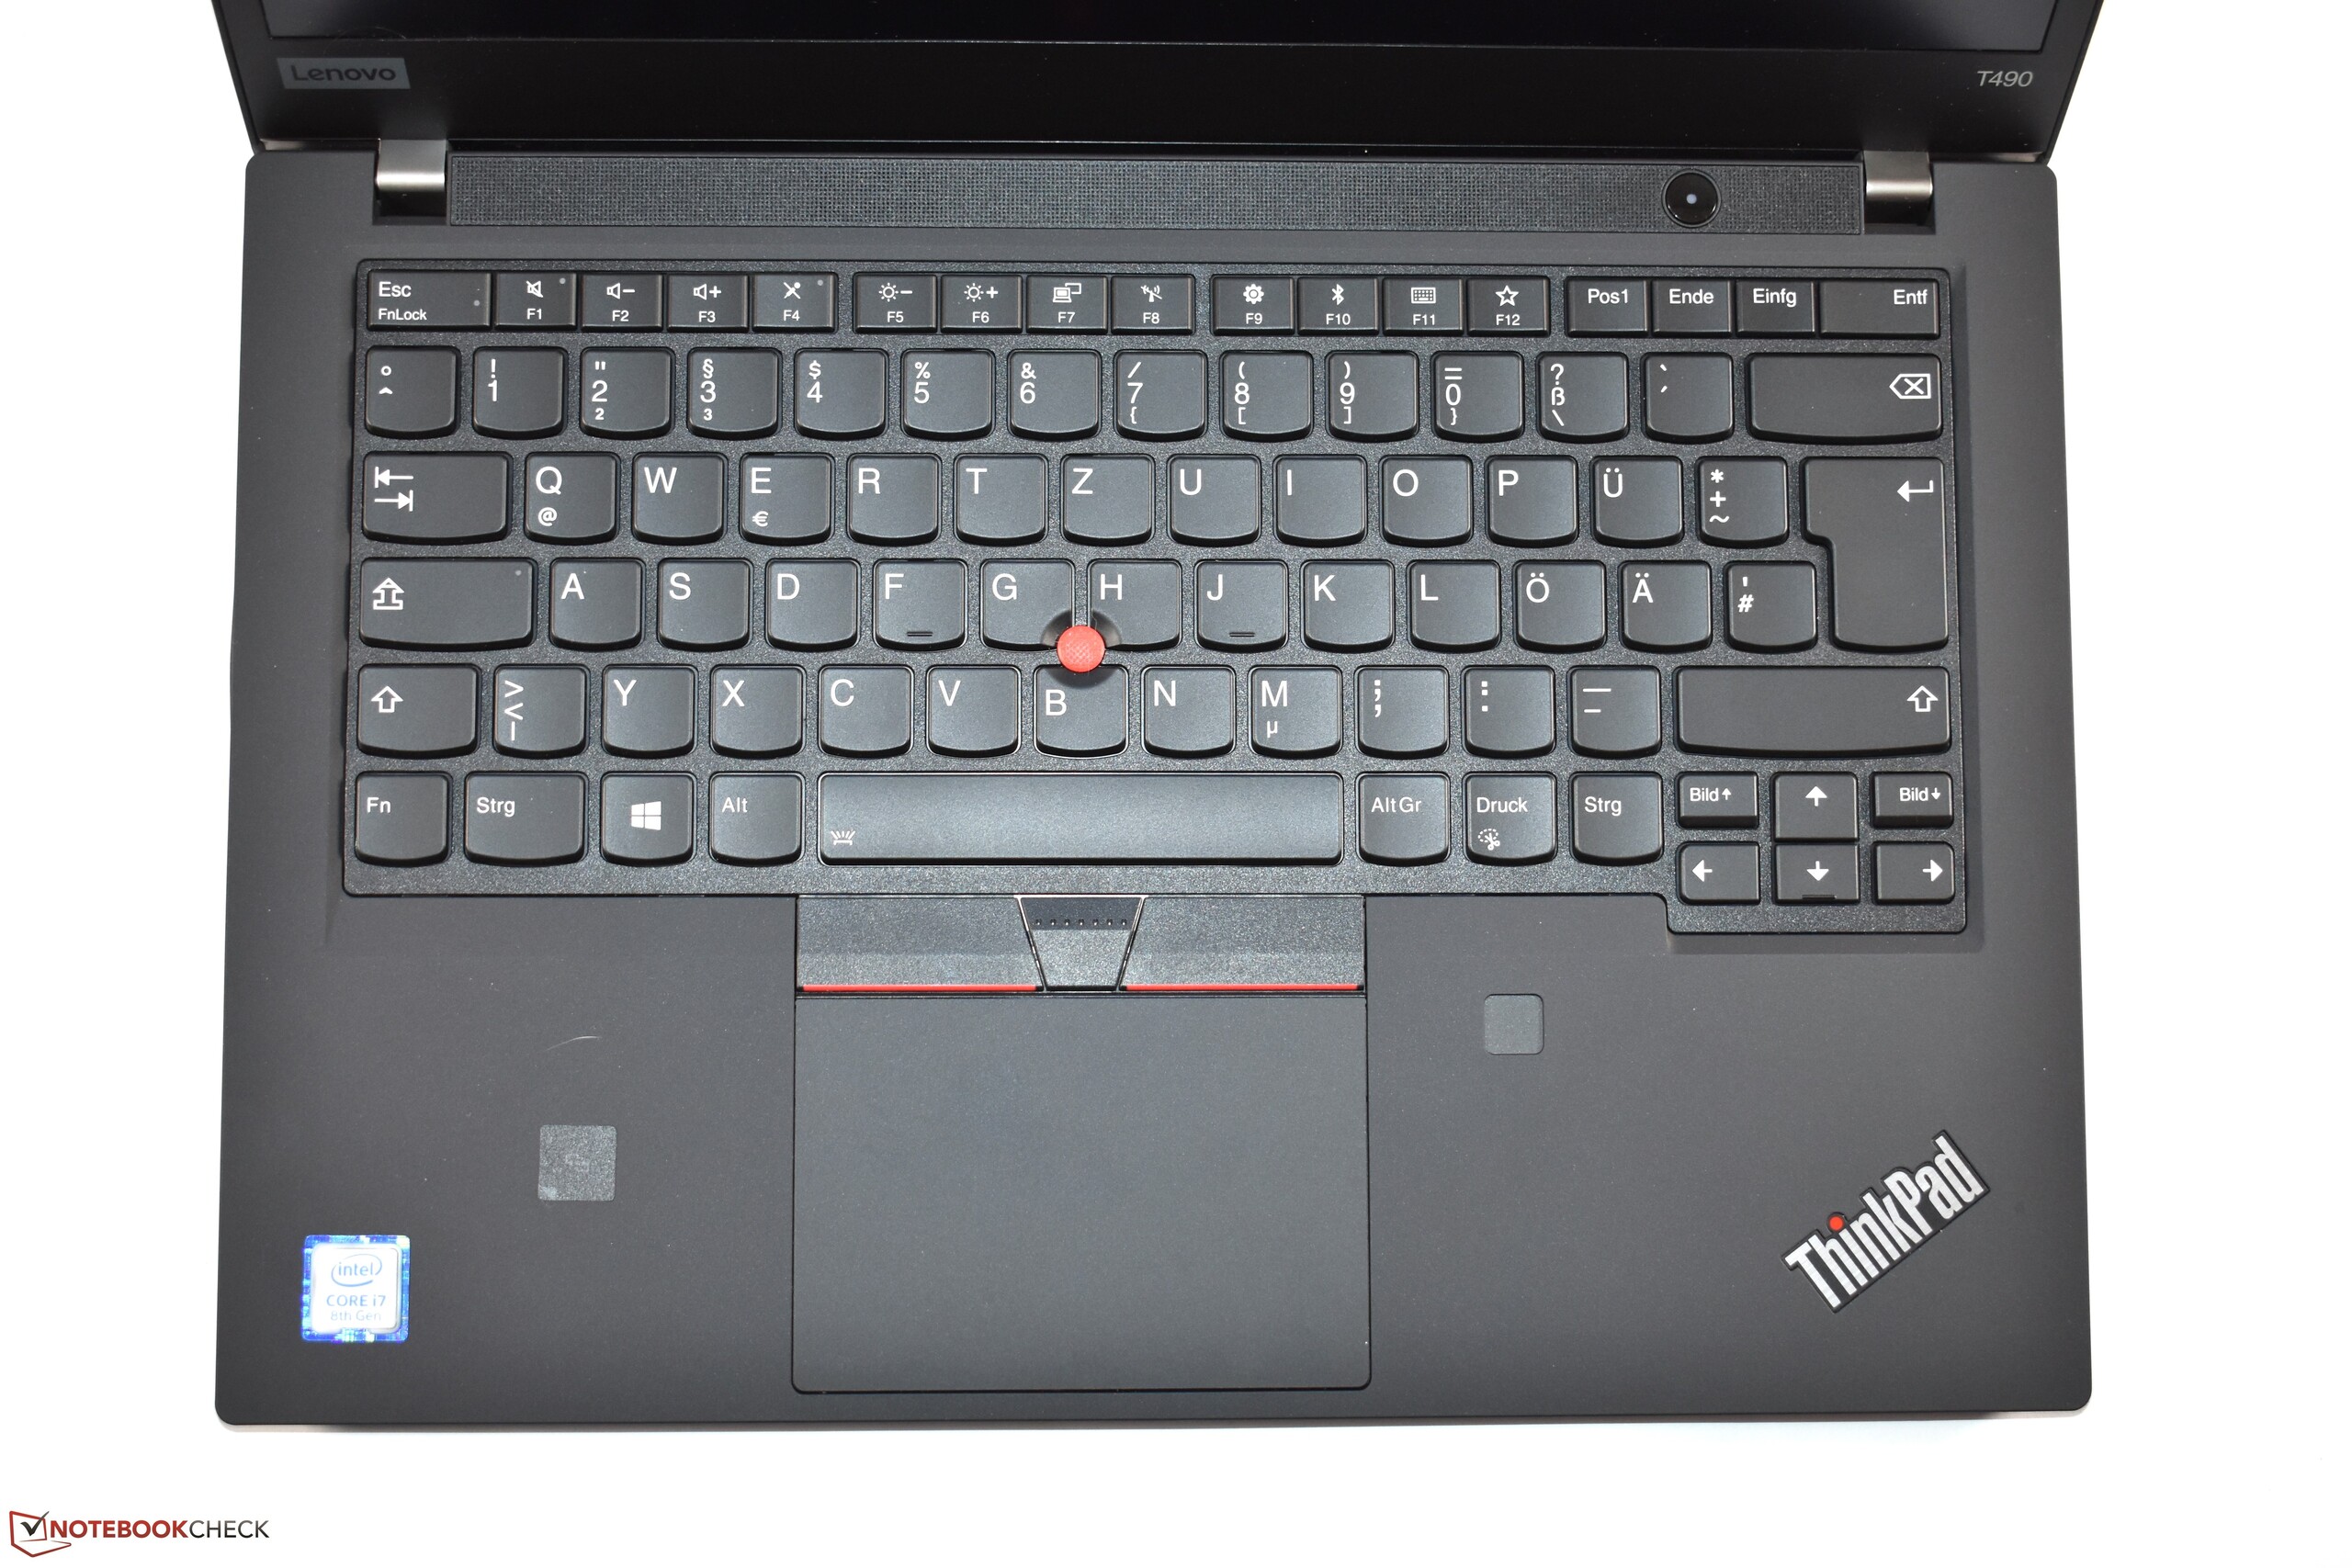
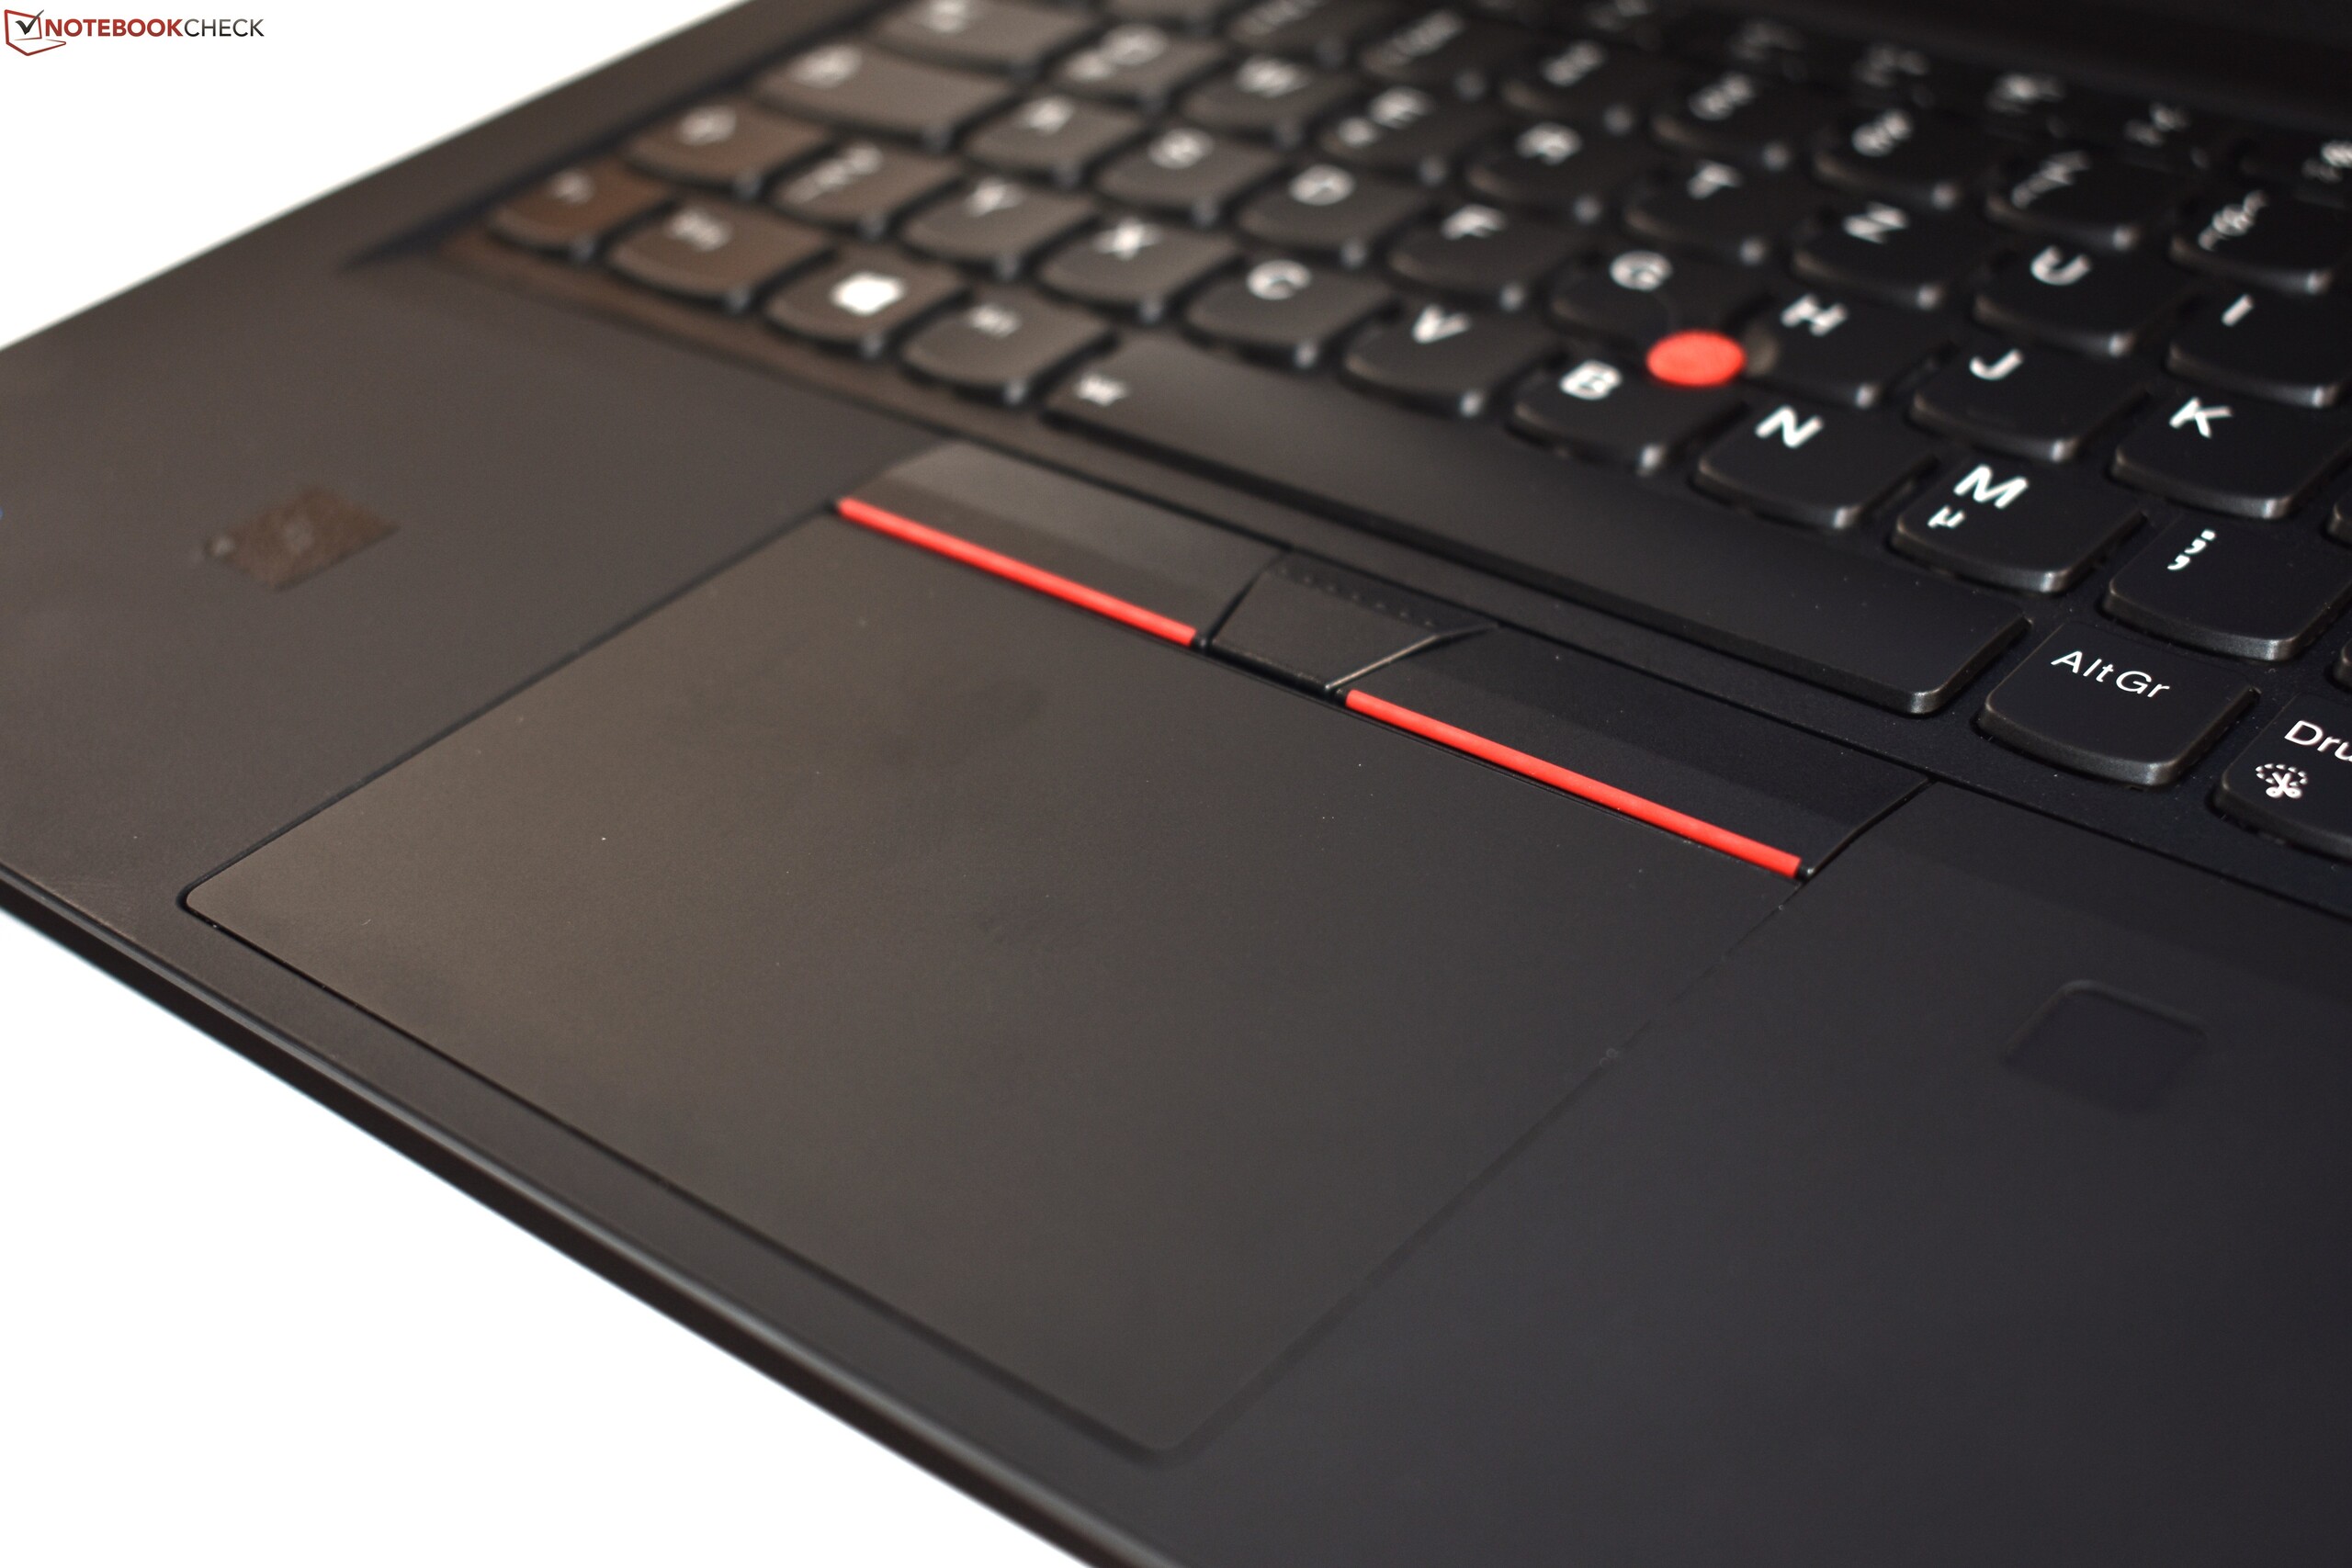
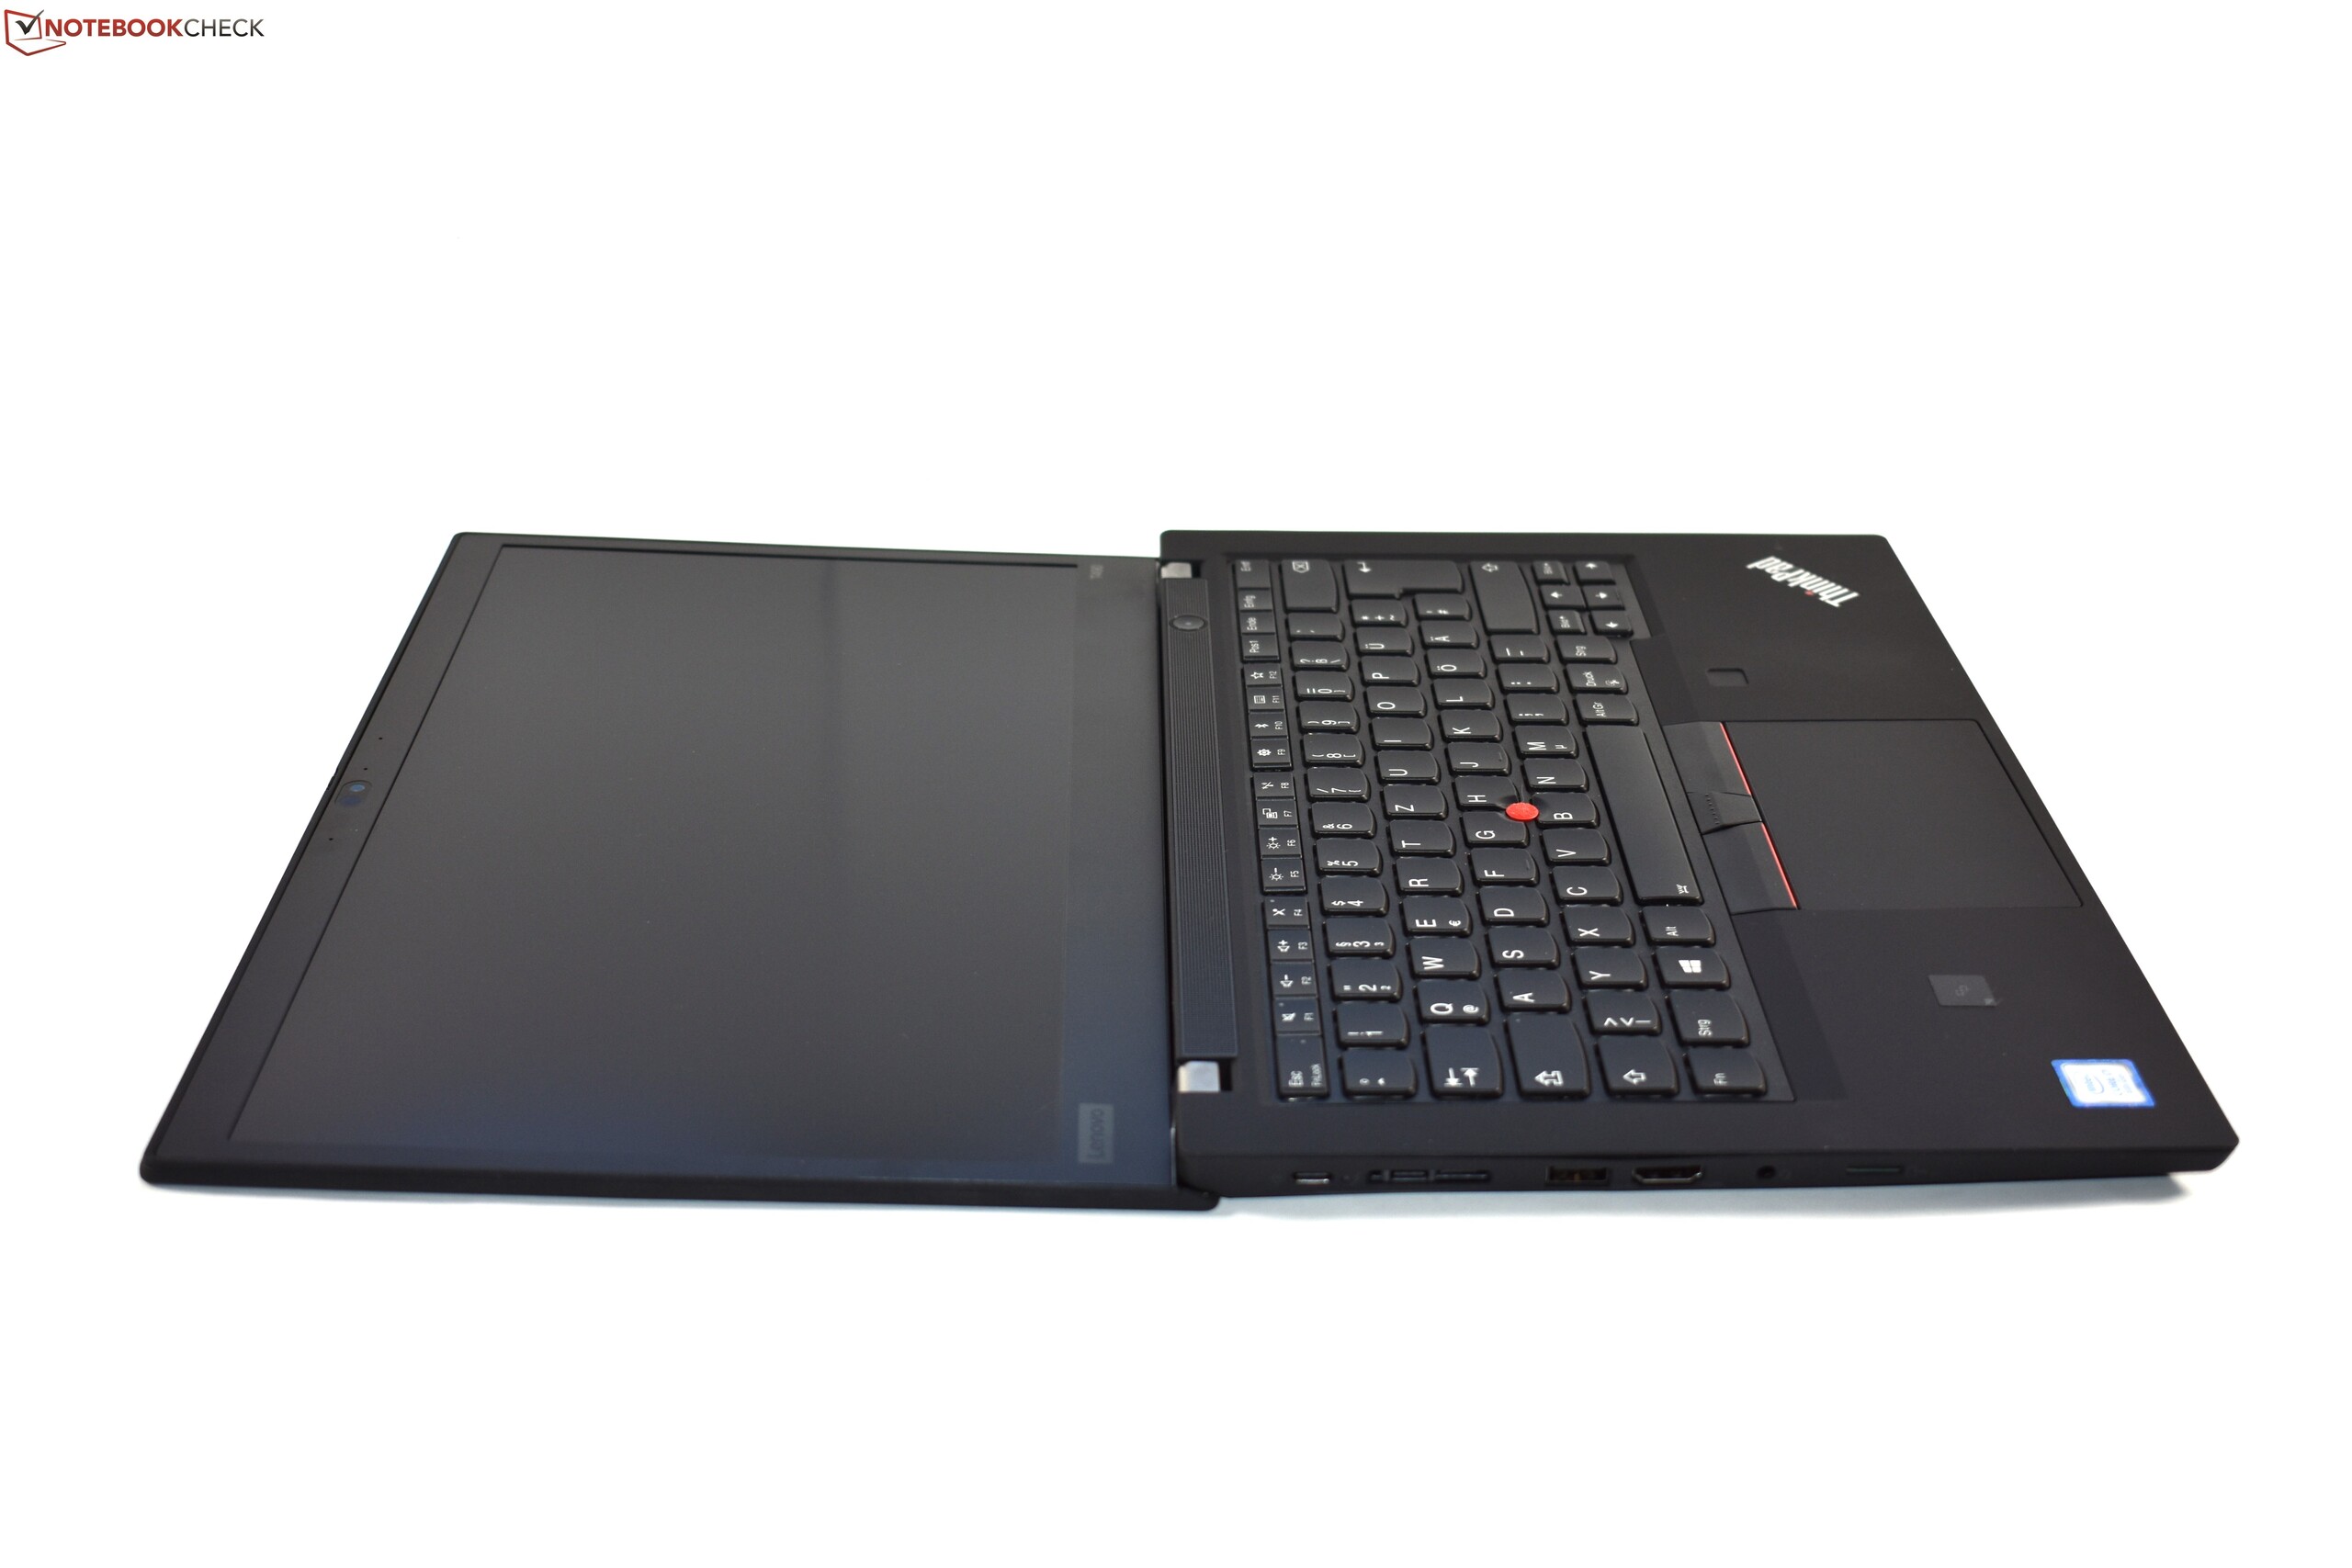
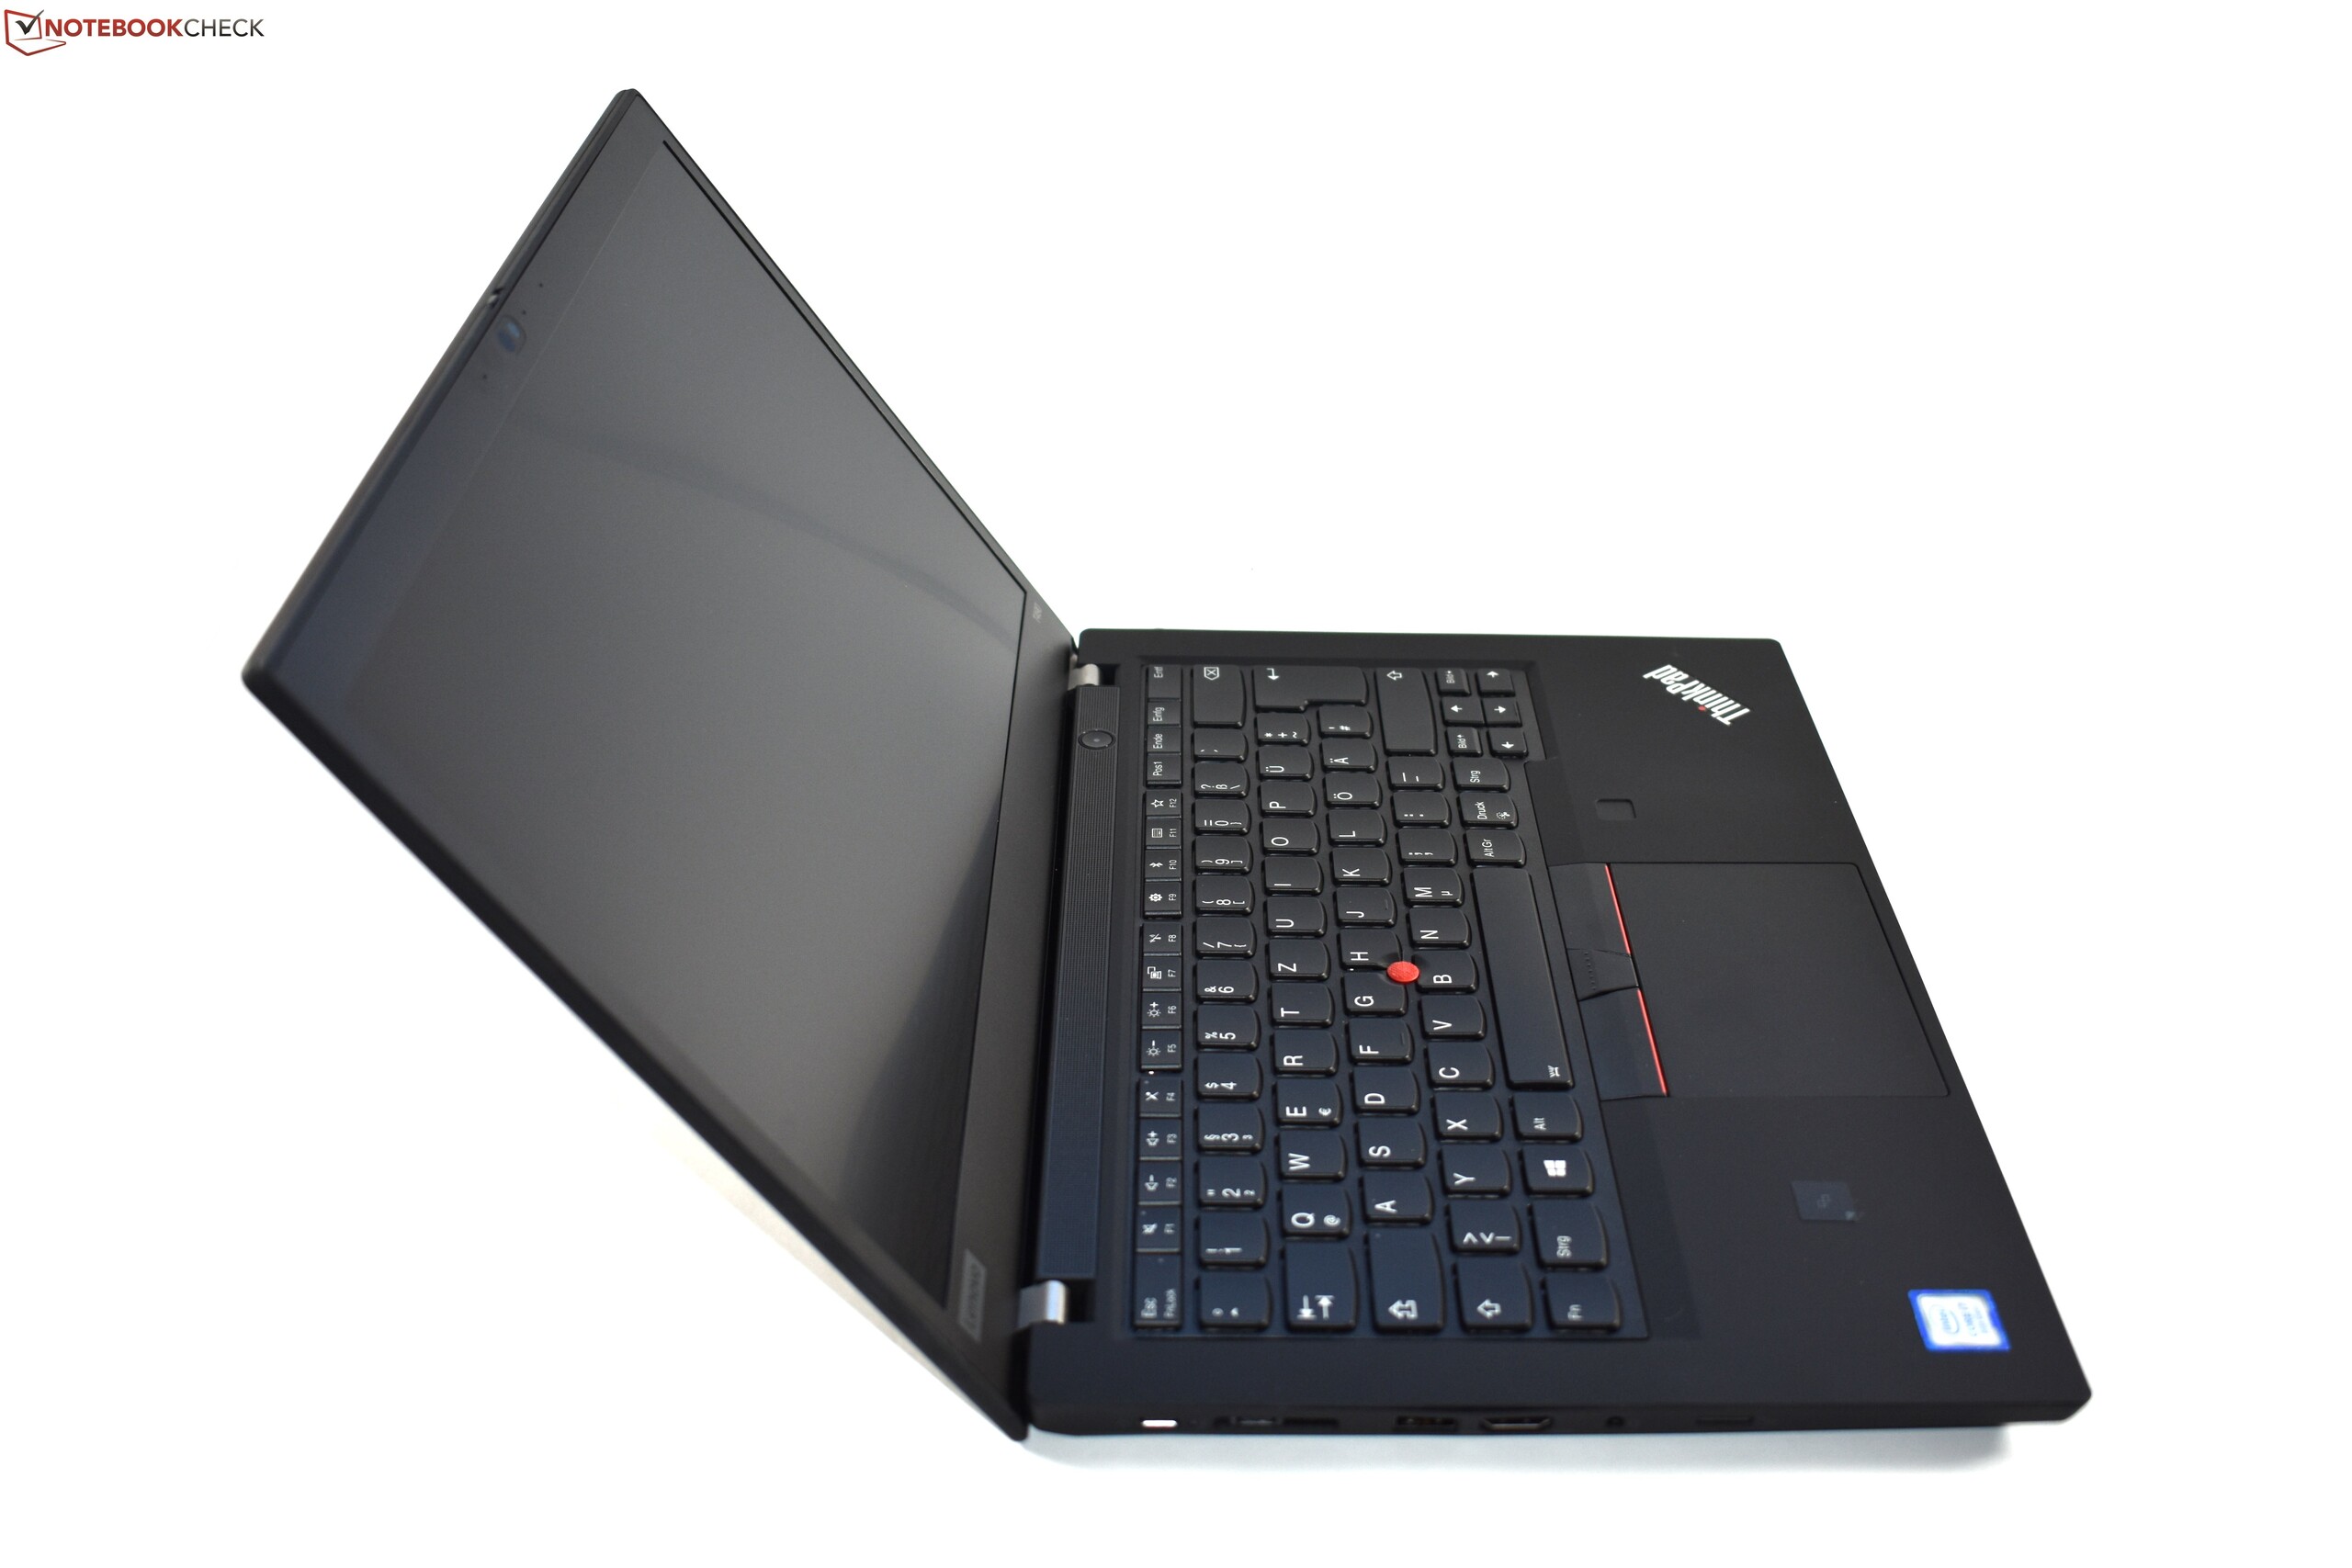
Non seulement le P43s hérite de l’excellent châssis du ThinkPad T490 identique, mais il en reprend également l’excellent clavier (rétroéclairé). Malheureusement, notre modèle de test ne possède pas de dalle IGZO comme le ThinkPad T490 que nous avons testé – cette dalle est quand même disponible dans la série P43s, et aurait été un meilleur choix. L’écran que nous avons ici est l’un des points faibles du P43s, parce que sa luminosité maximale est faible, et que sa couverture des espaces colorimétriques n’est pas extraordinaire. Ces deux problèmes ne devraient pas exister dans cette gamme de prix…
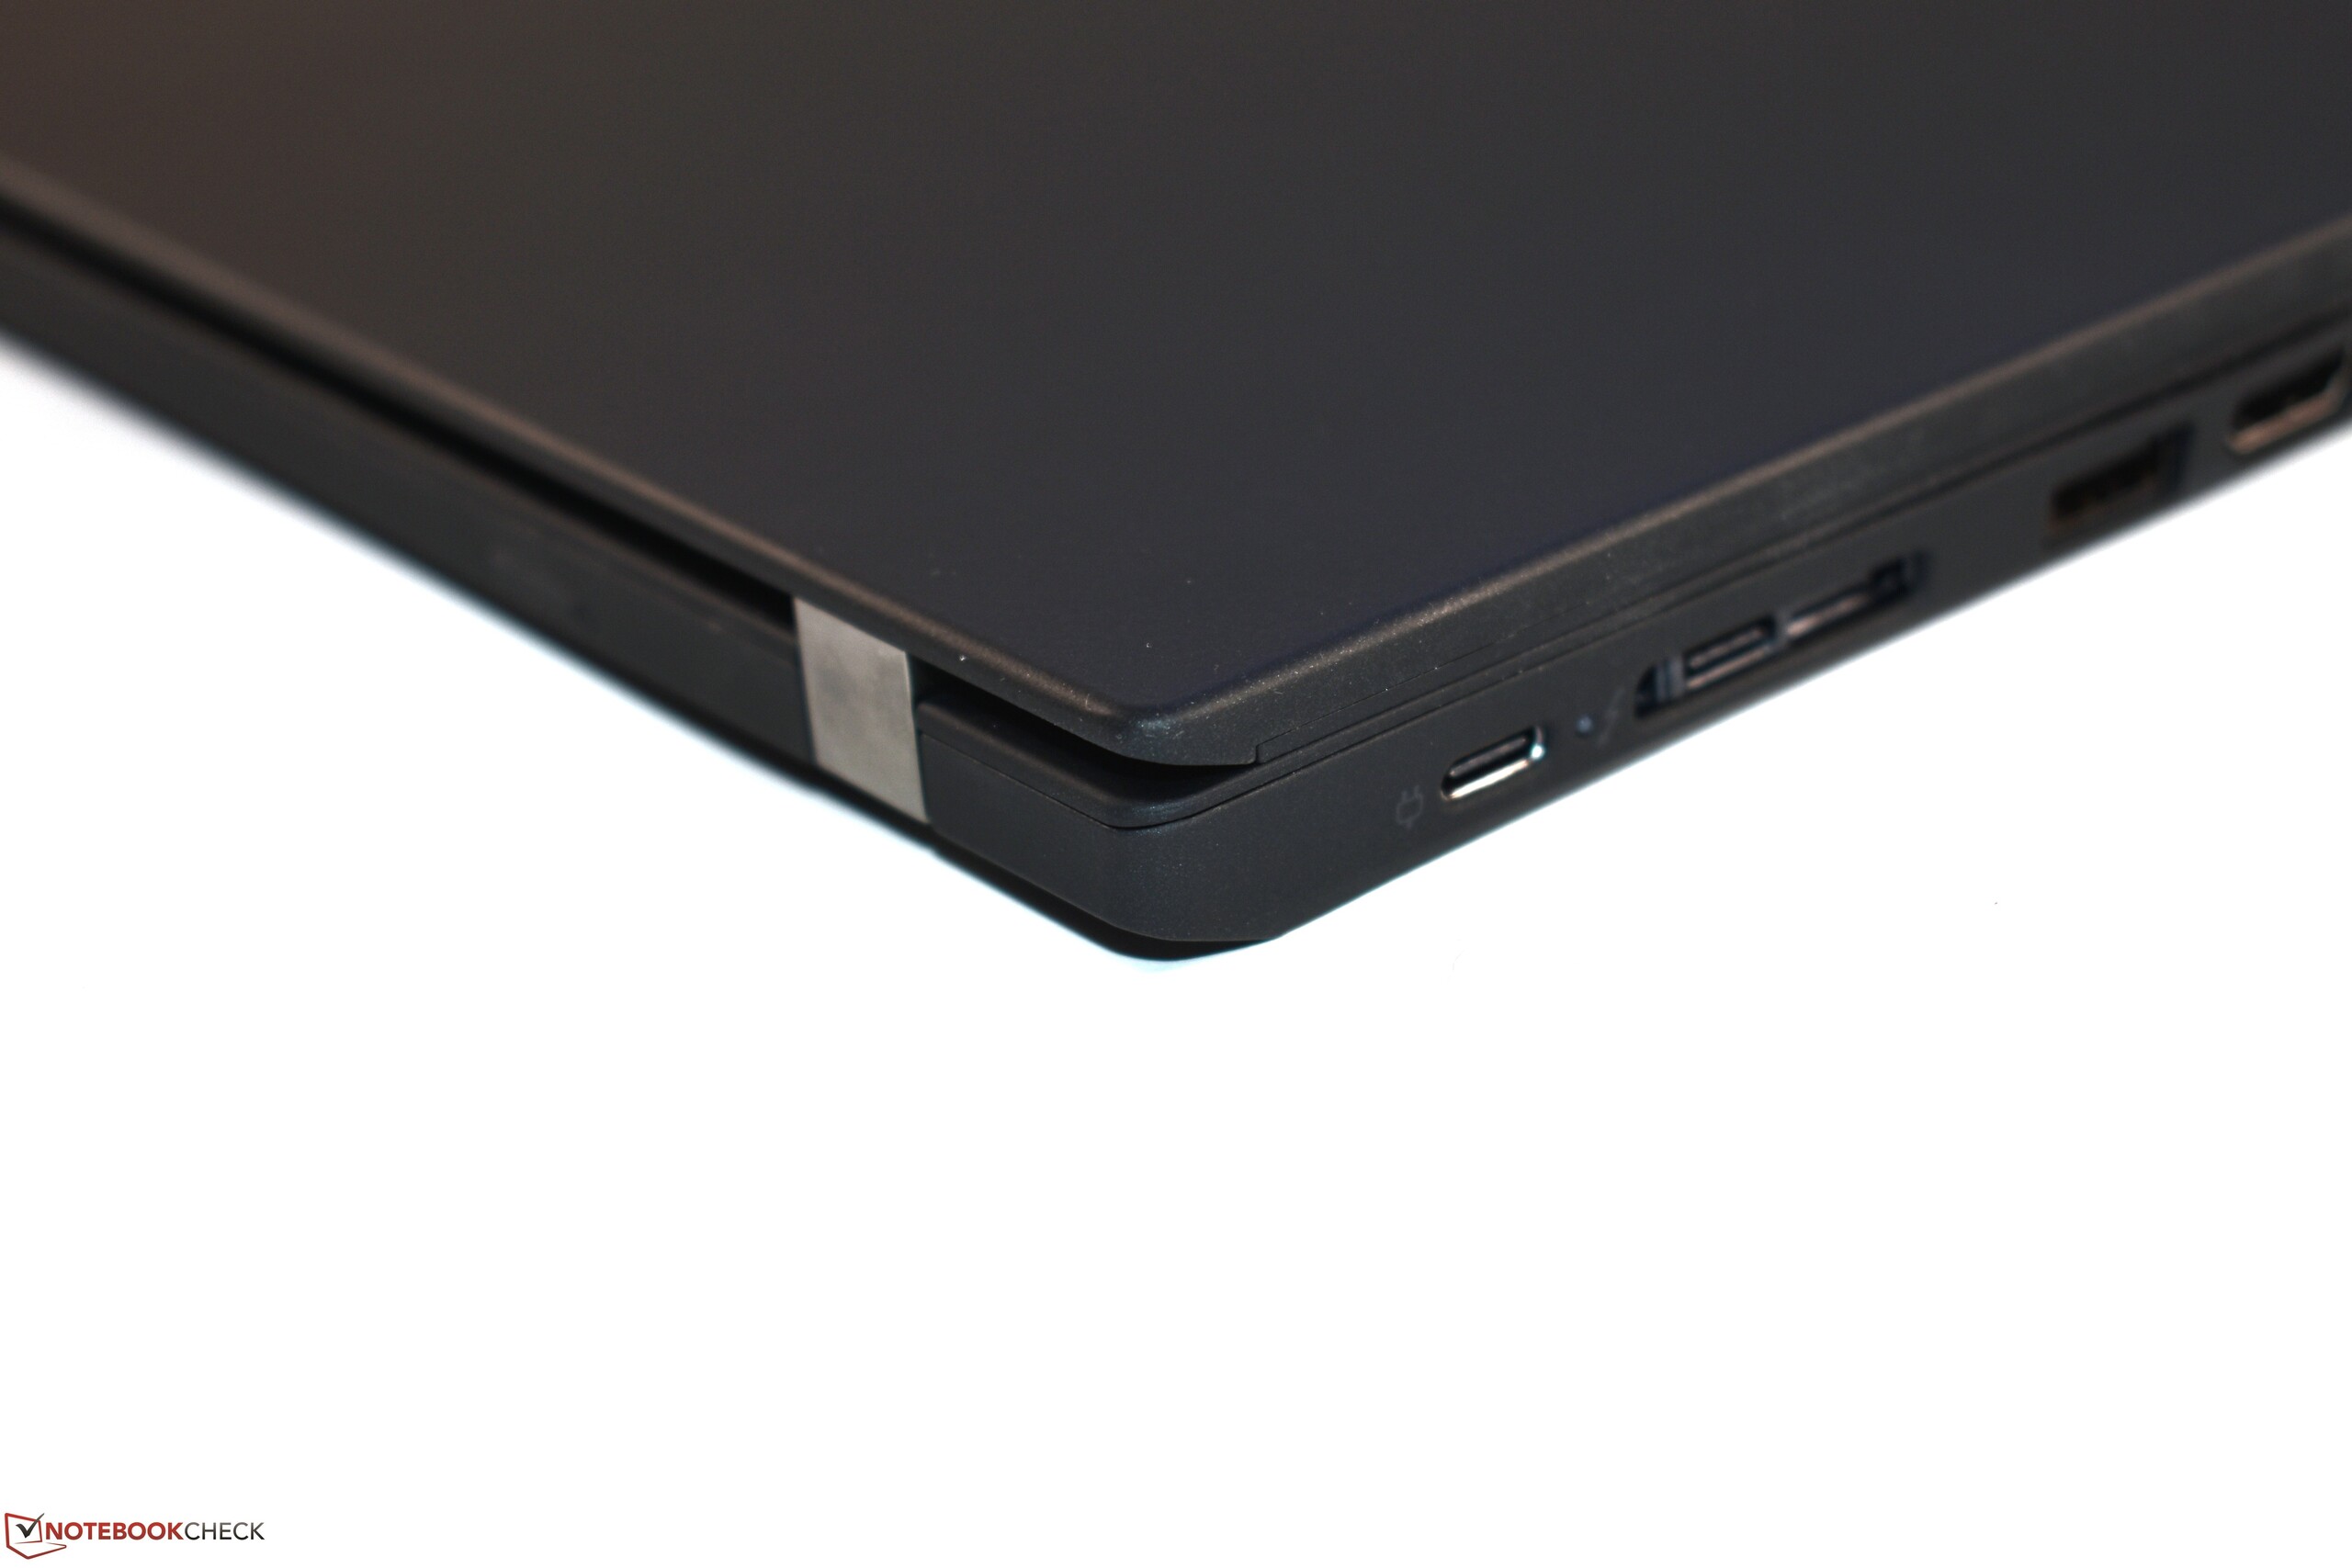
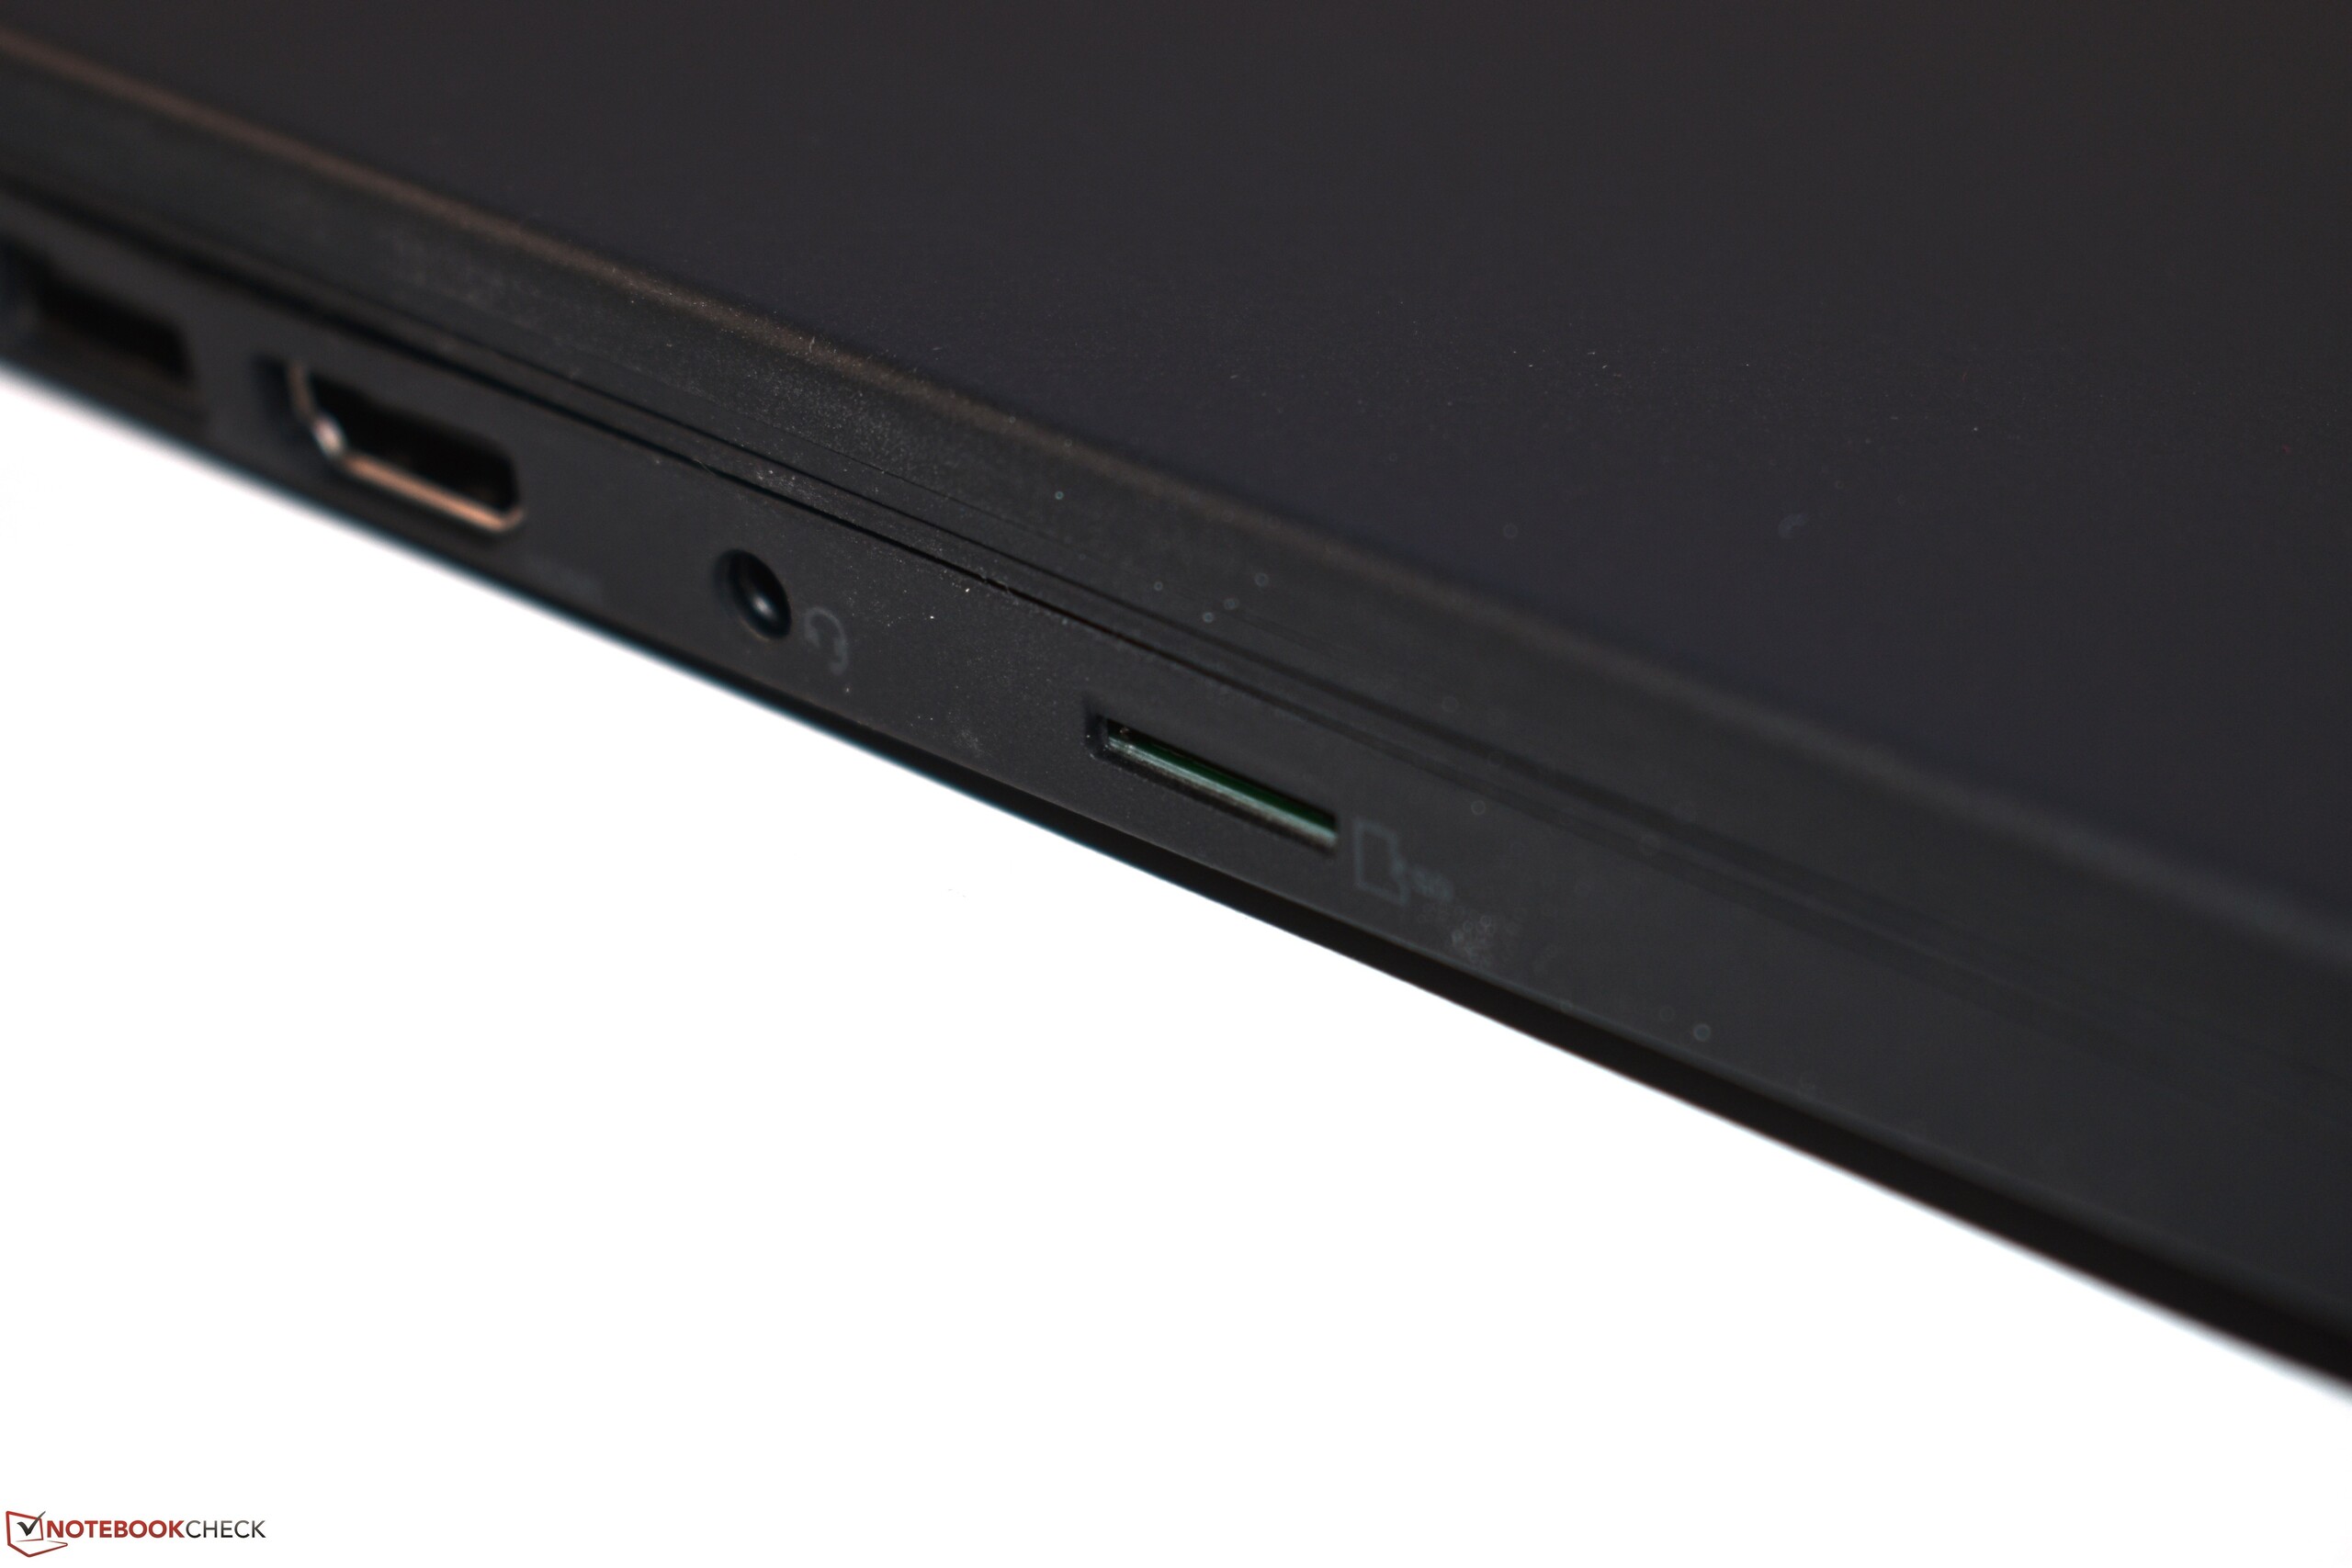
L’autonomie est bonne, et le SSD NVMe permet au système d’être réactif. Le tout est accompagné d’une garantie de trois ans. Le port Thunderbolt 3 doit également être signalé, et permet la connexion d’un GPU externe.
L’intégralité de cette critique est disponible en anglais en suivant ce lien.
Lenovo ThinkPad P43s-20RH001FGE
- 10/19/2019 v7 (old)
Sascha Mölck