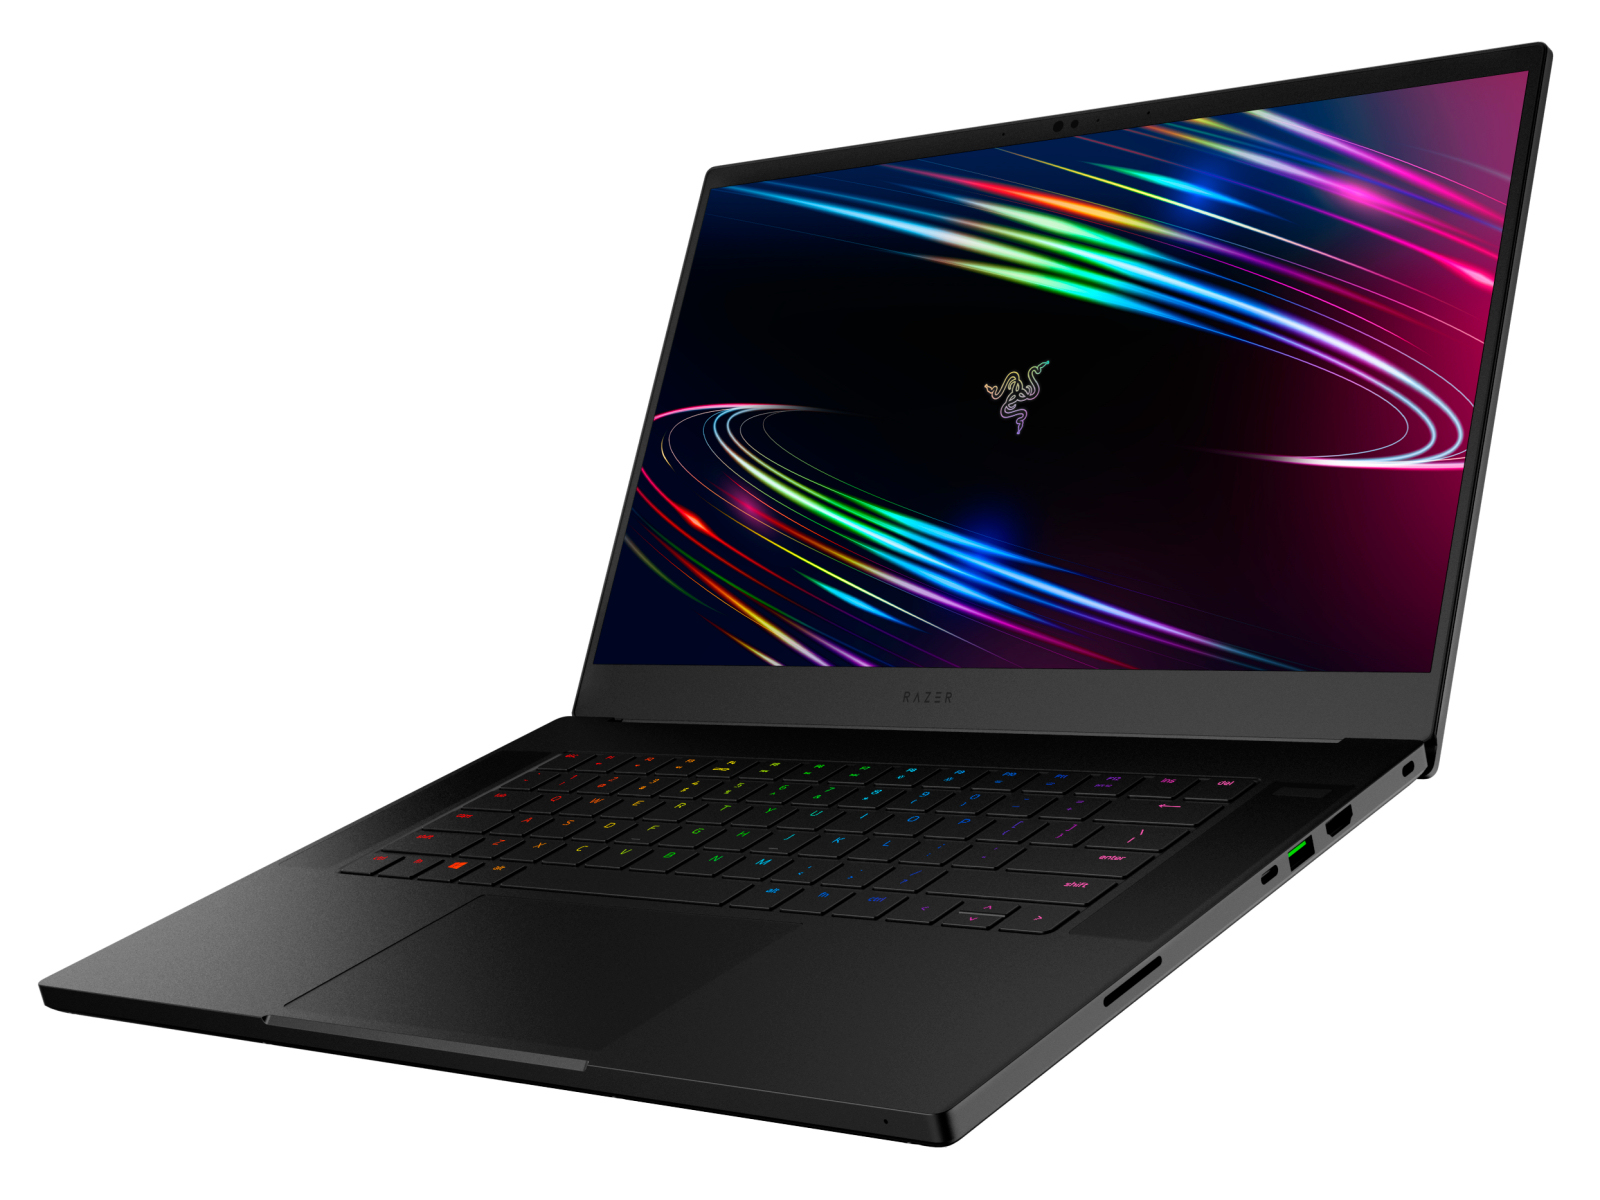
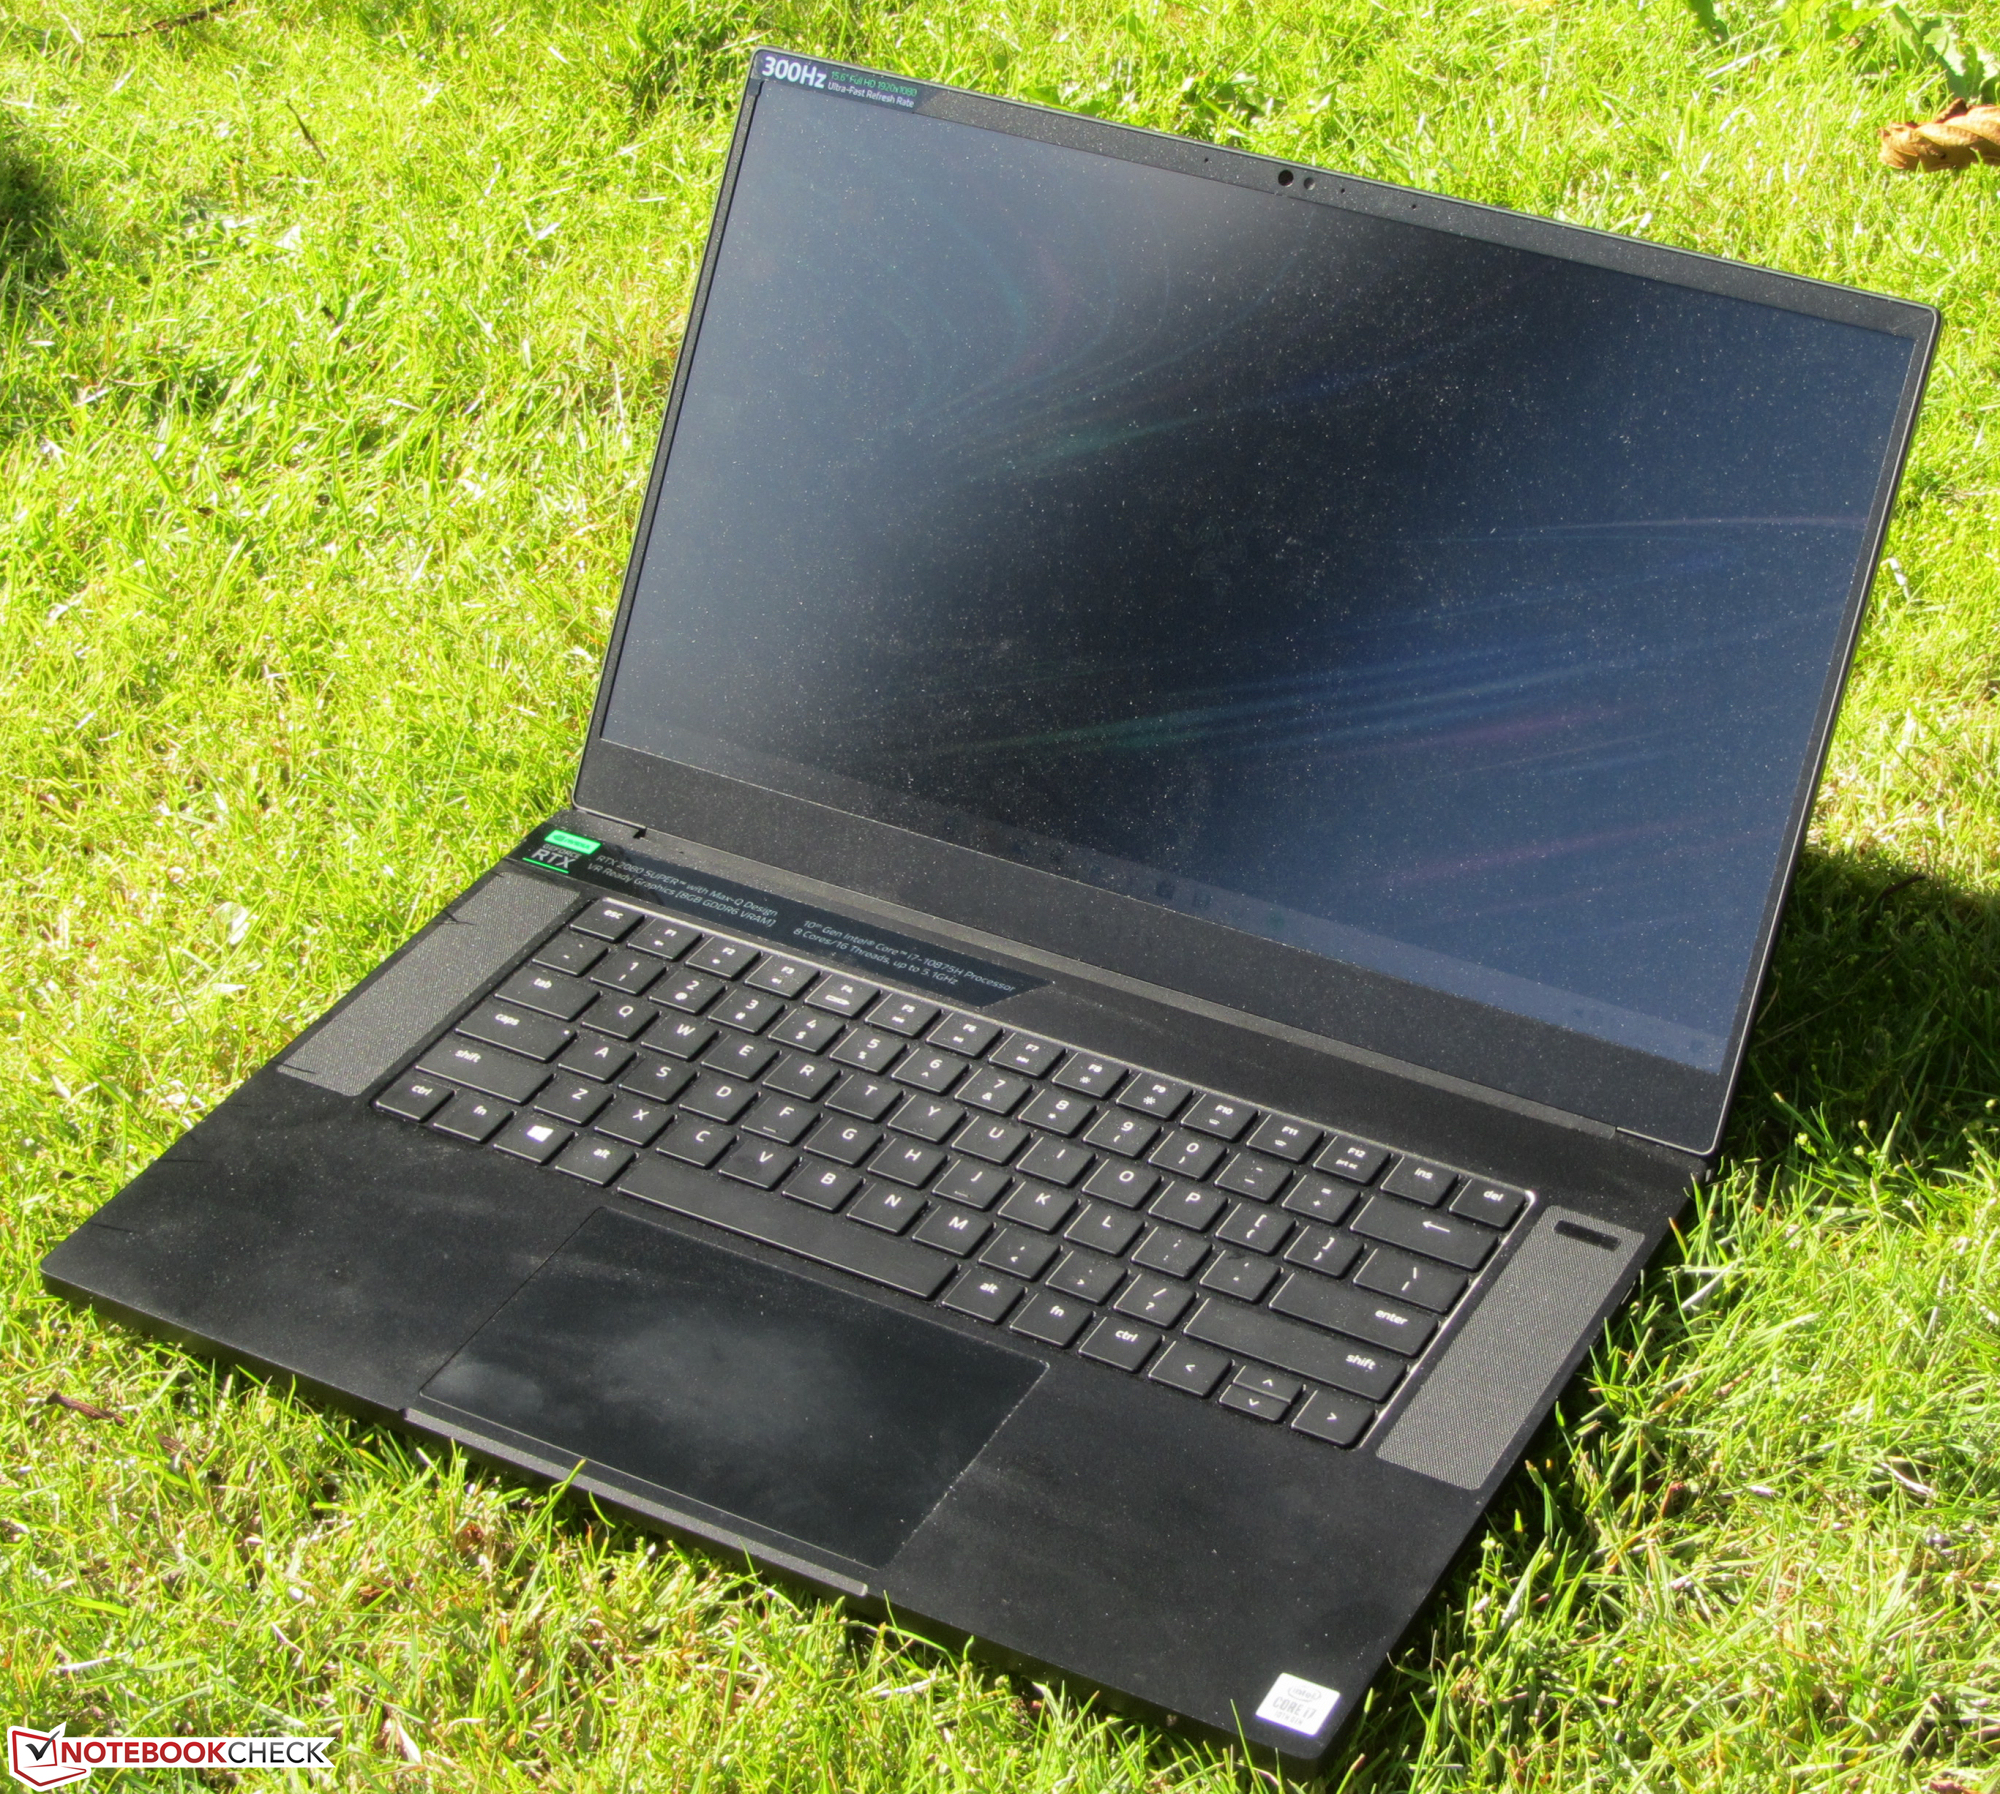
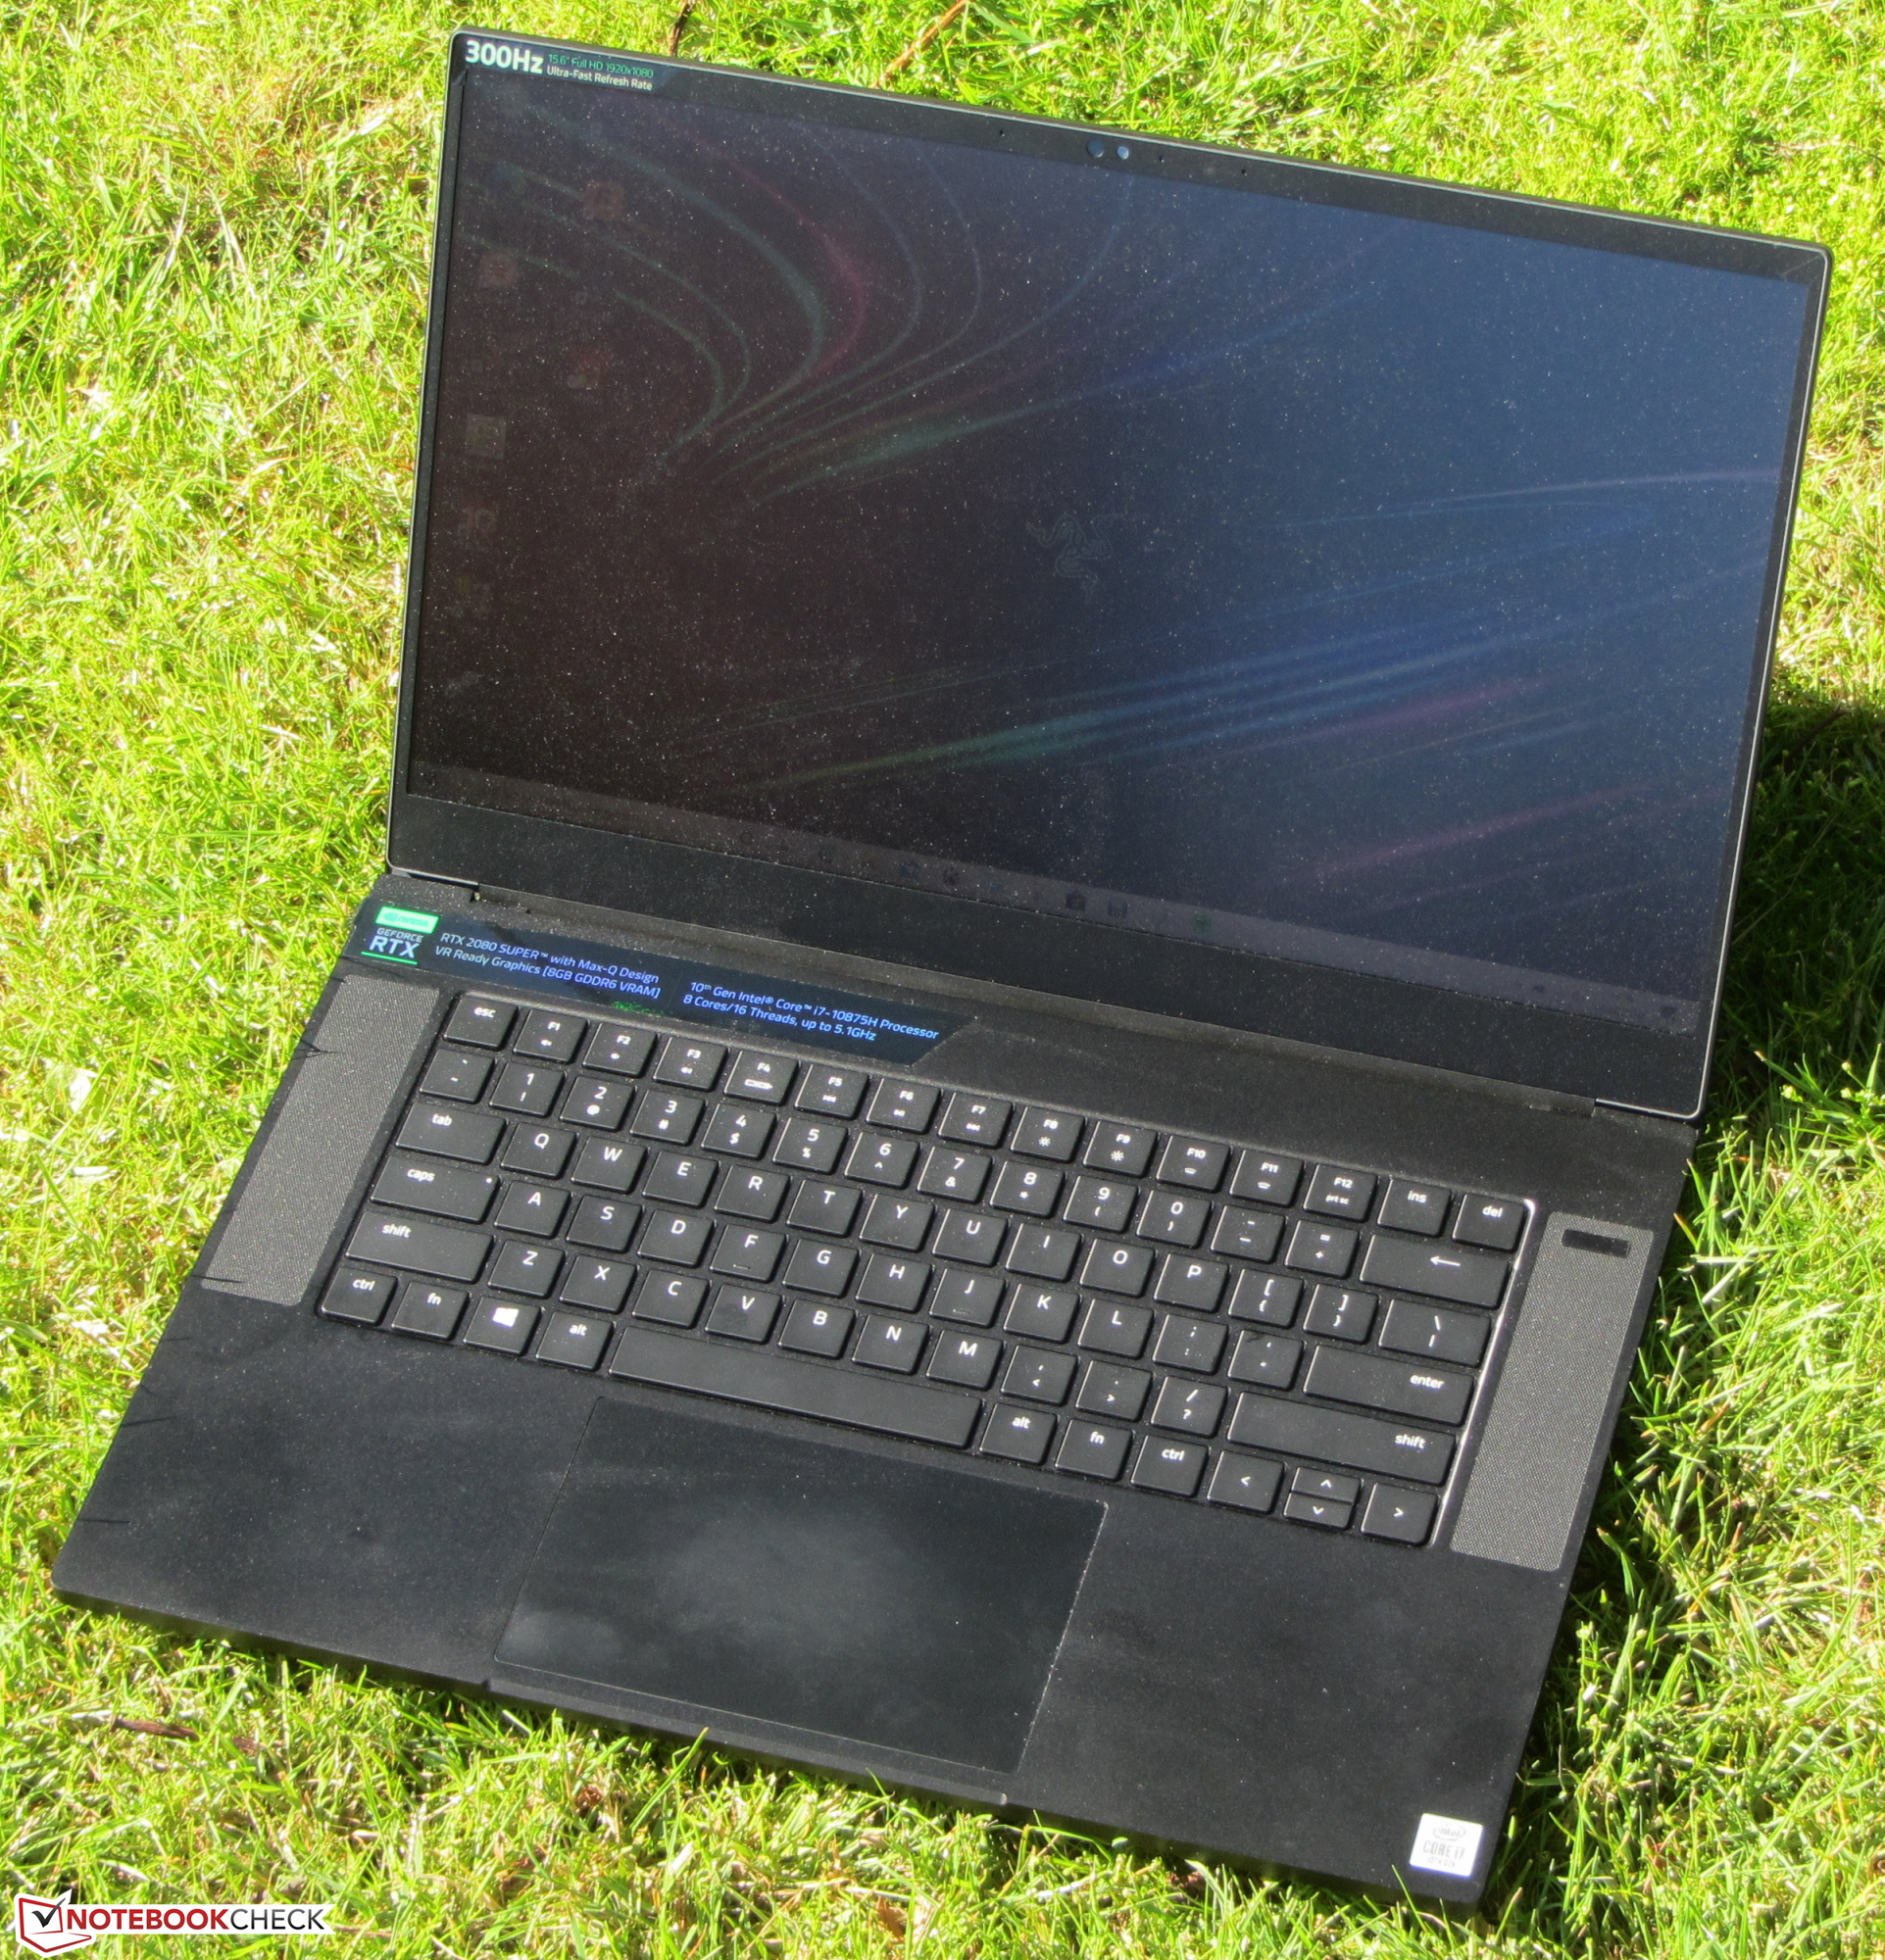
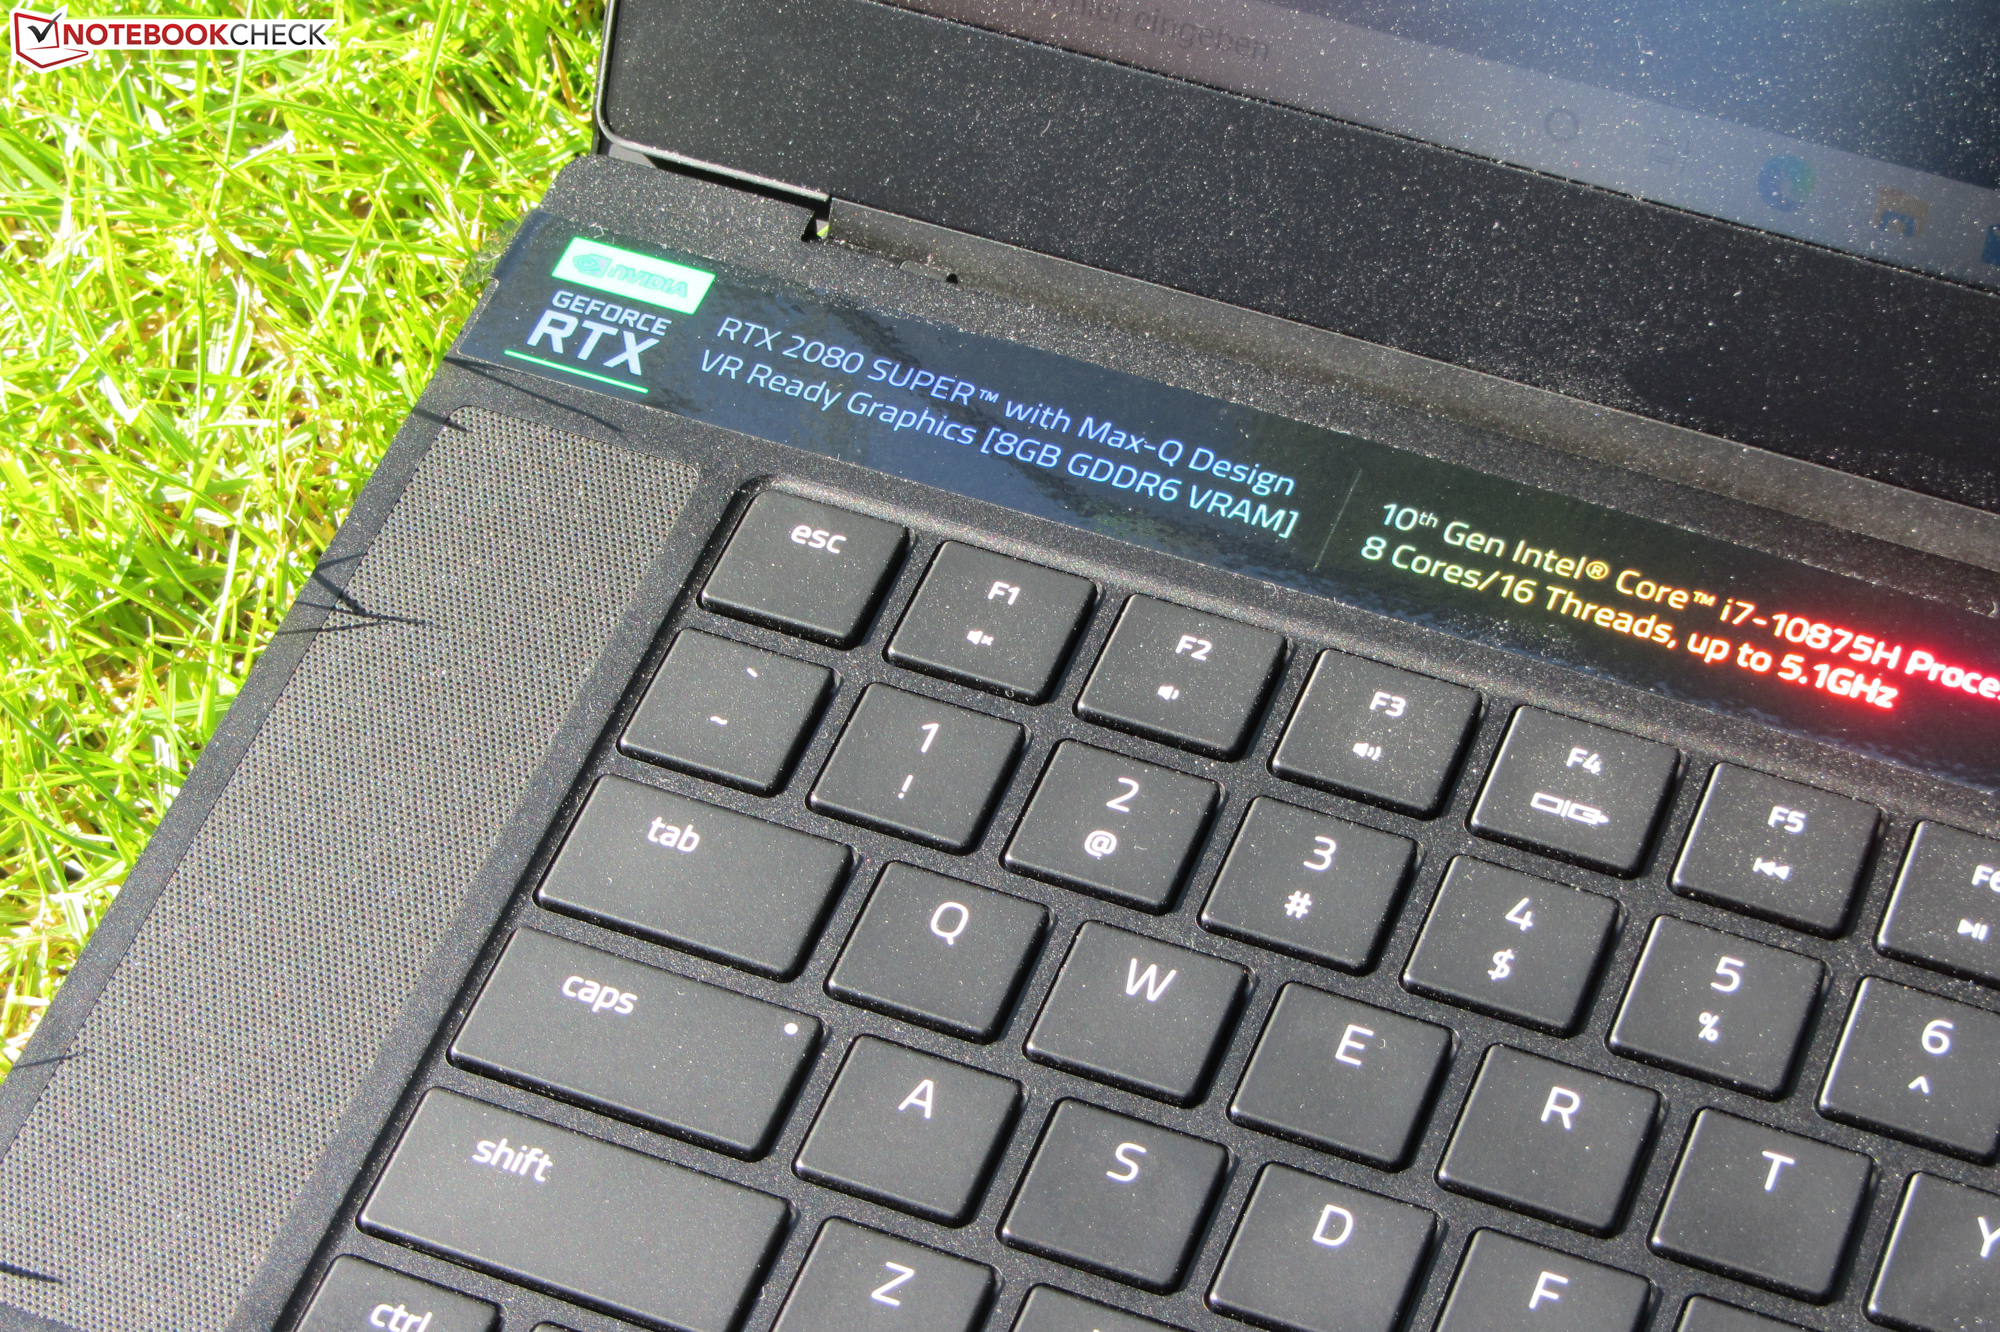
Test du Razer Blade 15 Modèle avancé 2020 (i7-10875H, RTX 2080 Super Max-Q, FHD, 300 Hz) : les détails comptent
Note | Date | Modèle | Poids | Épaisseur | Taille | Résolution | Prix |
|---|---|---|---|---|---|---|---|
| 85.9 % v7 (old) | 09/20 | Razer Blade 15 RTX 2080 Super Max-Q i7-10875H, GeForce RTX 2080 Super Max-Q | 2.2 kg | 17.8 mm | 15.60" | 1920x1080 | |
| 81.5 % v7 (old) | 04/19 | Asus Zephyrus S GX531GX i7-8750H, GeForce RTX 2080 Max-Q | 2.1 kg | 15.75 mm | 15.60" | 1920x1080 | |
| 85.8 % v7 (old) | 06/20 | Gigabyte Aero 15 OLED XB-8DE51B0SP i7-10875H, GeForce RTX 2070 Super Max-Q | 2.2 kg | 20 mm | 15.60" | 3840x2160 | |
| 84.6 % v7 (old) | 08/20 | MSI GE66 Raider 10SFS i9-10980HK, GeForce RTX 2070 Super Mobile | 2.4 kg | 23 mm | 15.60" | 1920x1080 | |
| 82.8 % v7 (old) | 11/19 | Schenker XMG Neo 15 XNE15M19 i7-9750H, GeForce RTX 2070 Max-Q | 2.1 kg | 22 mm | 15.60" | 1920x1080 |
| SD Card Reader | |
| average JPG Copy Test (av. of 3 runs) | |
| Gigabyte Aero 15 OLED XB-8DE51B0SP (Toshiba Exceria Pro SDXC 64 GB UHS-II) | |
| Razer Blade 15 RTX 2080 Super Max-Q (Toshiba Exceria Pro SDXC 64 GB UHS-II) | |
| MSI GE66 Raider 10SFS (Toshiba Exceria Pro SDXC 64 GB UHS-II) | |
| Moyenne de la classe Gaming (20.9 - 210, n=54, 2 dernières années) | |
| Schenker XMG Neo 15 XNE15M19 (Toshiba Exceria Pro SDXC 64 GB UHS-II) | |
| maximum AS SSD Seq Read Test (1GB) | |
| Gigabyte Aero 15 OLED XB-8DE51B0SP (Toshiba Exceria Pro SDXC 64 GB UHS-II) | |
| Razer Blade 15 RTX 2080 Super Max-Q (Toshiba Exceria Pro SDXC 64 GB UHS-II) | |
| MSI GE66 Raider 10SFS (Toshiba Exceria Pro SDXC 64 GB UHS-II) | |
| Moyenne de la classe Gaming (25.5 - 261, n=51, 2 dernières années) | |
| Schenker XMG Neo 15 XNE15M19 (Toshiba Exceria Pro SDXC 64 GB UHS-II) | |


| |||||||||||||||||||||||||
Homogénéité de la luminosité: 89 %
Valeur mesurée au centre, sur batterie: 347 cd/m²
Contraste: 1218:1 (Valeurs des noirs: 0.285 cd/m²)
ΔE ColorChecker Calman: 2.35 | ∀{0.5-29.43 Ø4.72}
calibrated: 1.16
ΔE Greyscale Calman: 3.04 | ∀{0.09-98 Ø4.97}
99% sRGB (Argyll 1.6.3 3D)
65% AdobeRGB 1998 (Argyll 1.6.3 3D)
71.4% AdobeRGB 1998 (Argyll 3D)
99% sRGB (Argyll 3D)
70.2% Display P3 (Argyll 3D)
Gamma: 2.35
CCT: 6658 K
| Razer Blade 15 RTX 2080 Super Max-Q AU Optronics B156HAN12.0, IPS, 1920x1080, 15.6" | Razer Blade 15 RTX 2080 Max-Q Sharp LQ156M1JW03 (SHP14C5), IPS, 1920x1080, 15.6" | Asus Zephyrus S GX531GX AU Optronics B156HAN08.2, IPS, 1920x1080, 15.6" | Gigabyte Aero 15 OLED XB-8DE51B0SP Samsung SDCA029, OLED, 3840x2160, 15.6" | MSI GE66 Raider 10SFS Sharp LQ156M1JW03 (SHP14C5), IPS-Level, 1920x1080, 15.6" | Schenker XMG Neo 15 XNE15M19 NV156FHM-N4G (BOE084D), IPS, 1920x1080, 15.6" | |
|---|---|---|---|---|---|---|
| Display | -3% | -7% | 27% | -2% | -9% | |
| Display P3 Coverage (%) | 70.2 | 66.9 -5% | 65.6 -7% | 99.9 42% | 68 -3% | 64 -9% |
| sRGB Coverage (%) | 99 | 98.1 -1% | 92.2 -7% | 100 1% | 99 0% | 90.3 -9% |
| AdobeRGB 1998 Coverage (%) | 71.4 | 68.5 -4% | 66.9 -6% | 98.2 38% | 69.8 -2% | 65.4 -8% |
| Response Times | -65% | -12% | 72% | -95% | -47% | |
| Response Time Grey 50% / Grey 80% * (ms) | 6 ? | 12.8 ? -113% | 7 ? -17% | 2.2 ? 63% | 16.4 ? -173% | 9.6 ? -60% |
| Response Time Black / White * (ms) | 9 ? | 10.4 ? -16% | 9.6 ? -7% | 1.8 ? 80% | 10.4 ? -16% | 12 ? -33% |
| PWM Frequency (Hz) | 23810 ? | 60 ? | 23580 ? | |||
| Screen | 0% | -22% | 2% | 9% | -19% | |
| Brightness middle (cd/m²) | 347 | 293 -16% | 323.6 -7% | 385 11% | 291 -16% | 313 -10% |
| Brightness (cd/m²) | 328 | 270 -18% | 315 -4% | 390 19% | 278 -15% | 295 -10% |
| Brightness Distribution (%) | 89 | 87 -2% | 91 2% | 93 4% | 91 2% | 89 0% |
| Black Level * (cd/m²) | 0.285 | 0.29 -2% | 0.29 -2% | 0.25 12% | 0.3 -5% | |
| Contrast (:1) | 1218 | 1010 -17% | 1116 -8% | 1164 -4% | 1043 -14% | |
| Colorchecker dE 2000 * | 2.35 | 1.69 28% | 3.31 -41% | 2.46 -5% | 1.19 49% | 3.33 -42% |
| Colorchecker dE 2000 max. * | 4.15 | 3.37 19% | 5.74 -38% | 4.01 3% | 3.04 27% | 6.25 -51% |
| Colorchecker dE 2000 calibrated * | 1.16 | 1.24 -7% | 2.73 -135% | 2.6 -124% | 1.77 -53% | |
| Greyscale dE 2000 * | 3.04 | 2.3 24% | 2.9 5% | 1.39 54% | 1.9 37% | 3.1 -2% |
| Gamma | 2.35 94% | 2.3 96% | 2.29 96% | 2.31 95% | 2.216 99% | 2.51 88% |
| CCT | 6658 98% | 6758 96% | 6765 96% | 6395 102% | 7018 93% | 6930 94% |
| Color Space (Percent of AdobeRGB 1998) (%) | 65 | 63 -3% | 59.7 -8% | 98 51% | 70 8% | 59 -9% |
| Color Space (Percent of sRGB) (%) | 99 | 98.5 -1% | 91.8 -7% | 100 1% | 92 -7% | 90 -9% |
| Moyenne finale (programmes/paramètres) | -23% /
-8% | -14% /
-18% | 34% /
17% | -29% /
-7% | -25% /
-20% |
* ... Moindre est la valeur, meilleures sont les performances
Temps de réponse de l'écran
| ↔ Temps de réponse noir à blanc | ||
|---|---|---|
| 9 ms ... hausse ↗ et chute ↘ combinées | ↗ 5 ms hausse | 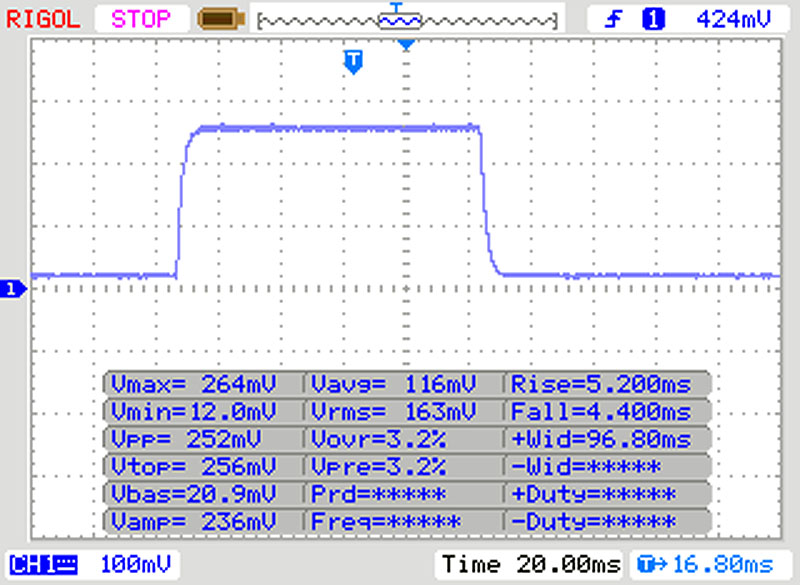 |
| ↘ 4 ms chute | ||
| L'écran montre de faibles temps de réponse, un bon écran pour jouer. En comparaison, tous les appareils testés affichent entre 0.1 (minimum) et 240 (maximum) ms. » 25 % des appareils testés affichent de meilleures performances. Cela signifie que les latences relevées sont meilleures que la moyenne (19.8 ms) de tous les appareils testés. | ||
| ↔ Temps de réponse gris 50% à gris 80% | ||
| 6 ms ... hausse ↗ et chute ↘ combinées | ↗ 3 ms hausse | 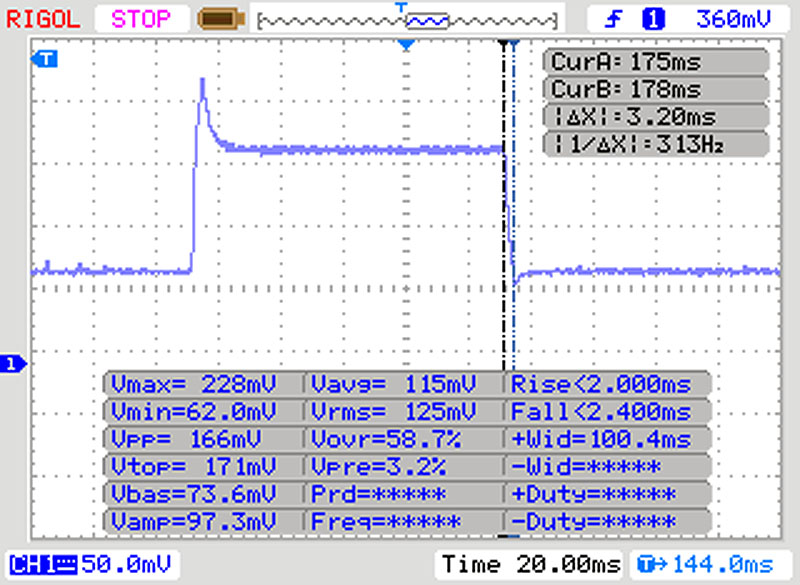 |
| ↘ 3 ms chute | ||
| L'écran montre de très faibles temps de réponse, parfait pour le jeu. En comparaison, tous les appareils testés affichent entre 0.165 (minimum) et 636 (maximum) ms. » 19 % des appareils testés affichent de meilleures performances. Cela signifie que les latences relevées sont meilleures que la moyenne (31 ms) de tous les appareils testés. | ||
Scintillement / MLI (Modulation de largeur d'impulsion)
| Scintillement / MLI (Modulation de largeur d'impulsion) non décelé |  | ||
En comparaison, 52 % des appareils testés n'emploient pas MDI pour assombrir leur écran. Nous avons relevé une moyenne à 7763 (minimum : 5 - maximum : 343500) Hz dans le cas où une MDI était active. | |||
| Cinebench R15 | |
| CPU Single 64Bit | |
| Moyenne de la classe Gaming (188.8 - 343, n=109, 2 dernières années) | |
| Gigabyte Aero 15 OLED XB-8DE51B0SP | |
| MSI GE66 Raider 10SFS | |
| Moyenne Intel Core i7-10875H (190 - 220, n=37) | |
| Razer Blade 15 RTX 2080 Super Max-Q (Boost) | |
| Razer Blade 15 RTX 2080 Super Max-Q (Hoch) | |
| Razer Blade 15 RTX 2080 Super Max-Q | |
| Razer Blade 15 RZ09-0328 | |
| Schenker XMG Neo 15 XNE15M19 | |
| Razer Blade 15 RTX 2080 Max-Q | |
| Asus Zephyrus S GX531GX | |
| CPU Multi 64Bit | |
| Moyenne de la classe Gaming (1578 - 6271, n=108, 2 dernières années) | |
| Gigabyte Aero 15 OLED XB-8DE51B0SP | |
| MSI GE66 Raider 10SFS | |
| Moyenne Intel Core i7-10875H (1003 - 1833, n=38) | |
| Razer Blade 15 RTX 2080 Super Max-Q (Boost) | |
| Razer Blade 15 RTX 2080 Super Max-Q (Hoch) | |
| Razer Blade 15 RTX 2080 Super Max-Q | |
| Schenker XMG Neo 15 XNE15M19 | |
| Razer Blade 15 RTX 2080 Max-Q | |
| Razer Blade 15 RZ09-0328 | |
| Asus Zephyrus S GX531GX | |
* ... Moindre est la valeur, meilleures sont les performances
| PCMark 8 Home Score Accelerated v2 | 4665 points | |
| PCMark 8 Creative Score Accelerated v2 | 4352 points | |
| PCMark 8 Work Score Accelerated v2 | 6340 points | |
| PCMark 10 Score | 5093 points | |
Aide | ||
| DPC Latencies / LatencyMon - interrupt to process latency (max), Web, Youtube, Prime95 | |
| Gigabyte Aero 15 OLED XB-8DE51B0SP | |
| MSI GE66 Raider 10SFS | |
| Razer Blade 15 RZ09-0328 | |
| Razer Blade 15 RTX 2080 Super Max-Q | |
* ... Moindre est la valeur, meilleures sont les performances

| Razer Blade 15 RTX 2080 Super Max-Q Samsung PM981a MZVLB1T0HBLR | Razer Blade 15 RTX 2080 Max-Q Samsung SSD PM981 MZVLB512HAJQ | Asus Zephyrus S GX531GX Intel SSD 660p SSDPEKNW512G8 | Gigabyte Aero 15 OLED XB-8DE51B0SP Intel Optane Memory H10 with Solid State Storage 32GB + 512GB HBRPEKNX0202A(L/H) | MSI GE66 Raider 10SFS WDC PC SN730 SDBPNTY-1T00 | Schenker XMG Neo 15 XNE15M19 Seagate FireCuda 510 SSD ZP1000GM30001 | Razer Blade 15 RZ09-0328 Lite-On CA5-8D512 | Moyenne Samsung PM981a MZVLB1T0HBLR | |
|---|---|---|---|---|---|---|---|---|
| CrystalDiskMark 5.2 / 6 | -13% | -41% | 0% | 6% | -18% | -1% | -2% | |
| Write 4K (MB/s) | 135.7 | 137.2 1% | 93.9 -31% | 127.4 -6% | 158.2 17% | 108.7 -20% | 118.7 -13% | 139.7 ? 3% |
| Read 4K (MB/s) | 46.98 | 46.82 0% | 46.29 -1% | 147.5 214% | 50.7 8% | 41.4 -12% | 52.4 12% | 49.9 ? 6% |
| Write Seq (MB/s) | 2180 | 1221 -44% | 974 -55% | 485.9 -78% | 1790 -18% | 1083 -50% | 2247 3% | 2036 ? -7% |
| Read Seq (MB/s) | 1949 | 1217 -38% | 1425 -27% | 1352 -31% | 2469 27% | 917 -53% | 2234 15% | 2014 ? 3% |
| Write 4K Q32T1 (MB/s) | 510 | 527 3% | 259.4 -49% | 476.5 -7% | 503 -1% | 468.5 -8% | 515 1% | 461 ? -10% |
| Read 4K Q32T1 (MB/s) | 569 | 614 8% | 296.5 -48% | 531 -7% | 579 2% | 530 -7% | 584 3% | 499 ? -12% |
| Write Seq Q32T1 (MB/s) | 2984 | 1986 -33% | 977 -67% | 1061 -64% | 3102 4% | 3057 2% | 2235 -25% | 2903 ? -3% |
| Read Seq Q32T1 (MB/s) | 3238 | 3234 0% | 1666 -49% | 2552 -21% | 3413 5% | 3422 6% | 3171 -2% | 3479 ? 7% |
| AS SSD | -4% | -37% | -37% | 21% | 14% | -24% | 5% | |
| Seq Read (MB/s) | 1950 | 1832 -6% | 1239 -36% | 1200 -38% | 2979 53% | 2341 20% | 2021 4% | 2553 ? 31% |
| Seq Write (MB/s) | 2322 | 1864 -20% | 920 -60% | 836 -64% | 2581 11% | 2575 11% | 2090 -10% | 2084 ? -10% |
| 4K Read (MB/s) | 45.48 | 52.1 15% | 45.74 1% | 65.8 45% | 47.33 4% | 51 12% | 47.71 5% | 53.1 ? 17% |
| 4K Write (MB/s) | 95.4 | 108.3 14% | 95.7 0% | 103.8 9% | 140 47% | 118.6 24% | 101.1 6% | 131.2 ? 38% |
| 4K-64 Read (MB/s) | 1484 | 1159 -22% | 322 -78% | 789 -47% | 1710 15% | 1637 10% | 856 -42% | 1477 ? 0% |
| 4K-64 Write (MB/s) | 1887 | 1807 -4% | 722 -62% | 929 -51% | 2188 16% | 2442 29% | 1041 -45% | 1805 ? -4% |
| Access Time Read * (ms) | 0.051 | 0.05 2% | 0.073 -43% | 0.103 -102% | 0.05 2% | 0.066 -29% | 0.052 -2% | 0.04983 ? 2% |
| Access Time Write * (ms) | 0.038 | 0.034 11% | 0.047 -24% | 0.045 -18% | 0.026 32% | 0.028 26% | 0.111 -192% | 0.04222 ? -11% |
| Score Read (Points) | 1725 | 1394 -19% | 492 -71% | 975 -43% | 2055 19% | 1922 11% | 1105 -36% | 1786 ? 4% |
| Score Write (Points) | 2215 | 2102 -5% | 910 -59% | 1117 -50% | 2586 17% | 2818 27% | 1351 -39% | 2144 ? -3% |
| Score Total (Points) | 4843 | 4221 -13% | 1654 -66% | 2594 -46% | 5673 17% | 5738 18% | 3037 -37% | 4826 ? 0% |
| Copy ISO MB/s (MB/s) | 1903 | 2083 9% | 1236 -35% | 2474 30% | 2098 ? 10% | |||
| Copy Program MB/s (MB/s) | 505 | 496.5 -2% | 703 39% | 679 34% | 500 ? -1% | |||
| Copy Game MB/s (MB/s) | 1113 | 977 -12% | 812 -27% | 1037 -7% | 1132 ? 2% | |||
| Moyenne finale (programmes/paramètres) | -9% /
-7% | -39% /
-39% | -19% /
-21% | 14% /
15% | -2% /
1% | -13% /
-15% | 2% /
3% |
* ... Moindre est la valeur, meilleures sont les performances
Continuous load read: DiskSpd Read Loop, Queue Depth 8
| 3DMark 11 Performance | 20888 points | |
| 3DMark Cloud Gate Standard Score | 32880 points | |
| 3DMark Fire Strike Score | 17148 points | |
| 3DMark Time Spy Score | 7683 points | |
Aide | ||
| The Witcher 3 - 1920x1080 Ultra Graphics & Postprocessing (HBAO+) | |
| Moyenne de la classe Gaming (95 - 240, n=7, 2 dernières années) | |
| Razer Blade 15 RTX 2080 Super Max-Q (GPU: Hoch) | |
| Razer Blade 15 RTX 2080 Super Max-Q | |
| Moyenne NVIDIA GeForce RTX 2080 Super Max-Q (74.3 - 96, n=11) | |
| MSI GE66 Raider 10SFS | |
| Asus Zephyrus S GX531GX | |
| Gigabyte Aero 15 OLED XB-8DE51B0SP | |
| Razer Blade 15 RTX 2080 Max-Q | |
| Razer Blade 15 RZ09-0328 | |
| Schenker XMG Neo 15 XNE15M19 | |
| BioShock Infinite - 1920x1080 Ultra Preset, DX11 (DDOF) | |
| Moyenne NVIDIA GeForce RTX 2080 Super Max-Q (170.2 - 181.1, n=4) | |
| Razer Blade 15 RTX 2080 Super Max-Q | |
| Razer Blade 15 RTX 2080 Max-Q | |
| Asus Zephyrus S GX531GX | |
| Shadow of the Tomb Raider - 1920x1080 Highest Preset AA:T | |
| MSI GE66 Raider 10SFS | |
| Moyenne de la classe Gaming (96 - 116, n=2, 2 dernières années) | |
| Gigabyte Aero 15 OLED XB-8DE51B0SP | |
| Moyenne NVIDIA GeForce RTX 2080 Super Max-Q (89 - 106, n=10) | |
| Razer Blade 15 RTX 2080 Super Max-Q | |
| Razer Blade 15 RTX 2080 Super Max-Q (GPU: Hoch) | |
| Razer Blade 15 RZ09-0328 | |
| Far Cry 5 - 1920x1080 Ultra Preset AA:T | |
| Moyenne de la classe Gaming (70 - 151, n=8, 2 dernières années) | |
| Moyenne NVIDIA GeForce RTX 2080 Super Max-Q (91 - 110, n=4) | |
| Razer Blade 15 RTX 2080 Super Max-Q | |
| Battlefield V - 1920x1080 Ultra Preset | |
| MSI GE66 Raider 10SFS | |
| Gigabyte Aero 15 OLED XB-8DE51B0SP | |
| Moyenne NVIDIA GeForce RTX 2080 Super Max-Q (109.7 - 125, n=4) | |
| Razer Blade 15 RTX 2080 Super Max-Q | |
| Borderlands 3 - 1920x1080 Badass Overall Quality (DX11) | |
| MSI GE66 Raider 10SFS | |
| Moyenne NVIDIA GeForce RTX 2080 Super Max-Q (62.5 - 71.6, n=4) | |
| Gigabyte Aero 15 OLED XB-8DE51B0SP | |
| Razer Blade 15 RTX 2080 Super Max-Q | |
| Razer Blade 15 RZ09-0328 | |
| Schenker XMG Neo 15 XNE15M19 | |
| Red Dead Redemption 2 - 1920x1080 Maximum Settings | |
| MSI GE66 Raider 10SFS | |
| Moyenne NVIDIA GeForce RTX 2080 Super Max-Q (40.6 - 45, n=5) | |
| Gigabyte Aero 15 OLED XB-8DE51B0SP | |
| Razer Blade 15 RTX 2080 Super Max-Q | |
| Doom Eternal - 1920x1080 Ultra Preset | |
| MSI GE66 Raider 10SFS | |
| Moyenne NVIDIA GeForce RTX 2080 Super Max-Q (140 - 177.7, n=8) | |
| Razer Blade 15 RTX 2080 Super Max-Q | |
| Bas | Moyen | Élevé | Ultra | |
|---|---|---|---|---|
| BioShock Infinite (2013) | 347.4 | 330.2 | 300.5 | 173 |
| The Witcher 3 (2015) | 308.4 | 239.9 | 153.2 | 87.7 |
| Dota 2 Reborn (2015) | 134.3 | 128.7 | 117.4 | 115 |
| X-Plane 11.11 (2018) | 109 | 95.8 | 80.8 | |
| Far Cry 5 (2018) | 111 | 100 | 96 | 91 |
| Shadow of the Tomb Raider (2018) | 117 | 104 | 100 | 93 |
| Battlefield V (2018) | 154.3 | 124.7 | 116.2 | 109.7 |
| Metro Exodus (2019) | 131 | 93.2 | 70.3 | 57.2 |
| Total War: Three Kingdoms (2019) | 227.8 | 123.8 | 83.8 | 61 |
| Control (2019) | 221.7 | 96.6 | 71 | |
| Borderlands 3 (2019) | 128.3 | 101.6 | 78.2 | 62.5 |
| Ghost Recon Breakpoint (2019) | 130 | 95 | 88 | 66 |
| Call of Duty Modern Warfare 2019 (2019) | 165.5 | 114.1 | 96.4 | 93.8 |
| Star Wars Jedi Fallen Order (2019) | 99.5 | 94.1 | 88.7 | |
| Red Dead Redemption 2 (2019) | 113.3 | 96.5 | 62.7 | 40.6 |
| Doom Eternal (2020) | 212.2 | 165.1 | 147.9 | 144.4 |
| Gears Tactics (2020) | 188.8 | 171.6 | 122.2 | 82.9 |
| F1 2020 (2020) | 219 | 174 | 150 | 115 |
| Death Stranding (2020) | 139.8 | 118.7 | 108.6 | 104.5 |
Degré de la nuisance sonore
| Au repos |
| 30.1 / 30.1 / 30.1 dB(A) |
| Fortement sollicité |
| 46.8 / 46 dB(A) |
 | ||
30 dB silencieux 40 dB(A) audible 50 dB(A) bruyant |
||
min: | ||
| Razer Blade 15 RTX 2080 Super Max-Q i7-10875H, GeForce RTX 2080 Super Max-Q | Razer Blade 15 RTX 2080 Max-Q i7-9750H, GeForce RTX 2080 Max-Q | Asus Zephyrus S GX531GX i7-8750H, GeForce RTX 2080 Max-Q | Gigabyte Aero 15 OLED XB-8DE51B0SP i7-10875H, GeForce RTX 2070 Super Max-Q | MSI GE66 Raider 10SFS i9-10980HK, GeForce RTX 2070 Super Mobile | Schenker XMG Neo 15 XNE15M19 i7-9750H, GeForce RTX 2070 Max-Q | Moyenne NVIDIA GeForce RTX 2080 Super Max-Q | Moyenne de la classe Gaming | |
|---|---|---|---|---|---|---|---|---|
| Noise | 8% | -7% | -13% | -15% | -9% | -4% | 6% | |
| arrêt / environnement * (dB) | 30.1 | 28.3 6% | 28.7 5% | 30 -0% | 30 -0% | 31 -3% | 27.9 ? 7% | 24.1 ? 20% |
| Idle Minimum * (dB) | 30.1 | 28.8 4% | 29.8 1% | 34 -13% | 30 -0% | 31 -3% | 29.7 ? 1% | 25.9 ? 14% |
| Idle Average * (dB) | 30.1 | 28.8 4% | 32.4 -8% | 36 -20% | 35 -16% | 34 -13% | 30.8 ? -2% | 27.5 ? 9% |
| Idle Maximum * (dB) | 30.1 | 29 4% | 38 -26% | 41 -36% | 44 -46% | 37 -23% | 35.4 ? -18% | 30 ? -0% |
| Load Average * (dB) | 46.8 | 33.5 28% | 38.2 18% | 48 -3% | 53 -13% | 47 -0% | 47.2 ? -1% | 43 ? 8% |
| Witcher 3 ultra * (dB) | 48.4 | 45 7% | 56.6 -17% | 48 1% | 53 -10% | 50 -3% | ||
| Load Maximum * (dB) | 46 | 45.2 2% | 56.6 -23% | 54 -17% | 55 -20% | 54 -17% | 49.6 ? -8% | 54.2 ? -18% |
* ... Moindre est la valeur, meilleures sont les performances
(-) La température maximale du côté supérieur est de 52 °C / 126 F, par rapport à la moyenne de 40.4 °C / 105 F, allant de 21.2 à 68.8 °C pour la classe Gaming.
(-) Le fond chauffe jusqu'à un maximum de 53 °C / 127 F, contre une moyenne de 43.2 °C / 110 F
(+) En utilisation inactive, la température moyenne du côté supérieur est de 28.3 °C / 83 F, par rapport à la moyenne du dispositif de 33.9 °C / 93 F.
(-) En jouant à The Witcher 3, la température moyenne du côté supérieur est de 39.9 °C / 104 F, alors que la moyenne de l'appareil est de 33.9 °C / 93 F.
(-) Les repose-poignets et le pavé tactile peuvent devenir très chauds au toucher, avec un maximum de 41.2 °C / 106.2# F.
(-) La température moyenne de la zone de l'appui-paume de dispositifs similaires était de 28.8 °C / 83.8 F (-12.4 °C / #-22.4 F).
| Razer Blade 15 RTX 2080 Super Max-Q i7-10875H, GeForce RTX 2080 Super Max-Q | Razer Blade 15 RTX 2080 Max-Q i7-9750H, GeForce RTX 2080 Max-Q | Asus Zephyrus S GX531GX i7-8750H, GeForce RTX 2080 Max-Q | Gigabyte Aero 15 OLED XB-8DE51B0SP i7-10875H, GeForce RTX 2070 Super Max-Q | MSI GE66 Raider 10SFS i9-10980HK, GeForce RTX 2070 Super Mobile | Schenker XMG Neo 15 XNE15M19 i7-9750H, GeForce RTX 2070 Max-Q | Moyenne NVIDIA GeForce RTX 2080 Super Max-Q | Moyenne de la classe Gaming | |
|---|---|---|---|---|---|---|---|---|
| Heat | 4% | 3% | 1% | -2% | -12% | 1% | 1% | |
| Maximum Upper Side * (°C) | 52 | 47 10% | 47 10% | 49 6% | 49 6% | 60 -15% | 47.9 ? 8% | 45.2 ? 13% |
| Maximum Bottom * (°C) | 53 | 49.2 7% | 48.6 8% | 61 -15% | 52 2% | 66 -25% | 51.9 ? 2% | 48.2 ? 9% |
| Idle Upper Side * (°C) | 29.3 | 28.6 2% | 28.8 2% | 27 8% | 30 -2% | 30 -2% | 30 ? -2% | 31 ? -6% |
| Idle Bottom * (°C) | 30.2 | 31.4 -4% | 33.2 -10% | 29 4% | 34 -13% | 32 -6% | 31 ? -3% | 34.4 ? -14% |
* ... Moindre est la valeur, meilleures sont les performances
Razer Blade 15 RTX 2080 Super Max-Q analyse audio
(±) | le niveau sonore du haut-parleur est moyen mais bon (74.9# dB)
Basses 100 - 315 Hz
(-) | presque aucune basse - en moyenne 15.1% plus bas que la médiane
(±) | la linéarité des basses est moyenne (10.9% delta à la fréquence précédente)
Médiums 400 - 2000 Hz
(±) | médiane supérieure - en moyenne 7.2% supérieure à la médiane
(+) | les médiums sont linéaires (6.9% delta à la fréquence précédente)
Aiguës 2 - 16 kHz
(+) | des sommets équilibrés - à seulement 2.4% de la médiane
(+) | les aigus sont linéaires (5.1% delta à la fréquence précédente)
Globalement 100 - 16 000 Hz
(±) | la linéarité du son global est moyenne (19.5% de différence avec la médiane)
Par rapport à la même classe
» 68% de tous les appareils testés de cette catégorie étaient meilleurs, 7% similaires, 26% pires
» Le meilleur avait un delta de 6%, la moyenne était de 18%, le pire était de 132%.
Par rapport à tous les appareils testés
» 48% de tous les appareils testés étaient meilleurs, 7% similaires, 44% pires
» Le meilleur avait un delta de 4%, la moyenne était de 24%, le pire était de 134%.
| Éteint/en veille | |
| Au repos | |
| Fortement sollicité |
|
Légende:
min: | |
| Razer Blade 15 RTX 2080 Super Max-Q i7-10875H, GeForce RTX 2080 Super Max-Q | Razer Blade 15 RTX 2080 Max-Q i7-9750H, GeForce RTX 2080 Max-Q | Asus Zephyrus S GX531GX i7-8750H, GeForce RTX 2080 Max-Q | Gigabyte Aero 15 OLED XB-8DE51B0SP i7-10875H, GeForce RTX 2070 Super Max-Q | MSI GE66 Raider 10SFS i9-10980HK, GeForce RTX 2070 Super Mobile | Schenker XMG Neo 15 XNE15M19 i7-9750H, GeForce RTX 2070 Max-Q | Moyenne NVIDIA GeForce RTX 2080 Super Max-Q | Moyenne de la classe Gaming | |
|---|---|---|---|---|---|---|---|---|
| Power Consumption | -12% | -33% | -52% | -17% | -4% | -28% | -31% | |
| Idle Minimum * (Watt) | 10.6 | 12.5 -18% | 16.1 -52% | 18 -70% | 6 43% | 11 -4% | 12.9 ? -22% | 13 ? -23% |
| Idle Average * (Watt) | 13.1 | 15.3 -17% | 20.9 -60% | 21 -60% | 14 -7% | 15 -15% | 17.3 ? -32% | 18.7 ? -43% |
| Idle Maximum * (Watt) | 15.8 | 20.7 -31% | 27 -71% | 38 -141% | 25 -58% | 21 -33% | 26.9 ? -70% | 24.3 ? -54% |
| Load Average * (Watt) | 131 | 90.2 31% | 93.4 29% | 113 14% | 108 18% | 94 28% | 123.9 ? 5% | 108.2 ? 17% |
| Witcher 3 ultra * (Watt) | 146 | 162 -11% | 168.2 -15% | 149 -2% | 195 -34% | 143 2% | ||
| Load Maximum * (Watt) | 169 | 209.3 -24% | 215.3 -27% | 256 -51% | 280 -66% | 173 -2% | 205 ? -21% | 254 ? -50% |
* ... Moindre est la valeur, meilleures sont les performances
| Razer Blade 15 RTX 2080 Super Max-Q i7-10875H, GeForce RTX 2080 Super Max-Q, 80 Wh | Razer Blade 15 RTX 2080 Max-Q i7-9750H, GeForce RTX 2080 Max-Q, 80 Wh | Asus Zephyrus S GX531GX i7-8750H, GeForce RTX 2080 Max-Q, 50 Wh | Gigabyte Aero 15 OLED XB-8DE51B0SP i7-10875H, GeForce RTX 2070 Super Max-Q, 94.2 Wh | MSI GE66 Raider 10SFS i9-10980HK, GeForce RTX 2070 Super Mobile, 99.99 Wh | Schenker XMG Neo 15 XNE15M19 i7-9750H, GeForce RTX 2070 Max-Q, 62 Wh | Razer Blade 15 RZ09-0328 i7-10750H, GeForce RTX 2070 Max-Q, 65 Wh | Moyenne de la classe Gaming | |
|---|---|---|---|---|---|---|---|---|
| Autonomie de la batterie | 27% | -51% | 15% | -6% | -18% | -34% | 4% | |
| Reader / Idle (h) | 8.7 | 15.9 83% | 8.6 -1% | 7.6 -13% | 7.3 -16% | 8.71 ? 0% | ||
| H.264 (h) | 7.3 | 8.9 ? 22% | ||||||
| WiFi v1.3 (h) | 6.1 | 6.6 8% | 3 -51% | 6.1 0% | 6.1 0% | 5.7 -7% | 4 -34% | 7 ? 15% |
| Load (h) | 1.9 | 1.7 -11% | 2.8 47% | 1.8 -5% | 1.3 -32% | 1.51 ? -21% |
Points positifs
Points négatifs
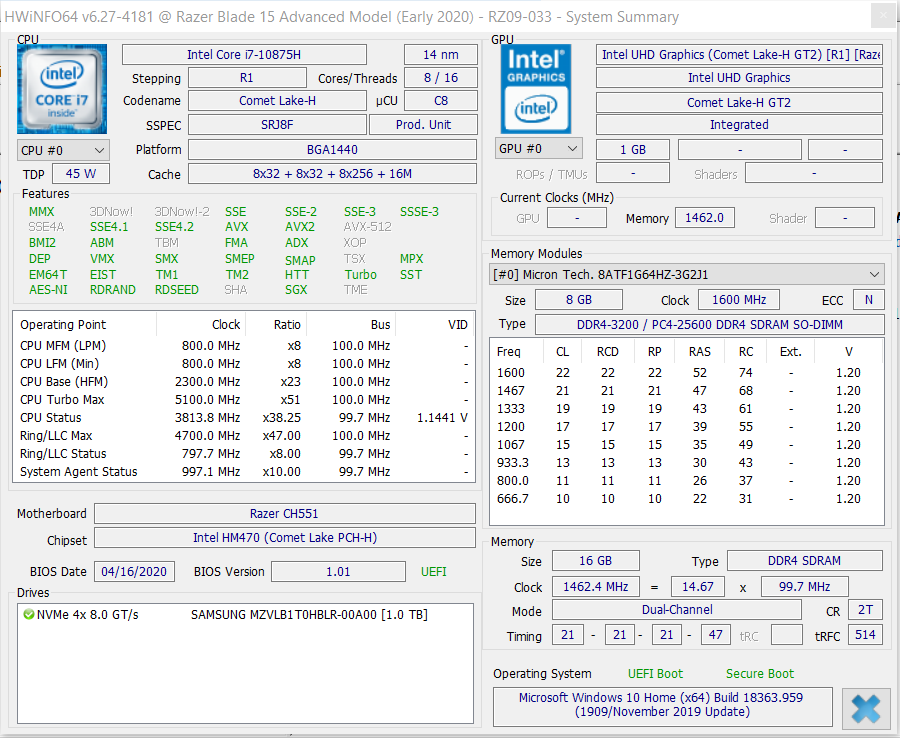
Razer intègre une grosse puissance de calcul dans un châssis élégant et fin en métal. Grâce au Core i7-19875H et à la GeForce RTX 2080 Super Max-Q, le PC portable peut faire tourner tous les jeux les plus récents. Aucun compromis ne sont à faire dans les réglages. Et si le GPU ne répond un jour plus à vos besoins, il est alors possible de connecter un GPU externe via le port Thunderbolt 3.
Avec le Blade 15 Modèle Avancé (2020), Razer choisit d'optimiser l'appareil, et cela paye.
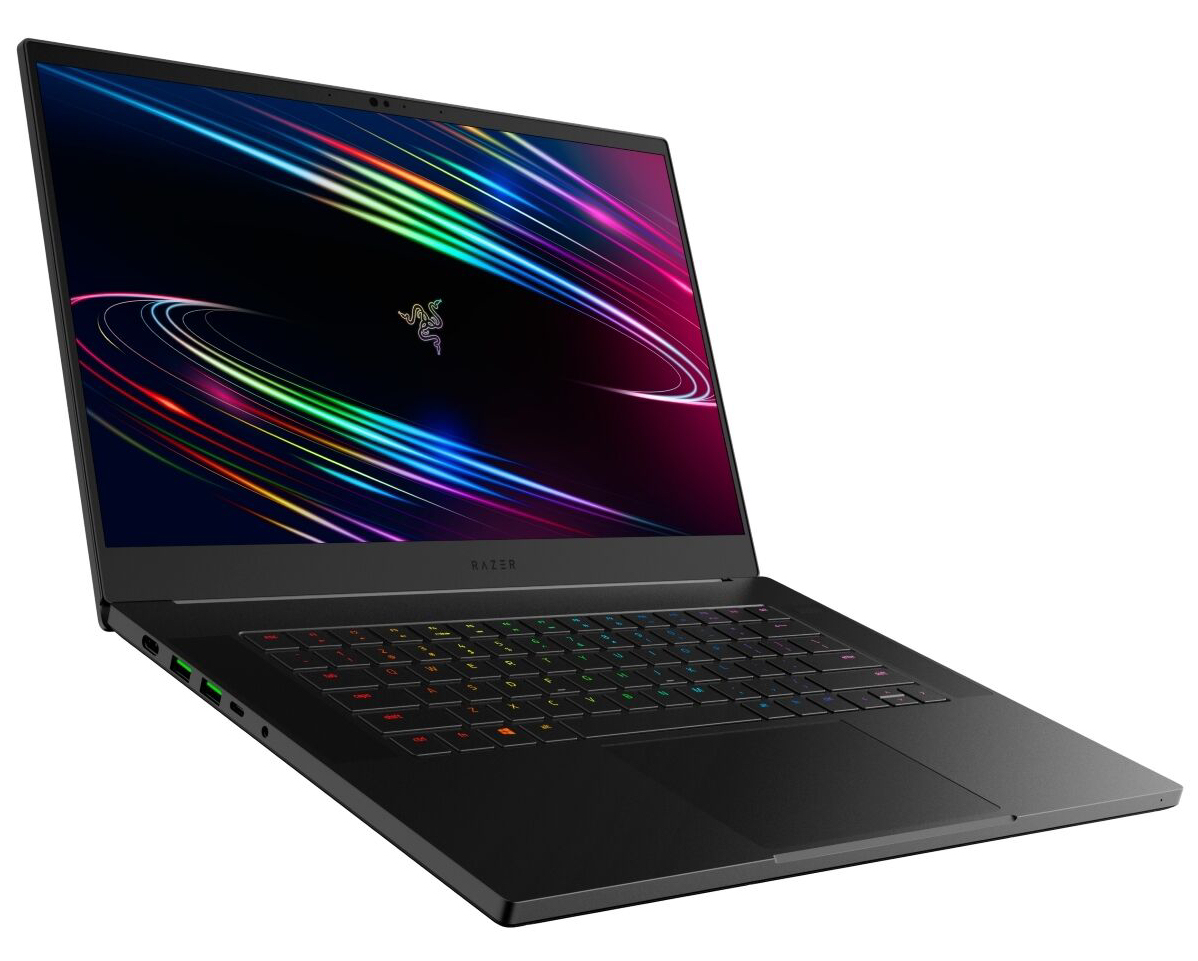
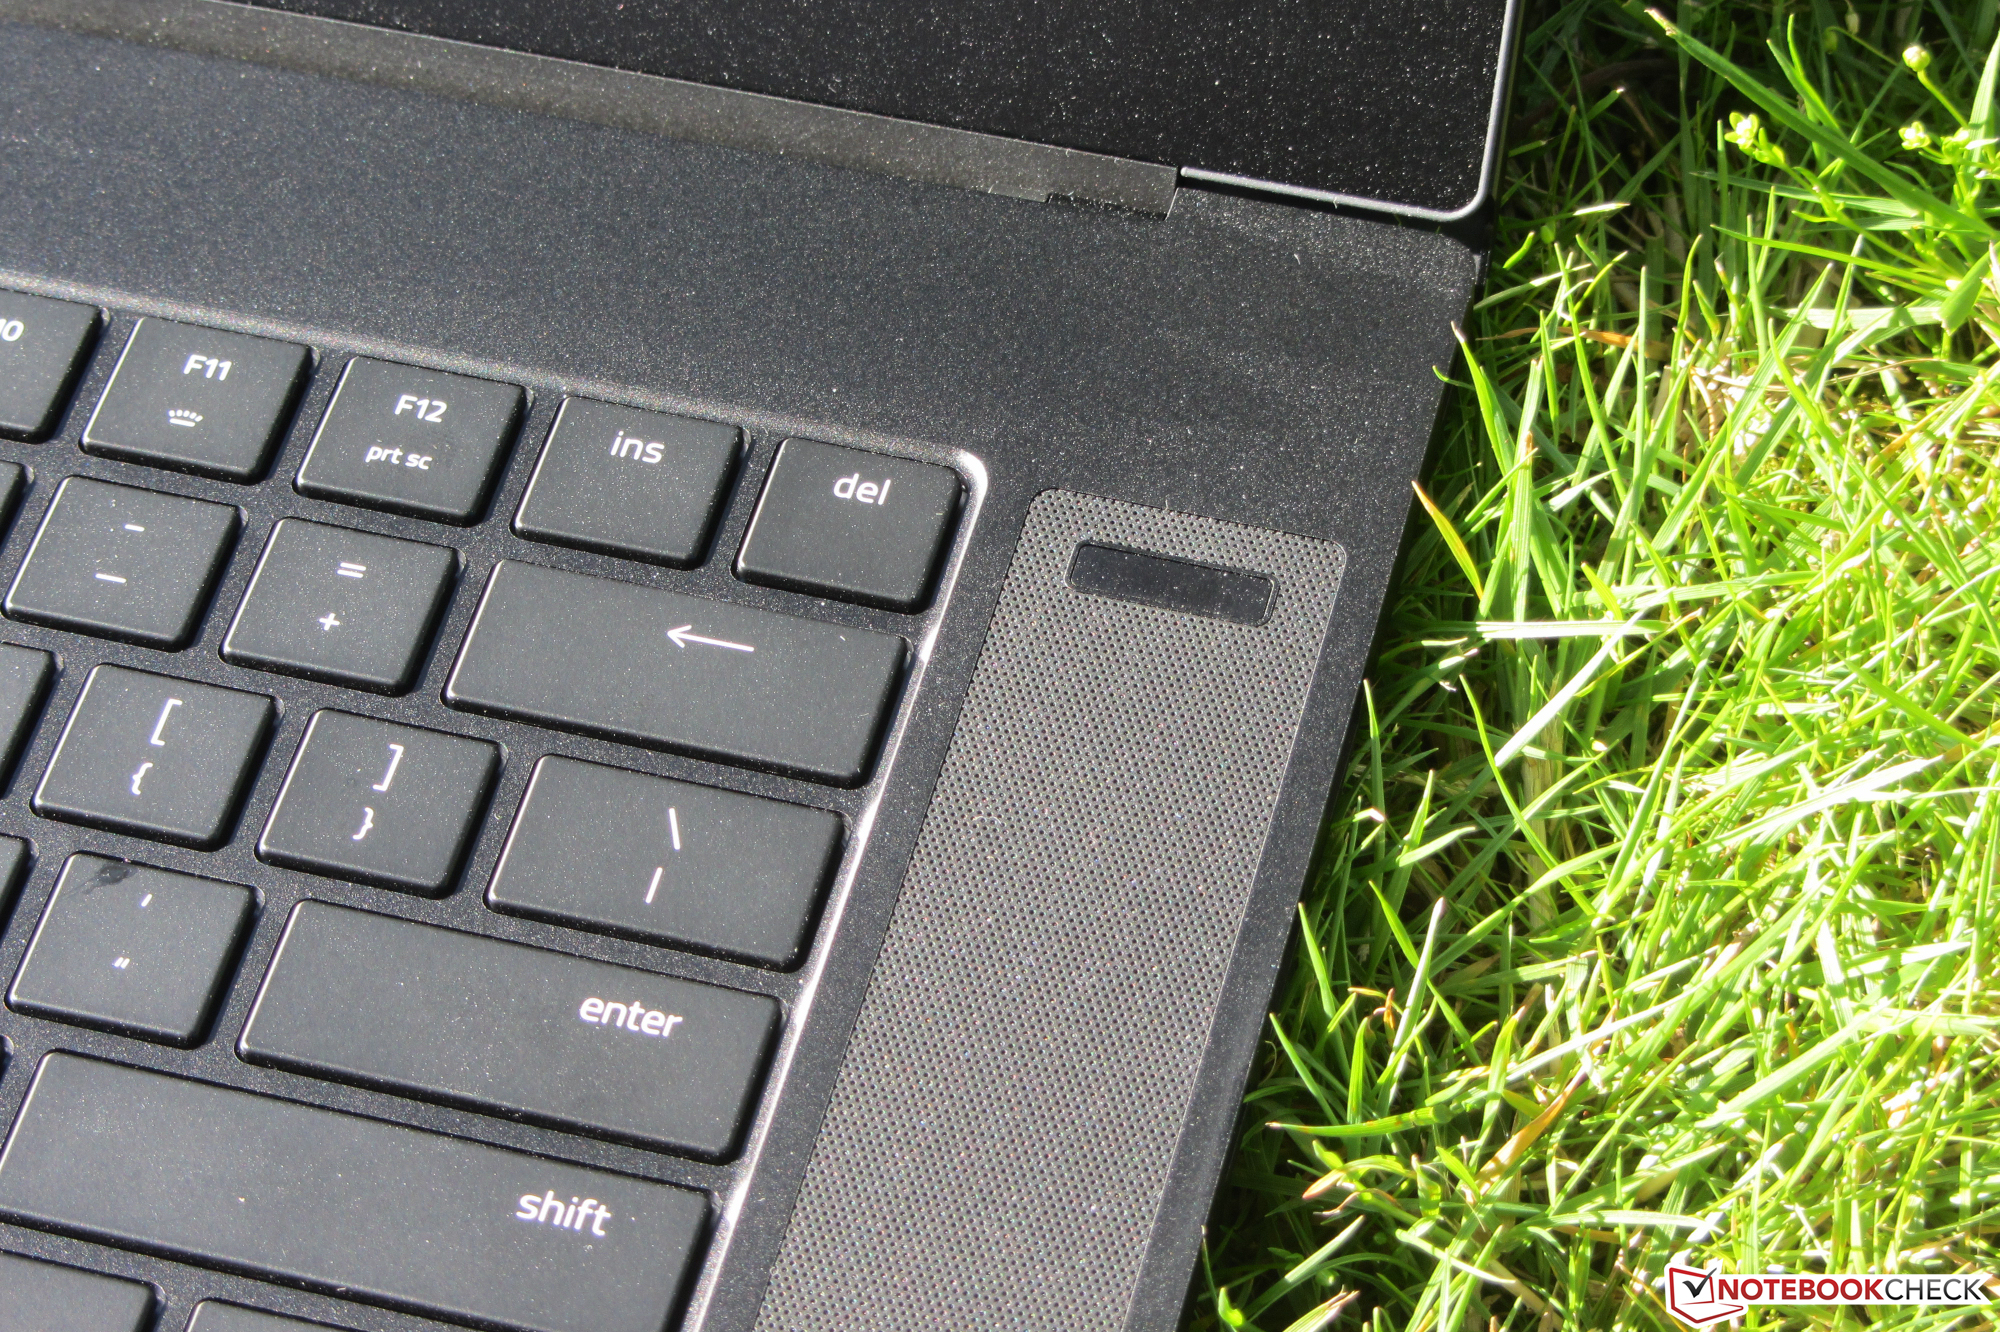
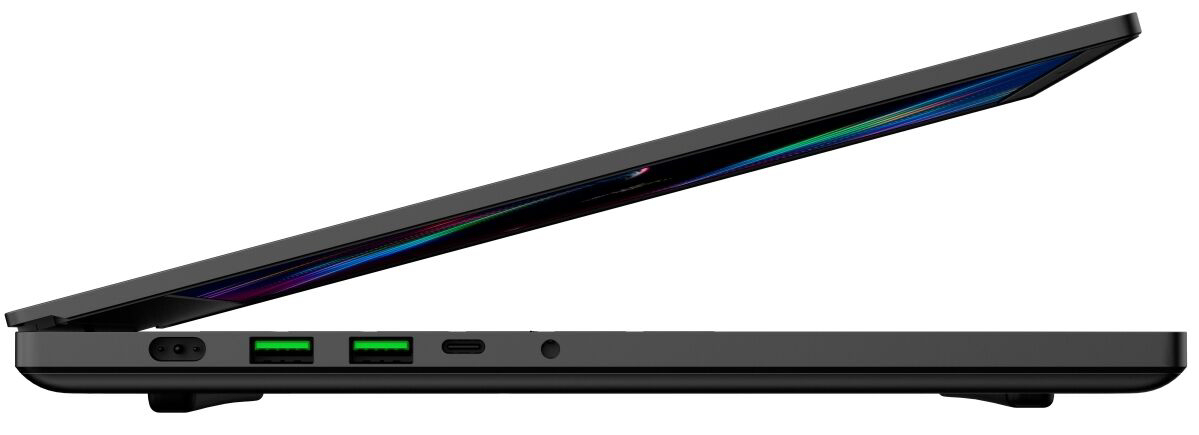
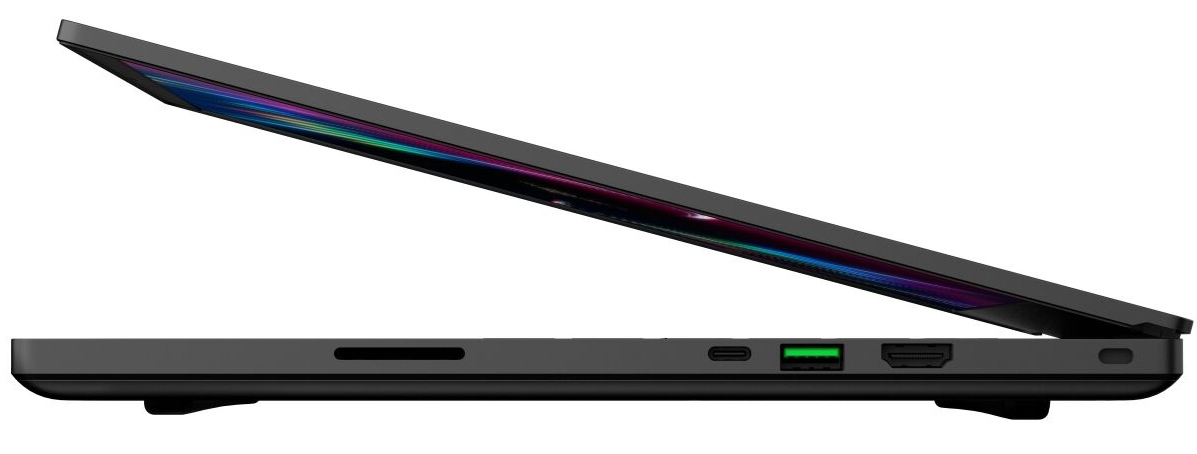
Le Blade 15 2020 intègre la technologie USB 3.2 Gen 2, tous les ports USB A étant à cette norme. Et cela est vrai également du nouveau port USB C (DisplayPort, Power Delivery). Ce dernier remplace l'ancien miniDisplayPort. De plus, le port Thunderbolt 3 et le port USB C 3.2 Gen 2 permettent toux deux de charger la batterie - nous avons pu les utiliser avec un chargeur de 45 W. L'utilisation de ces deux ports pour recharger encore mieux l'appareil n'est pas possible, le maximum étant fixé à 100 W.
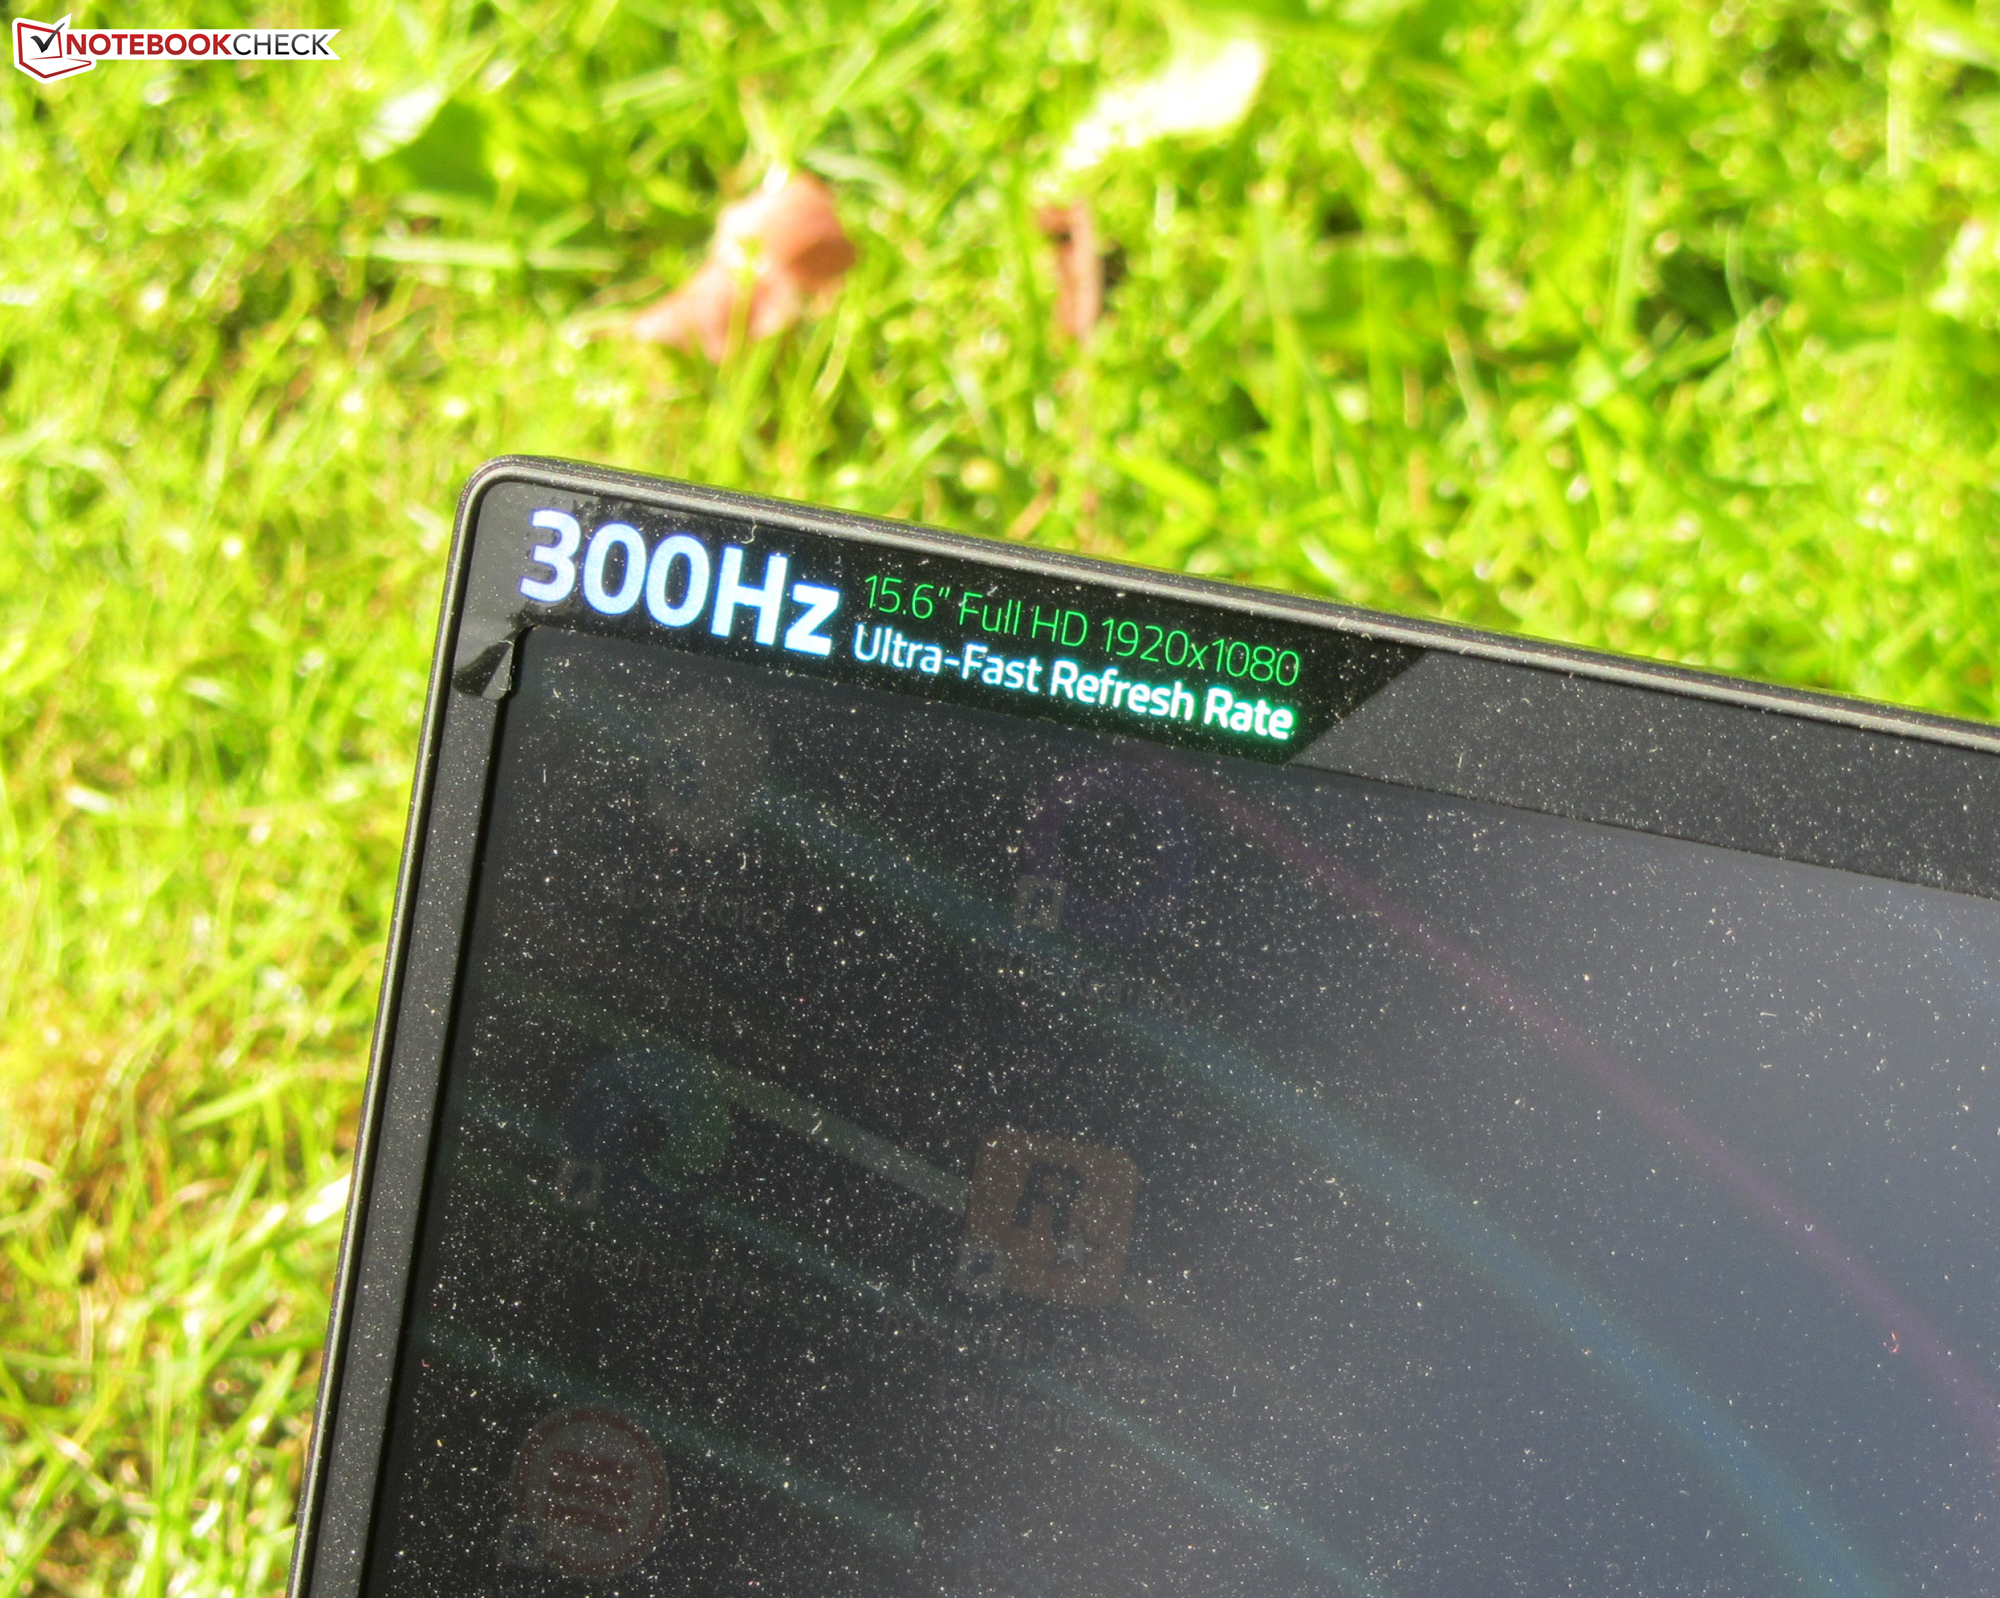
L'écran mat IPS Full HD 300 Hz est également une amélioration du prédécesseur. L'écran marque des points avec ses angles de vision, sa luminosité, son contraste, ses temps de réponses et ses couleurs fidèles. L'espace colorimétrique est également bon.
L’intégralité de cette critique est disponible en anglais en suivant ce lien.
Razer Blade 15 RTX 2080 Super Max-Q
- 08/10/2020 v7 (old)
Sascha Mölck
Price comparison
