Test du mini PC Maxtang MTN-FP750 : AMD Ryzen 7 7735HS ralenti par une configuration mal conçue

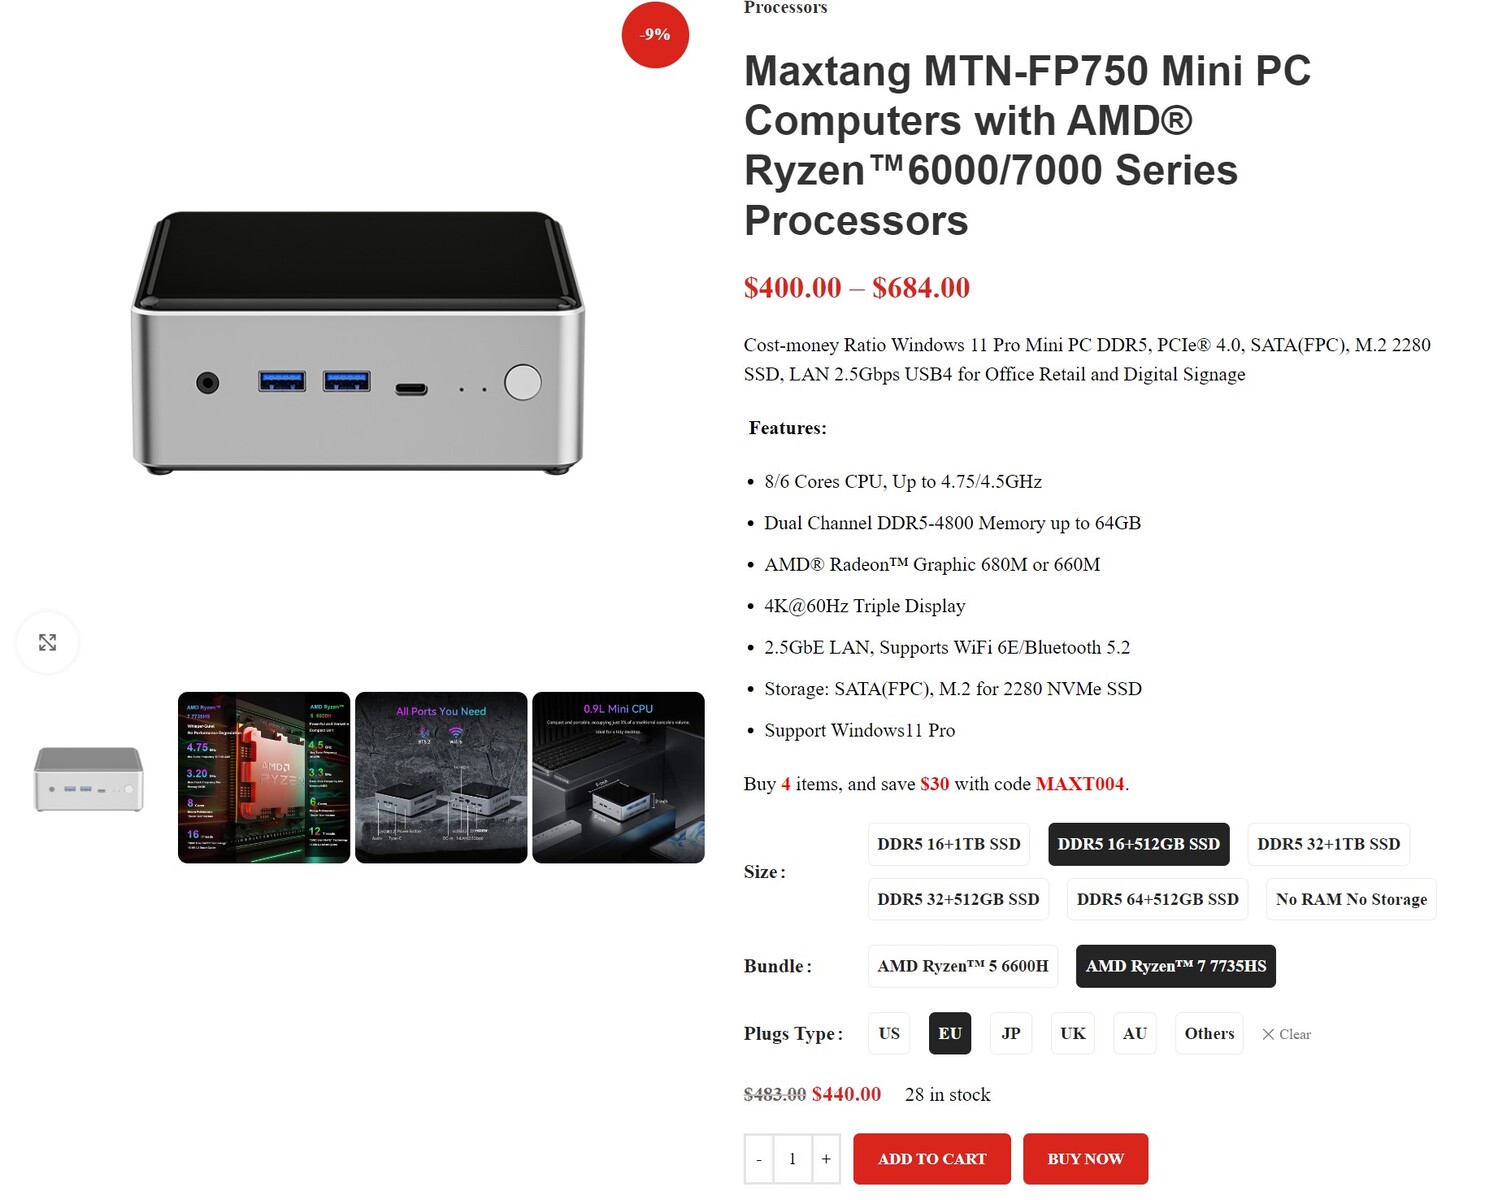
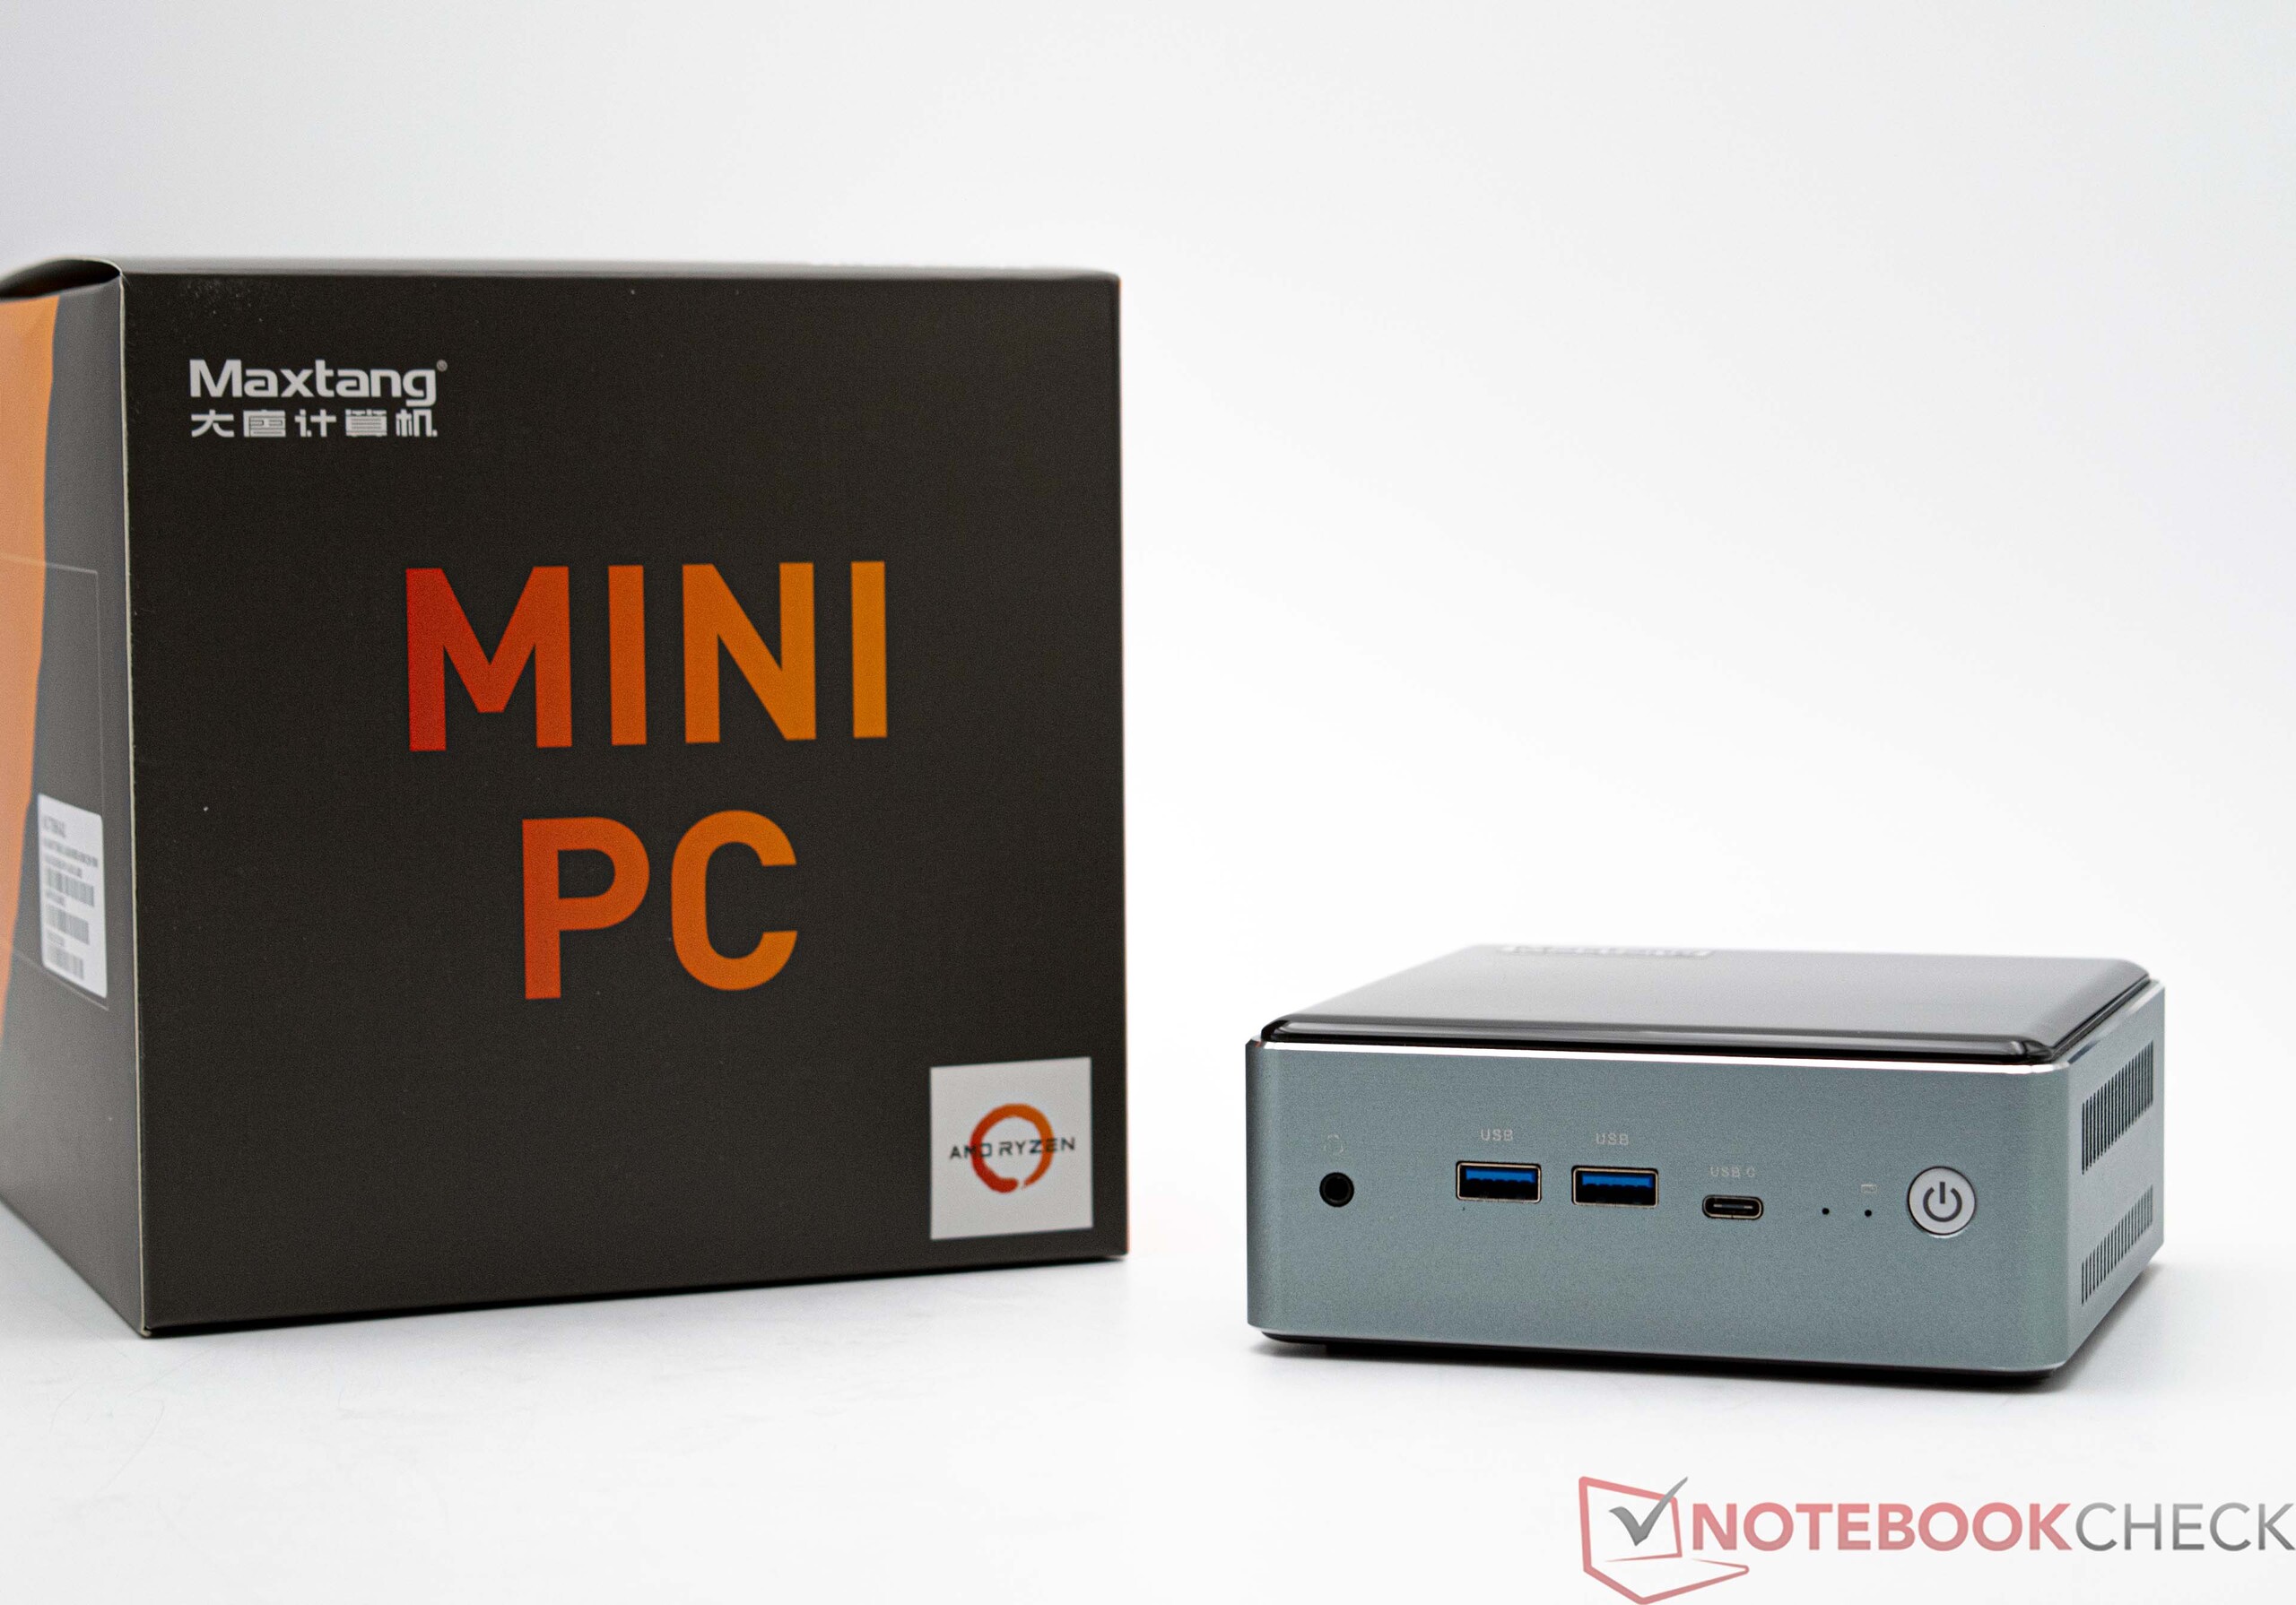
Maxtang est un fabricant chinois de systèmes qui vend des solutions industrielles spéciales sous la forme de systèmes embarqués ainsi que des mini-PC conçus pour un usage bureautique. Dans cette revue, nous nous concentrons sur le Maxtang MTN-FP750 qui coûte 440 dollars US. Le système est composé d'un AMD Ryzen 7 7735HS et de 16 Go de RAM DDR5 ainsi que d'un disque dur SSD de 512 Go. Par ailleurs, un AMD Ryzen 5 6600H est également disponible. En outre, le mini PC peut être commandé avec de la RAM supplémentaire et un SSD plus grand. Maxtang propose également une option barebones, mais uniquement avec le processeur AMD Ryzen 7 7735HS.
Dans cet article, le Maxtang MTN-FP750 est comparé aux mini PC actuels. Vous trouverez une liste plus détaillée des appareils de comparaison dans le tableau suivant.
Comparaison avec les concurrents potentiels
Note | Date | Modèle | Poids | Épaisseur | Prix |
|---|---|---|---|---|---|
| 79.5 % v7 (old) | 02/24 | Maxtang MTN-FP750 R7 7735HS, Radeon 680M | 601 g | 52 mm | |
| 85.1 % v7 (old) | 01/23 | Minisforum Neptune Series NAD9 i9-12900H, Iris Xe G7 96EUs | 1.2 kg | 66 mm | |
| 82.8 % v7 (old) | 07/23 | Geekom AS 6, R9 6900HX R9 6900HX, Radeon 680M | 753 g | 58 mm | |
| 82.3 % v7 (old) | 05/23 | Geekom Mini IT12 i7-1260P, Iris Xe G7 96EUs | 572 g | 45.6 mm | |
| 81.2 % v7 (old) | 10/23 | Geekom A5 R7 5800H, Vega 8 | 555 g | 49.2 mm | |
| 81.9 % v7 (old) | 05/23 | Minisforum Venus Series NAB6 i7-12650H, UHD Graphics 64EUs | 616 g | 55 mm | |
| 78.4 % v7 (old) | 01/24 | NiPoGi AD08 i7-12650H, UHD Graphics 64EUs | 878 g | 188.5 mm |
Le Maxtang MTN-FP750 en détail
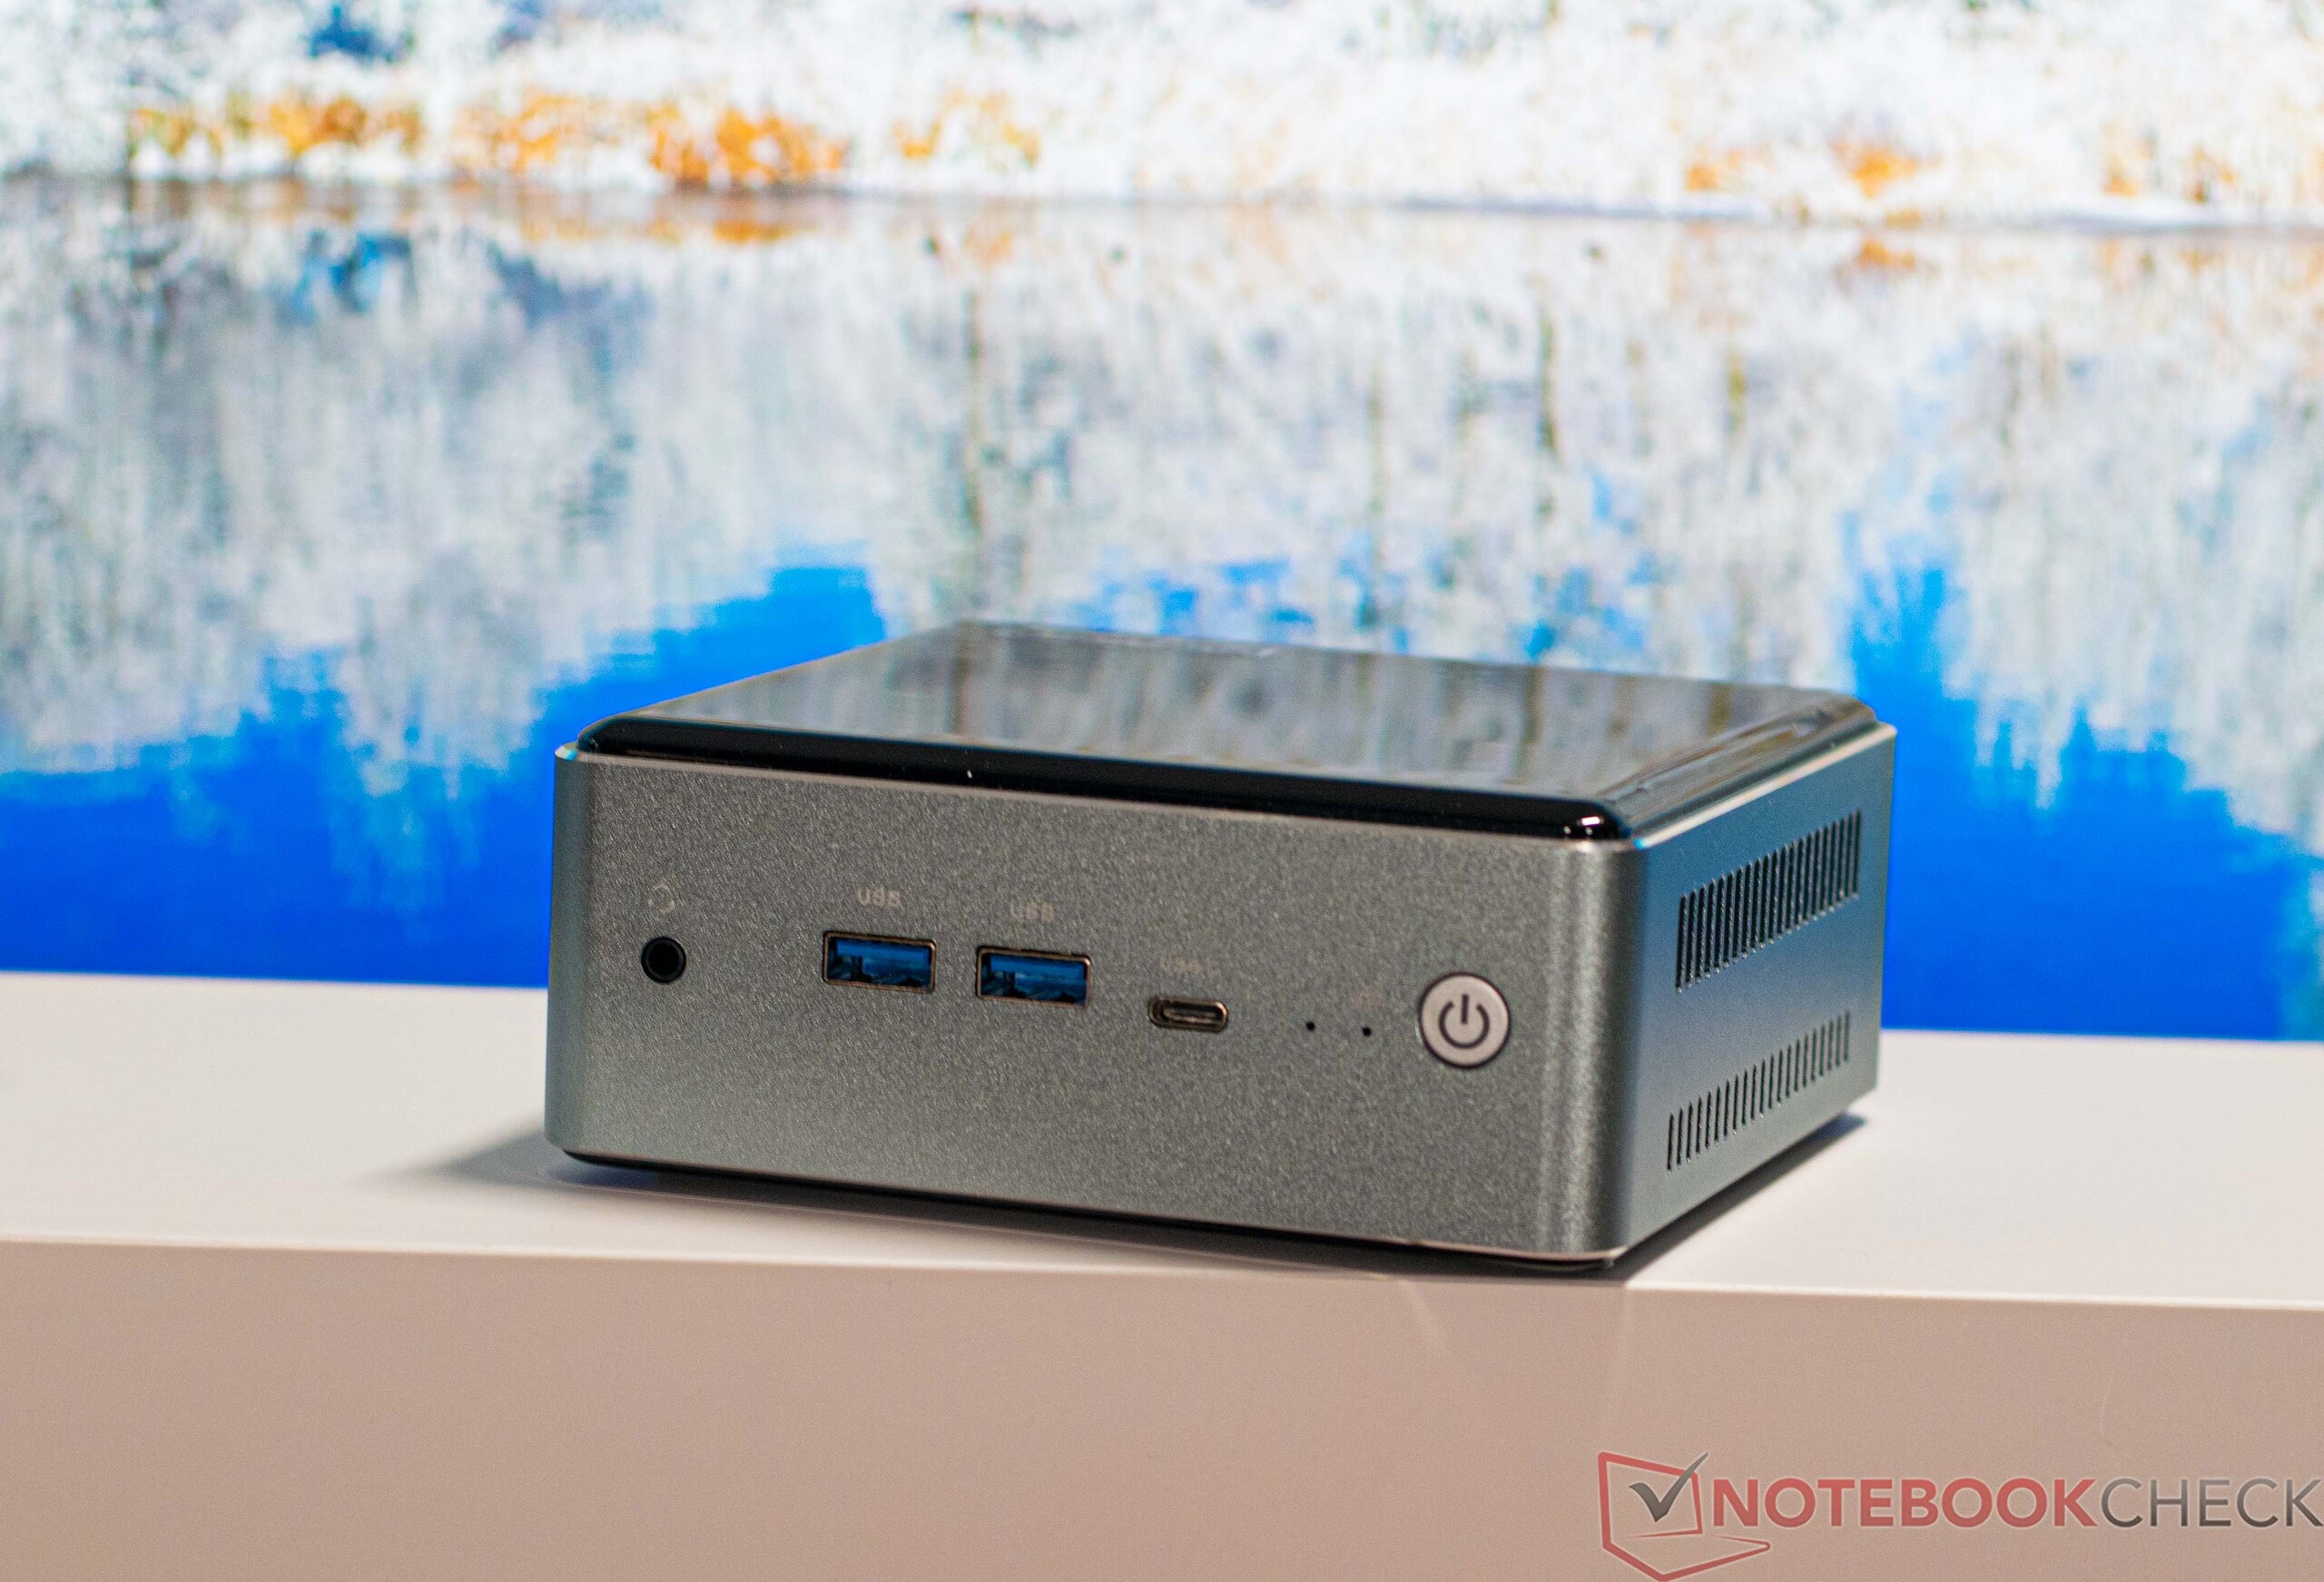
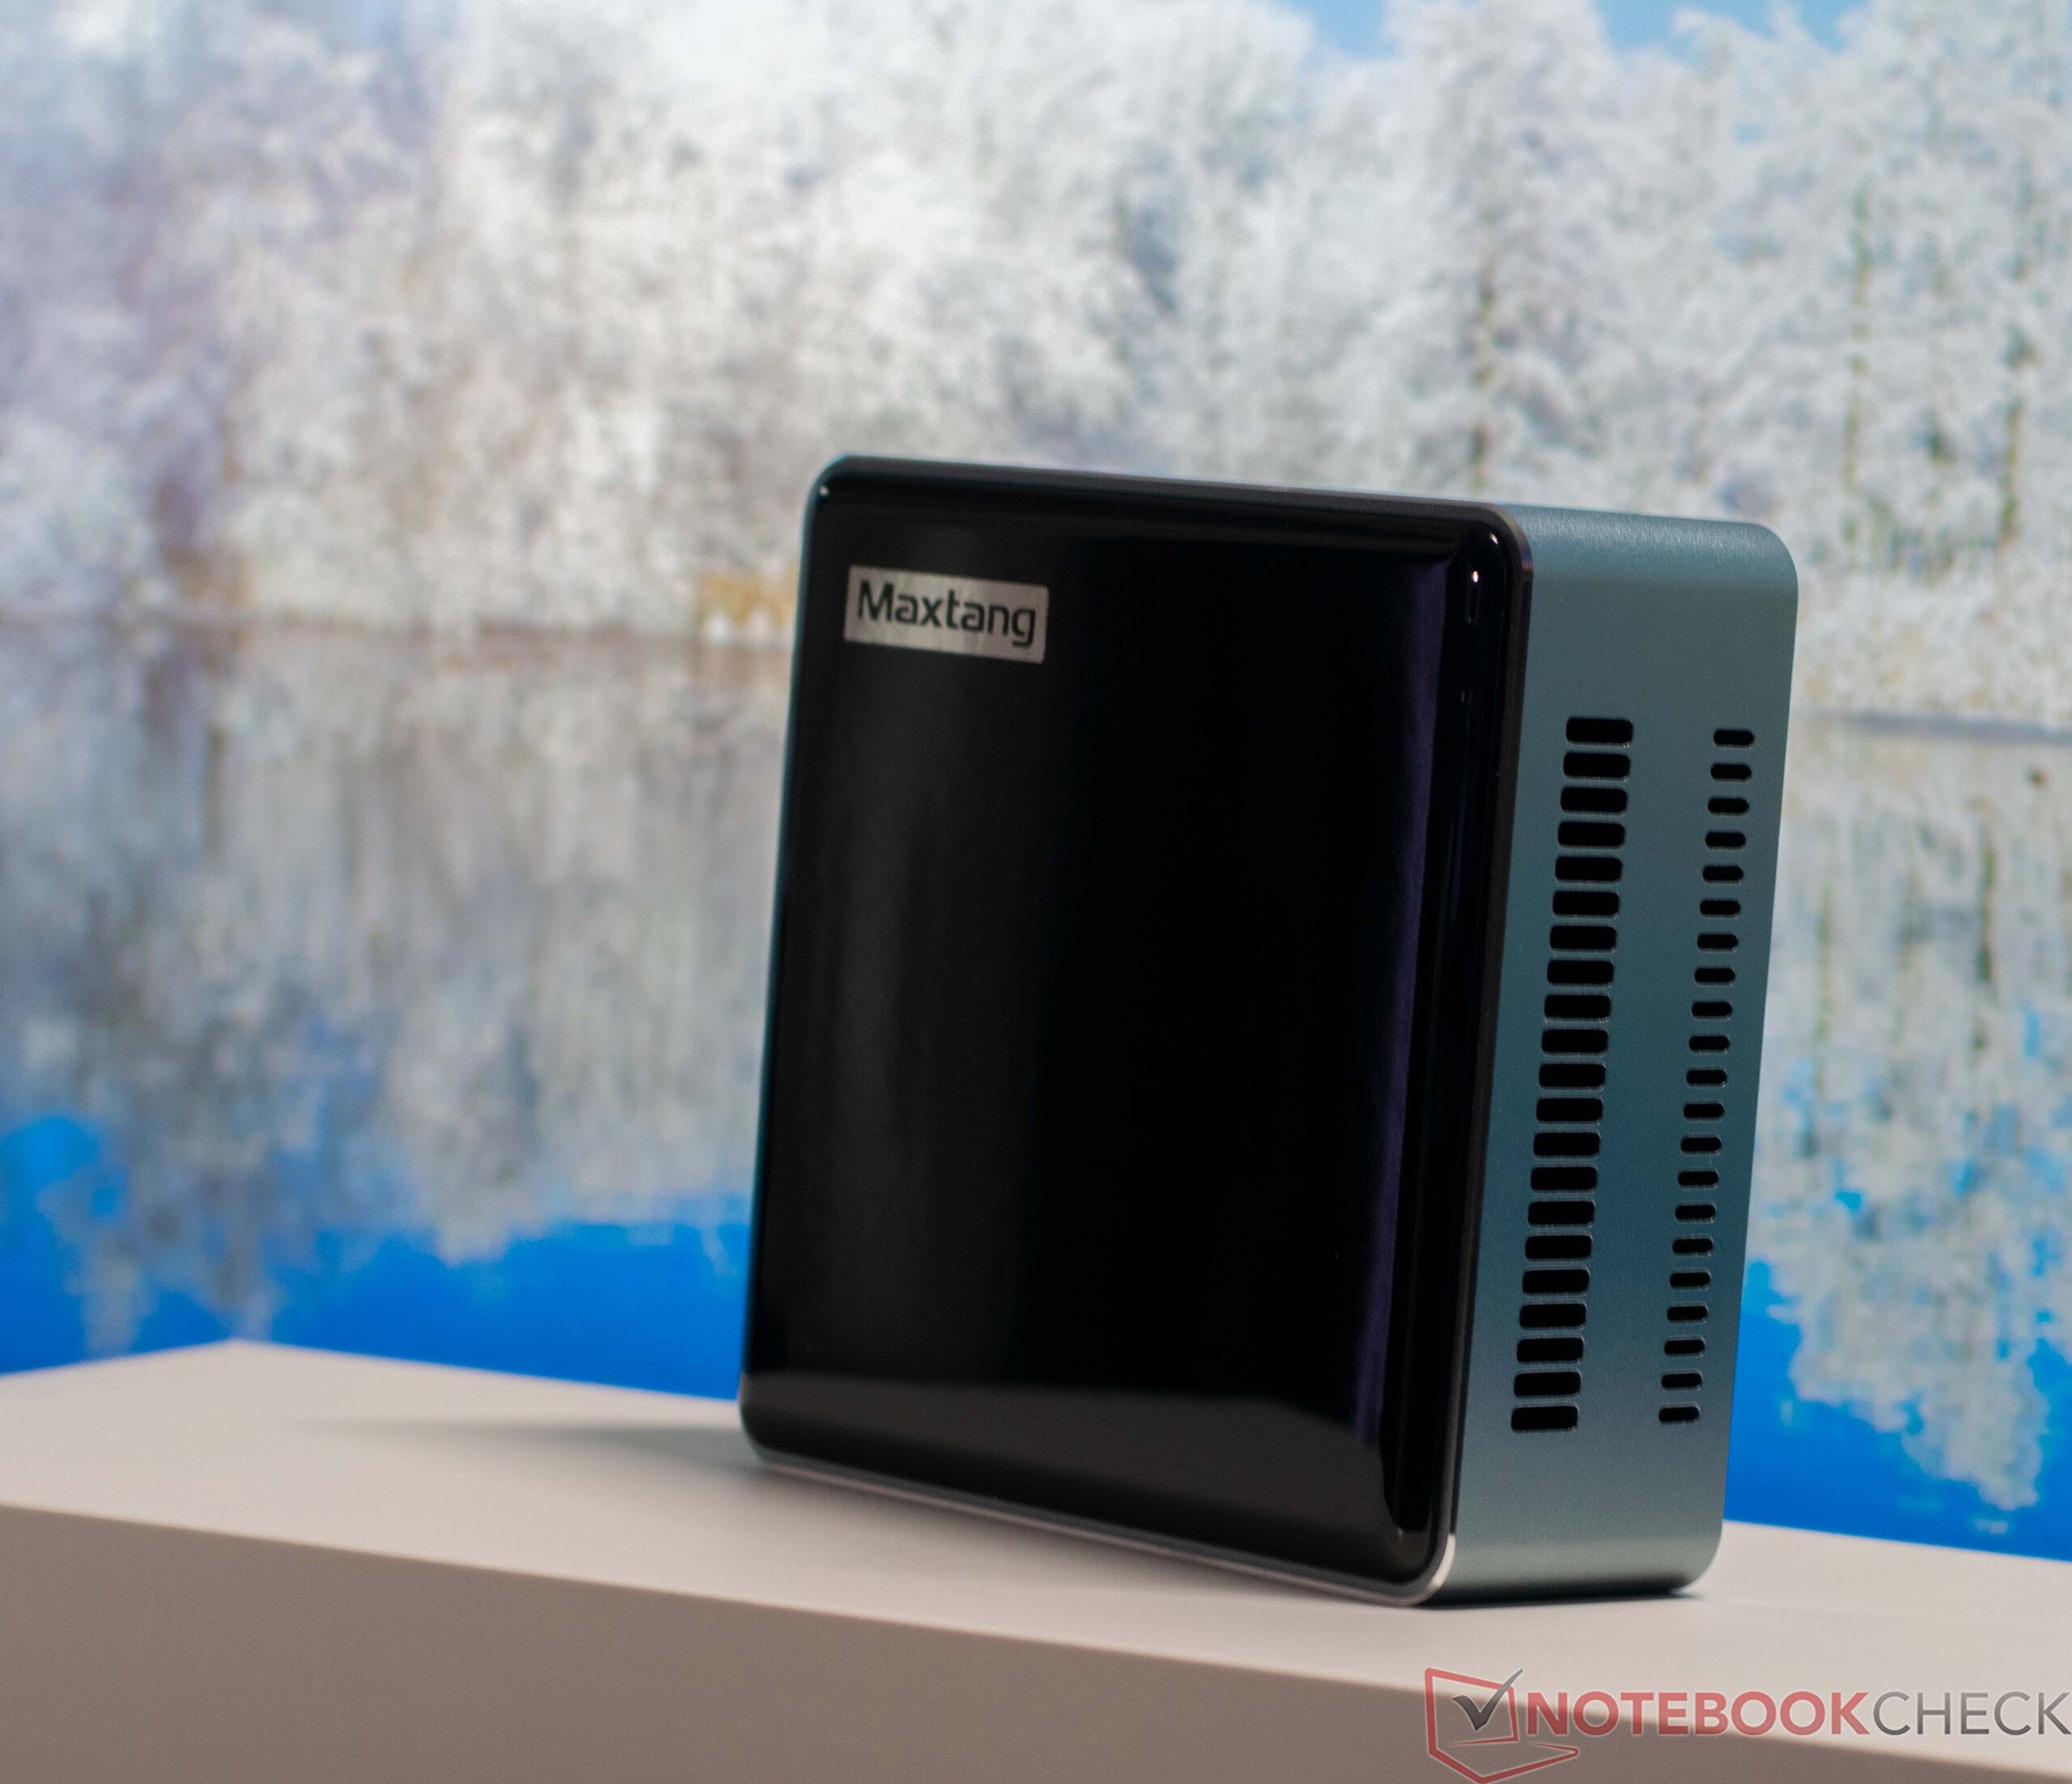
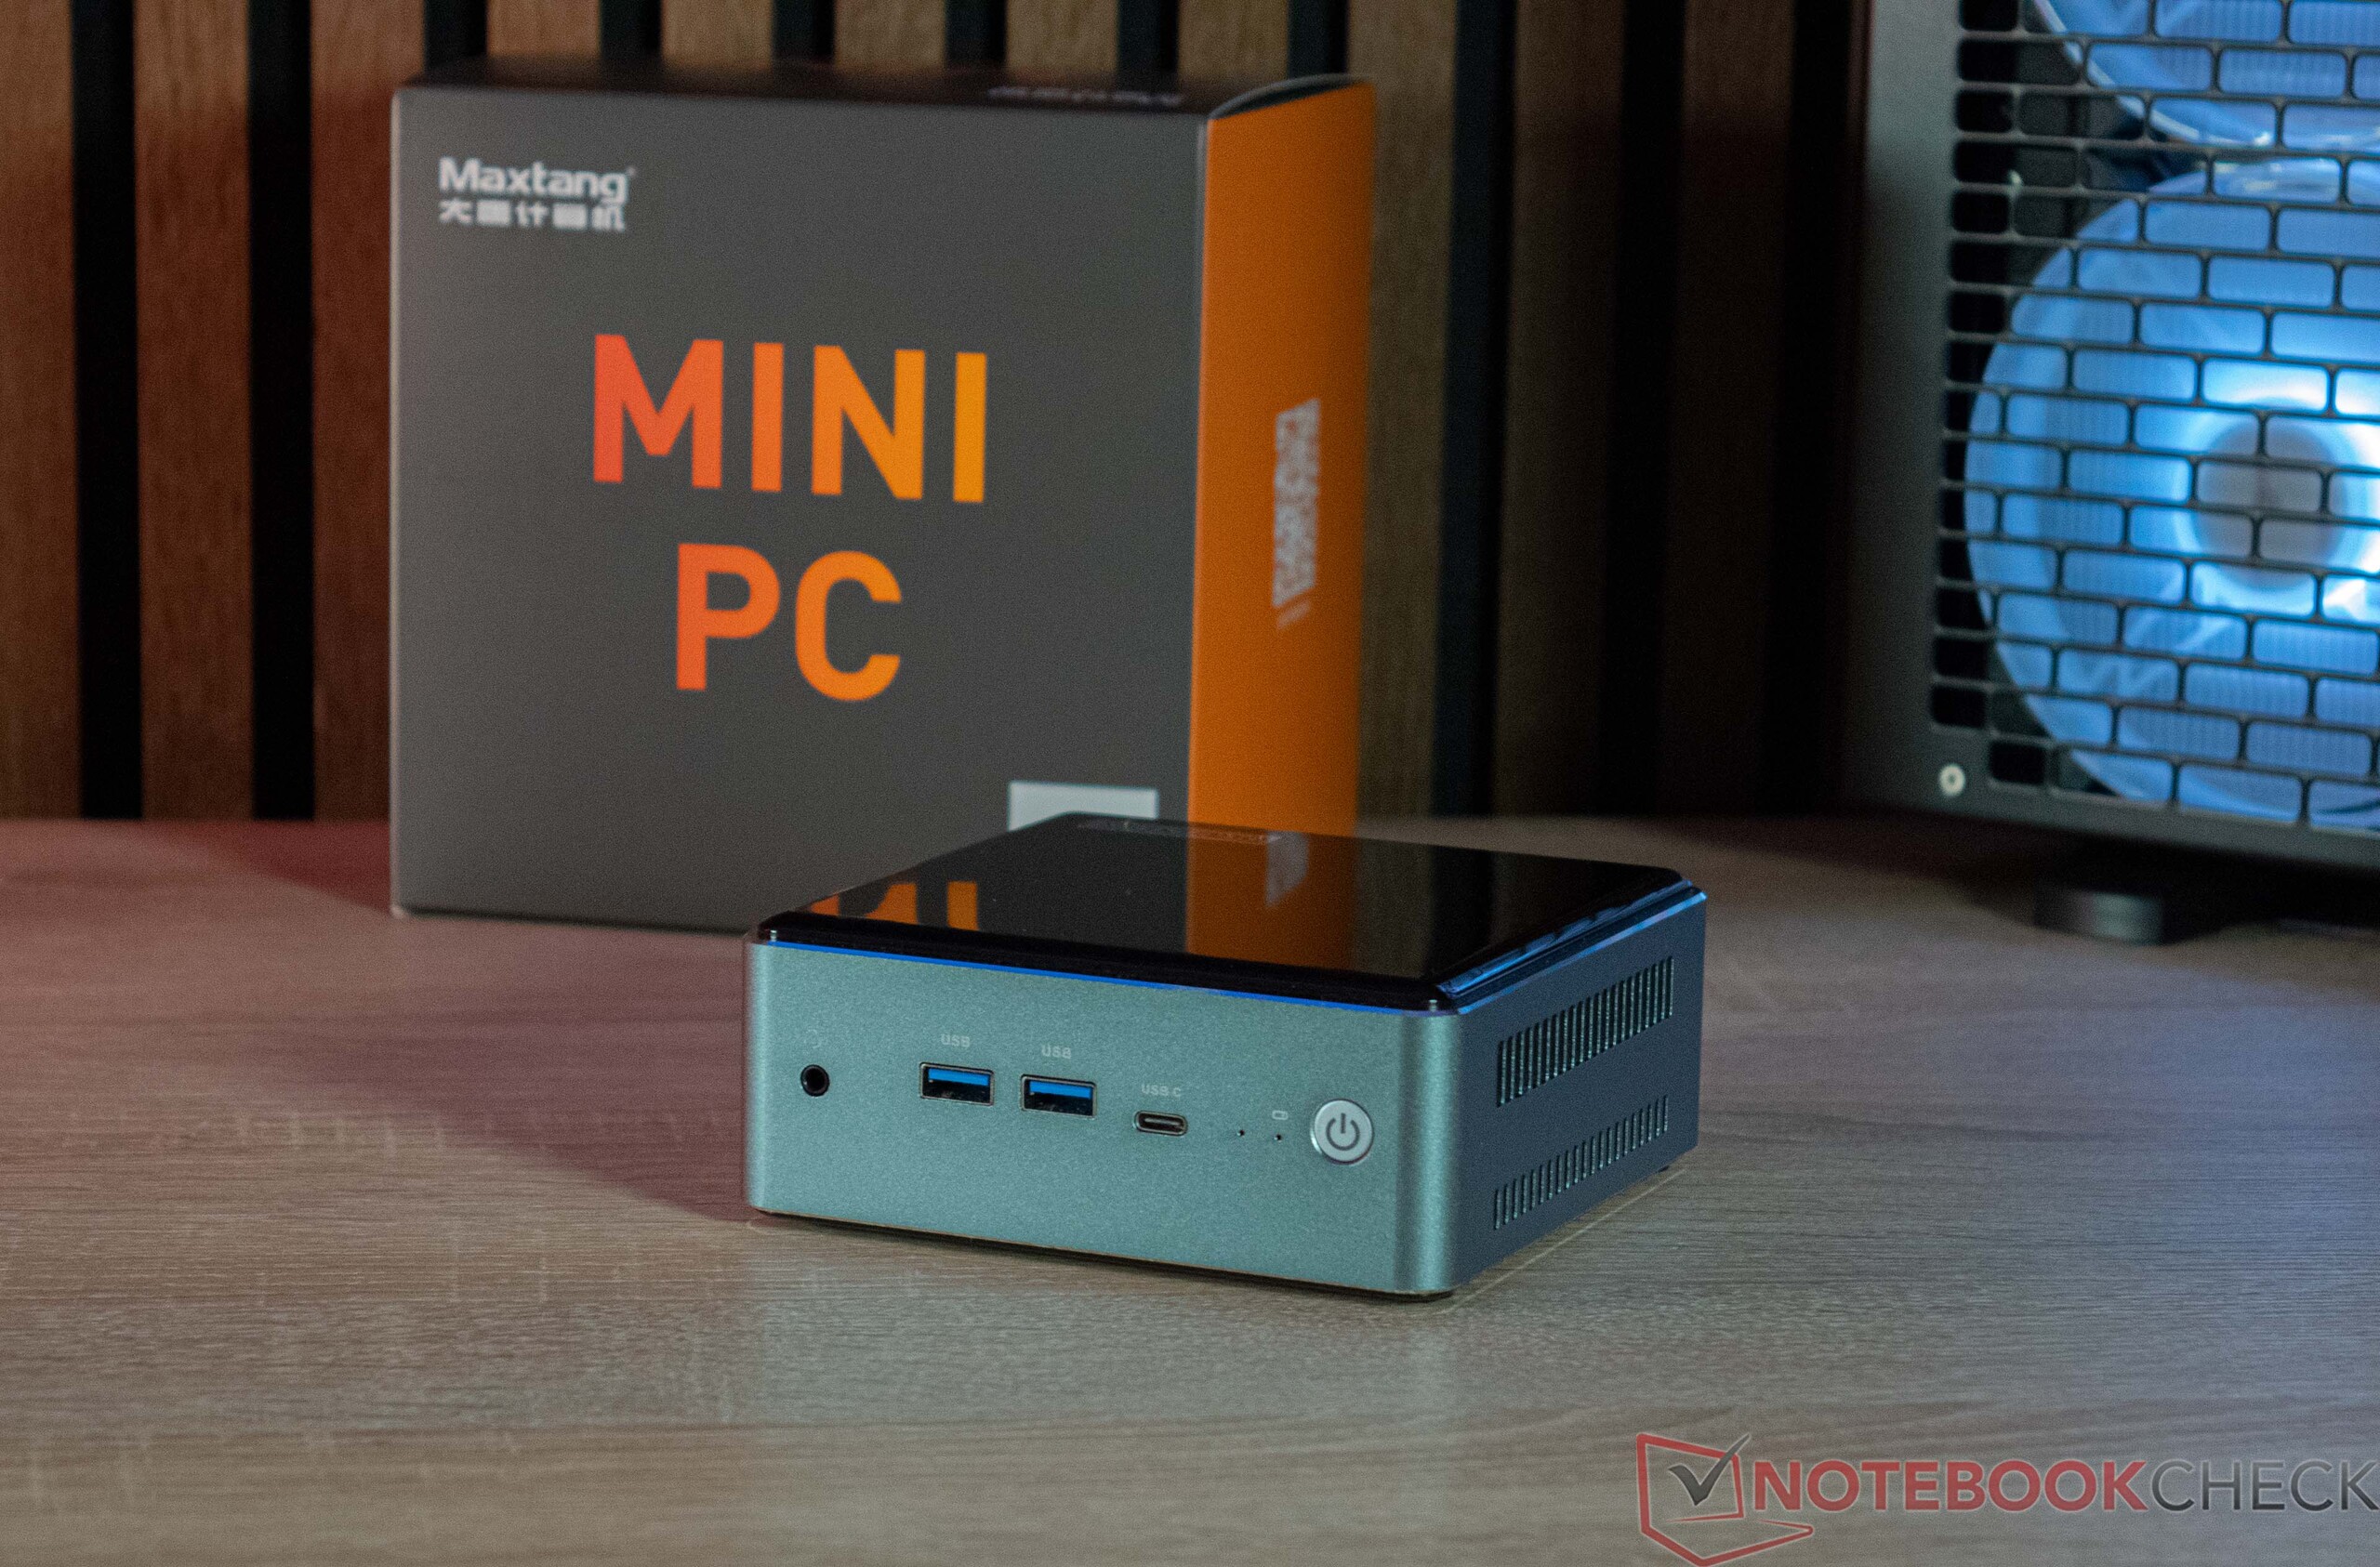

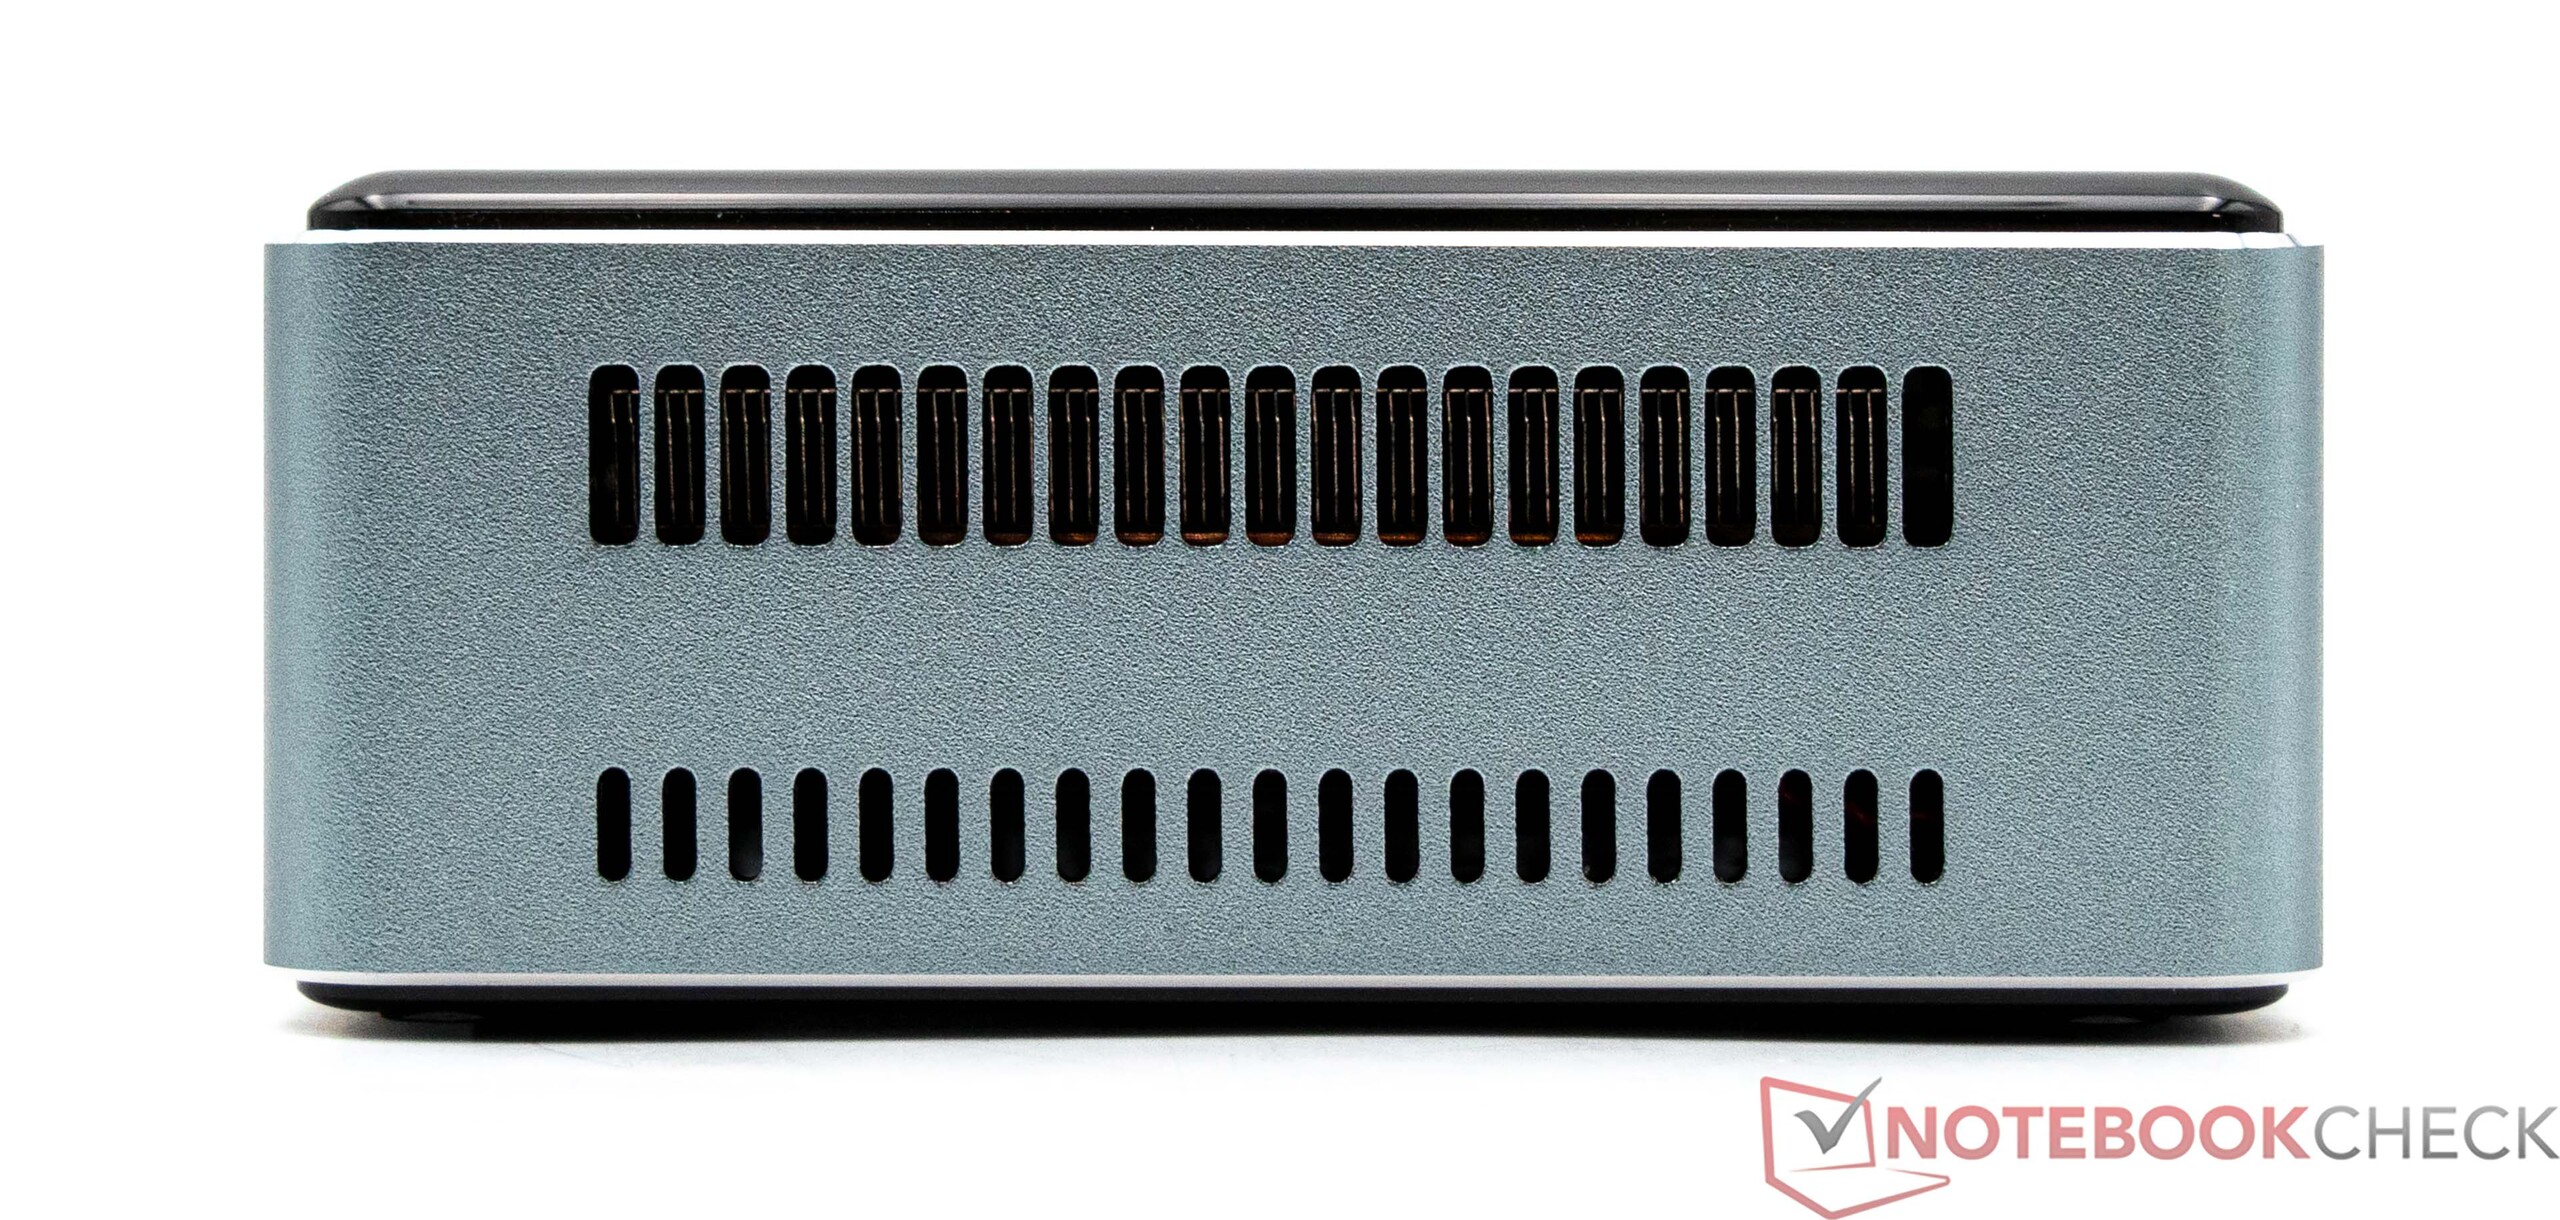
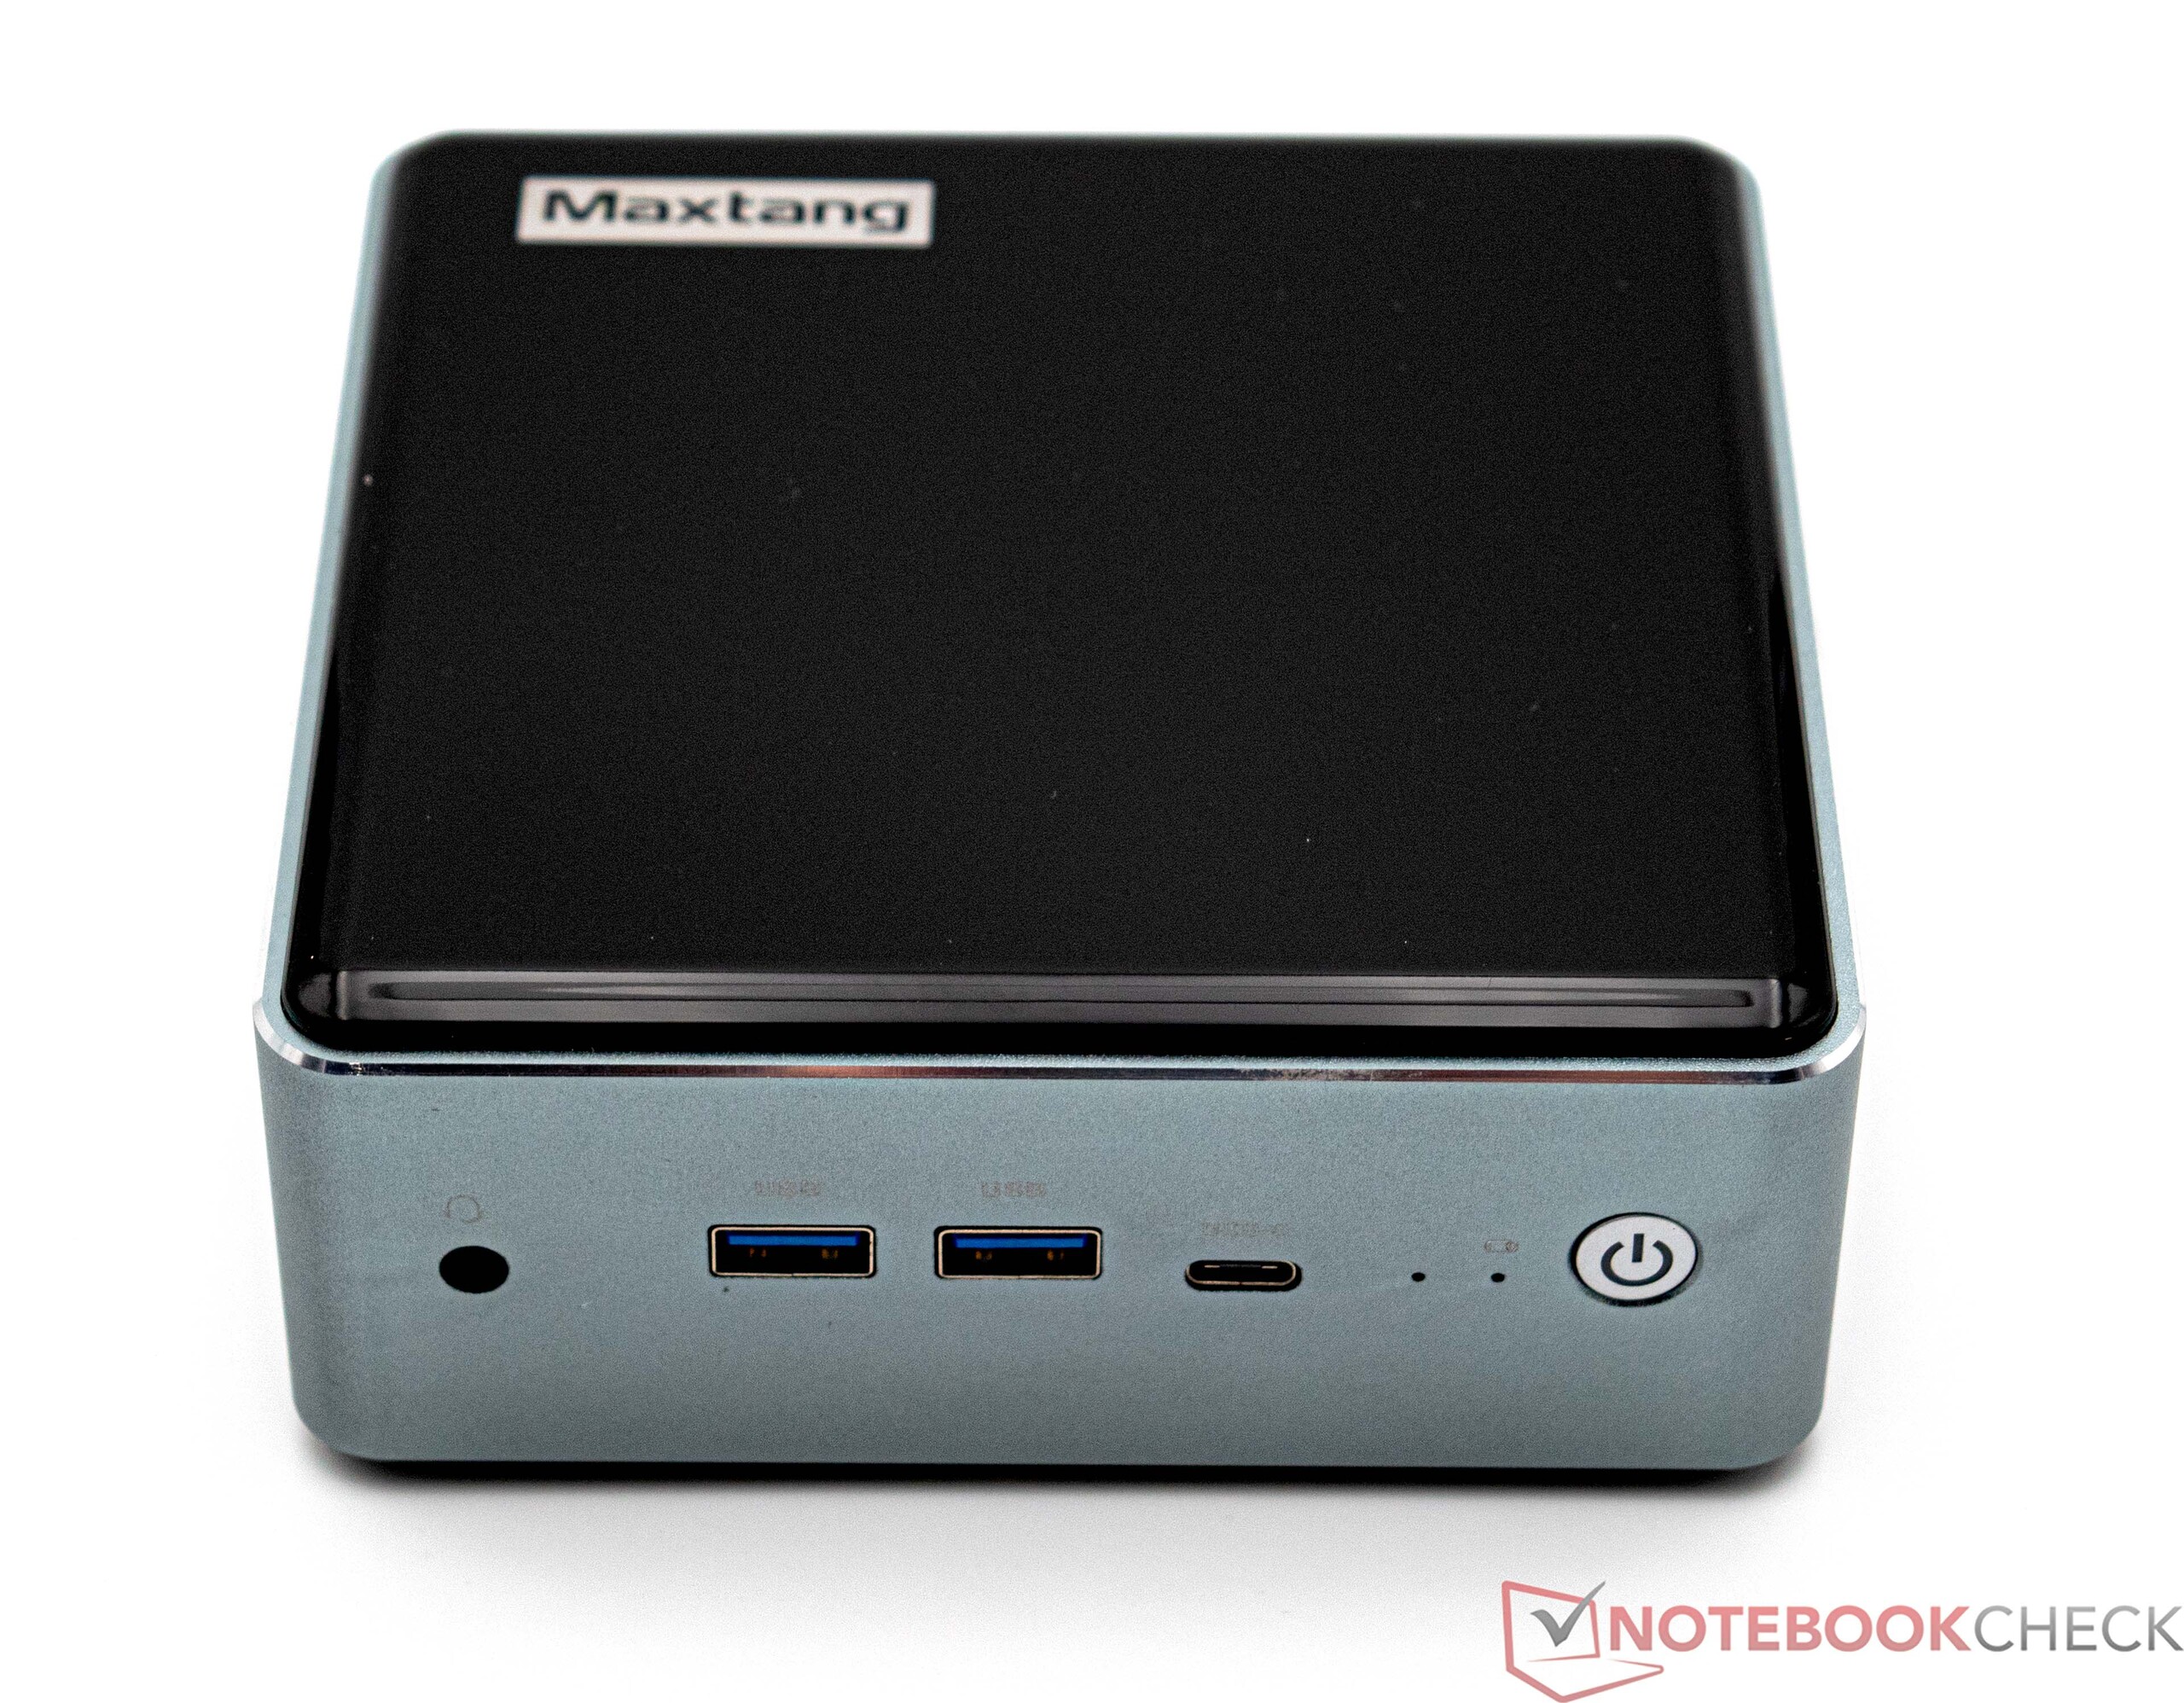
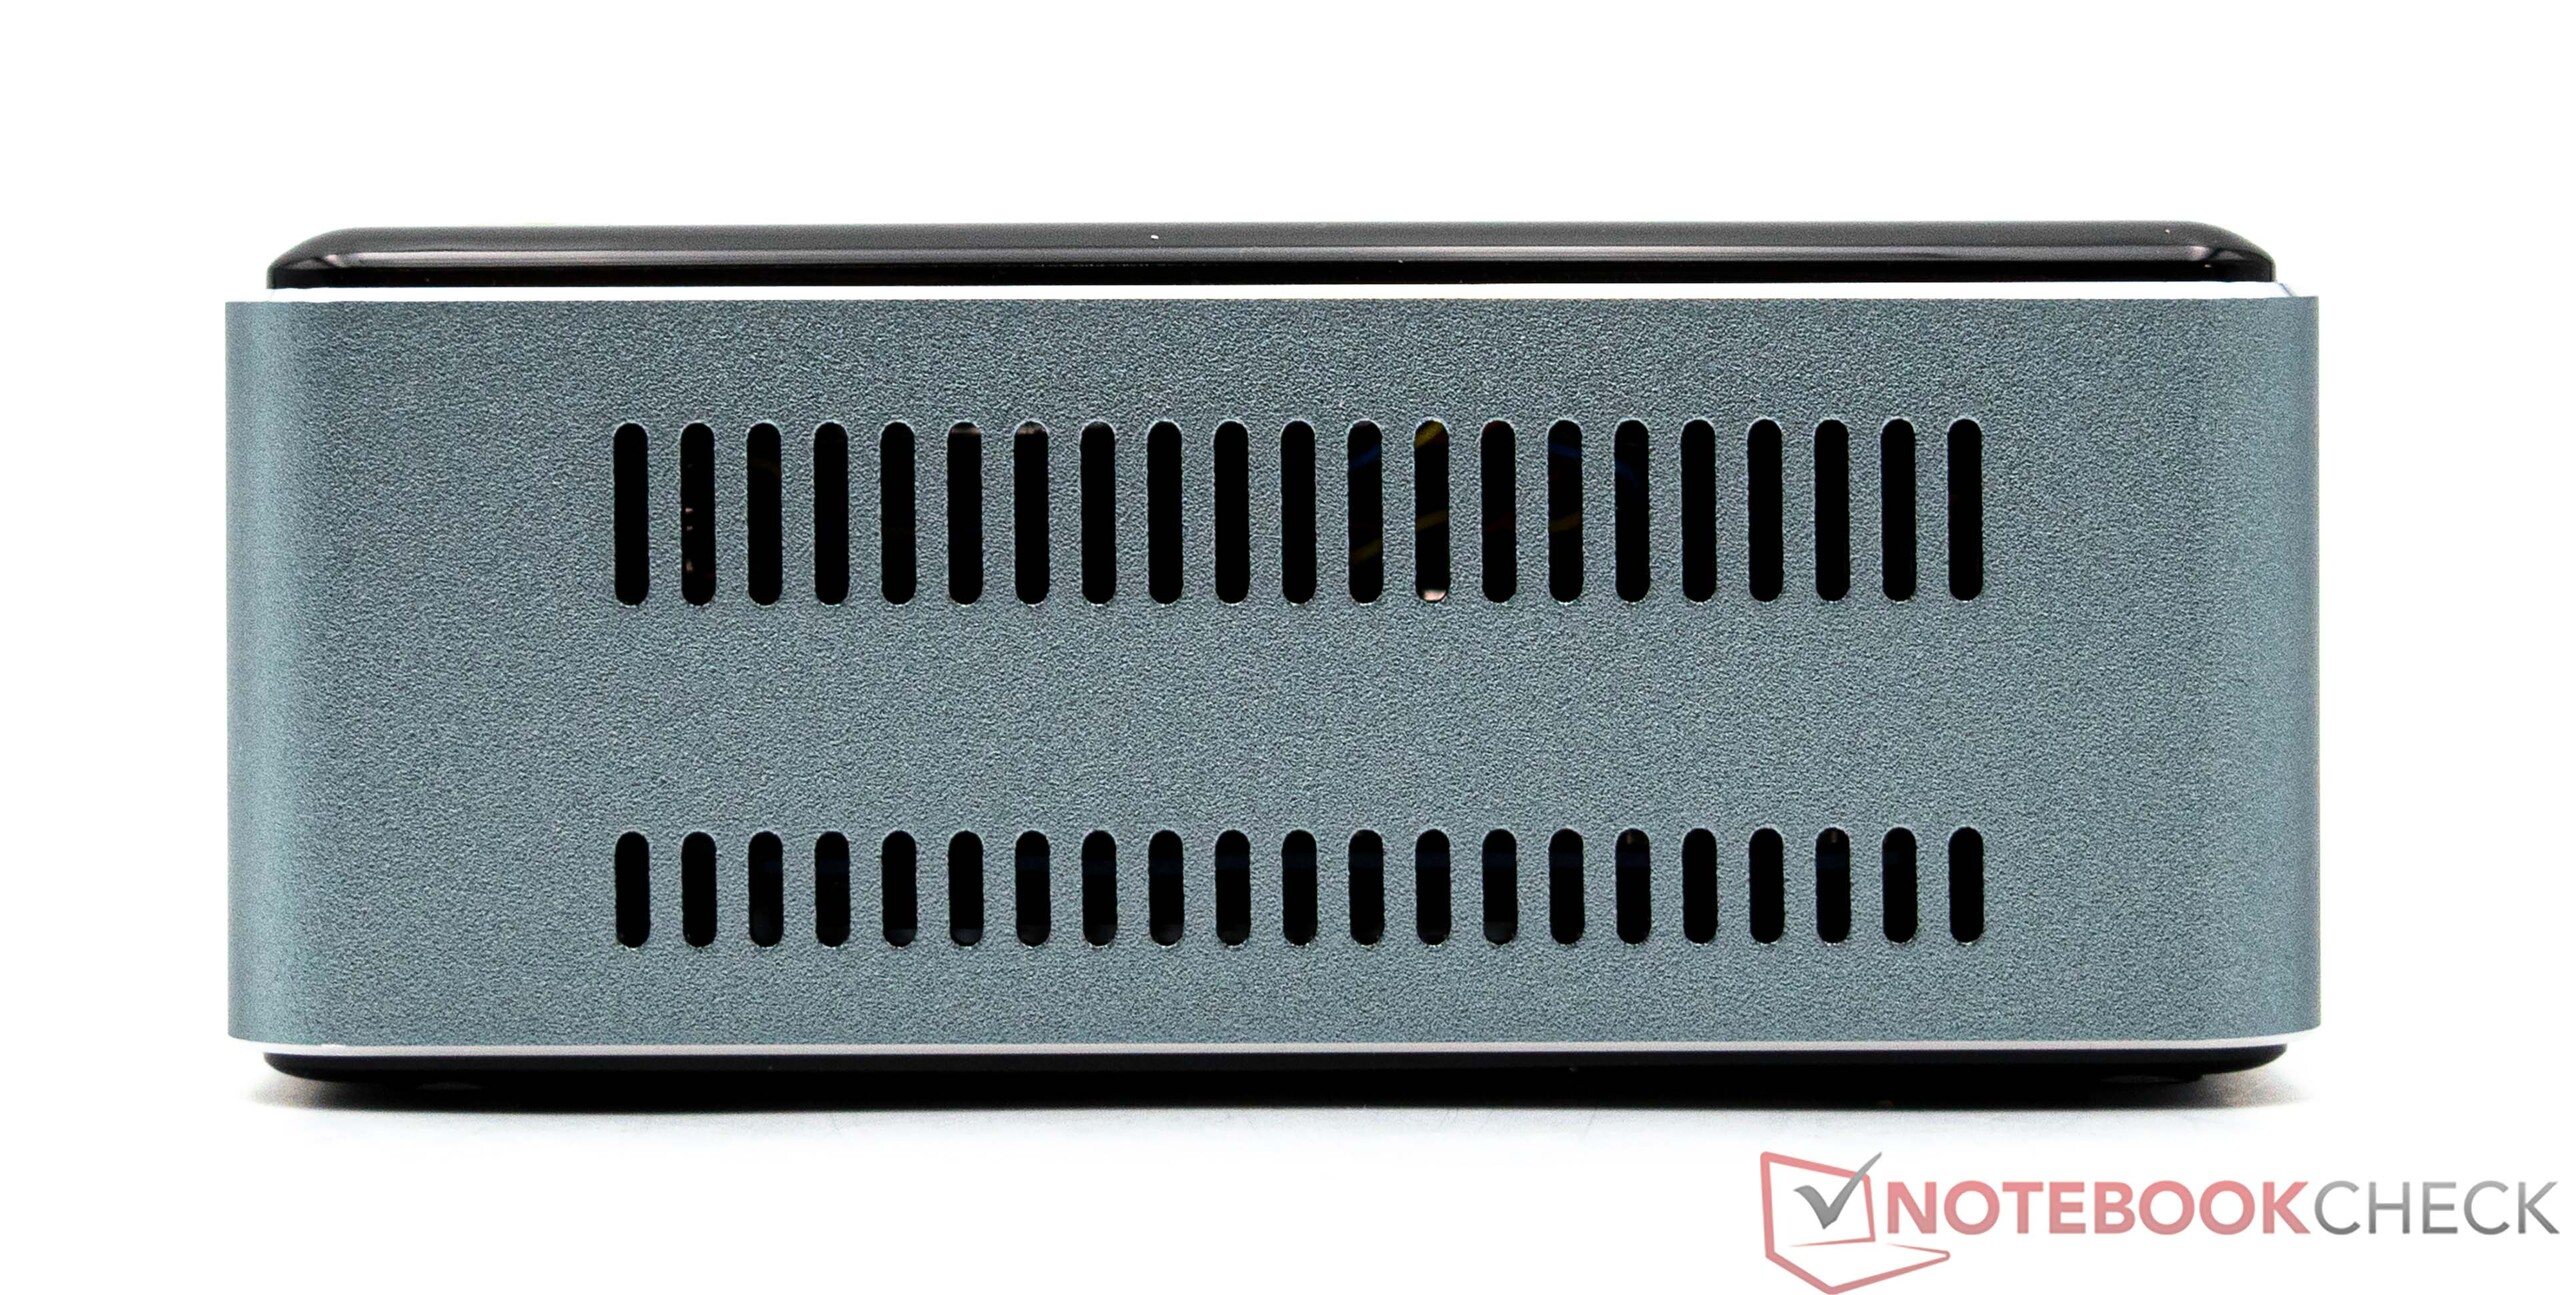

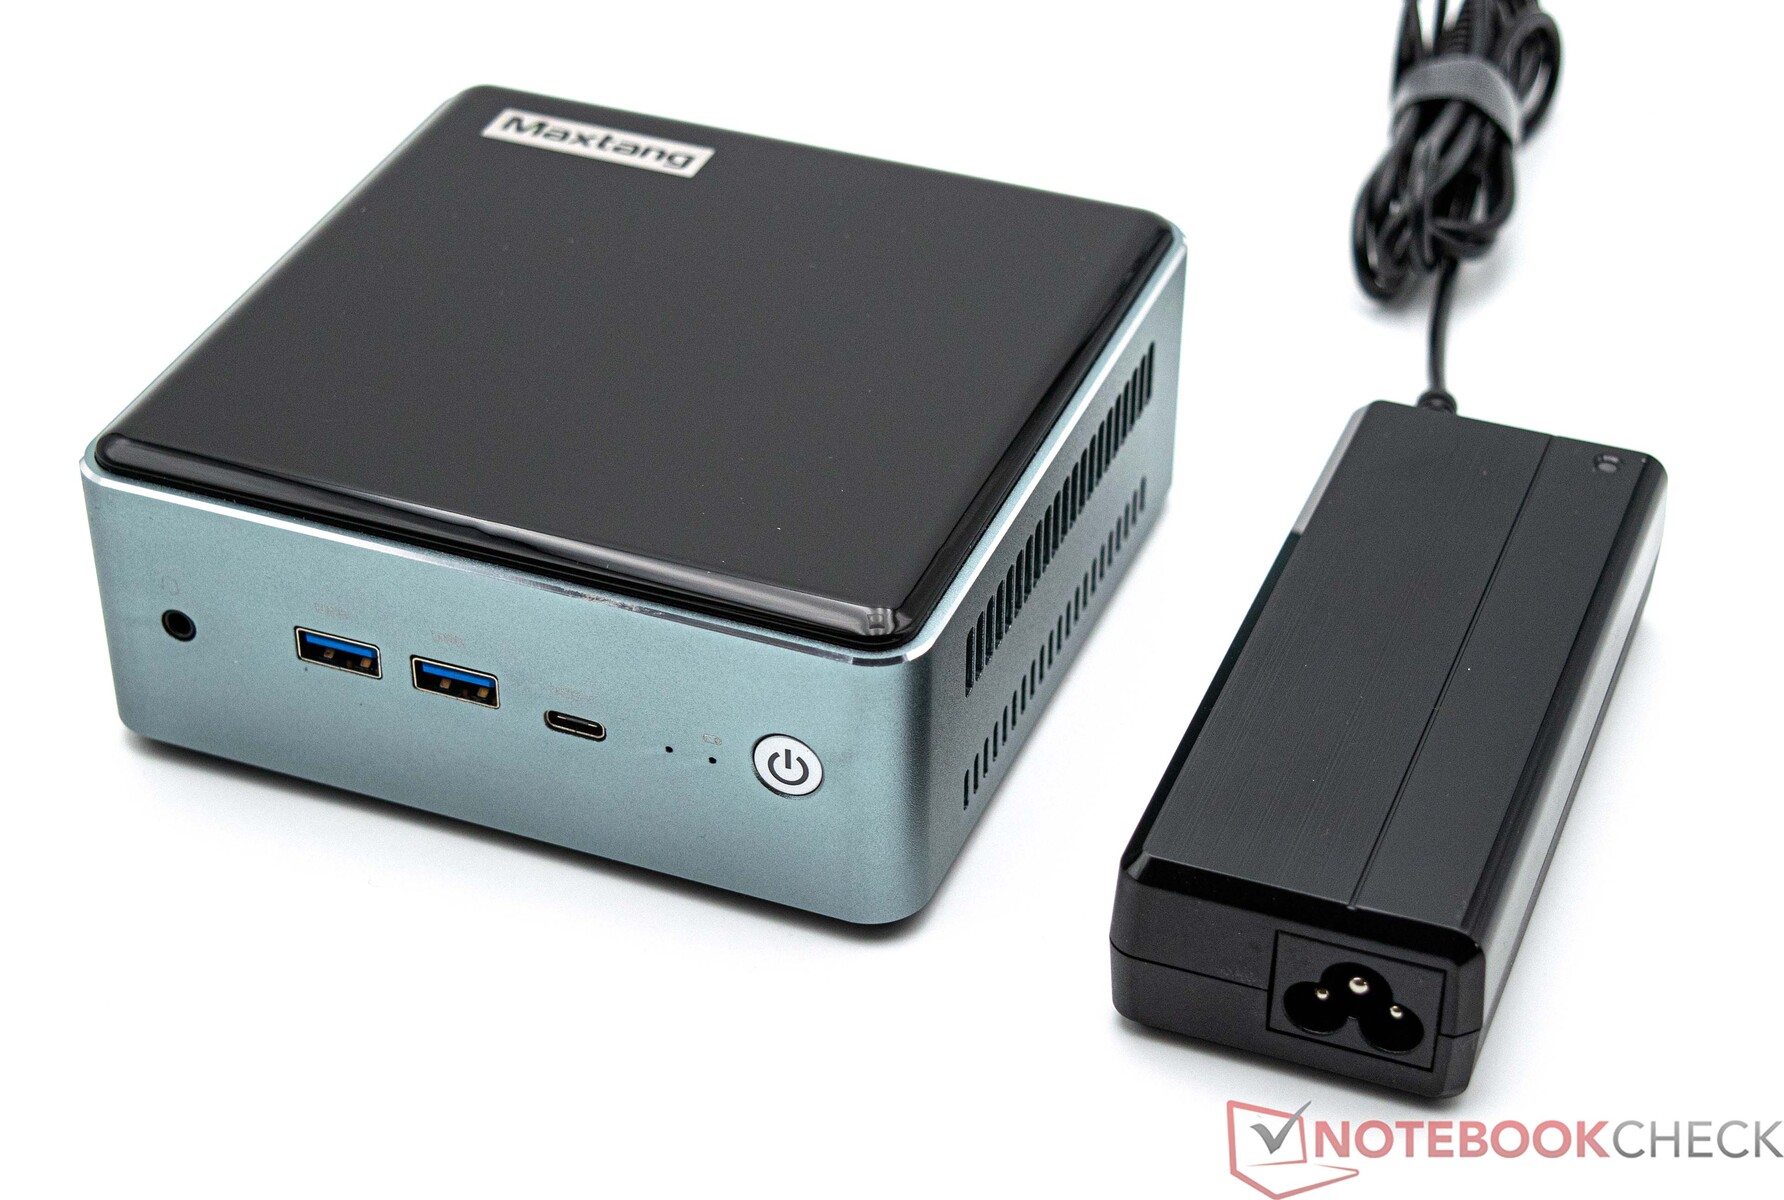
Boîtier - Métal et plastique en noir piano
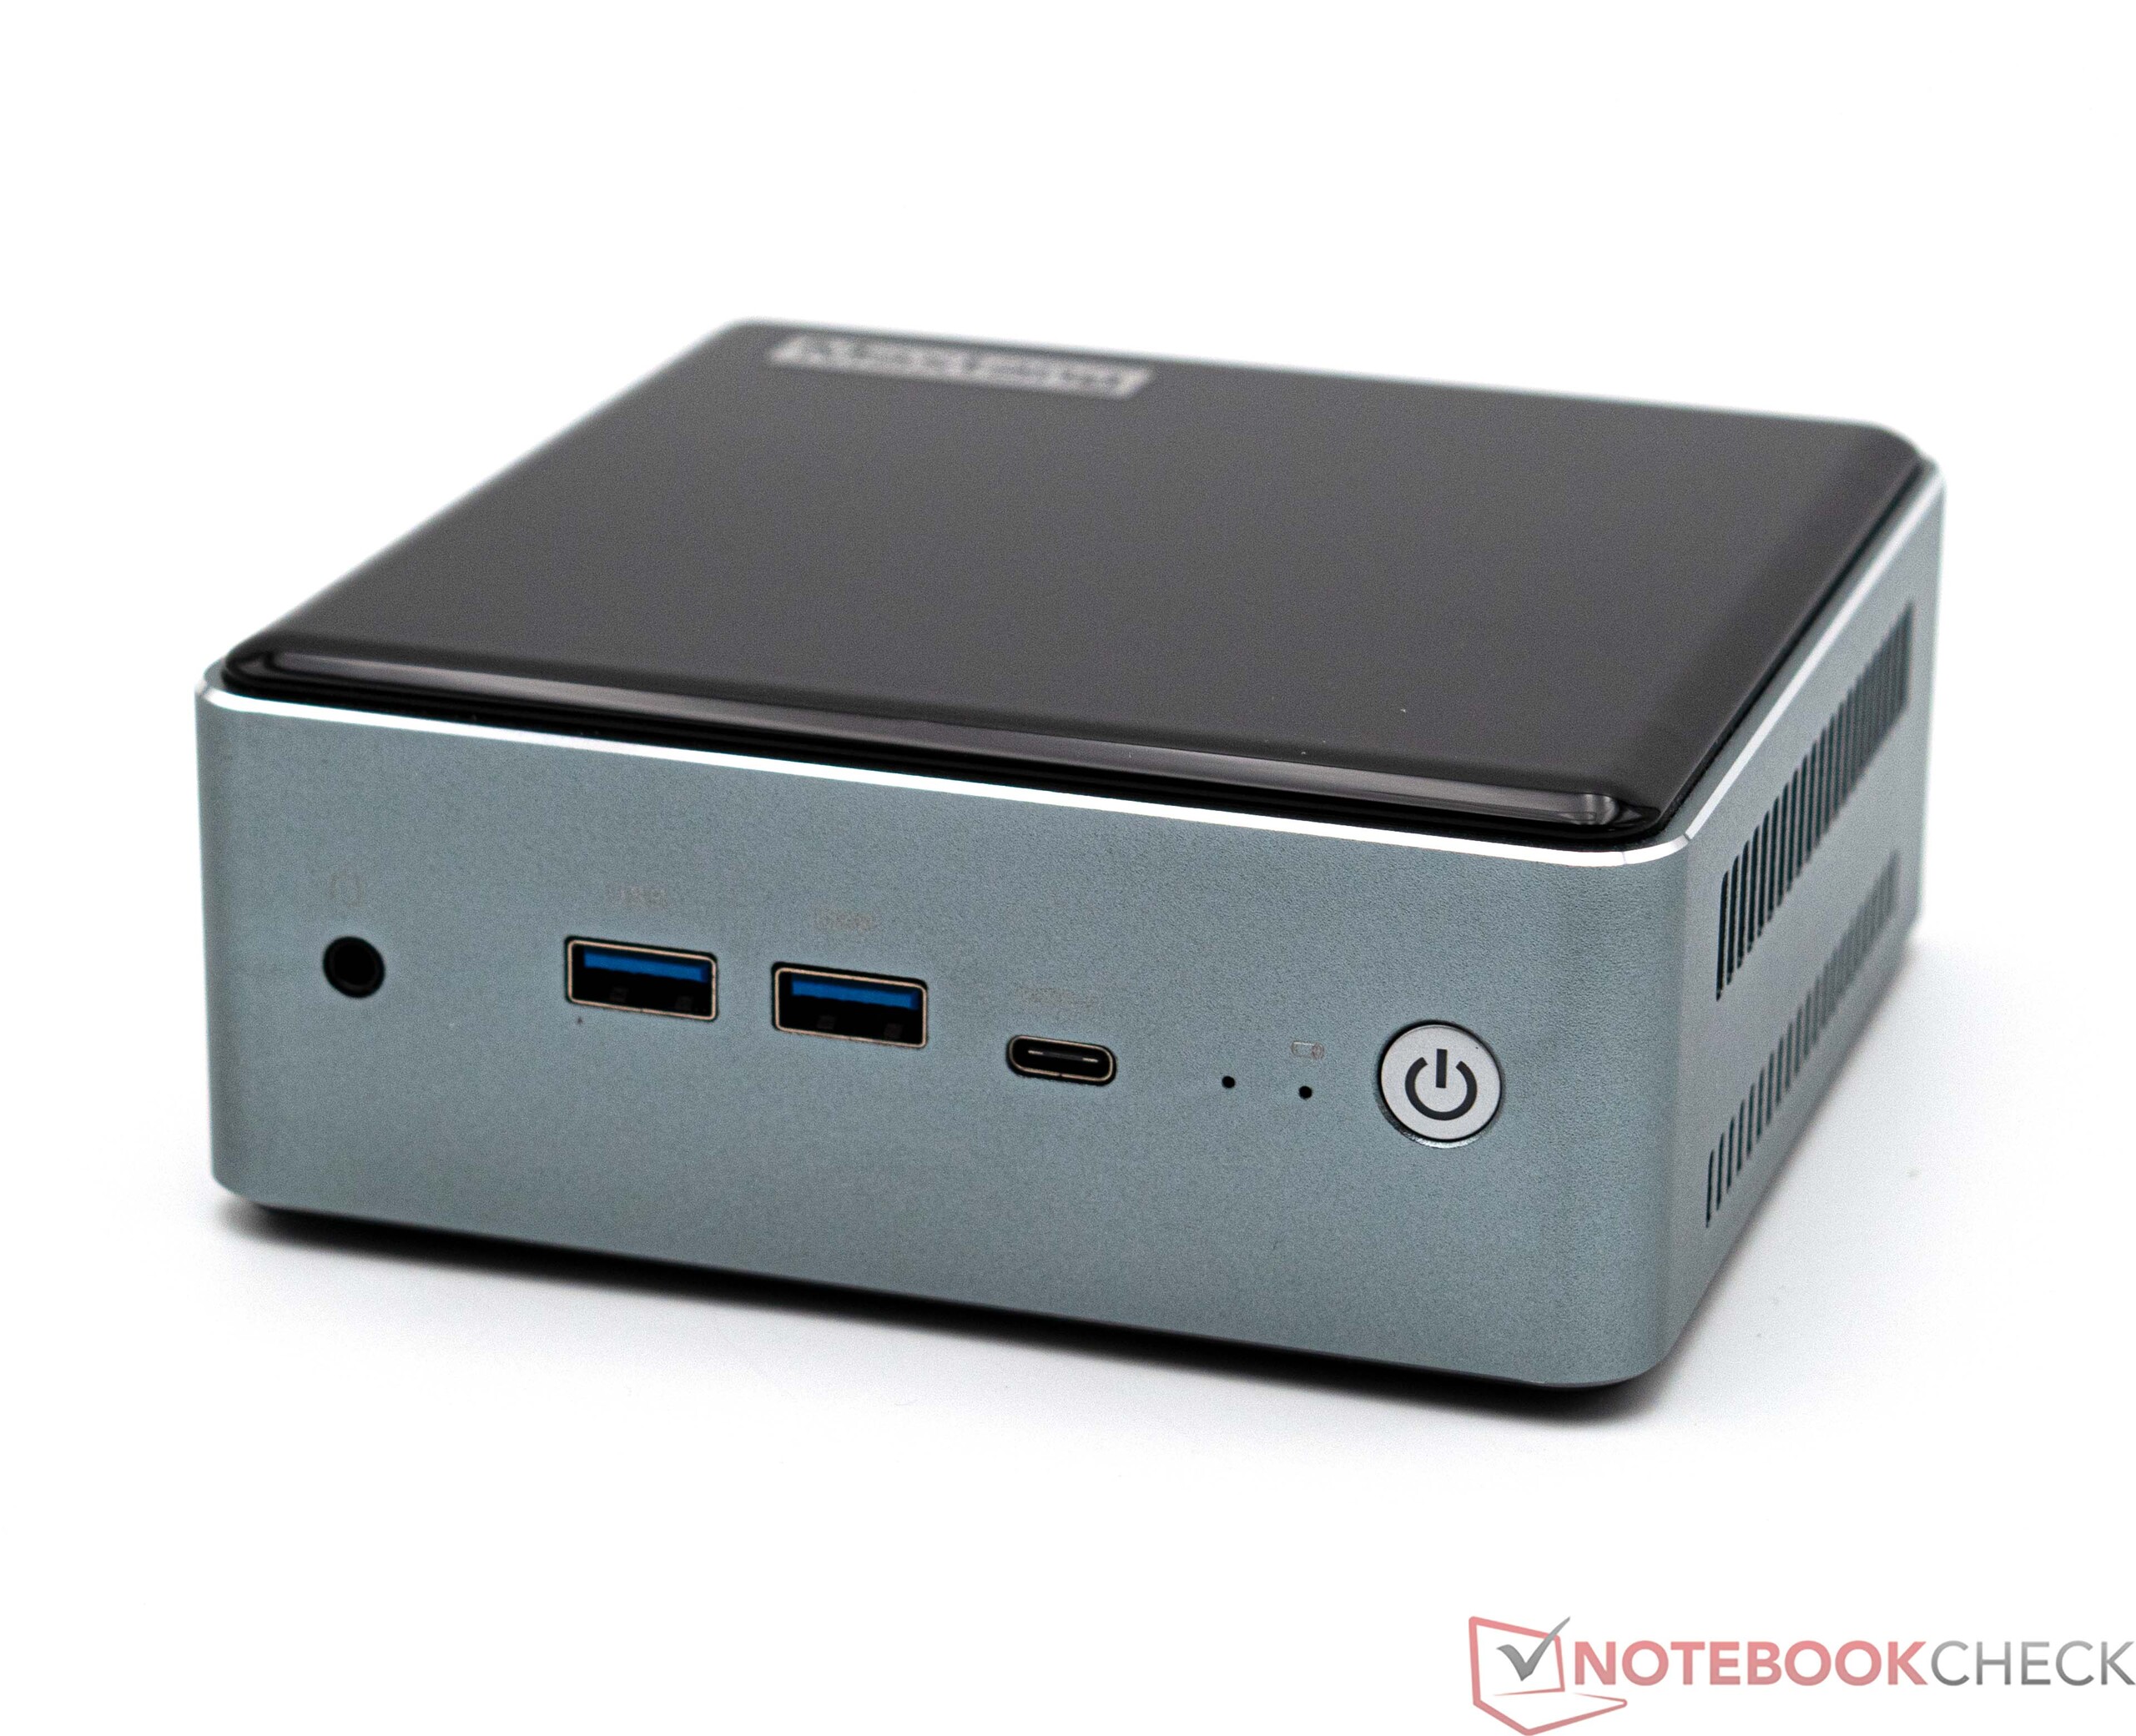
Le Maxtang MTN-FP750 est doté d'un boîtier métallique robuste, complété par des surfaces en plastique noir brillant sur le dessus et le dessous de l'appareil. Très rapidement, les empreintes digitales deviennent visibles et, tôt ou tard, les rayures sont inévitables. Du point de vue de la stabilité, l'appareil ne semble pas souffrir de la présence de couvercles en plastique. La marque Maxtang est inscrite sur le dessus du mini-PC.
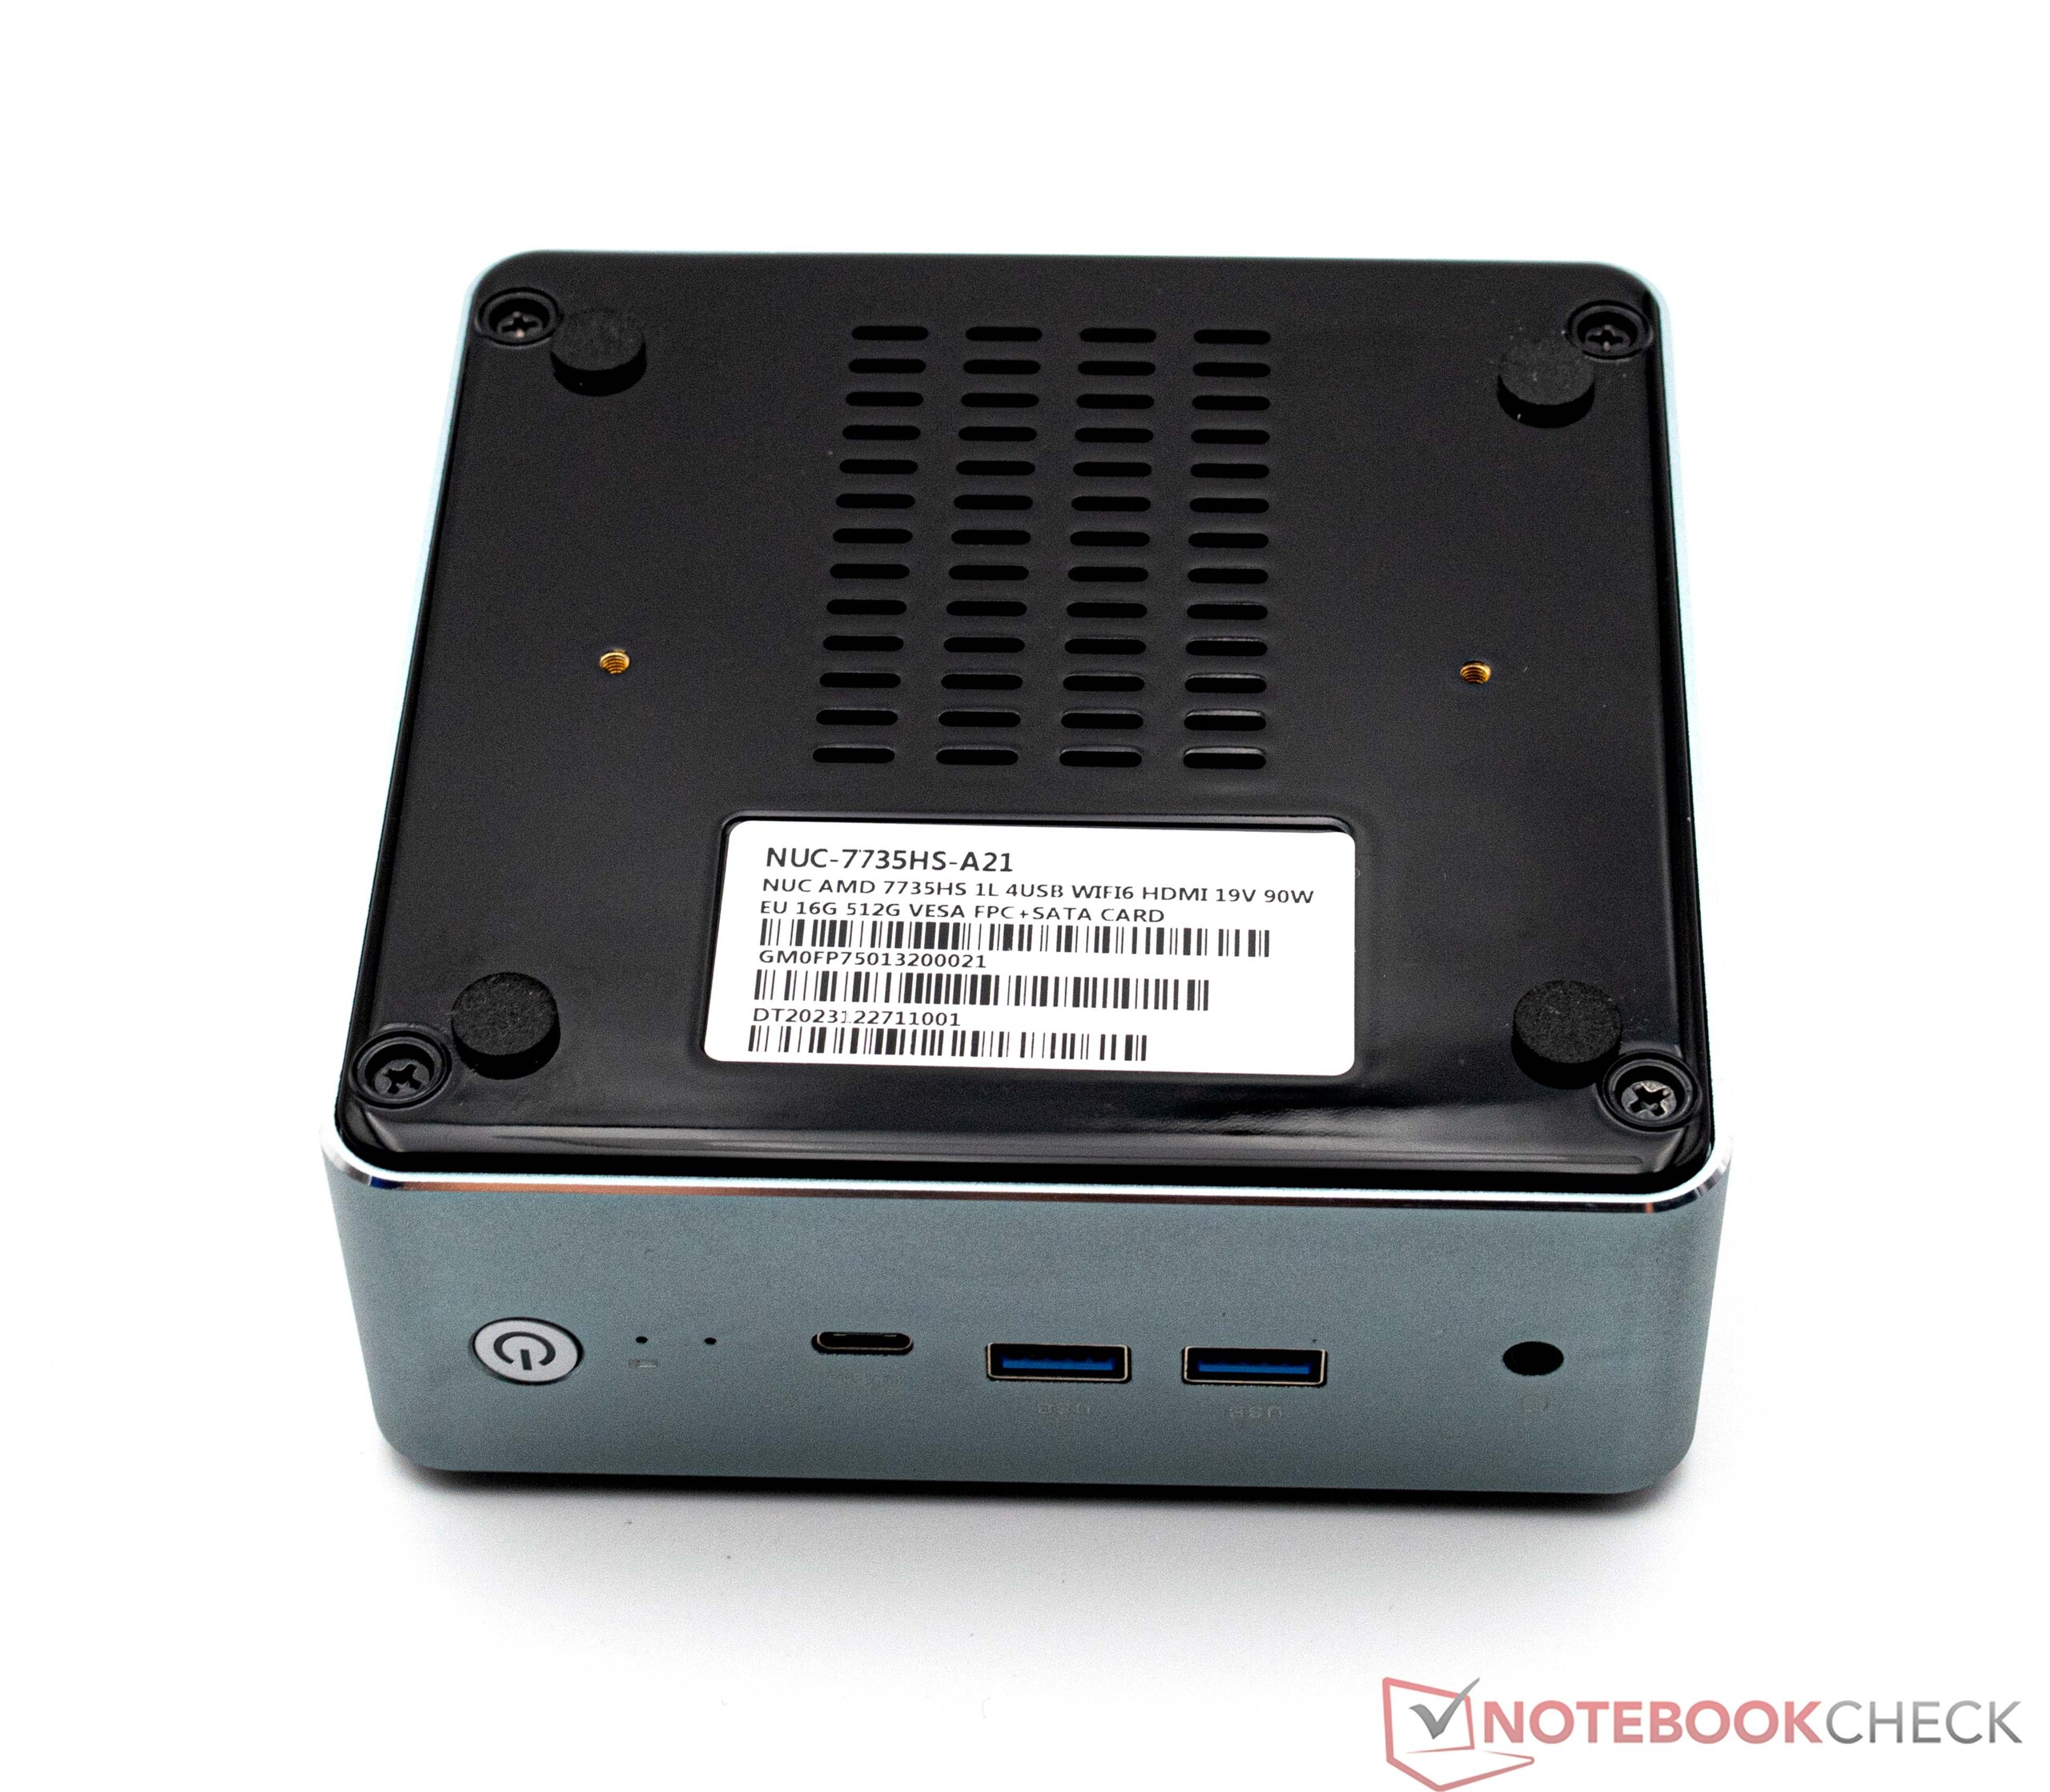
Avec ses 13 x 13 centimètres, l'appareil prend un peu plus de place sur le bureau que la concurrence et avec un poids de 600 grammes, le Maxtang MTN-FP750 est relativement léger. Le bloc d'alimentation pèse à peine 290 grammes. Le Maxtang MTN-FP750 peut également être fixé à un moniteur et un support VESA est inclus dans la boîte.
Caractéristiques
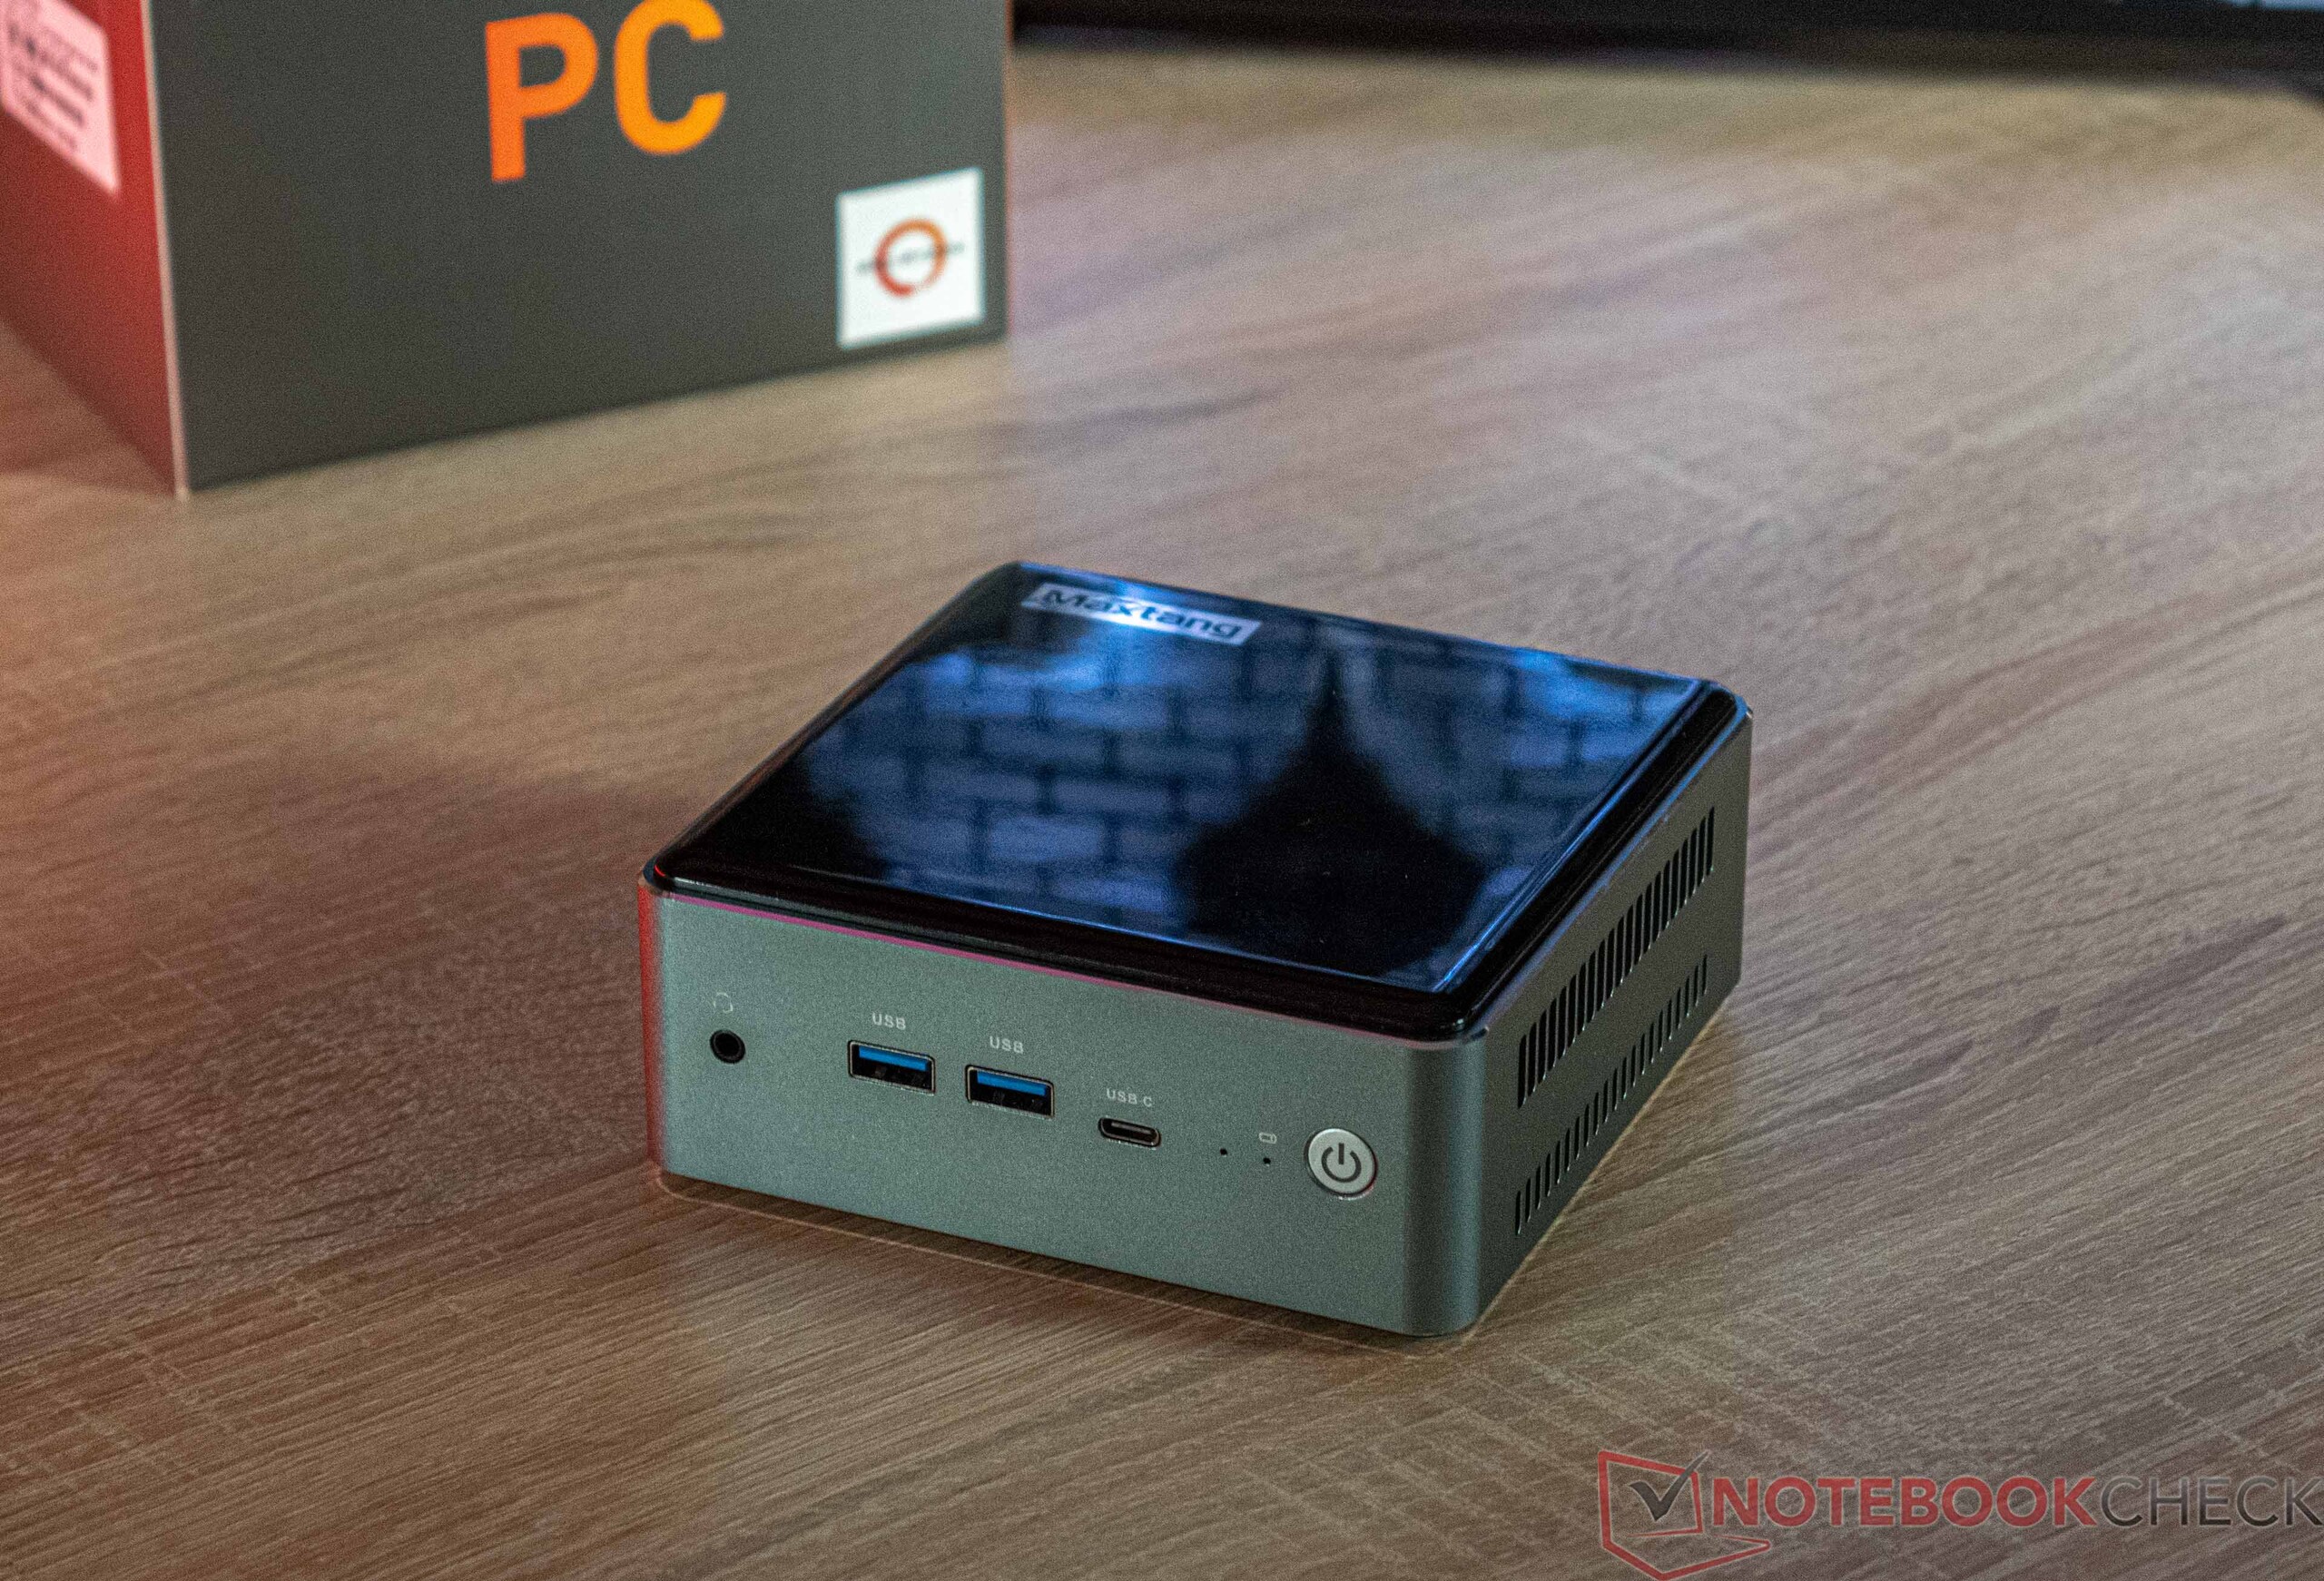
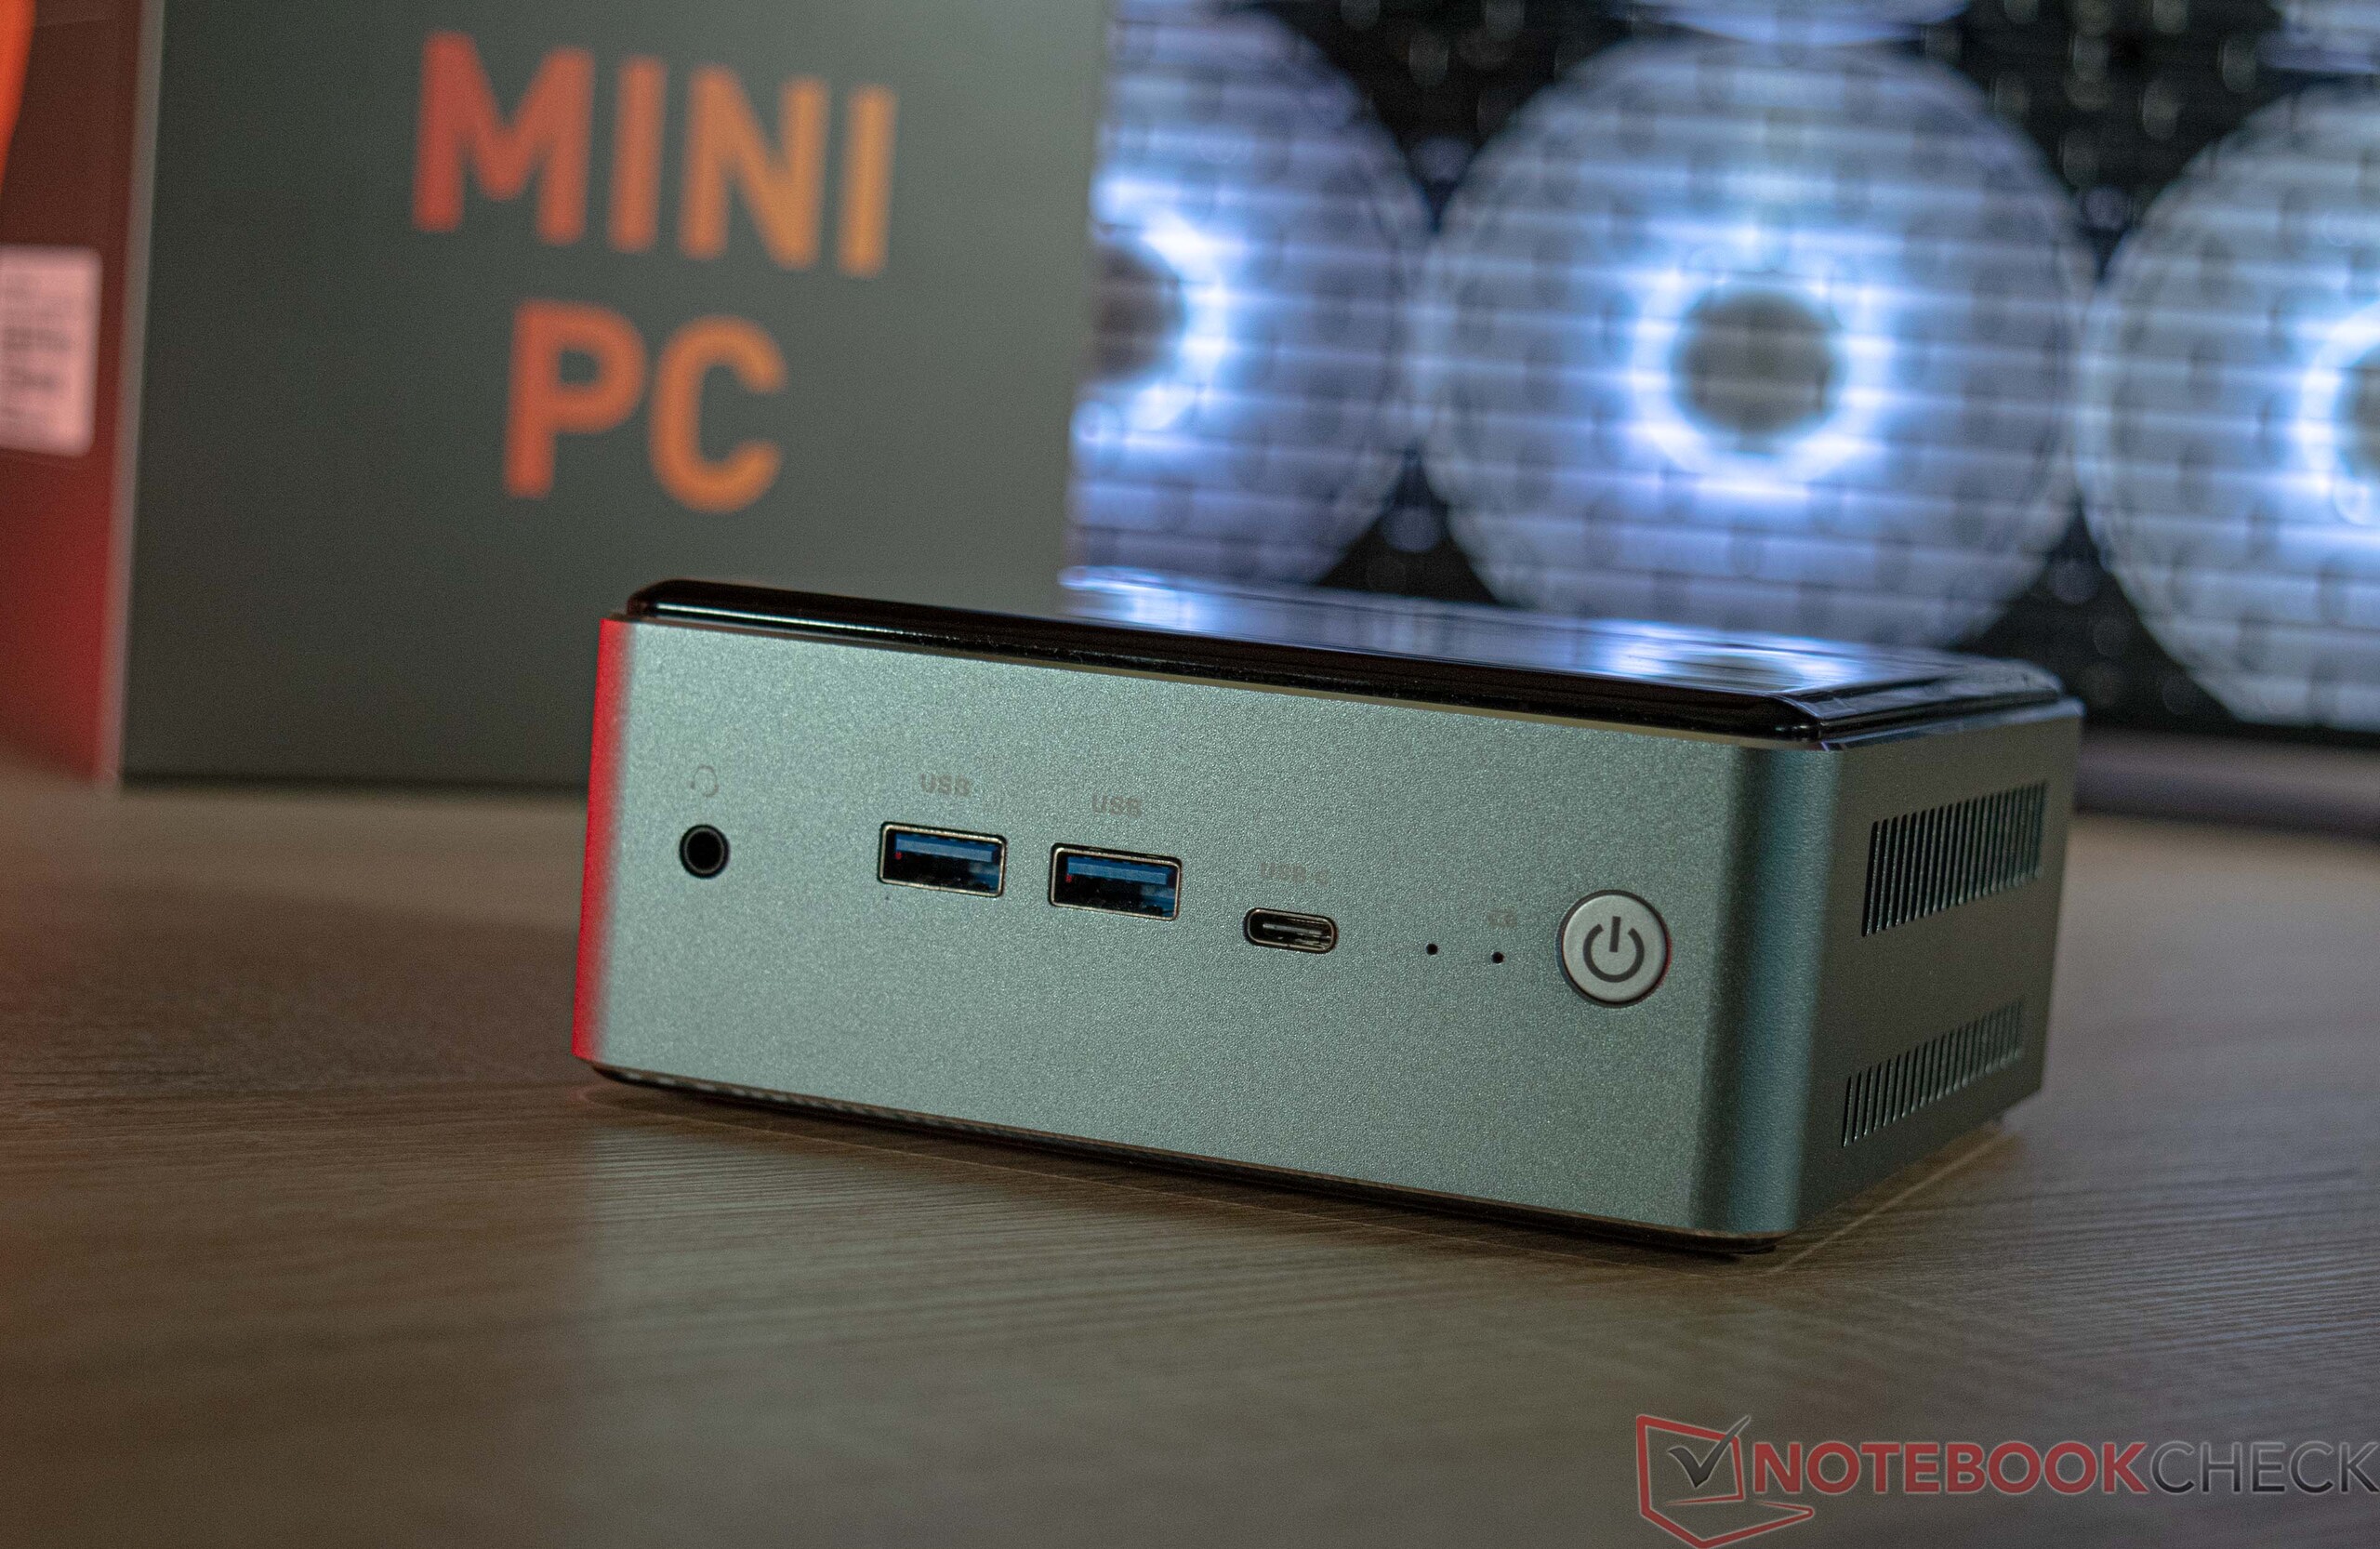
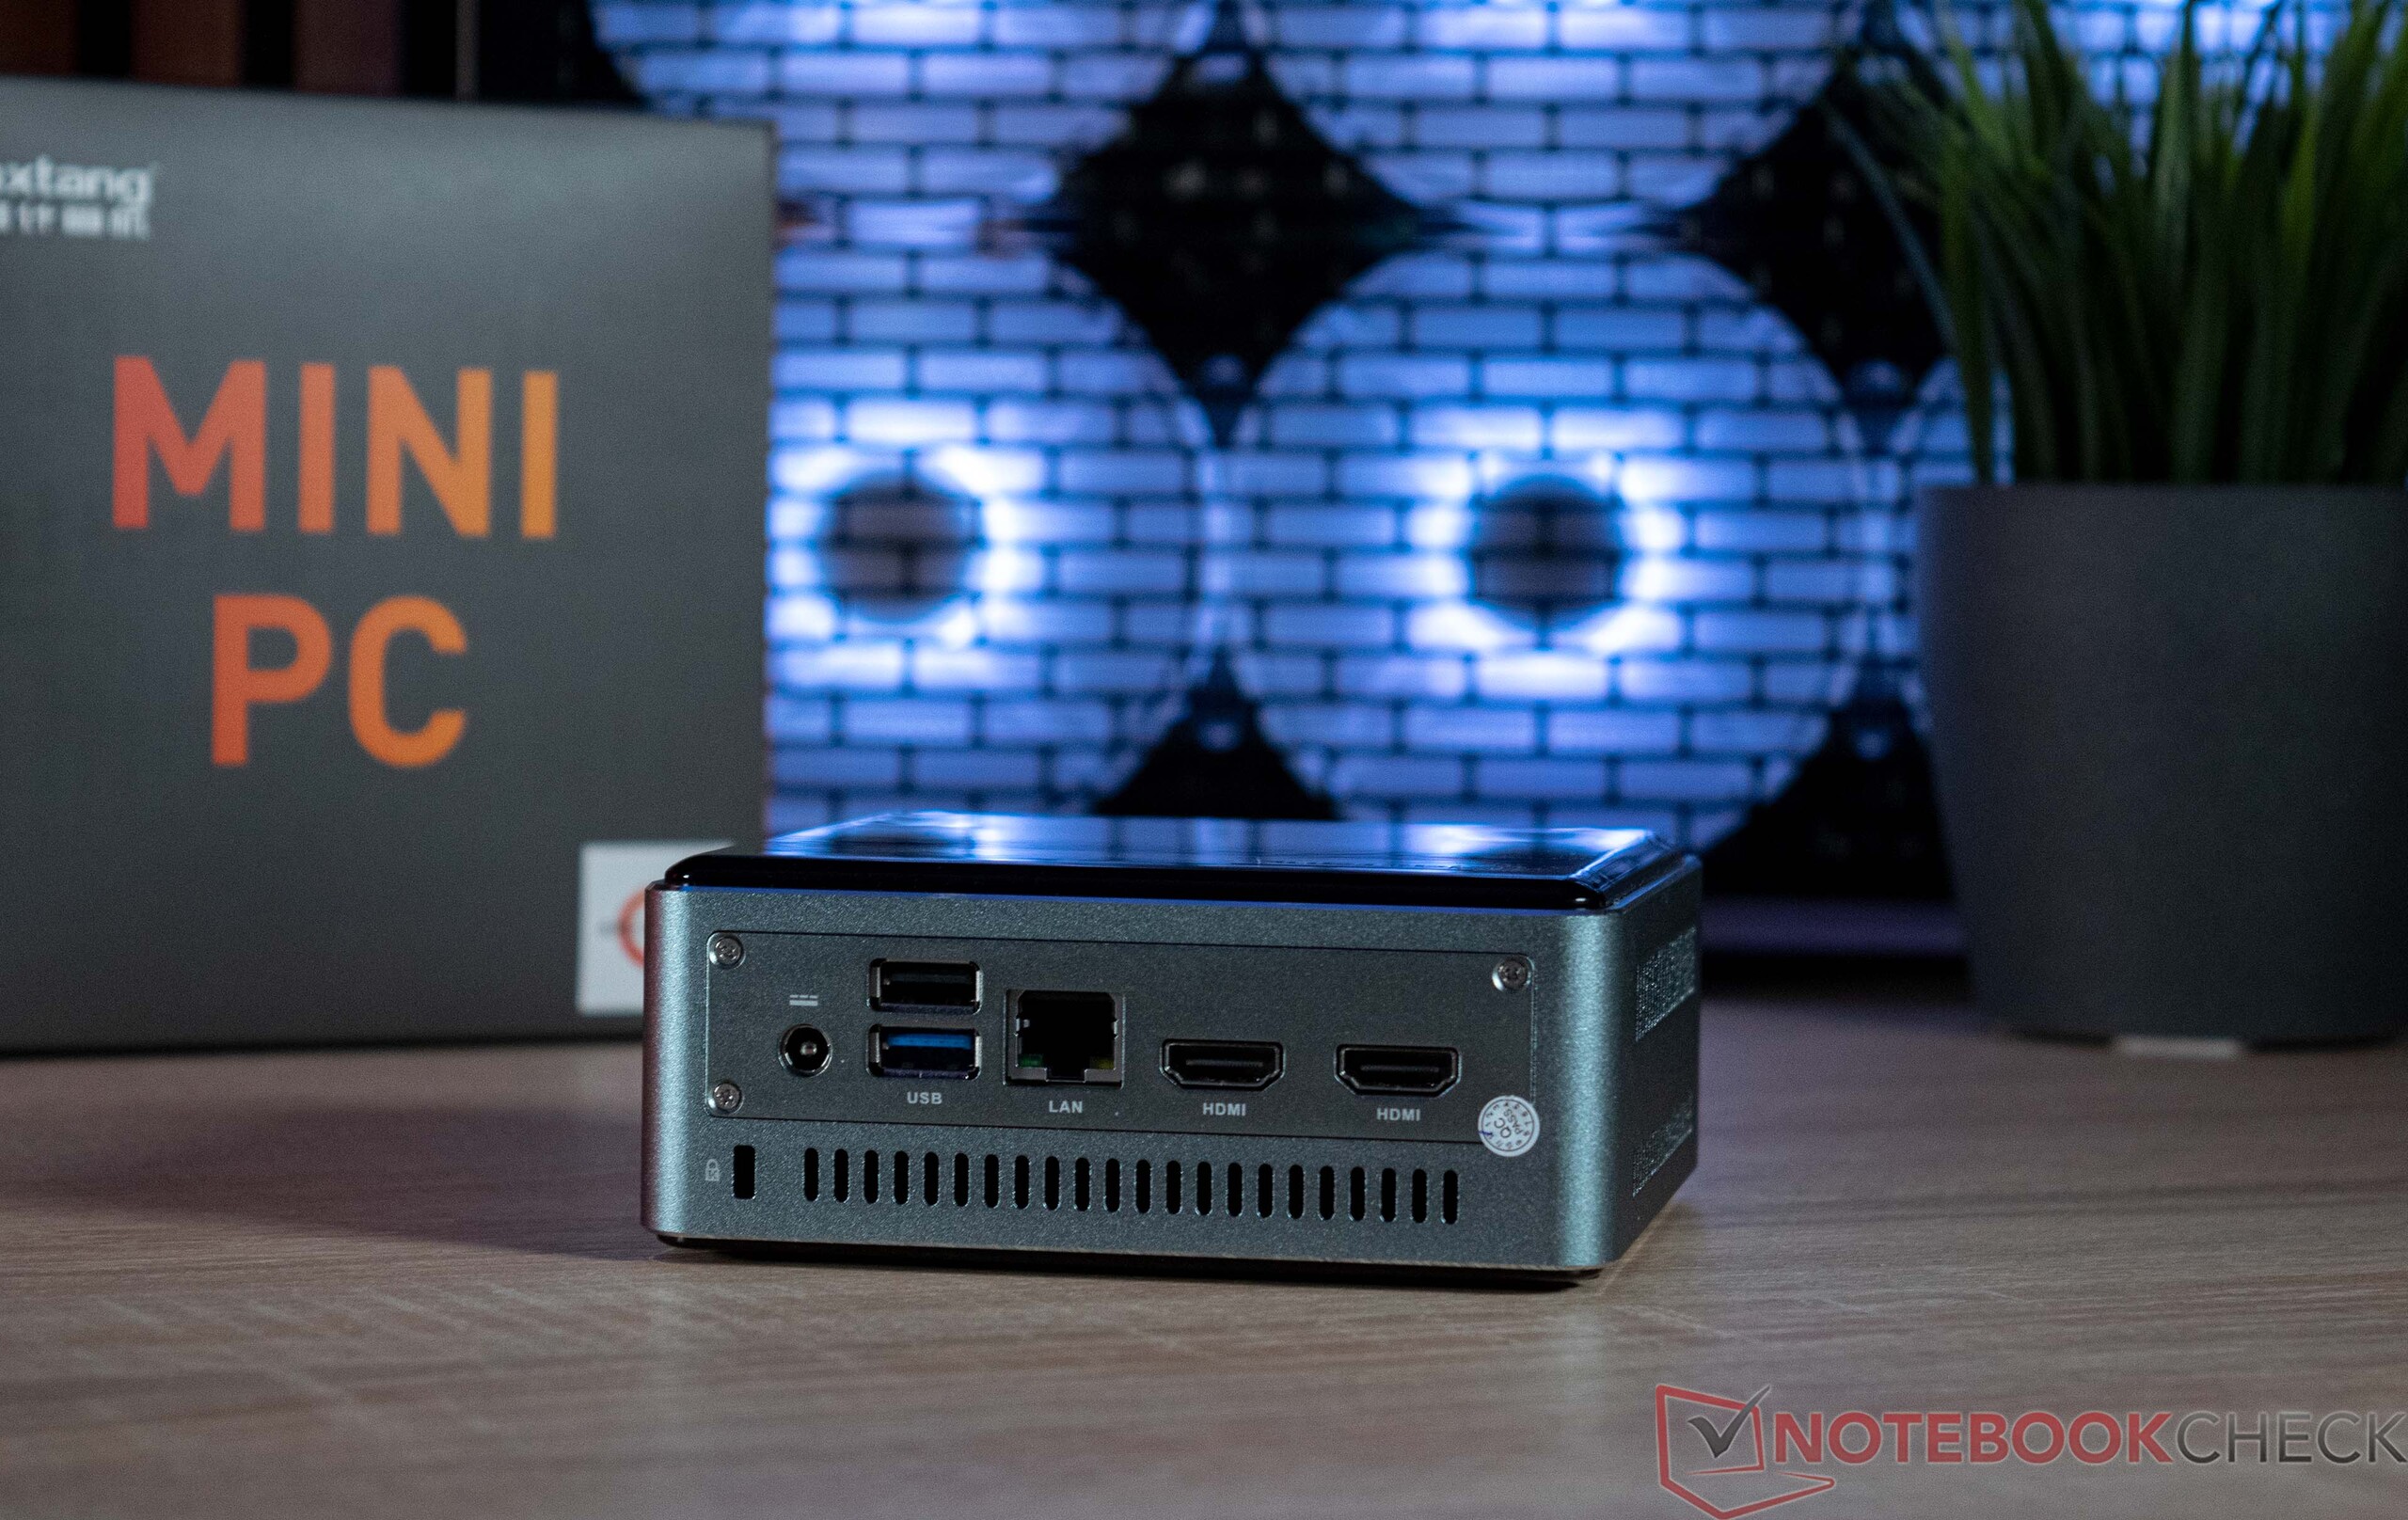
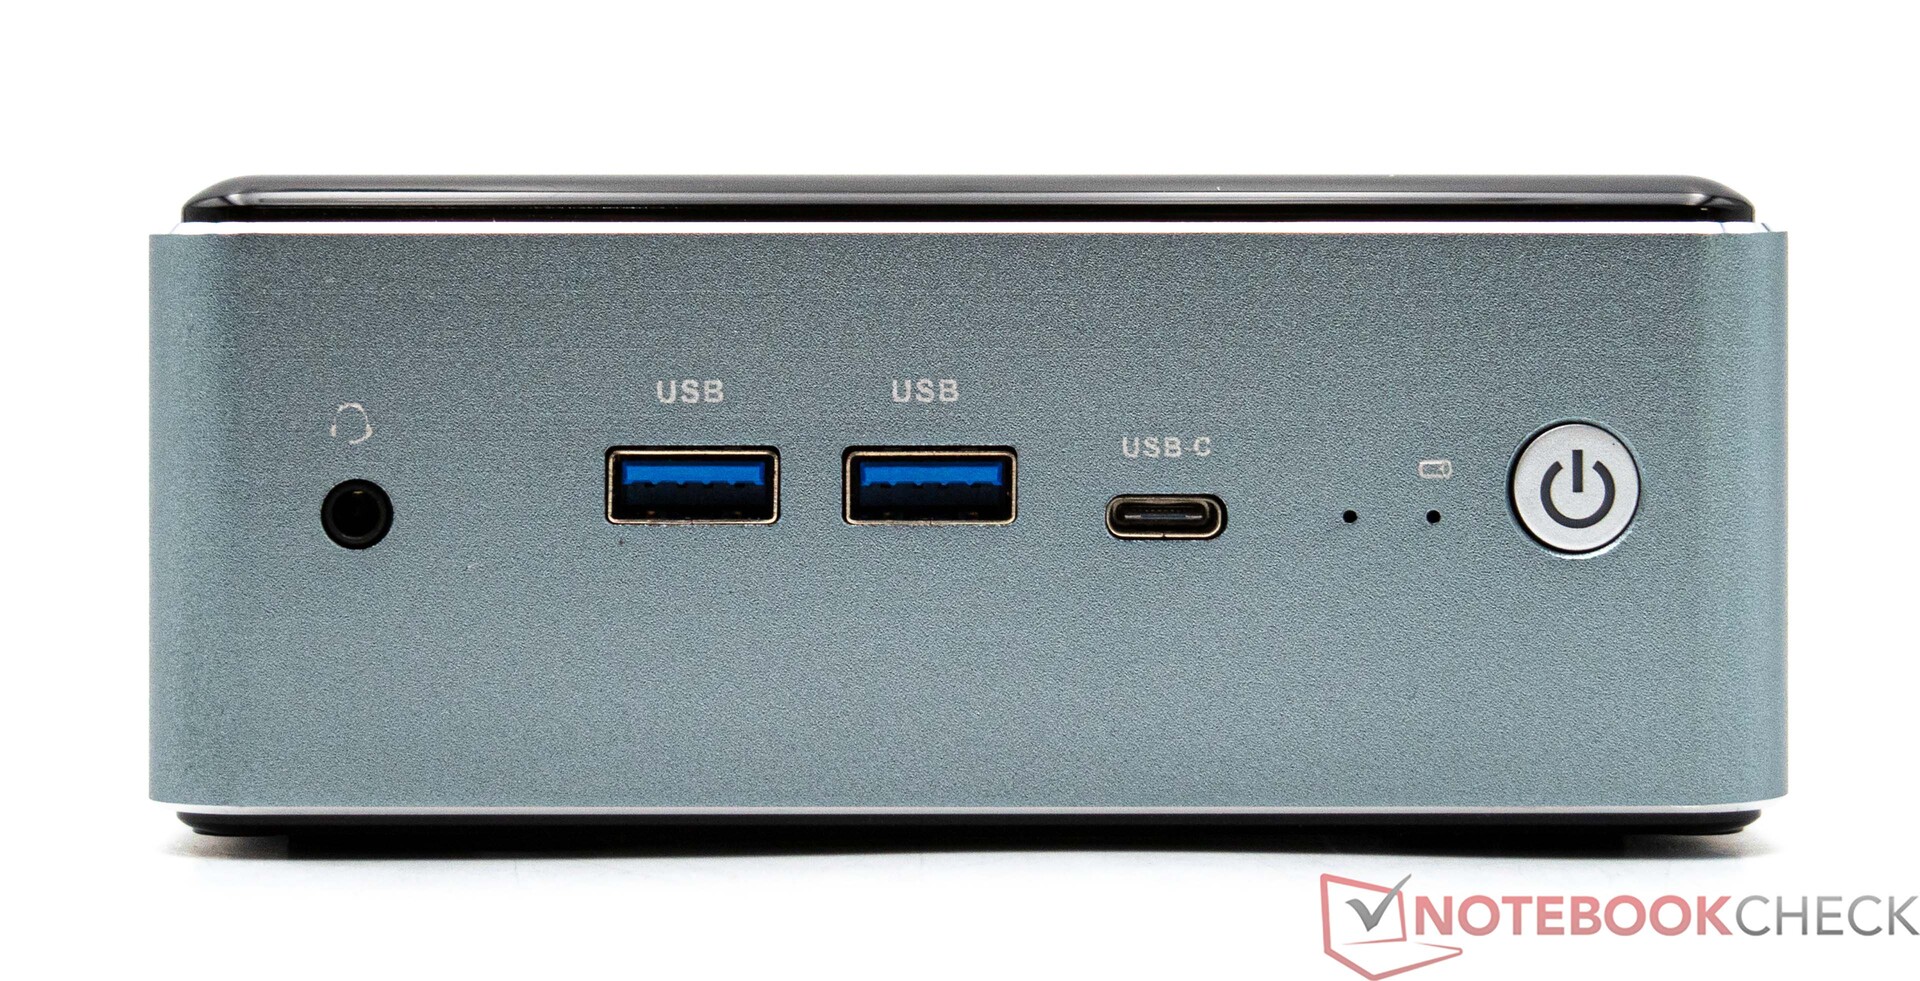
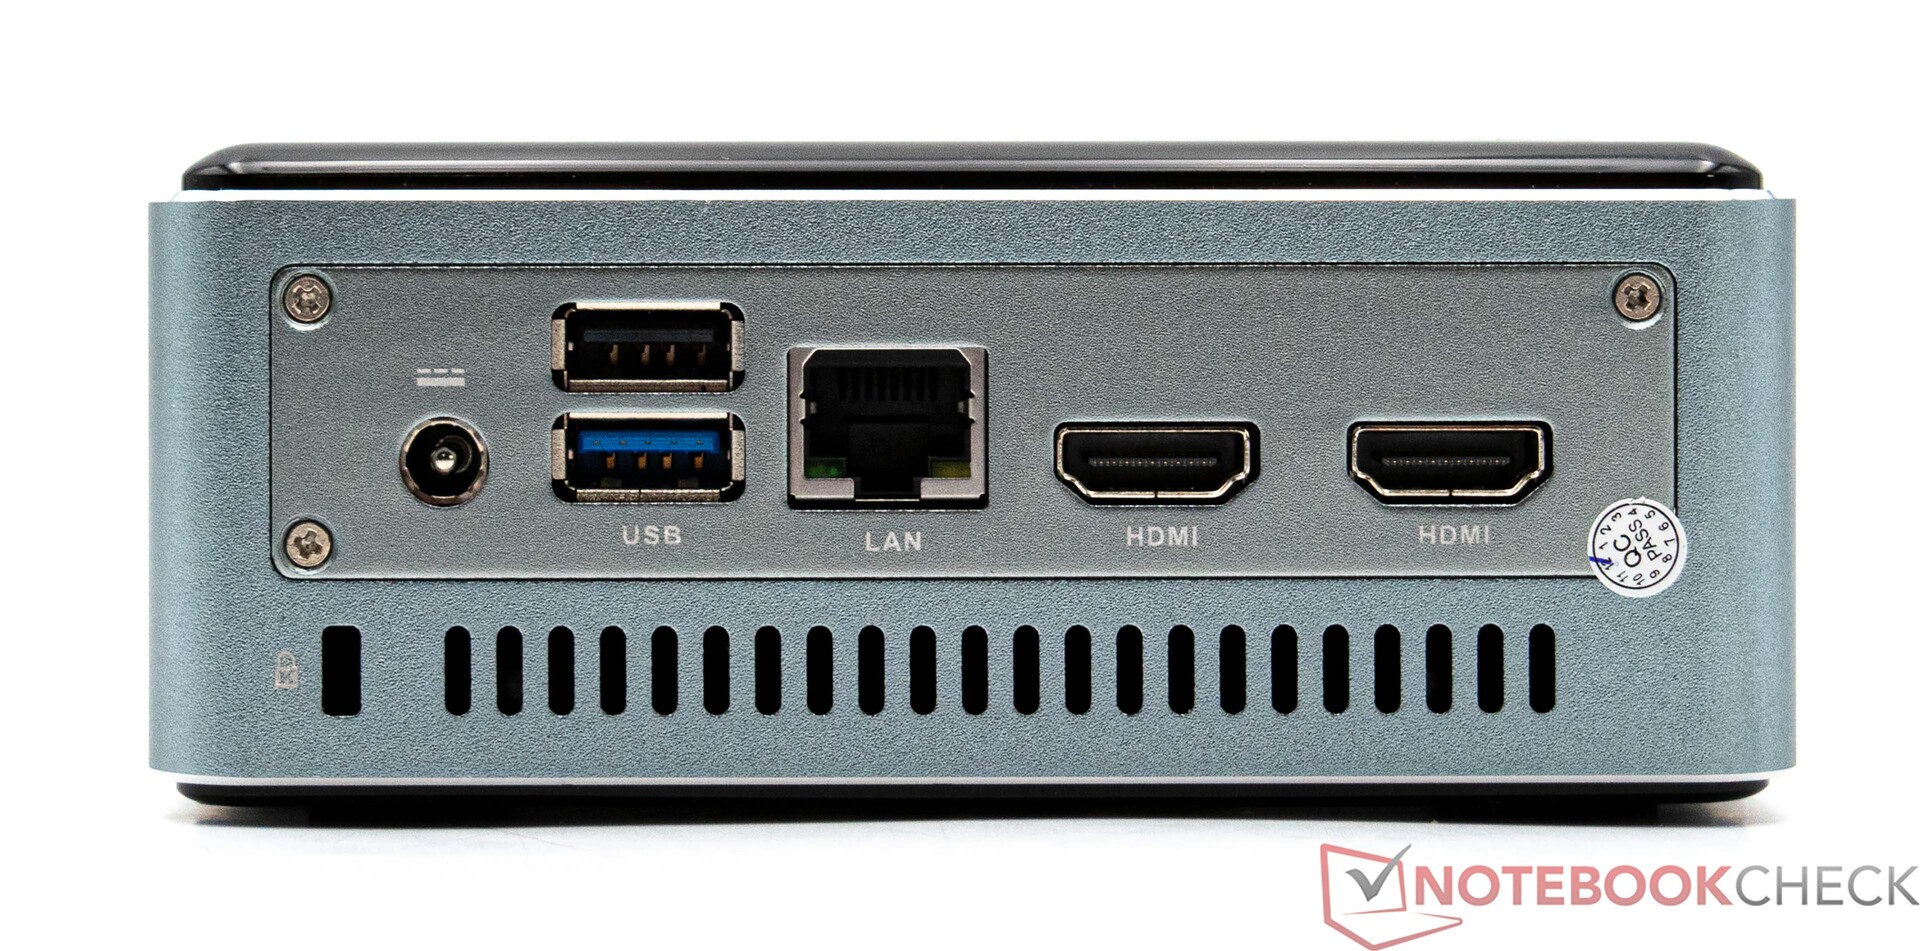
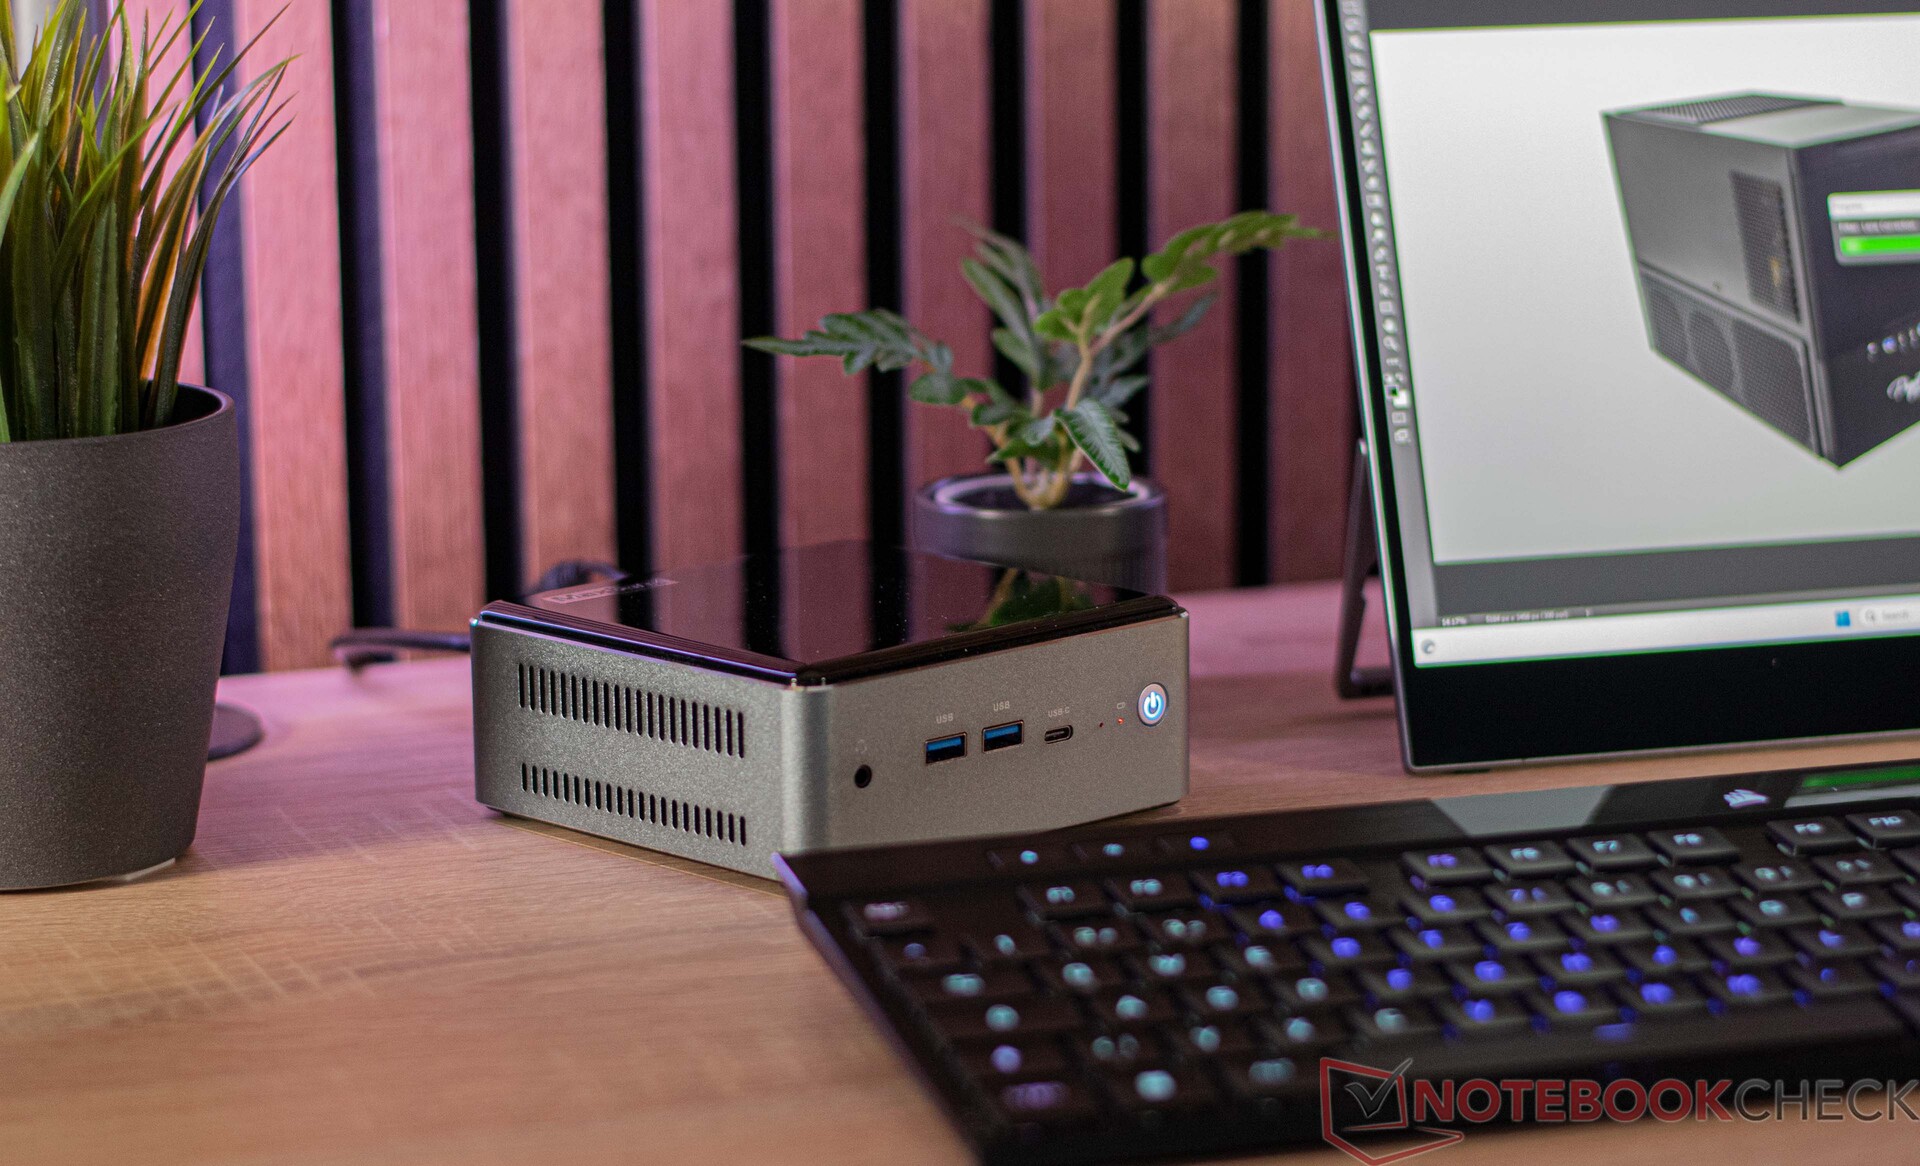
En ce qui concerne les ports, le Maxtang MTN-FP750 offre l'essentiel. Ils se trouvent tous à l'avant et à l'arrière. Il y a au total cinq ports USB, dont l'un (USB Type C) peut également être utilisé comme connecteur d'affichage. Avec les deux sorties HDMI à l'arrière, cela signifie qu'un total de trois moniteurs peut être utilisé simultanément. En outre, l'arrière de l'appareil abrite également le port LAN 2,5G.
Communication
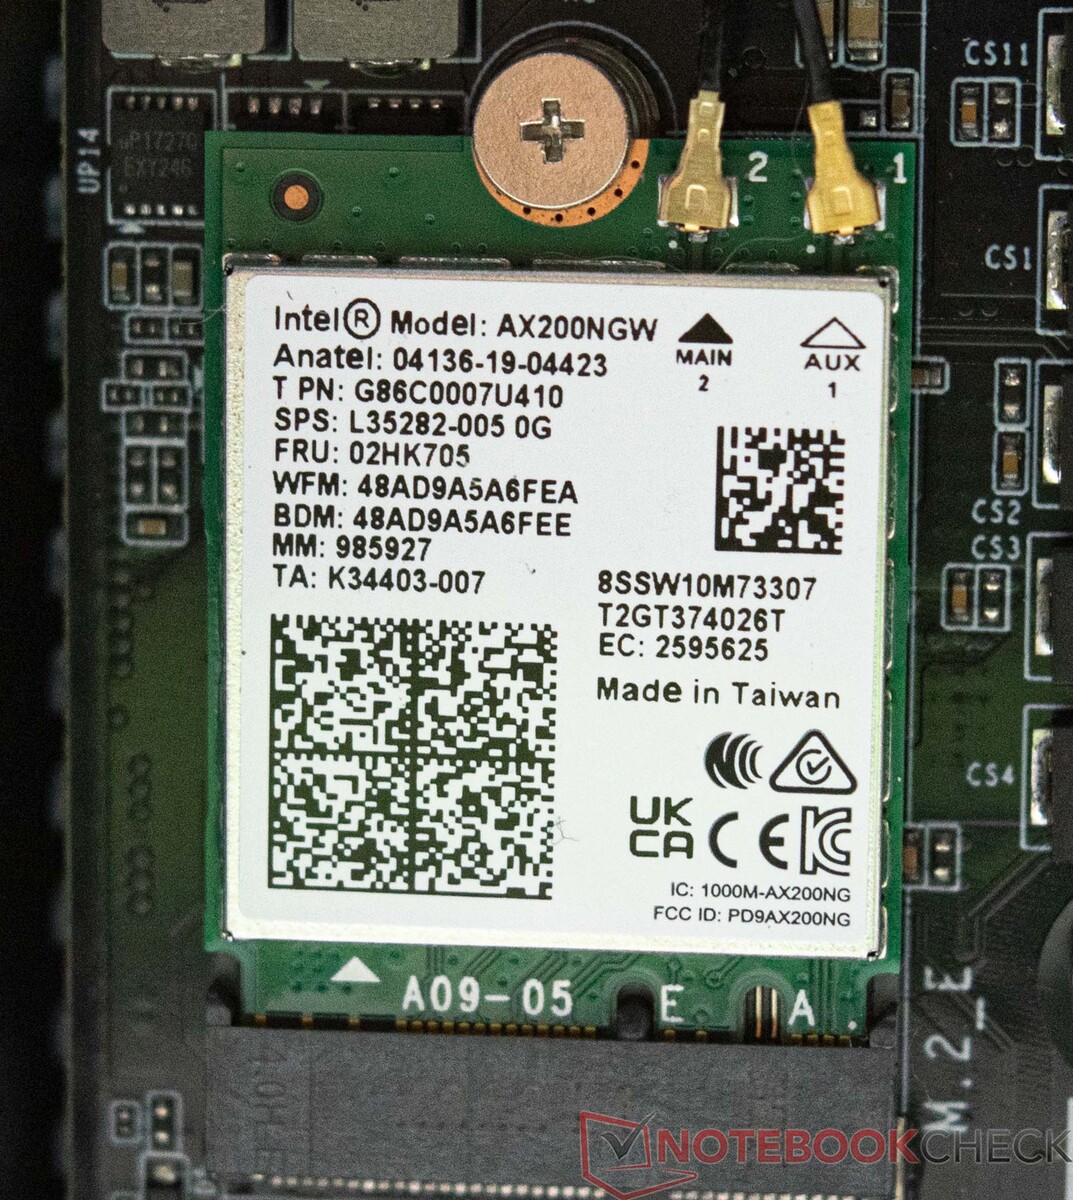
Le Maxtang MTN-FP750 est équipé d'un module sans fil Intel Wi-Fi 6 AX200 capable de gérer les fréquences de 2,4 et 5 GHz. Lors des tests, notre échantillon ne nous a pas vraiment impressionnés par ses résultats. Pour le test, nous avons utilisé un Asus ROG Rapture GT-AXE11000. Vous pouvez également connecter le mini-PC Maxtang au réseau via un port Ethernet. Les vitesses de transfert peuvent atteindre 2,5 Gbit/s.
Accessoires
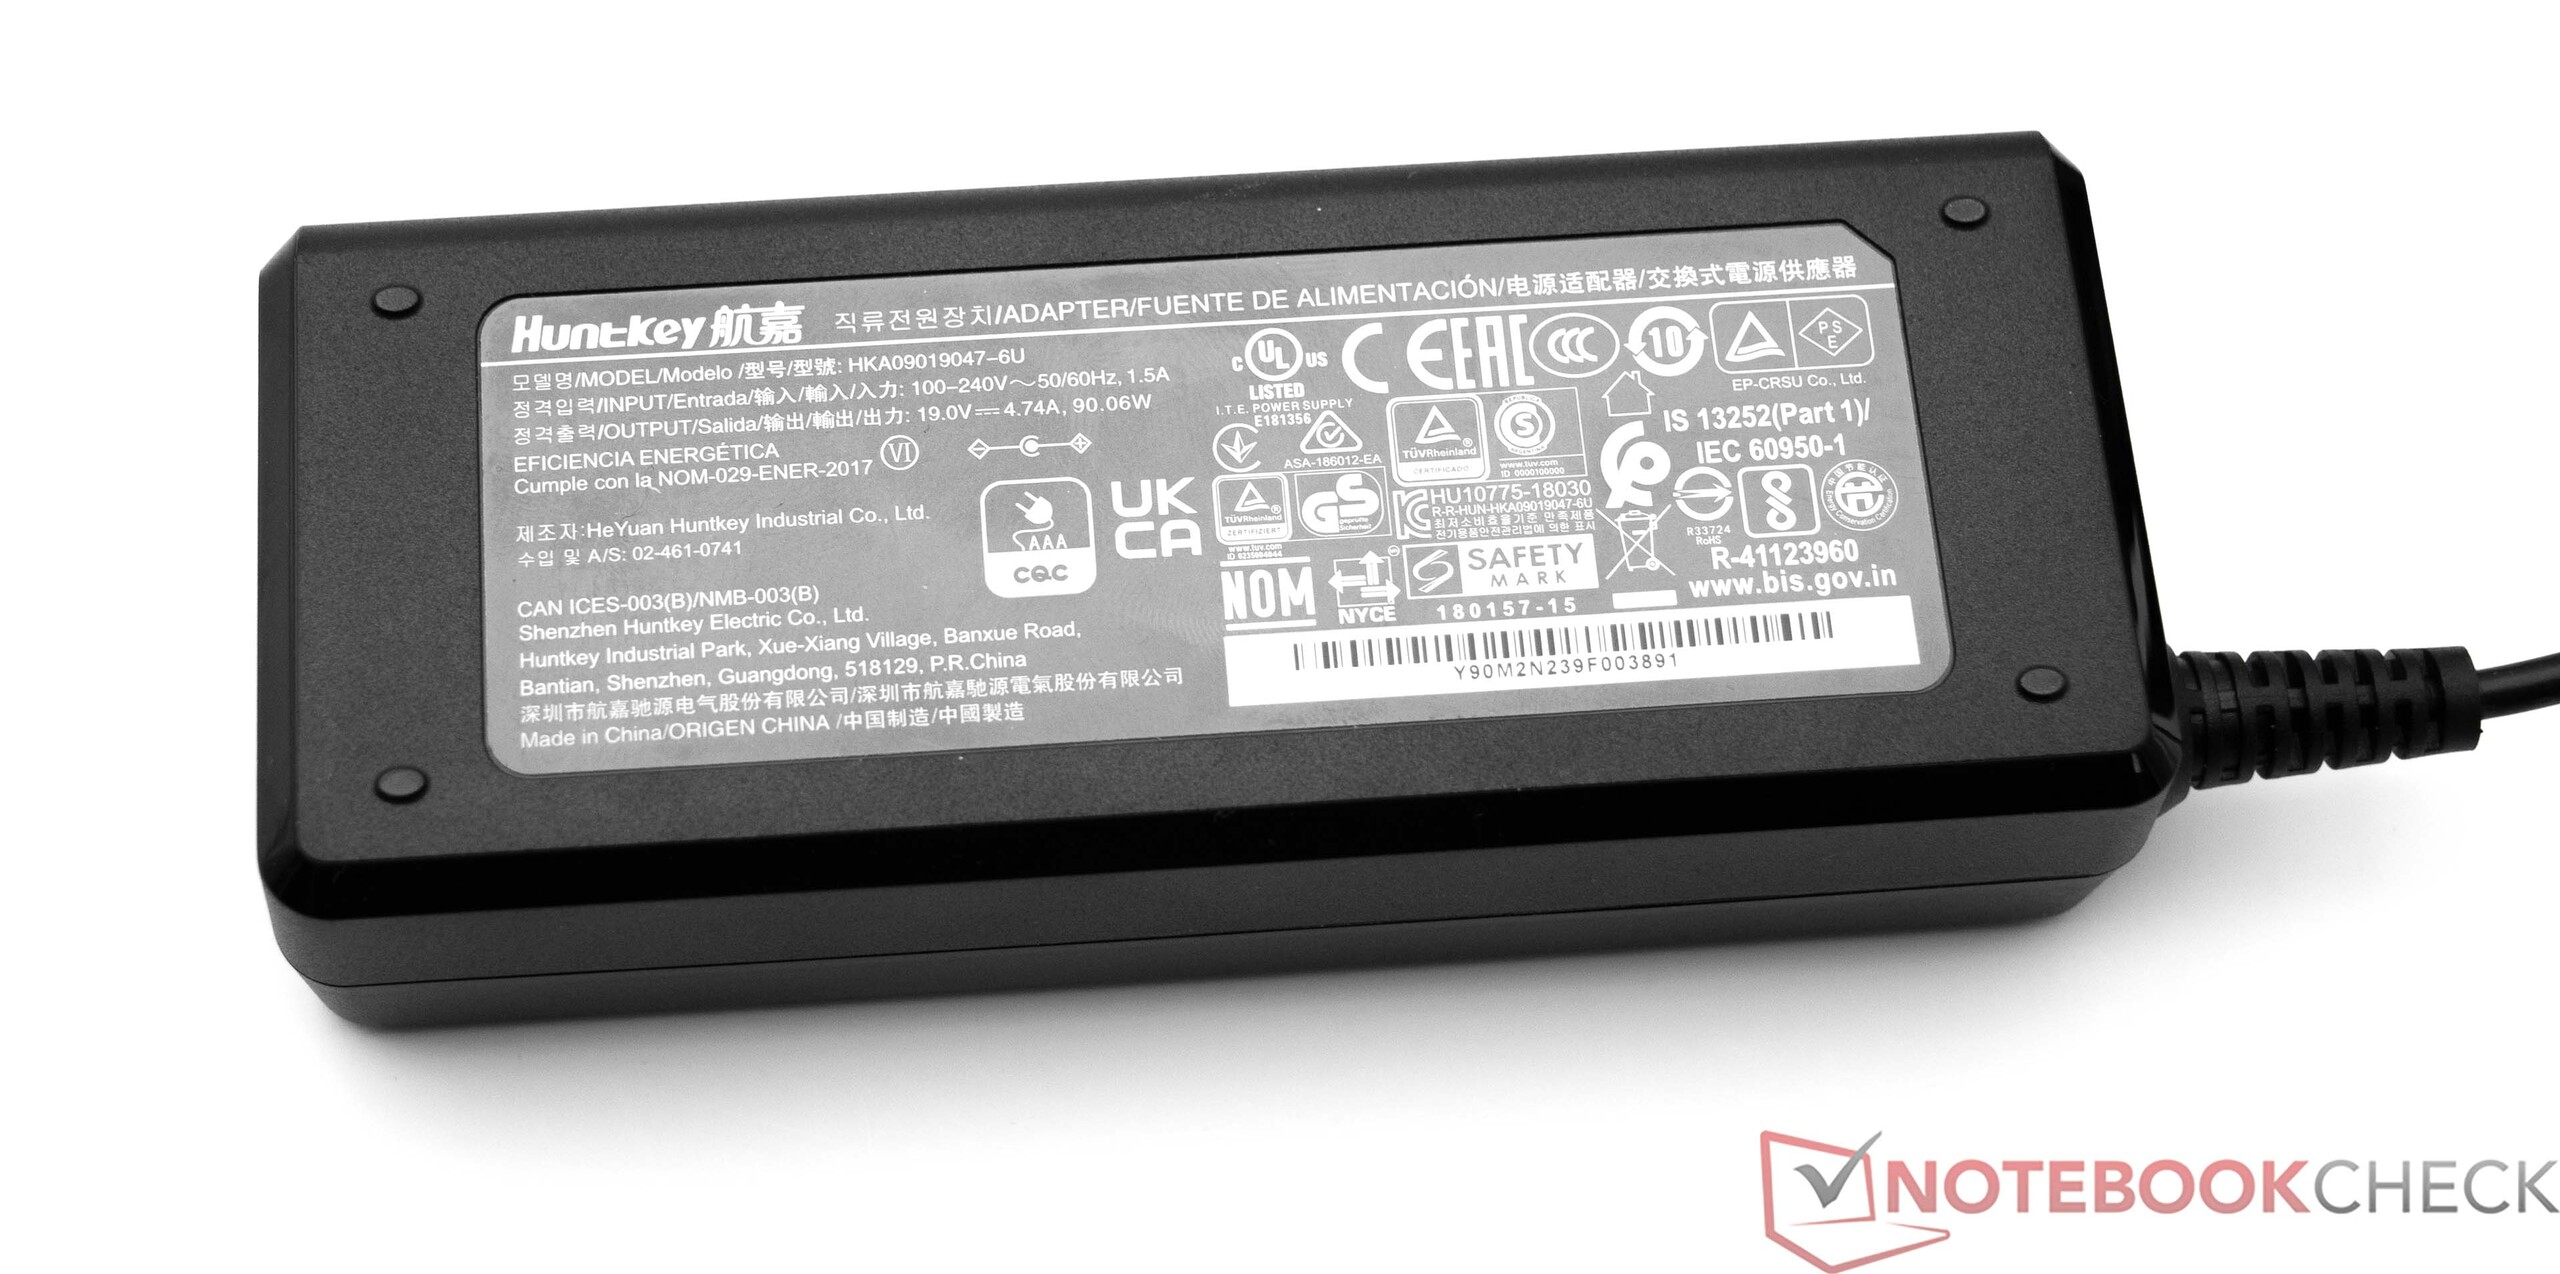
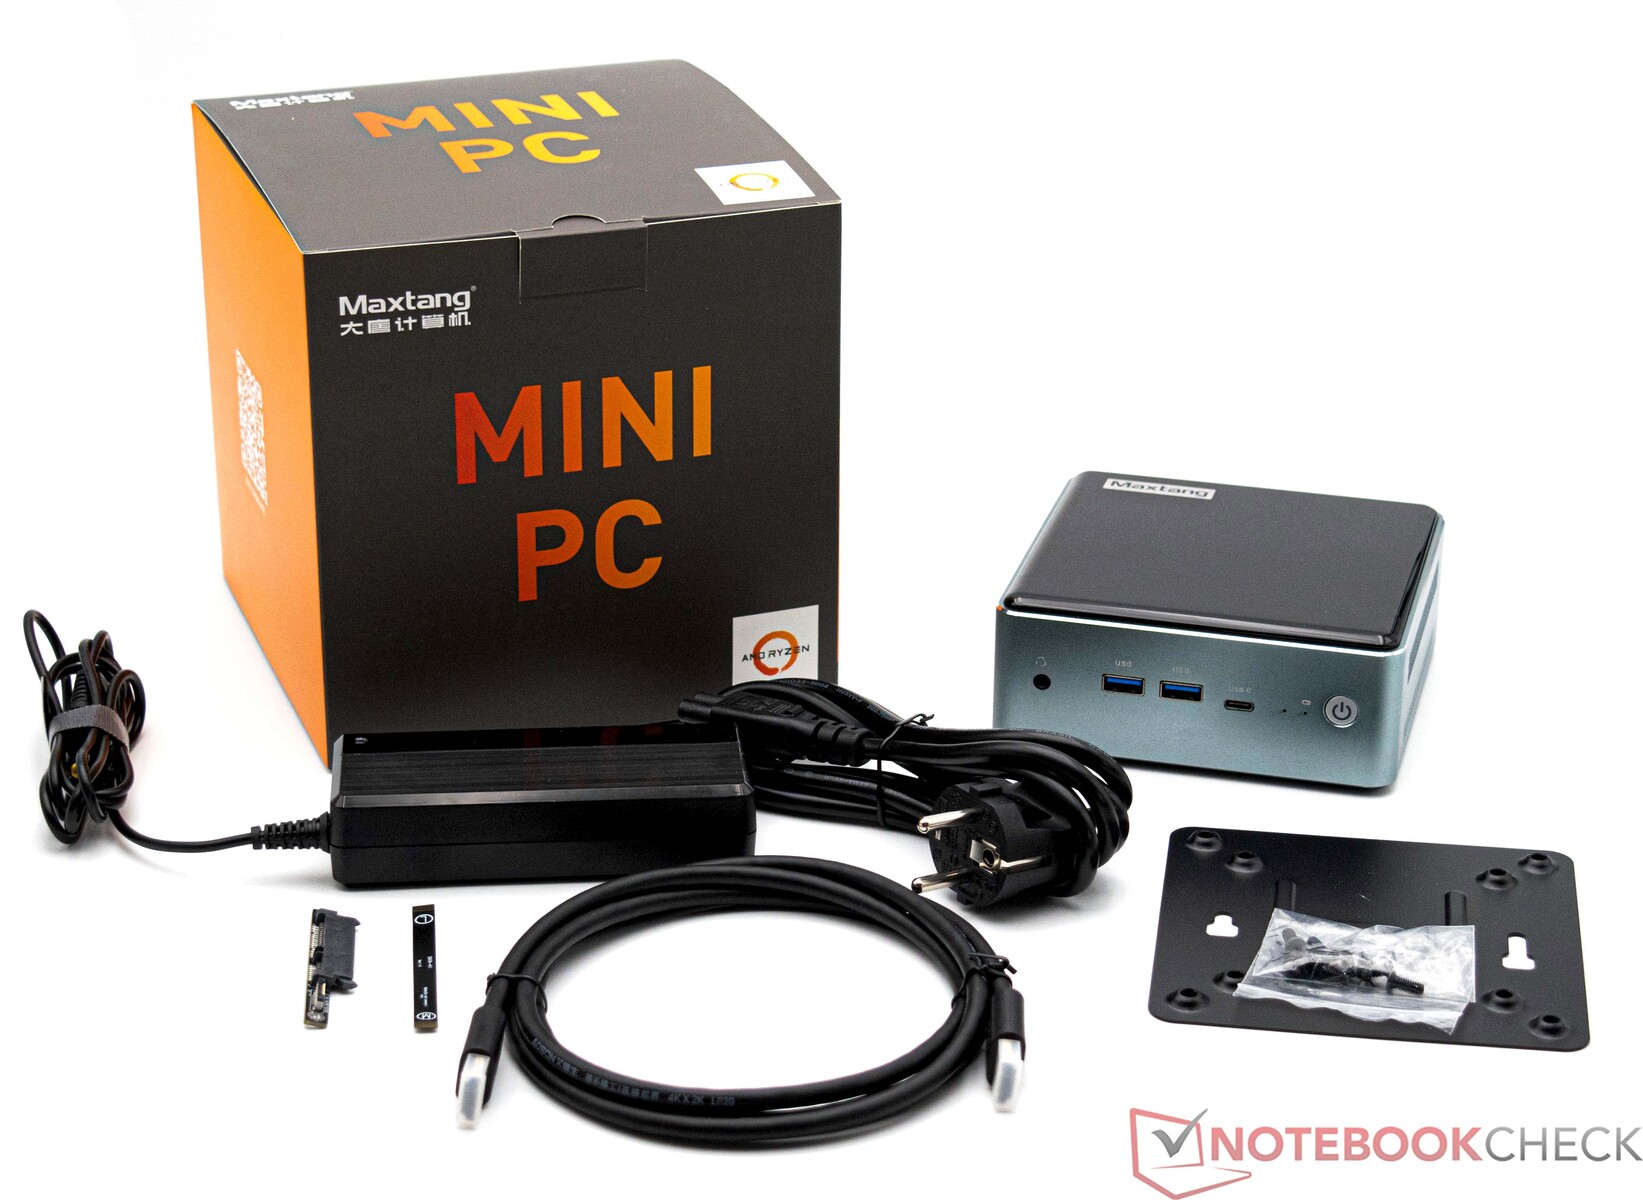
Le Maxtang MTN-FP750 est livré avec tous les composants les plus importants pour la mise en service de l'appareil. Outre l'appareil lui-même, la boîte contient un bloc d'alimentation de 90 watts (19 V ; 4,74 A) ainsi qu'une plaque de montage pour l'assemblage VESA. Un câble HDMI et un guide d'installation rapide font également partie de l'emballage.
Maintenance
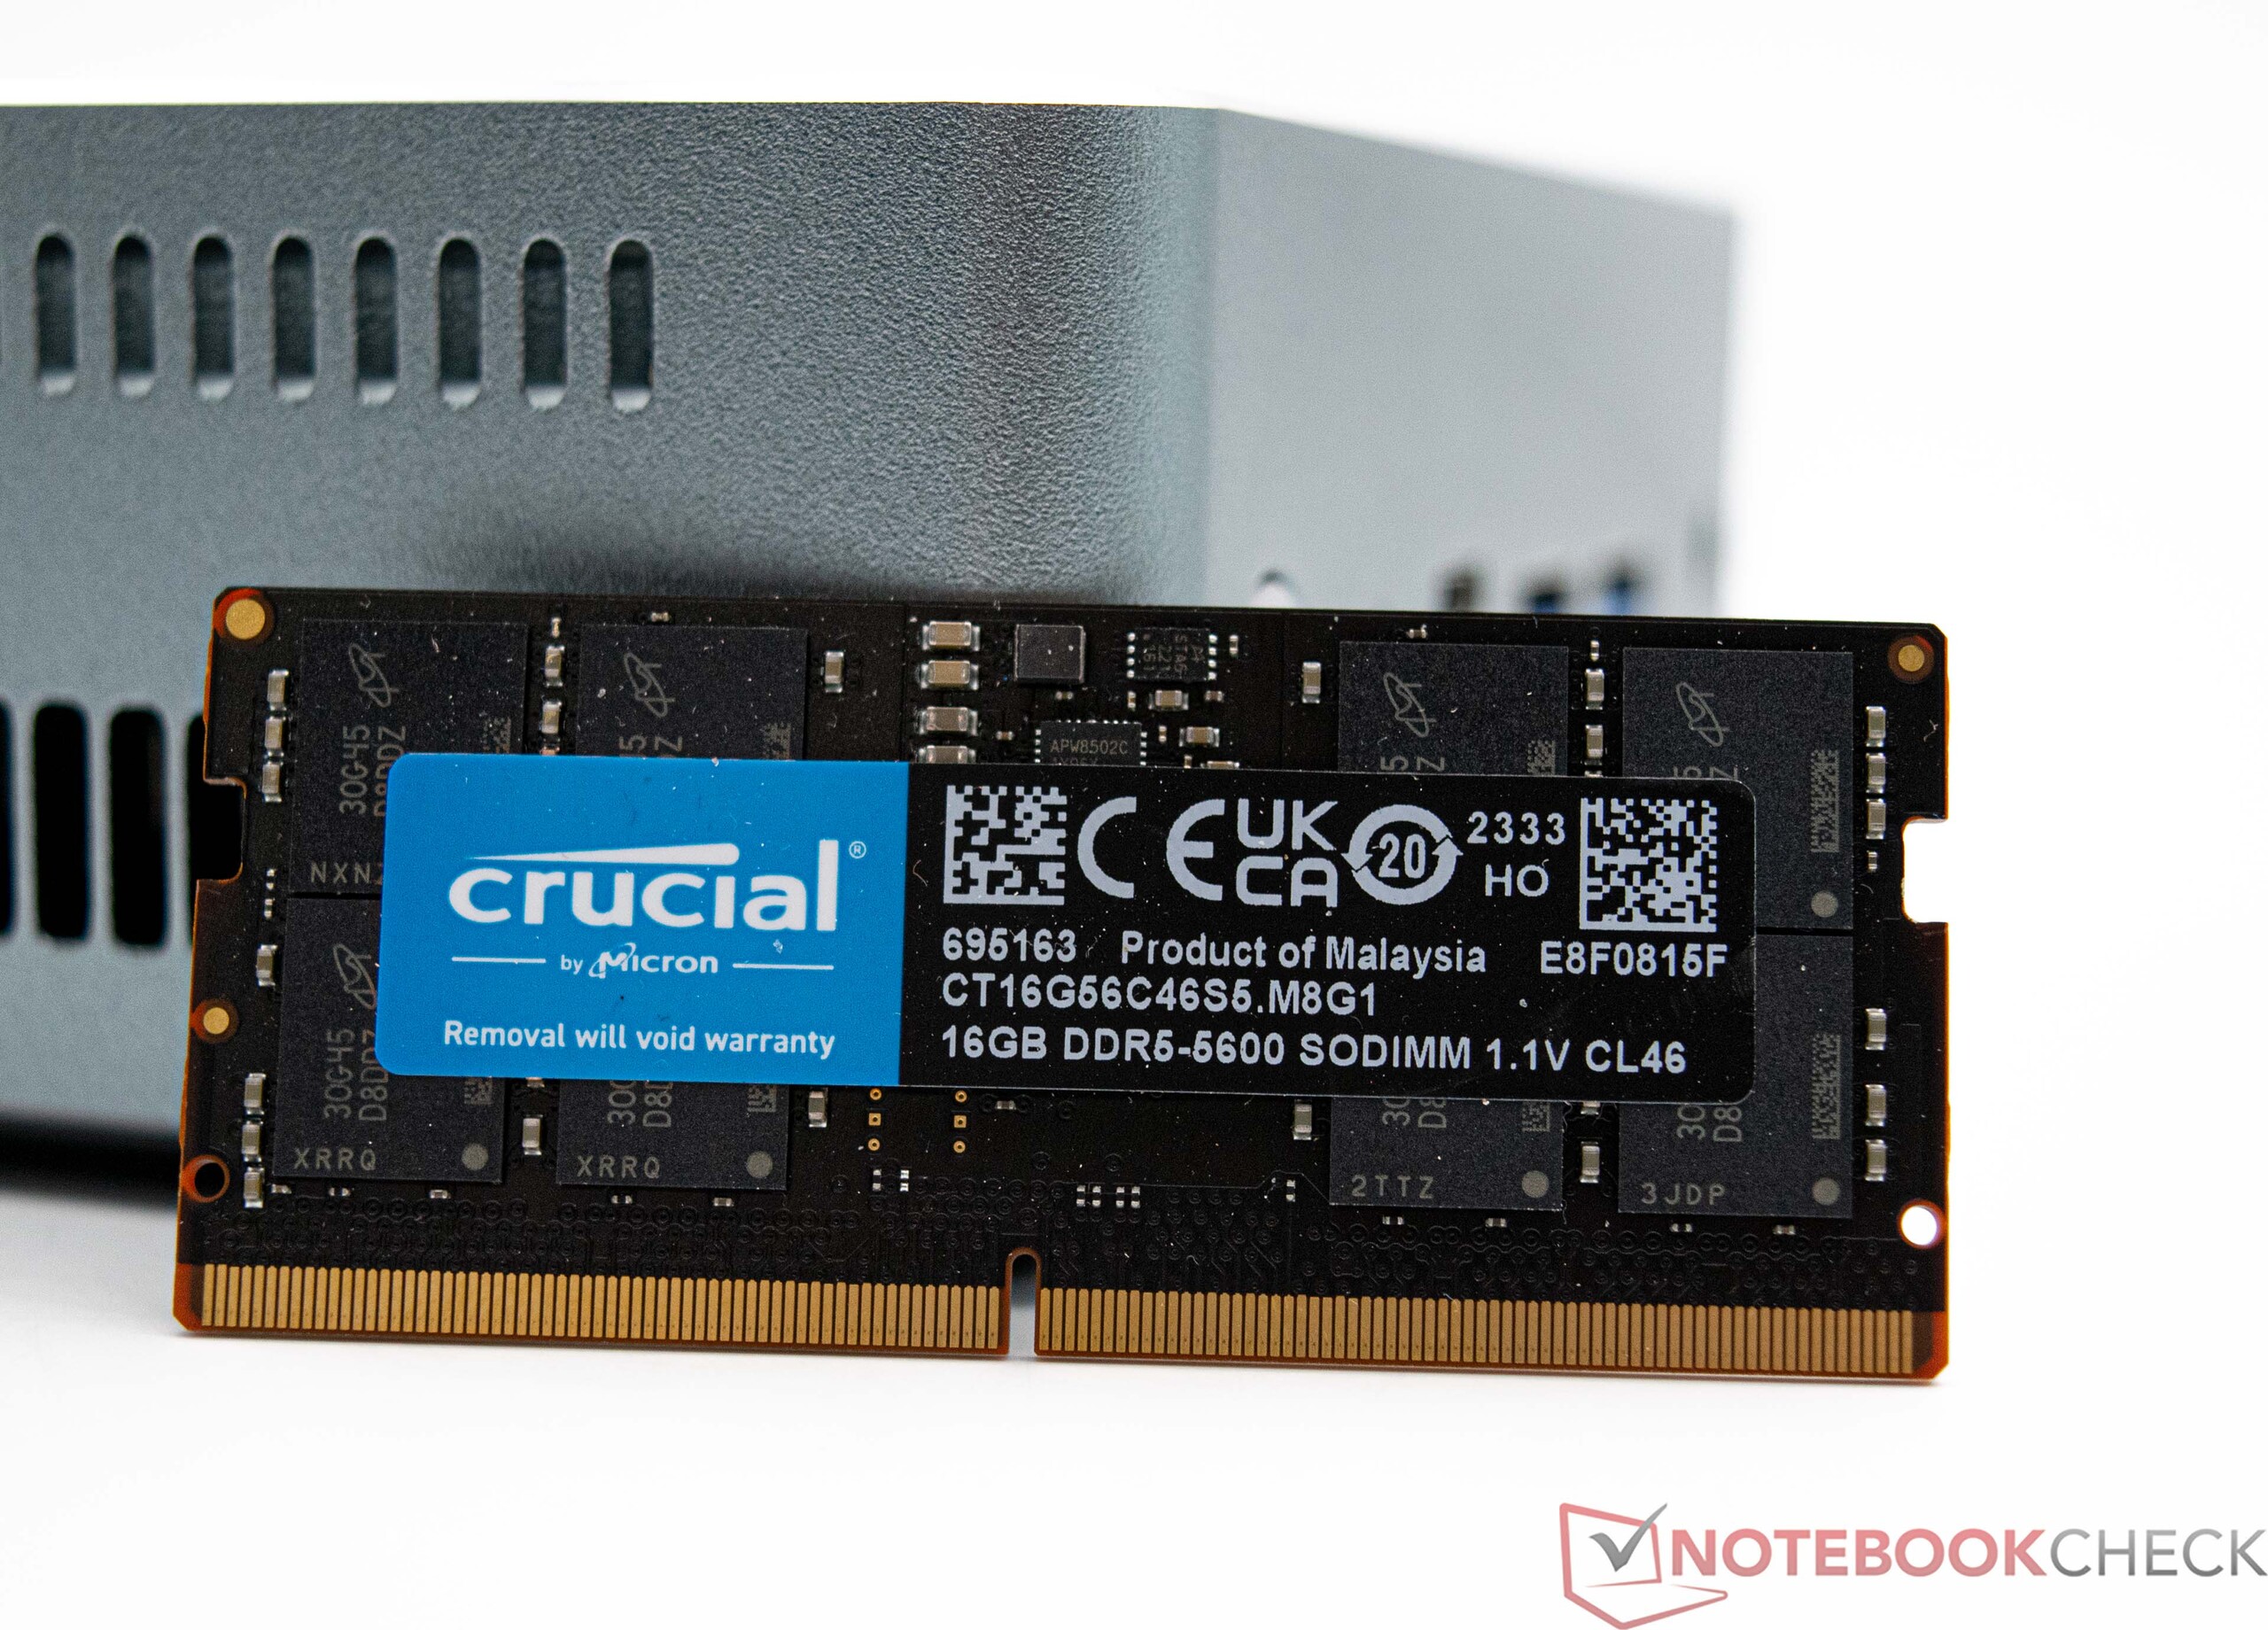
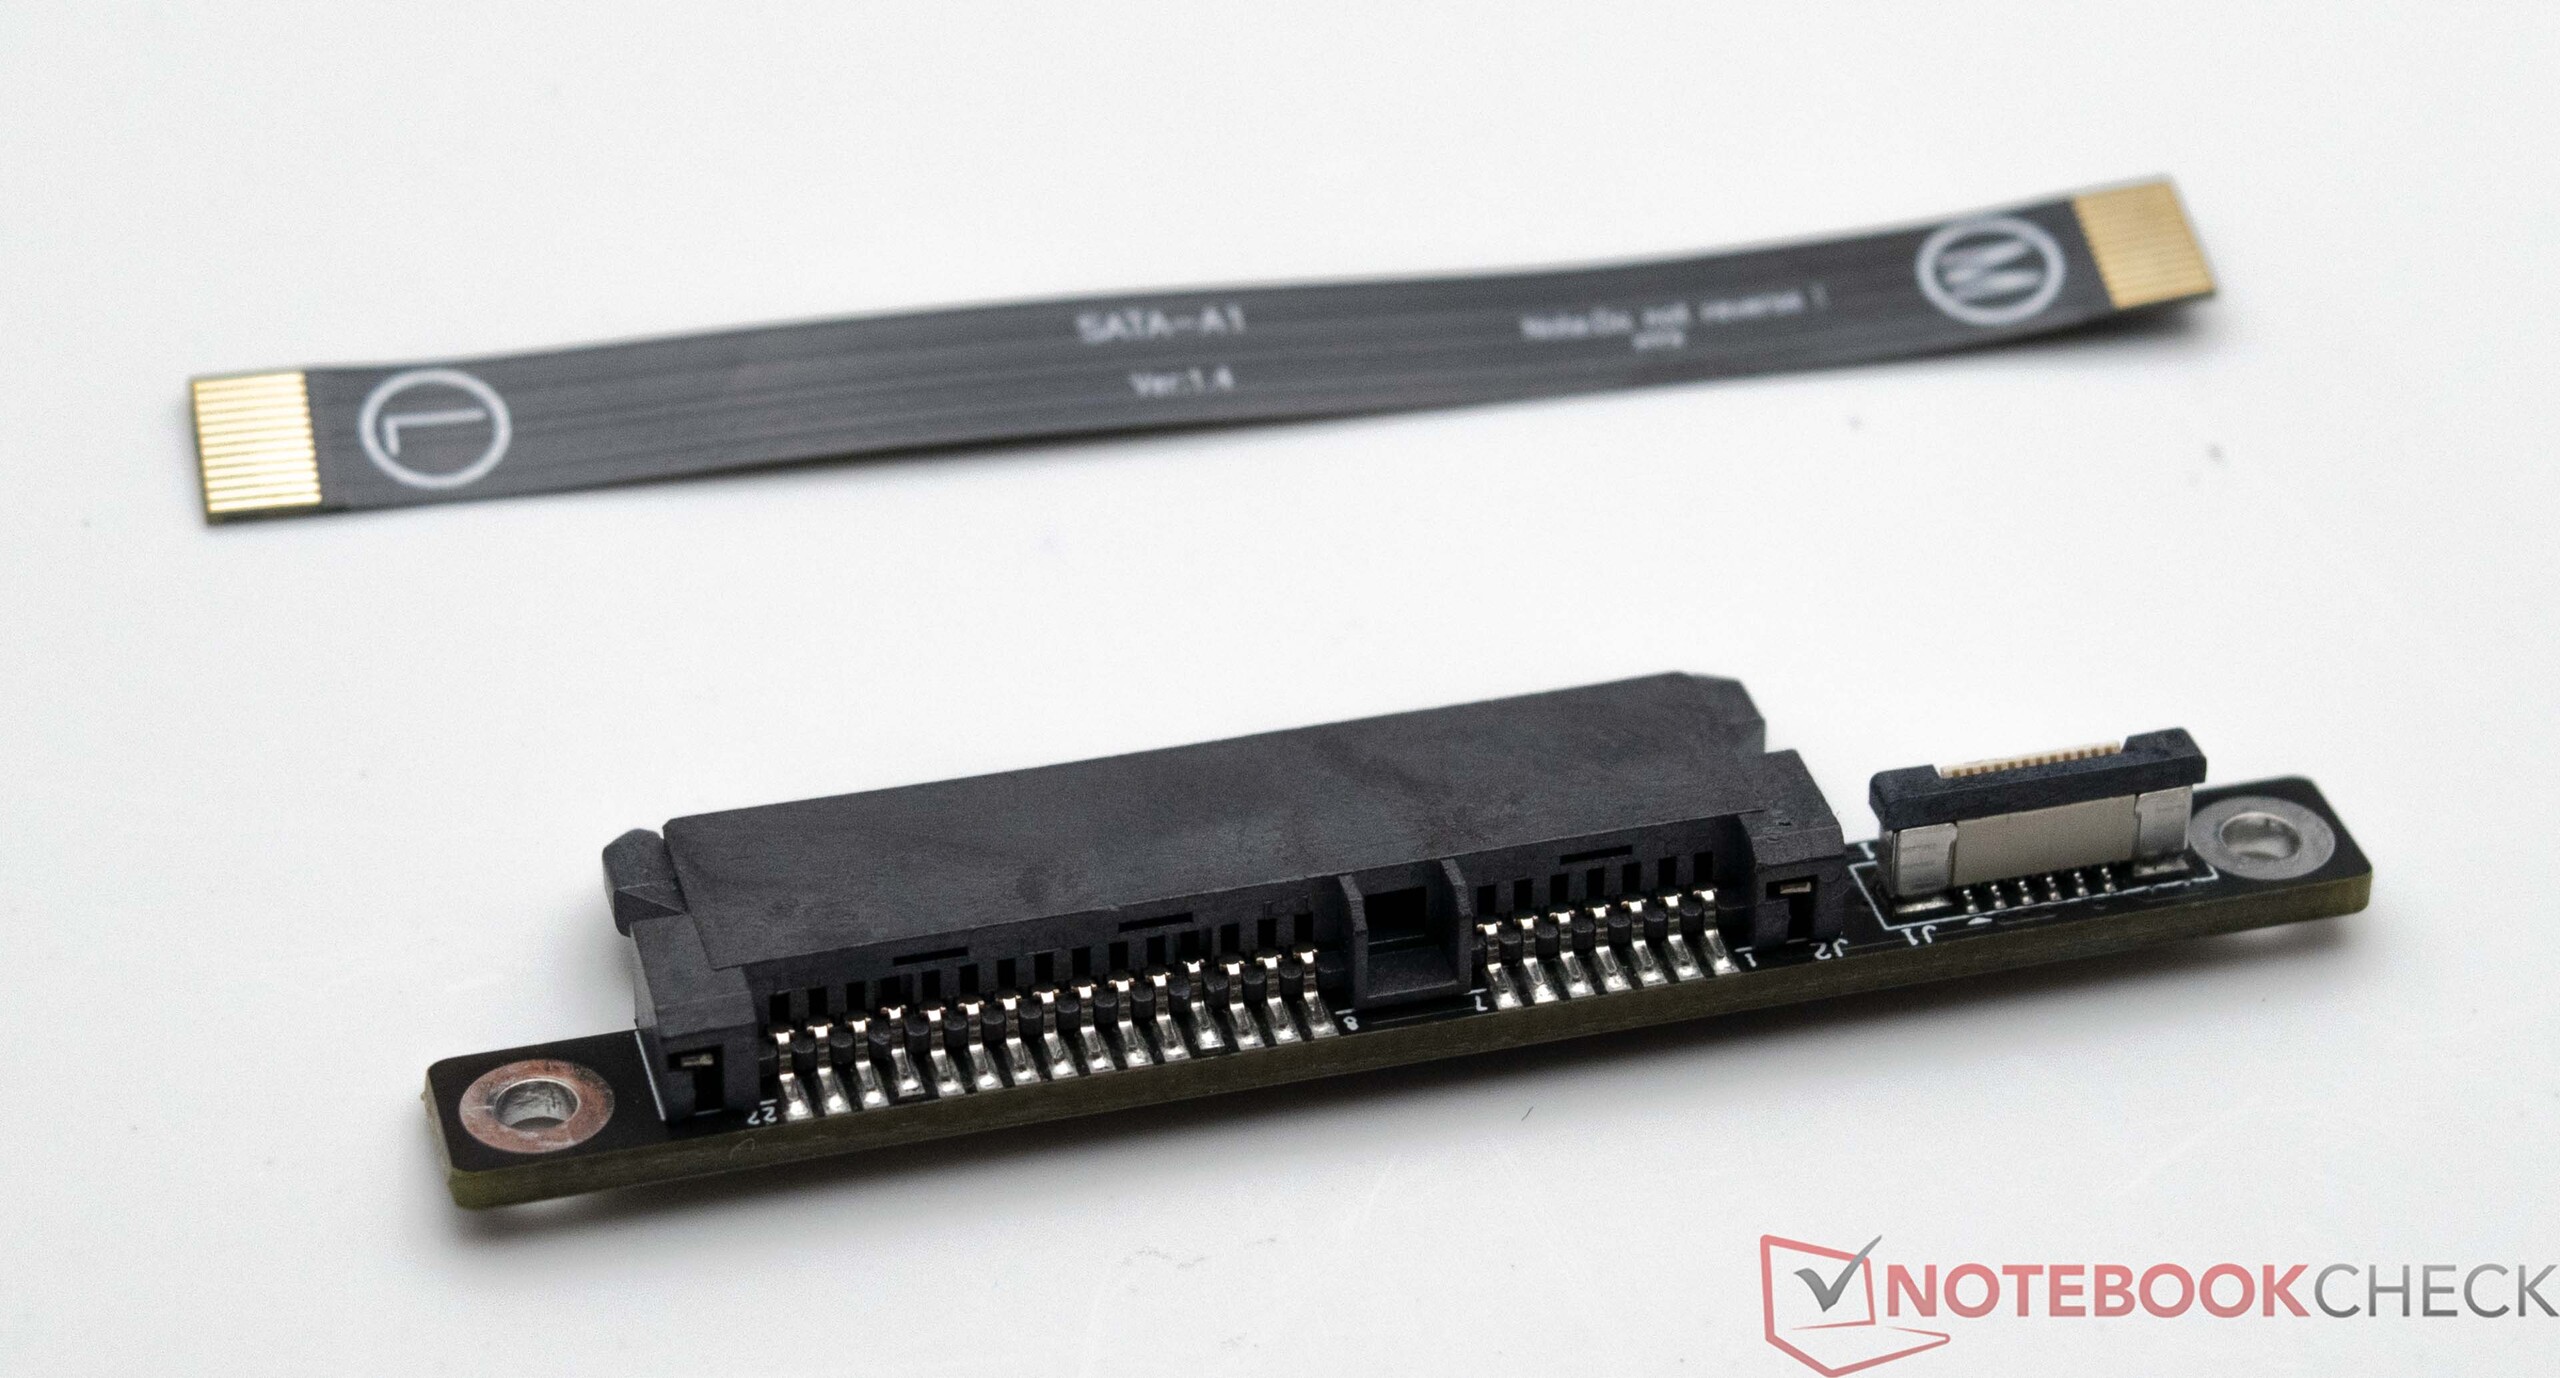
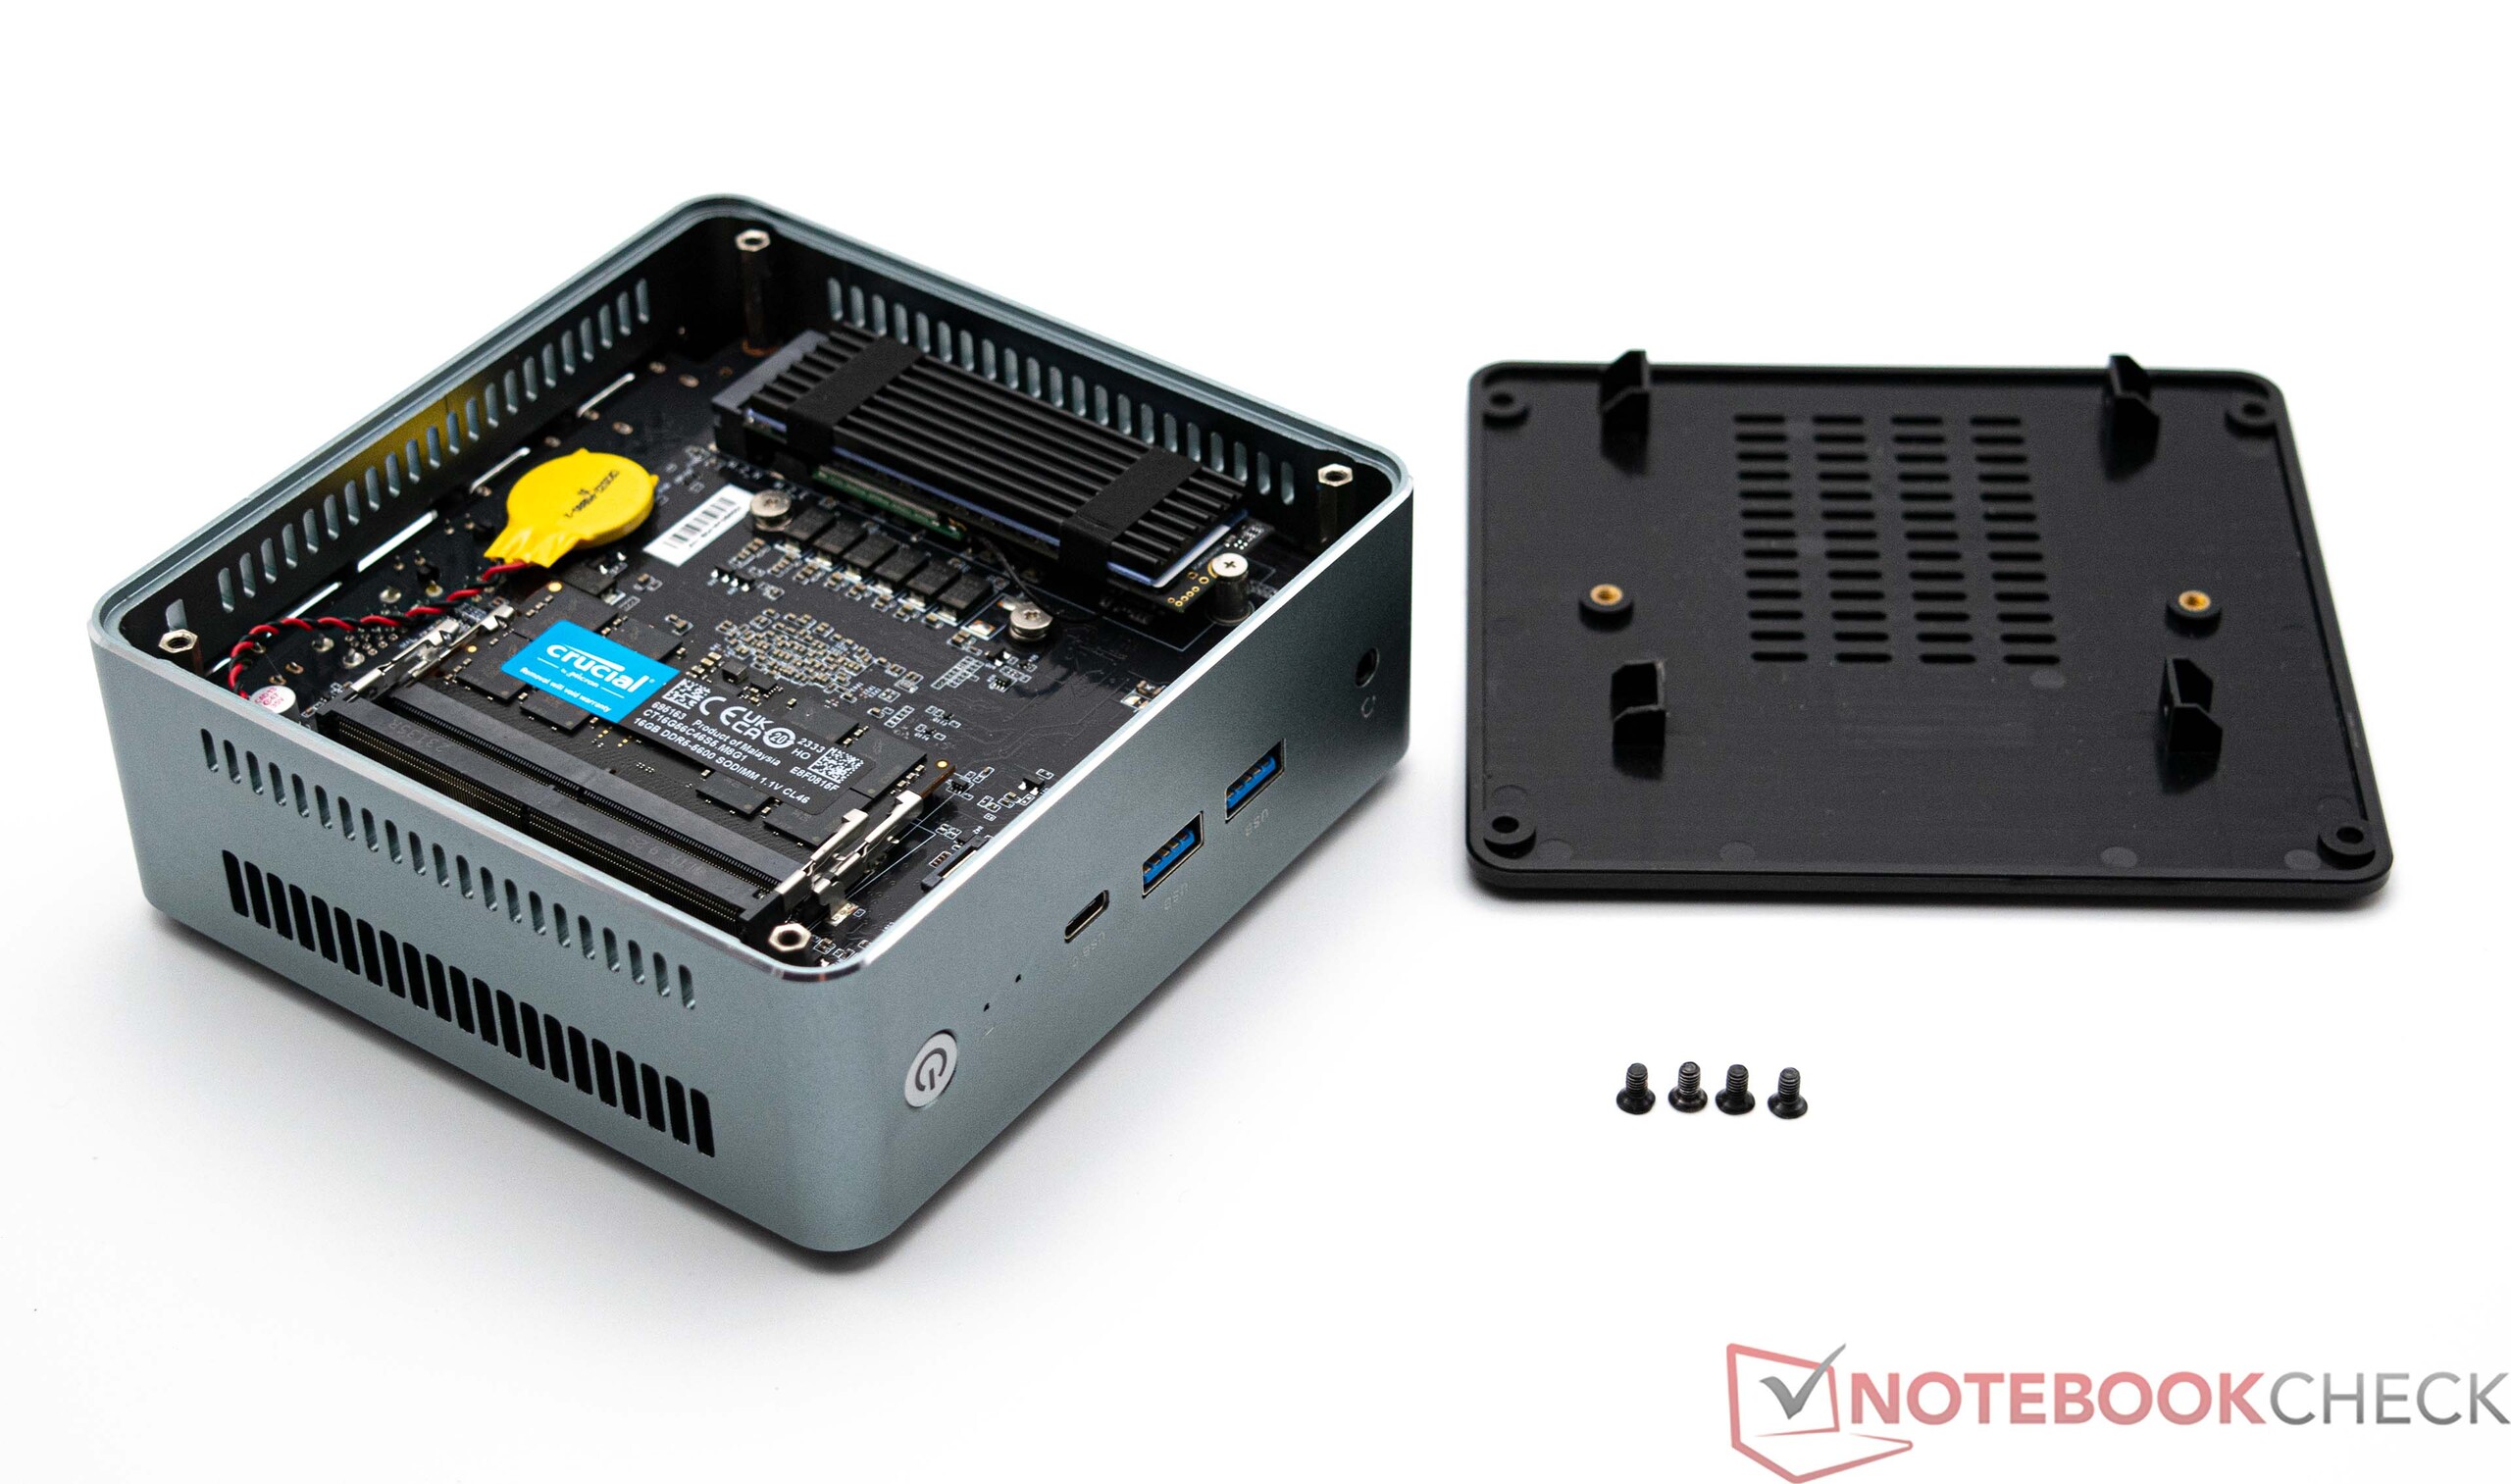
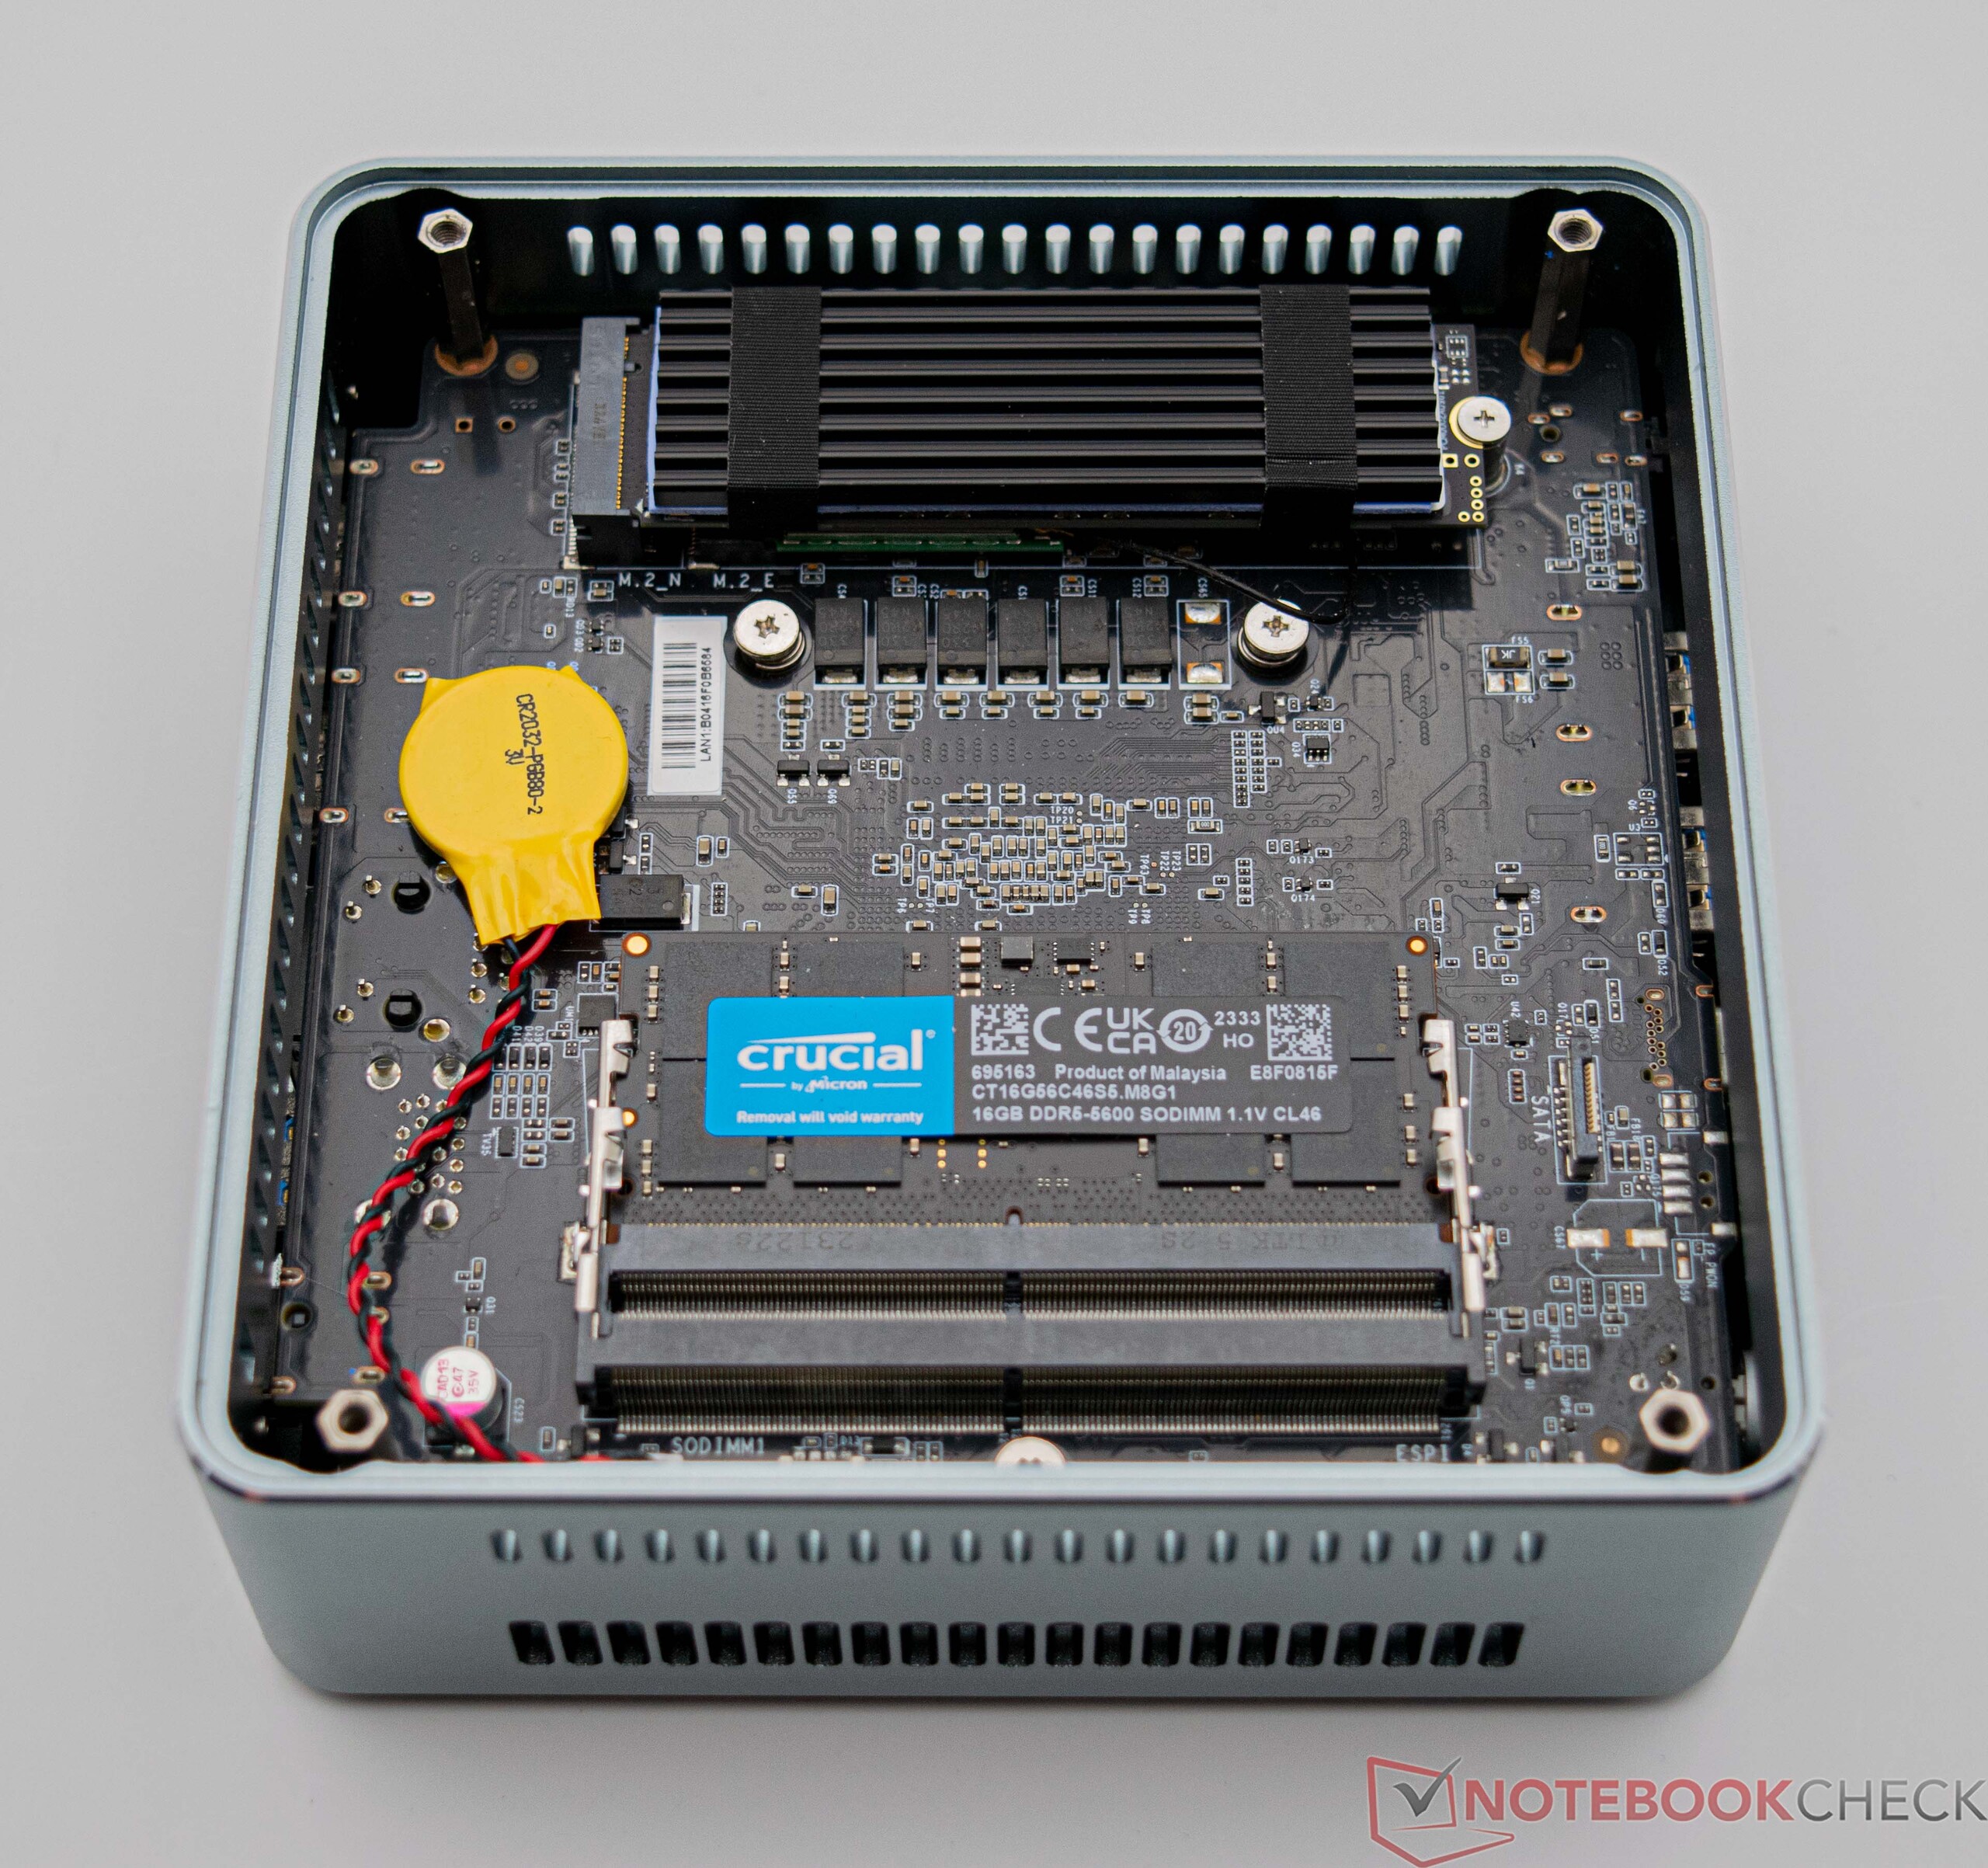
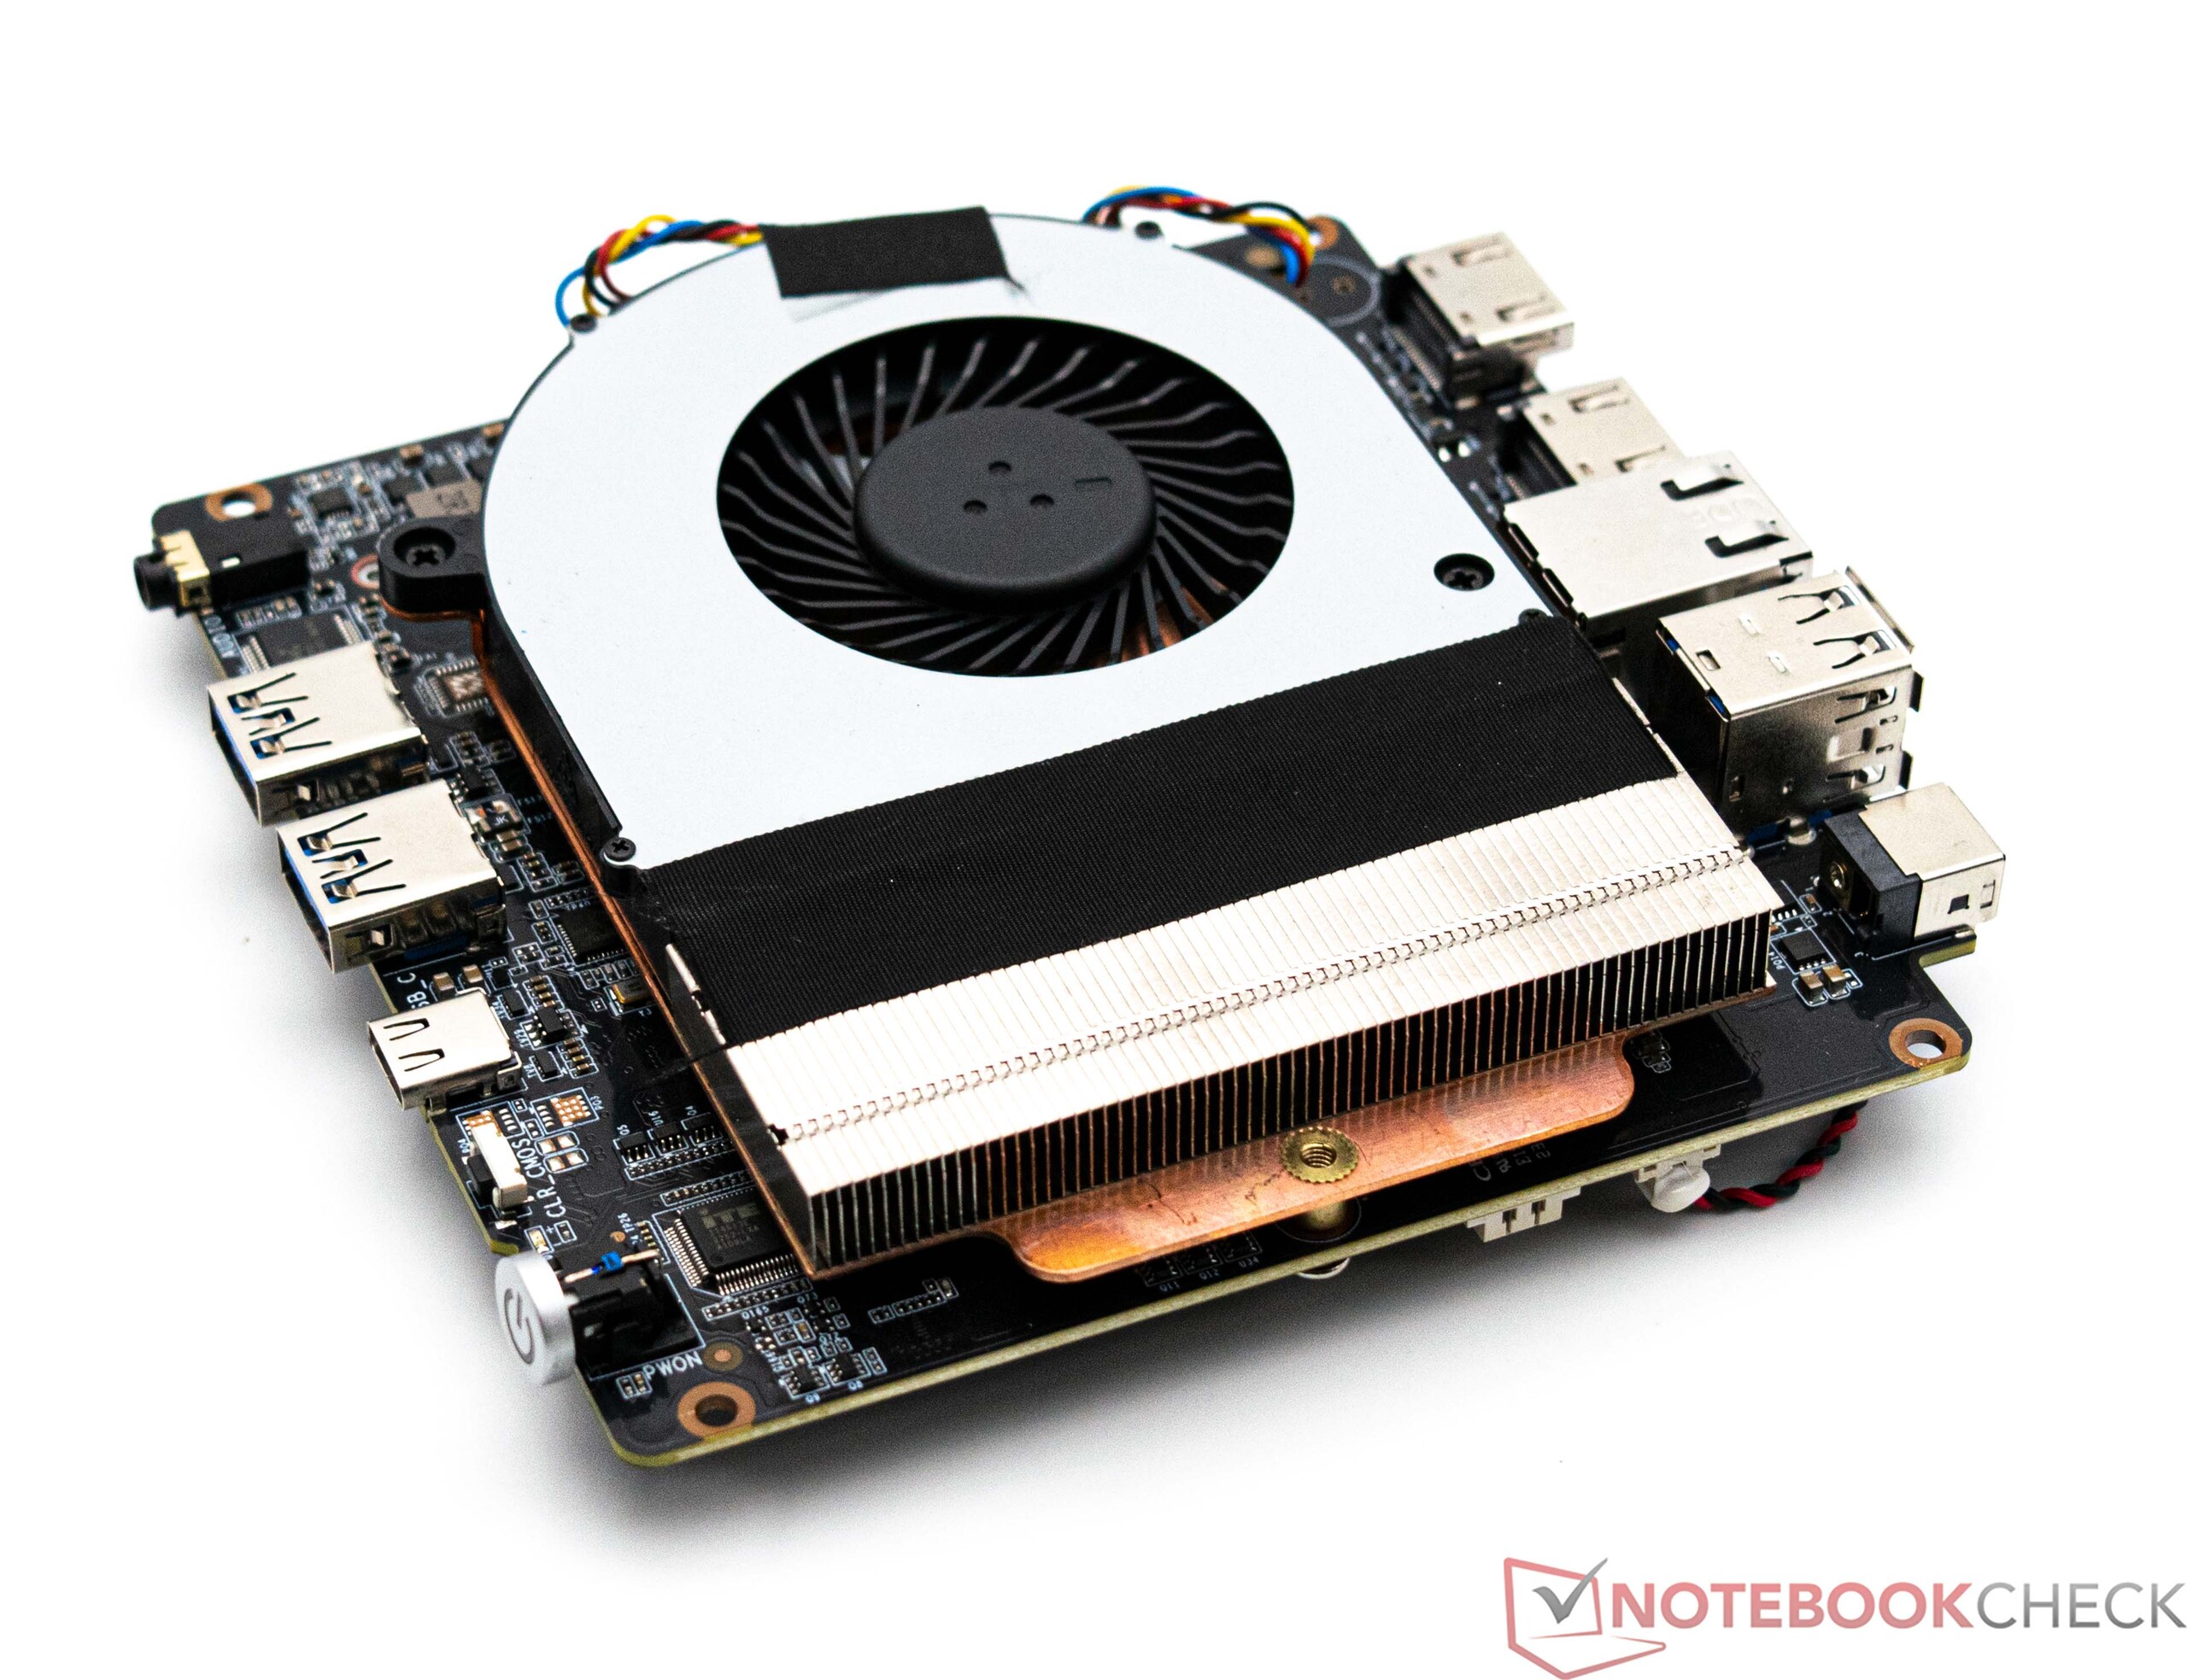
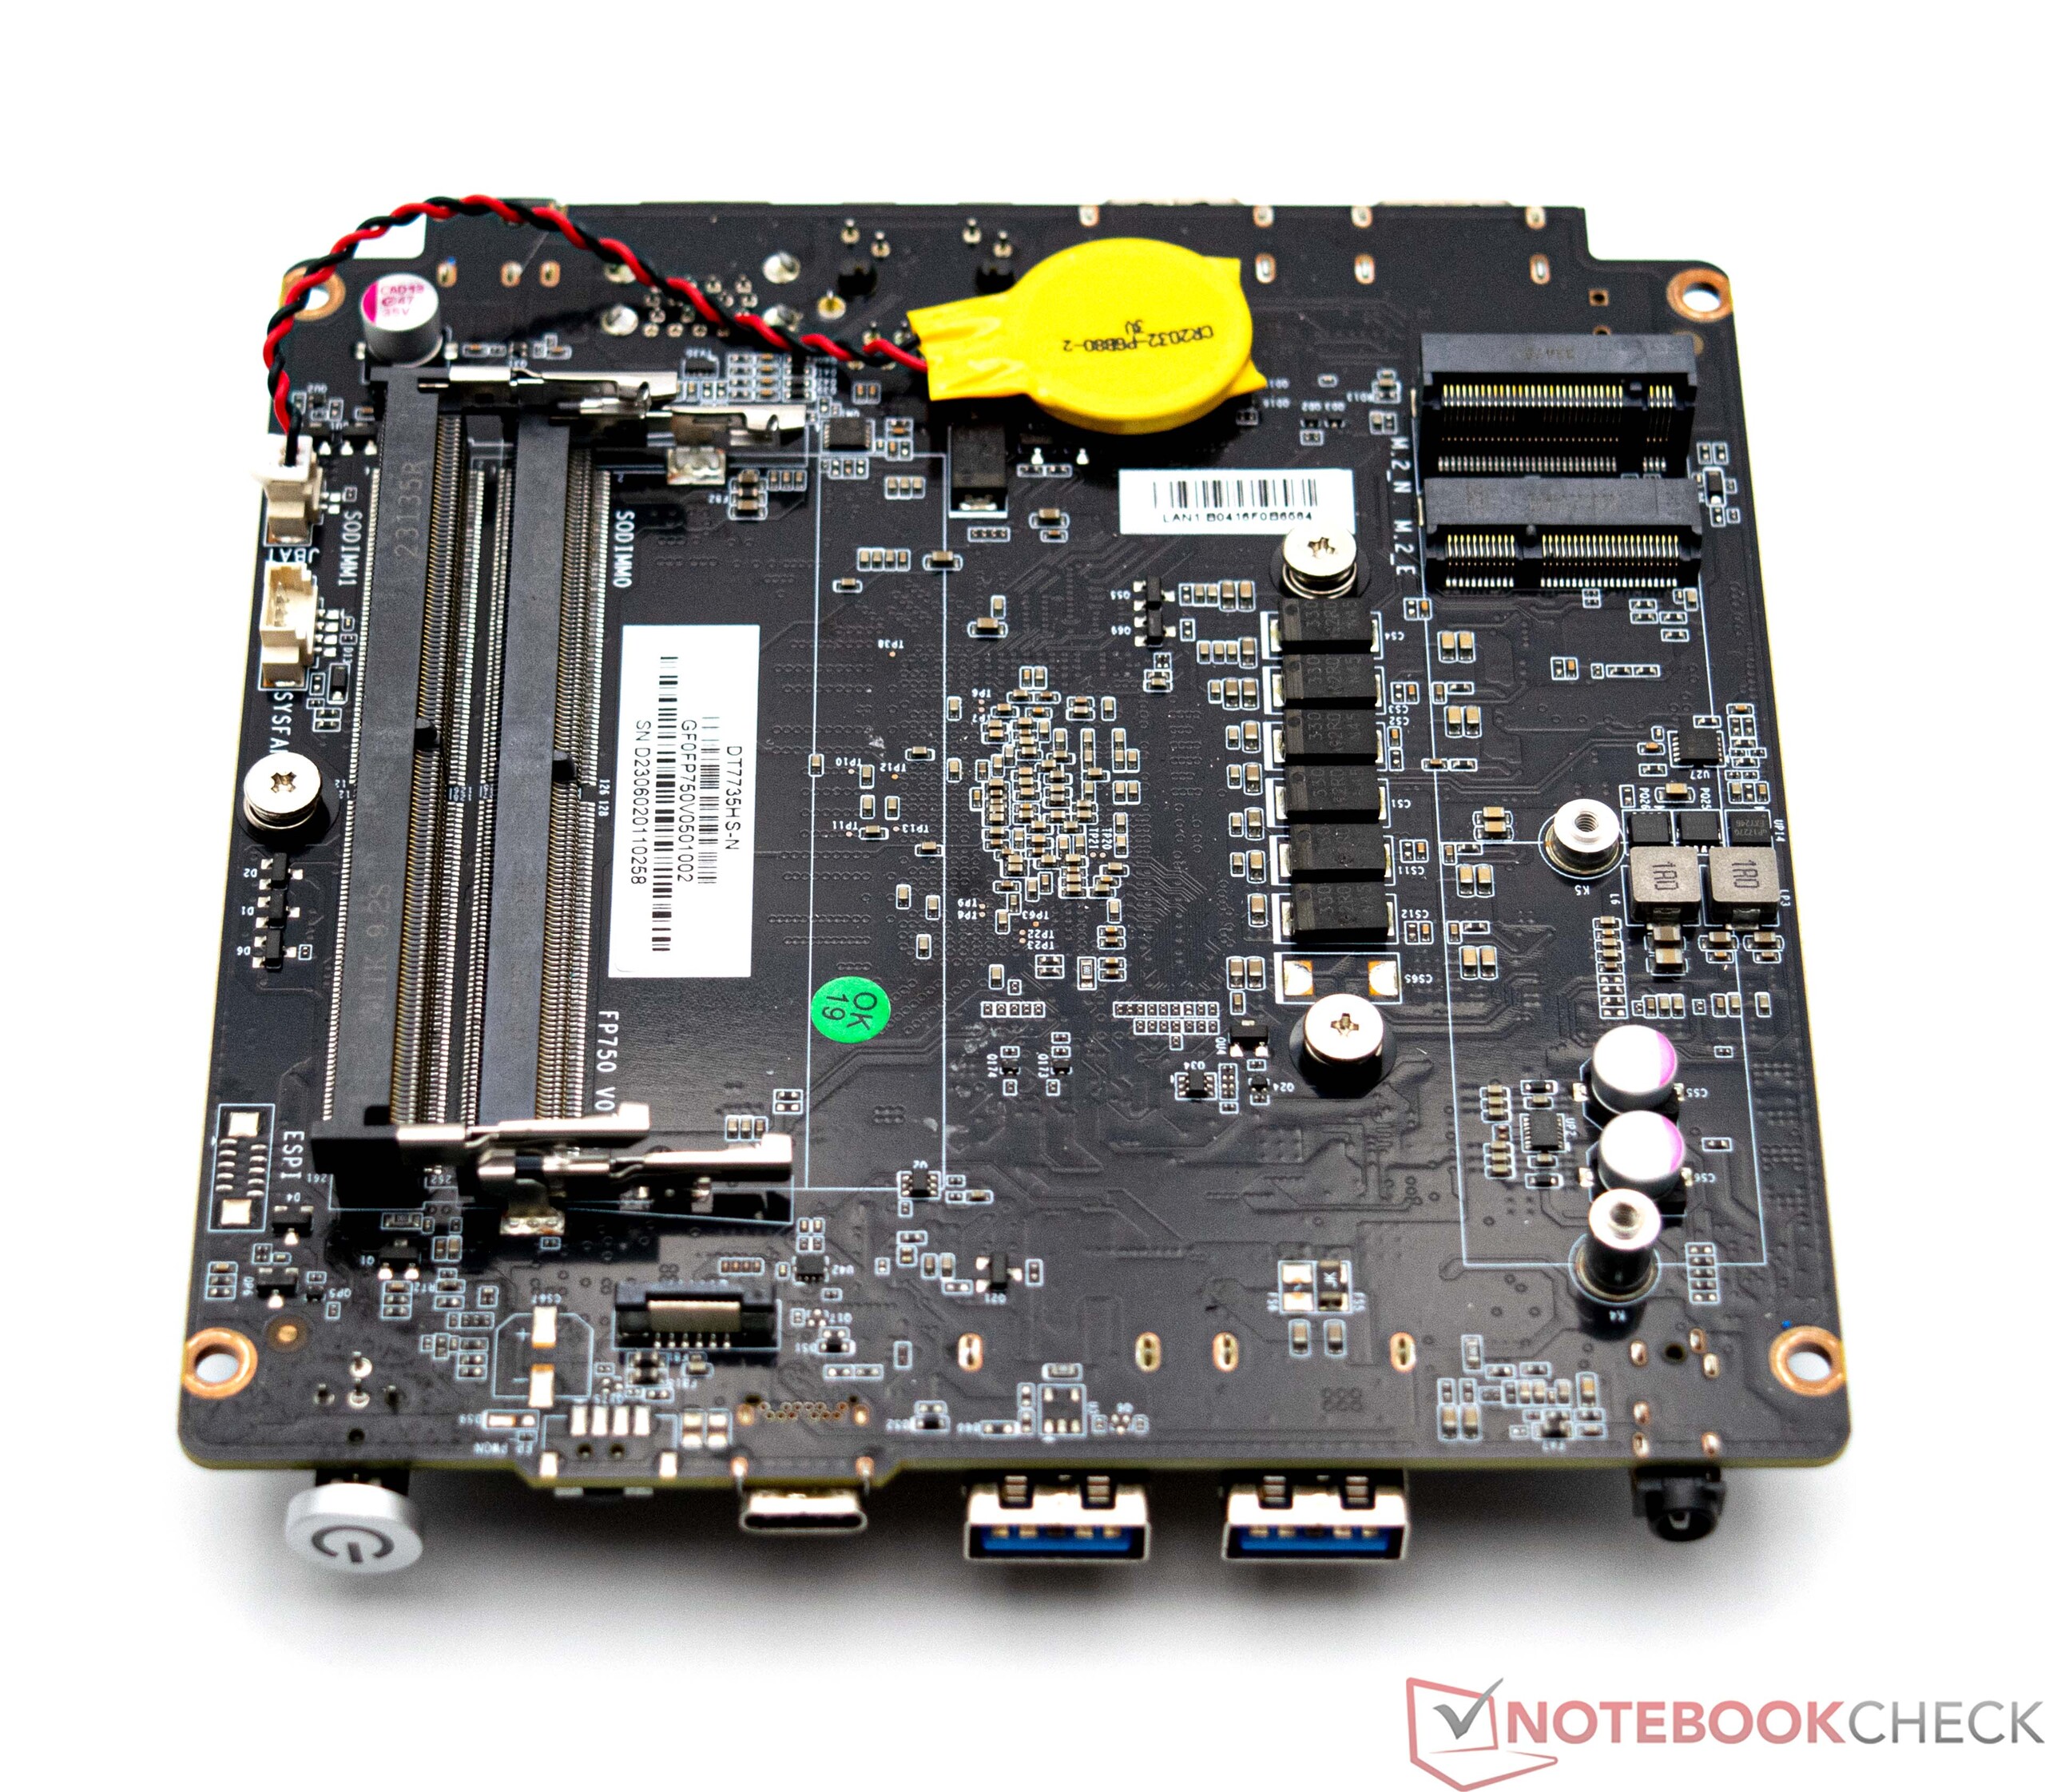
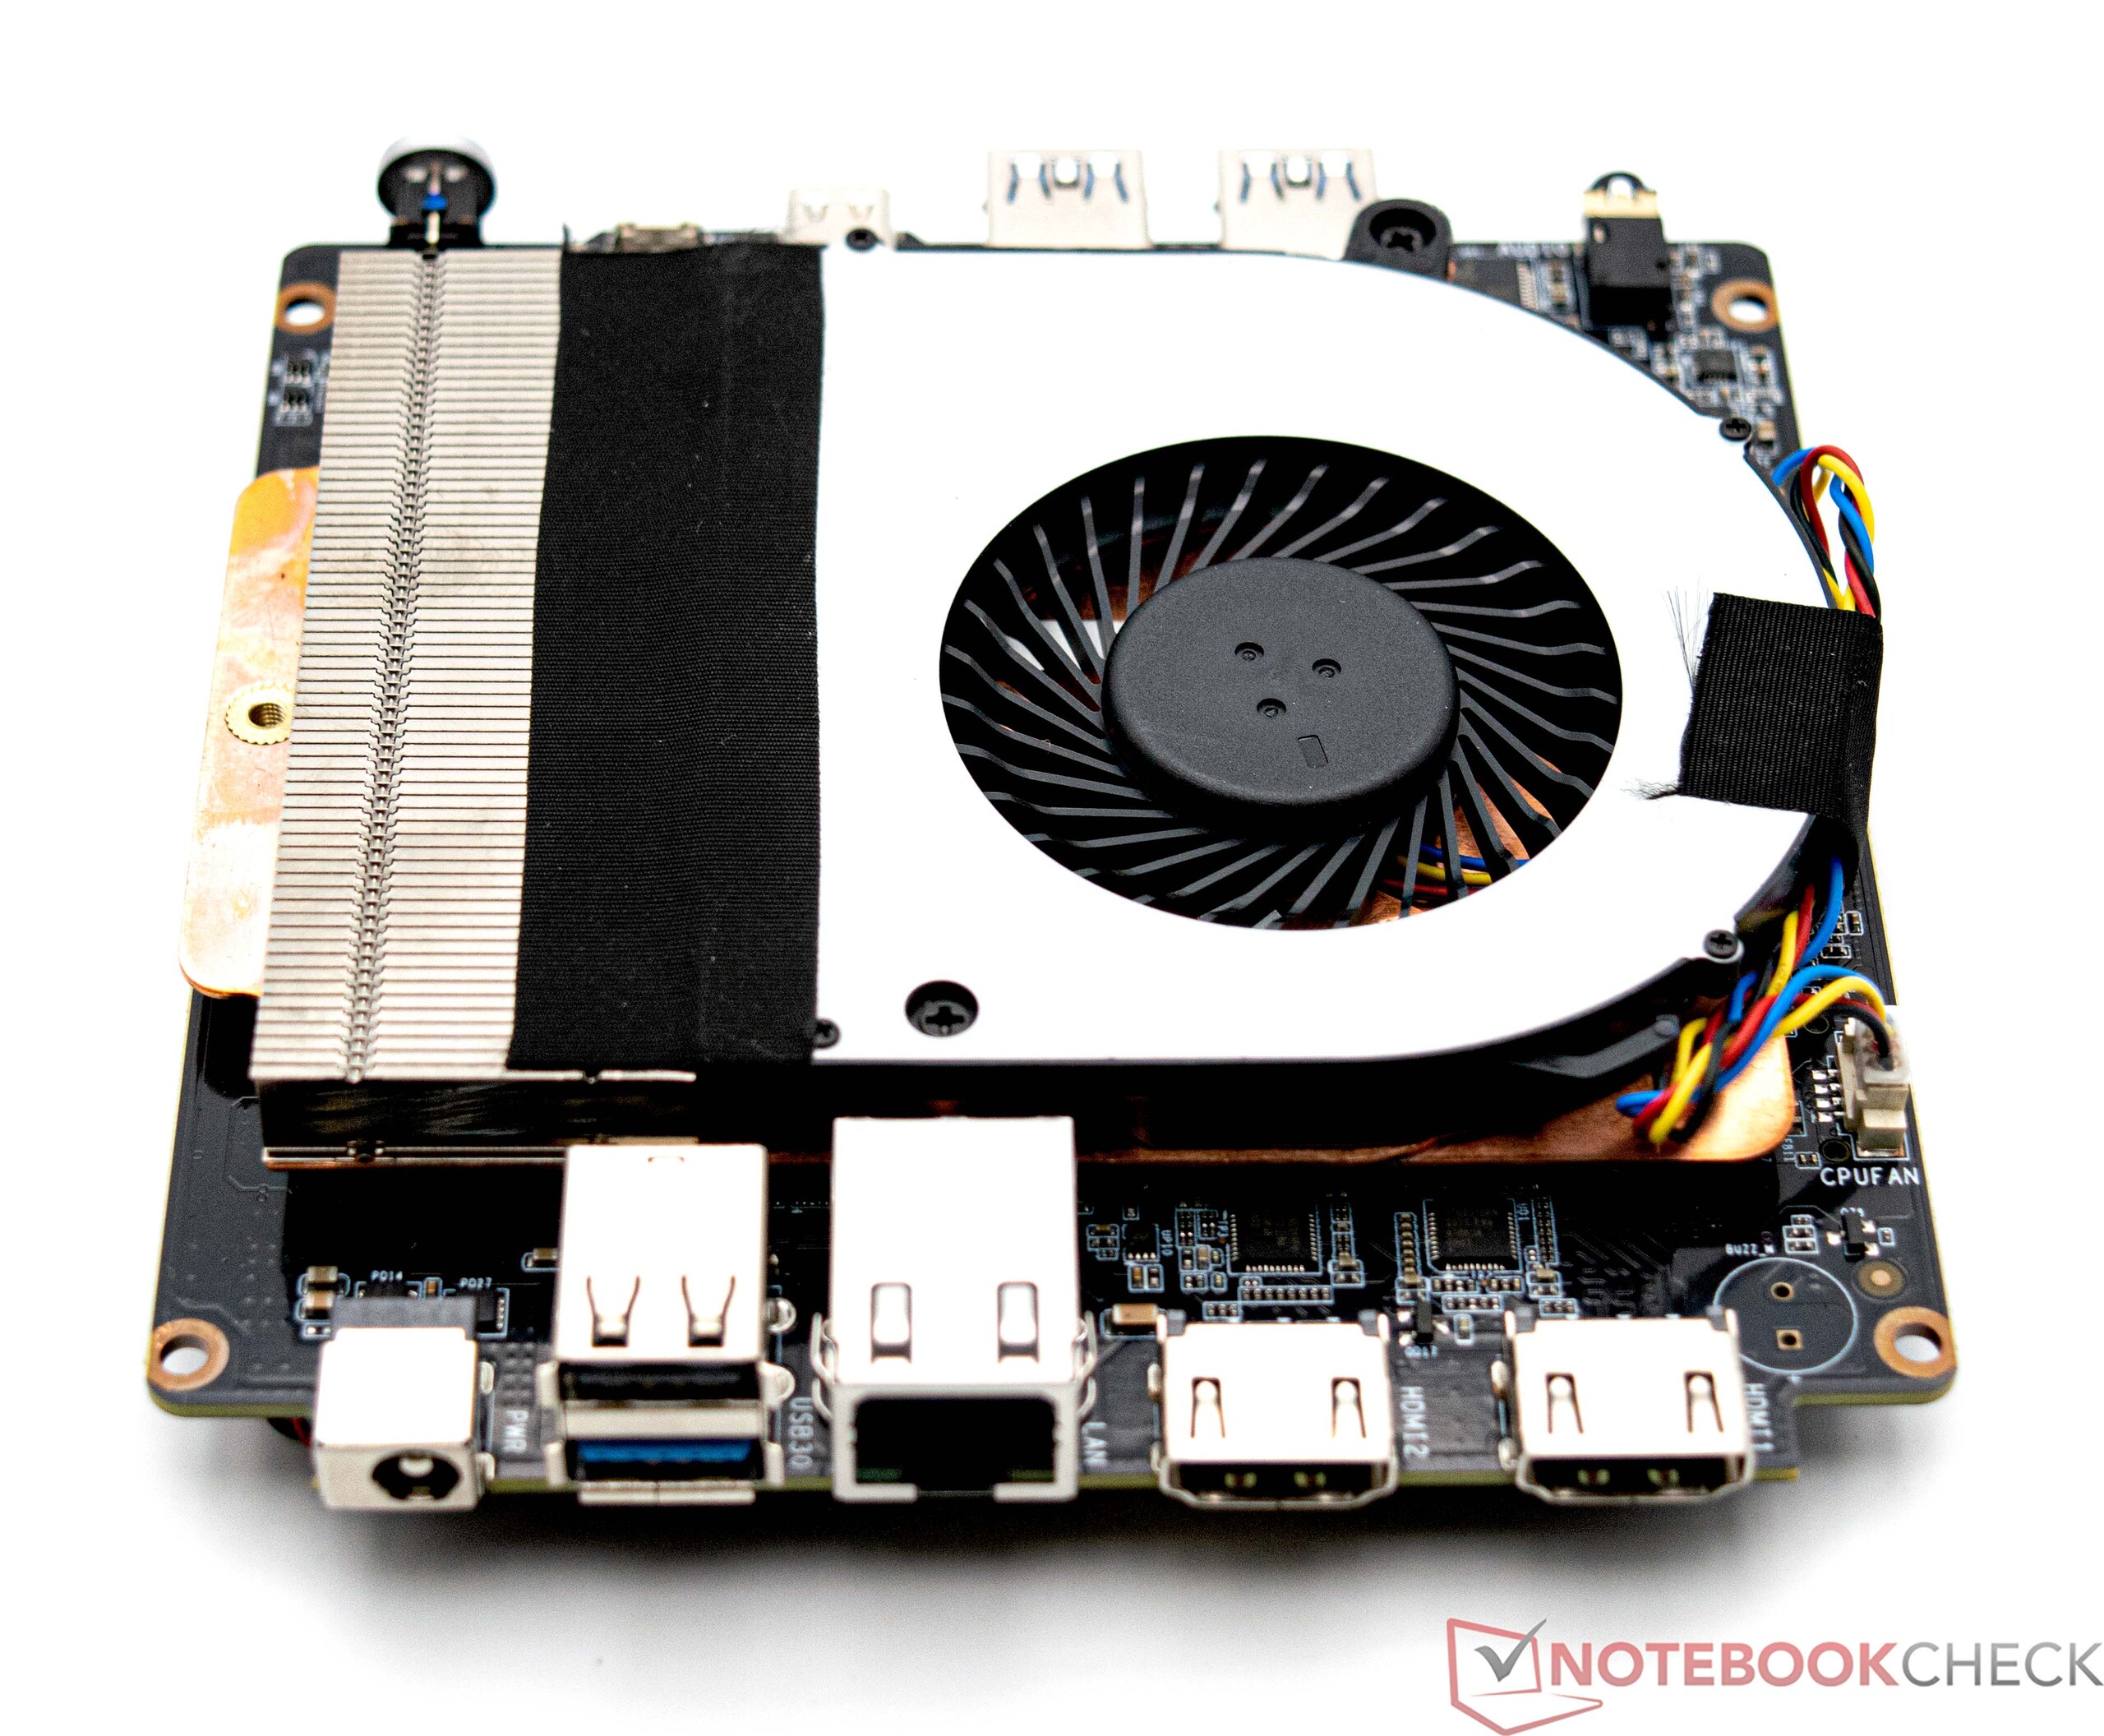
Le mini PC Maxtang s'ouvre relativement facilement. La base est fixée par quatre vis qui sont dissimulées par des pieds en caoutchouc collés. Sous la plaque de base, l'accès à la RAM ou au SSD M.2 est assez simple. Dans notre cas, il reste de la place pour installer un module de RAM supplémentaire et un second périphérique de stockage de masse (format 2,5 pouces). Pour accéder au ventilateur, il faut encore démonter l'appareil, ce qui rend impossible un nettoyage rapide.
Performance - Un AMD Ryzen 7 7735HS avec 8 cœurs et 16 threads
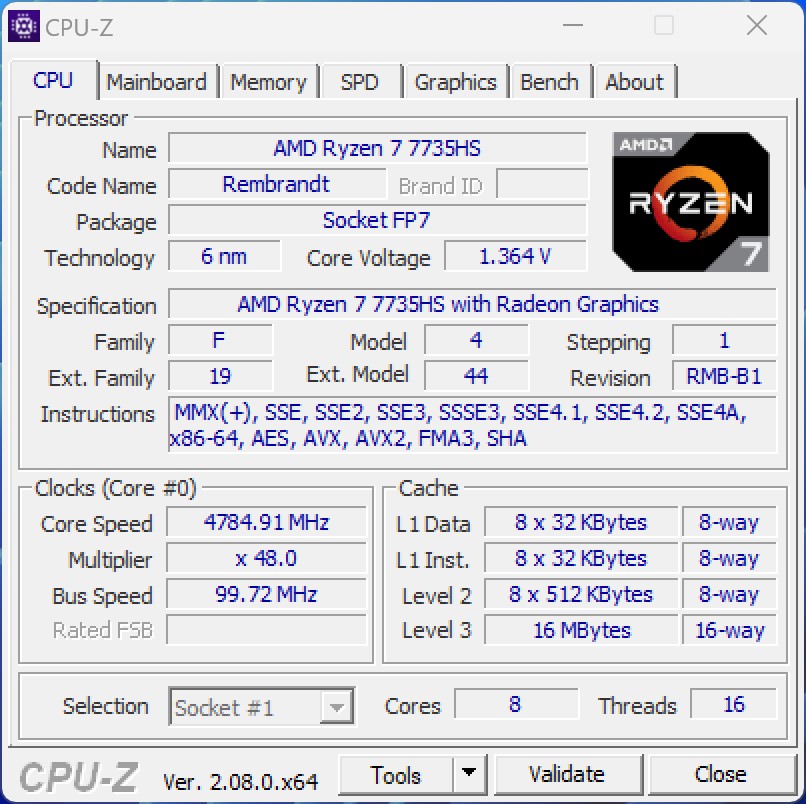
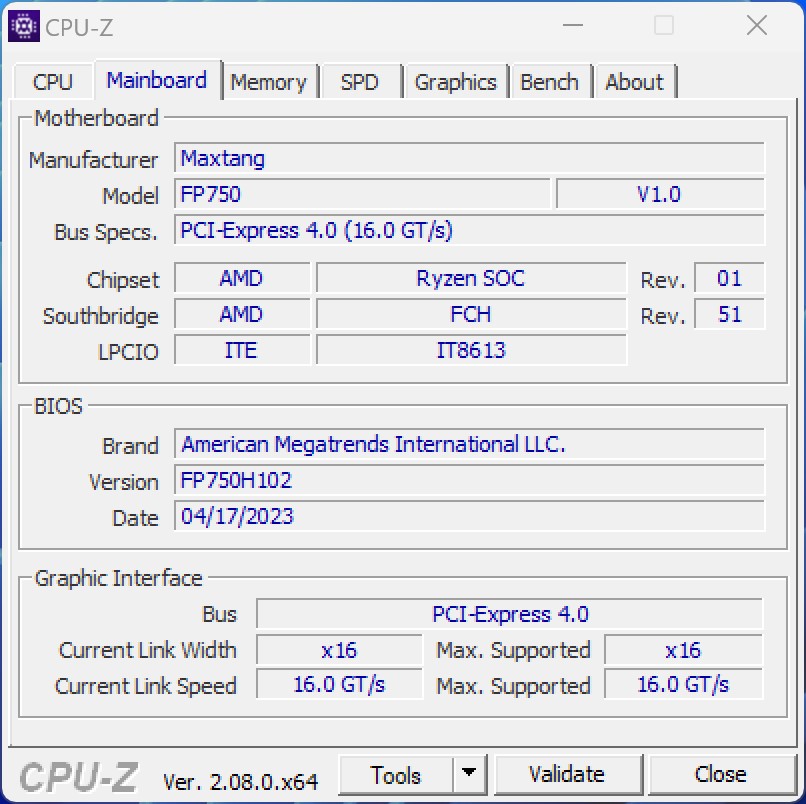
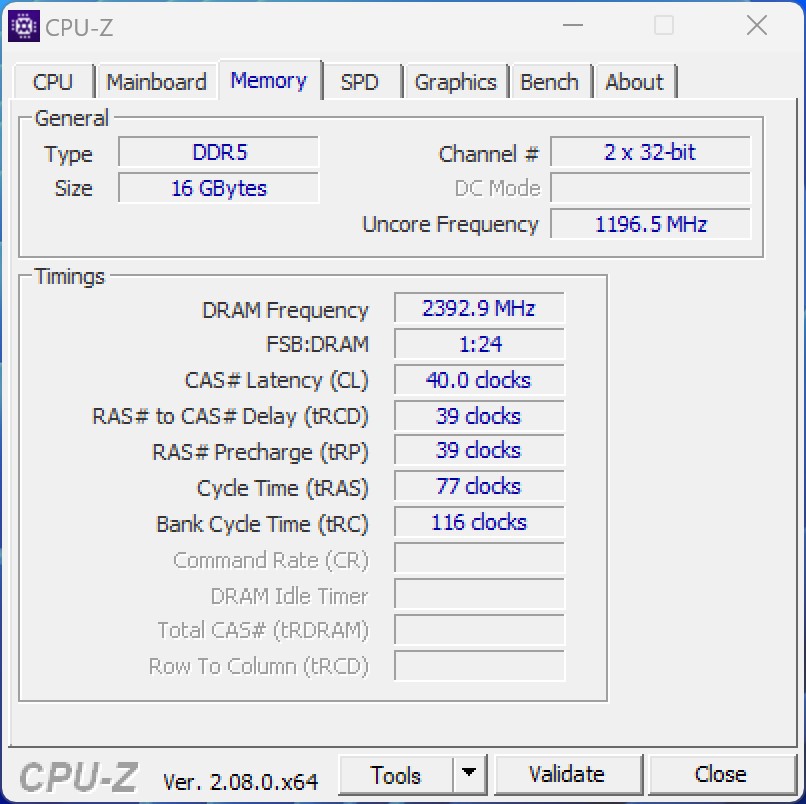
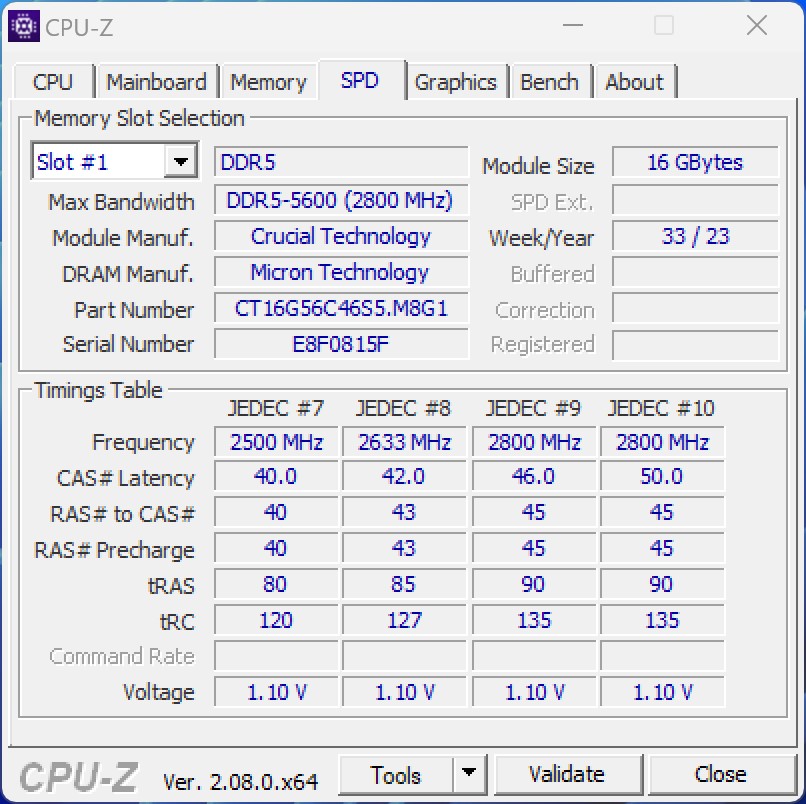
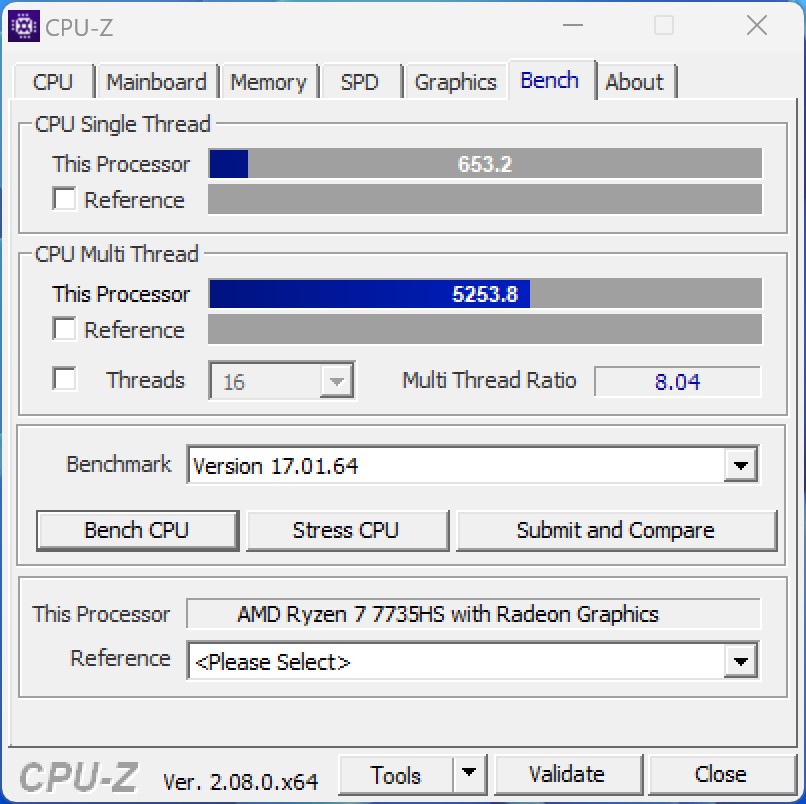
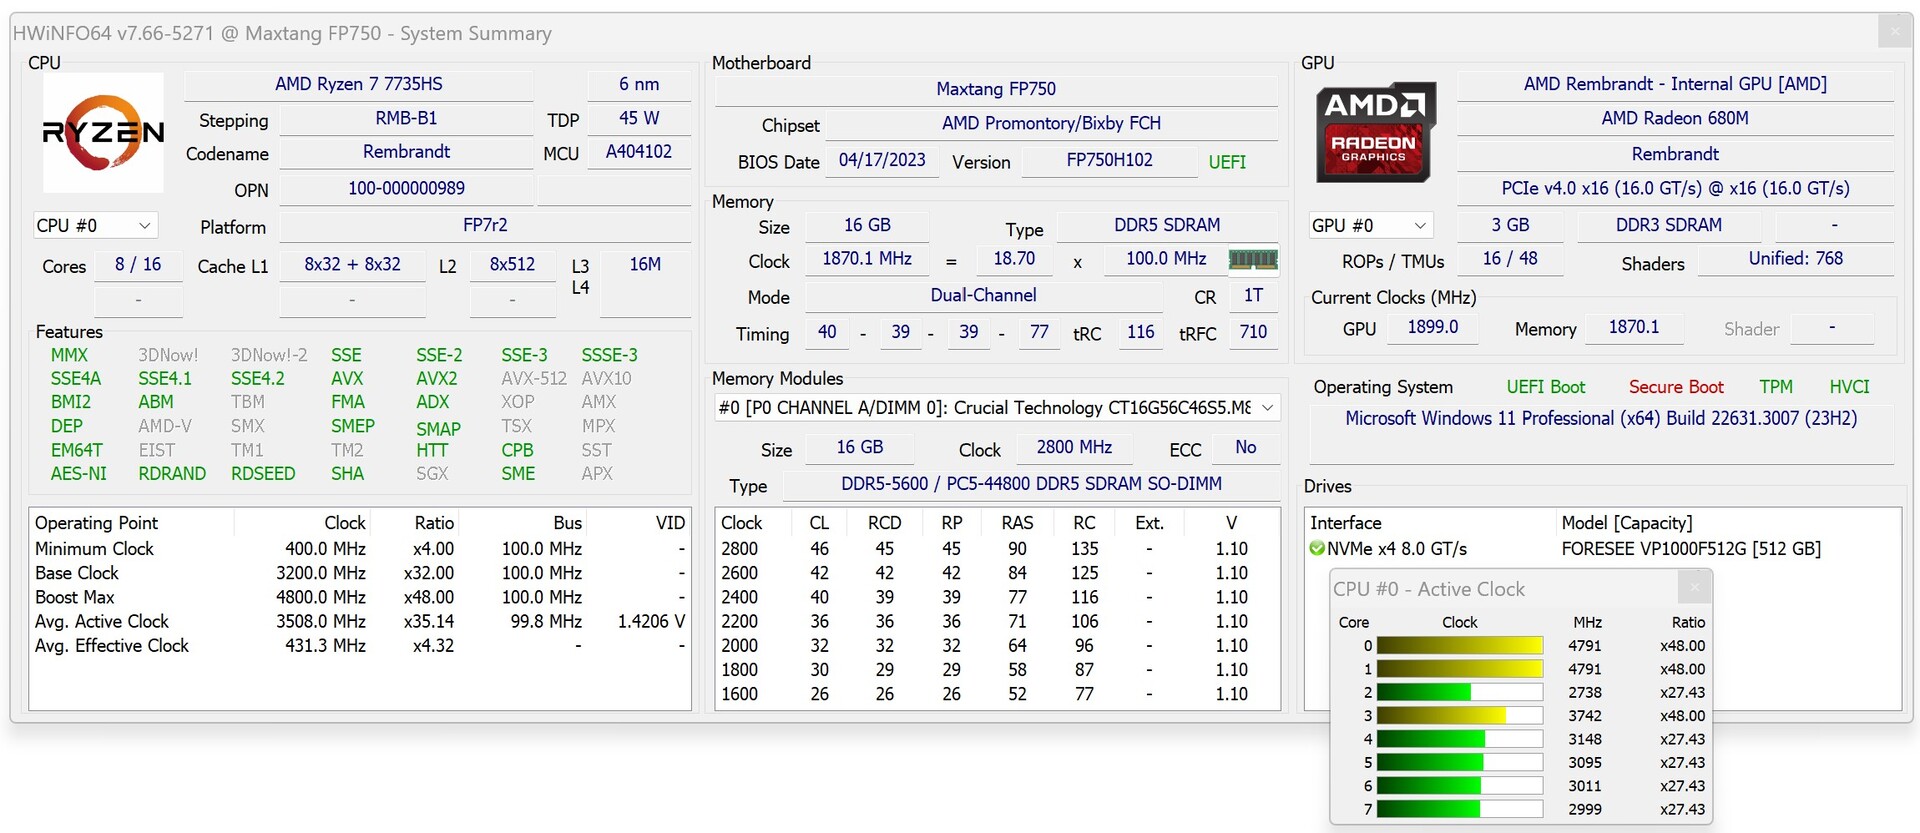
Notre appareil de test Maxtang MTN-FP750 est équipé d'un processeur AMD Ryzen 7 7735HS AMD Ryzen 7 7735HS. Dans la carte AMD Radeon 680Mle SoC dispose également d'un iGPU puissant. En ce qui concerne la mémoire vive, le fabricant a choisi de doter le mini PC d'un seul module DDR5-5600 de 16 Go, même si, dans la pratique, seule une DDR5-4800 peut être utilisée.
Conditions d'essai
Nous avons effectué tous les tests de performance en utilisant le profil énergétique "highest performance". Les performances du SoC n'ont pas été modifiées dans le BIOS et l'appareil a conservé ses paramètres d'usine.
Processeur
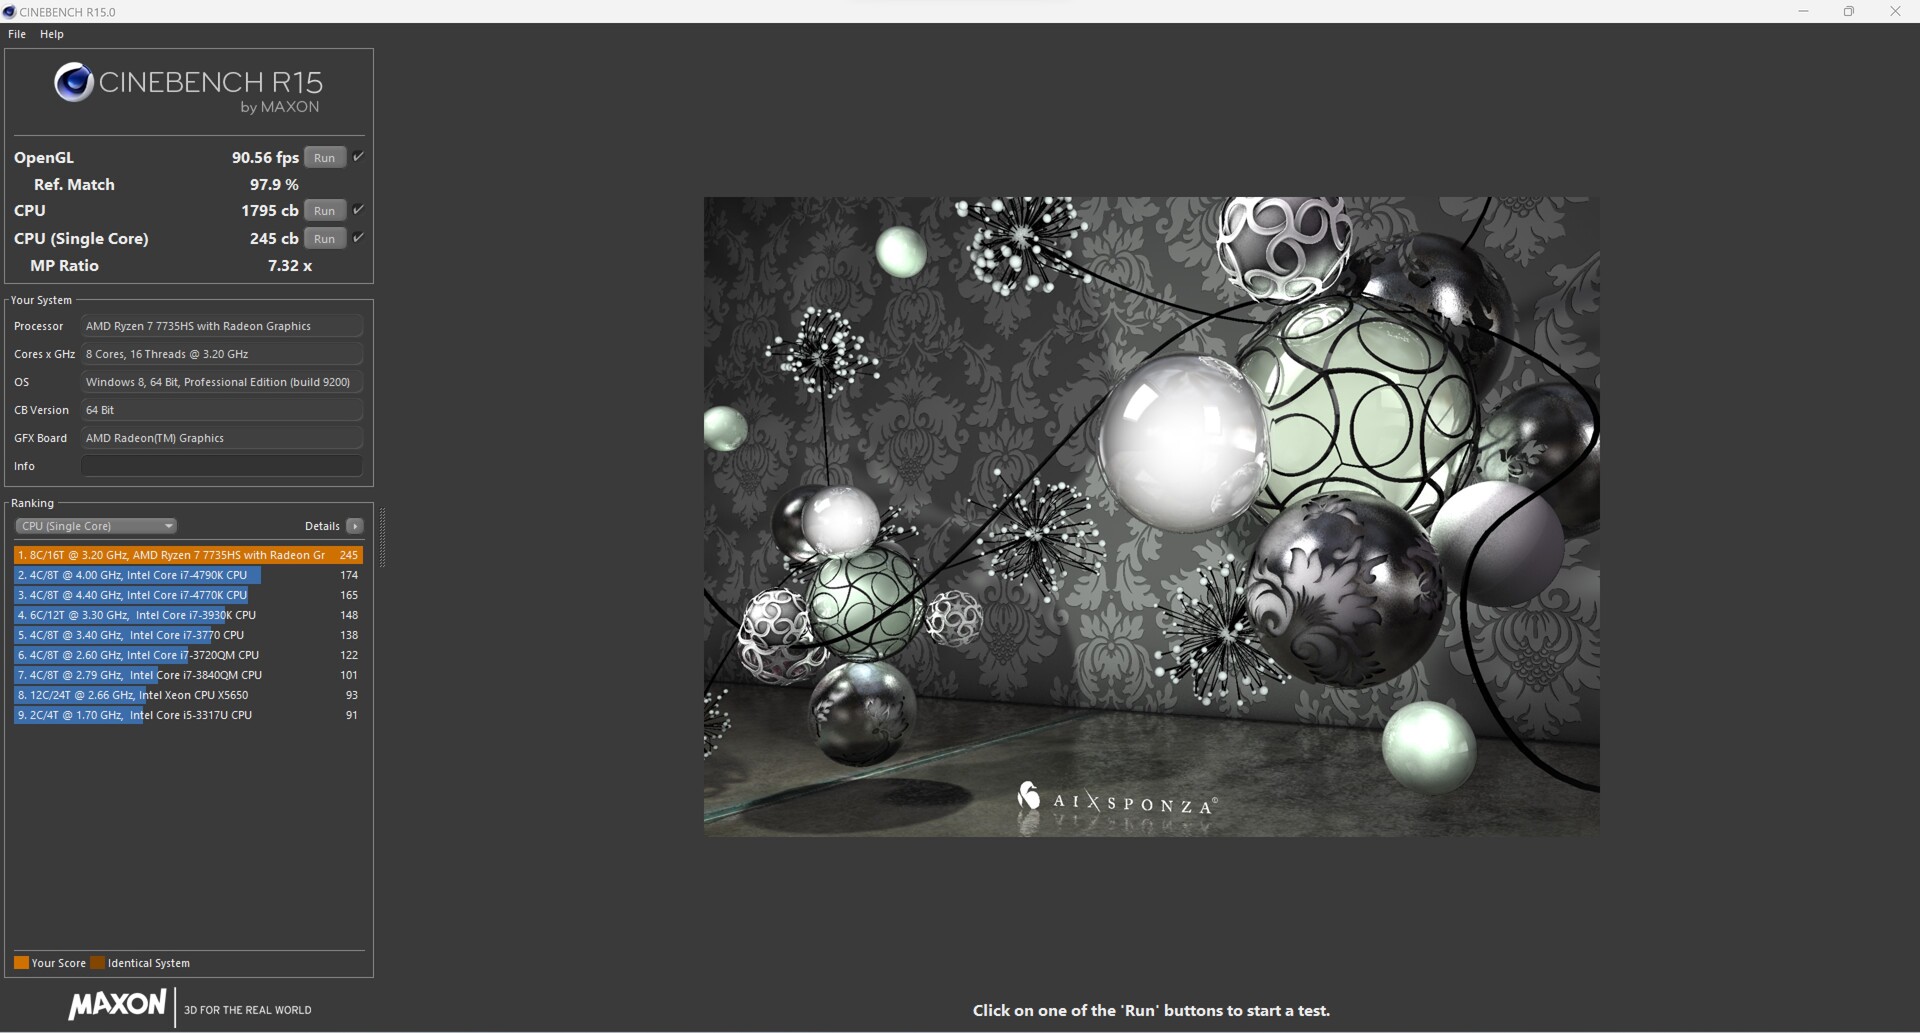
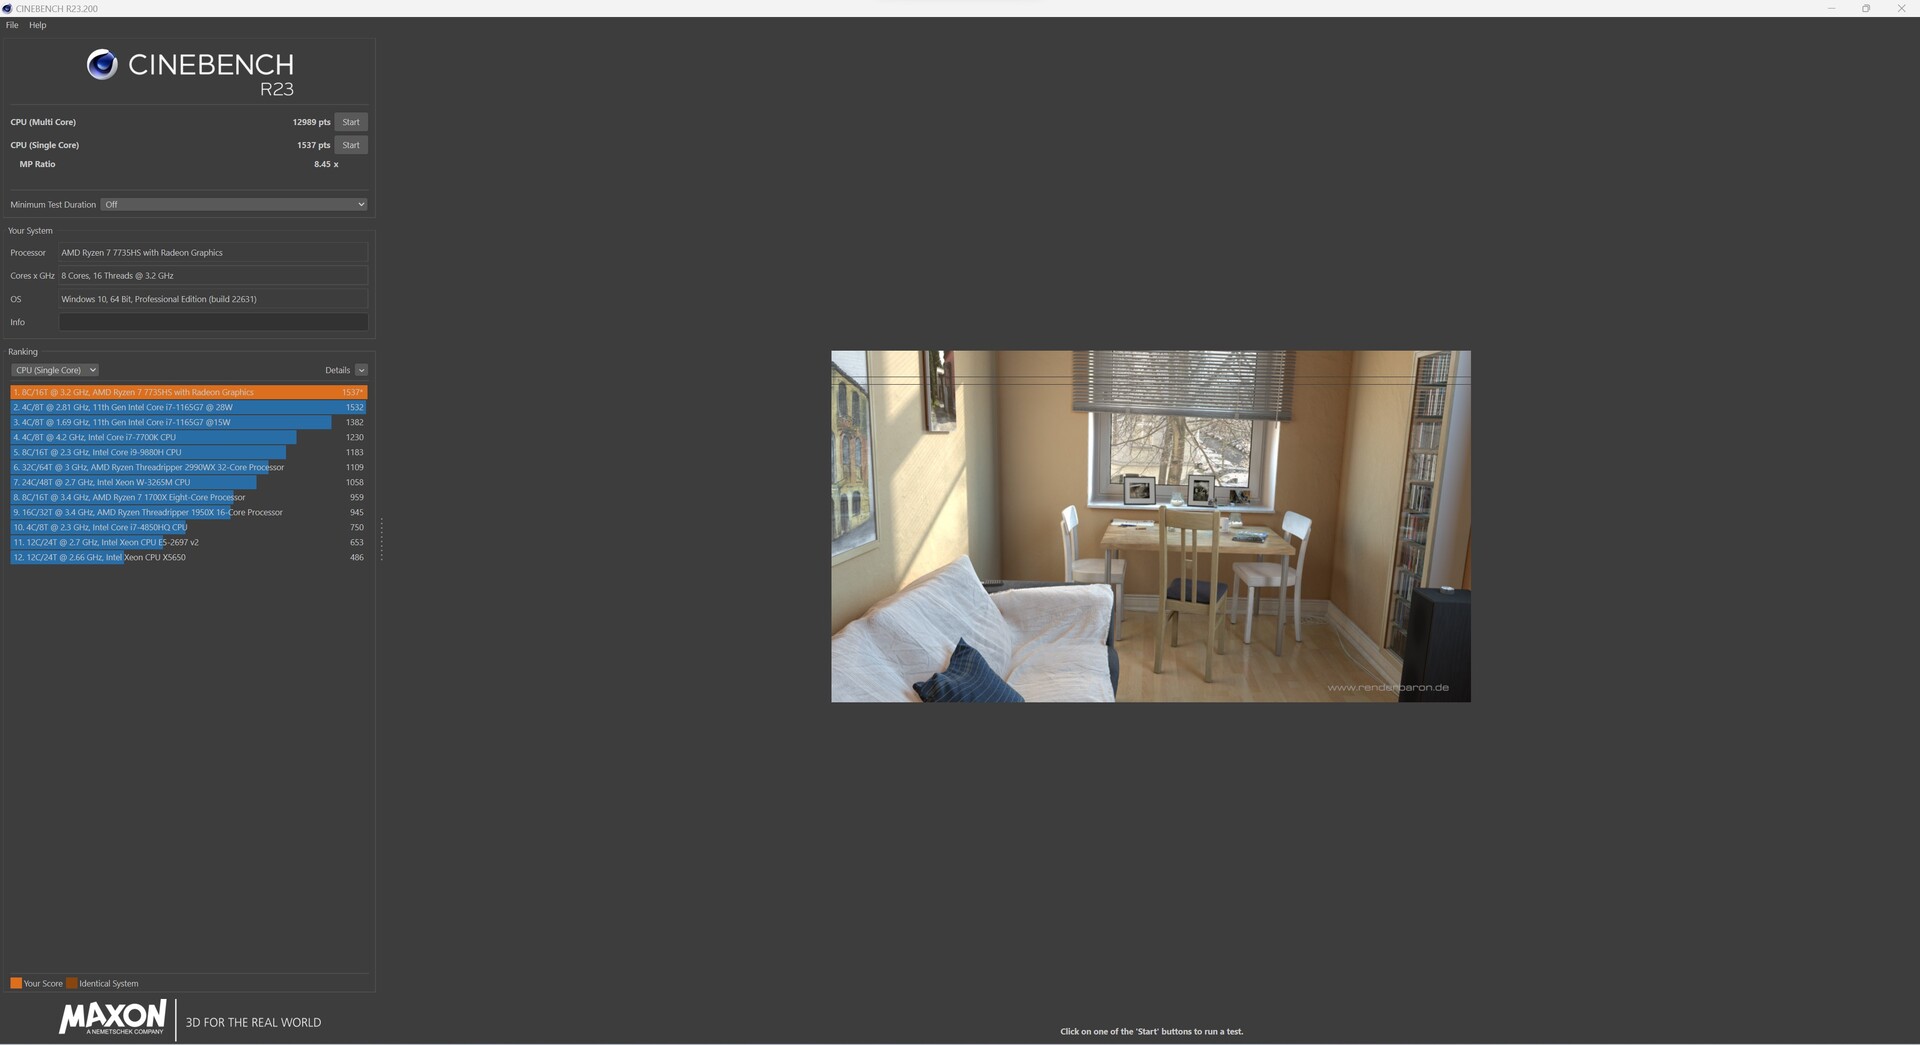
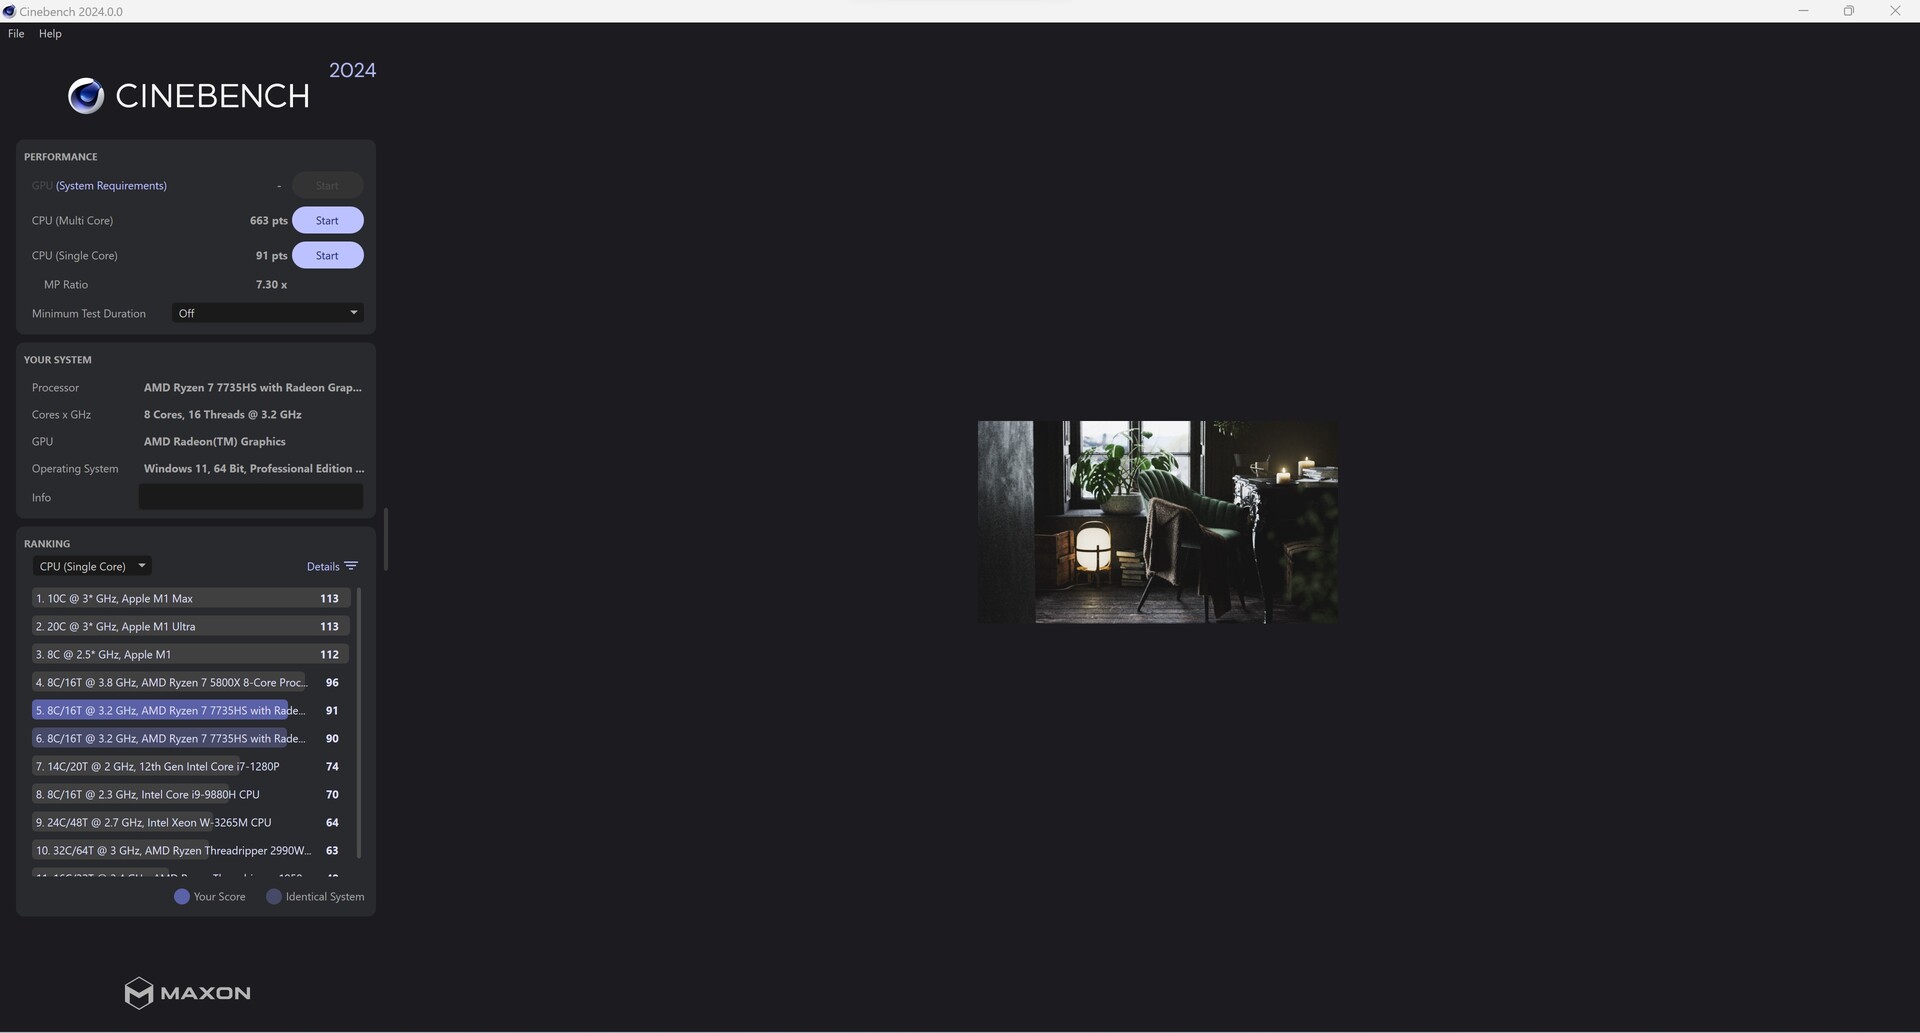
Le AMD Ryzen 7 7735HS est un processeur à 8 cœurs relativement moderne de la série Rembrandt. Cependant, le SoC Zen3 d'AMD ne peut plus être considéré comme l'un des nouveaux venus sur le marché. Malgré cela, le processeur peut traiter 16 threads en parallèle, ce qui constitue une bonne performance multithread. Dans la comparaison des performances, notre Maxtang MTN-FP750 n'a pu obtenir que l'avant-dernière place. La raison en est la limite de puissance de 35 watts de l'AMD Ryzen 7 7735HS.
Vous trouverez d'autres benchmarks de processeurs ici ici.
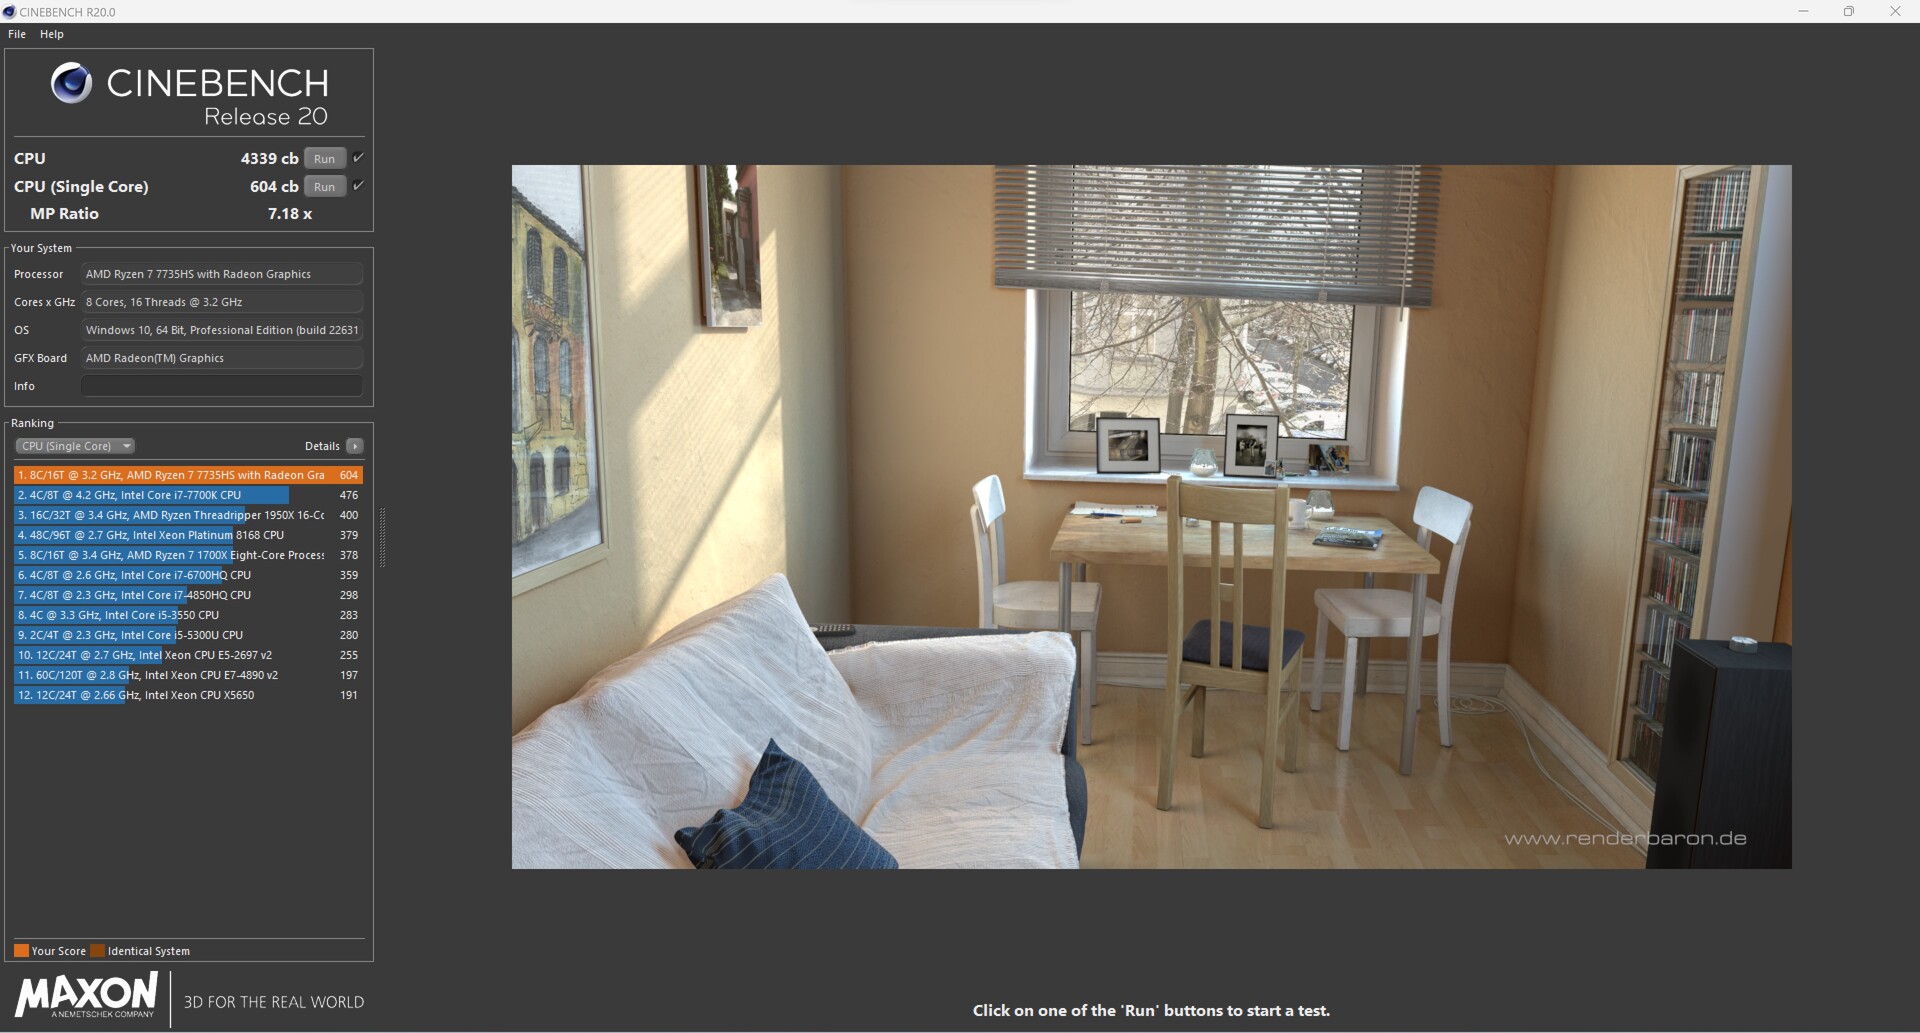
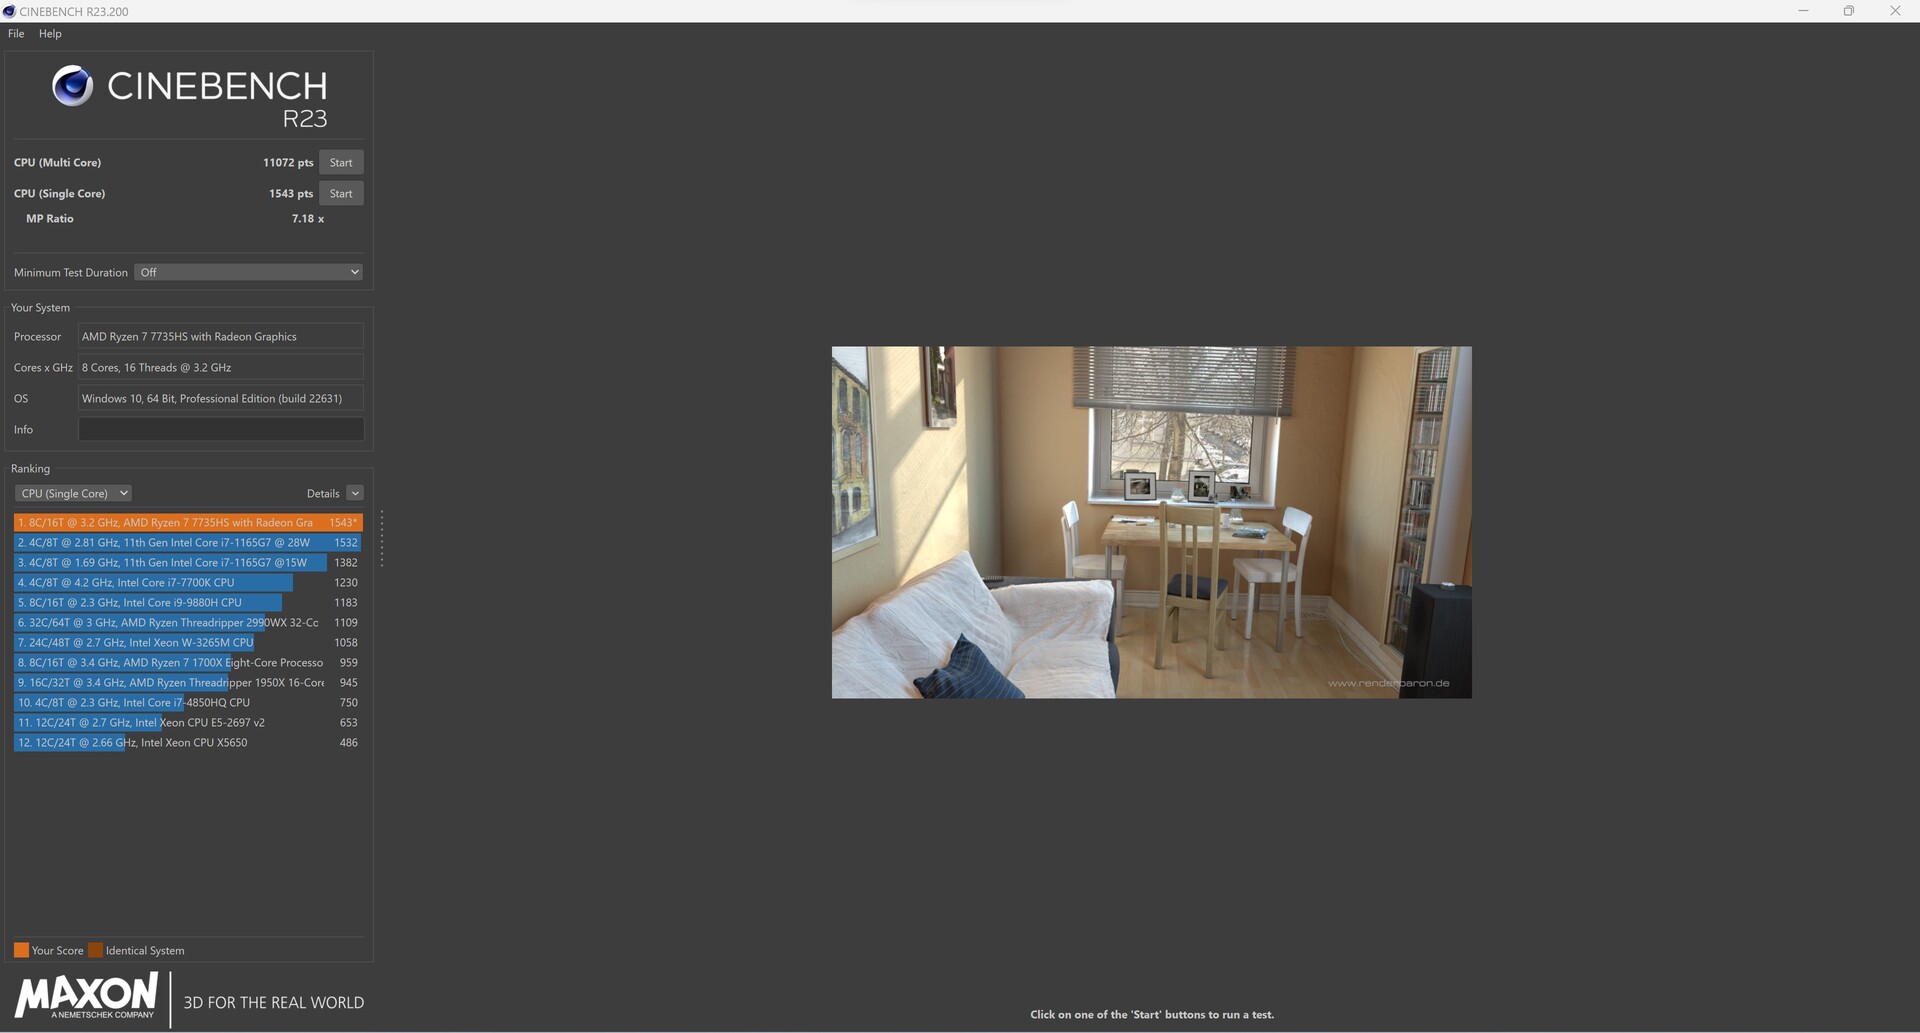
Résultats de Cinebench avec les réglages d'usine (PL1 et PL2 = 35 watts)

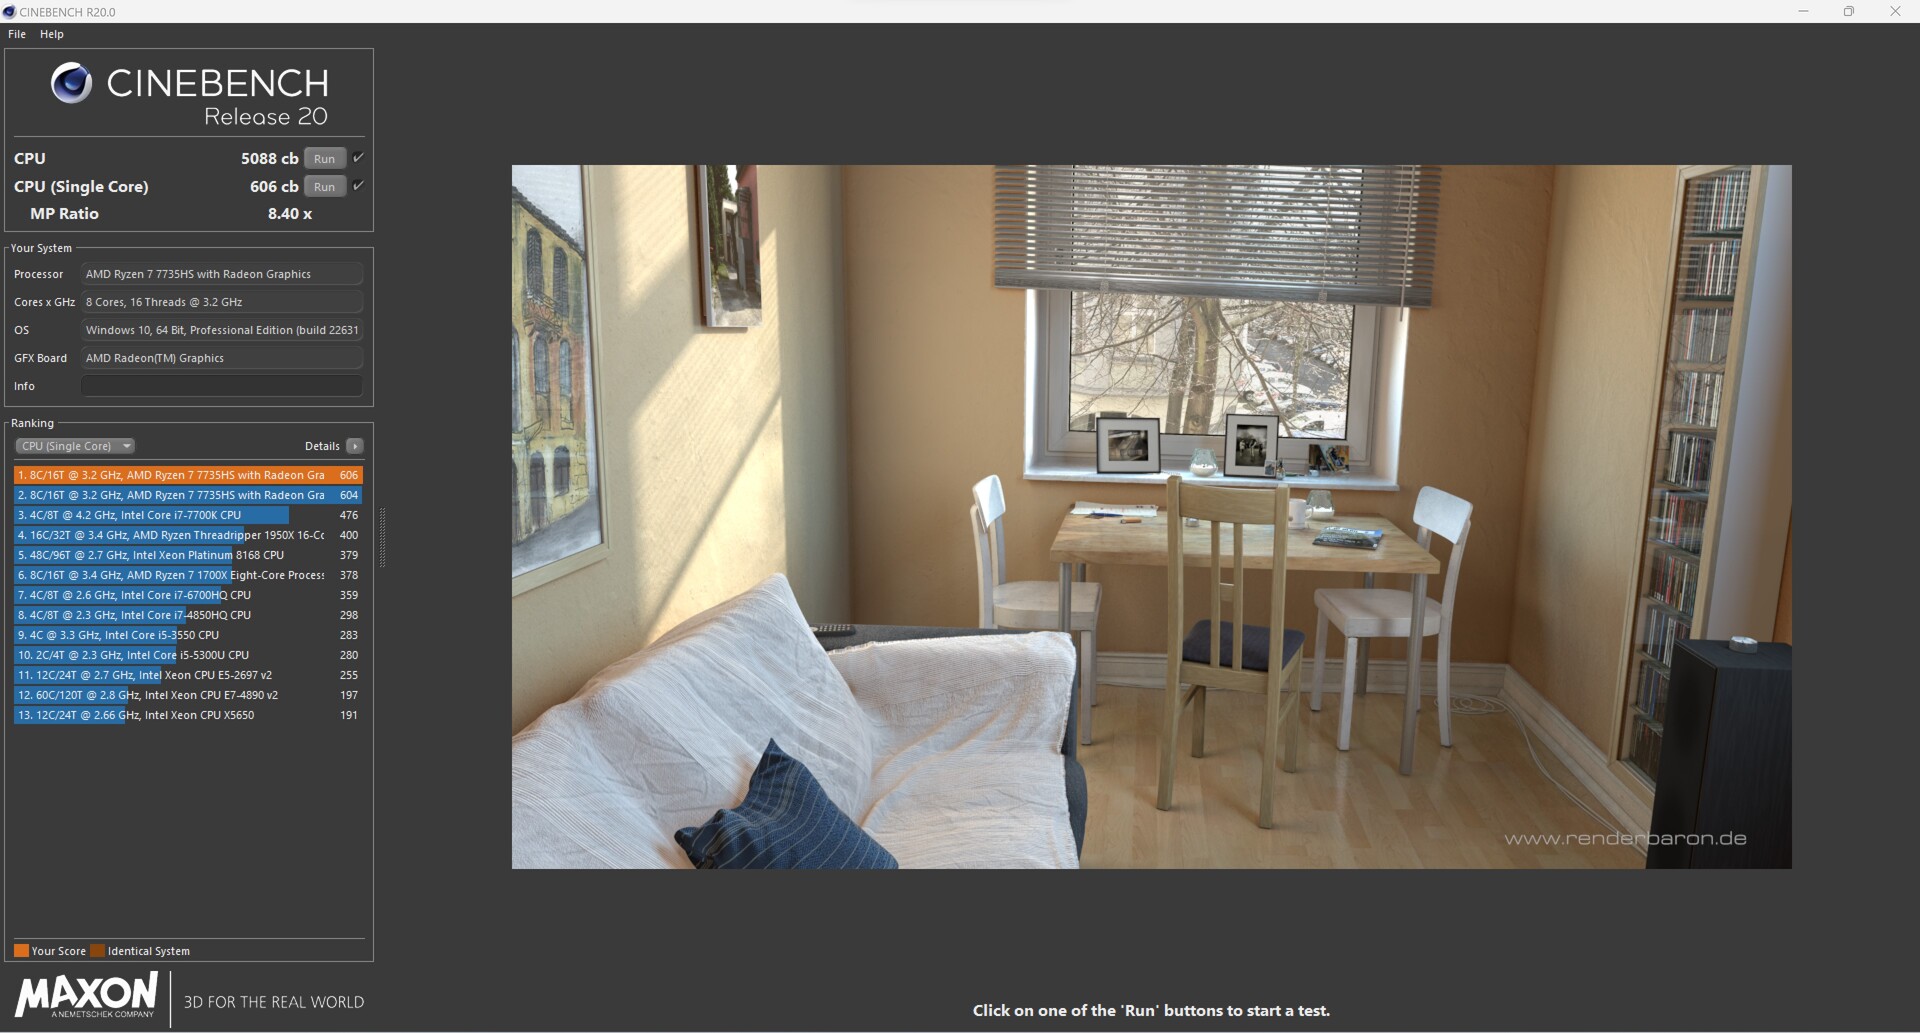
Résultats de Cinebench avec un objectif de puissance plus élevé (PL1 = 54 watts, PL2 = 65 watts)

| Performance rating - Percent | |
| Minisforum Neptune Series NAD9 | |
| Minisforum Venus Series NAB6 | |
| Geekom AS 6, R9 6900HX | |
| NiPoGi AD08 | |
| Geekom Mini IT12 | |
| Geekom A5 | |
| Maxtang MTN-FP750 | |
| Cinebench R10 | |
| Rendering Single CPUs 64Bit | |
| Minisforum Venus Series NAB6 | |
| Geekom Mini IT12 | |
| NiPoGi AD08 | |
| Minisforum Neptune Series NAD9 | |
| Maxtang MTN-FP750 | |
| Geekom AS 6, R9 6900HX | |
| Geekom A5 | |
| Rendering Multiple CPUs 64Bit | |
| Minisforum Neptune Series NAD9 | |
| Minisforum Venus Series NAB6 | |
| Geekom AS 6, R9 6900HX | |
| Geekom A5 | |
| Maxtang MTN-FP750 | |
| NiPoGi AD08 | |
| Geekom Mini IT12 | |
| Blender - v2.79 BMW27 CPU | |
| NiPoGi AD08 | |
| Geekom A5 | |
| Minisforum Venus Series NAB6 | |
| Geekom Mini IT12 | |
| Maxtang MTN-FP750 | |
| Minisforum Neptune Series NAD9 | |
| Geekom AS 6, R9 6900HX | |
| WinRAR - Result | |
| Minisforum Venus Series NAB6 | |
| Minisforum Neptune Series NAD9 | |
| NiPoGi AD08 | |
| Geekom A5 | |
| Geekom AS 6, R9 6900HX | |
| Geekom Mini IT12 | |
| Maxtang MTN-FP750 | |
| 3DMark 11 - 1280x720 Performance Physics | |
| Minisforum Neptune Series NAD9 | |
| Minisforum Venus Series NAB6 | |
| Geekom AS 6, R9 6900HX | |
| Geekom A5 | |
| NiPoGi AD08 | |
| Maxtang MTN-FP750 | |
| Geekom Mini IT12 | |
| HWBOT x265 Benchmark v2.2 - 4k Preset | |
| Geekom AS 6, R9 6900HX | |
| Minisforum Neptune Series NAD9 | |
| Minisforum Venus Series NAB6 | |
| Geekom A5 | |
| Maxtang MTN-FP750 | |
| NiPoGi AD08 | |
| Geekom Mini IT12 | |
| R Benchmark 2.5 - Overall mean | |
| Geekom A5 | |
| Maxtang MTN-FP750 | |
| Geekom AS 6, R9 6900HX | |
| NiPoGi AD08 | |
| Geekom Mini IT12 | |
| Minisforum Neptune Series NAD9 | |
| Minisforum Venus Series NAB6 | |
| LibreOffice - 20 Documents To PDF | |
| Maxtang MTN-FP750 | |
| Geekom A5 | |
| Geekom Mini IT12 | |
| NiPoGi AD08 | |
| Geekom AS 6, R9 6900HX | |
| Minisforum Venus Series NAB6 | |
| Minisforum Neptune Series NAD9 | |
| WebXPRT 3 - Overall | |
| Minisforum Neptune Series NAD9 | |
| Minisforum Venus Series NAB6 | |
| NiPoGi AD08 | |
| Geekom Mini IT12 | |
| Maxtang MTN-FP750 | |
| Geekom A5 | |
| Geekom AS 6, R9 6900HX | |
| Mozilla Kraken 1.1 - Total | |
| Geekom A5 | |
| Geekom AS 6, R9 6900HX | |
| Maxtang MTN-FP750 | |
| Minisforum Neptune Series NAD9 | |
| Geekom Mini IT12 | |
| NiPoGi AD08 | |
| Minisforum Venus Series NAB6 | |
* ... Moindre est la valeur, meilleures sont les performances
AIDA64: FP32 Ray-Trace | FPU Julia | CPU SHA3 | CPU Queen | FPU SinJulia | FPU Mandel | CPU AES | CPU ZLib | FP64 Ray-Trace | CPU PhotoWorxx
| Performance rating | |
| Moyenne de la classe Mini PC | |
| Geekom AS 6, R9 6900HX | |
| Geekom A5 | |
| Maxtang MTN-FP750 | |
| Minisforum Neptune Series NAD9 | |
| Minisforum Venus Series NAB6 | |
| NiPoGi AD08 | |
| Geekom Mini IT12 | |
| AIDA64 / FP32 Ray-Trace | |
| Moyenne de la classe Mini PC (974 - 82725, n=105, 2 dernières années) | |
| Geekom AS 6, R9 6900HX | |
| Maxtang MTN-FP750 | |
| Geekom A5 | |
| Minisforum Neptune Series NAD9 | |
| Minisforum Venus Series NAB6 | |
| NiPoGi AD08 | |
| Geekom Mini IT12 | |
| AIDA64 / FPU Julia | |
| Moyenne de la classe Mini PC (6115 - 363782, n=105, 2 dernières années) | |
| Geekom AS 6, R9 6900HX | |
| Maxtang MTN-FP750 | |
| Geekom A5 | |
| Minisforum Neptune Series NAD9 | |
| Minisforum Venus Series NAB6 | |
| NiPoGi AD08 | |
| Geekom Mini IT12 | |
| AIDA64 / CPU SHA3 | |
| Moyenne de la classe Mini PC (385 - 9475, n=105, 2 dernières années) | |
| Geekom AS 6, R9 6900HX | |
| Maxtang MTN-FP750 | |
| Geekom A5 | |
| Minisforum Neptune Series NAD9 | |
| Minisforum Venus Series NAB6 | |
| NiPoGi AD08 | |
| Geekom Mini IT12 | |
| AIDA64 / CPU Queen | |
| Geekom AS 6, R9 6900HX | |
| Moyenne de la classe Mini PC (20501 - 184747, n=90, 2 dernières années) | |
| Geekom A5 | |
| Maxtang MTN-FP750 | |
| Minisforum Neptune Series NAD9 | |
| Minisforum Venus Series NAB6 | |
| Geekom Mini IT12 | |
| NiPoGi AD08 | |
| AIDA64 / FPU SinJulia | |
| Moyenne de la classe Mini PC (1019 - 31931, n=105, 2 dernières années) | |
| Maxtang MTN-FP750 | |
| Geekom AS 6, R9 6900HX | |
| Geekom A5 | |
| Minisforum Neptune Series NAD9 | |
| Minisforum Venus Series NAB6 | |
| NiPoGi AD08 | |
| Geekom Mini IT12 | |
| AIDA64 / FPU Mandel | |
| Moyenne de la classe Mini PC (3322 - 192994, n=105, 2 dernières années) | |
| Geekom AS 6, R9 6900HX | |
| Maxtang MTN-FP750 | |
| Geekom A5 | |
| Minisforum Neptune Series NAD9 | |
| Minisforum Venus Series NAB6 | |
| NiPoGi AD08 | |
| Geekom Mini IT12 | |
| AIDA64 / CPU AES | |
| Geekom AS 6, R9 6900HX | |
| Geekom A5 | |
| Minisforum Neptune Series NAD9 | |
| Minisforum Venus Series NAB6 | |
| Moyenne de la classe Mini PC (9214 - 325960, n=104, 2 dernières années) | |
| Geekom Mini IT12 | |
| Maxtang MTN-FP750 | |
| NiPoGi AD08 | |
| AIDA64 / CPU ZLib | |
| Moyenne de la classe Mini PC (127.2 - 2431, n=105, 2 dernières années) | |
| Geekom AS 6, R9 6900HX | |
| Minisforum Neptune Series NAD9 | |
| Geekom A5 | |
| NiPoGi AD08 | |
| Minisforum Venus Series NAB6 | |
| Maxtang MTN-FP750 | |
| Geekom Mini IT12 | |
| AIDA64 / FP64 Ray-Trace | |
| Moyenne de la classe Mini PC (537 - 43587, n=105, 2 dernières années) | |
| Geekom AS 6, R9 6900HX | |
| Maxtang MTN-FP750 | |
| Geekom A5 | |
| Minisforum Neptune Series NAD9 | |
| Minisforum Venus Series NAB6 | |
| NiPoGi AD08 | |
| Geekom Mini IT12 | |
| AIDA64 / CPU PhotoWorxx | |
| Moyenne de la classe Mini PC (8069 - 96843, n=105, 2 dernières années) | |
| Geekom AS 6, R9 6900HX | |
| Geekom Mini IT12 | |
| Minisforum Venus Series NAB6 | |
| Geekom A5 | |
| NiPoGi AD08 | |
| Minisforum Neptune Series NAD9 | |
| Maxtang MTN-FP750 | |
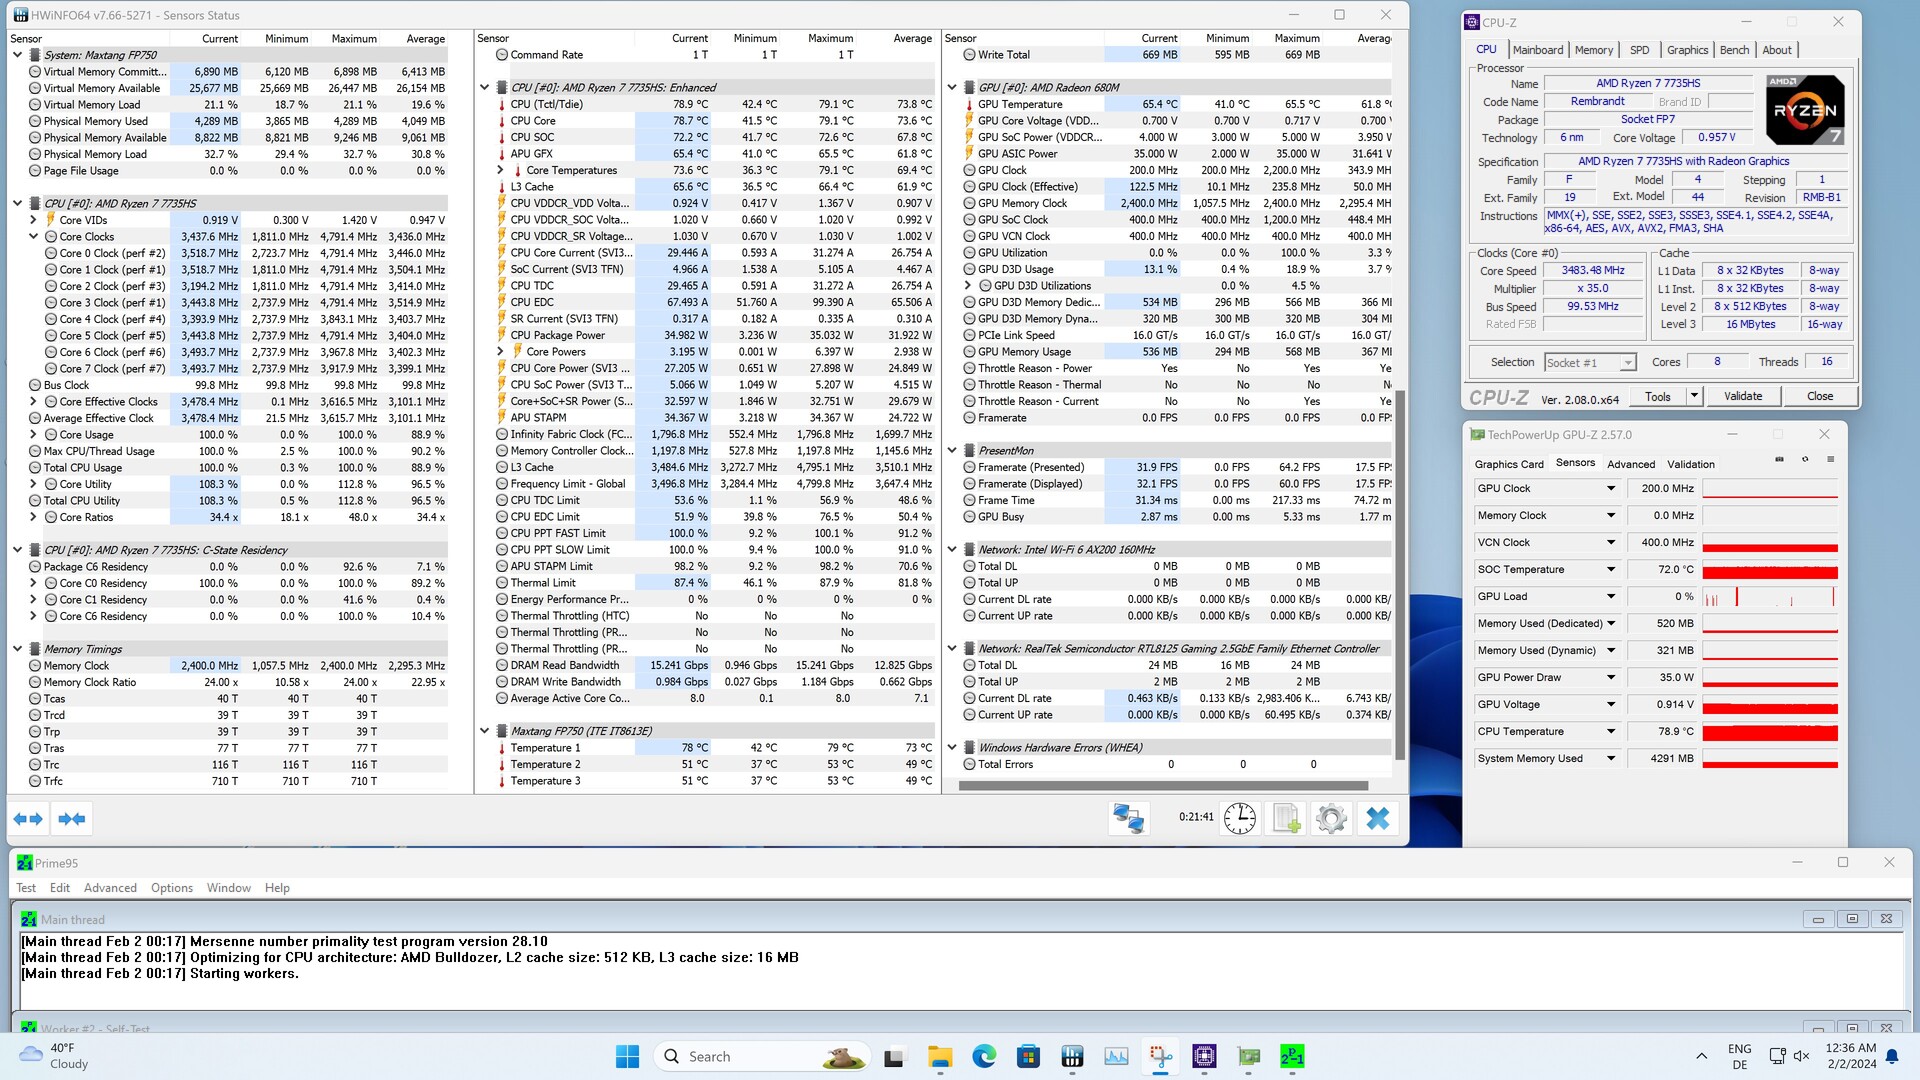
Maxtang MTN-FP750 vs. Cinebench R15 Multi-Loop
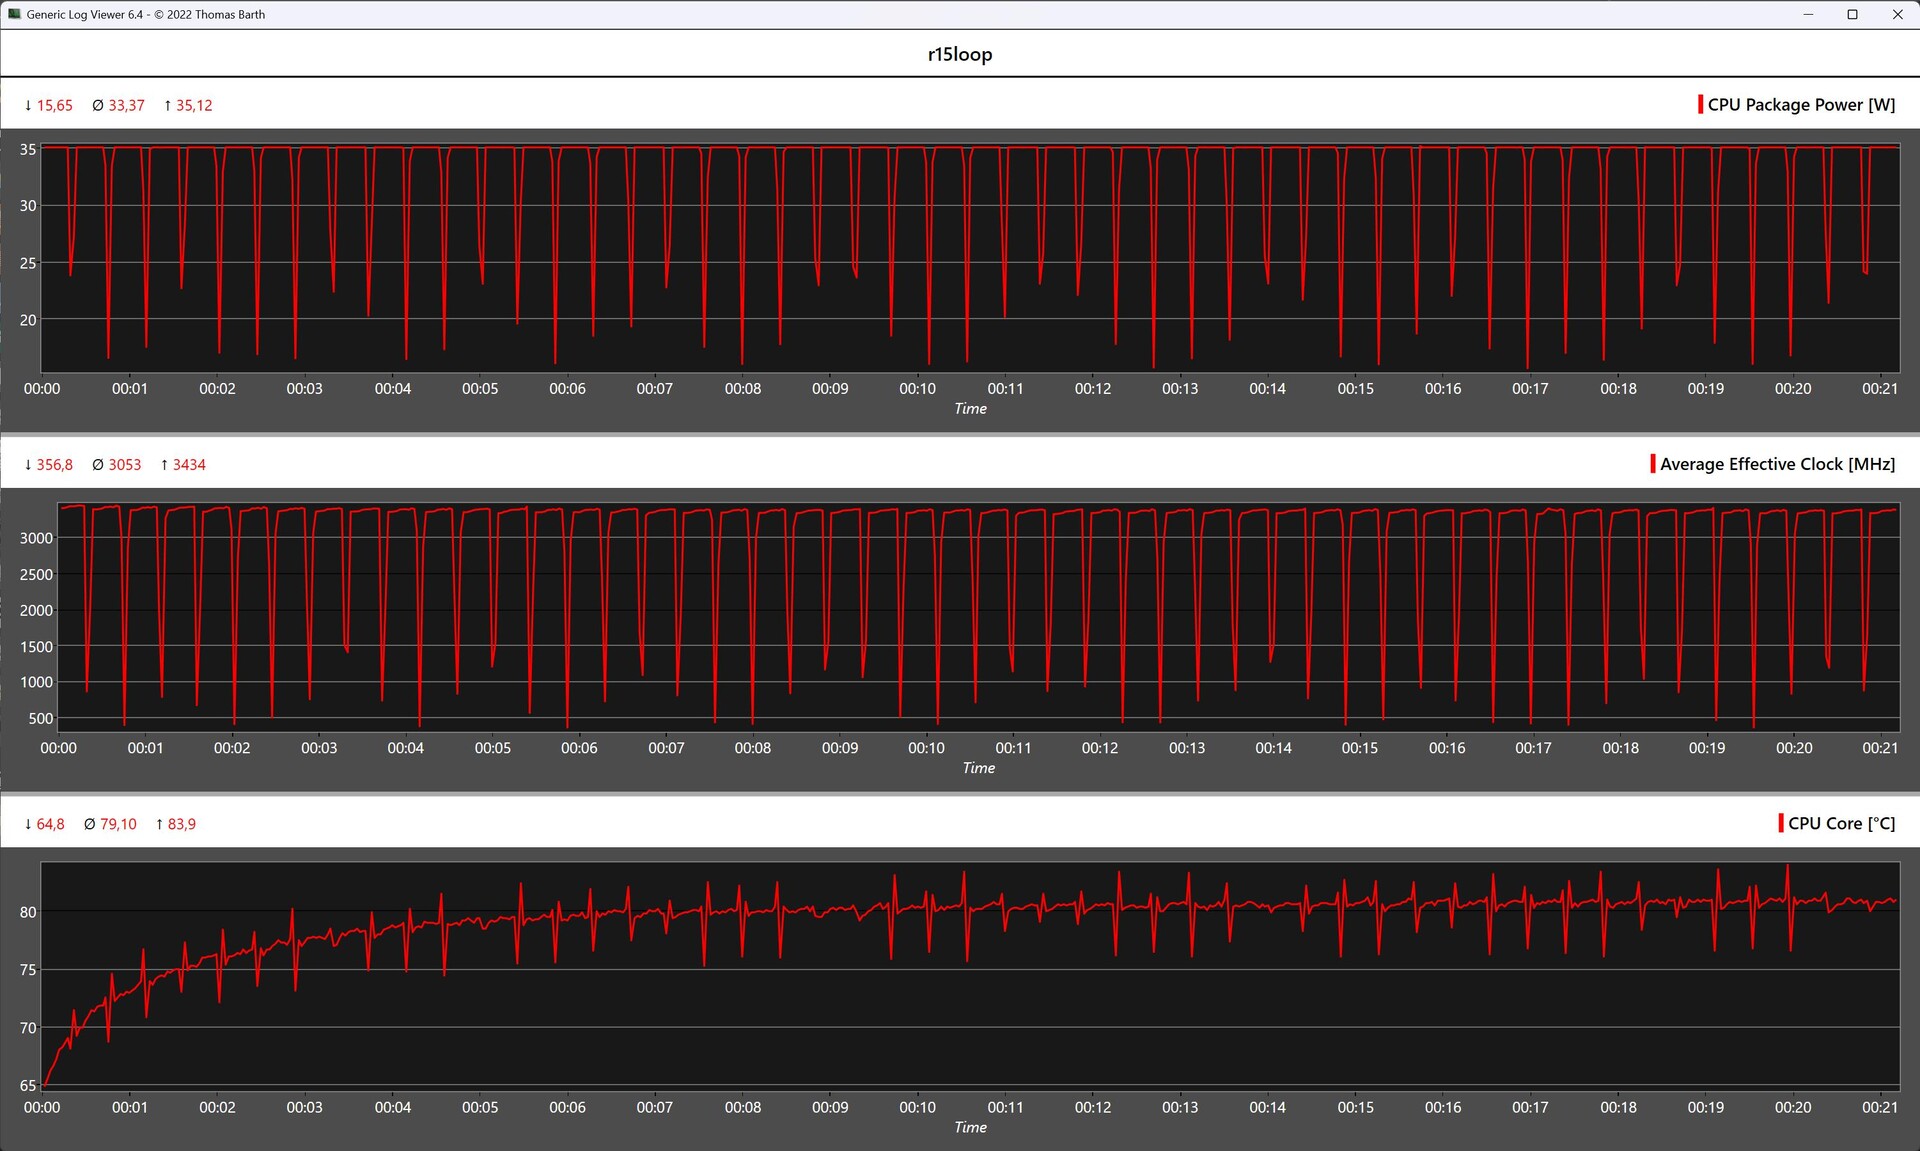
La boucle multiple Cinebench R15 nous a montré à quel point le système de refroidissement fonctionne bien sous charge. L'unité de refroidissement n'atteint pas ses limites en raison d'un faible TDP maximum de seulement 35 watts et c'est pourquoi l'appareil a été en mesure d'obtenir des performances de CPU toujours stables. Dans la comparaison, notre échantillon a même réussi à obtenir la deuxième place derrière le Geekom AS 6.
Performance du système
Une fois de plus, dans les tests synthétiques de performance du système, notre appareil d'évaluation a également été en queue de peloton. Dans les tâches quotidiennes et d'un point de vue subjectif, le Maxtang MTN-FP750 a été en mesure de fournir de bonnes performances système, tant que le système n'a pas été mis au défi de gérer trop de tâches simultanément. La mémoire vive semble être le goulot d'étranglement, car une fois la mémoire graphique soustraite, seuls 12 des 16 Go sont disponibles.
| AIDA64 / Memory Copy | |
| Moyenne de la classe Mini PC (15933 - 163031, n=105, 2 dernières années) | |
| Geekom AS 6, R9 6900HX | |
| Minisforum Venus Series NAB6 | |
| Minisforum Neptune Series NAD9 | |
| Geekom Mini IT12 | |
| NiPoGi AD08 | |
| Geekom A5 | |
| Maxtang MTN-FP750 | |
| AIDA64 / Memory Read | |
| Moyenne de la classe Mini PC (14143 - 123769, n=105, 2 dernières années) | |
| Geekom AS 6, R9 6900HX | |
| Minisforum Venus Series NAB6 | |
| Minisforum Neptune Series NAD9 | |
| Geekom Mini IT12 | |
| NiPoGi AD08 | |
| Geekom A5 | |
| Maxtang MTN-FP750 | |
| AIDA64 / Memory Write | |
| Moyenne de la classe Mini PC (10630 - 216693, n=105, 2 dernières années) | |
| Geekom AS 6, R9 6900HX | |
| Minisforum Venus Series NAB6 | |
| Minisforum Neptune Series NAD9 | |
| Geekom Mini IT12 | |
| Geekom A5 | |
| NiPoGi AD08 | |
| Maxtang MTN-FP750 | |
| AIDA64 / Memory Latency | |
| NiPoGi AD08 | |
| Moyenne de la classe Mini PC (88.1 - 184.8, n=106, 2 dernières années) | |
| Minisforum Neptune Series NAD9 | |
| Geekom AS 6, R9 6900HX | |
| Geekom A5 | |
| Geekom Mini IT12 | |
| Maxtang MTN-FP750 | |
| Minisforum Venus Series NAB6 | |
* ... Moindre est la valeur, meilleures sont les performances
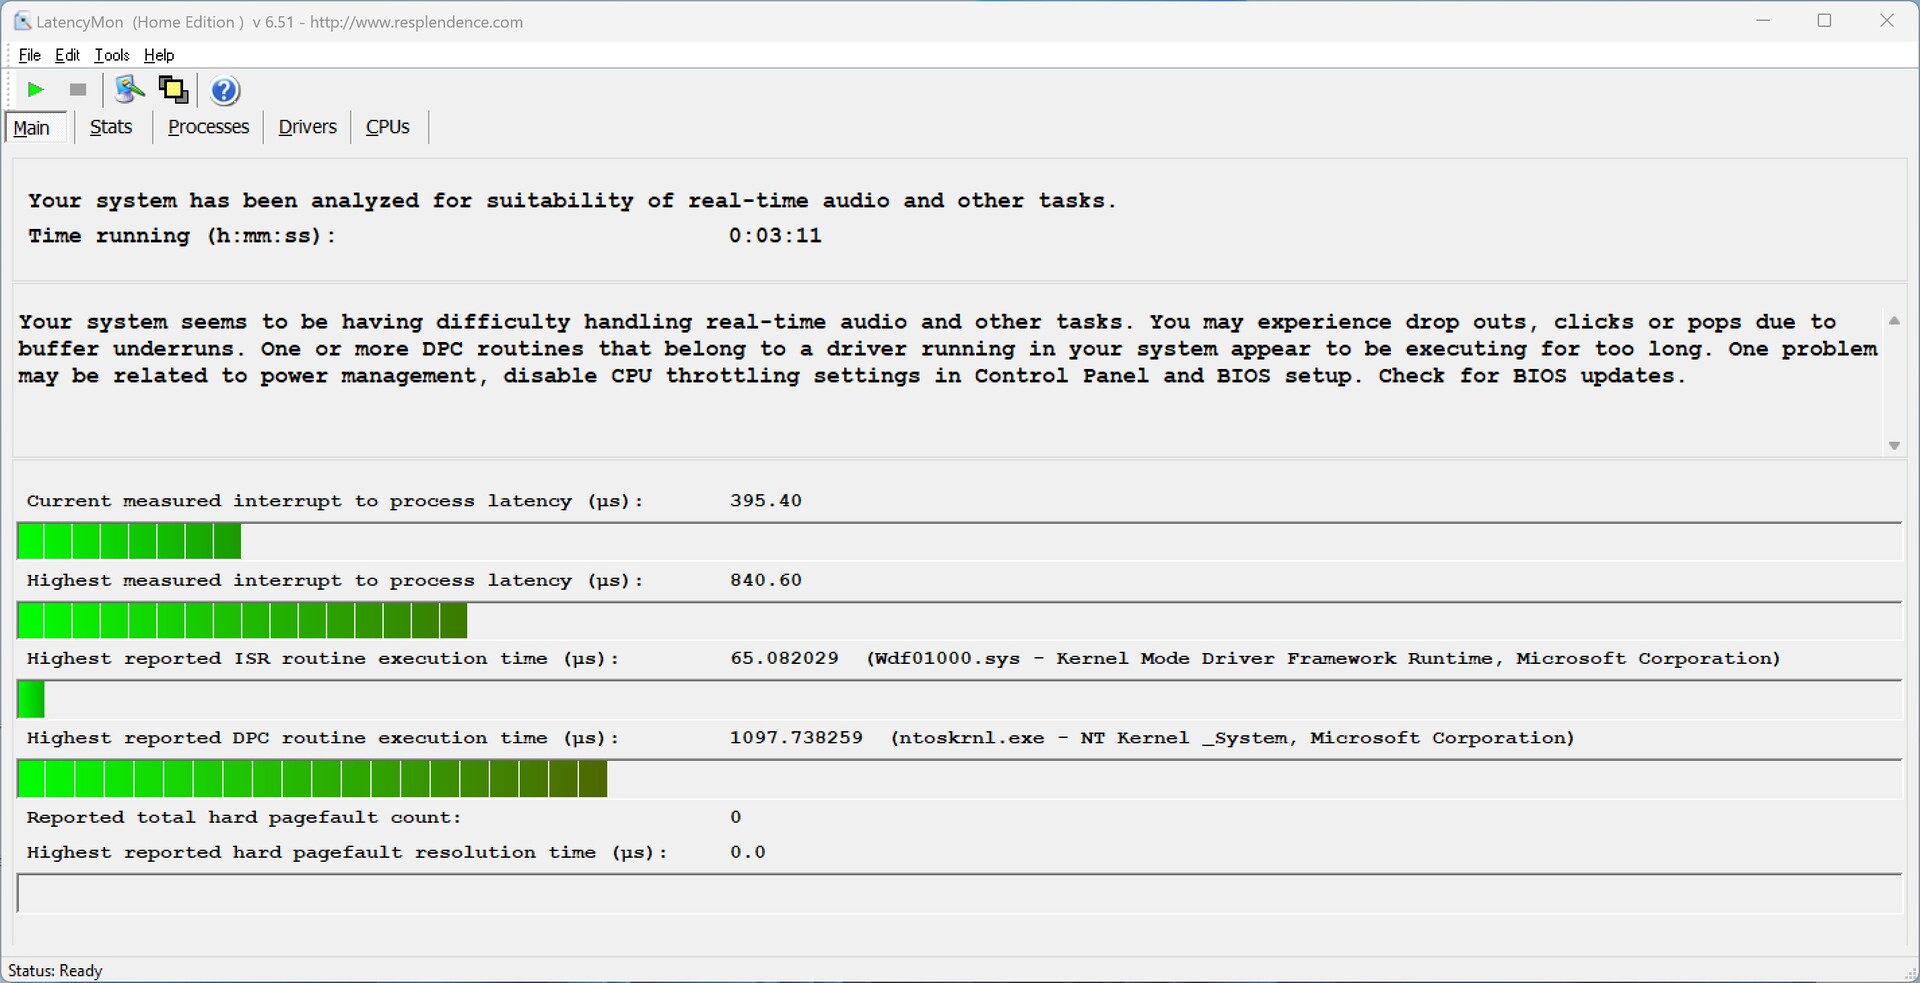
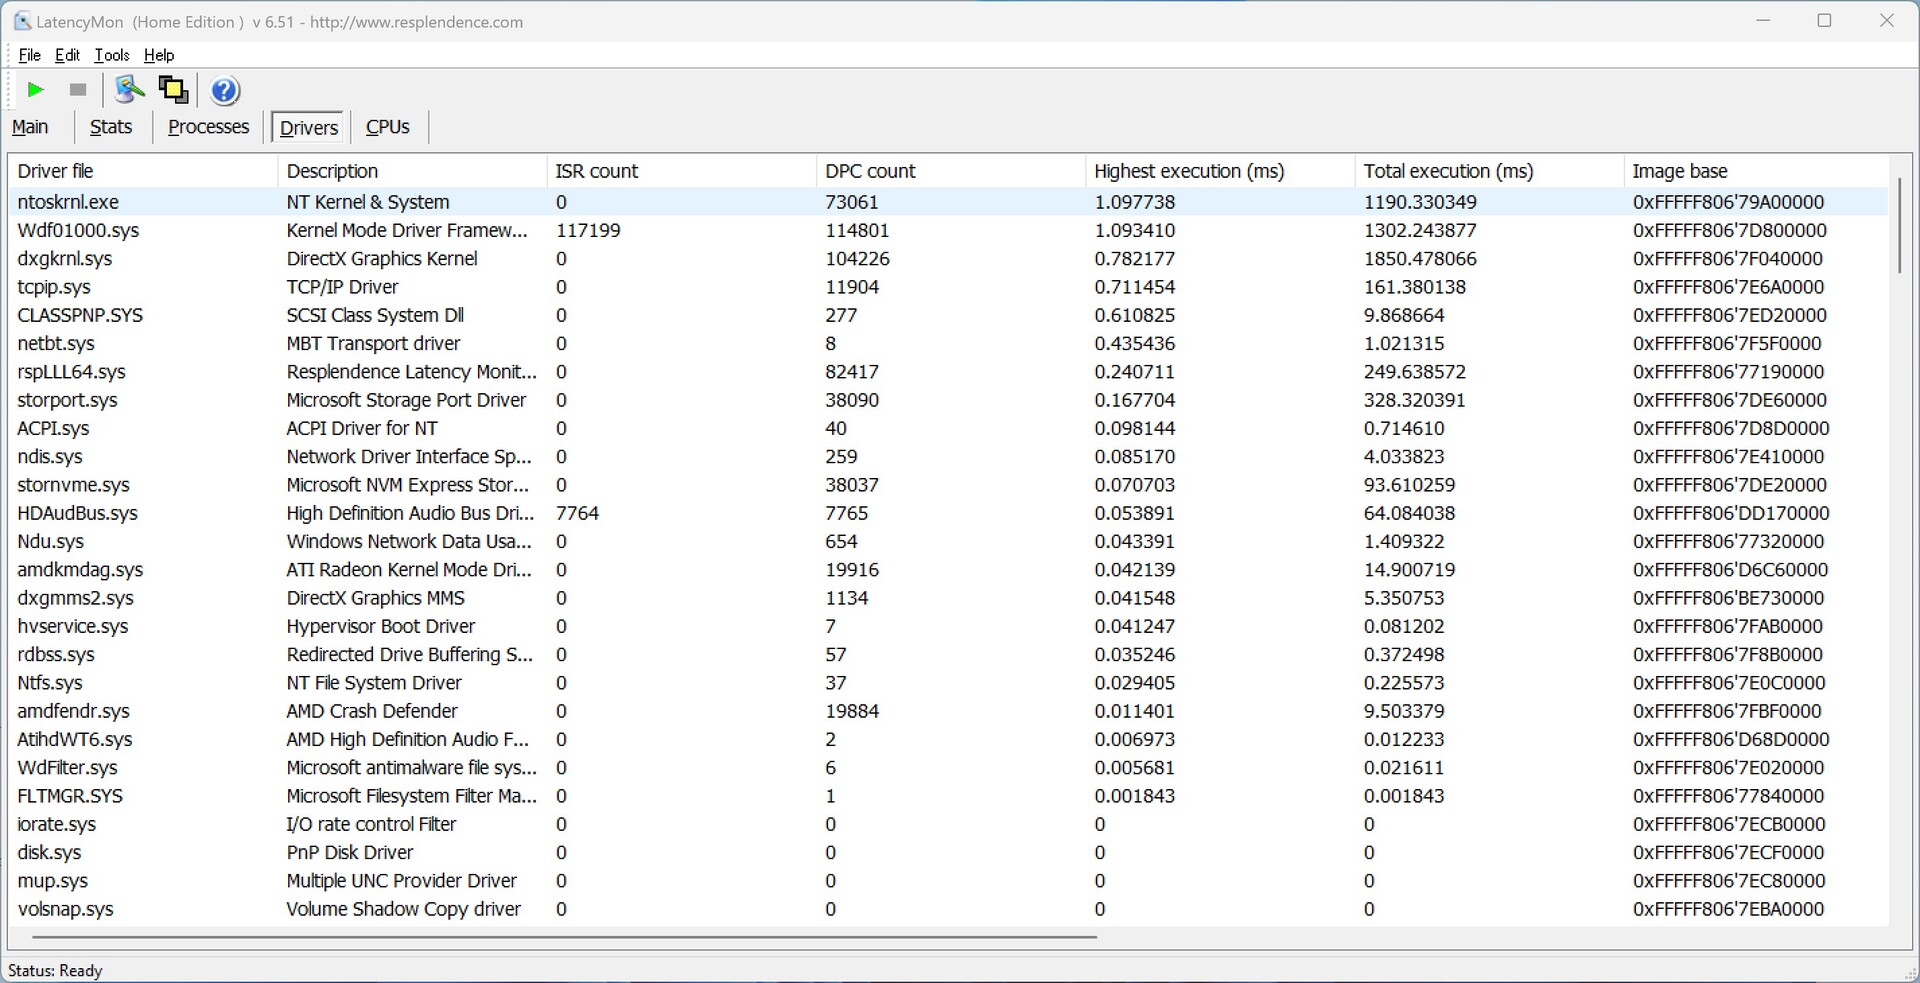
Latences DPC
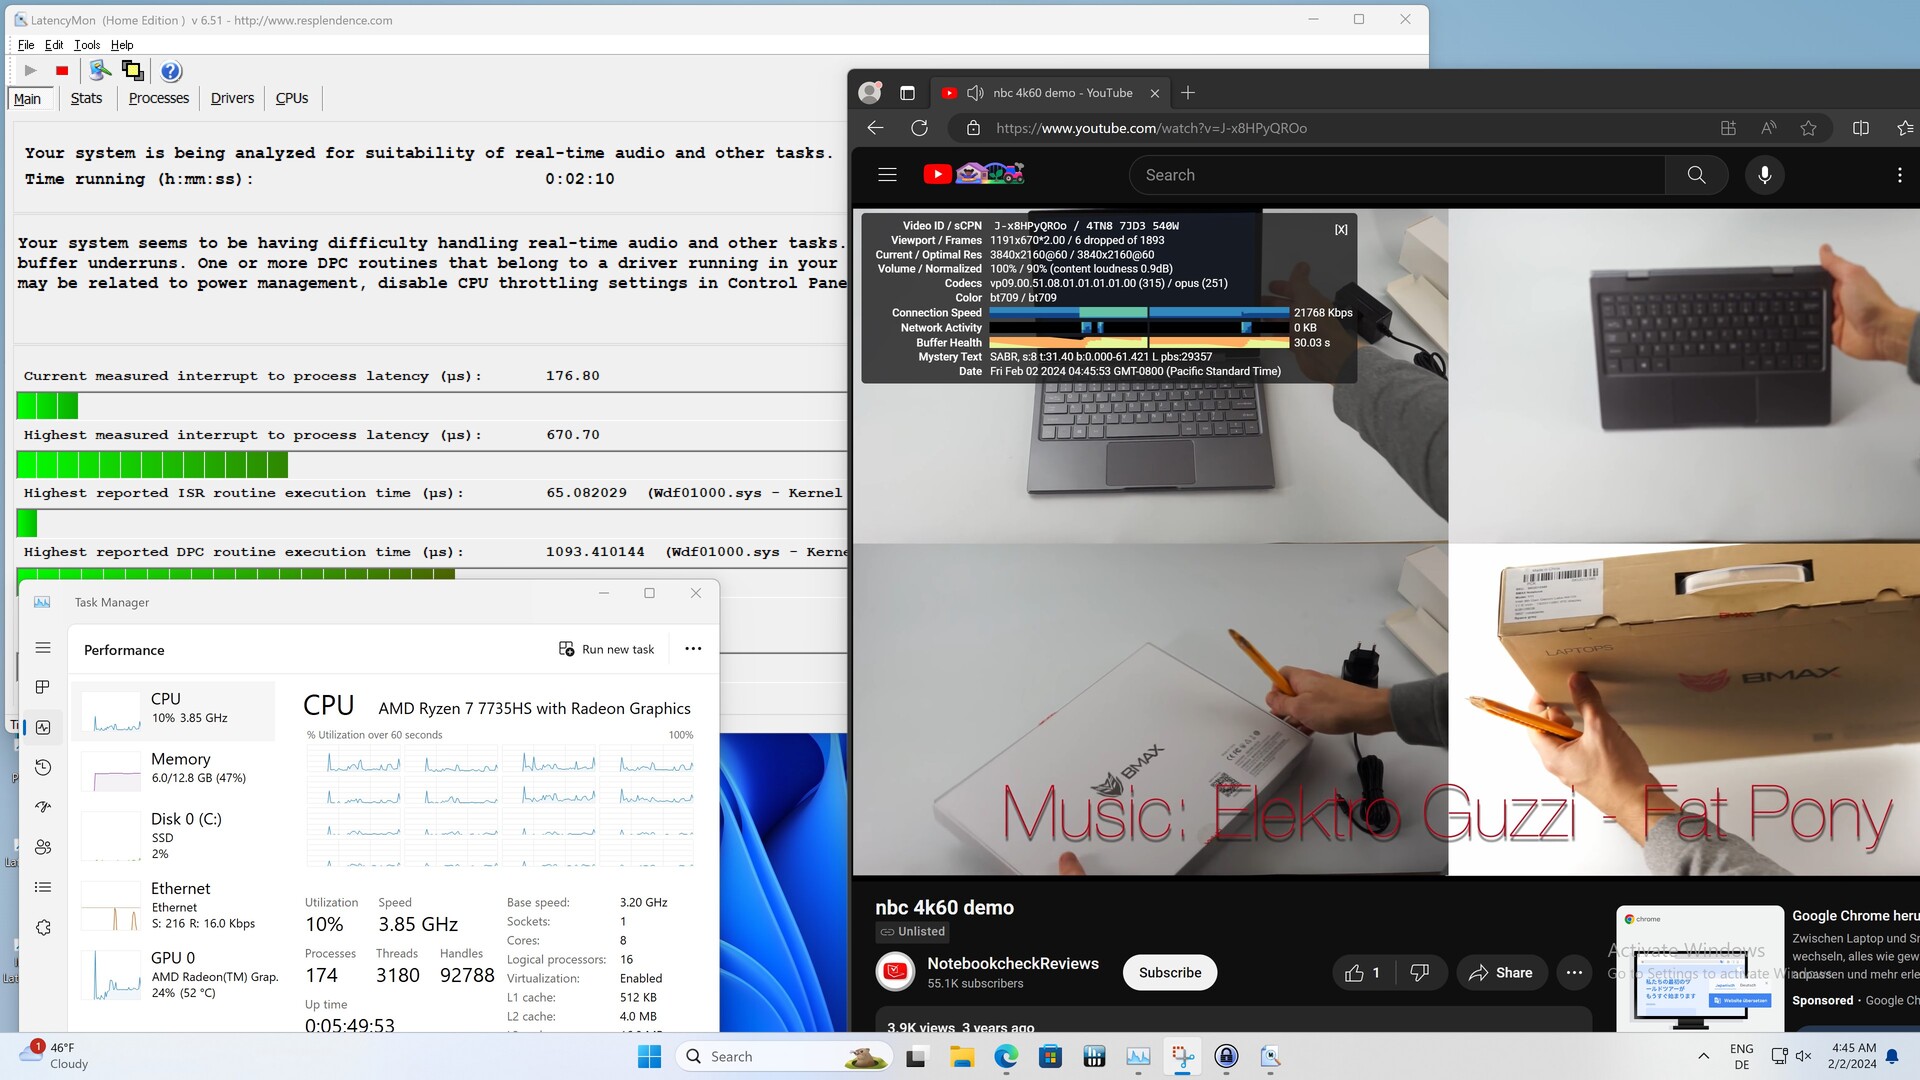
Nous avons déjà constaté une légère augmentation des temps de latence lors de l'ouverture de plusieurs onglets à l'aide du navigateur Edge. Cependant, elles n'ont pas augmenté au fur et à mesure que le test se poursuivait. Lors de la lecture de notre vidéo de test 4K, l'iGPU a été sollicité à environ 24 % de sa capacité.
| DPC Latencies / LatencyMon - interrupt to process latency (max), Web, Youtube, Prime95 | |
| Geekom AS 6, R9 6900HX | |
| Geekom A5 | |
| Minisforum Neptune Series NAD9 | |
| Maxtang MTN-FP750 | |
| NiPoGi AD08 | |
| Geekom Mini IT12 | |
| Minisforum Venus Series NAB6 | |
* ... Moindre est la valeur, meilleures sont les performances
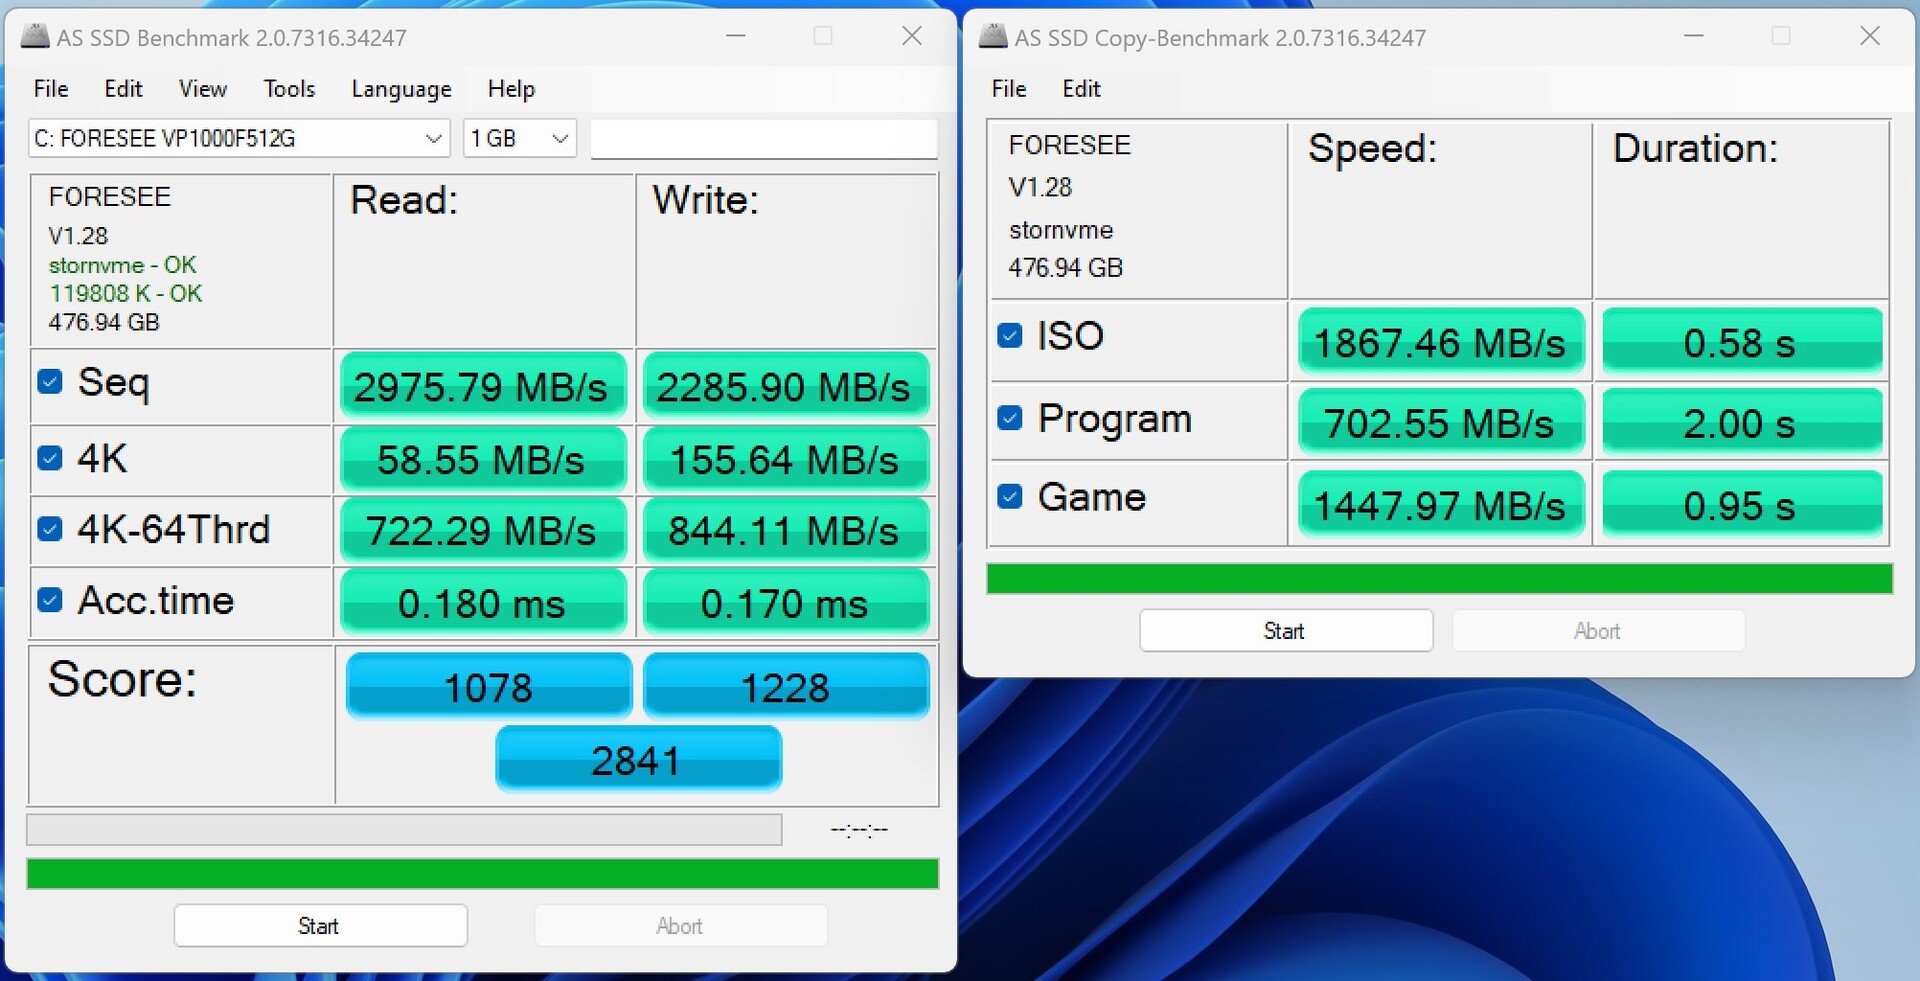
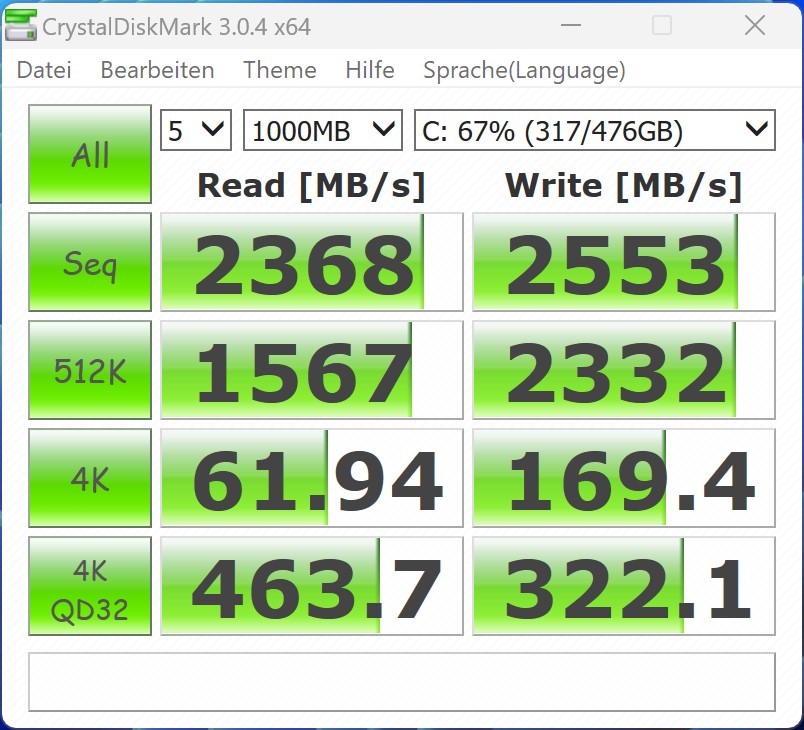
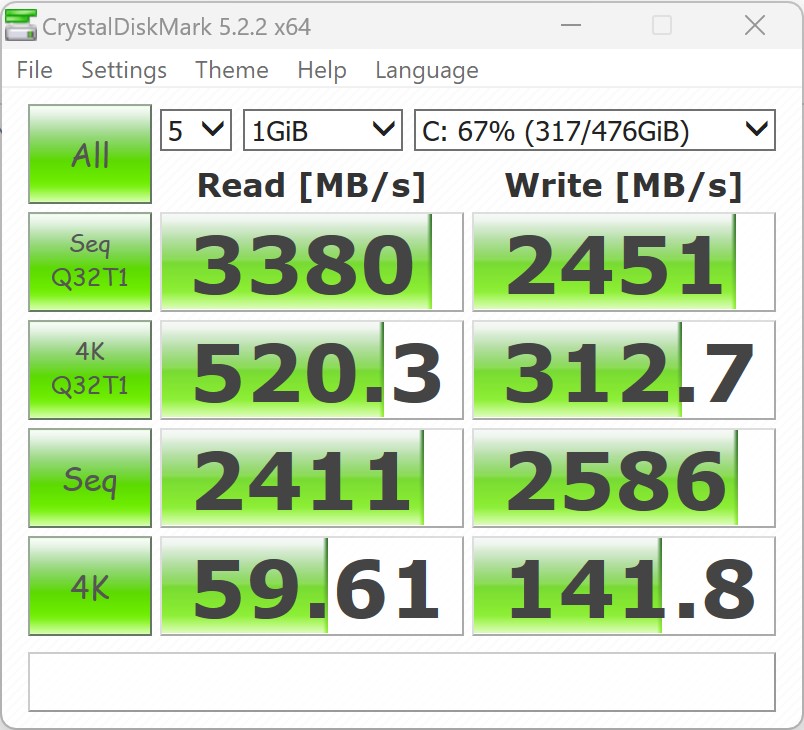
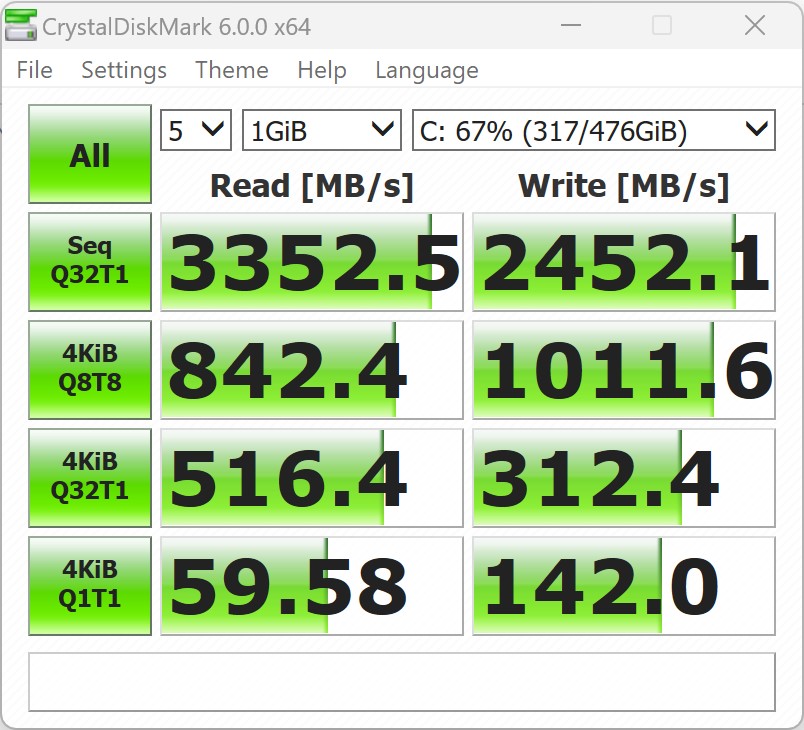
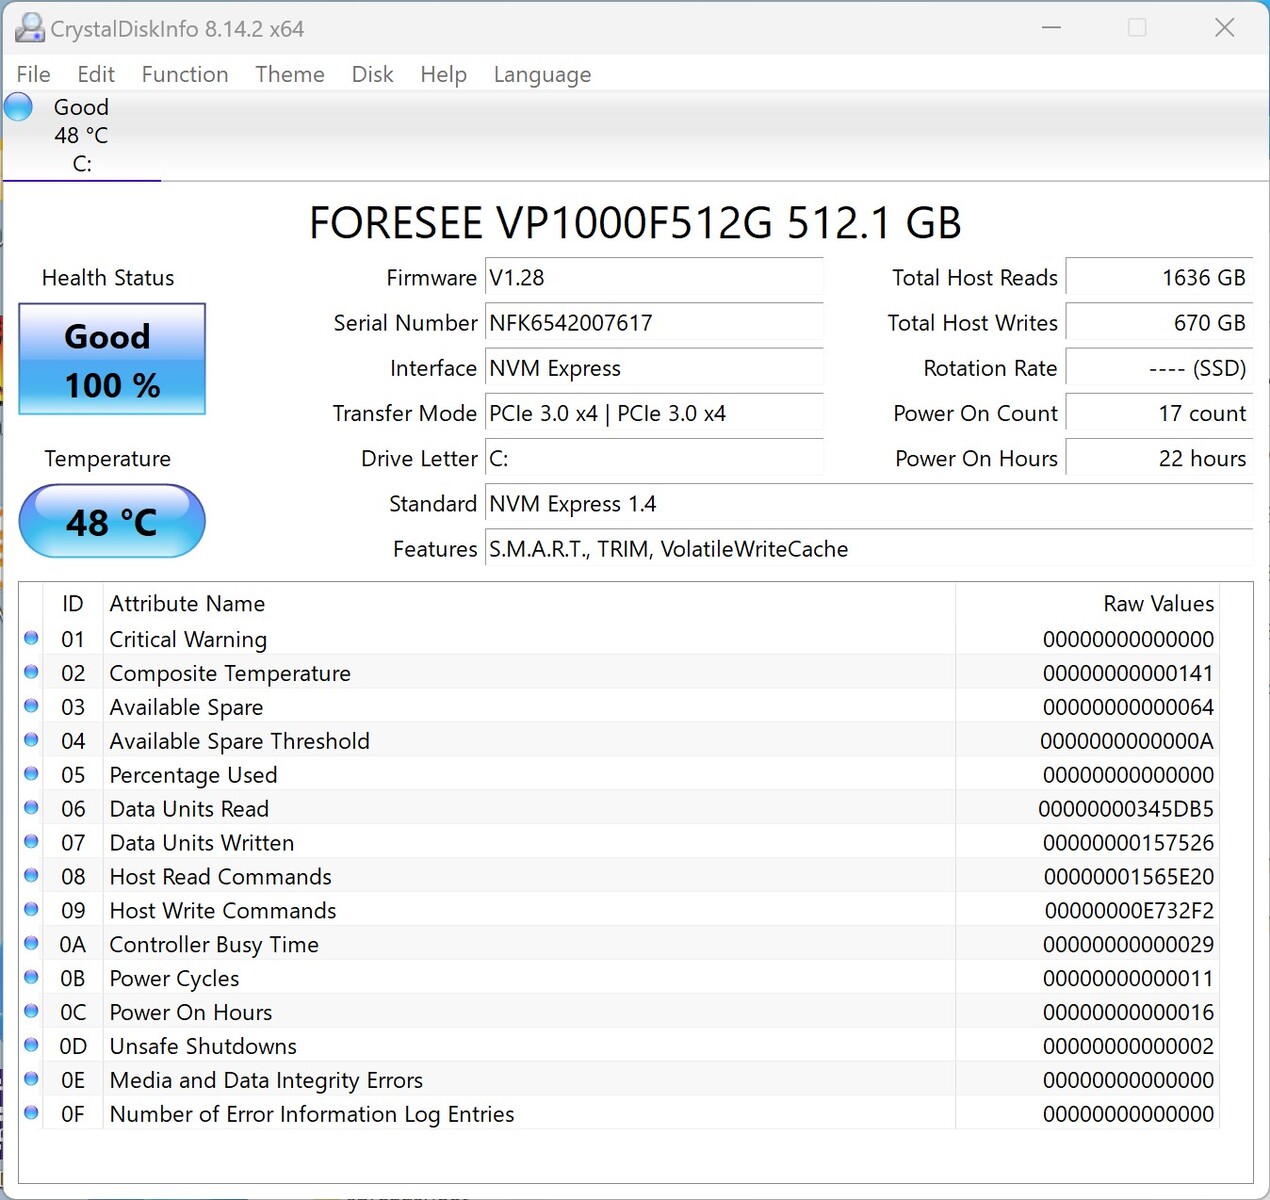
Mémoire de masse
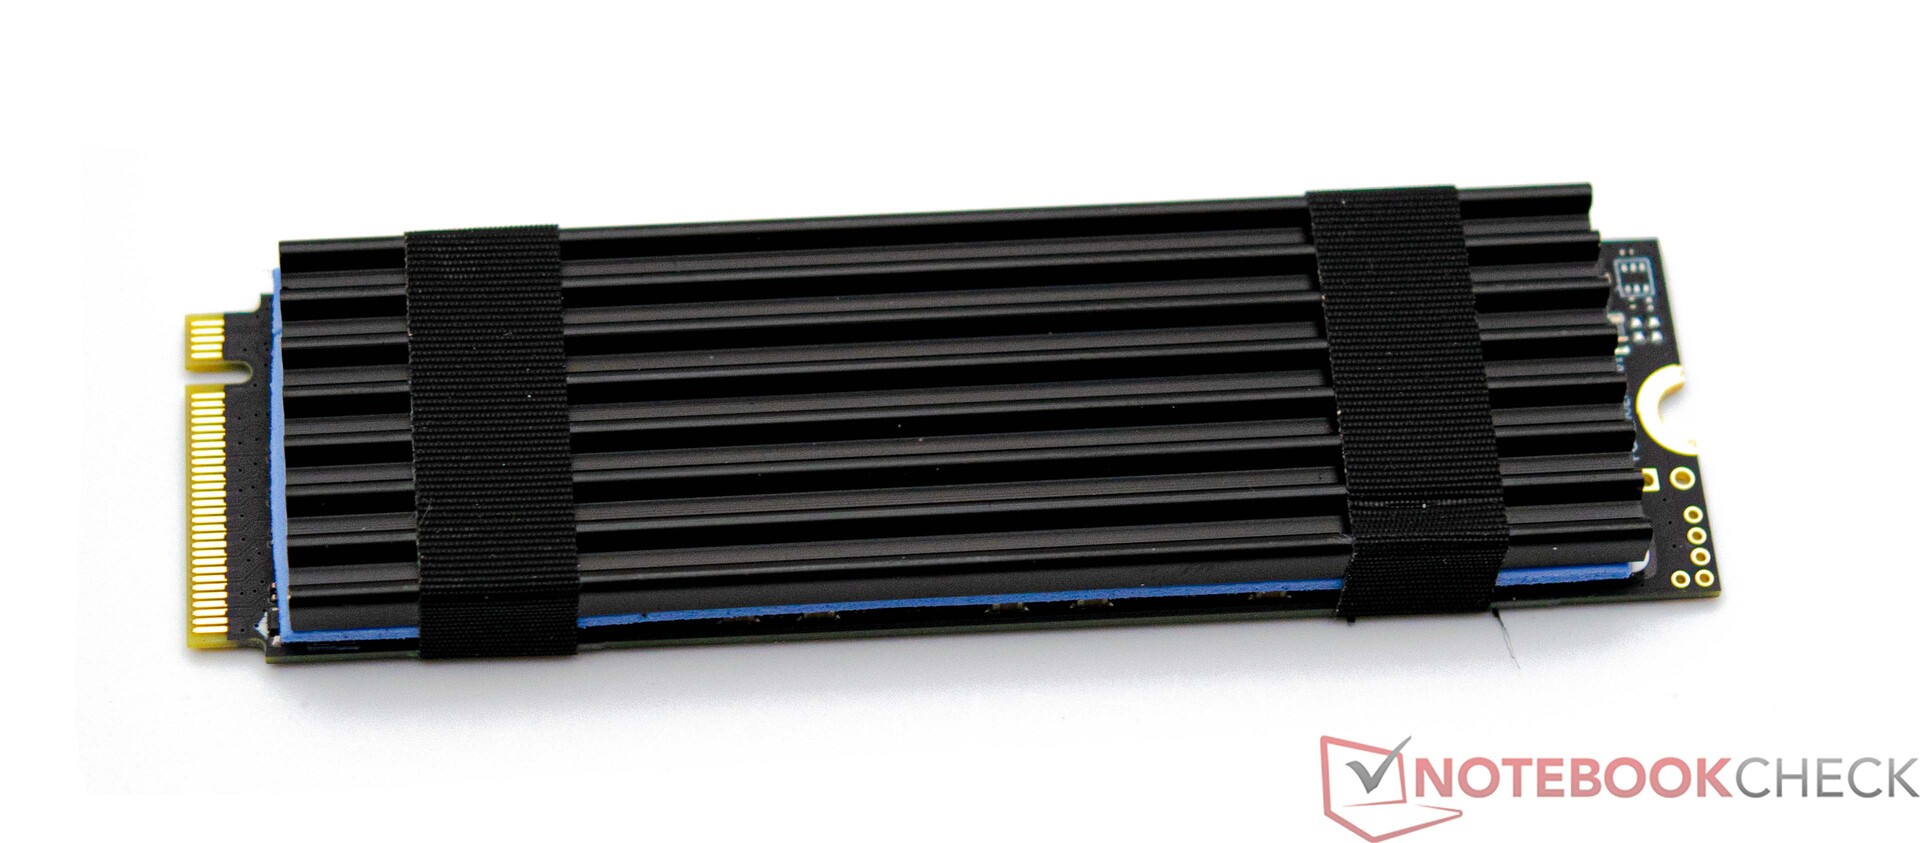
Maxtang a équipé notre échantillon MTN-FP750 d'un disque SSD Foresee de 512 Go. Le SSD PCIe 3.0 utilise l'interface M.2 avec la plus grande largeur de bande possible et n'est pas freiné artificiellement par une interface lente. Malgré cela, notre appareil de test n'a pu obtenir qu'une place en milieu de tableau. Il est possible d'installer un périphérique de stockage supplémentaire de 2,5 pouces. Consultez notre tableau de comparaison pour d'autres comparaisons et points de repère.

| Drive Performance rating - Percent | |
| Minisforum Neptune Series NAD9 | |
| Minisforum Venus Series NAB6 | |
| Moyenne de la classe Mini PC | |
| Geekom A5 | |
| NiPoGi AD08 | |
| Geekom Mini IT12 | |
| Maxtang MTN-FP750 | |
| Geekom AS 6, R9 6900HX | |
* ... Moindre est la valeur, meilleures sont les performances
Continuous Performance Read: DiskSpd Read Loop, Queue Depth 8
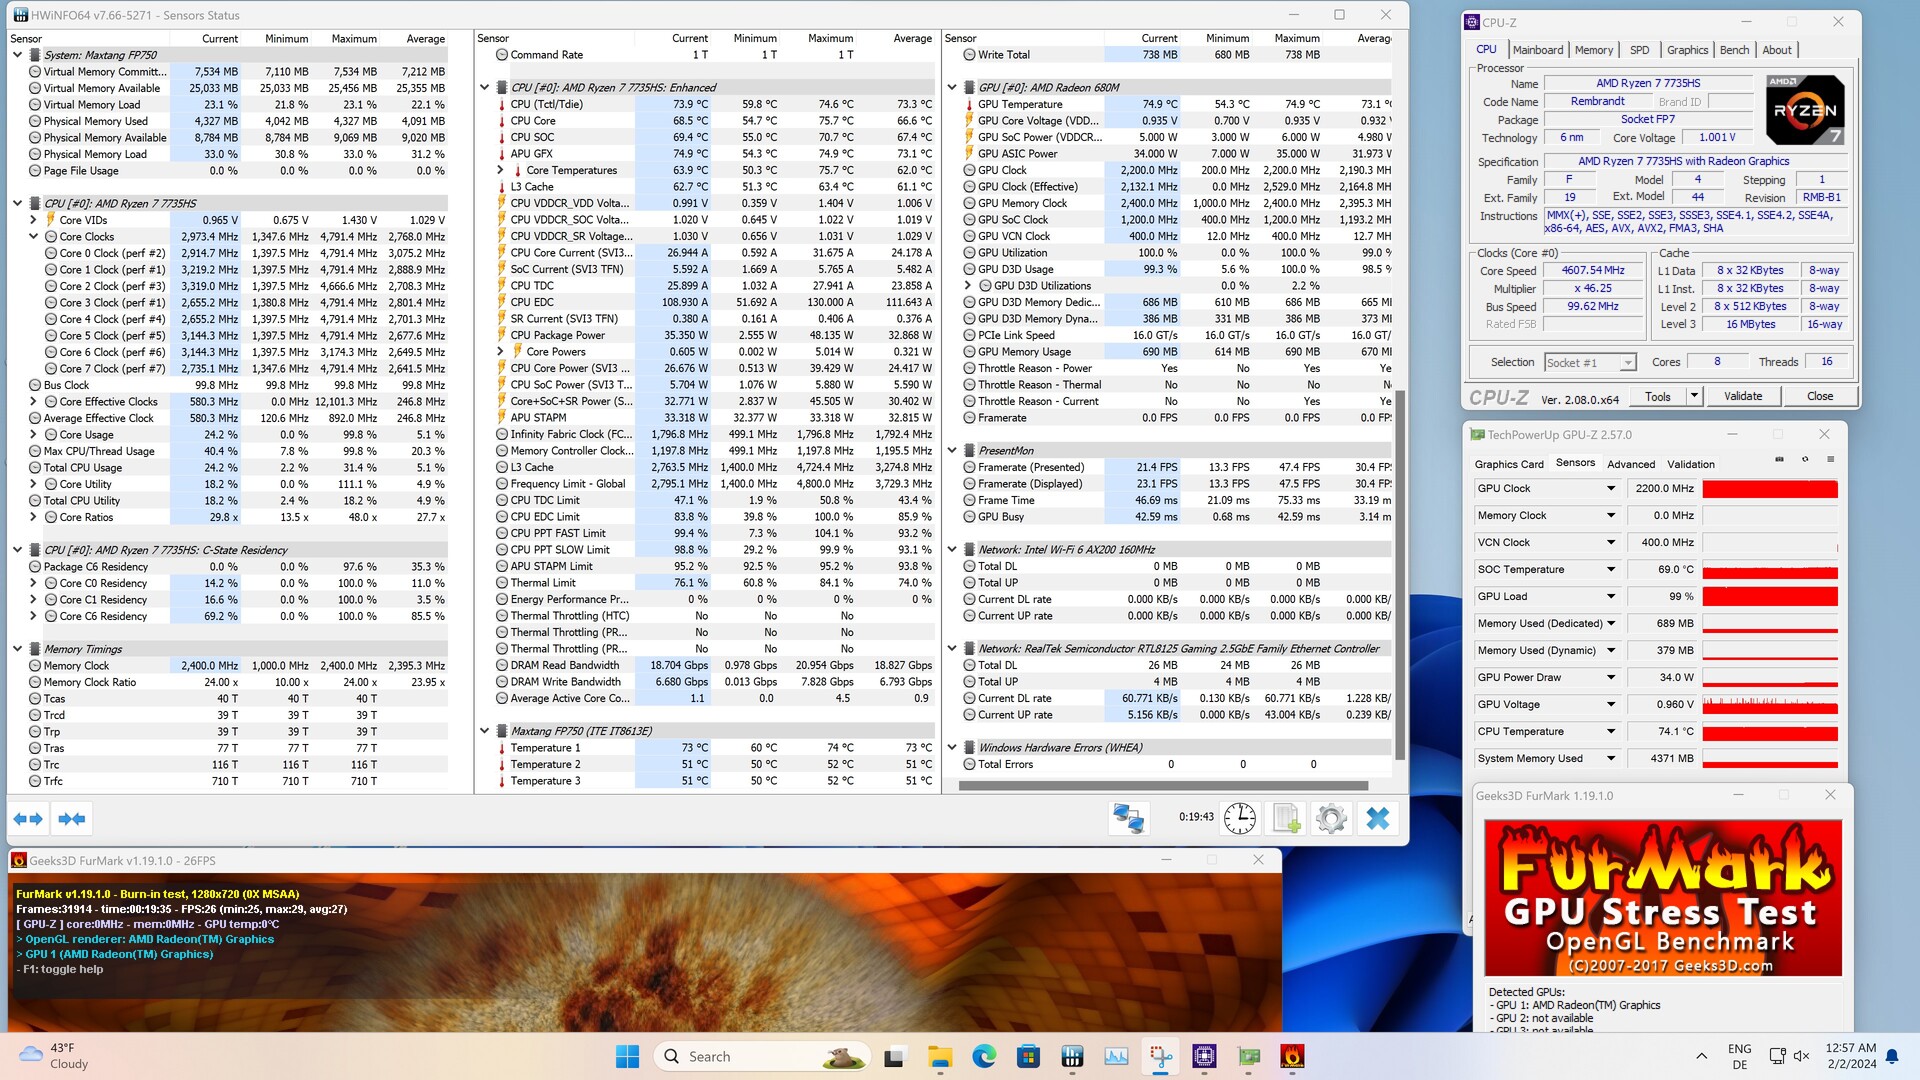
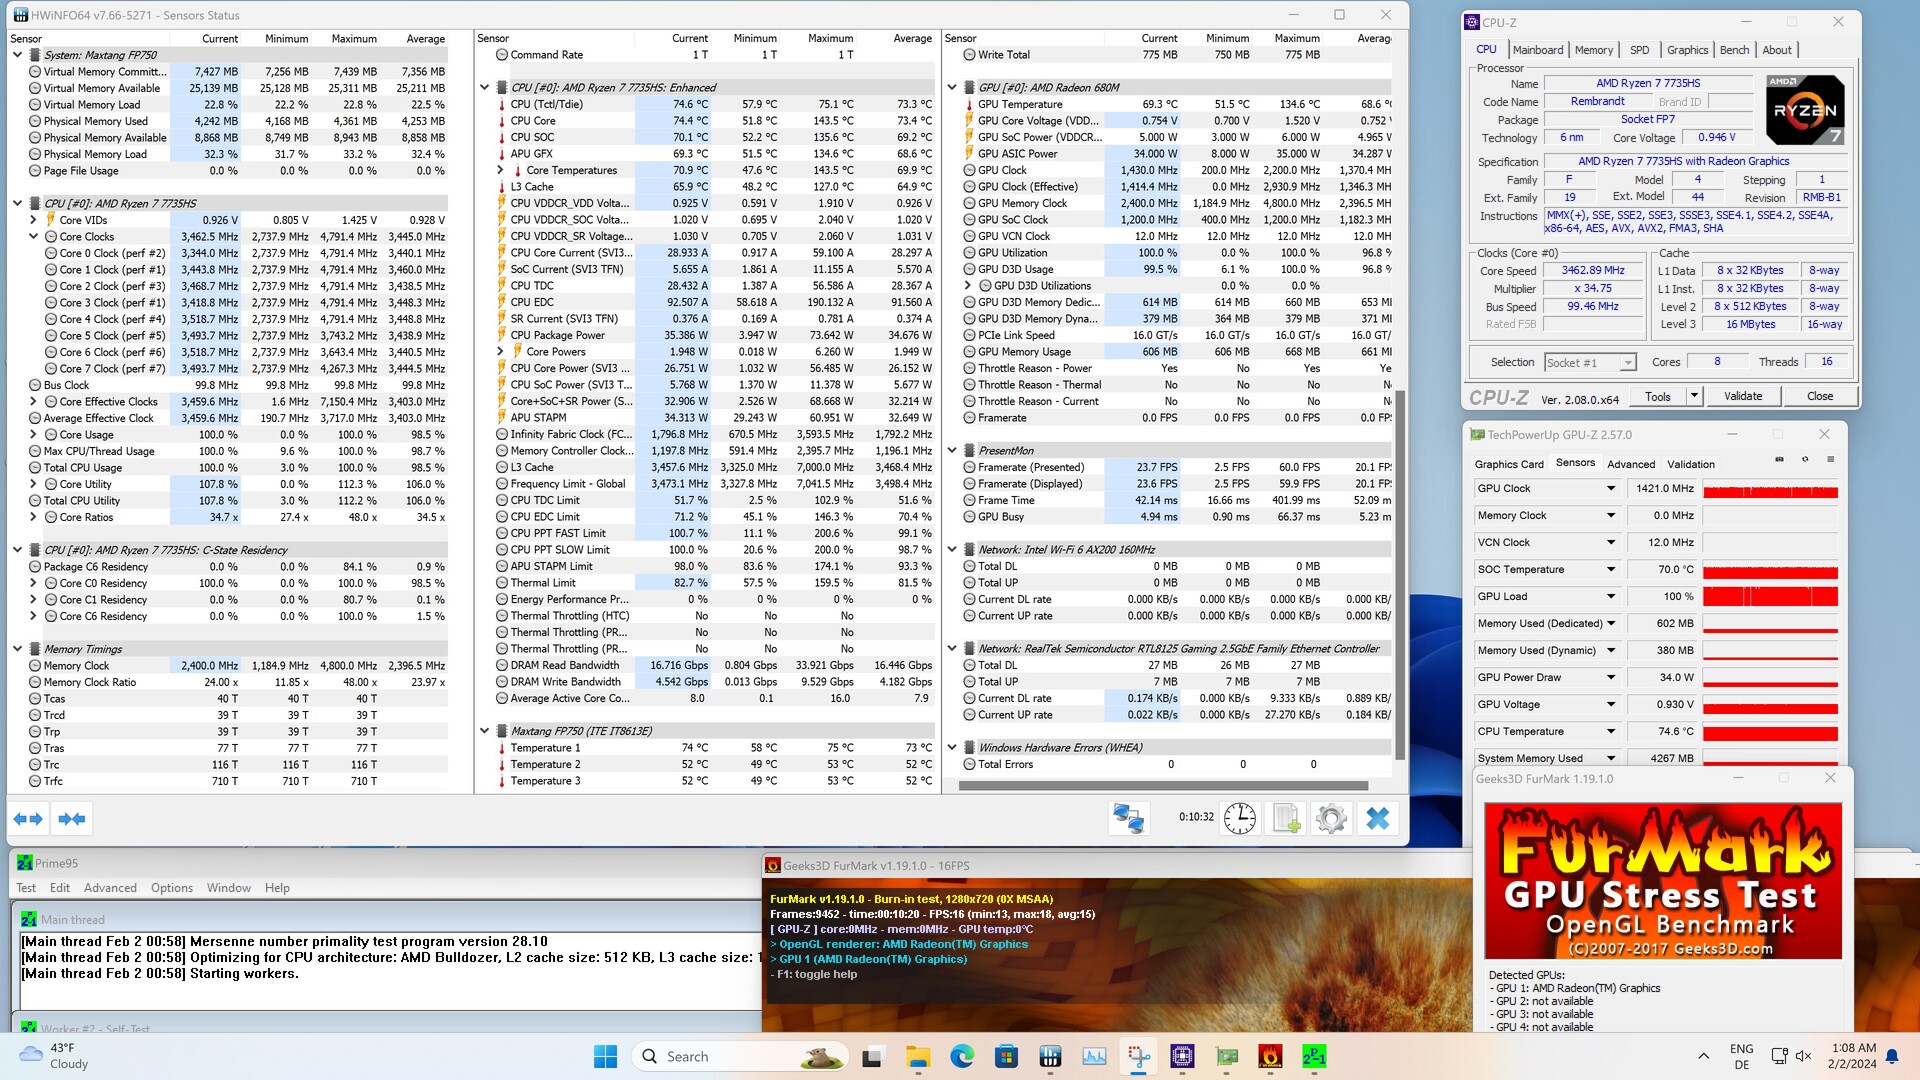
Carte graphique
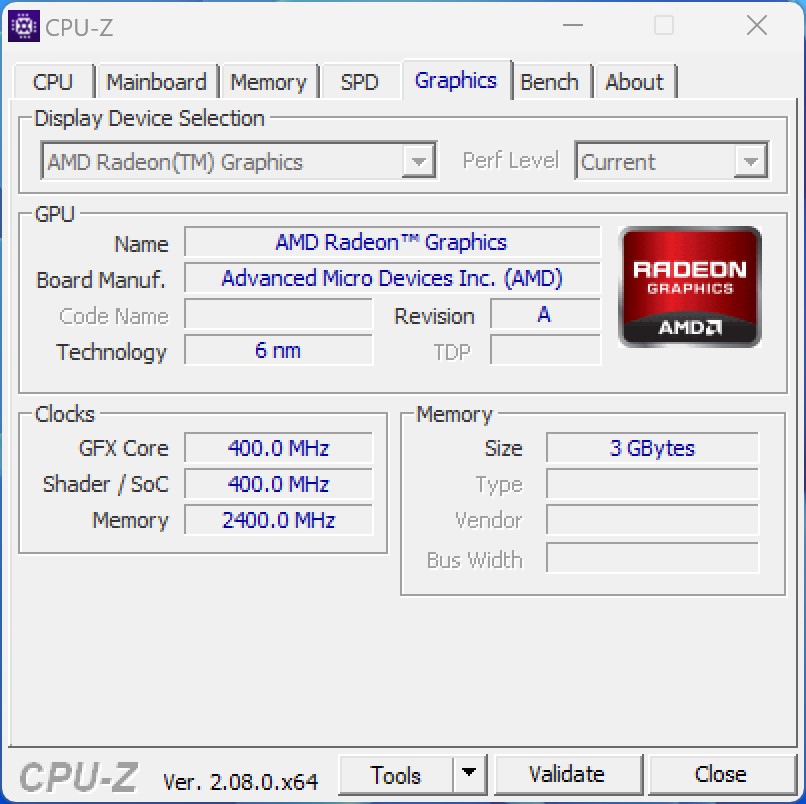
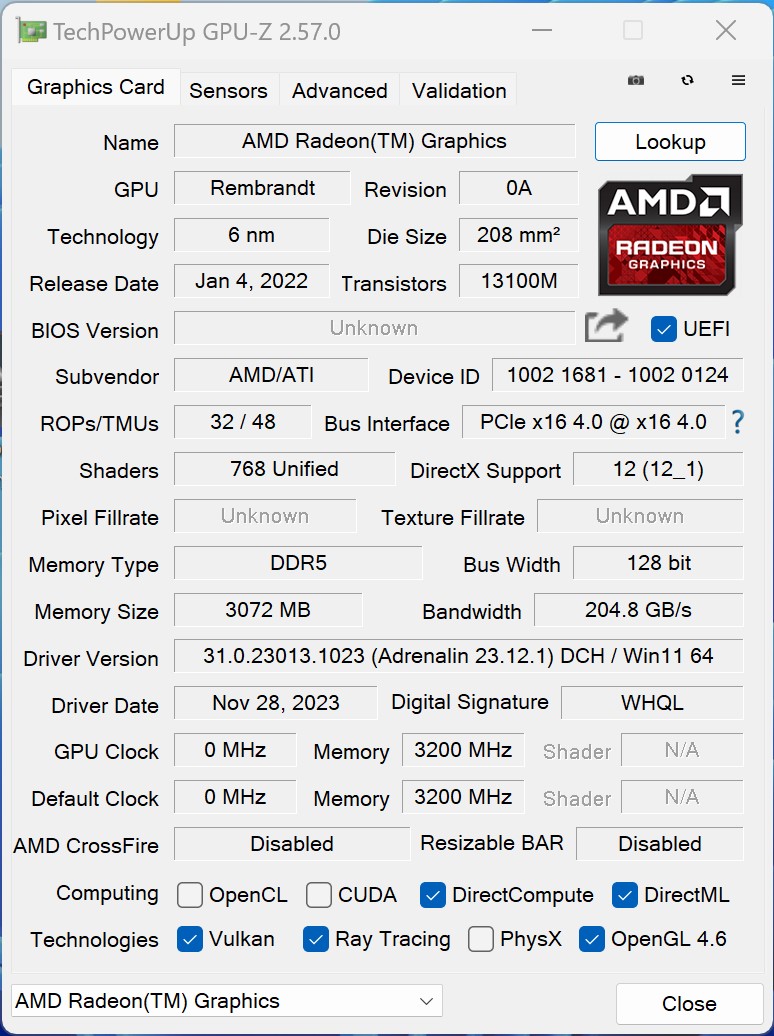
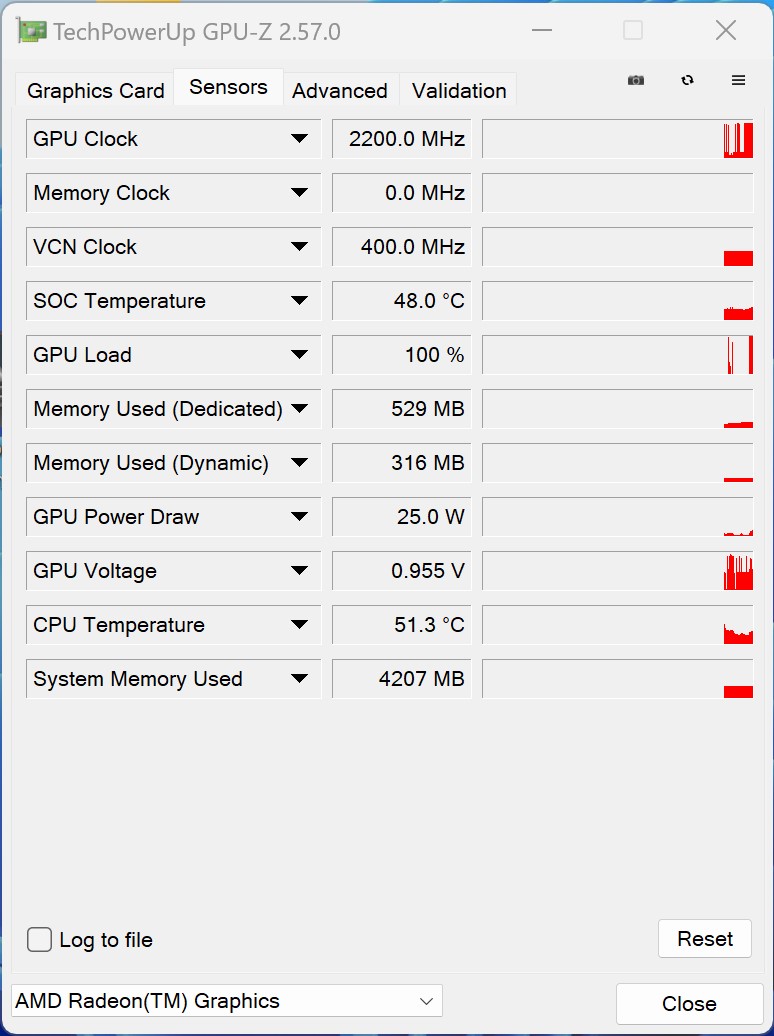
La sortie graphique est assurée par la carte AMD Radeon 680Mun iGPU qui offre de bonnes performances dans la plupart des situations. Cependant, avec le Maxtang MTN-FP750, c'est un peu différent et la raison en est la RAM installée. Le fabricant n'a équipé notre appareil d'essai que d'un seul module de mémoire vive. Dans cette configuration, la carte AMD Radeon 680M est à peine plus rapide que l'Intel Iris Xe Graphics G7 avec 96 UE. Même le Geekom A5 a le nez devant notre échantillon avec sa Radeon RX Vega 8 plus ancienne.
Pour comprendre les raisons de ces faibles performances, nous avons pris un autre module de mémoire vive dans nos réserves et nous avons effectué quelques tests de référence. Nous avons ainsi obtenu des résultats à peu près équivalents à ceux de la Geekom AS 6 ce qui fait que le Maxtang MTN-FP750 n'a rien à envier à ses concurrents.
Vous trouverez d'autres benchmarks AMD Radeon 680M ici.
| 3DMark Performance rating - Percent | |
| Moyenne AMD Radeon 680M | |
| Geekom AS 6, R9 6900HX | |
| Minisforum Neptune Series NAD9 | |
| Geekom A5 | |
| Geekom Mini IT12 | |
| Maxtang MTN-FP750 | |
| Minisforum Venus Series NAB6 | |
| NiPoGi AD08 | |
| Performance rating - Percent | |
| Geekom AS 6, R9 6900HX | |
| Geekom A5 | |
| Maxtang MTN-FP750 | |
| Minisforum Neptune Series NAD9 | |
| Geekom Mini IT12 | |
| Minisforum Venus Series NAB6 | |
| NiPoGi AD08 | |
| Unigine Valley 1.0 | |
| 1920x1080 Extreme HD DirectX AA:x8 | |
| Geekom AS 6, R9 6900HX | |
| Minisforum Neptune Series NAD9 | |
| Geekom A5 | |
| Geekom Mini IT12 | |
| Minisforum Venus Series NAB6 | |
| NiPoGi AD08 | |
| Maxtang MTN-FP750 | |
| 1920x1080 Extreme HD Preset OpenGL AA:x8 | |
| Geekom AS 6, R9 6900HX | |
| Geekom Mini IT12 | |
| Minisforum Neptune Series NAD9 | |
| Minisforum Venus Series NAB6 | |
| Geekom A5 | |
| Maxtang MTN-FP750 | |
| NiPoGi AD08 | |
| Maxtang MTN-FP750, AMD Radeon 680M R7 7735HS | Minisforum Neptune Series NAD9, Intel Iris Xe Graphics G7 96EUs i9-12900H | Geekom AS 6, R9 6900HX, AMD Radeon 680M R9 6900HX | Geekom Mini IT12, Intel Iris Xe Graphics G7 96EUs i7-1260P | Geekom A5, AMD Radeon RX Vega 8 (Ryzen 4000/5000) R7 5800H | Minisforum Venus Series NAB6, Intel UHD Graphics 64EUs (Alder Lake 12th Gen) i7-12650H | NiPoGi AD08, Intel UHD Graphics 64EUs (Alder Lake 12th Gen) i7-12650H | Moyenne de la classe Mini PC | |
|---|---|---|---|---|---|---|---|---|
| SPECviewperf 12 | -26% | 58% | -31% | 2% | -37% | -34% | 214% | |
| 1900x1060 3ds Max (3dsmax-05) (fps) | 46.9 | 40.9 -13% | 75.3 61% | 38.7 -17% | 51.7 10% | 36.2 -23% | 34.4 -27% | 153.1 ? 226% |
| 1900x1060 Catia (catia-04) (fps) | 51.5 | 41.2 -20% | 70.3 37% | 38.5 -25% | 44.2 -14% | 34.5 -33% | 30.3 -41% | 143.3 ? 178% |
| 1900x1060 Creo (creo-01) (fps) | 33.2 | 9.64 -71% | 45.2 36% | 7.52 -77% | 36.3 9% | 6.44 -81% | 21.1 -36% | 70.6 ? 113% |
| 1900x1060 Energy (energy-01) (fps) | 0.41 | 76.1 | 0.41 | 0.35 | 0.77 | 22.4 ? | ||
| 1900x1060 Maya (maya-04) (fps) | 45.2 | 39.9 -12% | 58.3 29% | 36.5 -19% | 40.3 -11% | 33.4 -26% | 32.5 -28% | 129.8 ? 187% |
| 1900x1060 Medical (medical-01) (fps) | 17.9 | 12.3 -31% | 44 146% | 11.2 -37% | 18.2 2% | 9.12 -49% | 8.41 -53% | 79.6 ? 345% |
| 1900x1060 Showcase (showcase-01) (fps) | 17.5 | 17.9 2% | 30.1 72% | 16.7 -5% | 21.7 24% | 15.9 -9% | 15.2 -13% | 82.9 ? 374% |
| 1900x1060 Solidworks (sw-03) (fps) | 72.1 | 47.2 -35% | 88.8 23% | 43.7 -39% | 68.3 -5% | 44.5 -38% | 43.4 -40% | 124.6 ? 73% |
| SPECviewperf 13 | -27% | 51% | -30% | 2% | -37% | -40% | 242% | |
| 3ds Max (3dsmax-06) (fps) | 48.3 | 40.5 -16% | 76.7 59% | 37.9 -22% | 51.6 7% | 36 -25% | 34.1 -29% | 149.4 ? 209% |
| Catia (catia-05) (fps) | 73.9 | 59.4 -20% | 105 42% | 56.3 -24% | 62.1 -16% | 49.6 -33% | 43.2 -42% | 199.8 ? 170% |
| Creo (creo-02) (fps) | 44.9 | 38.8 -14% | 78.4 75% | 36.8 -18% | 50.6 13% | 33 -27% | 33.1 -26% | 165.6 ? 269% |
| Energy (energy-02) (fps) | 11.4 | 4.27 -63% | 13.9 22% | 4.29 -62% | 10.6 -7% | 2.82 -75% | 2.62 -77% | 41 ? 260% |
| Maya (maya-05) (fps) | 58.3 | 44.2 -24% | 99 70% | 42.9 -26% | 56.5 -3% | 38.2 -34% | 41.3 -29% | 205 ? 252% |
| Medical (medical-02) (fps) | 32.8 | 14.5 -56% | 44.9 37% | 14 -57% | 31 -5% | 10.9 -67% | 8.63 -74% | 148.7 ? 353% |
| Showcase (showcase-02) (fps) | 17.4 | 17.9 3% | 30.4 75% | 16.8 -3% | 21.5 24% | 15.7 -10% | 15.1 -13% | 79.1 ? 355% |
| Solidworks (sw-04) (fps) | 72.9 | 55.8 -23% | 95 30% | 54.1 -26% | 72.4 -1% | 53.9 -26% | 51.9 -29% | 125 ? 71% |
| SPECviewperf 2020 | -35% | 84% | -24% | 2% | -43% | 298% | ||
| 3840x2160 Medical (medical-03) (fps) | 4.72 | 2.57 -46% | 8.59 82% | 3.37 -29% | 4.82 2% | 2.54 -46% | 22.9 ? 385% | |
| 3840x2160 Energy (energy-03) (fps) | 6.6 | 3.02 -54% | 16.9 156% | 7.39 12% | 5.33 -19% | 1.9 -71% | 33.8 ? 412% | |
| 3840x2160 Creo (creo-03) (fps) | 17.5 | 15.3 -13% | 28.9 65% | 15.1 -14% | 19.1 9% | 12.7 -27% | 50.3 ? 187% | |
| 3840x2160 CATIA (catia-06) (fps) | 13.1 | 8.2 -37% | 20.4 56% | 8.23 -37% | 13.1 0% | 7.63 -42% | 35.1 ? 168% | |
| 3840x2160 3ds Max (3dsmax-07) (fps) | 9.26 | 9.67 4% | 17.5 89% | 9.65 4% | 11.3 22% | 8.65 -7% | 54.8 ? 492% | |
| 3840x2160 Siemens NX (snx-04) (fps) | 33 | 6.69 -80% | 58.5 77% | 6.23 -81% | 38 15% | 6.61 -80% | 53.9 ? 63% | |
| 3840x2160 Maya (maya-06) (fps) | 29.5 | 24 -19% | 47.4 61% | 23.7 -20% | 25.8 -13% | 21.2 -28% | 141.1 ? 378% | |
| Moyenne finale (programmes/paramètres) | -29% /
-29% | 64% /
64% | -28% /
-28% | 2% /
2% | -39% /
-39% | -37% /
-37% | 251% /
251% |
| 3DMark 06 Score 1366x768 | 25274 points | |
| 3DMark Vantage P Result | 24874 points | |
| 3DMark 11 Performance | 6723 points | |
| 3DMark Ice Storm Standard Score | 127954 points | |
| 3DMark Cloud Gate Standard Score | 21960 points | |
| 3DMark Fire Strike Score | 4002 points | |
| 3DMark Fire Strike Extreme Score | 2090 points | |
| 3DMark Time Spy Score | 1591 points | |
Aide | ||
Performances des jeux
Le Maxtang MTN-FP750 que nous avons testé n'est que peu adapté au jeu. La carte AMD Radeon 680M, relativement puissante, ne parvient pas à délivrer toute sa puissance. C'est pourquoi nous recommandons l'installation de deux modules de mémoire vive pour obtenir des performances optimales. Vous trouverez une indication approximative des performances de jeu dans le tableau suivant Geekom AS 6.
Pour d'autres comparaisons et benchmarks, consultez notre Liste des jeux GPU.
| The Witcher 3 | |
| 1024x768 Low Graphics & Postprocessing | |
| Geekom AS 6, R9 6900HX | |
| Minisforum Neptune Series NAD9 | |
| Geekom Mini IT12 | |
| Geekom A5 | |
| Minisforum Venus Series NAB6 | |
| NiPoGi AD08 | |
| Maxtang MTN-FP750 | |
| 1920x1080 High Graphics & Postprocessing (Nvidia HairWorks Off) | |
| Geekom AS 6, R9 6900HX | |
| Minisforum Neptune Series NAD9 | |
| NiPoGi AD08 | |
| Geekom Mini IT12 | |
| Minisforum Venus Series NAB6 | |
| Geekom A5 | |
| Maxtang MTN-FP750 | |
| Borderlands 3 | |
| 1280x720 Very Low Overall Quality (DX11) | |
| Geekom A5 | |
| Geekom AS 6, R9 6900HX | |
| Minisforum Neptune Series NAD9 | |
| Maxtang MTN-FP750 | |
| Geekom Mini IT12 | |
| Minisforum Venus Series NAB6 | |
| NiPoGi AD08 | |
| 1920x1080 High Overall Quality (DX11) | |
| Geekom AS 6, R9 6900HX | |
| Geekom A5 | |
| Minisforum Neptune Series NAD9 | |
| Maxtang MTN-FP750 | |
| Geekom Mini IT12 | |
| Minisforum Venus Series NAB6 | |
| NiPoGi AD08 | |
| GTA V | |
| 1024x768 Lowest Settings possible | |
| Geekom A5 | |
| Minisforum Neptune Series NAD9 | |
| Minisforum Venus Series NAB6 | |
| Geekom AS 6, R9 6900HX | |
| Geekom Mini IT12 | |
| NiPoGi AD08 | |
| Maxtang MTN-FP750 | |
| 1920x1080 High/On (Advanced Graphics Off) AA:2xMSAA + FX AF:8x | |
| Geekom AS 6, R9 6900HX | |
| Geekom A5 | |
| Maxtang MTN-FP750 | |
| Minisforum Neptune Series NAD9 | |
| Geekom Mini IT12 | |
| Minisforum Venus Series NAB6 | |
| NiPoGi AD08 | |
| Bas | Moyen | Élevé | Ultra | |
|---|---|---|---|---|
| GTA V (2015) | 95.5 | 85.7 | 28.2 | 12.7 |
| The Witcher 3 (2015) | 73 | 46.7 | 23.7 | 14.9 |
| Dota 2 Reborn (2015) | 115.8 | 87.4 | 60.5 | 53.1 |
| Final Fantasy XV Benchmark (2018) | 39.2 | 20.5 | 14.6 | |
| X-Plane 11.11 (2018) | 49.8 | 39.8 | 33.8 | |
| Far Cry 5 (2018) | 46 | 25 | 22 | 21 |
| Strange Brigade (2018) | 78.4 | 31.4 | 26.7 | 23.1 |
| Shadow of the Tomb Raider (2018) | 53.3 | 21.8 | 19.8 | 16.4 |
| Far Cry New Dawn (2019) | 40 | 23 | 21 | 20 |
| Metro Exodus (2019) | 43.1 | 17.6 | 13.8 | 11.7 |
| Borderlands 3 (2019) | 58.2 | 24.8 | 15.7 | 12.5 |
| F1 2020 (2020) | 96.9 | 49.8 | 39.1 | 27.5 |
| F1 2021 (2021) | 97 | 49.8 | 36.4 | 16.7 |
| God of War (2022) | 19.5 | 15.9 | 11.7 | |
| GRID Legends (2022) | 58.2 | 45 | 34.2 | 26.6 |
| Tiny Tina's Wonderlands (2022) | 37.7 | 28.2 | 20.2 | 16.2 |
| F1 22 (2022) | 45.6 | 40.6 | 32.1 | 9.25 |
| F1 23 (2023) | 45.3 | 40.1 | 29.1 | |
| Total War Pharaoh (2023) | 43.3 | 33.3 | 21.6 | 16.9 |
| Prince of Persia The Lost Crown (2024) | 89.3 | 58.8 | 58.4 |
Émissions - Économiques mais pas inaudibles
Émissions sonores
Sans être souligné, le Maxtang MTN-FP750 est, la plupart du temps, silencieux. Cependant, en charge, nous avons rapidement atteint 45 dB(A) et nous n'avons pu discerner qu'une différence minime entre la charge moyenne et la charge maximale. Mais nous pouvons considérer qu'il s'agit d'une tolérance de mesure. Il est dommage qu'il n'y ait que deux niveaux de ventilation. Un coup d'oeil au tableau montre que les deux Geekom A5 et le NiPoGi AD08 étaient encore plus bruyants dans le même scénario.
Degré de la nuisance sonore
| Au repos |
| 25.3 / 25.3 / 25.4 dB(A) |
| Fortement sollicité |
| 45.1 / 45.3 dB(A) |
 | ||
30 dB silencieux 40 dB(A) audible 50 dB(A) bruyant |
||
min: | ||
| Maxtang MTN-FP750 R7 7735HS, Radeon 680M | Minisforum Neptune Series NAD9 i9-12900H, Iris Xe G7 96EUs | Geekom AS 6, R9 6900HX R9 6900HX, Radeon 680M | Geekom Mini IT12 i7-1260P, Iris Xe G7 96EUs | Geekom A5 R7 5800H, Vega 8 | Minisforum Venus Series NAB6 i7-12650H, UHD Graphics 64EUs | NiPoGi AD08 i7-12650H, UHD Graphics 64EUs | |
|---|---|---|---|---|---|---|---|
| Noise | -3% | -14% | -3% | -7% | -4% | -14% | |
| arrêt / environnement * (dB) | 25 | 30.2 -21% | 30 -20% | 29.8 -19% | 25 -0% | 29.4 -18% | 25 -0% |
| Idle Minimum * (dB) | 25.3 | 30.5 -21% | 33.2 -31% | 29.9 -18% | 28.2 -11% | 29.4 -16% | 31.1 -23% |
| Idle Average * (dB) | 25.3 | 30.5 -21% | 33.6 -33% | 30.1 -19% | 28.2 -11% | 29.5 -17% | 31.2 -23% |
| Idle Maximum * (dB) | 25.4 | 30.5 -20% | 33.6 -32% | 30.2 -19% | 28.2 -11% | 29.7 -17% | 31.3 -23% |
| Load Average * (dB) | 45.1 | 30.5 32% | 36.8 18% | 32.1 29% | 47.8 -6% | 34.6 23% | 51.7 -15% |
| Load Maximum * (dB) | 45.3 | 30.5 33% | 39.8 12% | 32.5 28% | 47.4 -5% | 36.1 20% | 45.8 -1% |
* ... Moindre est la valeur, meilleures sont les performances
Température
Le boîtier du Maxtang MTN-FP750 ne chauffe que très peu, que ce soit au repos ou en charge. Nous avons observé un point chaud sur la partie supérieure de l'appareil, qui n'a pas dépassé les 40 °C, tandis que la partie inférieure n'a même pas atteint les 35 °C. Cependant, le SoC se réchauffe considérablement, même si, à près de 80 °C, nous étions encore dans la zone verte. De plus, le fabricant a fixé une température maximale de 90 °C dans le BIOS. Nous n'avons pas réussi à atteindre cette température avec la limite de puissance prédéfinie de 35 watts.
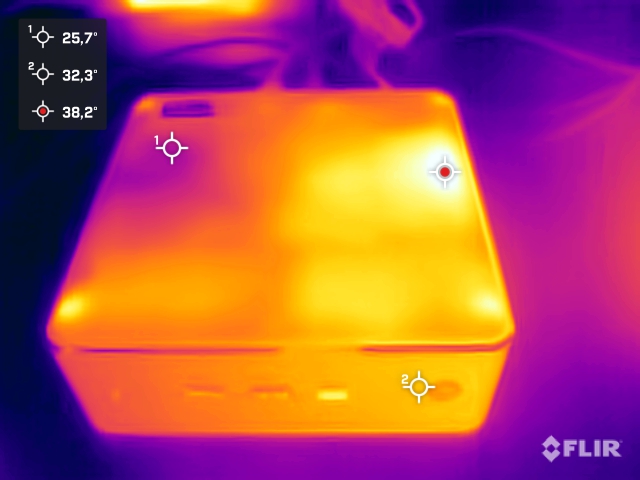
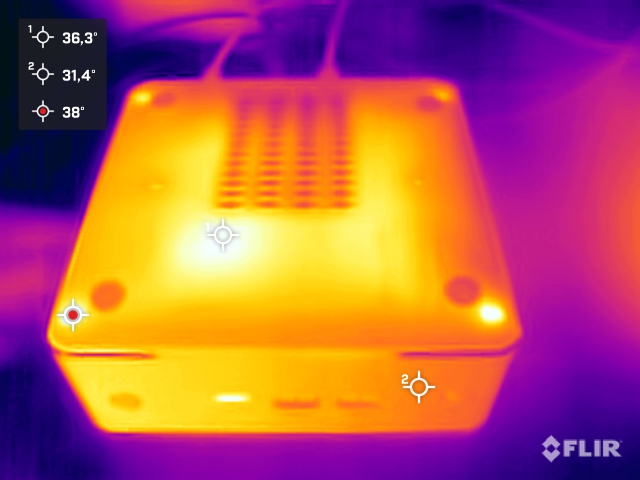
(+) La température maximale du côté supérieur est de 39.7 °C / 103 F, par rapport à la moyenne de 35.4 °C / 96 F, allant de 20.6 à 69.5 °C pour la classe Mini PC.
(+) Le fond chauffe jusqu'à un maximum de 34.3 °C / 94 F, contre une moyenne de 36.1 °C / 97 F
(+) En utilisation inactive, la température moyenne du côté supérieur est de 29.4 °C / 85 F, par rapport à la moyenne du dispositif de 32.1 °C / 90 F.
Consommation électrique
Dans notre comparaison, le Maxtang MTN-FP750 fait partie des appareils les plus économiques. En mode veille, nous avons déjà enregistré une très faible consommation d'énergie de seulement 7 à 8,4 watts. Seuls le Geekom A5 et le Geekom Mini IT12 peuvent suivre le rythme avec des scores aussi bas. En charge, notre échantillon est resté relativement économe, notre appareil de mesure enregistrant un pic de seulement 61,4 watts. Si l'on considère les limites de puissance du processeur, il ne s'agit pas d'une consommation d'énergie particulièrement surprenante en charge.
Cela signifie que le bloc d'alimentation de 90 watts n'a aucun problème à fournir suffisamment d'énergie au mini-PC. Le bloc d'alimentation peut même gérer sans problème le réglage manuel de la consommation d'énergie.

| Éteint/en veille | |
| Au repos | |
| Fortement sollicité |
|
Légende:
min: | |
| Maxtang MTN-FP750 R7 7735HS, Radeon 680M | Minisforum Neptune Series NAD9 i9-12900H, Iris Xe G7 96EUs | Geekom AS 6, R9 6900HX R9 6900HX, Radeon 680M | Geekom Mini IT12 i7-1260P, Iris Xe G7 96EUs | Geekom A5 R7 5800H, Vega 8 | Minisforum Venus Series NAB6 i7-12650H, UHD Graphics 64EUs | NiPoGi AD08 i7-12650H, UHD Graphics 64EUs | Moyenne AMD Radeon 680M | Moyenne de la classe Mini PC | |
|---|---|---|---|---|---|---|---|---|---|
| Power Consumption | -73% | -23% | -2% | -12% | -50% | -107% | -10% | -46% | |
| Idle Minimum * (Watt) | 7 | 12.1 -73% | 6.8 3% | 5 29% | 6.9 1% | 10.4 -49% | 14.2 -103% | 6.93 ? 1% | 8.81 ? -26% |
| Idle Average * (Watt) | 8.1 | 13 -60% | 9.4 -16% | 7 14% | 7.9 2% | 12.3 -52% | 15.1 -86% | 8.98 ? -11% | 11 ? -36% |
| Idle Maximum * (Watt) | 8.4 | 18.2 -117% | 13.7 -63% | 10.7 -27% | 8.9 -6% | 12.4 -48% | 28.7 -242% | 10.5 ? -25% | 13.9 ? -65% |
| Load Average * (Watt) | 54.2 | 70.6 -30% | 45.3 16% | 50.3 7% | 60.8 -12% | 72.9 -35% | 76.9 -42% | 53.5 ? 1% | 64.5 ? -19% |
| Load Maximum * (Watt) | 61.4 | 113 -84% | 94.8 -54% | 82 -34% | 89.7 -46% | 101.2 -65% | 100.2 -63% | 70.5 ? -15% | 113.1 ? -84% |
* ... Moindre est la valeur, meilleures sont les performances
Power consumption with an external monitor
Points positifs
Points négatifs
Verdict - De meilleures performances, mais seulement après optimisation
Le Maxtang MTN-FP750 est un mini PC relativement simple pour une utilisation bureautique à la maison ou sur le lieu de travail. Le processeur AMD Ryzen 7 7735HS offre suffisamment de puissance pour gérer la plupart des tâches. Avec ses 8 cœurs et ses 16 threads, le mini PC convient aux applications gourmandes en performances. La mémoire vive installée est de 16 Go, ce qui ne pose pas de problème pour l'instant. Cependant, l'utilisation d'un seul module de RAM s'est avérée payante, bien que le Maxtang MTN-FP750 permette l'installation de modules SO-DIMM. Cela signifie que, lors des tests, le Maxtang MTN-FP750 n'a pas fourni le type de performance que nous aurions attendu. Les différences de performances les plus notables se retrouvent dans les benchmarks 3D. Ce problème peut être évité en installant un module de mémoire vive supplémentaire et c'est sans aucun doute un point auquel les clients devraient prêter attention.
Selon la fiche technique, le Maxtang MTN-FP750 offre d'excellentes performances. Cependant, lors des tests, le mini PC n'a pas réussi à fournir la puissance promise.
Le plus grand avantage du Maxtang MTN-FP750 est son prix bas par rapport à la concurrence présentée dans notre comparatif. Les performances sont légèrement inférieures, à moins que vous ne preniez les choses en main et que les limites de puissance du SoC ne puissent pas être ajustées. À notre avis, la limite de puissance définie à 35 watts est un peu trop conservatrice. A 45 watts, le constructeur aurait pu trouver un bon compromis. Il en va de même pour la mémoire vive qui peut être étendue avec un second module. Si vous considérez ces deux points, du point de vue des performances, le Maxtang MTN-FP750 est complètement différent de celui que nous avons testé.
La sélection des ports peut être décrite comme solide. Tous les ports importants sont présents, mais c'est à peu près tout. Thunderbolt ou USB4 sont absents, ce qui limite légèrement le nombre de cas d'utilisation. L'un des effets secondaires positifs de l'utilisation d'un processeur aux performances limitées est la consommation d'énergie du Maxtang MTN-FP750. Lors des tests, cet appareil s'est avéré nettement plus économique que ses concurrents. Malheureusement, cela n'a pas eu d'influence positive sur le bruit relativement fort du ventilateur. Un concept de refroidissement légèrement amélioré aurait permis d'obtenir de meilleurs résultats dans ce domaine.
Prix et disponibilité
Dans notre configuration d'examen, le Maxtang MTN-FP750 peut être acheté pour 440 dollars US directement auprès du fabricant.
Maxtang MTN-FP750
- 02/27/2024 v7 (old)
Sebastian Bade
Transparency
La sélection des appareils à examiner est effectuée par notre équipe éditoriale. L'échantillon d'essai a été remis gratuitement à l'auteur par le fabricant à des fins d'évaluation. Cet examen n'a pas été influencé par des tiers et le fabricant n'a pas reçu de copie de cet examen avant sa publication. Il n'y avait aucune obligation de publier cet article. En tant que média indépendant, Notebookcheck n'est pas soumis à l'autorité des fabricants, des détaillants ou des éditeurs.
Voici comment Notebookcheck teste
Chaque année, Notebookcheck examine de manière indépendante des centaines d'ordinateurs portables et de smartphones en utilisant des procédures standardisées afin de garantir que tous les résultats sont comparables. Nous avons continuellement développé nos méthodes de test depuis environ 20 ans et avons établi des normes industrielles dans le processus. Dans nos laboratoires de test, des équipements de mesure de haute qualité sont utilisés par des techniciens et des rédacteurs expérimentés. Ces tests impliquent un processus de validation en plusieurs étapes. Notre système d'évaluation complexe repose sur des centaines de mesures et de points de référence bien fondés, ce qui garantit l'objectivité.
