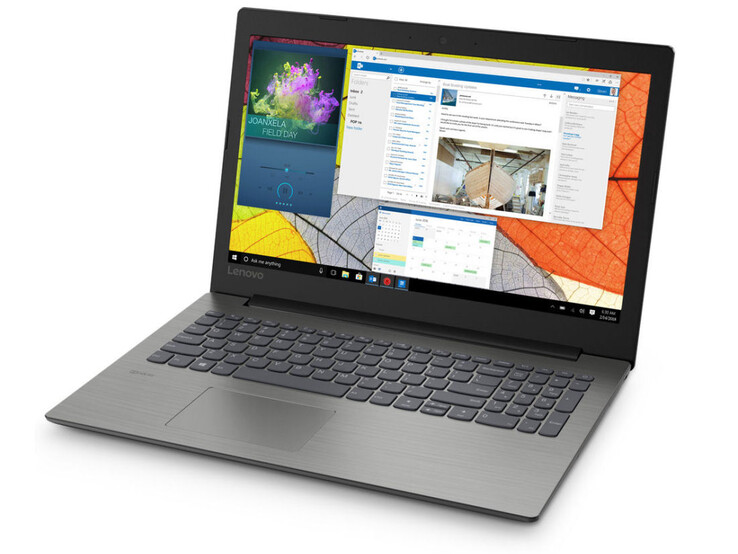
Courte critique du PC portable Lenovo IdeaPad 330-15IKB (i5-7200U, Radeon 530, FHD, RAM 8 Go, SSD 256 Go)
Top 10
» Le Top 10 des PC portables multimédia
» Le Top 10 des PC portables de jeu
» Le Top 10 des PC portables de jeu légers
» Le Top 10 des ordinateurs portables bureautiques
» Le Top 10 des PC portables bureautiques premium/professionnels
» Le Top 10 des Stations de travail mobiles
» Le Top 10 des Ultraportables
» Le Top 10 des Ultrabooks
» Le Top 10 des Convertibles
» Le Top 10 des Tablettes
» Le Top 10 des Tablettes Windows
» Le Top 10 des Smartphones
» Le Top 10 des PC Portables á moins de 300 euros
» Le Top 10 des PC Portables á moins de 500 euros
» Le Top 25 des meilleurs écrans d'ordinateurs
| SD Card Reader | |
| average JPG Copy Test (av. of 3 runs) | |
| Moyenne de la classe Office (22.4 - 198.5, n=29, 2 dernières années) | |
| HP Pavilion 15-cw0003ng (Toshiba Exceria Pro SDXC 64 GB UHS-II) | |
| Lenovo IdeaPad 330-15ARR 81D2005CUS (Toshiba Exceria Pro SDXC 64 GB UHS-II) | |
| Acer Swift 3 SF315-41G-R6BR (Toshiba Exceria Pro SDXC 64 GB UHS-II) | |
| Lenovo IdeaPad 330-15ARR-81D2005JGE (Toshiba Exceria Pro SDXC 64 GB UHS-II) | |
| Asus VivoBook 15 X542UF-DM143T (Toshiba Exceria Pro SDXC 64 GB UHS-II) | |
| HP 15-da0405ng (Toshiba Exceria Pro SDXC 64 GB UHS-II) | |
| HP Pavilion 15-cs0003ng (Toshiba Exceria Pro SDXC 64 GB UHS-II) | |
| Acer TravelMate P2510-G2-MG-50WE (Toshiba Exceria Pro SDXC 64 GB UHS-II) | |
| Lenovo Ideapad 330-15IKB-81DC00SWGE (Toshiba Exceria Pro SDXC 64 GB UHS-II) | |
| Medion Akoya S6625 (Toshiba Exceria Pro SDXC 64 GB UHS-II) | |
| maximum AS SSD Seq Read Test (1GB) | |
| Moyenne de la classe Office (25 - 249, n=27, 2 dernières années) | |
| Lenovo IdeaPad 330-15ARR 81D2005CUS (Toshiba Exceria Pro SDXC 64 GB UHS-II) | |
| Acer Swift 3 SF315-41G-R6BR (Toshiba Exceria Pro SDXC 64 GB UHS-II) | |
| HP Pavilion 15-cw0003ng (Toshiba Exceria Pro SDXC 64 GB UHS-II) | |
| HP Pavilion 15-cs0003ng (Toshiba Exceria Pro SDXC 64 GB UHS-II) | |
| Asus VivoBook 15 X542UF-DM143T (Toshiba Exceria Pro SDXC 64 GB UHS-II) | |
| Lenovo Ideapad 330-15IKB-81DC00SWGE (Toshiba Exceria Pro SDXC 64 GB UHS-II) | |
| Acer TravelMate P2510-G2-MG-50WE (Toshiba Exceria Pro SDXC 64 GB UHS-II) | |
| Medion Akoya S6625 (Toshiba Exceria Pro SDXC 64 GB UHS-II) | |
| |||||||||||||||||||||||||
Homogénéité de la luminosité: 85 %
Valeur mesurée au centre, sur batterie: 241 cd/m²
Contraste: 464:1 (Valeurs des noirs: 0.5 cd/m²)
ΔE ColorChecker Calman: 10.23 | ∀{0.5-29.43 Ø4.76}
ΔE Greyscale Calman: 11.78 | ∀{0.09-98 Ø5}
60% sRGB (Argyll 1.6.3 3D)
38% AdobeRGB 1998 (Argyll 1.6.3 3D)
41.26% AdobeRGB 1998 (Argyll 3D)
60% sRGB (Argyll 3D)
39.93% Display P3 (Argyll 3D)
Gamma: 2.55
CCT: 13383 K
| Lenovo Ideapad 330-15IKB-81DC00SWGE TN LED, 1920x1080, 15.6" | Lenovo IdeaPad 330-15ARR-81D2005JGE IPS, 1920x1080, 15.6" | Lenovo IdeaPad 330-15ARR 81D2005CUS TN LED, 1920x1080, 15.6" | Acer TravelMate P2510-G2-MG-50WE IPS, 1920x1080, 15.6" | HP Pavilion 15-cs0003ng IPS, 1920x1080, 15.6" | Acer Swift 3 SF315-41G-R6BR IPS, 1920x1080, 15.6" | HP Pavilion 15-cw0003ng IPS, 1920x1080, 15.6" | Asus VivoBook 15 X542UF-DM143T TN LED, 1920x1080, 15.6" | HP 15-da0405ng TN LED, 1920x1080, 15.6" | |
|---|---|---|---|---|---|---|---|---|---|
| Display | -2% | -9% | 6% | -9% | -1% | -8% | -6% | -1% | |
| Display P3 Coverage (%) | 39.93 | 39.21 -2% | 36.36 -9% | 42.27 6% | 36.27 -9% | 40.1 0% | 36.7 -8% | 37.47 -6% | 39.52 -1% |
| sRGB Coverage (%) | 60 | 59.1 -1% | 54.7 -9% | 63.5 6% | 54.6 -9% | 59 -2% | 55 -8% | 56.4 -6% | 59.4 -1% |
| AdobeRGB 1998 Coverage (%) | 41.26 | 40.51 -2% | 37.57 -9% | 43.69 6% | 37.47 -9% | 41.43 0% | 37.91 -8% | 38.71 -6% | 40.83 -1% |
| Response Times | 1% | -37% | -95% | -83% | -89% | -67% | -37% | -9% | |
| Response Time Grey 50% / Grey 80% * (ms) | 41 ? | 40 ? 2% | 38.8 ? 5% | 40 ? 2% | 45 ? -10% | 43 ? -5% | 40 ? 2% | 41 ? -0% | 41 ? -0% |
| Response Time Black / White * (ms) | 11 ? | 11 ? -0% | 19.6 ? -78% | 32 ? -191% | 28 ? -155% | 30 ? -173% | 26 ? -136% | 19 ? -73% | 13 ? -18% |
| PWM Frequency (Hz) | 200 ? | 200 ? | 25000 ? | 1471 ? | 7000 ? | 29000 ? | |||
| Screen | -16% | -7% | 49% | 14% | 38% | 33% | 22% | -4% | |
| Brightness middle (cd/m²) | 232 | 222 -4% | 252.2 9% | 259 12% | 240 3% | 284 22% | 186 -20% | 230 -1% | 176 -24% |
| Brightness (cd/m²) | 217 | 200 -8% | 251 16% | 230 6% | 237 9% | 254 17% | 180 -17% | 221 2% | 164 -24% |
| Brightness Distribution (%) | 85 | 87 2% | 84 -1% | 82 -4% | 90 6% | 80 -6% | 88 4% | 91 7% | 69 -19% |
| Black Level * (cd/m²) | 0.5 | 0.57 -14% | 0.54 -8% | 0.19 62% | 0.42 16% | 0.29 42% | 0.15 70% | 0.45 10% | 0.31 38% |
| Contrast (:1) | 464 | 389 -16% | 467 1% | 1363 194% | 571 23% | 979 111% | 1240 167% | 511 10% | 568 22% |
| Colorchecker dE 2000 * | 10.23 | 14.07 -38% | 12.36 -21% | 3.13 69% | 7.43 27% | 4.22 59% | 5.94 42% | 3.6 65% | 11.4 -11% |
| Colorchecker dE 2000 max. * | 17.22 | 23.62 -37% | 24.75 -44% | 7.81 55% | 12.42 28% | 9.29 46% | 10.81 37% | 5.59 68% | 19.76 -15% |
| Greyscale dE 2000 * | 11.78 | 15.89 -35% | 12.2 -4% | 1.42 88% | 6.26 47% | 1.17 90% | 4.44 62% | 3.13 73% | 12.75 -8% |
| Gamma | 2.55 86% | 2.59 85% | 1.83 120% | 2.36 93% | 2.96 74% | 2.39 92% | 2.81 78% | 2.45 90% | 2.59 85% |
| CCT | 13383 49% | 23883 27% | 13028 50% | 6391 102% | 6661 98% | 6360 102% | 6272 104% | 7244 90% | 14899 44% |
| Color Space (Percent of AdobeRGB 1998) (%) | 38 | 37 -3% | 34.6 -9% | 40 5% | 35 -8% | 38 0% | 35 -8% | 36 -5% | 38 0% |
| Color Space (Percent of sRGB) (%) | 60 | 57 -5% | 54.5 -9% | 63 5% | 54 -10% | 59 -2% | 55 -8% | 56 -7% | 59 -2% |
| Colorchecker dE 2000 calibrated * | 2.94 | 4.43 | 3.09 | 6.07 | 2.99 | ||||
| Moyenne finale (programmes/paramètres) | -6% /
-11% | -18% /
-11% | -13% /
21% | -26% /
-3% | -17% /
13% | -14% /
11% | -7% /
9% | -5% /
-4% |
* ... Moindre est la valeur, meilleures sont les performances
Temps de réponse de l'écran
| ↔ Temps de réponse noir à blanc | ||
|---|---|---|
| 11 ms ... hausse ↗ et chute ↘ combinées | ↗ 7 ms hausse | |
| ↘ 6 ms chute | ||
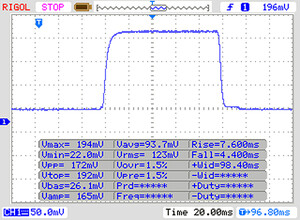
| L'écran montre de bons temps de réponse, mais insuffisant pour du jeu compétitif. En comparaison, tous les appareils testés affichent entre 0.1 (minimum) et 240 (maximum) ms. » 29 % des appareils testés affichent de meilleures performances. Cela signifie que les latences relevées sont meilleures que la moyenne (20.1 ms) de tous les appareils testés. | ||
| ↔ Temps de réponse gris 50% à gris 80% | ||
| 41 ms ... hausse ↗ et chute ↘ combinées | ↗ 22 ms hausse | |
| ↘ 19 ms chute | ||
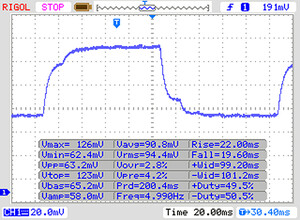
| L'écran souffre de latences très élevées, à éviter pour le jeu. En comparaison, tous les appareils testés affichent entre 0.165 (minimum) et 636 (maximum) ms. » 64 % des appareils testés affichent de meilleures performances. Cela signifie que les latences relevées sont moins bonnes que la moyenne (31.5 ms) de tous les appareils testés. | ||
Scintillement / MLI (Modulation de largeur d'impulsion)
| Scintillement / MLI (Modulation de largeur d'impulsion) décelé | 200 Hz | ≤ 90 Niveau de luminosité | |
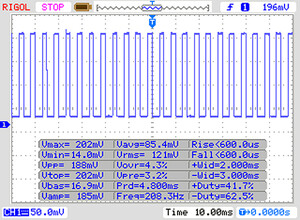
Le rétroéclairage de l'écran scintille à la fréquence de 200 Hz (certainement du fait de l'utilisation d'une MDI - Modulation de largeur d'impulsion) à un niveau de luminosité inférieur ou égal à 90 % . Aucun scintillement ne devrait être perceptible au-dessus de cette valeur. La fréquence de rafraîchissement de 200 Hz est relativement faible, les personnes les plus sensibles devraient percevoir un scintillement et être sujettes à une fatigue oculaire accrue (avec le niveau de luminosité indiqué) En comparaison, 53 % des appareils testés n'emploient pas MDI pour assombrir leur écran. Nous avons relevé une moyenne à 8082 (minimum : 5 - maximum : 343500) Hz dans le cas où une MDI était active. | |||
| Cinebench R10 | |
| Rendering Single 32Bit | |
| Moyenne de la classe Office (5060 - 10817, n=15, 2 dernières années) | |
| Medion Akoya S6625 | |
| Asus VivoBook 15 X542UF-DM143T | |
| HP 15-da0405ng | |
| Moyenne Intel Core i5-7200U (4787 - 5022, n=47) | |
| Lenovo Ideapad 330-15IKB-81DC00SWGE | |
| Acer Swift 3 SF315-41G-R6BR | |
| Rendering Multiple CPUs 32Bit | |
| Moyenne de la classe Office (19806 - 60850, n=15, 2 dernières années) | |
| Asus VivoBook 15 X542UF-DM143T | |
| Medion Akoya S6625 | |
| HP 15-da0405ng | |
| Acer Swift 3 SF315-41G-R6BR | |
| Moyenne Intel Core i5-7200U (9213 - 11955, n=47) | |
| Lenovo Ideapad 330-15IKB-81DC00SWGE | |
| Geekbench 3 | |
| 32 Bit Multi-Core Score | |
| Asus VivoBook 15 X542UF-DM143T | |
| HP 15-da0405ng | |
| Medion Akoya S6625 | |
| Acer Swift 3 SF315-41G-R6BR | |
| Lenovo Ideapad 330-15IKB-81DC00SWGE | |
| Moyenne Intel Core i5-7200U (6297 - 6932, n=30) | |
| 32 Bit Single-Core Score | |
| Medion Akoya S6625 | |
| Acer Swift 3 SF315-41G-R6BR | |
| Asus VivoBook 15 X542UF-DM143T | |
| HP 15-da0405ng | |
| Lenovo Ideapad 330-15IKB-81DC00SWGE | |
| Moyenne Intel Core i5-7200U (2812 - 3209, n=30) | |
| Geekbench 4.4 | |
| 64 Bit Multi-Core Score | |
| Moyenne de la classe Office (16566 - 41544, n=11, 2 dernières années) | |
| Medion Akoya S6625 | |
| Asus VivoBook 15 X542UF-DM143T | |
| HP 15-da0405ng | |
| Acer Swift 3 SF315-41G-R6BR | |
| Lenovo Ideapad 330-15IKB-81DC00SWGE | |
| Moyenne Intel Core i5-7200U (7066 - 7767, n=15) | |
| 64 Bit Single-Core Score | |
| Moyenne de la classe Office (4469 - 8042, n=11, 2 dernières années) | |
| Medion Akoya S6625 | |
| Asus VivoBook 15 X542UF-DM143T | |
| HP 15-da0405ng | |
| Lenovo Ideapad 330-15IKB-81DC00SWGE | |
| Moyenne Intel Core i5-7200U (3648 - 3958, n=15) | |
| Acer Swift 3 SF315-41G-R6BR | |
| Mozilla Kraken 1.1 - Total | |
| Lenovo Ideapad 330-15IKB-81DC00SWGE (Edge 44) | |
| Lenovo IdeaPad 330-15ARR 81D2005CUS (Edge 41.16299.611.0) | |
| HP Pavilion 15-cw0003ng | |
| Acer Swift 3 SF315-41G-R6BR (Edge 42) | |
| Acer TravelMate P2510-G2-MG-50WE | |
| Moyenne Intel Core i5-7200U (1109 - 1542, n=42) | |
| Medion Akoya S6625 (Edge 42) | |
| HP Pavilion 15-cs0003ng | |
| Moyenne de la classe Office (391 - 1297, n=84, 2 dernières années) | |
| Octane V2 - Total Score | |
| Moyenne de la classe Office (59450 - 122119, n=19, 2 dernières années) | |
| Medion Akoya S6625 (Edge 42) | |
| HP Pavilion 15-cs0003ng | |
| Moyenne Intel Core i5-7200U (21890 - 32838, n=45) | |
| Acer Swift 3 SF315-41G-R6BR (Edge 42) | |
| Lenovo Ideapad 330-15IKB-81DC00SWGE (Edge 44) | |
| Lenovo IdeaPad 330-15ARR 81D2005CUS (Edge 41.16299.611.0) | |
| JetStream 1.1 - Total Score | |
| Medion Akoya S6625 (Edge 42) | |
| Asus VivoBook 15 X542UF-DM143T (Edge 41) | |
| Acer TravelMate P2510-G2-MG-50WE | |
| HP 15-da0405ng (Edge 42) | |
| Moyenne Intel Core i5-7200U (127.7 - 223, n=69) | |
| Acer Swift 3 SF315-41G-R6BR (Edge 42) | |
| HP Pavilion 15-cw0003ng | |
| Lenovo Ideapad 330-15IKB-81DC00SWGE (Edge 44) | |
| HP Pavilion 15-cs0003ng | |
| Lenovo IdeaPad 330-15ARR 81D2005CUS (Edge 41.16299.611.0) | |
| Lenovo IdeaPad 330-15ARR-81D2005JGE | |
* ... Moindre est la valeur, meilleures sont les performances
| PCMark 7 Score | 5481 points | |
| PCMark 8 Home Score Accelerated v2 | 3907 points | |
| PCMark 8 Creative Score Accelerated v2 | 4601 points | |
| PCMark 8 Work Score Accelerated v2 | 4631 points | |
| PCMark 10 Score | 3293 points | |
Aide | ||
| Lenovo Ideapad 330-15IKB-81DC00SWGE Micron SSD 1100 SED 256GB MTFDDAK256TBN | Acer TravelMate P2510-G2-MG-50WE SK Hynix HFS256G39TND-N210A | HP Pavilion 15-cs0003ng SK Hynix SC313 HFS256G39TNF | HP Pavilion 15-cw0003ng Intel SSD 600p SSDPEKKW512G7 | Asus VivoBook 15 X542UF-DM143T Micron 1100 MTFDDAV256TBN | HP 15-da0405ng SK Hynix BC501 NVMe 256 GB | Acer Swift 3 SF315-41G-R6BR Intel SSD 600p SSDPEKKW256G7 | Lenovo IdeaPad 330-15ARR 81D2005CUS SK Hynix Canvas SC311 256GB HFS256G32TNF | Lenovo IdeaPad 330-15ARR-81D2005JGE Seagate Mobile HDD 1TB ST1000LM035 | Moyenne Micron SSD 1100 SED 256GB MTFDDAK256TBN | |
|---|---|---|---|---|---|---|---|---|---|---|
| CrystalDiskMark 5.2 / 6 | 50% | 73% | 147% | 82% | 168% | 157% | 68% | -88% | 28% | |
| Write 4K (MB/s) | 24.2 | 71.8 197% | 66.9 176% | 105.8 337% | 94.9 292% | 97.6 303% | 112 363% | 66.6 175% | 0.217 -99% | 48.2 ? 99% |
| Read 4K (MB/s) | 7.548 | 21.23 181% | 30.33 302% | 29.22 287% | 27.3 262% | 39.08 418% | 32.44 330% | 29.2 287% | 0.367 -95% | 16.3 ? 116% |
| Write Seq (MB/s) | 395.1 | 257.1 -35% | 447.6 13% | 581 47% | 410.4 4% | 571 45% | 598 51% | 465.6 18% | 98.8 -75% | 404 ? 2% |
| Read Seq (MB/s) | 443.3 | 476.3 7% | 534 20% | 1065 140% | 464 5% | 1110 150% | 1157 161% | 526 19% | 131.1 -70% | 466 ? 5% |
| Write 4K Q32T1 (MB/s) | 160.2 | 202.6 26% | 197.5 23% | 201 25% | 246.5 54% | 235.7 47% | 255.5 59% | 197 23% | 0.222 -100% | 160.9 ? 0% |
| Read 4K Q32T1 (MB/s) | 179 | 282 58% | 234.5 31% | 278.6 56% | 246.4 38% | 297 66% | 287.5 61% | 202.9 13% | 0.781 -100% | 181.9 ? 2% |
| Write Seq Q32T1 (MB/s) | 455.2 | 265.6 -42% | 495.6 9% | 584 28% | 451.4 -1% | 812 78% | 594 30% | 481.4 6% | 97 -79% | 444 ? -2% |
| Read Seq Q32T1 (MB/s) | 517 | 559 8% | 559 8% | 1824 253% | 532 3% | 1742 237% | 1568 203% | 537 4% | 93.3 -82% | 524 ? 1% |
| 3DMark 03 Standard | 30891 points | |
| 3DMark 05 Standard | 18412 points | |
| 3DMark 06 Standard Score | 11481 points | |
| 3DMark Vantage P Result | 6392 points | |
| 3DMark 11 Performance | 2314 points | |
| 3DMark Ice Storm Standard Score | 48958 points | |
| 3DMark Cloud Gate Standard Score | 6154 points | |
| 3DMark Fire Strike Score | 1386 points | |
| 3DMark Time Spy Score | 497 points | |
Aide | ||
| Bas | Moyen | Élevé | Ultra | |
|---|---|---|---|---|
| StarCraft 2 (2010) | 247 | 75.8 | 46.6 | 24.8 |
| The Elder Scrolls V: Skyrim (2011) | 58.8 | 42.4 | 31.4 | 17.8 |
| Counter-Strike: GO (2012) | 145.2 | 119.8 | 64.9 | 35.5 |
| Tomb Raider (2013) | 100.1 | 51.7 | 39.9 | 17.8 |
| BioShock Infinite (2013) | 97.5 | 50.5 | 42.9 | 14.8 |
| Middle-earth: Shadow of Mordor (2014) | 46.8 | 29.1 | 15.2 | |
| The Witcher 3 (2015) | 27.1 | 17.3 | 14 | 5.6 |
| Dota 2 Reborn (2015) | 62.1 | 46.9 | 29.3 | 28 |
| World of Warships (2015) | 92.9 | 61.2 | 24.6 | |
| Ashes of the Singularity (2016) | 16.5 | 8.9 | ||
| Overwatch (2016) | 69.9 | 59.3 | 27.8 | |
| Deus Ex Mankind Divided (2016) | 19.7 | 14.2 | ||
| Fortnite (2018) | 62.4 | 18.1 | ||
| Final Fantasy XV Benchmark (2018) | 15.5 | 7.2 | ||
| Kingdom Come: Deliverance (2018) | 25.8 | 10 | ||
| X-Plane 11.11 (2018) | 26.1 | 17.3 | ||
| Far Cry 5 (2018) | 22 | 9 | ||
| Monster Hunter World (2018) | 22.9 | 8.6 | ||
| F1 2018 (2018) | 29 | 18 | ||
| Shadow of the Tomb Raider (2018) | 23 | 8 | ||
| FIFA 19 (2018) | 65.8 | 34.6 | 32 | |
| Forza Horizon 4 (2018) | 31 | 20 | ||
| Assassin´s Creed Odyssey (2018) | 23 | 14 | ||
| Hitman 2 (2018) | 16.5 | 8.2 | ||
| Fallout 76 (2018) | 23.4 | 10.7 | ||
| Battlefield V (2018) | 28.6 | 13.2 | ||
| Farming Simulator 19 (2018) | 53.8 | 21.6 | 10.6 | |
| Darksiders III (2018) | 41.9 | 10.5 | ||
| Just Cause 4 (2018) | 19.6 | 11.8 | ||
| Apex Legends (2019) | 27.8 | 11.9 | ||
| Far Cry New Dawn (2019) | 21 | 9 | ||
| Metro Exodus (2019) | 13.6 | 6.4 | ||
| Anthem (2019) | 18.6 | 11 | ||
| Dirt Rally 2.0 (2019) | 45.6 | 16.1 |
| BioShock Infinite - 1366x768 Medium Preset | |
| HP Pavilion 15-cs0003ng | |
| Acer Swift 3 SF315-41G-R6BR | |
| Asus VivoBook 15 X542UF-DM143T | |
| Medion Akoya S6625 | |
| Dell Latitude 15 3590-K8JP | |
| HP 15-da0405ng | |
| Moyenne AMD Radeon 530 (41.7 - 60.3, n=5) | |
| Lenovo Ideapad 330-15IKB-81DC00SWGE | |
| HP 17-bs103ng | |
| The Witcher 3 - 1024x768 Low Graphics & Postprocessing | |
| Moyenne de la classe Office (16 - 177, n=16, 2 dernières années) | |
| Acer Swift 3 SF315-41G-R6BR | |
| Asus VivoBook 15 X542UF-DM143T | |
| Medion Akoya S6625 | |
| Dell Latitude 15 3590-K8JP | |
| Moyenne AMD Radeon 530 (24 - 32.8, n=4) | |
| HP 15-da0405ng | |
| Lenovo Ideapad 330-15IKB-81DC00SWGE | |
| Lenovo IdeaPad 330-15ARR 81D2005CUS | |
| Tomb Raider - 1366x768 Normal Preset AA:FX AF:4x | |
| Asus VivoBook 15 X542UF-DM143T | |
| Acer Swift 3 SF315-41G-R6BR | |
| HP 15-da0405ng | |
| Moyenne AMD Radeon 530 (49.7 - 59, n=3) | |
| Lenovo Ideapad 330-15IKB-81DC00SWGE | |
| HP 17-bs103ng | |
| Dota 2 Reborn - 1366x768 med (1/3) | |
| Asus VivoBook 15 X542UF-DM143T | |
| Moyenne de la classe Office (27.6 - 152, n=82, 2 dernières années) | |
| HP 15-da0405ng | |
| Acer Swift 3 SF315-41G-R6BR | |
| Moyenne AMD Radeon 530 (46.9 - 66.6, n=4) | |
| HP 17-bs103ng | |
| Lenovo Ideapad 330-15IKB-81DC00SWGE | |
| World of Warships - 1366x768 Medium Preset AF:Trilinear | |
| Asus VivoBook 15 X542UF-DM143T | |
| HP 15-da0405ng | |
| Acer Swift 3 SF315-41G-R6BR | |
| Lenovo Ideapad 330-15IKB-81DC00SWGE | |
| Moyenne AMD Radeon 530 (n=1) | |
| StarCraft 2 - 1360x768 high | |
| Asus VivoBook 15 X542UF-DM143T | |
| HP 15-da0405ng | |
| Lenovo Ideapad 330-15IKB-81DC00SWGE | |
| Moyenne AMD Radeon 530 (n=1) | |
| The Elder Scrolls V: Skyrim - 1366x768 Medium Preset AA:4x | |
| Lenovo Ideapad 330-15IKB-81DC00SWGE | |
| Moyenne AMD Radeon 530 (31 - 42.4, n=2) | |
| HP 17-bs103ng | |
| Counter-Strike: GO - 1366x768 High AA:2x MS AF:4x | |
| Lenovo Ideapad 330-15IKB-81DC00SWGE | |
| Moyenne AMD Radeon 530 (n=1) | |
Degré de la nuisance sonore
| Au repos |
| 30.5 / 30.5 / 31.2 dB(A) |
| Fortement sollicité |
| 35.4 / 38.7 dB(A) |
 | ||
30 dB silencieux 40 dB(A) audible 50 dB(A) bruyant |
||
min: | ||
| Lenovo Ideapad 330-15IKB-81DC00SWGE i5-7200U, Radeon 530 | Lenovo IdeaPad 330-15ARR 81D2005CUS R5 2500U, Vega 8 | Lenovo IdeaPad 330-15ARR-81D2005JGE R3 2200U, Vega 3 | Acer TravelMate P2510-G2-MG-50WE i5-8250U, GeForce MX130 | HP Pavilion 15-cs0003ng i5-8250U, GeForce MX130 | HP Pavilion 15-cw0003ng R5 2500U, Vega 8 | Asus VivoBook 15 X542UF-DM143T i5-8250U, GeForce MX130 | HP 15-da0405ng i5-8250U, GeForce MX110 | Acer Swift 3 SF315-41G-R6BR R5 2500U, Radeon RX 540 | Moyenne AMD Radeon 530 | Moyenne de la classe Office | |
|---|---|---|---|---|---|---|---|---|---|---|---|
| Noise | 3% | -1% | 1% | -6% | 1% | -1% | -1% | 2% | -5% | 13% | |
| arrêt / environnement * (dB) | 30.5 | 28.1 8% | 30.6 -0% | 30.3 1% | 30.6 -0% | 30.5 -0% | 30 2% | 30.6 -0% | 30.3 1% | 29.7 ? 3% | 24.2 ? 21% |
| Idle Minimum * (dB) | 30.5 | 28.1 8% | 31.8 -4% | 30.3 1% | 30.6 -0% | 31.4 -3% | 30.9 -1% | 30.9 -1% | 30.3 1% | 31.6 ? -4% | 24.5 ? 20% |
| Idle Average * (dB) | 30.5 | 31.6 -4% | 31.8 -4% | 30.3 1% | 30.6 -0% | 31.4 -3% | 30.9 -1% | 30.9 -1% | 30.3 1% | 31.6 ? -4% | 24.7 ? 19% |
| Idle Maximum * (dB) | 31.2 | 32.8 -5% | 31.8 -2% | 31 1% | 32.1 -3% | 31.6 -1% | 30.9 1% | 30.9 1% | 32.2 -3% | 31.8 ? -2% | 25.5 ? 18% |
| Load Average * (dB) | 35.4 | 36.5 -3% | 35.2 1% | 35.6 -1% | 43.2 -22% | 33.5 5% | 39 -10% | 36.8 -4% | 34.8 2% | 39.5 ? -12% | 33.5 ? 5% |
| Load Maximum * (dB) | 38.7 | 32.8 15% | 36.4 6% | 38.6 -0% | 43.4 -12% | 35.9 7% | 38 2% | 39 -1% | 35 10% | 42.3 ? -9% | 40.7 ? -5% |
| Witcher 3 ultra * (dB) | 32.8 |
* ... Moindre est la valeur, meilleures sont les performances
(-) La température maximale du côté supérieur est de 46.5 °C / 116 F, par rapport à la moyenne de 34.3 °C / 94 F, allant de 21.2 à 62.5 °C pour la classe Office.
(-) Le fond chauffe jusqu'à un maximum de 53.8 °C / 129 F, contre une moyenne de 36.8 °C / 98 F
(+) En utilisation inactive, la température moyenne du côté supérieur est de 26.9 °C / 80 F, par rapport à la moyenne du dispositif de 29.5 °C / 85 F.
(-) Les repose-poignets et le pavé tactile peuvent devenir très chauds au toucher, avec un maximum de 42 °C / 107.6# F.
(-) La température moyenne de la zone de l'appui-paume de dispositifs similaires était de 27.5 °C / 81.5 F (-14.5 °C / #-26.1 F).
| Lenovo Ideapad 330-15IKB-81DC00SWGE i5-7200U, Radeon 530 | Lenovo IdeaPad 330-15ARR 81D2005CUS R5 2500U, Vega 8 | Lenovo IdeaPad 330-15ARR-81D2005JGE R3 2200U, Vega 3 | Acer TravelMate P2510-G2-MG-50WE i5-8250U, GeForce MX130 | HP Pavilion 15-cs0003ng i5-8250U, GeForce MX130 | HP Pavilion 15-cw0003ng R5 2500U, Vega 8 | Asus VivoBook 15 X542UF-DM143T i5-8250U, GeForce MX130 | HP 15-da0405ng i5-8250U, GeForce MX110 | Acer Swift 3 SF315-41G-R6BR R5 2500U, Radeon RX 540 | Moyenne AMD Radeon 530 | Moyenne de la classe Office | |
|---|---|---|---|---|---|---|---|---|---|---|---|
| Heat | 11% | 20% | 8% | 11% | 24% | 15% | 23% | 4% | 10% | 13% | |
| Maximum Upper Side * (°C) | 46.5 | 36.8 21% | 34.5 26% | 49 -5% | 48 -3% | 37.3 20% | 40.2 14% | 37.3 20% | 46.6 -0% | 41.7 ? 10% | 40.5 ? 13% |
| Maximum Bottom * (°C) | 53.8 | 42 22% | 34 37% | 47.4 12% | 49 9% | 37.3 31% | 46.6 13% | 41 24% | 45.5 15% | 42.3 ? 21% | 42.6 ? 21% |
| Idle Upper Side * (°C) | 30.5 | 29.4 4% | 27.5 10% | 26.6 13% | 24.4 20% | 23.7 22% | 25.1 18% | 22.3 27% | 30.2 1% | 28.3 ? 7% | 27 ? 11% |
| Idle Bottom * (°C) | 30.1 | 30.6 -2% | 28.2 6% | 26.7 11% | 24.6 18% | 23.9 21% | 25.8 14% | 23.5 22% | 30.7 -2% | 29.3 ? 3% | 28.2 ? 6% |
* ... Moindre est la valeur, meilleures sont les performances
Lenovo Ideapad 330-15IKB-81DC00SWGE analyse audio
(-) | haut-parleurs pas très forts (63.3 dB)
Basses 100 - 315 Hz
(-) | presque aucune basse - en moyenne 23.4% plus bas que la médiane
(±) | la linéarité des basses est moyenne (12.7% delta à la fréquence précédente)
Médiums 400 - 2000 Hz
(+) | médiane équilibrée - seulement 1.9% de la médiane
(±) | la linéarité des médiums est moyenne (7.6% delta à la fréquence précédente)
Aiguës 2 - 16 kHz
(+) | des sommets équilibrés - à seulement 1.7% de la médiane
(+) | les aigus sont linéaires (5.6% delta à la fréquence précédente)
Globalement 100 - 16 000 Hz
(±) | la linéarité du son global est moyenne (20.7% de différence avec la médiane)
Par rapport à la même classe
» 47% de tous les appareils testés de cette catégorie étaient meilleurs, 10% similaires, 43% pires
» Le meilleur avait un delta de 7%, la moyenne était de 21%, le pire était de 53%.
Par rapport à tous les appareils testés
» 55% de tous les appareils testés étaient meilleurs, 8% similaires, 37% pires
» Le meilleur avait un delta de 4%, la moyenne était de 24%, le pire était de 134%.
Asus VivoBook 15 X542UF-DM143T analyse audio
(-) | haut-parleurs pas très forts (71.1 dB)
Basses 100 - 315 Hz
(-) | presque aucune basse - en moyenne 16.9% plus bas que la médiane
(±) | la linéarité des basses est moyenne (14.3% delta à la fréquence précédente)
Médiums 400 - 2000 Hz
(+) | médiane équilibrée - seulement 1.2% de la médiane
(+) | les médiums sont linéaires (4.5% delta à la fréquence précédente)
Aiguës 2 - 16 kHz
(+) | des sommets équilibrés - à seulement 2.9% de la médiane
(+) | les aigus sont linéaires (4.2% delta à la fréquence précédente)
Globalement 100 - 16 000 Hz
(±) | la linéarité du son global est moyenne (15.2% de différence avec la médiane)
Par rapport à la même classe
» 35% de tous les appareils testés de cette catégorie étaient meilleurs, 4% similaires, 61% pires
» Le meilleur avait un delta de 5%, la moyenne était de 17%, le pire était de 45%.
Par rapport à tous les appareils testés
» 21% de tous les appareils testés étaient meilleurs, 4% similaires, 75% pires
» Le meilleur avait un delta de 4%, la moyenne était de 24%, le pire était de 134%.
HP 15-da0405ng analyse audio
(±) | le niveau sonore du haut-parleur est moyen mais bon (72.1# dB)
Basses 100 - 315 Hz
(-) | presque aucune basse - en moyenne 25.4% plus bas que la médiane
(±) | la linéarité des basses est moyenne (11.6% delta à la fréquence précédente)
Médiums 400 - 2000 Hz
(+) | médiane équilibrée - seulement 3% de la médiane
(±) | la linéarité des médiums est moyenne (7.7% delta à la fréquence précédente)
Aiguës 2 - 16 kHz
(+) | des sommets équilibrés - à seulement 2.3% de la médiane
(+) | les aigus sont linéaires (4% delta à la fréquence précédente)
Globalement 100 - 16 000 Hz
(±) | la linéarité du son global est moyenne (19.9% de différence avec la médiane)
Par rapport à la même classe
» 41% de tous les appareils testés de cette catégorie étaient meilleurs, 9% similaires, 50% pires
» Le meilleur avait un delta de 7%, la moyenne était de 21%, le pire était de 53%.
Par rapport à tous les appareils testés
» 51% de tous les appareils testés étaient meilleurs, 7% similaires, 42% pires
» Le meilleur avait un delta de 4%, la moyenne était de 24%, le pire était de 134%.
Acer Swift 3 SF315-41G-R6BR analyse audio
(±) | le niveau sonore du haut-parleur est moyen mais bon (74.2# dB)
Basses 100 - 315 Hz
(-) | presque aucune basse - en moyenne 15.1% plus bas que la médiane
(+) | les basses sont linéaires (5% delta à la fréquence précédente)
Médiums 400 - 2000 Hz
(+) | médiane équilibrée - seulement 3.8% de la médiane
(+) | les médiums sont linéaires (5.7% delta à la fréquence précédente)
Aiguës 2 - 16 kHz
(±) | sommets plus élevés - en moyenne 6.6% plus élevés que la médiane
(+) | les aigus sont linéaires (5.7% delta à la fréquence précédente)
Globalement 100 - 16 000 Hz
(±) | la linéarité du son global est moyenne (18.2% de différence avec la médiane)
Par rapport à la même classe
» 53% de tous les appareils testés de cette catégorie étaient meilleurs, 8% similaires, 39% pires
» Le meilleur avait un delta de 5%, la moyenne était de 17%, le pire était de 45%.
Par rapport à tous les appareils testés
» 38% de tous les appareils testés étaient meilleurs, 8% similaires, 54% pires
» Le meilleur avait un delta de 4%, la moyenne était de 24%, le pire était de 134%.
| Éteint/en veille | |
| Au repos | |
| Fortement sollicité |
|
Légende:
min: | |
| Lenovo Ideapad 330-15IKB-81DC00SWGE i5-7200U, Radeon 530 | Lenovo IdeaPad 330-15ARR 81D2005CUS R5 2500U, Vega 8 | Lenovo IdeaPad 330-15ARR-81D2005JGE R3 2200U, Vega 3 | Acer TravelMate P2510-G2-MG-50WE i5-8250U, GeForce MX130 | HP Pavilion 15-cs0003ng i5-8250U, GeForce MX130 | HP Pavilion 15-cw0003ng R5 2500U, Vega 8 | Asus VivoBook 15 X542UF-DM143T i5-8250U, GeForce MX130 | HP 15-da0405ng i5-8250U, GeForce MX110 | Acer Swift 3 SF315-41G-R6BR R5 2500U, Radeon RX 540 | Moyenne AMD Radeon 530 | Moyenne de la classe Office | |
|---|---|---|---|---|---|---|---|---|---|---|---|
| Power Consumption | -35% | -36% | -8% | -13% | -6% | -18% | -4% | -48% | -30% | -17% | |
| Idle Minimum * (Watt) | 3.6 | 7.6 -111% | 8 -122% | 3.3 8% | 3.3 8% | 4.5 -25% | 4.75 -32% | 3.8 -6% | 6.9 -92% | 5.34 ? -48% | 4.48 ? -24% |
| Idle Average * (Watt) | 6.4 | 10.6 -66% | 9.9 -55% | 5.6 13% | 6.1 5% | 7.3 -14% | 6.9 -8% | 6.2 3% | 9.6 -50% | 8.12 ? -27% | 7.36 ? -15% |
| Idle Maximum * (Watt) | 7.2 | 11.8 -64% | 10.4 -44% | 7.8 -8% | 8.3 -15% | 9.4 -31% | 7 3% | 6.7 7% | 11.8 -64% | 11.3 ? -57% | 8.74 ? -21% |
| Load Average * (Watt) | 39.4 | 24.1 39% | 31 21% | 54 -37% | 56 -42% | 34 14% | 53 -35% | 40.8 -4% | 50 -27% | 46.5 ? -18% | 42.5 ? -8% |
| Load Maximum * (Watt) | 55.3 | 39.4 29% | 43 22% | 63 -14% | 67 -21% | 41.9 24% | 65.3 -18% | 65.2 -18% | 60 -8% | 54.8 ? 1% | 64.5 ? -17% |
| Witcher 3 ultra * (Watt) | 30.3 |
* ... Moindre est la valeur, meilleures sont les performances
| Lenovo Ideapad 330-15IKB-81DC00SWGE i5-7200U, Radeon 530, 30 Wh | Acer TravelMate P2510-G2-MG-50WE i5-8250U, GeForce MX130, 48 Wh | HP Pavilion 15-cs0003ng i5-8250U, GeForce MX130, 41 Wh | HP Pavilion 15-cw0003ng R5 2500U, Vega 8, 41 Wh | Asus VivoBook 15 X542UF-DM143T i5-8250U, GeForce MX130, 38 Wh | HP 15-da0405ng i5-8250U, GeForce MX110, 41 Wh | Acer Swift 3 SF315-41G-R6BR R5 2500U, Radeon RX 540, 48 Wh | Lenovo IdeaPad 330-15ARR 81D2005CUS R5 2500U, Vega 8, 35 Wh | Lenovo IdeaPad 330-15ARR-81D2005JGE R3 2200U, Vega 3, 35 Wh | Moyenne de la classe Office | |
|---|---|---|---|---|---|---|---|---|---|---|
| Autonomie de la batterie | 82% | 20% | 13% | 42% | 23% | 33% | -17% | -50% | 128% | |
| Reader / Idle (h) | 13.5 | 8.2 -39% | 8.4 -38% | 12.1 -10% | 22.3 ? 65% | |||||
| H.264 (h) | 5 | 8.6 72% | 3.8 -24% | 6.1 22% | 15 ? 200% | |||||
| WiFi v1.3 (h) | 4.8 | 8.4 75% | 4.7 -2% | 5 4% | 6.8 42% | 5.9 23% | 6.7 40% | 4 -17% | 2.4 -50% | 12.6 ? 163% |
| Load (h) | 1 | 2 100% | 2 100% | 2.1 110% | 1.8 80% | 1.833 ? 83% |
Points positifs
Points négatifs
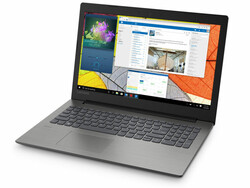
Le Lenovo IdeaPad 330-15IKB est en quelques sortes un anachronisme. Son processeur Core i5-7200U et sa Radeon 530 sont dépassés, tout comme son écran TN. Et sa batterie est trop petite pour un 15,6 pouces.
De plus, si le SSD est suffisamment rapide pour faire tourner fluidement la machine, il est largement plus lent que la plupart des disques M.2 2280 trouvés dans la plupart des portables modernes. Enfin, Lenovo fait l’impasse sur le rétroéclairage du clavier.
Nous ne pouvons pas recommander le Lenovo IdeaPad 330-15IKB. Il est si loin de nos attentes dans tant de domaines que nous conseillons vivement d’aller voir ailleurs si vous recherchez un portable de bureau de 15,6 pouces pas cher.
Si vous êtes intéressés par l’IdeaPad 330-15, alors la version Ryzen 5 2500U propose des performances comparables avec un écran IPS, mais à un prix bien plus abordable. Il possède néanmoins aussi la même autonomie décevante, si bien qu’il vaut peut-être mieux laisser de côté cette série en attendant que Lenovo corrige ses défauts.
L’intégralité de cette critique est disponible en anglais en suivant ce lien.
Lenovo Ideapad 330-15IKB-81DC00SWGE
- 03/17/2019 v6 (old)
Sascha Mölck


