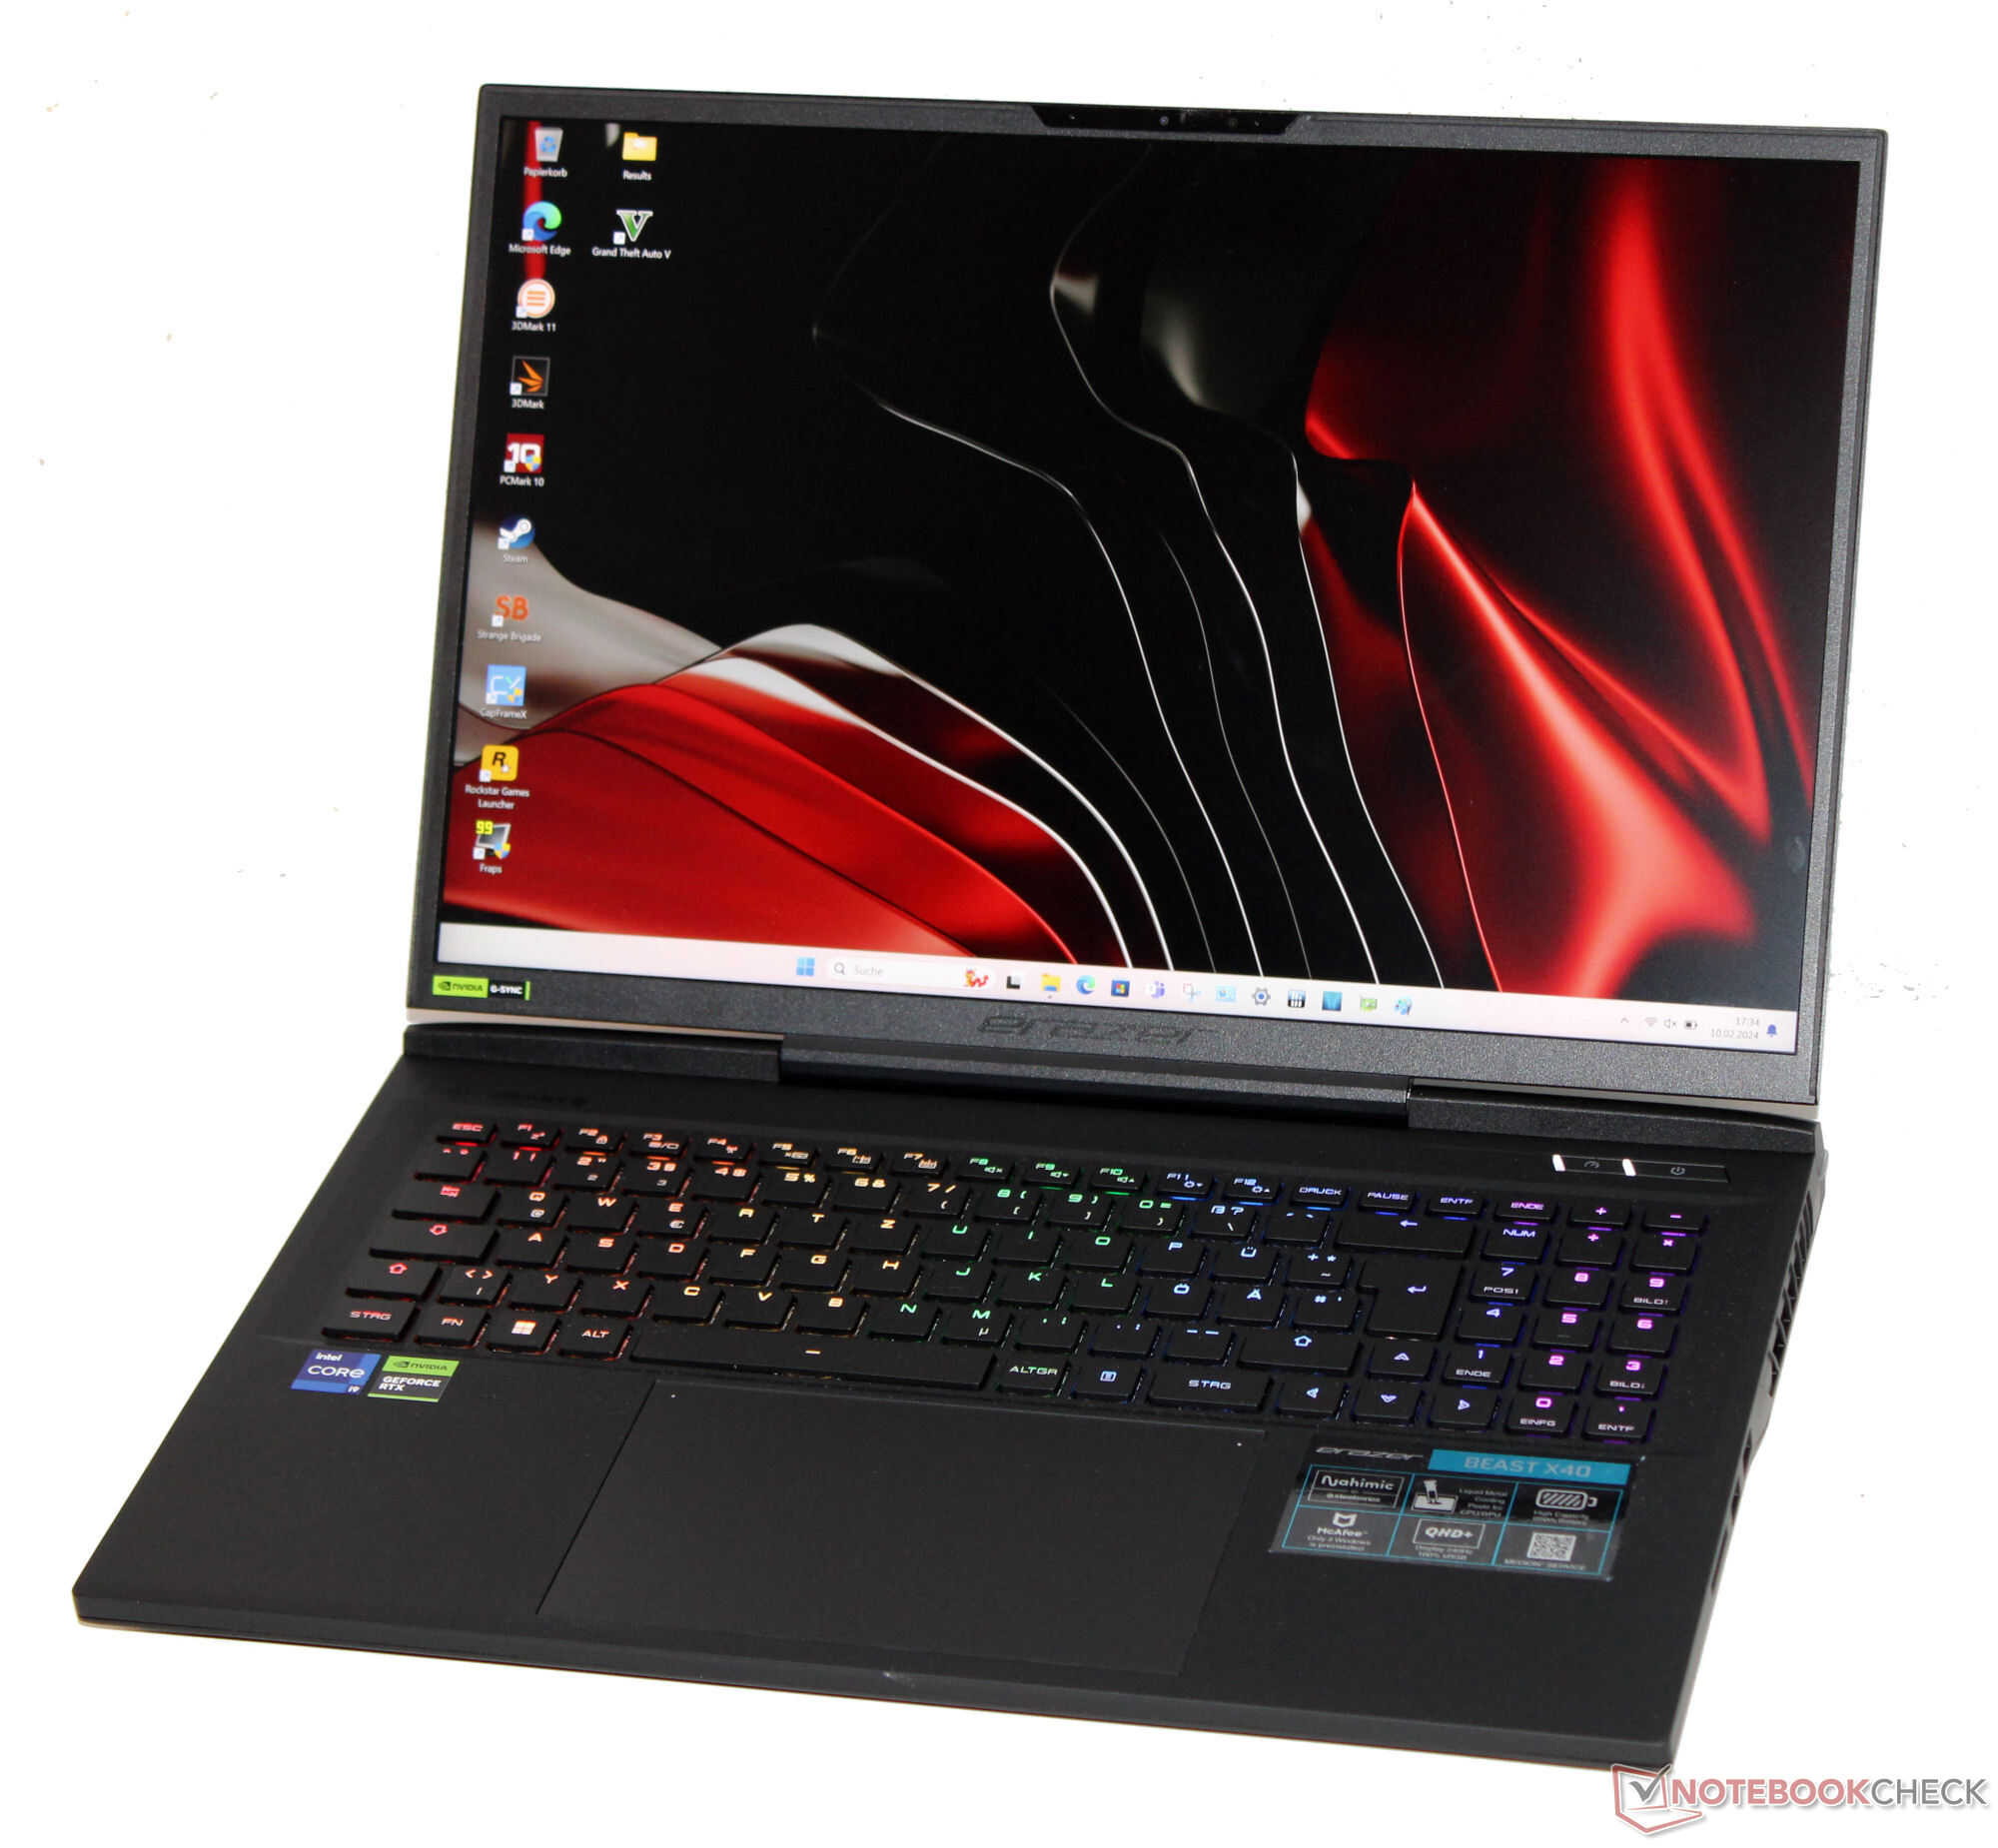
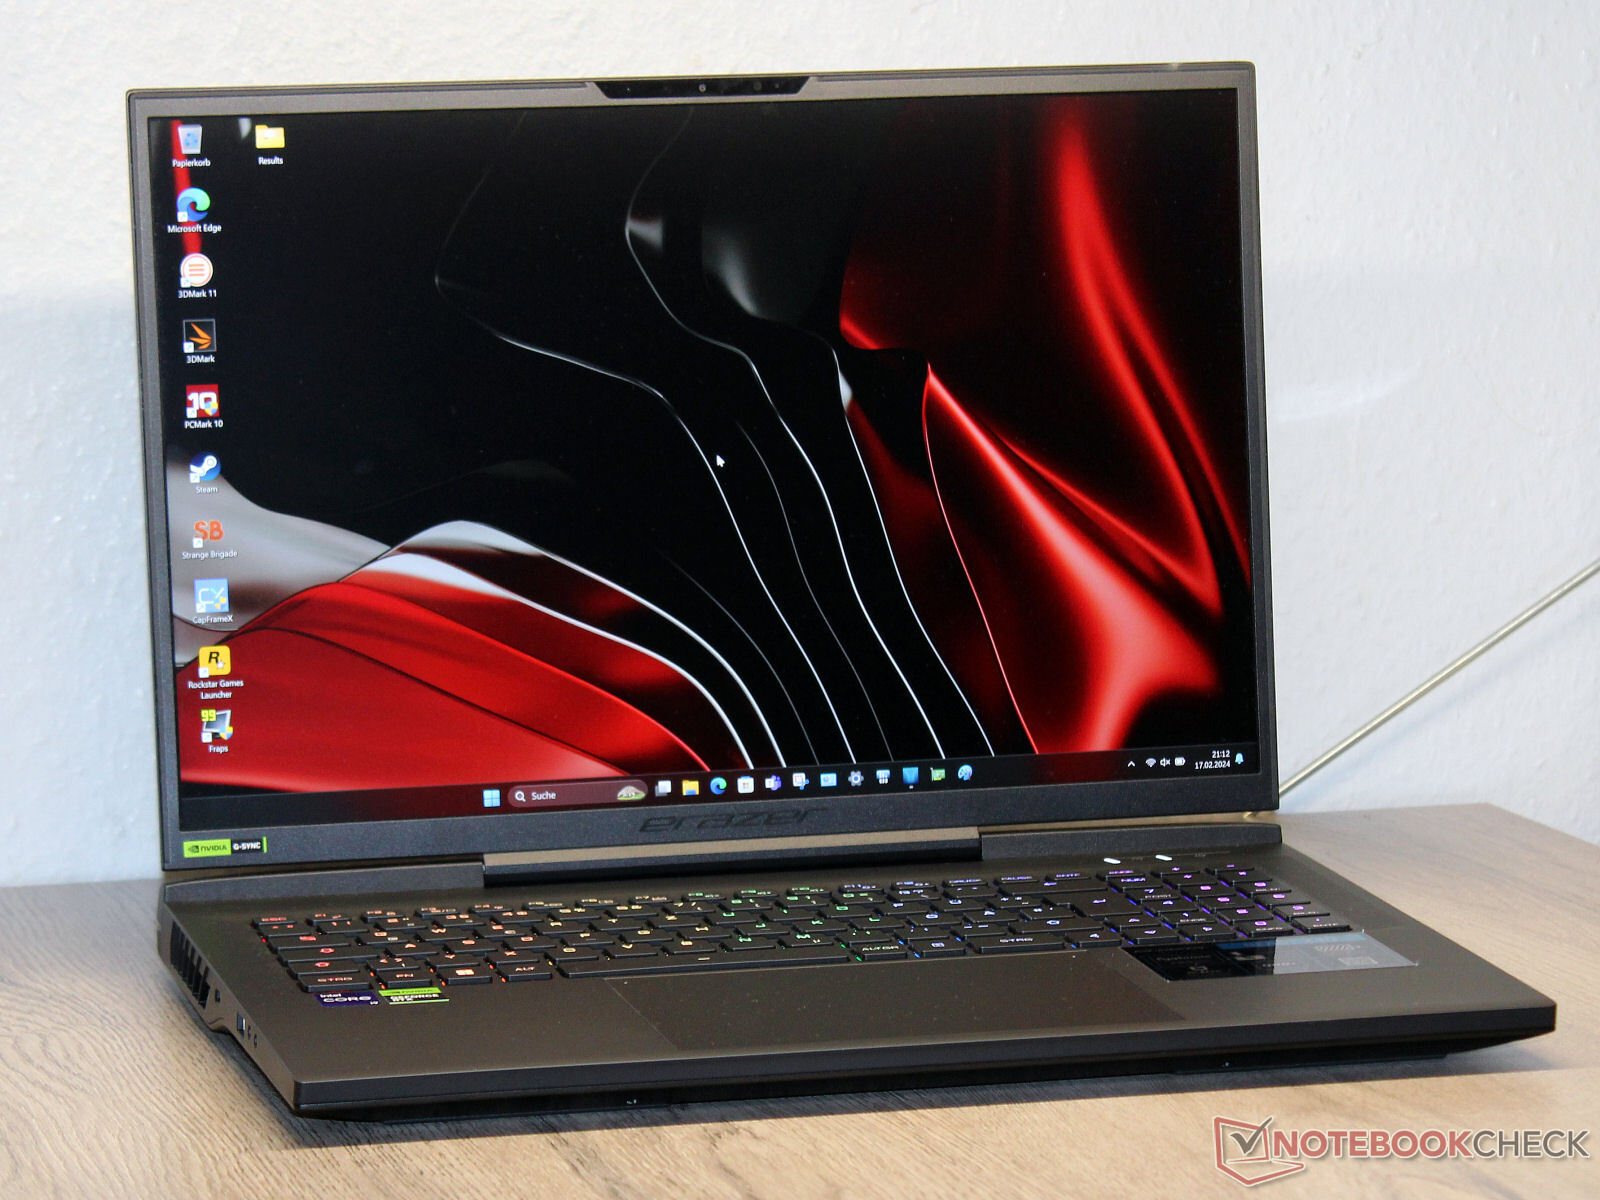
Test du Medion Erazer Beast X40 (2024) : gaming haut de gamme avec RTX 4090 et clavier mécanique

Le Medion Beast X40 est l'un des ordinateurs portables les plus puissants actuellement disponibles. Intel Raptor Lake, Nvidia Ada Lovelace, 2 To d'espace de stockage et 32 Go de RAM s'additionnent pour équiper l'ordinateur portable pour le streaming, le rendu et le jeu, tout en coûtant une bombe à environ 4 000 €.
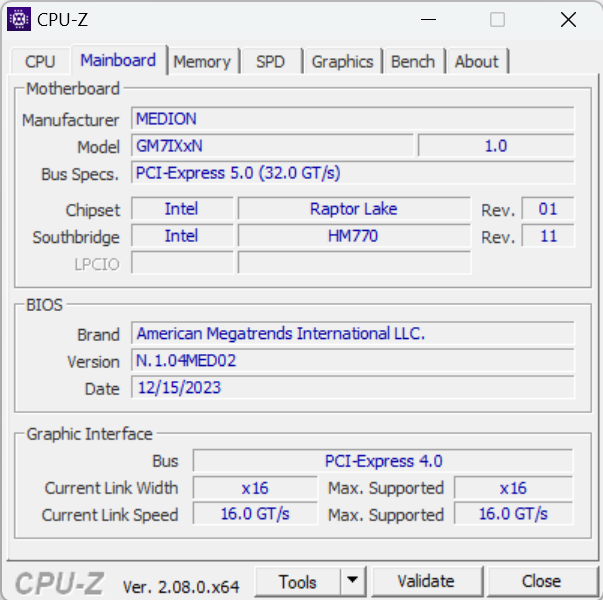
Comme pour son prédécesseurle Beast X40 est construit à partir d'un châssis Tongfang barebone (GM7IX9N). La concurrence comprend des ordinateurs portables de jeu tels que le Asus ROG Strix Scar 17 G733PYVle Schenker Key 17 Pro (Début 23)et le MSI Titan 18 HX A14VIG.
Comparaison avec les concurrents potentiels
Note | Date | Modèle | Poids | Épaisseur | Taille | Résolution | Prix |
|---|---|---|---|---|---|---|---|
| 89.2 % v7 (old) | 02/24 | Medion Erazer Beast X40 2024 i9-14900HX, GeForce RTX 4090 Laptop GPU | 2.9 kg | 36 mm | 17.00" | 2560x1600 | |
| 87.2 % v7 (old) | 08/23 | Asus ROG Strix Scar 17 G733PYV-LL053X R9 7945HX3D, GeForce RTX 4090 Laptop GPU | 2.9 kg | 28.3 mm | 17.30" | 2560x1440 | |
| 85.5 % v7 (old) | 06/23 | Schenker Key 17 Pro (Early 23) i9-13900HX, GeForce RTX 4090 Laptop GPU | 3.4 kg | 24.9 mm | 17.30" | 3840x2160 | |
| 88.3 % v7 (old) | 02/24 | Asus ROG Strix Scar 18 G834JYR (2024) i9-14900HX, GeForce RTX 4090 Laptop GPU | 3.1 kg | 30.8 mm | 18.00" | 2560x1600 | |
| 88.8 % v7 (old) | 01/24 | MSI Titan 18 HX A14VIG i9-14900HX, GeForce RTX 4090 Laptop GPU | 3.6 kg | 32.1 mm | 18.00" | 3840x2400 |
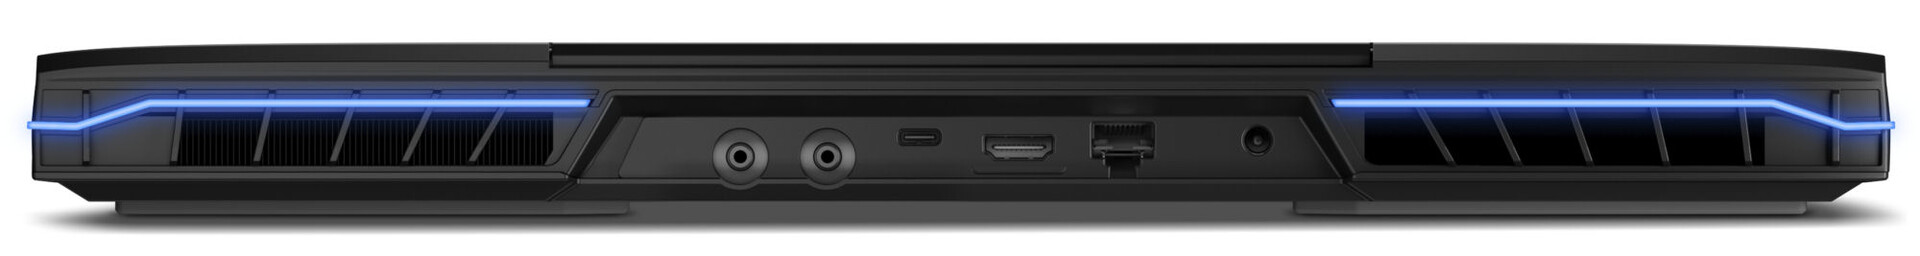
Châssis et caractéristiques : Le Beast X40 offre le Thunderbolt 4
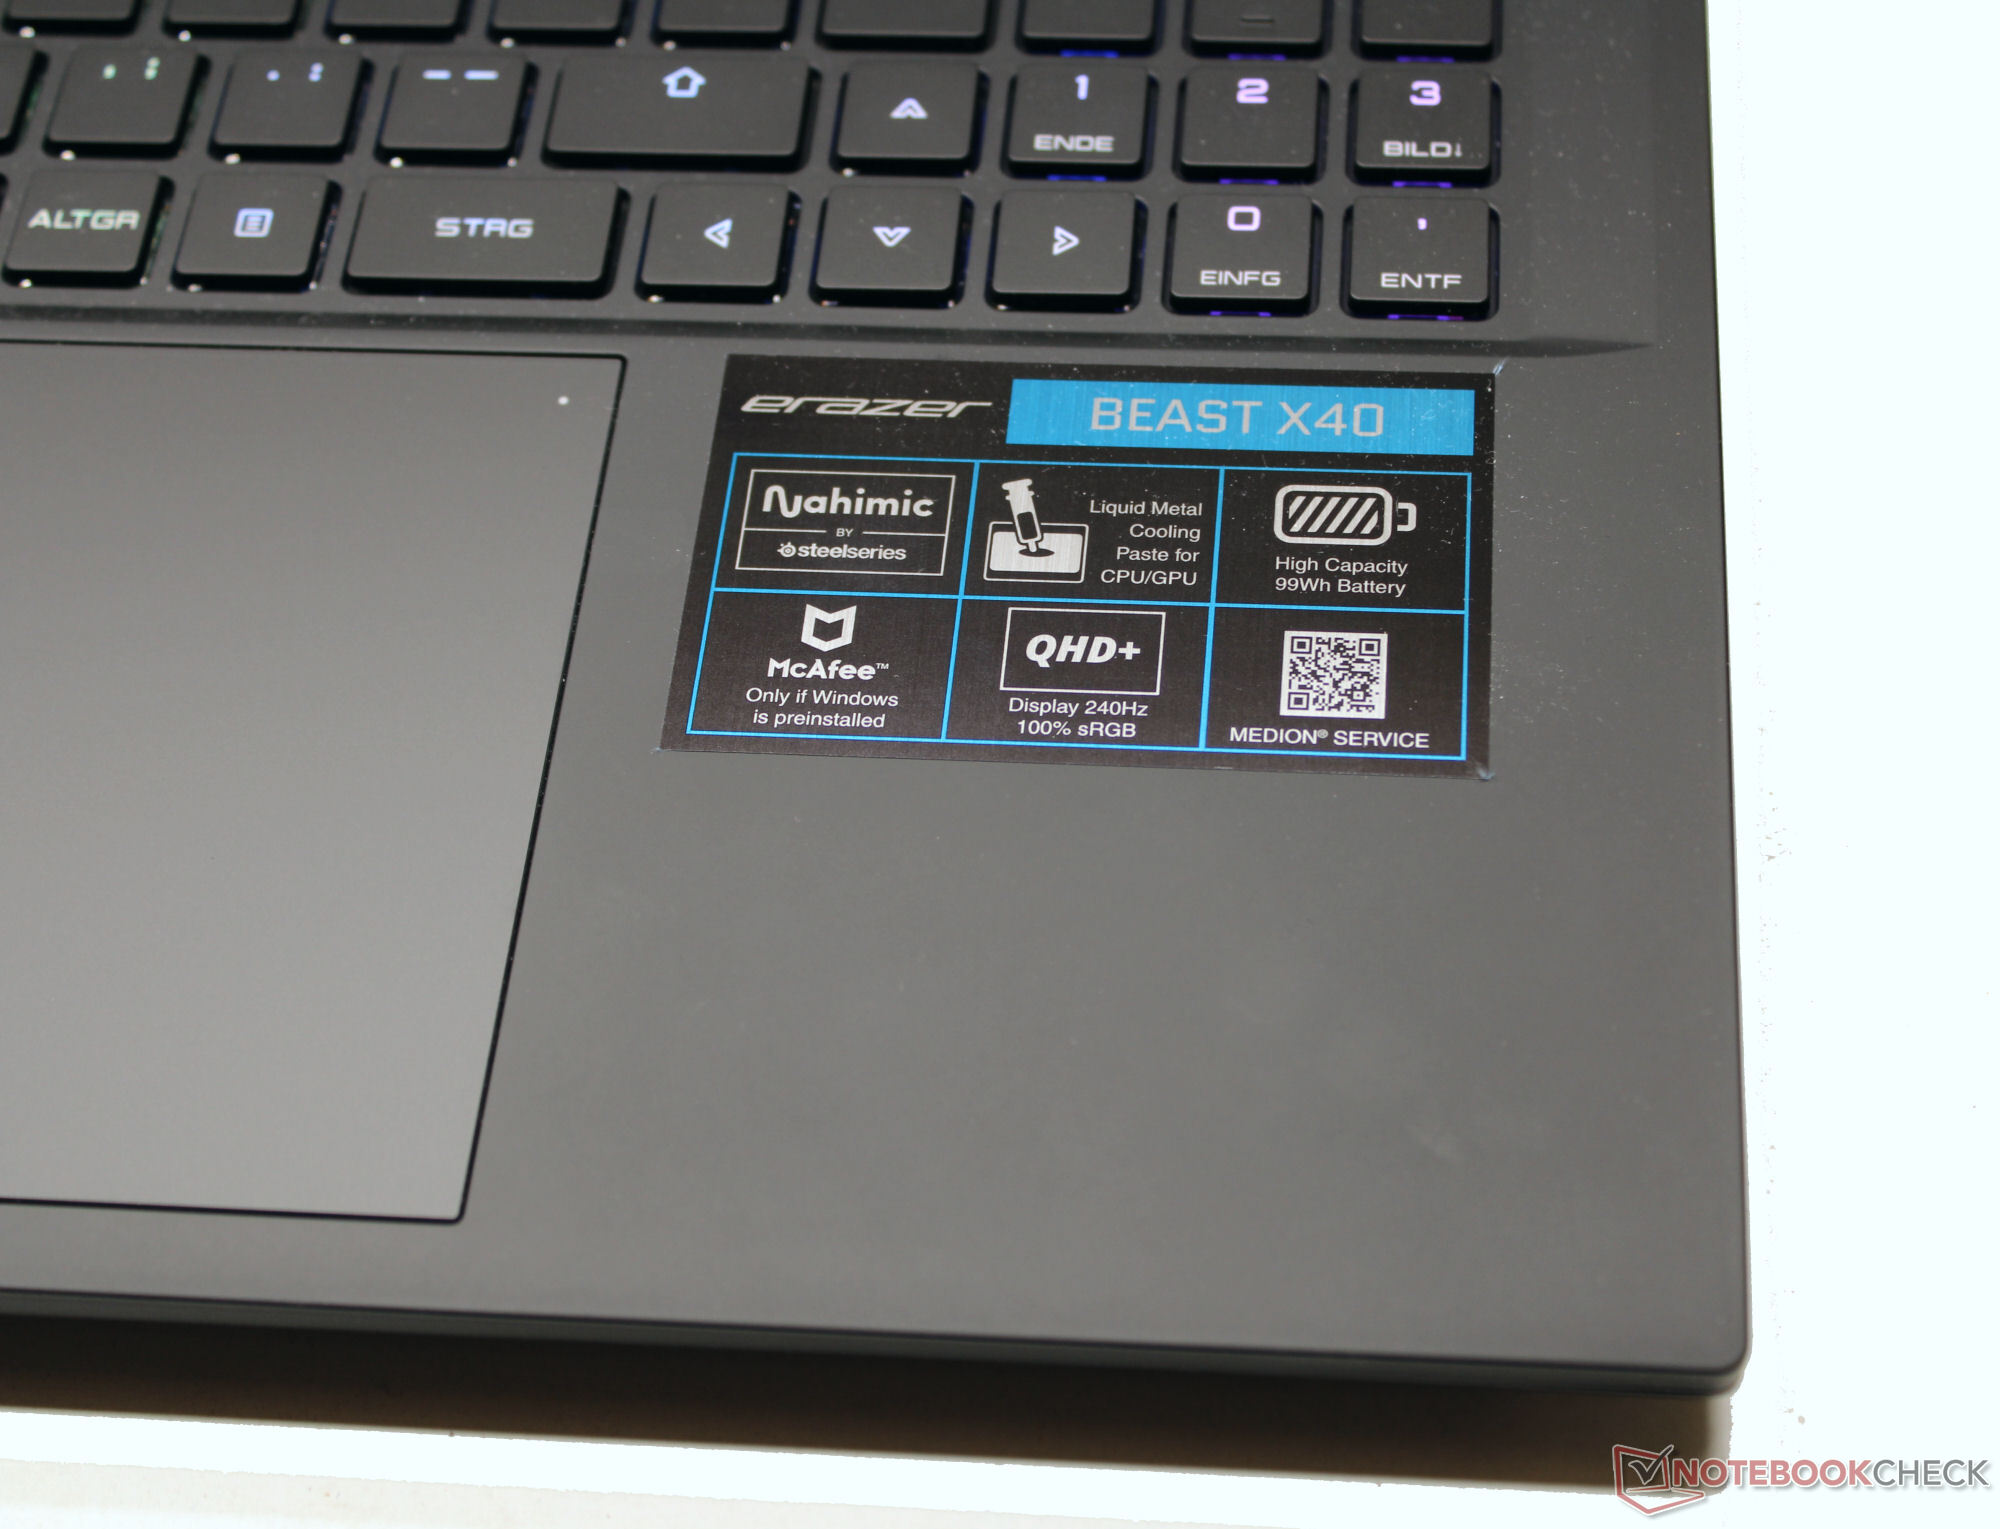
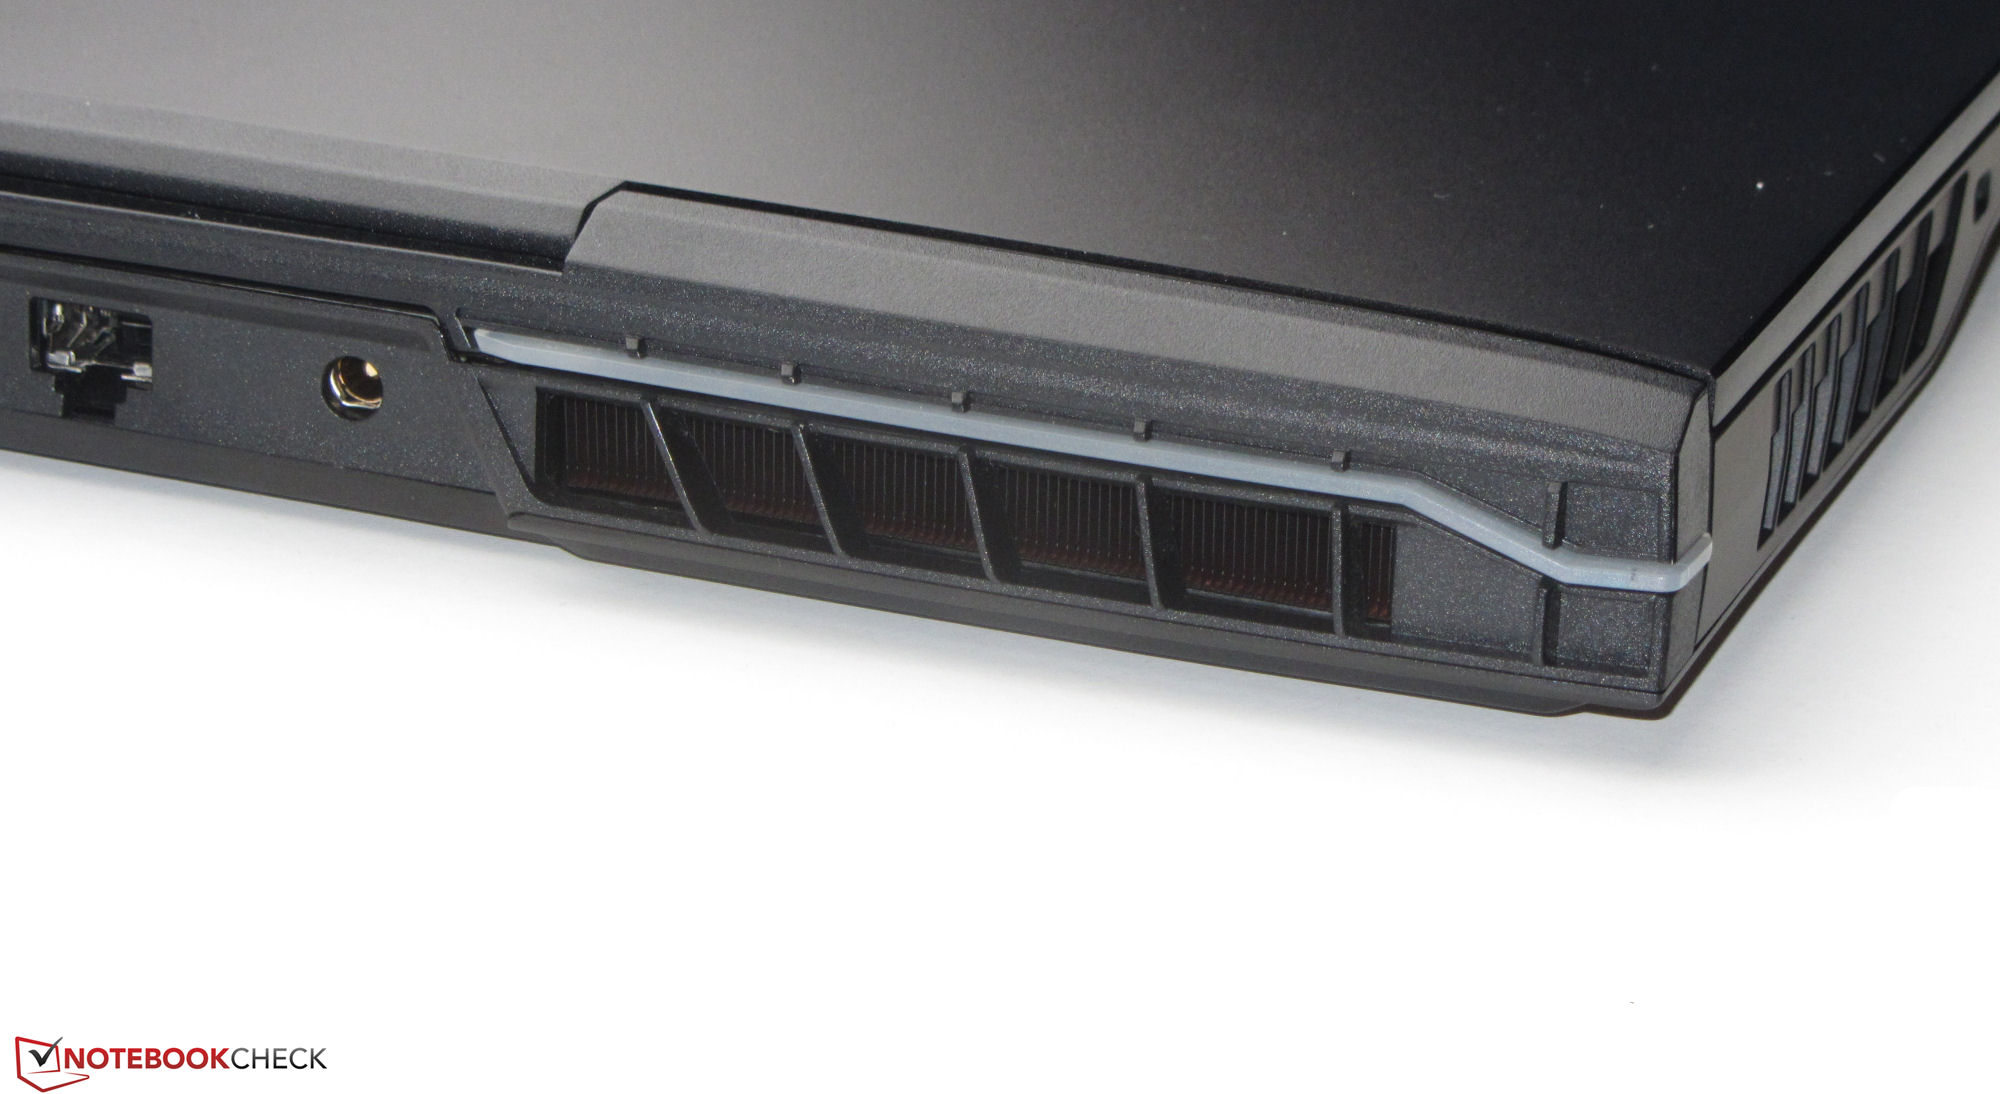
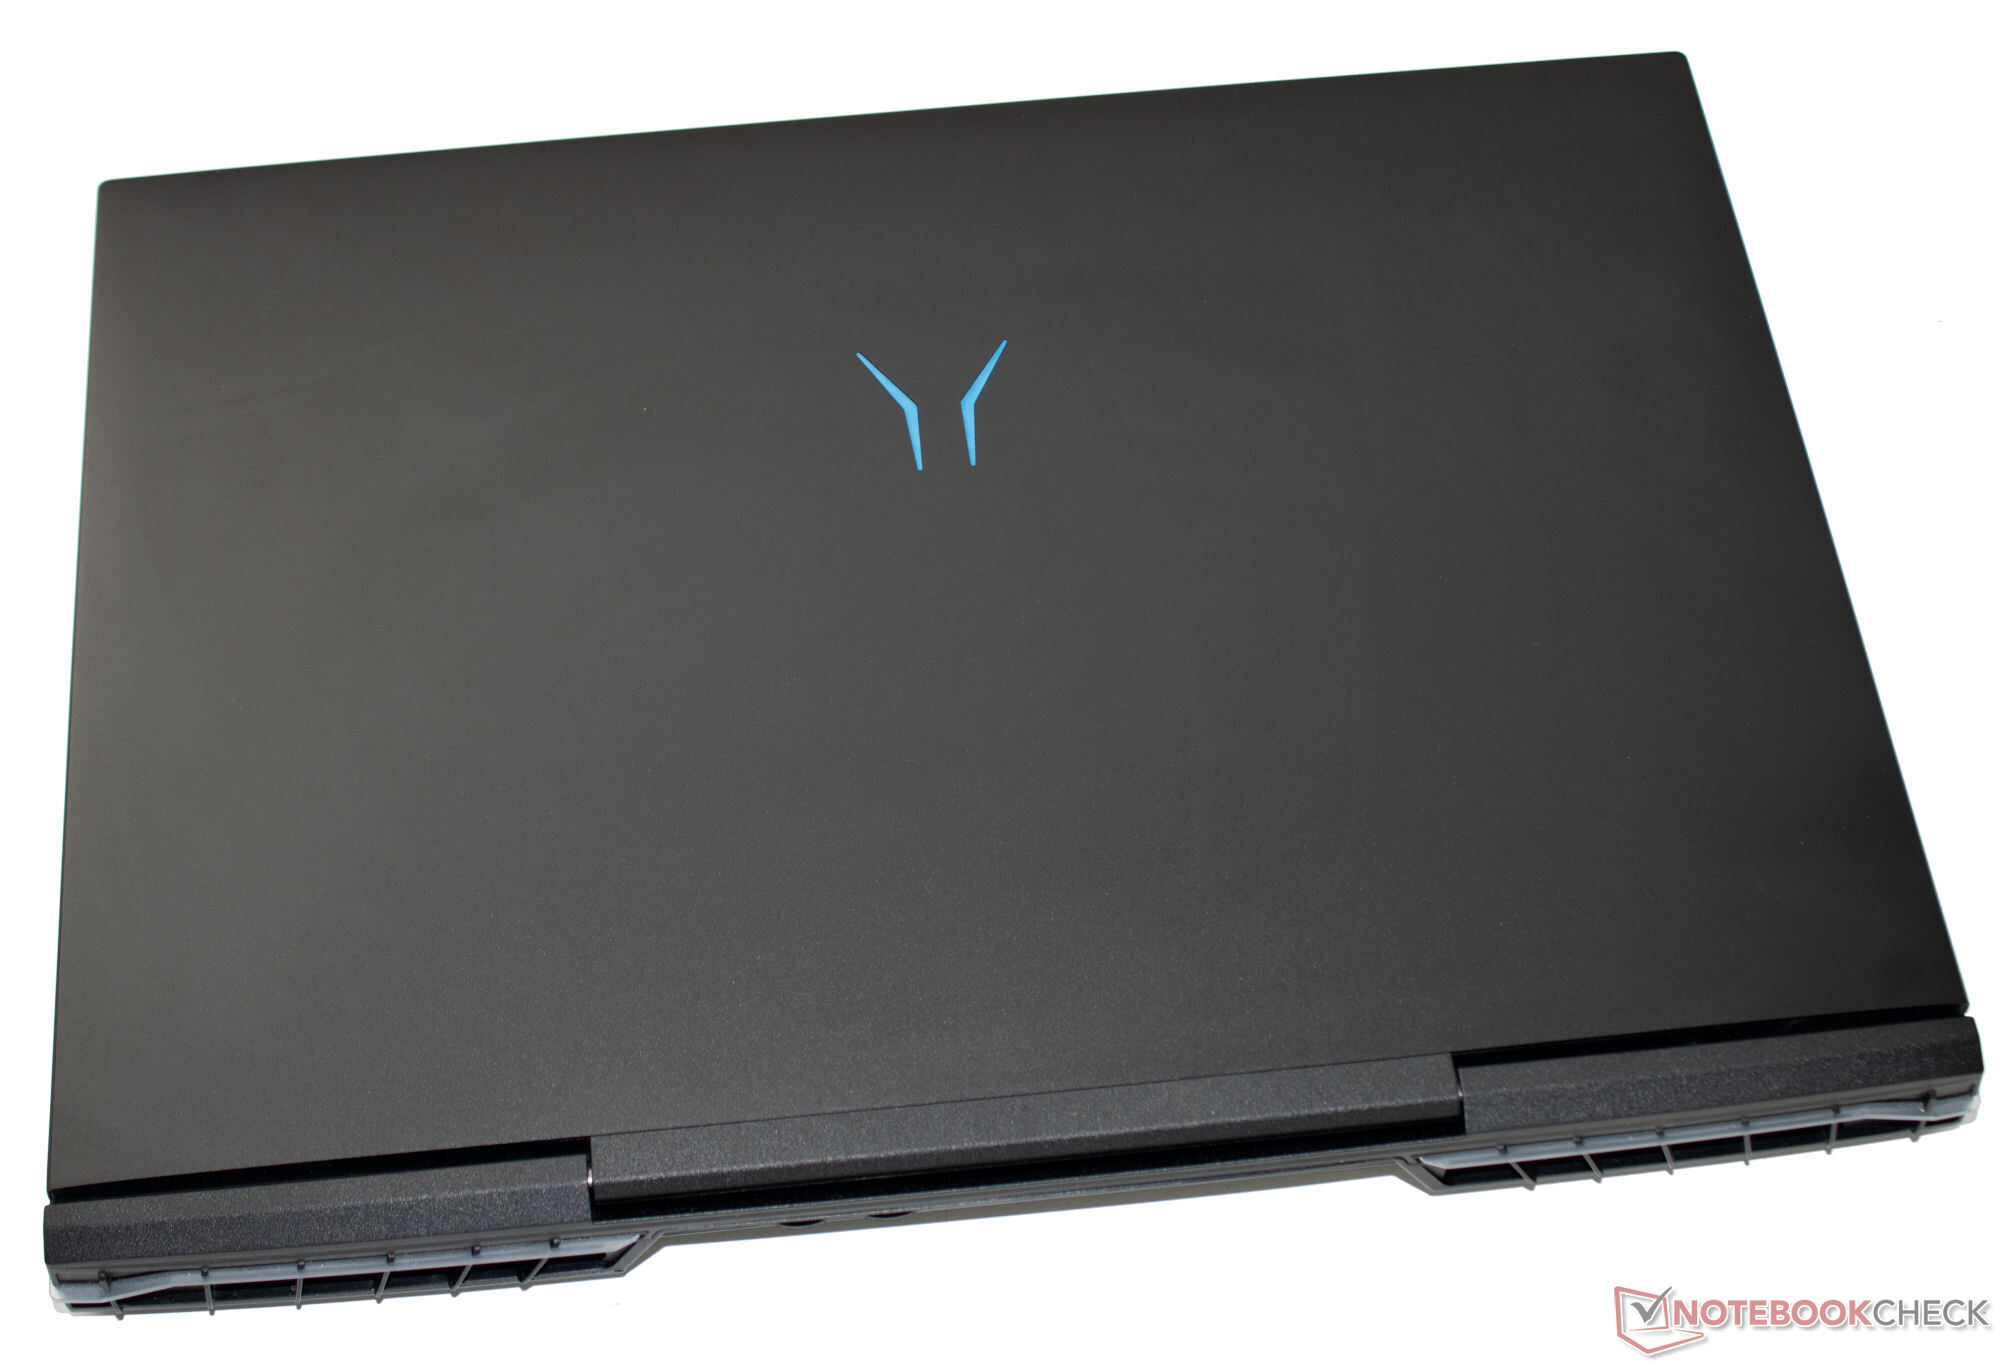
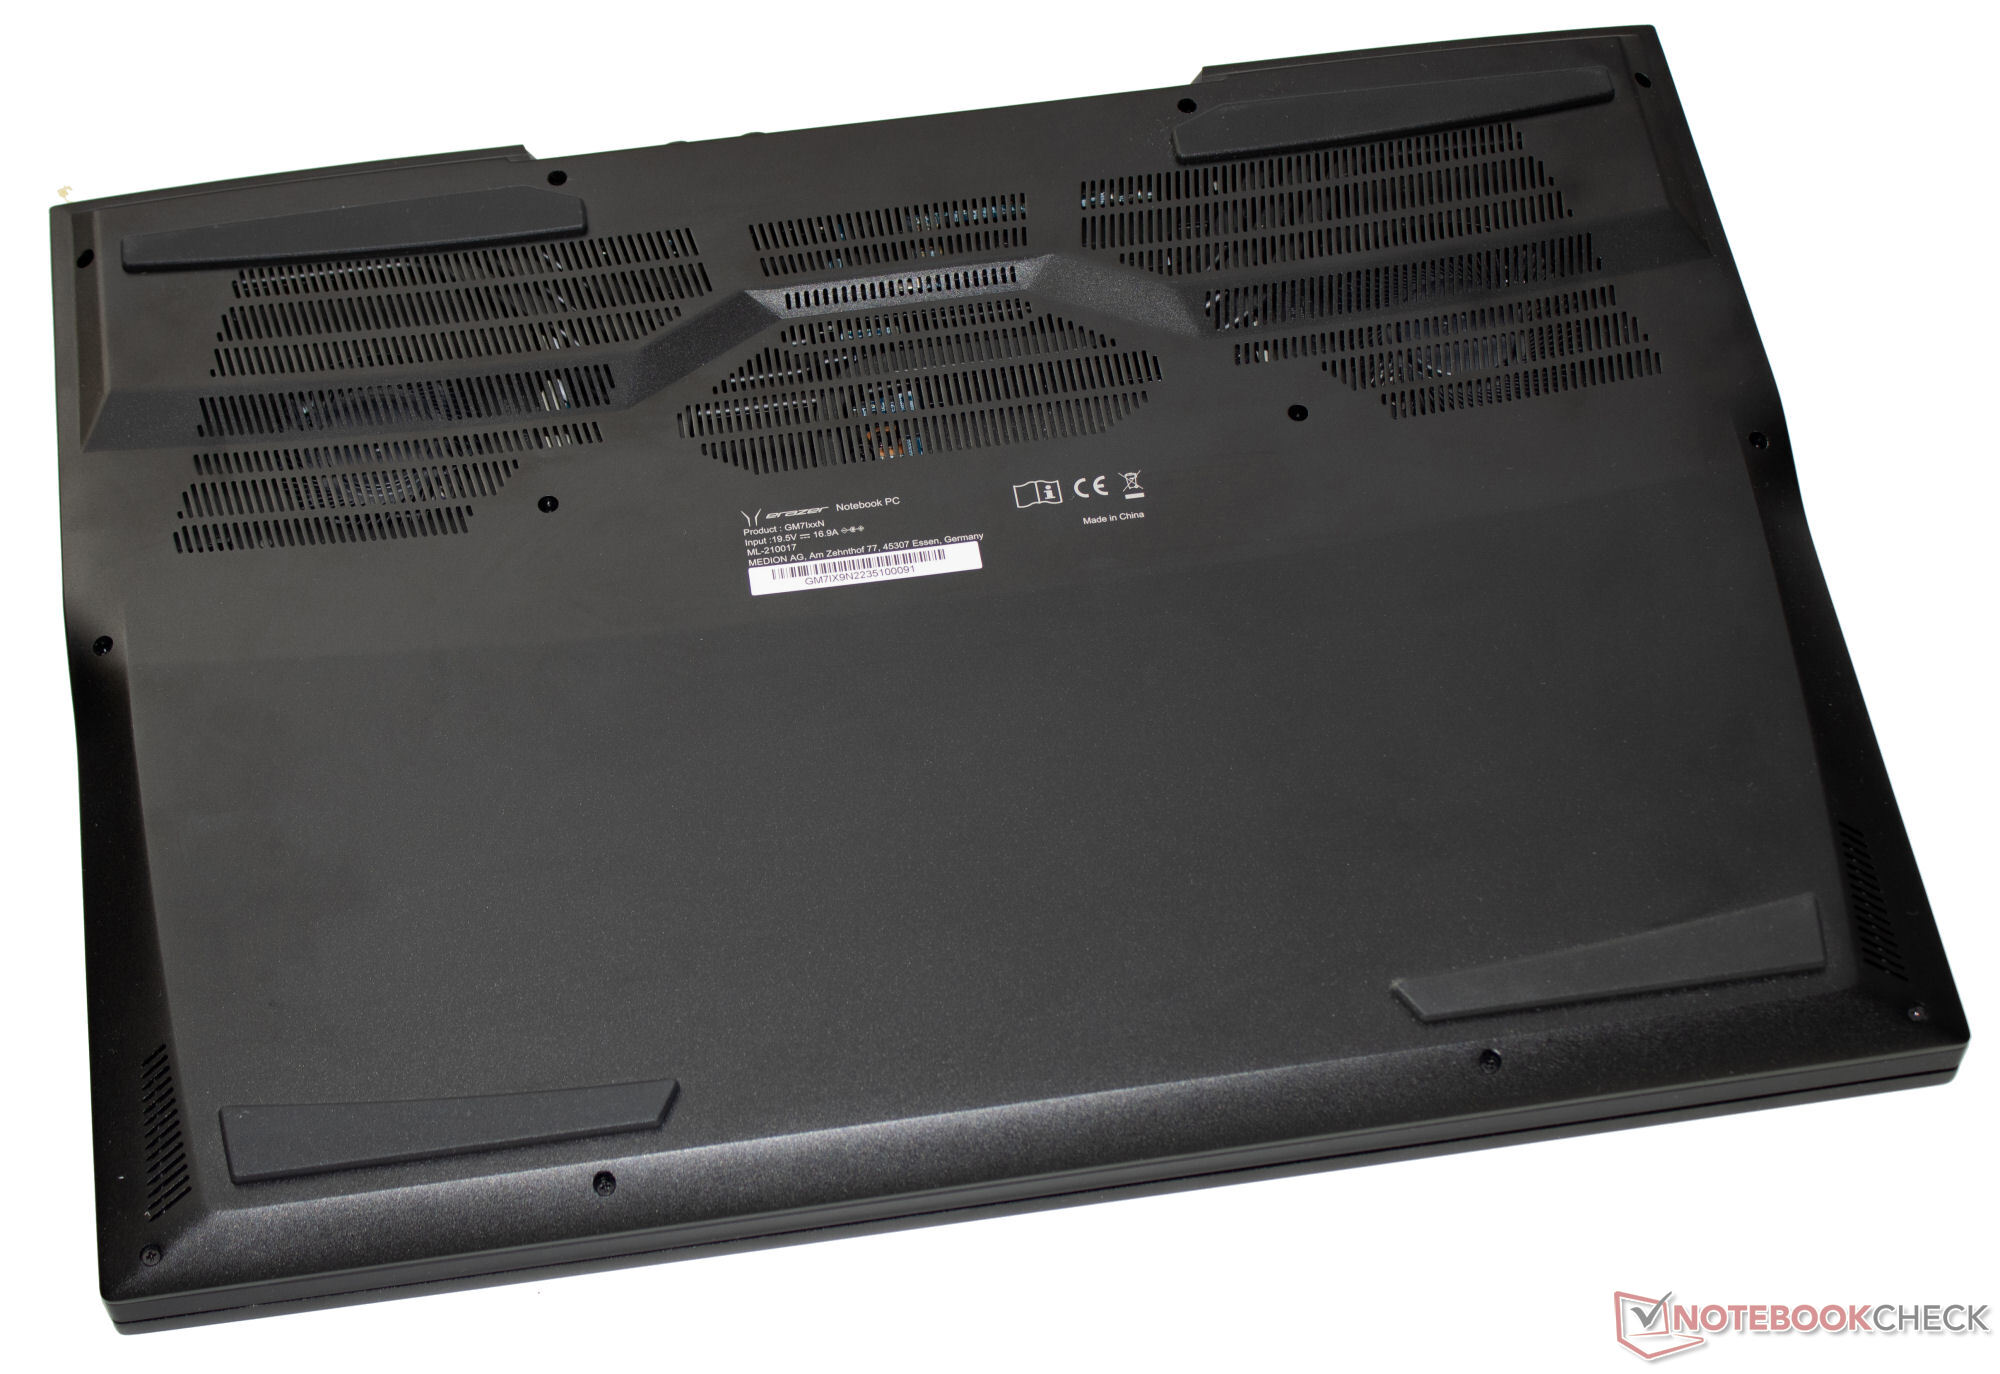
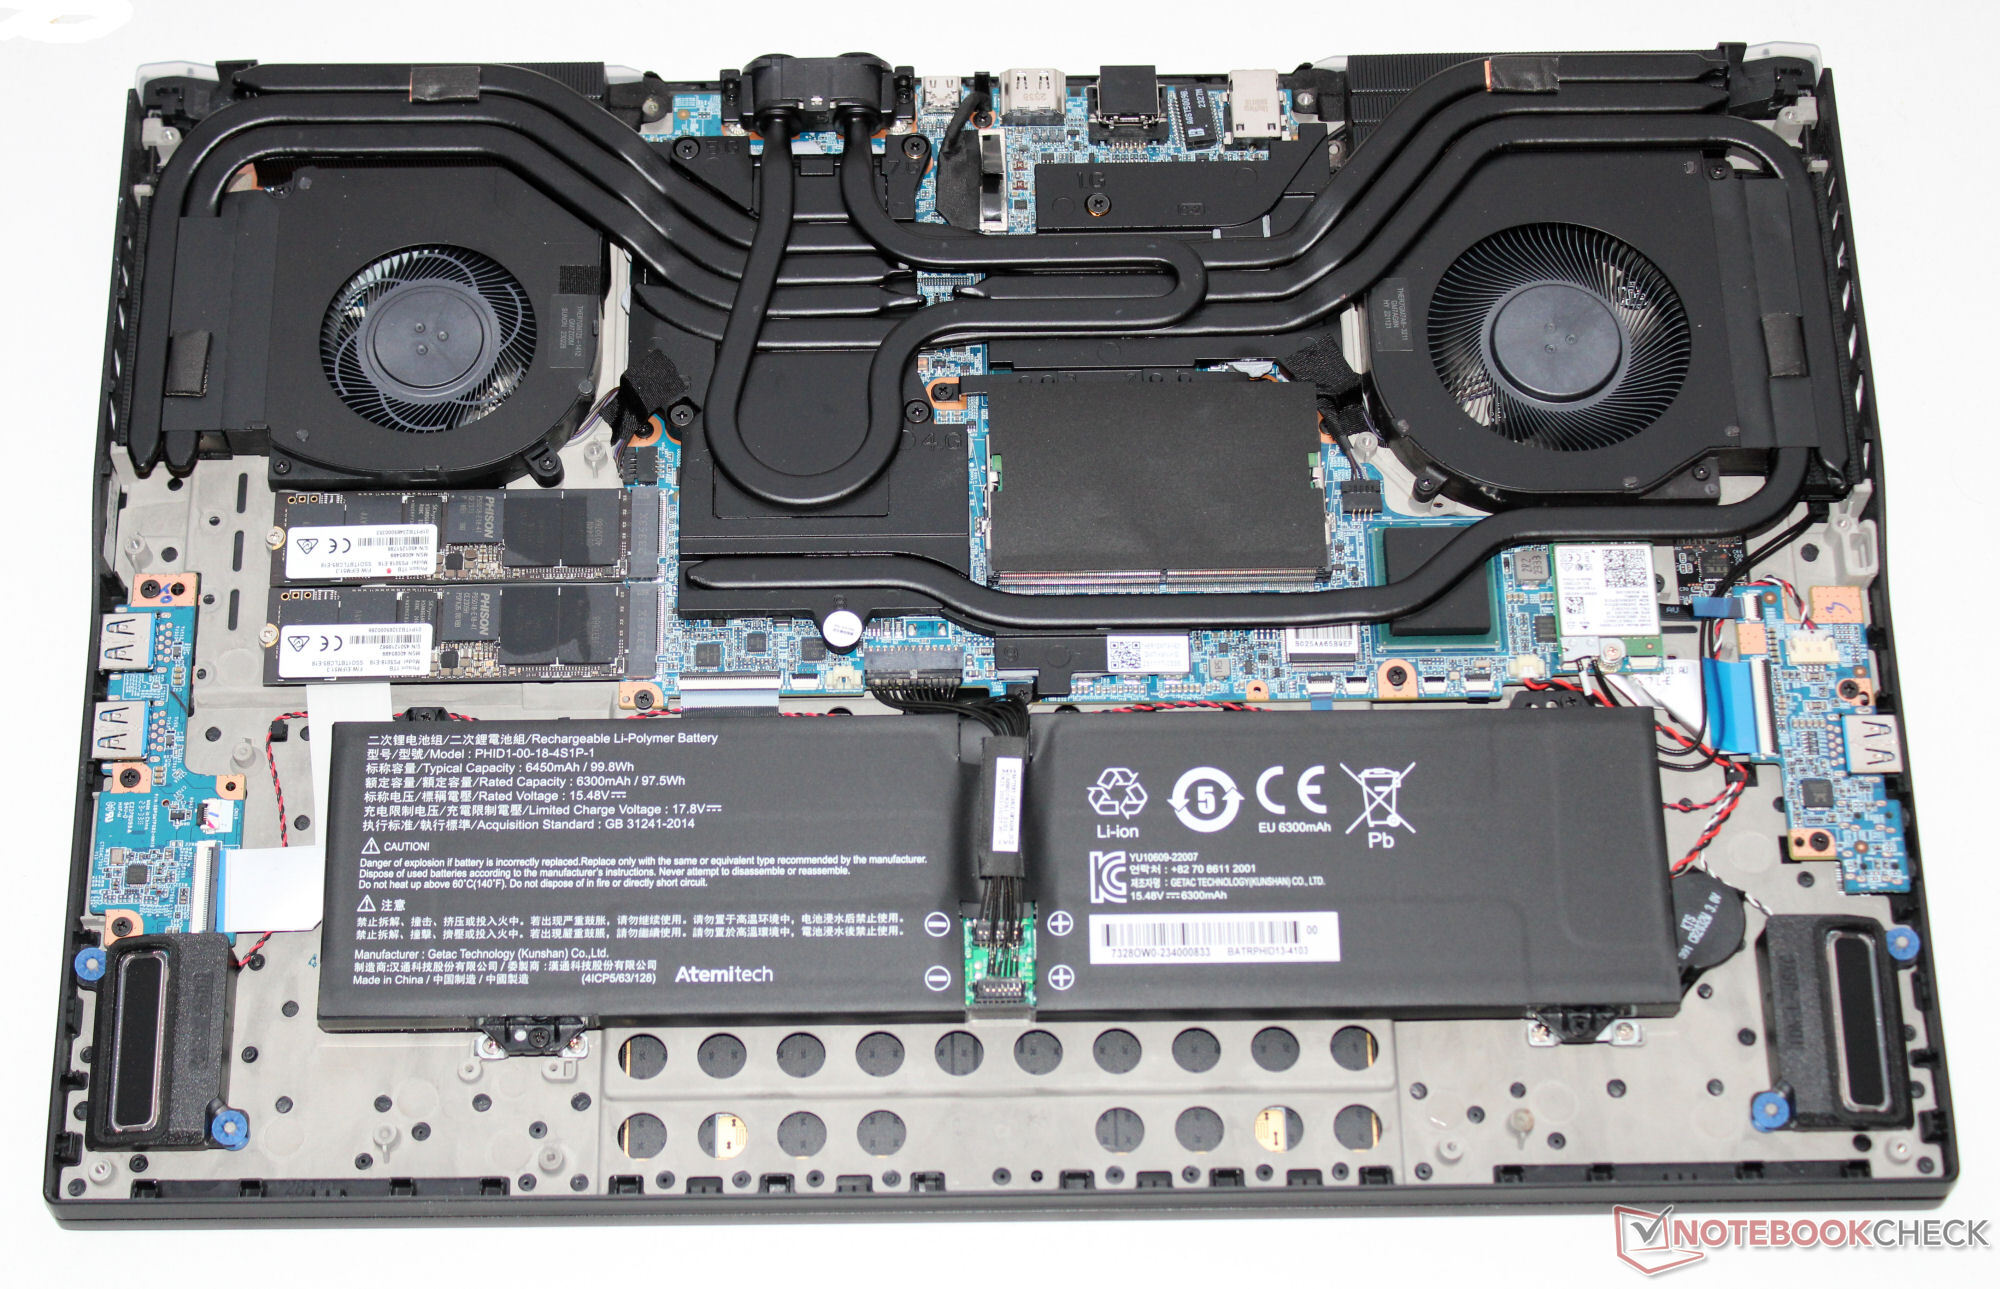
La technologie du Beast X40 est logée dans un boîtier métallique noir mat, robuste et élégant, aux surfaces lisses. L'unité de base est recouverte d'un revêtement en caoutchouc antidérapant. Deux bandes de LED RVB au-dessus des sorties d'air arrière, le logo éclairé du couvercle et l'éclairage des touches RVB ajoutent une touche de couleur. La batterie (vissée et non collée) et les autres composants internes sont accessibles après avoir retiré le panneau inférieur.
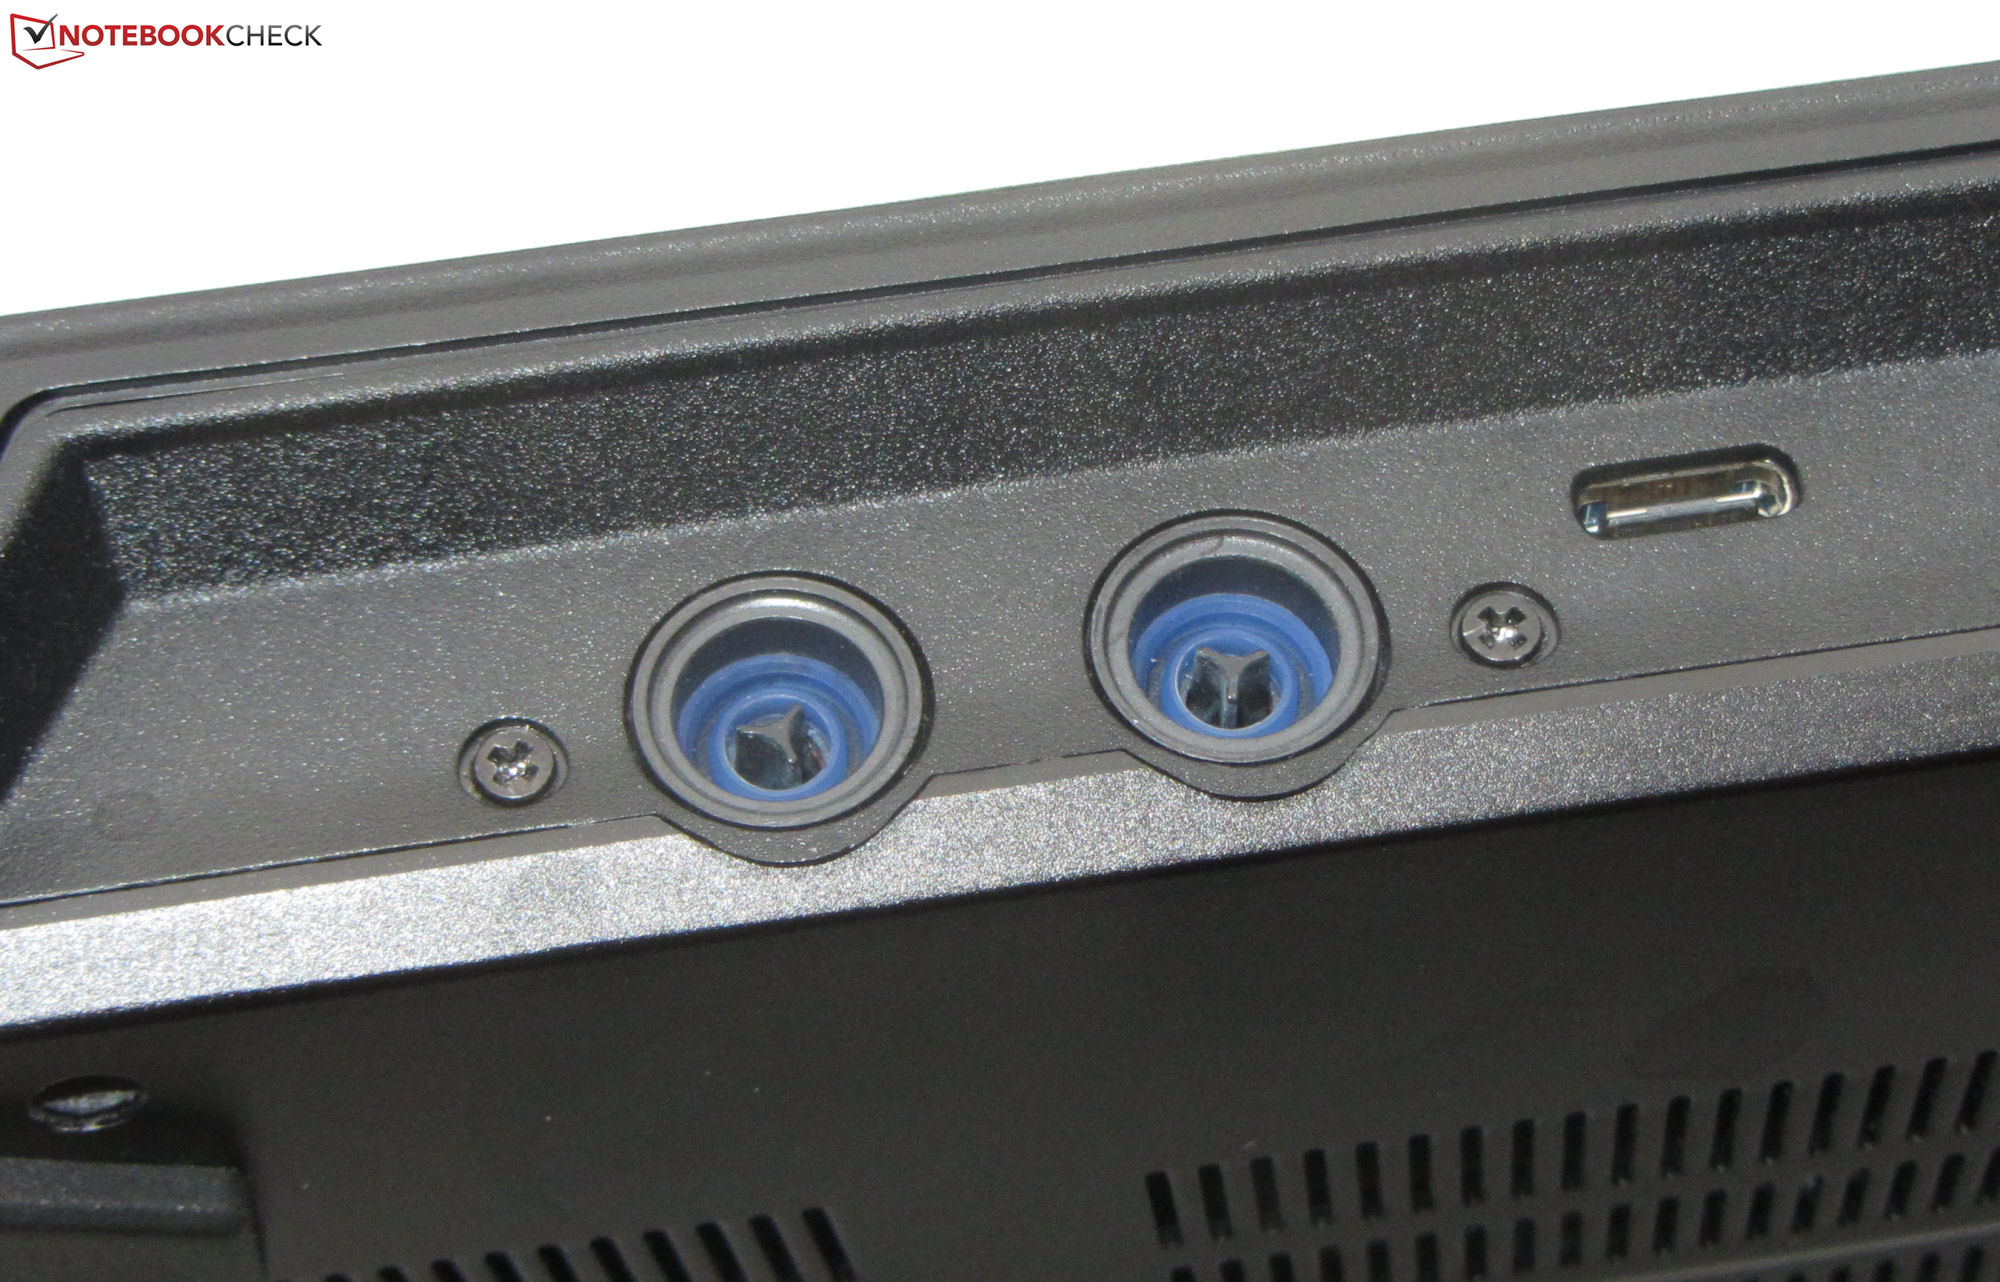
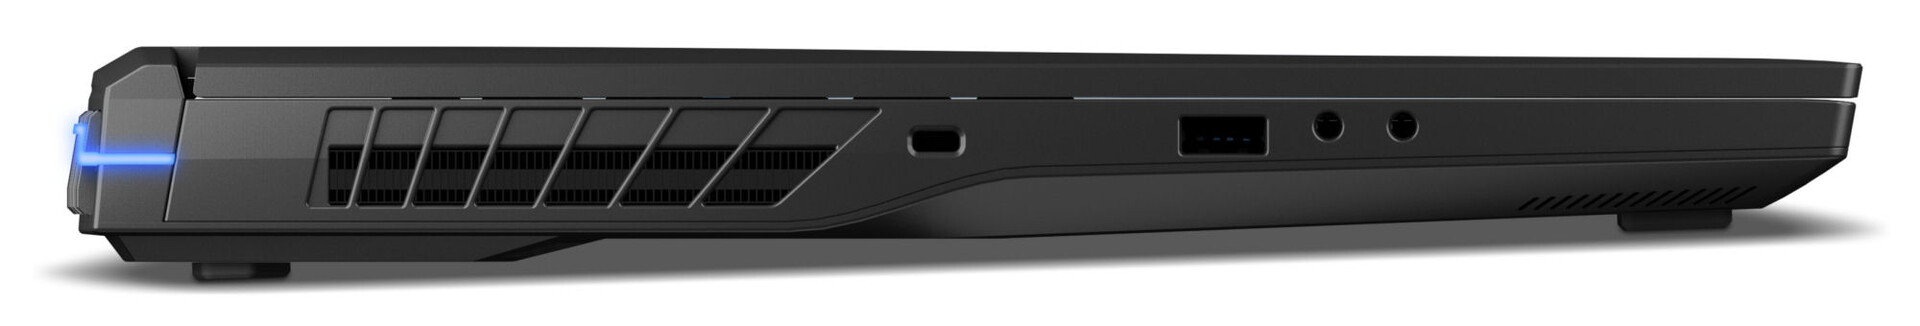
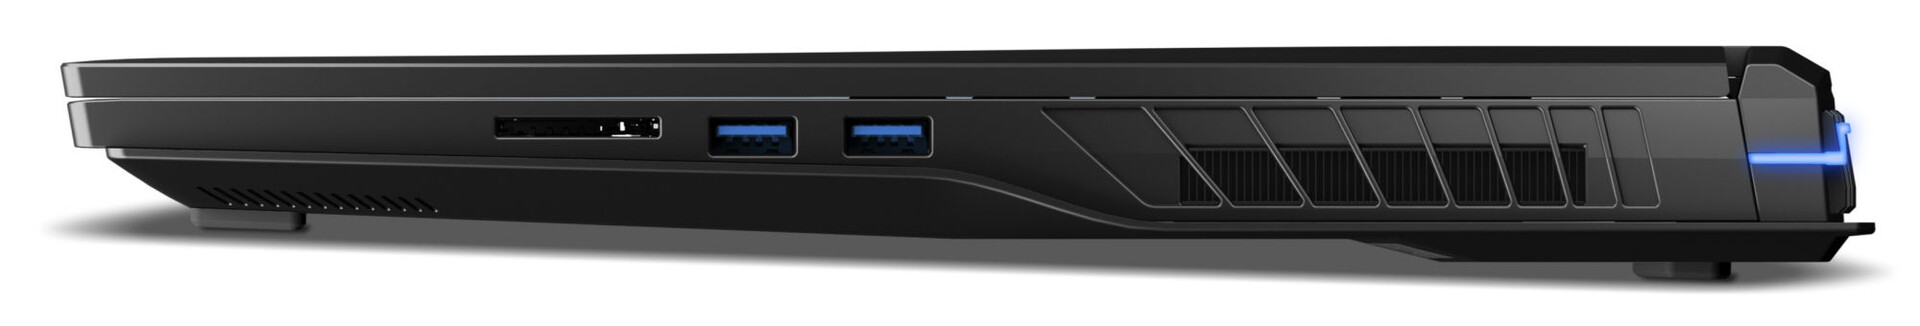
L'Erazer arbore trois ports USB-A (2x USB 3.2 Gen 1 et 1x USB 3.2 Gen 2) et un port USB Type-C sous la forme d'un Thunderbolt 4. Nous avons pu confirmer que ce dernier peut sortir un signal DisplayPort et prend en charge Power Delivery. Au total, l'ordinateur portable dispose de deux sorties vidéo (HDMI 2.1 et DisplayPort).
Nous avons testé le lecteur de carte mémoire SD avec notre carte de référence AV Pro SD microSD 128 GB V60 et avons constaté qu'il offrait des vitesses de lecture supérieures à la moyenne. La webcam 1080p est fournie en standard.
L'Erazer Beast X40 utilise une puce Intel Wi-Fi 6E AX211 tandis que les connexions filaires sont gérées par un contrôleur Realtek RTL8125 2.5 GbE. L'ordinateur portable offre de solides performances Wi-Fi lors de nos tests en utilisant le routeur de référence Asus ROG Rapture GT-AXE11000 sans aucun autre périphérique Wi-Fi à proximité immédiate et à une courte distance entre l'ordinateur portable et le PC serveur.
| SD Card Reader | |
| average JPG Copy Test (av. of 3 runs) | |
| Moyenne de la classe Gaming (20.9 - 210, n=54, 2 dernières années) | |
| MSI Titan 18 HX A14VIG (Toshiba Exceria Pro SDXC 64 GB UHS-II) | |
| Medion Erazer Beast X40 (AV PRO microSD 128 GB V60) | |
| Medion Erazer Beast X40 2024 (AV PRO microSD 128 GB V60) | |
| maximum AS SSD Seq Read Test (1GB) | |
| Moyenne de la classe Gaming (25.5 - 261, n=51, 2 dernières années) | |
| MSI Titan 18 HX A14VIG (Toshiba Exceria Pro SDXC 64 GB UHS-II) | |
| Medion Erazer Beast X40 2024 (AV PRO microSD 128 GB V60) | |
| Medion Erazer Beast X40 (AV PRO microSD 128 GB V60) | |


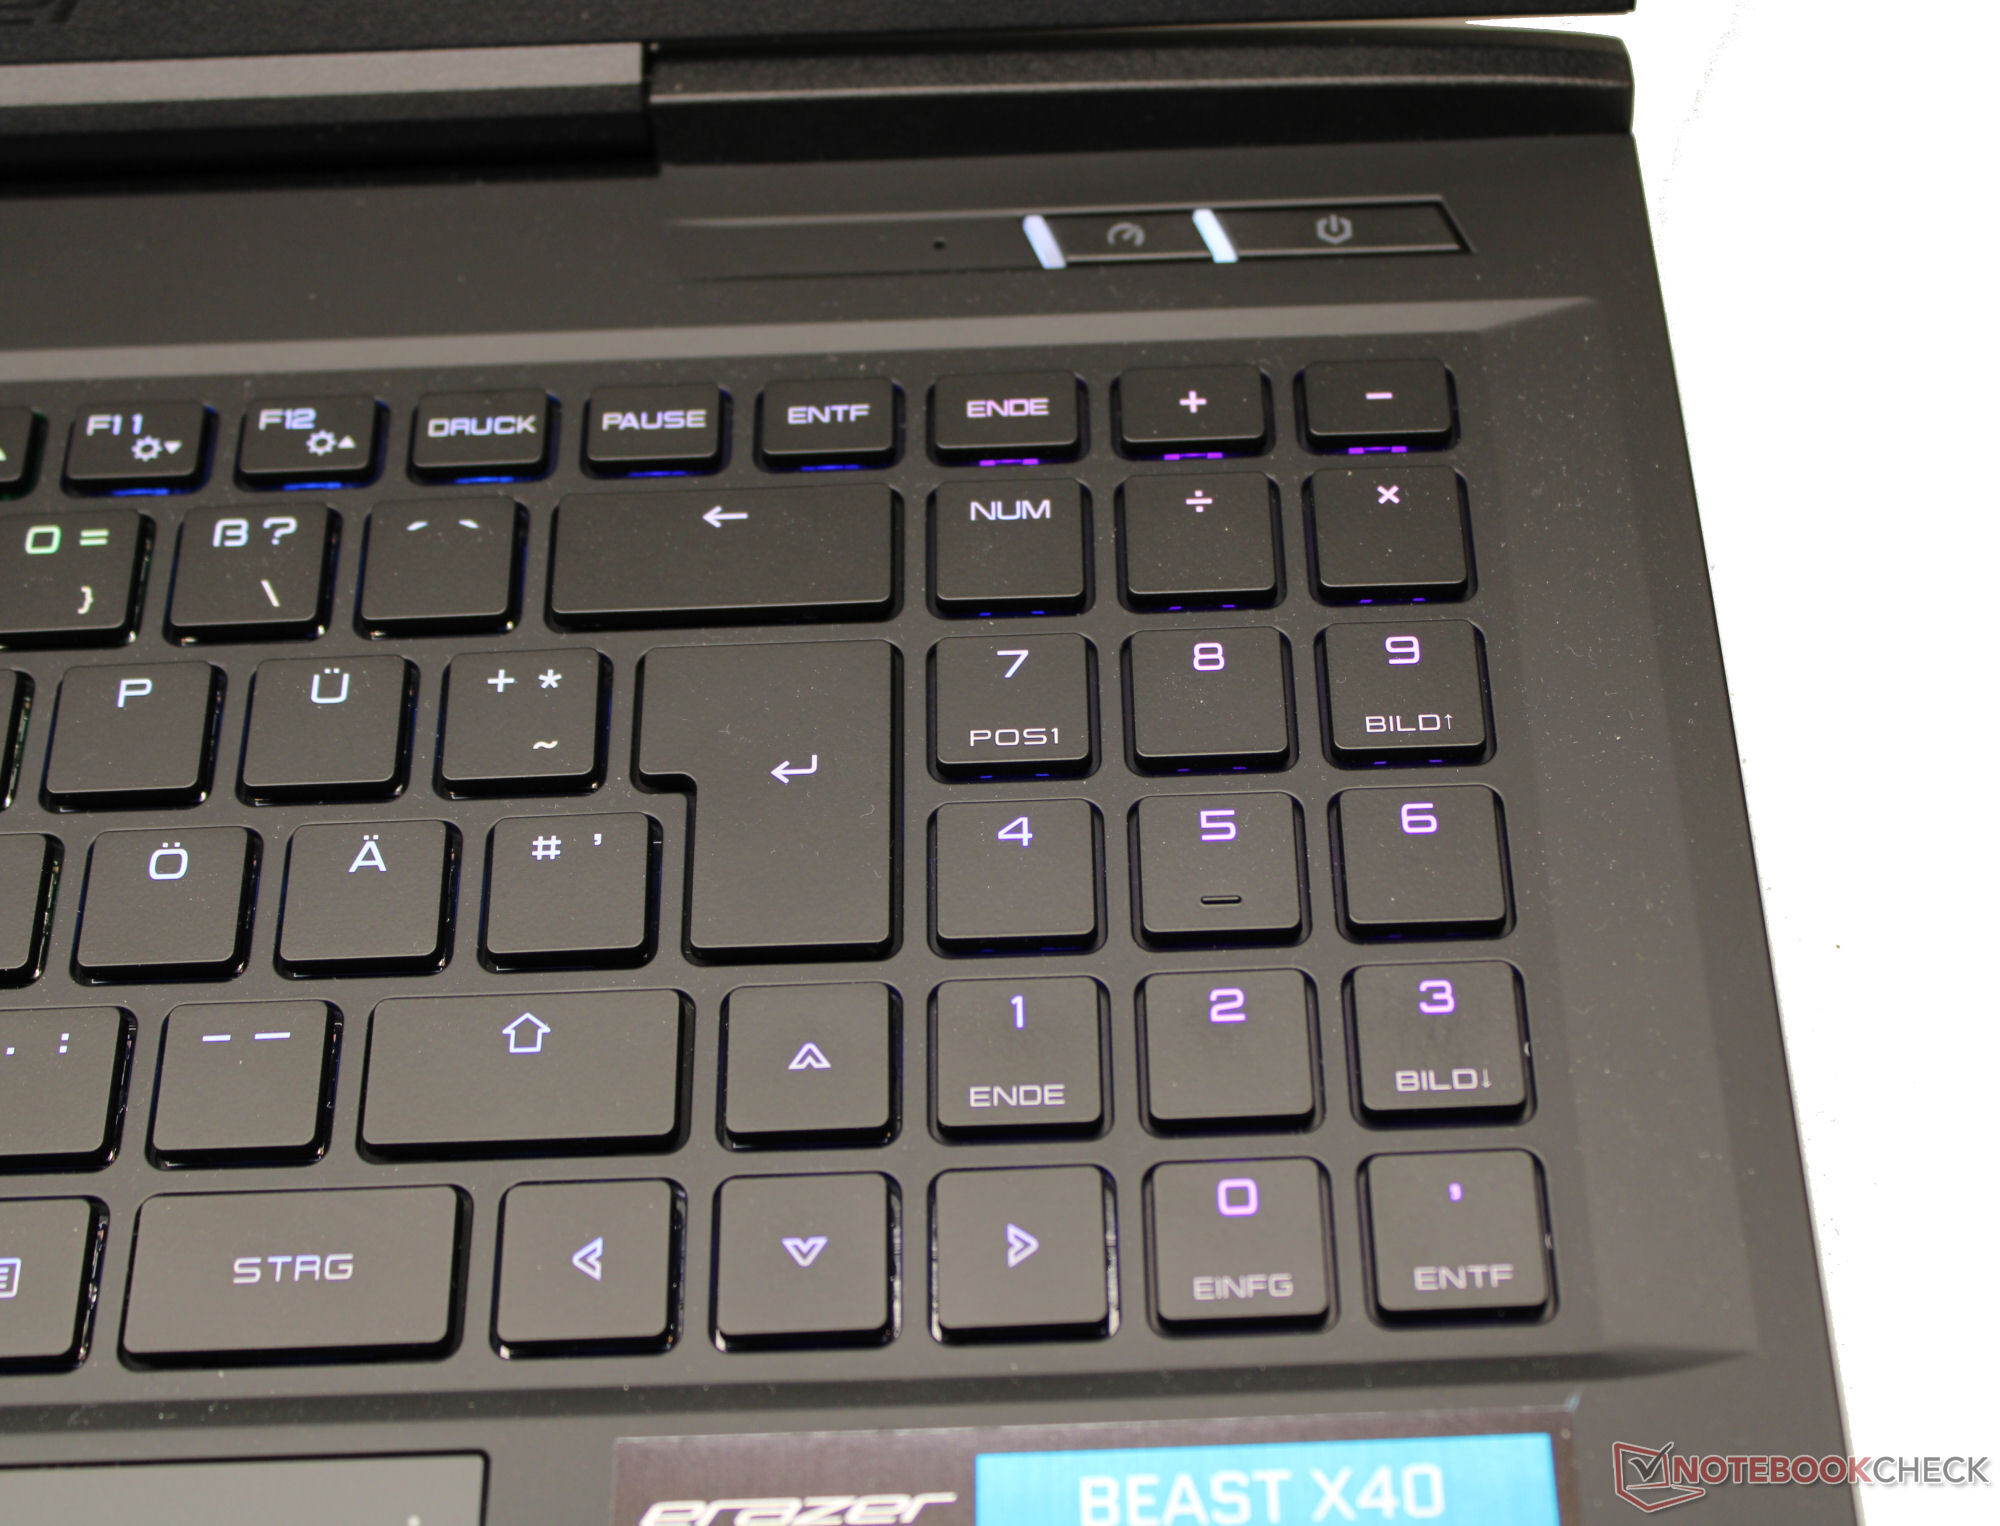
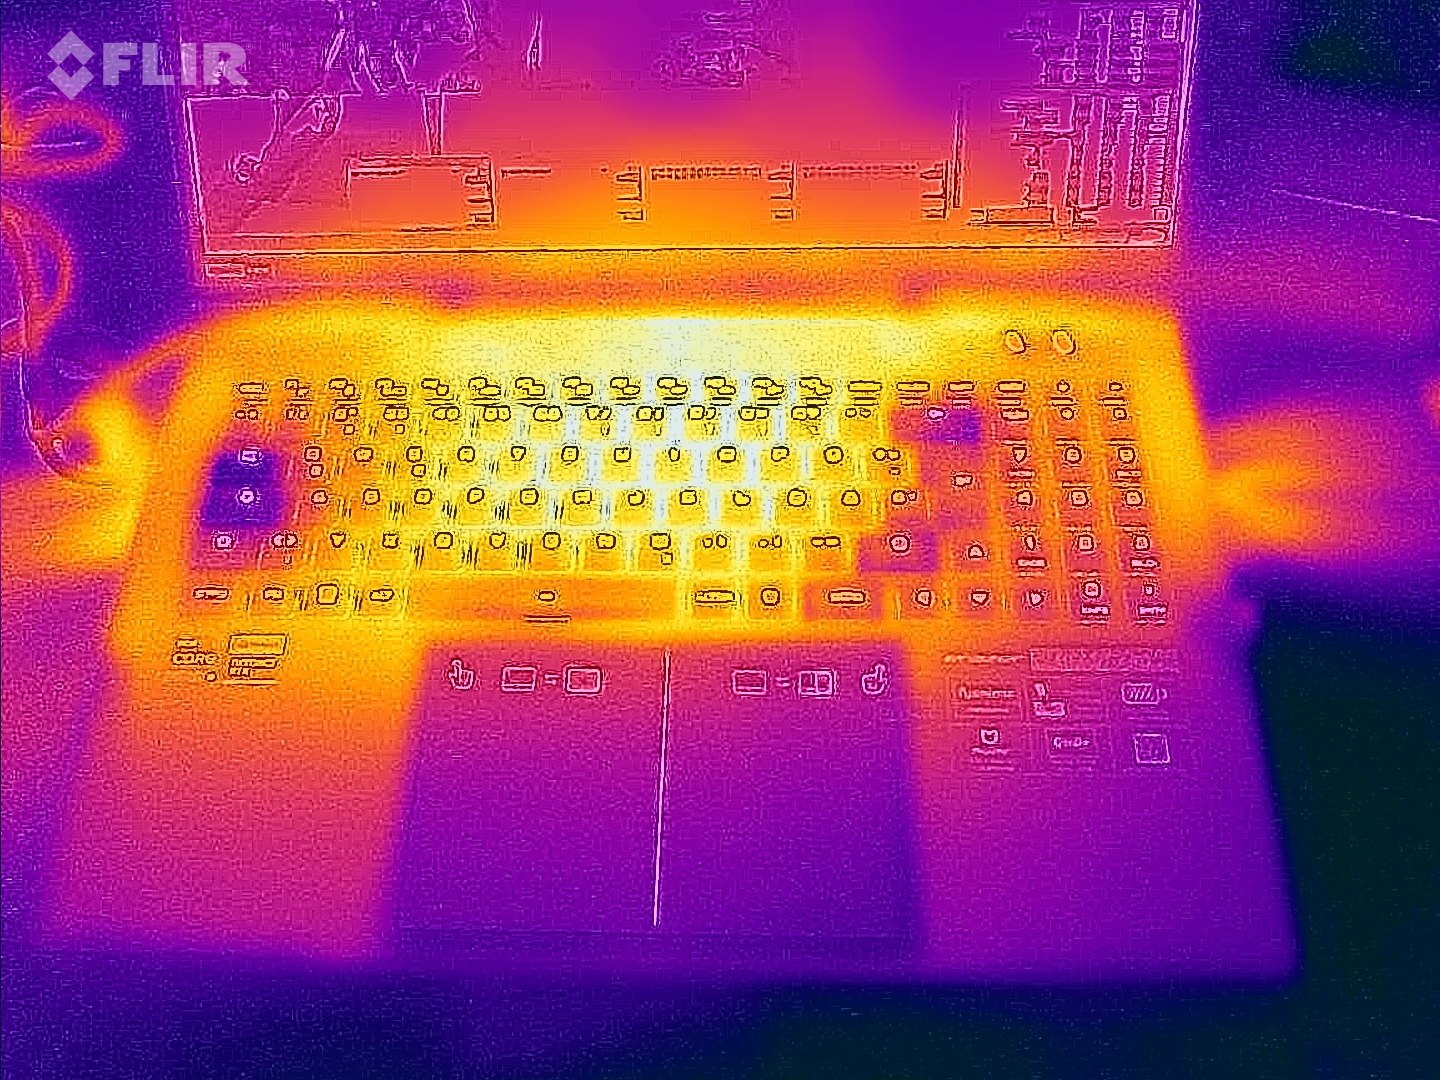
Périphériques d'entrée : Clavier mécanique avec commutateurs Cherry MX
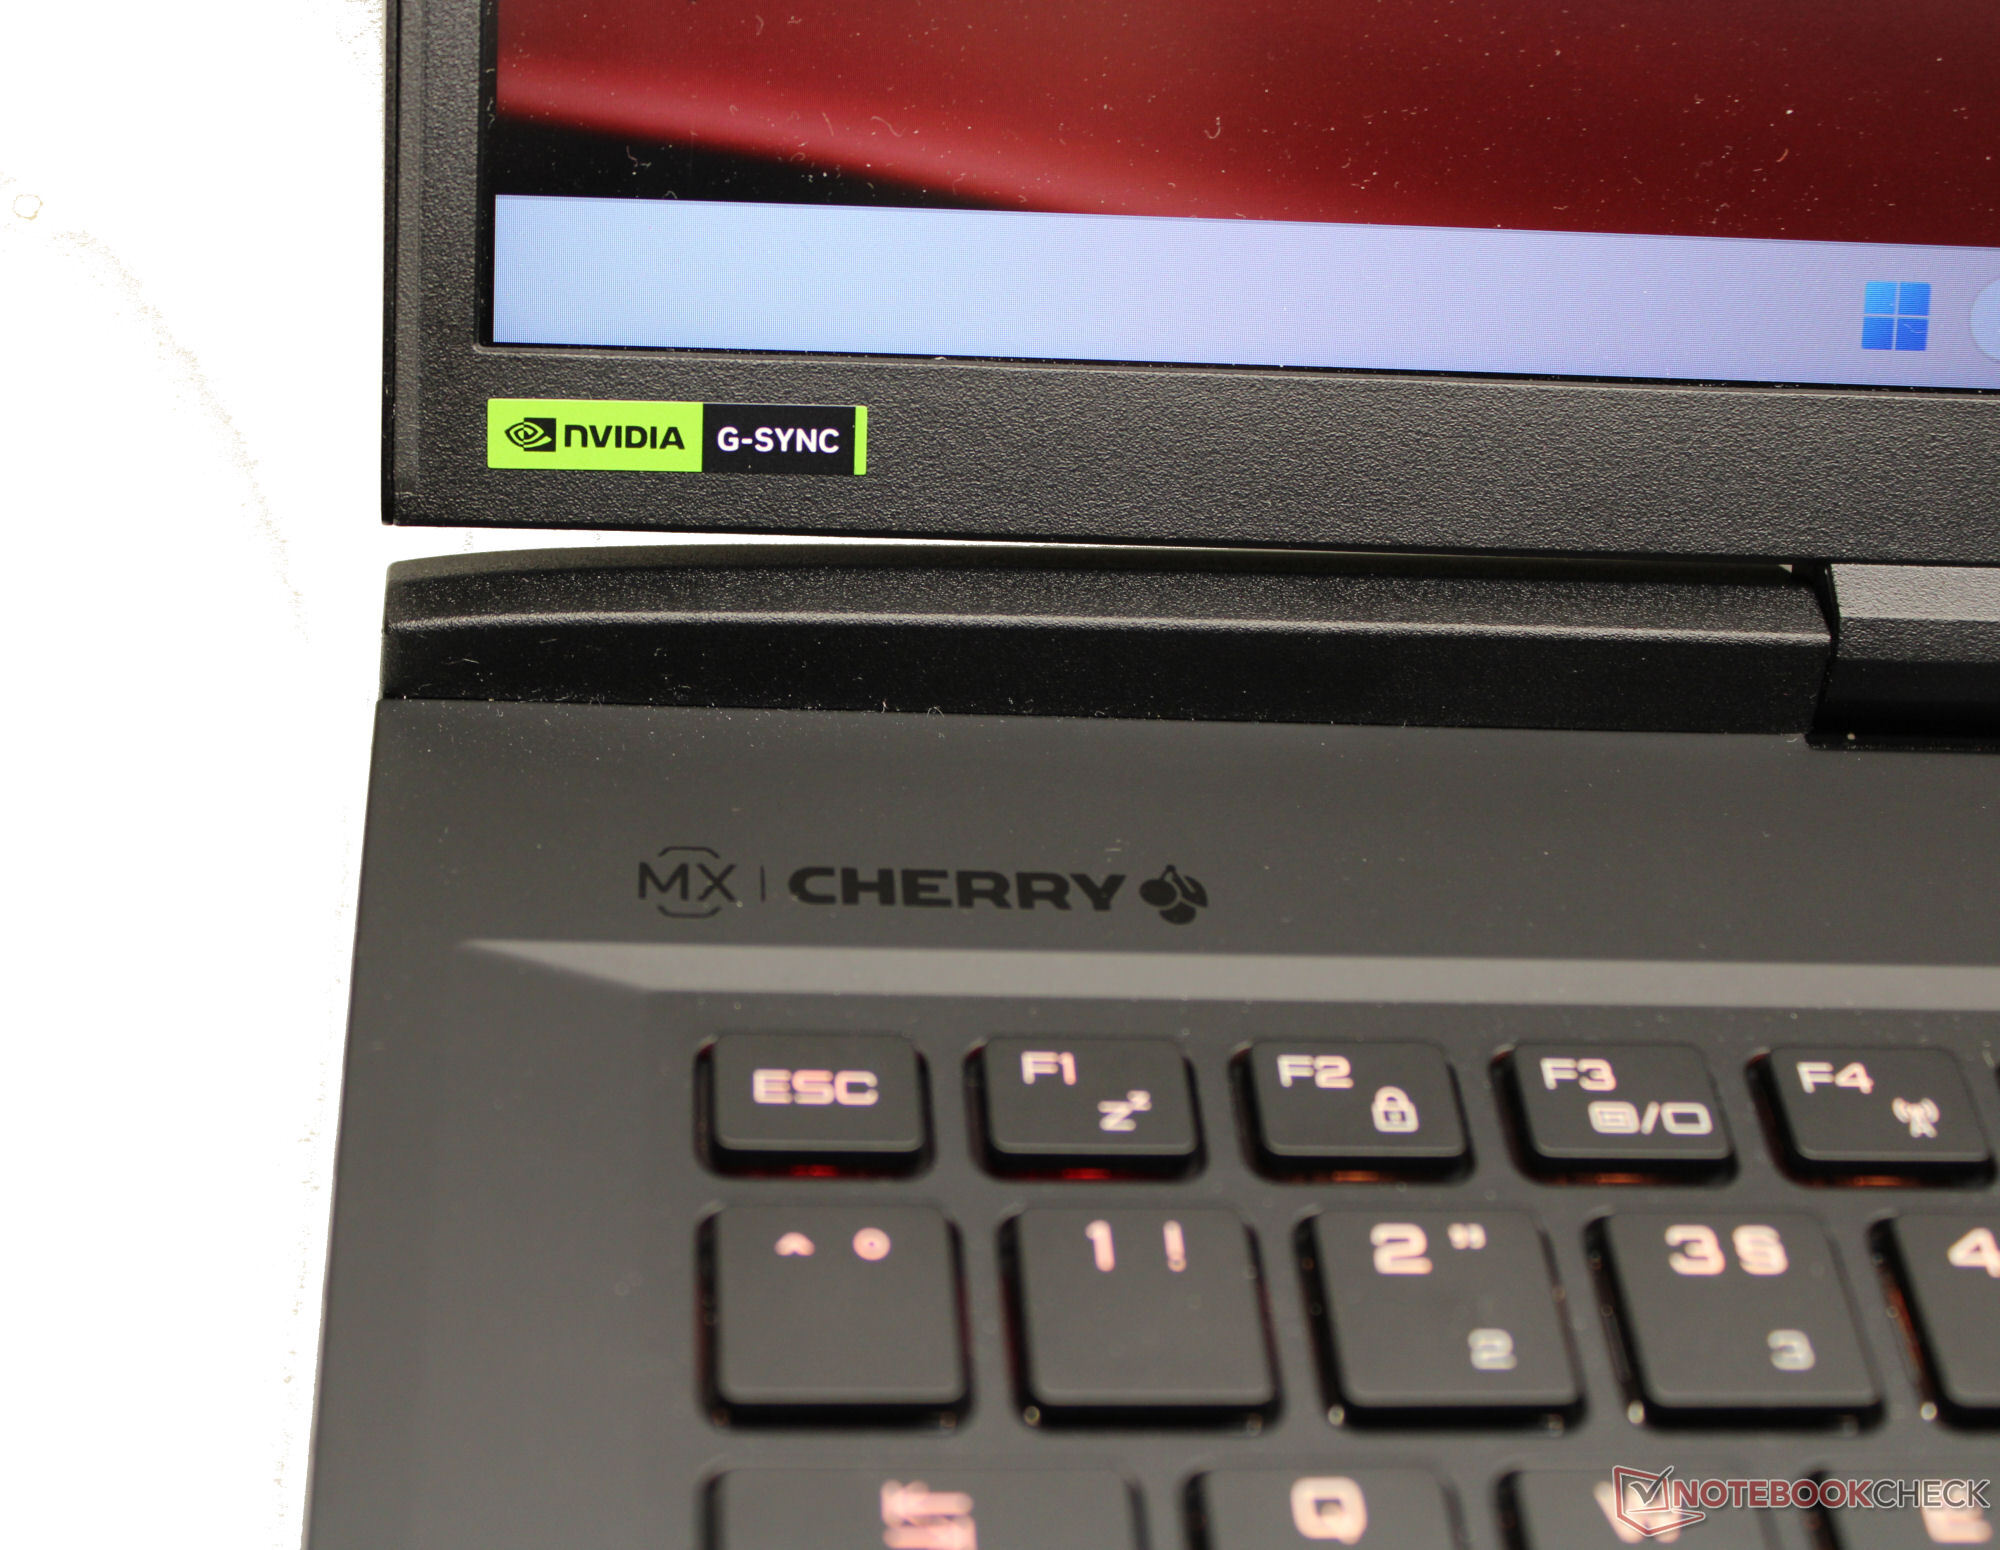
Le clavier mécanique du Beast X40 marque des points avec sa sensation de frappe riche et ses entrées précises. Ses commutateurs Cherry MX offrent une course moyenne et un point de pression clairement audible et perceptible. Un pavé numérique et un éclairage individuel des touches RGB complètent l'harmonie générale du clavier.
Le pavé tactile multi-touch (15,5 x 10 cm) a une course courte et un point de pression clair. Il peut être désactivé complètement ou d'un seul côté (à droite).

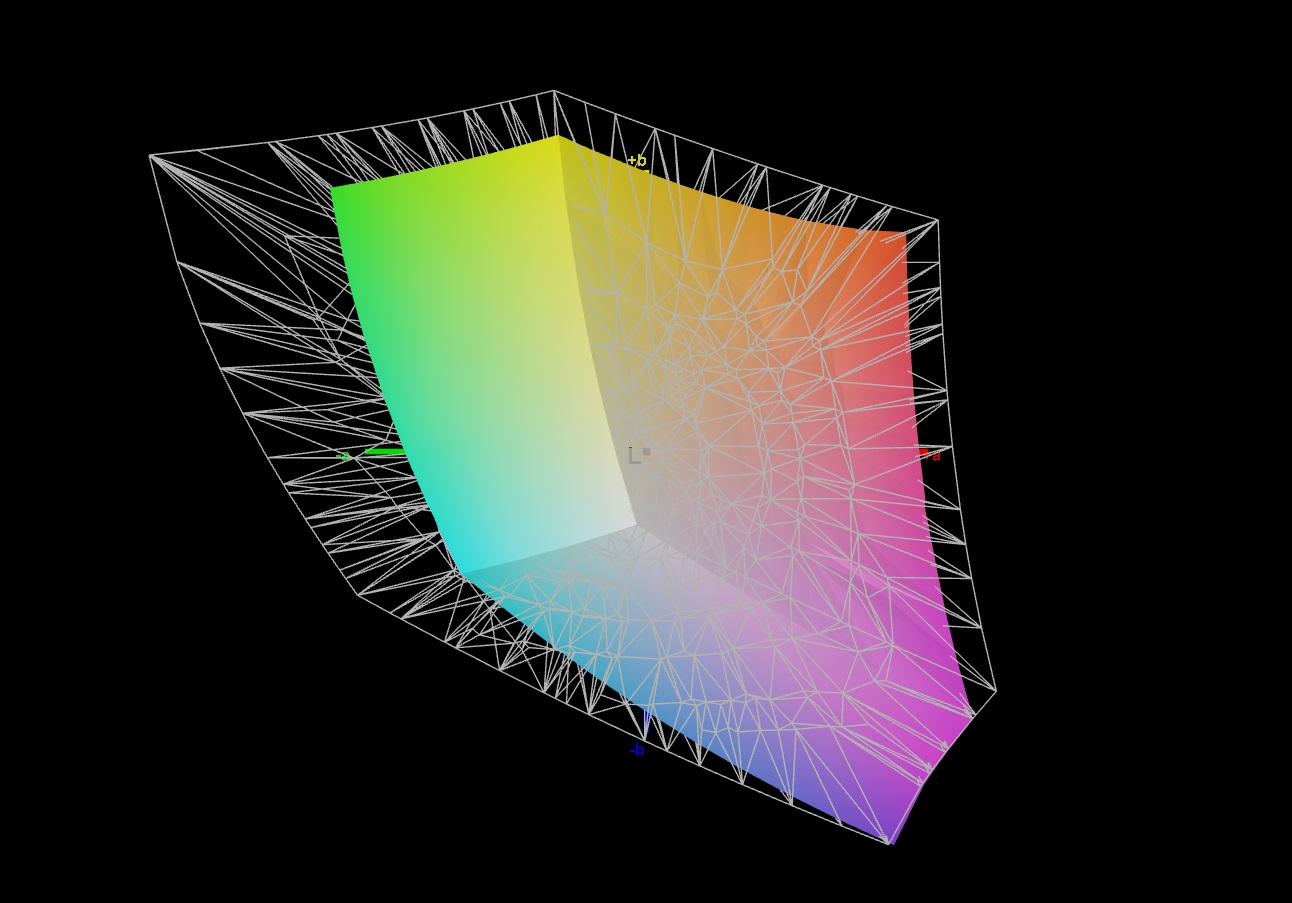
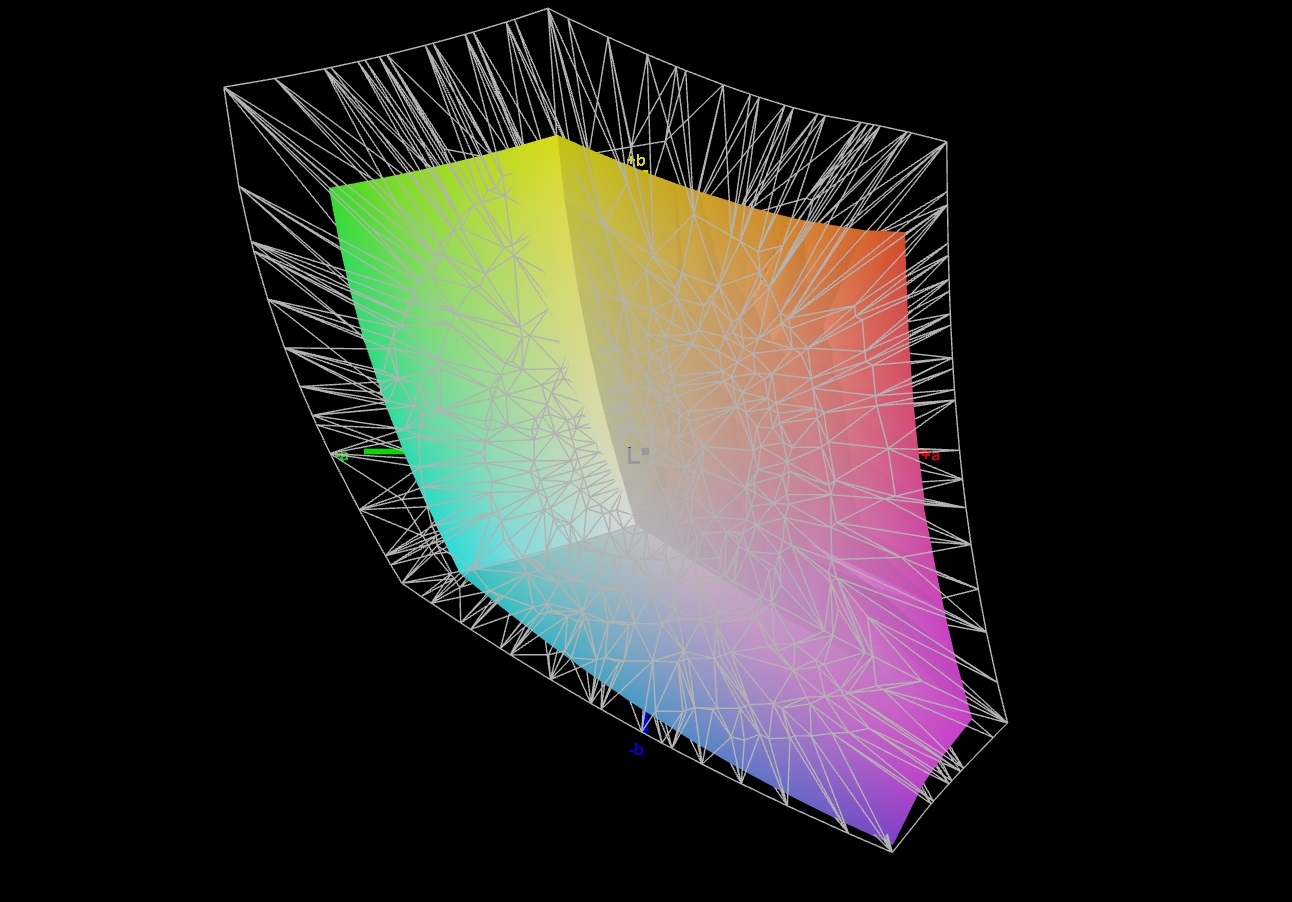
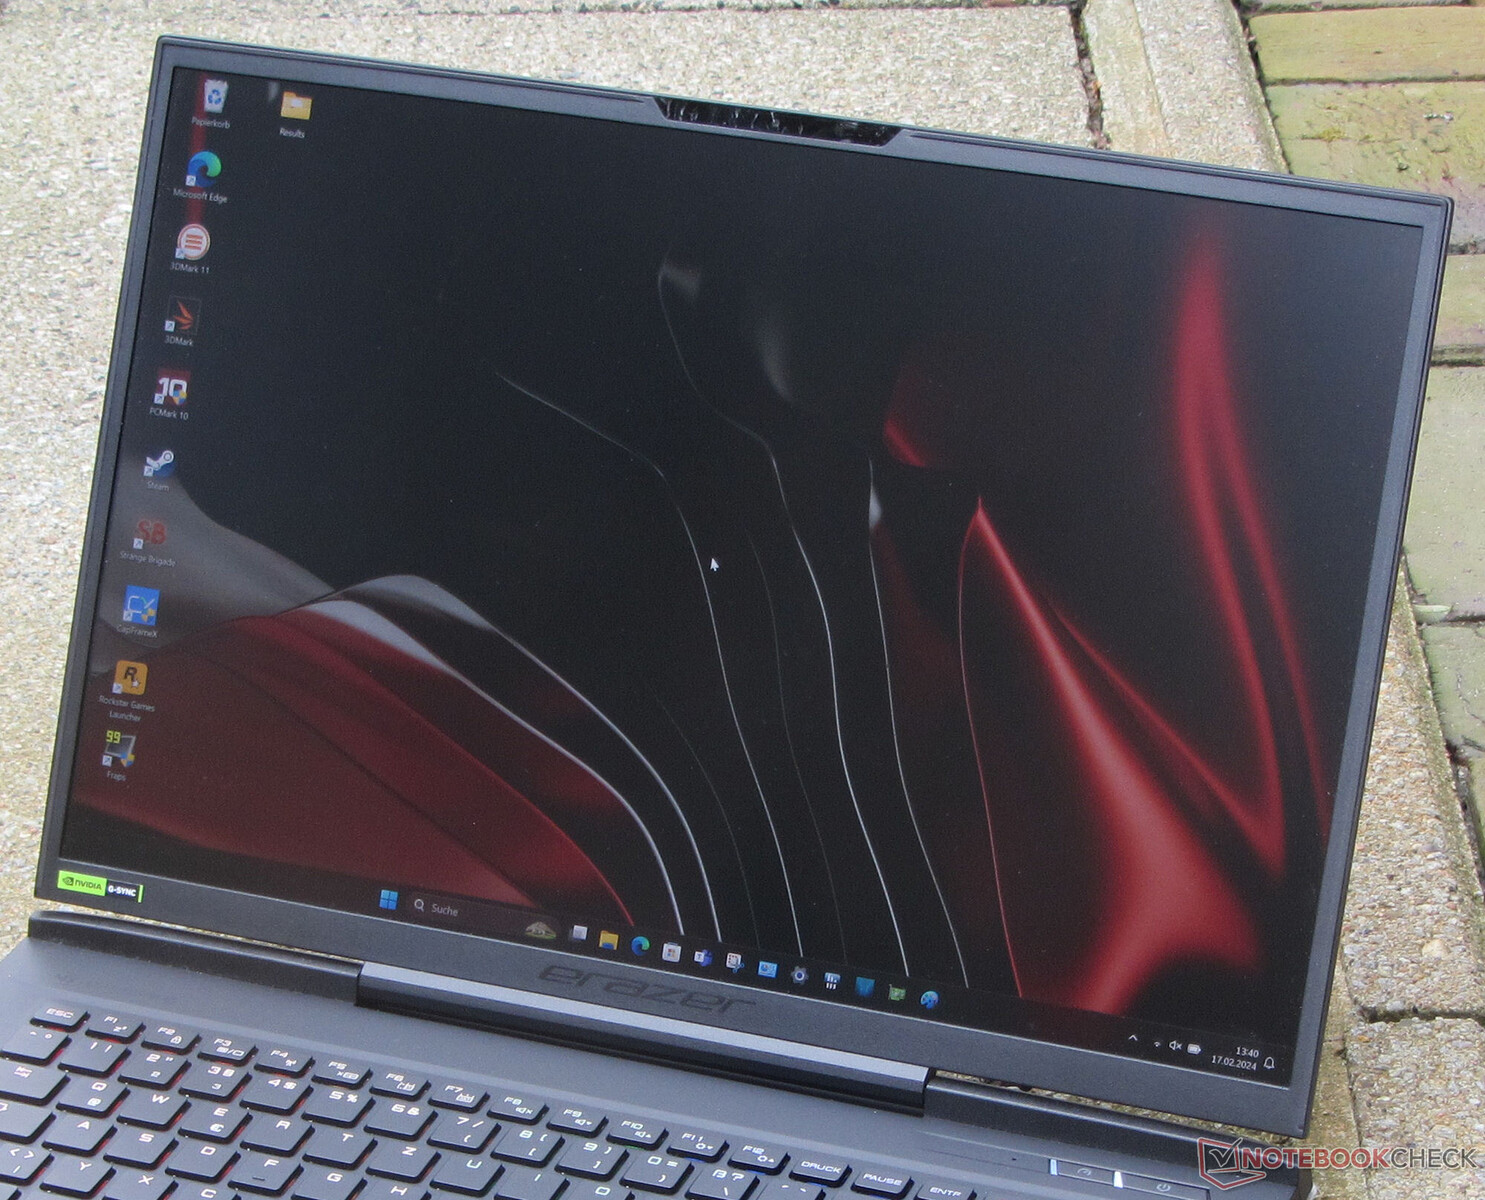
Écran : QHD+ avec une couverture sRGB décente
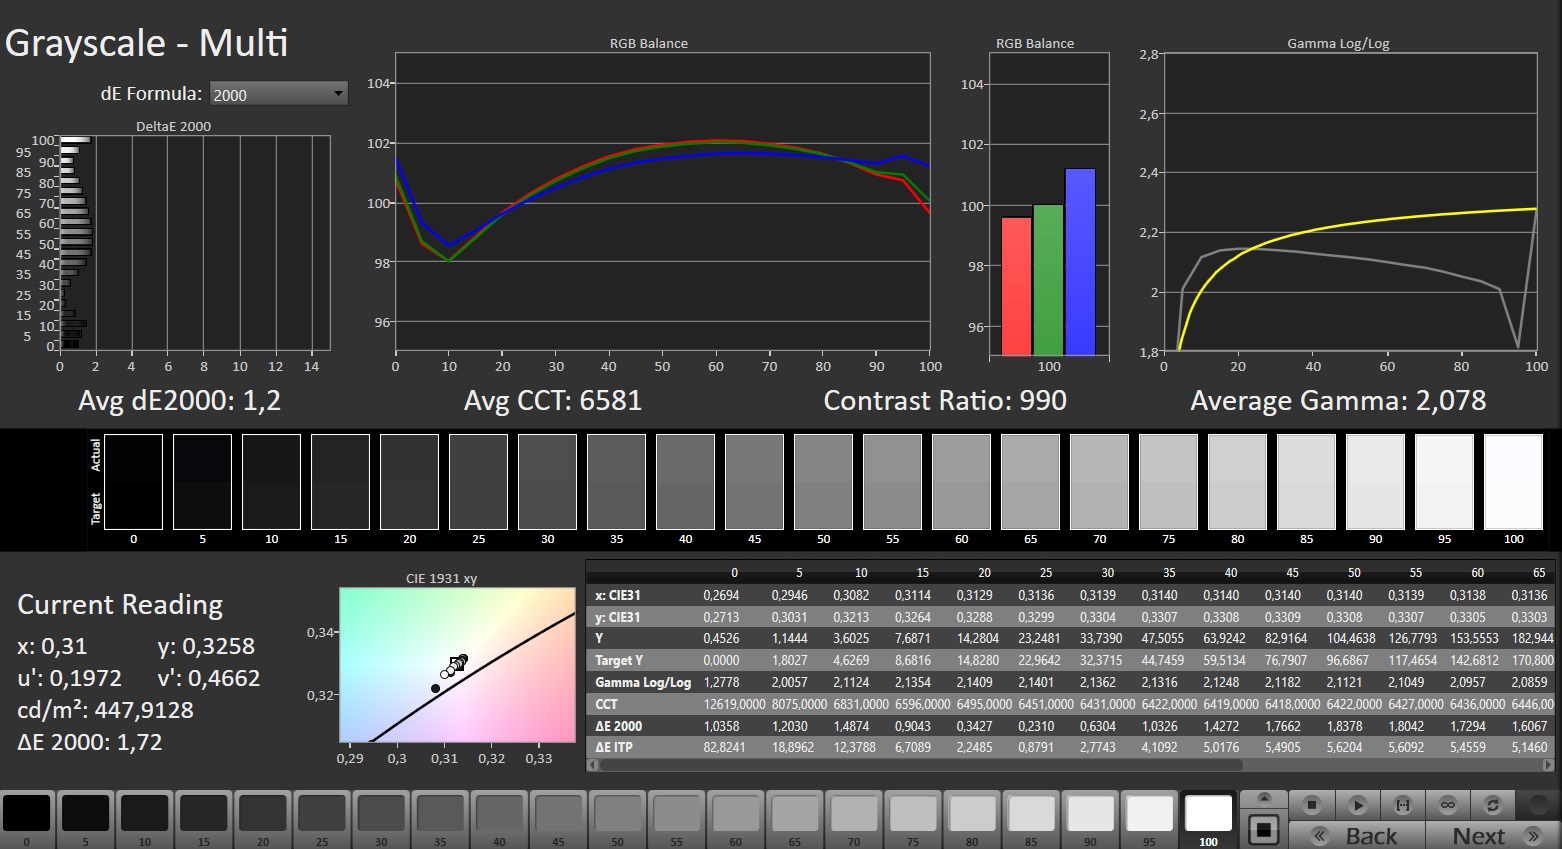
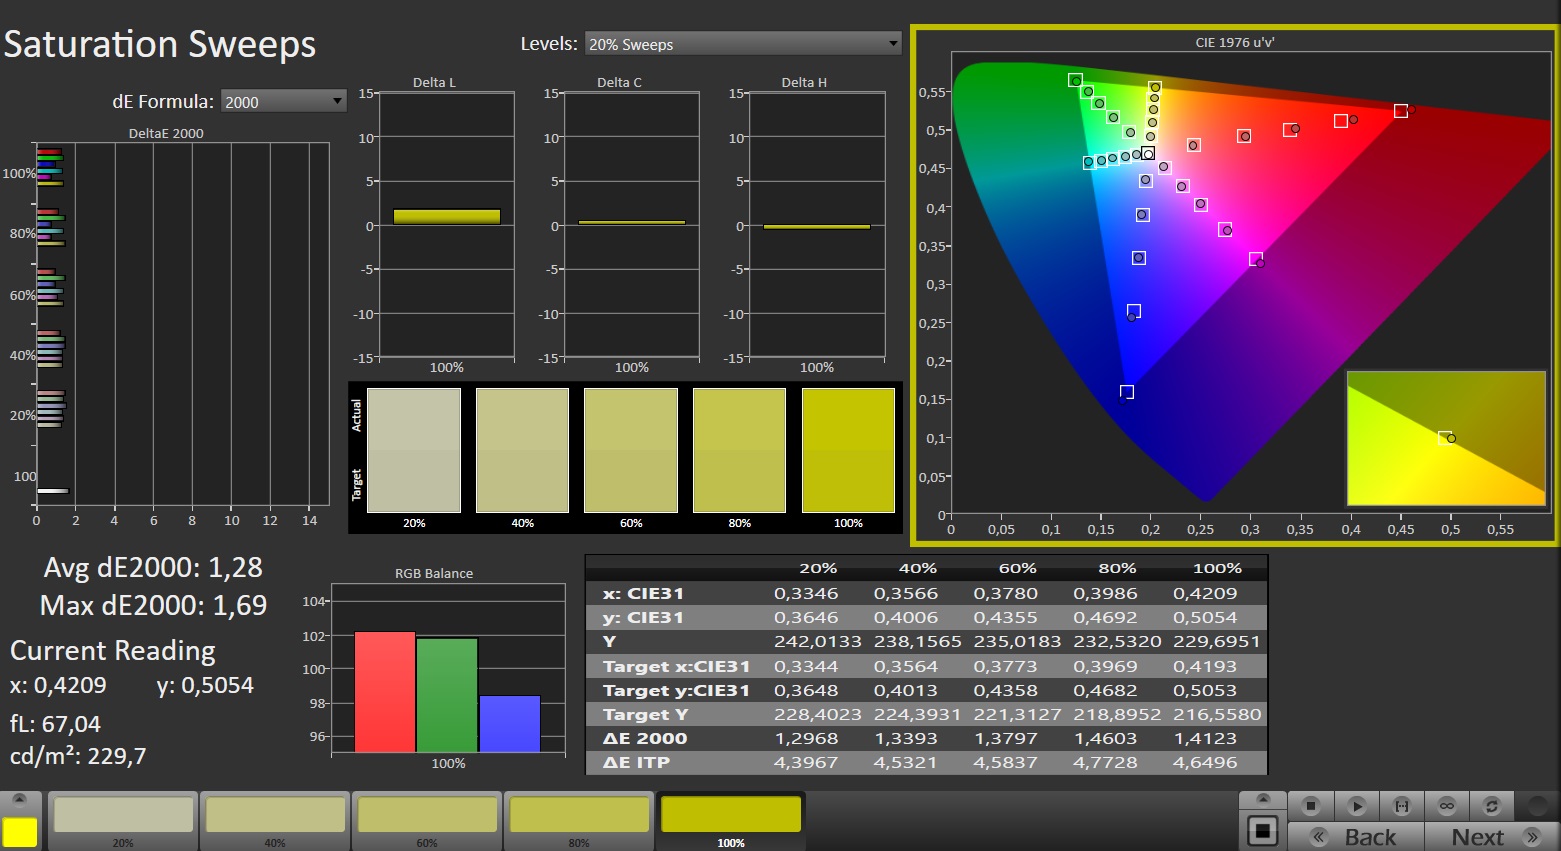
Le 2024 Beast X40 utilise le même écran mat QHD+ 240 Hz (2 560 x 1 600 pixels) développé par BOE, comme le 2023 Beast X40 2023 Beast X40. L'écran présente de bons niveaux de luminosité, des temps de réponse courts, des taux de rafraîchissement élevés et ne présente pas de scintillement PWM.
Medion ne propose actuellement pas d'autres options d'affichage.
| |||||||||||||||||||||||||
Homogénéité de la luminosité: 87 %
Valeur mesurée au centre, sur batterie: 422 cd/m²
Contraste: 1005:1 (Valeurs des noirs: 0.42 cd/m²)
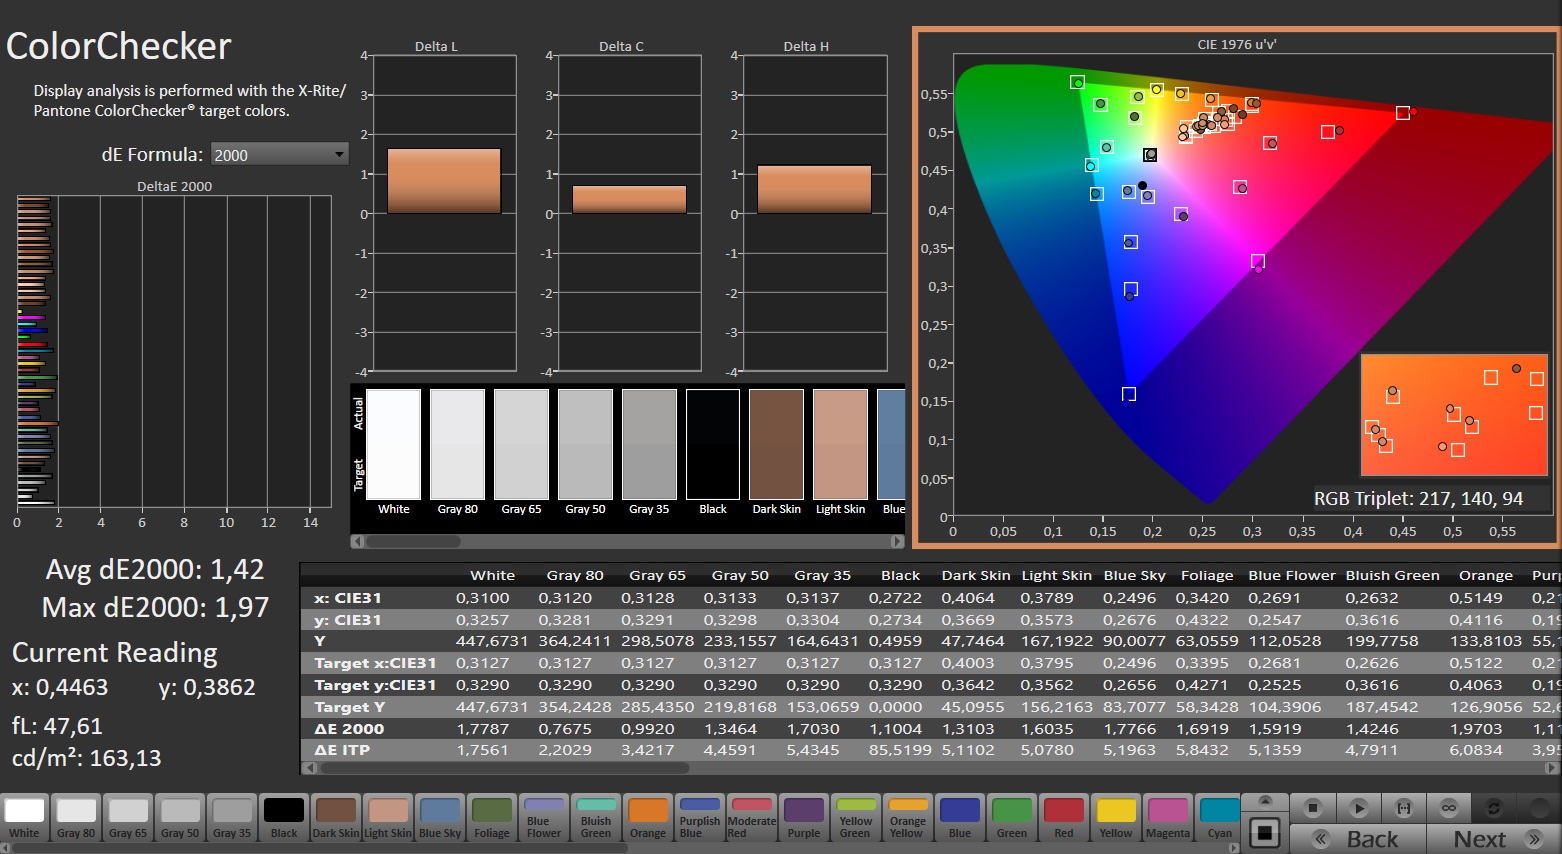
ΔE ColorChecker Calman: 1.42 | ∀{0.5-29.43 Ø4.71}
calibrated: 0.7
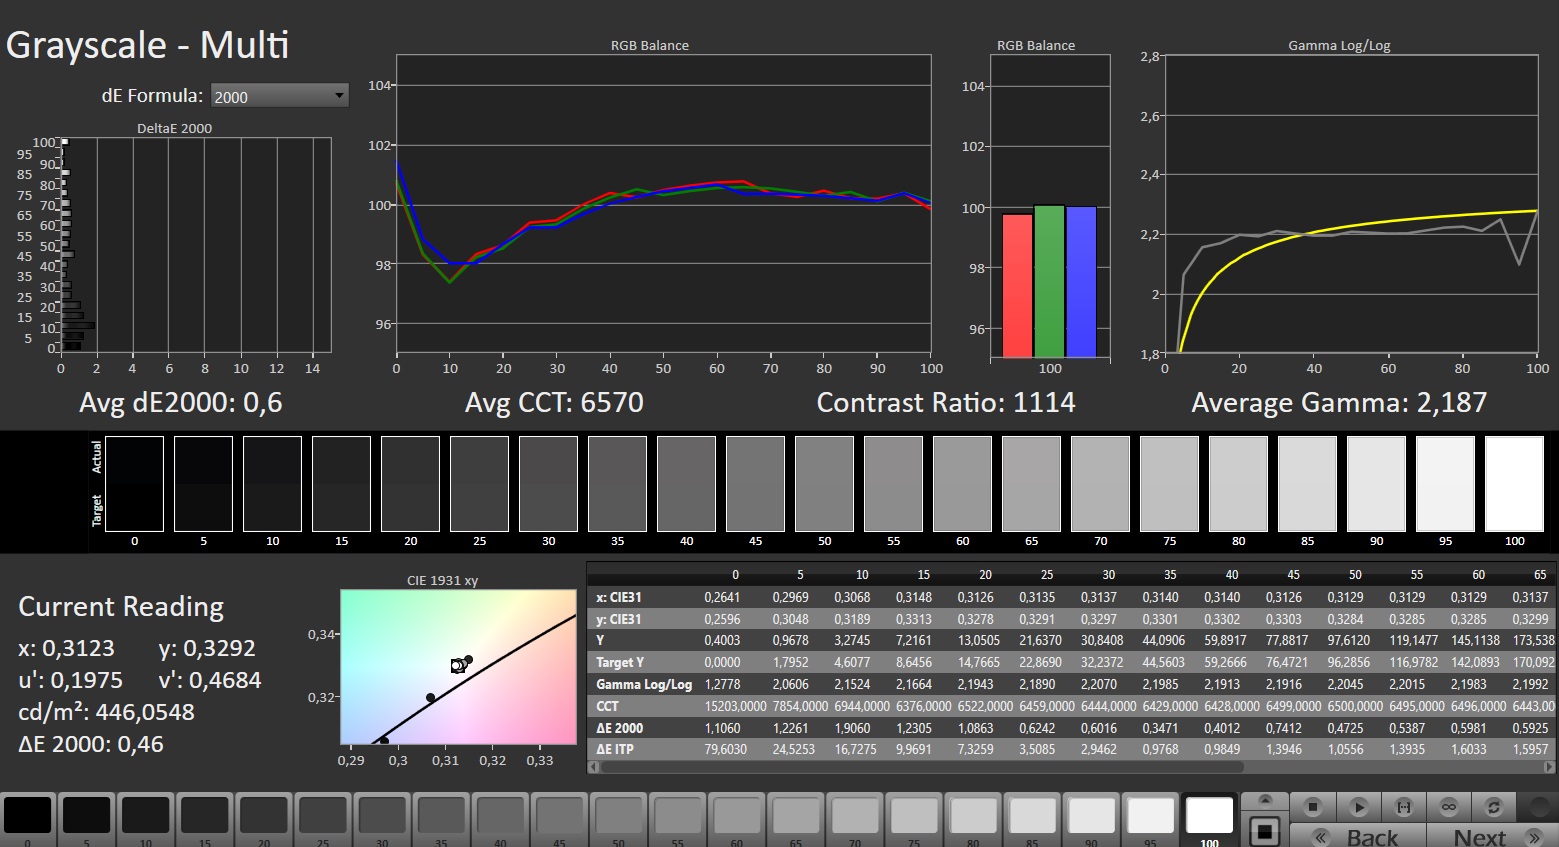
ΔE Greyscale Calman: 1.2 | ∀{0.09-98 Ø4.96}
69% AdobeRGB 1998 (Argyll 3D)
99.5% sRGB (Argyll 3D)
68.1% Display P3 (Argyll 3D)
Gamma: 2.078
CCT: 6581 K
| Medion Erazer Beast X40 2024 BOE NE170QDM-NZ1, IPS, 2560x1600, 17" | Schenker Key 17 Pro (Early 23) BOE CQ NE173QUM-NY1, IPS, 3840x2160, 17.3" | Asus ROG Strix Scar 17 G733PY-XS96 NE173QHM-NZ2, IPS, 2560x1440, 17.3" | Asus ROG Strix Scar 18 G834JYR (2024) BOE NE180QDM-NM1, Mini LED, 2560x1600, 18" | MSI Titan 18 HX A14VIG AU Optronics B180ZAN01.0, Mini-LED, 3840x2400, 18" | Medion Erazer Beast X40 BOE NE170QDM-NZ1, IPS, 2560x1600, 17" | |
|---|---|---|---|---|---|---|
| Display | 21% | 23% | 26% | 23% | 1% | |
| Display P3 Coverage (%) | 68.1 | 96.4 42% | 98 44% | 99.9 47% | 98.1 44% | 68.6 1% |
| sRGB Coverage (%) | 99.5 | 99.9 0% | 100 1% | 100 1% | 99.8 0% | 99.8 0% |
| AdobeRGB 1998 Coverage (%) | 69 | 84.3 22% | 85.6 24% | 90 30% | 86.2 25% | 69.4 1% |
| Response Times | -15% | -9% | -29% | -530% | -3% | |
| Response Time Grey 50% / Grey 80% * (ms) | 11.7 ? | 14.8 ? -26% | 6.2 ? 47% | 12 ? -3% | 8.6 ? 26% | 11.3 ? 3% |
| Response Time Black / White * (ms) | 6.9 ? | 7.2 ? -4% | 11.4 ? -65% | 10.7 ? -55% | 81.8 ? -1086% | 7.5 ? -9% |
| PWM Frequency (Hz) | 5733 ? | 2592 ? | ||||
| Screen | -0% | -6% | 166% | -119% | -29% | |
| Brightness middle (cd/m²) | 422 | 487 15% | 322.5 -24% | 937 122% | 467.5 11% | 384 -9% |
| Brightness (cd/m²) | 388 | 485 25% | 317 -18% | 934 141% | 459 18% | 377 -3% |
| Brightness Distribution (%) | 87 | 87 0% | 86 -1% | 89 2% | 90 3% | 90 3% |
| Black Level * (cd/m²) | 0.42 | 0.51 -21% | 0.29 31% | 0.066 84% | 0.45 -7% | |
| Contrast (:1) | 1005 | 955 -5% | 1112 11% | 14197 1313% | 853 -15% | |
| Colorchecker dE 2000 * | 1.42 | 1.51 -6% | 1.15 19% | 1.52 -7% | 3.77 -165% | 2.05 -44% |
| Colorchecker dE 2000 max. * | 1.97 | 2.19 -11% | 3.03 -54% | 2.82 -43% | 6.12 -211% | 3.64 -85% |
| Colorchecker dE 2000 calibrated * | 0.7 | 0.56 20% | 1.21 -73% | 2.94 -320% | 0.74 -6% | |
| Greyscale dE 2000 * | 1.2 | 1.2 -0% | 1.7 -42% | 1.7 -42% | 3.2 -167% | 2.3 -92% |
| Gamma | 2.078 106% | 2.273 97% | 2.27 97% | 2.042 108% | 2.43 91% | 2.017 109% |
| CCT | 6581 99% | 6451 101% | 6299 103% | 6578 99% | 6478 100% | 6546 99% |
| Moyenne finale (programmes/paramètres) | 2% /
2% | 3% /
-1% | 54% /
108% | -209% /
-152% | -10% /
-19% |
* ... Moindre est la valeur, meilleures sont les performances
L'écran affiche une bonne représentation des couleurs au départ de l'usine : Avec une déviation d'environ 1,4, l'objectif (DeltaE < 3) est atteint. L'étalonnage réduit l'écart à 0,7 et garantit des niveaux de gris plus équilibrés.
L'écran peut reproduire complètement l'espace colorimétrique sRGB, mais pas les espaces colorimétriques AdobeRGB et DCI P3. Les écrans des concurrents offrent plus ici.

Temps de réponse de l'écran
| ↔ Temps de réponse noir à blanc | ||
|---|---|---|
| 6.9 ms ... hausse ↗ et chute ↘ combinées | ↗ 2.8 ms hausse | 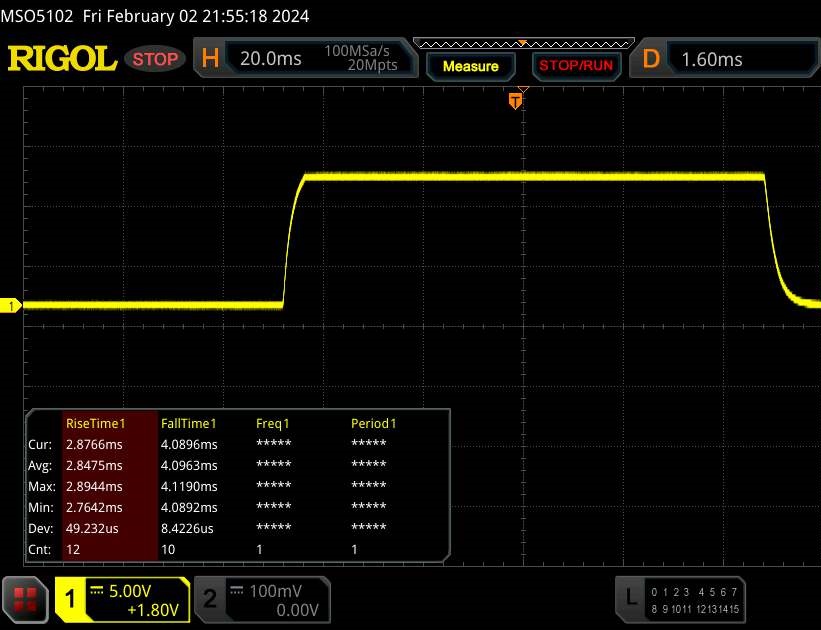 |
| ↘ 4.1 ms chute | ||
| L'écran montre de très faibles temps de réponse, parfait pour le jeu. En comparaison, tous les appareils testés affichent entre 0.1 (minimum) et 240 (maximum) ms. » 21 % des appareils testés affichent de meilleures performances. Cela signifie que les latences relevées sont meilleures que la moyenne (19.8 ms) de tous les appareils testés. | ||
| ↔ Temps de réponse gris 50% à gris 80% | ||
| 11.7 ms ... hausse ↗ et chute ↘ combinées | ↗ 5.7 ms hausse | 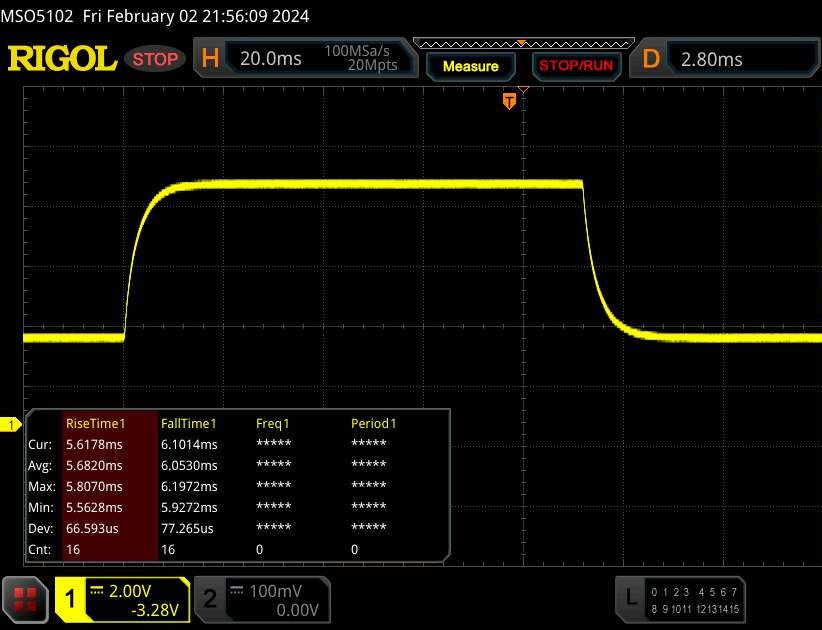 |
| ↘ 6 ms chute | ||
| L'écran montre de bons temps de réponse, mais insuffisant pour du jeu compétitif. En comparaison, tous les appareils testés affichent entre 0.165 (minimum) et 636 (maximum) ms. » 25 % des appareils testés affichent de meilleures performances. Cela signifie que les latences relevées sont meilleures que la moyenne (31 ms) de tous les appareils testés. | ||
Scintillement / MLI (Modulation de largeur d'impulsion)
| Scintillement / MLI (Modulation de largeur d'impulsion) non décelé |  | ||
En comparaison, 52 % des appareils testés n'emploient pas MDI pour assombrir leur écran. Nous avons relevé une moyenne à 7757 (minimum : 5 - maximum : 343500) Hz dans le cas où une MDI était active. | |||
L'écran IPS, dont l'angle de vision est stable, peut être lu dans n'importe quelle position. Il est possible de lire l'écran à l'extérieur si le soleil n'est pas trop fort.
Performance : Le Medion Beast X40 est équipé d'un matériel haut de gamme
L'ordinateur portable haut de gamme de Medion fait bonne figure dans tous les domaines d'application gourmands en performances (p. ex. jeux, rendu). La puissance de calcul nécessaire est fournie par Raptor Lake et Ada Lovelace. Ce modèle X40 est disponible pour environ 4 000 euros. Des versions moins chères sont disponibles à partir de 2.500 euros. En option, Medion propose un système de refroidissement à l'eau (environ 200 euros), qui permet d'augmenter légèrement les performances et de réduire les émissions.
Conditions d'essai
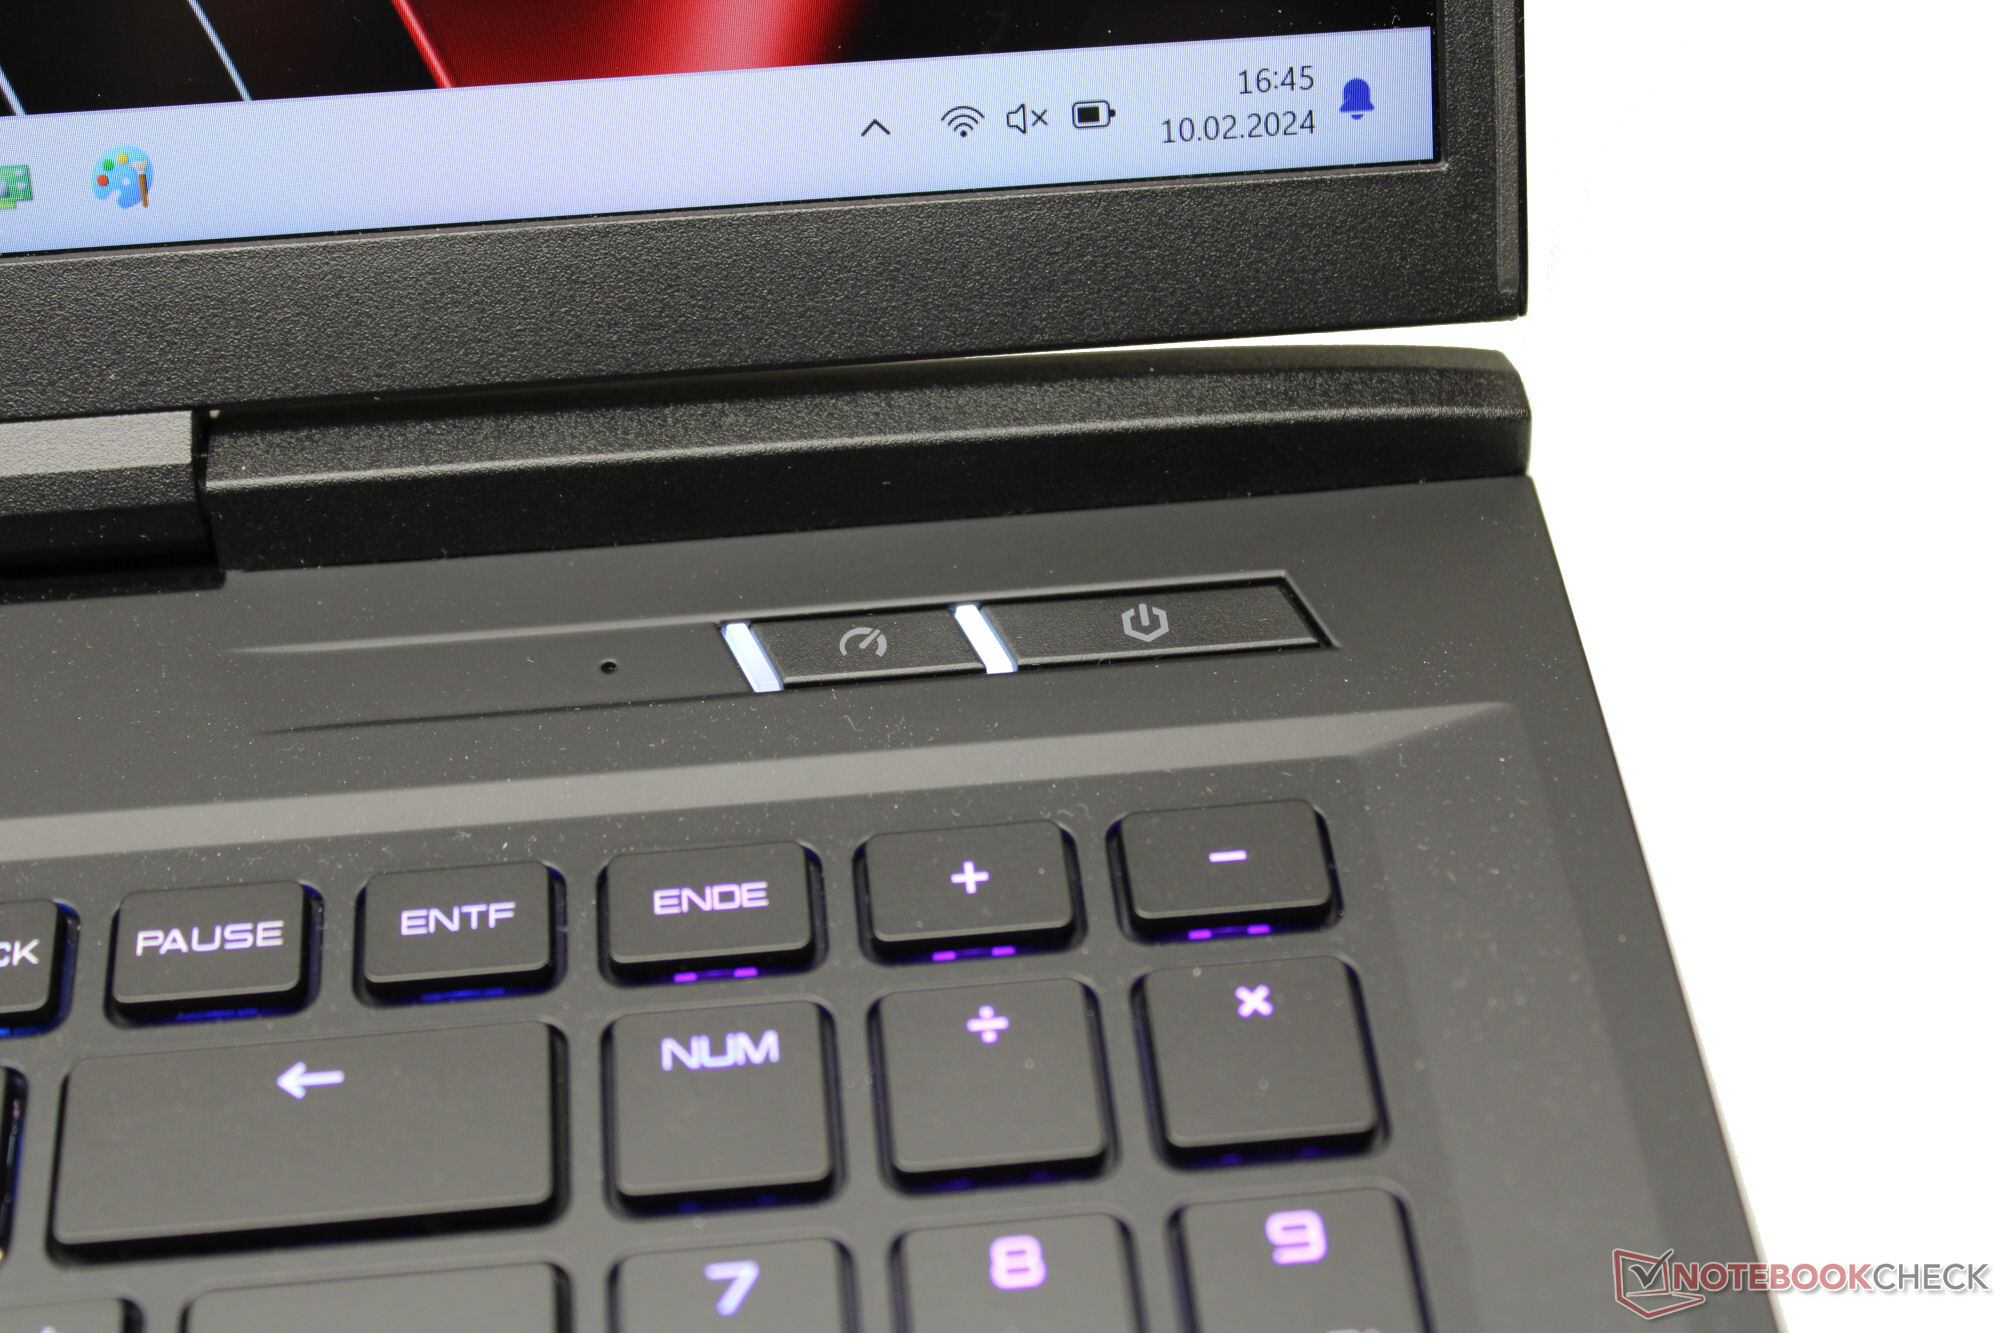
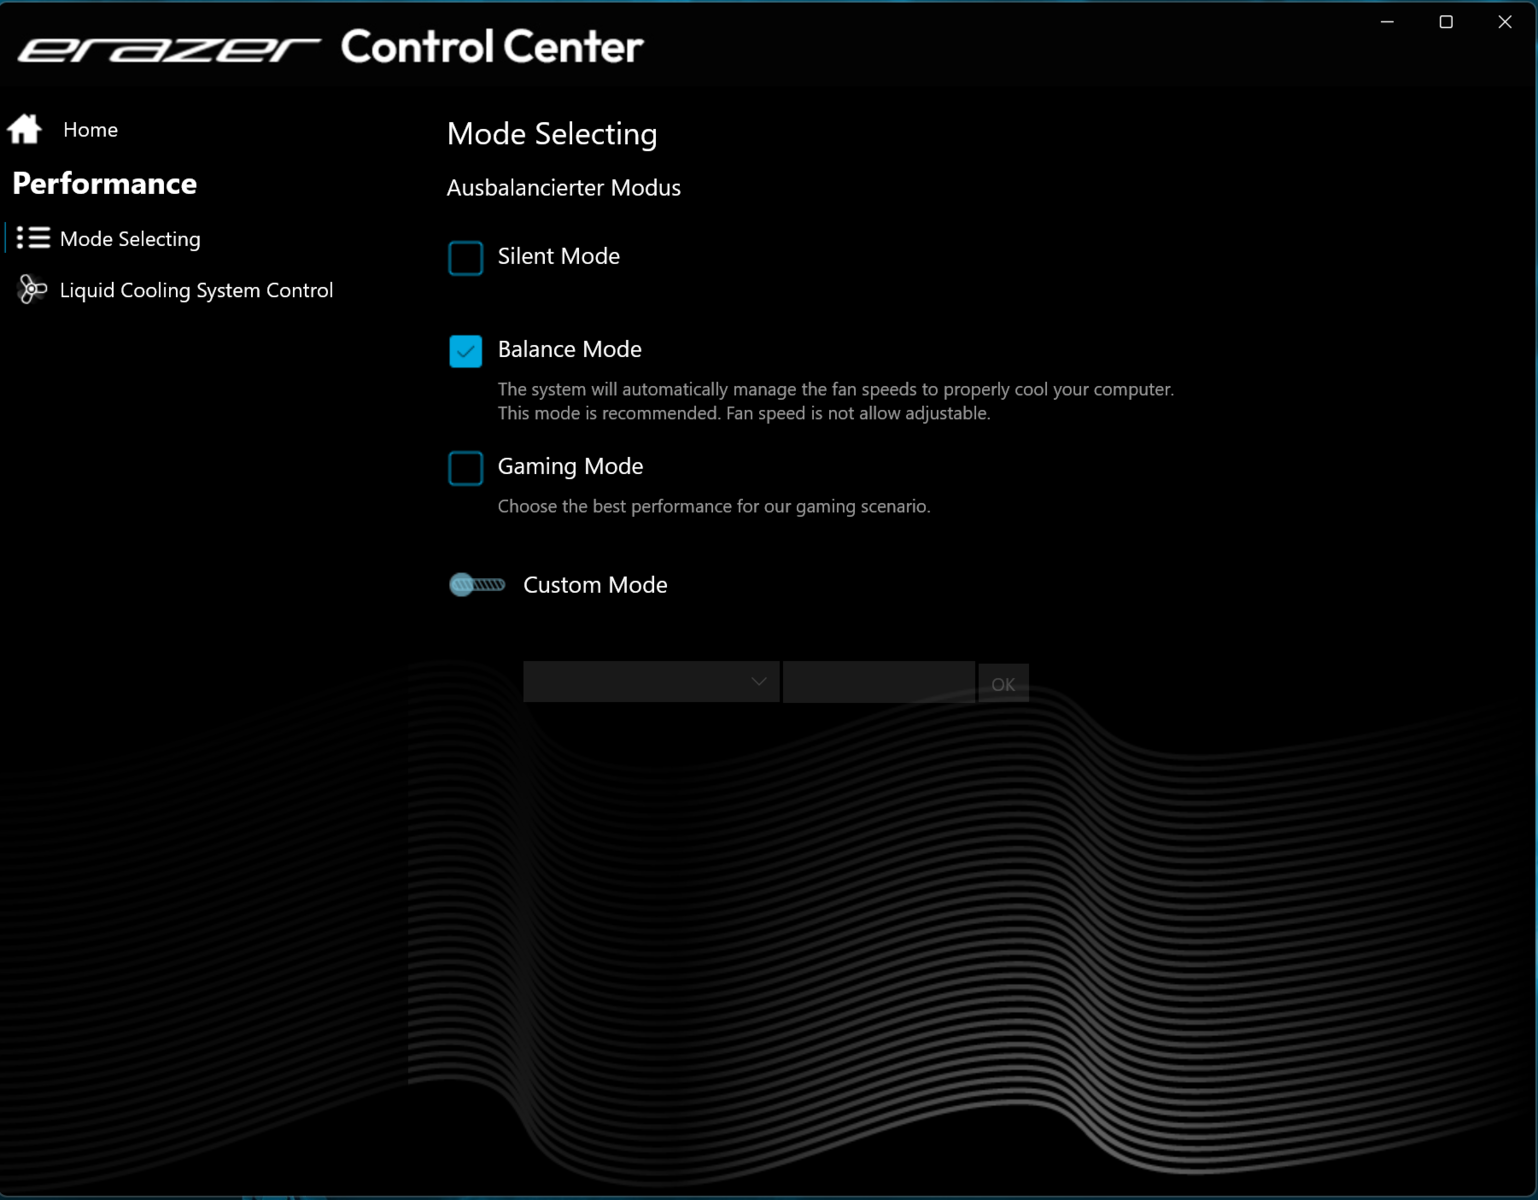
Une touche dédiée, située à côté du bouton d'alimentation, vous permet de basculer rapidement entre les trois modes de performance spécifiques au fabricant (voir le tableau ci-dessous). Les modes "Balance Mode" (benchmarks) et "Silent Mode" (tests de batterie) ont été utilisés.
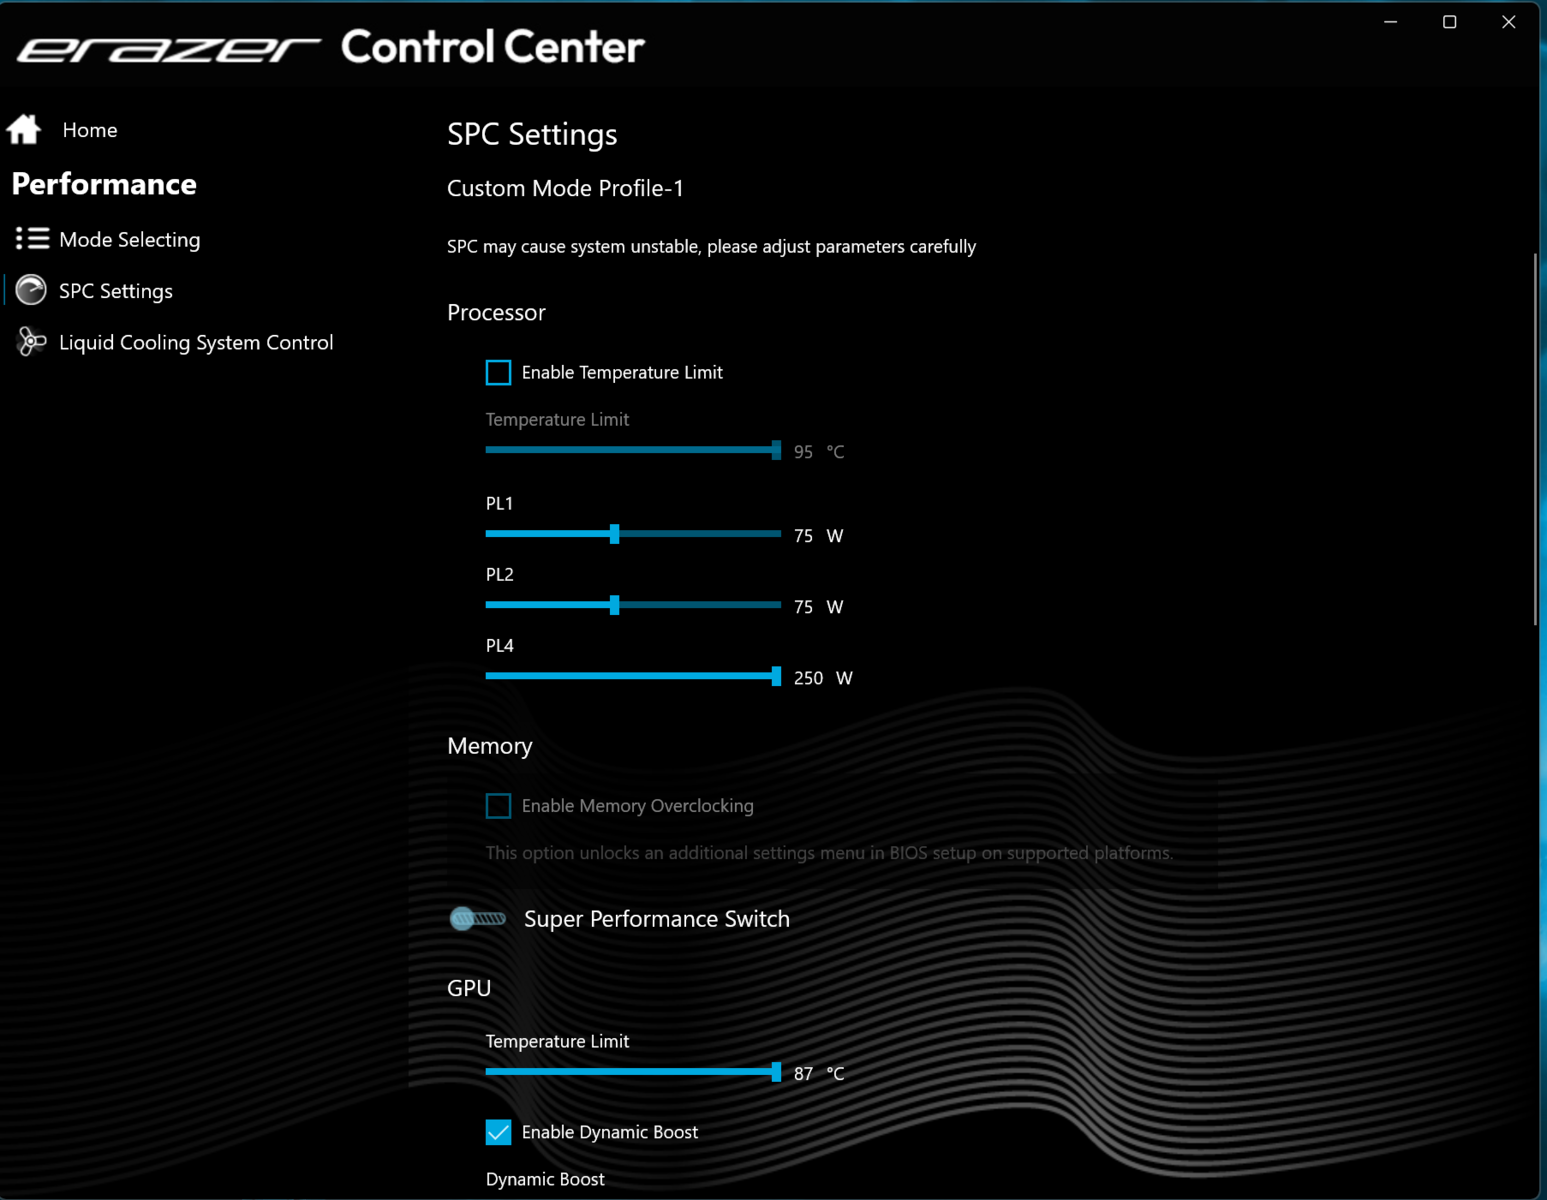
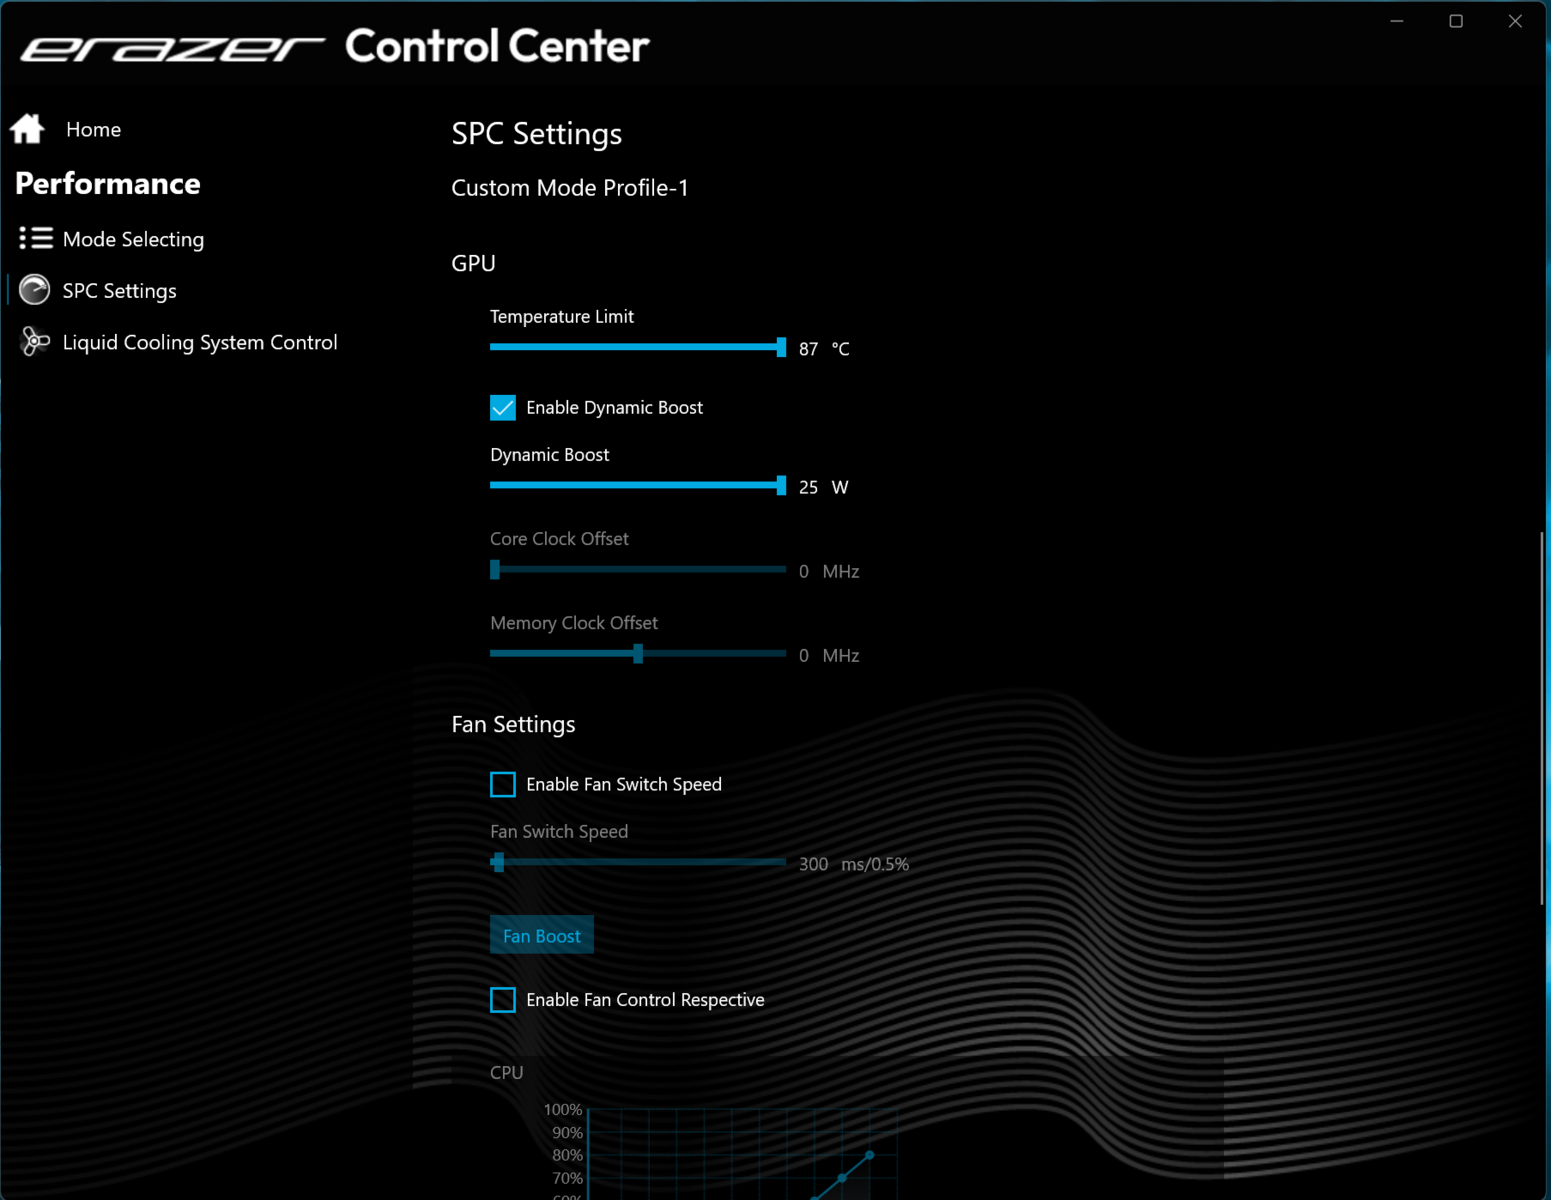
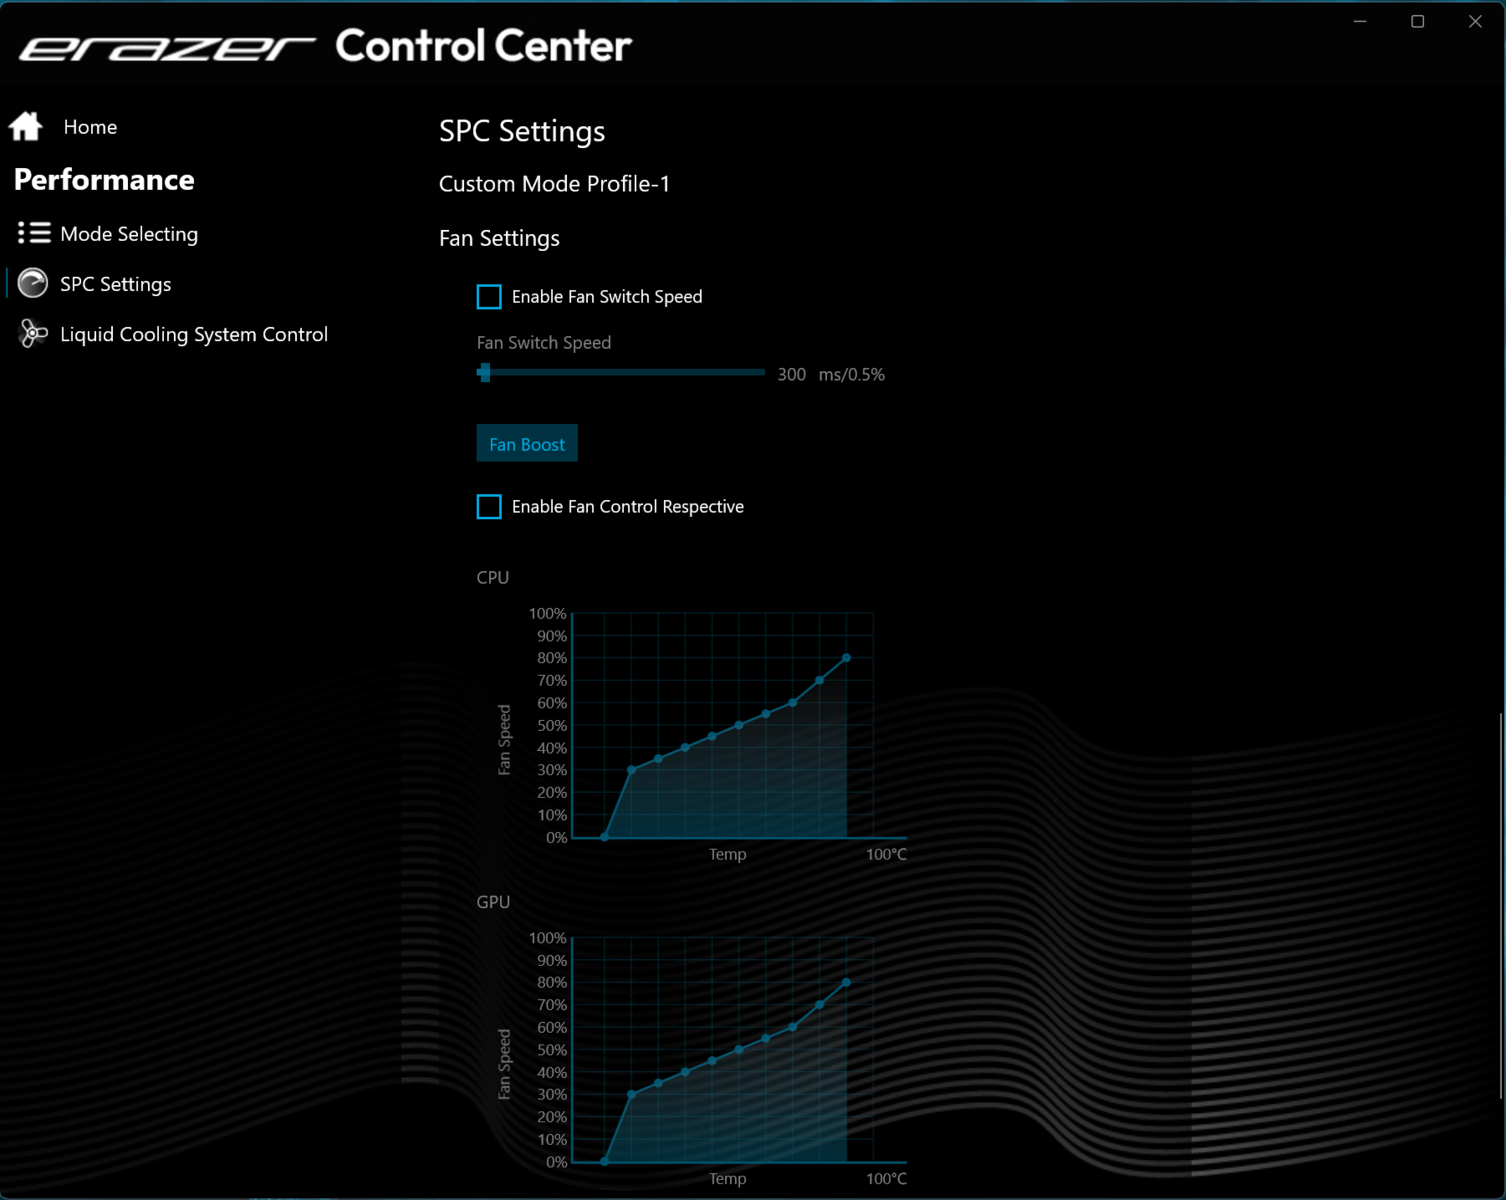
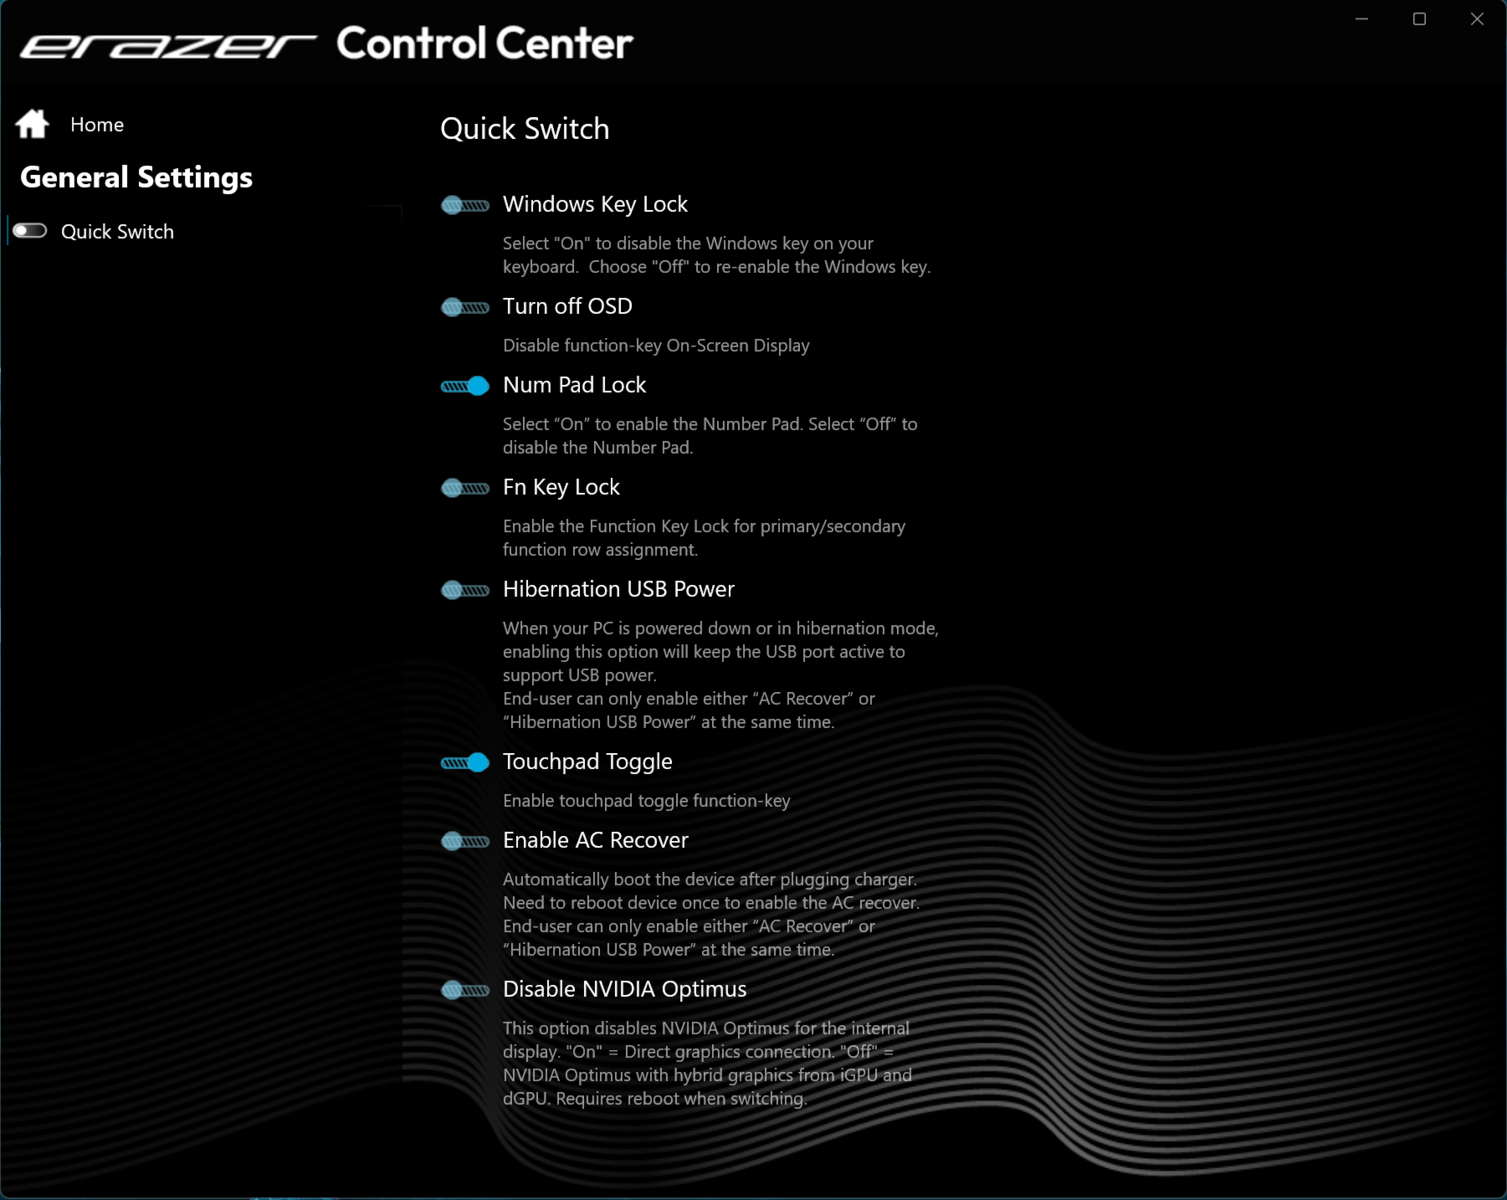
Des profils individuels peuvent être créés à l'aide du logiciel Control Center préinstallé, dans lequel les limites de puissance du CPU, le TGP du GPU et/ou les limites supérieures de température peuvent être ajustés.
| Mode jeu | Mode équilibre | Mode silencieux | |
|---|---|---|---|
| Limite de puissance 1 (HWInfo) | 160 watts | 160 watts | 160 watts |
| Limite de puissance 2 (HWInfo) | 160 watts | 160 watts | 160 watts |
| Bruit (Witcher 3) | 52 dB(A) | 50 dB(A) | 34 dB(A) |
| Performance (Witcher 3) | ~214 fps | ~204 fps | 30 fps (verrouillé) |
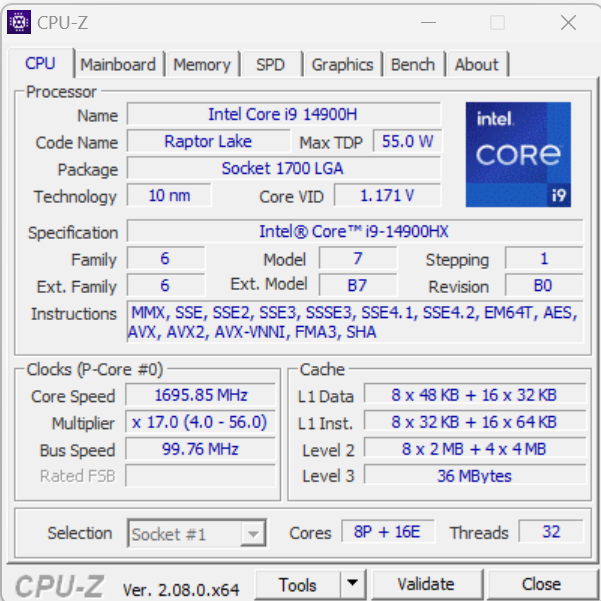
Processeur
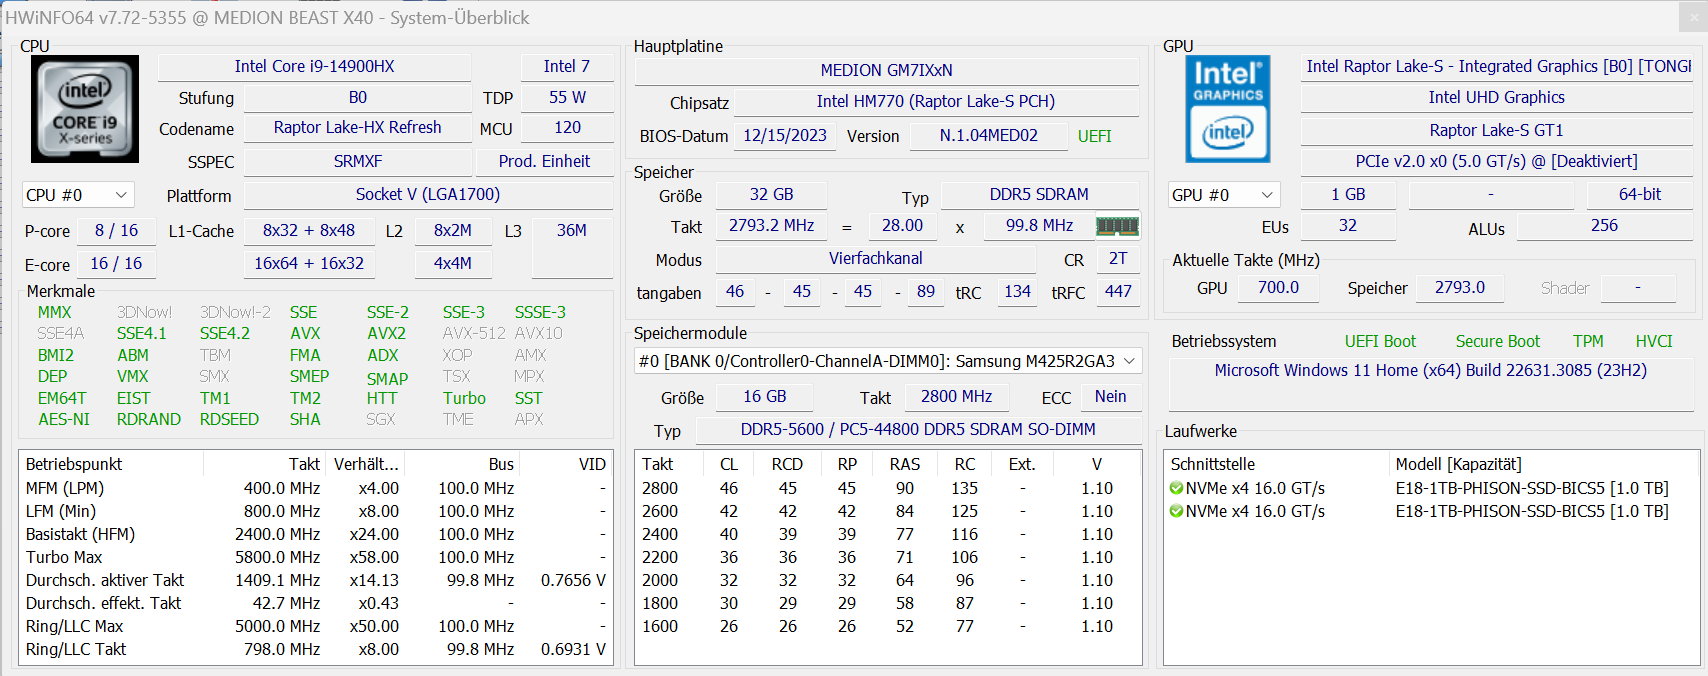
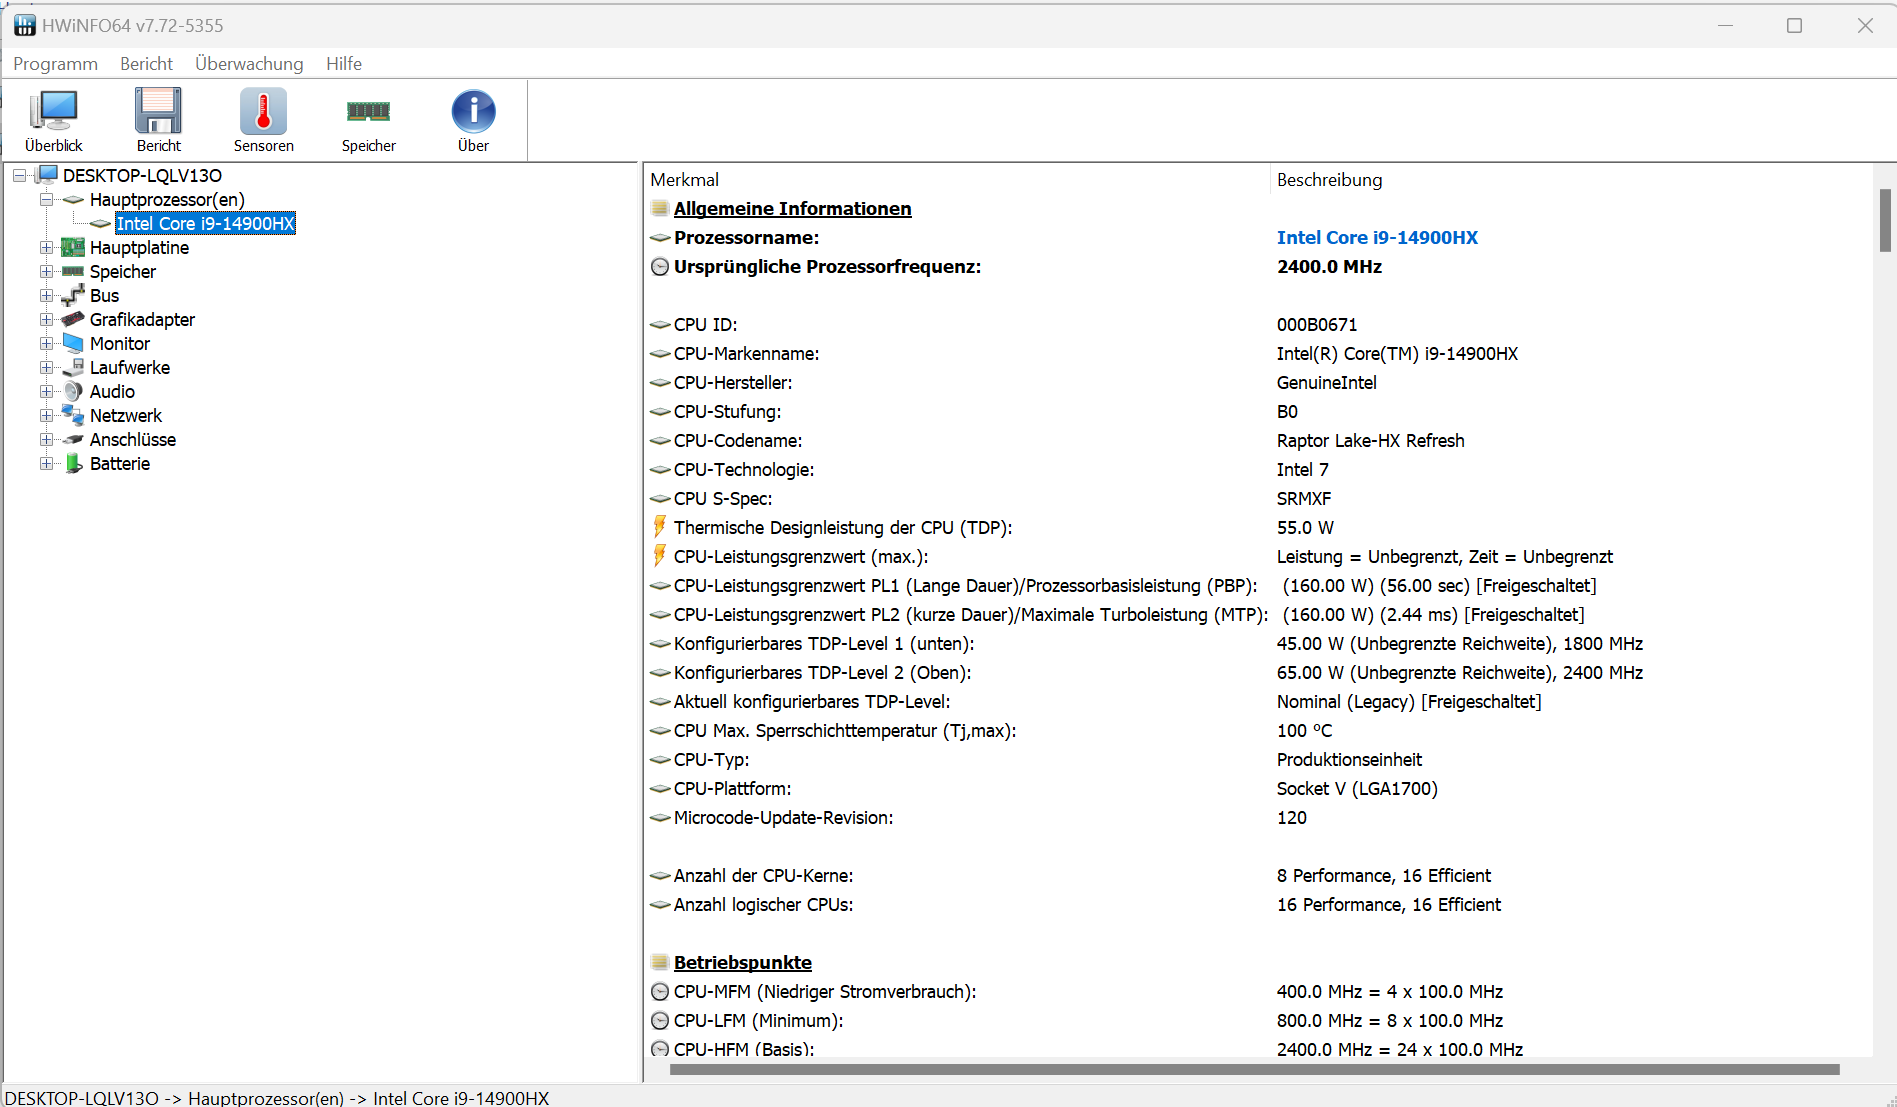
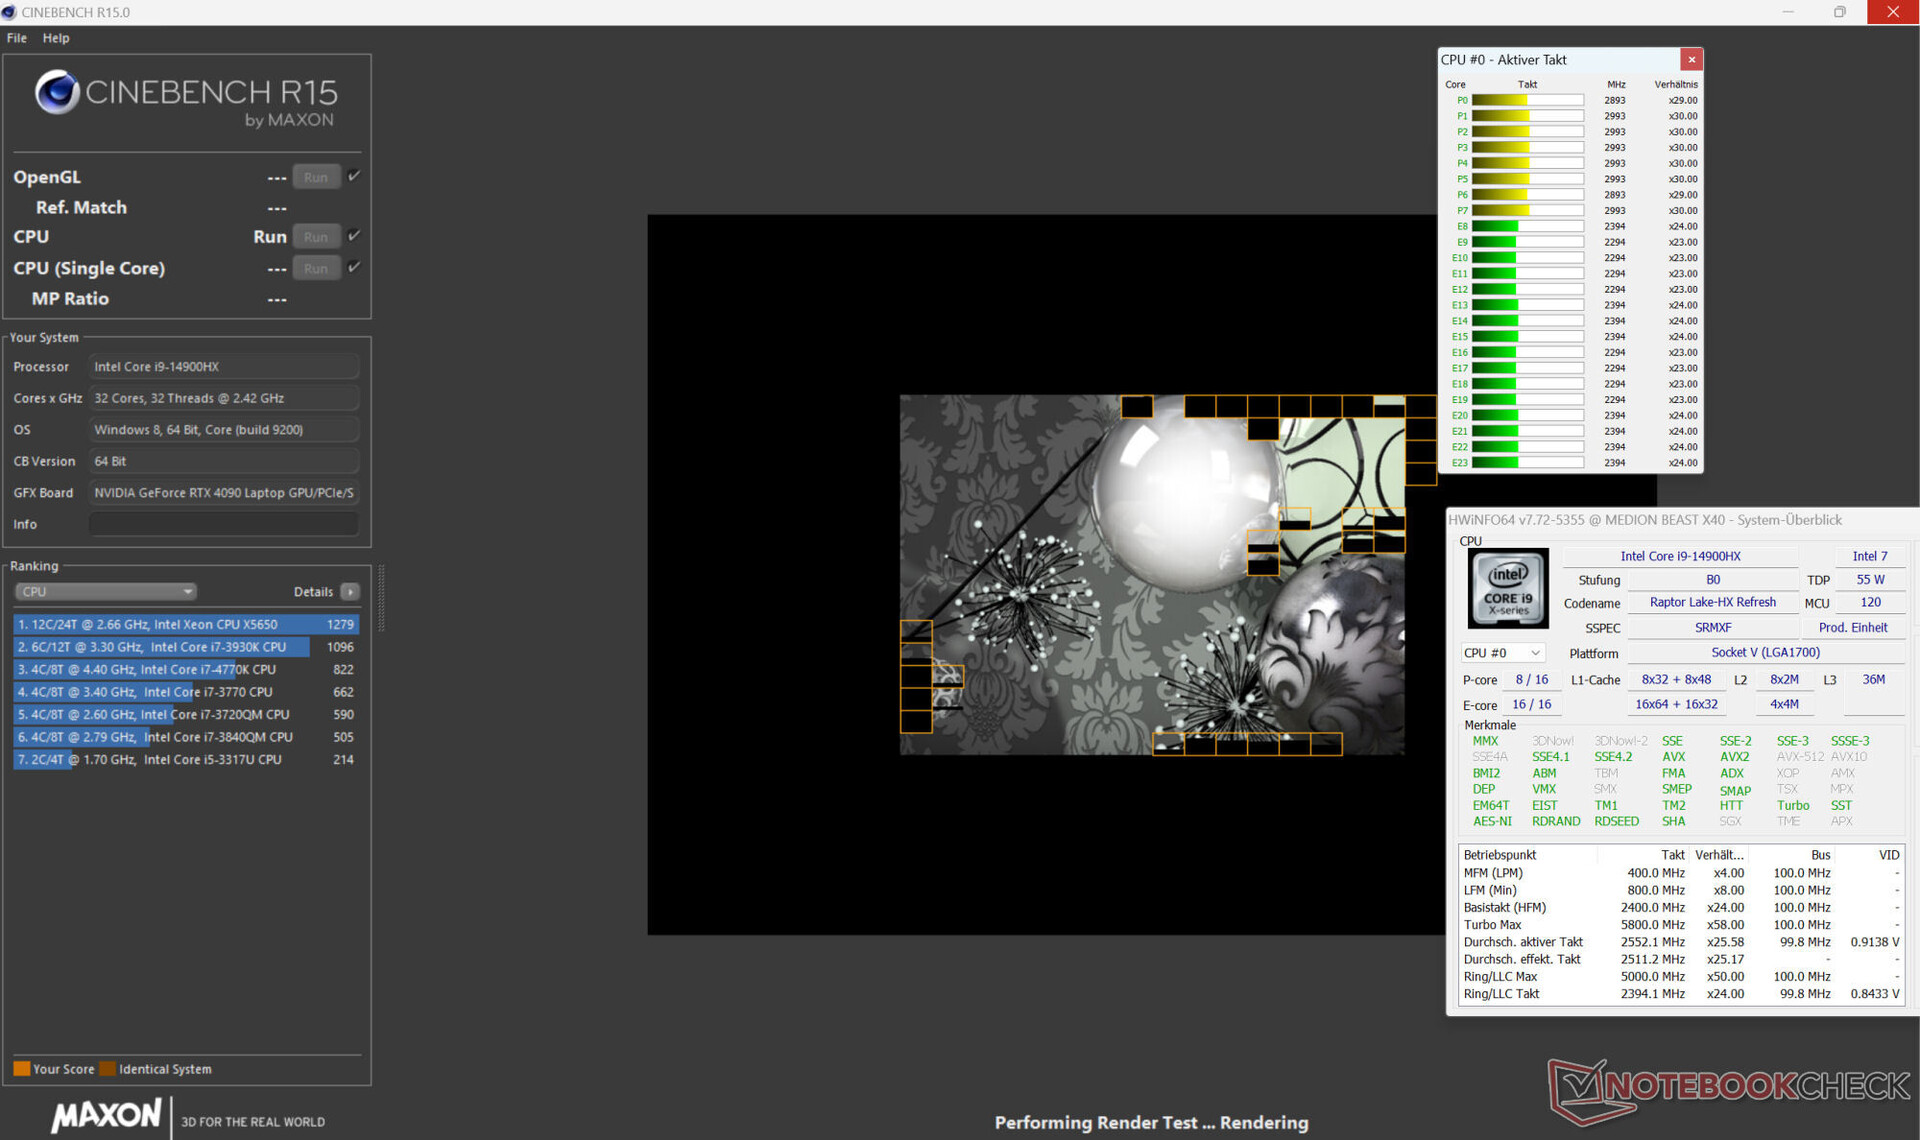
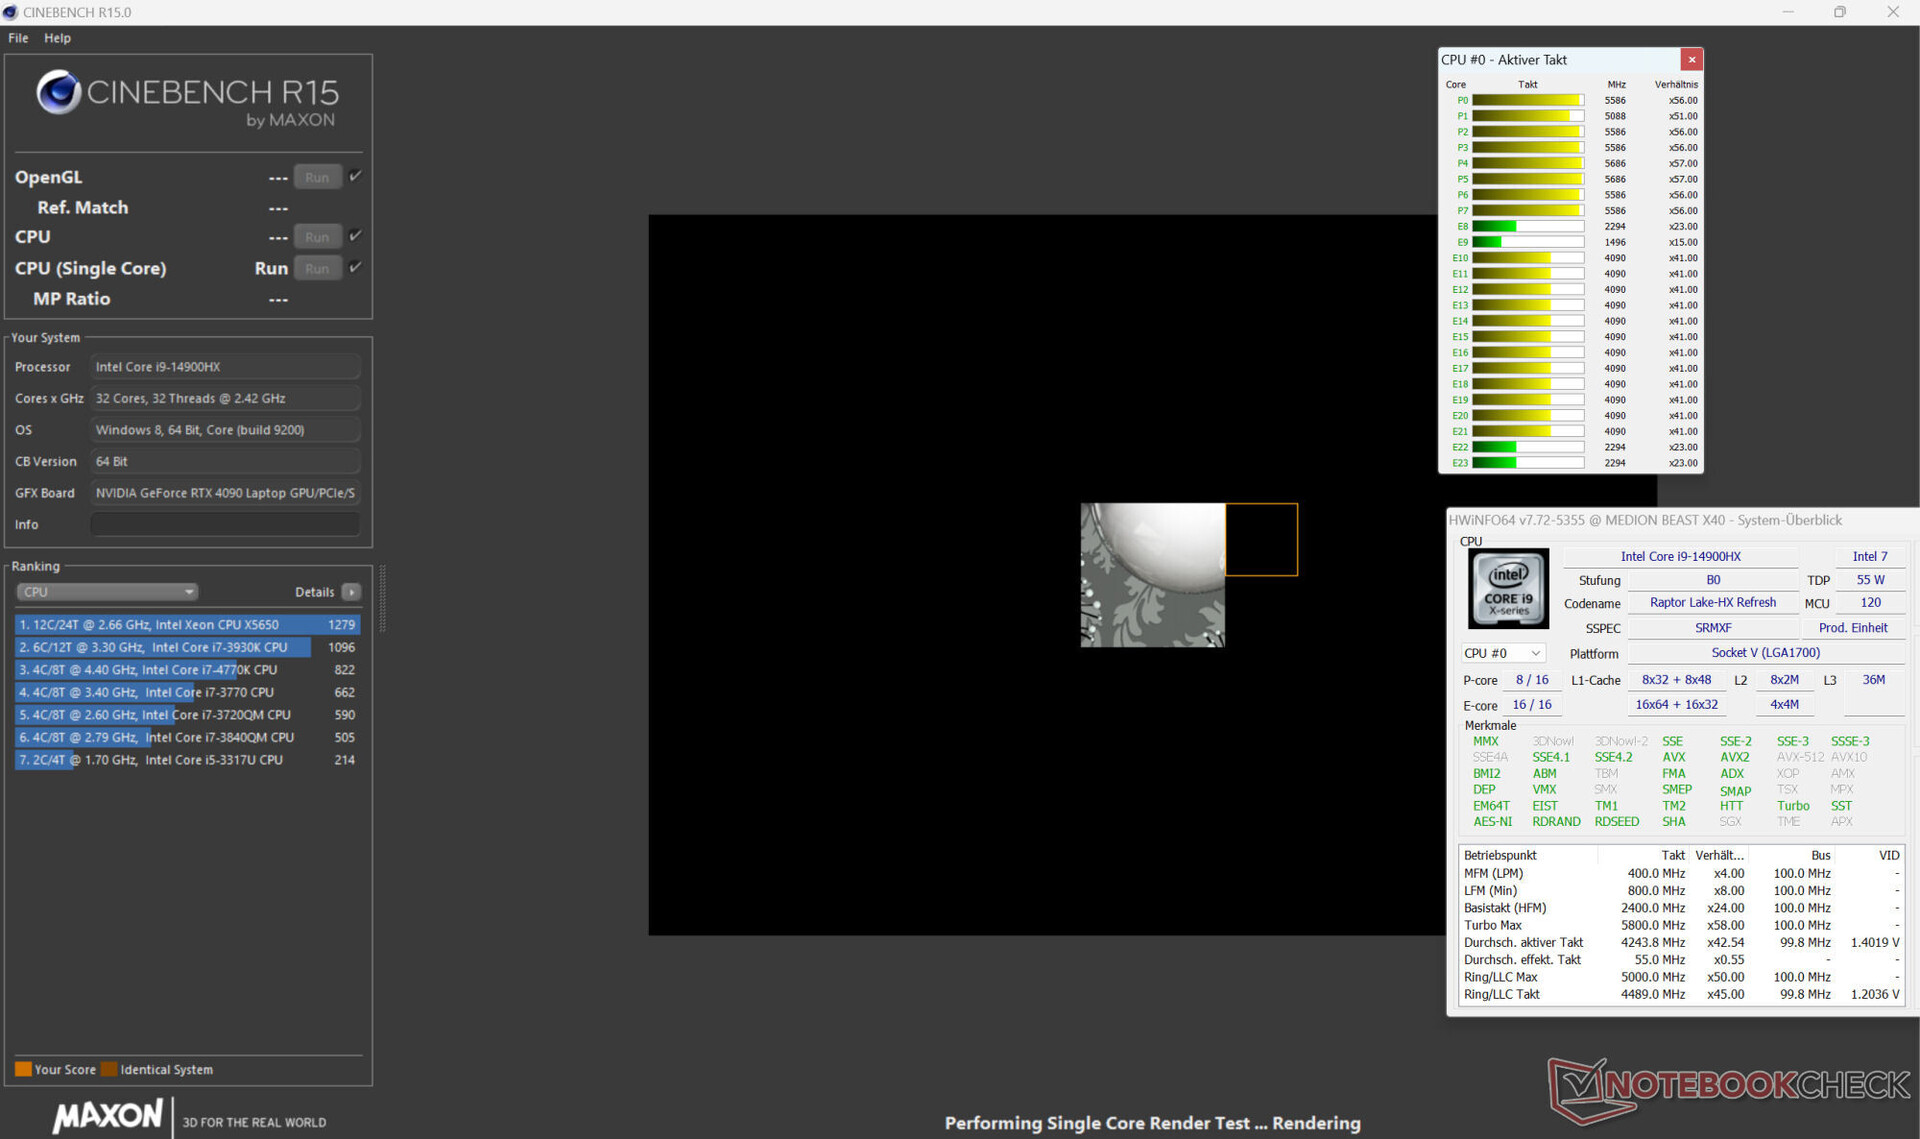
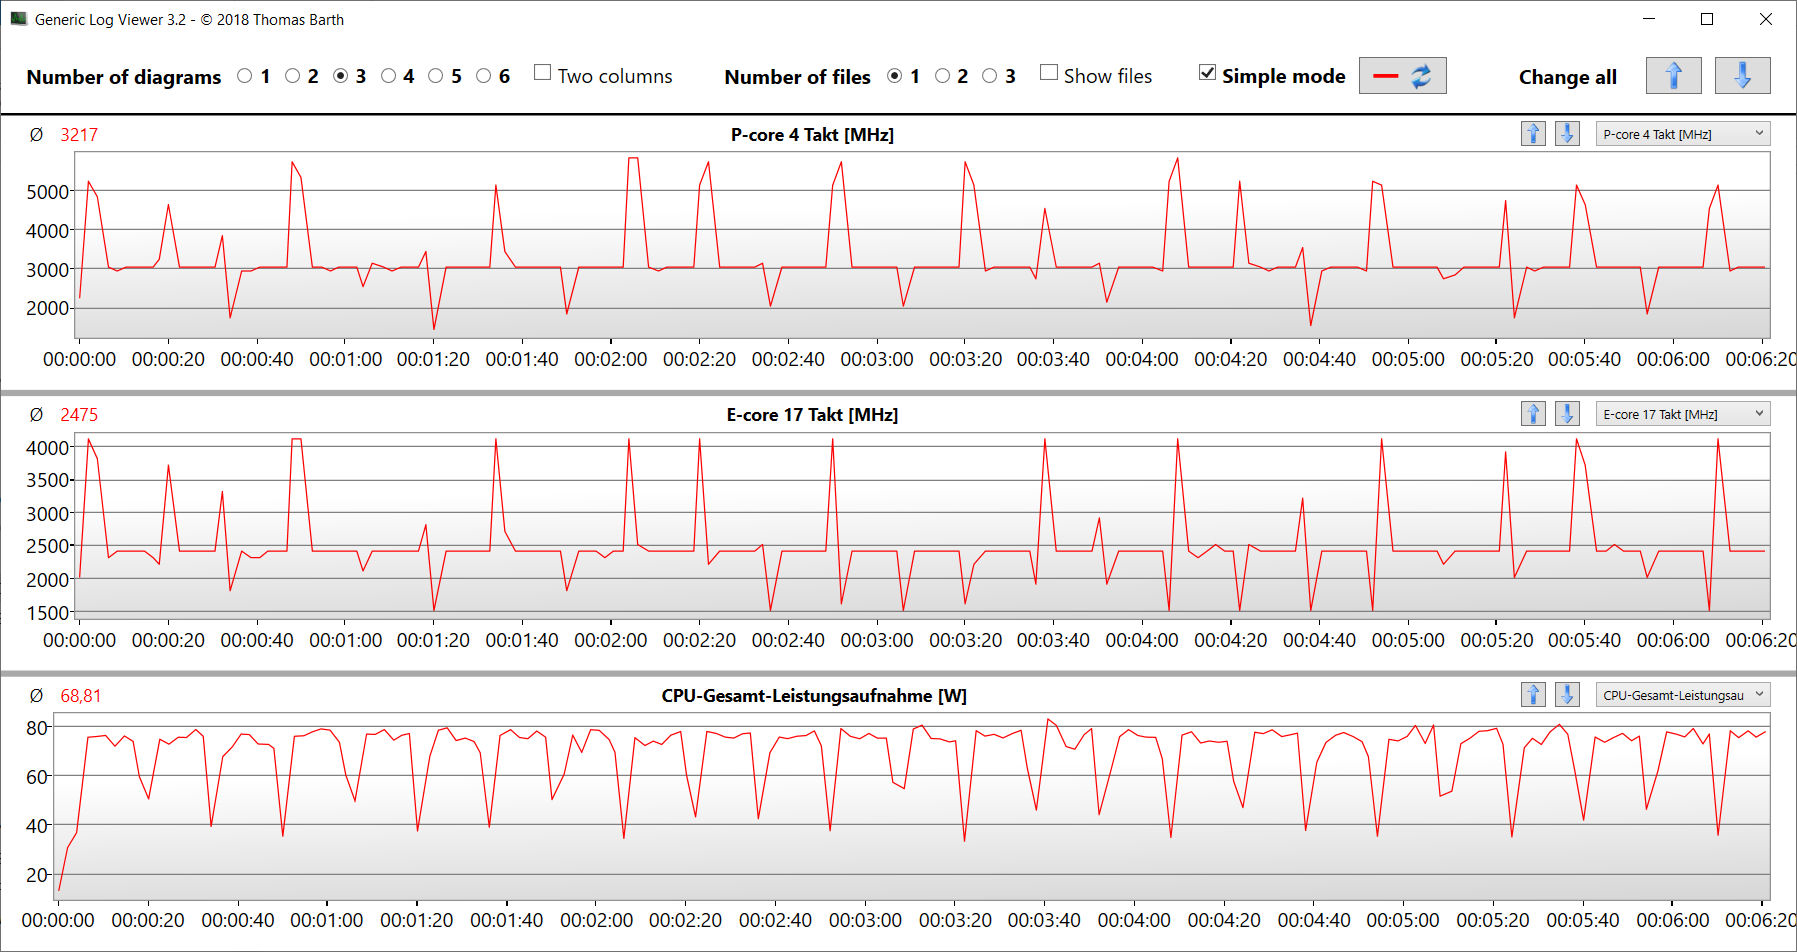
Les 24 cœurs de CPU (8P + 16E et 32 threads) du Raptor Lake-HX Core i9-14900HX atteignent des vitesses d'horloge maximales de 5,8 GHz (cœur P) et de 4,1 GHz (cœur E). Grâce à des fréquences d'horloge légèrement plus élevées, le CPU offre un peu plus de performances que le CPU du 2023 Beast X40 équipé d'un Core i9-13900HX.
La charge multithread continue (boucle CB15) est reconnue avec une fréquence d'horloge constante - le niveau dépend du mode d'alimentation. le mode "Balance" fournit des valeurs de référence inférieures à la moyenne du CPU, tandis que le mode "Gaming" les dépasse. La performance du single-thread est différente : elle se situe à un niveau élevé, presque identique dans les trois profils.
Vous trouverez plus d'informations sur le Core i9-14900HX dans notre article d'analyse Test de l'Intel Raptor Lake-HX Refresh : Core i9-14900HX avec plus de performances à cœur unique .
Cinebench R15 Multi Dauertest
| CPU Performance rating - Percent | |
| Asus ROG Strix Scar 17 G733PYV-LL053X | |
| Medion Erazer Beast X40 2024 | |
| MSI Titan 18 HX A14VIG | |
| Asus ROG Strix Scar 18 G834JYR (2024) | |
| Moyenne Intel Core i9-14900HX | |
| Medion Erazer Beast X40 -2! | |
| Schenker Key 17 Pro (Early 23) -2! | |
| Medion Erazer Beast X40 2024 | |
| Moyenne de la classe Gaming | |
| Cinebench R20 | |
| CPU (Multi Core) | |
| Asus ROG Strix Scar 17 G733PYV-LL053X | |
| MSI Titan 18 HX A14VIG | |
| Medion Erazer Beast X40 2024 (Gaming Mode) | |
| Medion Erazer Beast X40 | |
| Moyenne Intel Core i9-14900HX (6579 - 13832, n=37) | |
| Asus ROG Strix Scar 18 G834JYR (2024) | |
| Schenker Key 17 Pro (Early 23) | |
| Moyenne de la classe Gaming (4029 - 16433, n=106, 2 dernières années) | |
| Medion Erazer Beast X40 2024 | |
| CPU (Single Core) | |
| Medion Erazer Beast X40 2024 | |
| Asus ROG Strix Scar 18 G834JYR (2024) | |
| Medion Erazer Beast X40 2024 (Gaming Mode) | |
| Moyenne Intel Core i9-14900HX (657 - 859, n=37) | |
| MSI Titan 18 HX A14VIG | |
| Schenker Key 17 Pro (Early 23) | |
| Medion Erazer Beast X40 | |
| Moyenne de la classe Gaming (442 - 913, n=106, 2 dernières années) | |
| Asus ROG Strix Scar 17 G733PYV-LL053X | |
| Blender - v2.79 BMW27 CPU | |
| Moyenne de la classe Gaming (79 - 330, n=104, 2 dernières années) | |
| Medion Erazer Beast X40 2024 | |
| Moyenne Intel Core i9-14900HX (91 - 206, n=37) | |
| Schenker Key 17 Pro (Early 23) | |
| Asus ROG Strix Scar 18 G834JYR (2024) | |
| Medion Erazer Beast X40 2024 (Gaming Mode) | |
| Medion Erazer Beast X40 | |
| MSI Titan 18 HX A14VIG | |
| Asus ROG Strix Scar 17 G733PYV-LL053X | |
| Geekbench 6.7 | |
| Multi-Core | |
| Medion Erazer Beast X40 2024 (6.2.1, Gaming Mode) | |
| Asus ROG Strix Scar 18 G834JYR (2024) (6.2.1) | |
| Moyenne Intel Core i9-14900HX (13158 - 19665, n=37) | |
| Asus ROG Strix Scar 17 G733PYV-LL053X | |
| MSI Titan 18 HX A14VIG (6.2.1) | |
| Moyenne de la classe Gaming (6625 - 22850, n=106, 2 dernières années) | |
| Medion Erazer Beast X40 2024 (6.2.1) | |
| Single-Core | |
| Medion Erazer Beast X40 2024 (6.2.1, Gaming Mode) | |
| Medion Erazer Beast X40 2024 (6.2.1) | |
| Asus ROG Strix Scar 18 G834JYR (2024) (6.2.1) | |
| Moyenne Intel Core i9-14900HX (2419 - 3129, n=37) | |
| Asus ROG Strix Scar 17 G733PYV-LL053X | |
| Moyenne de la classe Gaming (1490 - 3259, n=106, 2 dernières années) | |
| MSI Titan 18 HX A14VIG (6.2.1) | |
| HWBOT x265 Benchmark v2.2 - 4k Preset | |
| Asus ROG Strix Scar 17 G733PYV-LL053X | |
| Medion Erazer Beast X40 2024 (Gaming Mode) | |
| MSI Titan 18 HX A14VIG | |
| Medion Erazer Beast X40 | |
| Moyenne Intel Core i9-14900HX (16.8 - 38.9, n=37) | |
| Asus ROG Strix Scar 18 G834JYR (2024) | |
| Moyenne de la classe Gaming (11.5 - 44.4, n=105, 2 dernières années) | |
| Schenker Key 17 Pro (Early 23) | |
| Medion Erazer Beast X40 2024 | |
| LibreOffice - 20 Documents To PDF | |
| Moyenne de la classe Gaming (33.2 - 88.8, n=105, 2 dernières années) | |
| MSI Titan 18 HX A14VIG (6.3.4.2) | |
| Asus ROG Strix Scar 18 G834JYR (2024) (6.3.4.2) | |
| Medion Erazer Beast X40 | |
| Medion Erazer Beast X40 2024 (6.3.4.2) | |
| Moyenne Intel Core i9-14900HX (19 - 85.1, n=37) | |
| Schenker Key 17 Pro (Early 23) | |
| Medion Erazer Beast X40 2024 (6.3.4.2, Gaming Mode) | |
| Asus ROG Strix Scar 17 G733PYV-LL053X | |
| R Benchmark 2.5 - Overall mean | |
| Moyenne de la classe Gaming (0.3439 - 0.759, n=106, 2 dernières années) | |
| Asus ROG Strix Scar 17 G733PYV-LL053X | |
| Medion Erazer Beast X40 | |
| Schenker Key 17 Pro (Early 23) | |
| Asus ROG Strix Scar 18 G834JYR (2024) | |
| MSI Titan 18 HX A14VIG | |
| Moyenne Intel Core i9-14900HX (0.3604 - 0.4859, n=37) | |
| Medion Erazer Beast X40 2024 | |
| Medion Erazer Beast X40 2024 (Gaming Mode) | |
* ... Moindre est la valeur, meilleures sont les performances
AIDA64: FP32 Ray-Trace | FPU Julia | CPU SHA3 | CPU Queen | FPU SinJulia | FPU Mandel | CPU AES | CPU ZLib | FP64 Ray-Trace | CPU PhotoWorxx
| Performance rating | |
| Asus ROG Strix Scar 17 G733PYV-LL053X | |
| Medion Erazer Beast X40 2024 | |
| MSI Titan 18 HX A14VIG | |
| Medion Erazer Beast X40 | |
| Asus ROG Strix Scar 18 G834JYR (2024) | |
| Schenker Key 17 Pro (Early 23) | |
| Moyenne de la classe Gaming | |
| Moyenne Intel Core i9-14900HX | |
| Medion Erazer Beast X40 2024 | |
| AIDA64 / FP32 Ray-Trace | |
| Asus ROG Strix Scar 17 G733PYV-LL053X (v6.88.6413 Beta) | |
| Moyenne de la classe Gaming (10227 - 85542, n=105, 2 dernières années) | |
| MSI Titan 18 HX A14VIG (v6.92.6600) | |
| Medion Erazer Beast X40 2024 (v6.92.6600, Gaming Mode) | |
| Medion Erazer Beast X40 (v6.75.6100) | |
| Asus ROG Strix Scar 18 G834JYR (2024) (v6.92.6600) | |
| Moyenne Intel Core i9-14900HX (13098 - 33474, n=36) | |
| Schenker Key 17 Pro (Early 23) (v6.75.6100) | |
| Medion Erazer Beast X40 2024 (v6.92.6600) | |
| AIDA64 / FPU Julia | |
| Asus ROG Strix Scar 17 G733PYV-LL053X (v6.88.6413 Beta) | |
| MSI Titan 18 HX A14VIG (v6.92.6600) | |
| Medion Erazer Beast X40 2024 (v6.92.6600, Gaming Mode) | |
| Moyenne de la classe Gaming (51376 - 238426, n=105, 2 dernières années) | |
| Medion Erazer Beast X40 (v6.75.6100) | |
| Asus ROG Strix Scar 18 G834JYR (2024) (v6.92.6600) | |
| Moyenne Intel Core i9-14900HX (67573 - 166040, n=36) | |
| Schenker Key 17 Pro (Early 23) (v6.75.6100) | |
| Medion Erazer Beast X40 2024 (v6.92.6600) | |
| AIDA64 / CPU SHA3 | |
| Asus ROG Strix Scar 17 G733PYV-LL053X (v6.88.6413 Beta) | |
| MSI Titan 18 HX A14VIG (v6.92.6600) | |
| Medion Erazer Beast X40 2024 (v6.92.6600, Gaming Mode) | |
| Medion Erazer Beast X40 (v6.75.6100) | |
| Moyenne de la classe Gaming (2180 - 10115, n=105, 2 dernières années) | |
| Asus ROG Strix Scar 18 G834JYR (2024) (v6.92.6600) | |
| Moyenne Intel Core i9-14900HX (3589 - 7979, n=36) | |
| Schenker Key 17 Pro (Early 23) (v6.75.6100) | |
| Medion Erazer Beast X40 2024 (v6.92.6600) | |
| AIDA64 / CPU Queen | |
| Asus ROG Strix Scar 17 G733PYV-LL053X (v6.88.6413 Beta) | |
| MSI Titan 18 HX A14VIG (v6.92.6600) | |
| Medion Erazer Beast X40 2024 (v6.92.6600, Gaming Mode) | |
| Asus ROG Strix Scar 18 G834JYR (2024) (v6.92.6600) | |
| Moyenne Intel Core i9-14900HX (118405 - 148966, n=36) | |
| Schenker Key 17 Pro (Early 23) (v6.75.6100) | |
| Medion Erazer Beast X40 (v6.75.6100) | |
| Medion Erazer Beast X40 2024 (v6.92.6600) | |
| Moyenne de la classe Gaming (49785 - 173351, n=90, 2 dernières années) | |
| AIDA64 / FPU SinJulia | |
| Asus ROG Strix Scar 17 G733PYV-LL053X (v6.88.6413 Beta) | |
| MSI Titan 18 HX A14VIG (v6.92.6600) | |
| Medion Erazer Beast X40 2024 (v6.92.6600, Gaming Mode) | |
| Asus ROG Strix Scar 18 G834JYR (2024) (v6.92.6600) | |
| Medion Erazer Beast X40 (v6.75.6100) | |
| Moyenne Intel Core i9-14900HX (10475 - 18517, n=36) | |
| Schenker Key 17 Pro (Early 23) (v6.75.6100) | |
| Moyenne de la classe Gaming (4424 - 33636, n=105, 2 dernières années) | |
| Medion Erazer Beast X40 2024 (v6.92.6600) | |
| AIDA64 / FPU Mandel | |
| Asus ROG Strix Scar 17 G733PYV-LL053X (v6.88.6413 Beta) | |
| Moyenne de la classe Gaming (25115 - 128721, n=105, 2 dernières années) | |
| MSI Titan 18 HX A14VIG (v6.92.6600) | |
| Medion Erazer Beast X40 2024 (v6.92.6600, Gaming Mode) | |
| Medion Erazer Beast X40 (v6.75.6100) | |
| Asus ROG Strix Scar 18 G834JYR (2024) (v6.92.6600) | |
| Moyenne Intel Core i9-14900HX (32543 - 83662, n=36) | |
| Schenker Key 17 Pro (Early 23) (v6.75.6100) | |
| Medion Erazer Beast X40 2024 | |
| AIDA64 / CPU AES | |
| Asus ROG Strix Scar 17 G733PYV-LL053X (v6.88.6413 Beta) | |
| Schenker Key 17 Pro (Early 23) (v6.75.6100) | |
| Moyenne Intel Core i9-14900HX (86964 - 241777, n=36) | |
| MSI Titan 18 HX A14VIG (v6.92.6600) | |
| Medion Erazer Beast X40 2024 (v6.92.6600, Gaming Mode) | |
| Medion Erazer Beast X40 (v6.75.6100) | |
| Asus ROG Strix Scar 18 G834JYR (2024) (v6.92.6600) | |
| Moyenne de la classe Gaming (39258 - 247074, n=105, 2 dernières années) | |
| Medion Erazer Beast X40 2024 (v6.92.6600) | |
| AIDA64 / CPU ZLib | |
| MSI Titan 18 HX A14VIG (v6.92.6600) | |
| Medion Erazer Beast X40 2024 (v6.92.6600, Gaming Mode) | |
| Asus ROG Strix Scar 17 G733PYV-LL053X (v6.88.6413 Beta) | |
| Medion Erazer Beast X40 (v6.75.6100) | |
| Moyenne Intel Core i9-14900HX (1054 - 2292, n=36) | |
| Asus ROG Strix Scar 18 G834JYR (2024) | |
| Schenker Key 17 Pro (Early 23) (v6.75.6100) | |
| Moyenne de la classe Gaming (574 - 2531, n=105, 2 dernières années) | |
| Medion Erazer Beast X40 2024 (v6.92.6600) | |
| AIDA64 / FP64 Ray-Trace | |
| Asus ROG Strix Scar 17 G733PYV-LL053X (v6.88.6413 Beta) | |
| Moyenne de la classe Gaming (5509 - 45446, n=105, 2 dernières années) | |
| MSI Titan 18 HX A14VIG (v6.92.6600) | |
| Medion Erazer Beast X40 2024 (v6.92.6600, Gaming Mode) | |
| Medion Erazer Beast X40 (v6.75.6100) | |
| Asus ROG Strix Scar 18 G834JYR (2024) (v6.92.6600) | |
| Moyenne Intel Core i9-14900HX (6809 - 18349, n=36) | |
| Schenker Key 17 Pro (Early 23) (v6.75.6100) | |
| Medion Erazer Beast X40 2024 (v6.92.6600) | |
| AIDA64 / CPU PhotoWorxx | |
| Schenker Key 17 Pro (Early 23) (v6.75.6100) | |
| Asus ROG Strix Scar 18 G834JYR (2024) (v6.92.6600) | |
| Medion Erazer Beast X40 2024 (v6.92.6600) | |
| Medion Erazer Beast X40 2024 (v6.92.6600, Gaming Mode) | |
| Moyenne Intel Core i9-14900HX (23903 - 54702, n=36) | |
| Moyenne de la classe Gaming (12271 - 89891, n=105, 2 dernières années) | |
| Medion Erazer Beast X40 (v6.75.6100) | |
| Asus ROG Strix Scar 17 G733PYV-LL053X (v6.88.6413 Beta) | |
| MSI Titan 18 HX A14VIG (v6.92.6600) | |
Performance du système
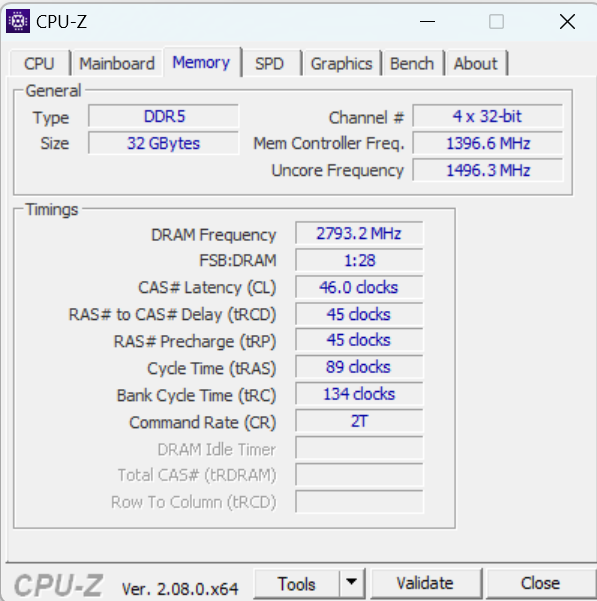
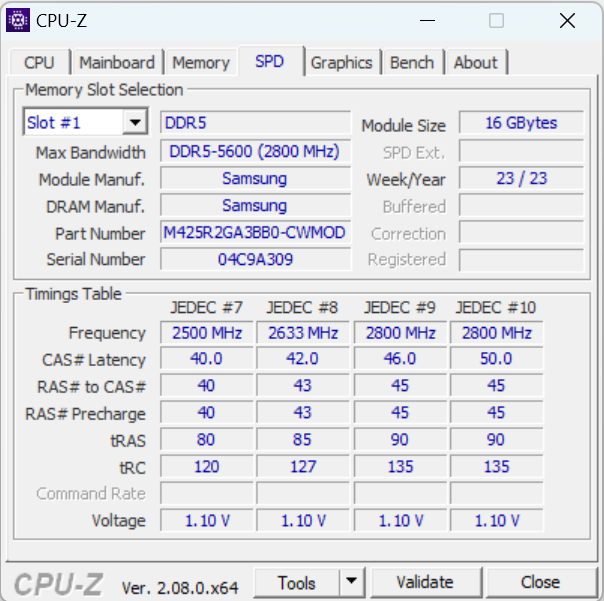
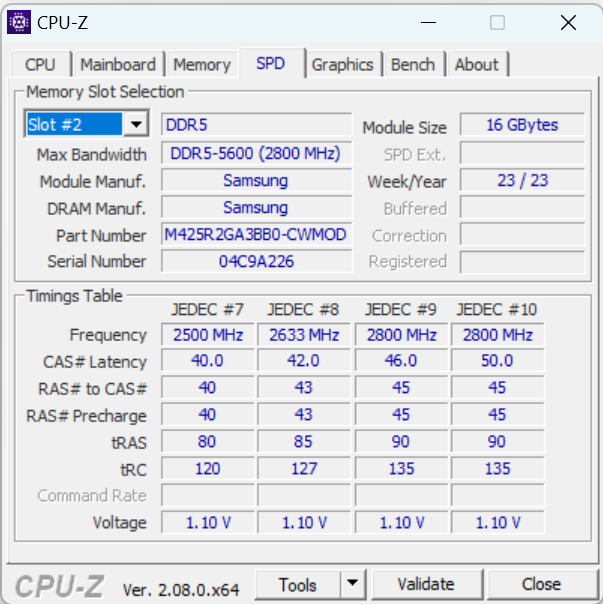
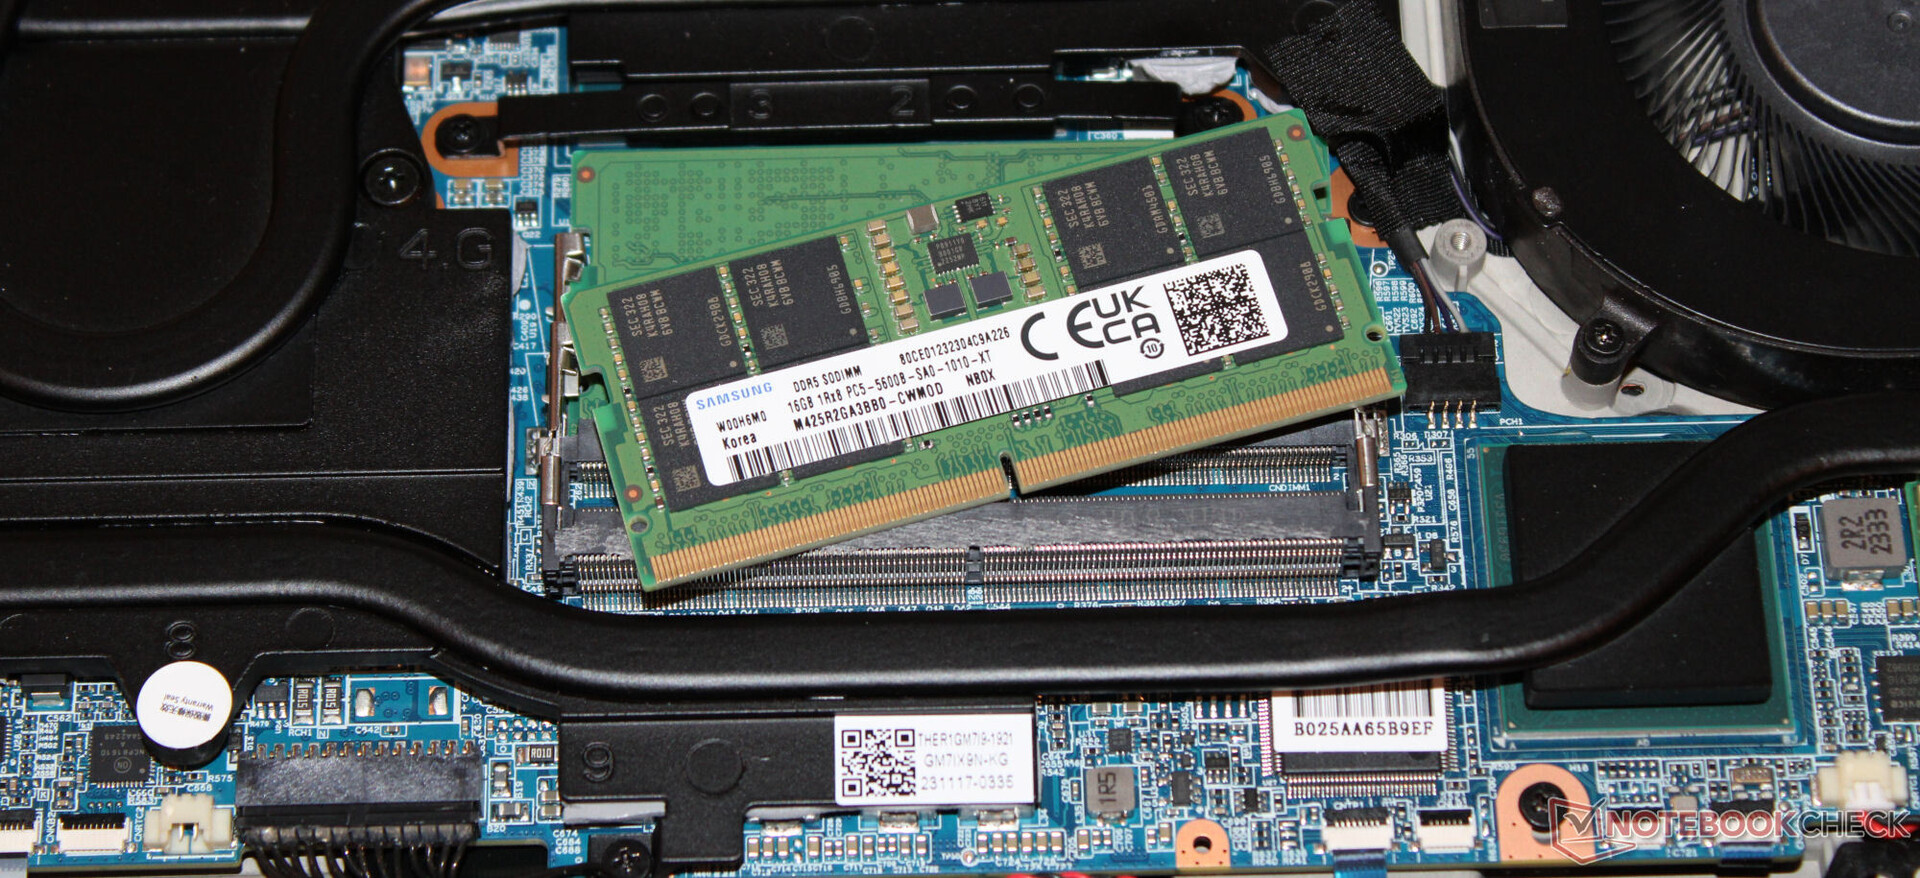
Un simple coup d'œil à la fiche technique suffit à confirmer que le système offre suffisamment de puissance pour faire tourner sans problème des applications exigeantes telles que les jeux, le rendu et le streaming. Les taux de transfert de la mémoire vive se situent à un niveau normal pour de la RAM DDR5-5600.
CrossMark: Overall | Productivity | Creativity | Responsiveness
WebXPRT 3: Overall
WebXPRT 4: Overall
Mozilla Kraken 1.1: Total
| PCMark 10 / Score | |
| Asus ROG Strix Scar 17 G733PYV-LL053X | |
| MSI Titan 18 HX A14VIG | |
| Medion Erazer Beast X40 2024 | |
| Schenker Key 17 Pro (Early 23) | |
| Asus ROG Strix Scar 18 G834JYR (2024) | |
| Moyenne Intel Core i9-14900HX, NVIDIA GeForce RTX 4090 Laptop GPU (8230 - 9234, n=13) | |
| Moyenne de la classe Gaming (5828 - 12414, n=93, 2 dernières années) | |
| Medion Erazer Beast X40 | |
| PCMark 10 / Essentials | |
| MSI Titan 18 HX A14VIG | |
| Asus ROG Strix Scar 17 G733PYV-LL053X | |
| Asus ROG Strix Scar 18 G834JYR (2024) | |
| Schenker Key 17 Pro (Early 23) | |
| Medion Erazer Beast X40 | |
| Moyenne Intel Core i9-14900HX, NVIDIA GeForce RTX 4090 Laptop GPU (10778 - 11628, n=13) | |
| Medion Erazer Beast X40 2024 | |
| Moyenne de la classe Gaming (8810 - 11935, n=97, 2 dernières années) | |
| PCMark 10 / Productivity | |
| Medion Erazer Beast X40 2024 | |
| Medion Erazer Beast X40 | |
| Schenker Key 17 Pro (Early 23) | |
| Moyenne de la classe Gaming (6845 - 25323, n=95, 2 dernières années) | |
| Asus ROG Strix Scar 17 G733PYV-LL053X | |
| Moyenne Intel Core i9-14900HX, NVIDIA GeForce RTX 4090 Laptop GPU (9458 - 11759, n=13) | |
| Asus ROG Strix Scar 18 G834JYR (2024) | |
| MSI Titan 18 HX A14VIG | |
| PCMark 10 / Digital Content Creation | |
| MSI Titan 18 HX A14VIG | |
| Asus ROG Strix Scar 17 G733PYV-LL053X | |
| Asus ROG Strix Scar 18 G834JYR (2024) | |
| Medion Erazer Beast X40 2024 | |
| Moyenne Intel Core i9-14900HX, NVIDIA GeForce RTX 4090 Laptop GPU (13219 - 16462, n=13) | |
| Schenker Key 17 Pro (Early 23) | |
| Moyenne de la classe Gaming (7602 - 19954, n=95, 2 dernières années) | |
| Medion Erazer Beast X40 | |
| CrossMark / Overall | |
| Schenker Key 17 Pro (Early 23) | |
| Asus ROG Strix Scar 18 G834JYR (2024) | |
| Medion Erazer Beast X40 2024 | |
| Medion Erazer Beast X40 | |
| Moyenne Intel Core i9-14900HX, NVIDIA GeForce RTX 4090 Laptop GPU (1877 - 2344, n=10) | |
| Asus ROG Strix Scar 17 G733PYV-LL053X | |
| Moyenne de la classe Gaming (1366 - 2409, n=94, 2 dernières années) | |
| MSI Titan 18 HX A14VIG | |
| CrossMark / Productivity | |
| Schenker Key 17 Pro (Early 23) | |
| Medion Erazer Beast X40 2024 | |
| Asus ROG Strix Scar 18 G834JYR (2024) | |
| Medion Erazer Beast X40 | |
| Moyenne Intel Core i9-14900HX, NVIDIA GeForce RTX 4090 Laptop GPU (1738 - 2162, n=10) | |
| Asus ROG Strix Scar 17 G733PYV-LL053X | |
| Moyenne de la classe Gaming (1386 - 2254, n=94, 2 dernières années) | |
| MSI Titan 18 HX A14VIG | |
| CrossMark / Creativity | |
| Asus ROG Strix Scar 18 G834JYR (2024) | |
| Schenker Key 17 Pro (Early 23) | |
| Asus ROG Strix Scar 17 G733PYV-LL053X | |
| Medion Erazer Beast X40 | |
| Moyenne Intel Core i9-14900HX, NVIDIA GeForce RTX 4090 Laptop GPU (2195 - 2660, n=10) | |
| Medion Erazer Beast X40 2024 | |
| Moyenne de la classe Gaming (1343 - 2786, n=94, 2 dernières années) | |
| MSI Titan 18 HX A14VIG | |
| CrossMark / Responsiveness | |
| Schenker Key 17 Pro (Early 23) | |
| Asus ROG Strix Scar 18 G834JYR (2024) | |
| Medion Erazer Beast X40 2024 | |
| Moyenne Intel Core i9-14900HX, NVIDIA GeForce RTX 4090 Laptop GPU (1478 - 2327, n=10) | |
| Medion Erazer Beast X40 | |
| Moyenne de la classe Gaming (1226 - 2334, n=94, 2 dernières années) | |
| Asus ROG Strix Scar 17 G733PYV-LL053X | |
| MSI Titan 18 HX A14VIG | |
| WebXPRT 3 / Overall | |
| Asus ROG Strix Scar 17 G733PYV-LL053X | |
| MSI Titan 18 HX A14VIG | |
| Medion Erazer Beast X40 2024 | |
| Moyenne Intel Core i9-14900HX, NVIDIA GeForce RTX 4090 Laptop GPU (279 - 339, n=10) | |
| Medion Erazer Beast X40 | |
| Asus ROG Strix Scar 18 G834JYR (2024) | |
| Moyenne de la classe Gaming (220 - 532, n=98, 2 dernières années) | |
| Schenker Key 17 Pro (Early 23) | |
| WebXPRT 4 / Overall | |
| Asus ROG Strix Scar 17 G733PYV-LL053X | |
| Asus ROG Strix Scar 18 G834JYR (2024) | |
| Medion Erazer Beast X40 2024 | |
| Schenker Key 17 Pro (Early 23) | |
| Moyenne Intel Core i9-14900HX, NVIDIA GeForce RTX 4090 Laptop GPU (246 - 309, n=8) | |
| MSI Titan 18 HX A14VIG | |
| Moyenne de la classe Gaming (165 - 354, n=98, 2 dernières années) | |
| Mozilla Kraken 1.1 / Total | |
| Schenker Key 17 Pro (Early 23) | |
| Medion Erazer Beast X40 | |
| Moyenne de la classe Gaming (391 - 590, n=100, 2 dernières années) | |
| Moyenne Intel Core i9-14900HX, NVIDIA GeForce RTX 4090 Laptop GPU (428 - 535, n=11) | |
| MSI Titan 18 HX A14VIG | |
| Asus ROG Strix Scar 18 G834JYR (2024) | |
| Medion Erazer Beast X40 2024 | |
| Asus ROG Strix Scar 17 G733PYV-LL053X | |
* ... Moindre est la valeur, meilleures sont les performances
| PCMark 10 Score | 8963 points | |
Aide | ||
| AIDA64 / Memory Copy | |
| Asus ROG Strix Scar 18 G834JYR (2024) | |
| Schenker Key 17 Pro (Early 23) | |
| Medion Erazer Beast X40 2024 | |
| Moyenne Intel Core i9-14900HX (38028 - 83392, n=36) | |
| Moyenne de la classe Gaming (21750 - 129946, n=105, 2 dernières années) | |
| Medion Erazer Beast X40 | |
| MSI Titan 18 HX A14VIG | |
| Asus ROG Strix Scar 17 G733PYV-LL053X | |
| AIDA64 / Memory Read | |
| Asus ROG Strix Scar 18 G834JYR (2024) | |
| Medion Erazer Beast X40 2024 | |
| Schenker Key 17 Pro (Early 23) | |
| Moyenne Intel Core i9-14900HX (43306 - 87568, n=36) | |
| Medion Erazer Beast X40 | |
| Moyenne de la classe Gaming (22956 - 118858, n=105, 2 dernières années) | |
| Asus ROG Strix Scar 17 G733PYV-LL053X | |
| MSI Titan 18 HX A14VIG | |
| AIDA64 / Memory Write | |
| Asus ROG Strix Scar 18 G834JYR (2024) | |
| Medion Erazer Beast X40 2024 | |
| Schenker Key 17 Pro (Early 23) | |
| Moyenne de la classe Gaming (22297 - 135096, n=105, 2 dernières années) | |
| Moyenne Intel Core i9-14900HX (37146 - 80589, n=36) | |
| Medion Erazer Beast X40 | |
| Asus ROG Strix Scar 17 G733PYV-LL053X | |
| MSI Titan 18 HX A14VIG | |
| AIDA64 / Memory Latency | |
| Moyenne de la classe Gaming (75.3 - 259, n=105, 2 dernières années) | |
| MSI Titan 18 HX A14VIG | |
| Schenker Key 17 Pro (Early 23) | |
| Medion Erazer Beast X40 | |
| Asus ROG Strix Scar 17 G733PYV-LL053X | |
| Moyenne Intel Core i9-14900HX (76.1 - 105, n=36) | |
| Asus ROG Strix Scar 18 G834JYR (2024) | |
| Medion Erazer Beast X40 2024 | |
* ... Moindre est la valeur, meilleures sont les performances
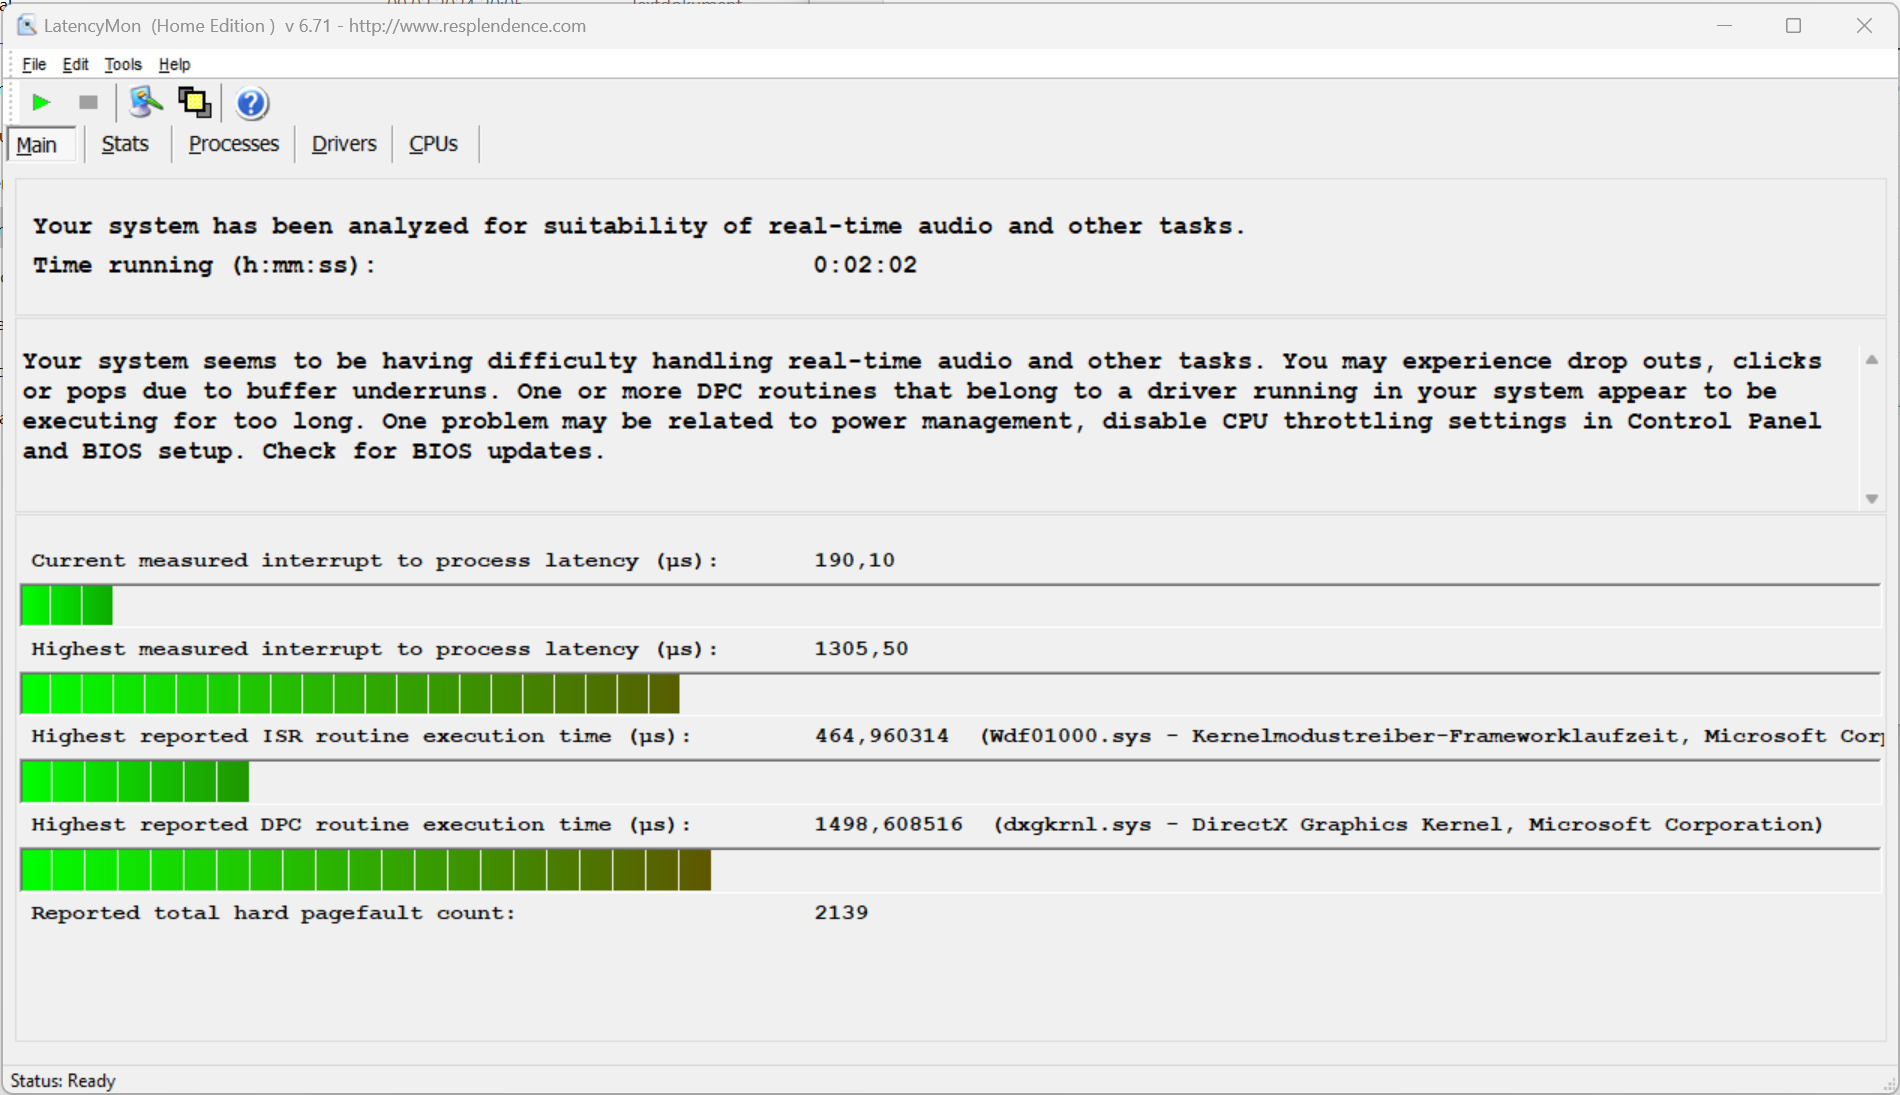
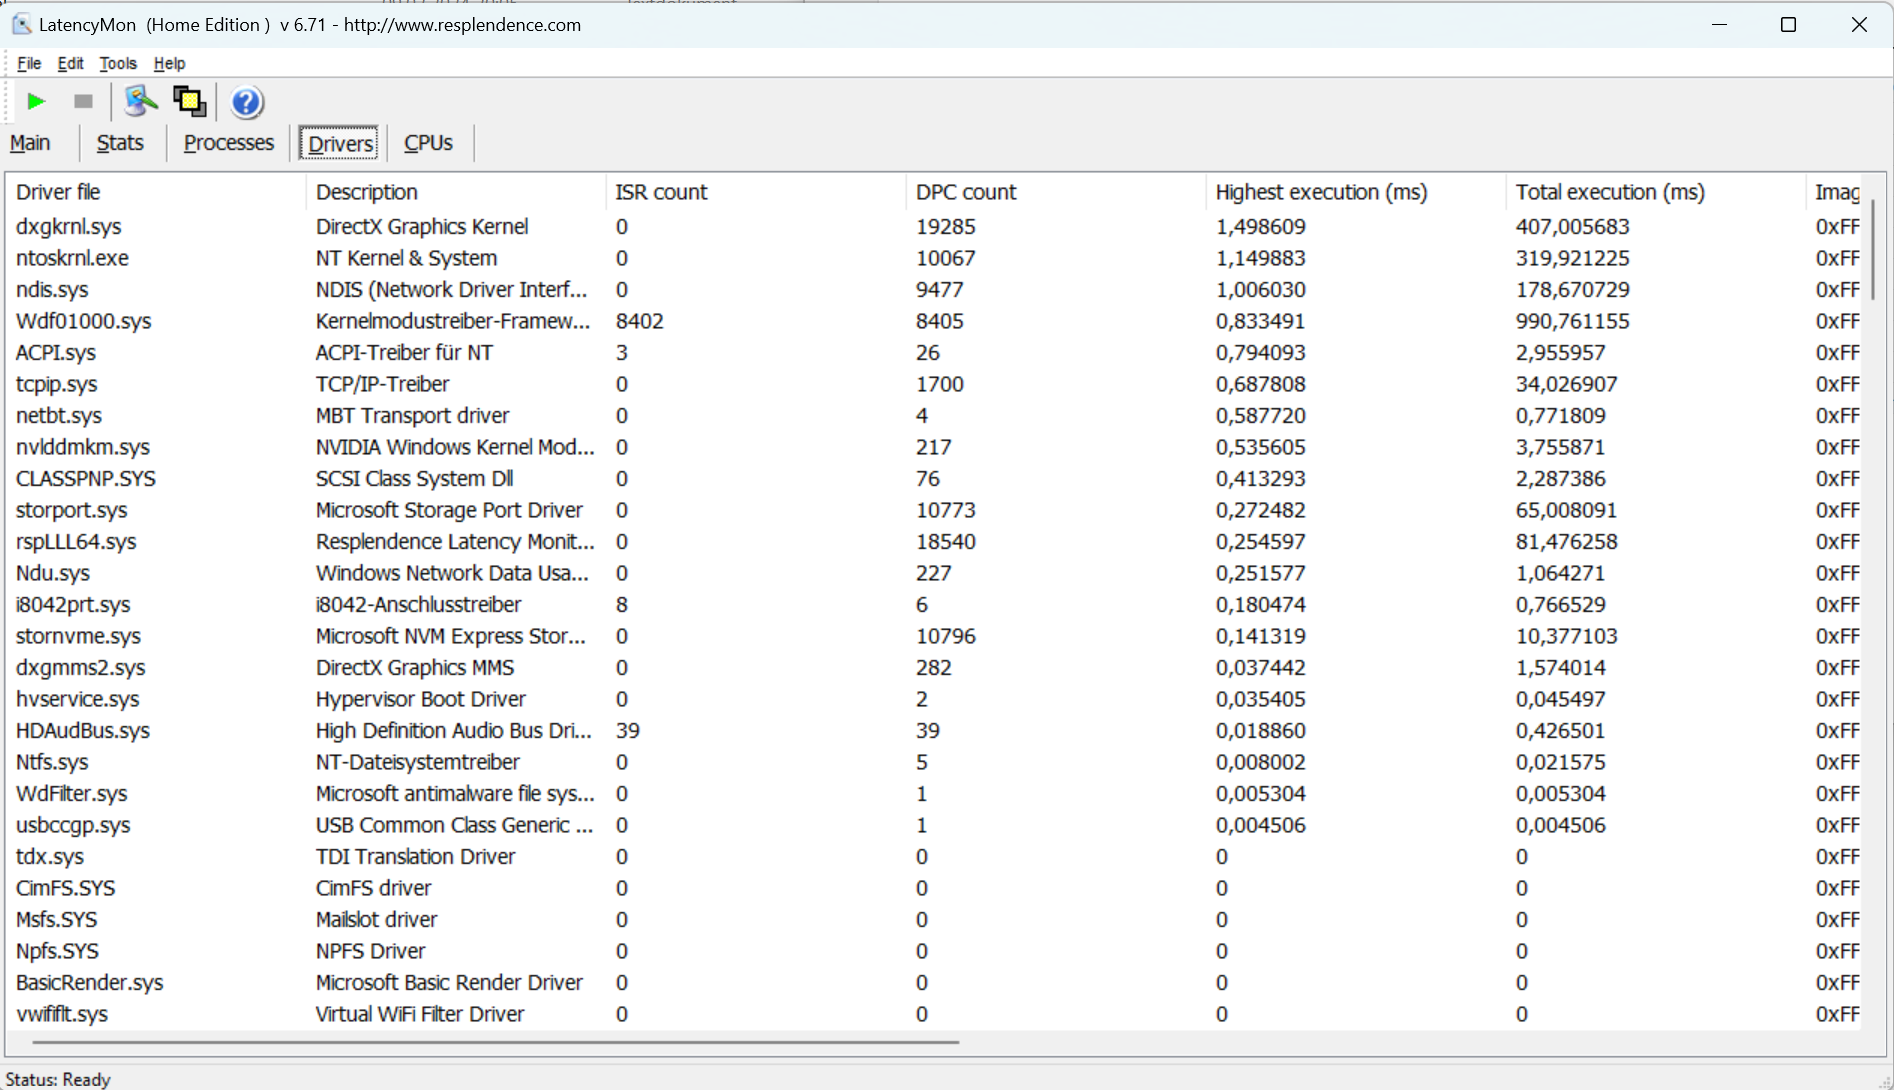
Latence DPC
Latency Monitor révèle des anomalies pendant le test de latence (navigation sur le web, lecture de vidéos 4k et charge élevée de Prime95). Le système ne semble pas adapté à l'édition vidéo et audio en temps réel. Les futures mises à jour des logiciels et des pilotes pourraient apporter des améliorations, voire des détériorations.
| DPC Latencies / LatencyMon - interrupt to process latency (max), Web, Youtube, Prime95 | |
| Schenker Key 17 Pro (Early 23) | |
| MSI Titan 18 HX A14VIG | |
| Medion Erazer Beast X40 | |
| Medion Erazer Beast X40 2024 | |
| Asus ROG Strix Scar 18 G834JYR (2024) | |
| Asus ROG Strix Scar 17 G733PYV-LL053X | |
* ... Moindre est la valeur, meilleures sont les performances
Mémoire de masse
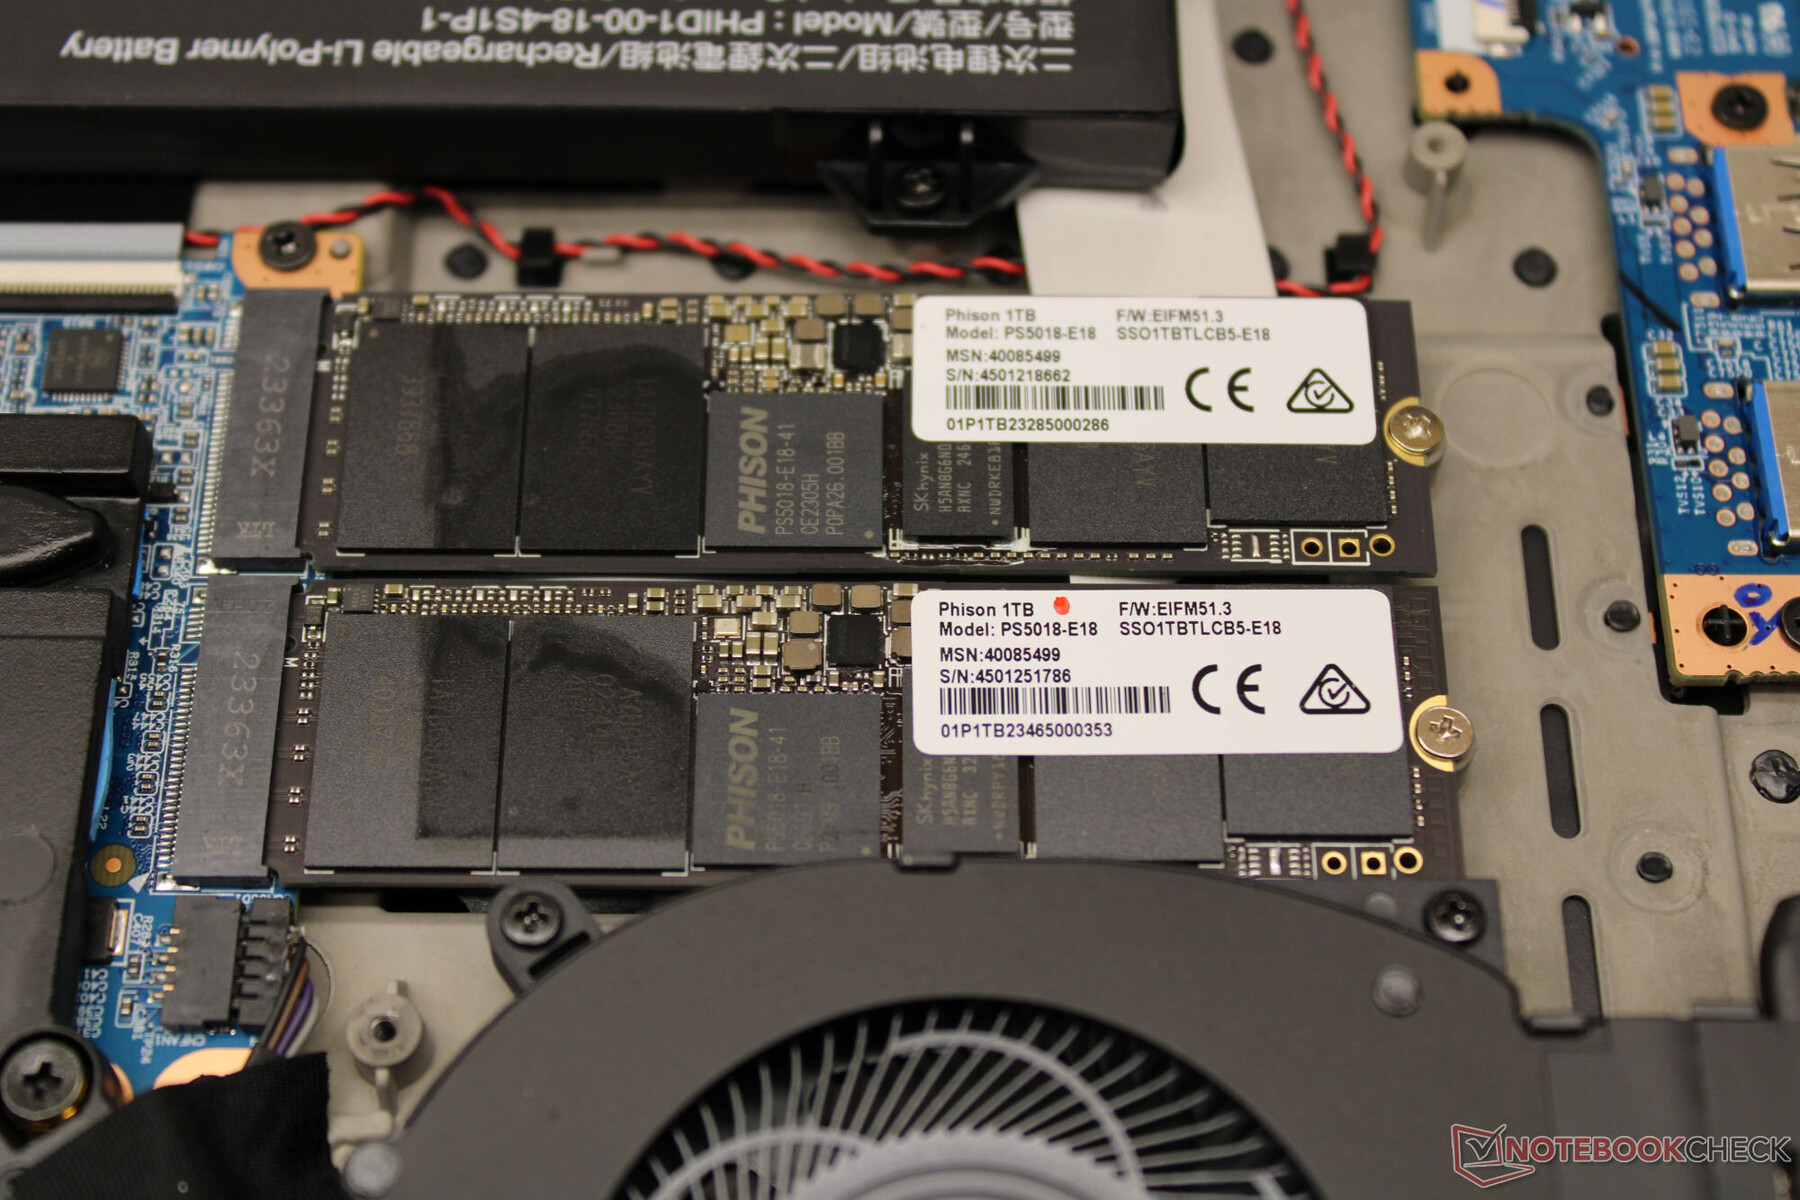
Le X40 embarque deux disques SSD PCIe Gen 4 M.2 2280 de 1 To chacun, mais ils ne sont pas configurés en réseau RAID. Un SSD sert de disque système et l'autre de stockage de données. De très bons débits de données sont atteints. Il n'y a pas de baisse de performance due à l'étranglement thermique.
Le X40 prend généralement en charge RAID-0/1, mais l'option correspondante doit d'abord être activée dans le BIOS, après quoi Windows doit être réinstallé. Cette procédure n'est pas recommandée pour les non-initiés.

* ... Moindre est la valeur, meilleures sont les performances
Disk throttling: DiskSpd Read Loop, Queue Depth 8
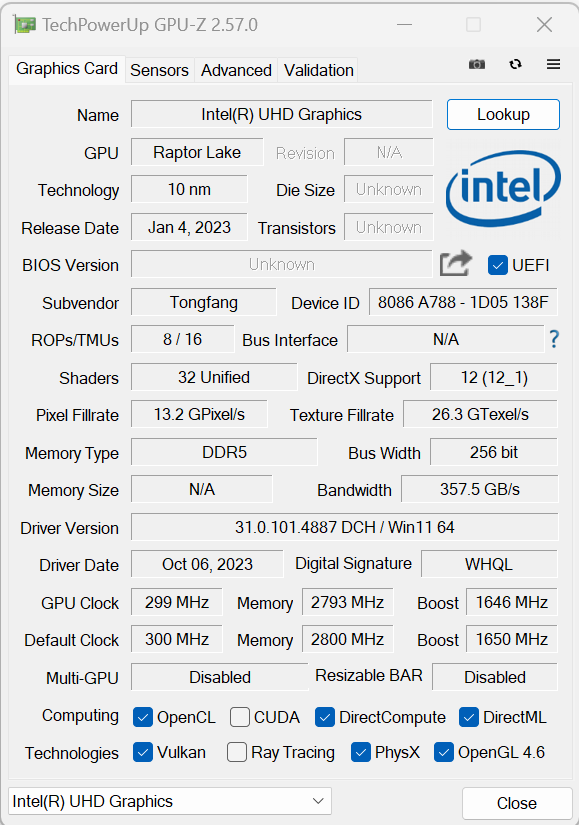
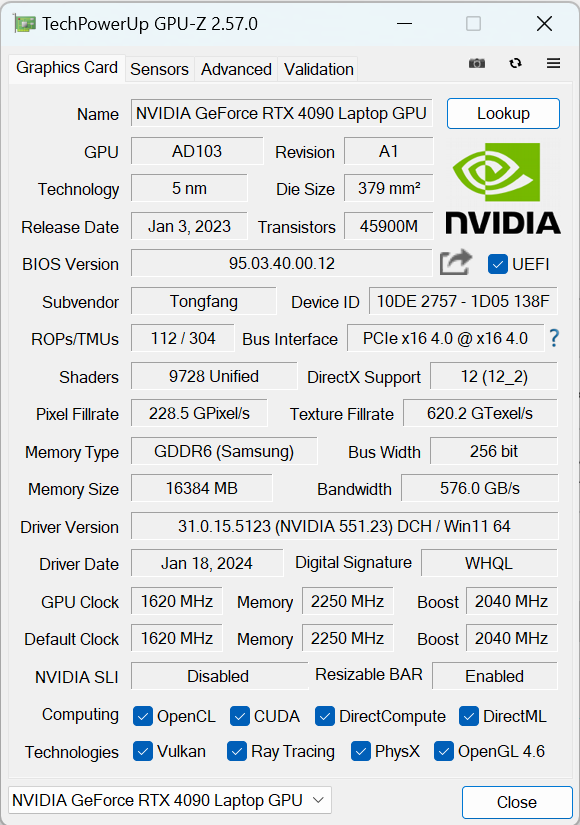
Carte graphique
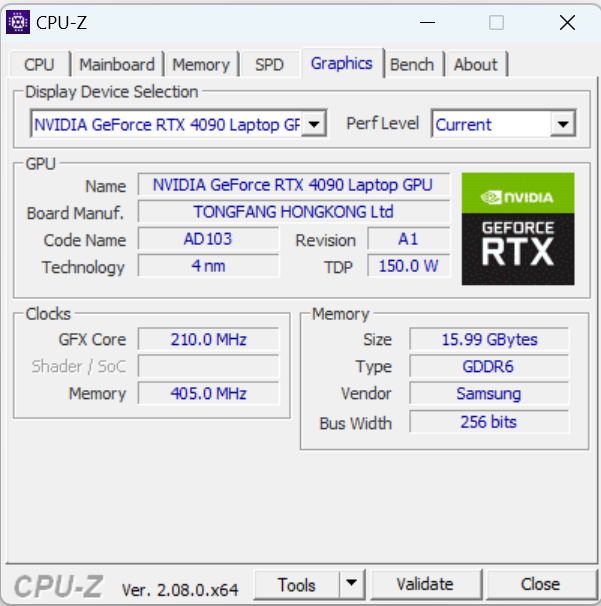
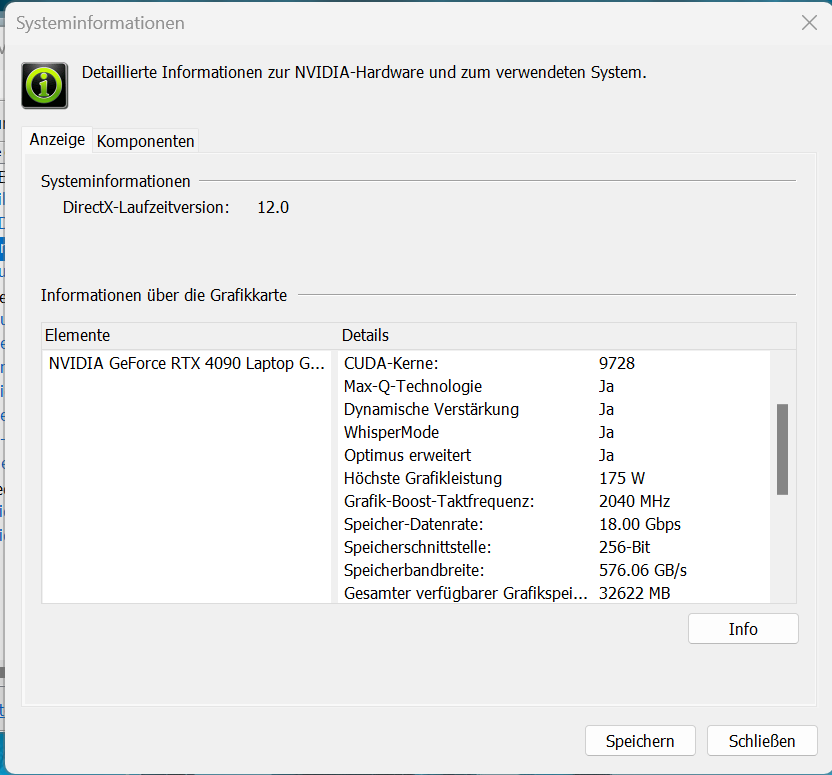
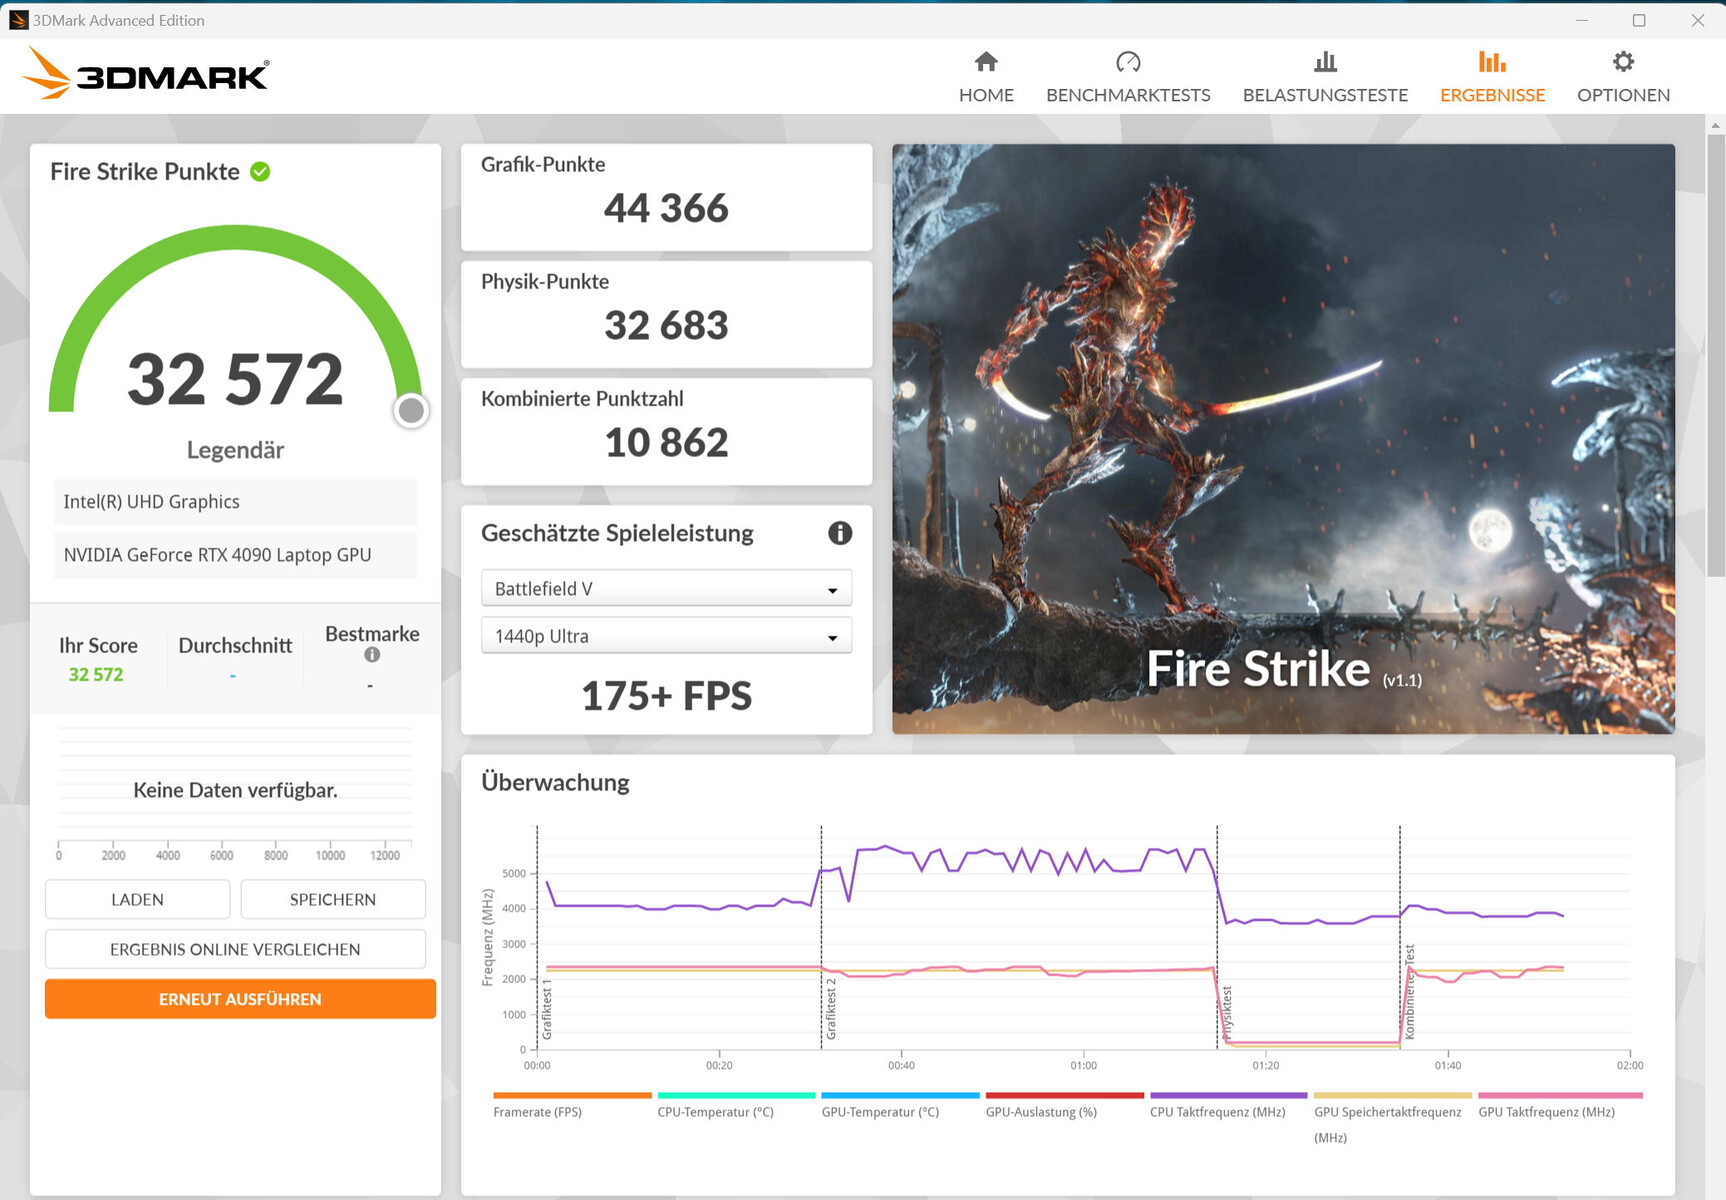
Le Medion Erazer Beast X40 s'appuie sur la technologie GeForce RTX 4090 - actuellement le GPU mobile le plus puissant de Nvidia. Il dispose de 9 728 shaders, d'un bus mémoire de 256 bits et d'une mémoire GDDR6 de 16 Go. La RTX 4090 bénéficie d'un TGP maximum de 175 W (150 watts + 25 watts Dynamic Boost) - il n'est pas possible de dépasser cette limite.
Les résultats des benchmarks sont au même niveau (Mode Balance) ou au-dessus (Mode Gaming) de la moyenne de la RTX 4090 précédente. La situation est différente dans les jeux.
Les taux de rafraîchissement sont supérieurs à la moyenne du GPU dans les deux cas. Advanced Optimus est pris en charge, de sorte que le passage de dGPU à Optimus ne nécessite pas de redémarrage.
| 3DMark Performance rating - Percent | |
| Medion Erazer Beast X40 2024 | |
| MSI Titan 18 HX A14VIG | |
| Asus ROG Strix Scar 17 G733PYV-LL053X | |
| Medion Erazer Beast X40 | |
| Schenker Key 17 Pro (Early 23) | |
| Moyenne NVIDIA GeForce RTX 4090 Laptop GPU | |
| Medion Erazer Beast X40 2024 | |
| Asus ROG Strix Scar 18 G834JYR (2024) | |
| Moyenne de la classe Gaming | |
| 3DMark 11 - 1280x720 Performance GPU | |
| Medion Erazer Beast X40 2024 (Gaming Mode) | |
| Schenker Key 17 Pro (Early 23) | |
| Medion Erazer Beast X40 | |
| Moyenne NVIDIA GeForce RTX 4090 Laptop GPU (54073 - 73027, n=42) | |
| Medion Erazer Beast X40 2024 | |
| Asus ROG Strix Scar 17 G733PYV-LL053X | |
| MSI Titan 18 HX A14VIG | |
| Asus ROG Strix Scar 18 G834JYR (2024) | |
| Moyenne de la classe Gaming (21841 - 80022, n=104, 2 dernières années) | |
| 3DMark | |
| 1920x1080 Fire Strike Graphics | |
| MSI Titan 18 HX A14VIG | |
| Asus ROG Strix Scar 17 G733PYV-LL053X | |
| Medion Erazer Beast X40 2024 (Gaming Mode) | |
| Moyenne NVIDIA GeForce RTX 4090 Laptop GPU (40259 - 53059, n=41) | |
| Medion Erazer Beast X40 | |
| Medion Erazer Beast X40 2024 | |
| Asus ROG Strix Scar 18 G834JYR (2024) | |
| Schenker Key 17 Pro (Early 23) | |
| Moyenne de la classe Gaming (12242 - 62849, n=115, 2 dernières années) | |
| 2560x1440 Time Spy Graphics | |
| Medion Erazer Beast X40 2024 (Gaming Mode) | |
| MSI Titan 18 HX A14VIG | |
| Schenker Key 17 Pro (Early 23) | |
| Asus ROG Strix Scar 17 G733PYV-LL053X | |
| Medion Erazer Beast X40 | |
| Moyenne NVIDIA GeForce RTX 4090 Laptop GPU (16950 - 23292, n=43) | |
| Medion Erazer Beast X40 2024 | |
| Asus ROG Strix Scar 18 G834JYR (2024) | |
| Moyenne de la classe Gaming (5012 - 26212, n=115, 2 dernières années) | |
| 3DMark 11 Performance | 41974 points | |
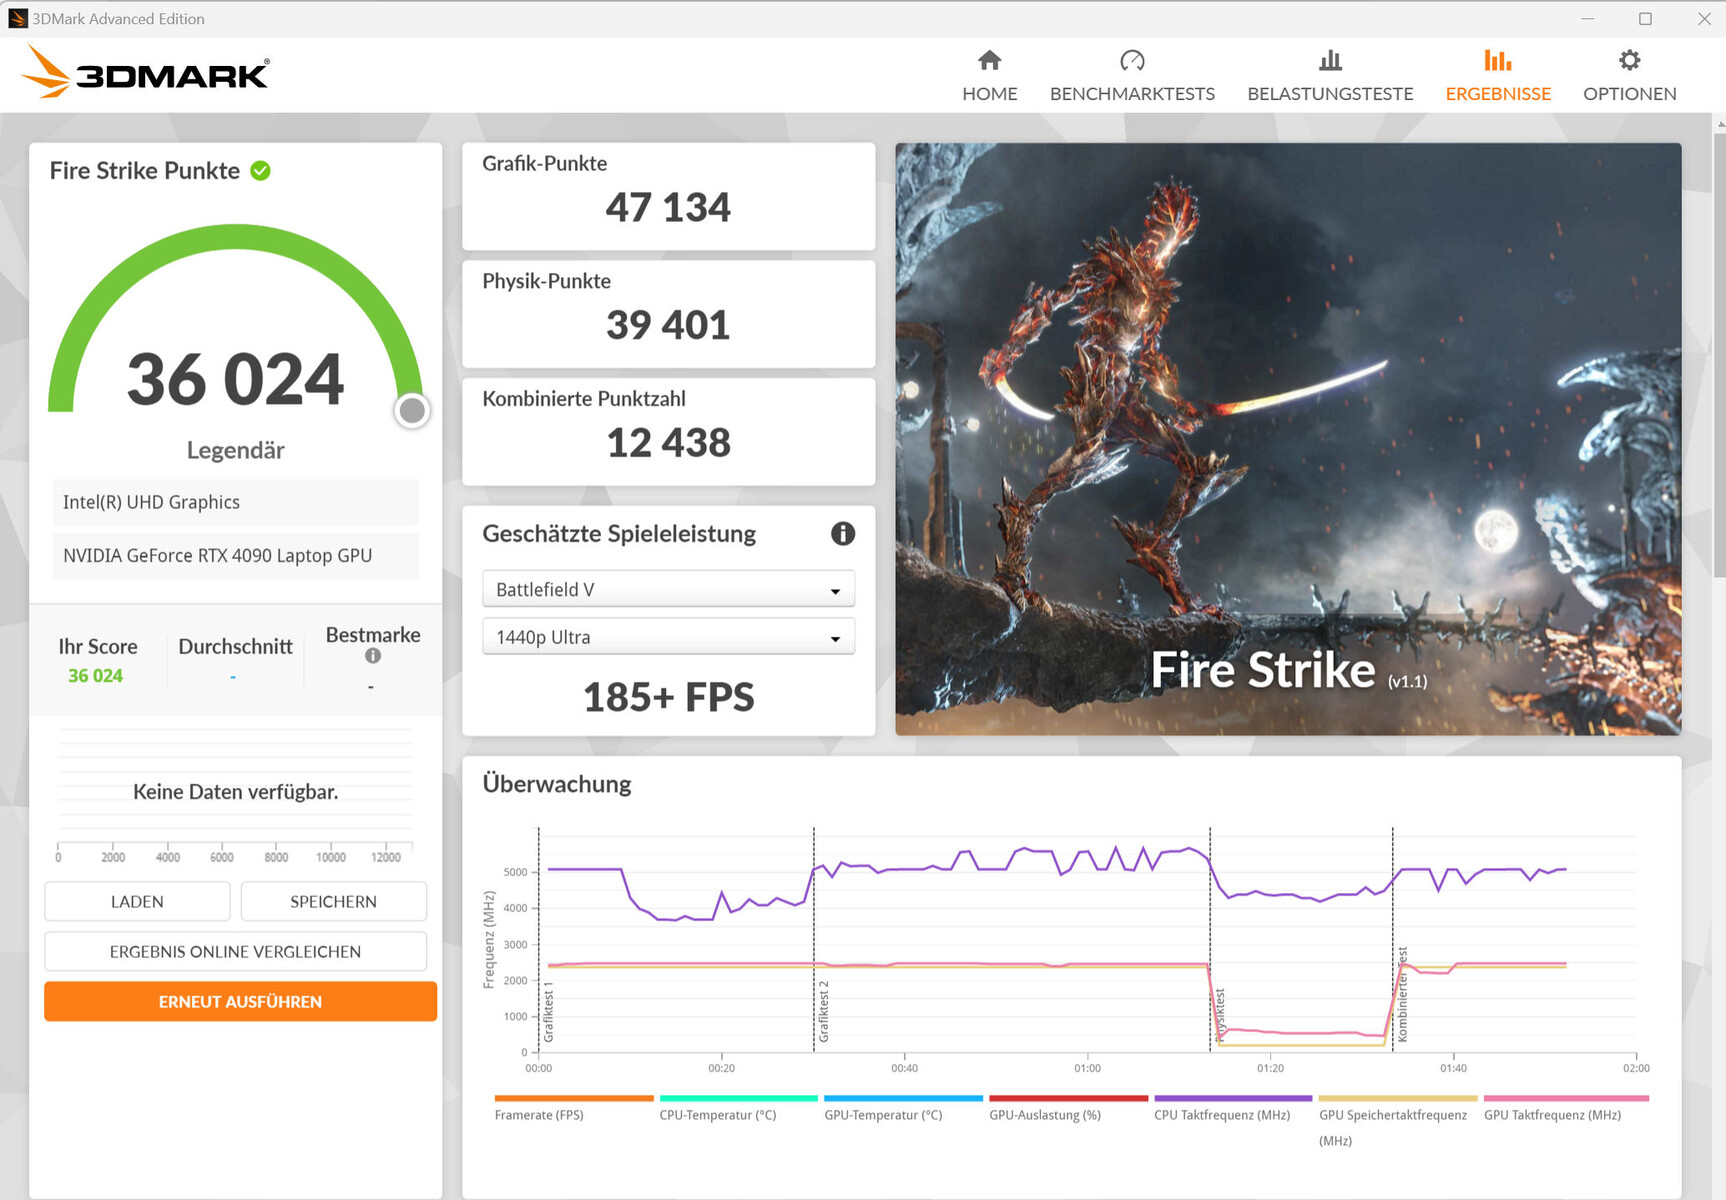
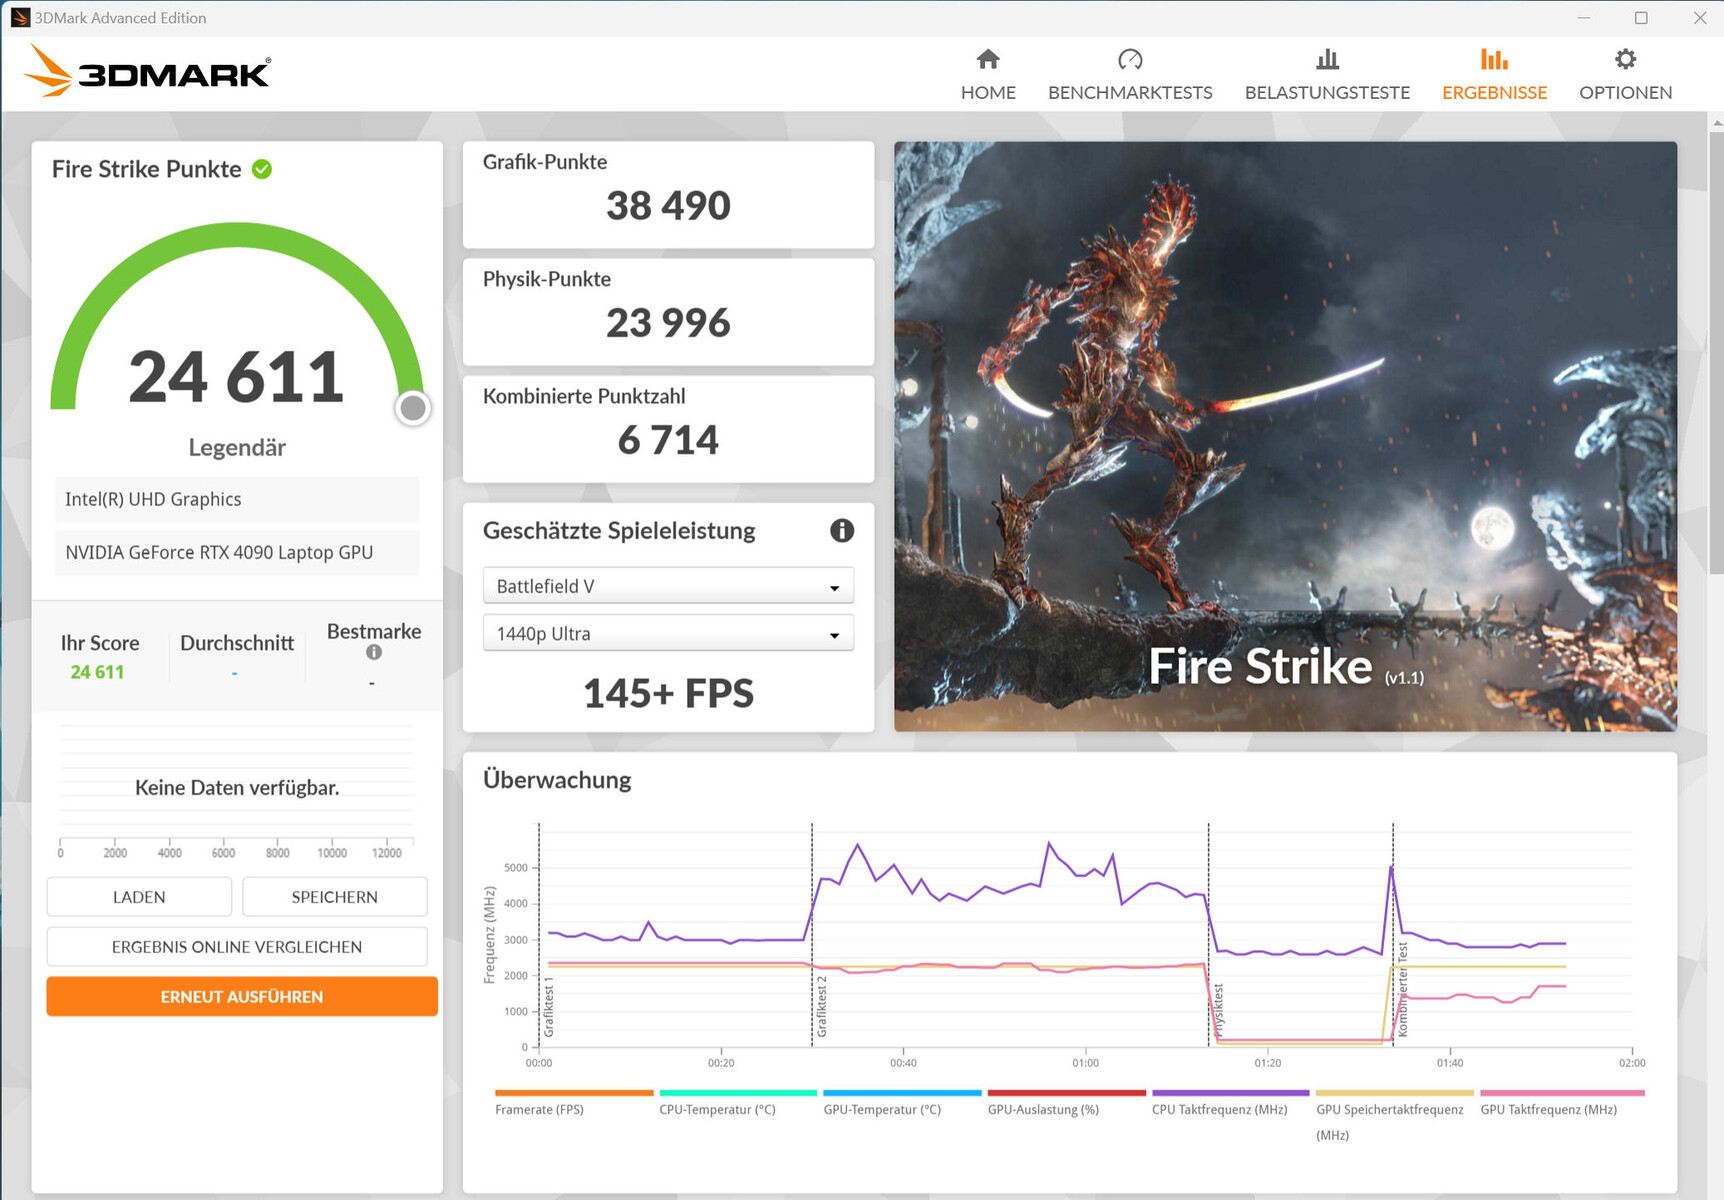
| 3DMark Fire Strike Score | 32572 points | |
| 3DMark Time Spy Score | 19655 points | |
Aide | ||
| Geekbench 6.7 | |
| GPU Vulkan | |
| Medion Erazer Beast X40 2024 (6.2.1, Gaming Mode) | |
| Medion Erazer Beast X40 2024 (6.2.1) | |
| Asus ROG Strix Scar 18 G834JYR (2024) (6.2.1) | |
| Asus ROG Strix Scar 17 G733PYV-LL053X | |
| MSI Titan 18 HX A14VIG (6.2.1) | |
| Moyenne NVIDIA GeForce RTX 4090 Laptop GPU (128748 - 196201, n=16) | |
| Moyenne de la classe Gaming (7562 - 244348, n=59, 2 dernières années) | |
| GPU OpenCL | |
| Medion Erazer Beast X40 2024 (6.2.1) | |
| Medion Erazer Beast X40 2024 (6.2.1, Gaming Mode) | |
| Asus ROG Strix Scar 17 G733PYV-LL053X | |
| Asus ROG Strix Scar 18 G834JYR (2024) (6.2.1) | |
| Moyenne NVIDIA GeForce RTX 4090 Laptop GPU (159127 - 209521, n=20) | |
| MSI Titan 18 HX A14VIG (6.2.1) | |
| Moyenne de la classe Gaming (67235 - 253130, n=103, 2 dernières années) | |
| V-Ray Benchmark Next 4.10 | |
| GPU | |
| Medion Erazer Beast X40 2024 (v4.10.07, Gaming Mode) | |
| Asus ROG Strix Scar 17 G733PYV-LL053X (v4.10.07 ) | |
| Schenker Key 17 Pro (Early 23) (v4.10.07 ) | |
| Medion Erazer Beast X40 (v4.10.07 ) | |
| Moyenne NVIDIA GeForce RTX 4090 Laptop GPU (873 - 1334, n=30) | |
| Asus ROG Strix Scar 18 G834JYR (2024) (v4.10.07 ) | |
| Medion Erazer Beast X40 2024 (v4.10.07 ) | |
| Moyenne de la classe Gaming (427 - 1627, n=99, 2 dernières années) | |
| CPU | |
| Asus ROG Strix Scar 17 G733PYV-LL053X (v4.10.07 ) | |
| Medion Erazer Beast X40 2024 (v4.10.07, Gaming Mode) | |
| Medion Erazer Beast X40 (v4.10.07 ) | |
| Moyenne NVIDIA GeForce RTX 4090 Laptop GPU (18206 - 37629, n=30) | |
| Asus ROG Strix Scar 18 G834JYR (2024) (v4.10.07 ) | |
| Schenker Key 17 Pro (Early 23) (v4.10.07 ) | |
| Moyenne de la classe Gaming (10048 - 45327, n=97, 2 dernières années) | |
| Medion Erazer Beast X40 2024 (v4.10.07 ) | |
* ... Moindre est la valeur, meilleures sont les performances
| The Witcher 3 - 1920x1080 Ultra Graphics & Postprocessing (HBAO+) | |
| Medion Erazer Beast X40 2024 (Gaming Mode) | |
| MSI Titan 18 HX A14VIG | |
| Asus ROG Strix Scar 17 G733PYV-LL053X | |
| Schenker Key 17 Pro (Early 23) | |
| Medion Erazer Beast X40 2024 | |
| Moyenne NVIDIA GeForce RTX 4090 Laptop GPU (139.2 - 216, n=35) | |
| Moyenne de la classe Gaming (104.7 - 240, n=7, 2 dernières années) | |
| Medion Erazer Beast X40 | |
| Asus ROG Strix Scar 18 G834JYR (2024) | |
| GTA V - 1920x1080 Highest AA:4xMSAA + FX AF:16x | |
| Asus ROG Strix Scar 17 G733PYV-LL053X | |
| Medion Erazer Beast X40 2024 (Gaming Mode) | |
| Medion Erazer Beast X40 | |
| Schenker Key 17 Pro (Early 23) | |
| Medion Erazer Beast X40 2024 | |
| MSI Titan 18 HX A14VIG | |
| Moyenne NVIDIA GeForce RTX 4090 Laptop GPU (91.1 - 167.7, n=40) | |
| Asus ROG Strix Scar 18 G834JYR (2024) | |
| Moyenne de la classe Gaming (48.3 - 186.9, n=94, 2 dernières années) | |
| Final Fantasy XV Benchmark - 1920x1080 High Quality | |
| Medion Erazer Beast X40 2024 (1.3, Gaming Mode) | |
| MSI Titan 18 HX A14VIG (1.3) | |
| Schenker Key 17 Pro (Early 23) (1.3) | |
| Medion Erazer Beast X40 2024 (1.3) | |
| Asus ROG Strix Scar 17 G733PYV-LL053X (1.3) | |
| Medion Erazer Beast X40 (1.3) | |
| Moyenne NVIDIA GeForce RTX 4090 Laptop GPU (122.2 - 201, n=40) | |
| Asus ROG Strix Scar 18 G834JYR (2024) (1.3) | |
| Moyenne de la classe Gaming (41 - 215, n=95, 2 dernières années) | |
| Strange Brigade - 1920x1080 ultra AA:ultra AF:16 | |
| Asus ROG Strix Scar 17 G733PYV-LL053X (1.47.22.14 D3D12) | |
| MSI Titan 18 HX A14VIG (1.47.22.14 D3D12) | |
| Schenker Key 17 Pro (Early 23) (1.47.22.14 D3D12) | |
| Medion Erazer Beast X40 2024 (1.47.22.14 D3D12, Gaming Mode) | |
| Medion Erazer Beast X40 2024 (1.47.22.14 D3D12) | |
| Medion Erazer Beast X40 (1.47.22.14 D3D12) | |
| Moyenne NVIDIA GeForce RTX 4090 Laptop GPU (233 - 421, n=39) | |
| Asus ROG Strix Scar 18 G834JYR (2024) (1.47.22.14 D3D12) | |
| Moyenne de la classe Gaming (76.3 - 458, n=87, 2 dernières années) | |
| Dota 2 Reborn - 1920x1080 ultra (3/3) best looking | |
| Asus ROG Strix Scar 17 G733PYV-LL053X | |
| Medion Erazer Beast X40 2024 | |
| Medion Erazer Beast X40 2024 (Gaming Mode) | |
| Schenker Key 17 Pro (Early 23) | |
| Moyenne NVIDIA GeForce RTX 4090 Laptop GPU (115.7 - 220, n=42) | |
| MSI Titan 18 HX A14VIG | |
| Medion Erazer Beast X40 | |
| Asus ROG Strix Scar 18 G834JYR (2024) | |
| Moyenne de la classe Gaming (84.8 - 248, n=107, 2 dernières années) | |
| X-Plane 11.11 - 1920x1080 high (fps_test=3) | |
| Asus ROG Strix Scar 17 G733PYV-LL053X | |
| Medion Erazer Beast X40 2024 | |
| Medion Erazer Beast X40 2024 (Gaming Mode) | |
| Asus ROG Strix Scar 18 G834JYR (2024) | |
| Schenker Key 17 Pro (Early 23) | |
| Moyenne NVIDIA GeForce RTX 4090 Laptop GPU (77.8 - 166.2, n=46) | |
| Medion Erazer Beast X40 | |
| MSI Titan 18 HX A14VIG | |
| Moyenne de la classe Gaming (55.5 - 143.5, n=109, 2 dernières années) | |
| Helldivers 2 | |
| 1920x1080 Ultra Preset | |
| Medion Erazer Beast X40 2024 | |
| Moyenne NVIDIA GeForce RTX 4090 Laptop GPU (130.2 - 141.2, n=2) | |
| Asus ROG Zephyrus M16 | |
| Moyenne de la classe Gaming (18.4 - 153.8, n=5, 2 dernières années) | |
| 2560x1440 Ultra Preset | |
| Medion Erazer Beast X40 2024 | |
| Moyenne de la classe Gaming (81.3 - 140.1, n=5, 2 dernières années) | |
| Moyenne NVIDIA GeForce RTX 4090 Laptop GPU (105.5 - 122.6, n=2) | |
| Asus ROG Zephyrus M16 | |
| Enshrouded | |
| 1920x1080 Max. Quality AA:FX | |
| Medion Erazer Beast X40 2024 | |
| Moyenne NVIDIA GeForce RTX 4090 Laptop GPU (79 - 101.5, n=3) | |
| Asus ROG Strix Scar 18 G834JYR (2024) | |
| Asus ROG Zephyrus M16 | |
| Moyenne de la classe Gaming (n=12 dernières années) | |
| 2560x1440 Max. Quality AA:FX | |
| Medion Erazer Beast X40 2024 | |
| Asus ROG Strix Scar 18 G834JYR (2024) | |
| Moyenne NVIDIA GeForce RTX 4090 Laptop GPU (61.8 - 76, n=3) | |
| Asus ROG Zephyrus M16 | |
| Ready or Not | |
| 1920x1080 Epic Preset | |
| Asus ROG Zephyrus M16 | |
| Moyenne NVIDIA GeForce RTX 4090 Laptop GPU (155.1 - 203, n=2) | |
| Medion Erazer Beast X40 2024 | |
| 2560x1440 Epic Preset | |
| Medion Erazer Beast X40 2024 | |
| Moyenne NVIDIA GeForce RTX 4090 Laptop GPU (141.1 - 144.3, n=2) | |
| Asus ROG Zephyrus M16 | |
| Immortals of Aveum | |
| 1920x1080 Ultra AF:16x | |
| Medion Erazer Beast X40 2024 | |
| Moyenne NVIDIA GeForce RTX 4090 Laptop GPU (90.6 - 106.3, n=2) | |
| 2560x1440 Ultra AF:16x | |
| Medion Erazer Beast X40 2024 | |
| Moyenne NVIDIA GeForce RTX 4090 Laptop GPU (62.9 - 76.5, n=2) | |
The Witcher 3 FPS chart
| Bas | Moyen | Élevé | Ultra | QHD | |
|---|---|---|---|---|---|
| GTA V (2015) | 187.3 | 186.7 | 183 | 141.5 | 139.8 |
| The Witcher 3 (2015) | 555 | 518 | 394 | 204 | 157.6 |
| Dota 2 Reborn (2015) | 241 | 214 | 205 | 189.9 | |
| Final Fantasy XV Benchmark (2018) | 225 | 210 | 181.1 | 147.7 | |
| X-Plane 11.11 (2018) | 207 | 182.2 | 143.9 | ||
| Strange Brigade (2018) | 484 | 401 | 387 | 371 | 289 |
| Immortals of Aveum (2023) | 119.3 | 109.6 | 106.3 | 76.5 | |
| Cyberpunk 2077 (2023) | 133.2 | 131 | 120.9 | 118.9 | 87.5 |
| Ready or Not (2023) | 289 | 166.6 | 158 | 155.1 | 144.3 |
| Enshrouded (2024) | 150.5 | 134.5 | 116.2 | 101.5 | 76 |
| Helldivers 2 (2024) | 146.8 | 143.8 | 143.3 | 141.2 | 122.6 |
Émissions et énergie : Le Beast X40 peut travailler en silence
Émissions sonores
La sollicitation à pleine charge révèle que le Beast X40 peut atteindre des niveaux de pression sonore de 52 dB(A). L'ordinateur portable est à peine plus silencieux en mode Gaming.
Le "Silent Mode" assure un niveau sonore très bas, mais fournit plus qu'assez de puissance pour les tâches quotidiennes telles que la bureautique et l'internet. Le jeu est également possible dans ce mode. Cependant, la fréquence d'images est bloquée à 30 fps par le système dans notre test Witcher 3.
Dans certaines circonstances, un ronronnement électronique peut être entendu à l'intérieur de l'ordinateur portable pendant le test The Witcher 3, par exemple, ou lors de l'exécution du benchmark Specviewperf.
Degré de la nuisance sonore
| Au repos |
| 28 / 29 / 32 dB(A) |
| Fortement sollicité |
| 48 / 52 dB(A) |
 | ||
30 dB silencieux 40 dB(A) audible 50 dB(A) bruyant |
||
min: | ||
| Medion Erazer Beast X40 2024 i9-14900HX, GeForce RTX 4090 Laptop GPU | Asus ROG Strix Scar 17 G733PYV-LL053X R9 7945HX3D, GeForce RTX 4090 Laptop GPU | Schenker Key 17 Pro (Early 23) i9-13900HX, GeForce RTX 4090 Laptop GPU | Asus ROG Strix Scar 18 G834JYR (2024) i9-14900HX, GeForce RTX 4090 Laptop GPU | MSI Titan 18 HX A14VIG i9-14900HX, GeForce RTX 4090 Laptop GPU | Medion Erazer Beast X40 i9-13900HX, GeForce RTX 4090 Laptop GPU | |
|---|---|---|---|---|---|---|
| Noise | 0% | -17% | 1% | 6% | -1% | |
| arrêt / environnement * (dB) | 25 | 23 8% | 26 -4% | 24 4% | 22.8 9% | 24 4% |
| Idle Minimum * (dB) | 28 | 23 18% | 26 7% | 27 4% | 23.8 15% | 25 11% |
| Idle Average * (dB) | 29 | 27.7 4% | 33 -14% | 28 3% | 23.8 18% | 29 -0% |
| Idle Maximum * (dB) | 32 | 34.7 -8% | 46 -44% | 32 -0% | 28 12% | 35 -9% |
| Load Average * (dB) | 48 | 53.4 -11% | 56 -17% | 50 -4% | 38 21% | 51 -6% |
| Witcher 3 ultra * (dB) | 50 | 53.4 -7% | 62 -24% | 50 -0% | 57.3 -15% | 51 -2% |
| Load Maximum * (dB) | 52 | 53.4 -3% | 64 -23% | 52 -0% | 62.8 -21% | 53 -2% |
* ... Moindre est la valeur, meilleures sont les performances
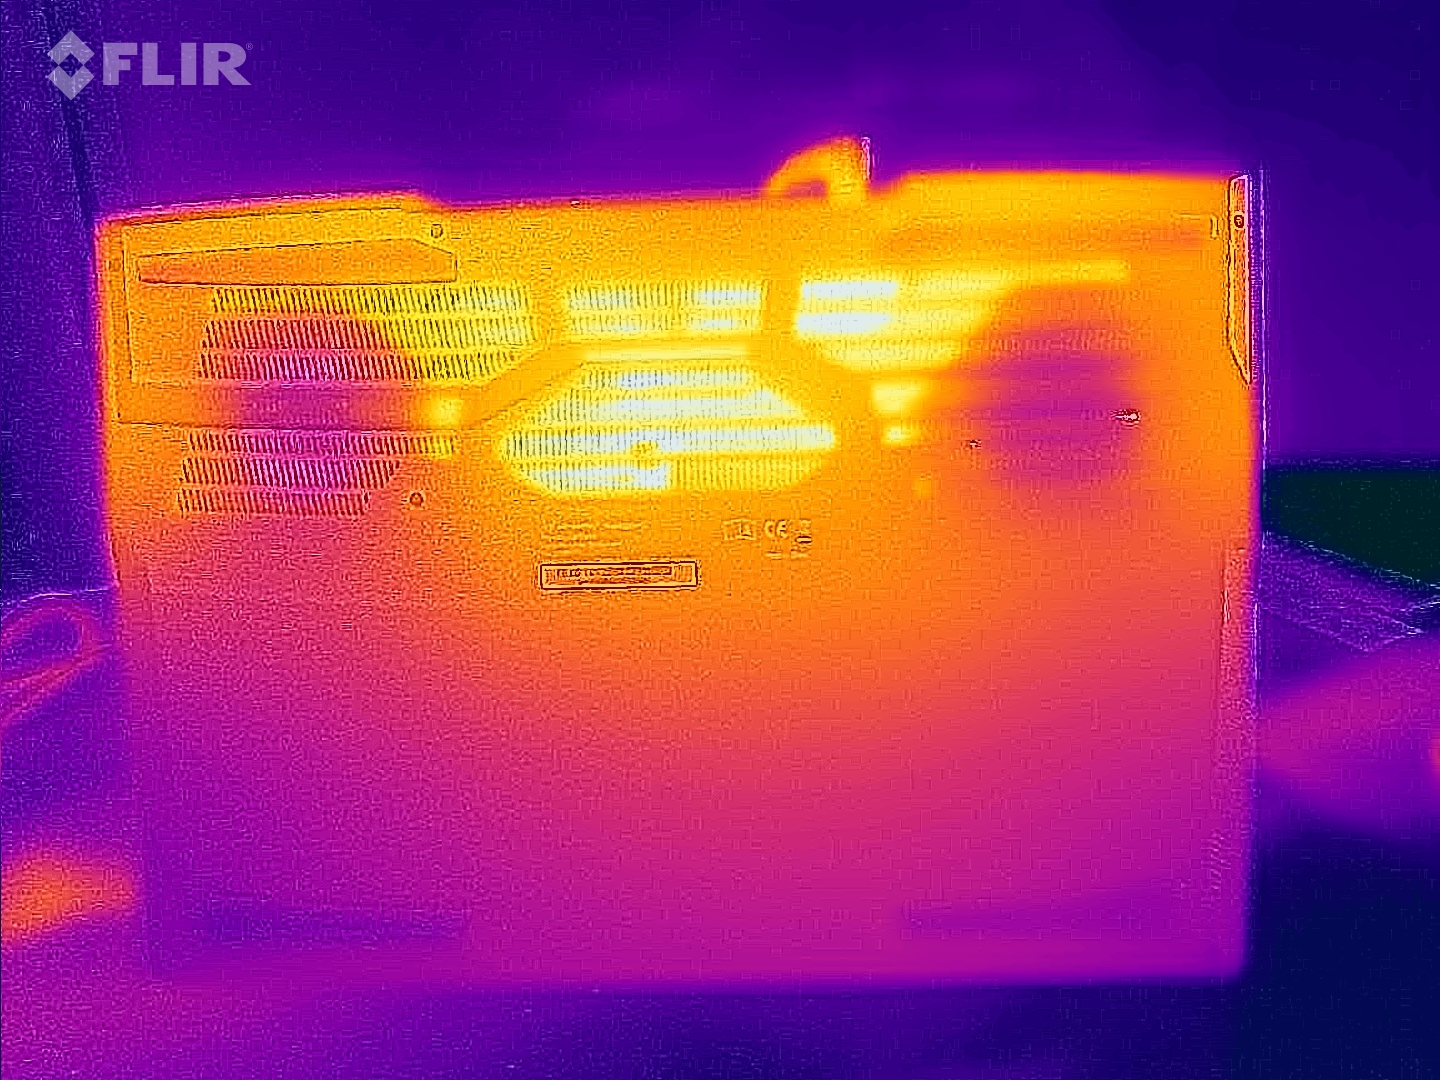
Température
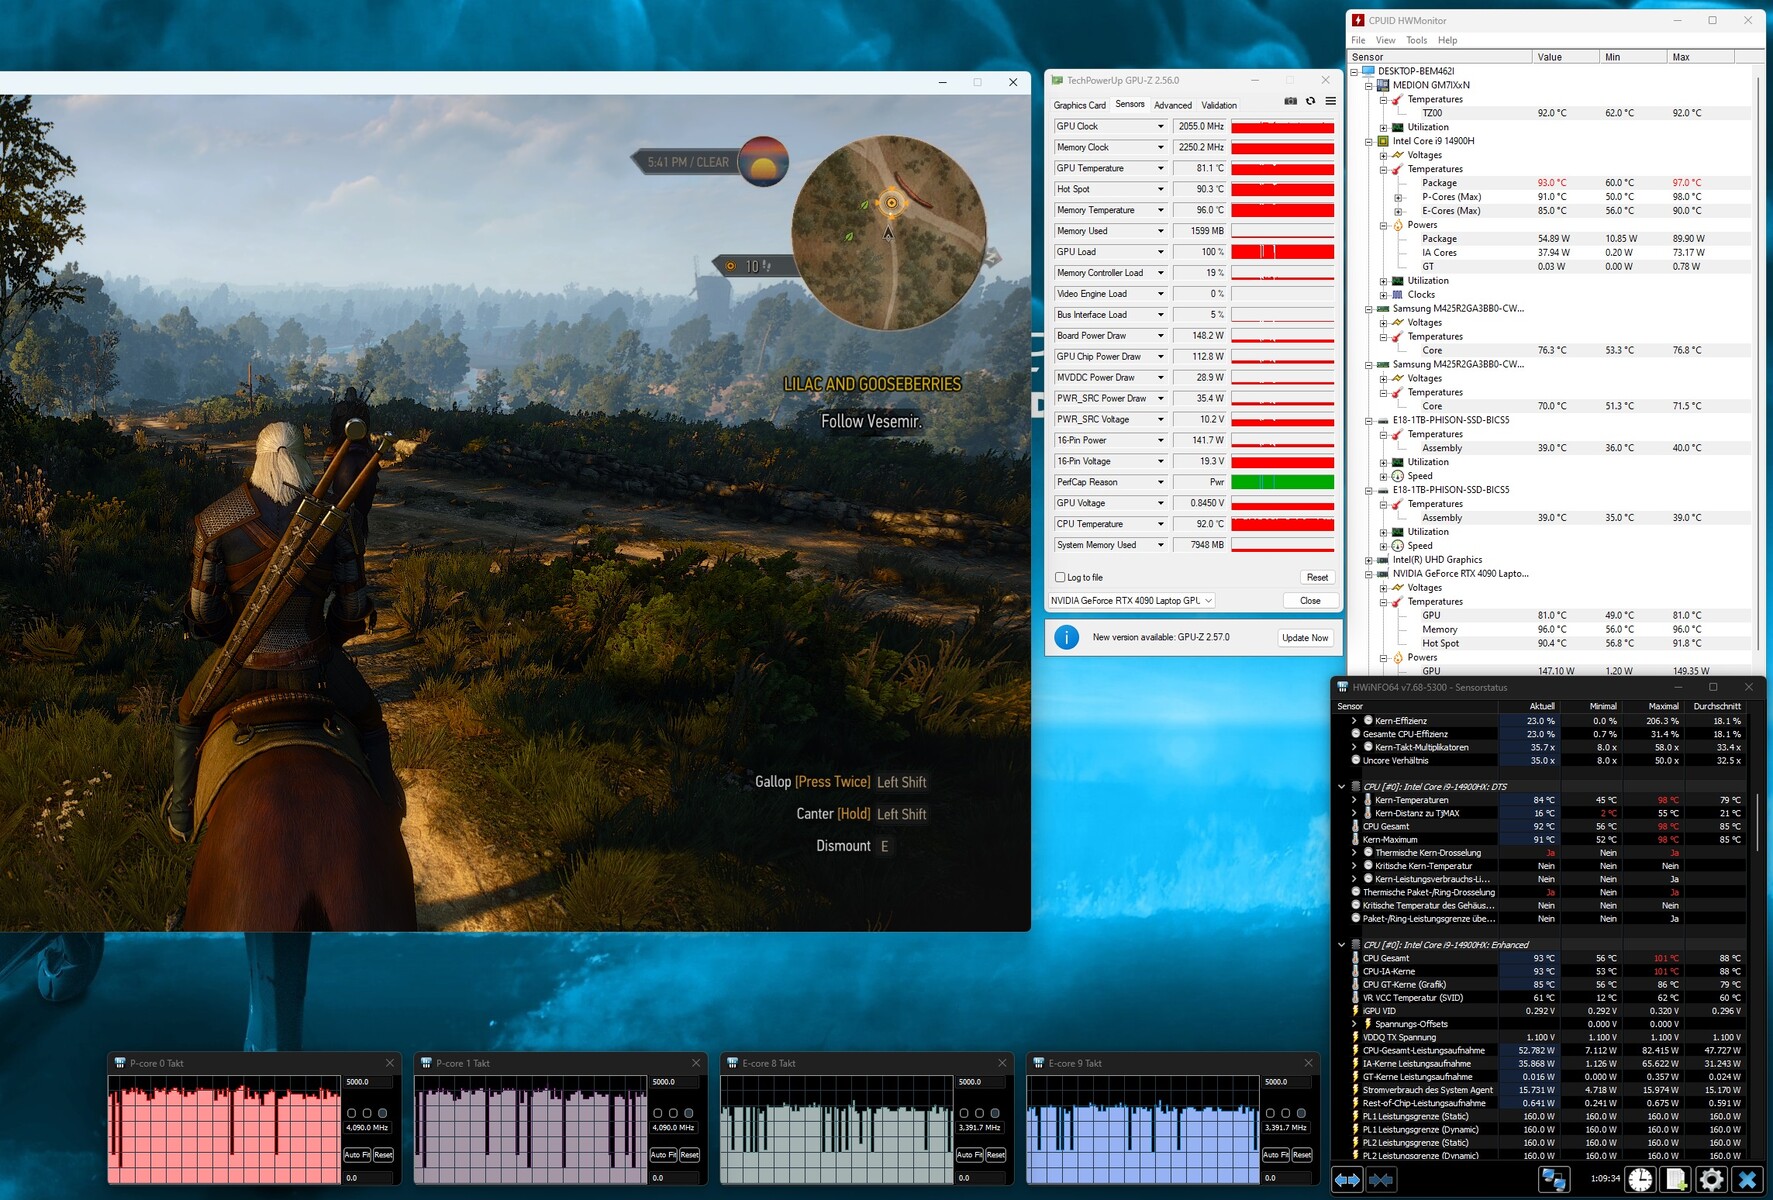
Le test de stress et le test Witcher 3 font chauffer l'ordinateur portable de manière perceptible, mais pas excessive. Des valeurs supérieures à 50 degrés Celsius sont atteintes à certains moments. Dans le cadre d'une utilisation quotidienne (bureautique, Internet), les valeurs restent dans la fourchette verte.
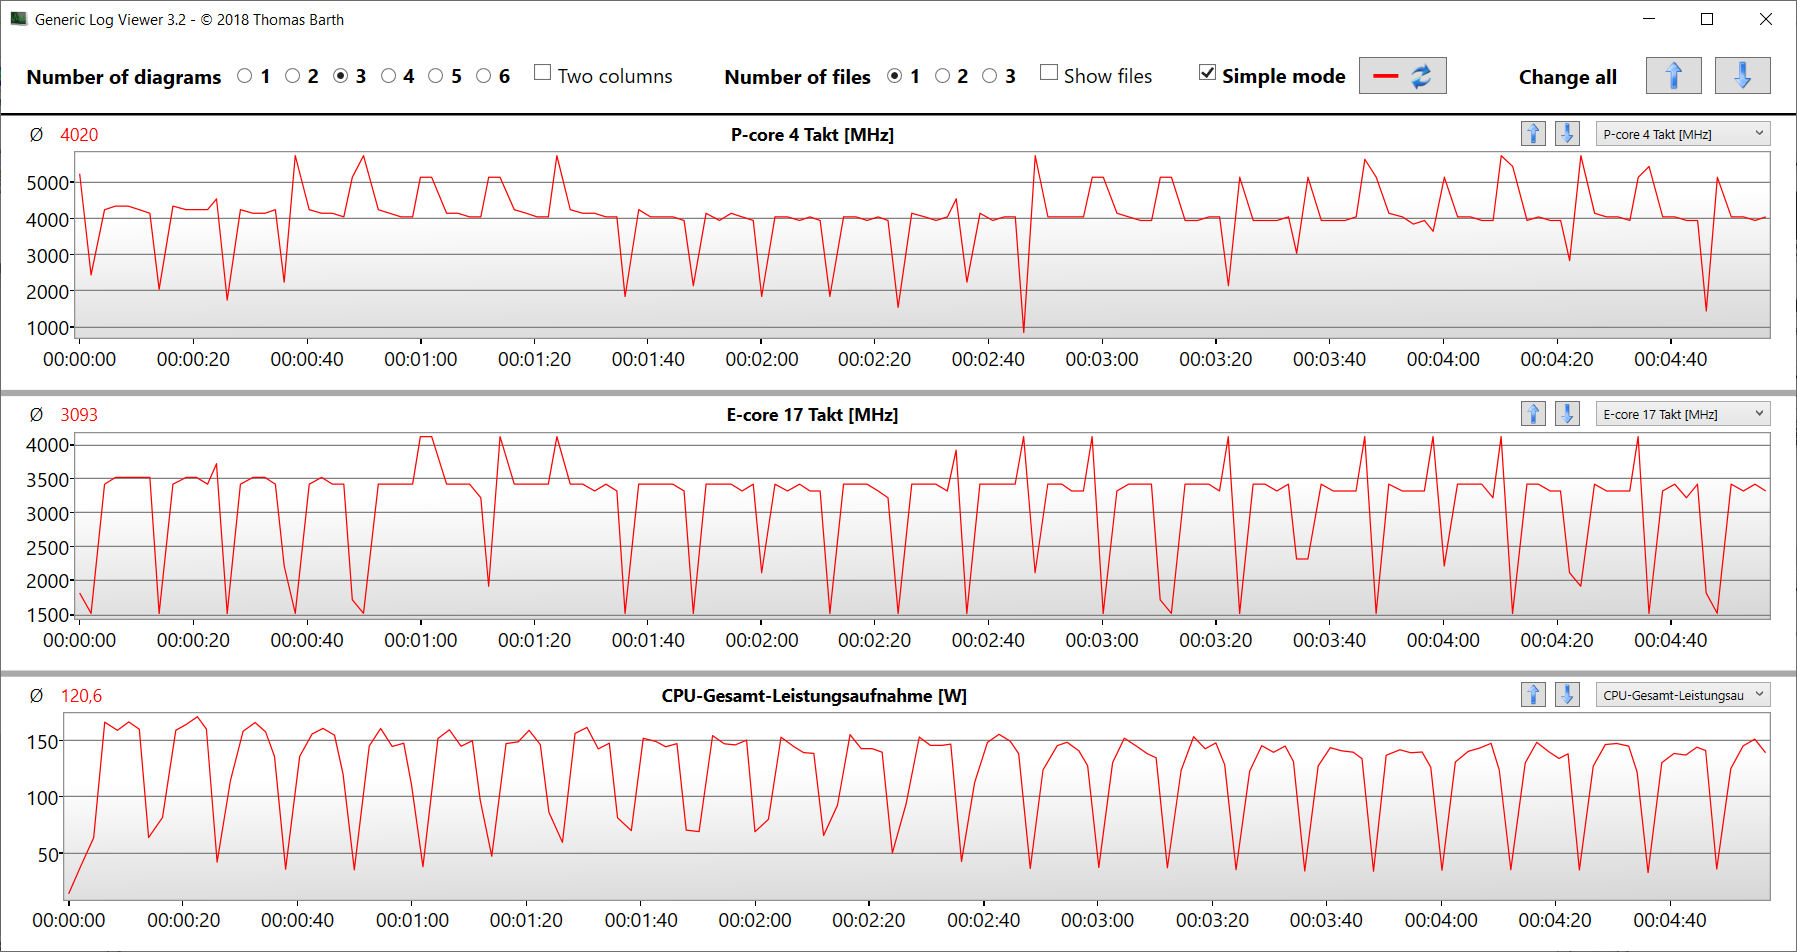
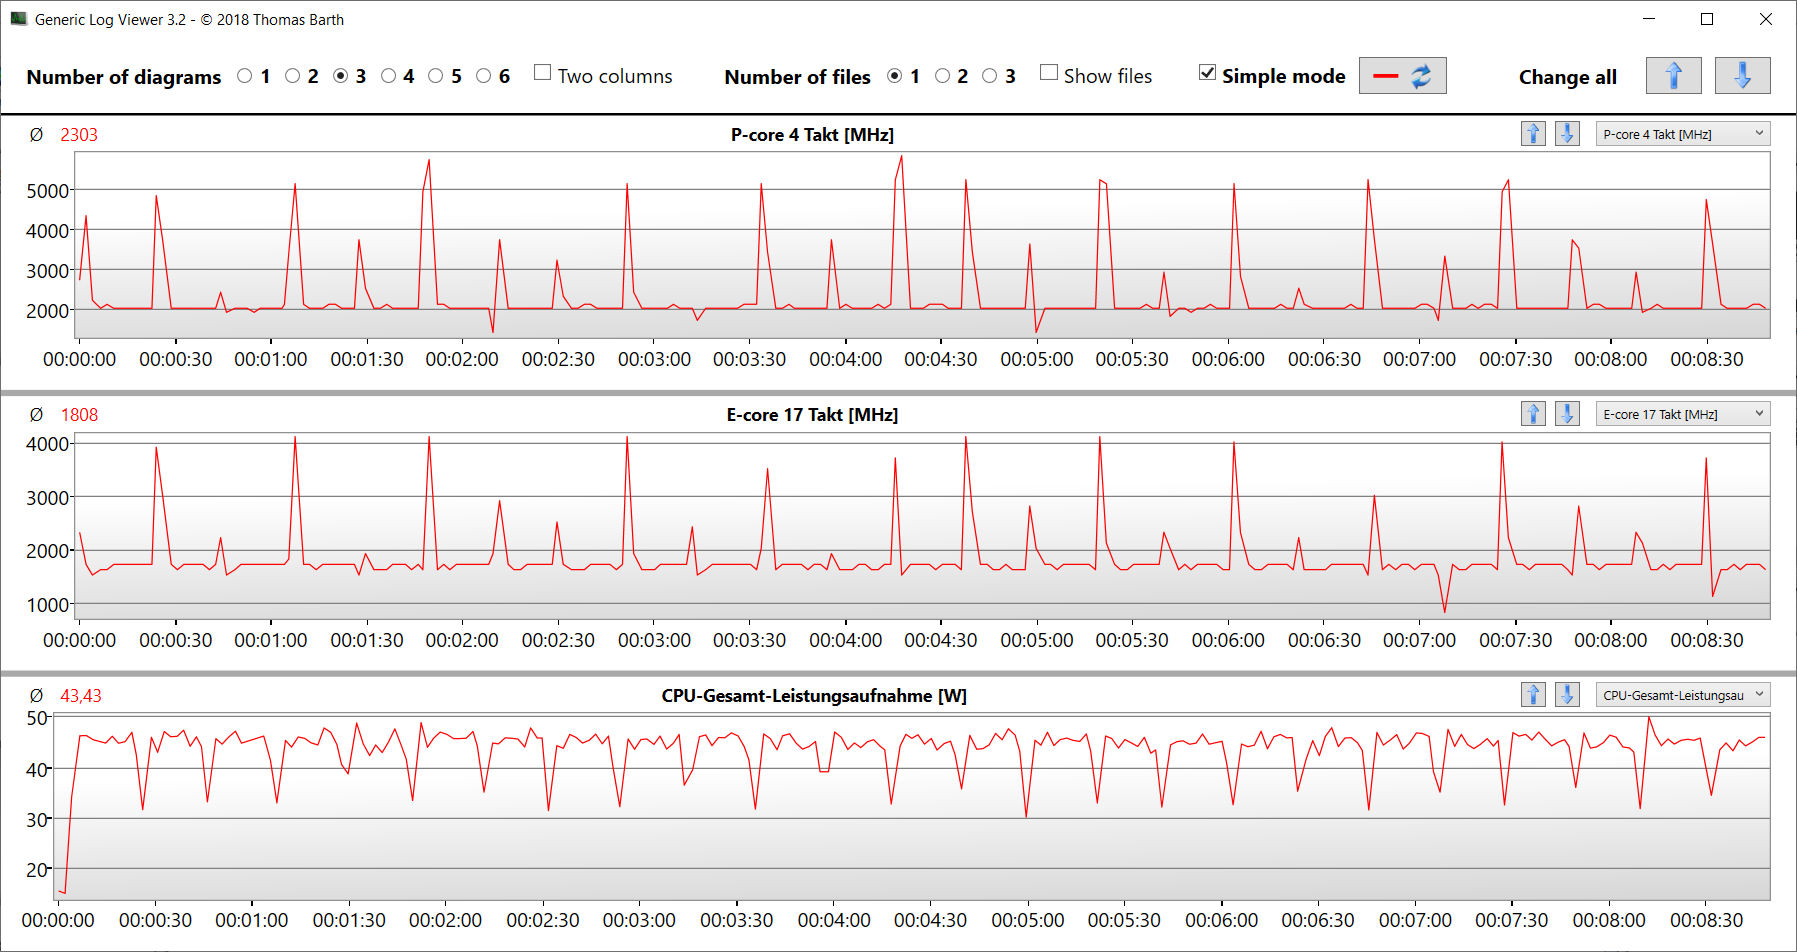
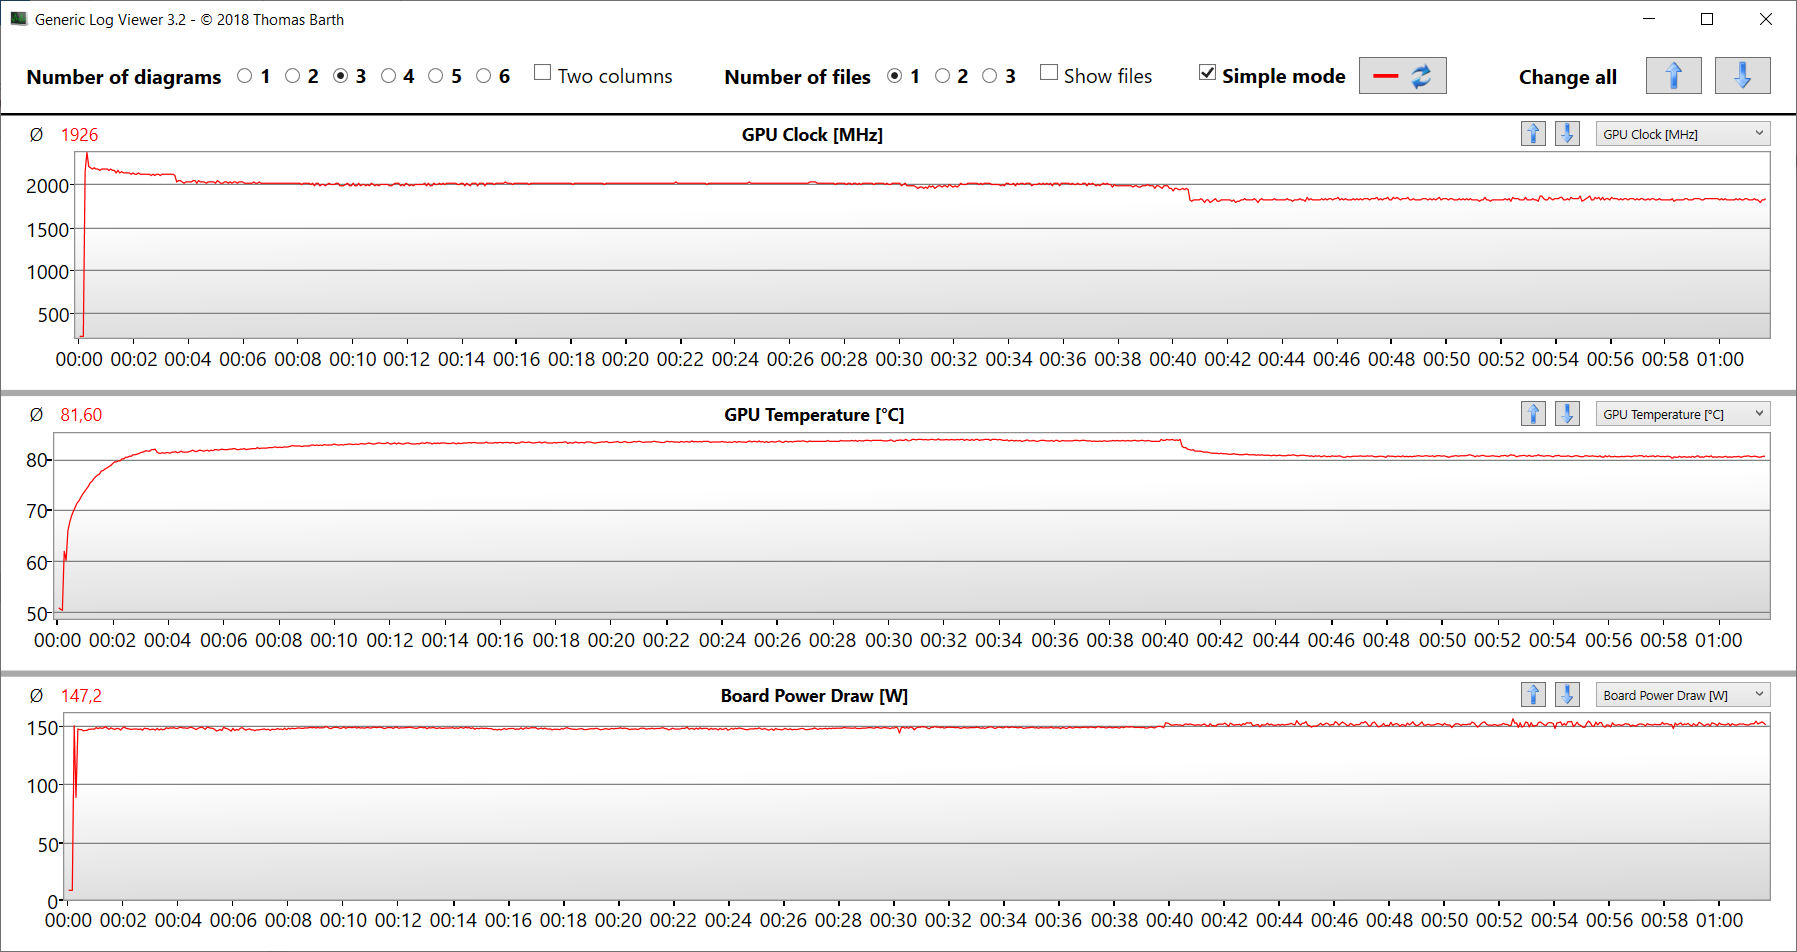
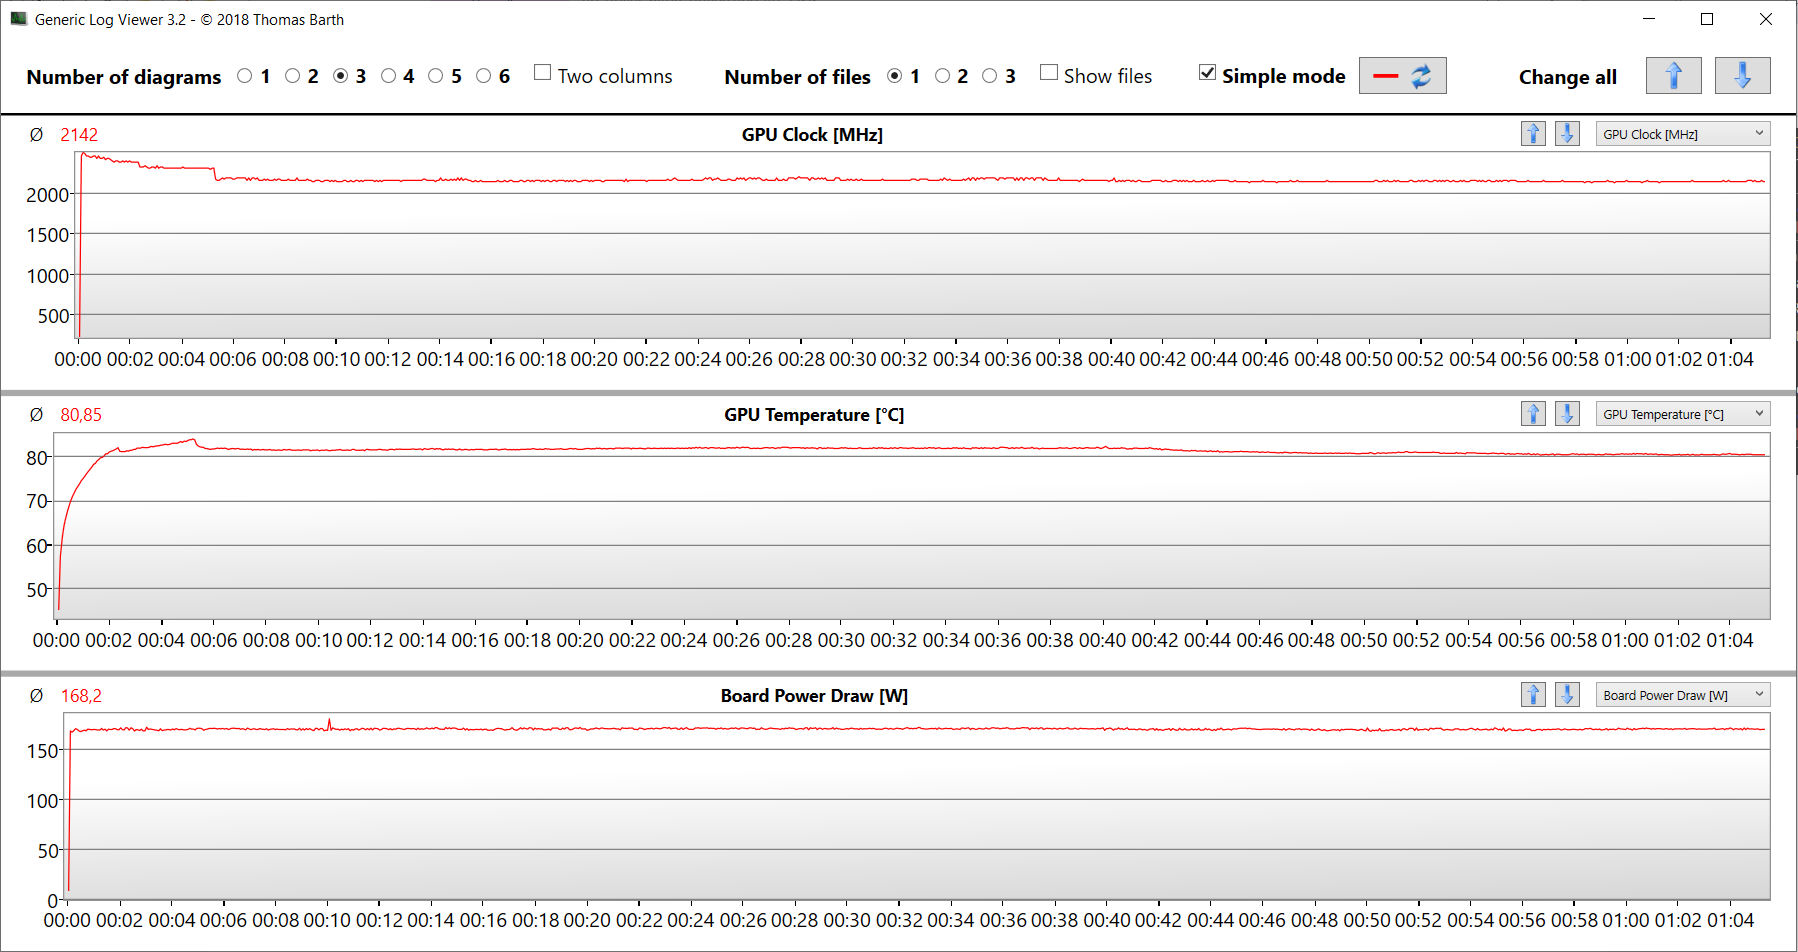
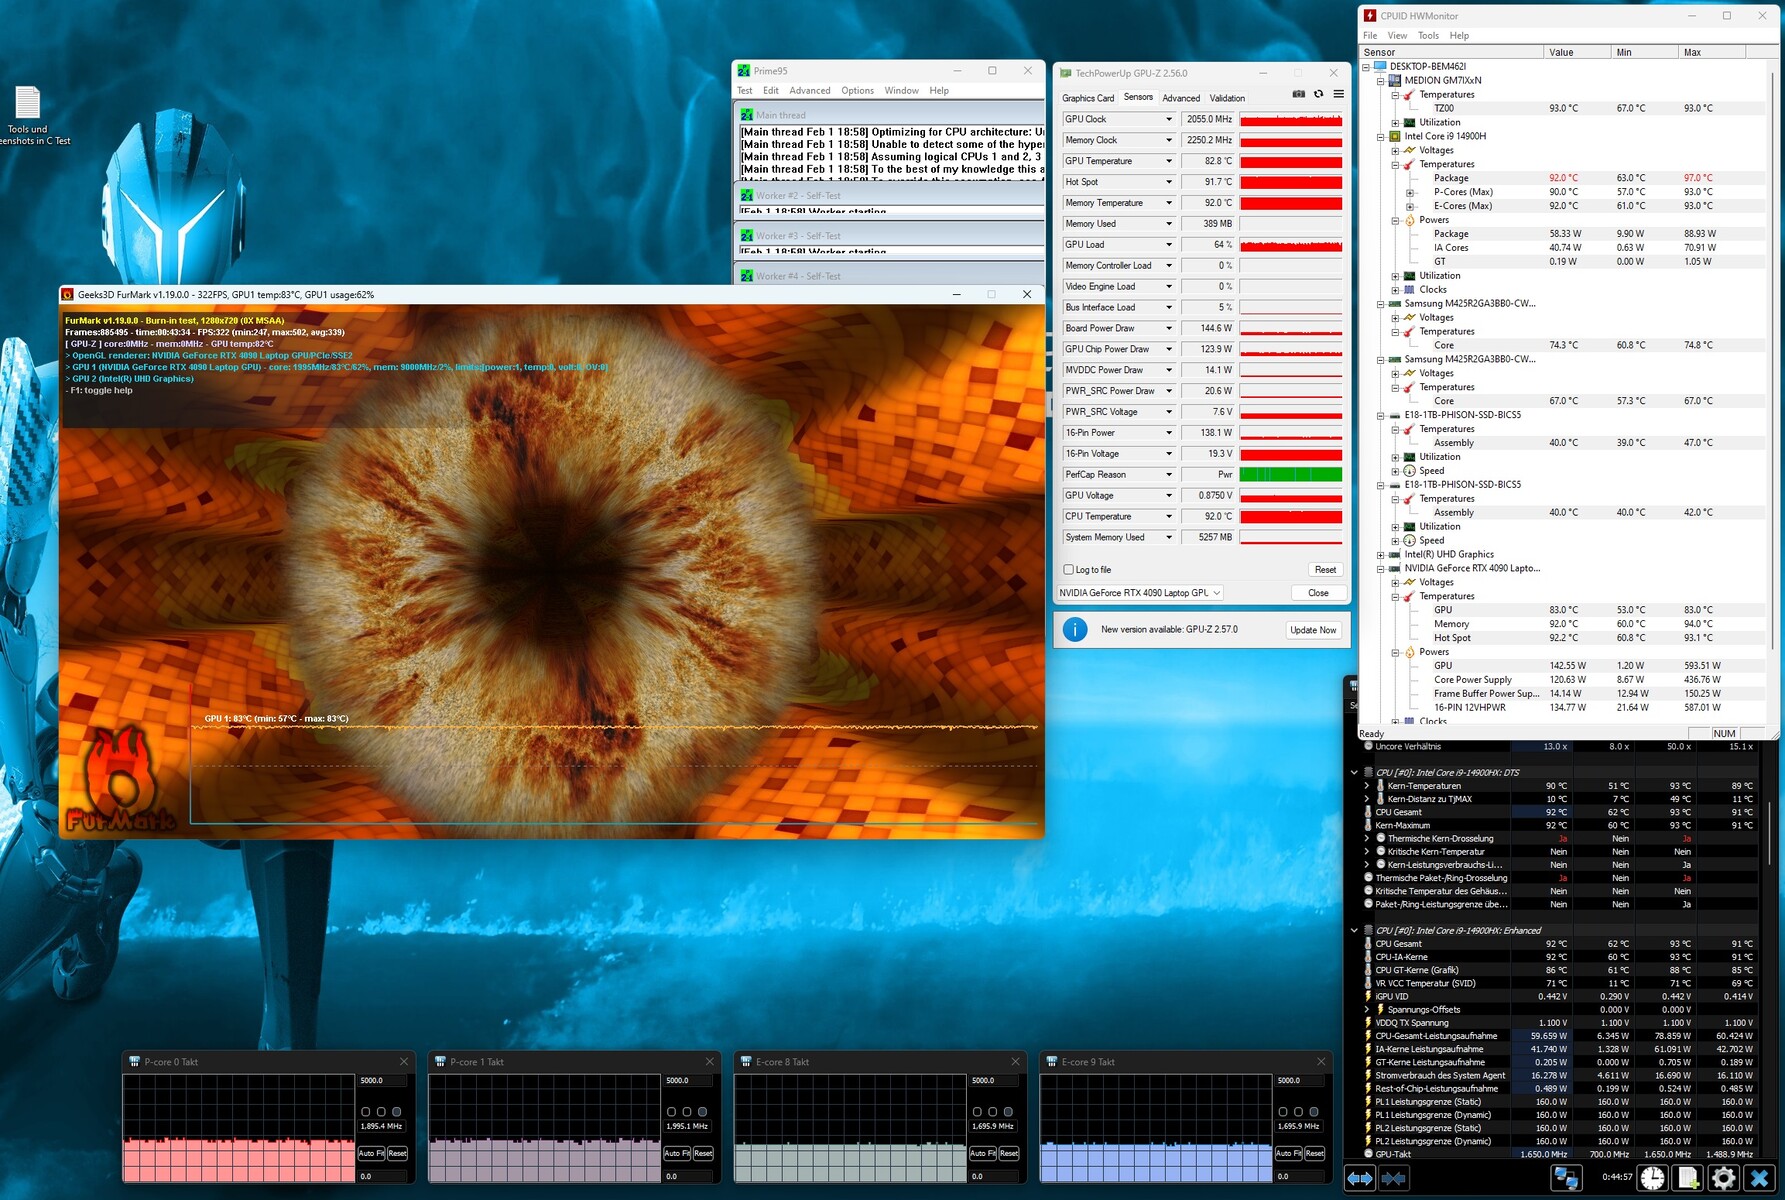
Le test de stress (Prime95 et Furmark en fonctionnement continu) est un scénario extrême pour tester la stabilité du système à pleine charge. La fréquence d'horloge du CPU chute à 1,9 à 2 GHz (P-cores) ou 1,7 GHz (E-cores) dans les premières minutes et reste à ce niveau. Le GPU fonctionne à des vitesses comprises entre 2 et 2,1 GHz.
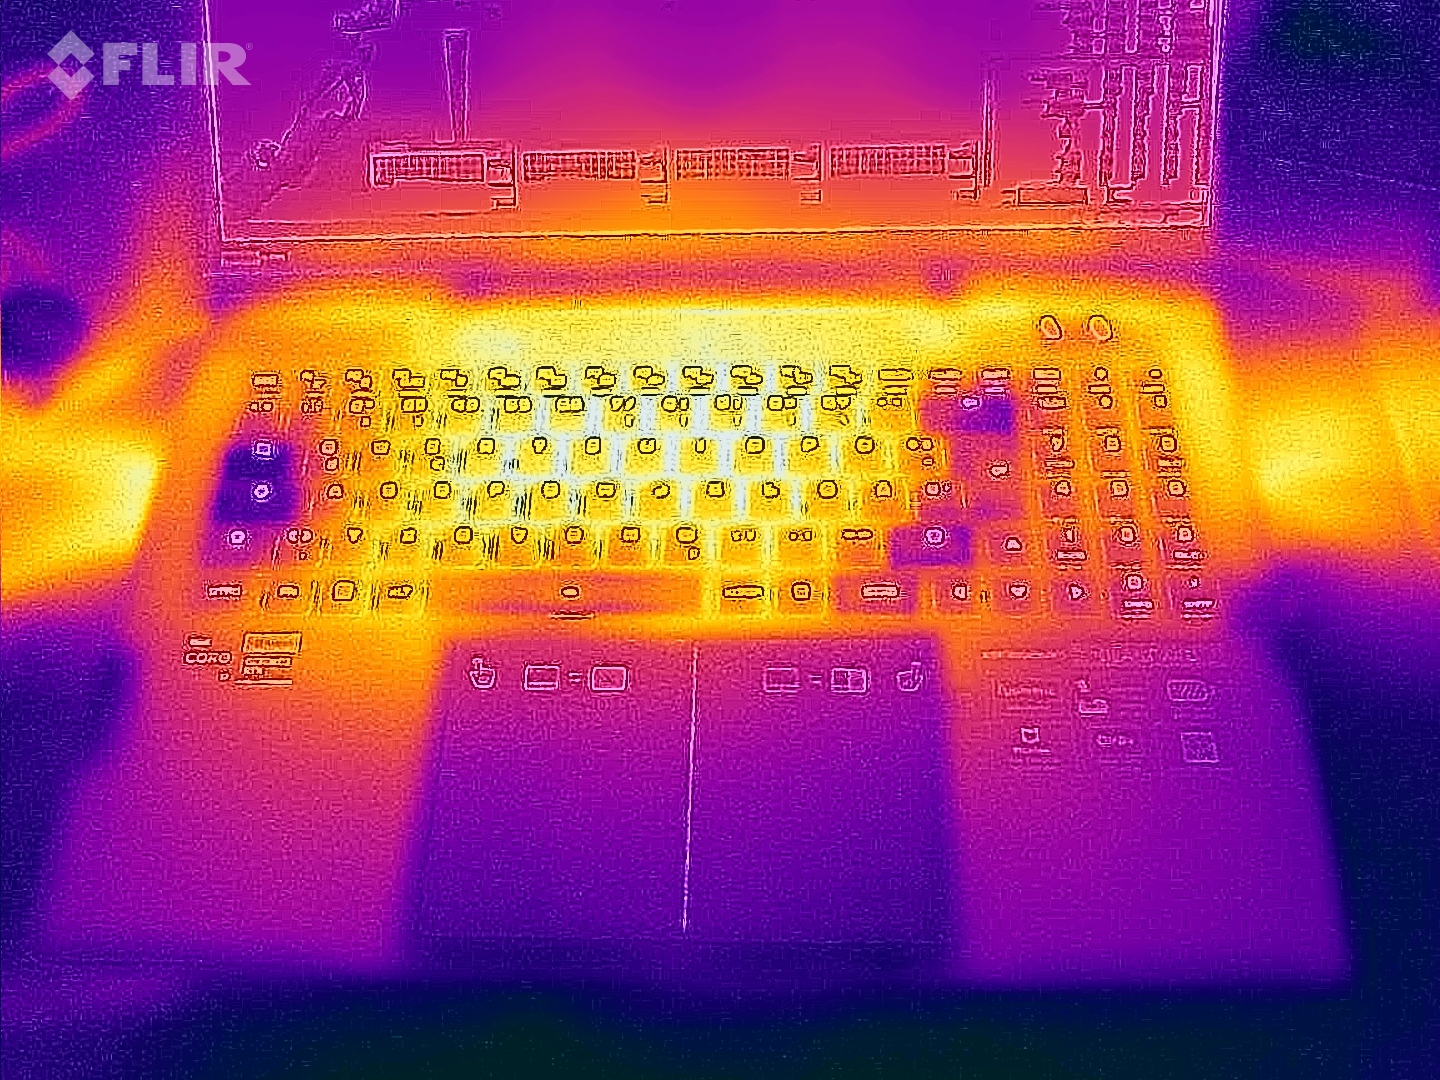
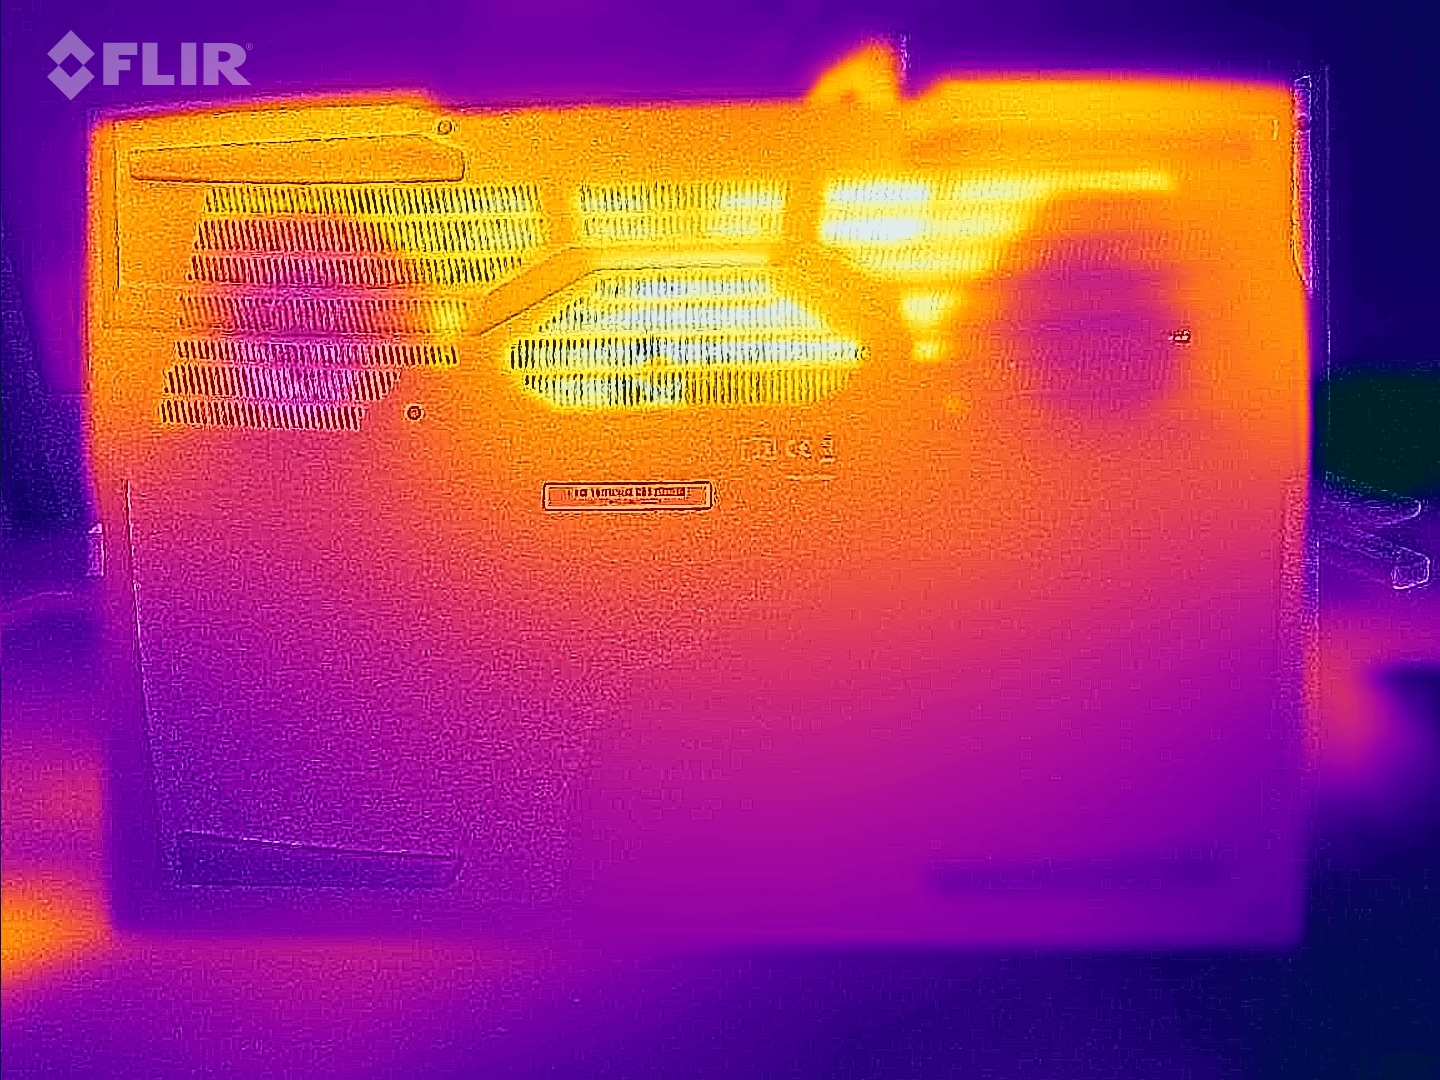
(-) La température maximale du côté supérieur est de 47 °C / 117 F, par rapport à la moyenne de 40.4 °C / 105 F, allant de 21.2 à 68.8 °C pour la classe Gaming.
(-) Le fond chauffe jusqu'à un maximum de 54 °C / 129 F, contre une moyenne de 43.2 °C / 110 F
(+) En utilisation inactive, la température moyenne du côté supérieur est de 28.1 °C / 83 F, par rapport à la moyenne du dispositif de 33.9 °C / 93 F.
(-) En jouant à The Witcher 3, la température moyenne du côté supérieur est de 39.1 °C / 102 F, alors que la moyenne de l'appareil est de 33.9 °C / 93 F.
(+) Les repose-poignets et le pavé tactile atteignent la température maximale de la peau (34 °C / 93.2 F) et ne sont donc pas chauds.
(-) La température moyenne de la zone de l'appui-paume de dispositifs similaires était de 28.8 °C / 83.8 F (-5.2 °C / #-9.4 F).
| Medion Erazer Beast X40 2024 Intel Core i9-14900HX, NVIDIA GeForce RTX 4090 Laptop GPU | Asus ROG Strix Scar 17 G733PYV-LL053X AMD Ryzen 9 7945HX3D, NVIDIA GeForce RTX 4090 Laptop GPU | Schenker Key 17 Pro (Early 23) Intel Core i9-13900HX, NVIDIA GeForce RTX 4090 Laptop GPU | Asus ROG Strix Scar 18 G834JYR (2024) Intel Core i9-14900HX, NVIDIA GeForce RTX 4090 Laptop GPU | MSI Titan 18 HX A14VIG Intel Core i9-14900HX, NVIDIA GeForce RTX 4090 Laptop GPU | Medion Erazer Beast X40 Intel Core i9-13900HX, NVIDIA GeForce RTX 4090 Laptop GPU | |
|---|---|---|---|---|---|---|
| Heat | 14% | -11% | 4% | 5% | 1% | |
| Maximum Upper Side * (°C) | 47 | 40.1 15% | 57 -21% | 49 -4% | 37.8 20% | 48 -2% |
| Maximum Bottom * (°C) | 54 | 46.7 14% | 60 -11% | 47 13% | 37.6 30% | 52 4% |
| Idle Upper Side * (°C) | 30 | 26.5 12% | 32 -7% | 29 3% | 34.8 -16% | 30 -0% |
| Idle Bottom * (°C) | 32 | 27.7 13% | 34 -6% | 31 3% | 36 -13% | 31 3% |
* ... Moindre est la valeur, meilleures sont les performances
Haut-parleur
Les haut-parleurs stéréo produisent un son très correct dans l'ensemble.
Medion Erazer Beast X40 2024 analyse audio
(+) | les haut-parleurs peuvent jouer relativement fort (88# dB)
Basses 100 - 315 Hz
(±) | basse réduite - en moyenne 14.7% inférieure à la médiane
(±) | la linéarité des basses est moyenne (7.2% delta à la fréquence précédente)
Médiums 400 - 2000 Hz
(+) | médiane équilibrée - seulement 3.7% de la médiane
(+) | les médiums sont linéaires (5.8% delta à la fréquence précédente)
Aiguës 2 - 16 kHz
(+) | des sommets équilibrés - à seulement 2.8% de la médiane
(+) | les aigus sont linéaires (6.4% delta à la fréquence précédente)
Globalement 100 - 16 000 Hz
(+) | le son global est linéaire (12.1% différence à la médiane)
Par rapport à la même classe
» 12% de tous les appareils testés de cette catégorie étaient meilleurs, 4% similaires, 84% pires
» Le meilleur avait un delta de 6%, la moyenne était de 18%, le pire était de 132%.
Par rapport à tous les appareils testés
» 10% de tous les appareils testés étaient meilleurs, 2% similaires, 88% pires
» Le meilleur avait un delta de 4%, la moyenne était de 23%, le pire était de 134%.
Consommation d'énergie
La Beast X40 ne réserve pas de surprises en termes de consommation d'énergie. Les valeurs sont à un niveau normal pour le matériel installé.
Le test Witcher 3 et le test de stress sont exécutés avec une consommation d'énergie légèrement inférieure. Le bloc d'alimentation de 330 W s'avère adéquat en cas de stress.
| Éteint/en veille | |
| Au repos | |
| Fortement sollicité |
|
Légende:
min: | |
Power consumption: The Witcher 3 / Stress test
Power consumption: External monitor
Durée de vie de la batterie
Le Beast X40 atteint une durée de fonctionnement de 6:14 h dans le test pratique WLAN (illustration de la charge lors de l'accès à des sites web à l'aide d'un script), ce qui est une valeur décente.
Cela place le X40 au même niveau que son prédécesseur.
Points positifs
Points négatifs
Verdict : un concentré de puissance haut de gamme
Le Medion Erazer Beast X40 vient de l'extrémité supérieure de l'échelle des performances : la GeForce RTX 4090 et Core i9-14900HX fournissent la puissance nécessaire pour les jeux, le streaming, le rendu et l'édition vidéo. Il est possible de trouver un compromis entre performances et bruit. Avec un système de refroidissement à l'eau en option (environ 200 €), il est possible d'obtenir une légère augmentation des performances et une réduction globale des émissions.
Avec l'Erazer Beast X40, Medion propose un ordinateur portable de jeu extrêmement puissant.
Les points positifs sont un écran 17 pouces de haute qualité (2 560 x 1 600 pixels, 240 Hz, G-Sync, sRGB) au format 16:10, un clavier mécanique tactile et un port Thunderbolt 4. Ce dernier ouvre des options d'extension (GPU externe, solution d'accueil), prend en charge Power Delivery et peut émettre un signal DisplayPort. L'autonomie de la batterie est également satisfaisante.
Les différences entre le modèle actuel et celui de l'année dernière x40 de l'année dernière de l'année dernière ne sont pas très marquées. Grâce à des vitesses d'horloge légèrement plus élevées, le Core i9-14900HX offre, avec le même nombre de cœurs et de threads, des performances légèrement supérieures à celles du Core i9-13900HX Core i9-13900HX du modèle de l'année précédente. Ce dernier serait une alternative (moins chère) : Medion le vend actuellement pour un peu moins de 3 500 euros.
Une autre alternative serait le Asus ROG Strix Scar 17 X3D. Il offre un niveau de performance comparable et un écran avec couverture DCI-P3. L'ordinateur portable d'Asus ne dispose toutefois pas de Thunderbolt 4. Il est également moins performant en termes d'autonomie de la batterie.
Prix et disponibilité
Le Medion Erazer Beast X40 (2024) est disponible dans la boutique Medion et sur Cyberport.de à un prix inférieur à 4 000 €.
Medion Erazer Beast X40 2024
- 02/21/2024 v7 (old)
Sascha Mölck
Transparency
La sélection des appareils à examiner est effectuée par notre équipe éditoriale. L'échantillon de test a été prêté à l'auteur par le fabricant ou le détaillant pour les besoins de cet examen. Le prêteur n'a pas eu d'influence sur cette évaluation et le fabricant n'a pas reçu de copie de cette évaluation avant sa publication. Il n'y avait aucune obligation de publier cet article. En tant que média indépendant, Notebookcheck n'est pas soumis à l'autorité des fabricants, des détaillants ou des éditeurs.
Voici comment Notebookcheck teste
Chaque année, Notebookcheck examine de manière indépendante des centaines d'ordinateurs portables et de smartphones en utilisant des procédures standardisées afin de garantir que tous les résultats sont comparables. Nous avons continuellement développé nos méthodes de test depuis environ 20 ans et avons établi des normes industrielles dans le processus. Dans nos laboratoires de test, des équipements de mesure de haute qualité sont utilisés par des techniciens et des rédacteurs expérimentés. Ces tests impliquent un processus de validation en plusieurs étapes. Notre système d'évaluation complexe repose sur des centaines de mesures et de points de référence bien fondés, ce qui garantit l'objectivité.Price comparison
