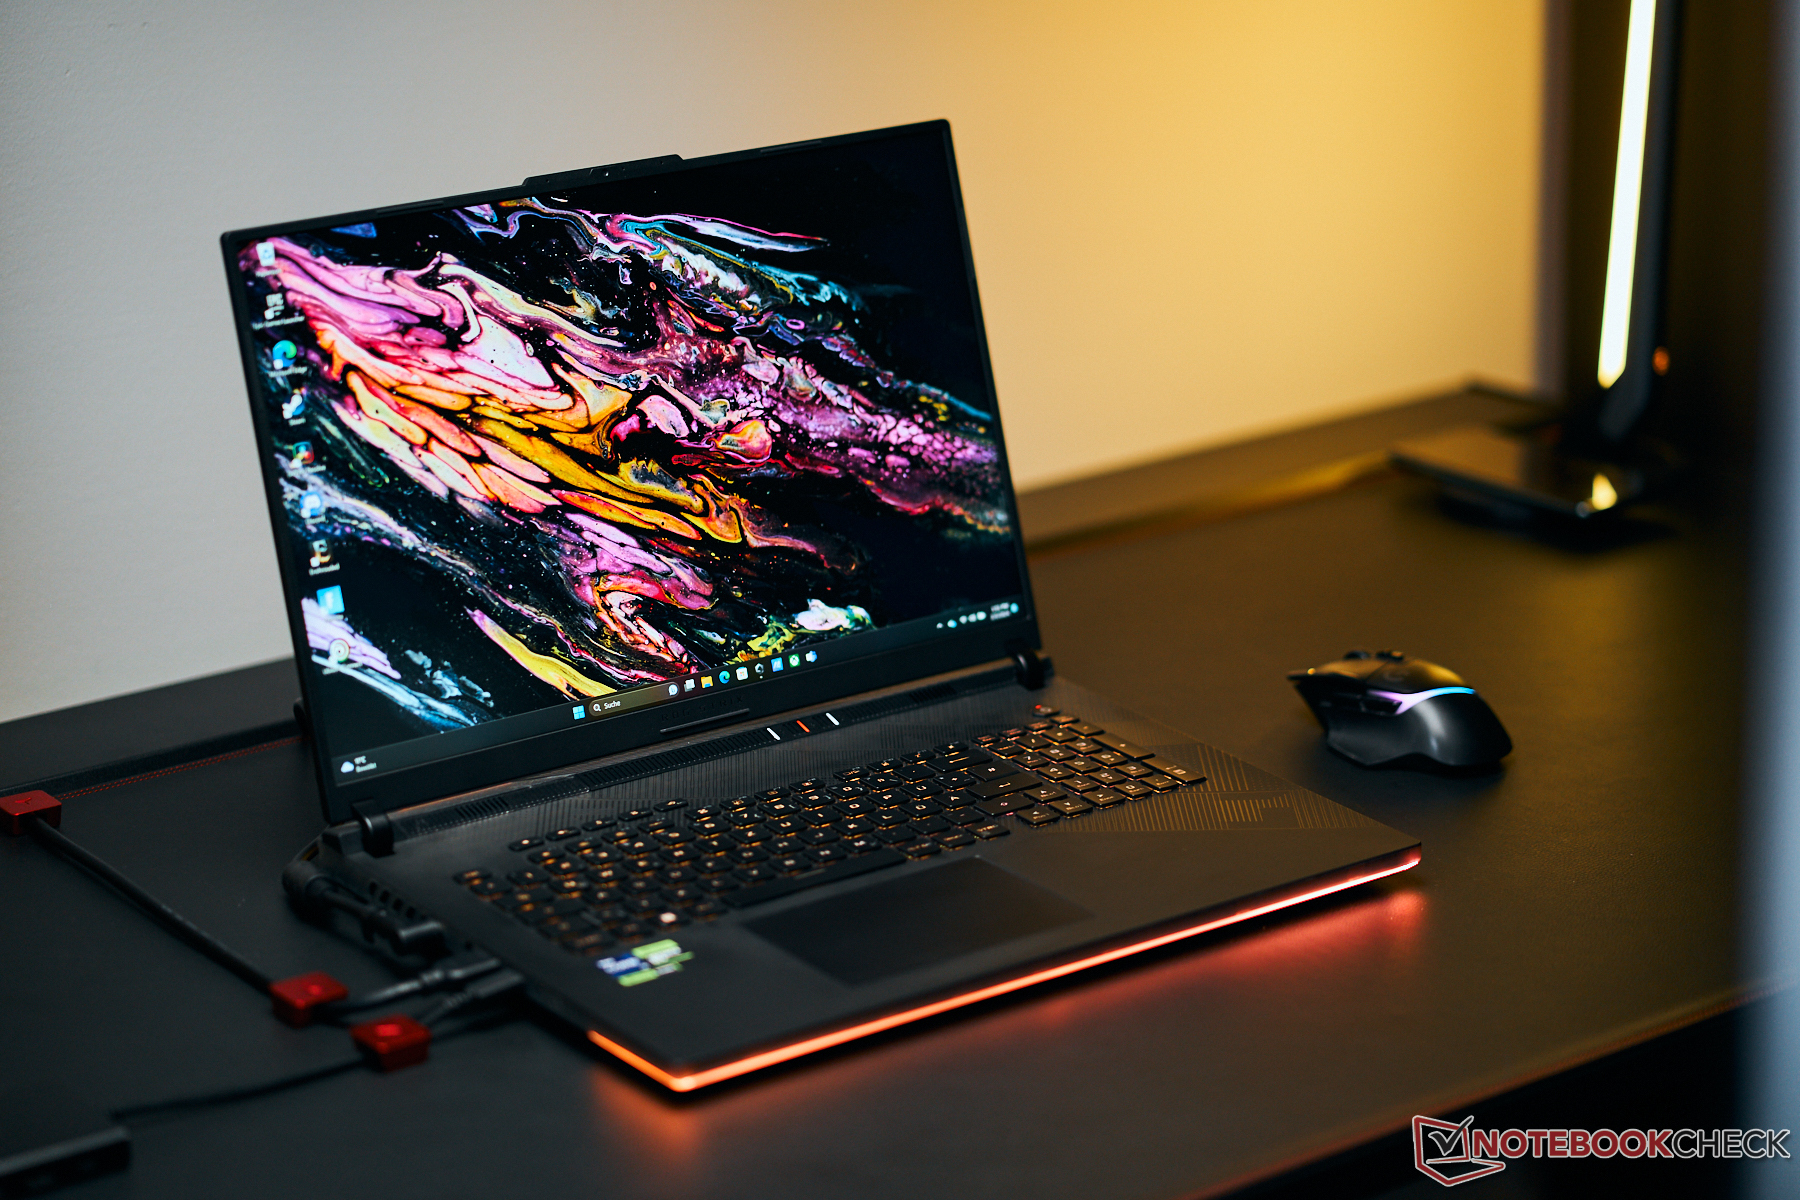
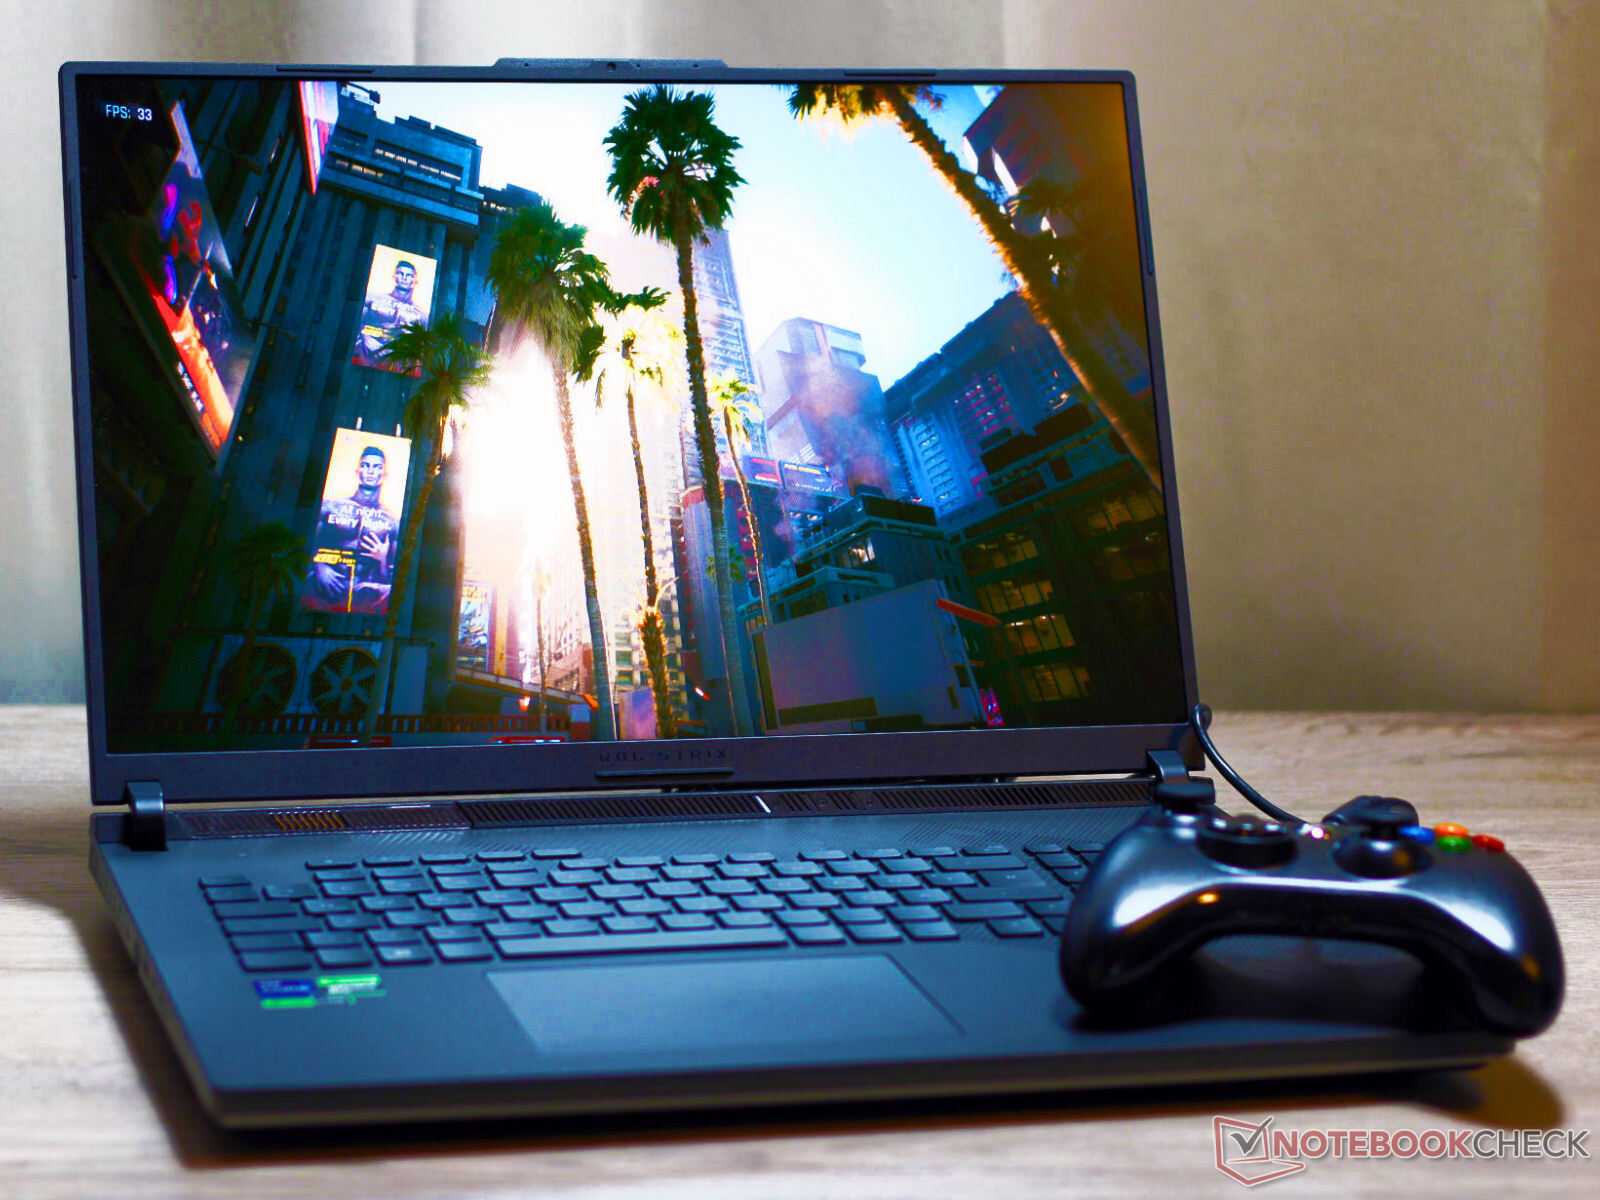
Test de l'Asus ROG Strix Scar 18 (2024) : PC portable de jeu avec RTX 4090 et mini-LED
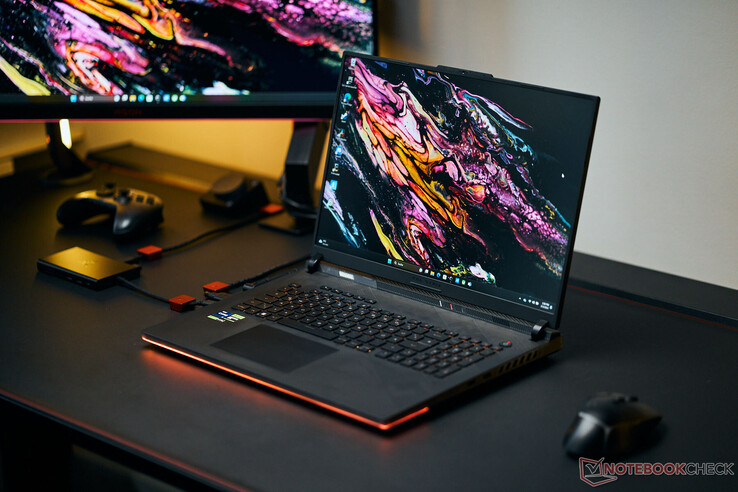
Avec le ROG Strix Scar 18, ASUS vise les joueurs et les créateurs qui ne manquent pas de moyens : Notre configuration de test du champion haut de gamme est disponible à partir de 4 500 euros (~4 848 $). Le prix est poussé à de telles hauteurs par le matériel puissant et un écran mini-LED très lumineux au format 16:10 avec des couleurs précises et une diagonale de 18 pouces. Parmi les concurrents, on trouve des appareils tels que Alienware m18 R1l'Alienware m18 R1, l'Acer Predator Helios 18 Acer Predator Helios 18l'Acer Predator Helios 18 Razer Blade 18et le MSI Titan 18 HX A14VIG.
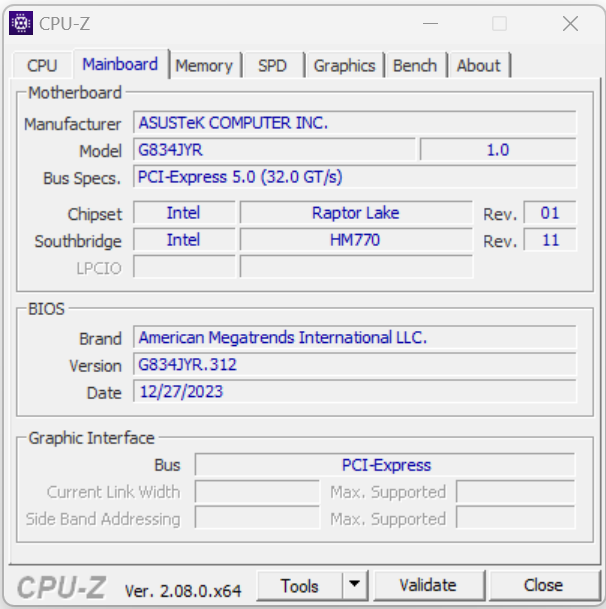
L'ordinateur portable est le frère du Scar 18 que nous avons testé l'année dernière et partage une construction identique. Outre l'écran, la génération de CPU représente le seul changement, avec Raptor Lake Refresh remplaçant Raptor Lake.
Comparaison avec les concurrents potentiels
Note | Date | Modèle | Poids | Épaisseur | Taille | Résolution | Prix |
|---|---|---|---|---|---|---|---|
| 88.3 % v7 (old) | 02/24 | Asus ROG Strix Scar 18 G834JYR (2024) i9-14900HX, GeForce RTX 4090 Laptop GPU | 3.1 kg | 30.8 mm | 18.00" | 2560x1600 | |
| 89.2 % v7 (old) | 11/23 | Alienware m18 R1 AMD R9 7945HX, Radeon RX 7900M | 3.9 kg | 26.7 mm | 18.00" | 1920x1200 | |
| 90.7 % v7 (old) | 04/23 | Alienware m18 R1 i9-13980HX, GeForce RTX 4090 Laptop GPU | 3.9 kg | 26.7 mm | 18.00" | 1920x1200 | |
| 88.3 % v7 (old) | 10/23 | Acer Predator Helios 18 N23Q2 i9-13900HX, GeForce RTX 4080 Laptop GPU | 3.2 kg | 29.15 mm | 18.00" | 2560x1600 | |
| 91.4 % v7 (old) | 02/23 | Razer Blade 18 RTX 4070 i9-13950HX, GeForce RTX 4070 Laptop GPU | 3 kg | 21.9 mm | 18.00" | 2560x1600 | |
| 88.8 % v7 (old) | 01/24 | MSI Titan 18 HX A14VIG i9-14900HX, GeForce RTX 4090 Laptop GPU | 3.6 kg | 32.1 mm | 18.00" | 3840x2400 |
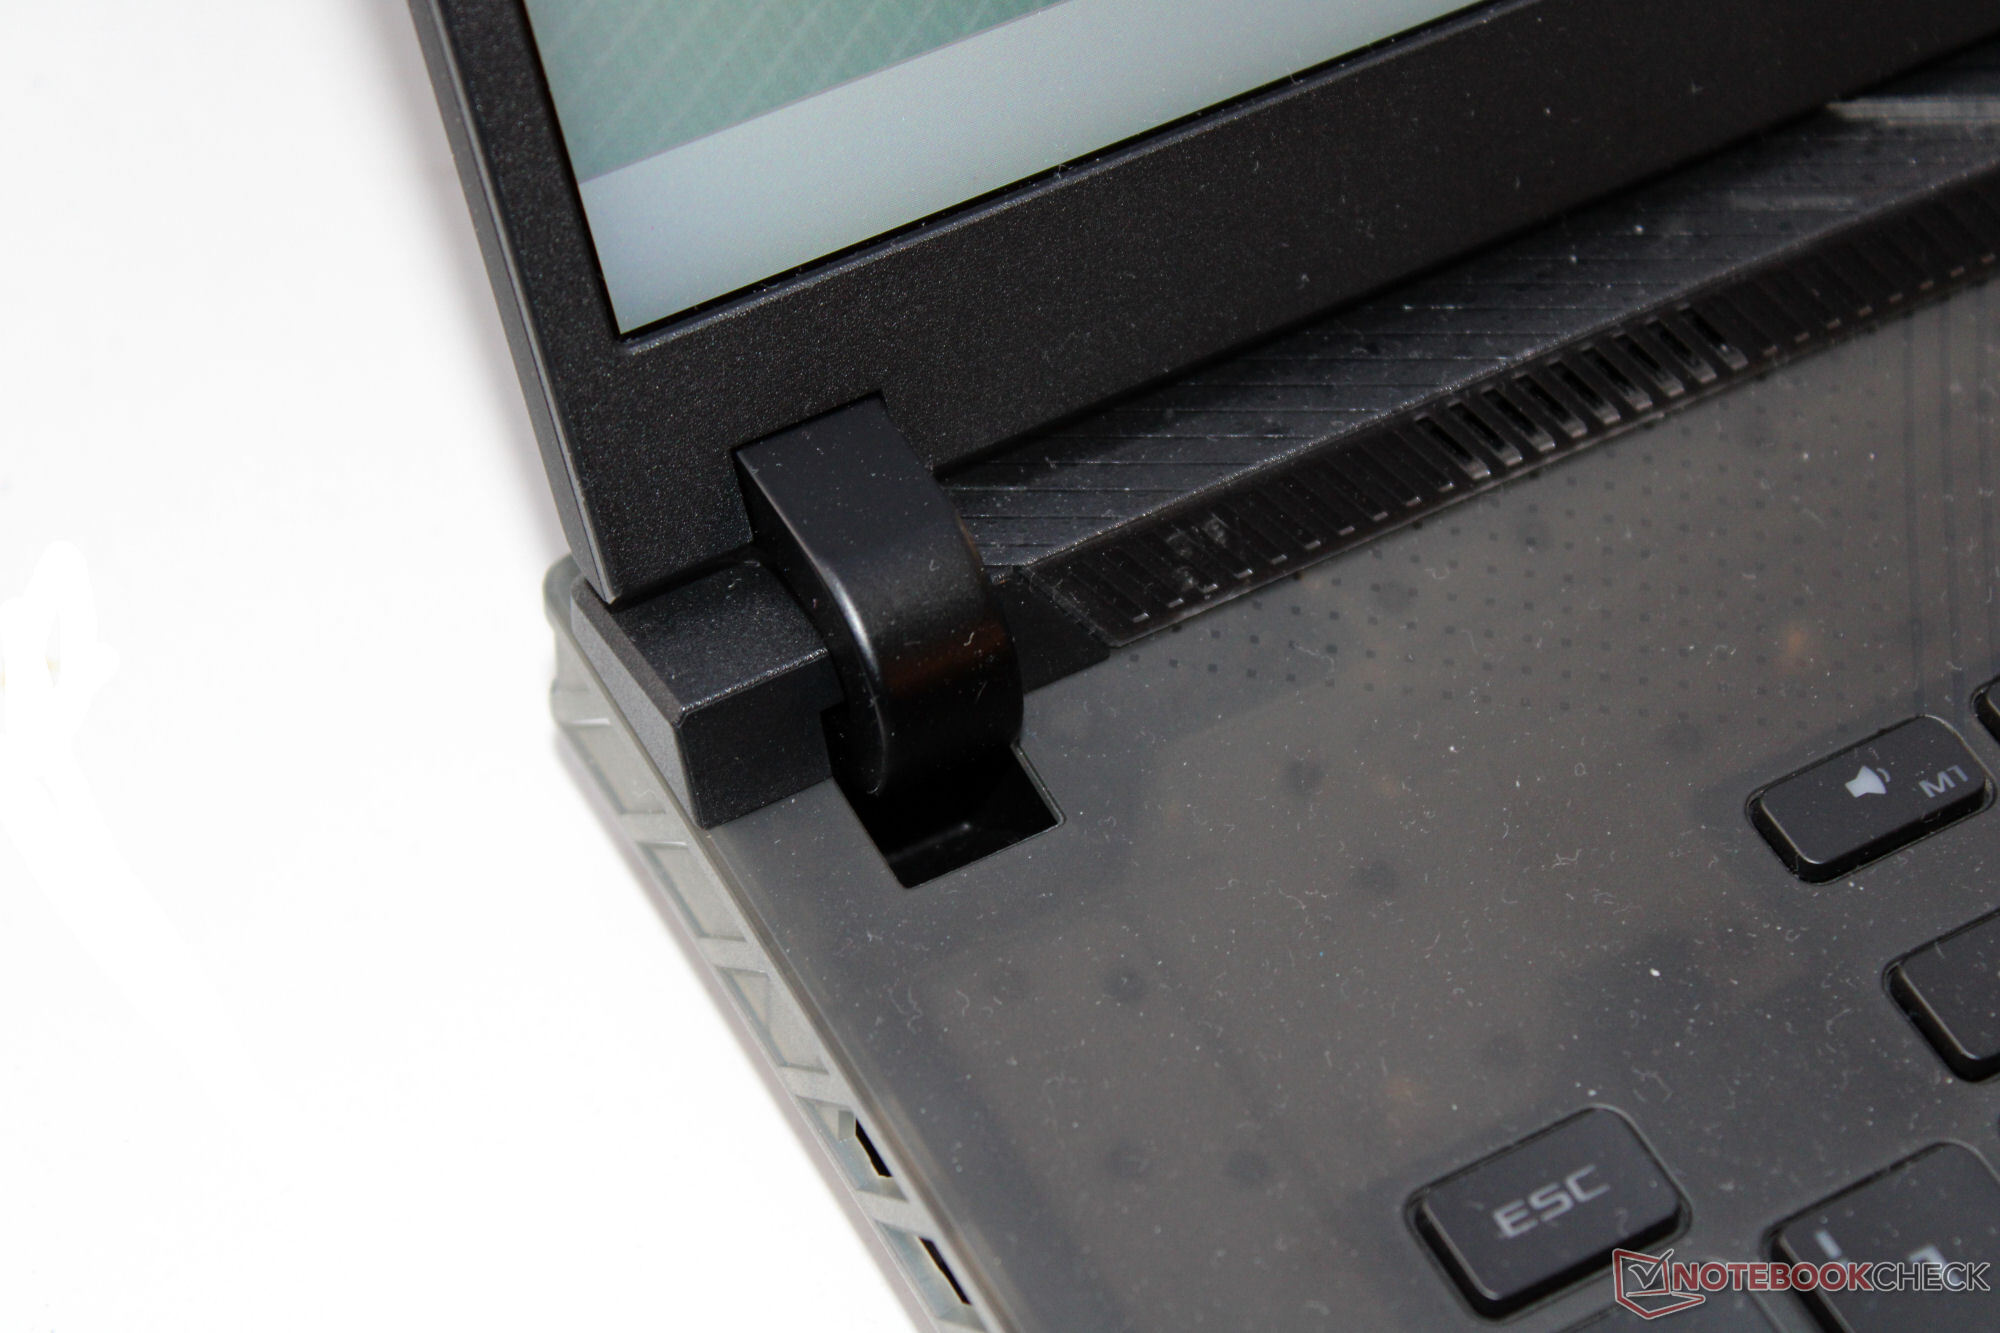
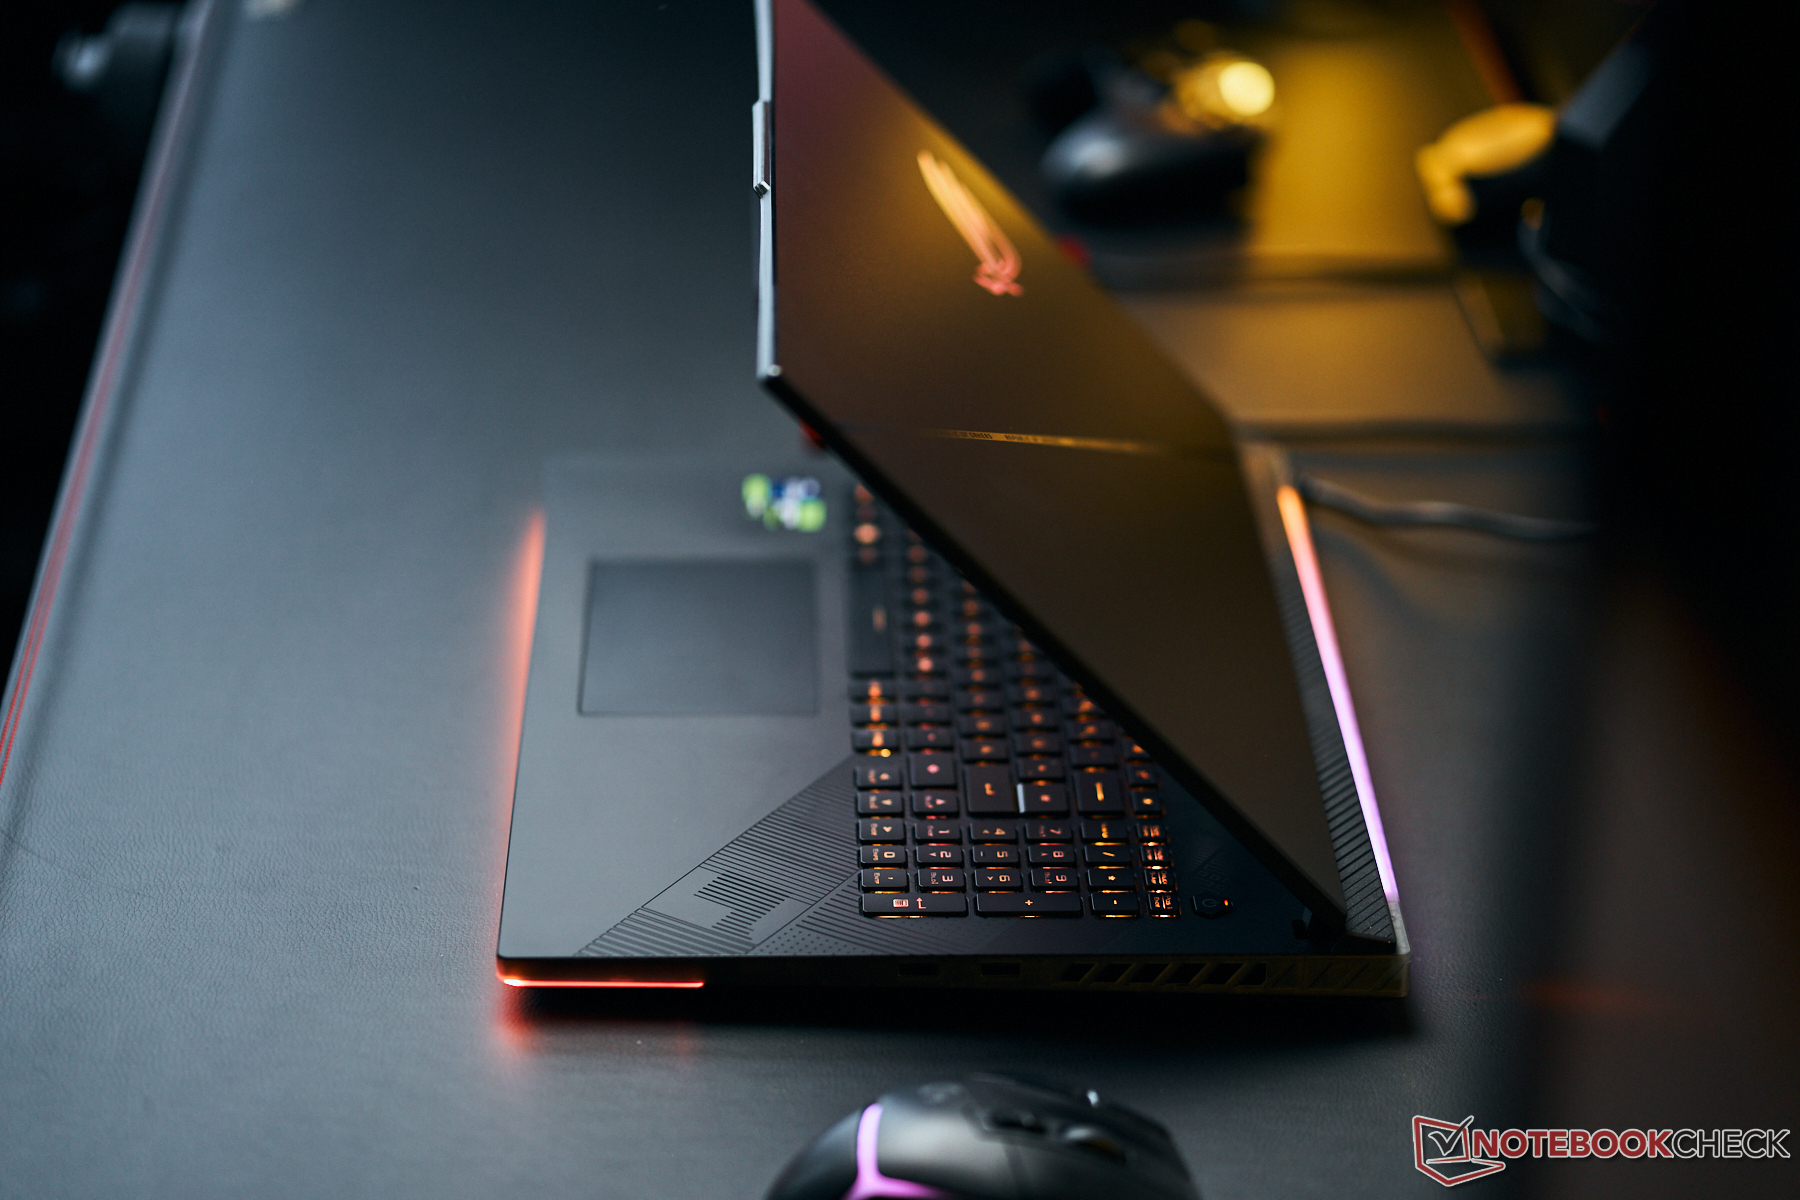
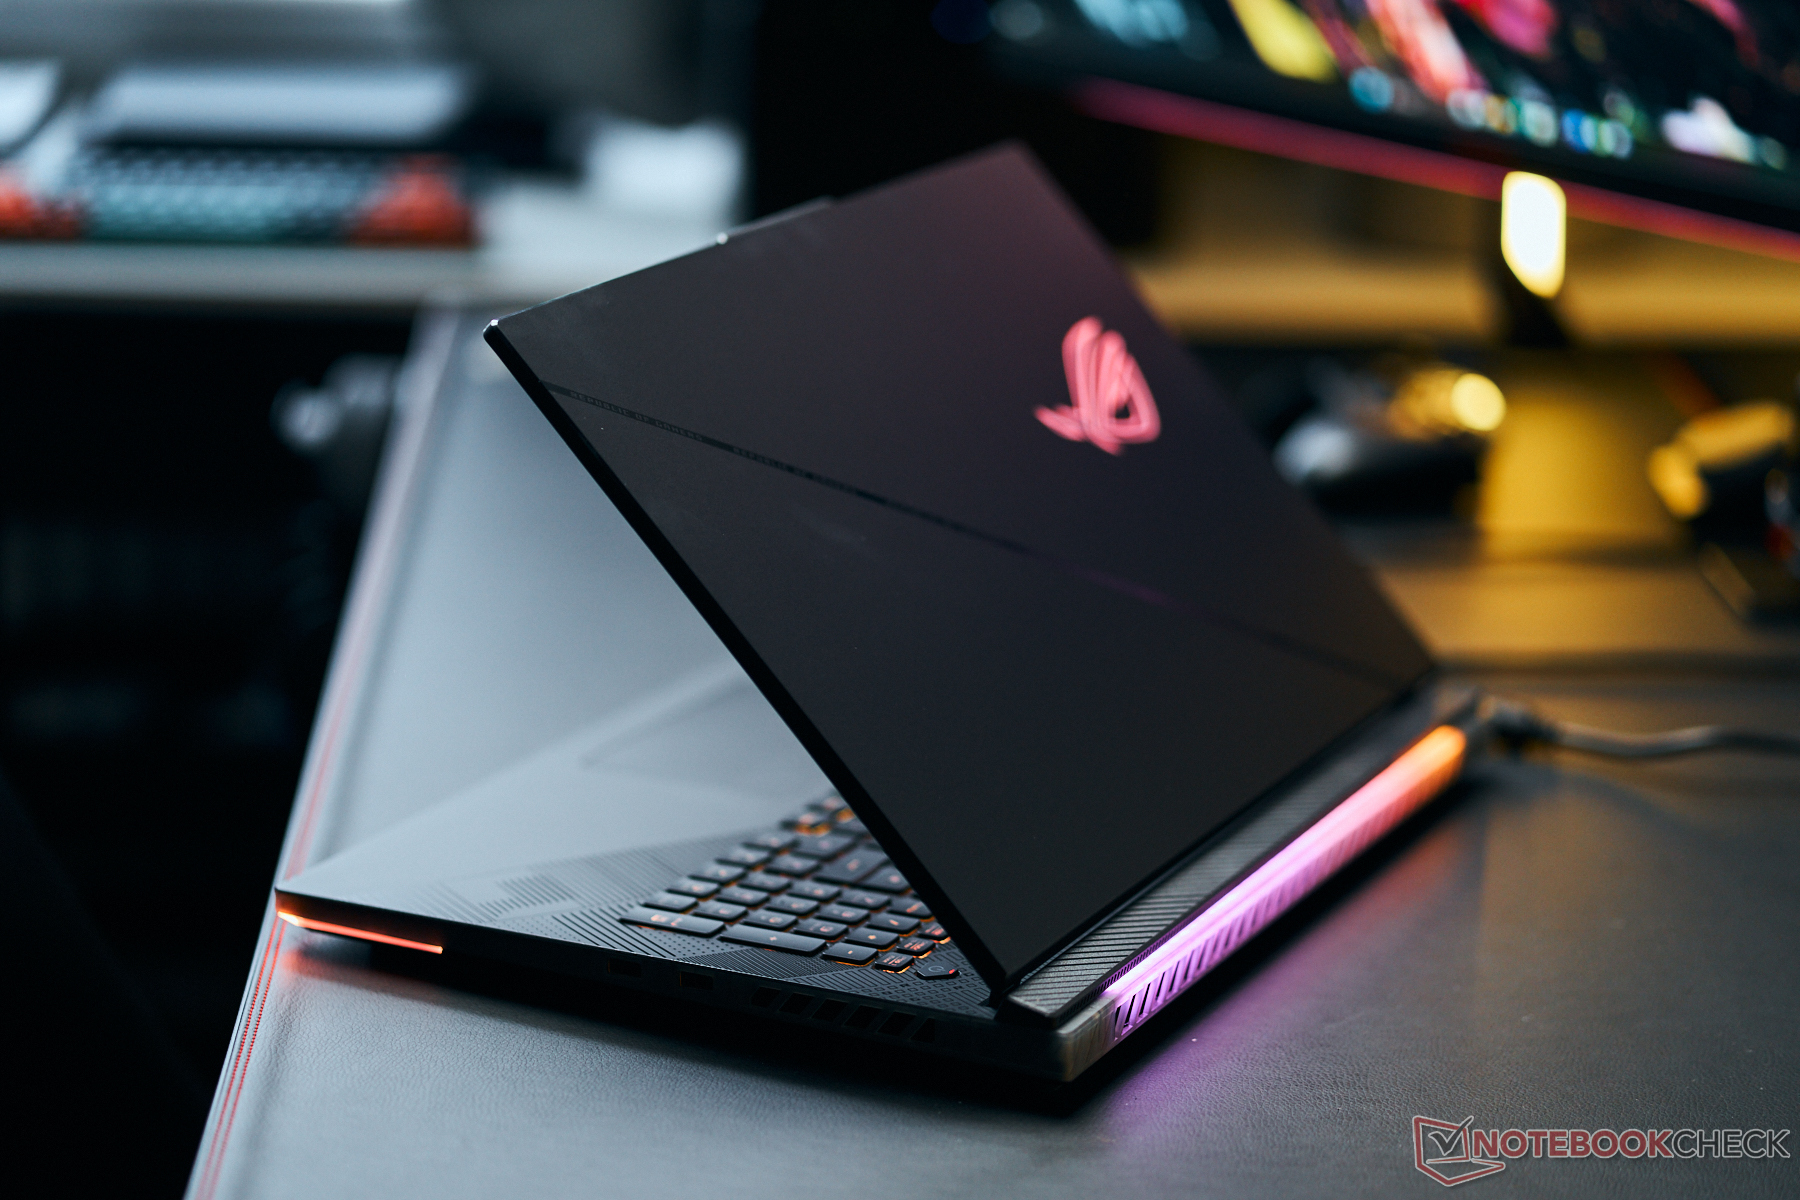
Boîtier - Beaucoup de plastique et peu d'aluminium
Malgré son prix élevé, l'utilisation de matériaux de haute qualité reste limitée : seul le dos du couvercle de l'écran du Scar est en aluminium et le reste des composants est en plastique. Certaines parties du plastique (au-dessus du clavier et sur les petits côtés) laissent passer un peu de lumière. Des bandes LED à l'avant et à l'arrière ainsi qu'un logo lumineux sur le couvercle de l'écran apportent un peu de vie à ce boîtier noir.
Nous ne constatons aucun défaut de fabrication et les écarts entre les matériaux sont faibles et réguliers. Bien que le couvercle ne puisse être tourné que légèrement, la réponse de l'unité de base est plus prononcée. Un ordinateur portable de plusieurs milliers d'euros devrait faire mieux. La pression exercée sur le couvercle de l'écran ne provoque pas d'artefacts d'image. Les charnières maintiennent fermement le couvercle en place, mais l'écran oscille encore légèrement lorsque vous déplacez l'ordinateur portable. L'angle d'ouverture maximal est de 130 degrés, et il peut être ouvert d'une seule main.
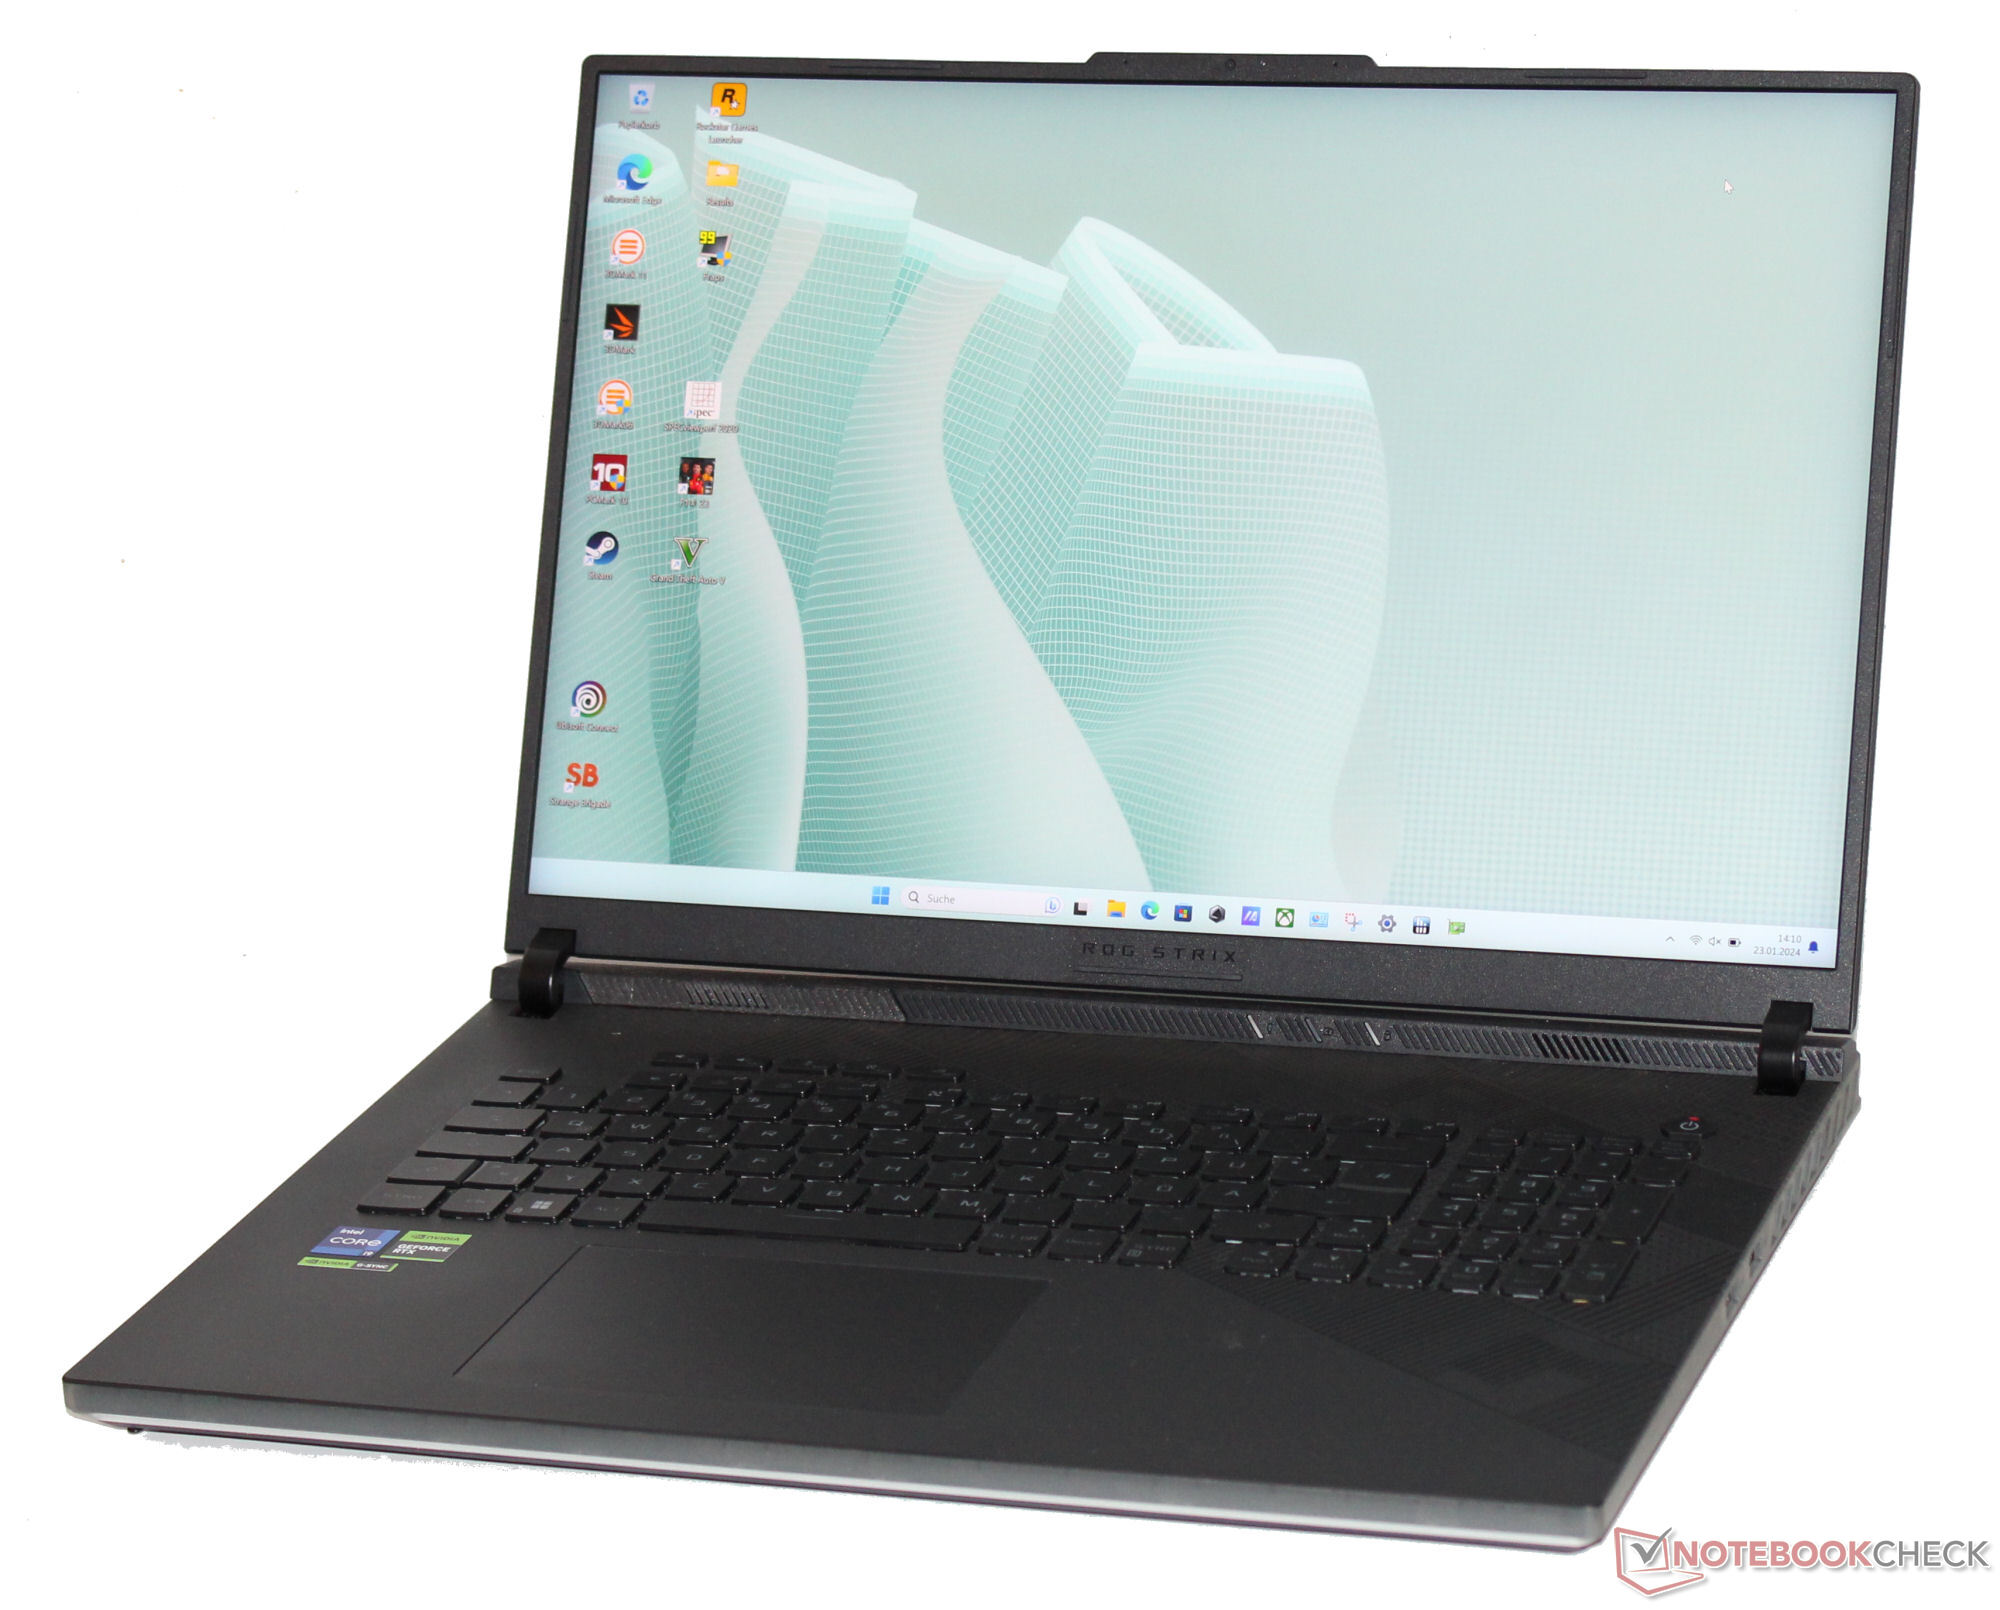
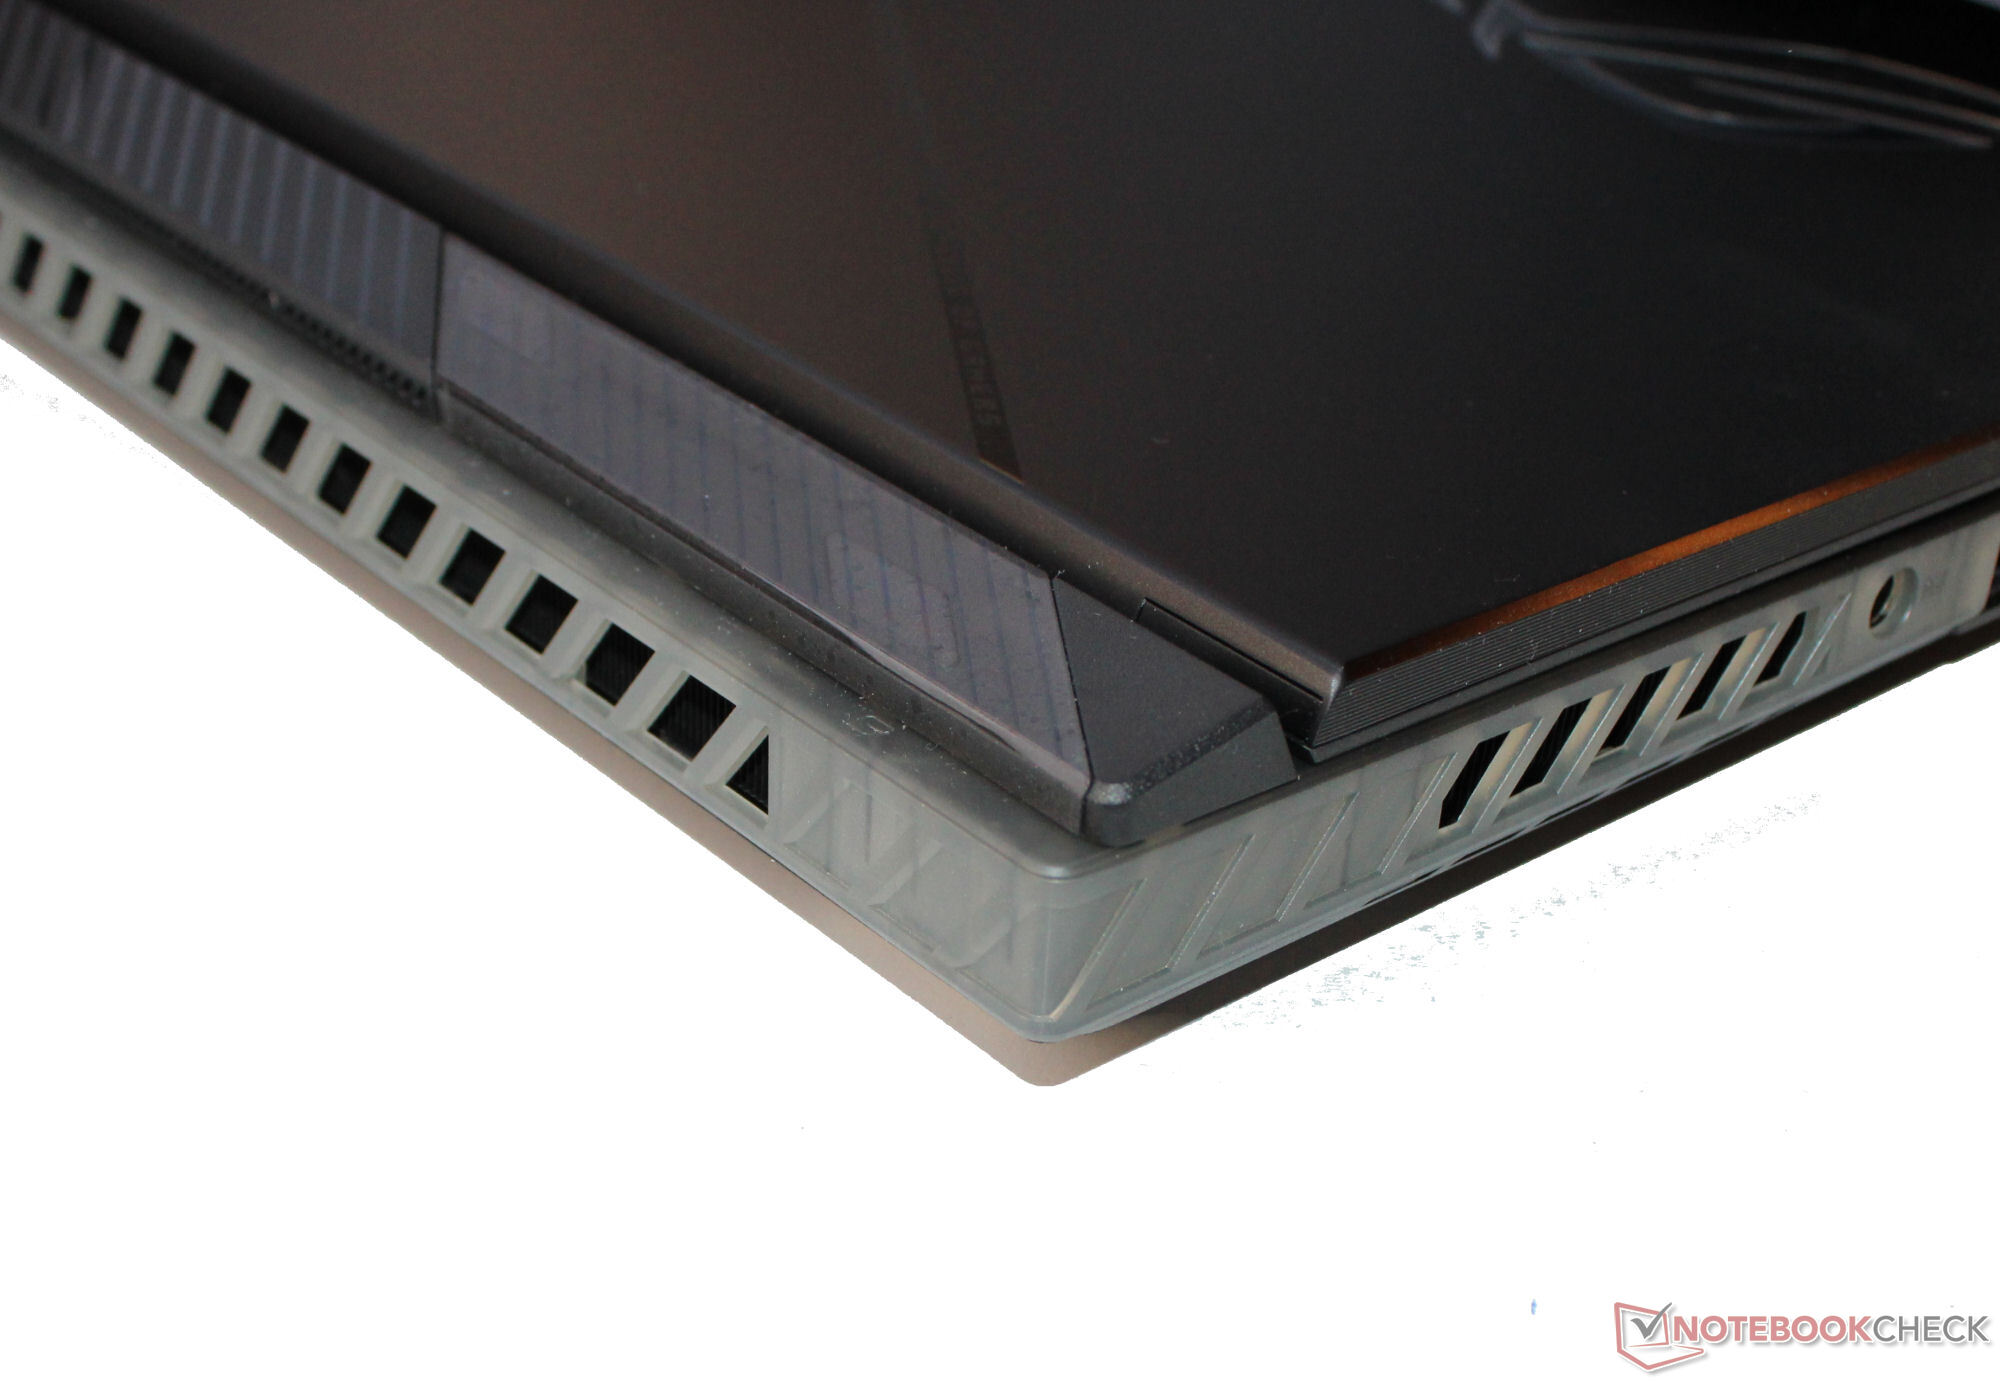
Le Scar 18 est l'un des appareils les plus compacts et les plus légers de notre comparatif et n'est surpassé que par le Blade 18 à ces égards.
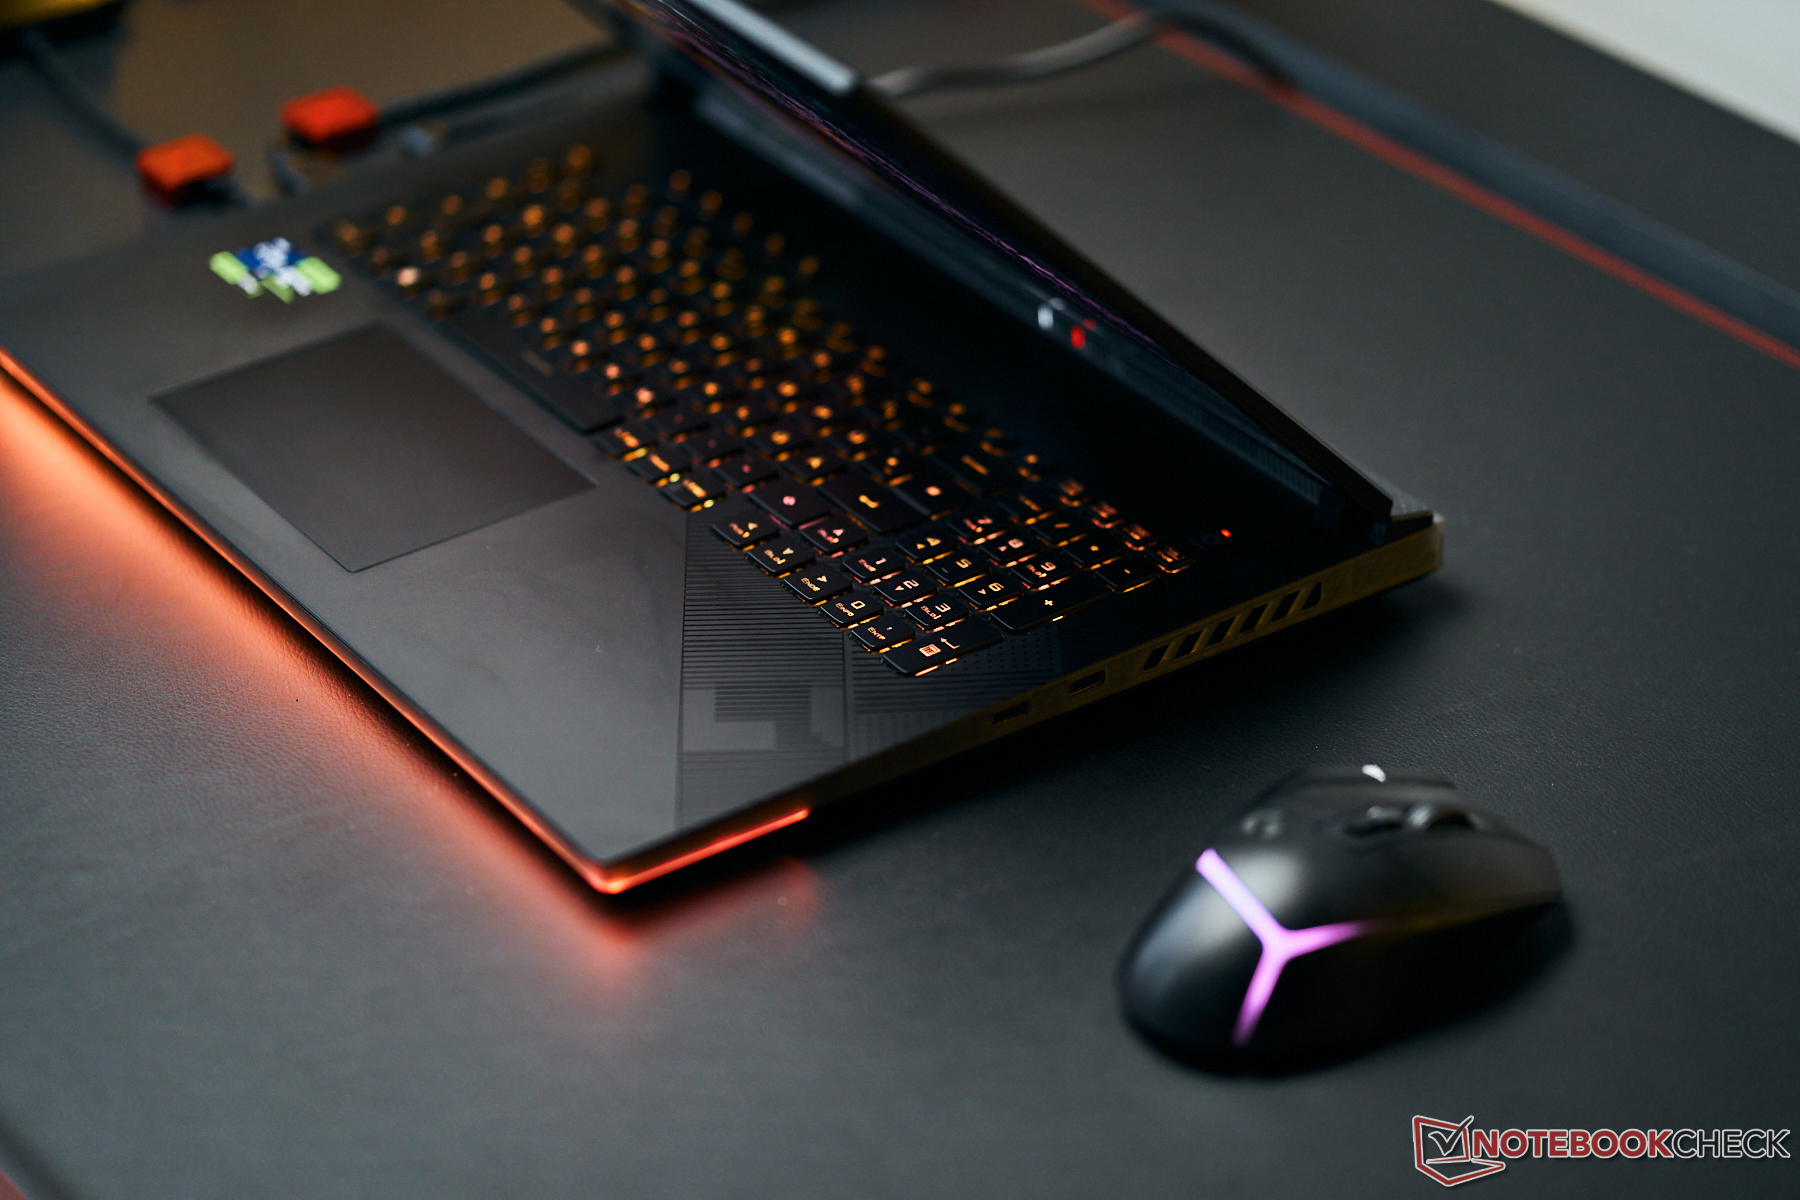
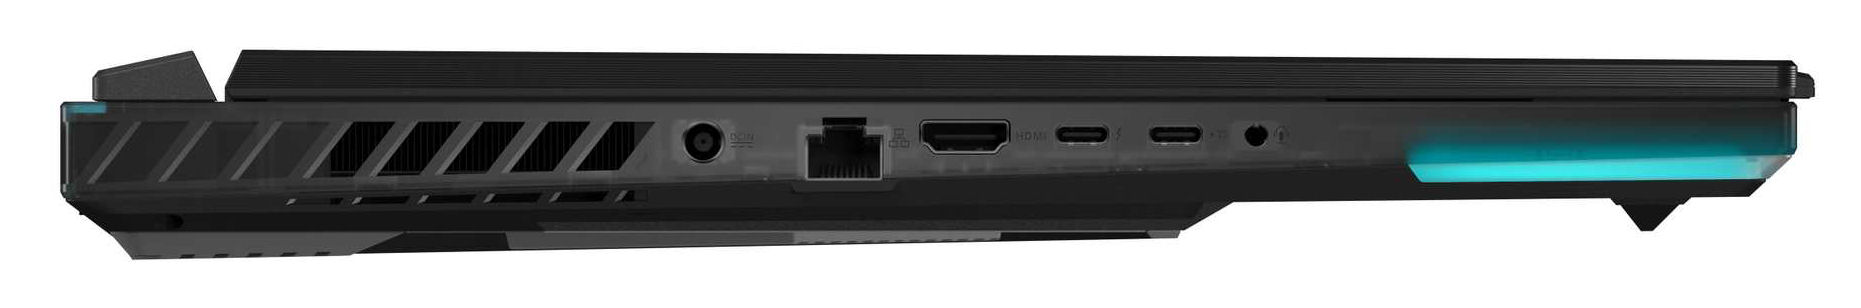
Equipement - Asus Strix offre Thunderbolt 4
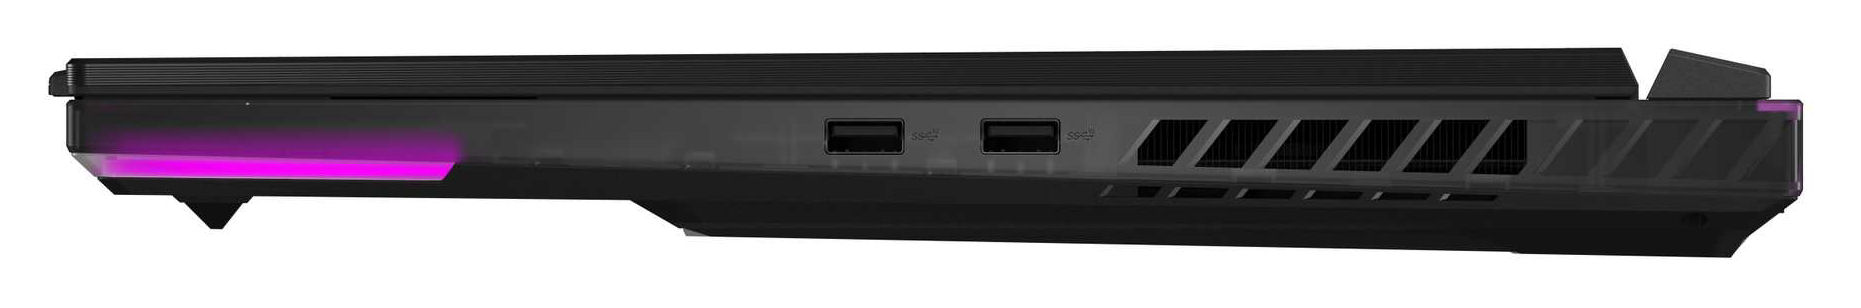
L'ordinateur portable Asus offre deux ports USB-A (USB 3.2 Gen 2) et deux ports USB-C (1x Thunderbolt 4, 1x USB 3.2 Gen 2). Les deux ports USB-C peuvent émettre un signal DisplayPort, et le port USB 3.2 Gen 2 prend également en charge Power Delivery. Les connexions sont complétées par un port HDMI, un port audio et un port Gigabit Ethernet. L'ordinateur portable ne comprend pas de lecteur de carte de stockage.
Il n'y a pas de ports à l'arrière de l'ordinateur portable, et tous les ports sont placés sur les côtés gauche et droit du boîtier. Les câbles allant vers l'arrière bloqueraient certaines ouvertures de ventilateur sur les côtés de l'ordinateur portable. C'est par exemple le cas du câble d'alimentation (prise d'alimentation coudée). Les droitiers ne seront peut-être gênés que par les ports USB-A qui ne sont placés que sur le côté droit.
Communication
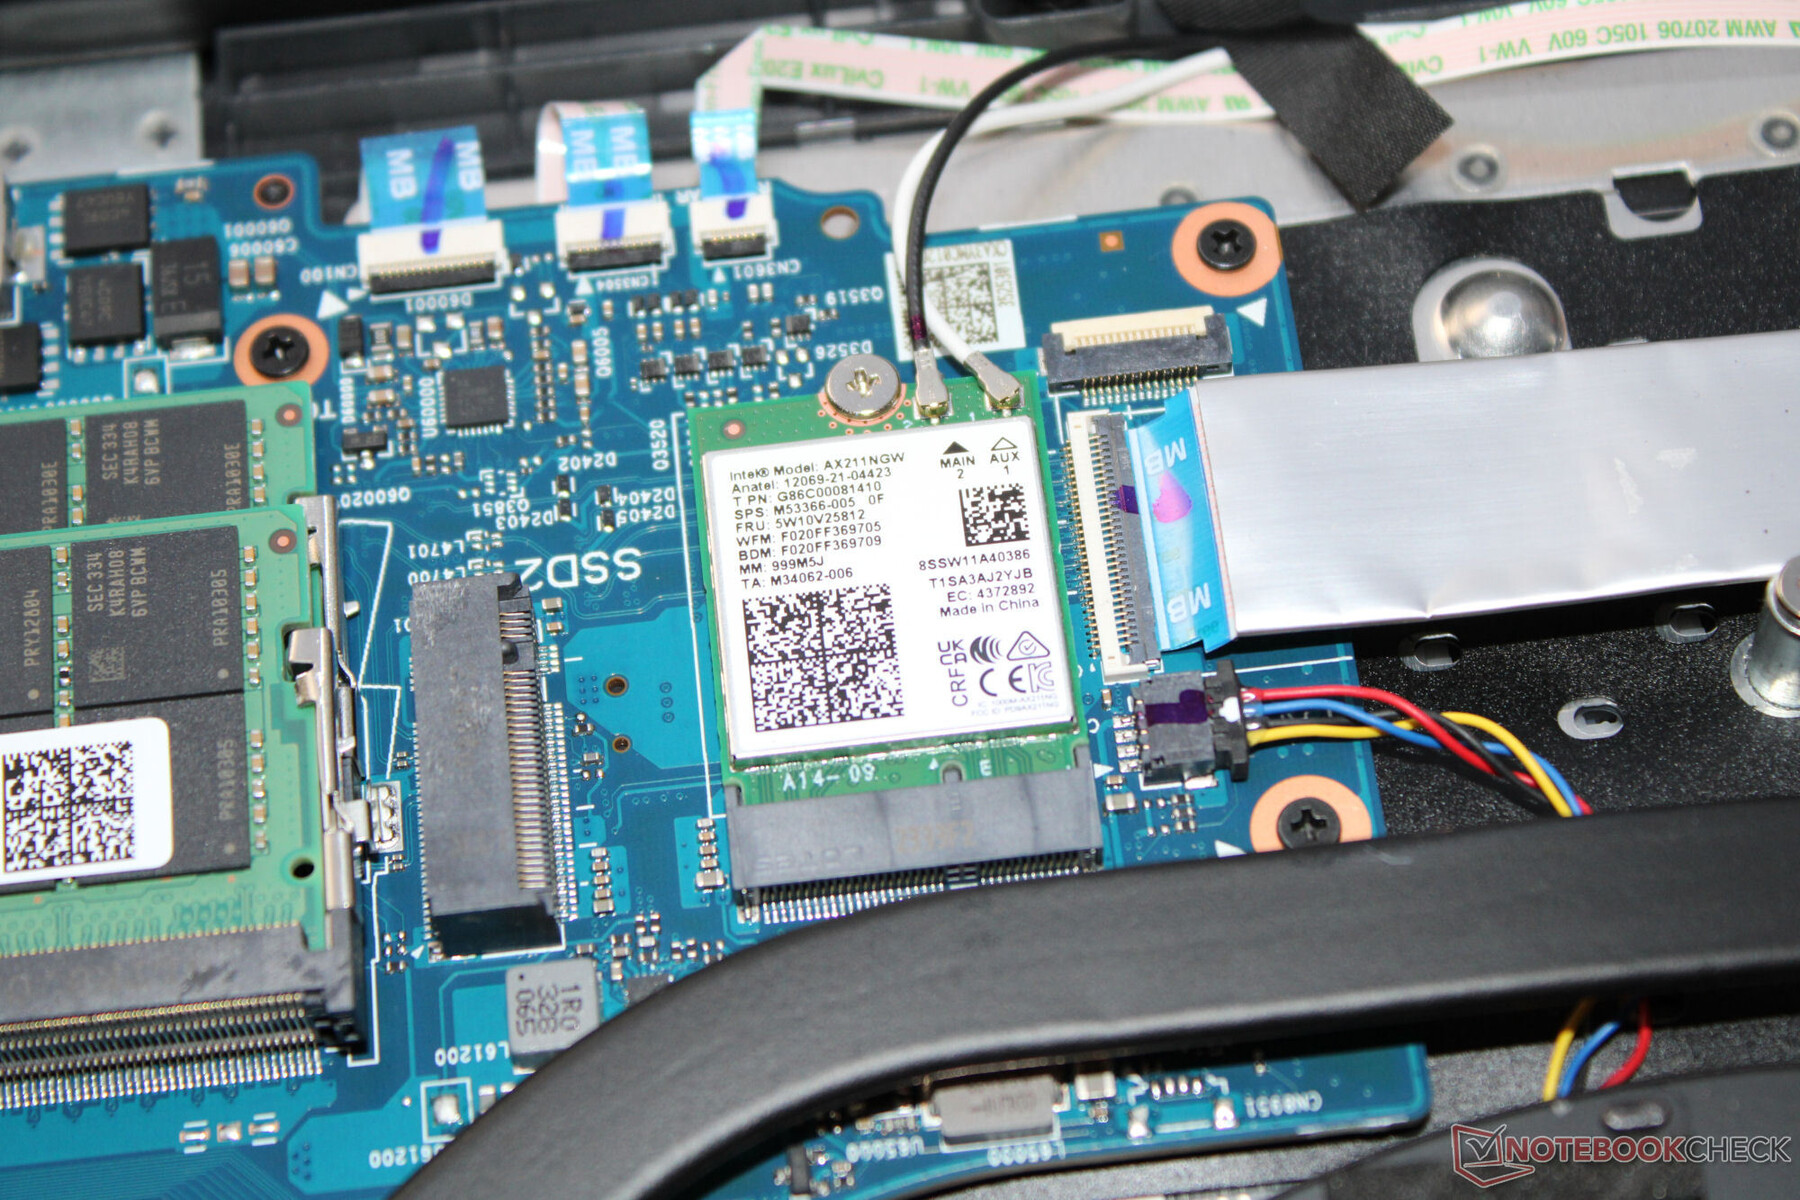
Dans des conditions optimales (pas d'autres appareils Wi-Fi à proximité, distance réduite entre l'ordinateur portable et le PC serveur), l'ordinateur portable atteint des taux de transfert Wi-Fi bons à très bons. Le Strix utilise une puce Wi-Fi 6E (Intel AX211), et les connexions filaires sont gérées par un contrôleur Realtek (RTL8125 ; 2,5 Gbit/s).
Webcam
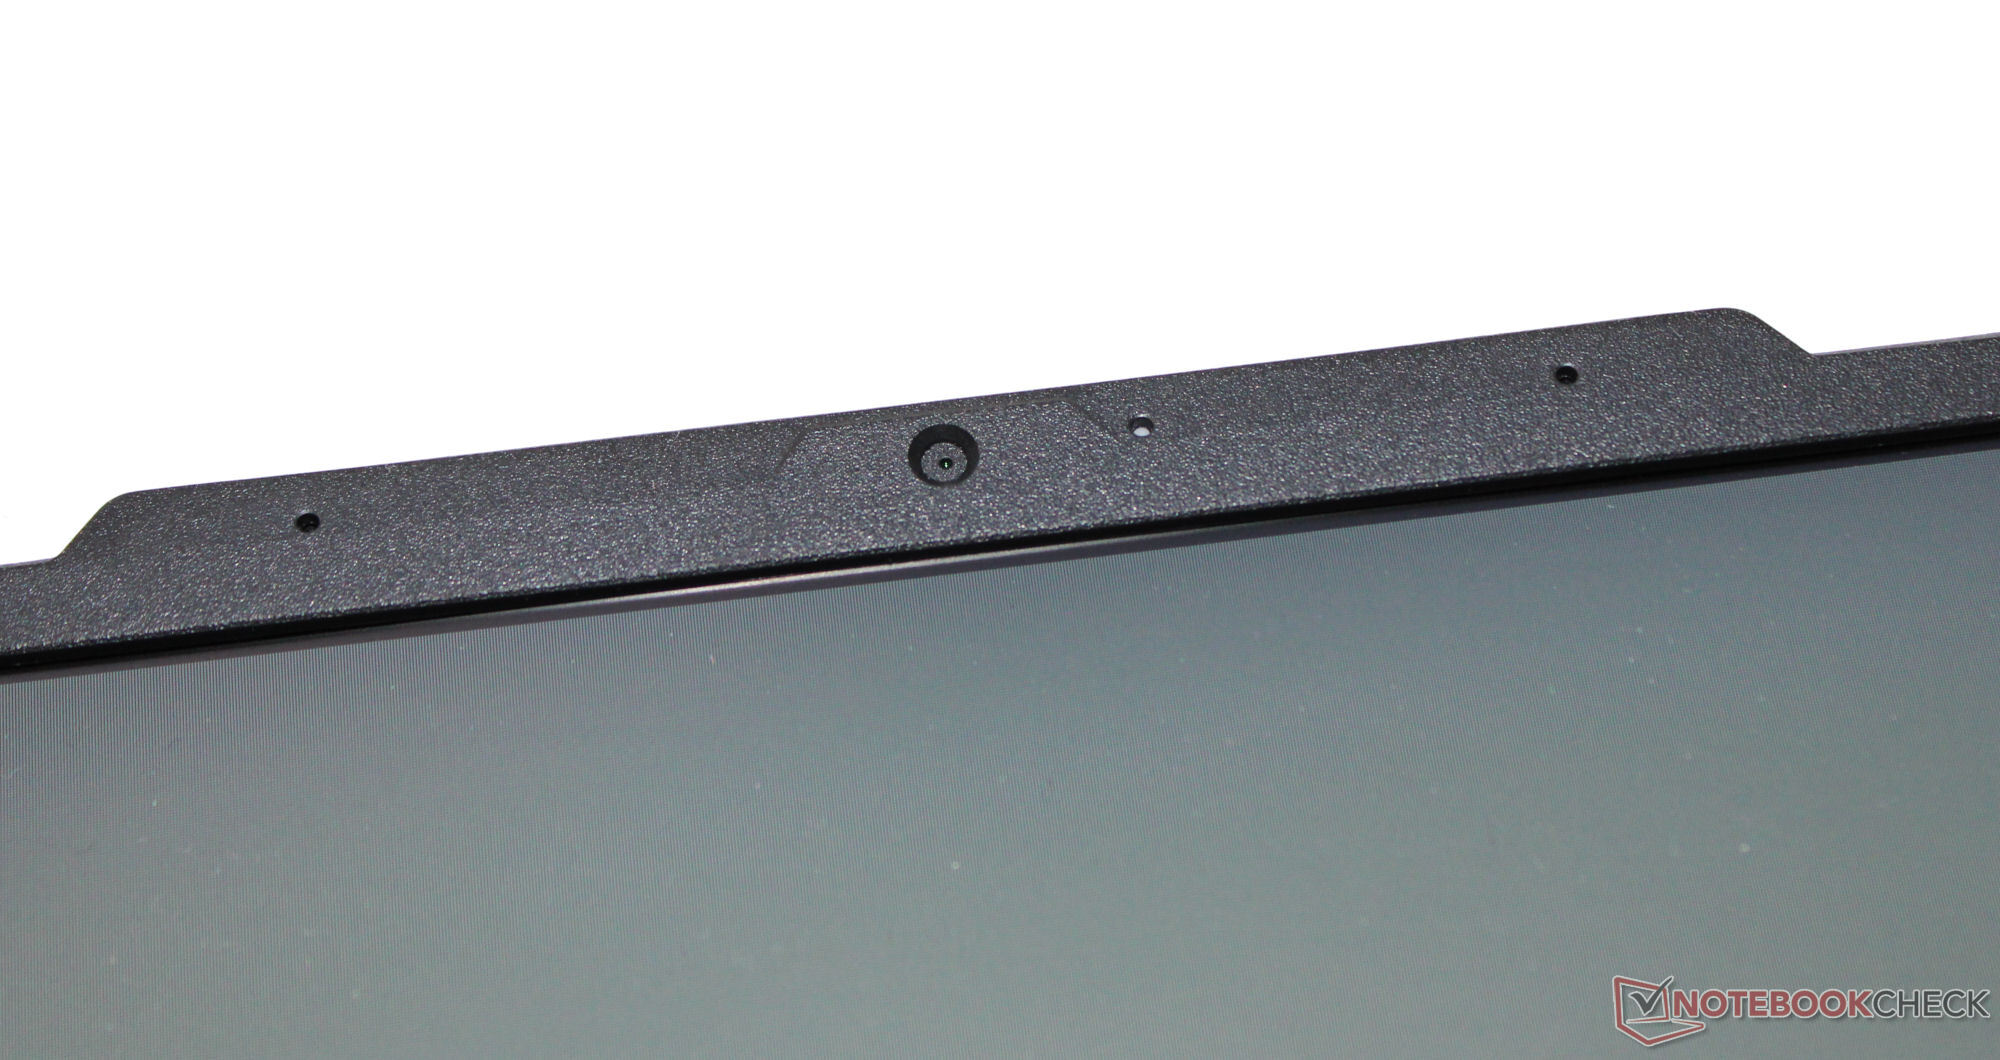
Alors qu'Asus utilise généralement du matériel de haute qualité, la webcam est une exception, avec seulement un maigre modèle de 0,9 Mp (max. 1280x720 pixels) utilisé ici. La qualité de l'image n'est pas convaincante, mais une déviation des couleurs d'environ 8 (DeltaE cible < 3) est tout de même acceptable. L'appareil photo n'est pas équipé d'un obturateur manuel.

 GeForce RTX 4090 Laptop GPU, i9-14900HX, Samsung PM9A1a MZVL22T0HDLB")
 GeForce RTX 4090 Laptop GPU, i9-14900HX, Samsung PM9A1a MZVL22T0HDLB")
Accessoires
L'ordinateur portable n'est pas accompagné d'accessoires supplémentaires en plus des documents habituels.
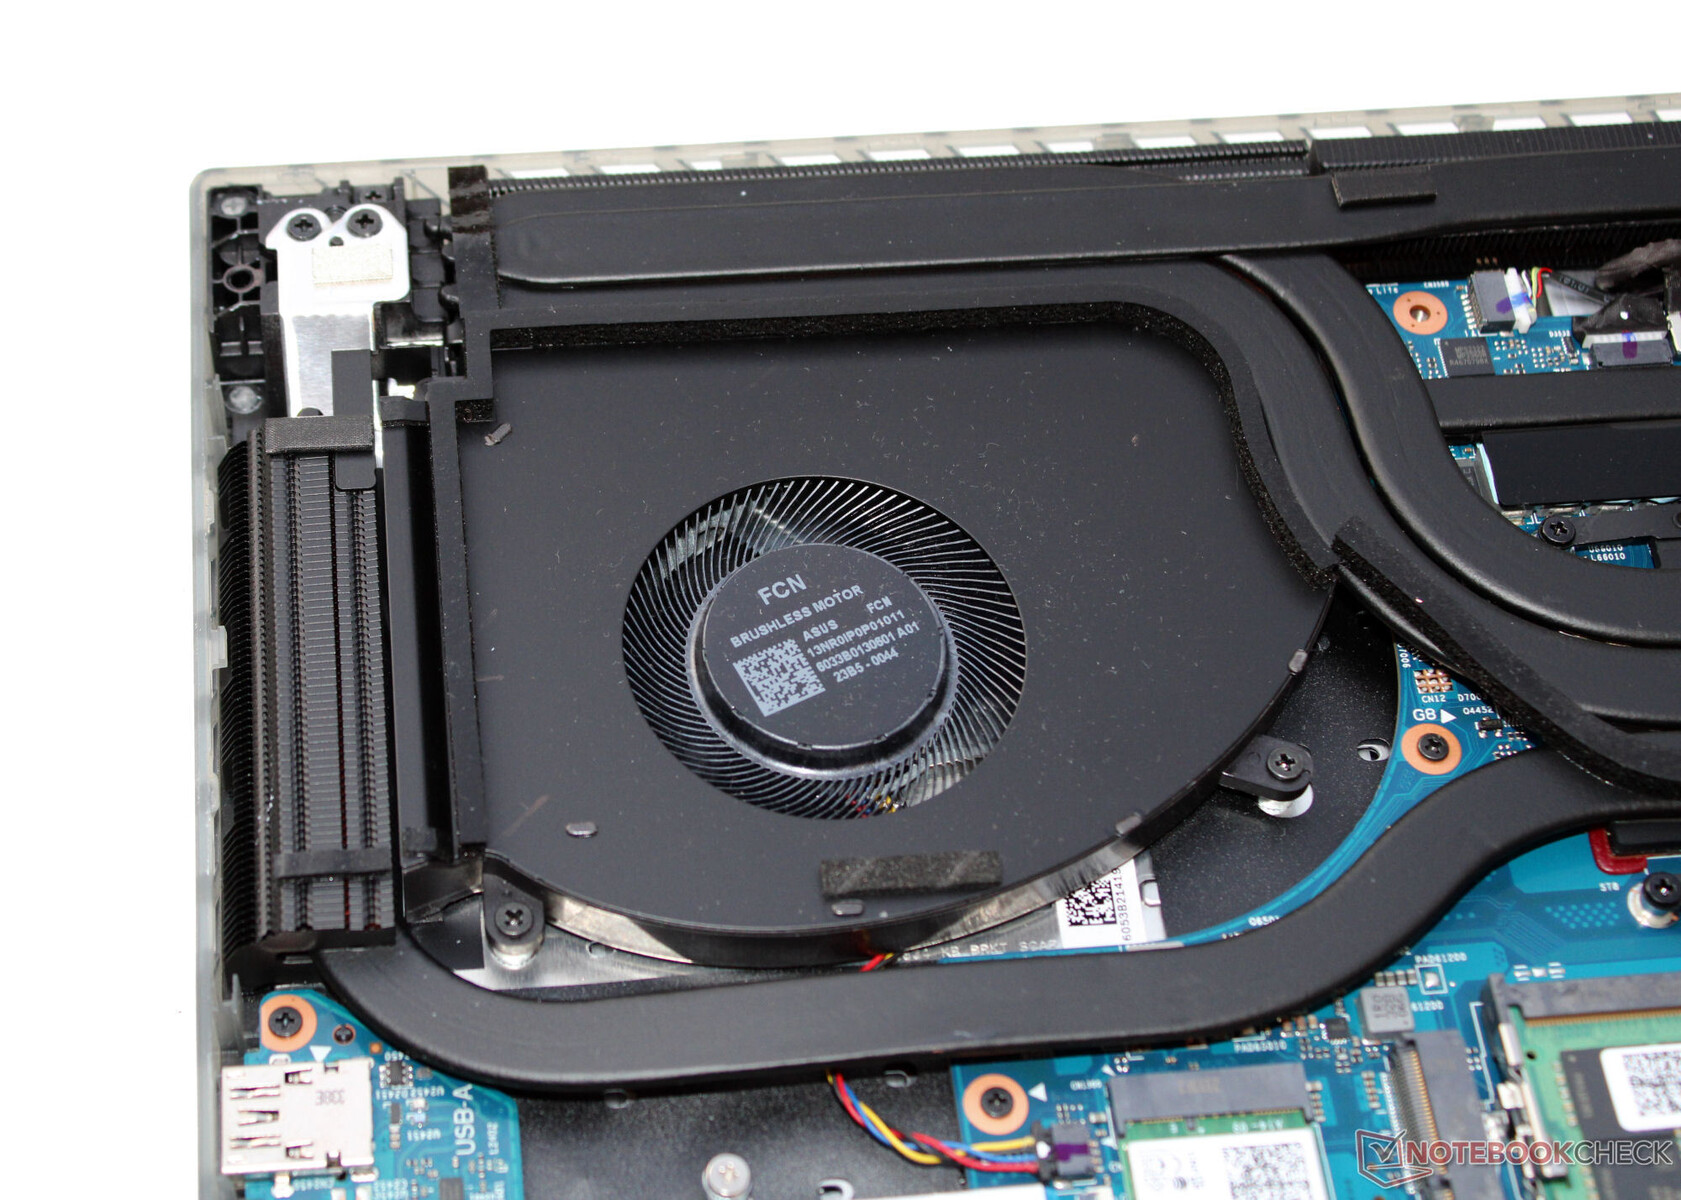
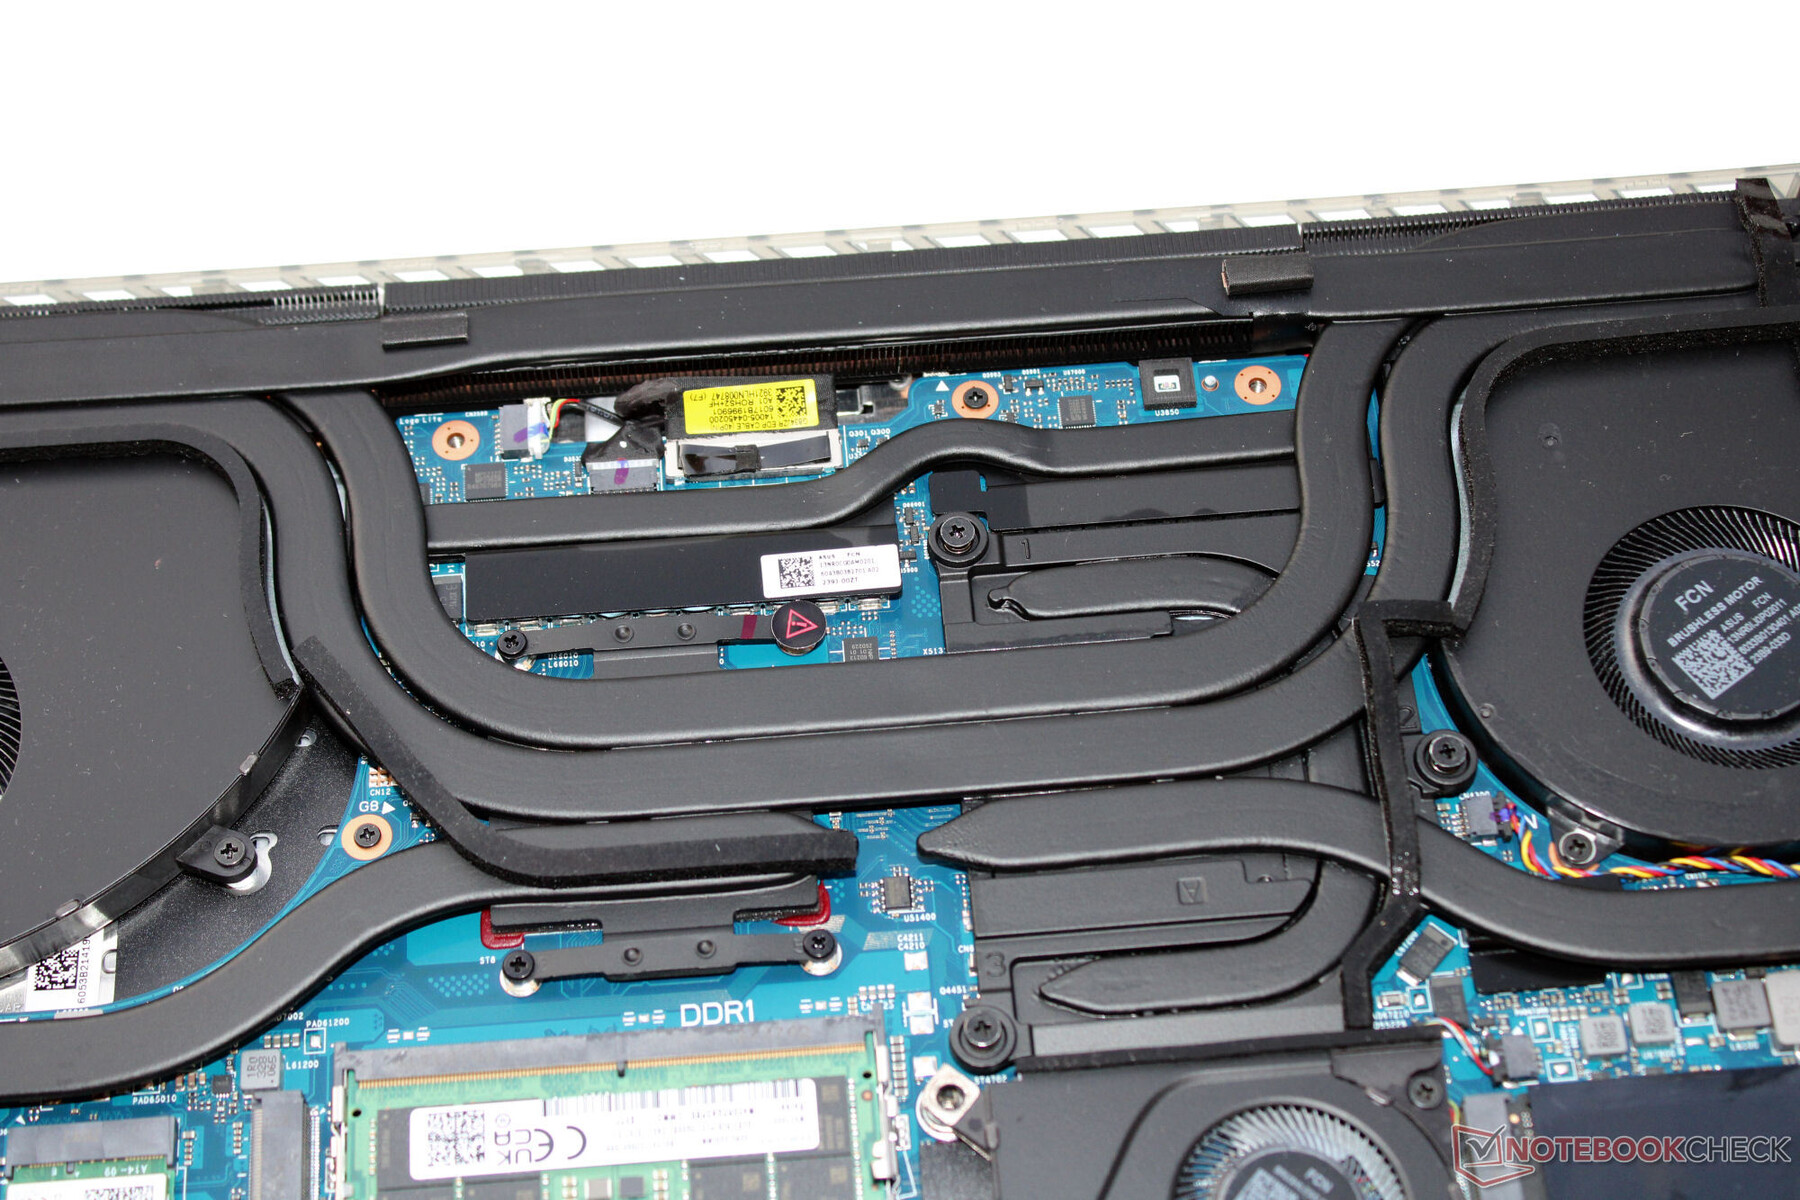
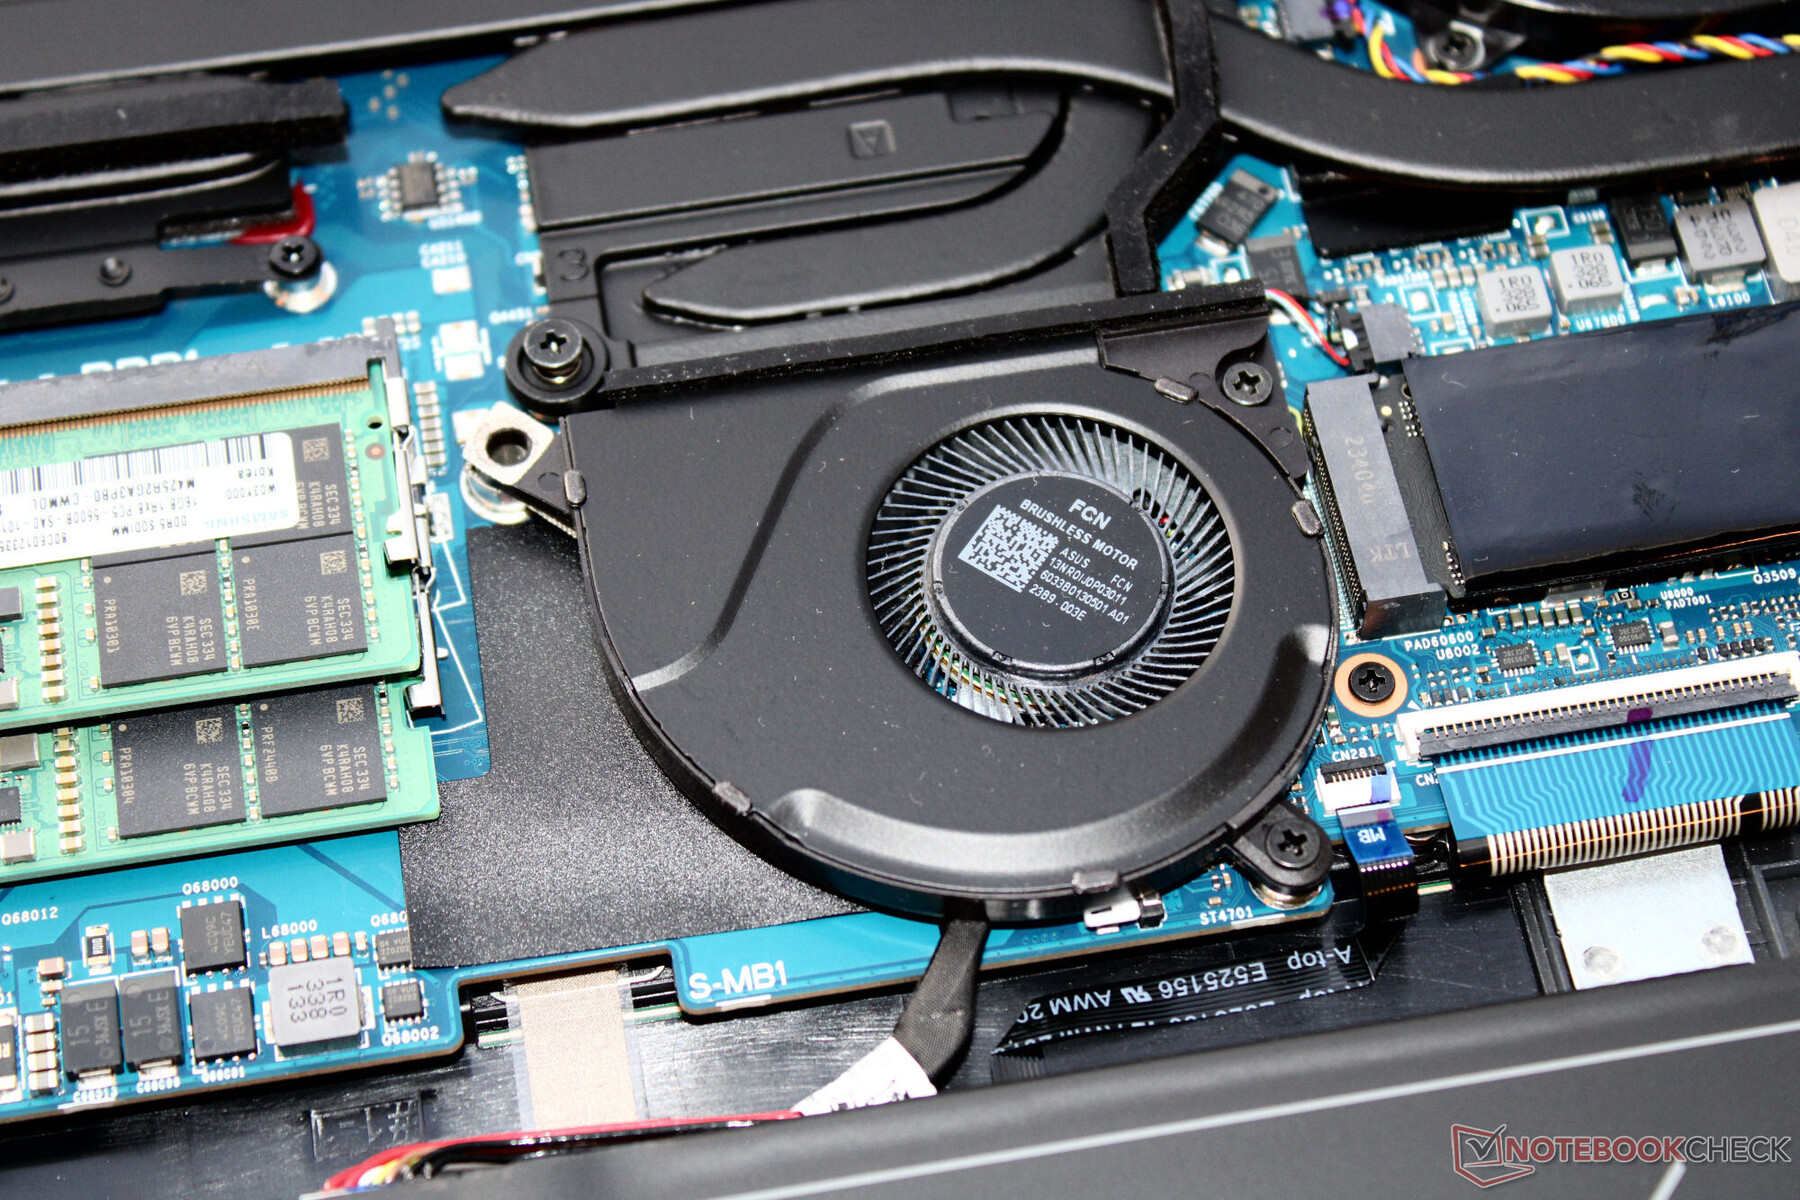
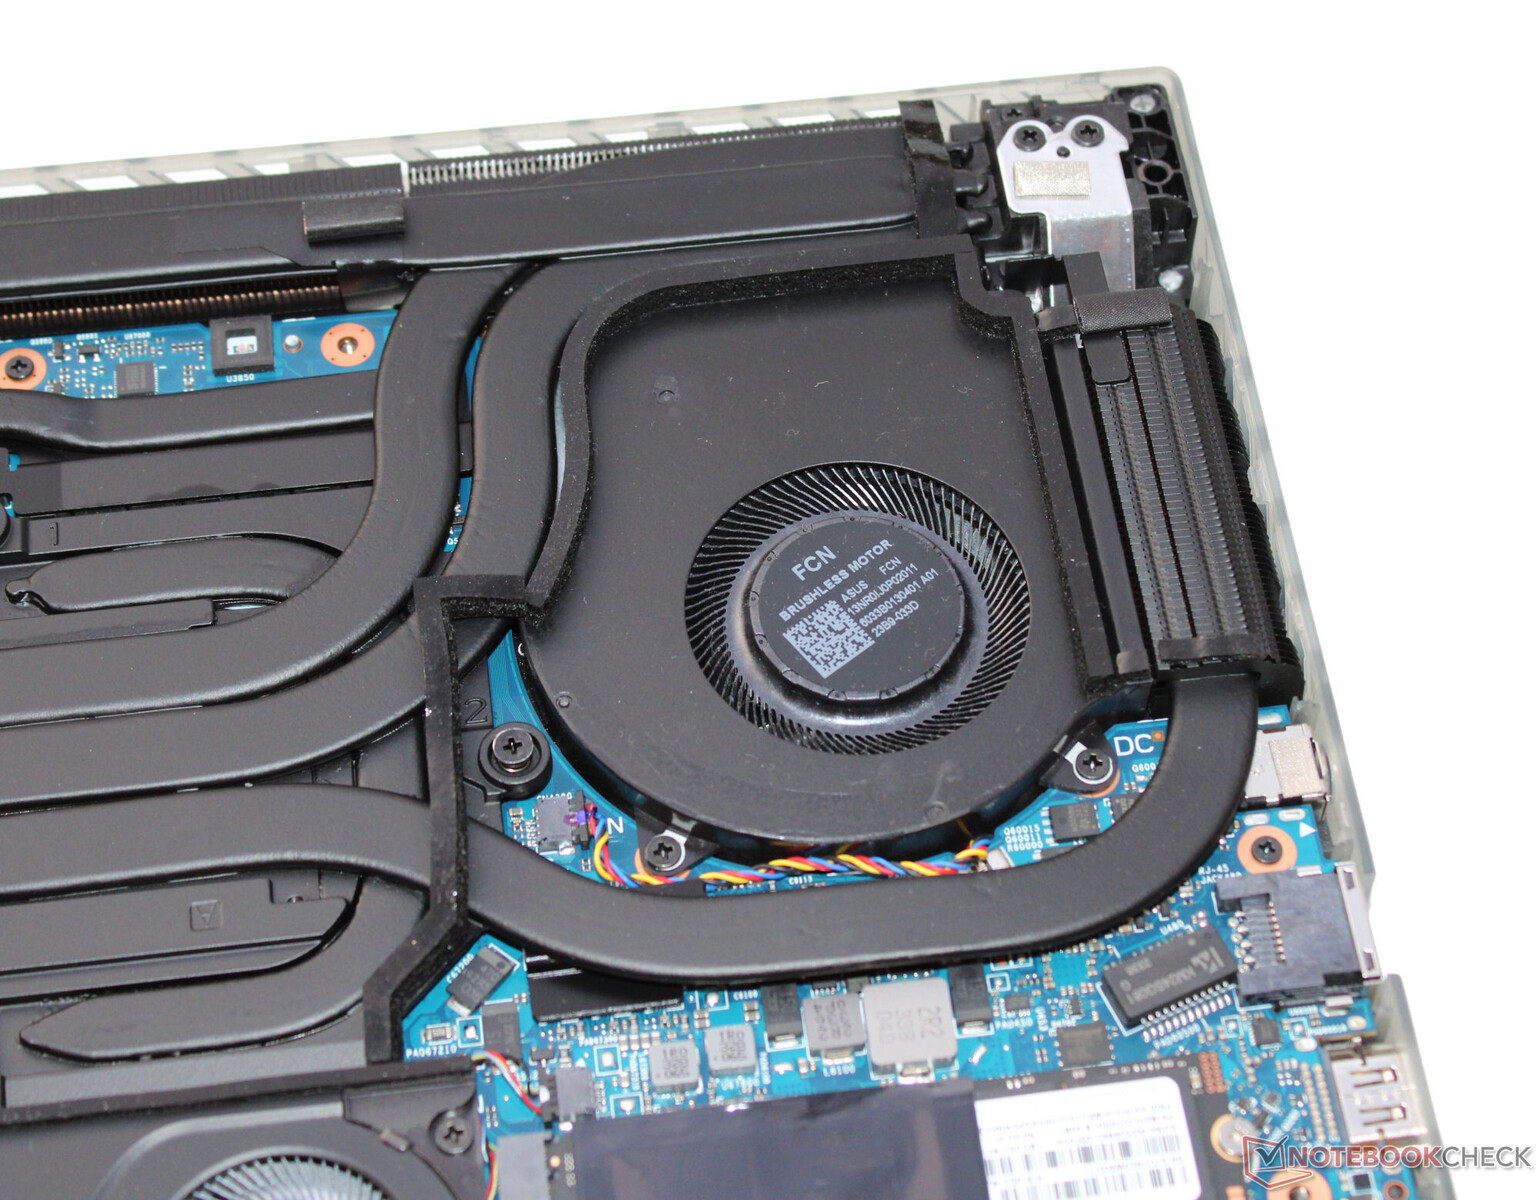
Maintenance
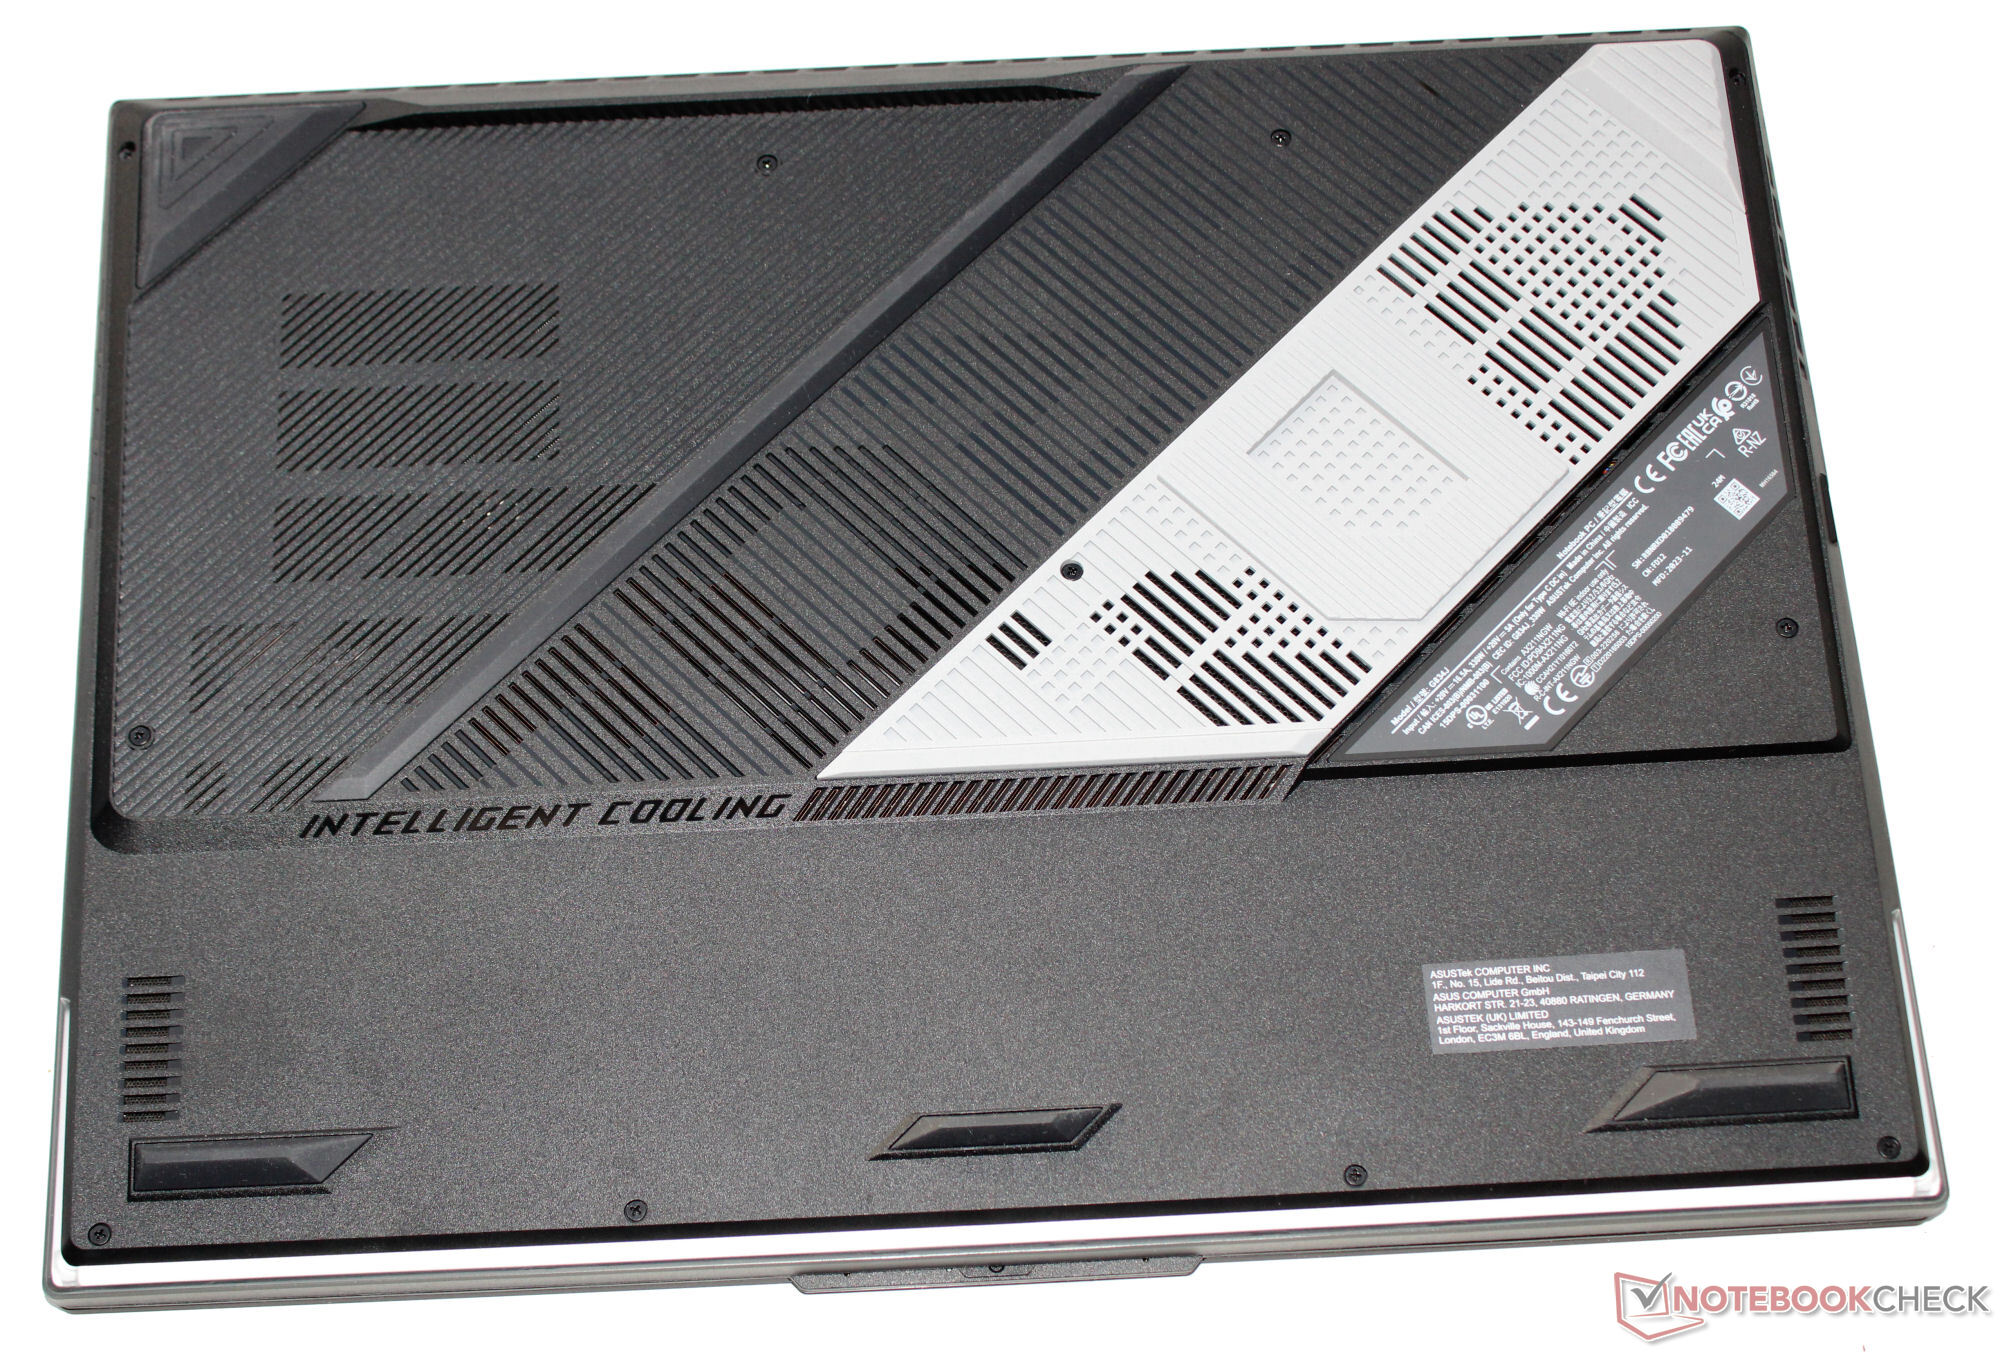
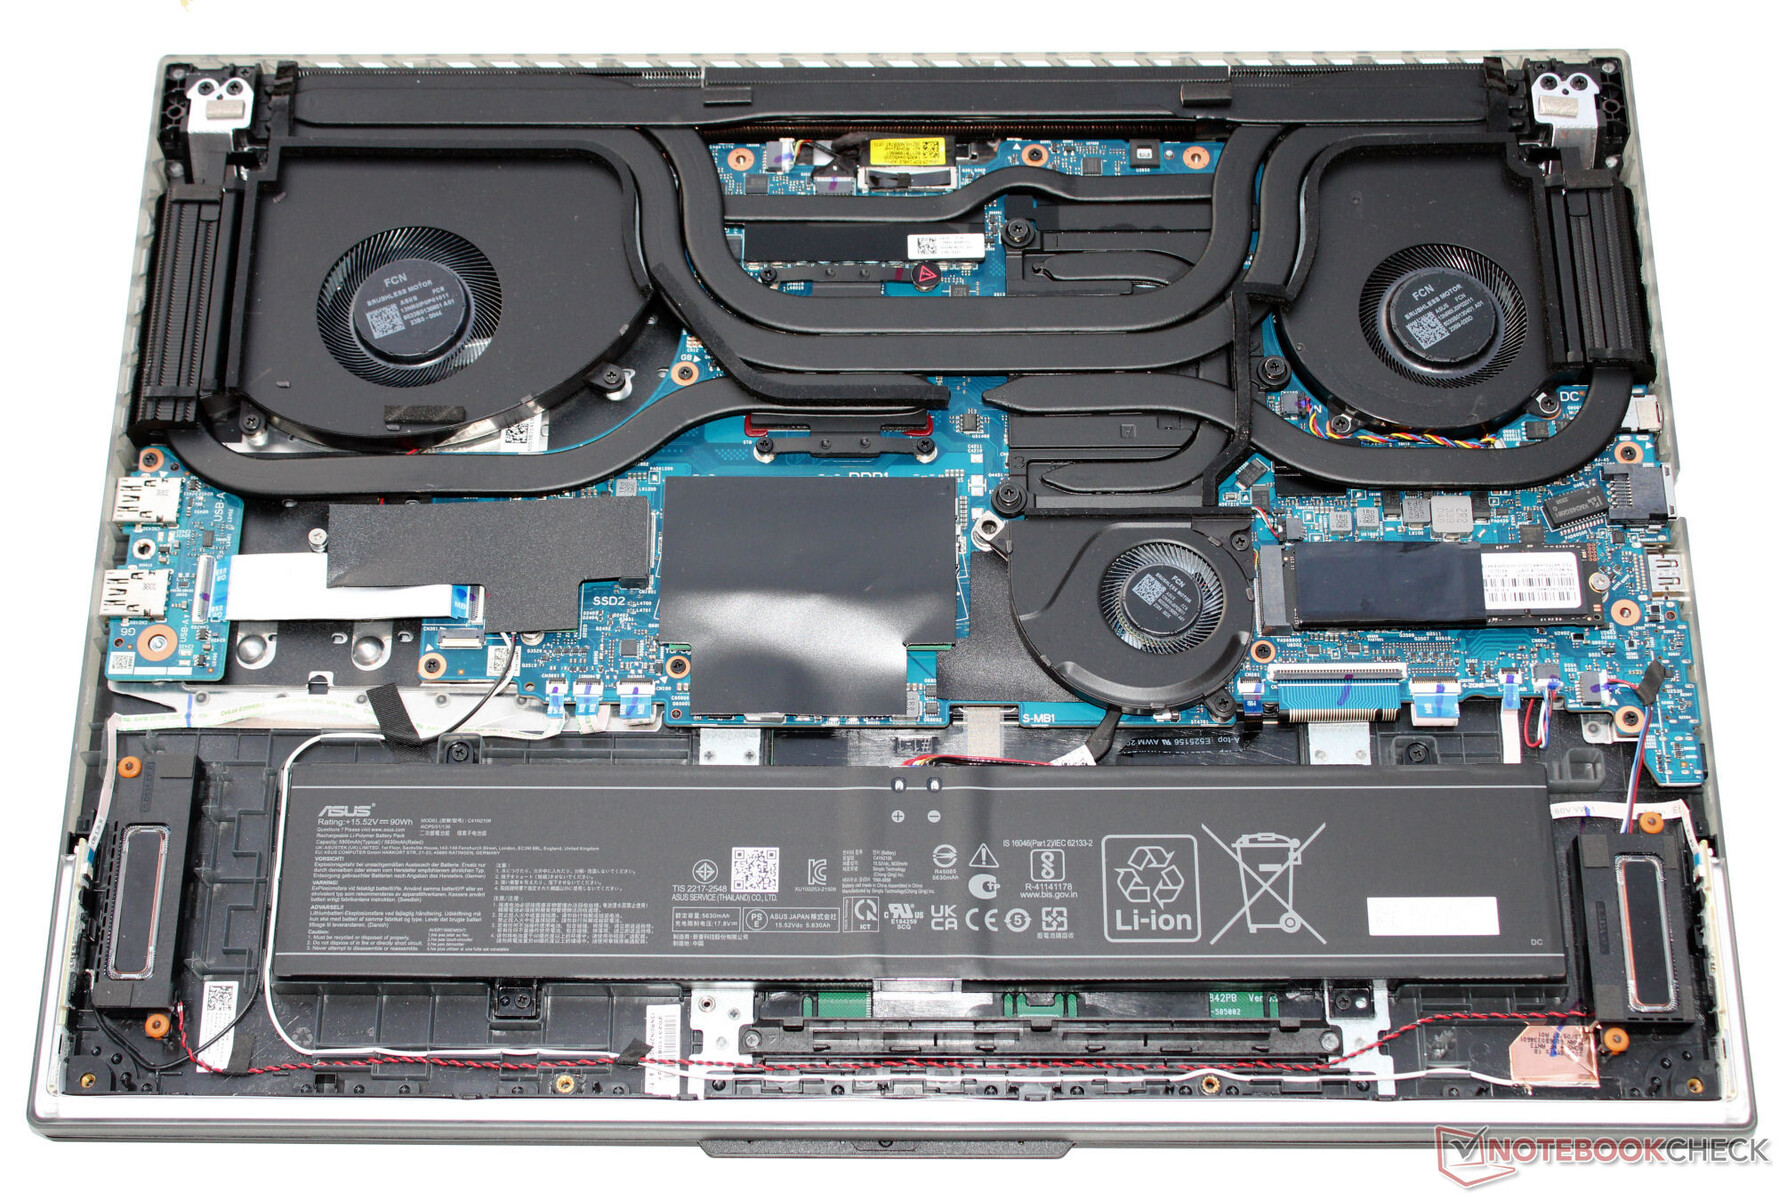
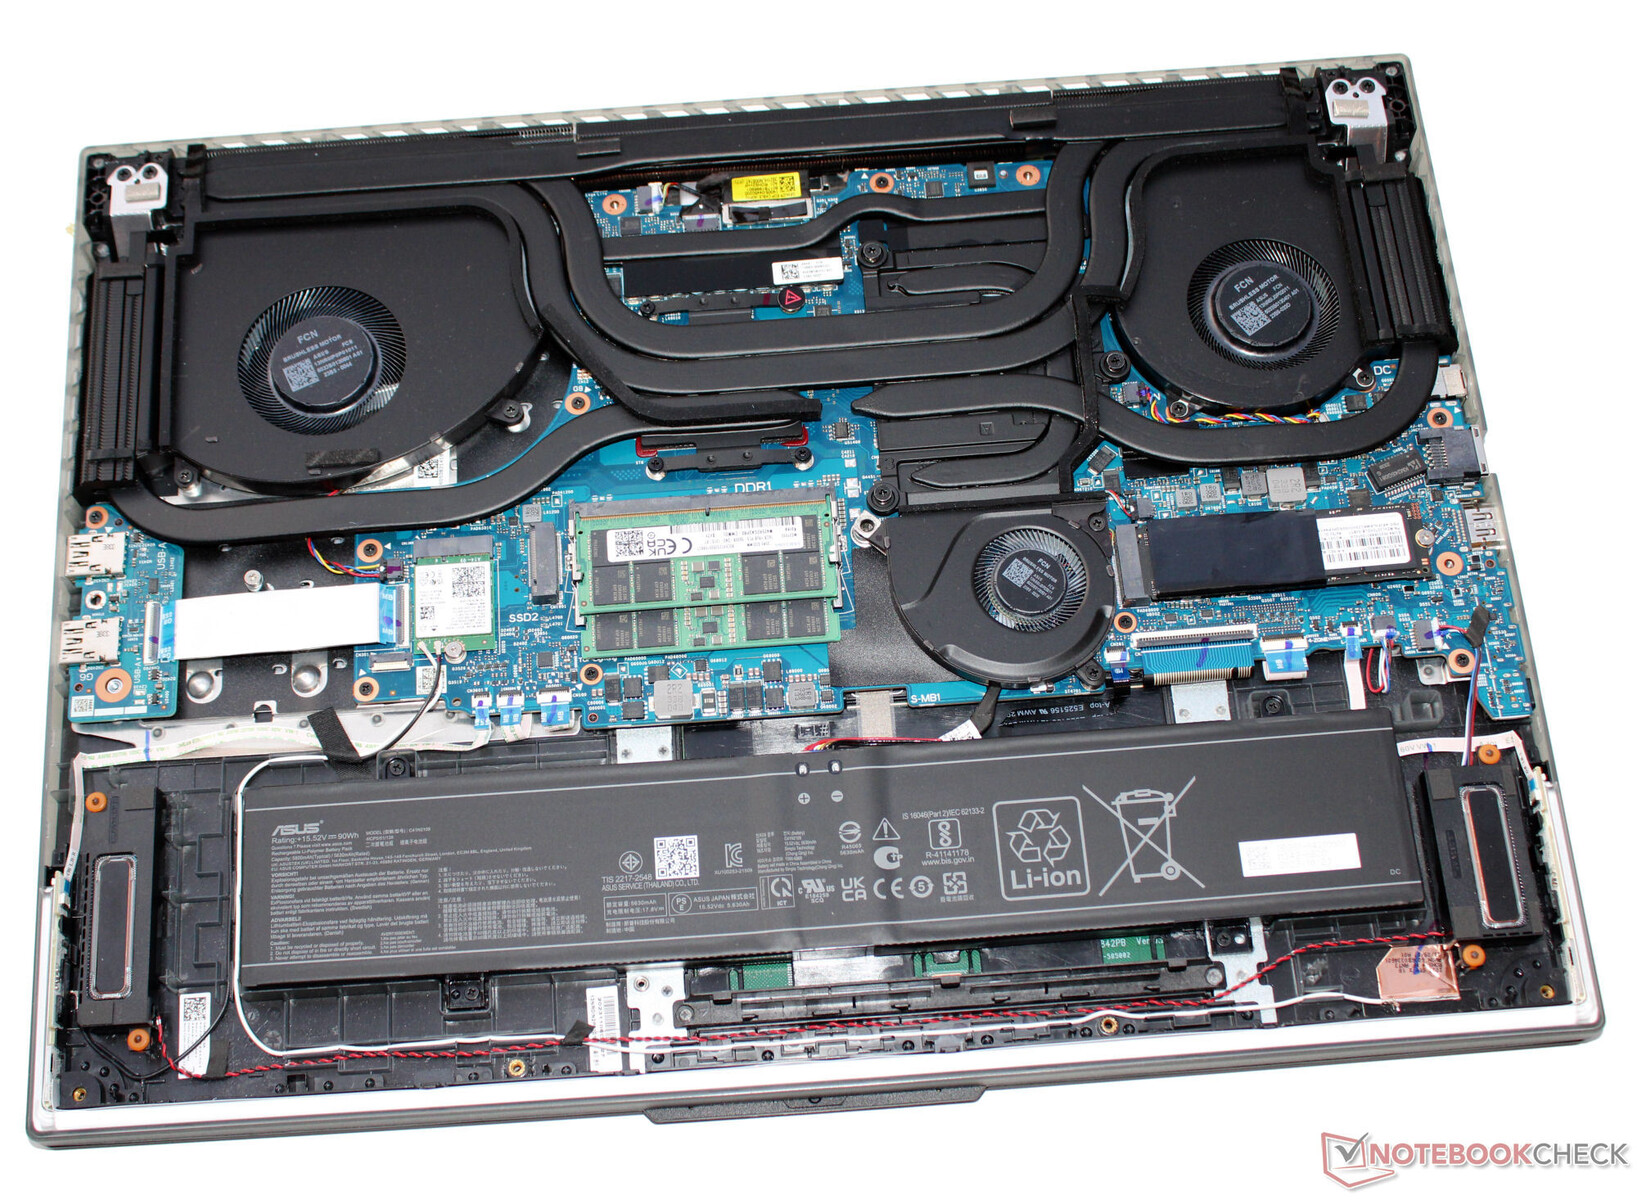
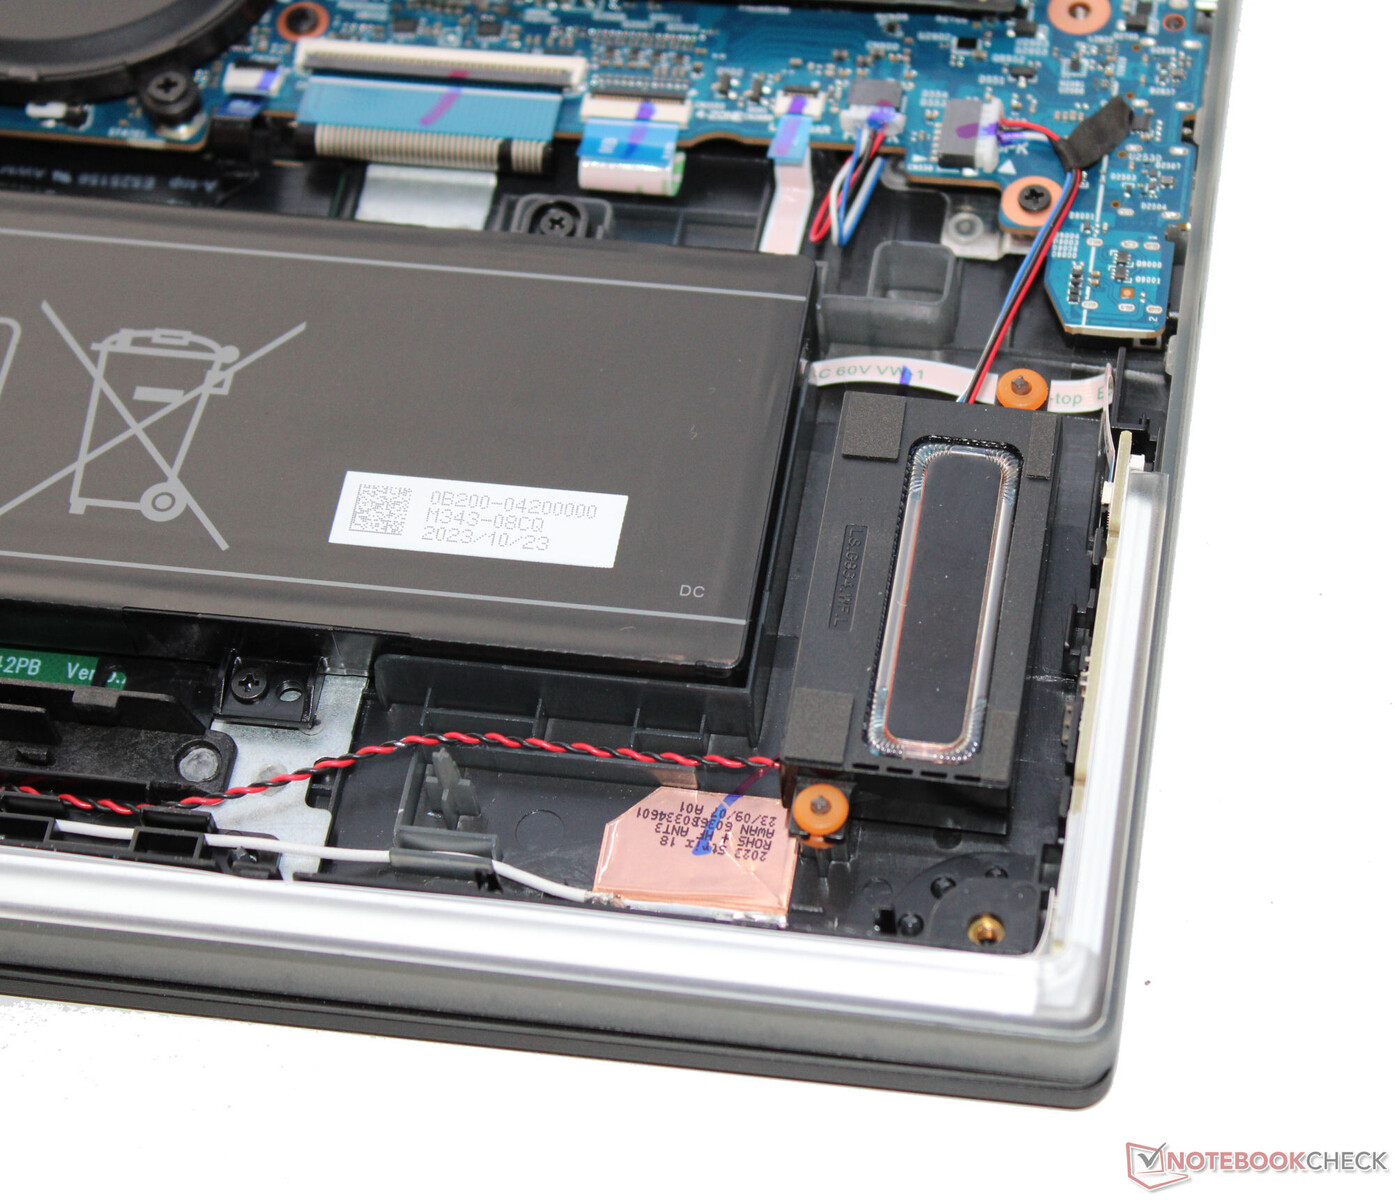
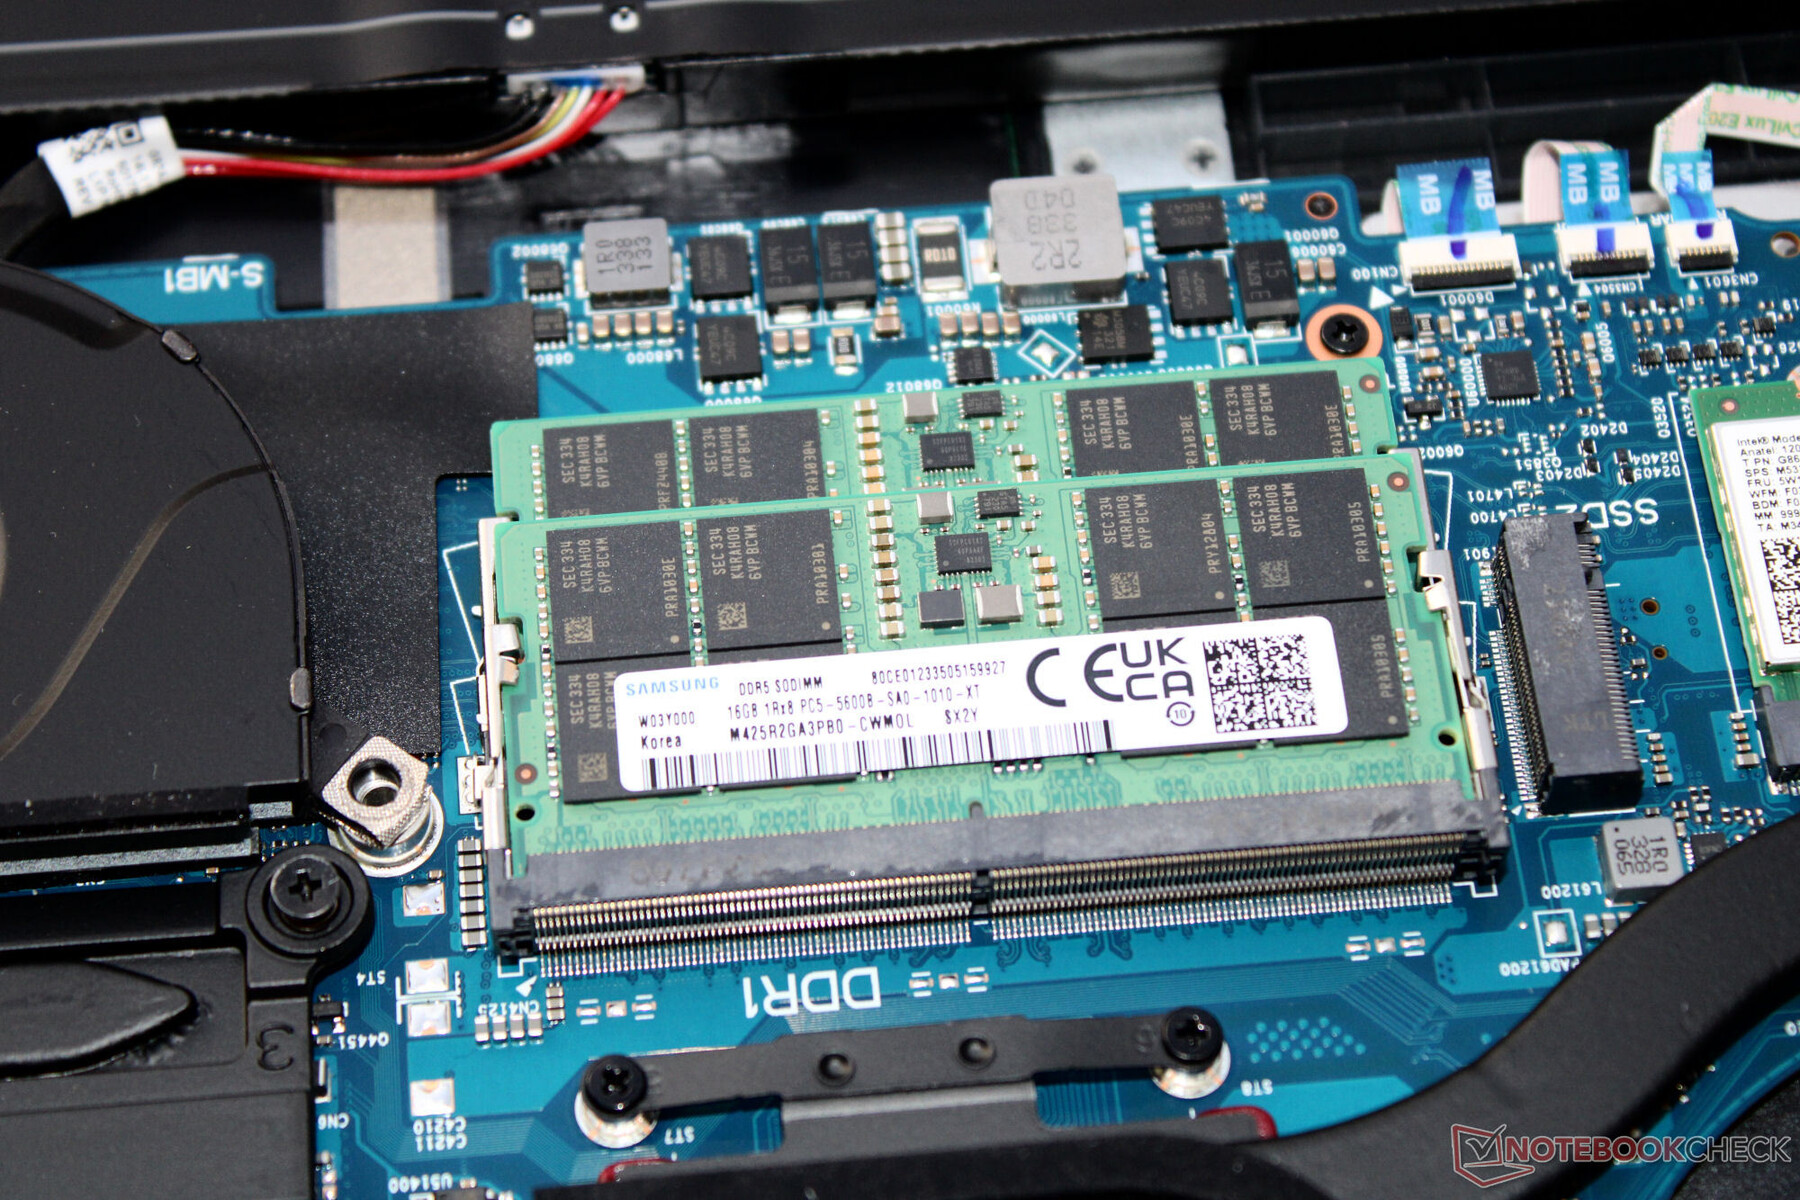
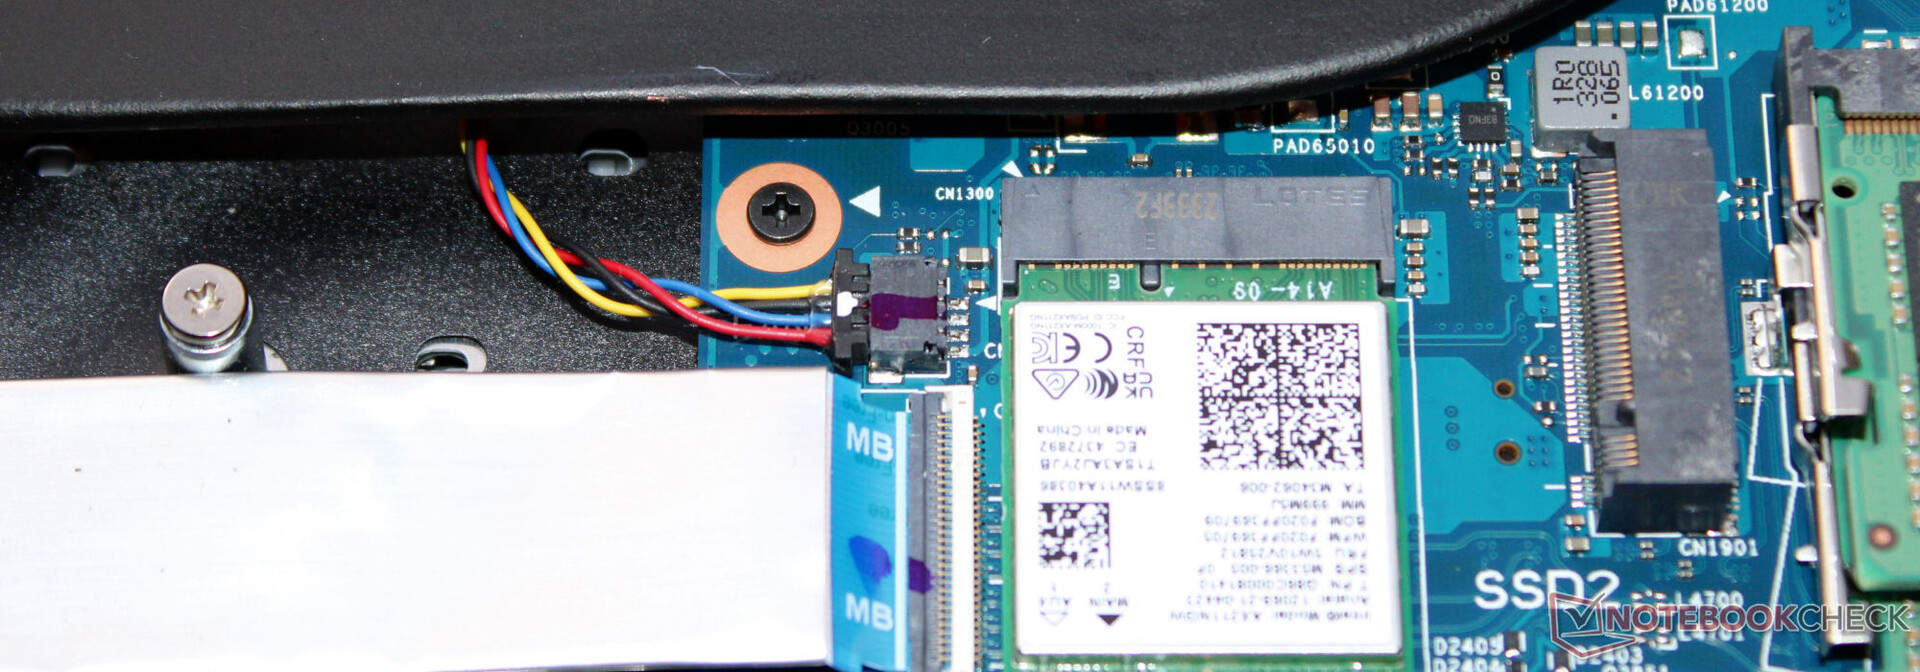
Pour ouvrir l'ordinateur portable, vous devez retirer toutes les vis situées sur le fond du boîtier. Vous pouvez ensuite soulever la plaque du boîtier à l'aide d'un outil de levage. Après avoir retiré la plaque du boîtier, vous avez accès aux banques de stockage (occupées), au SSD (PCIe 4, M.2-2280), au deuxième emplacement SSD (PCIe 4, M.2-2280), au module WLAN, à la batterie BIOS, aux ventilateurs et à la batterie (vissée, non collée).
Le clavier ne peut pas être remplacé facilement. Pour ce faire, vous devez remplacer toute la partie supérieure de la base, ce qui nécessite de démonter complètement l'ordinateur portable.
Garantie
Asus offre une garantie de deux ans pour cet ordinateur portable de 18 pouces en Allemagne. Une extension de garantie à trois ans coûterait environ 200 euros (~215 $).
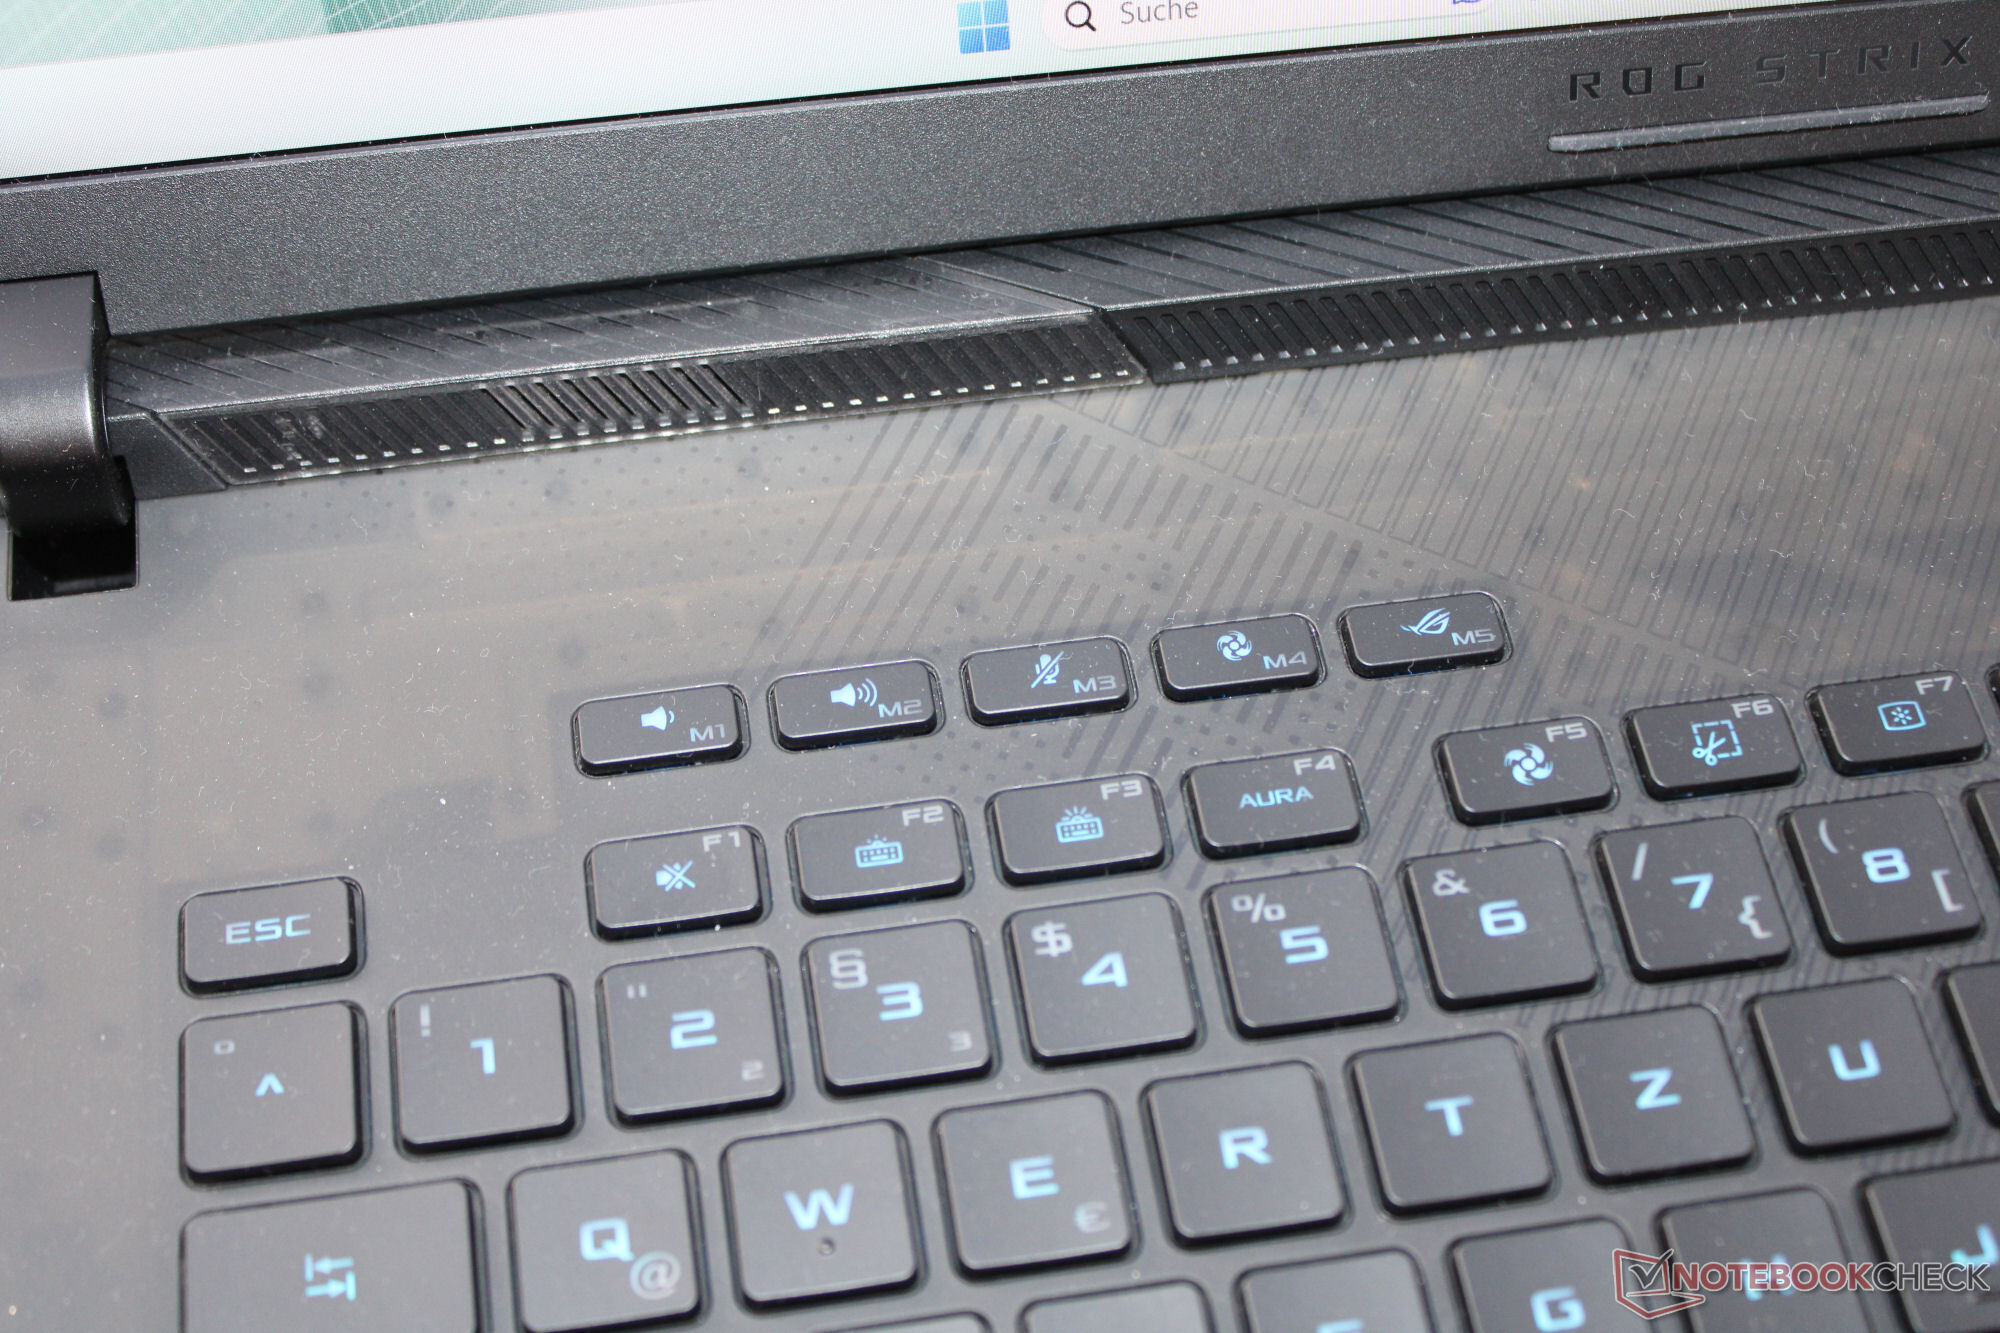
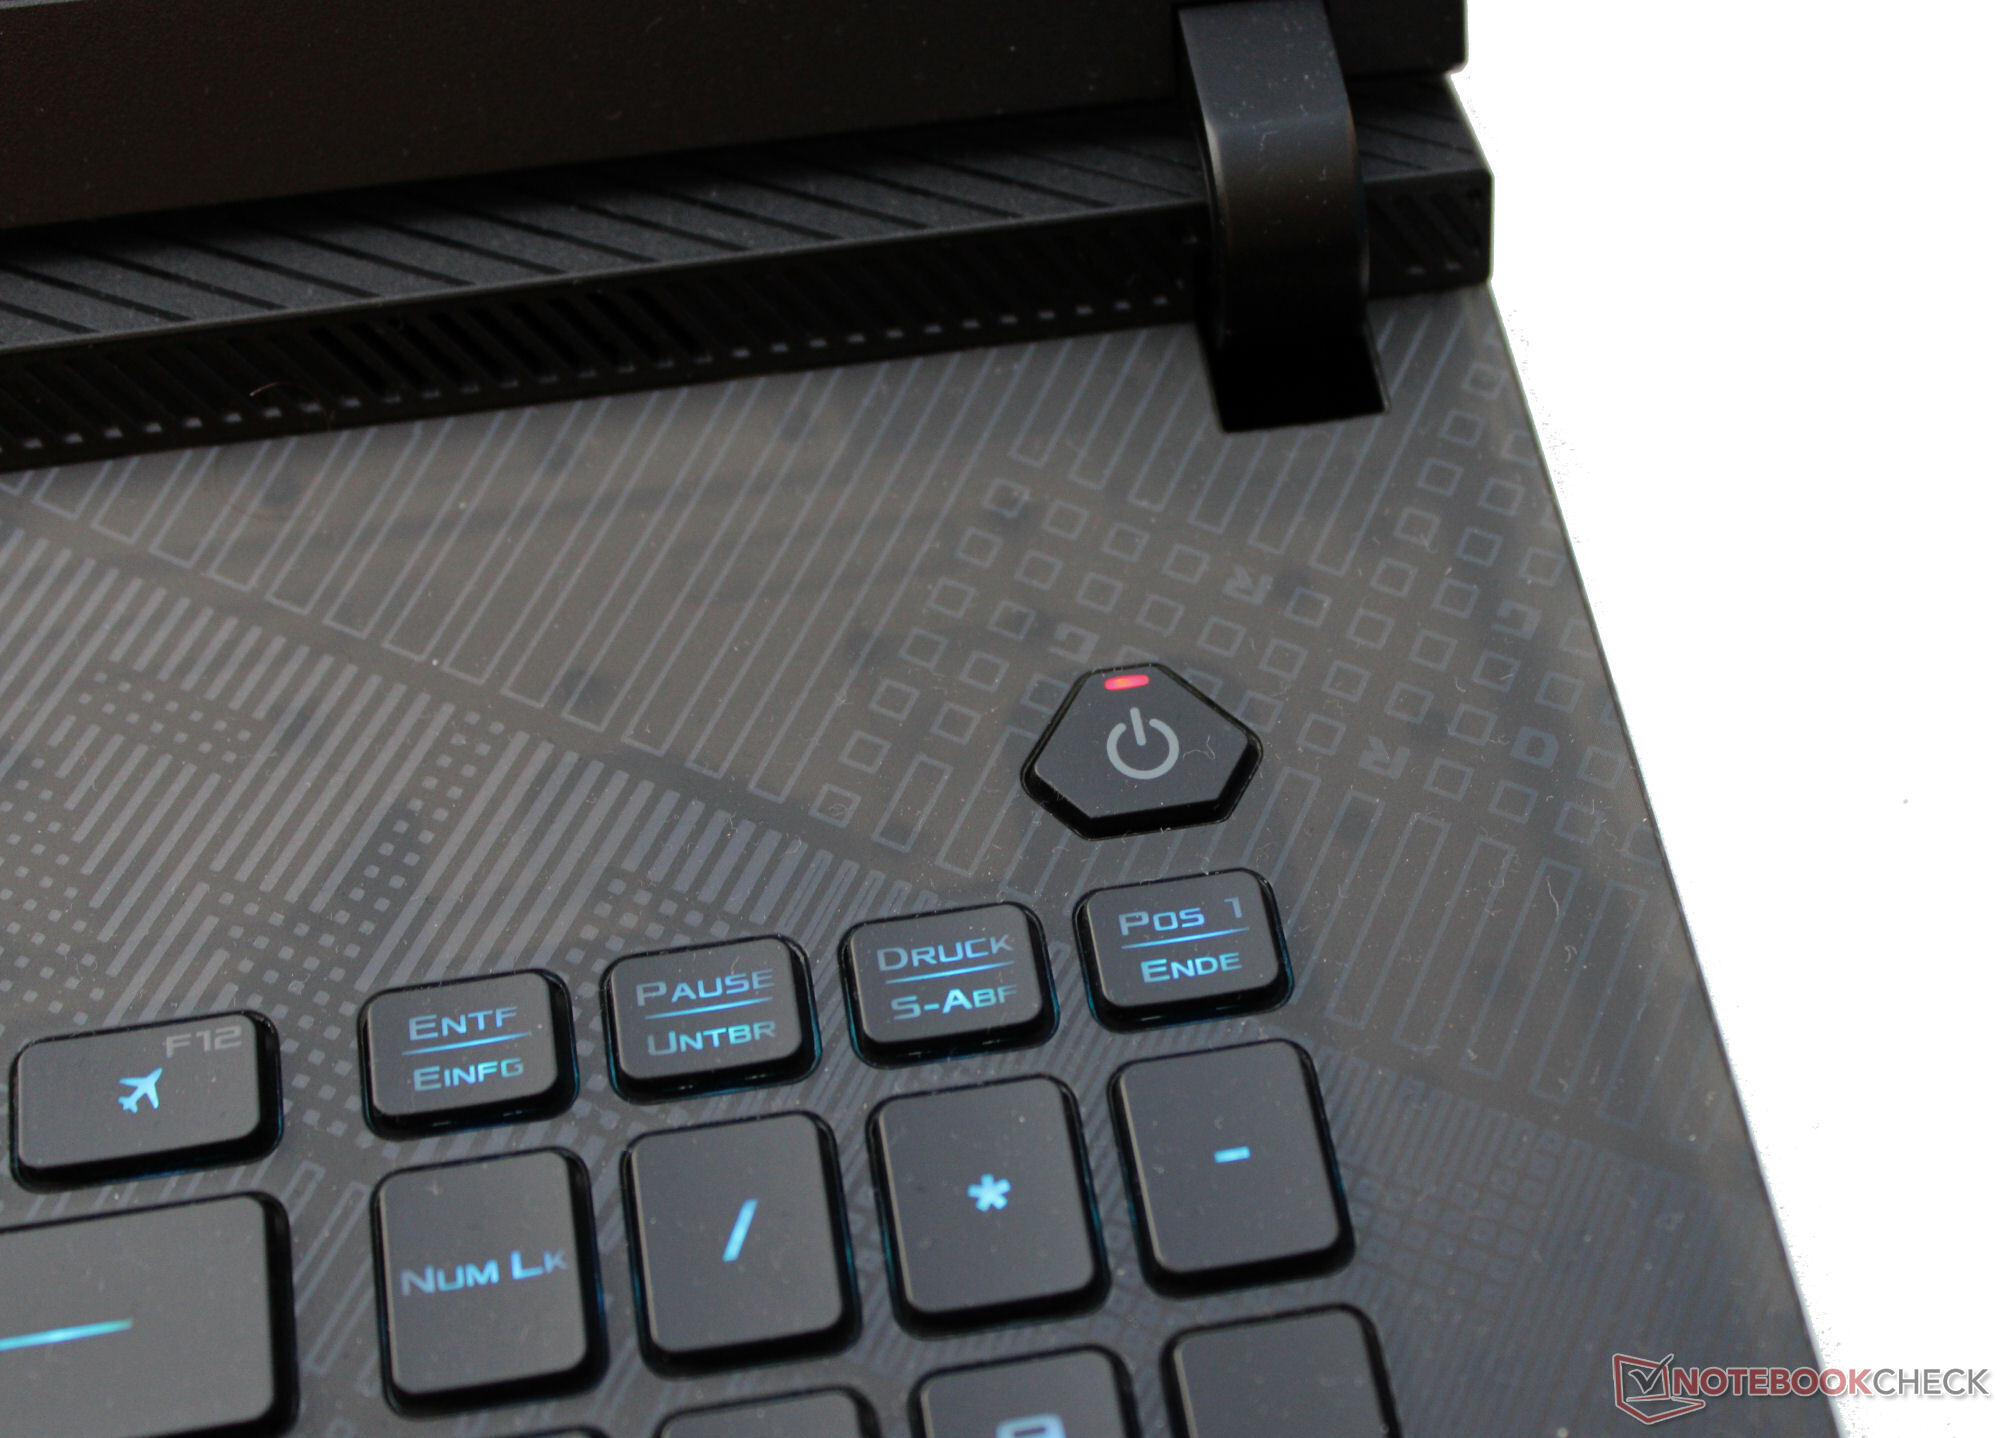
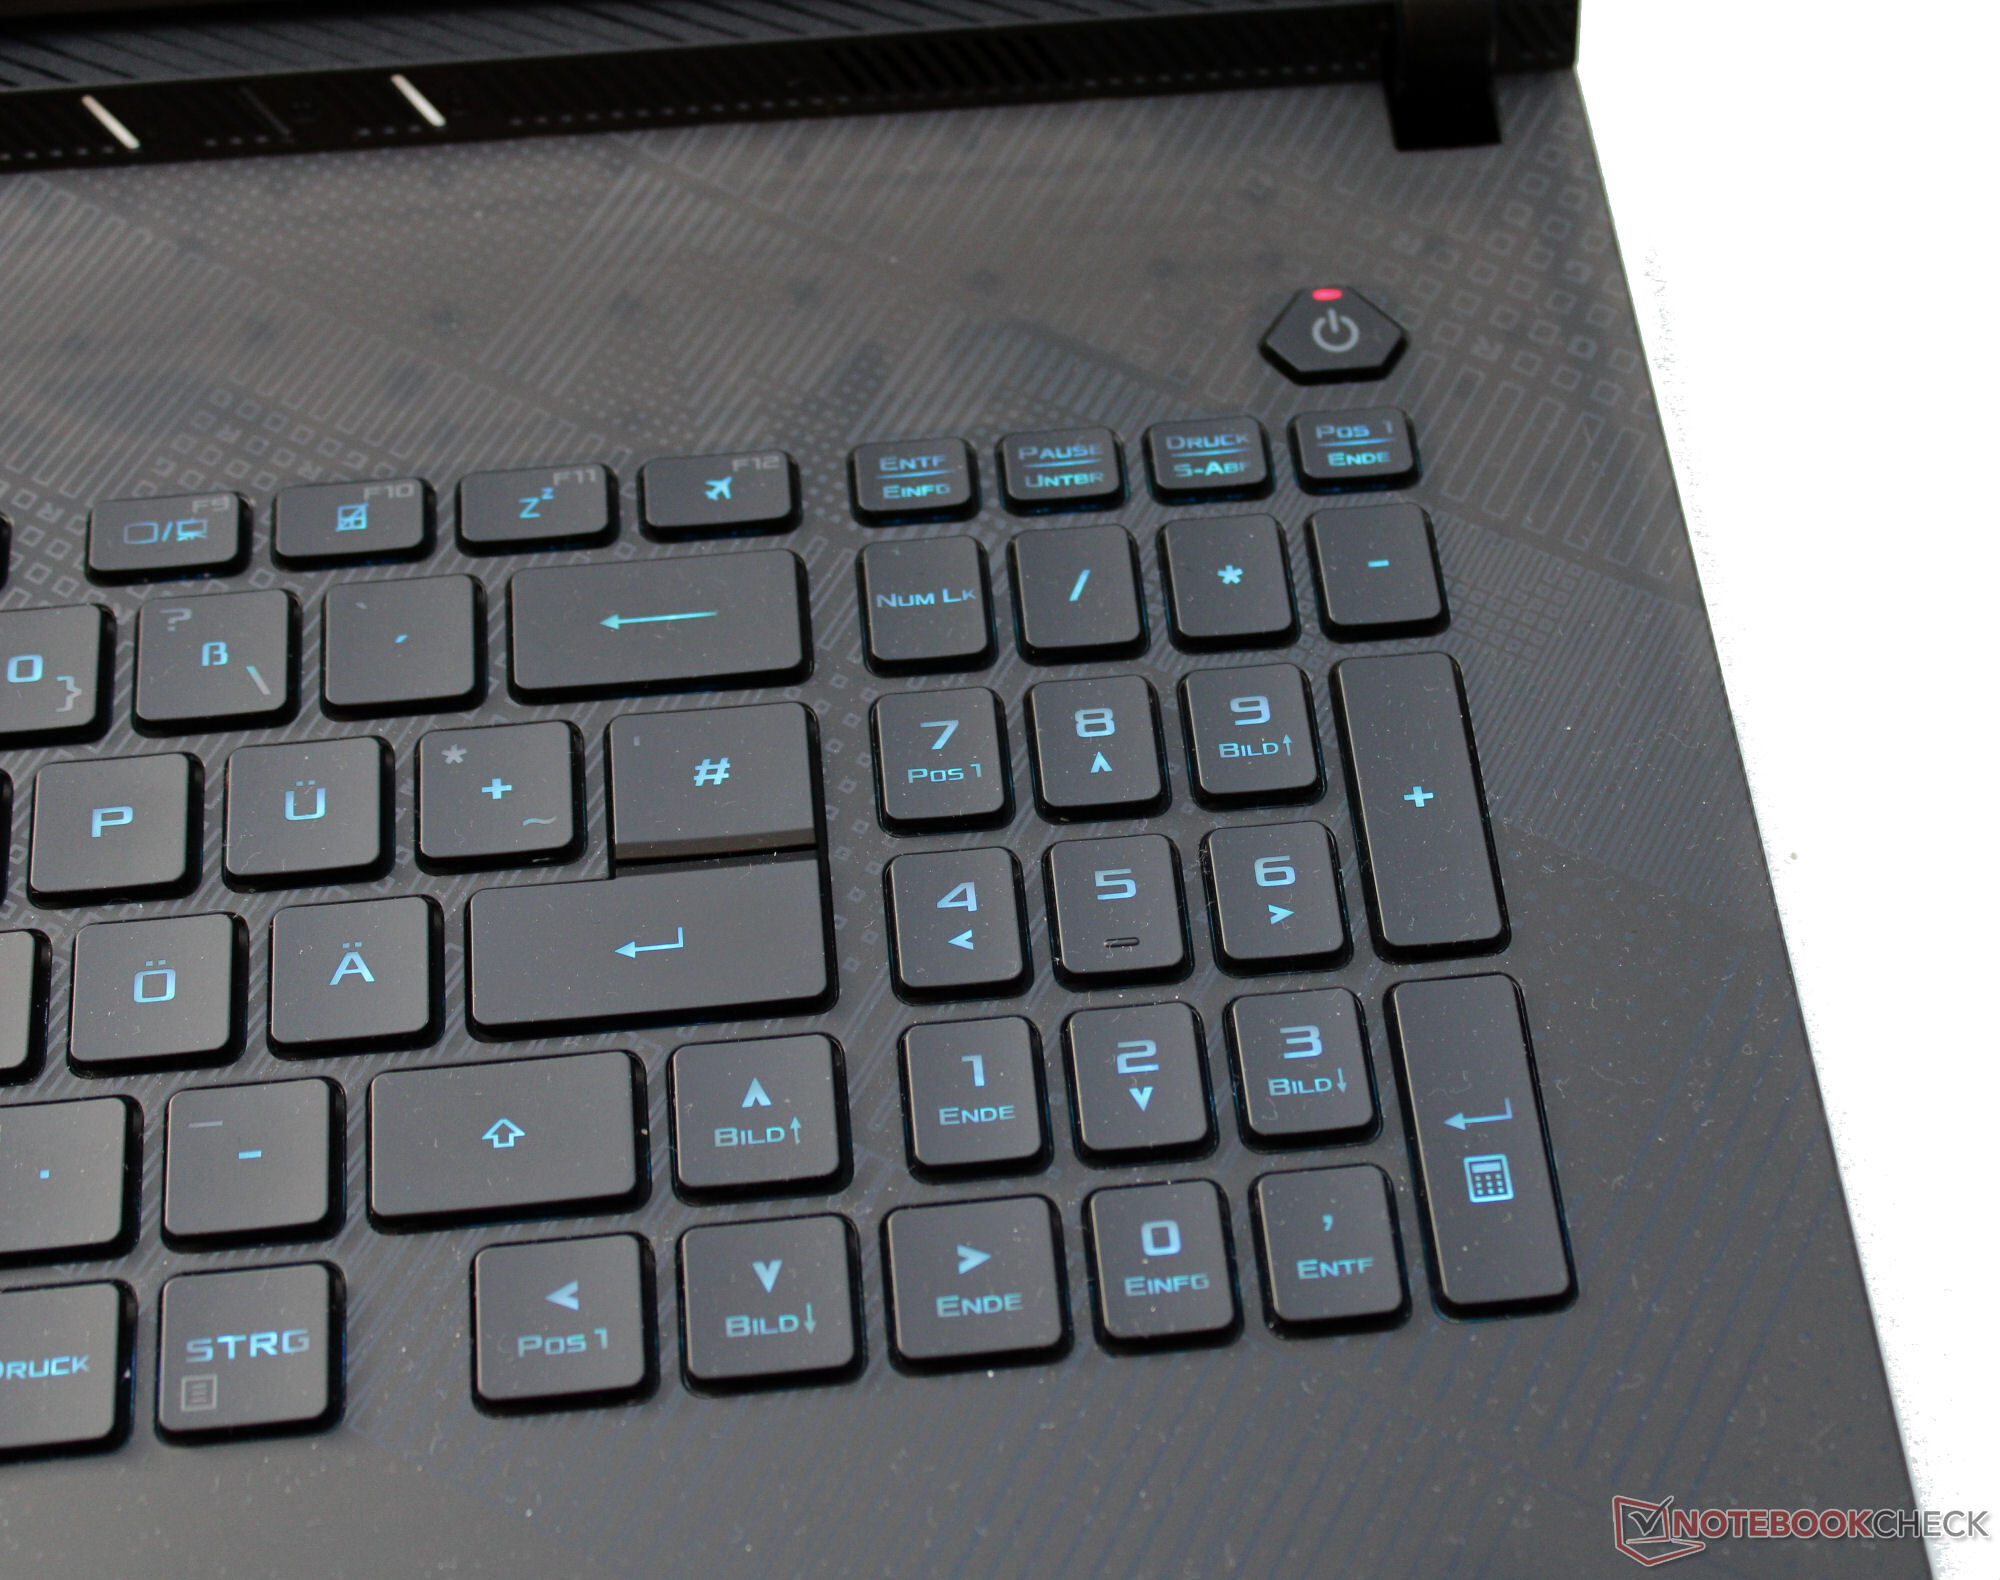
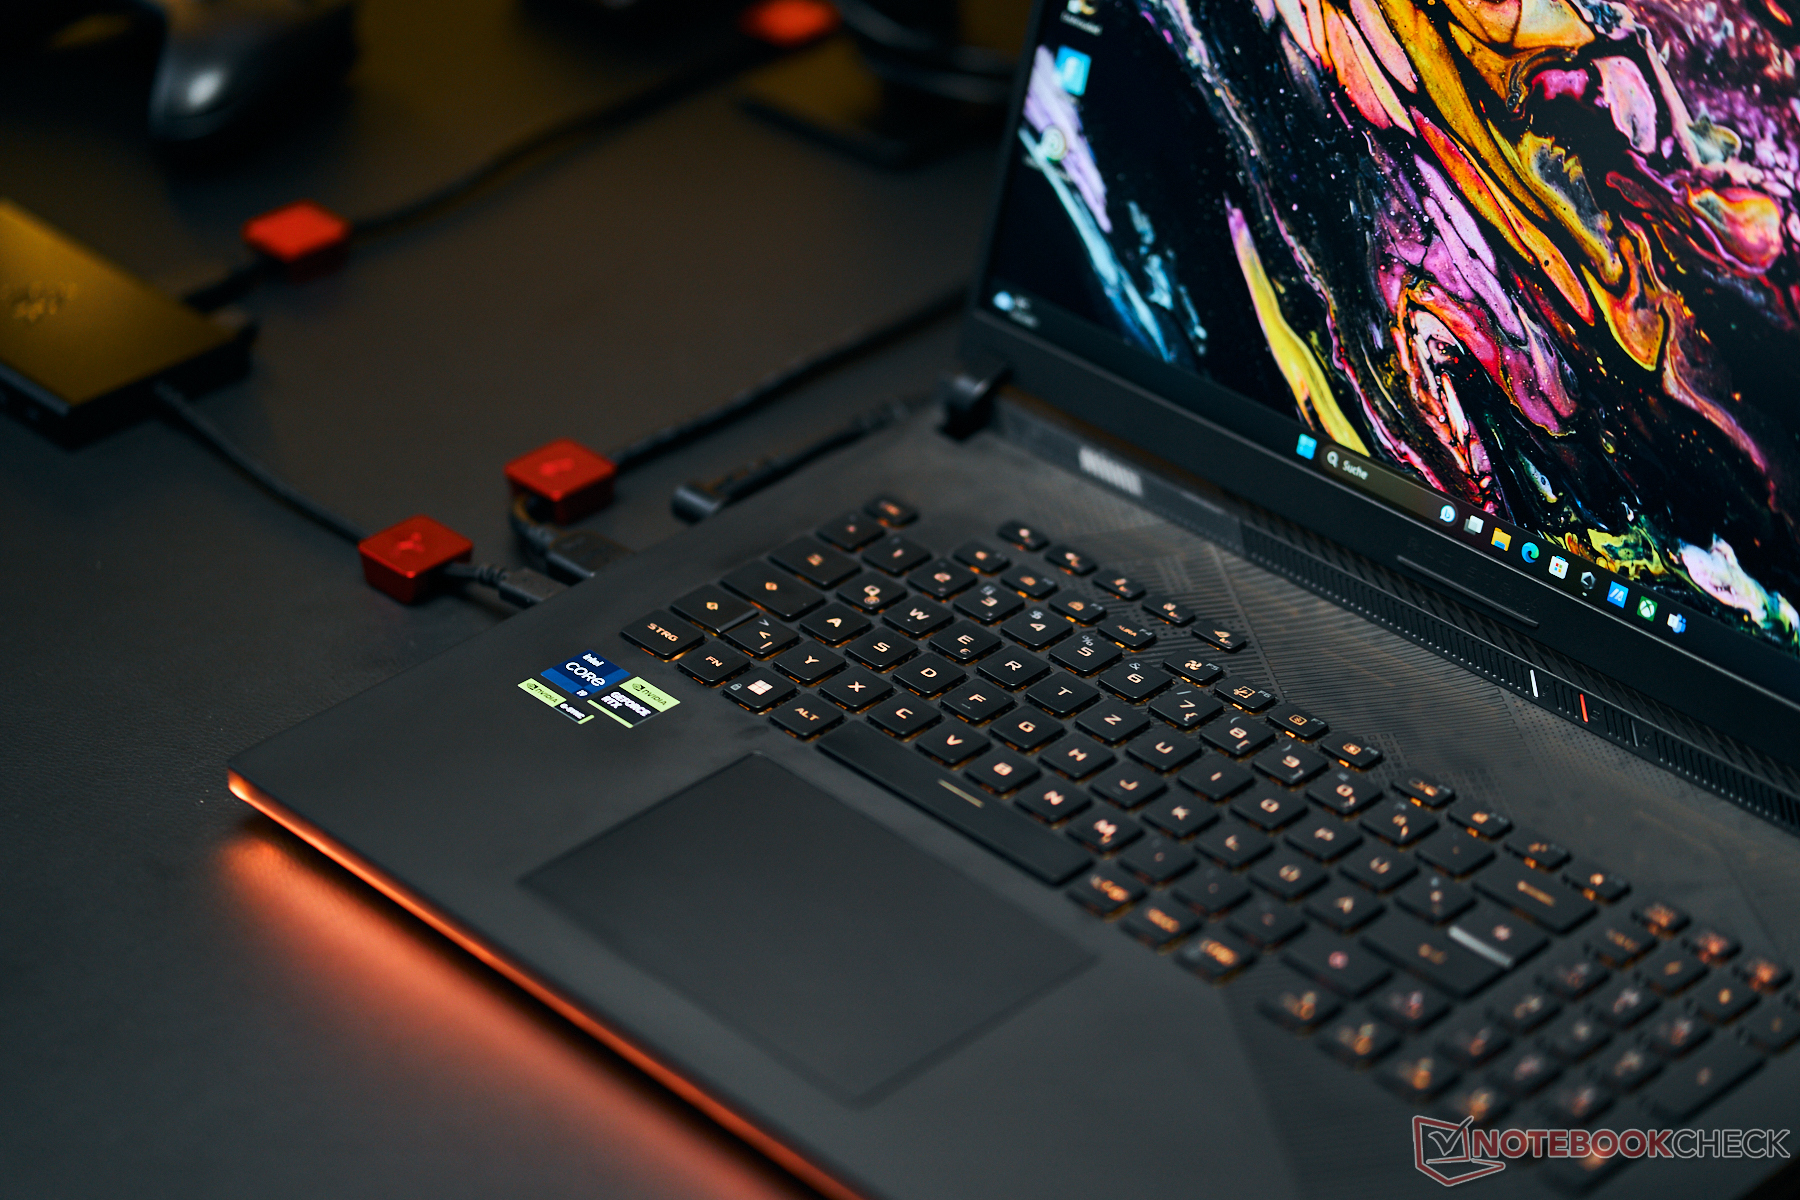
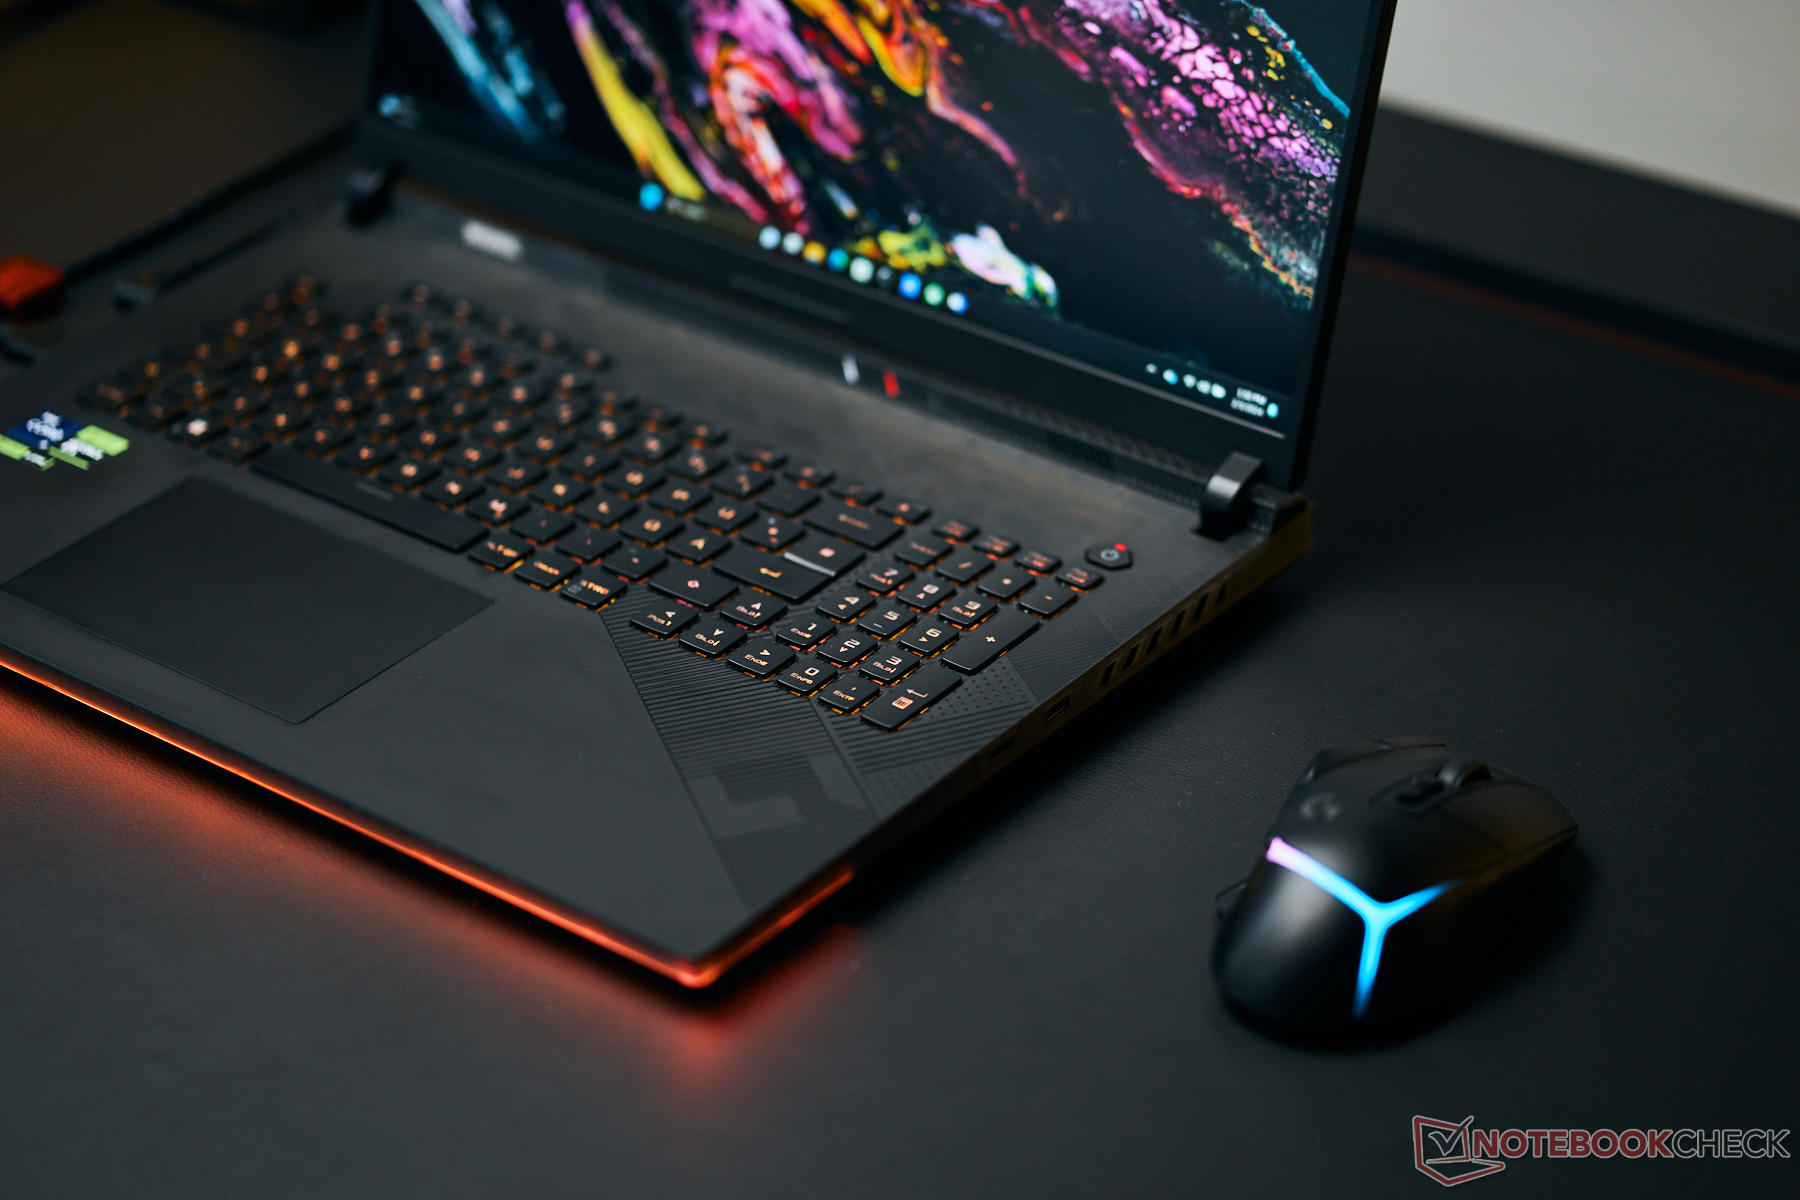
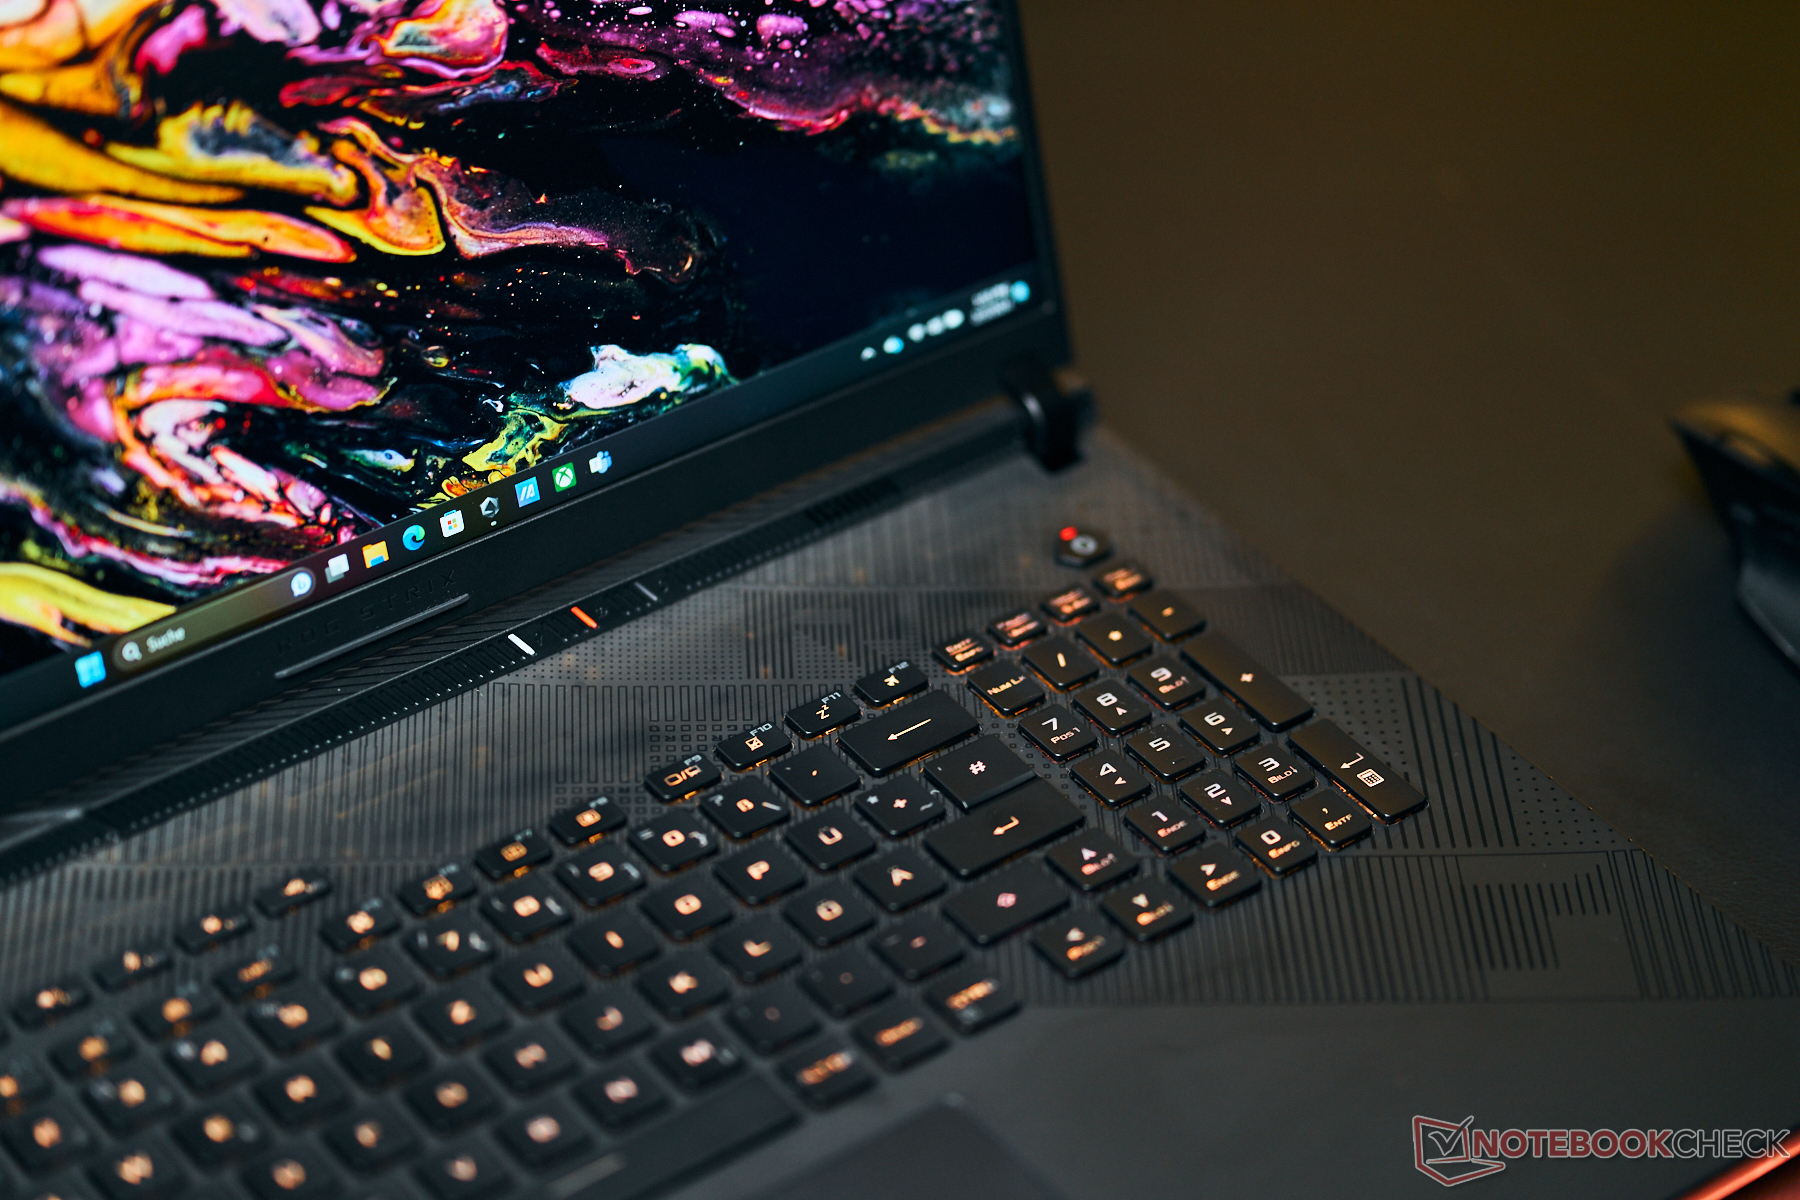
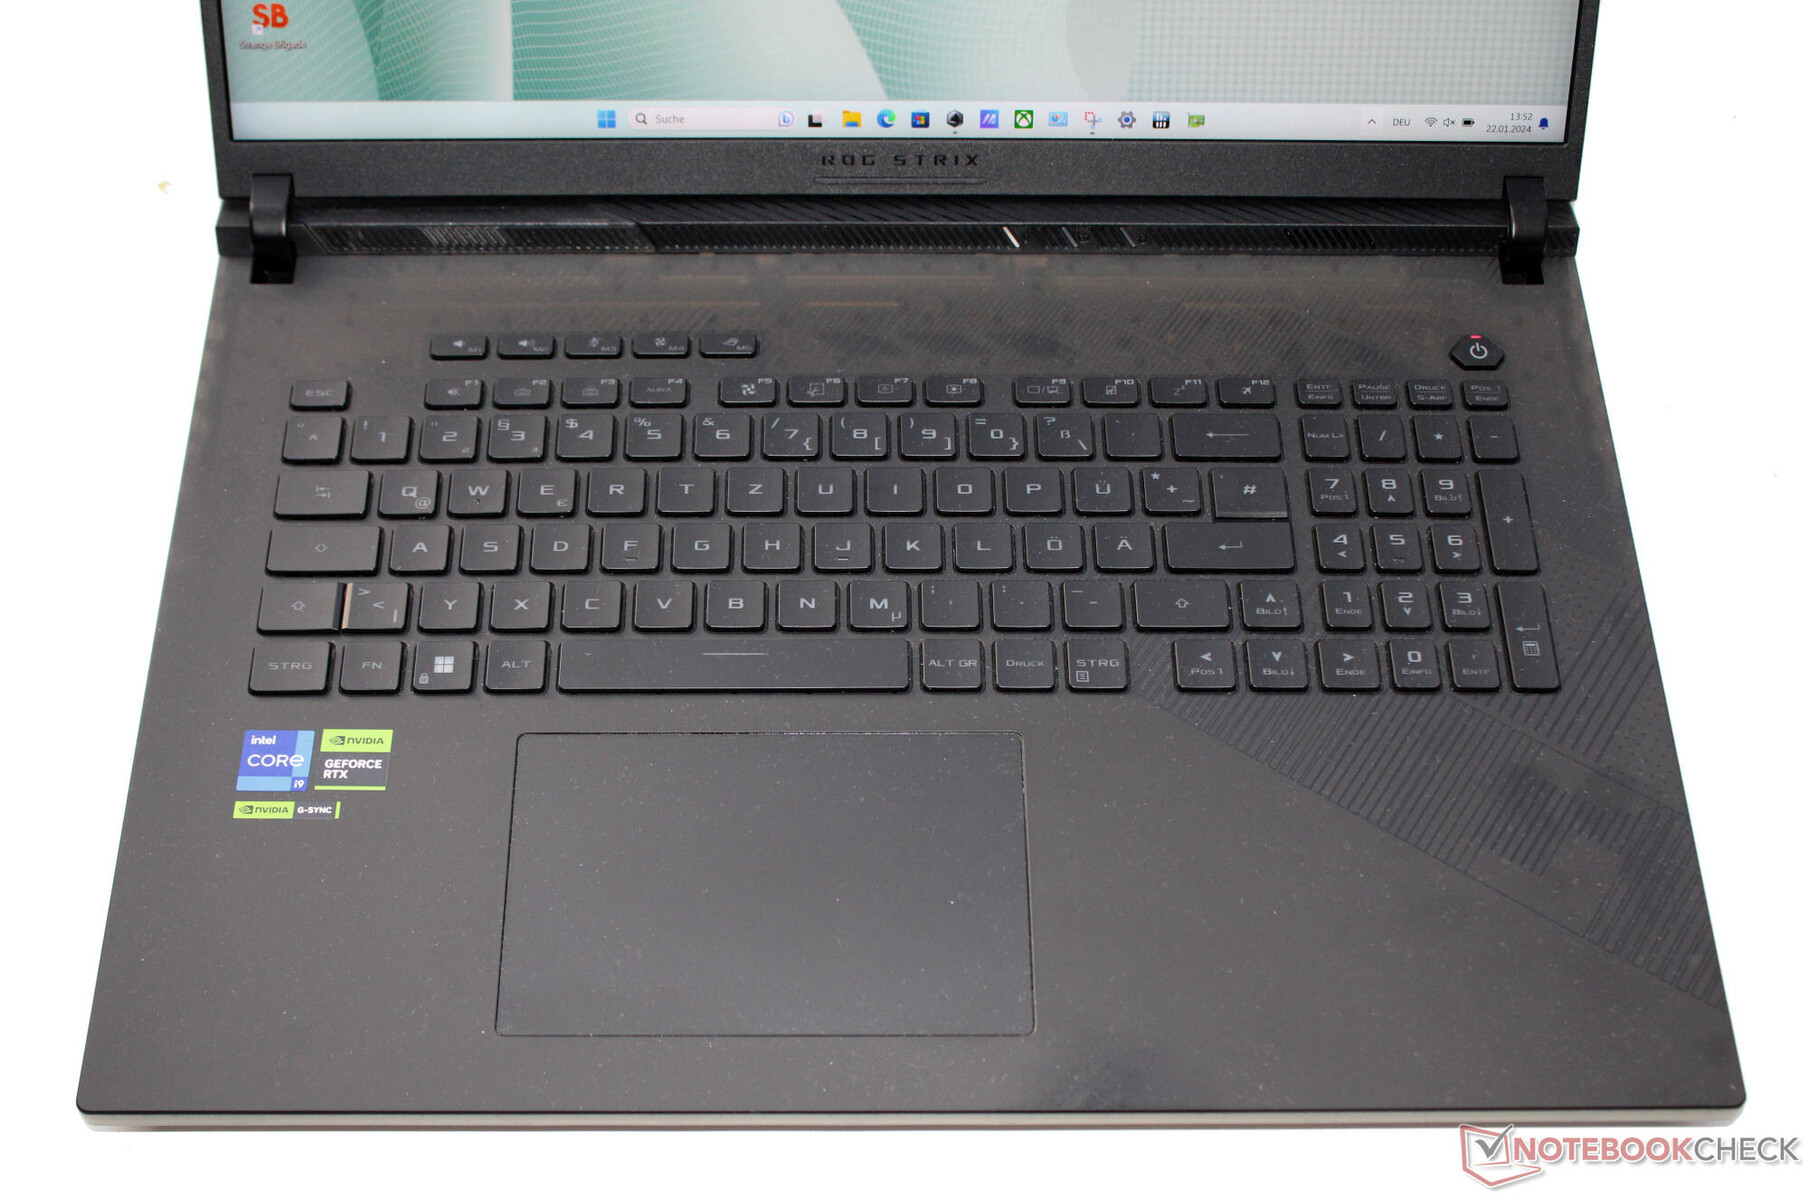
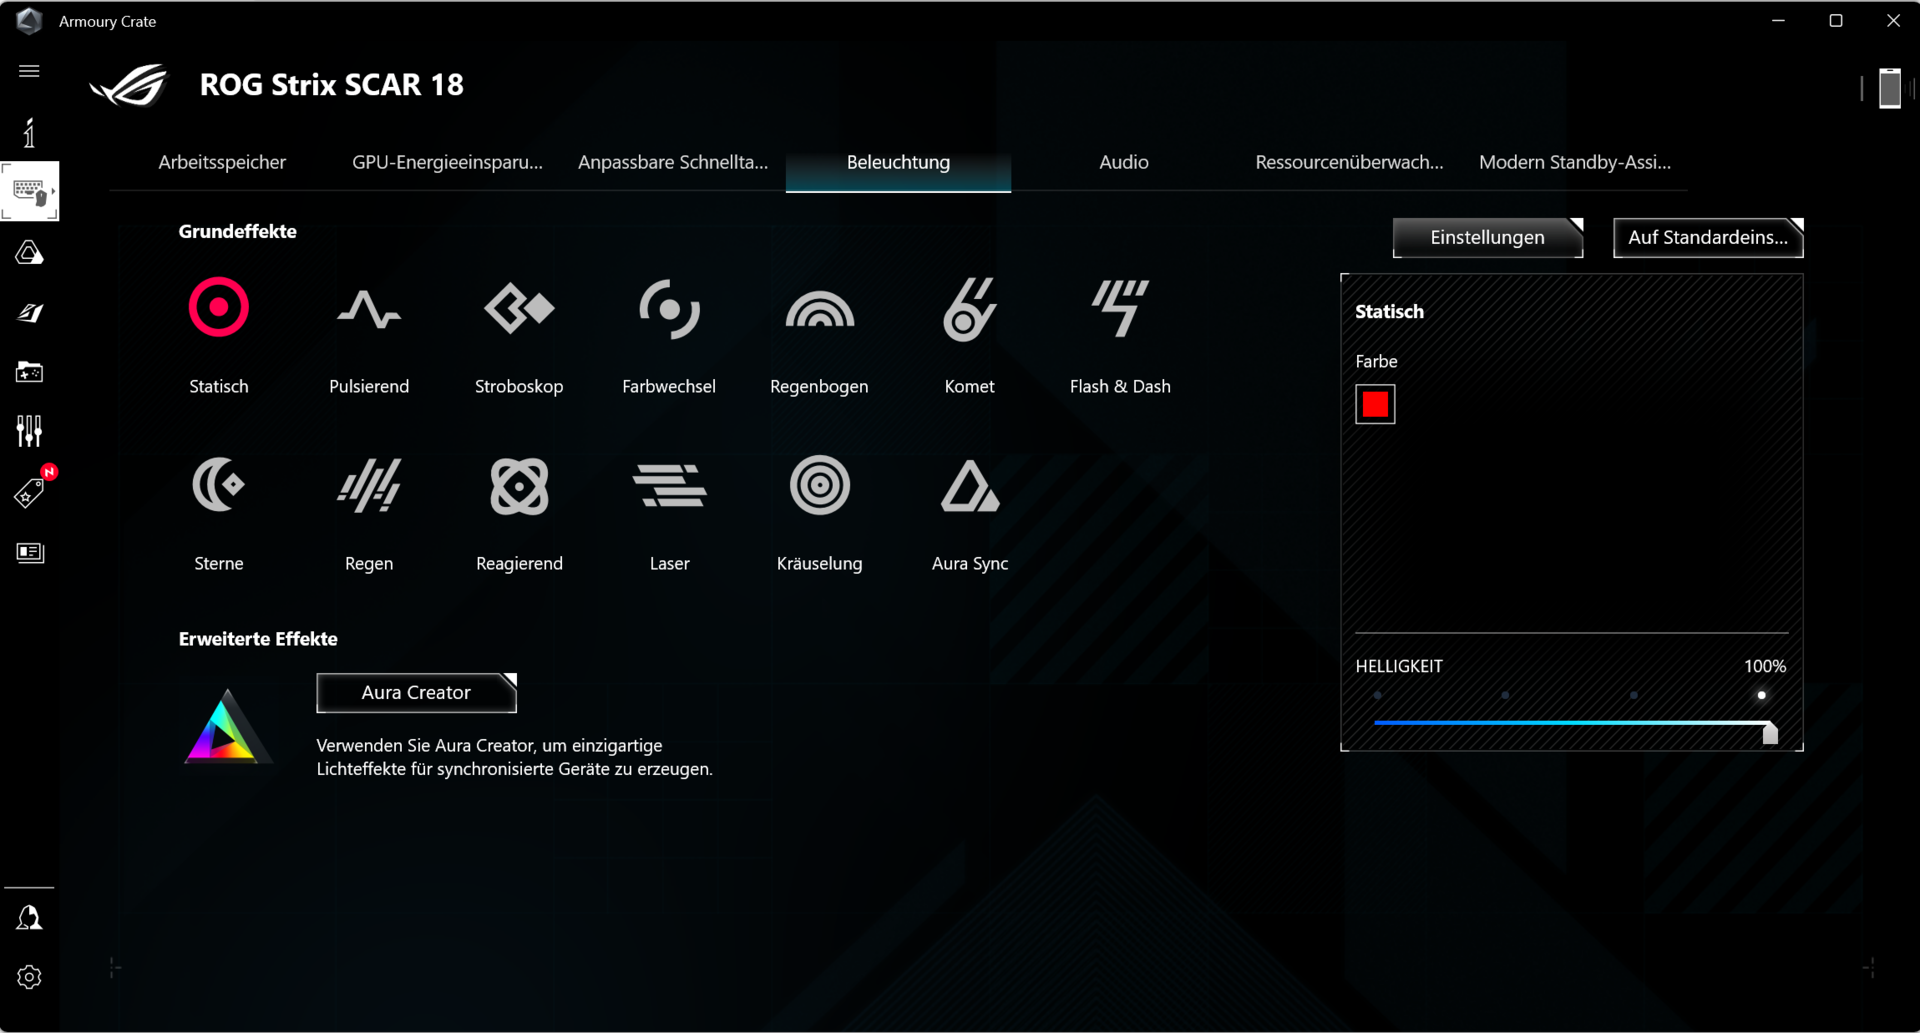
Périphériques d'entrée - Ordinateur Asus avec illumination RGB d'une seule touche
Clavier
Les touches concaves du clavier chiclet éclairé offrent une course moyenne et un point de pression clair. La résistance des touches est satisfaisante, mais elle aurait pu être légèrement plus nette. Lors de la frappe, la moitié droite du clavier présente un certain jeu, au mieux minime. Cependant, cela ne s'est pas avéré gênant. Un point positif est que les quatre touches fléchées sont de taille normale. Dans l'ensemble, Asus propose un clavier adapté aux tâches quotidiennes.
Pavé tactile
Un ClickPad (~13 x 8,5 cm, ~5.1 x 3.35 in) dont la surface lisse facilite le glissement des doigts sert de substitut à la souris. Il offre une course courte et un point de pression clair.
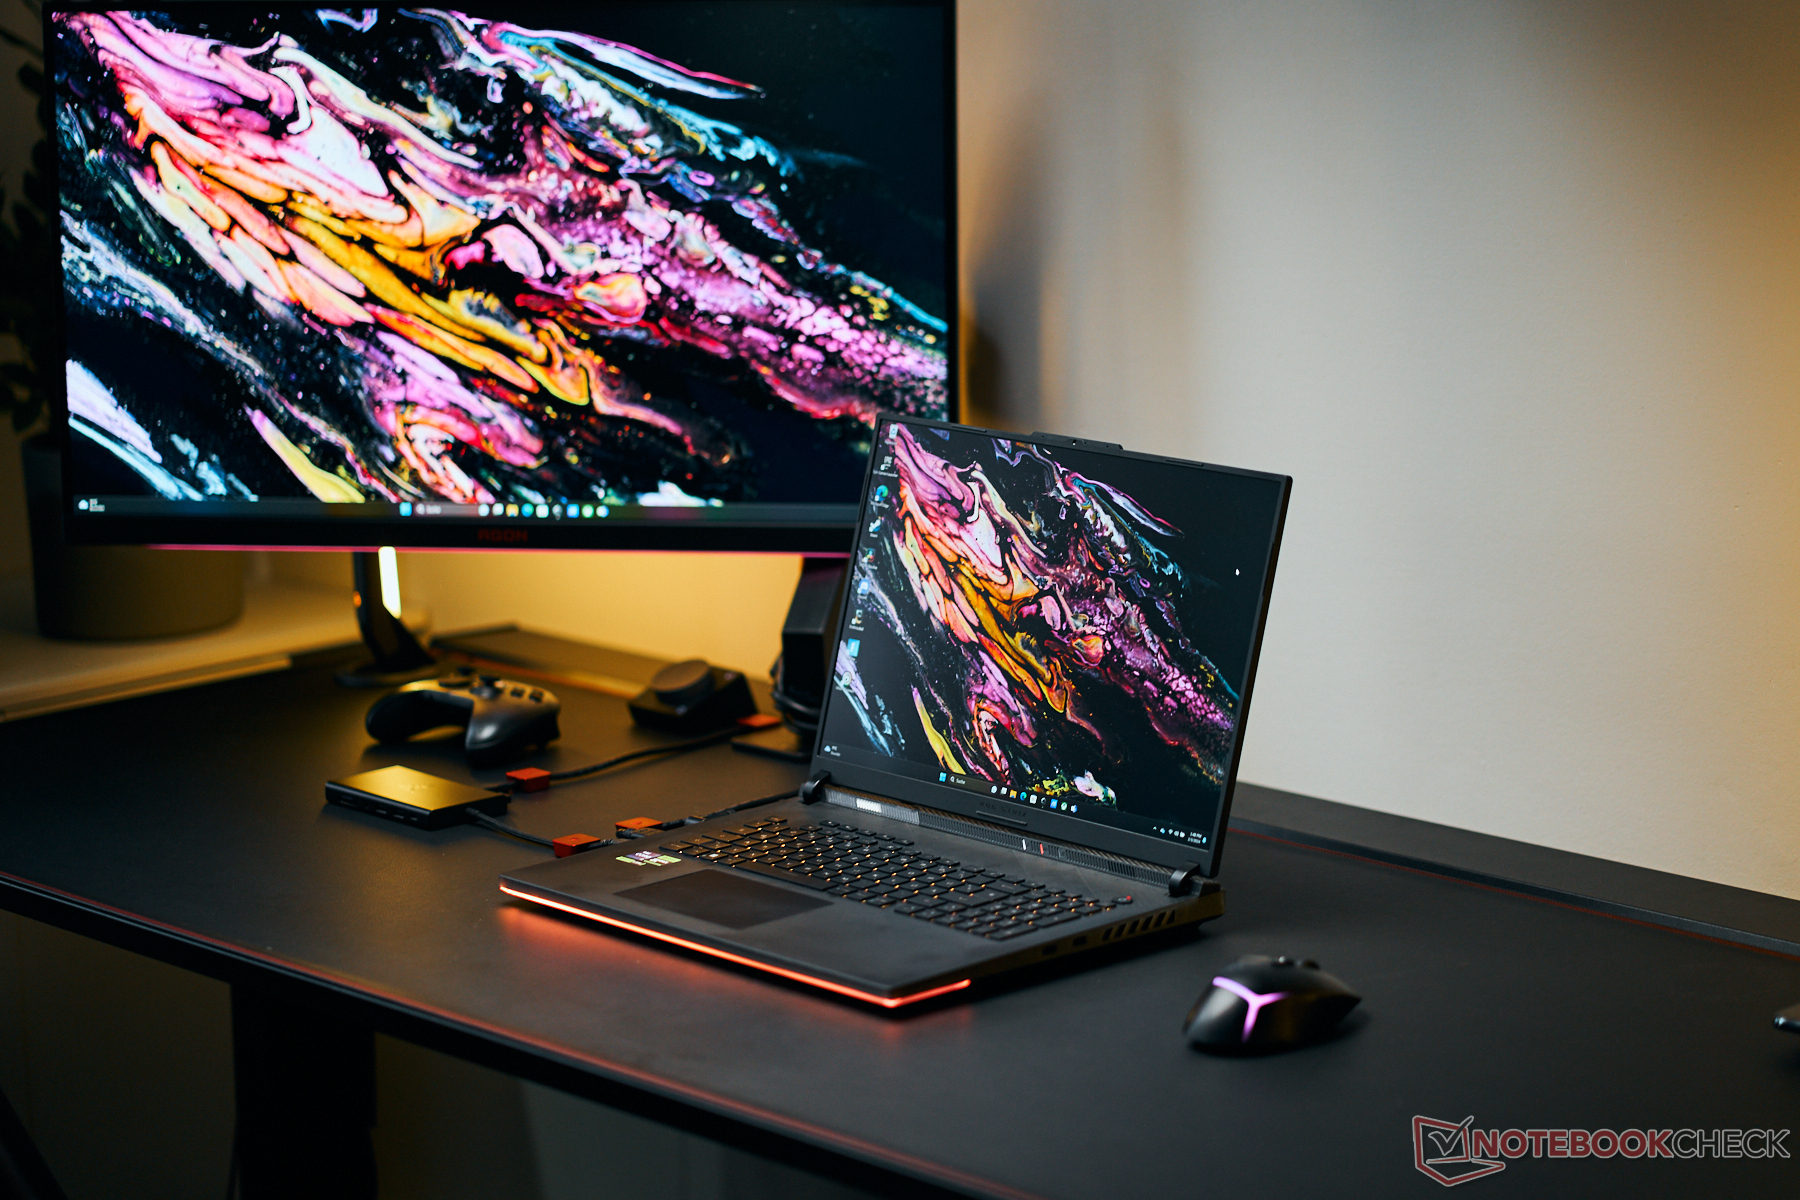
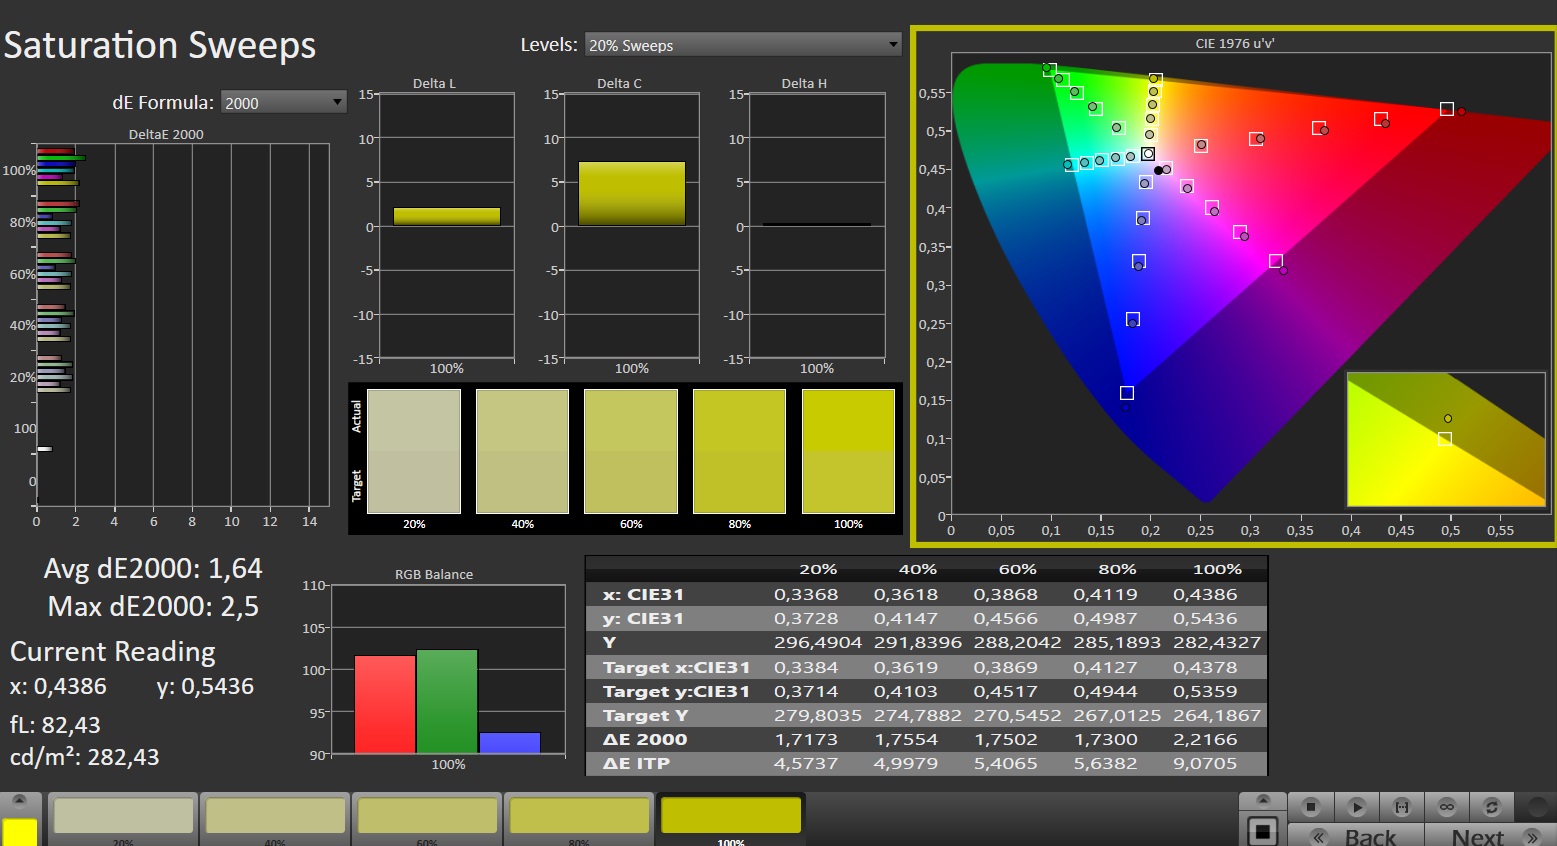
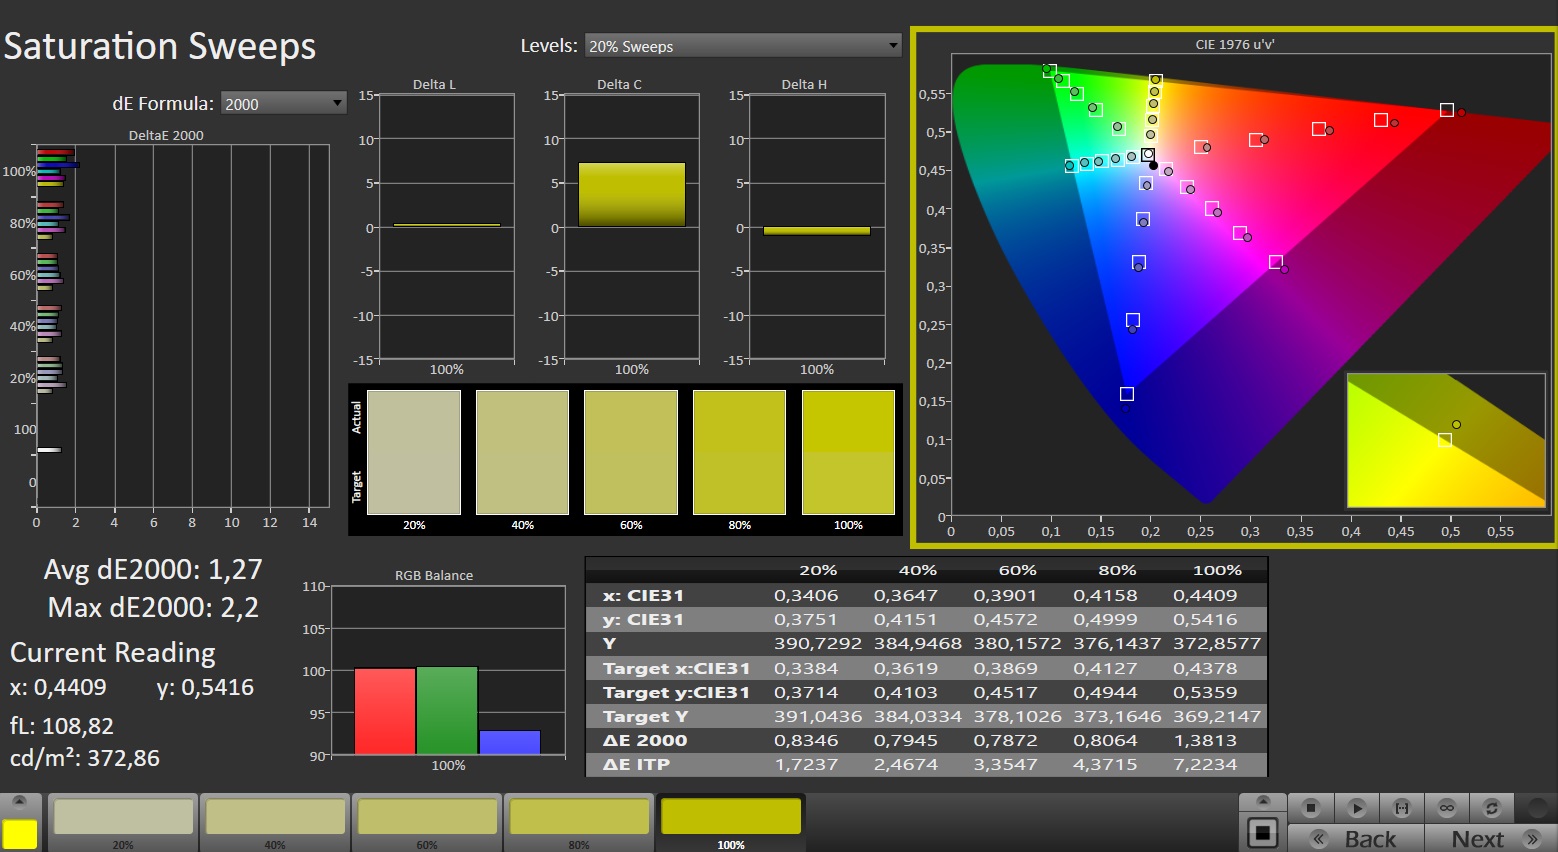
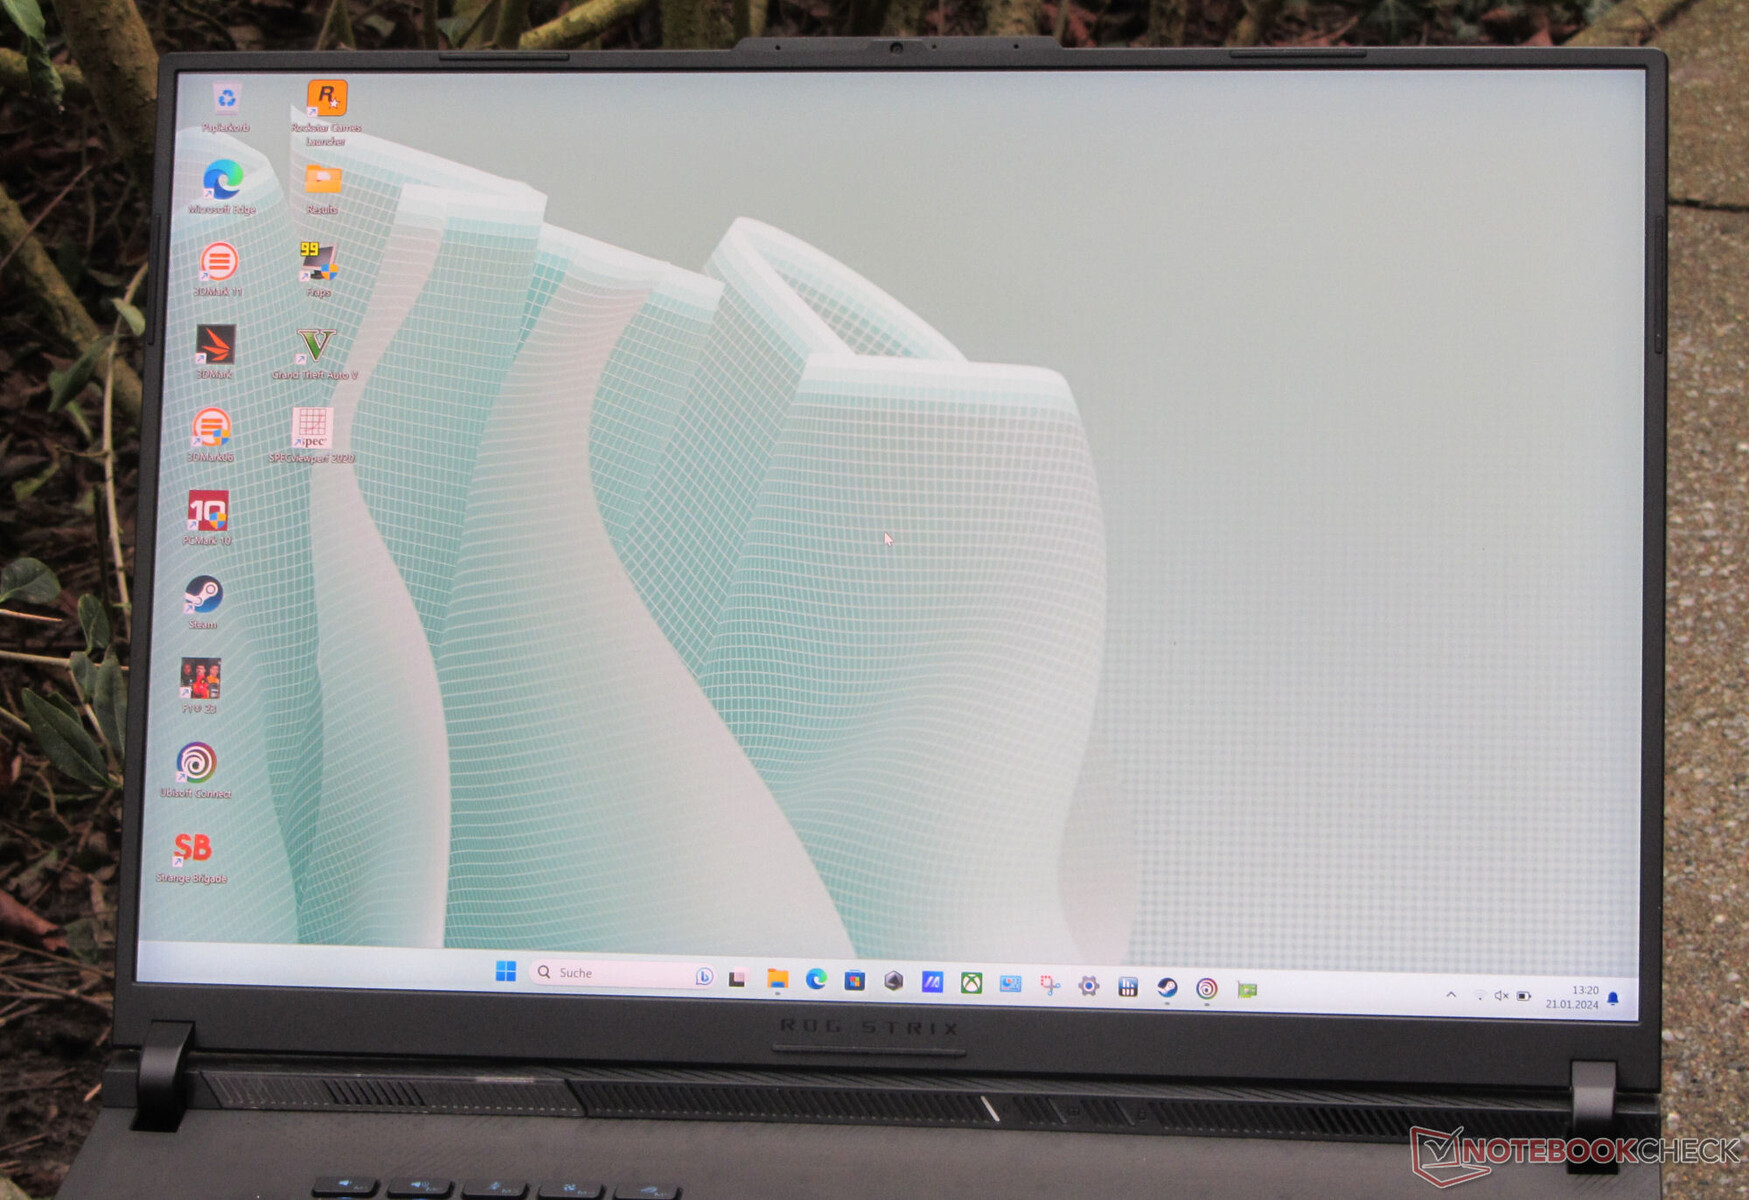
Affichage - Mini-LED avec couverture de l'espace colorimétrique DCI-P3
Le Scar 18 offre un écran mini-LED de 18 pouces (2560x1600 pixels) au format 16:10. Ses points positifs sont la luminosité élevée, l'excellent contraste et la valeur des noirs, ainsi que la surface mate. L'écran rapide de 240 Hz prend également en charge le HDR et le G-Sync.
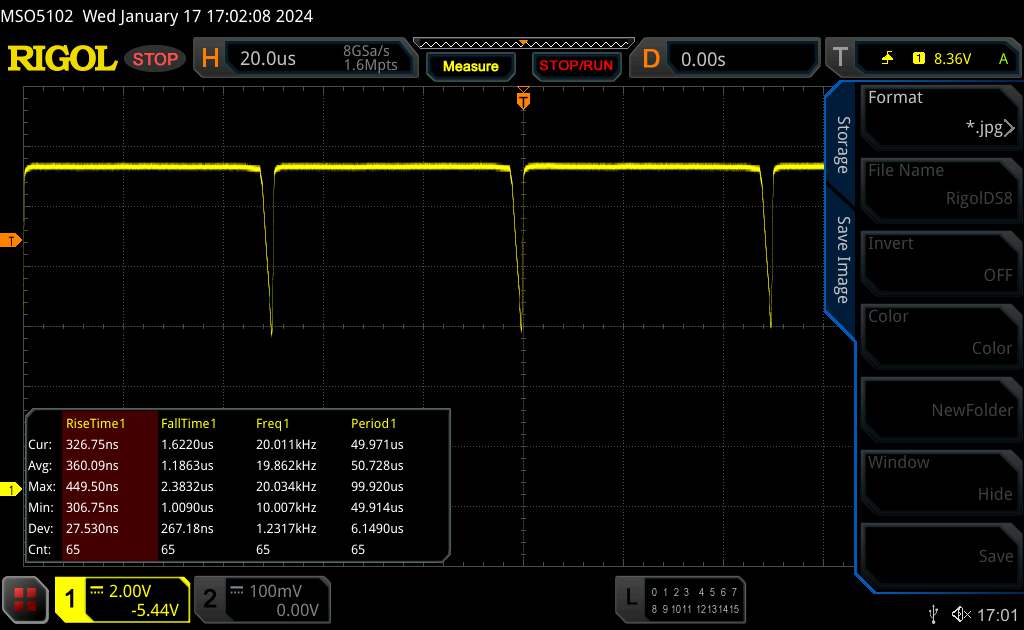
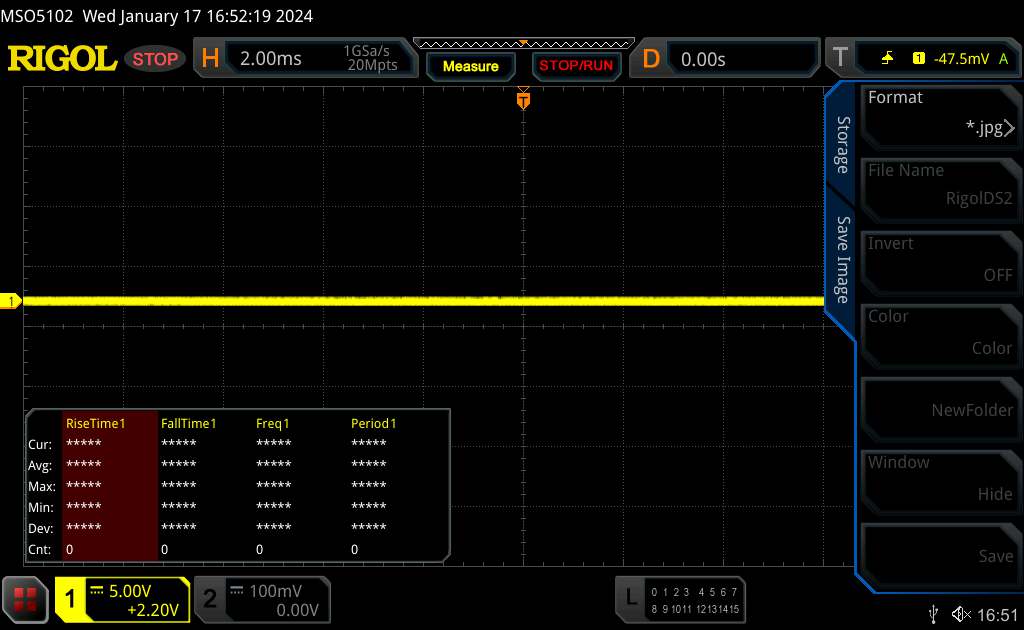
En revanche, l'écran n'est pas totalement exempt de scintillement PWM, même si cela ne devrait pas jouer un rôle important au quotidien : Nous mesurons un scintillement à haute fréquence (5.733 Hz) à des valeurs de luminosité inférieures à 94 cd/m².
| |||||||||||||||||||||||||
Homogénéité de la luminosité: 89 %
Valeur mesurée au centre, sur batterie: 937 cd/m²
Contraste: 14197:1 (Valeurs des noirs: 0.066 cd/m²)
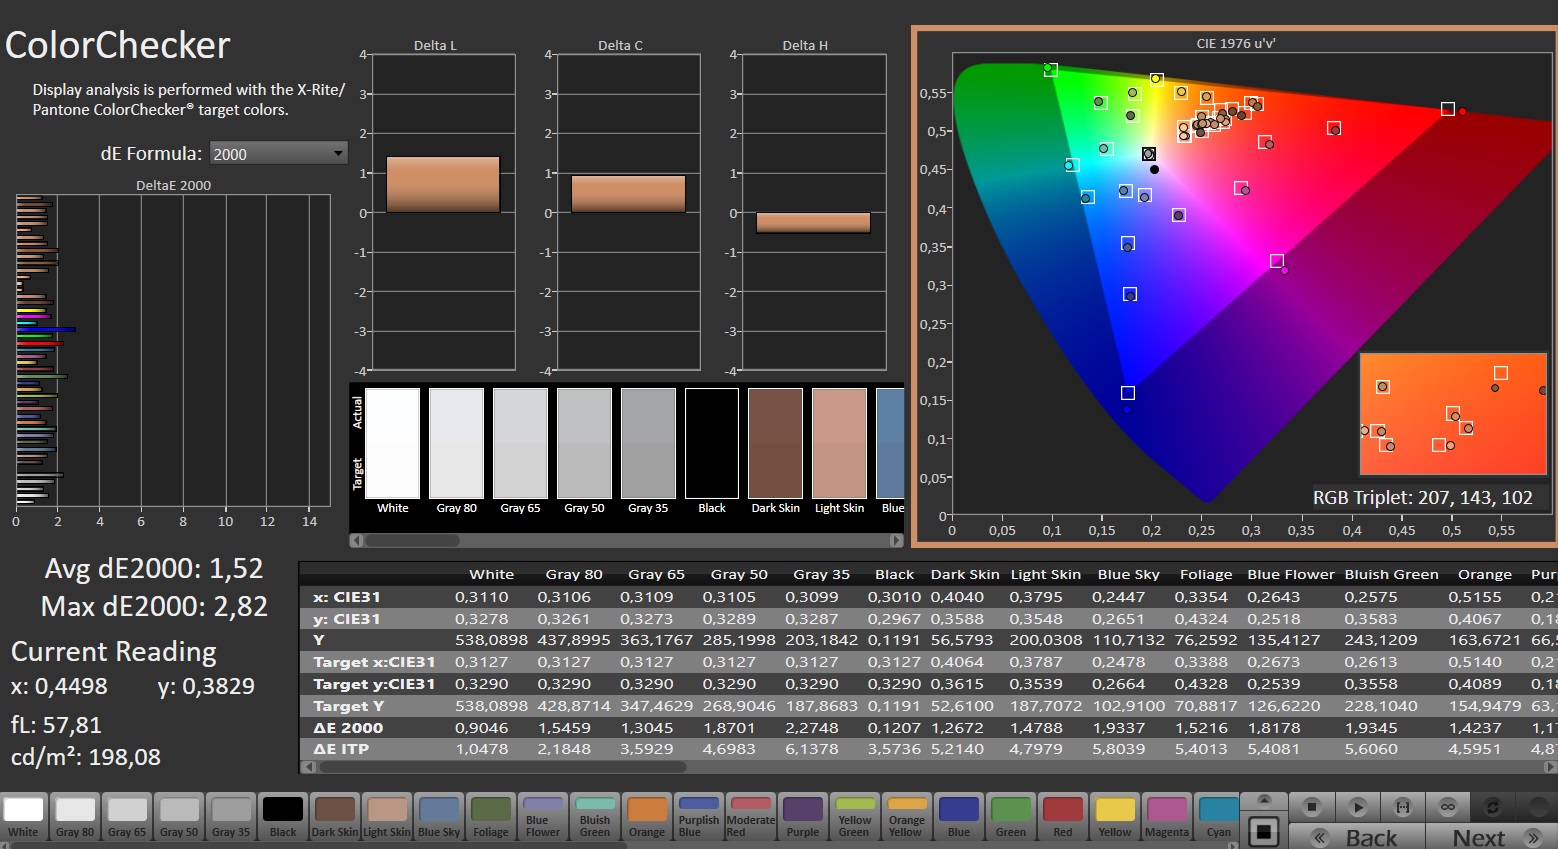
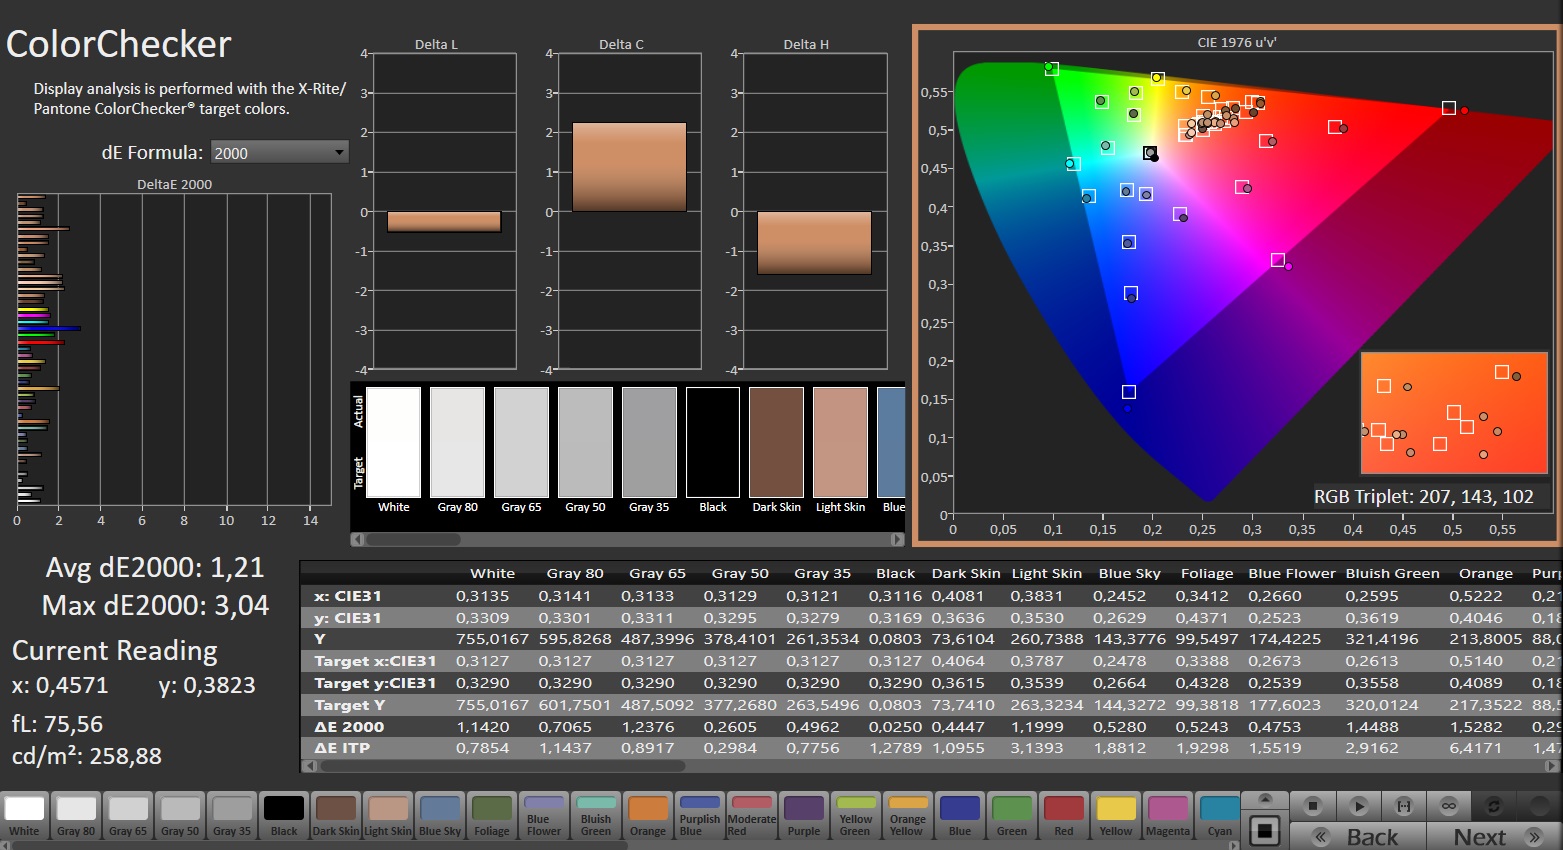
ΔE ColorChecker Calman: 1.52 | ∀{0.5-29.43 Ø4.71}
calibrated: 1.21
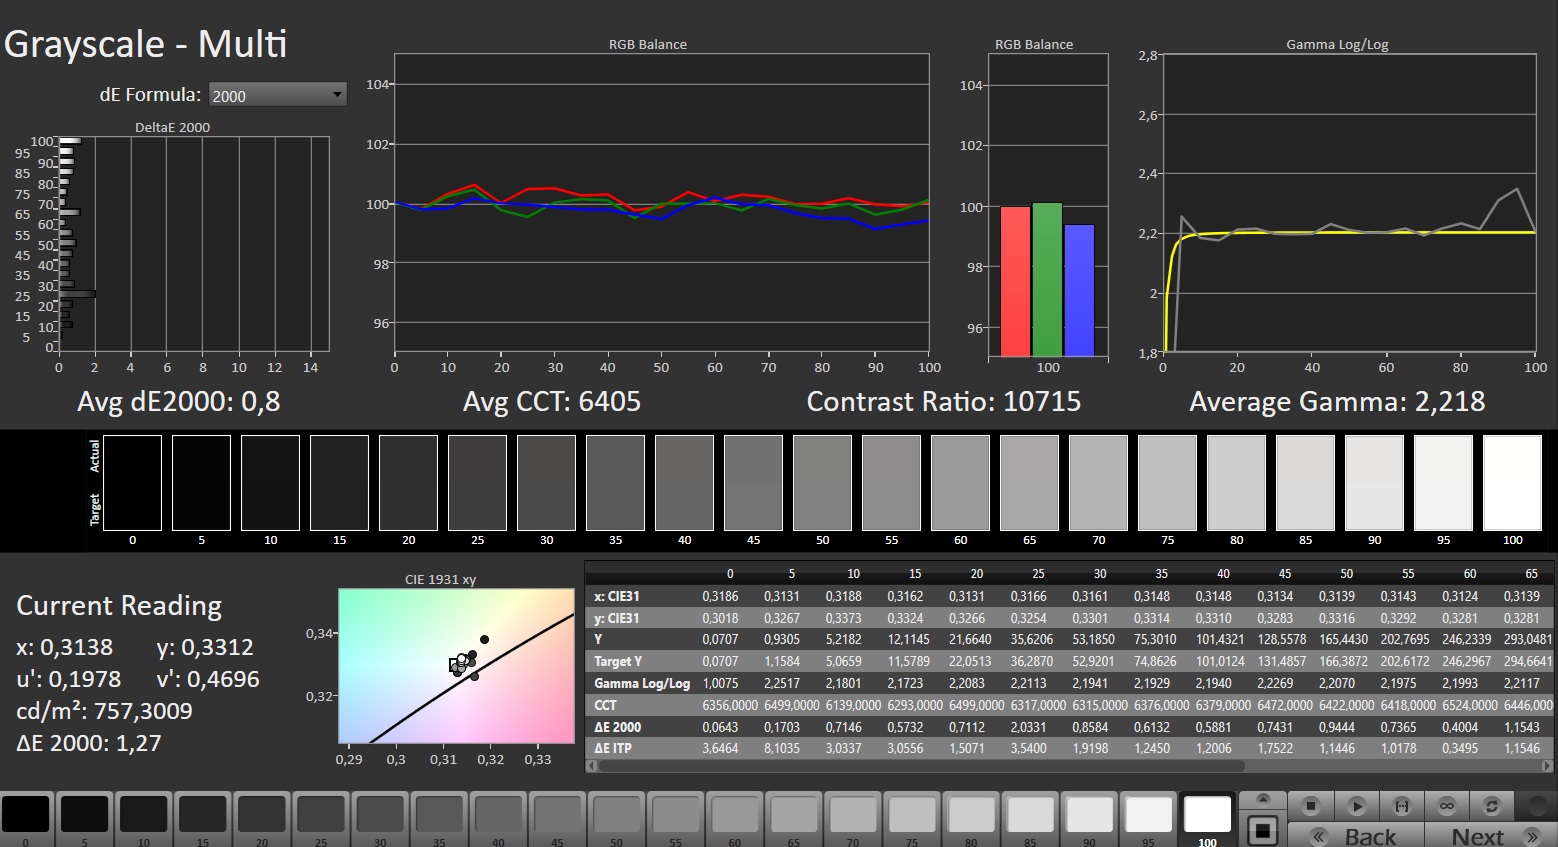
ΔE Greyscale Calman: 1.7 | ∀{0.09-98 Ø4.96}
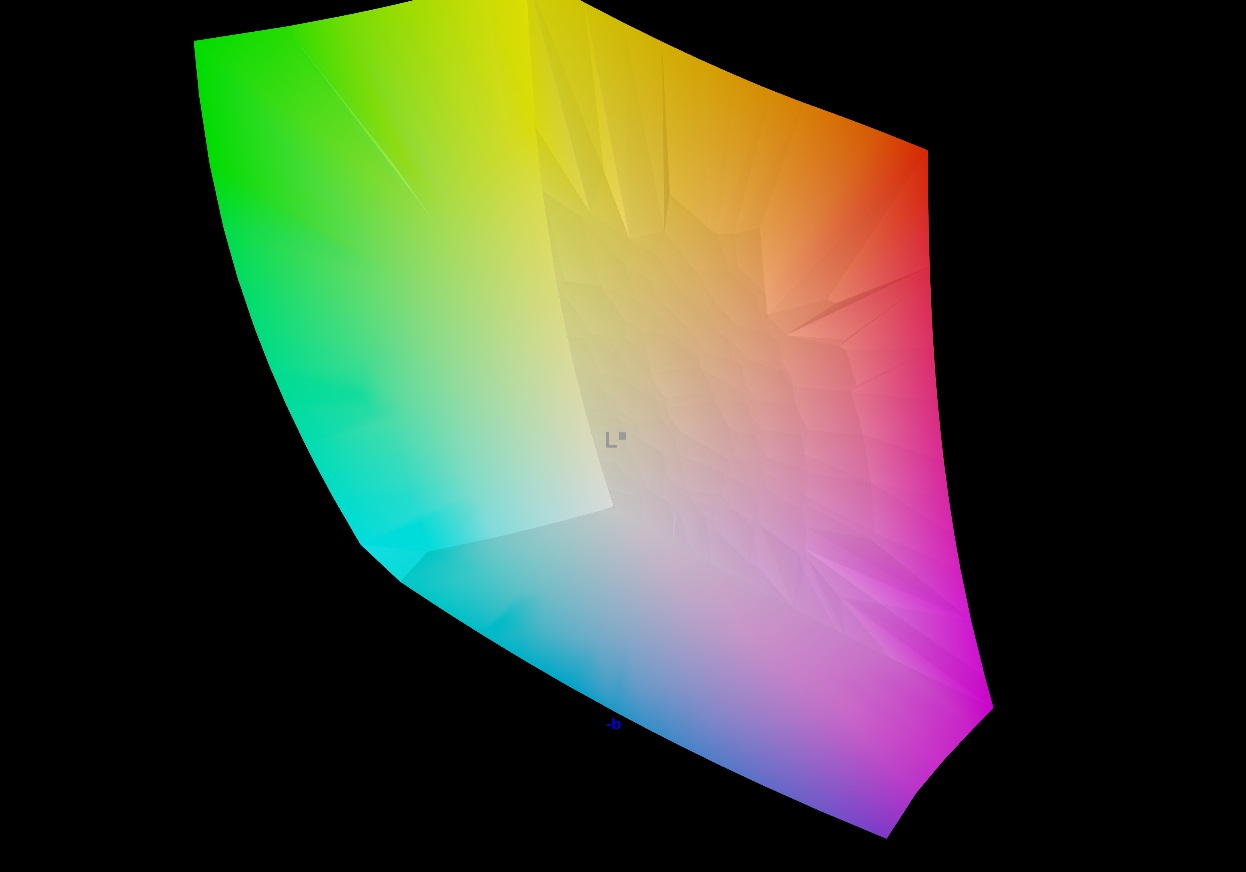
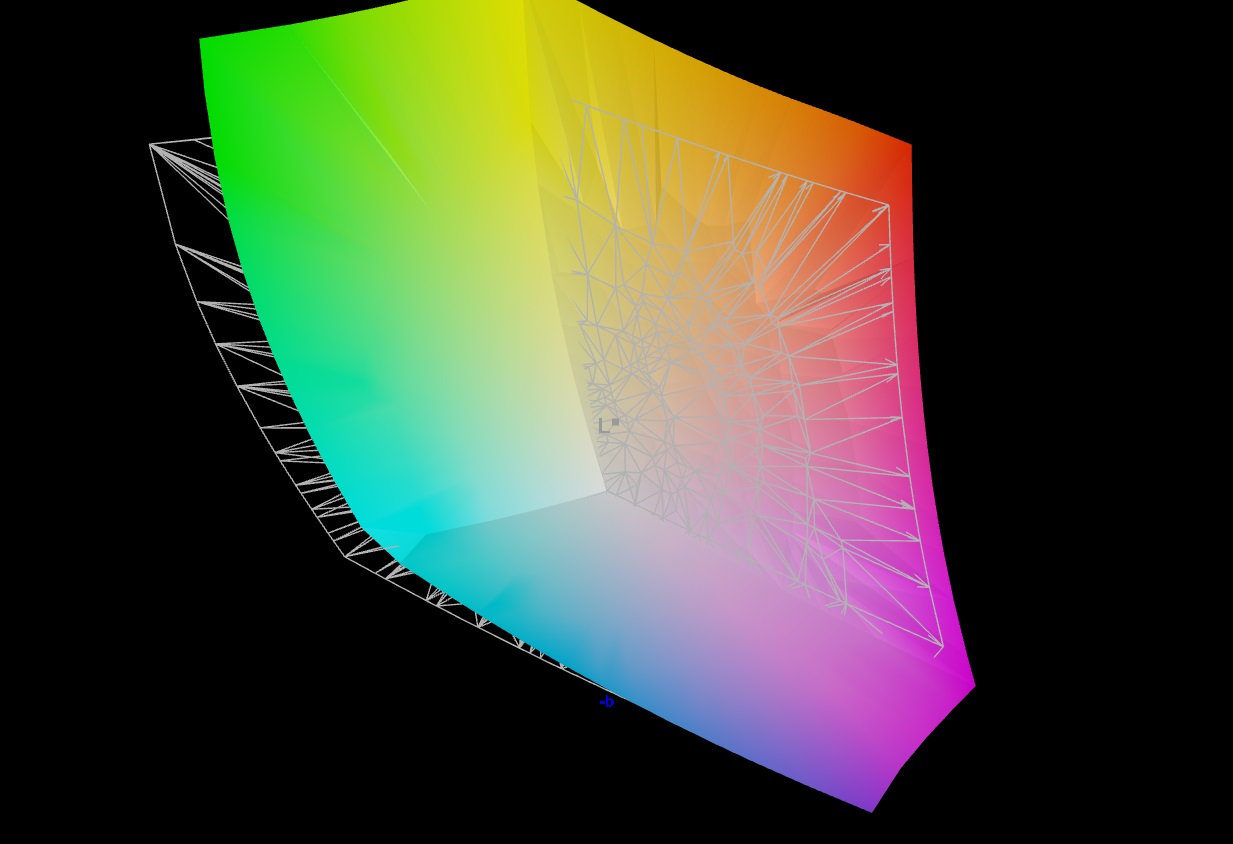
90% AdobeRGB 1998 (Argyll 3D)
100% sRGB (Argyll 3D)
99.9% Display P3 (Argyll 3D)
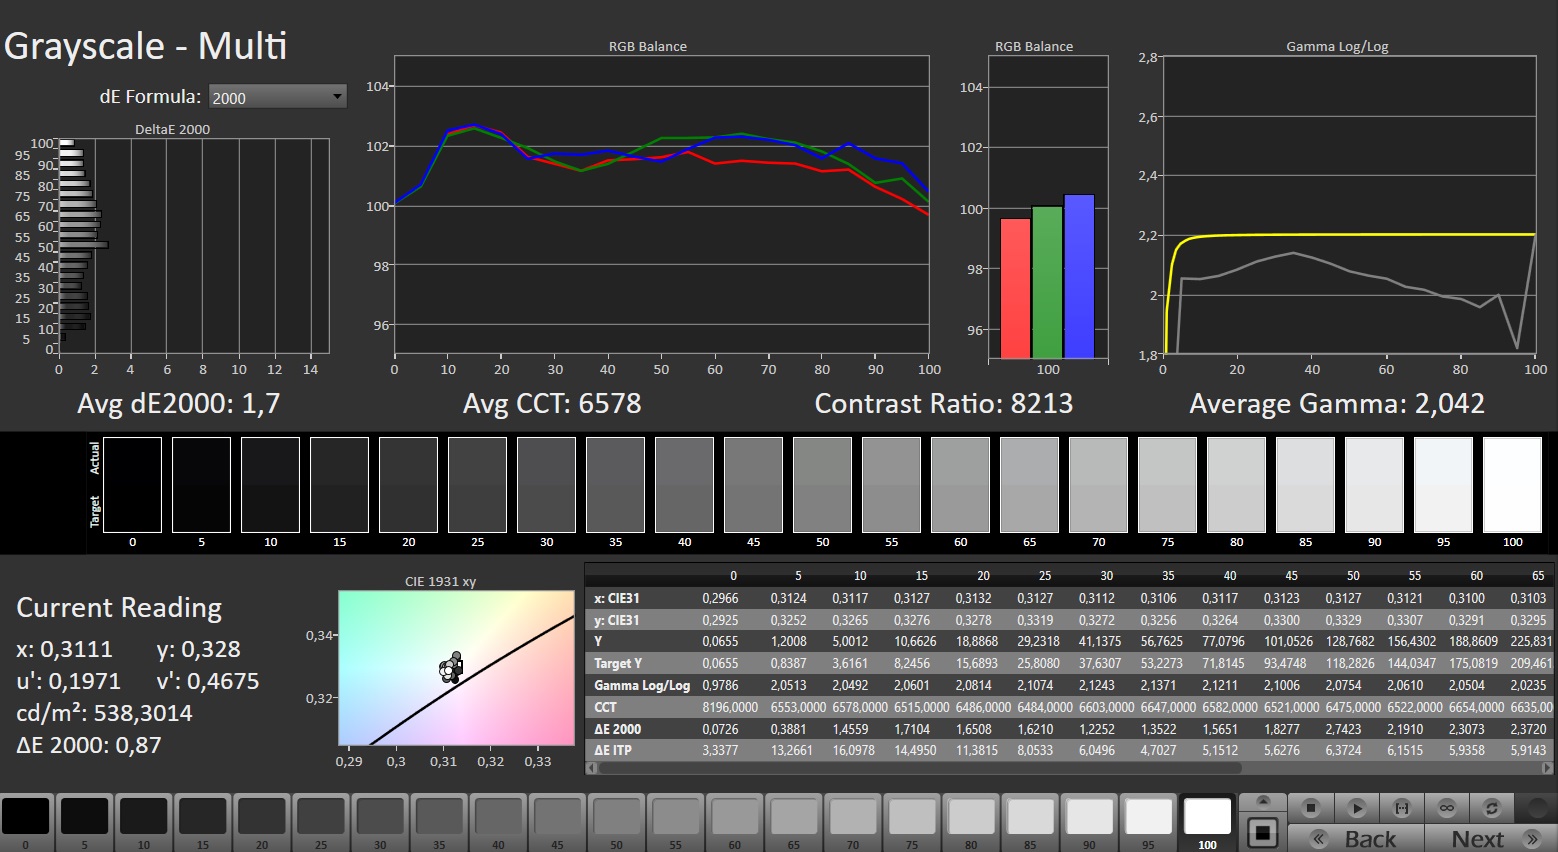
Gamma: 2.042
CCT: 6578 K
| Asus ROG Strix Scar 18 G834JYR (2024) BOE NE180QDM-NM1, Mini LED, 2560x1600, 18" | Alienware m18 R1 AMD BOE NE18NZ1, IPS, 1920x1200, 18" | Alienware m18 R1 Chi Mei 180JME, IPS, 1920x1200, 18" | Acer Predator Helios 18 N23Q2 AUO45A8 (B180QAN01.2), IPS, 2560x1600, 18" | Razer Blade 18 RTX 4070 AU Optronics B180QAN01.0, IPS, 2560x1600, 18" | MSI Titan 18 HX A14VIG AU Optronics B180ZAN01.0, Mini-LED, 3840x2400, 18" | Asus ROG Strix Scar 18 2023 G834JY-N6005W NE180QDM-NZ2, IPS, 2560x1600, 18" | |
|---|---|---|---|---|---|---|---|
| Display | -1% | -1% | 1% | -3% | -2% | -3% | |
| Display P3 Coverage (%) | 99.9 | 98.5 -1% | 97.7 -2% | 99.8 0% | 96.9 -3% | 98.1 -2% | 97.2 -3% |
| sRGB Coverage (%) | 100 | 99.7 0% | 100 0% | 100 0% | 99.8 0% | 99.8 0% | 99.9 0% |
| AdobeRGB 1998 Coverage (%) | 90 | 88.7 -1% | 89.8 0% | 91.8 2% | 85.3 -5% | 86.2 -4% | 84.9 -6% |
| Response Times | 44% | 41% | -15% | 45% | -318% | 37% | |
| Response Time Grey 50% / Grey 80% * (ms) | 12 ? | 2.8 ? 77% | 3 ? 75% | 7.6 ? 37% | 4.2 ? 65% | 8.6 ? 28% | 5.41 ? 55% |
| Response Time Black / White * (ms) | 10.7 ? | 9.6 ? 10% | 9.9 ? 7% | 17.8 ? -66% | 8 ? 25% | 81.8 ? -664% | 8.62 ? 19% |
| PWM Frequency (Hz) | 5733 ? | 2509 | 2592 ? | ||||
| Screen | -42% | -64% | -114% | -142% | -85% | -211% | |
| Brightness middle (cd/m²) | 937 | 319.6 -66% | 372.8 -60% | 360 -62% | 549.6 -41% | 467.5 -50% | 490 -48% |
| Brightness (cd/m²) | 934 | 304 -67% | 367 -61% | 355 -62% | 524 -44% | 459 -51% | 468 -50% |
| Brightness Distribution (%) | 89 | 87 -2% | 97 9% | 92 3% | 89 0% | 90 1% | 86 -3% |
| Black Level * (cd/m²) | 0.066 | 0.25 -279% | 0.32 -385% | 0.21 -218% | 0.53 -703% | 0.54 -718% | |
| Contrast (:1) | 14197 | 1278 -91% | 1165 -92% | 1714 -88% | 1037 -93% | 907 -94% | |
| Colorchecker dE 2000 * | 1.52 | 1.22 20% | 1.92 -26% | 3.82 -151% | 3.32 -118% | 3.77 -148% | 4.97 -227% |
| Colorchecker dE 2000 max. * | 2.82 | 3.1 -10% | 3.65 -29% | 7.38 -162% | 6.63 -135% | 6.12 -117% | 11.02 -291% |
| Colorchecker dE 2000 calibrated * | 1.21 | 0.47 61% | 0.51 58% | 2.24 -85% | 2.7 -123% | 2.94 -143% | 2.97 -145% |
| Greyscale dE 2000 * | 1.7 | 0.8 53% | 1.5 12% | 5.06 -198% | 2 -18% | 3.2 -88% | 7.2 -324% |
| Gamma | 2.042 108% | 2.23 99% | 2.34 94% | 2.52 87% | 2.29 96% | 2.43 91% | 2.161 102% |
| CCT | 6578 99% | 6471 100% | 6607 98% | 5657 115% | 6319 103% | 6478 100% | 6515 100% |
| Moyenne finale (programmes/paramètres) | 0% /
-21% | -8% /
-35% | -43% /
-75% | -33% /
-85% | -135% /
-103% | -59% /
-131% |
* ... Moindre est la valeur, meilleures sont les performances
La précision des couleurs est une évidence, les espaces colorimétriques sRGB et DCI-P3 étant entièrement couverts et l'espace colorimétrique Adobe RGB l'étant à 90 %. Grâce à la certification Pantone, la reproduction des couleurs est déjà très bonne à l'état de livraison, et avec une déviation de 1,52, l'objectif de DeltaE < 3 est atteint. Un étalonnage supplémentaire permet d'obtenir une légère amélioration, mais il s'agit principalement d'une échelle de gris plus équilibrée.

Temps de réponse de l'écran
| ↔ Temps de réponse noir à blanc | ||
|---|---|---|
| 10.7 ms ... hausse ↗ et chute ↘ combinées | ↗ 7.6 ms hausse | 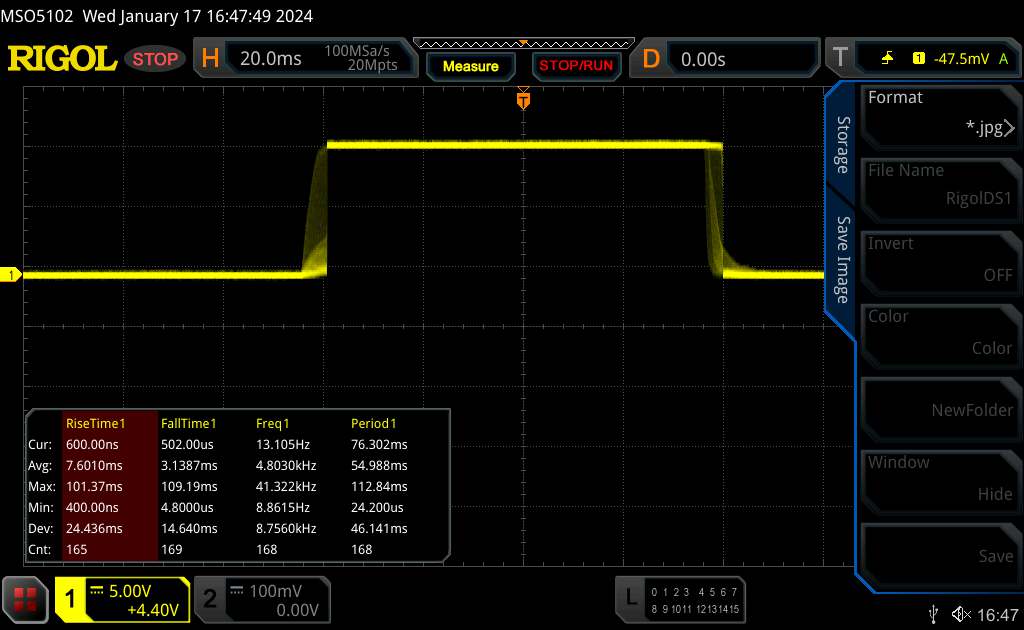 |
| ↘ 3.1 ms chute | ||
| L'écran montre de bons temps de réponse, mais insuffisant pour du jeu compétitif. En comparaison, tous les appareils testés affichent entre 0.1 (minimum) et 240 (maximum) ms. » 29 % des appareils testés affichent de meilleures performances. Cela signifie que les latences relevées sont meilleures que la moyenne (19.8 ms) de tous les appareils testés. | ||
| ↔ Temps de réponse gris 50% à gris 80% | ||
| 12 ms ... hausse ↗ et chute ↘ combinées | ↗ 8 ms hausse | |
| ↘ 4 ms chute | ||
| L'écran montre de bons temps de réponse, mais insuffisant pour du jeu compétitif. En comparaison, tous les appareils testés affichent entre 0.165 (minimum) et 636 (maximum) ms. » 25 % des appareils testés affichent de meilleures performances. Cela signifie que les latences relevées sont meilleures que la moyenne (31 ms) de tous les appareils testés. | ||
Scintillement / MLI (Modulation de largeur d'impulsion)
| Scintillement / MLI (Modulation de largeur d'impulsion) décelé | 5733 Hz | |
| ≤ 94 Niveau de luminosité en cd/m² | ||
Le rétroéclairage de l'écran scintille à la fréquence de 5733 Hz (certainement du fait de l'utilisation d'une MDI - Modulation de largeur d'impulsion) à un niveau de luminosité inférieur ou égal à 94 cd/m² . Aucun scintillement ne devrait être perceptible au-dessus de cette valeur. La fréquence de rafraîchissement de 5733 Hz est élevée, la grande majorité des utilisateurs ne devrait pas percevoir de scintillements et être sujette à une fatigue oculaire accrue. Le scintillement ne se produit qu'avec un niveau de luminosité relativement faible. Le symptôme devrait être imperceptible en pratique. Une utilisation en milieu fermé peut entraîner une fatigue oculaire. En comparaison, 52 % des appareils testés n'emploient pas MDI pour assombrir leur écran. Nous avons relevé une moyenne à 7747 (minimum : 5 - maximum : 343500) Hz dans le cas où une MDI était active. | ||
L'écran IPS offre des angles de vision stables et peut être lu sous presque tous les angles. La luminosité maximale élevée permet également de lire le contenu de l'écran à l'extérieur.

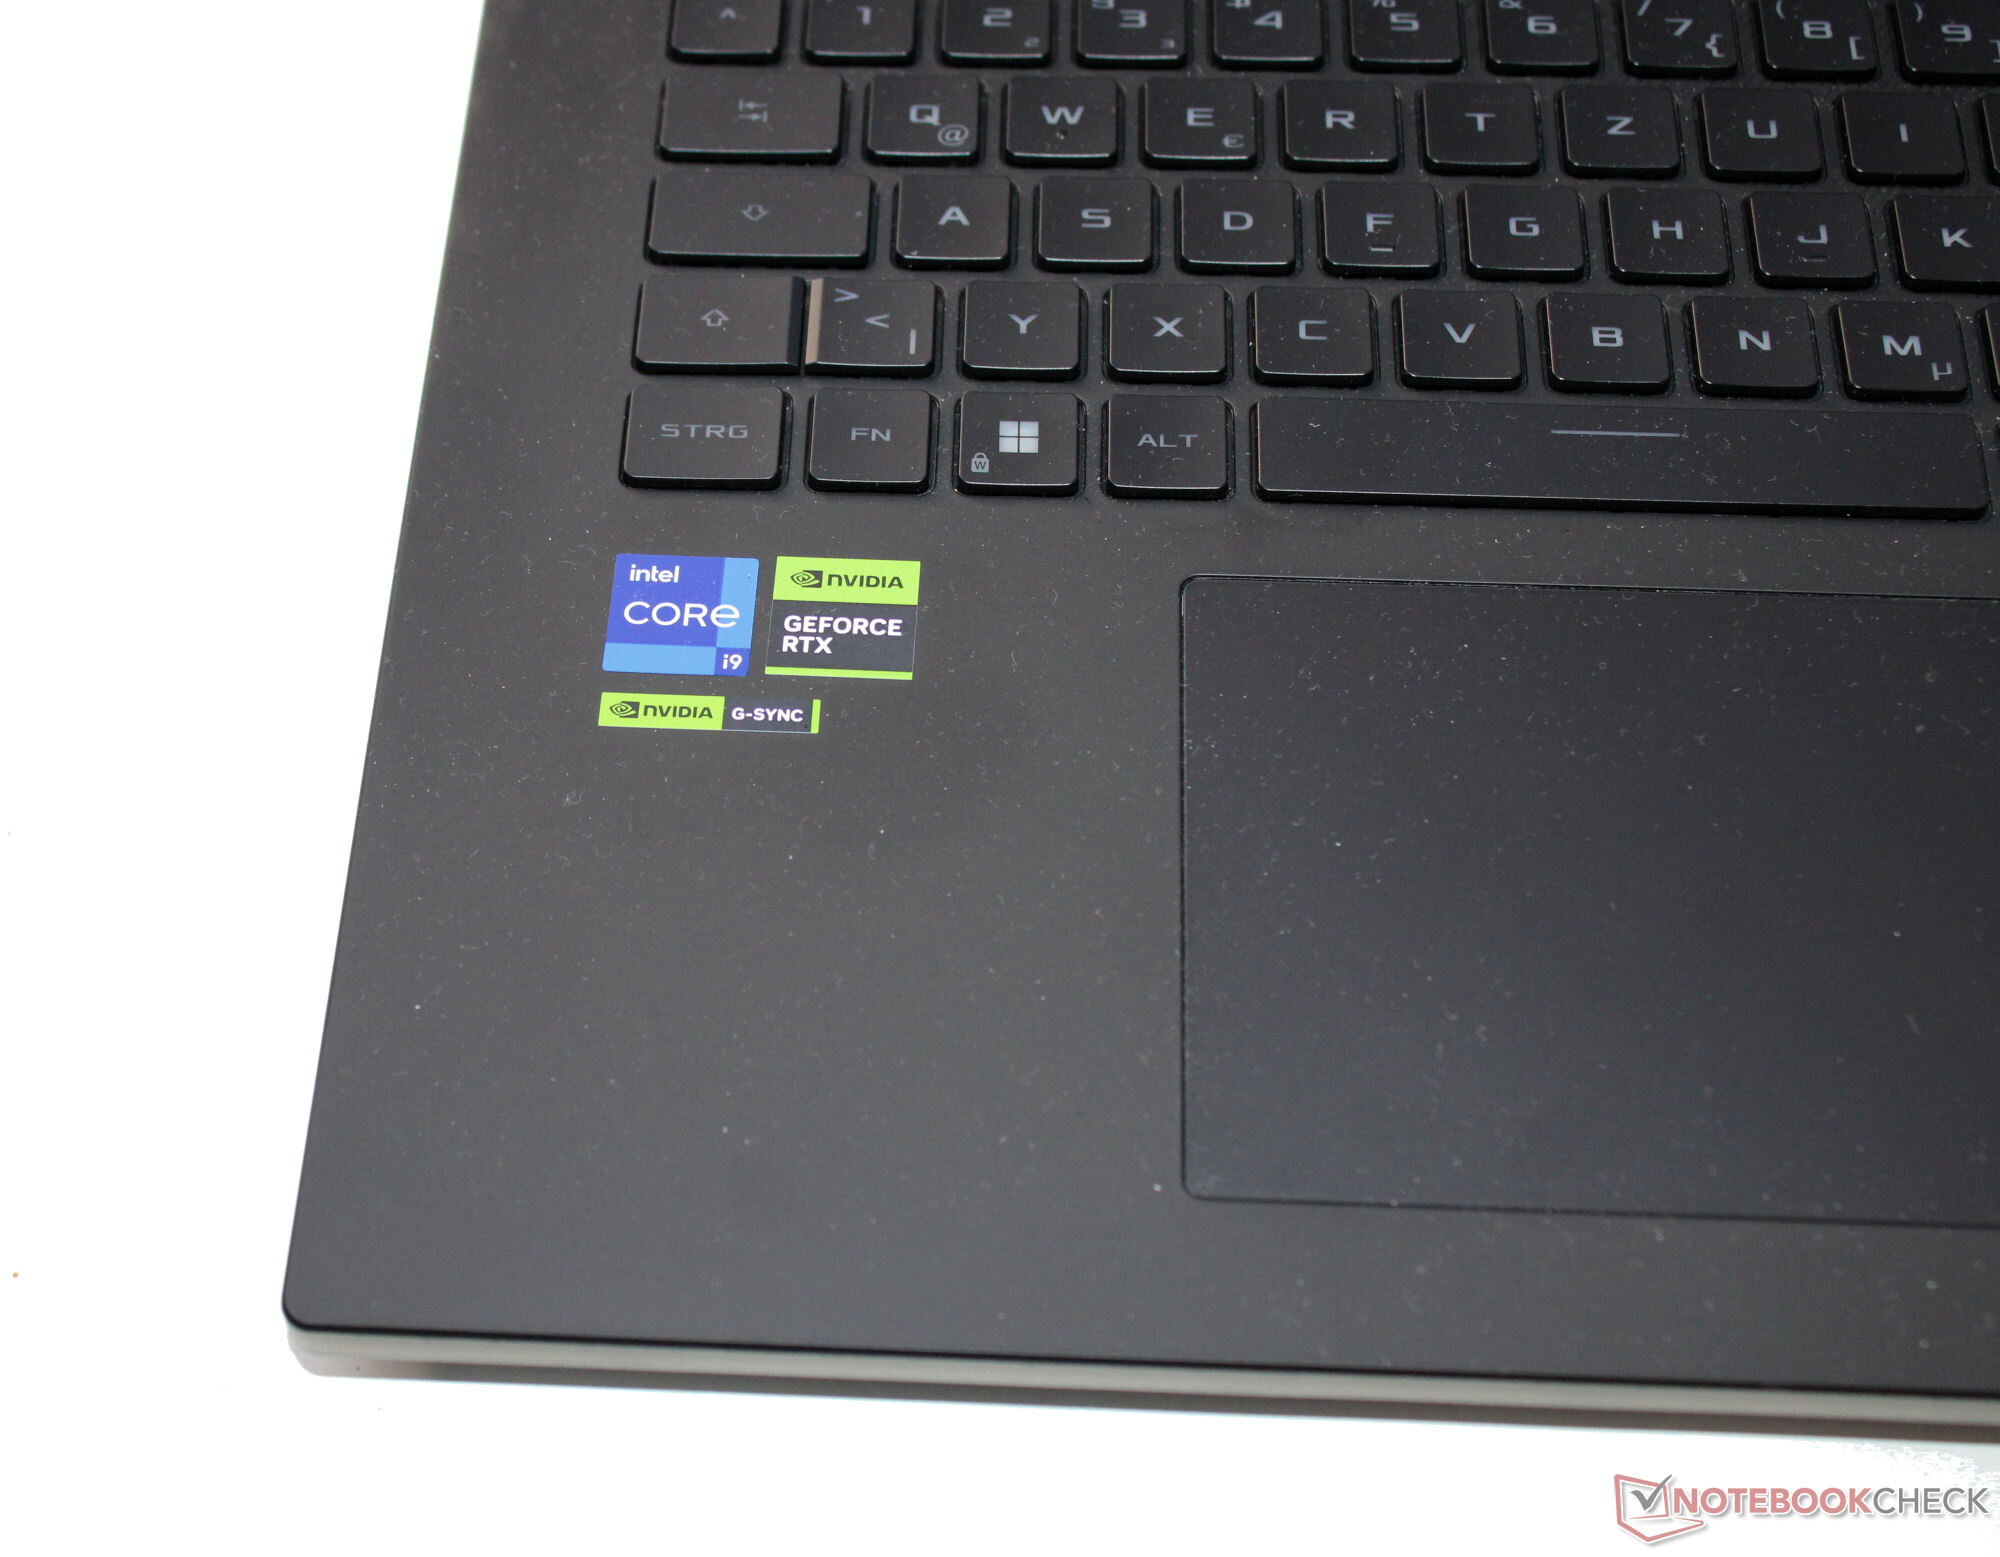
Performance - Le Scar 18 offre un matériel haut de gamme
L'Asus ROG Strix Scar 18 est un ordinateur portable haut de gamme au format 18 pouces. Les performances informatiques nécessaires sont fournies par Raptor Lake Refresh et le matériel Ada Lovelace. Les prix commencent à partir de 3 600 euros (~3 878 $), et notre unité de test actuelle est disponible pour environ 4 500 euros (~4 848 $).
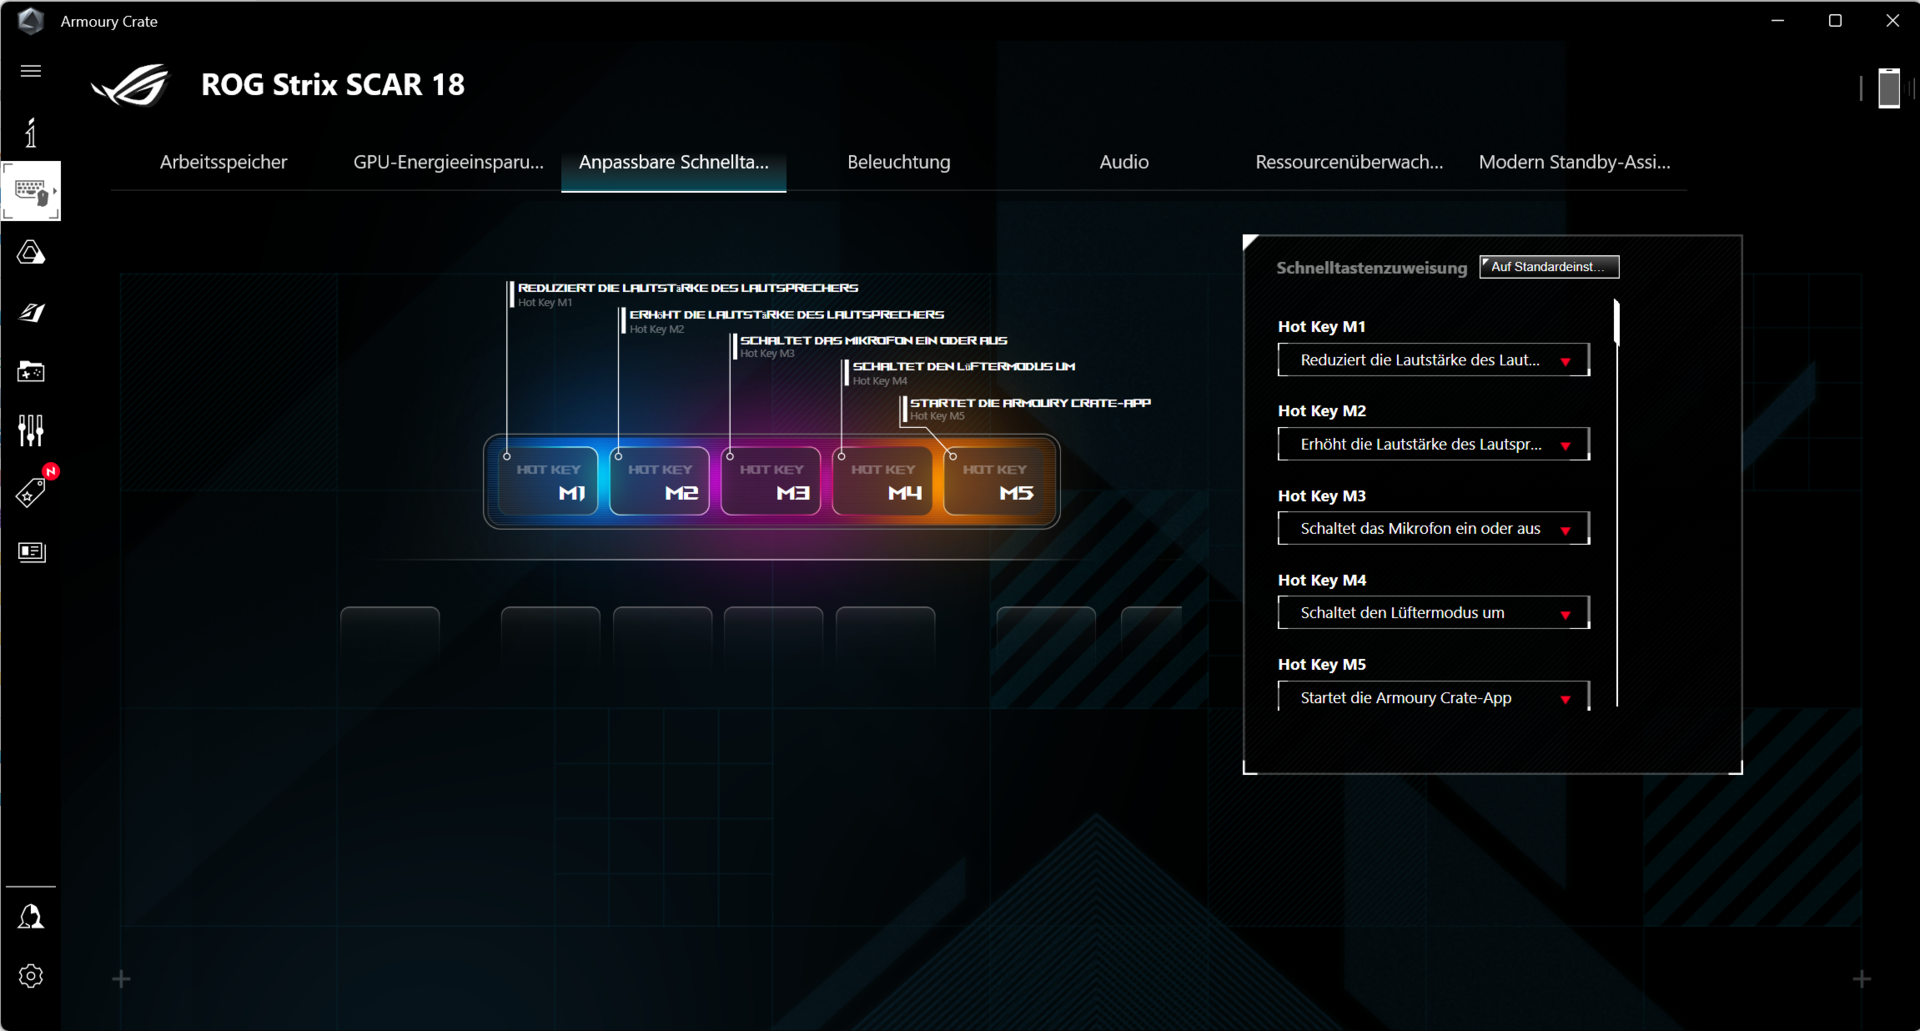
Conditions d'essai
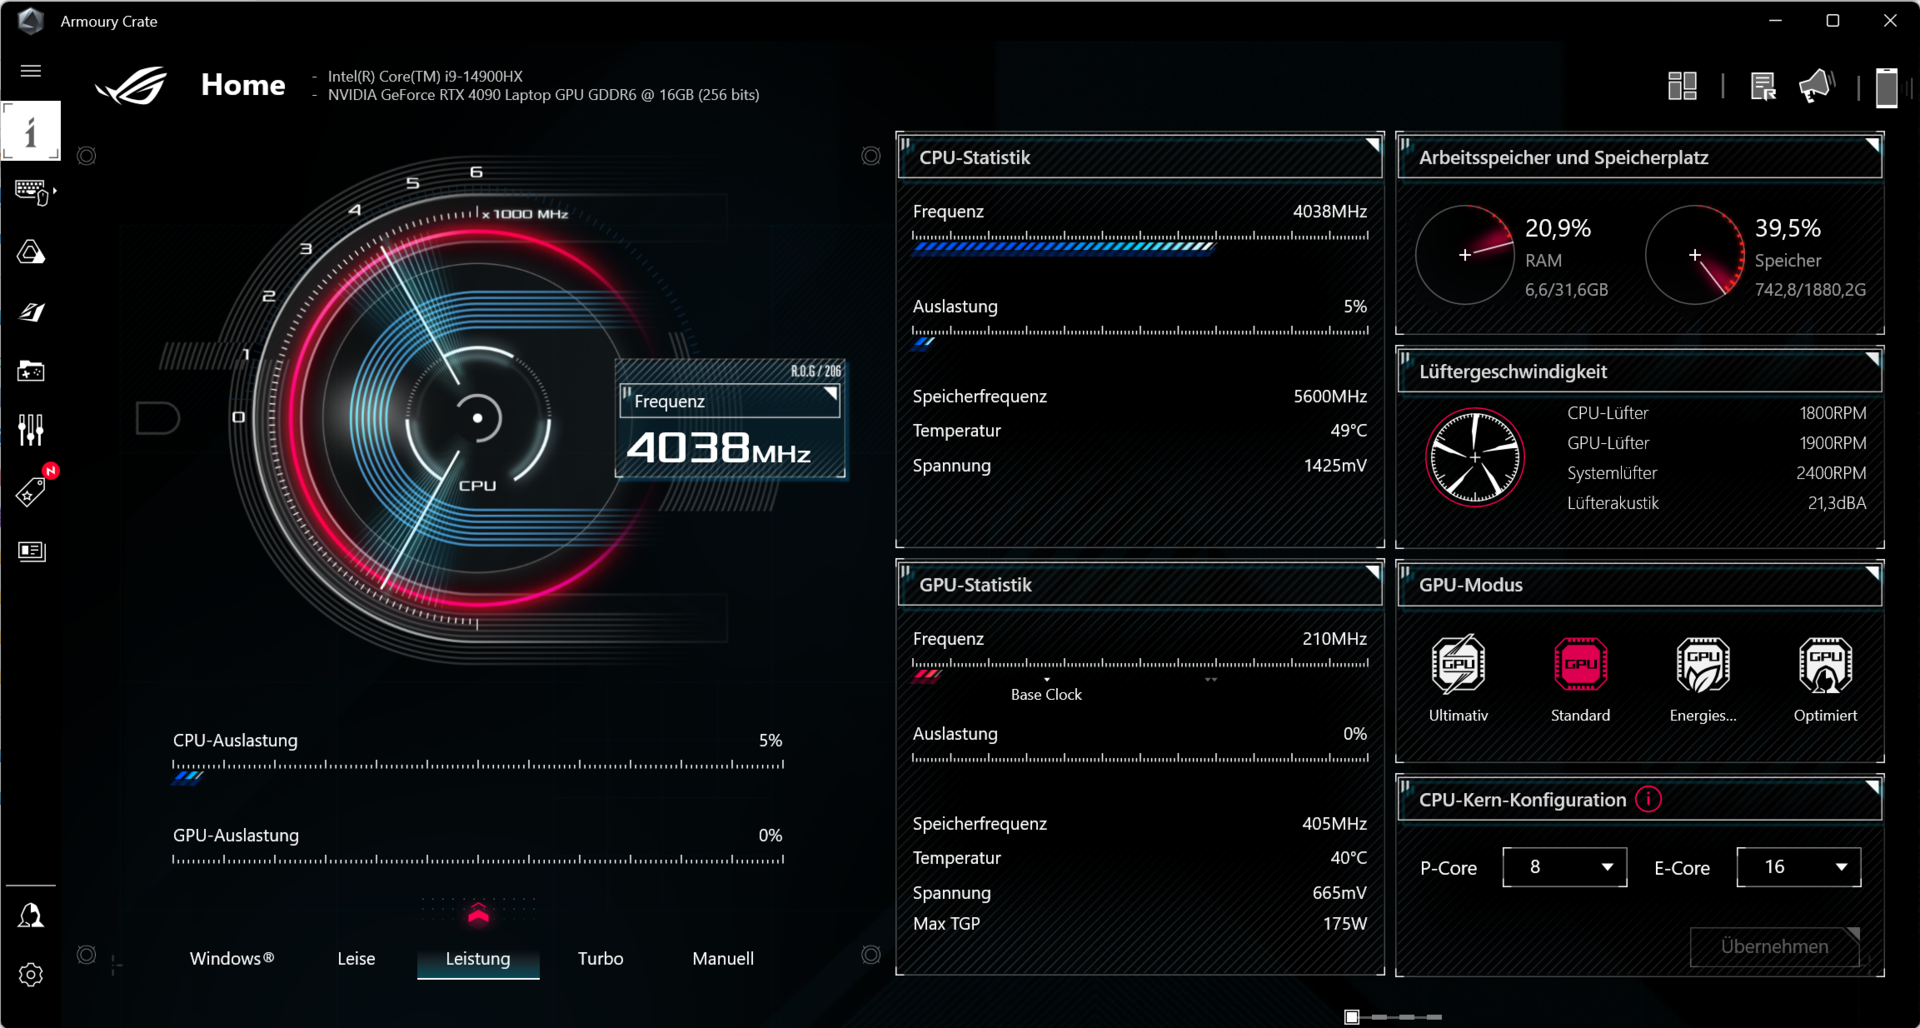
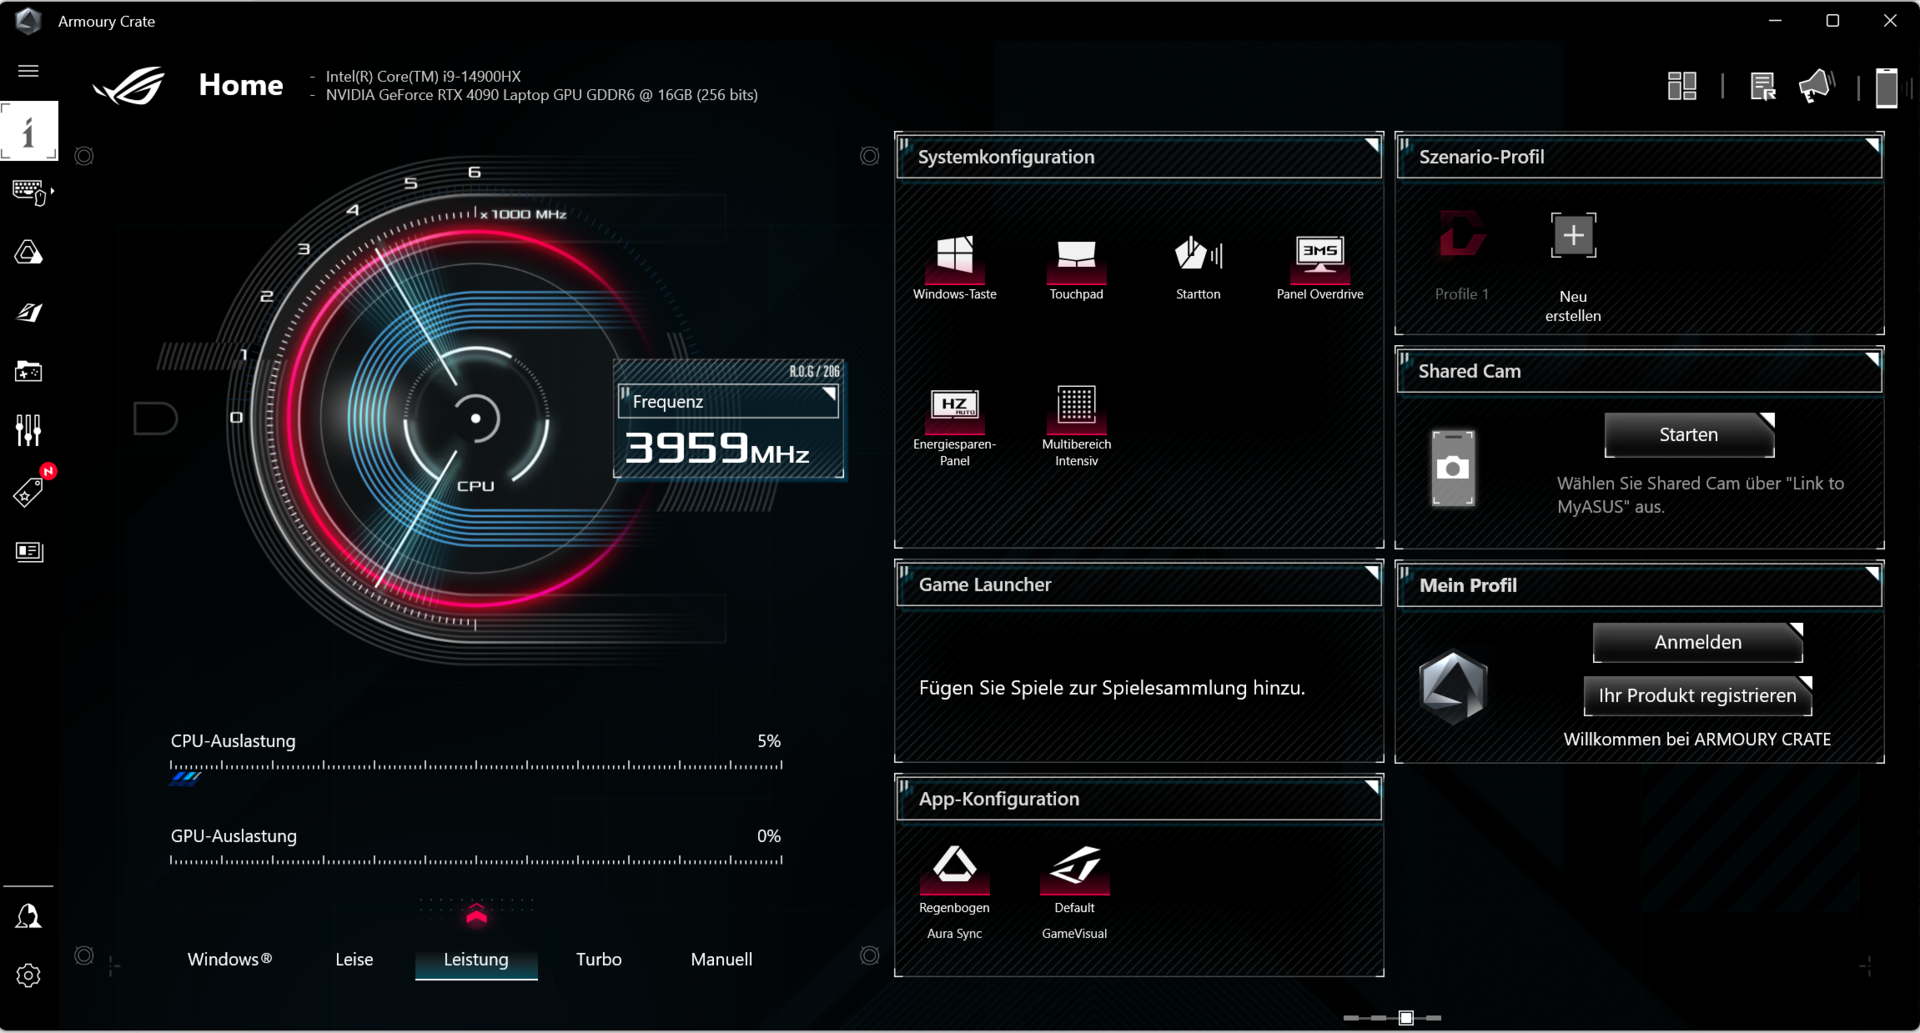
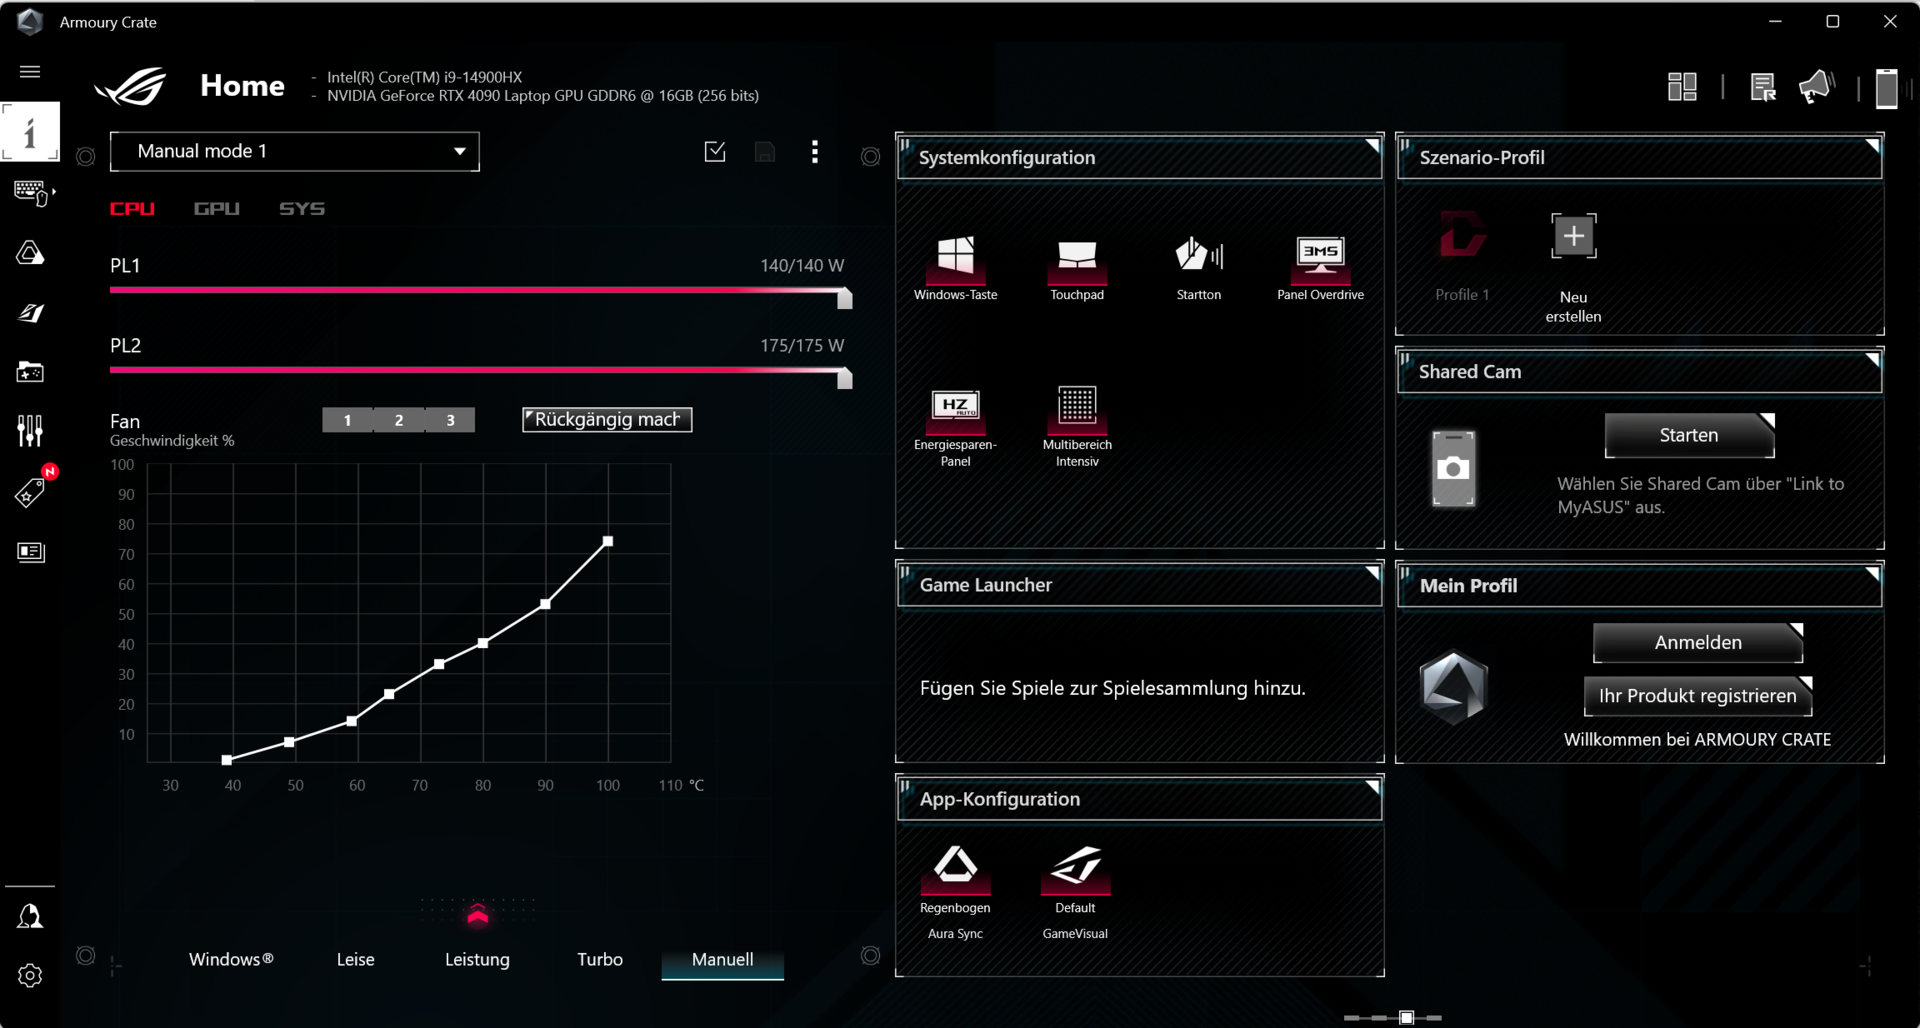
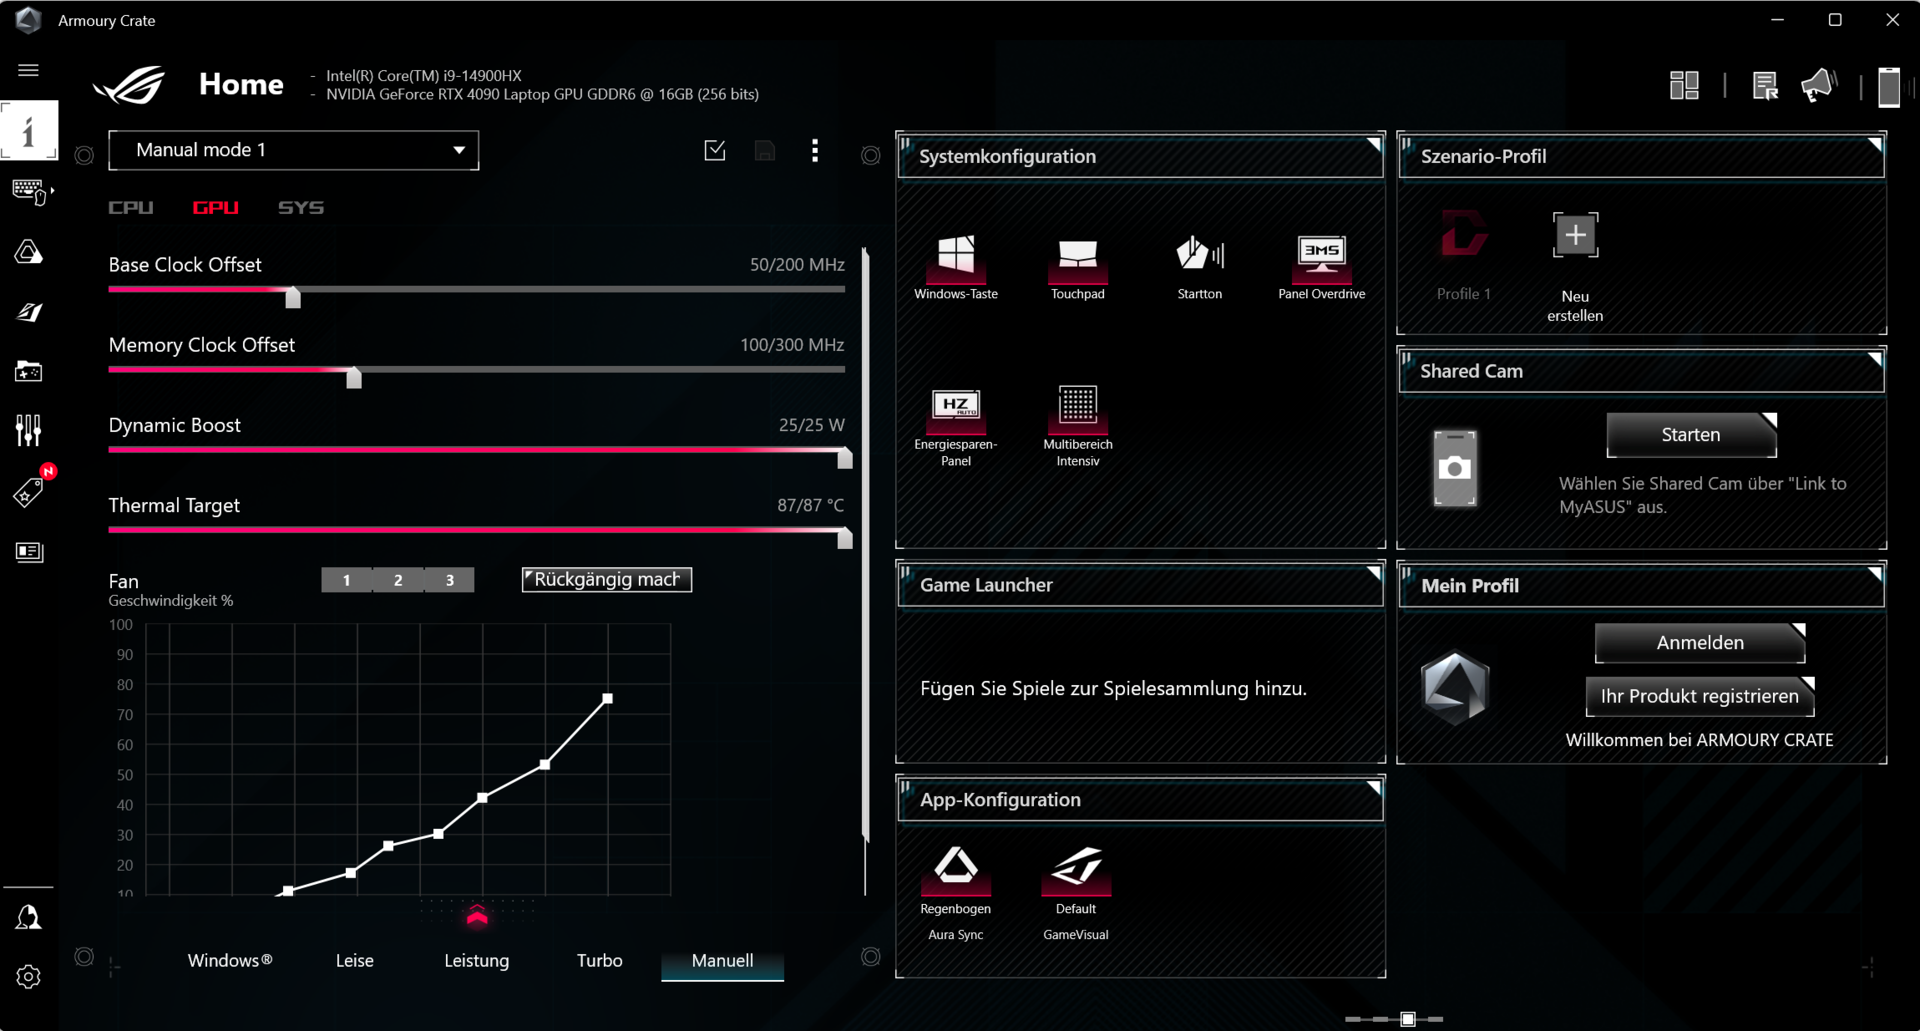
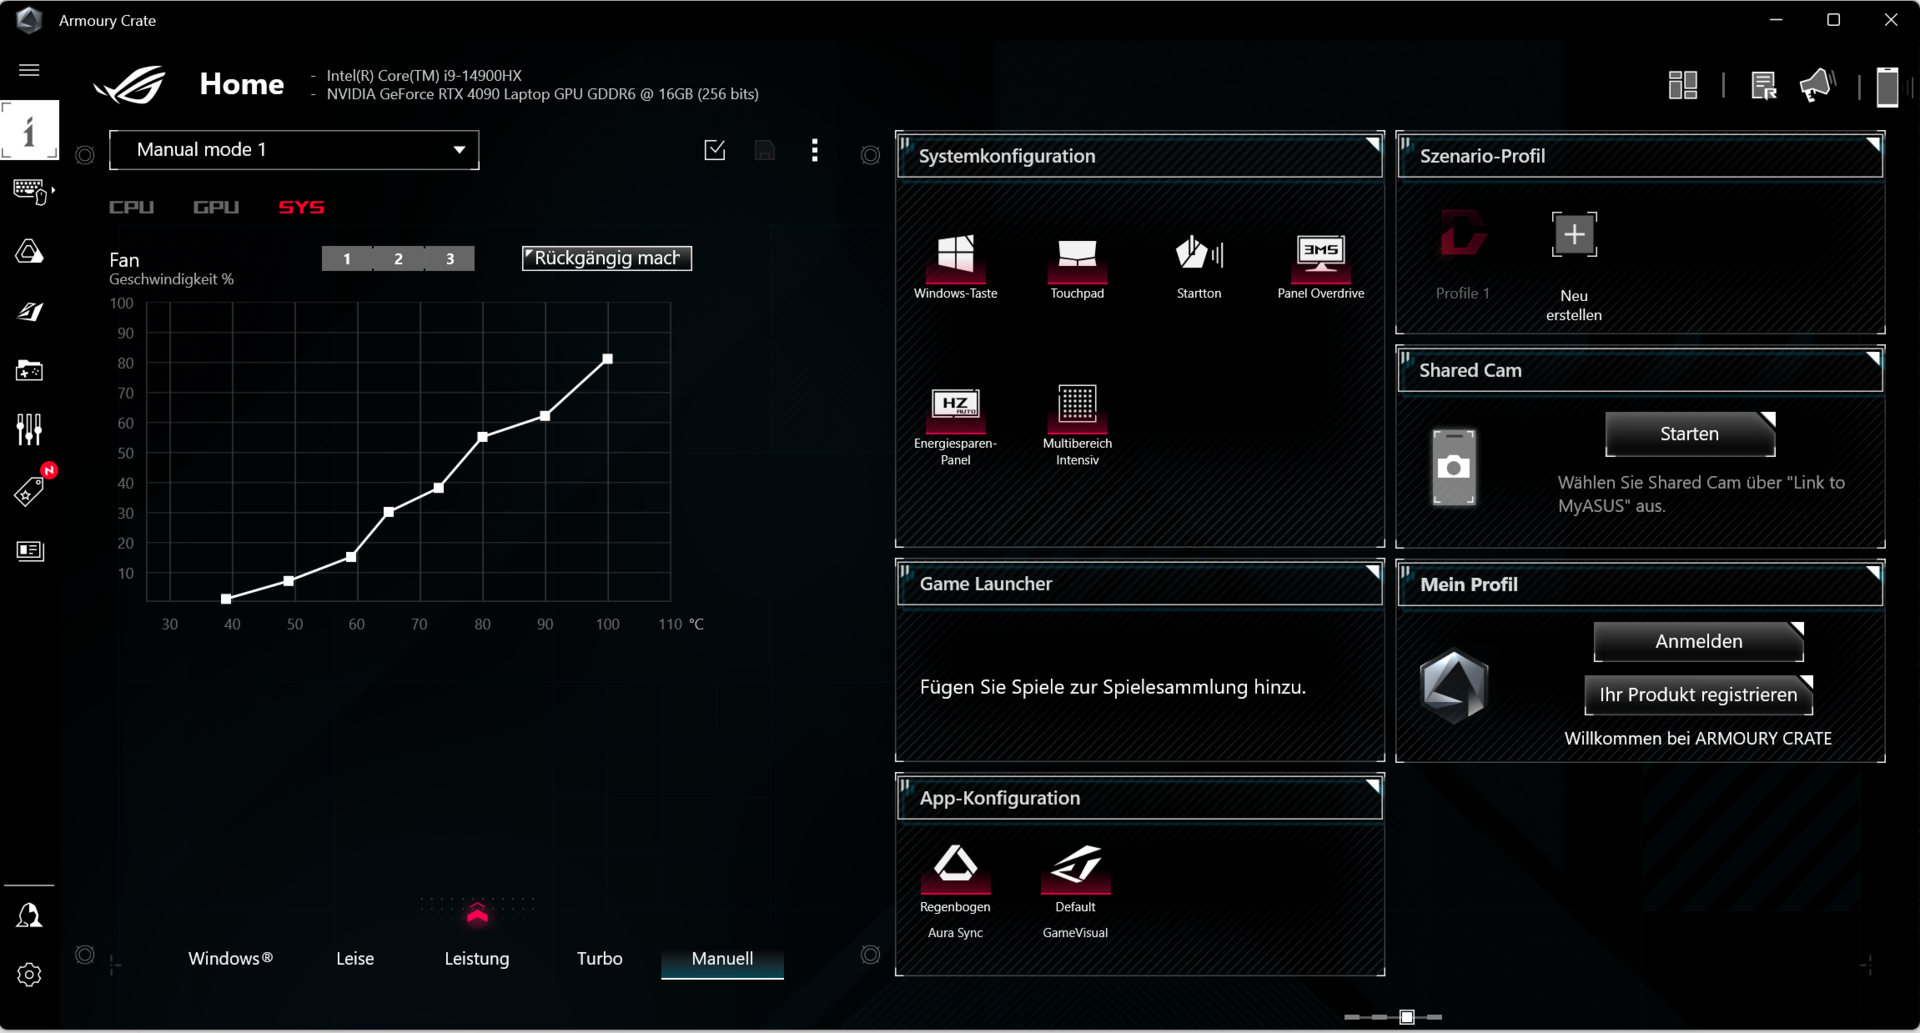
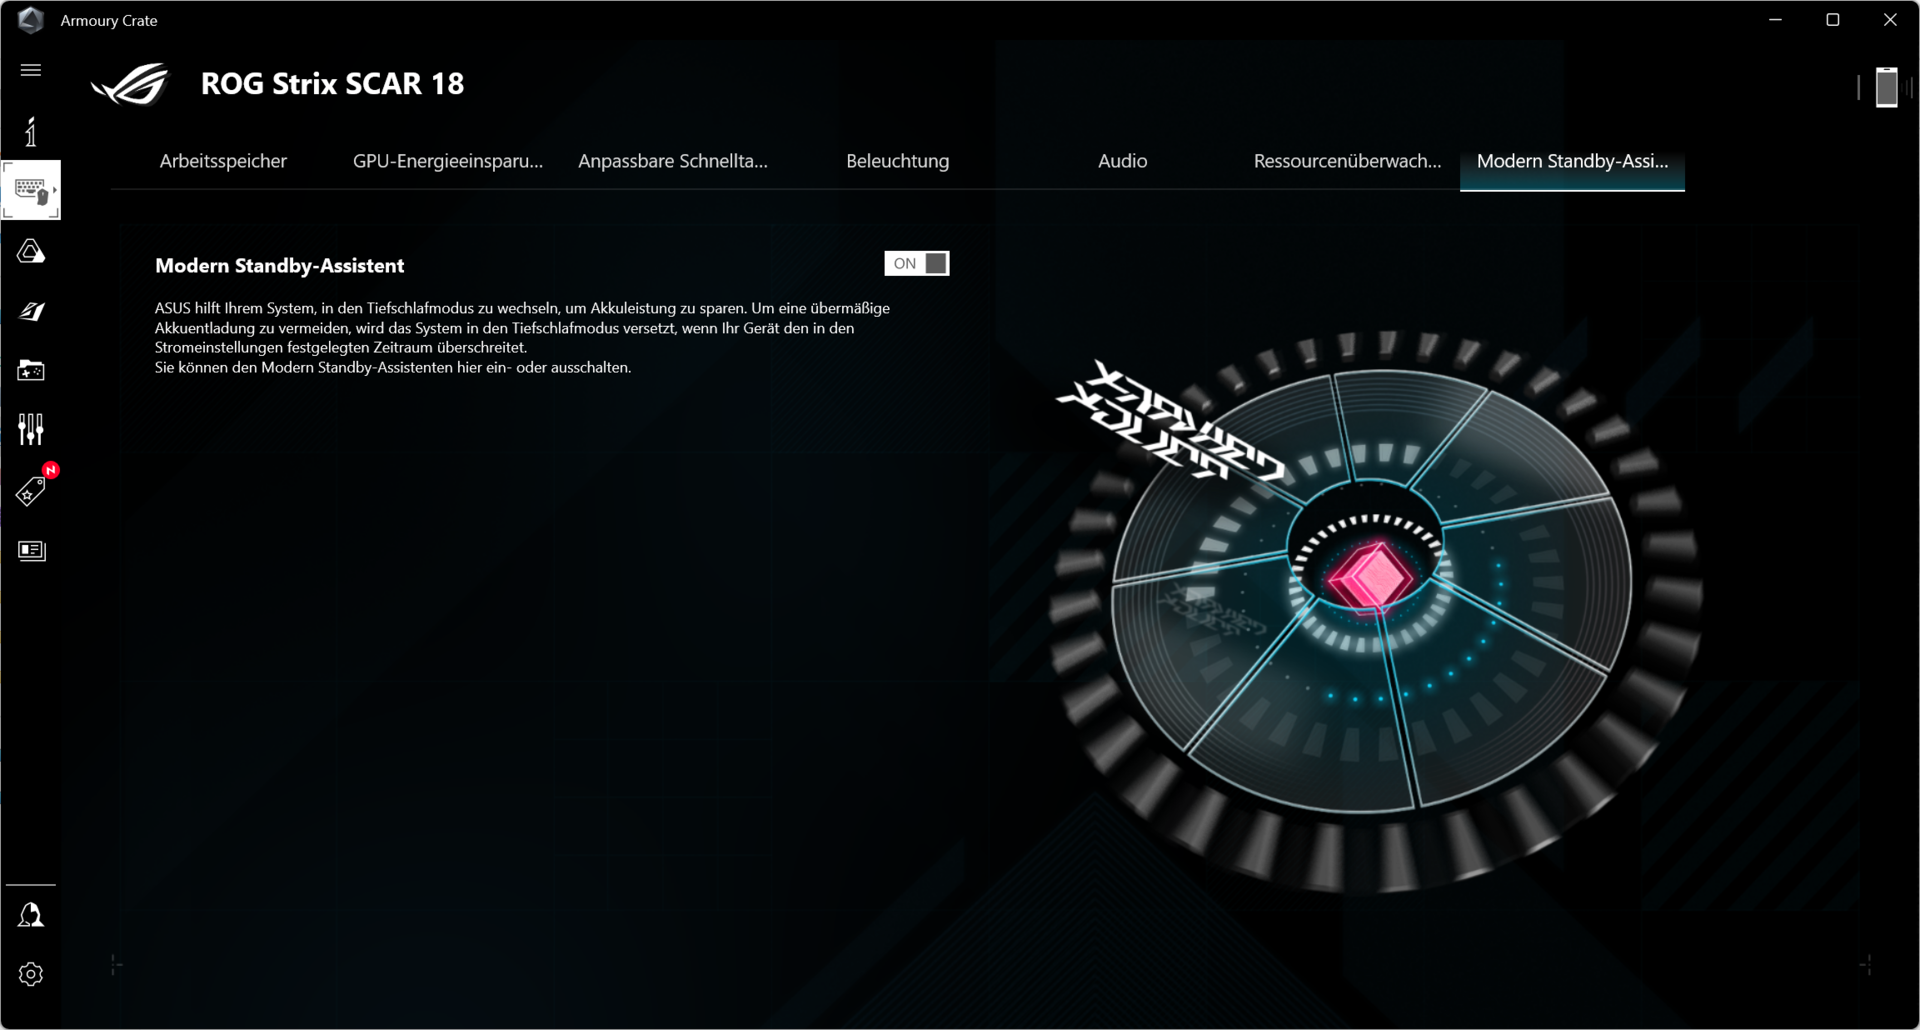
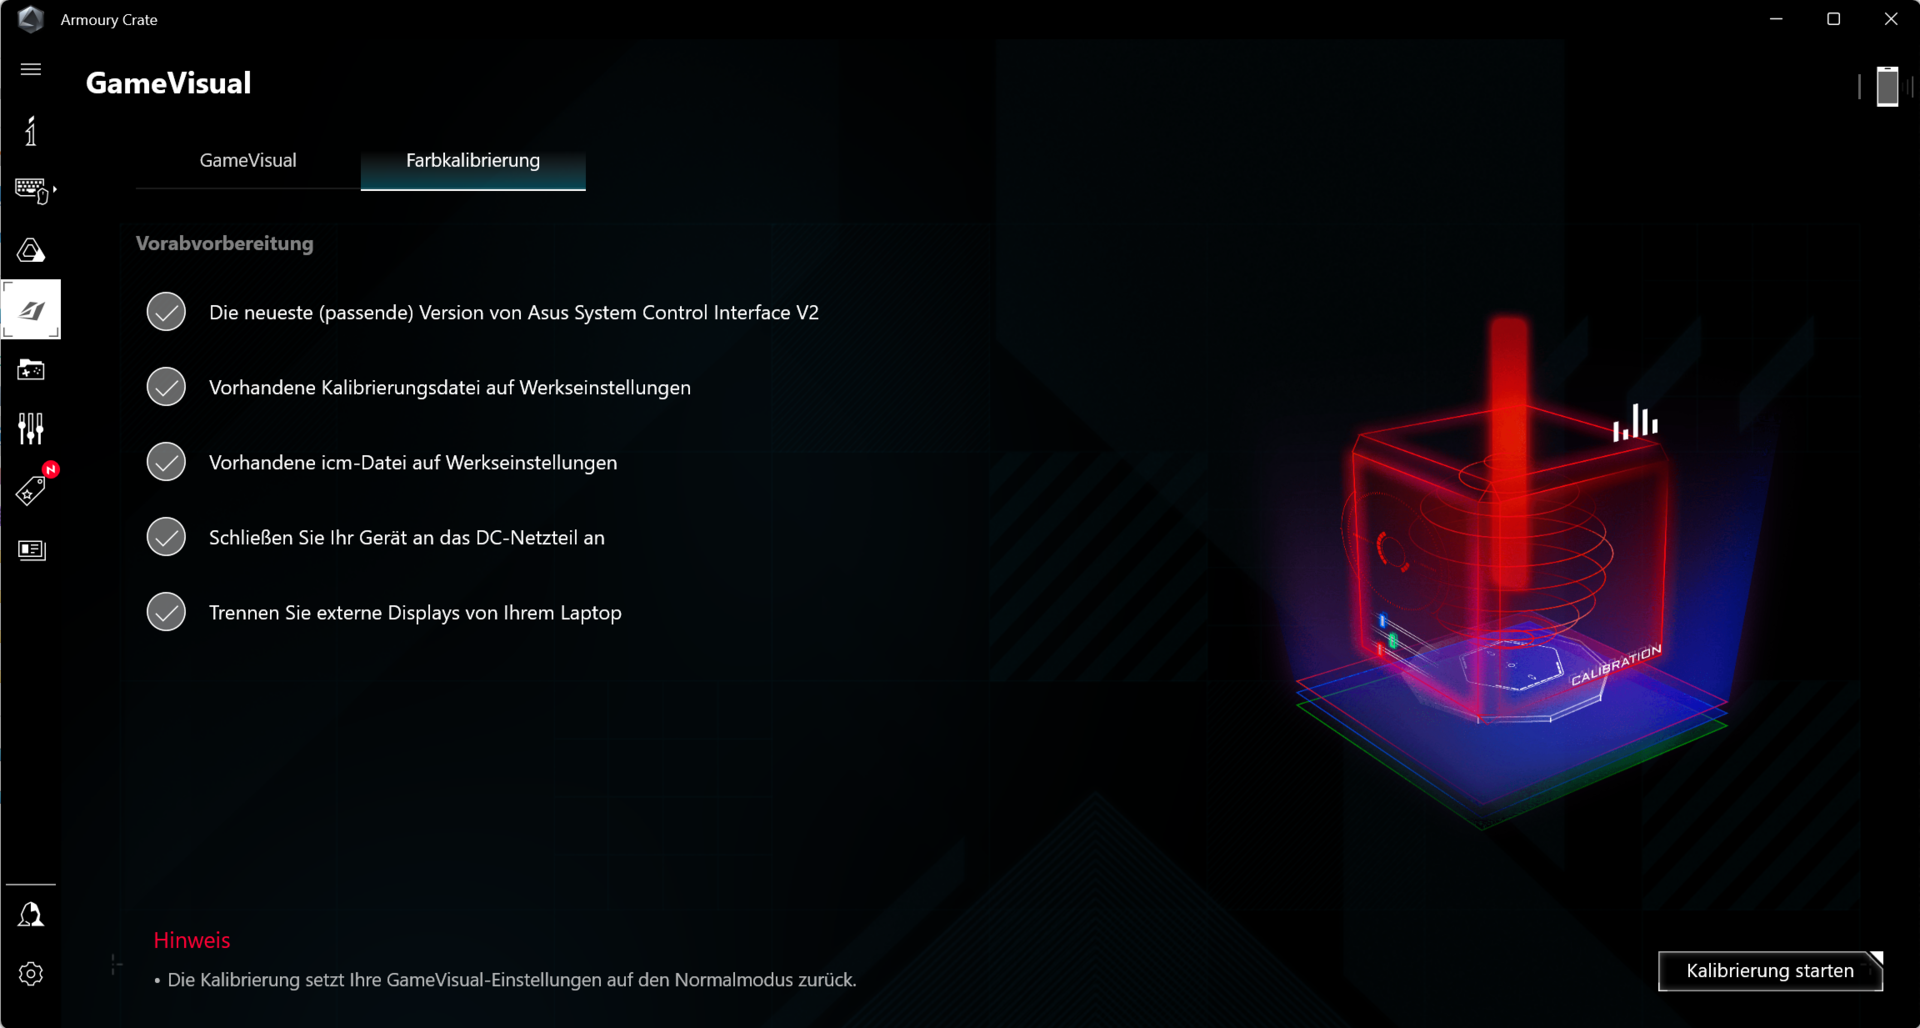
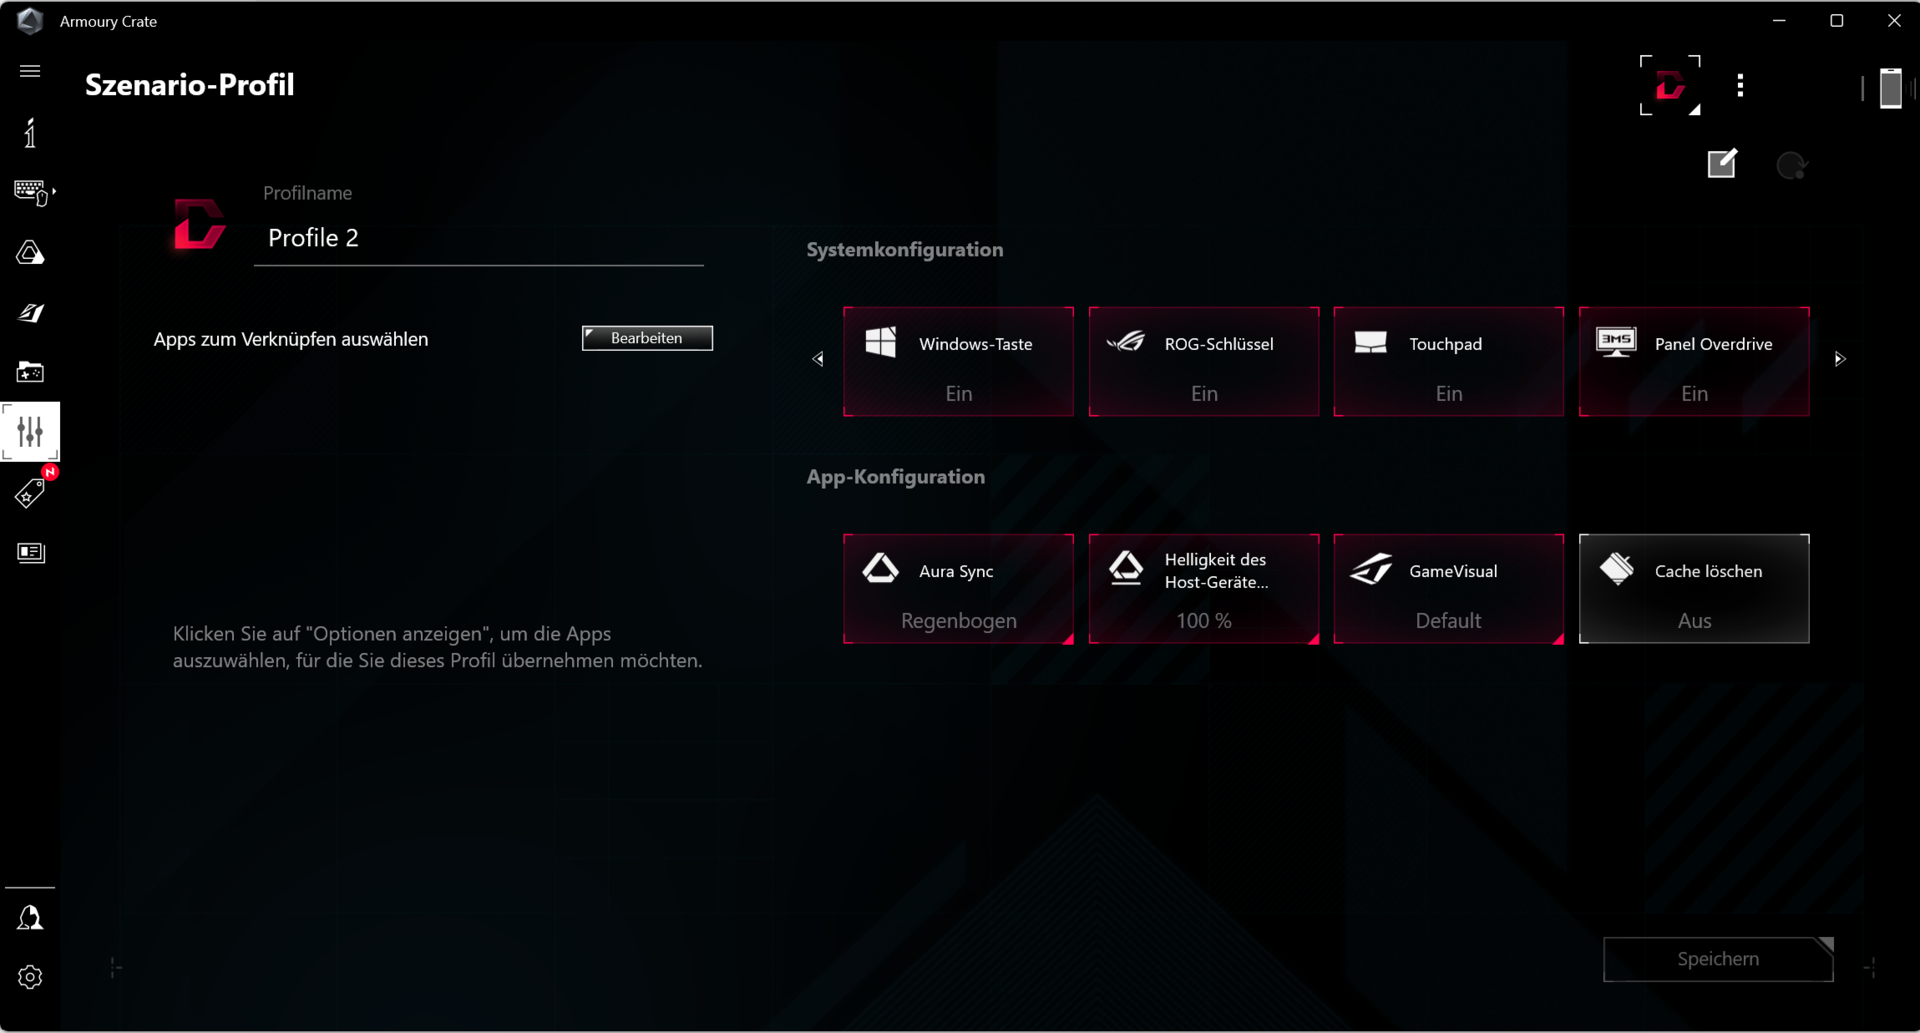
Trois modes d'alimentation préconfigurés par Asus sont disponibles (voir tableau), et vous pouvez passer de l'un à l'autre en utilisant la combinaison de touches Fn + F5. Nous utilisons le mode "Performance" pour nos benchmarks et le mode "Silent" pour nos tests de batterie. Le mode GPU est réglé sur "Standard". Le centre de contrôle ("Armory Crate") de l'ordinateur portable permet de créer des profils individuels ("Manuel") comprenant le réglage des limites de puissance, le Dynamic Boost, et les courbes de ventilateur.
| Performance | Turbo | Silencieux | |
|---|---|---|---|
| Limite de puissance 1 (HWInfo) | 110 Watt | 175 Watt | 65 Watt |
| Limite de puissance 2 (HWInfo) | 120 Watt | 175 Watt | 100 Watt |
| Bruit (Le Witcher 3) | 50 dB(A) | 56 dB(A) | 35 dB(A) |
| Performances (Le Witcher 3) | ~188 fps | ~183 fps | ~68 fps |
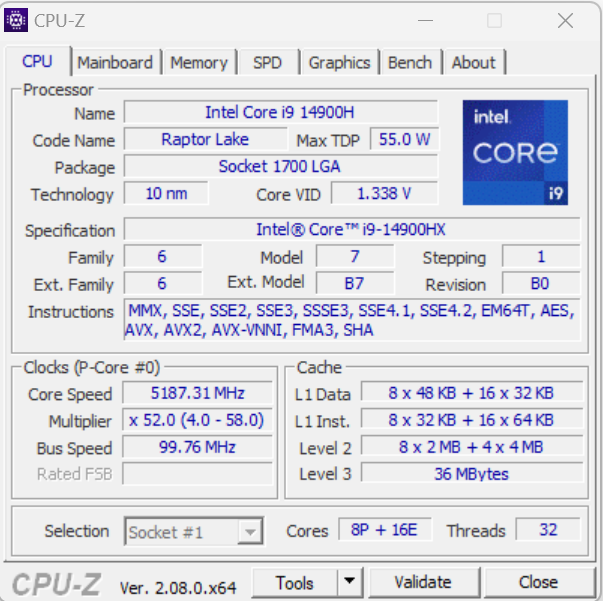
Processeur
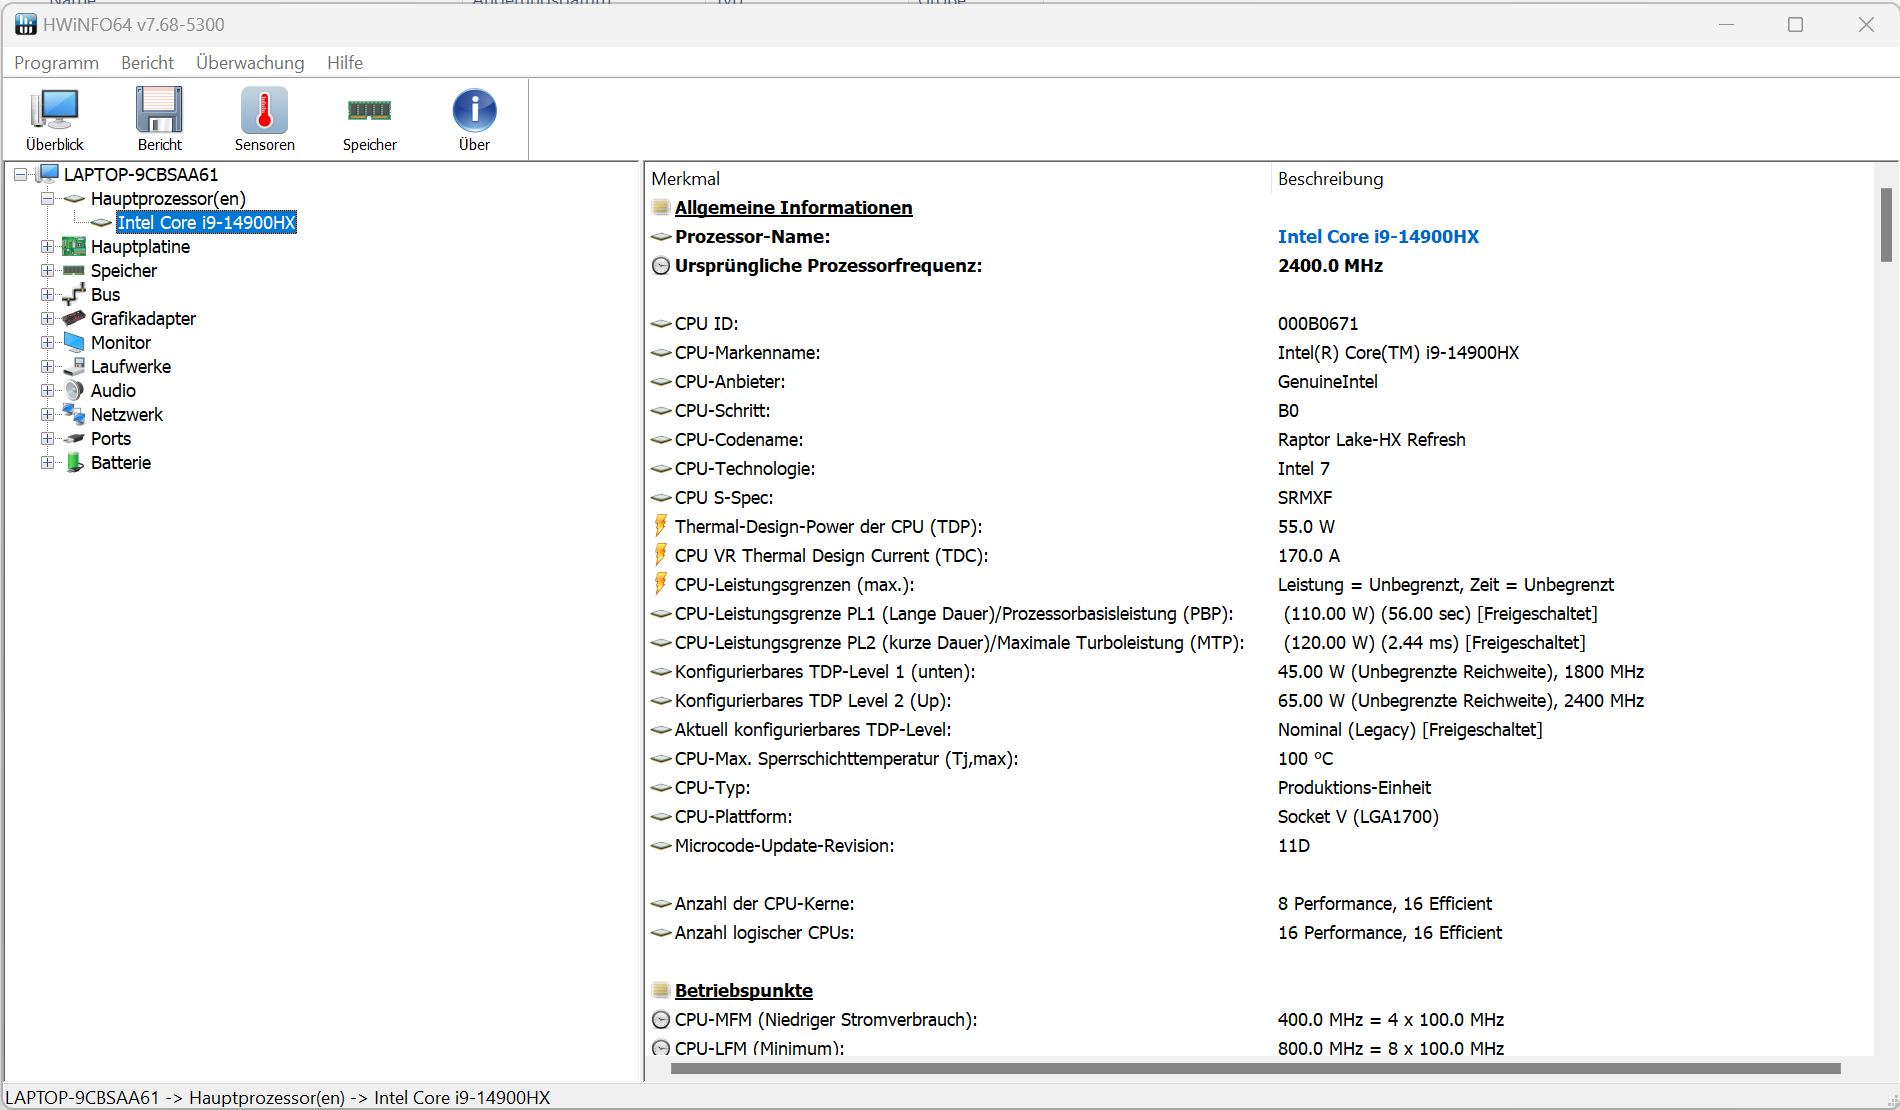
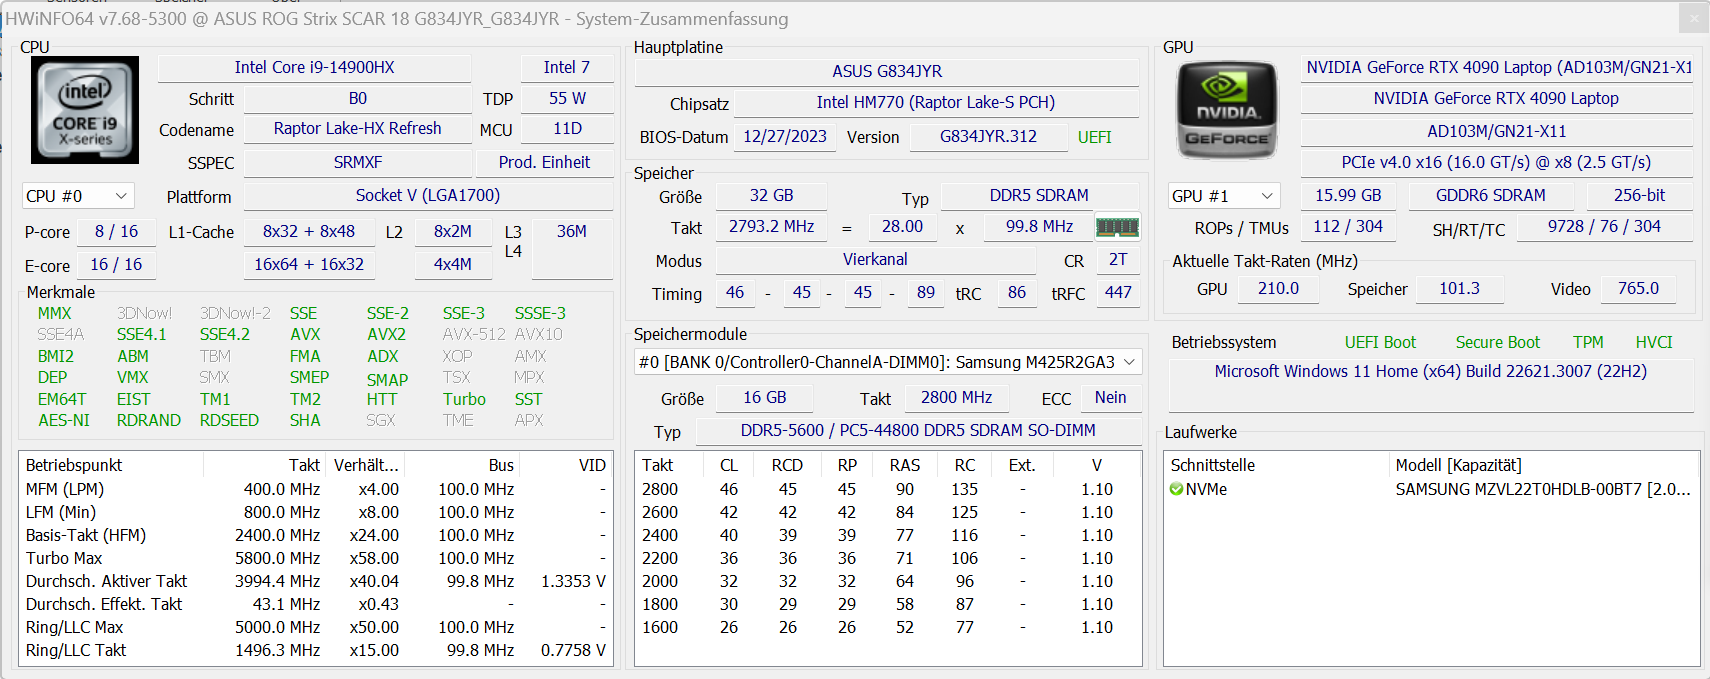
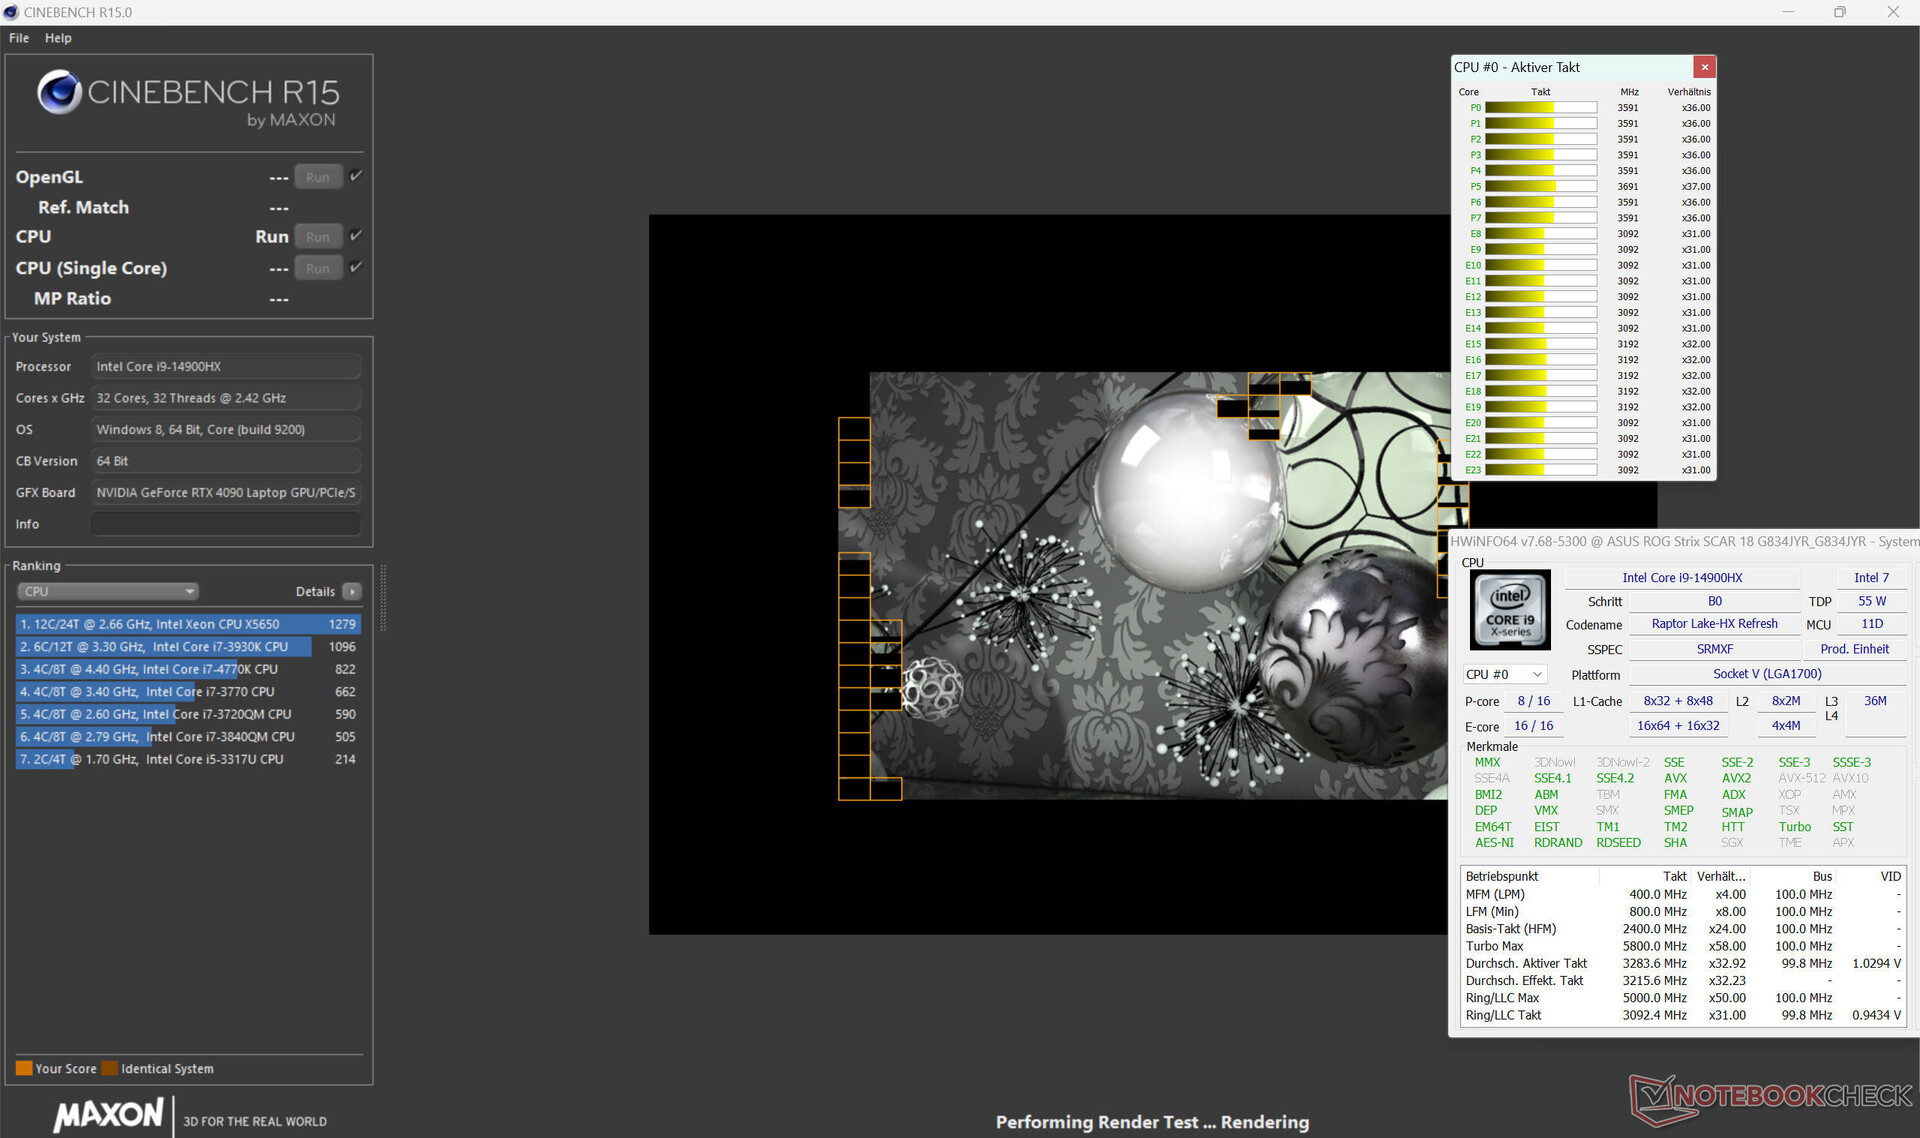
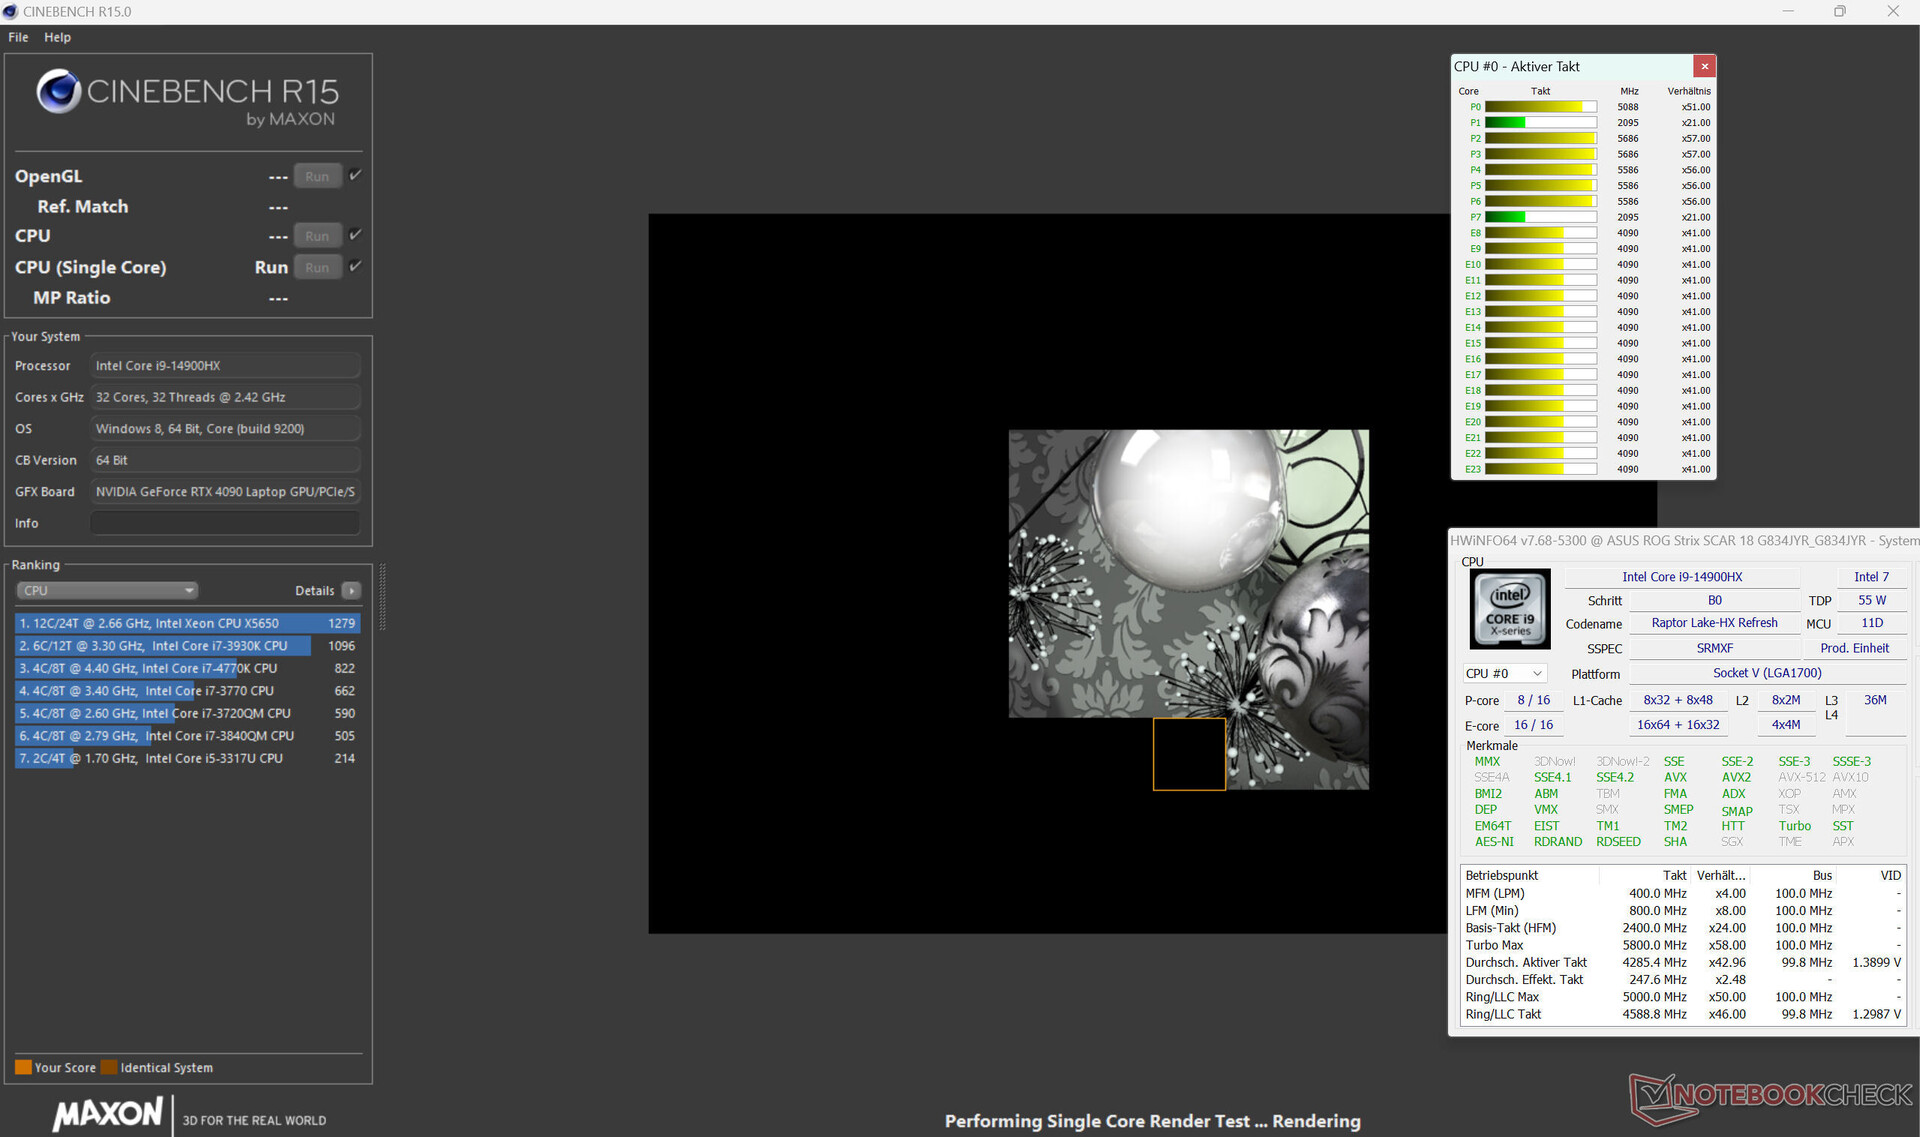
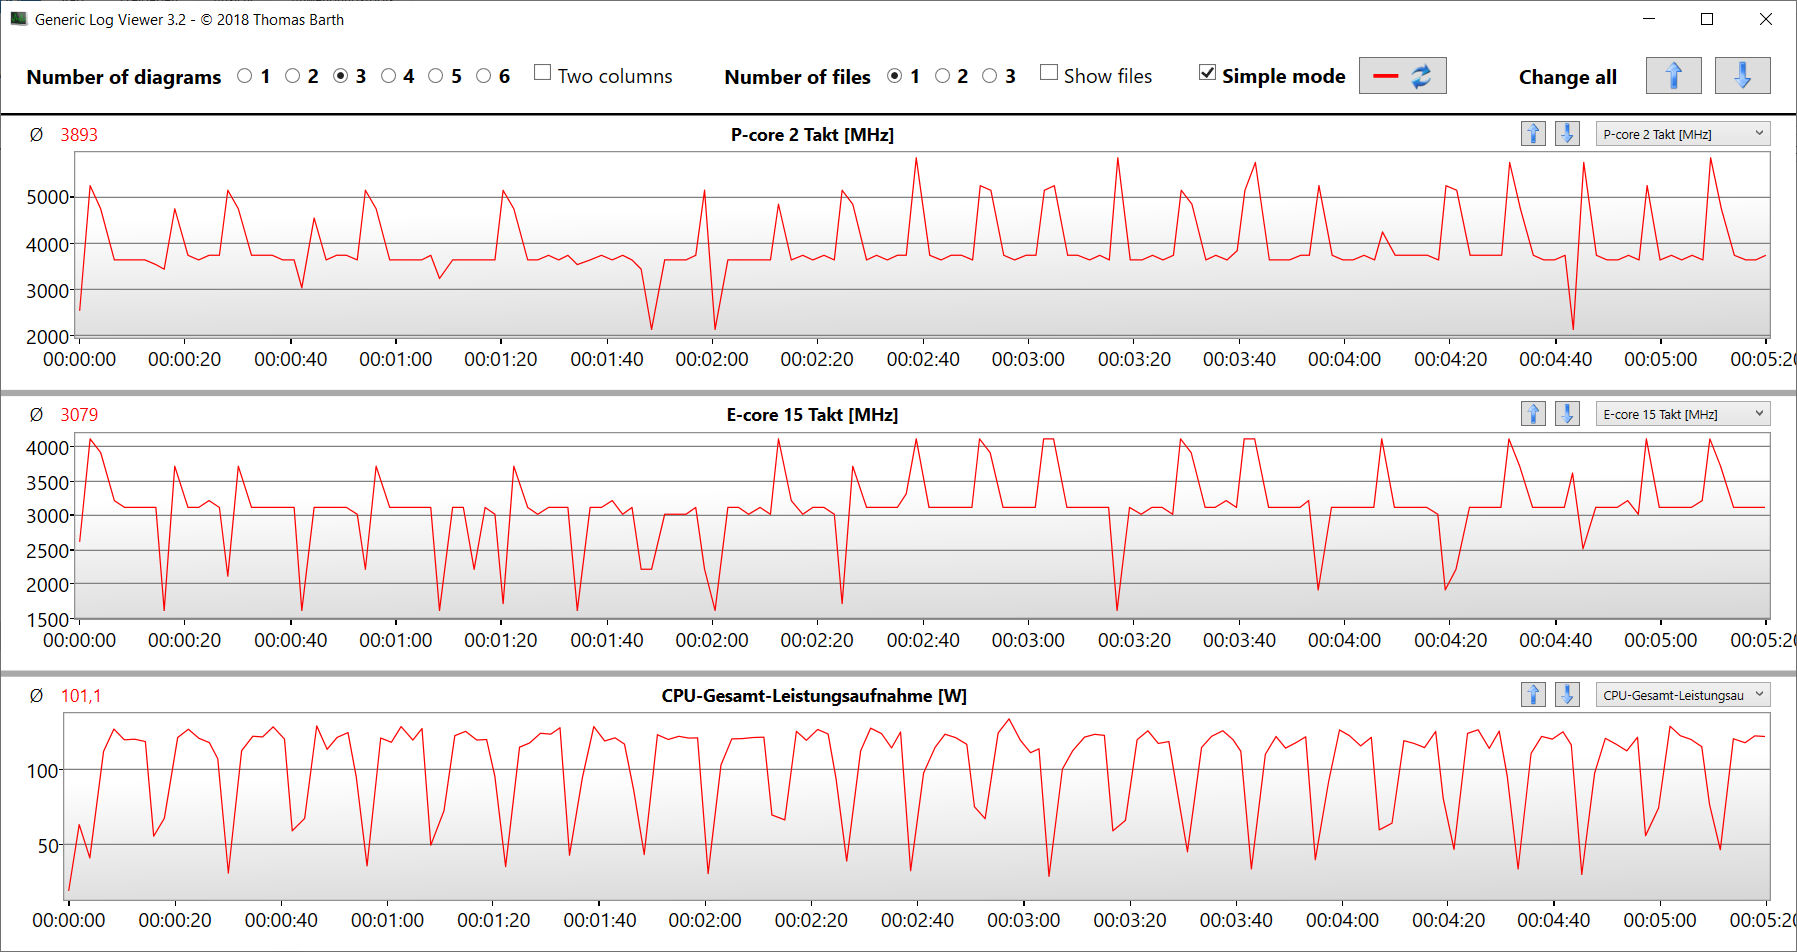
Les 24 cœurs de CPU (8P + 16E = 32 threads) du Core i9-14900HX (Raptor Lake) atteignent des vitesses d'horloge maximales de 5,8 GHz (cœurs P) et de 4,1 GHz (cœurs E). Le CPU réagit à une charge multithread constante (CB15 Loop) avec une vitesse Turbo qui reste constamment élevée. Vous trouverez plus d'informations sur le Core i9 dans notre analyse.
Le choix du profil de puissance n'a qu'une influence limitée sur les performances monofilaires, mais a plus d'influence sur les performances multi-filières. En sélectionnant "Performance", vous obtenez des valeurs de référence inférieures à la moyenne du CPU déterminée jusqu'à présent, tandis qu'en sélectionnant "Turbo", vous obtenez des résultats légèrement supérieurs à la moyenne. Les performances de l'unité de traitement unique, qui sont plus importantes au quotidien, se situent au même niveau sur secteur et sur batterie, mais les performances de l'unité de traitement multiple chutent de manière significative sur batterie.
Cinebench R15 Multi Constant Load Test
| CPU Performance rating - Percent | |
| Alienware m18 R1 AMD | |
| Asus ROG Strix Scar 18 G834JYR (2024) | |
| Asus ROG Strix Scar 18 2023 G834JY-N6005W -2! | |
| Alienware m18 R1 -2! | |
| MSI Titan 18 HX A14VIG | |
| Acer Predator Helios 18 N23Q2 | |
| Asus ROG Strix Scar 18 G834JYR (2024) | |
| Moyenne Intel Core i9-14900HX | |
| Razer Blade 18 RTX 4070 -2! | |
| Moyenne de la classe Gaming | |
| Cinebench R20 | |
| CPU (Multi Core) | |
| Alienware m18 R1 AMD | |
| Alienware m18 R1 | |
| Asus ROG Strix Scar 18 G834JYR (2024) (Turbo) | |
| MSI Titan 18 HX A14VIG | |
| Asus ROG Strix Scar 18 2023 G834JY-N6005W | |
| Acer Predator Helios 18 N23Q2 | |
| Moyenne Intel Core i9-14900HX (6579 - 13832, n=37) | |
| Razer Blade 18 RTX 4070 | |
| Asus ROG Strix Scar 18 G834JYR (2024) | |
| Moyenne de la classe Gaming (4029 - 16433, n=106, 2 dernières années) | |
| CPU (Single Core) | |
| Asus ROG Strix Scar 18 G834JYR (2024) (Turbo) | |
| Asus ROG Strix Scar 18 G834JYR (2024) | |
| Asus ROG Strix Scar 18 2023 G834JY-N6005W | |
| Moyenne Intel Core i9-14900HX (657 - 859, n=37) | |
| MSI Titan 18 HX A14VIG | |
| Alienware m18 R1 | |
| Acer Predator Helios 18 N23Q2 | |
| Razer Blade 18 RTX 4070 | |
| Moyenne de la classe Gaming (442 - 913, n=106, 2 dernières années) | |
| Alienware m18 R1 AMD | |
| Blender - v2.79 BMW27 CPU | |
| Moyenne de la classe Gaming (79 - 330, n=104, 2 dernières années) | |
| Moyenne Intel Core i9-14900HX (91 - 206, n=37) | |
| Asus ROG Strix Scar 18 G834JYR (2024) | |
| Razer Blade 18 RTX 4070 | |
| Asus ROG Strix Scar 18 G834JYR (2024) (Turbo) | |
| Acer Predator Helios 18 N23Q2 | |
| MSI Titan 18 HX A14VIG | |
| Asus ROG Strix Scar 18 2023 G834JY-N6005W | |
| Alienware m18 R1 | |
| Alienware m18 R1 AMD | |
| Geekbench 6.7 | |
| Multi-Core | |
| Asus ROG Strix Scar 18 G834JYR (2024) (6.2.1, Turbo) | |
| Acer Predator Helios 18 N23Q2 | |
| Asus ROG Strix Scar 18 G834JYR (2024) (6.2.1) | |
| Moyenne Intel Core i9-14900HX (13158 - 19665, n=37) | |
| MSI Titan 18 HX A14VIG (6.2.1) | |
| Alienware m18 R1 AMD | |
| Moyenne de la classe Gaming (6625 - 22850, n=106, 2 dernières années) | |
| Single-Core | |
| Asus ROG Strix Scar 18 G834JYR (2024) (6.2.1, Turbo) | |
| Asus ROG Strix Scar 18 G834JYR (2024) (6.2.1) | |
| Moyenne Intel Core i9-14900HX (2419 - 3129, n=37) | |
| Acer Predator Helios 18 N23Q2 | |
| Alienware m18 R1 AMD | |
| Moyenne de la classe Gaming (1490 - 3259, n=106, 2 dernières années) | |
| MSI Titan 18 HX A14VIG (6.2.1) | |
| HWBOT x265 Benchmark v2.2 - 4k Preset | |
| Alienware m18 R1 AMD | |
| Asus ROG Strix Scar 18 2023 G834JY-N6005W | |
| Alienware m18 R1 | |
| Asus ROG Strix Scar 18 G834JYR (2024) (Turbo) | |
| Razer Blade 18 RTX 4070 | |
| MSI Titan 18 HX A14VIG | |
| Acer Predator Helios 18 N23Q2 | |
| Moyenne Intel Core i9-14900HX (16.8 - 38.9, n=37) | |
| Asus ROG Strix Scar 18 G834JYR (2024) | |
| Moyenne de la classe Gaming (11.5 - 44.4, n=105, 2 dernières années) | |
| LibreOffice - 20 Documents To PDF | |
| Moyenne de la classe Gaming (33.2 - 88.8, n=105, 2 dernières années) | |
| Acer Predator Helios 18 N23Q2 | |
| Alienware m18 R1 | |
| MSI Titan 18 HX A14VIG (6.3.4.2) | |
| Asus ROG Strix Scar 18 G834JYR (2024) (6.3.4.2) | |
| Razer Blade 18 RTX 4070 | |
| Moyenne Intel Core i9-14900HX (19 - 85.1, n=37) | |
| Alienware m18 R1 AMD (6.3.4.2) | |
| Asus ROG Strix Scar 18 G834JYR (2024) (6.3.4.2, Turbo) | |
| Asus ROG Strix Scar 18 2023 G834JY-N6005W | |
| R Benchmark 2.5 - Overall mean | |
| Moyenne de la classe Gaming (0.3439 - 0.759, n=106, 2 dernières années) | |
| Alienware m18 R1 AMD | |
| Acer Predator Helios 18 N23Q2 | |
| Razer Blade 18 RTX 4070 | |
| Asus ROG Strix Scar 18 G834JYR (2024) | |
| Alienware m18 R1 | |
| MSI Titan 18 HX A14VIG | |
| Moyenne Intel Core i9-14900HX (0.3604 - 0.4859, n=37) | |
| Asus ROG Strix Scar 18 2023 G834JY-N6005W | |
| Asus ROG Strix Scar 18 G834JYR (2024) (Turbo) | |
* ... Moindre est la valeur, meilleures sont les performances
AIDA64: FP32 Ray-Trace | FPU Julia | CPU SHA3 | CPU Queen | FPU SinJulia | FPU Mandel | CPU AES | CPU ZLib | FP64 Ray-Trace | CPU PhotoWorxx
| Performance rating | |
| Alienware m18 R1 AMD | |
| Acer Predator Helios 18 N23Q2 | |
| Alienware m18 R1 | |
| MSI Titan 18 HX A14VIG | |
| Asus ROG Strix Scar 18 2023 G834JY-N6005W | |
| Asus ROG Strix Scar 18 G834JYR (2024) | |
| Razer Blade 18 RTX 4070 | |
| Asus ROG Strix Scar 18 G834JYR (2024) | |
| Moyenne de la classe Gaming | |
| Moyenne Intel Core i9-14900HX | |
| AIDA64 / FP32 Ray-Trace | |
| Alienware m18 R1 AMD (v6.85.6300) | |
| Moyenne de la classe Gaming (10227 - 85542, n=105, 2 dernières années) | |
| Alienware m18 R1 (v6.85.6300) | |
| MSI Titan 18 HX A14VIG (v6.92.6600) | |
| Asus ROG Strix Scar 18 2023 G834JY-N6005W (v6.85.6300) | |
| Acer Predator Helios 18 N23Q2 (v6.85.6300) | |
| Asus ROG Strix Scar 18 G834JYR (2024) (v6.92.6600, Turbo) | |
| Razer Blade 18 RTX 4070 (v6.85.6300) | |
| Asus ROG Strix Scar 18 G834JYR (2024) (v6.92.6600) | |
| Moyenne Intel Core i9-14900HX (13098 - 33474, n=36) | |
| AIDA64 / FPU Julia | |
| Alienware m18 R1 AMD (v6.85.6300) | |
| MSI Titan 18 HX A14VIG (v6.92.6600) | |
| Alienware m18 R1 (v6.85.6300) | |
| Moyenne de la classe Gaming (51376 - 238426, n=105, 2 dernières années) | |
| Asus ROG Strix Scar 18 2023 G834JY-N6005W (v6.85.6300) | |
| Asus ROG Strix Scar 18 G834JYR (2024) (v6.92.6600, Turbo) | |
| Acer Predator Helios 18 N23Q2 (v6.85.6300) | |
| Razer Blade 18 RTX 4070 (v6.85.6300) | |
| Asus ROG Strix Scar 18 G834JYR (2024) (v6.92.6600) | |
| Moyenne Intel Core i9-14900HX (67573 - 166040, n=36) | |
| AIDA64 / CPU SHA3 | |
| Alienware m18 R1 AMD (v6.85.6300) | |
| MSI Titan 18 HX A14VIG (v6.92.6600) | |
| Alienware m18 R1 (v6.85.6300) | |
| Asus ROG Strix Scar 18 2023 G834JY-N6005W (v6.85.6300) | |
| Acer Predator Helios 18 N23Q2 (v6.85.6300) | |
| Asus ROG Strix Scar 18 G834JYR (2024) (v6.92.6600, Turbo) | |
| Moyenne de la classe Gaming (2180 - 10115, n=105, 2 dernières années) | |
| Razer Blade 18 RTX 4070 (v6.85.6300) | |
| Asus ROG Strix Scar 18 G834JYR (2024) (v6.92.6600) | |
| Moyenne Intel Core i9-14900HX (3589 - 7979, n=36) | |
| AIDA64 / CPU Queen | |
| Alienware m18 R1 AMD (v6.85.6300) | |
| MSI Titan 18 HX A14VIG (v6.92.6600) | |
| Alienware m18 R1 (v6.85.6300) | |
| Asus ROG Strix Scar 18 G834JYR (2024) (v6.92.6600) | |
| Asus ROG Strix Scar 18 G834JYR (2024) (v6.92.6600, Turbo) | |
| Asus ROG Strix Scar 18 2023 G834JY-N6005W (v6.85.6300) | |
| Moyenne Intel Core i9-14900HX (118405 - 148966, n=36) | |
| Razer Blade 18 RTX 4070 (v6.85.6300) | |
| Acer Predator Helios 18 N23Q2 (v6.85.6300) | |
| Moyenne de la classe Gaming (49785 - 173351, n=90, 2 dernières années) | |
| AIDA64 / FPU SinJulia | |
| Alienware m18 R1 AMD (v6.85.6300) | |
| MSI Titan 18 HX A14VIG (v6.92.6600) | |
| Asus ROG Strix Scar 18 2023 G834JY-N6005W (v6.85.6300) | |
| Alienware m18 R1 (v6.85.6300) | |
| Asus ROG Strix Scar 18 G834JYR (2024) (v6.92.6600, Turbo) | |
| Asus ROG Strix Scar 18 G834JYR (2024) (v6.92.6600) | |
| Razer Blade 18 RTX 4070 (v6.85.6300) | |
| Acer Predator Helios 18 N23Q2 (v6.85.6300) | |
| Moyenne Intel Core i9-14900HX (10475 - 18517, n=36) | |
| Moyenne de la classe Gaming (4424 - 33636, n=105, 2 dernières années) | |
| AIDA64 / FPU Mandel | |
| Alienware m18 R1 AMD (v6.85.6300) | |
| Alienware m18 R1 (v6.85.6300) | |
| Moyenne de la classe Gaming (25115 - 128721, n=105, 2 dernières années) | |
| MSI Titan 18 HX A14VIG (v6.92.6600) | |
| Asus ROG Strix Scar 18 2023 G834JY-N6005W (v6.85.6300) | |
| Acer Predator Helios 18 N23Q2 (v6.85.6300) | |
| Asus ROG Strix Scar 18 G834JYR (2024) (v6.92.6600, Turbo) | |
| Razer Blade 18 RTX 4070 (v6.85.6300) | |
| Asus ROG Strix Scar 18 G834JYR (2024) (v6.92.6600) | |
| Moyenne Intel Core i9-14900HX (32543 - 83662, n=36) | |
| AIDA64 / CPU AES | |
| Acer Predator Helios 18 N23Q2 (v6.85.6300) | |
| Alienware m18 R1 AMD (v6.85.6300) | |
| Moyenne Intel Core i9-14900HX (86964 - 241777, n=36) | |
| MSI Titan 18 HX A14VIG (v6.92.6600) | |
| Alienware m18 R1 (v6.85.6300) | |
| Asus ROG Strix Scar 18 2023 G834JY-N6005W (v6.85.6300) | |
| Asus ROG Strix Scar 18 G834JYR (2024) (v6.92.6600, Turbo) | |
| Asus ROG Strix Scar 18 G834JYR (2024) (v6.92.6600) | |
| Razer Blade 18 RTX 4070 (v6.85.6300) | |
| Moyenne de la classe Gaming (39258 - 247074, n=105, 2 dernières années) | |
| AIDA64 / CPU ZLib | |
| Alienware m18 R1 AMD (v6.85.6300) | |
| MSI Titan 18 HX A14VIG (v6.92.6600) | |
| Asus ROG Strix Scar 18 2023 G834JY-N6005W (v6.85.6300) | |
| Alienware m18 R1 (v6.85.6300) | |
| Acer Predator Helios 18 N23Q2 (v6.85.6300) | |
| Asus ROG Strix Scar 18 G834JYR (2024) (v6.92.6600, Turbo) | |
| Razer Blade 18 RTX 4070 (v6.85.6300) | |
| Moyenne Intel Core i9-14900HX (1054 - 2292, n=36) | |
| Asus ROG Strix Scar 18 G834JYR (2024) | |
| Moyenne de la classe Gaming (574 - 2531, n=105, 2 dernières années) | |
| AIDA64 / FP64 Ray-Trace | |
| Alienware m18 R1 AMD (v6.85.6300) | |
| Moyenne de la classe Gaming (5509 - 45446, n=105, 2 dernières années) | |
| Alienware m18 R1 (v6.85.6300) | |
| MSI Titan 18 HX A14VIG (v6.92.6600) | |
| Asus ROG Strix Scar 18 2023 G834JY-N6005W (v6.85.6300) | |
| Acer Predator Helios 18 N23Q2 (v6.85.6300) | |
| Asus ROG Strix Scar 18 G834JYR (2024) (v6.92.6600, Turbo) | |
| Razer Blade 18 RTX 4070 (v6.85.6300) | |
| Asus ROG Strix Scar 18 G834JYR (2024) (v6.92.6600) | |
| Moyenne Intel Core i9-14900HX (6809 - 18349, n=36) | |
| AIDA64 / CPU PhotoWorxx | |
| Alienware m18 R1 (v6.85.6300) | |
| Acer Predator Helios 18 N23Q2 (v6.85.6300) | |
| Asus ROG Strix Scar 18 G834JYR (2024) (v6.92.6600) | |
| Asus ROG Strix Scar 18 G834JYR (2024) (v6.92.6600, Turbo) | |
| Razer Blade 18 RTX 4070 (v6.85.6300) | |
| Moyenne Intel Core i9-14900HX (23903 - 54702, n=36) | |
| Moyenne de la classe Gaming (12271 - 89891, n=105, 2 dernières années) | |
| Asus ROG Strix Scar 18 2023 G834JY-N6005W (v6.85.6300) | |
| Alienware m18 R1 AMD (v6.85.6300) | |
| MSI Titan 18 HX A14VIG (v6.92.6600) | |
Performance du système
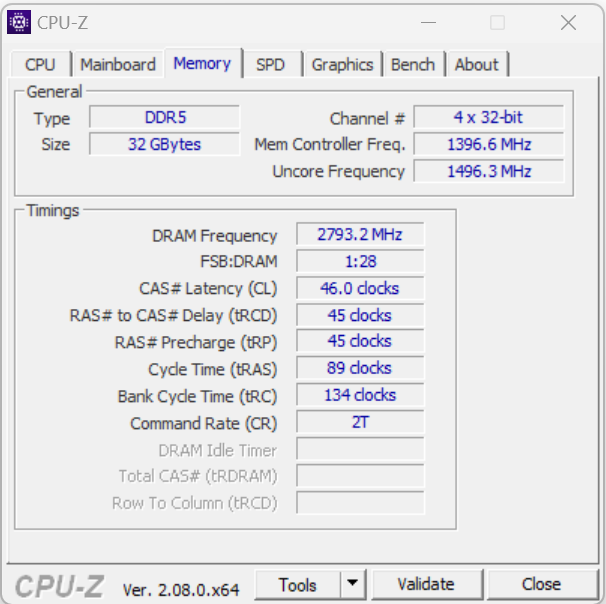
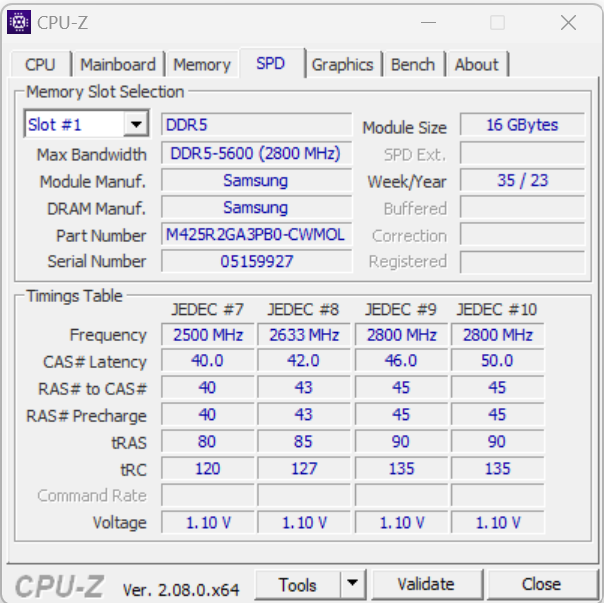
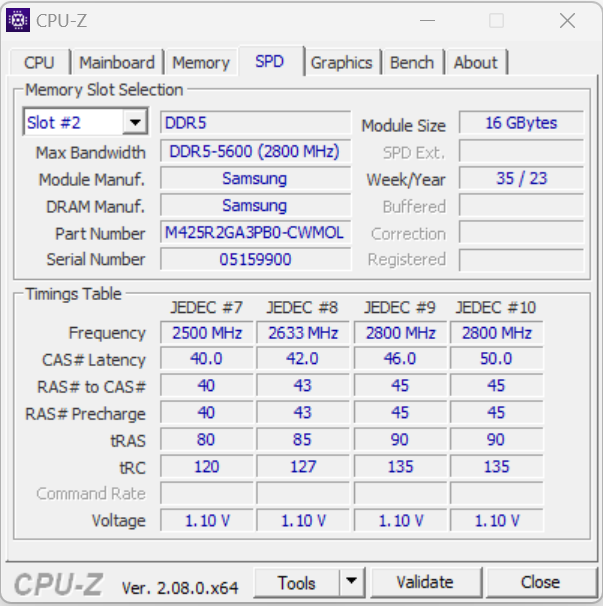
Le système, qui fonctionne sans heurts, ne présente aucune lacune en termes de performances informatiques, et l'ordinateur portable prend en charge les jeux, le rendu et d'autres tâches sans aucun problème. Les taux de transfert de la mémoire de travail se situent à un niveau normal pour de la RAM DDR5-5600.
CrossMark: Overall | Productivity | Creativity | Responsiveness
WebXPRT 3: Overall
WebXPRT 4: Overall
Mozilla Kraken 1.1: Total
| PCMark 10 / Score | |
| Alienware m18 R1 AMD | |
| MSI Titan 18 HX A14VIG | |
| Asus ROG Strix Scar 18 G834JYR (2024) | |
| Asus ROG Strix Scar 18 2023 G834JY-N6005W | |
| Alienware m18 R1 | |
| Moyenne Intel Core i9-14900HX, NVIDIA GeForce RTX 4090 Laptop GPU (8230 - 9234, n=13) | |
| Acer Predator Helios 18 N23Q2 | |
| Moyenne de la classe Gaming (5828 - 12414, n=93, 2 dernières années) | |
| Razer Blade 18 RTX 4070 | |
| PCMark 10 / Essentials | |
| Alienware m18 R1 AMD | |
| Razer Blade 18 RTX 4070 | |
| MSI Titan 18 HX A14VIG | |
| Asus ROG Strix Scar 18 G834JYR (2024) | |
| Alienware m18 R1 | |
| Moyenne Intel Core i9-14900HX, NVIDIA GeForce RTX 4090 Laptop GPU (10778 - 11628, n=13) | |
| Acer Predator Helios 18 N23Q2 | |
| Moyenne de la classe Gaming (8810 - 11935, n=97, 2 dernières années) | |
| PCMark 10 / Productivity | |
| Alienware m18 R1 AMD | |
| Moyenne de la classe Gaming (6845 - 25323, n=95, 2 dernières années) | |
| Moyenne Intel Core i9-14900HX, NVIDIA GeForce RTX 4090 Laptop GPU (9458 - 11759, n=13) | |
| Asus ROG Strix Scar 18 G834JYR (2024) | |
| Acer Predator Helios 18 N23Q2 | |
| MSI Titan 18 HX A14VIG | |
| Alienware m18 R1 | |
| Razer Blade 18 RTX 4070 | |
| PCMark 10 / Digital Content Creation | |
| Alienware m18 R1 AMD | |
| MSI Titan 18 HX A14VIG | |
| Alienware m18 R1 | |
| Asus ROG Strix Scar 18 G834JYR (2024) | |
| Moyenne Intel Core i9-14900HX, NVIDIA GeForce RTX 4090 Laptop GPU (13219 - 16462, n=13) | |
| Acer Predator Helios 18 N23Q2 | |
| Moyenne de la classe Gaming (7602 - 19954, n=95, 2 dernières années) | |
| Razer Blade 18 RTX 4070 | |
| CrossMark / Overall | |
| Asus ROG Strix Scar 18 G834JYR (2024) | |
| Acer Predator Helios 18 N23Q2 | |
| Alienware m18 R1 | |
| Razer Blade 18 RTX 4070 | |
| Moyenne Intel Core i9-14900HX, NVIDIA GeForce RTX 4090 Laptop GPU (1877 - 2344, n=10) | |
| Asus ROG Strix Scar 18 2023 G834JY-N6005W | |
| Moyenne de la classe Gaming (1366 - 2409, n=94, 2 dernières années) | |
| Alienware m18 R1 AMD | |
| MSI Titan 18 HX A14VIG | |
| CrossMark / Productivity | |
| Acer Predator Helios 18 N23Q2 | |
| Asus ROG Strix Scar 18 G834JYR (2024) | |
| Alienware m18 R1 | |
| Razer Blade 18 RTX 4070 | |
| Moyenne Intel Core i9-14900HX, NVIDIA GeForce RTX 4090 Laptop GPU (1738 - 2162, n=10) | |
| Asus ROG Strix Scar 18 2023 G834JY-N6005W | |
| Moyenne de la classe Gaming (1386 - 2254, n=94, 2 dernières années) | |
| Alienware m18 R1 AMD | |
| MSI Titan 18 HX A14VIG | |
| CrossMark / Creativity | |
| Asus ROG Strix Scar 18 G834JYR (2024) | |
| Alienware m18 R1 | |
| Asus ROG Strix Scar 18 2023 G834JY-N6005W | |
| Acer Predator Helios 18 N23Q2 | |
| Razer Blade 18 RTX 4070 | |
| Moyenne Intel Core i9-14900HX, NVIDIA GeForce RTX 4090 Laptop GPU (2195 - 2660, n=10) | |
| Moyenne de la classe Gaming (1343 - 2786, n=94, 2 dernières années) | |
| Alienware m18 R1 AMD | |
| MSI Titan 18 HX A14VIG | |
| CrossMark / Responsiveness | |
| Acer Predator Helios 18 N23Q2 | |
| Asus ROG Strix Scar 18 G834JYR (2024) | |
| Alienware m18 R1 | |
| Razer Blade 18 RTX 4070 | |
| Moyenne Intel Core i9-14900HX, NVIDIA GeForce RTX 4090 Laptop GPU (1478 - 2327, n=10) | |
| Moyenne de la classe Gaming (1226 - 2334, n=94, 2 dernières années) | |
| Asus ROG Strix Scar 18 2023 G834JY-N6005W | |
| Alienware m18 R1 AMD | |
| MSI Titan 18 HX A14VIG | |
| WebXPRT 3 / Overall | |
| Alienware m18 R1 AMD | |
| Razer Blade 18 RTX 4070 | |
| Alienware m18 R1 | |
| Asus ROG Strix Scar 18 2023 G834JY-N6005W | |
| MSI Titan 18 HX A14VIG | |
| Moyenne Intel Core i9-14900HX, NVIDIA GeForce RTX 4090 Laptop GPU (279 - 339, n=10) | |
| Asus ROG Strix Scar 18 G834JYR (2024) | |
| Acer Predator Helios 18 N23Q2 | |
| Moyenne de la classe Gaming (220 - 532, n=98, 2 dernières années) | |
| WebXPRT 4 / Overall | |
| Asus ROG Strix Scar 18 2023 G834JY-N6005W | |
| Alienware m18 R1 | |
| Asus ROG Strix Scar 18 G834JYR (2024) | |
| Razer Blade 18 RTX 4070 | |
| Alienware m18 R1 AMD | |
| Moyenne Intel Core i9-14900HX, NVIDIA GeForce RTX 4090 Laptop GPU (246 - 309, n=8) | |
| MSI Titan 18 HX A14VIG | |
| Moyenne de la classe Gaming (165 - 354, n=98, 2 dernières années) | |
| Mozilla Kraken 1.1 / Total | |
| Razer Blade 18 RTX 4070 | |
| Alienware m18 R1 AMD | |
| Moyenne de la classe Gaming (391 - 590, n=100, 2 dernières années) | |
| Alienware m18 R1 | |
| Acer Predator Helios 18 N23Q2 | |
| Moyenne Intel Core i9-14900HX, NVIDIA GeForce RTX 4090 Laptop GPU (428 - 535, n=11) | |
| MSI Titan 18 HX A14VIG | |
| Asus ROG Strix Scar 18 G834JYR (2024) | |
| Asus ROG Strix Scar 18 2023 G834JY-N6005W | |
* ... Moindre est la valeur, meilleures sont les performances
| PCMark 10 Score | 8801 points | |
Aide | ||
| AIDA64 / Memory Copy | |
| Asus ROG Strix Scar 18 G834JYR (2024) | |
| Alienware m18 R1 | |
| Acer Predator Helios 18 N23Q2 | |
| Razer Blade 18 RTX 4070 | |
| Moyenne Intel Core i9-14900HX (38028 - 83392, n=36) | |
| Moyenne de la classe Gaming (21750 - 129946, n=105, 2 dernières années) | |
| Asus ROG Strix Scar 18 2023 G834JY-N6005W | |
| MSI Titan 18 HX A14VIG | |
| Alienware m18 R1 AMD | |
| AIDA64 / Memory Read | |
| Alienware m18 R1 | |
| Asus ROG Strix Scar 18 G834JYR (2024) | |
| Acer Predator Helios 18 N23Q2 | |
| Razer Blade 18 RTX 4070 | |
| Moyenne Intel Core i9-14900HX (43306 - 87568, n=36) | |
| Asus ROG Strix Scar 18 2023 G834JY-N6005W | |
| Moyenne de la classe Gaming (22956 - 118858, n=105, 2 dernières années) | |
| Alienware m18 R1 AMD | |
| MSI Titan 18 HX A14VIG | |
| AIDA64 / Memory Write | |
| Alienware m18 R1 | |
| Asus ROG Strix Scar 18 G834JYR (2024) | |
| Moyenne de la classe Gaming (22297 - 135096, n=105, 2 dernières années) | |
| Razer Blade 18 RTX 4070 | |
| Acer Predator Helios 18 N23Q2 | |
| Moyenne Intel Core i9-14900HX (37146 - 80589, n=36) | |
| Asus ROG Strix Scar 18 2023 G834JY-N6005W | |
| Alienware m18 R1 AMD | |
| MSI Titan 18 HX A14VIG | |
| AIDA64 / Memory Latency | |
| Moyenne de la classe Gaming (75.3 - 259, n=105, 2 dernières années) | |
| MSI Titan 18 HX A14VIG | |
| Alienware m18 R1 AMD | |
| Asus ROG Strix Scar 18 2023 G834JY-N6005W | |
| Moyenne Intel Core i9-14900HX (76.1 - 105, n=36) | |
| Razer Blade 18 RTX 4070 | |
| Acer Predator Helios 18 N23Q2 | |
| Asus ROG Strix Scar 18 G834JYR (2024) | |
| Alienware m18 R1 | |
* ... Moindre est la valeur, meilleures sont les performances
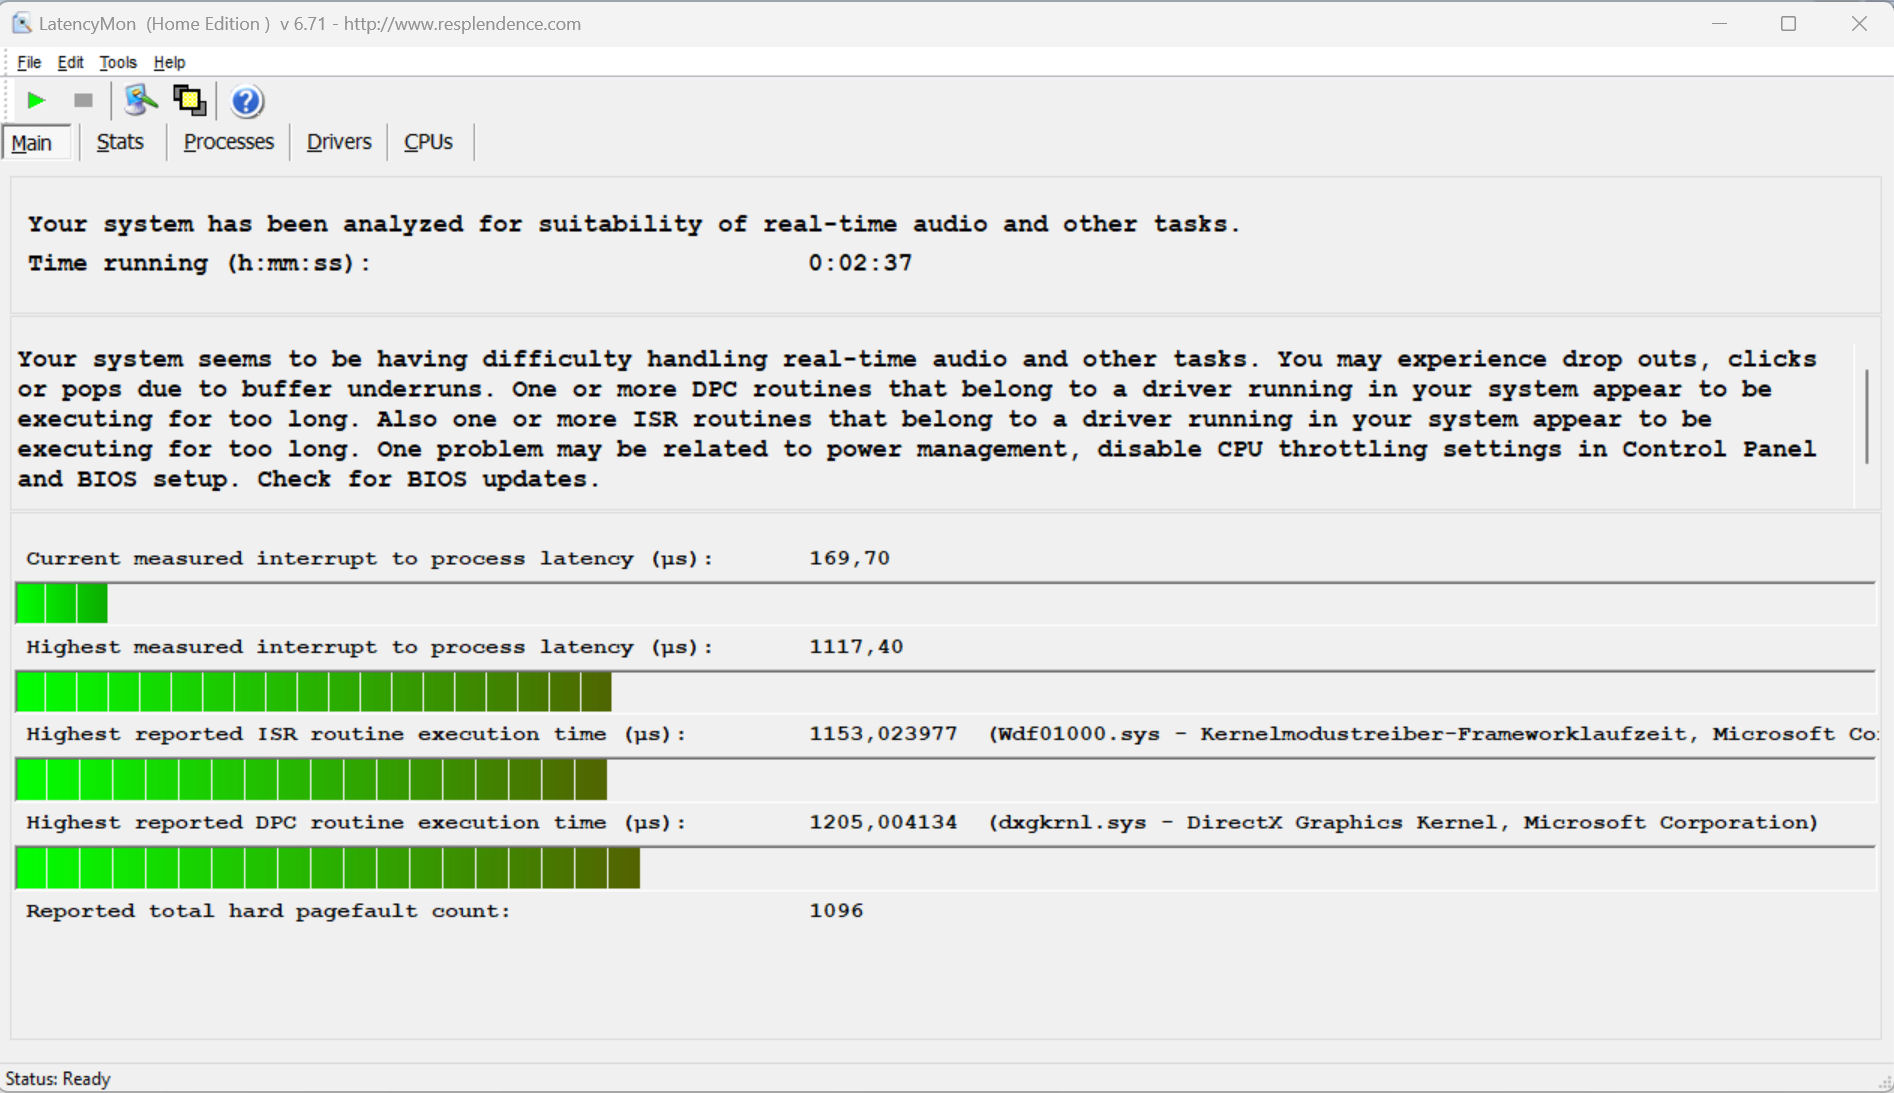
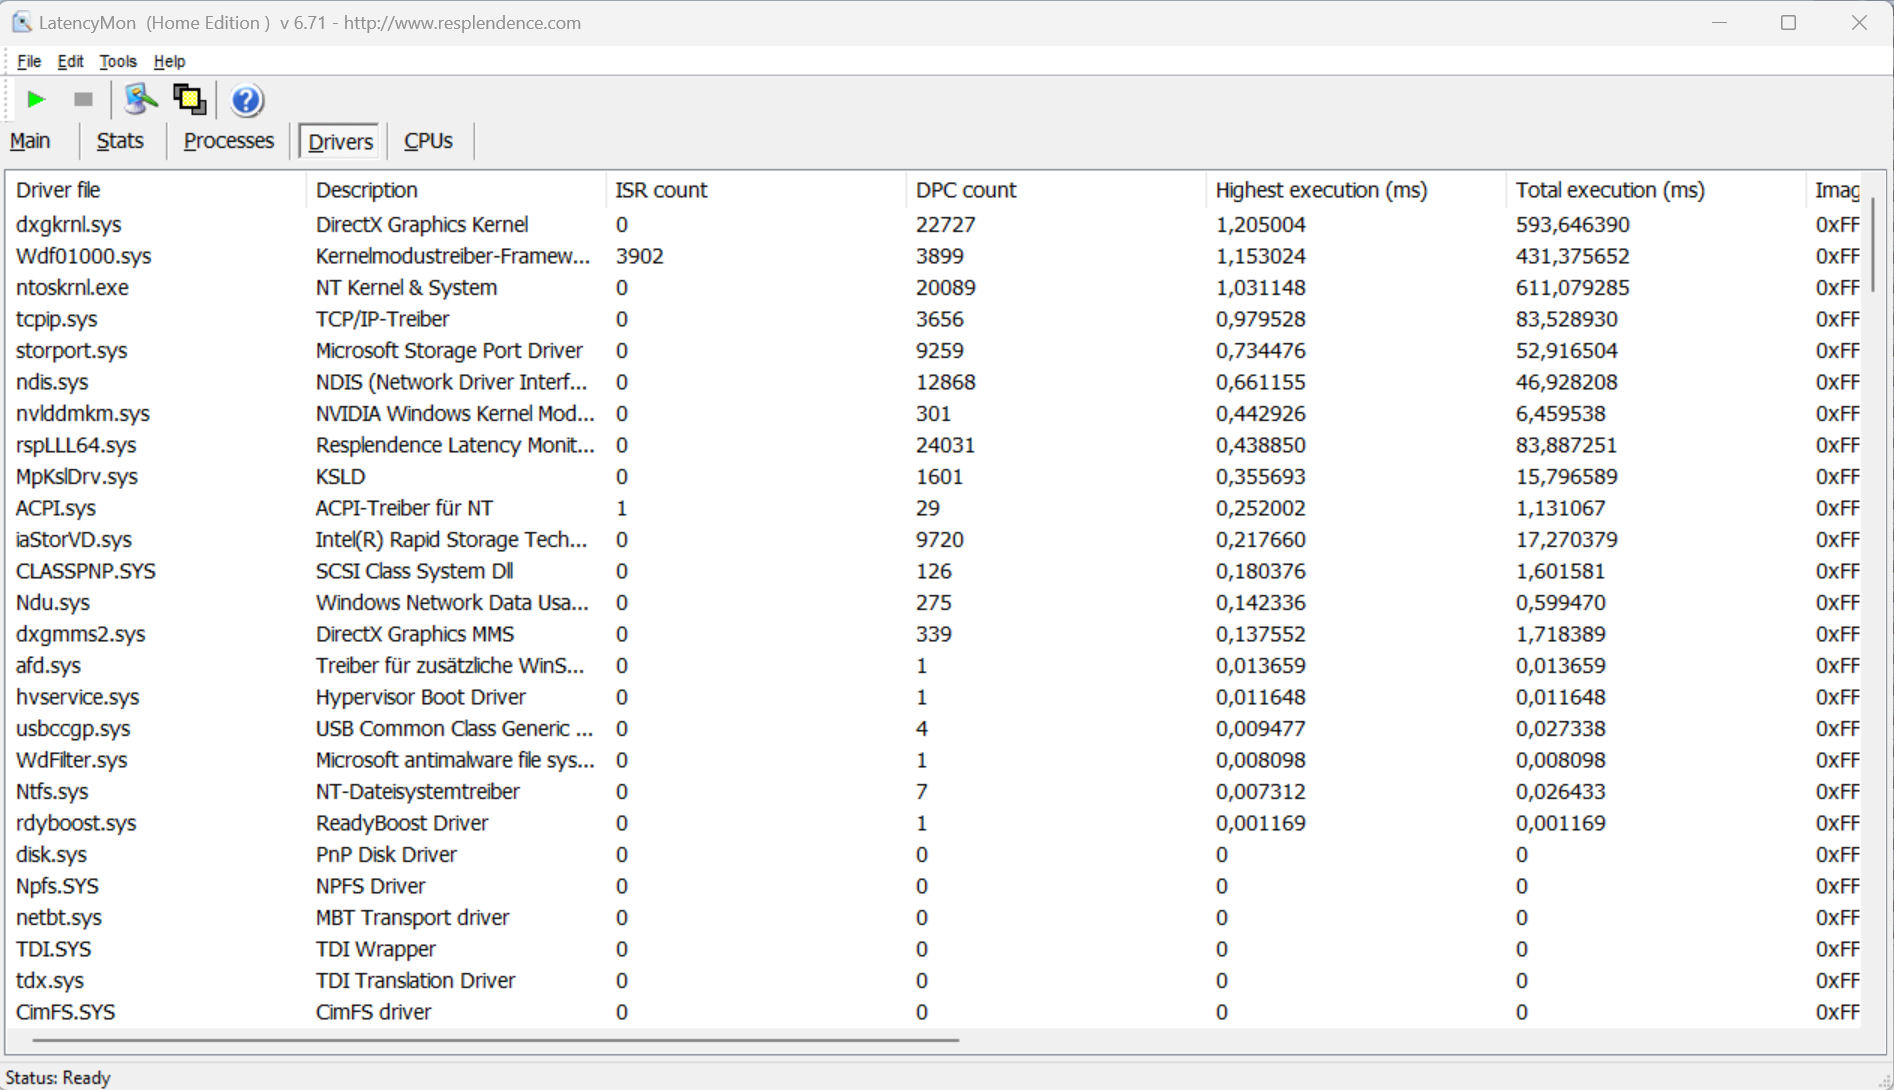
Latences DPC
Le test standardisé Latency Monitor (avec navigation sur le web, reproduction de vidéos 4k et charge élevée de Prime95) révèle un certain comportement ostensible, et le système ne semble pas adapté au traitement vidéo et audio en temps réel. Les futures mises à jour logicielles pourraient apporter des améliorations ou même aggraver la situation.
| DPC Latencies / LatencyMon - interrupt to process latency (max), Web, Youtube, Prime95 | |
| Acer Predator Helios 18 N23Q2 | |
| Alienware m18 R1 | |
| MSI Titan 18 HX A14VIG | |
| Razer Blade 18 RTX 4070 | |
| Alienware m18 R1 AMD | |
| Asus ROG Strix Scar 18 G834JYR (2024) | |
| Asus ROG Strix Scar 18 2023 G834JY-N6005W | |
* ... Moindre est la valeur, meilleures sont les performances
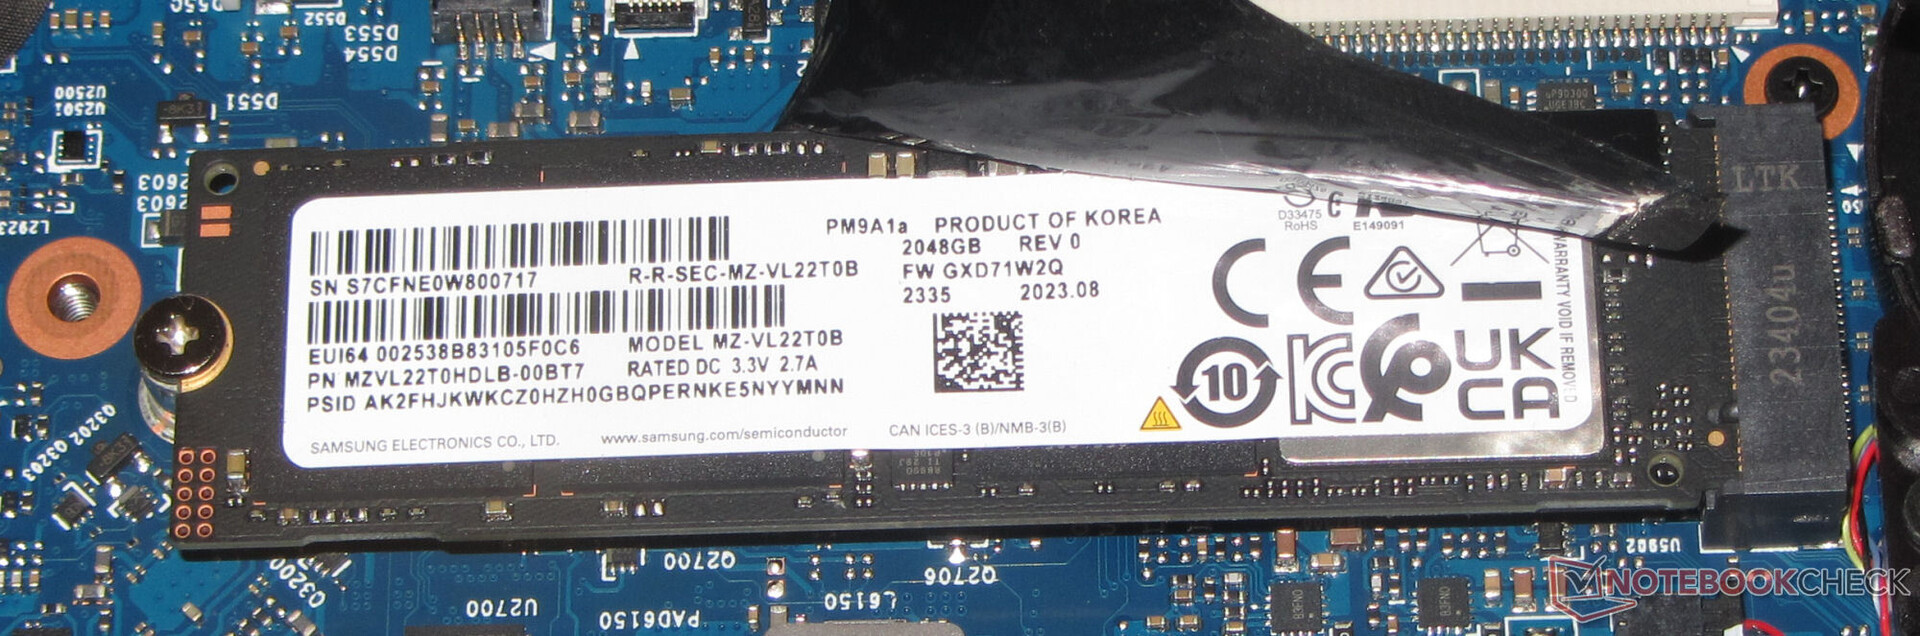
Solution de stockage
Le Scar 18 peut accepter un total de deux SSD PCIe 4 au format M.2-2280, le RAID-0 étant également pris en charge. Le SSD Samsung de 2 To de notre unité de test offre d'excellents débits de données. Un autre aspect positif est l'absence d'étranglement thermique.

* ... Moindre est la valeur, meilleures sont les performances
Disk Throttling: DiskSpd Read Loop, Queue Depth 8
Carte graphique
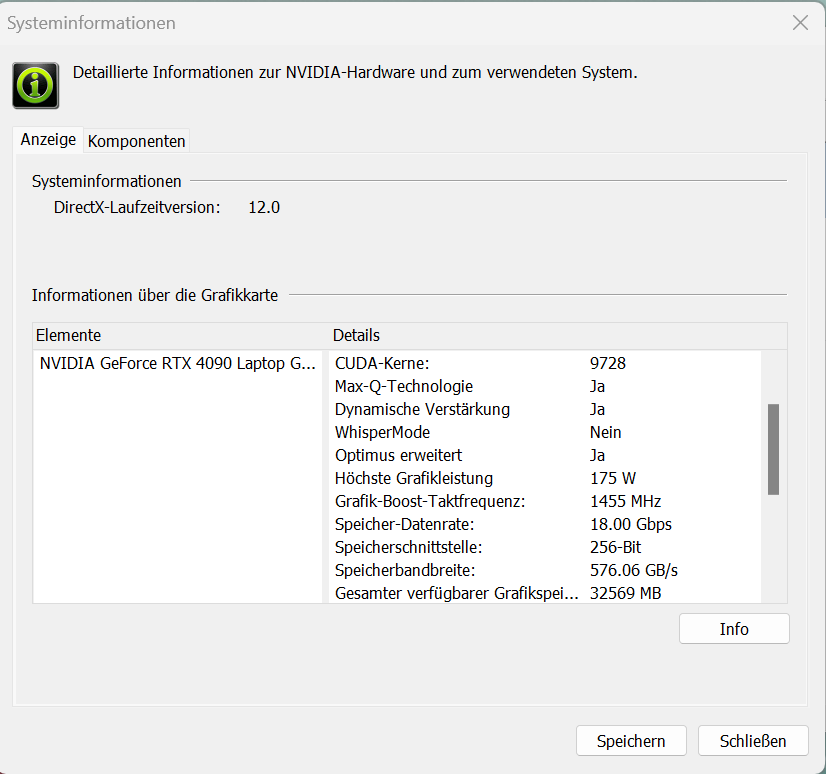
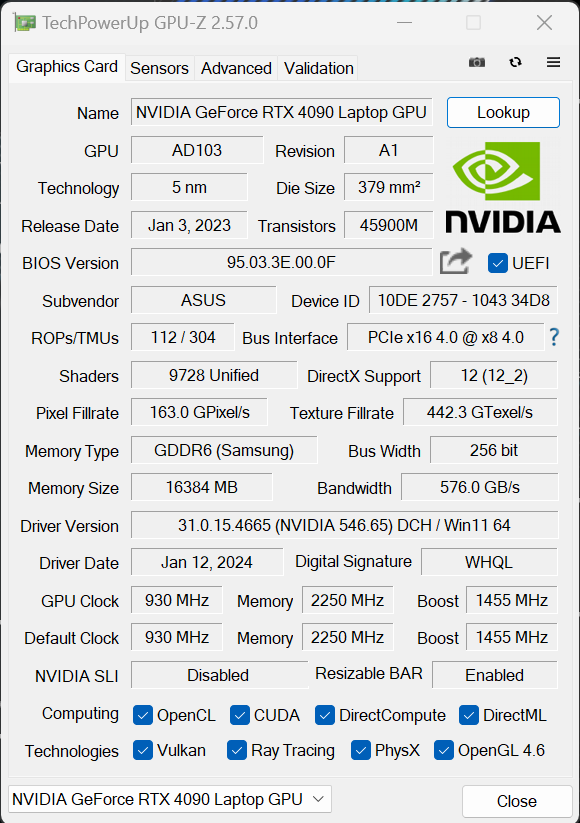
Avec la GeForce RTX 4090asus utilise le meilleur modèle actuel de Nvidia parmi les GPU mobiles. Il offre 9 728 unités de shaders, un bus de stockage de 256 bits et peut également utiliser un stockage GDDR6 rapide (16 384 Mo). La RTX 4090 bénéficie d'une puissance maximale de 175 watts (150 W + 25 W Dynamic Boost) - il n'est pas possible d'en faire plus.
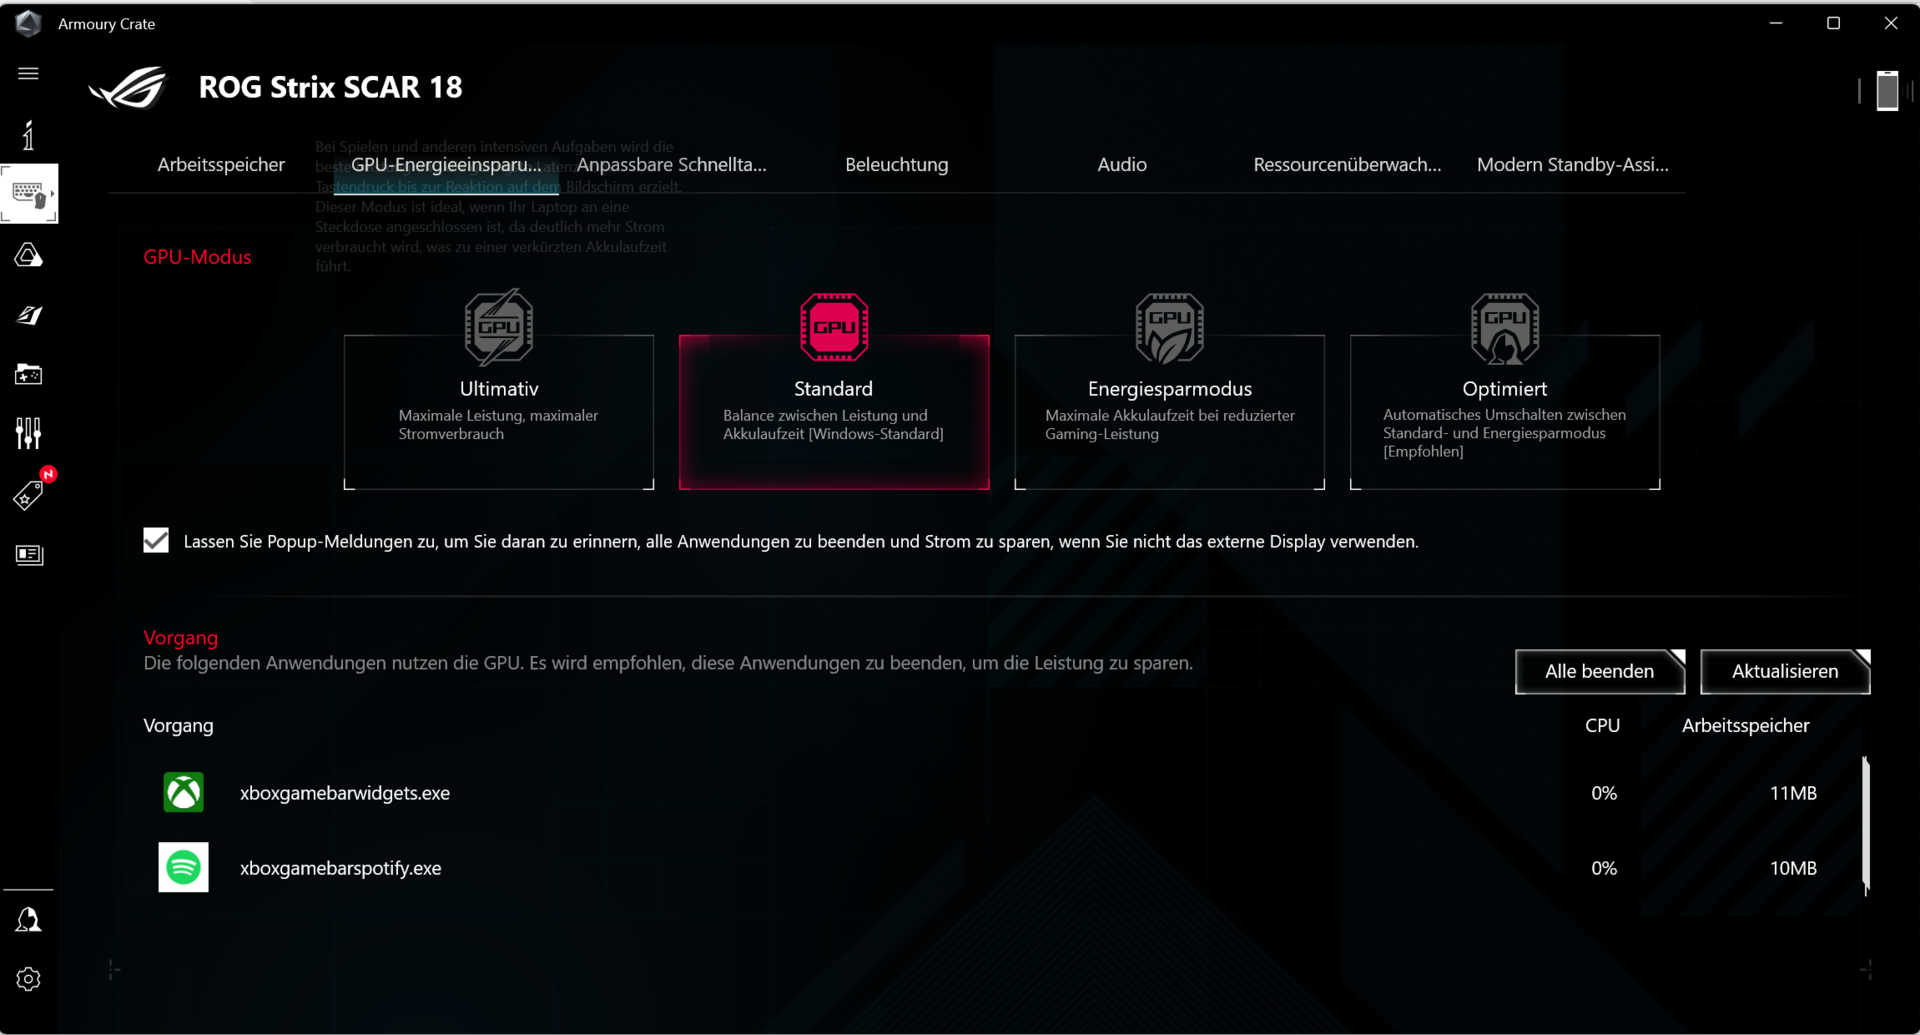
En mode "Performance", les résultats du benchmark se situent en dessous de la moyenne déterminée pour la RTX 4090 jusqu'à présent, tandis que le mode "Turbo" donne des valeurs au même niveau que la moyenne. Le mode Optimus avancé est pris en charge, la commutation entre le dGPU et Optimus ne nécessitant pas de redémarrage.
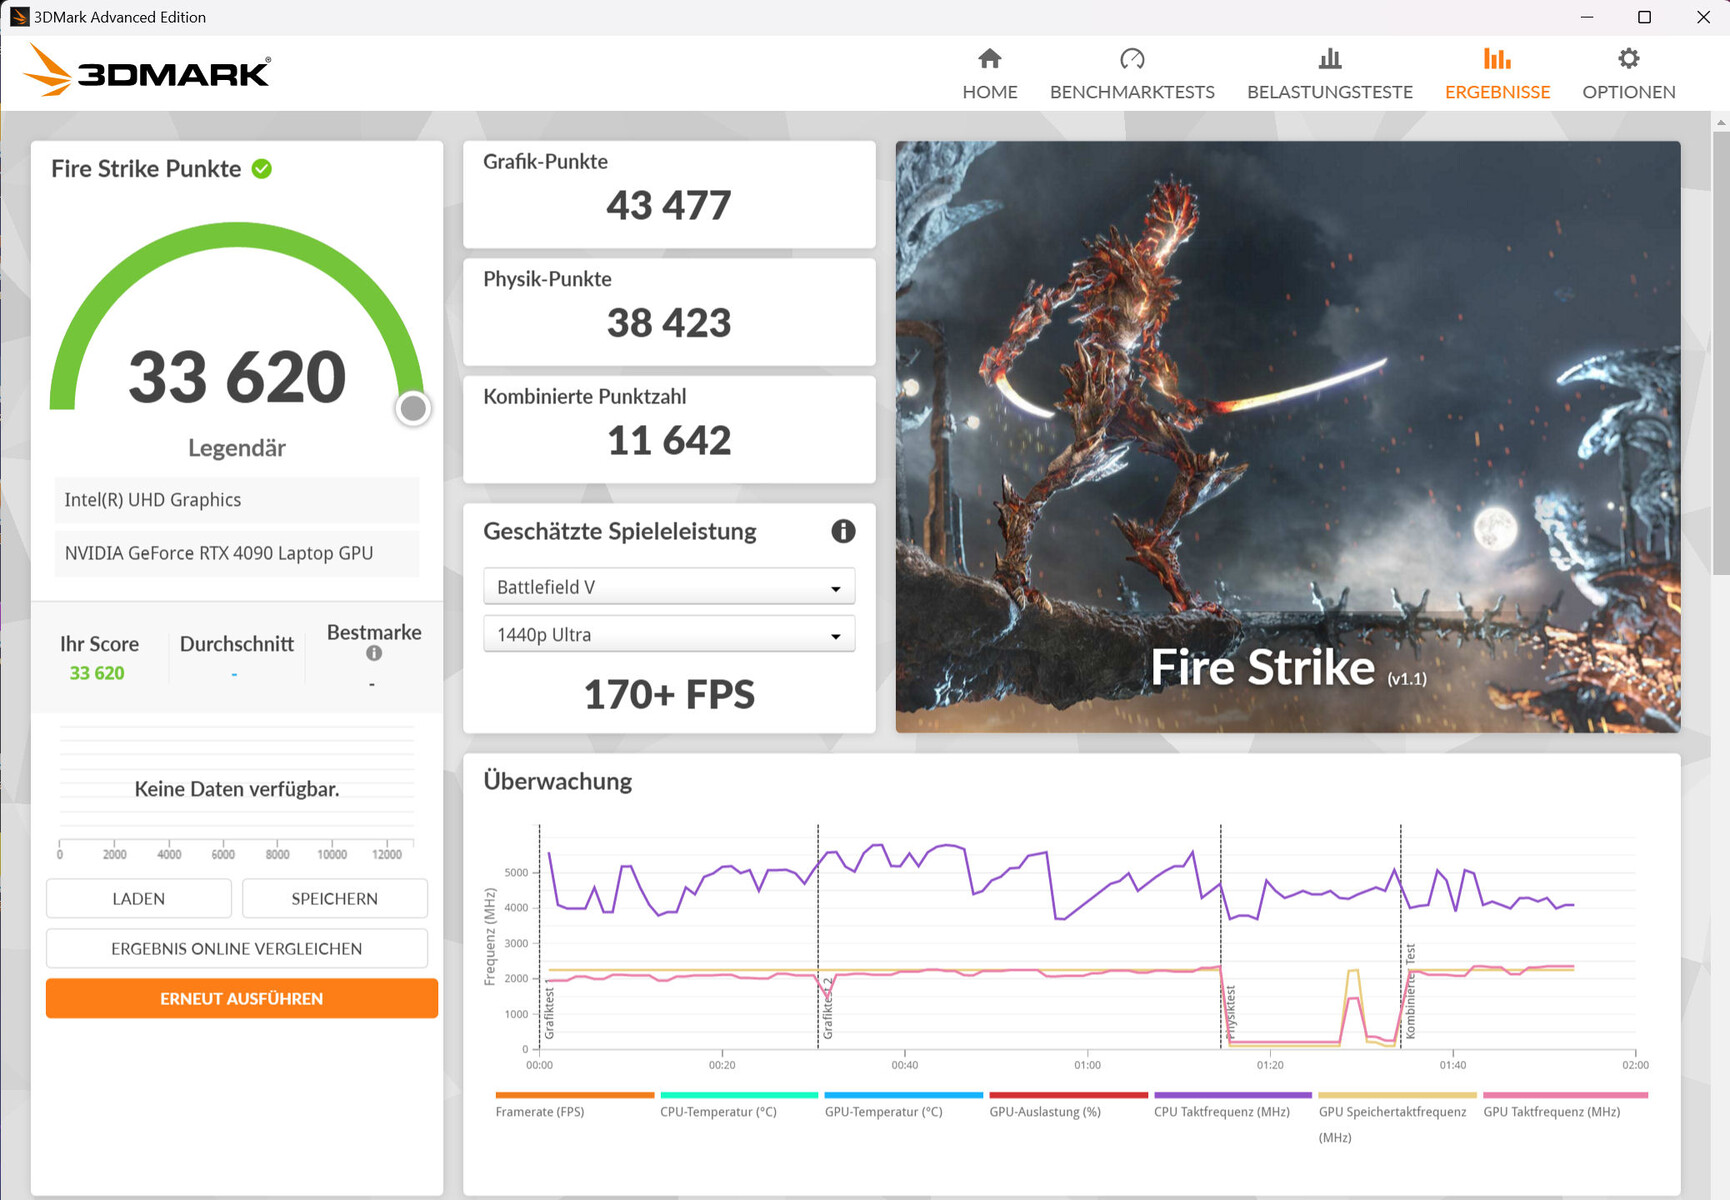
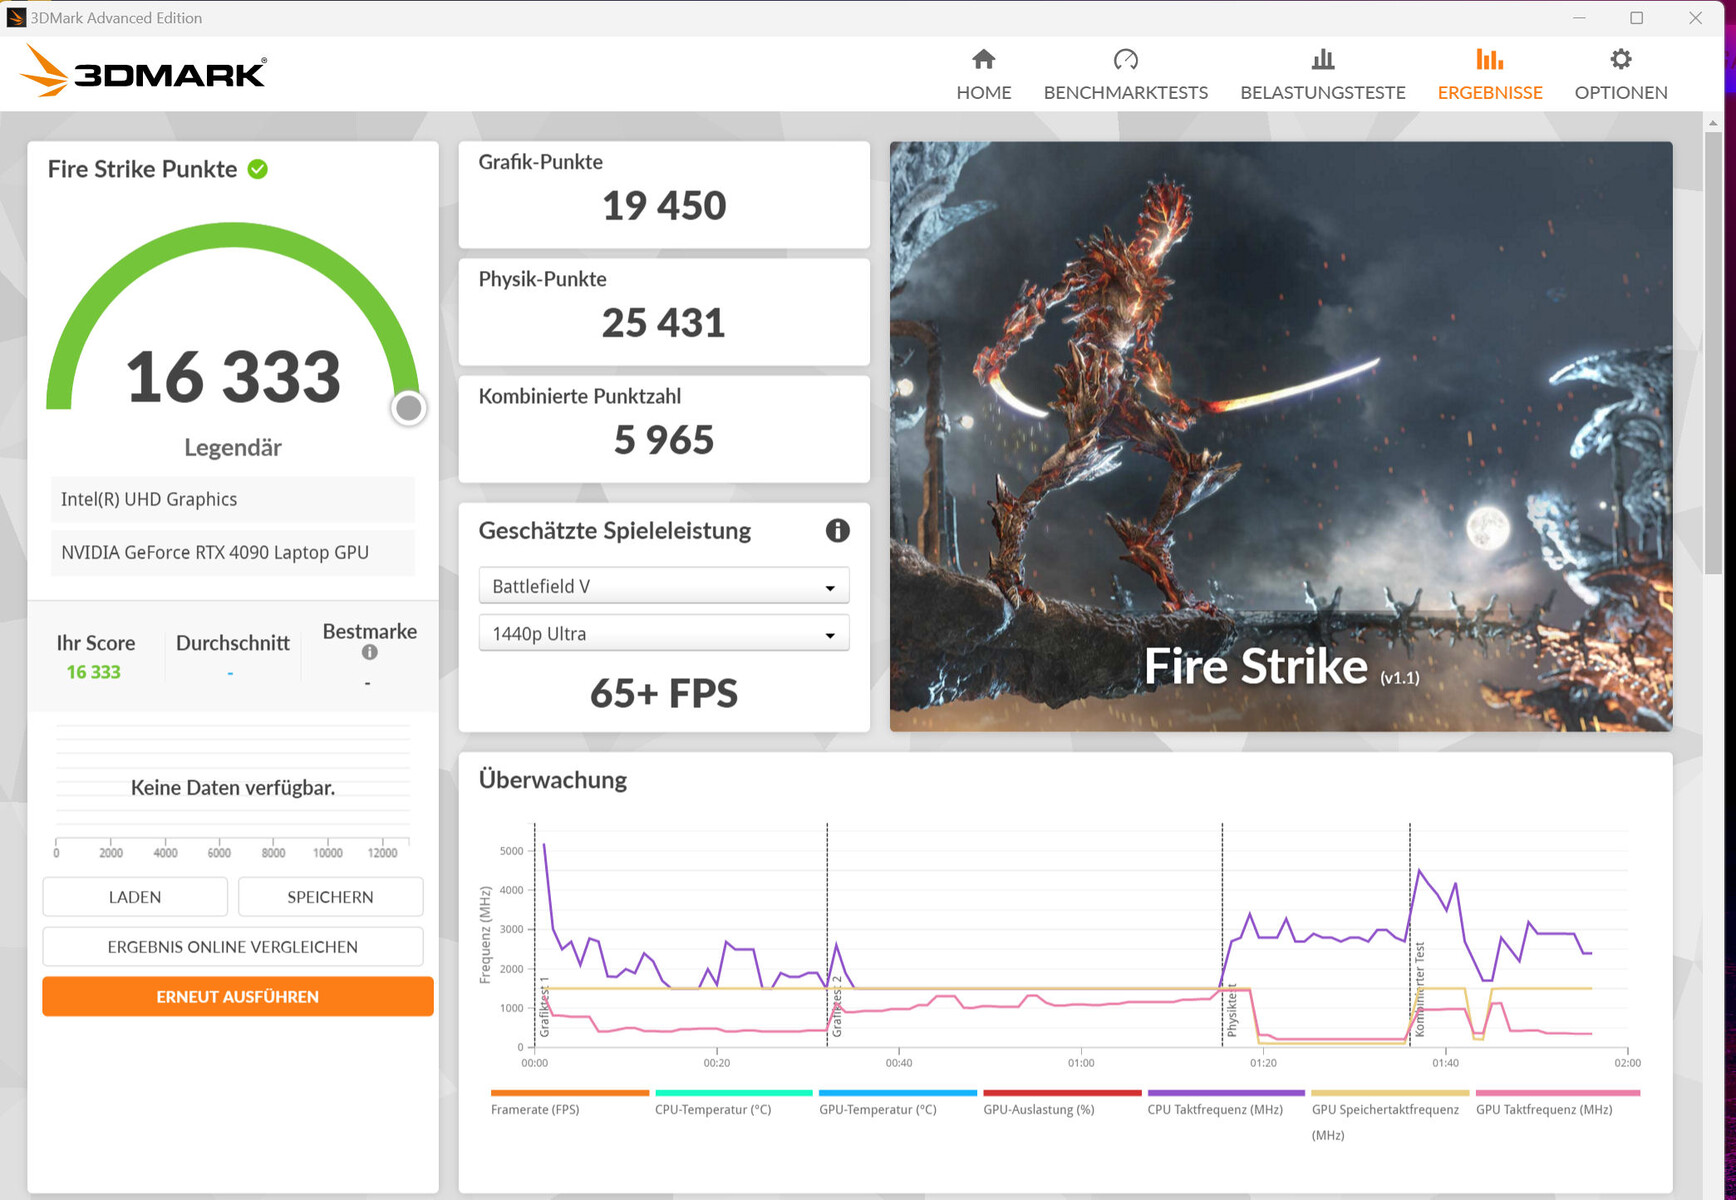

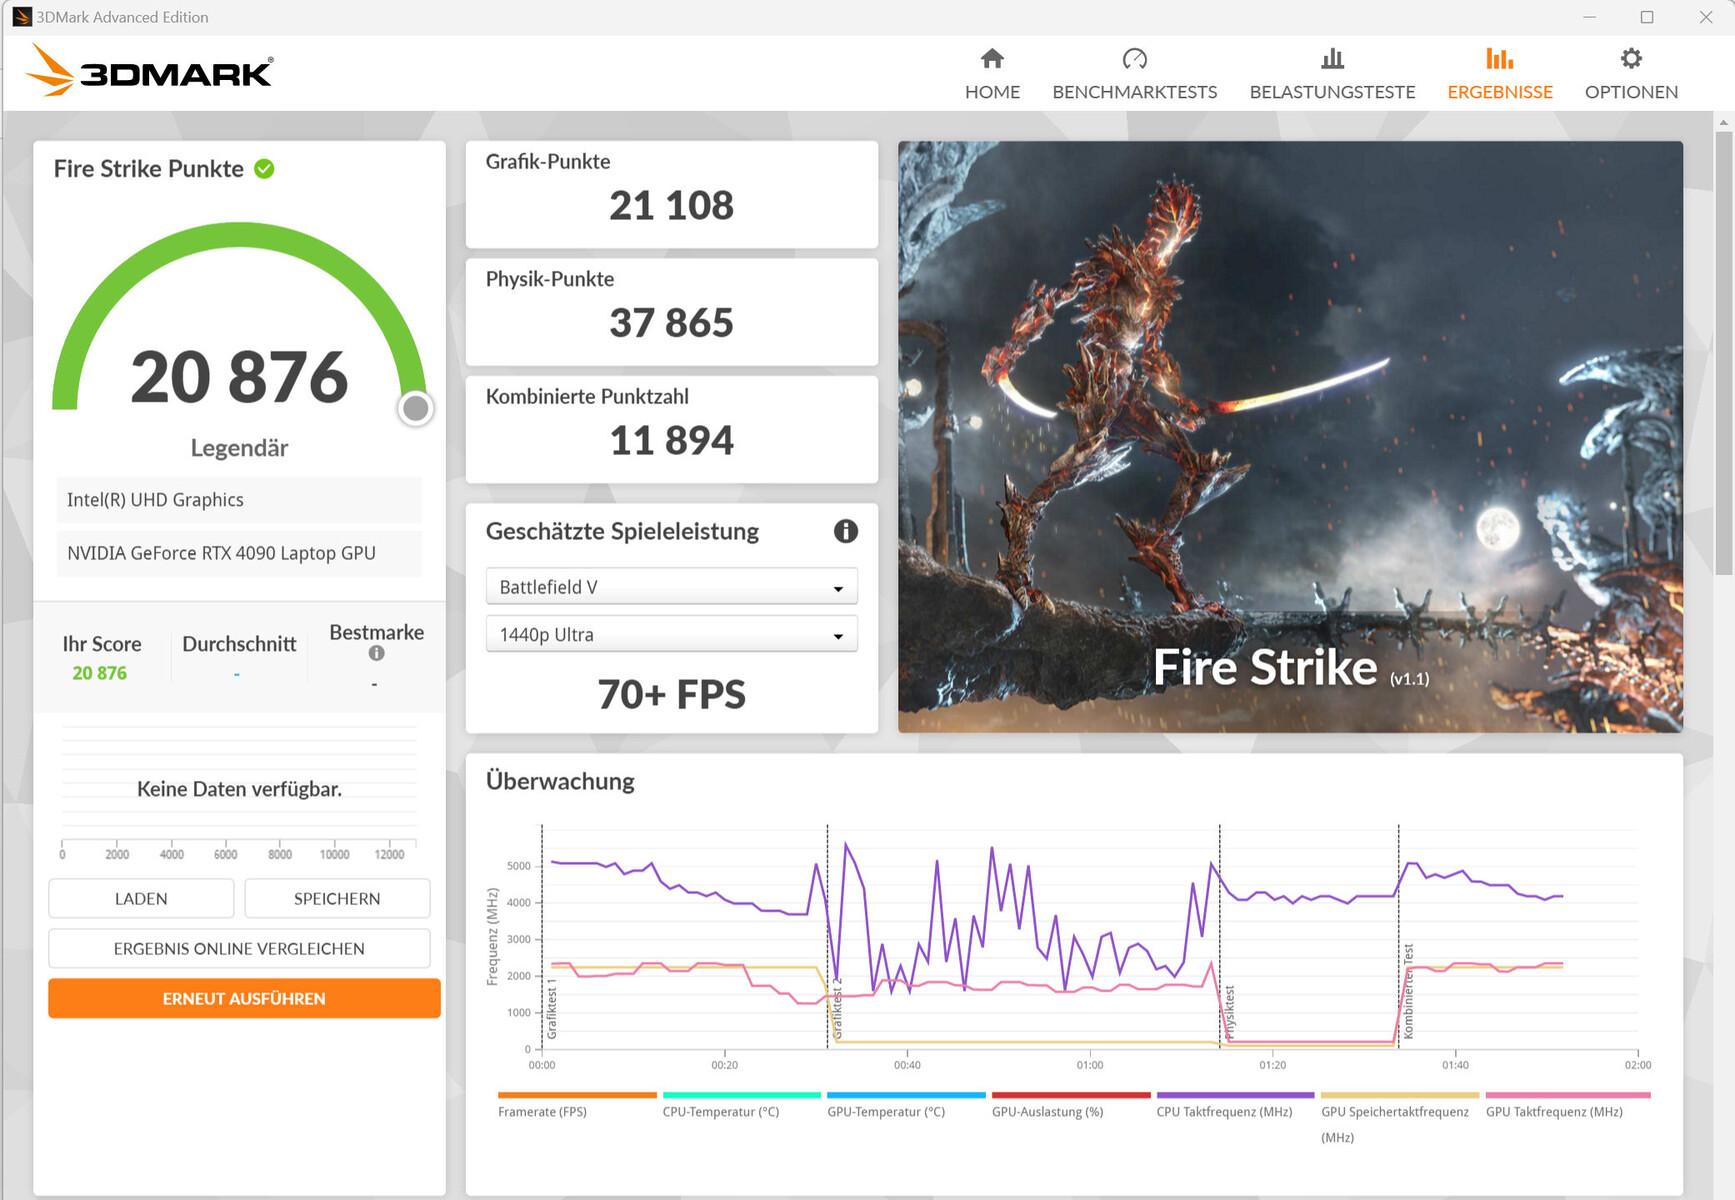
| 3DMark 11 Performance | 42985 points | |
| 3DMark Cloud Gate Standard Score | 65110 points | |
| 3DMark Fire Strike Score | 33620 points | |
| 3DMark Time Spy Score | 19507 points | |
Aide | ||
| V-Ray Benchmark Next 4.10 | |
| GPU | |
| Asus ROG Strix Scar 18 2023 G834JY-N6005W (v4.10.07 ) | |
| Moyenne NVIDIA GeForce RTX 4090 Laptop GPU (873 - 1334, n=30) | |
| Asus ROG Strix Scar 18 G834JYR (2024) (v4.10.07 ) | |
| Acer Predator Helios 18 N23Q2 (v4.10.07 ) | |
| Moyenne de la classe Gaming (427 - 1627, n=99, 2 dernières années) | |
| CPU | |
| Asus ROG Strix Scar 18 2023 G834JY-N6005W (v4.10.07 ) | |
| Acer Predator Helios 18 N23Q2 (v4.10.07 ) | |
| Moyenne NVIDIA GeForce RTX 4090 Laptop GPU (18206 - 37629, n=30) | |
| Asus ROG Strix Scar 18 G834JYR (2024) (v4.10.07 ) | |
| Moyenne de la classe Gaming (10048 - 45327, n=97, 2 dernières années) | |
* ... Moindre est la valeur, meilleures sont les performances
Performances des jeux
Le Scar 18 permet de jouer en QHD+ avec des paramètres maximums. Des résolutions plus élevées peuvent être utilisées si vous connectez le moniteur correspondant. Les jeux prenant en charge DLSS 3 et Frame Generation permettent des réglages maximaux et des effets de raytracing supplémentaires en résolution 4k.
En mode "Performance", les taux de rafraîchissement des jeux testés sont inférieurs à la moyenne de la RTX 4090 déterminée jusqu'à présent. La sélection du mode "Turbo" peut entraîner une légère augmentation, et il en va de même pour le mode GPU "Ultimate".
| The Witcher 3 - 1920x1080 Ultra Graphics & Postprocessing (HBAO+) | |
| Alienware m18 R1 | |
| MSI Titan 18 HX A14VIG | |
| Moyenne NVIDIA GeForce RTX 4090 Laptop GPU (139.2 - 216, n=35) | |
| Moyenne de la classe Gaming (104.7 - 240, n=6, 2 dernières années) | |
| Asus ROG Strix Scar 18 G834JYR (2024) | |
| Acer Predator Helios 18 N23Q2 | |
| Alienware m18 R1 AMD | |
| Razer Blade 18 RTX 4070 | |
| Call of Duty Modern Warfare 3 2023 | |
| 1920x1080 Extreme Preset | |
| Moyenne NVIDIA GeForce RTX 4090 Laptop GPU (148 - 205, n=7) | |
| Asus ROG Strix Scar 18 G834JYR (2024) | |
| Moyenne de la classe Gaming (27 - 95, n=2, 2 dernières années) | |
| 2560x1440 Extreme Preset | |
| Asus ROG Strix Scar 18 G834JYR (2024) | |
| Moyenne NVIDIA GeForce RTX 4090 Laptop GPU (113 - 162, n=7) | |
| Moyenne de la classe Gaming (n=12 dernières années) | |
| The Finals | |
| 1920x1080 Epic Preset | |
| Asus ROG Strix Scar 18 G834JYR (2024) | |
| Moyenne NVIDIA GeForce RTX 4090 Laptop GPU (174.1 - 211, n=2) | |
| Moyenne de la classe Gaming (n=12 dernières années) | |
| 2560x1440 Epic Preset | |
| Asus ROG Strix Scar 18 G834JYR (2024) | |
| Moyenne NVIDIA GeForce RTX 4090 Laptop GPU (137.2 - 147.4, n=2) | |
| Moyenne de la classe Gaming (n=12 dernières années) | |
| 1920x1080 Epic Preset + Epic RTX Global Illumination | |
| Asus ROG Strix Scar 18 G834JYR (2024) | |
| Moyenne NVIDIA GeForce RTX 4090 Laptop GPU (159.8 - 190.8, n=2) | |
| Palworld | |
| 1920x1080 Epic Preset AA:TSR | |
| Asus ROG Strix Scar 18 G834JYR (2024) | |
| Moyenne NVIDIA GeForce RTX 4090 Laptop GPU (138.8 - 150.9, n=2) | |
| Moyenne de la classe Gaming (n=12 dernières années) | |
| 2560x1440 Epic Preset AA:TSR | |
| Asus ROG Strix Scar 18 G834JYR (2024) | |
| Moyenne NVIDIA GeForce RTX 4090 Laptop GPU (110.5 - 119.8, n=2) | |
| Enshrouded | |
| 1920x1080 Max. Quality AA:FX | |
| Moyenne NVIDIA GeForce RTX 4090 Laptop GPU (79 - 101.5, n=3) | |
| Asus ROG Strix Scar 18 G834JYR (2024) | |
| Moyenne de la classe Gaming (n=12 dernières années) | |
| 2560x1440 Max. Quality AA:FX | |
| Asus ROG Strix Scar 18 G834JYR (2024) | |
| Moyenne NVIDIA GeForce RTX 4090 Laptop GPU (61.8 - 76, n=3) | |
Pour évaluer si les fréquences d'images restent relativement constantes sur une période plus longue, nous avons lancé le jeu "The Witcher 3" pendant environ 60 minutes en résolution Full-HD avec les paramètres de qualité maximum. Le personnage du jeu n'est pas déplacé. Nous n'observons aucune baisse de la fréquence des images.
The Witcher 3 FPS Chart
| Bas | Moyen | Élevé | Ultra | QHD | |
|---|---|---|---|---|---|
| GTA V (2015) | 187.5 | 187.1 | 181.2 | 136 | 129.6 |
| The Witcher 3 (2015) | 579.6 | 501.7 | 342.8 | 189.4 | 151.5 |
| Dota 2 Reborn (2015) | 219 | 194.5 | 173.9 | 161.3 | |
| Final Fantasy XV Benchmark (2018) | 221 | 198.1 | 166.1 | 143.6 | |
| X-Plane 11.11 (2018) | 197.9 | 172.4 | 136.8 | ||
| Far Cry 5 (2018) | 176 | 163 | 156 | 145 | 145 |
| Strange Brigade (2018) | 429 | 350 | 341 | 331 | 279 |
| Starfield (2023) | 112.7 | 100 | 84.2 | 78.4 | 66 |
| Cyberpunk 2077 (2023) | 134.8 | 121.5 | 117.7 | 112.1 | 83.8 |
| Call of Duty Modern Warfare 3 2023 (2023) | 229 | 210 | 169 | 162 | 162 |
| The Finals (2023) | 228 | 216 | 214 | 211 | 147.4 |
| Palworld (2024) | 211 | 180.9 | 151.3 | 150.9 | 119.8 |
| Enshrouded (2024) | 135.2 | 120.1 | 100.8 | 87.6 | 68.9 |
Émissions - Le G834JYR peut fonctionner silencieusement
Émissions sonores
À pleine charge, le niveau sonore augmente jusqu'à 52 dB(A) en mode "Performance". En mode "Turbo", la valeur augmente encore un peu plus, et une comparaison avec le Scar 18 de 2023 montre la même chose. Son fonctionnement peut également être plus silencieux en général : si vous renoncez aux performances en sélectionnant le mode "Silent", le niveau sonore diminue à 35 dB(A). Au ralenti ou en utilisation quotidienne (bureau, Internet), souvent un seul des deux ventilateurs fonctionne et parfois les deux restent silencieux, notamment en utilisant le profil "Silent".
Degré de la nuisance sonore
| Au repos |
| 27 / 28 / 32 dB(A) |
| Fortement sollicité |
| 50 / 52 dB(A) |
 | ||
30 dB silencieux 40 dB(A) audible 50 dB(A) bruyant |
||
min: | ||
| Asus ROG Strix Scar 18 G834JYR (2024) i9-14900HX, GeForce RTX 4090 Laptop GPU | Alienware m18 R1 AMD R9 7945HX, Radeon RX 7900M | Alienware m18 R1 i9-13980HX, GeForce RTX 4090 Laptop GPU | Acer Predator Helios 18 N23Q2 i9-13900HX, GeForce RTX 4080 Laptop GPU | Razer Blade 18 RTX 4070 i9-13950HX, GeForce RTX 4070 Laptop GPU | MSI Titan 18 HX A14VIG i9-14900HX, GeForce RTX 4090 Laptop GPU | Asus ROG Strix Scar 18 2023 G834JY-N6005W i9-13980HX, GeForce RTX 4090 Laptop GPU | |
|---|---|---|---|---|---|---|---|
| Noise | 8% | 12% | 6% | 10% | 5% | 2% | |
| arrêt / environnement * (dB) | 24 | 22.4 7% | 22.8 5% | 23 4% | 23.5 2% | 22.8 5% | 23.9 -0% |
| Idle Minimum * (dB) | 27 | 23 15% | 23 15% | 23 15% | 23.8 12% | 23.8 12% | 23.9 11% |
| Idle Average * (dB) | 28 | 23.4 16% | 23 18% | 23 18% | 23.8 15% | 23.8 15% | 32.6 -16% |
| Idle Maximum * (dB) | 32 | 33.5 -5% | 23 28% | 23 28% | 26.8 16% | 28 12% | 32.6 -2% |
| Load Average * (dB) | 50 | 33.5 33% | 35.6 29% | 45.26 9% | 37.3 25% | 38 24% | 35.9 28% |
| Witcher 3 ultra * (dB) | 50 | 53.6 -7% | 51.3 -3% | 59.82 -20% | 48 4% | 57.3 -15% | |
| Load Maximum * (dB) | 52 | 53.6 -3% | 56.7 -9% | 59.94 -15% | 53.5 -3% | 62.8 -21% | 55.8 -7% |
* ... Moindre est la valeur, meilleures sont les performances
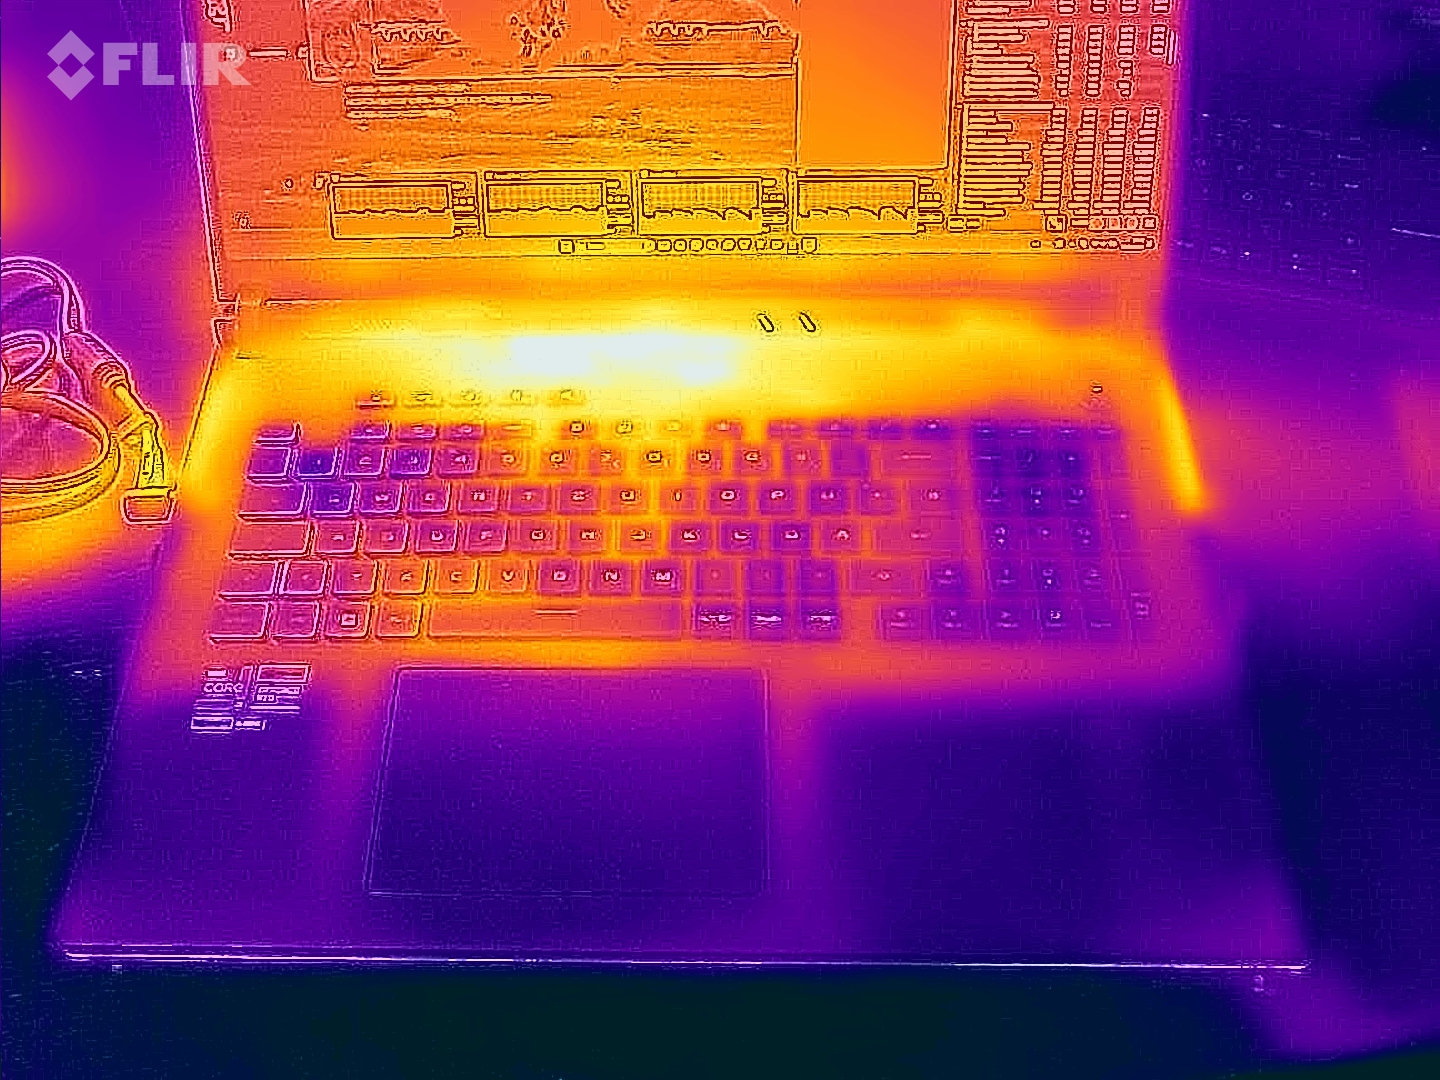
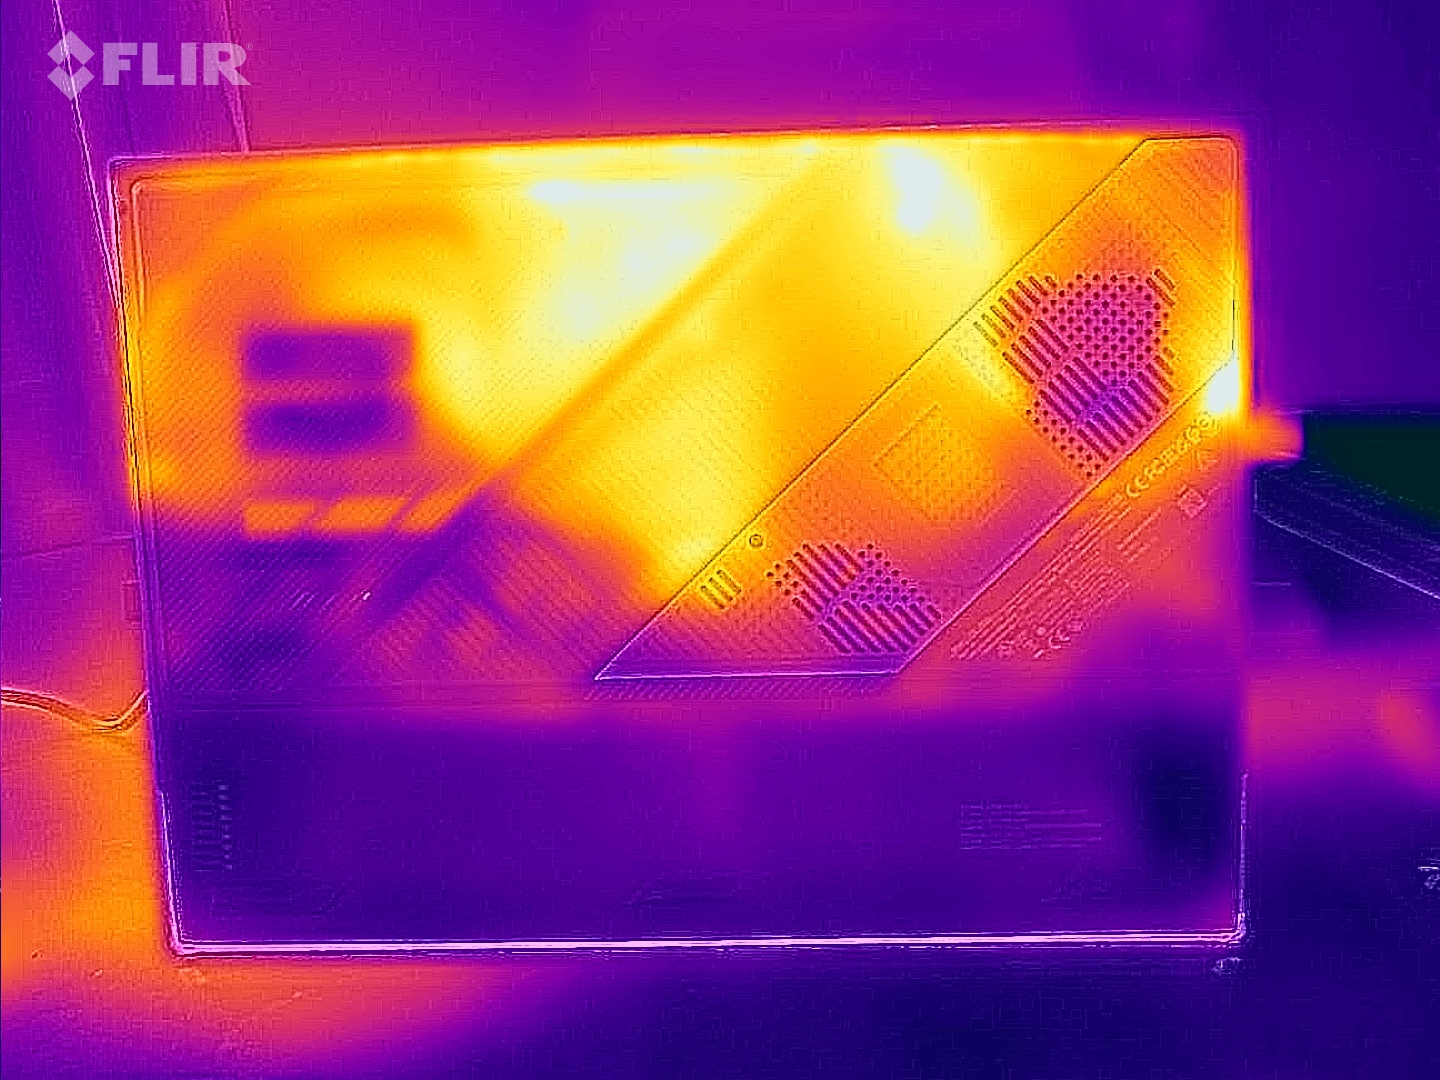
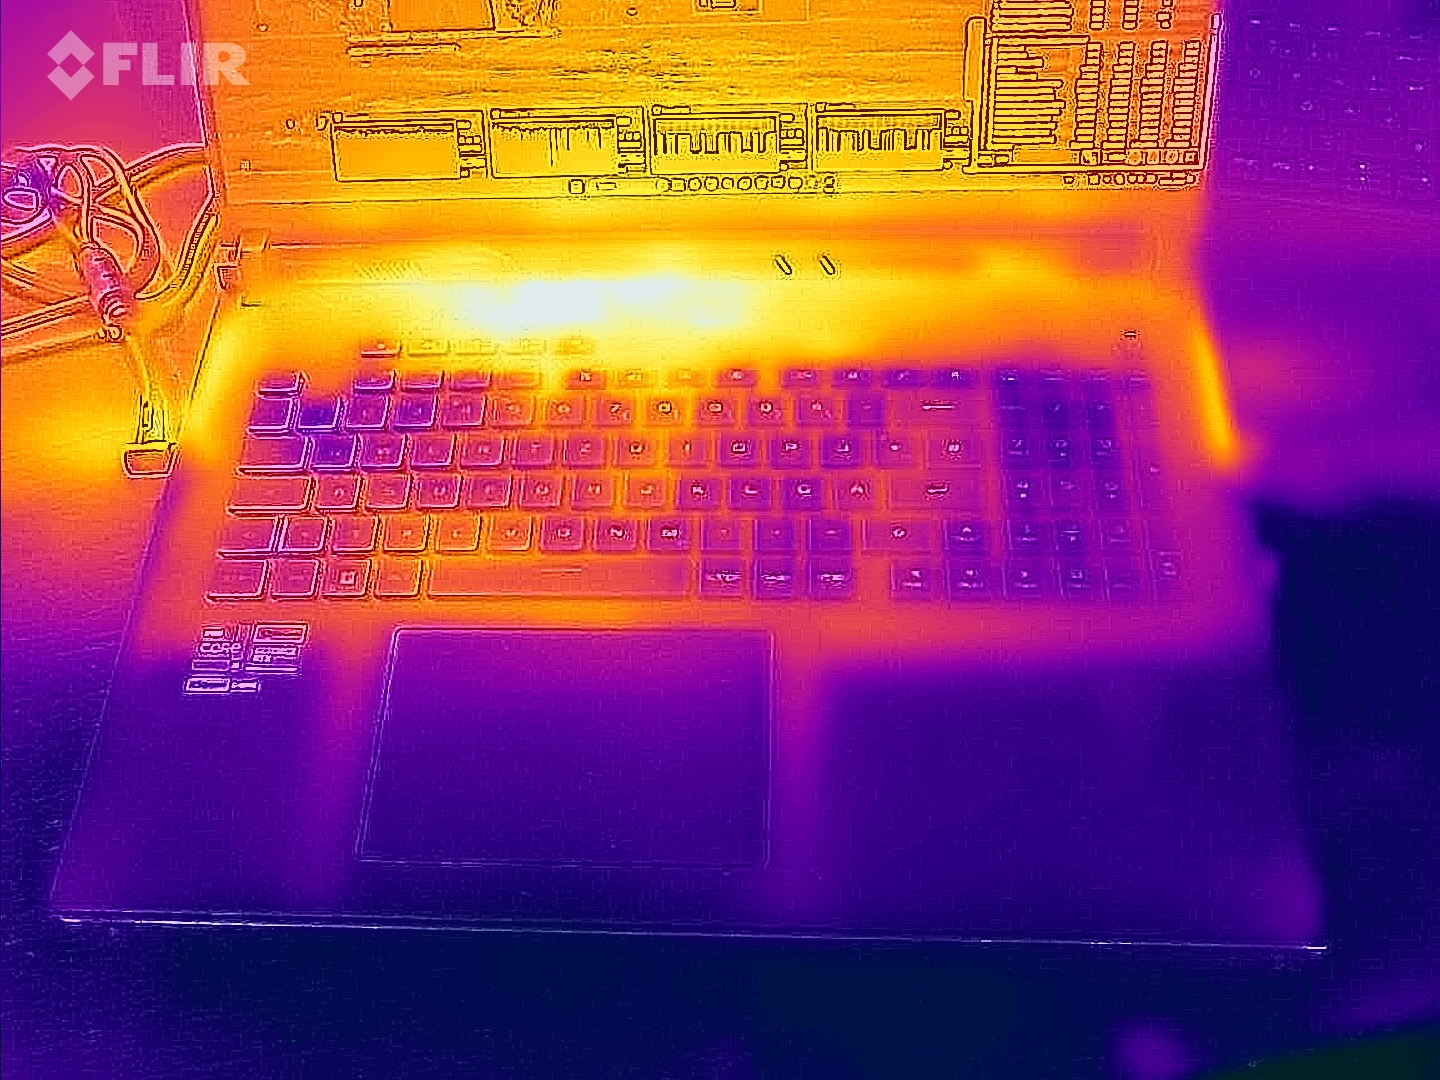
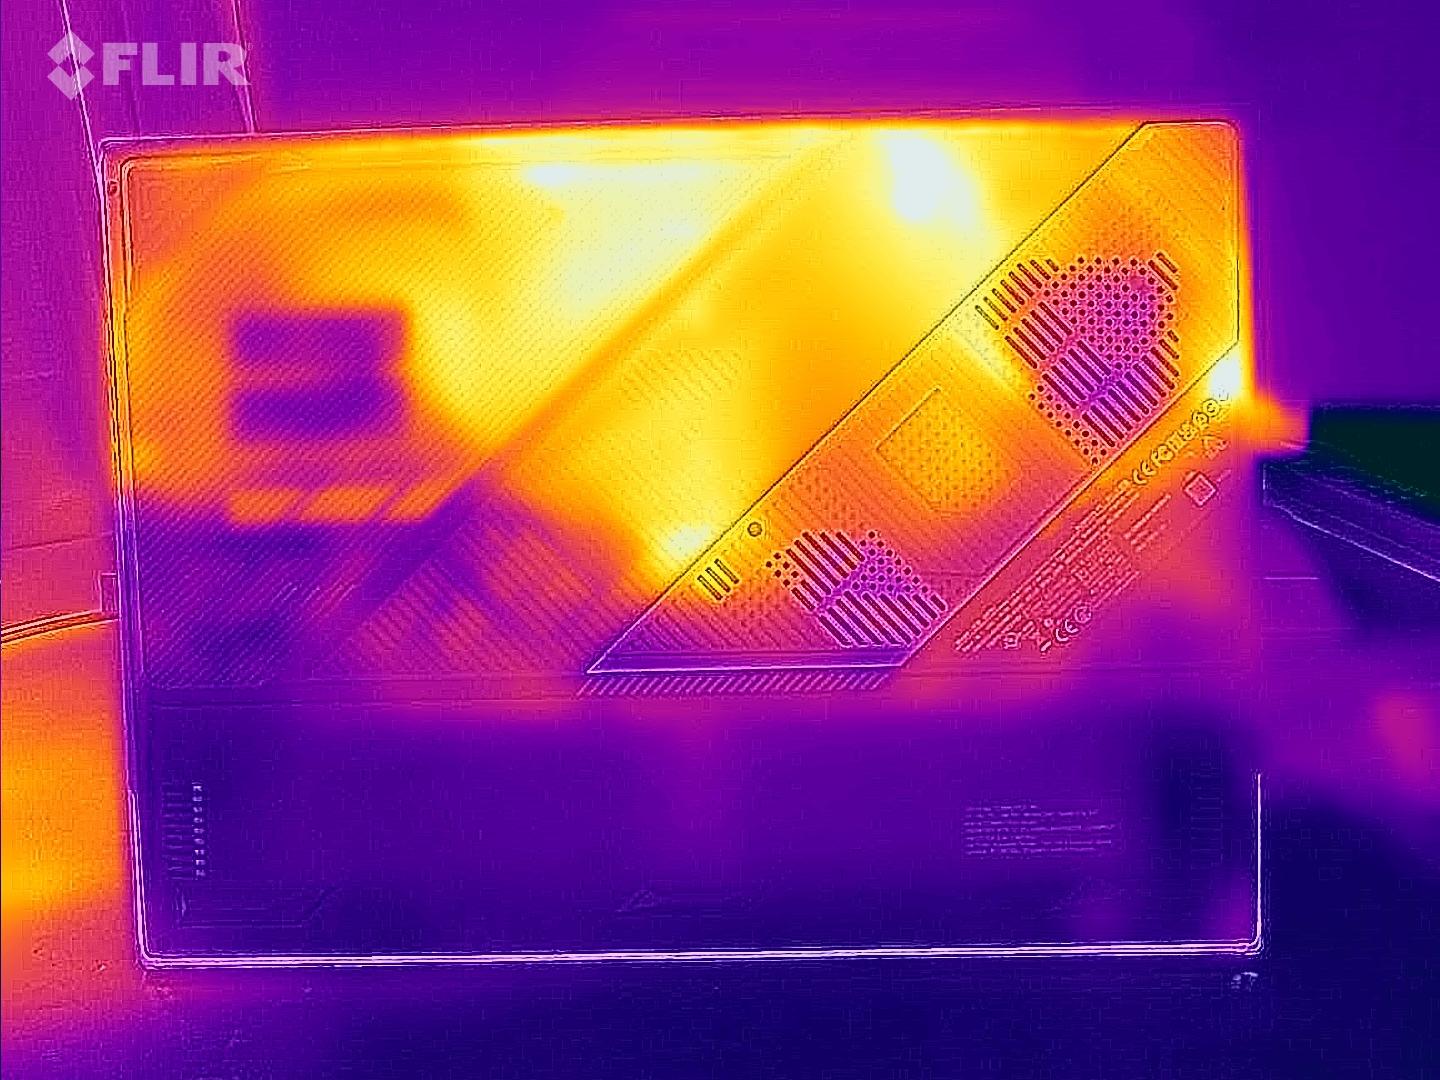
Températures
Le test de stress et le test Witcher 3 entraînent un réchauffement notable mais non excessif de l'ordinateur portable. À certains endroits, des valeurs supérieures à 50 ºC (122 ºF) sont atteintes. Toutefois, dans le cadre d'une utilisation quotidienne (bureautique, Internet), les températures restent dans la fourchette verte.
(-) La température maximale du côté supérieur est de 49 °C / 120 F, par rapport à la moyenne de 40.4 °C / 105 F, allant de 21.2 à 68.8 °C pour la classe Gaming.
(-) Le fond chauffe jusqu'à un maximum de 47 °C / 117 F, contre une moyenne de 43.2 °C / 110 F
(+) En utilisation inactive, la température moyenne du côté supérieur est de 27.3 °C / 81 F, par rapport à la moyenne du dispositif de 33.9 °C / 93 F.
(-) En jouant à The Witcher 3, la température moyenne du côté supérieur est de 39.1 °C / 102 F, alors que la moyenne de l'appareil est de 33.9 °C / 93 F.
(+) Les repose-poignets et le pavé tactile atteignent la température maximale de la peau (35 °C / 95 F) et ne sont donc pas chauds.
(-) La température moyenne de la zone de l'appui-paume de dispositifs similaires était de 28.8 °C / 83.8 F (-6.2 °C / #-11.2 F).
| Asus ROG Strix Scar 18 G834JYR (2024) Intel Core i9-14900HX, NVIDIA GeForce RTX 4090 Laptop GPU | Alienware m18 R1 AMD AMD Ryzen 9 7945HX, AMD Radeon RX 7900M | Alienware m18 R1 Intel Core i9-13980HX, NVIDIA GeForce RTX 4090 Laptop GPU | Acer Predator Helios 18 N23Q2 Intel Core i9-13900HX, NVIDIA GeForce RTX 4080 Laptop GPU | Razer Blade 18 RTX 4070 Intel Core i9-13950HX, NVIDIA GeForce RTX 4070 Laptop GPU | MSI Titan 18 HX A14VIG Intel Core i9-14900HX, NVIDIA GeForce RTX 4090 Laptop GPU | Asus ROG Strix Scar 18 2023 G834JY-N6005W Intel Core i9-13980HX, NVIDIA GeForce RTX 4090 Laptop GPU | |
|---|---|---|---|---|---|---|---|
| Heat | 8% | 13% | -8% | 7% | 2% | -3% | |
| Maximum Upper Side * (°C) | 49 | 40.2 18% | 39 20% | 35 29% | 39.2 20% | 37.8 23% | 54 -10% |
| Maximum Bottom * (°C) | 47 | 37.4 20% | 36.4 23% | 56 -19% | 35.6 24% | 37.6 20% | 46 2% |
| Idle Upper Side * (°C) | 29 | 31.6 -9% | 29.2 -1% | 34 -17% | 31.8 -10% | 34.8 -20% | 30 -3% |
| Idle Bottom * (°C) | 31 | 30.6 1% | 27.8 10% | 39 -26% | 33.2 -7% | 36 -16% | 31 -0% |
* ... Moindre est la valeur, meilleures sont les performances
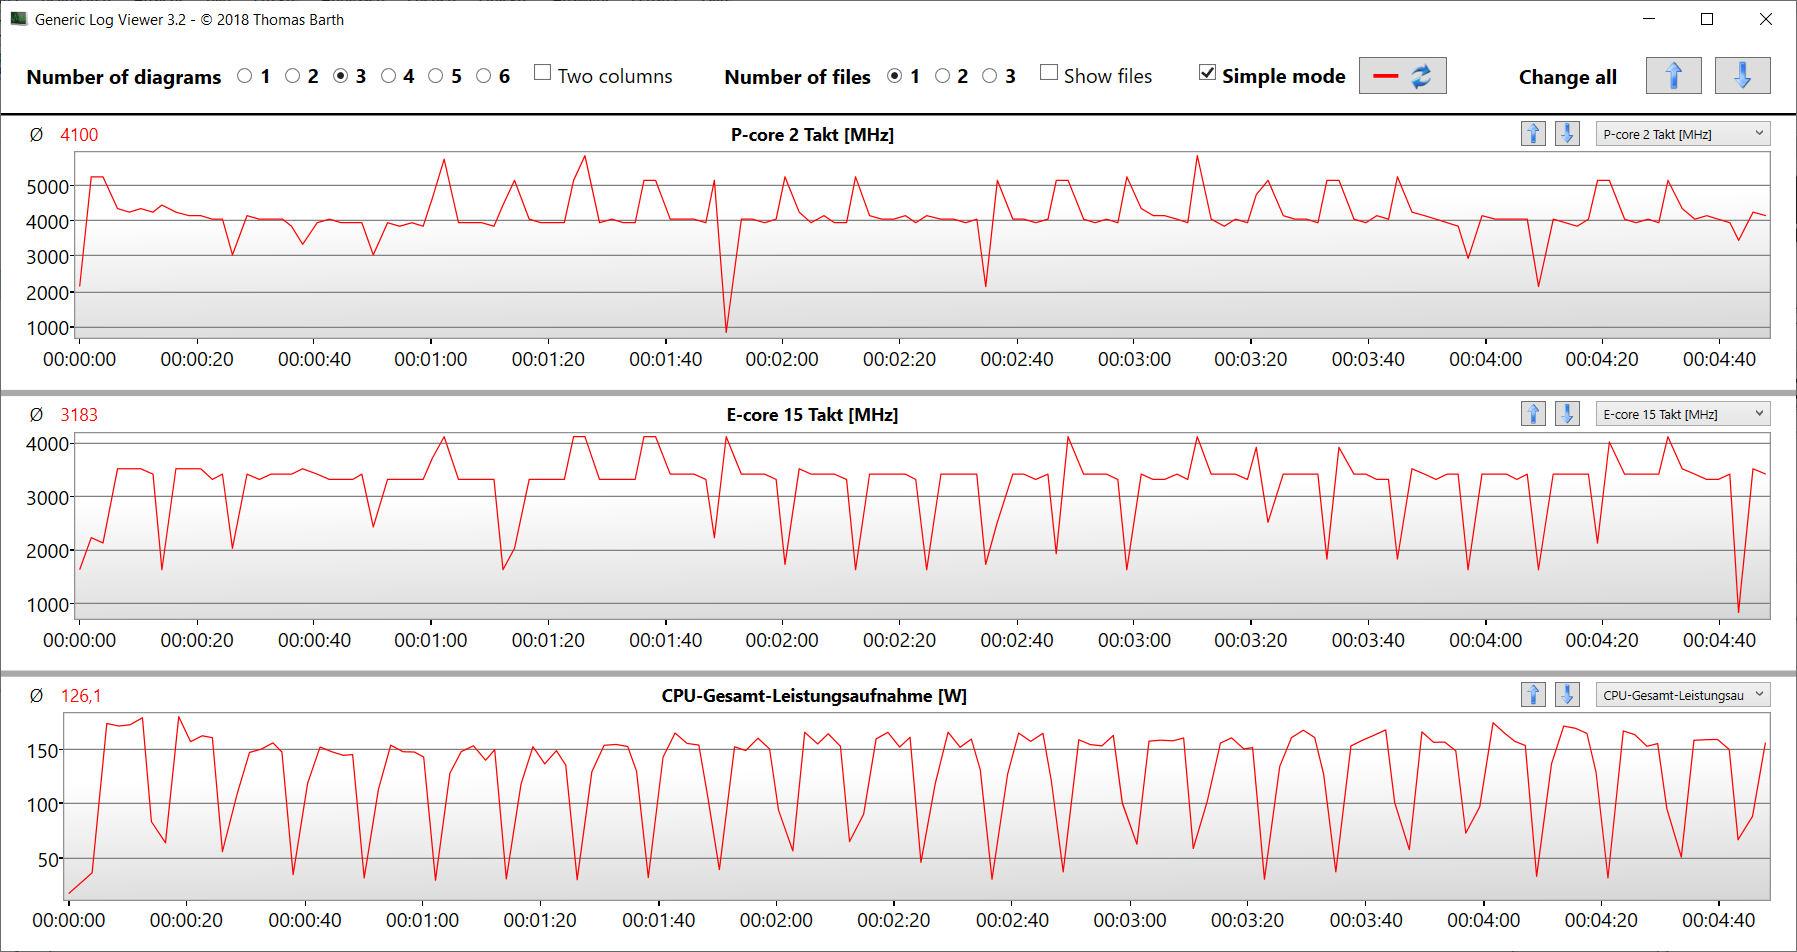
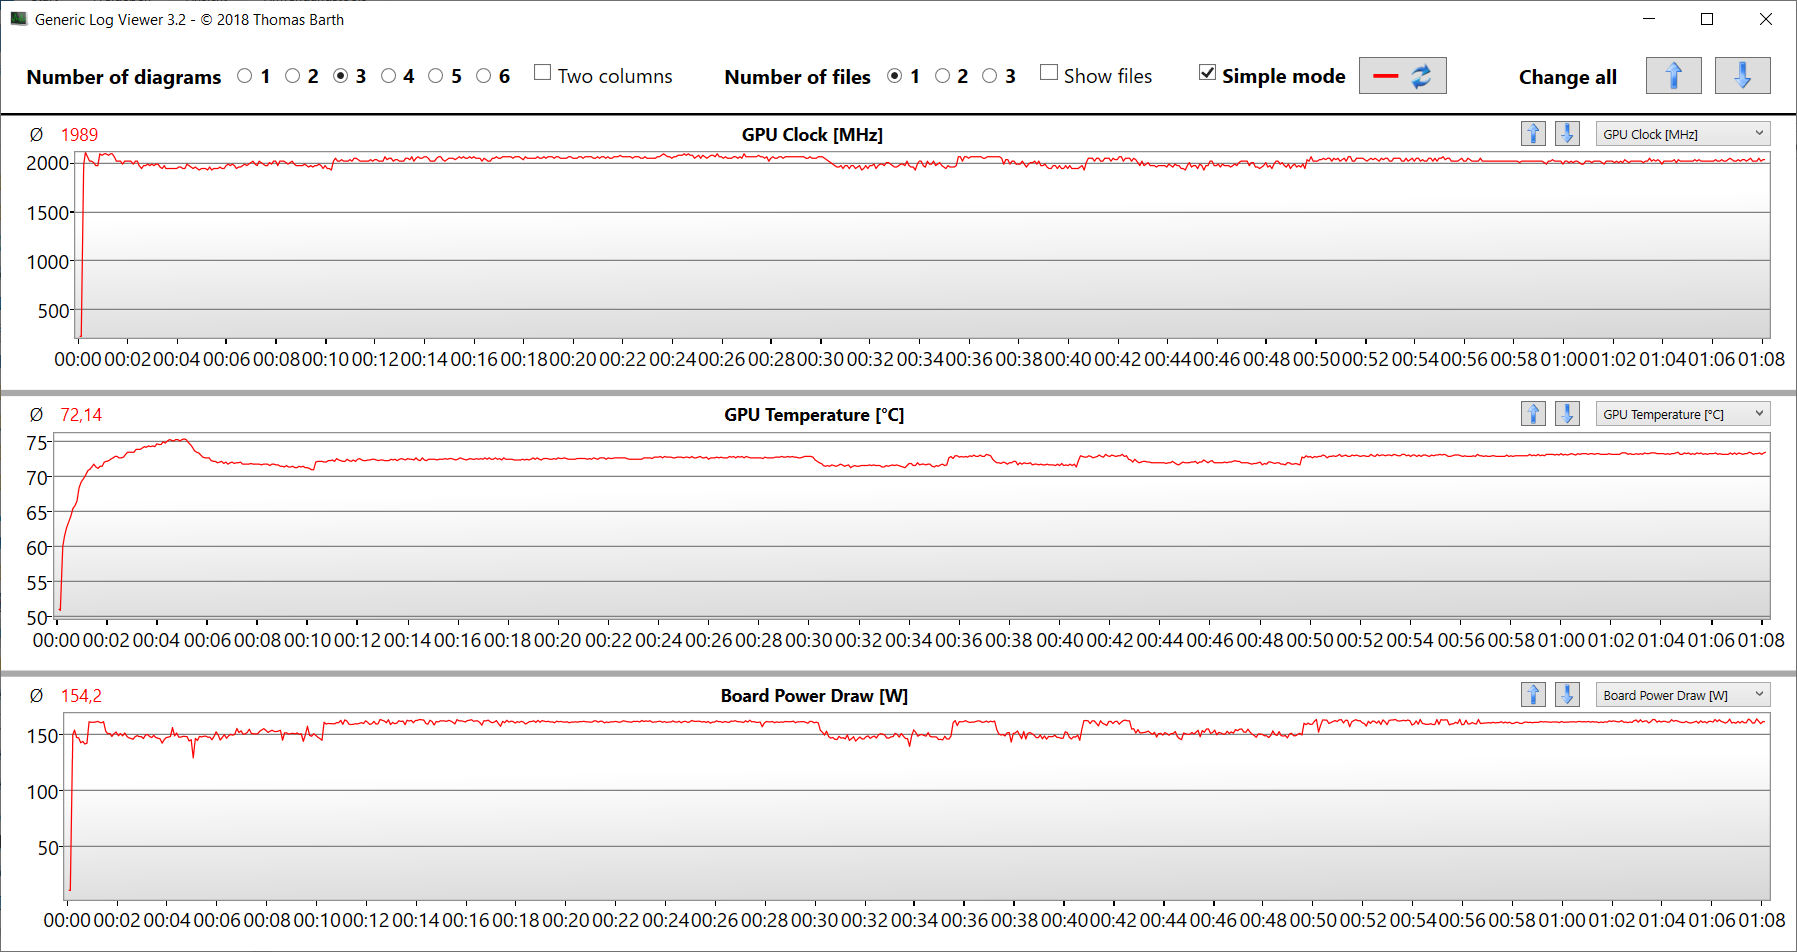
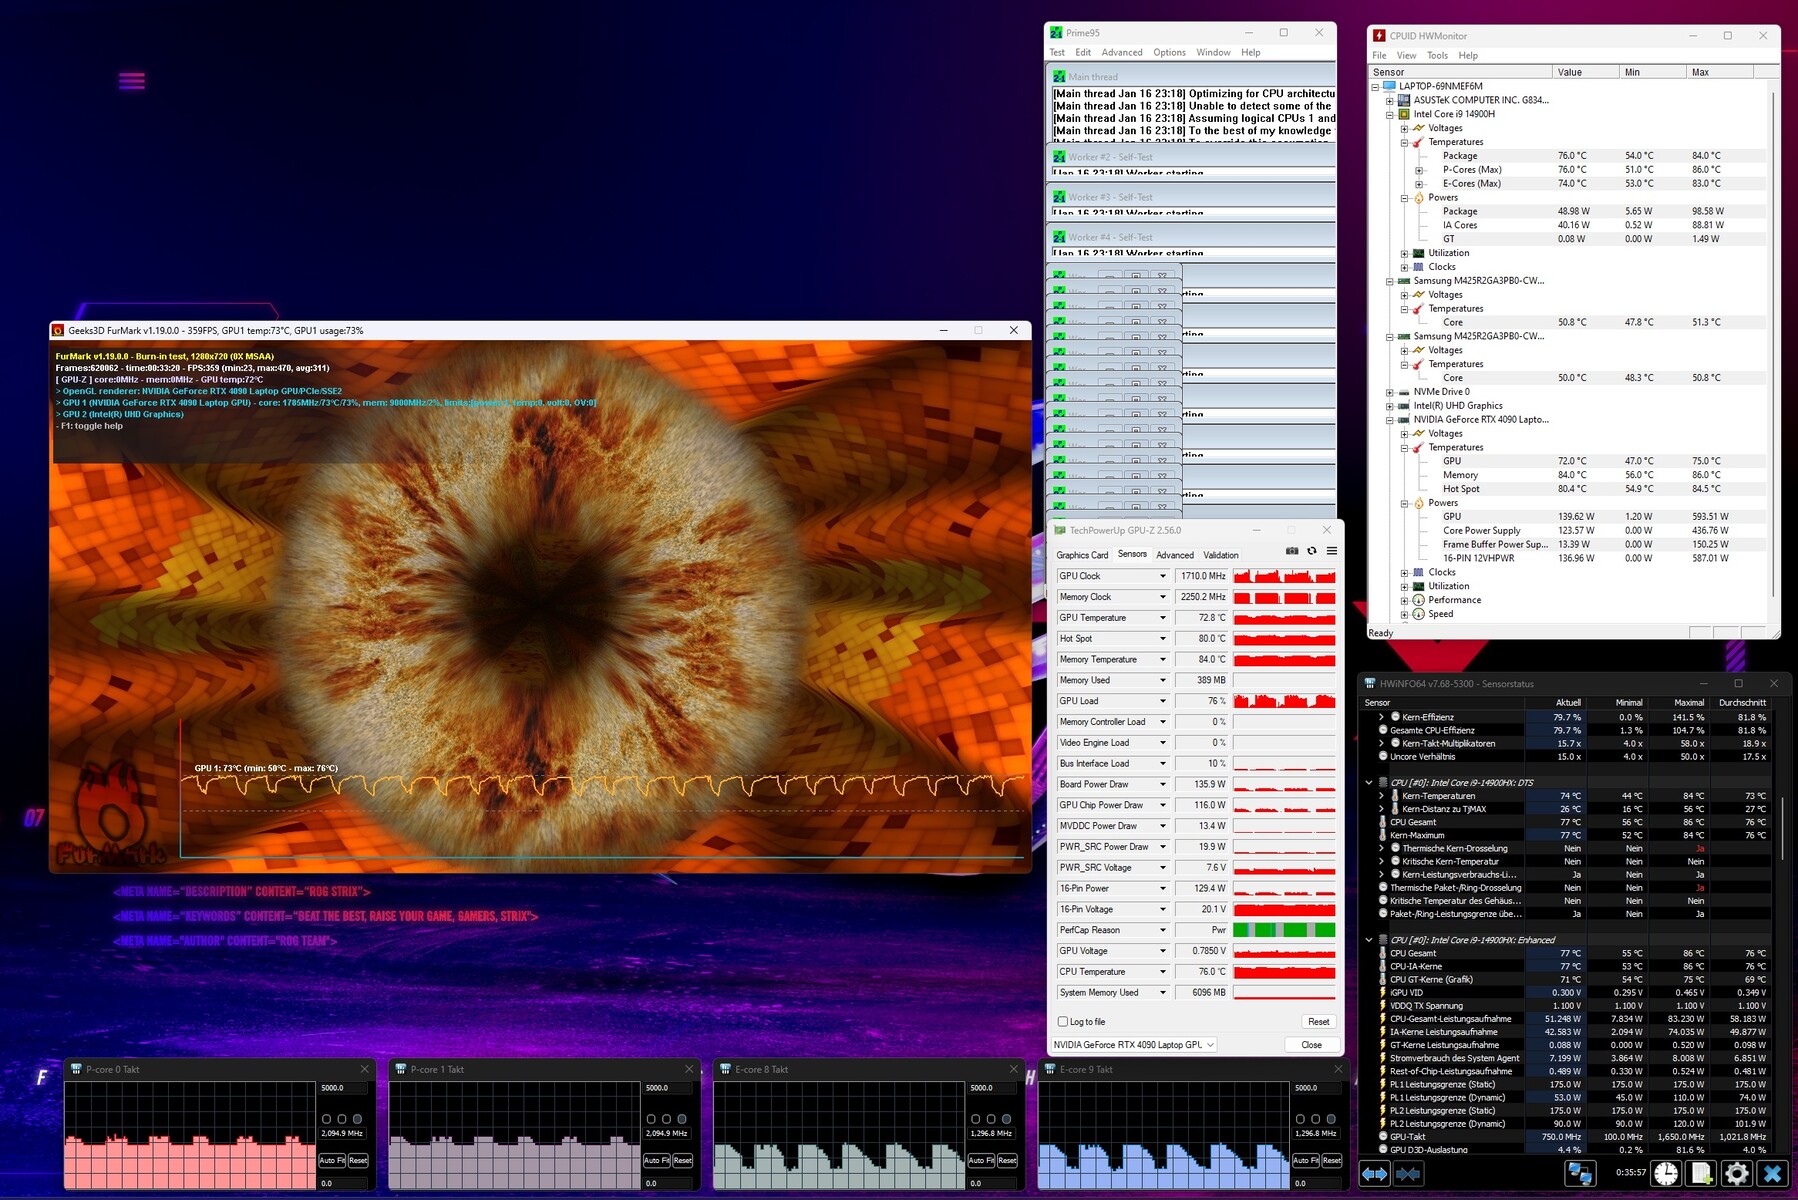
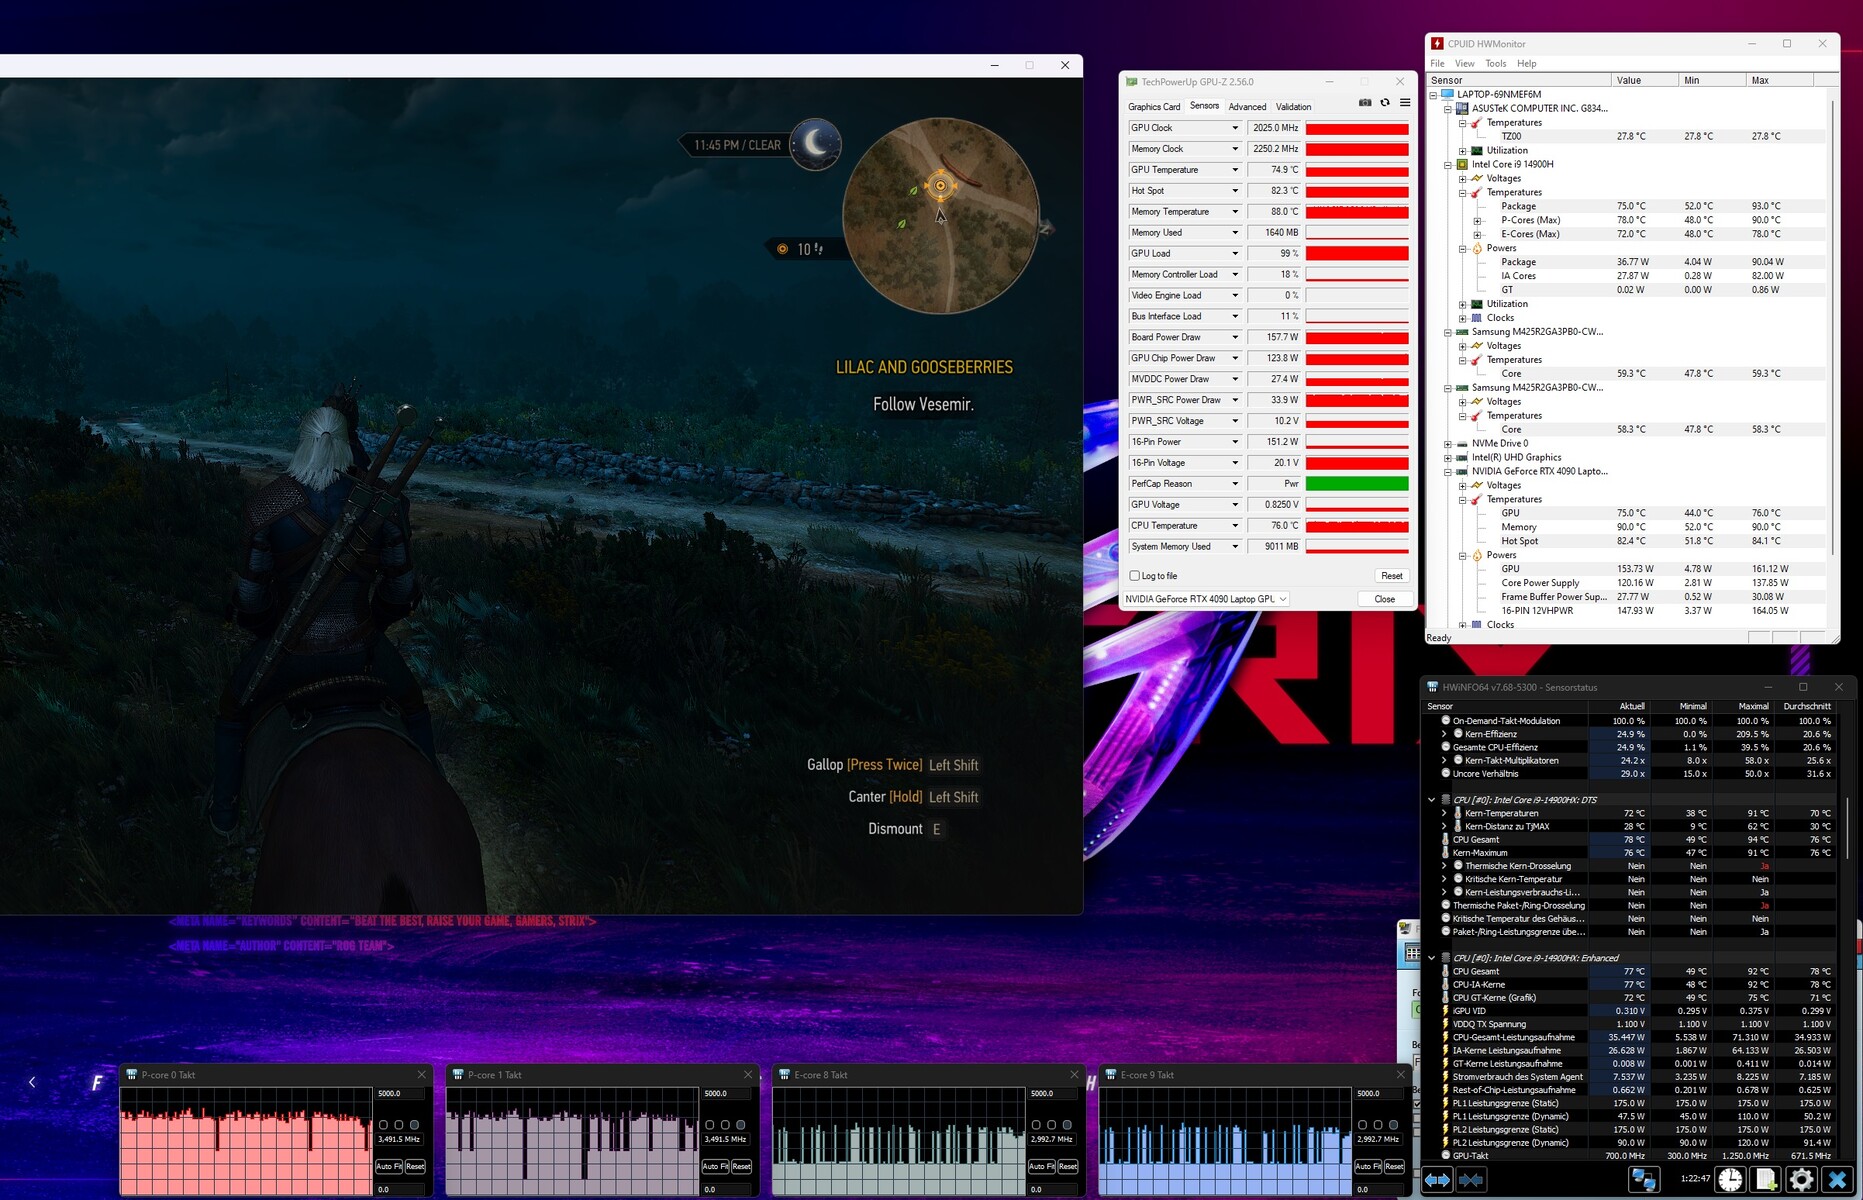
Test de stress
Le test de stress (avec Prime95 et Furmark fonctionnant en permanence) représente un scénario extrême pour évaluer la stabilité du système à pleine charge. Le CPU atteint des vitesses maximales de 2,5 à 2,6 GHz (cœurs P) et de 2,2 à 2,3 GHz (cœurs E). Le GPU (1,9 à 2 GHz) commence le test à une vitesse presque maximale, qui diminue légèrement au fur et à mesure que le test se poursuit. En outre, le GPU est régulièrement étranglé de manière significative.
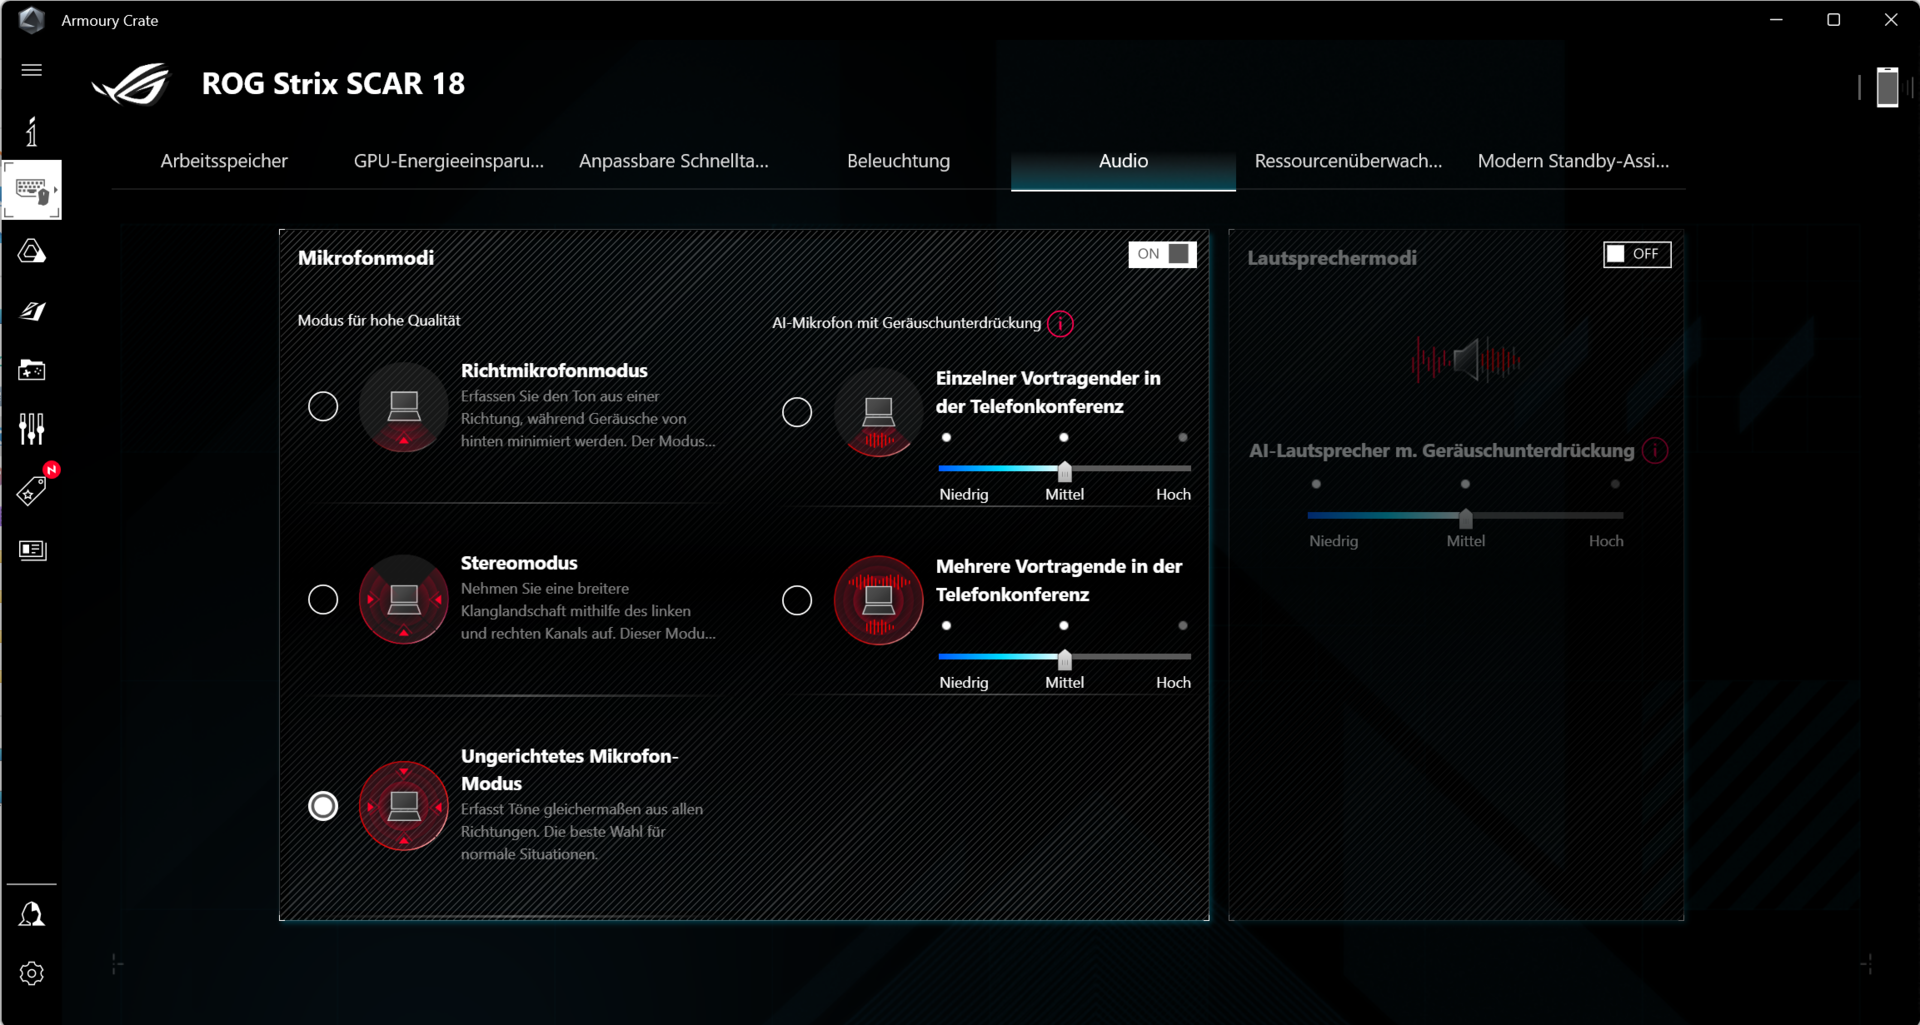
Intervenants
Les quatre haut-parleurs produisent ensemble un son très correct. Pour une expérience sonore encore meilleure, vous pouvez utiliser un casque ou des haut-parleurs externes.
Asus ROG Strix Scar 18 G834JYR (2024) analyse audio
(+) | les haut-parleurs peuvent jouer relativement fort (82# dB)
Basses 100 - 315 Hz
(±) | basse réduite - en moyenne 5.6% inférieure à la médiane
(+) | les basses sont linéaires (6.8% delta à la fréquence précédente)
Médiums 400 - 2000 Hz
(±) | médiane supérieure - en moyenne 5.7% supérieure à la médiane
(+) | les médiums sont linéaires (2.8% delta à la fréquence précédente)
Aiguës 2 - 16 kHz
(±) | sommets réduits - en moyenne 7.2% plus bas que la médiane
(±) | la linéarité des aigus est moyenne (7.2% delta à la fréquence précédente)
Globalement 100 - 16 000 Hz
(+) | le son global est linéaire (13% différence à la médiane)
Par rapport à la même classe
» 18% de tous les appareils testés de cette catégorie étaient meilleurs, 3% similaires, 79% pires
» Le meilleur avait un delta de 6%, la moyenne était de 18%, le pire était de 132%.
Par rapport à tous les appareils testés
» 13% de tous les appareils testés étaient meilleurs, 3% similaires, 85% pires
» Le meilleur avait un delta de 4%, la moyenne était de 23%, le pire était de 134%.
MSI Titan 18 HX A14VIG analyse audio
(+) | les haut-parleurs peuvent jouer relativement fort (89.2# dB)
Basses 100 - 315 Hz
(-) | presque aucune basse - en moyenne 17.6% plus bas que la médiane
(±) | la linéarité des basses est moyenne (8% delta à la fréquence précédente)
Médiums 400 - 2000 Hz
(+) | médiane équilibrée - seulement 1.8% de la médiane
(+) | les médiums sont linéaires (3.7% delta à la fréquence précédente)
Aiguës 2 - 16 kHz
(+) | des sommets équilibrés - à seulement 1.2% de la médiane
(+) | les aigus sont linéaires (2% delta à la fréquence précédente)
Globalement 100 - 16 000 Hz
(+) | le son global est linéaire (9.9% différence à la médiane)
Par rapport à la même classe
» 5% de tous les appareils testés de cette catégorie étaient meilleurs, 2% similaires, 94% pires
» Le meilleur avait un delta de 6%, la moyenne était de 18%, le pire était de 132%.
Par rapport à tous les appareils testés
» 4% de tous les appareils testés étaient meilleurs, 1% similaires, 95% pires
» Le meilleur avait un delta de 4%, la moyenne était de 23%, le pire était de 134%.
Gestion de l'énergie - L'Asus ROG atteint une assez bonne autonomie
Consommation électrique
Pendant le test Witcher 3, la consommation d'énergie reste constante à un niveau attendu, et pendant le test de stress, la consommation varie. Cette variation peut être attribuée à une réduction significative de la vitesse du GPU qui se produit régulièrement. Le chargeur de 330 watts fournit une puissance suffisante.
| Éteint/en veille | |
| Au repos | |
| Fortement sollicité |
|
Légende:
min: | |
| Asus ROG Strix Scar 18 G834JYR (2024) i9-14900HX, GeForce RTX 4090 Laptop GPU | Alienware m18 R1 AMD R9 7945HX, Radeon RX 7900M | Alienware m18 R1 i9-13980HX, GeForce RTX 4090 Laptop GPU | Acer Predator Helios 18 N23Q2 i9-13900HX, GeForce RTX 4080 Laptop GPU | Razer Blade 18 RTX 4070 i9-13950HX, GeForce RTX 4070 Laptop GPU | MSI Titan 18 HX A14VIG i9-14900HX, GeForce RTX 4090 Laptop GPU | Asus ROG Strix Scar 18 2023 G834JY-N6005W i9-13980HX, GeForce RTX 4090 Laptop GPU | Moyenne de la classe Gaming | |
|---|---|---|---|---|---|---|---|---|
| Power Consumption | -112% | -48% | -4% | -40% | -40% | -35% | 7% | |
| Idle Minimum * (Watt) | 14 | 30.3 -116% | 21.6 -54% | 16 -14% | 24.5 -75% | 13.2 6% | 17.3 -24% | 13 ? 7% |
| Idle Average * (Watt) | 17 | 55.6 -227% | 25.2 -48% | 19 -12% | 34.1 -101% | 25.4 -49% | 27 -59% | 18.7 ? -10% |
| Idle Maximum * (Watt) | 24 | 101.1 -321% | 56.7 -136% | 21.3 11% | 47.7 -99% | 53.5 -123% | 46 -92% | 24.3 ? -1% |
| Load Average * (Watt) | 143 | 160.3 -12% | 164.1 -15% | 124 13% | 140 2% | 151.4 -6% | 133 7% | 110.2 ? 23% |
| Witcher 3 ultra * (Watt) | 251 | 216 14% | 311 -24% | 289 -15% | 202 20% | 336 -34% | ||
| Load Maximum * (Watt) | 302 | 332.1 -10% | 338.9 -12% | 319 -6% | 261 14% | 395.2 -31% | 329 -9% | 258 ? 15% |
* ... Moindre est la valeur, meilleures sont les performances
Power Consumption The Witcher 3 / Stress Test
Power Consumption With External Monitor
Autonomie de la batterie
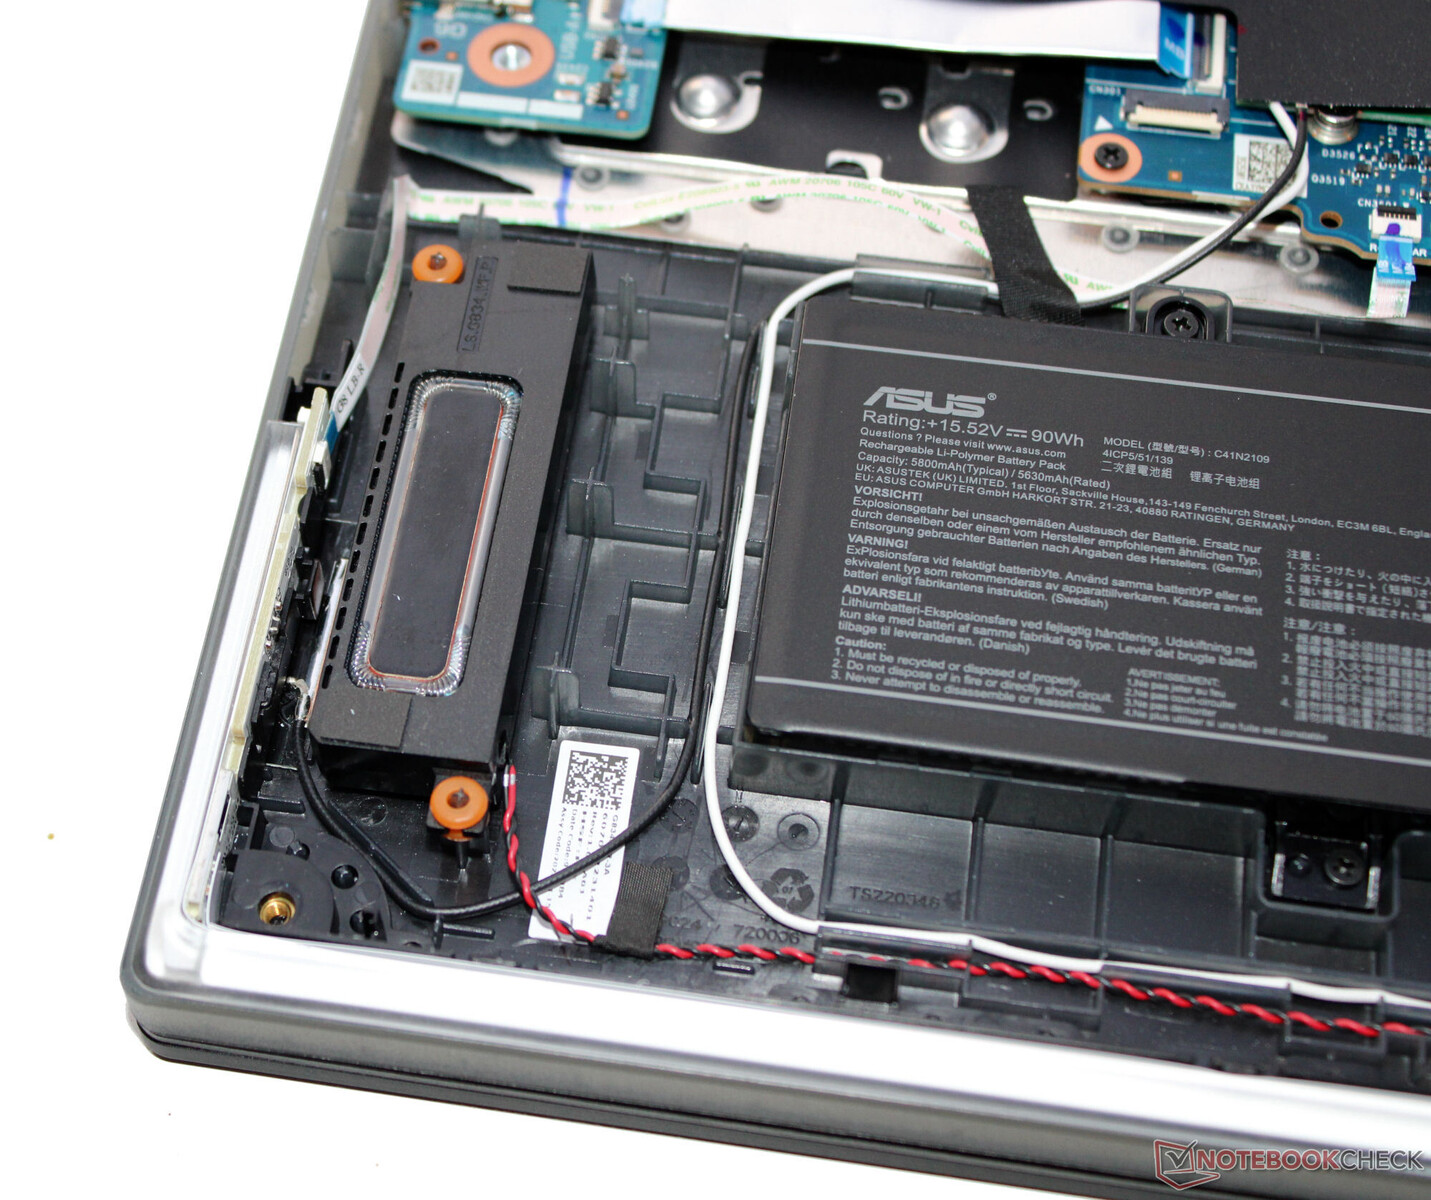
Lors de notre test WLAN avec chargement de sites web par script et de notre test vidéo avec lecture en boucle du court métrage Big Buck Bunny (codage H.264, FHD), l'ordinateur portable de 18 pouces a atteint des durées de fonctionnement de 7:41 h et 7:27 h respectivement. Le Scar 18 offre donc de très bonnes valeurs dans l'ensemble et est capable de surpasser ses concurrents par des marges significatives, bien que la capacité de leur batterie soit en partie plus importante.
| Asus ROG Strix Scar 18 G834JYR (2024) i9-14900HX, GeForce RTX 4090 Laptop GPU, 90 Wh | Alienware m18 R1 AMD R9 7945HX, Radeon RX 7900M, 97 Wh | Alienware m18 R1 i9-13980HX, GeForce RTX 4090 Laptop GPU, 97 Wh | Acer Predator Helios 18 N23Q2 i9-13900HX, GeForce RTX 4080 Laptop GPU, 90 Wh | Razer Blade 18 RTX 4070 i9-13950HX, GeForce RTX 4070 Laptop GPU, 91.7 Wh | MSI Titan 18 HX A14VIG i9-14900HX, GeForce RTX 4090 Laptop GPU, 99.9 Wh | Asus ROG Strix Scar 18 2023 G834JY-N6005W i9-13980HX, GeForce RTX 4090 Laptop GPU, 90 Wh | Moyenne de la classe Gaming | |
|---|---|---|---|---|---|---|---|---|
| Autonomie de la batterie | -61% | -45% | -16% | -26% | -32% | -15% | -0% | |
| Reader / Idle (h) | 10.2 | 4.5 -56% | 5.6 -45% | 7 -31% | 5.9 -42% | 8.16 ? -20% | ||
| H.264 (h) | 7.5 | 4.8 -36% | 7 -7% | 8.32 ? 11% | ||||
| WiFi v1.3 (h) | 7.7 | 1.4 -82% | 4.3 -44% | 4.4 -43% | 4 -48% | 4.2 -45% | 7.1 -8% | 7.11 ? -8% |
| Load (h) | 1.3 | 0.7 -46% | 0.7 -46% | 1.7 31% | 1.3 0% | 1.2 -8% | 0.9 -31% | 1.502 ? 16% |
| Witcher 3 ultra (h) | 0.9 |
Points positifs
Points négatifs
Verdict - Des améliorations sont possibles
Le traitement de la vidéo et de l'image, le streaming, le rendu et les jeux font partie des principaux scénarios d'utilisation de l'ordinateur portable. Alors que la GeForce RTX 4090 et le Core i9-14900HX fournissent les performances nécessaires, ils n'atteignent pas de nouveaux records. Les émissions se situent aux niveaux élevés habituels pour cette catégorie d'appareils.
Avec le ROG Strix Scar 18 (2024), Asus propose un ordinateur portable haut de gamme puissant à un prix élevé.
Le point fort de l'ordinateur portable est son écran mini-LED (2560x1600 pixels, DCI-P3, Dolby Vision, 240 Hz) d'une diagonale de 18 pouces au format 16:10. Ses points positifs sont une luminosité maximale de près de 1 000 cd/m², une très bonne valeur de noir et une grande précision des couleurs.
Les ports USB-C (1x USB 3.2 Gen 2, 1x Thunderbolt 4) facilitent son intégration dans les configurations existantes du lieu de travail et ouvrent quelques options d'extension telles qu'un GPU externe ou une station d'accueil. Les deux ports USB-C peuvent être utilisés pour la sortie du signal DisplayPort, et le port USB 3.2 Gen 2 prend également en charge Power Delivery. Le tout est accompagné d'une très bonne autonomie de batterie.
Une alternative pourrait être le MSI Titan 18 HX A14VIGqui est capable d'obtenir des performances légèrement supérieures à partir de la même combinaison CPU/GPU, offre un écran mini-LED 4k et dispose de deux ports TB4. Cependant, l'ordinateur portable de MSI est loin d'atteindre l'autonomie de la batterie du Strix.
Prix et disponibilité
L'Asus ROG Strix Scar 18 (2024) est disponible pour environ 3 000 $ sur la boutique Asus et pour le même prix sur Amazon, par exemple. Une configuration similaire à notre unité de test est disponible pour ~$3,900 sur Amazon.
Asus ROG Strix Scar 18 G834JYR (2024)
- 02/07/2024 v7 (old)
Sascha Mölck
Transparency
La sélection des appareils à examiner est effectuée par notre équipe éditoriale. L'échantillon de test a été prêté à l'auteur par le fabricant ou le détaillant pour les besoins de cet examen. Le prêteur n'a pas eu d'influence sur cette évaluation et le fabricant n'a pas reçu de copie de cette évaluation avant sa publication. Il n'y avait aucune obligation de publier cet article. En tant que média indépendant, Notebookcheck n'est pas soumis à l'autorité des fabricants, des détaillants ou des éditeurs.
Voici comment Notebookcheck teste
Chaque année, Notebookcheck examine de manière indépendante des centaines d'ordinateurs portables et de smartphones en utilisant des procédures standardisées afin de garantir que tous les résultats sont comparables. Nous avons continuellement développé nos méthodes de test depuis environ 20 ans et avons établi des normes industrielles dans le processus. Dans nos laboratoires de test, des équipements de mesure de haute qualité sont utilisés par des techniciens et des rédacteurs expérimentés. Ces tests impliquent un processus de validation en plusieurs étapes. Notre système d'évaluation complexe repose sur des centaines de mesures et de points de référence bien fondés, ce qui garantit l'objectivité.Price comparison

