
Verdict - Beaucoup d'espace pour les mises à niveau, mode de performance faible
Lorsque le mode "Performance" est activé, l'ordinateur portable de jeu n'est pas à la hauteur des attentes en termes de performances. En revanche, il est légèrement plus silencieux que certains de ses concurrents, et si vous avez besoin de plus de puissance, vous pouvez toujours passer au très bruyant "mode Turbo". Nous aurions toutefois souhaité un mode entre les deux. La grande évolutivité et le bon équipement sont également des points positifs : 4 emplacements de RAM et 3 emplacements de SSD, ainsi qu'un mini panneau LED de haute qualité et un Wi-Fi 7 rapide.
En dessous du Wi-Fi 6E, les taux de transfert sont particulièrement lents en comparaison. Le fait que le couvercle de l'écran se referme beaucoup trop vite est également un peu gênant. Bien que le disque dur SSD soit rapide, il est parfois étranglé en cas de charge prolongée.
Points positifs
Points négatifs
Prix et disponibilité
Dans notre configuration de test, l'ordinateur portable de jeu est disponible à partir de 3 850 euros (environ 4500 dollars), par exemple, chez notebooksbilliger.de.
- $2,608.76Acer Predator Helios Neo 18 AI Gaming Laptop | Intel Core Ultra 9 Processor 275HX | NVIDIA GeForce RTX 5070 Ti | 18" WQXGA 240Hz G-SYNC | 32GB DDR5 | 2TB Gen 4 SSD | Killer Wi-Fi 6E | PHN18-72-9474
- $3,379.99acer Predator Helios 18 AI Gaming Laptop 18" 250Hz 1000 nits Mini-LED WQXGA (Intel Ultra 9-275HX, GeForce RTX 5080 16GB, 32GB DDR5, 1TB SSD, 2 Thunderbolt 5, Win 11 Home) w/DKZ USB Port Expander
- $1,999.99Acer Predator Helios Neo 18 AI Gaming Laptop | Intel Core Ultra 9 Processor 275HX | NVIDIA GeForce RTX 5070 Ti | 18" WQXGA 240Hz G-SYNC | 16GB DDR5 | 1TB Gen 4 SSD | Killer Wi-Fi 6E | PHN18-72-92Y3
Table des matières
- Verdict - Beaucoup d'espace pour les mises à niveau, mode de performance faible
- Spécifications
- Boîtier et caractéristiques : Predator facile à mettre à niveau
- Dispositifs d'entrée - bouton Predator et beaucoup de RGB
- Écran - mini LED 1 600p
- Performance - Légèrement en dessous de la moyenne en mode performance
- Émissions et énergie - Bloc d'alimentation de 400 W !
- Notebookcheck note globale
- Comparaison des alternatives possibles
L'année dernière, nous avons acheté l'Helios 18 avec un mini panneau LED, Core i9-14900HXet un GeForce RTX 4090 comme un "ensemble complet et sans souci" pour les joueurs. Le contrôle du ventilateur, la consommation d'énergie et l'étranglement du SSD ont fait l'objet de légères critiques. Qu'a fait Acer à ce sujet cette année ?
Spécifications
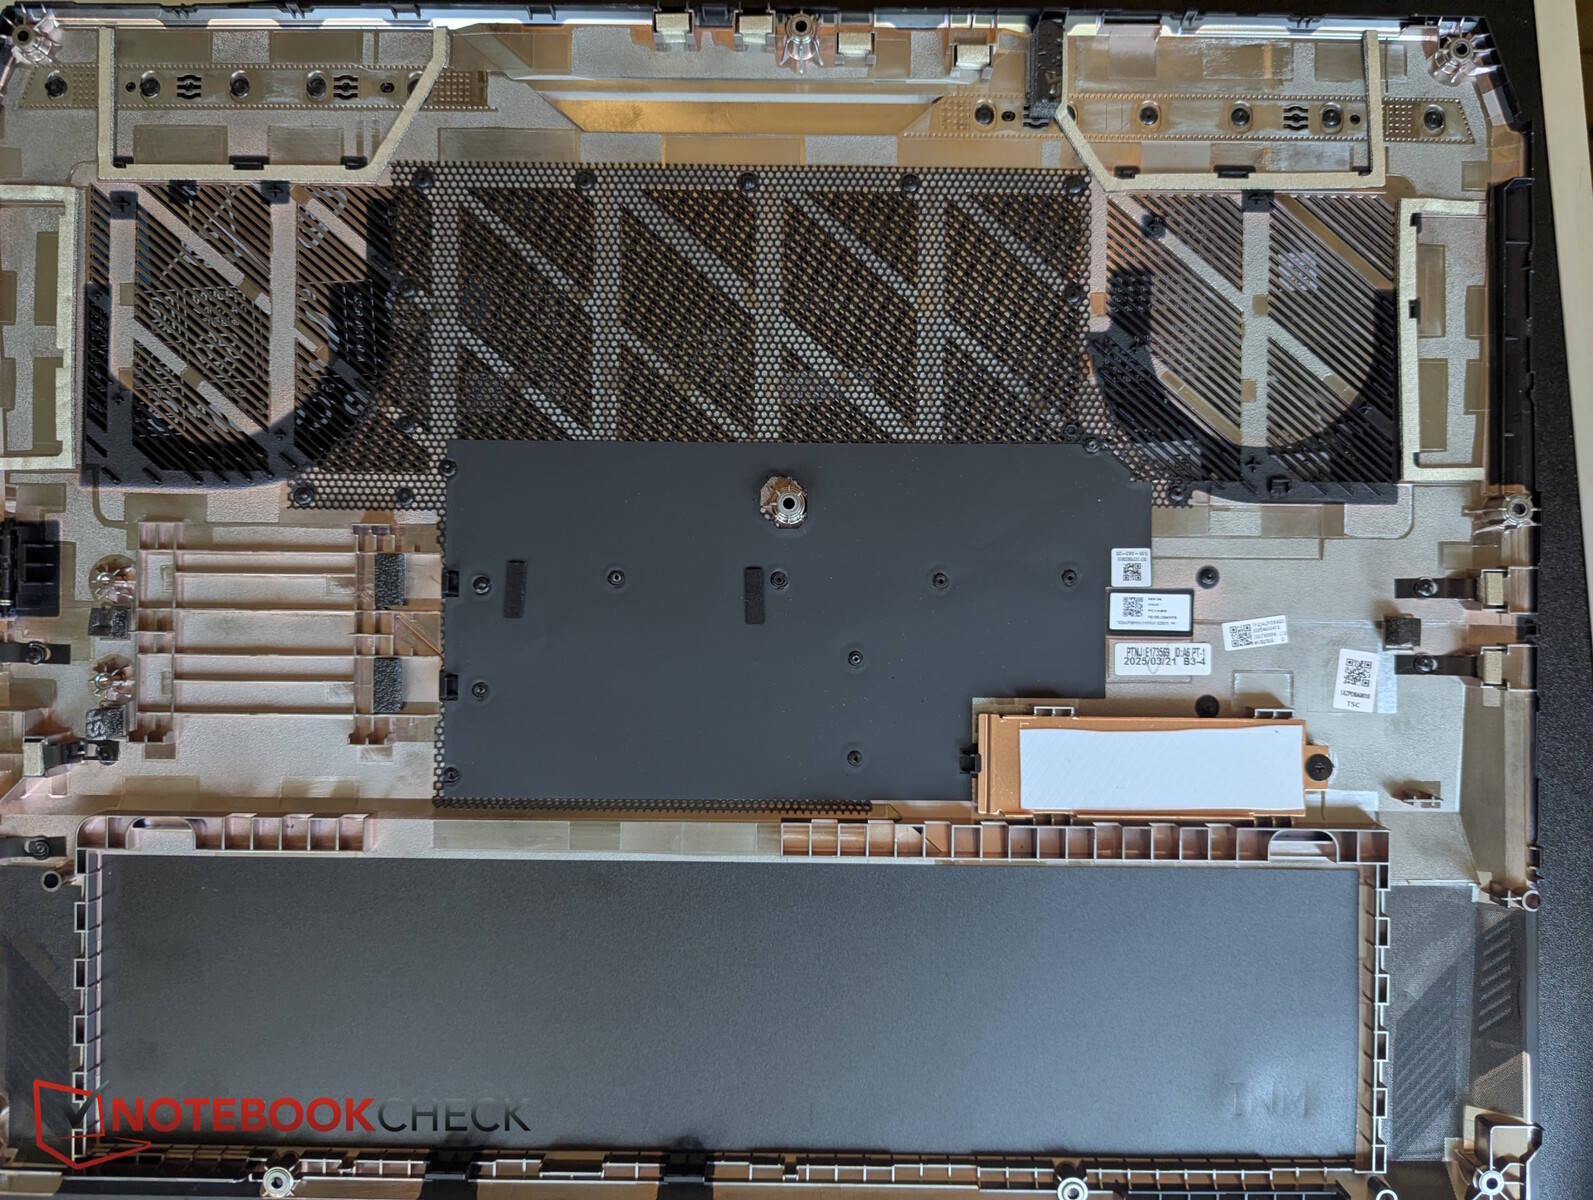
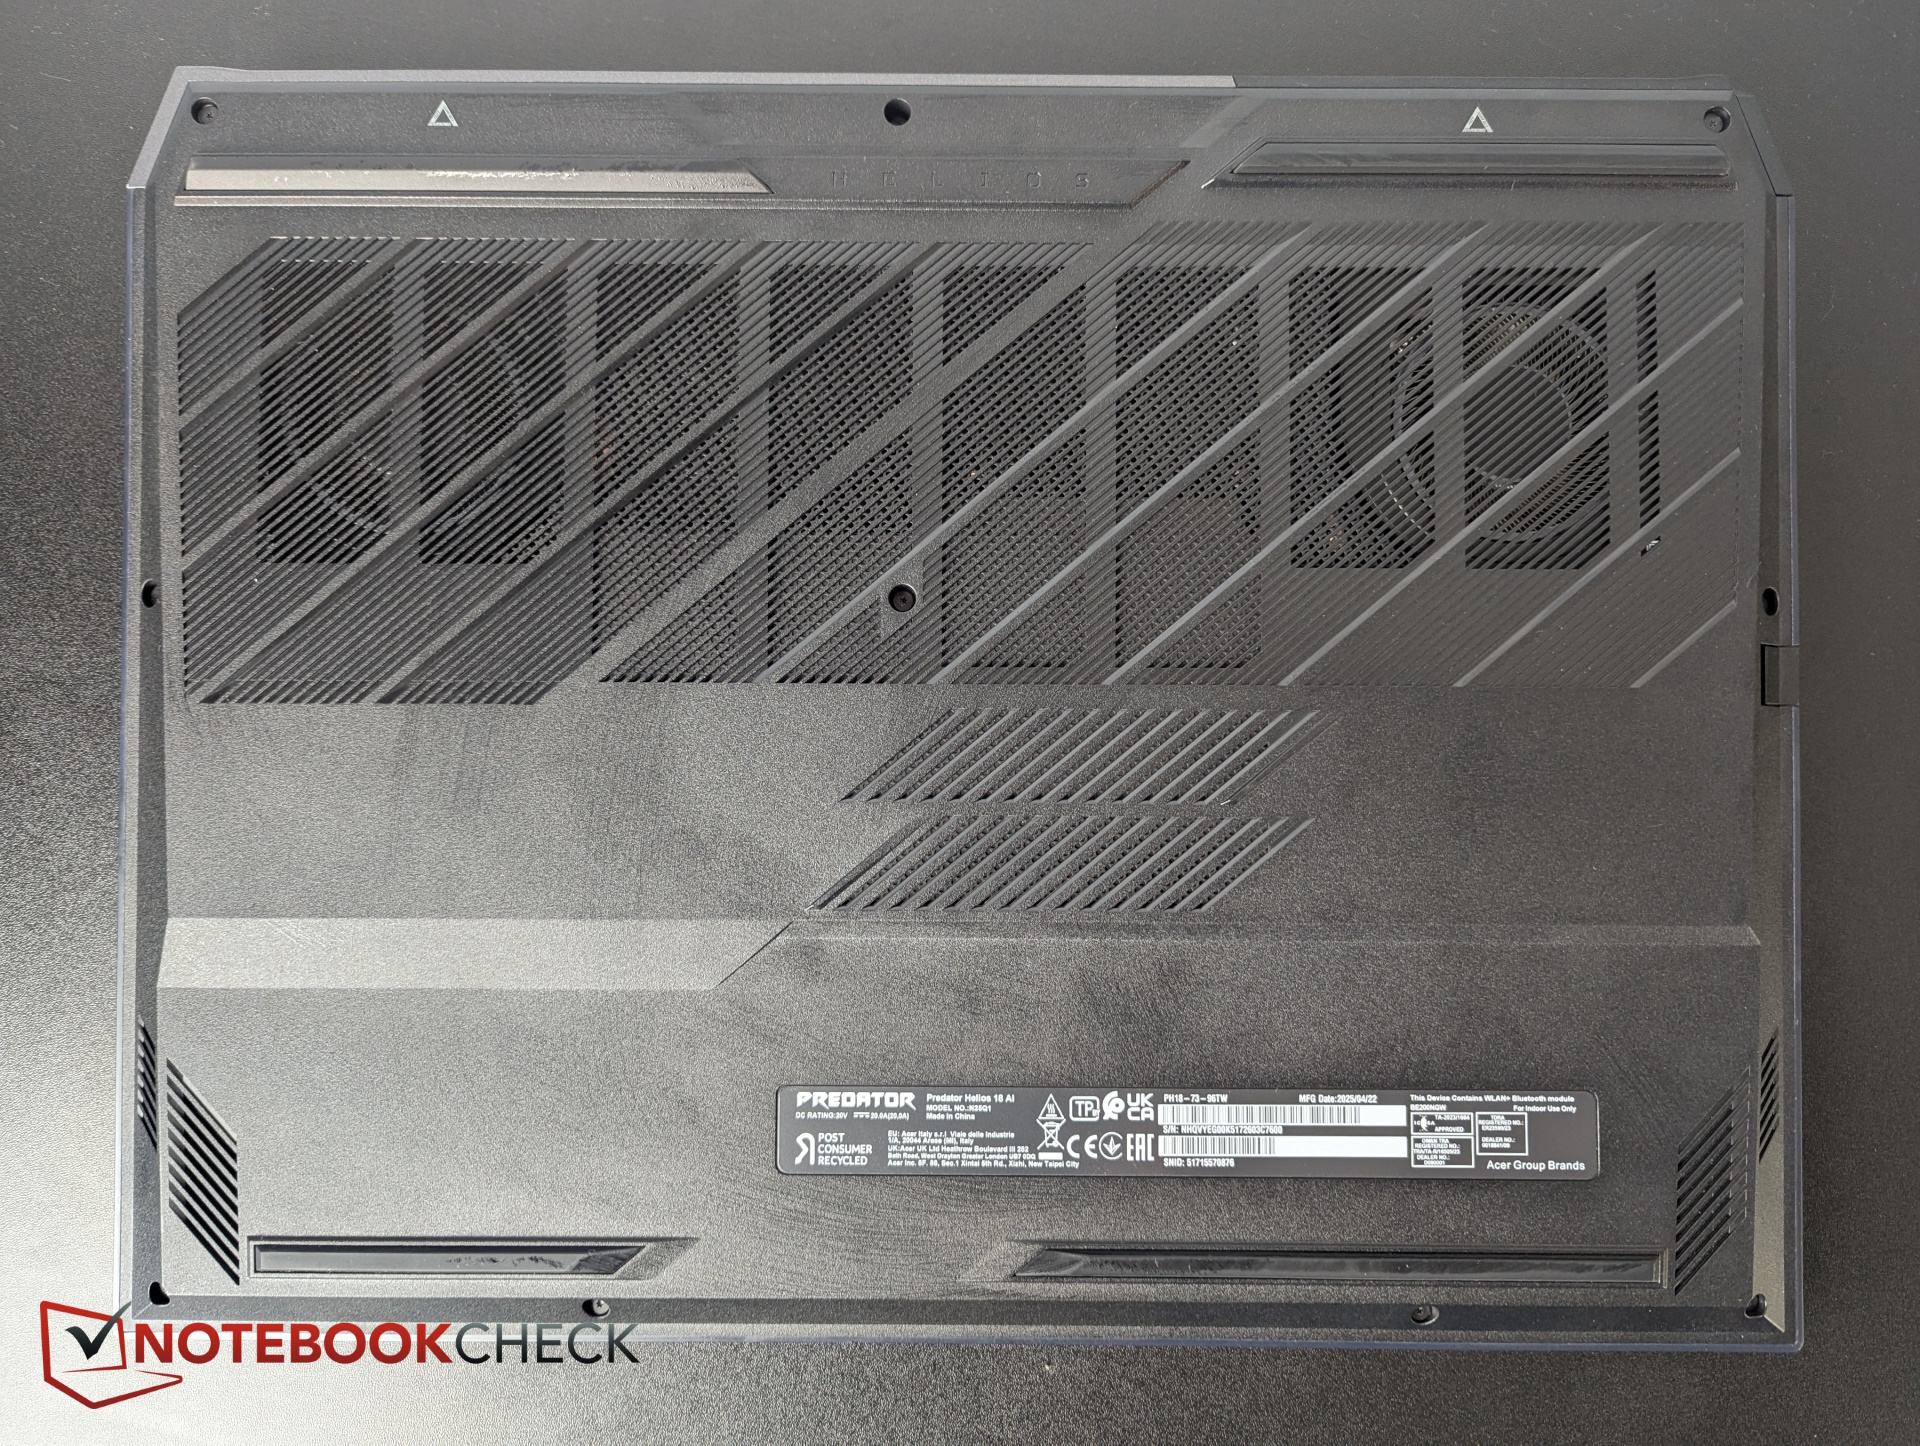
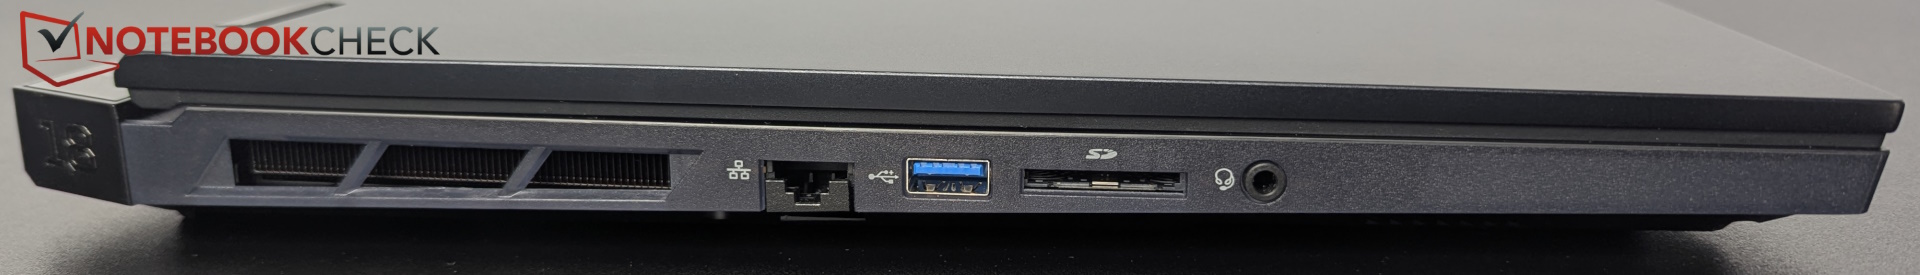
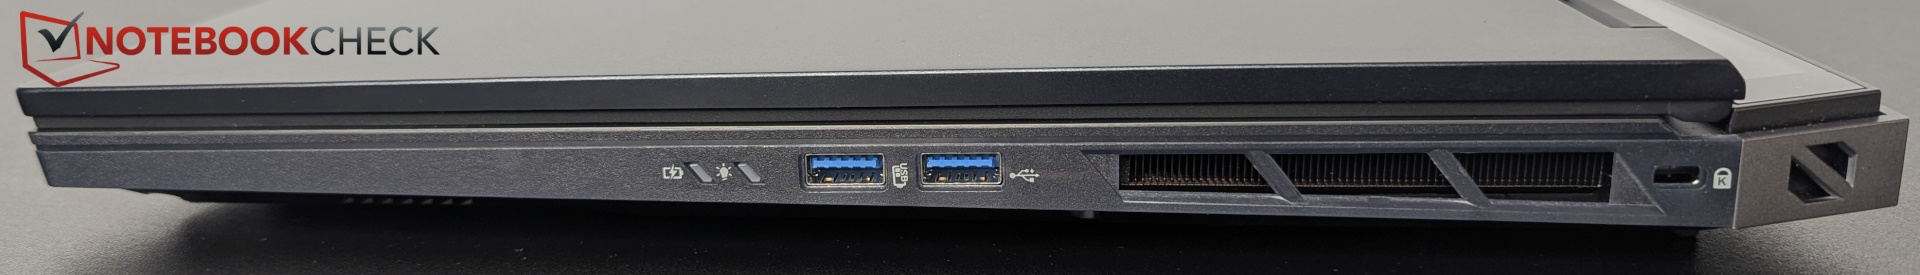
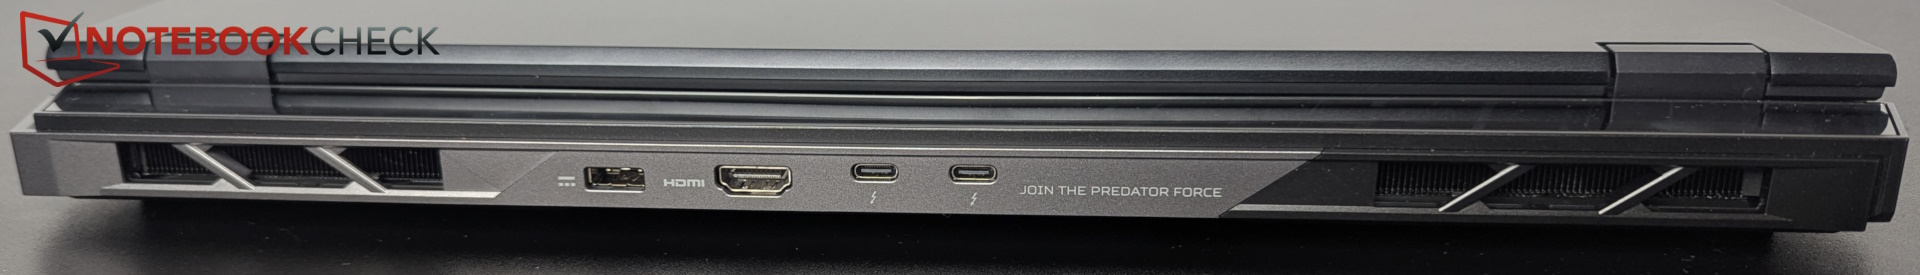
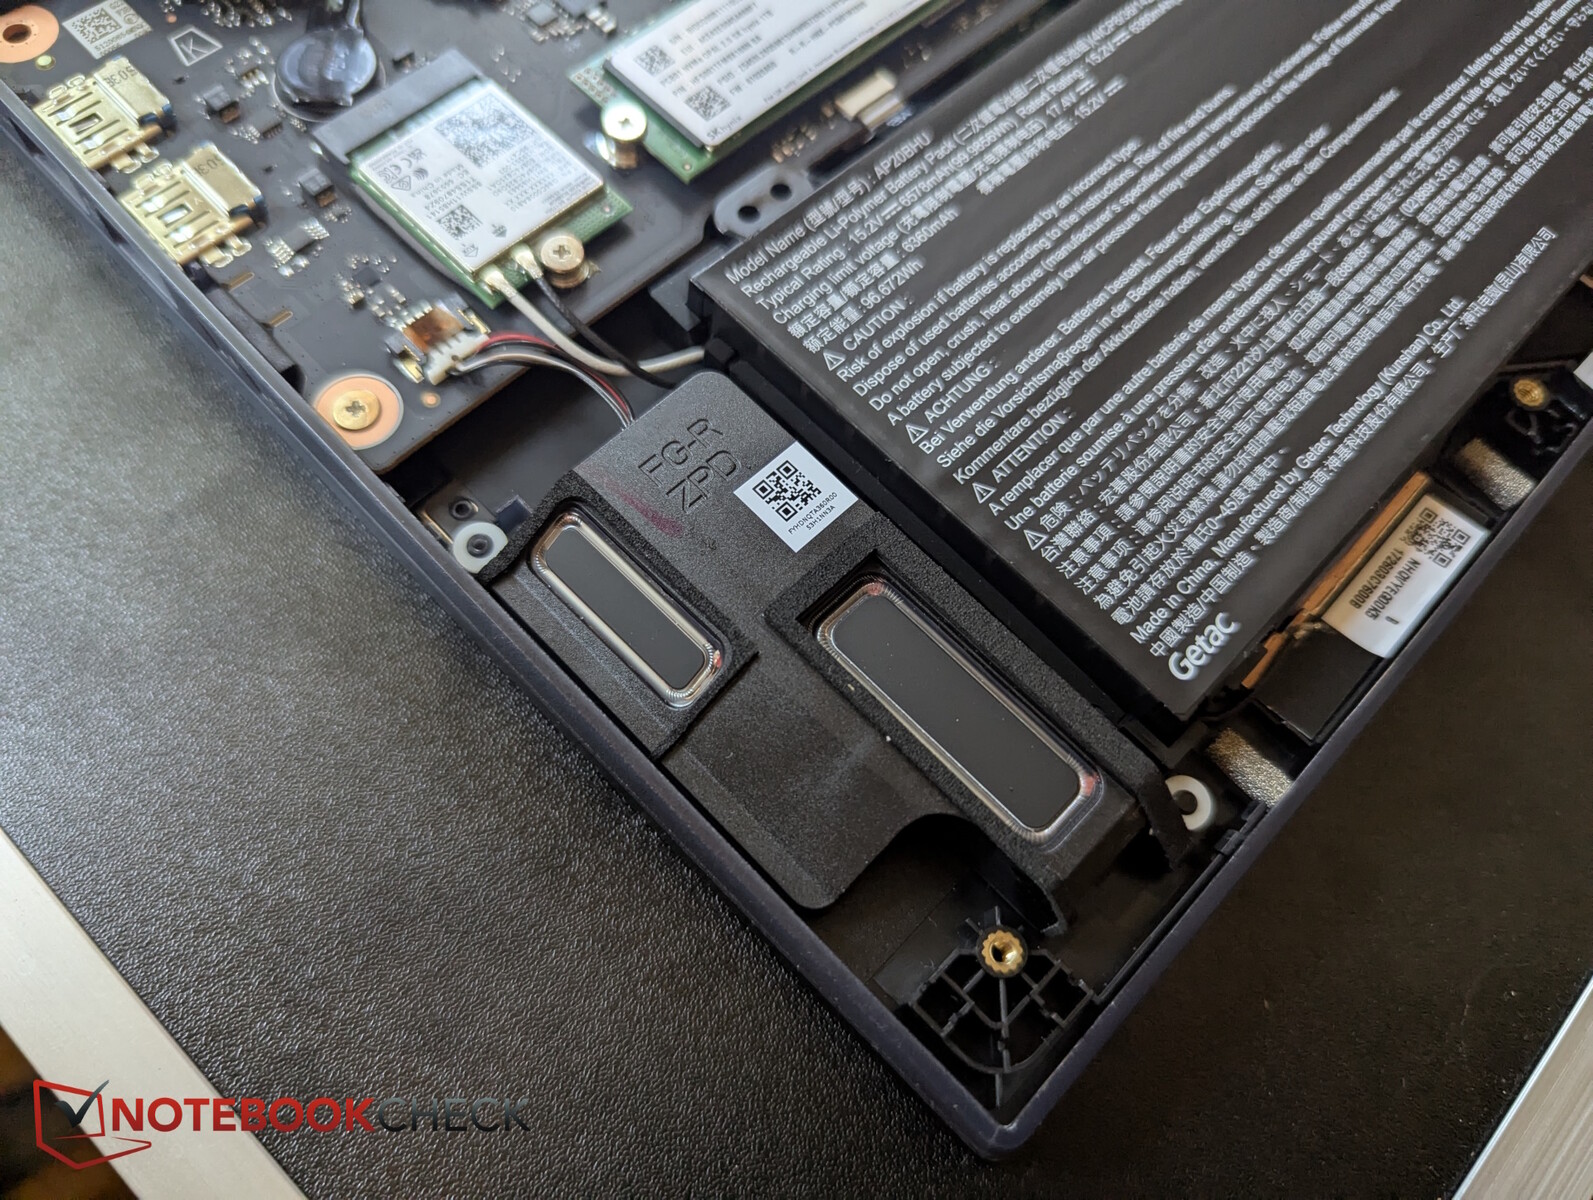
Boîtier et caractéristiques : Predator facile à mettre à niveau
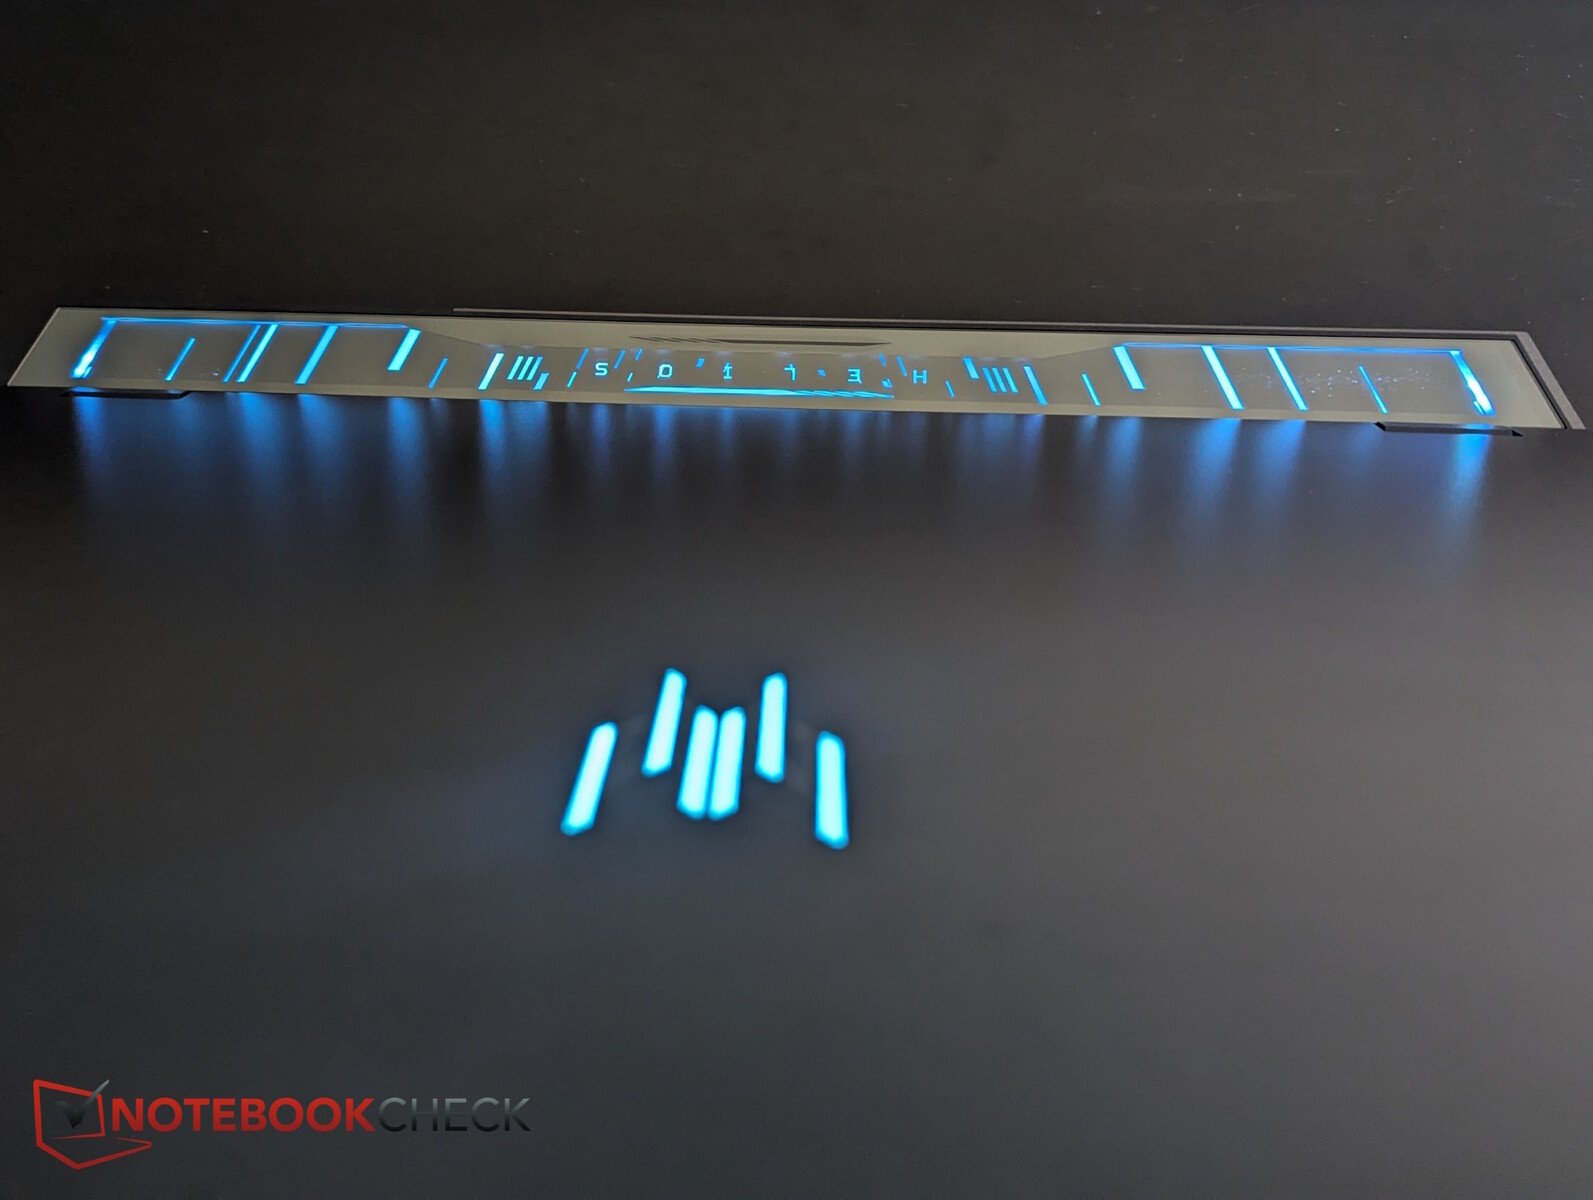
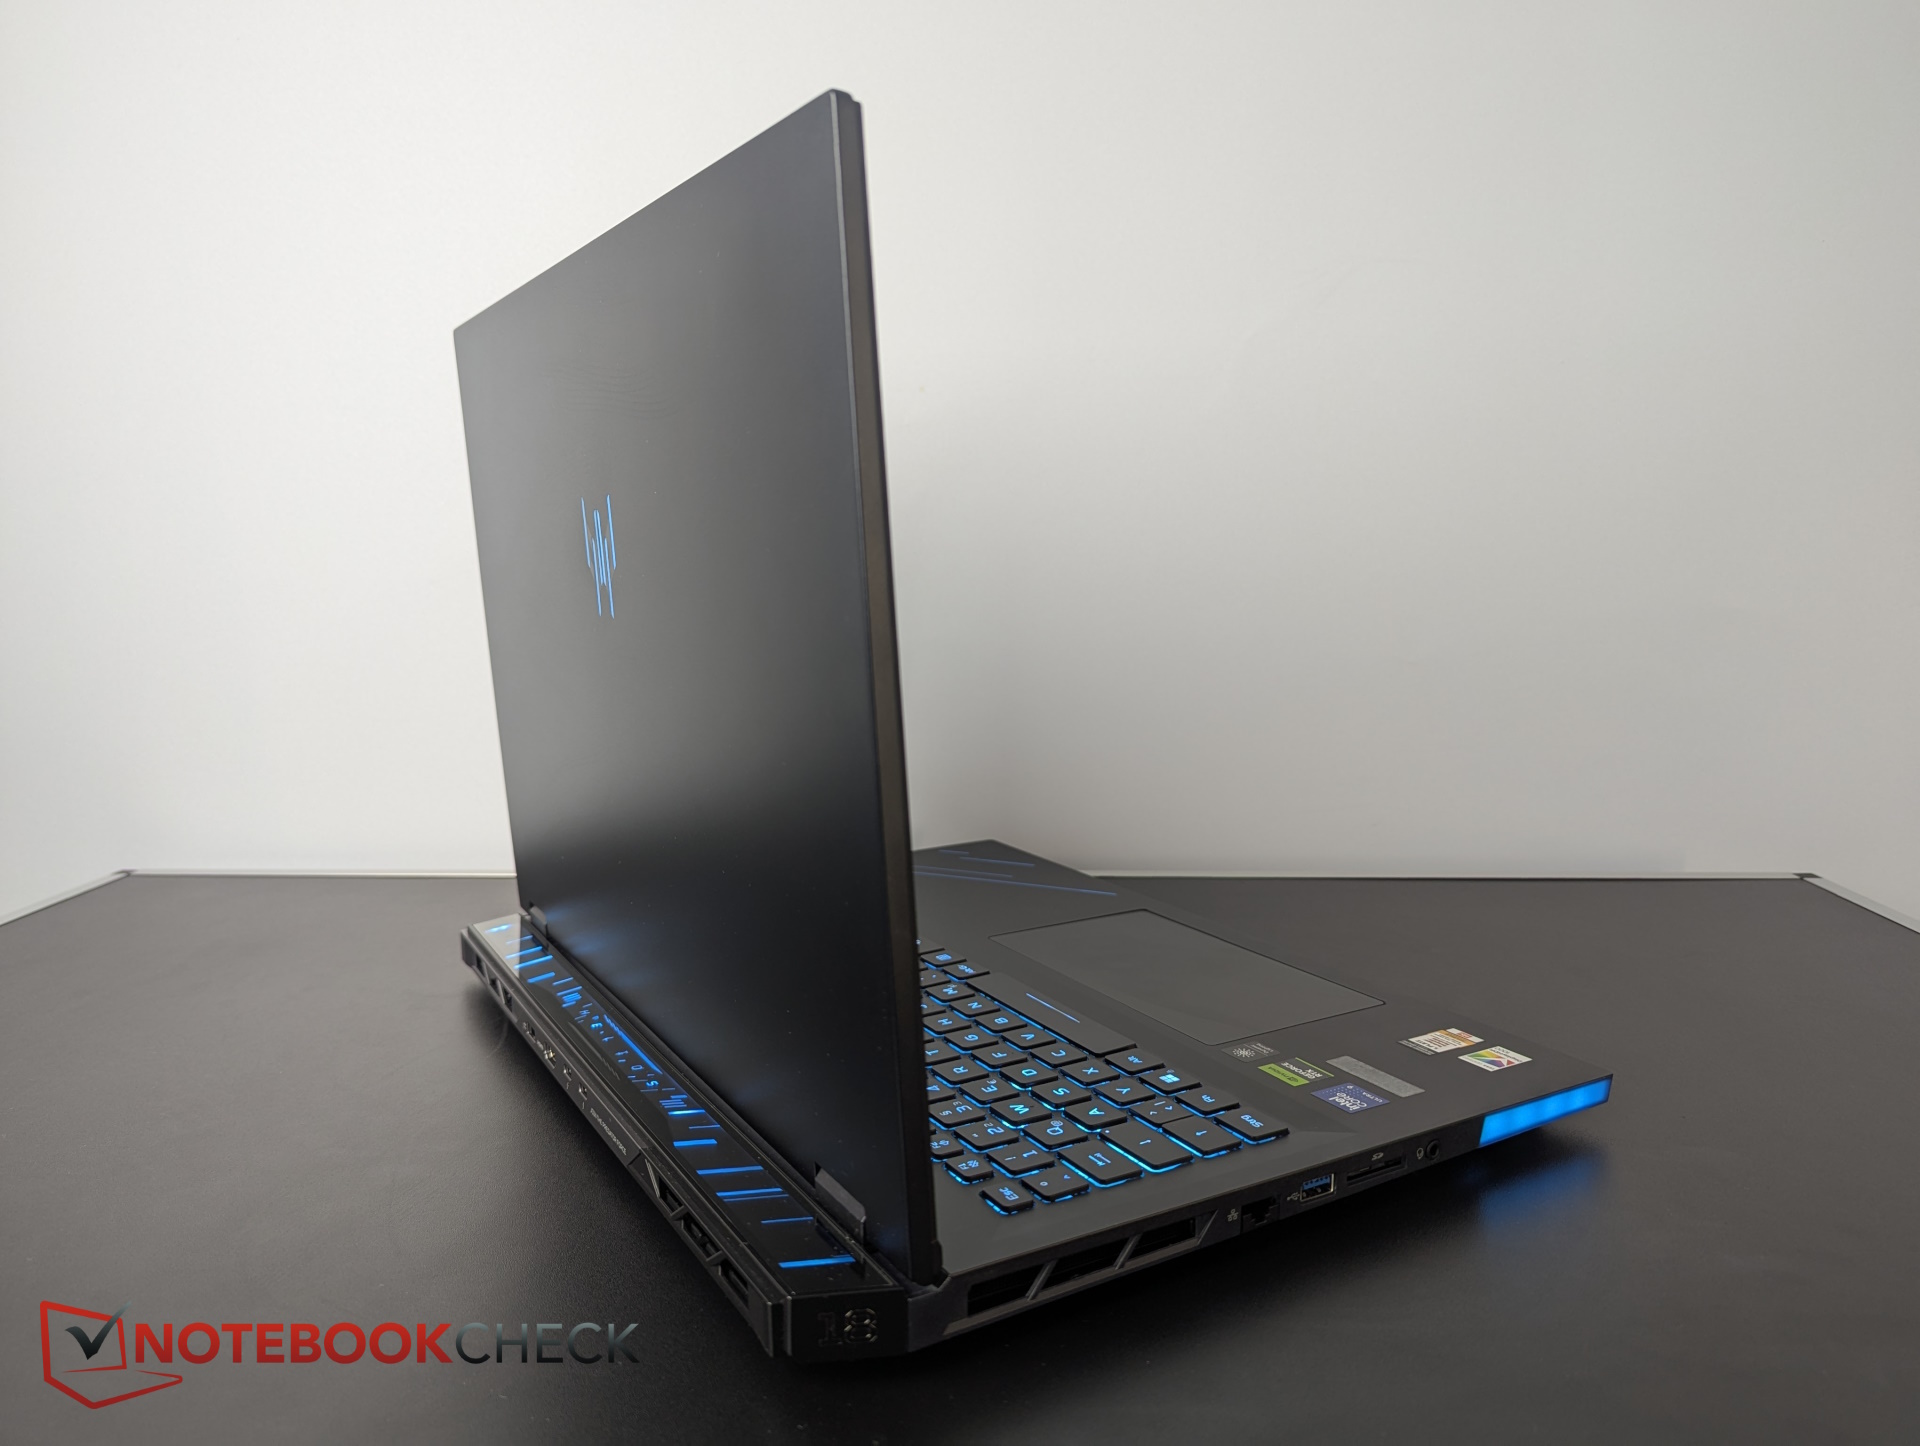
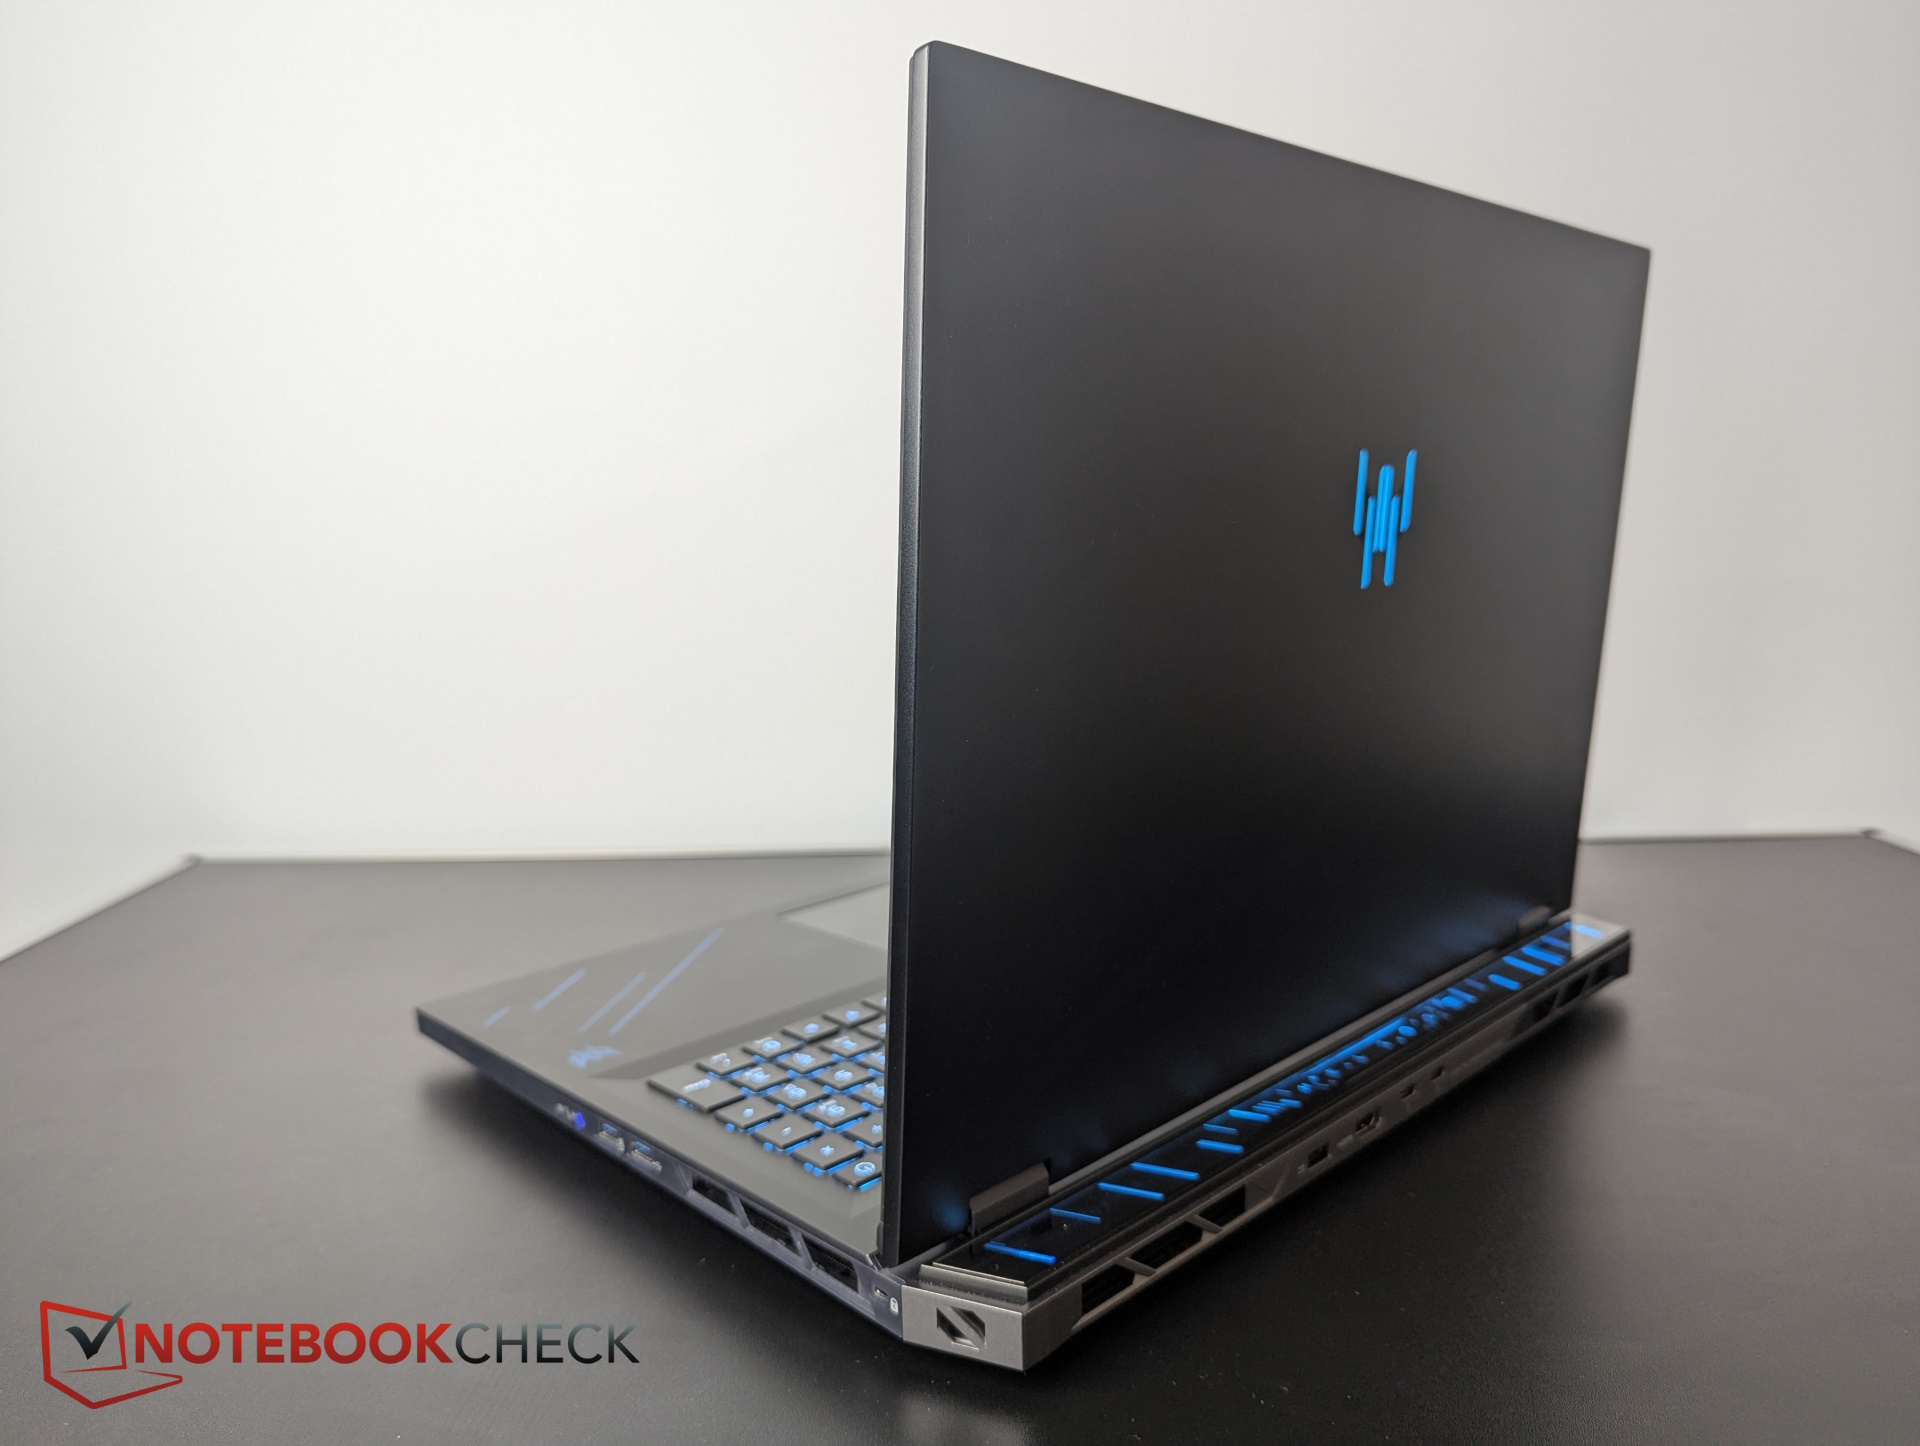
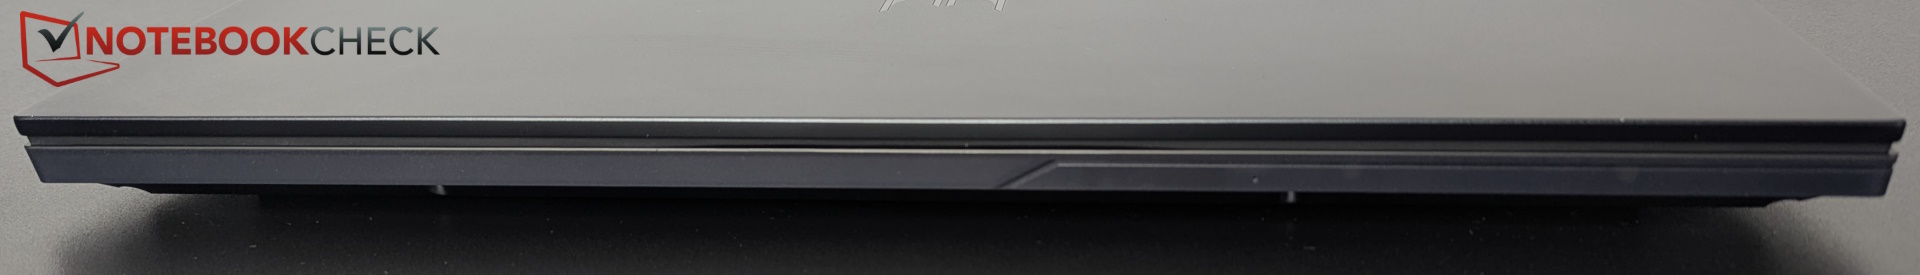
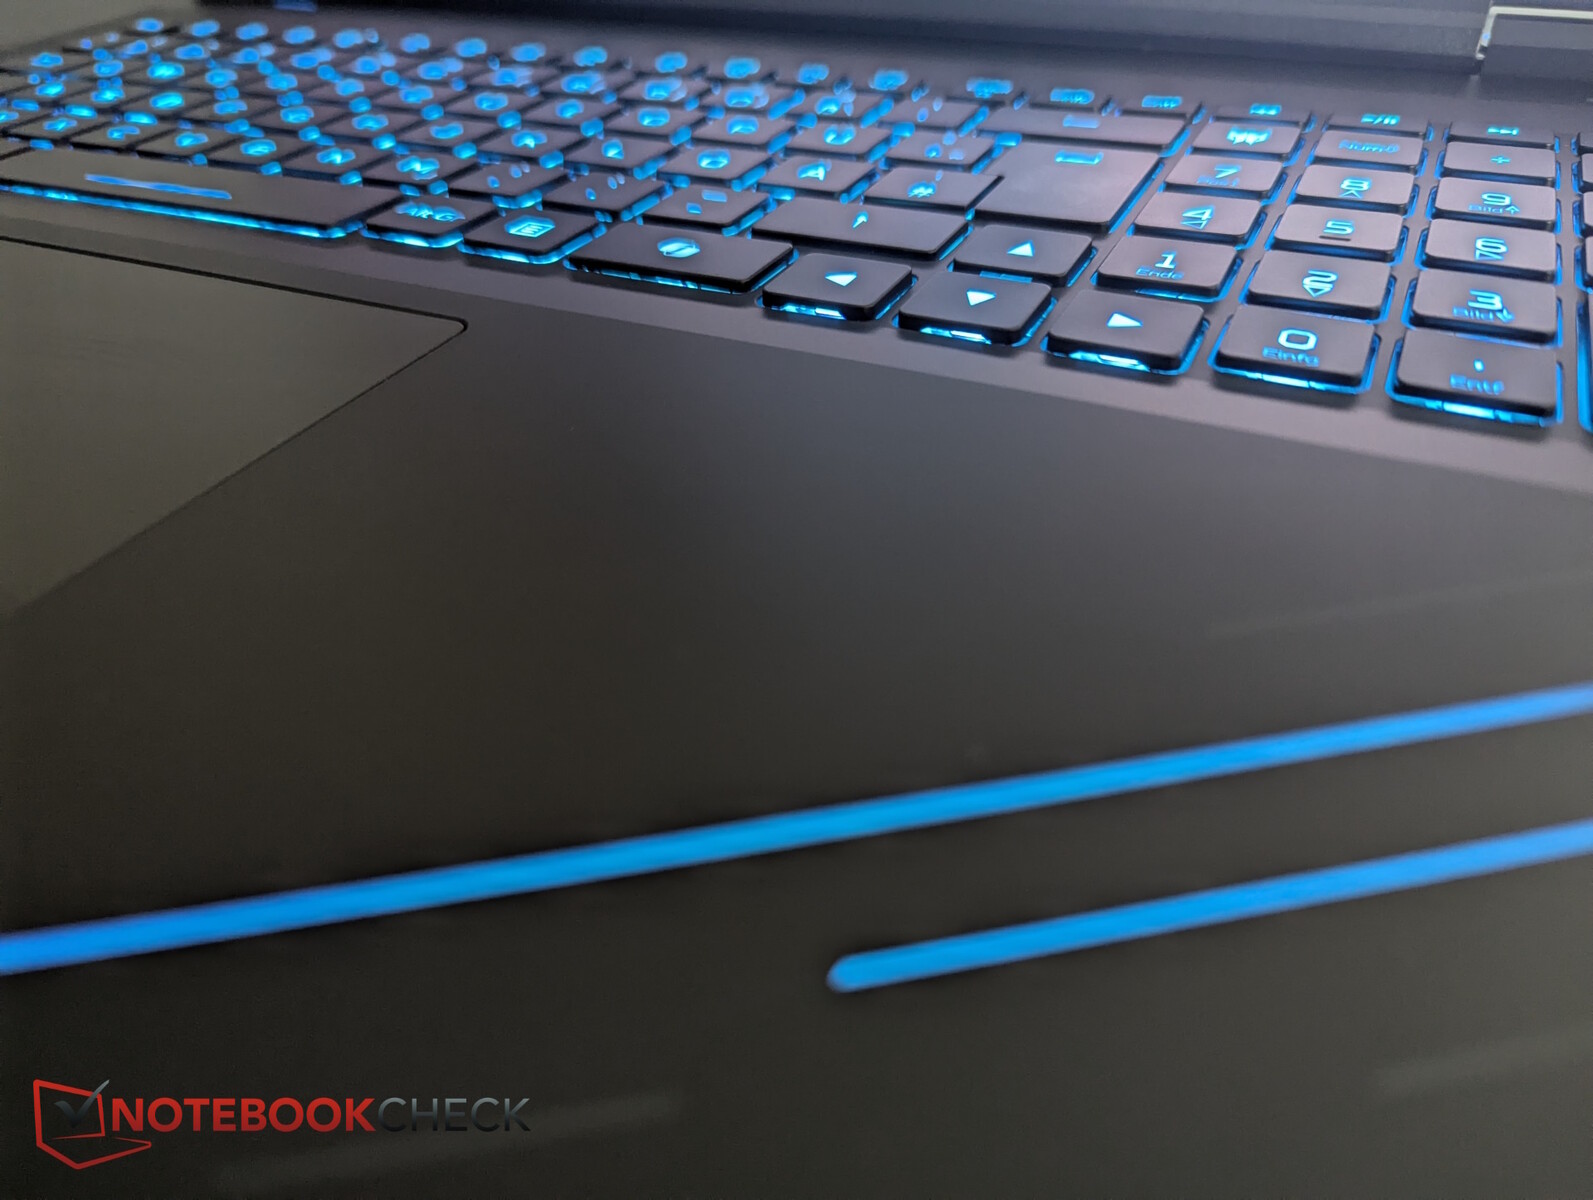
À première vue, le boîtier noir avec le système de refroidissement dépassant à l'arrière ne semble guère avoir changé. Mais lorsque toutes les lumières s'allument, vous pouvez voir quelques différences avec le Prédécesseur. Par exemple, il y a maintenant une bande LED qui entoure le bord avant gauche. La base, le couvercle et la sortie d'air sont également éclairés.
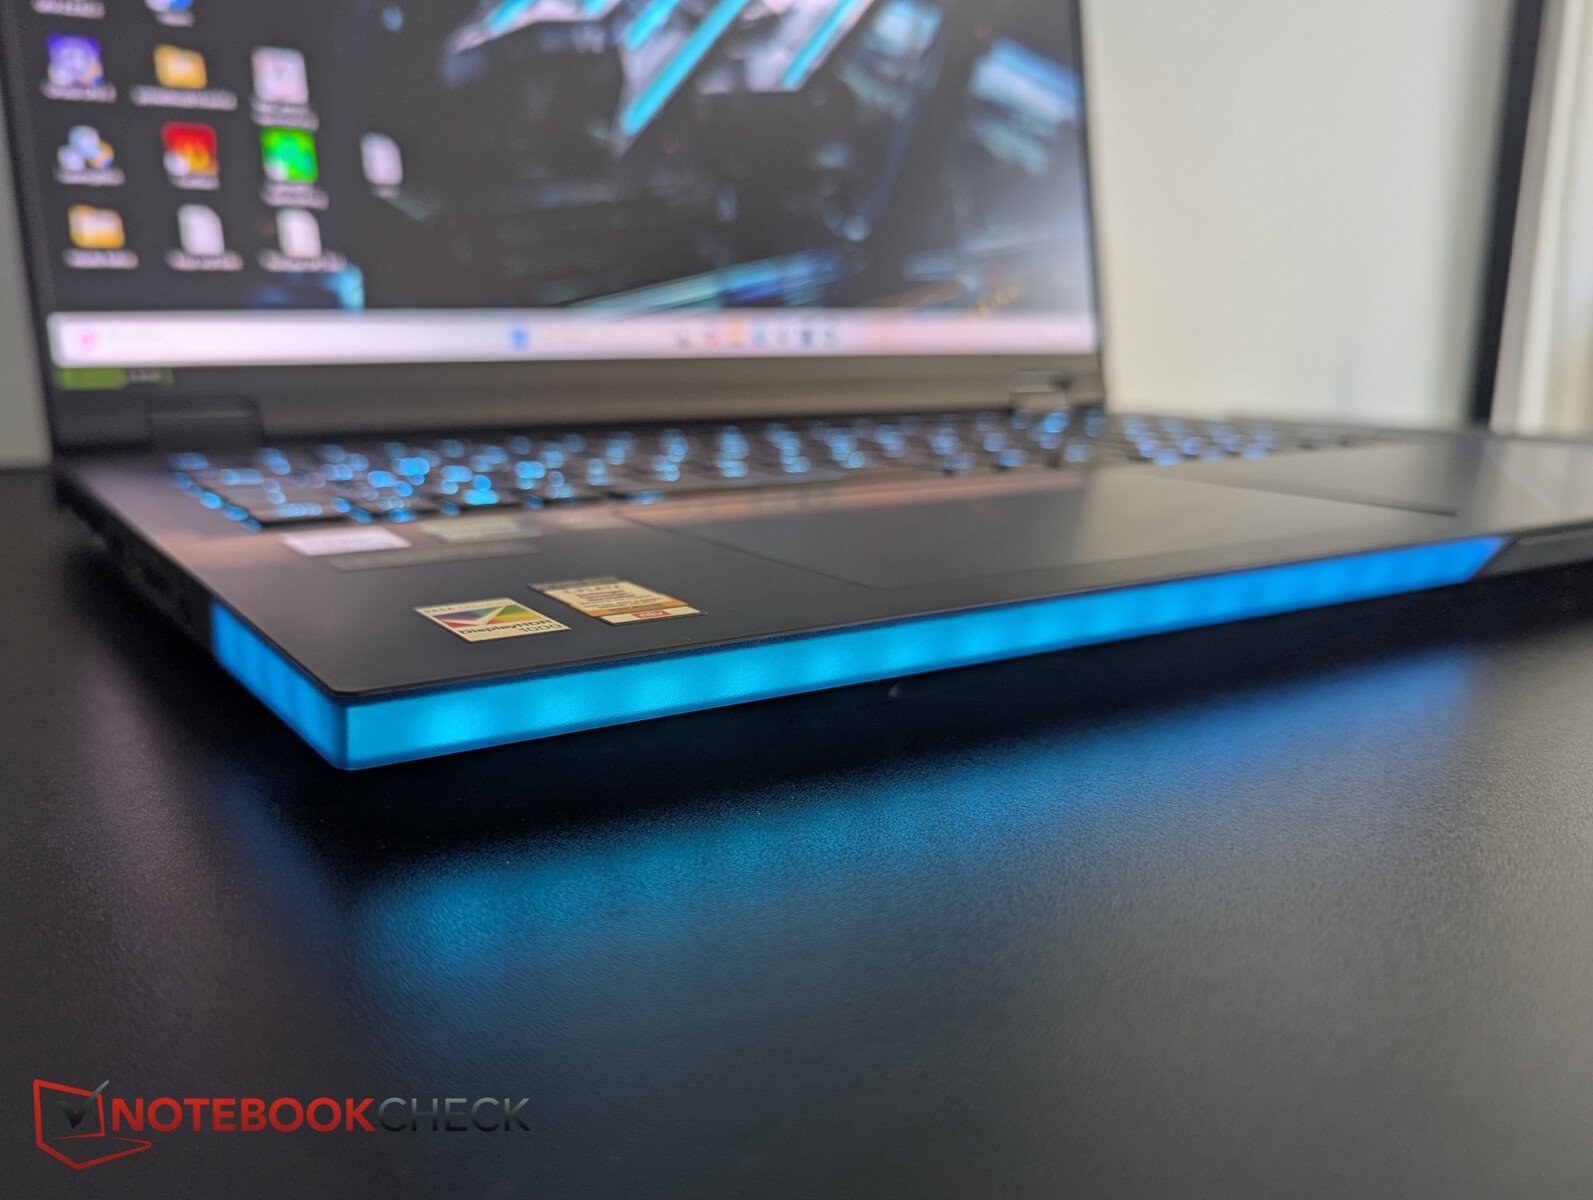

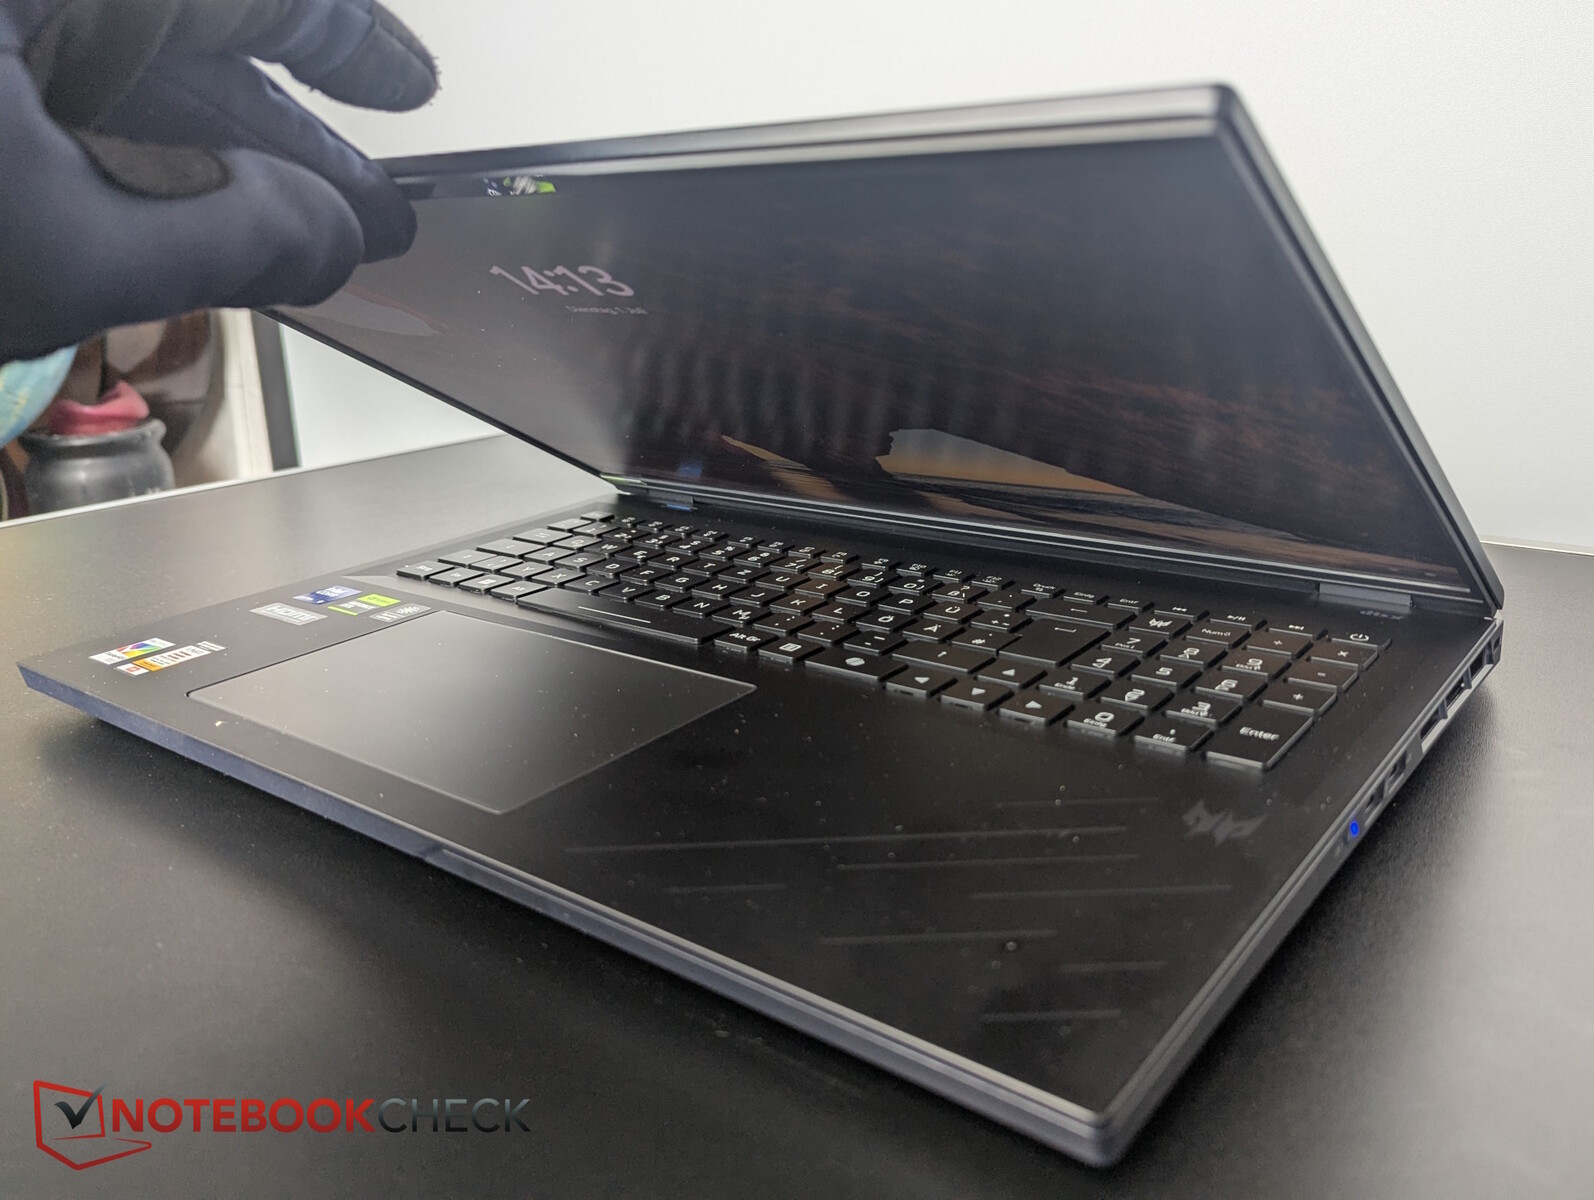
Le couvercle (qui s'ouvre à environ 160 degrés mais se referme trop tôt) et la base sont en aluminium, ce qui garantit une bonne stabilité. Le dessous et le cadre d'affichage sont en plastique.
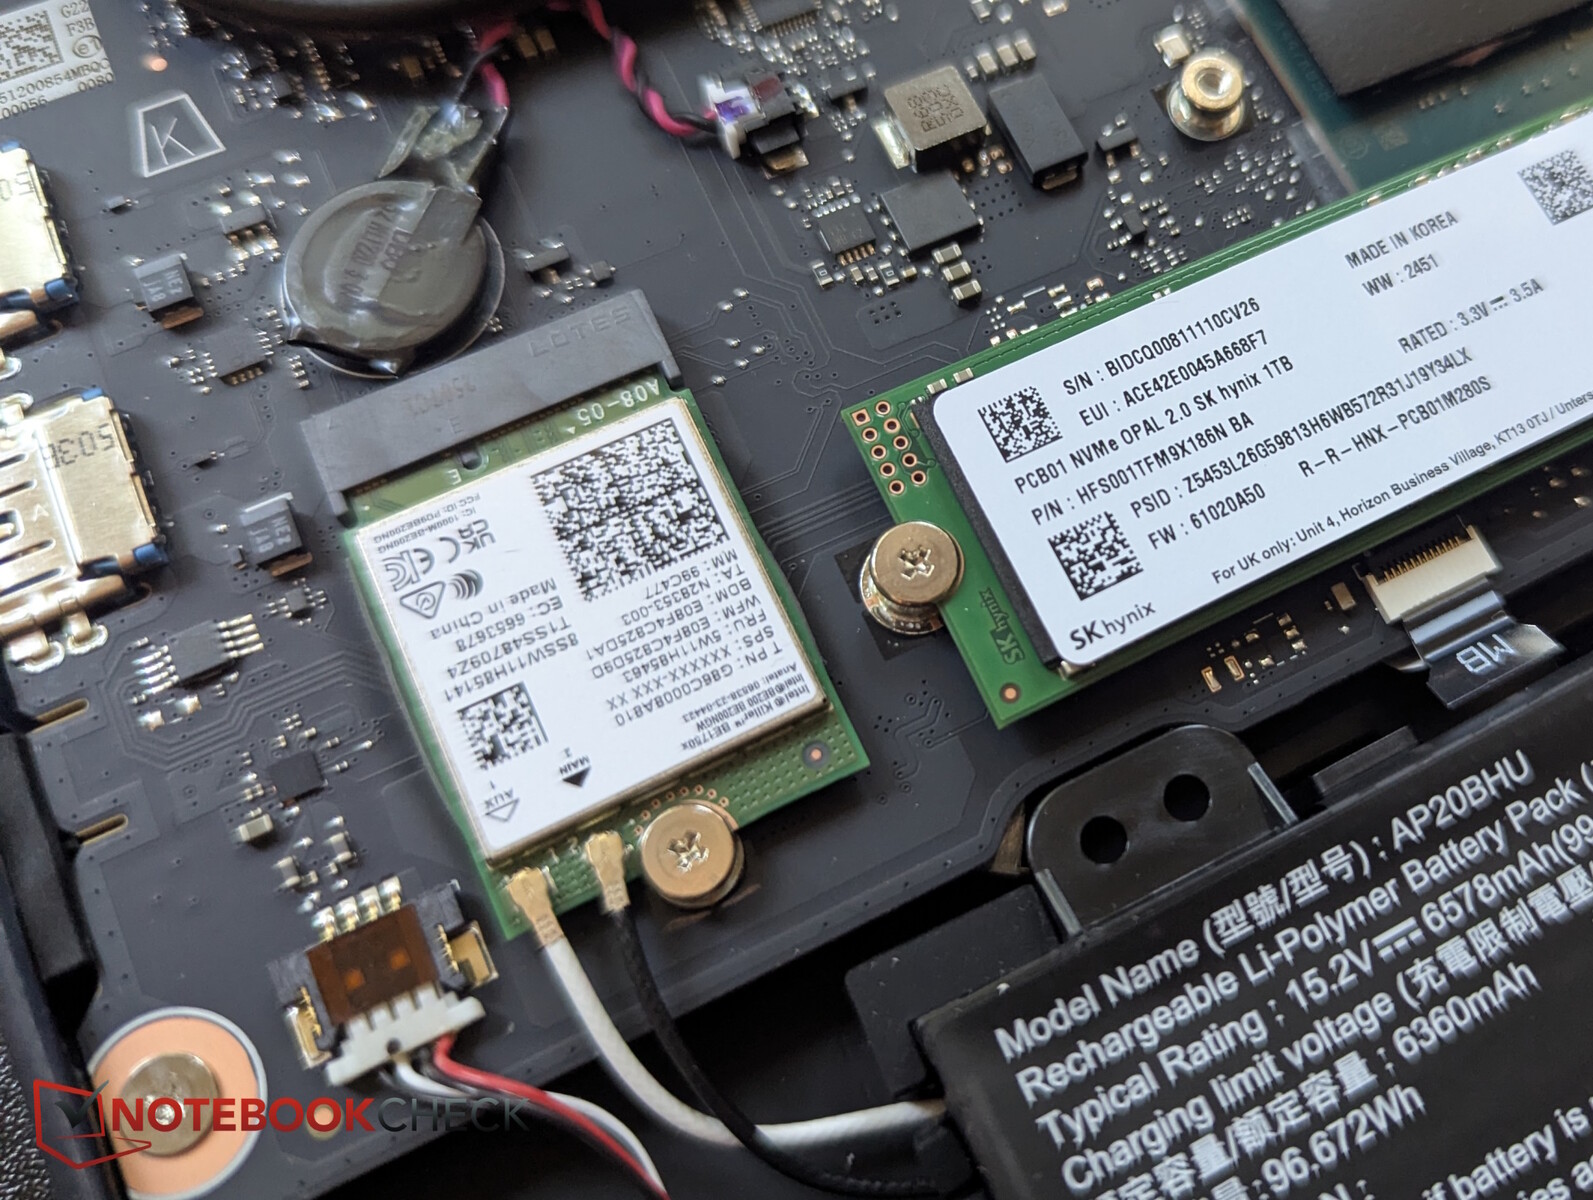
Onze vis Phillips de même longueur maintiennent le dessous en place. À l'intérieur, on trouve quatre emplacements pour RAM et trois emplacements pour SSD M.2. Le module Wi-Fi 7 est également remplaçable. Ce dernier est rapide sur le réseau 6 GHz, mais lent sur le réseau 5 GHz.
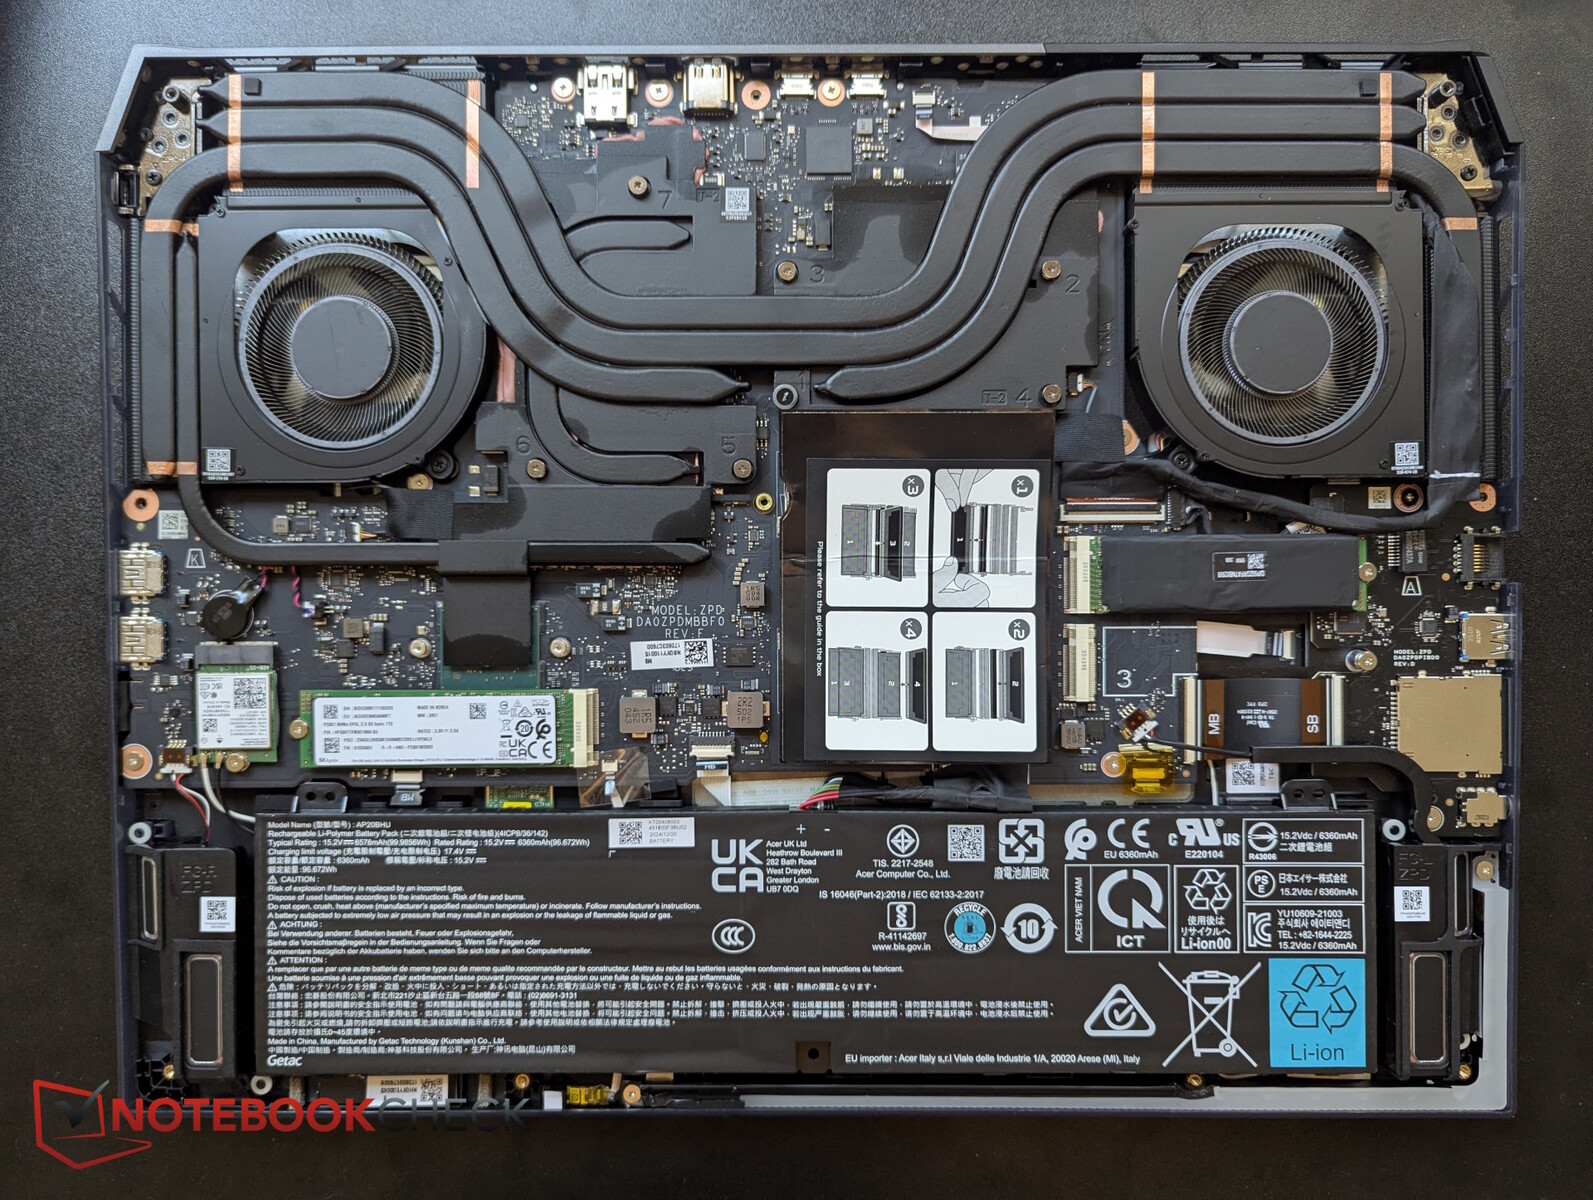

Avec la même épaisseur, le nouvel Helios 18 est maintenant légèrement plus court sur les deux bords, mais presque 200 g plus lourd. Après tout, la concurrence est tout aussi grande, épaisse et lourde
La webcam Full HD n'est plus tout à fait à la hauteur : l'image est laiteuse, la netteté pourrait être bien meilleure, mais les écarts de couleur sont acceptables.

| SD Card Reader | |
| average JPG Copy Test (av. of 3 runs) | |
| MSI Vector A18 HX A9W (Toshiba Exceria Pro SDXC 64 GB UHS-II) | |
| Medion Erazer Beast 18 X1 MD62731 (AV PRO microSD 128 GB V60) | |
| Moyenne de la classe Gaming (20.9 - 210, n=53, 2 dernières années) | |
| MSI Titan 18 HX AI A2XWJG (AV PRO microSD 128 GB V60) | |
| Acer Predator Helios 18 AI | |
| MSI Raider A18 HX A9WIG-080 | |
| maximum AS SSD Seq Read Test (1GB) | |
| MSI Vector A18 HX A9W (Toshiba Exceria Pro SDXC 64 GB UHS-II) | |
| MSI Raider A18 HX A9WIG-080 | |
| Medion Erazer Beast 18 X1 MD62731 (AV PRO microSD 128 GB V60) | |
| Moyenne de la classe Gaming (25.5 - 261, n=50, 2 dernières années) | |
| MSI Titan 18 HX AI A2XWJG (AV PRO microSD 128 GB V60) | |
| Acer Predator Helios 18 AI | |


Durabilité
Acer ne fournit aucune information sur les émissions deCO2. L'emballage se compose principalement de carton, qui peut même être utilisé comme support pour les écouteurs. Toutefois, le bloc d'alimentation est emballé dans du plastique, tandis que la boîte d'expédition d'Acer contient du polystyrène.
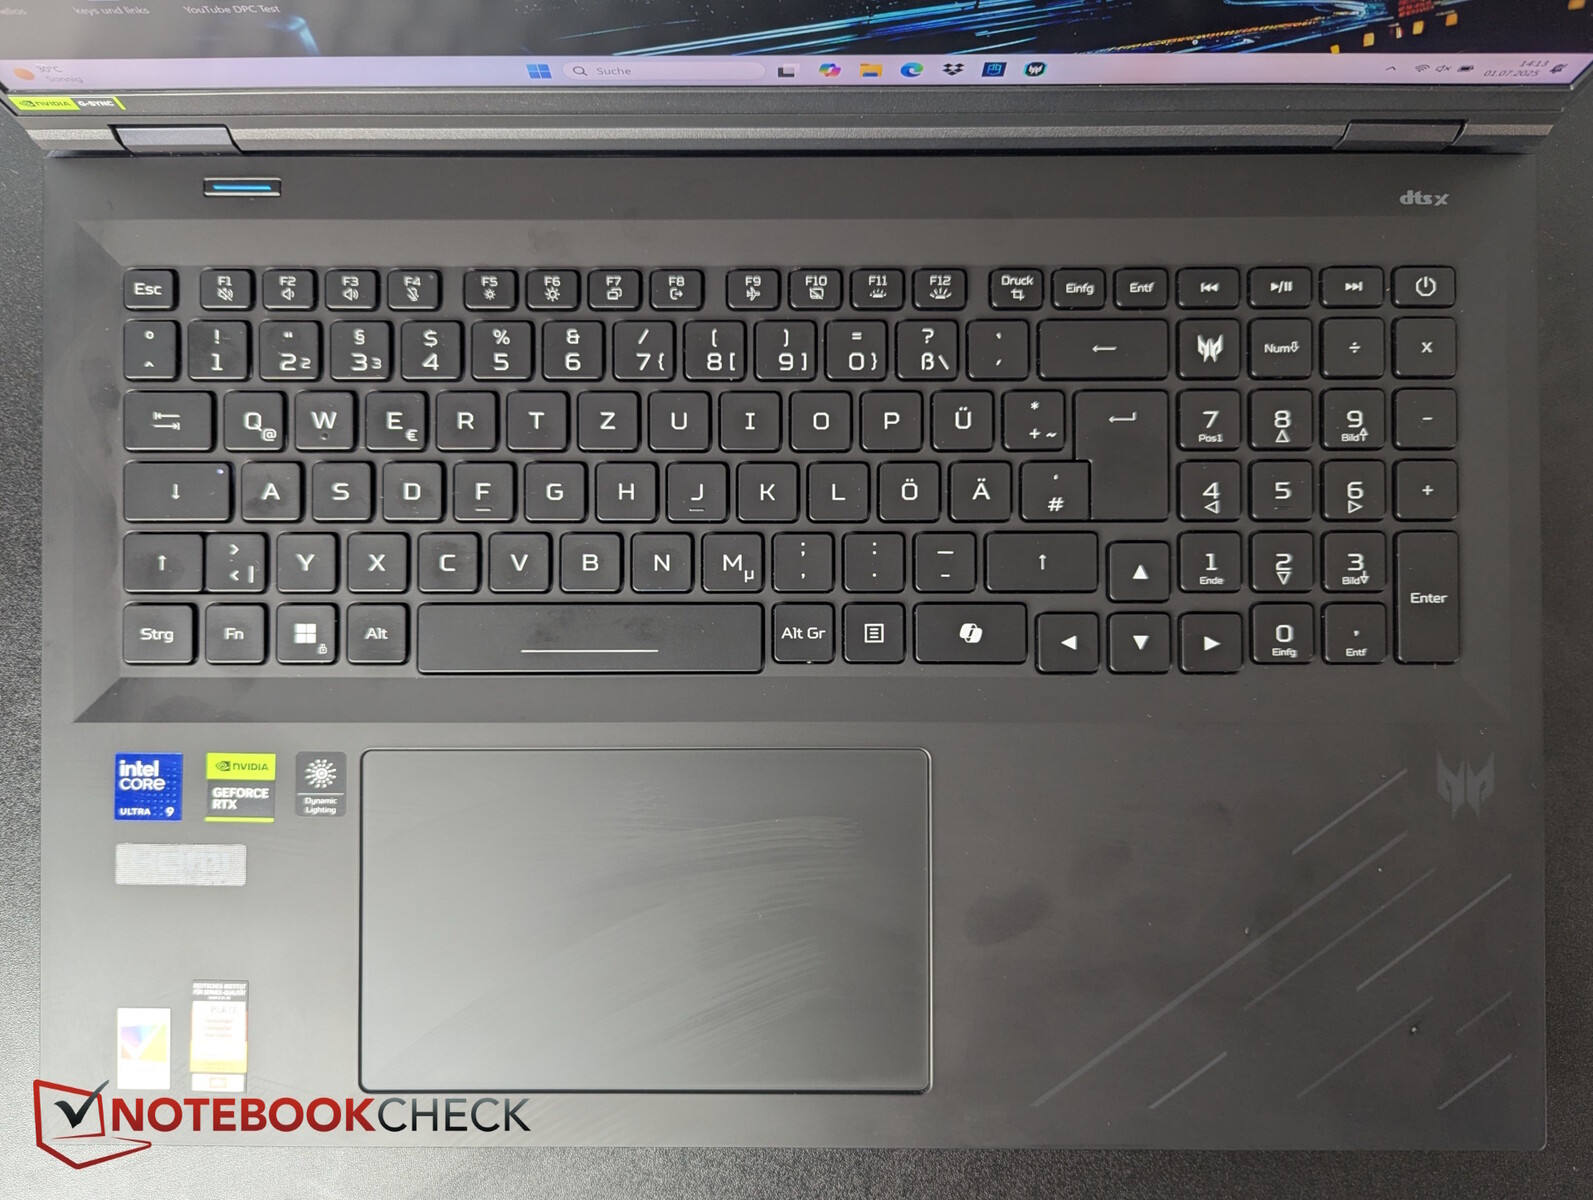
Dispositifs d'entrée - bouton Predator et beaucoup de RGB
Grâce à l'écran de 18 pouces, vous disposez également d'un grand pavé numérique sur la droite. Les touches fléchées sont également de taille standard. Un bouton Predator supplémentaire permet de lancer le centre de contrôle. Un commutateur de mode est conçu séparément en haut à gauche.
Les touches ont une course courte à moyenne et offrent un bon retour d'information. Le bruit de la frappe est modéré ; seule la barre d'espacement est légèrement plus bruyante.
Le pavé tactile est énorme (environ 15,2 x 9 cm) et offre de bonnes propriétés de glissement, même avec des mouvements lents. Cependant, les touches intégrées semblent un peu trop "élastiques" lors de la frappe, et elles claquent légèrement. Les clics se déclenchent de manière assez fiable, mais les tapotements ne le sont pas toujours.
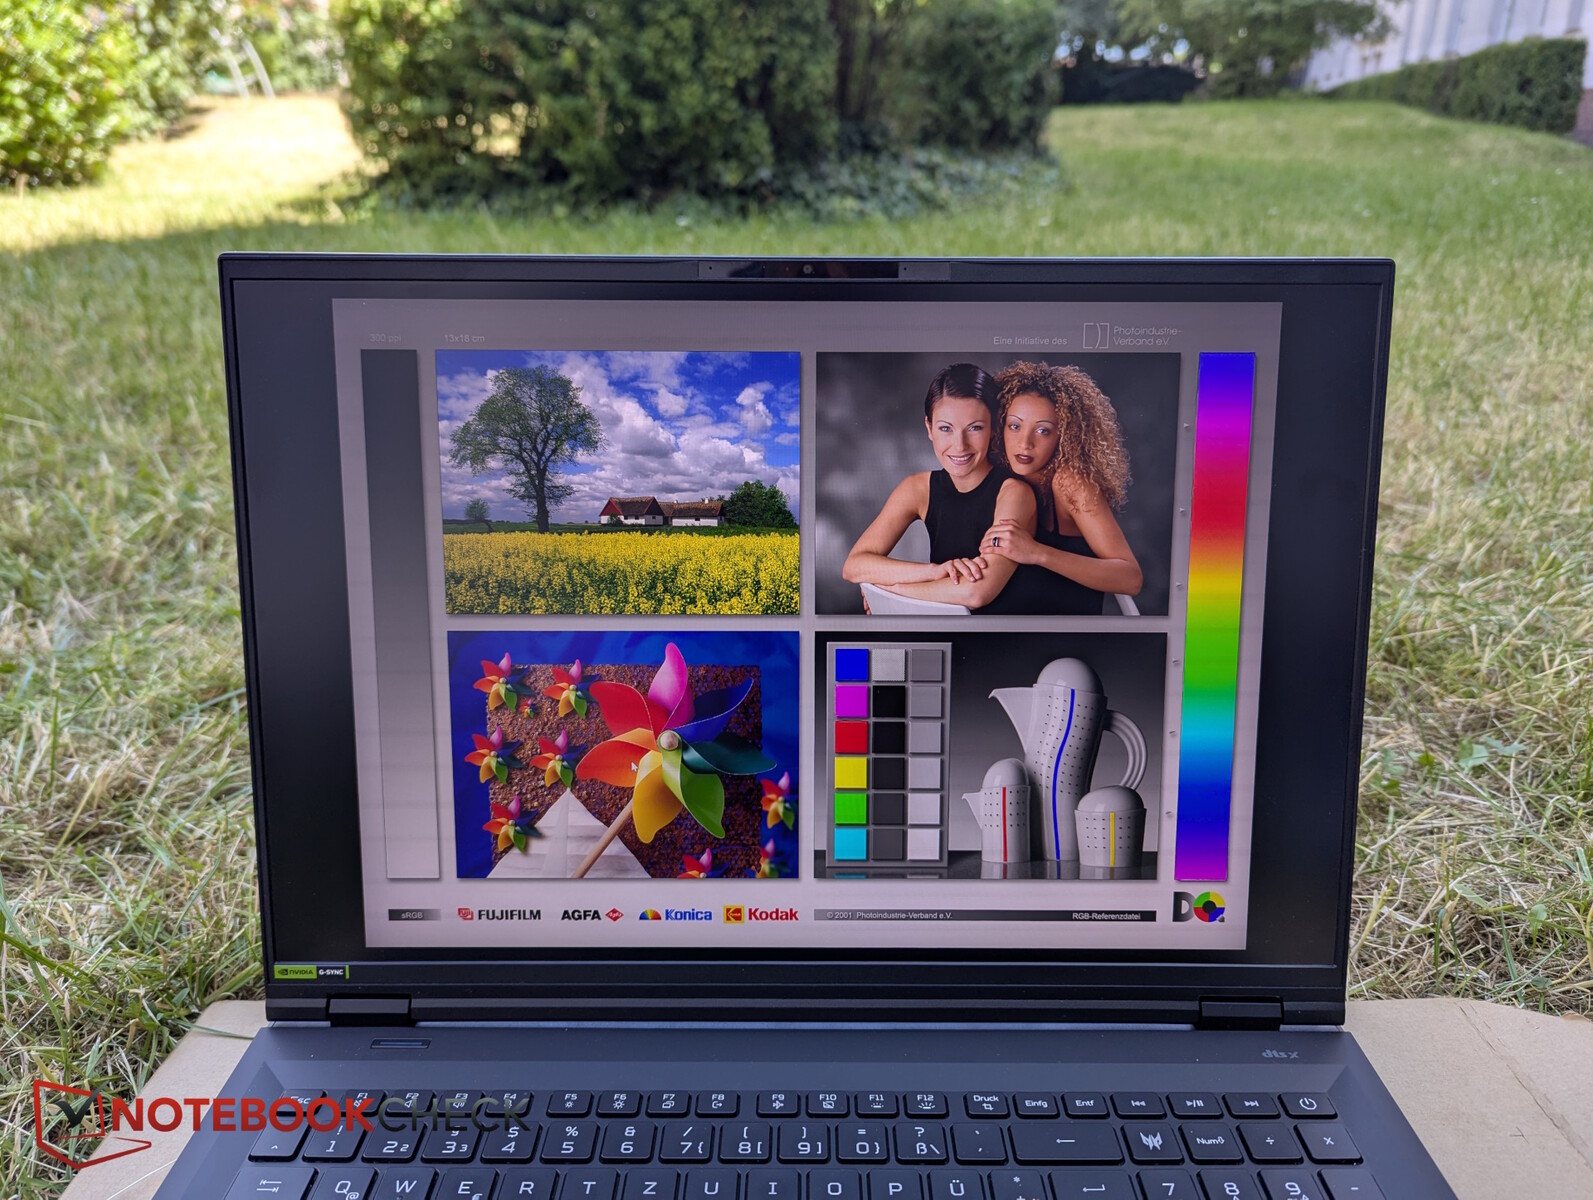
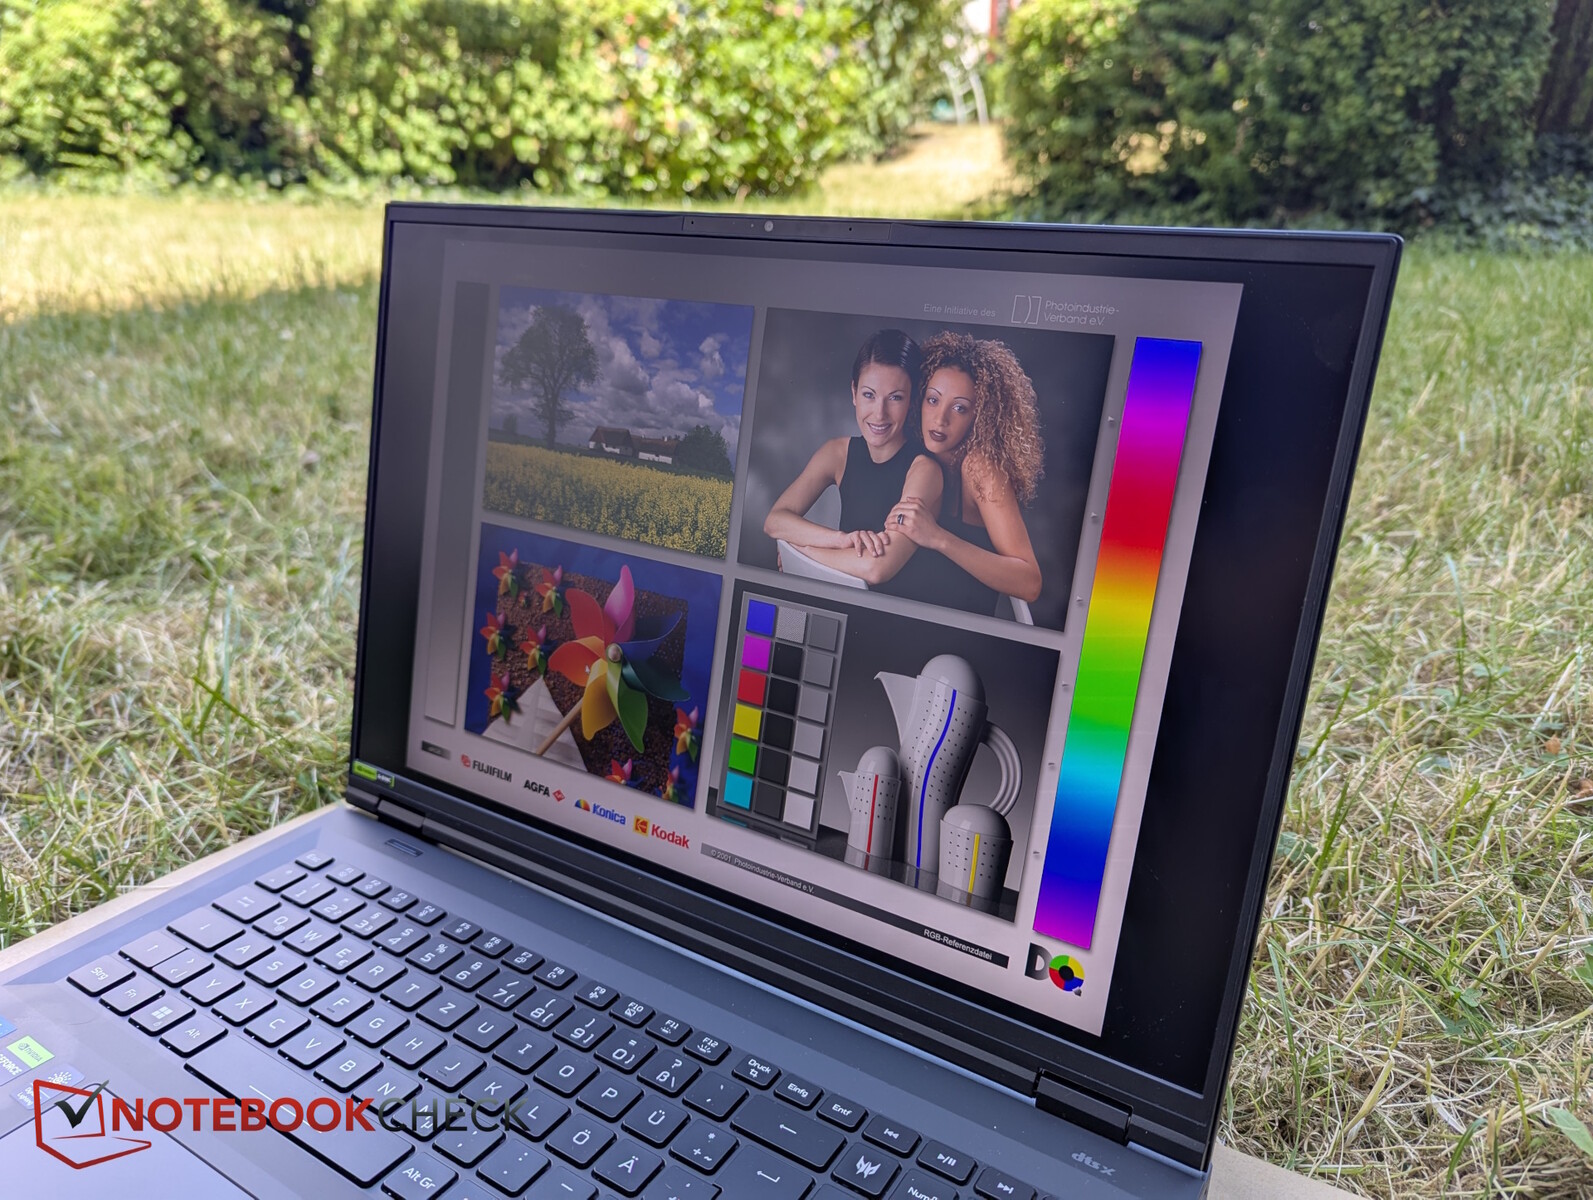
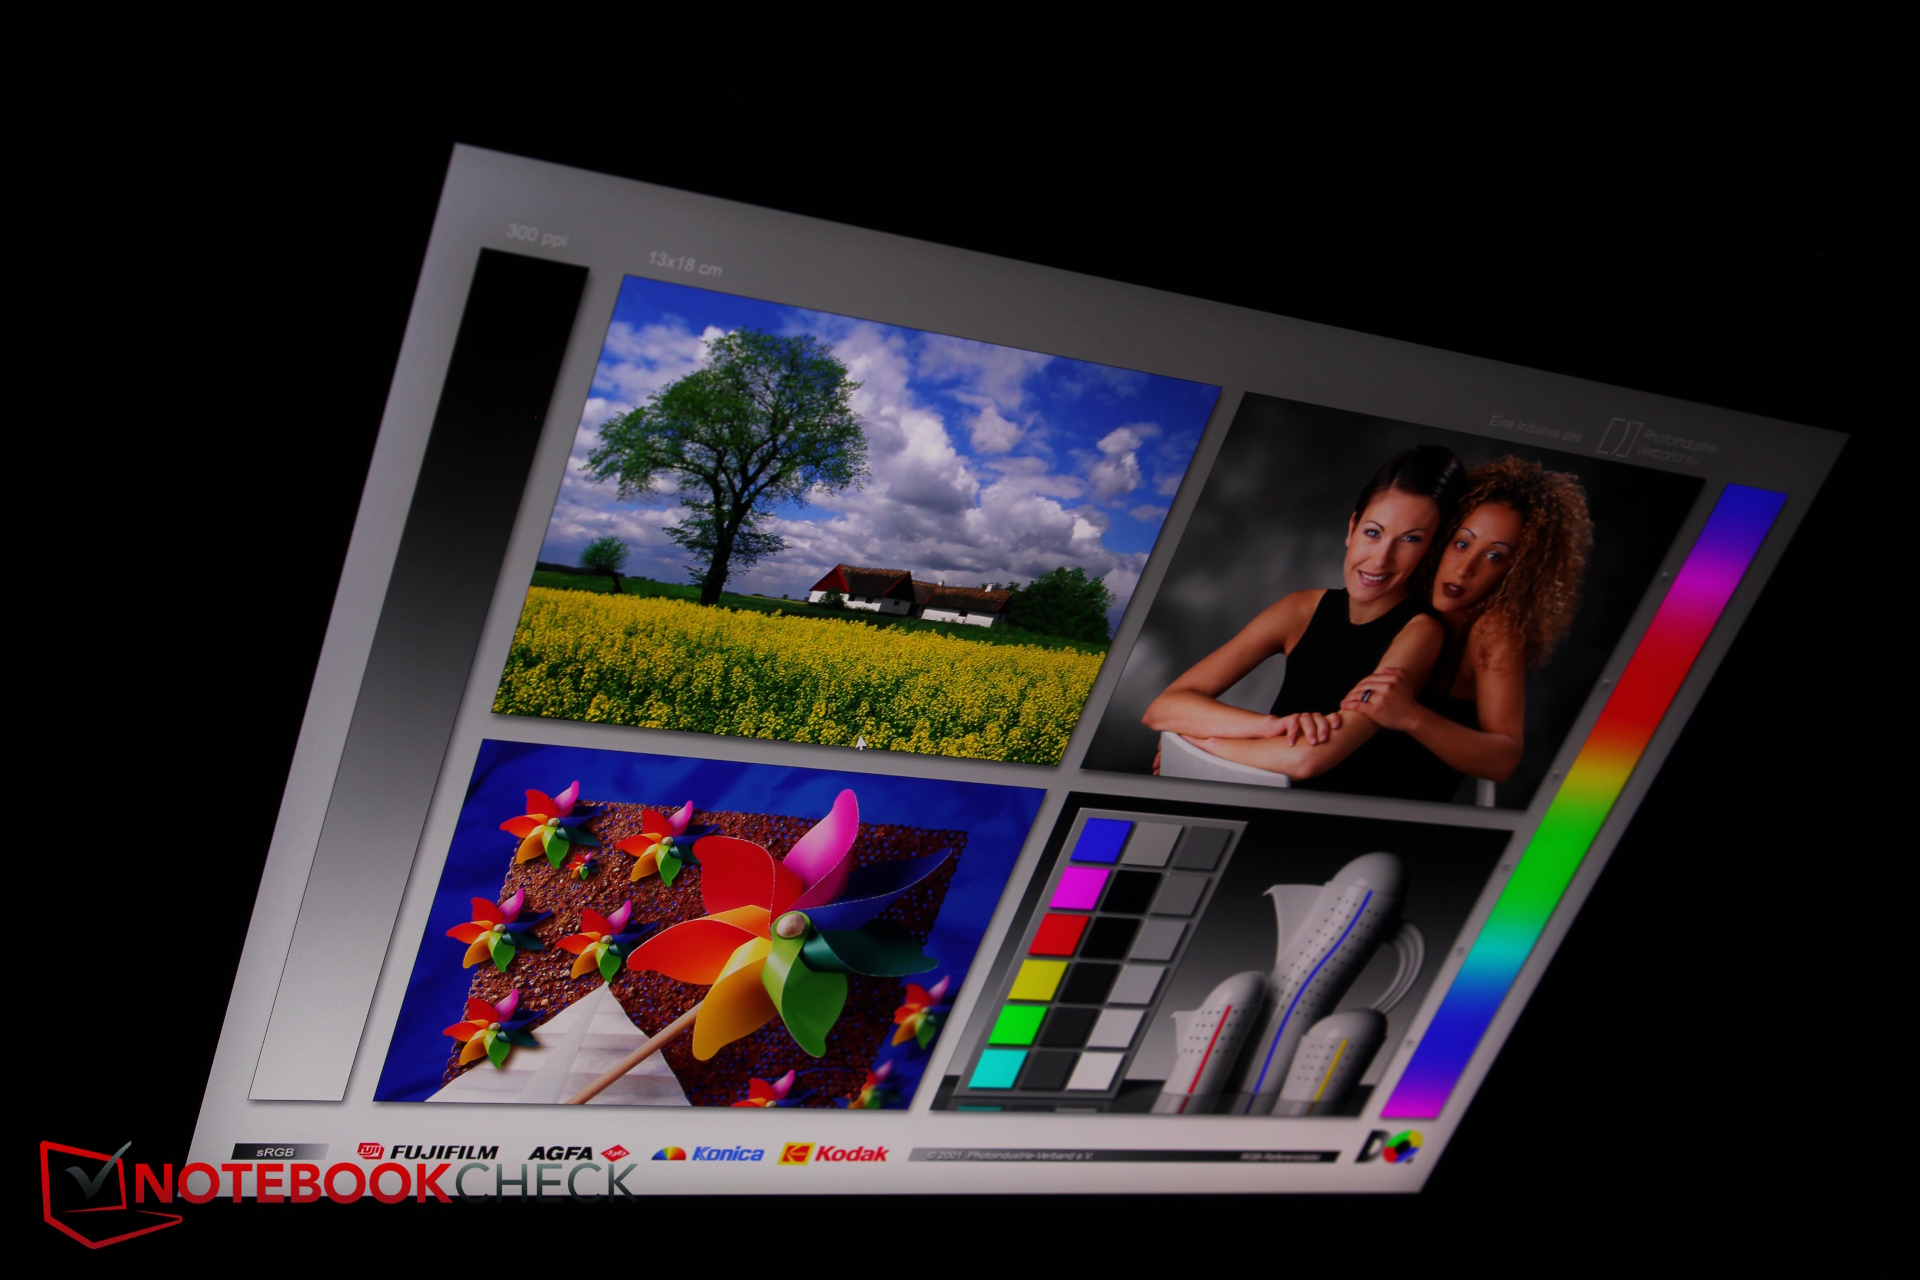
Écran - mini LED 1 600p
Dans notre cas, l'Helios est équipé d'un écran QHD mini-LED à 250 Hz, alors que l'écran 4K bi-mode annoncé par Acer sur son site web n'est disponible qu'avec l'ordinateur portable RTX 5090.
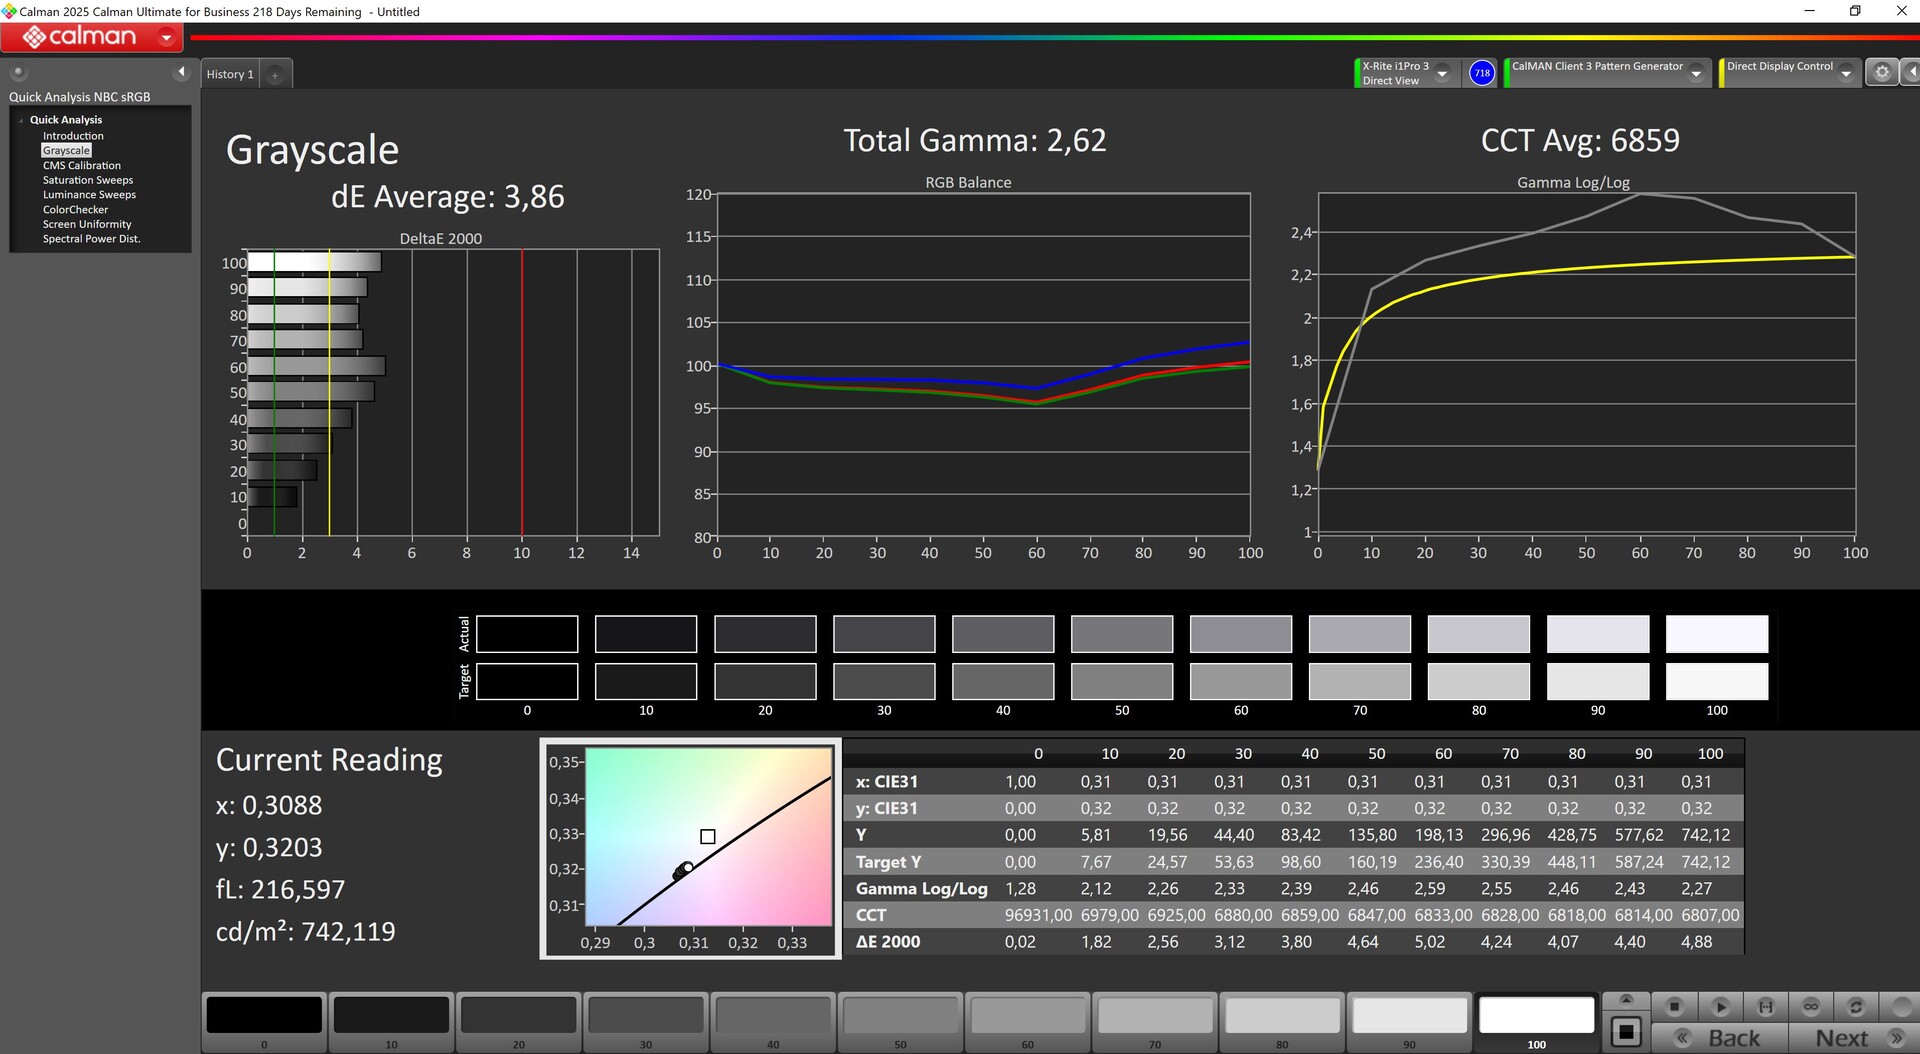
Cependant, l'écran de l'appareil testé est toujours de haute qualité, puisque nous avons mesuré une luminosité moyenne de plus de 700 nits. L'éclairage est très bon, sans halos, et le niveau de noir est extrêmement bas, ce qui se traduit par un contraste très élevé. L'écran scintille, mais à un rythme très élevé, de sorte que même les personnes sensibles ne devraient pas remarquer le PWM. Les espaces colorimétriques P3 et sRGB sont entièrement couverts.
| |||||||||||||||||||||||||
Homogénéité de la luminosité: 96 %
Valeur mesurée au centre, sur batterie: 400 cd/m²
Contraste: 18250:1 (Valeurs des noirs: 0.04 cd/m²)
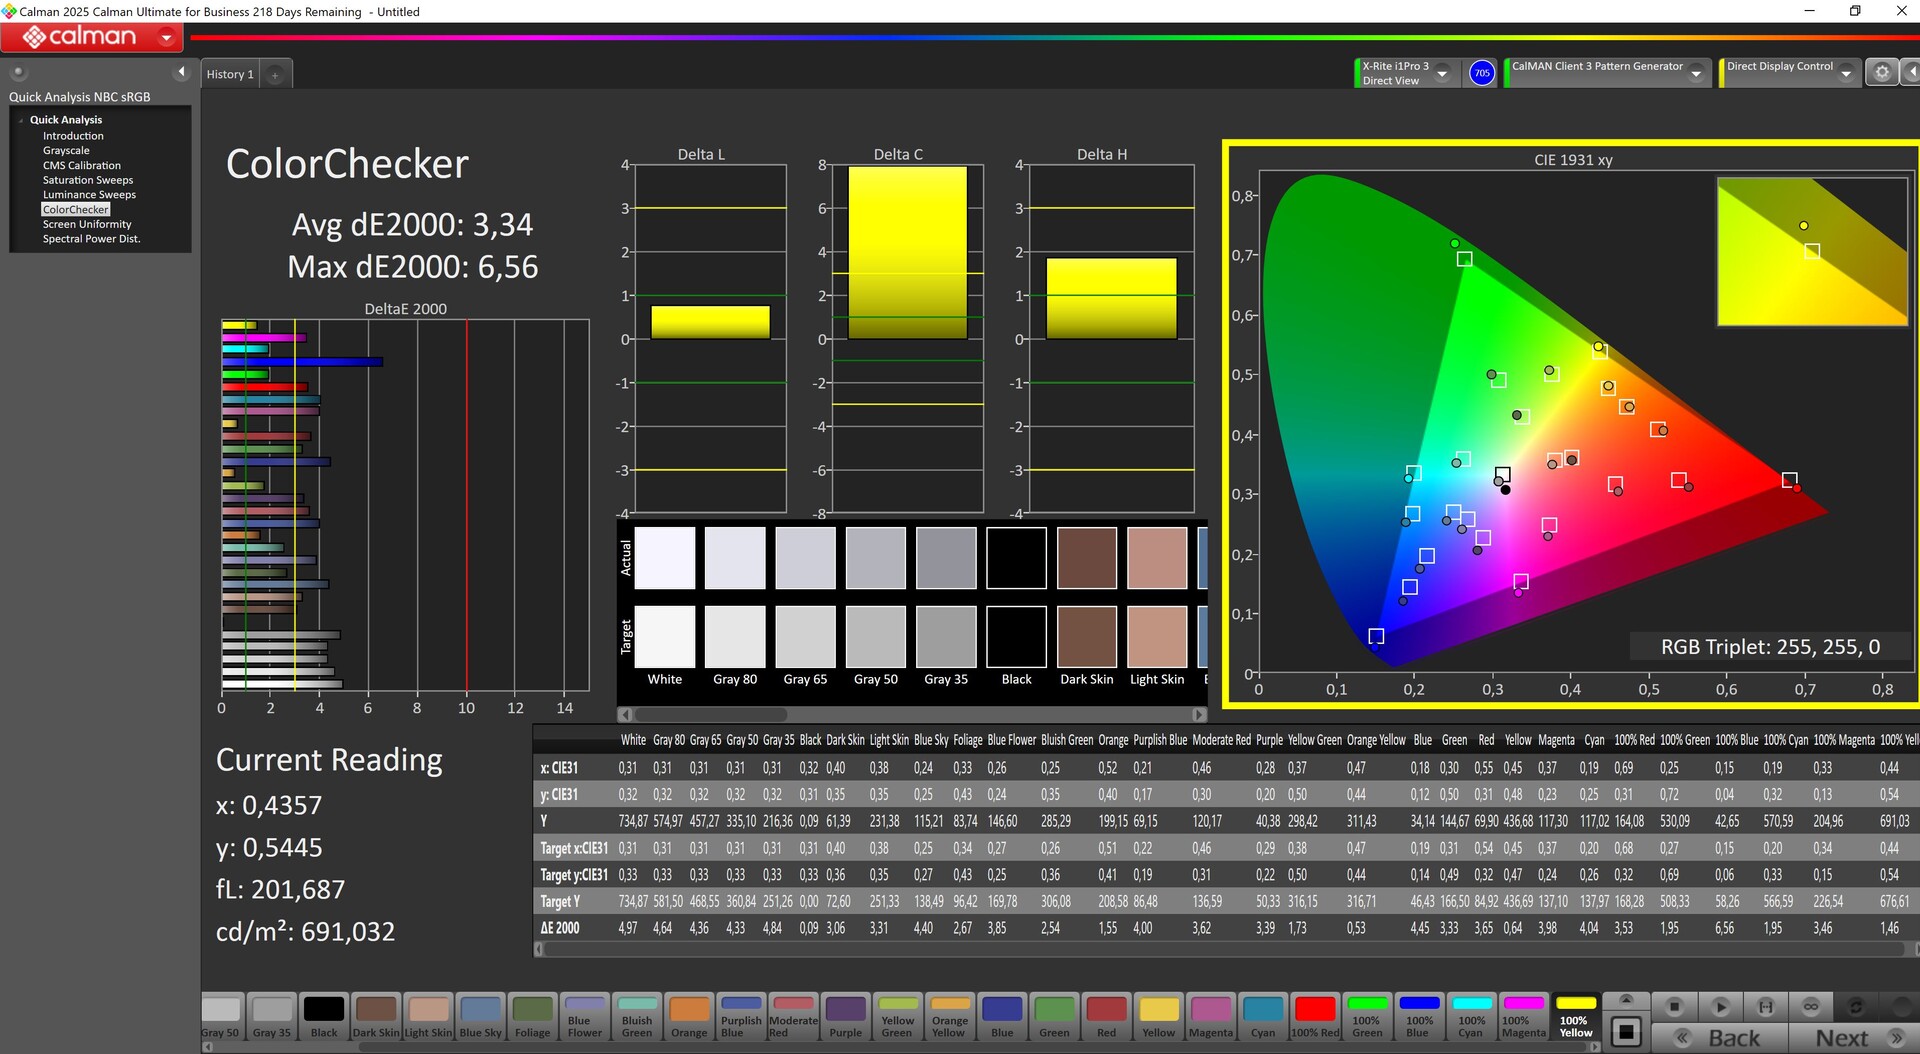
ΔE ColorChecker Calman: 3.34 | ∀{0.5-29.43 Ø4.72}
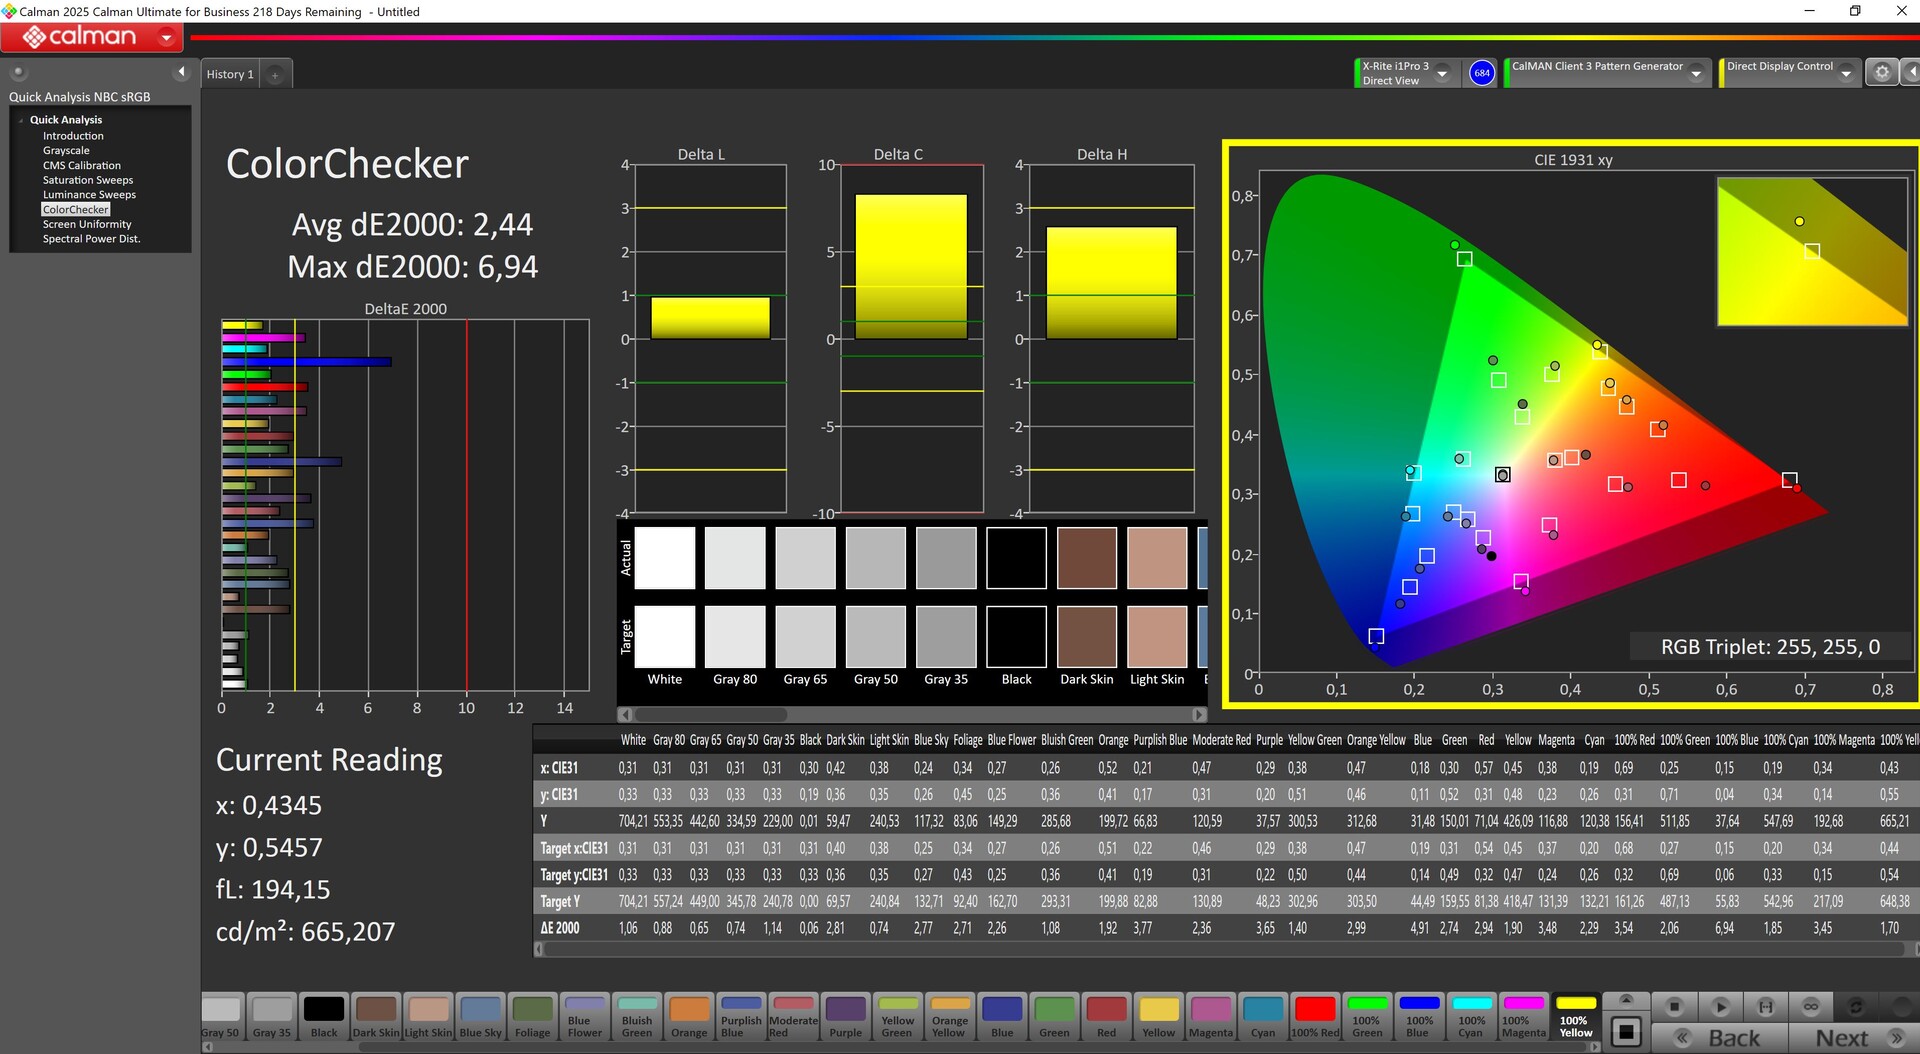
calibrated: 2.44
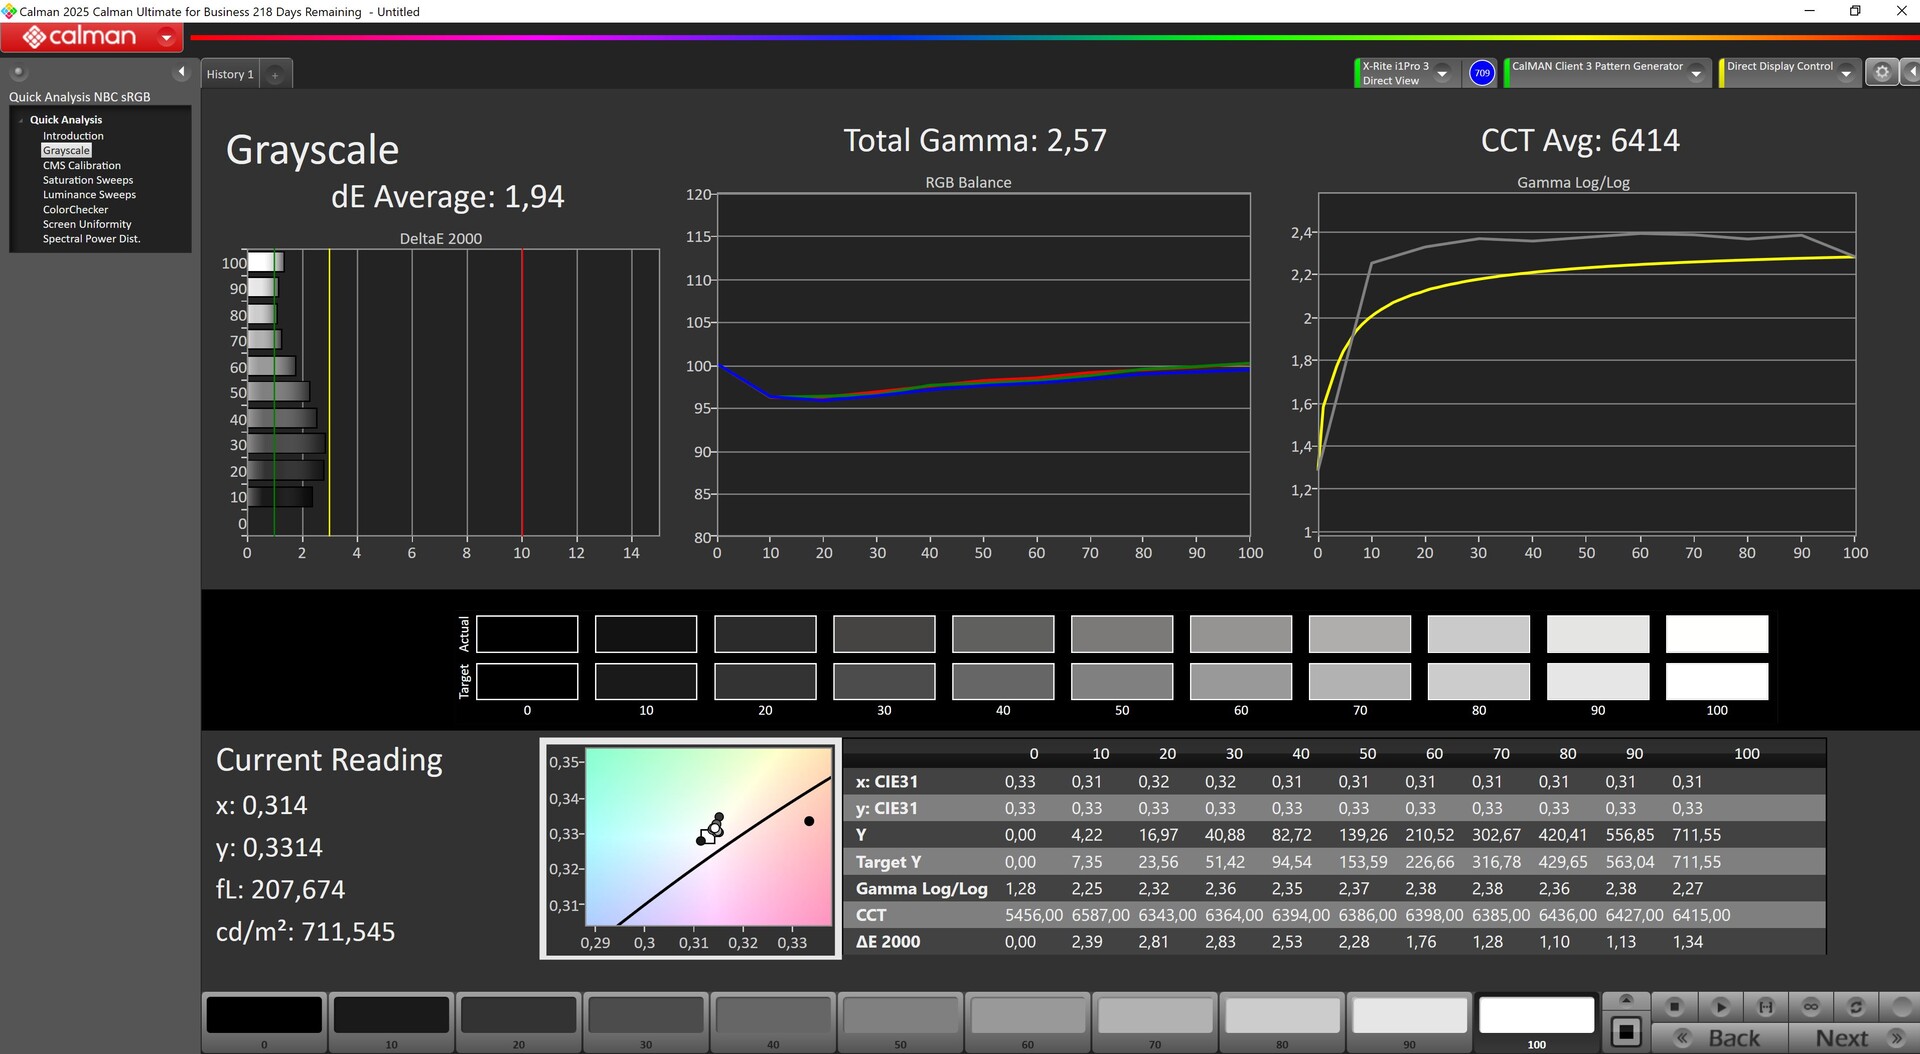
ΔE Greyscale Calman: 3.86 | ∀{0.09-98 Ø4.97}
90.1% AdobeRGB 1998 (Argyll 3D)
100% sRGB (Argyll 3D)
99.7% Display P3 (Argyll 3D)
Gamma: 2.62
CCT: 6859 K
| Acer Predator Helios 18 AI B180QAN01.2 (AUO45A8), IPS, 2560x1600, 18", 250 Hz | Acer Predator Helios 18 PH18-72-98MW B180QAN01.2 (AUO45A8), Mini-LED, 2560x1600, 18", 250 Hz | Medion Erazer Beast 18 X1 MD62731 BOEhydis NE180QDM-NZ2, IPS, 2560x1600, 18", 240 Hz | Asus Strix Scar 18 G835LX N180QDM-NM2, Mini-LED, 2560x1600, 18", 240 Hz | MSI Titan 18 HX AI A2XWJG AU Optronics B180ZAN01.0, Mini-LED, 3840x2160, 18", 120 Hz | MSI Vector A18 HX A9W AU Optronics B180QAN01.0, IPS, 2560x1600, 18", 240 Hz | |
|---|---|---|---|---|---|---|
| Display | 1% | -3% | -1% | 0% | -2% | |
| HDR Peak Brightness (cd/m²) | 1153 | |||||
| Display P3 Coverage (%) | 99.7 | 99.7 0% | 97.1 -3% | 99 -1% | 99.7 0% | 98.1 -2% |
| sRGB Coverage (%) | 100 | 100 0% | 99.9 0% | 100 0% | 99.9 0% | 99.9 0% |
| AdobeRGB 1998 Coverage (%) | 90.1 | 91.6 2% | 84.7 -6% | 87.2 -3% | 90.4 0% | 86.3 -4% |
| Response Times | -295% | -96% | -114% | -159% | -90% | |
| Response Time Grey 50% / Grey 80% * (ms) | 3.6 ? | 8 ? -122% | 5.6 ? -56% | 7.4 ? -106% | 8.8 ? -144% | 4.3 ? -19% |
| Response Time Black / White * (ms) | 3.1 ? | 17.6 ? -468% | 7.3 ? -135% | 10.4 ? -235% | 15 ? -384% | 8.1 ? -161% |
| PWM Frequency (Hz) | 2500 | 4832 ? | 20610 ? | 15430 ? | ||
| PWM Amplitude * (%) | 100 | 100 -0% | 50 50% | |||
| Screen | 5% | -122% | -3% | -10% | -153% | |
| Brightness middle (cd/m²) | 730 | 722 -1% | 478 -35% | 764 5% | 704 -4% | 543 -26% |
| Brightness (cd/m²) | 719 | 724 1% | 456 -37% | 747 4% | 680 -5% | 502 -30% |
| Brightness Distribution (%) | 96 | 93 -3% | 89 -7% | 93 -3% | 88 -8% | 86 -10% |
| Black Level * (cd/m²) | 0.04 | 0.04 -0% | 0.4 -900% | 0.1 -150% | 0.56 -1300% | |
| Contrast (:1) | 18250 | 18050 -1% | 1195 -93% | 7640 -58% | 970 -95% | |
| Colorchecker dE 2000 * | 3.34 | 3.4 -2% | 3.94 -18% | 1.2 64% | 4.11 -23% | 3.41 -2% |
| Colorchecker dE 2000 max. * | 6.56 | 5.32 19% | 8.6 -31% | 2.8 57% | 6.43 2% | 6.4 2% |
| Colorchecker dE 2000 calibrated * | 2.44 | 1.6 34% | 0.75 69% | 2.5 -2% | 0.66 73% | |
| Greyscale dE 2000 * | 3.86 | 3.8 2% | 5.5 -42% | 1.5 61% | 4.9 -27% | 3.4 12% |
| Gamma | 2.62 84% | 2.383 92% | 2.212 99% | 2.17 101% | 2.03 108% | 2.3 96% |
| CCT | 6859 95% | 7051 92% | 7059 92% | 6556 99% | 6331 103% | 6070 107% |
| Moyenne finale (programmes/paramètres) | -96% /
-39% | -74% /
-92% | -39% /
-26% | -56% /
-42% | -82% /
-112% |
* ... Moindre est la valeur, meilleures sont les performances
Nous avons mesuré des valeurs moyennes de DeltaE de 3,86 (niveaux de gris) et de 3,34 (ColorChecker) à la luminosité native au départ de l'usine. Nous avons pu réduire ces valeurs à 1,94 et 2,44, respectivement, grâce à notre étalonnage manuel.
Temps de réponse de l'écran
| ↔ Temps de réponse noir à blanc | ||
|---|---|---|
| 3.1 ms ... hausse ↗ et chute ↘ combinées | ↗ 2.7 ms hausse | 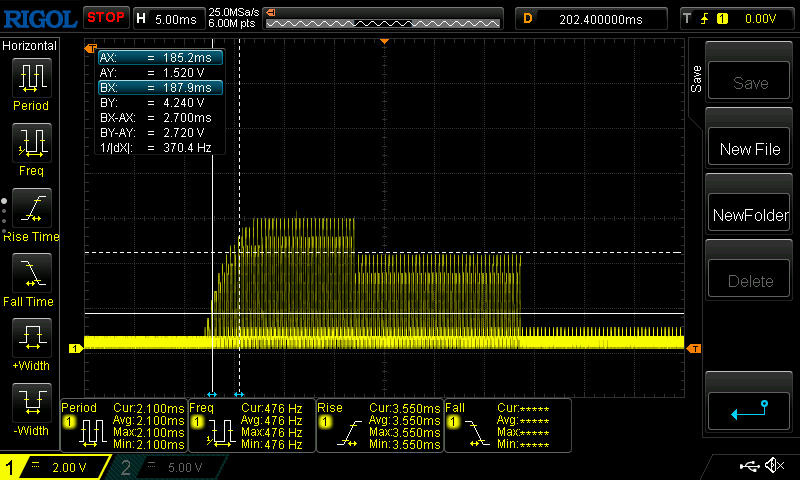 |
| ↘ 0.4 ms chute | ||
| L'écran montre de très faibles temps de réponse, parfait pour le jeu. En comparaison, tous les appareils testés affichent entre 0.1 (minimum) et 240 (maximum) ms. » 15 % des appareils testés affichent de meilleures performances. Cela signifie que les latences relevées sont meilleures que la moyenne (19.8 ms) de tous les appareils testés. | ||
| ↔ Temps de réponse gris 50% à gris 80% | ||
| 3.6 ms ... hausse ↗ et chute ↘ combinées | ↗ 1.6 ms hausse |  |
| ↘ 2 ms chute | ||
| L'écran montre de très faibles temps de réponse, parfait pour le jeu. En comparaison, tous les appareils testés affichent entre 0.165 (minimum) et 636 (maximum) ms. » 14 % des appareils testés affichent de meilleures performances. Cela signifie que les latences relevées sont meilleures que la moyenne (31 ms) de tous les appareils testés. | ||
Scintillement / MLI (Modulation de largeur d'impulsion)
| Scintillement / MLI (Modulation de largeur d'impulsion) décelé | 2500 Hz Amplitude: 100 % |  | |
Le rétroéclairage de l'écran scintille à la fréquence de 2500 Hz (certainement du fait de l'utilisation d'une MDI - Modulation de largeur d'impulsion) . La fréquence de rafraîchissement de 2500 Hz est élevée, la grande majorité des utilisateurs ne devrait pas percevoir de scintillements et être sujette à une fatigue oculaire accrue. En comparaison, 52 % des appareils testés n'emploient pas MDI pour assombrir leur écran. Nous avons relevé une moyenne à 7750 (minimum : 5 - maximum : 343500) Hz dans le cas où une MDI était active. | |||
En mode batterie, la luminosité est réduite de 700 à 400 nits. Toutefois, cela reste suffisant pour permettre un affichage clair du contenu à l'extérieur, à l'ombre et en vue directe du dessus.

Performance - Légèrement en dessous de la moyenne en mode performance
Avec son Intel Core Ultra 9 275HX et l'ordinateur portable Ordinateur portable Nvidia GeForce RTX 5080ce grand ordinateur portable de 18 pouces se positionne clairement comme un gamer haut de gamme et un remplaçant d'ordinateur de bureau, notamment grâce à ses nombreuses options de mise à niveau.
Conditions d'essai
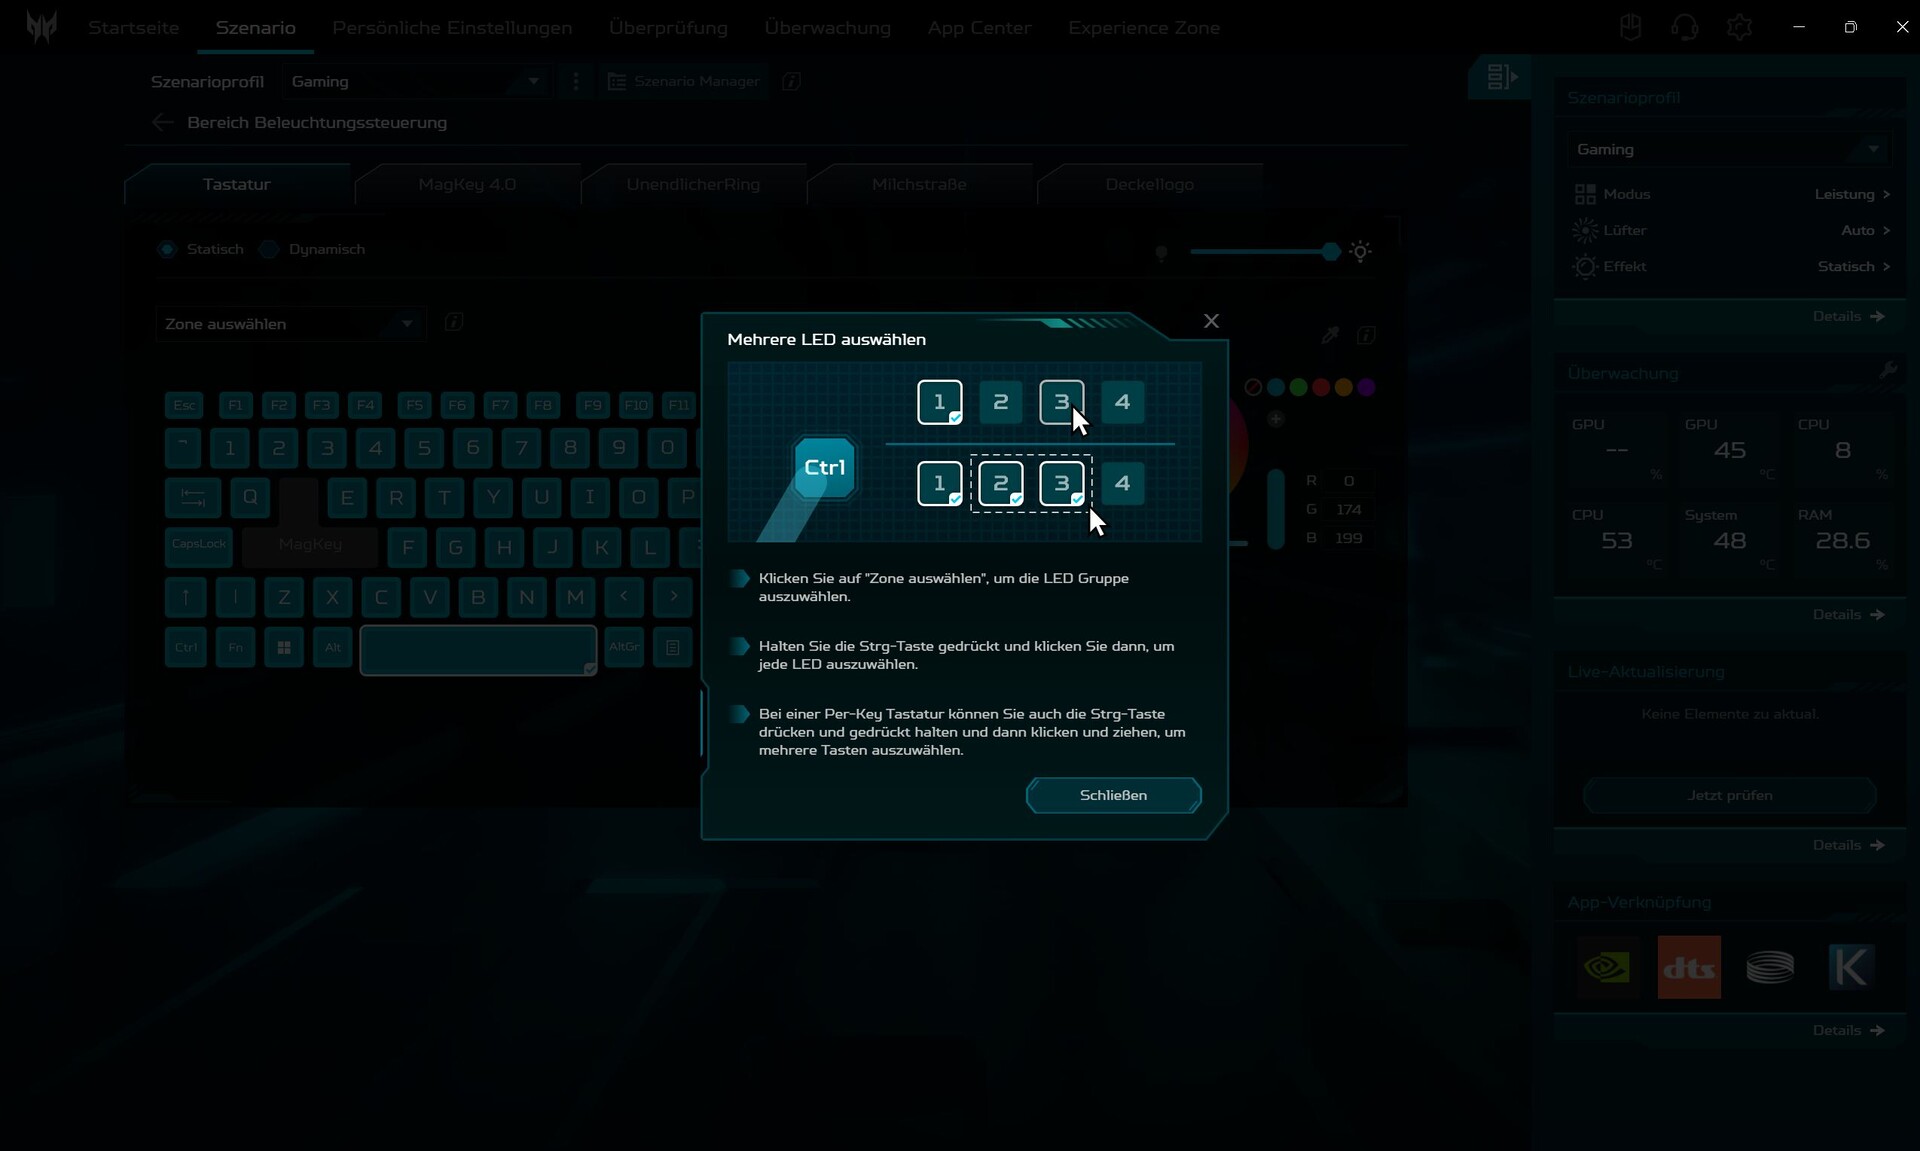
PredatorSense est le centre de contrôle (notre article de synthèse) des ordinateurs portables de jeu Acer. Le programme contient de nombreux paramètres, mais il est quelque peu confus, alambiqué et surchargé. Par exemple, la commutation graphique est disponible via un lien textuel ("Paramètres de fonctionnement du GPU") et est facilement oubliée. Il existe 4 modes de performance (silencieux, équilibré, performance, turbo) ; nous utilisons le mode performance pour nos benchmarks.
Au démarrage, un son de démarrage est toujours émis si fort que vous ne pouvez pas vous empêcher de grimacer. Heureusement, ce son peut être désactivé dans PredatorSense (Paramètres personnels, Effet de démarrage du système).
Le logiciel "Acer Jump Start" est également gênant. Il agace avec un pop-up pour Dropbox, n'est en fait pas très utile et peut être désinstallé en toute sécurité.
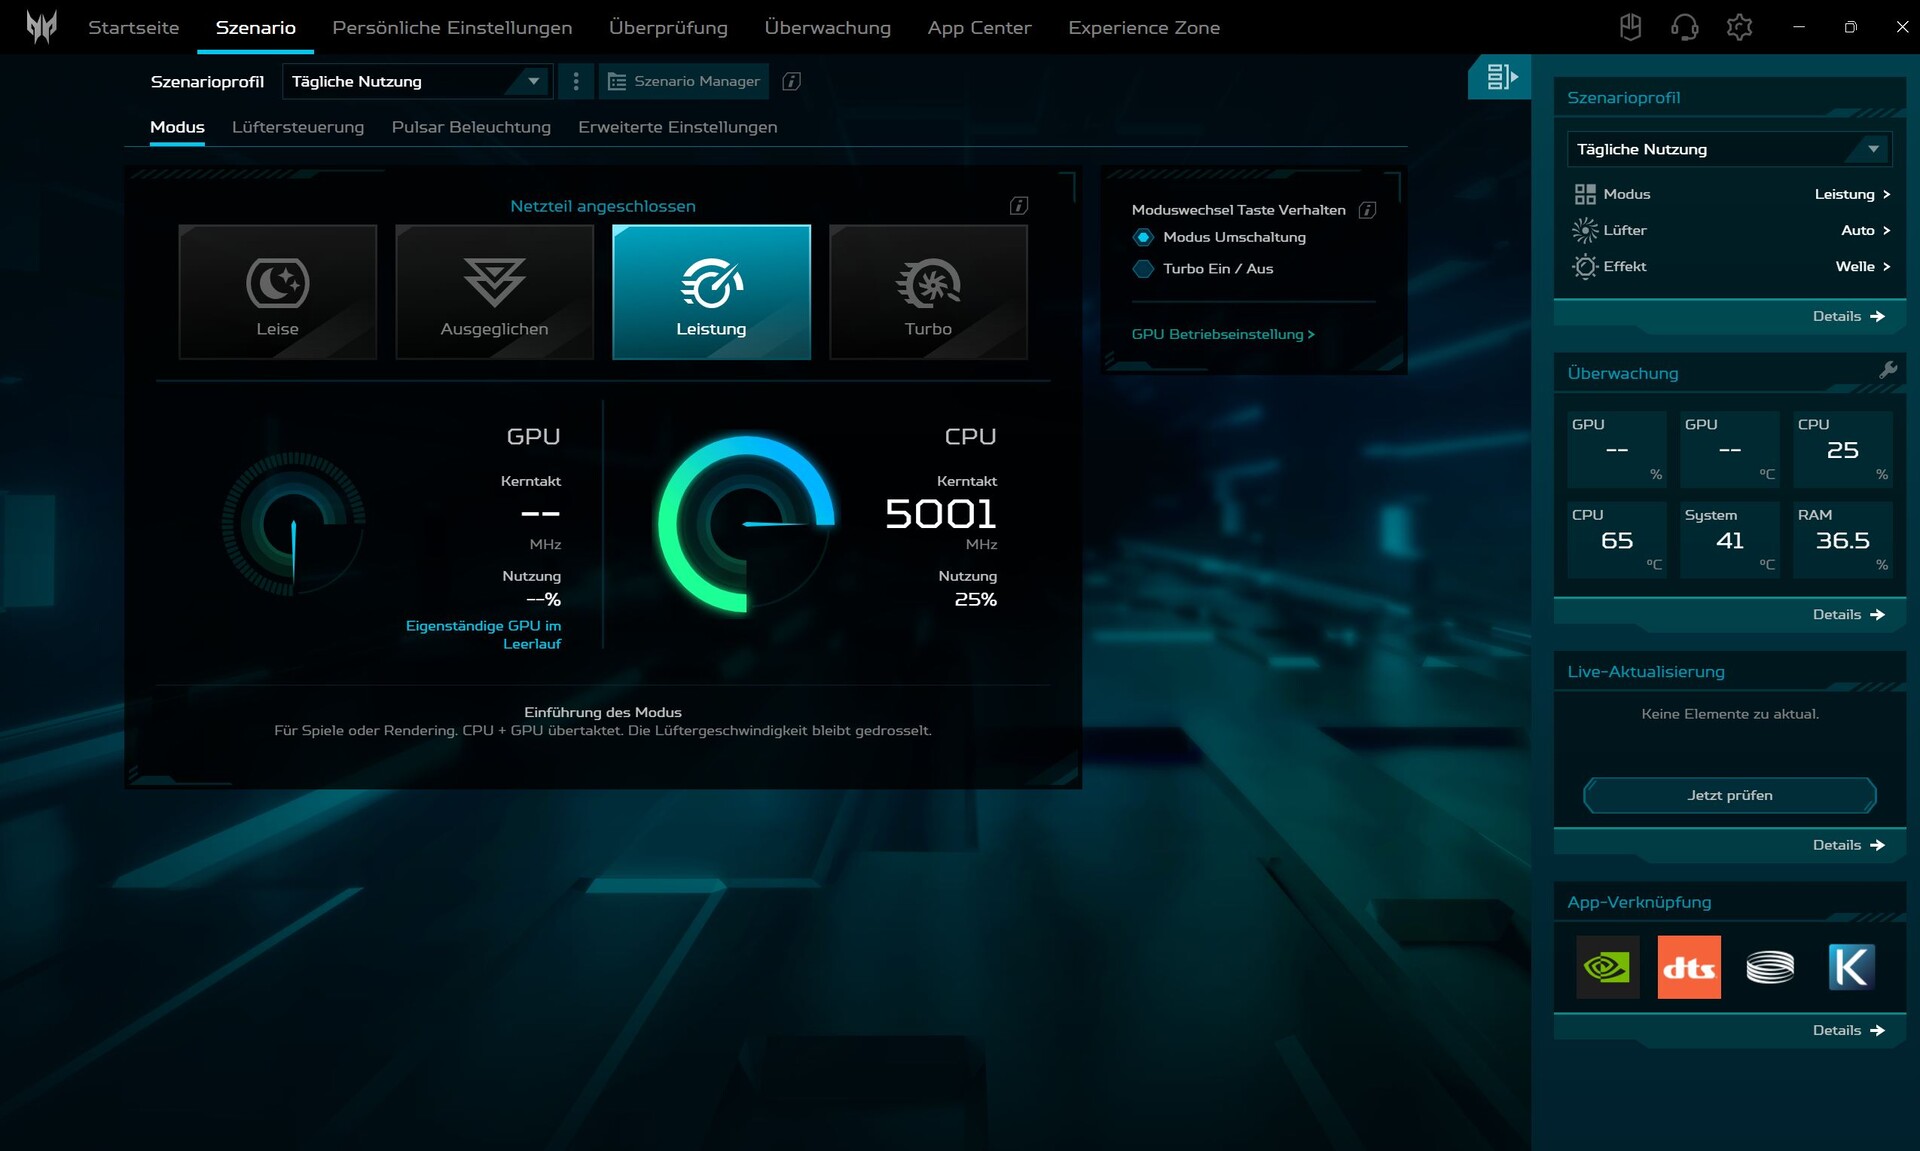


| Profil énergétique | PL2/PL1 | CB 15 Multi | CP 2077 FHD Ultra | max. Volume du ventilateur |
|---|---|---|---|---|
| Silencieux | 115/75 watts | 4 709 points | 111 fps | 27,5 dB(A) |
| Équilibré | 135/115 watts | 5,242 points | 121 fps | 39 dB(A) |
| Power | 160/135 watts | 5,379 points | 139.6 fps | 50.33 dB(A) |
| Turbo | 190/160 watts | 5.894 points | 147 fps | 60 dB(A) |
| batterie (équilibrée) | 135/115 watts | 3 319 points | 26,6 fps | 27,5 dB(A) |
Processeur
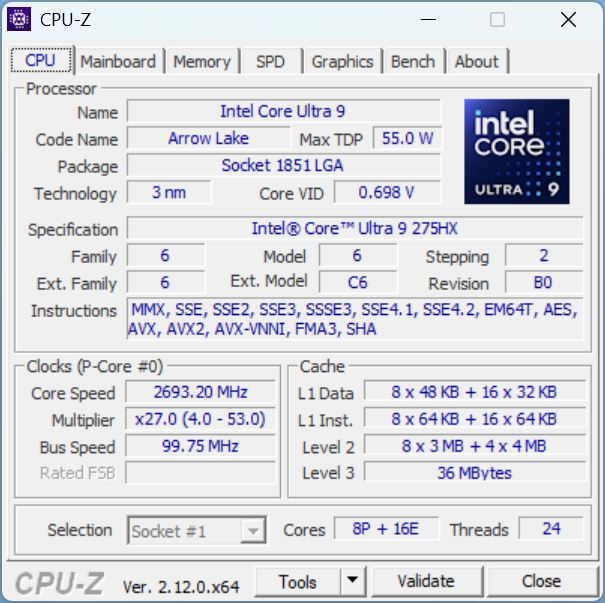
L'Intel Core Ultra 9 275HX Intel Core Ultra 9 275HX est installé dans de nombreux ordinateurs portables de jeu haut de gamme, ses 24 cœurs (8 cœurs P, 16 cœurs E) cadencent jusqu'à 4,6 à 5,4 GHz.
Dans la boucle continue de Cinebench R15, notre Helios 18 se classe dans la moyenne. Le Medion Erazer Beast 18 X1 est plus faible, le Asus Strix Scar 18 est plus rapide, tous deux avec le même processeur. Sur l'ensemble des tests CPU, l'ordinateur portable moyen avec le même CPU est 6 % plus rapide, et l'Asus Strix Scar est même 13 % plus rapide. En mode Turbo, le score de Cinebench R15 est supérieur à la moyenne mais reste inférieur à celui de nombreux concurrents.
Loin de la prise de courant, l'Helios 18 perd environ 38 % de sa performance CPU.
Cinebench R15 Multi loop
Cinebench R23: Multi Core | Single Core
Cinebench R20: CPU (Multi Core) | CPU (Single Core)
Cinebench R15: CPU Multi 64Bit | CPU Single 64Bit
Blender: v2.79 BMW27 CPU
7-Zip 18.03: 7z b 4 | 7z b 4 -mmt1
Geekbench 6.7: Multi-Core | Single-Core
Geekbench 5.5: Multi-Core | Single-Core
HWBOT x265 Benchmark v2.2: 4k Preset
LibreOffice : 20 Documents To PDF
R Benchmark 2.5: Overall mean
| CPU Performance rating | |
| MSI Raider A18 HX A9WIG-080 | |
| Asus Strix Scar 18 G835LX | |
| MSI Titan 18 HX AI A2XWJG | |
| MSI Vector A18 HX A9W | |
| Moyenne Intel Core Ultra 9 275HX | |
| Acer Predator Helios 18 AI | |
| Medion Erazer Beast 18 X1 MD62731 | |
| Acer Predator Helios 18 PH18-72-98MW | |
| Moyenne de la classe Gaming | |
| Cinebench R23 / Multi Core | |
| MSI Titan 18 HX AI A2XWJG | |
| MSI Vector A18 HX A9W | |
| Asus Strix Scar 18 G835LX | |
| MSI Raider A18 HX A9WIG-080 | |
| Moyenne Intel Core Ultra 9 275HX (30712 - 40970, n=31) | |
| Acer Predator Helios 18 AI | |
| Medion Erazer Beast 18 X1 MD62731 | |
| Acer Predator Helios 18 PH18-72-98MW | |
| Moyenne de la classe Gaming (10488 - 40970, n=106, 2 dernières années) | |
| Cinebench R23 / Single Core | |
| Medion Erazer Beast 18 X1 MD62731 | |
| Asus Strix Scar 18 G835LX | |
| Moyenne Intel Core Ultra 9 275HX (2009 - 2267, n=31) | |
| MSI Titan 18 HX AI A2XWJG | |
| Acer Predator Helios 18 PH18-72-98MW | |
| MSI Raider A18 HX A9WIG-080 | |
| Acer Predator Helios 18 AI | |
| Moyenne de la classe Gaming (1166 - 2356, n=106, 2 dernières années) | |
| MSI Vector A18 HX A9W | |
| Cinebench R20 / CPU (Multi Core) | |
| MSI Titan 18 HX AI A2XWJG | |
| MSI Vector A18 HX A9W | |
| Asus Strix Scar 18 G835LX | |
| MSI Raider A18 HX A9WIG-080 | |
| Moyenne Intel Core Ultra 9 275HX (12026 - 16108, n=30) | |
| Acer Predator Helios 18 AI | |
| Medion Erazer Beast 18 X1 MD62731 | |
| Moyenne de la classe Gaming (4029 - 16108, n=105, 2 dernières années) | |
| Acer Predator Helios 18 PH18-72-98MW | |
| Cinebench R20 / CPU (Single Core) | |
| Asus Strix Scar 18 G835LX | |
| Medion Erazer Beast 18 X1 MD62731 | |
| MSI Raider A18 HX A9WIG-080 | |
| Moyenne Intel Core Ultra 9 275HX (774 - 870, n=30) | |
| MSI Titan 18 HX AI A2XWJG | |
| Acer Predator Helios 18 PH18-72-98MW | |
| MSI Vector A18 HX A9W | |
| Acer Predator Helios 18 AI | |
| Moyenne de la classe Gaming (442 - 895, n=105, 2 dernières années) | |
| Cinebench R15 / CPU Multi 64Bit | |
| MSI Titan 18 HX AI A2XWJG | |
| MSI Vector A18 HX A9W | |
| Asus Strix Scar 18 G835LX | |
| MSI Raider A18 HX A9WIG-080 | |
| Moyenne Intel Core Ultra 9 275HX (4737 - 6271, n=30) | |
| Acer Predator Helios 18 AI | |
| Medion Erazer Beast 18 X1 MD62731 | |
| Acer Predator Helios 18 PH18-72-98MW | |
| Moyenne de la classe Gaming (1578 - 6271, n=104, 2 dernières années) | |
| Cinebench R15 / CPU Single 64Bit | |
| Asus Strix Scar 18 G835LX | |
| Medion Erazer Beast 18 X1 MD62731 | |
| Moyenne Intel Core Ultra 9 275HX (306 - 343, n=31) | |
| MSI Titan 18 HX AI A2XWJG | |
| MSI Raider A18 HX A9WIG-080 | |
| MSI Vector A18 HX A9W | |
| Acer Predator Helios 18 PH18-72-98MW | |
| Acer Predator Helios 18 AI | |
| Moyenne de la classe Gaming (188.8 - 343, n=105, 2 dernières années) | |
| Blender / v2.79 BMW27 CPU | |
| Moyenne de la classe Gaming (80 - 330, n=103, 2 dernières années) | |
| Acer Predator Helios 18 PH18-72-98MW | |
| Medion Erazer Beast 18 X1 MD62731 | |
| Acer Predator Helios 18 AI | |
| Moyenne Intel Core Ultra 9 275HX (82 - 116, n=29) | |
| Asus Strix Scar 18 G835LX | |
| MSI Titan 18 HX AI A2XWJG | |
| MSI Vector A18 HX A9W | |
| MSI Raider A18 HX A9WIG-080 | |
| 7-Zip 18.03 / 7z b 4 | |
| MSI Raider A18 HX A9WIG-080 | |
| MSI Vector A18 HX A9W | |
| MSI Titan 18 HX AI A2XWJG | |
| Asus Strix Scar 18 G835LX | |
| Moyenne Intel Core Ultra 9 275HX (98236 - 124155, n=30) | |
| Acer Predator Helios 18 PH18-72-98MW | |
| Acer Predator Helios 18 AI | |
| Medion Erazer Beast 18 X1 MD62731 | |
| Moyenne de la classe Gaming (33491 - 148086, n=104, 2 dernières années) | |
| 7-Zip 18.03 / 7z b 4 -mmt1 | |
| MSI Vector A18 HX A9W | |
| MSI Raider A18 HX A9WIG-080 | |
| Medion Erazer Beast 18 X1 MD62731 | |
| Asus Strix Scar 18 G835LX | |
| MSI Titan 18 HX AI A2XWJG | |
| Moyenne Intel Core Ultra 9 275HX (6026 - 7149, n=30) | |
| Moyenne de la classe Gaming (4199 - 7436, n=104, 2 dernières années) | |
| Acer Predator Helios 18 PH18-72-98MW | |
| Acer Predator Helios 18 AI | |
| Geekbench 6.7 / Multi-Core | |
| MSI Titan 18 HX AI A2XWJG | |
| Asus Strix Scar 18 G835LX | |
| MSI Raider A18 HX A9WIG-080 | |
| Moyenne Intel Core Ultra 9 275HX (16033 - 21668, n=33) | |
| Acer Predator Helios 18 AI | |
| Medion Erazer Beast 18 X1 MD62731 | |
| Acer Predator Helios 18 PH18-72-98MW | |
| MSI Vector A18 HX A9W | |
| Moyenne de la classe Gaming (6625 - 22104, n=105, 2 dernières années) | |
| Geekbench 6.7 / Single-Core | |
| MSI Vector A18 HX A9W | |
| Asus Strix Scar 18 G835LX | |
| MSI Raider A18 HX A9WIG-080 | |
| Medion Erazer Beast 18 X1 MD62731 | |
| MSI Titan 18 HX AI A2XWJG | |
| Moyenne Intel Core Ultra 9 275HX (2843 - 3160, n=33) | |
| Acer Predator Helios 18 PH18-72-98MW | |
| Acer Predator Helios 18 AI | |
| Moyenne de la classe Gaming (1490 - 3259, n=105, 2 dernières années) | |
| Geekbench 5.5 / Multi-Core | |
| MSI Titan 18 HX AI A2XWJG | |
| Asus Strix Scar 18 G835LX | |
| MSI Raider A18 HX A9WIG-080 | |
| Moyenne Intel Core Ultra 9 275HX (19105 - 25855, n=31) | |
| MSI Vector A18 HX A9W | |
| Acer Predator Helios 18 AI | |
| Acer Predator Helios 18 PH18-72-98MW | |
| Medion Erazer Beast 18 X1 MD62731 | |
| Moyenne de la classe Gaming (6460 - 27010, n=104, 2 dernières années) | |
| Geekbench 5.5 / Single-Core | |
| MSI Raider A18 HX A9WIG-080 | |
| MSI Vector A18 HX A9W | |
| Asus Strix Scar 18 G835LX | |
| Medion Erazer Beast 18 X1 MD62731 | |
| MSI Titan 18 HX AI A2XWJG | |
| Moyenne Intel Core Ultra 9 275HX (2033 - 2292, n=31) | |
| Moyenne de la classe Gaming (986 - 2474, n=104, 2 dernières années) | |
| Acer Predator Helios 18 AI | |
| Acer Predator Helios 18 PH18-72-98MW | |
| HWBOT x265 Benchmark v2.2 / 4k Preset | |
| MSI Titan 18 HX AI A2XWJG | |
| MSI Vector A18 HX A9W | |
| MSI Raider A18 HX A9WIG-080 | |
| Asus Strix Scar 18 G835LX | |
| Moyenne Intel Core Ultra 9 275HX (30.7 - 43.8, n=30) | |
| Acer Predator Helios 18 AI | |
| Medion Erazer Beast 18 X1 MD62731 | |
| Acer Predator Helios 18 PH18-72-98MW | |
| Moyenne de la classe Gaming (11.5 - 44.3, n=104, 2 dernières années) | |
| LibreOffice / 20 Documents To PDF | |
| Acer Predator Helios 18 PH18-72-98MW | |
| Moyenne de la classe Gaming (33.2 - 88.8, n=104, 2 dernières années) | |
| Medion Erazer Beast 18 X1 MD62731 | |
| MSI Titan 18 HX AI A2XWJG | |
| MSI Raider A18 HX A9WIG-080 | |
| MSI Vector A18 HX A9W | |
| Moyenne Intel Core Ultra 9 275HX (33.2 - 62.1, n=30) | |
| Asus Strix Scar 18 G835LX | |
| Acer Predator Helios 18 AI | |
| R Benchmark 2.5 / Overall mean | |
| Acer Predator Helios 18 AI | |
| Moyenne de la classe Gaming (0.3439 - 0.759, n=105, 2 dernières années) | |
| Acer Predator Helios 18 PH18-72-98MW | |
| Moyenne Intel Core Ultra 9 275HX (0.3943 - 0.4568, n=30) | |
| MSI Titan 18 HX AI A2XWJG | |
| Medion Erazer Beast 18 X1 MD62731 | |
| Asus Strix Scar 18 G835LX | |
| MSI Raider A18 HX A9WIG-080 | |
| MSI Vector A18 HX A9W | |
* ... Moindre est la valeur, meilleures sont les performances
AIDA64: FP32 Ray-Trace | FPU Julia | CPU SHA3 | CPU Queen | FPU SinJulia | FPU Mandel | CPU AES | CPU ZLib | FP64 Ray-Trace | CPU PhotoWorxx
| Performance rating | |
| MSI Raider A18 HX A9WIG-080 | |
| MSI Vector A18 HX A9W | |
| MSI Titan 18 HX AI A2XWJG | |
| Asus Strix Scar 18 G835LX | |
| Moyenne Intel Core Ultra 9 275HX | |
| Acer Predator Helios 18 AI | |
| Medion Erazer Beast 18 X1 MD62731 | |
| Moyenne de la classe Gaming | |
| Acer Predator Helios 18 PH18-72-98MW | |
| AIDA64 / FP32 Ray-Trace | |
| MSI Vector A18 HX A9W | |
| MSI Raider A18 HX A9WIG-080 | |
| MSI Titan 18 HX AI A2XWJG | |
| Asus Strix Scar 18 G835LX | |
| Moyenne Intel Core Ultra 9 275HX (28039 - 39895, n=30) | |
| Acer Predator Helios 18 AI | |
| Moyenne de la classe Gaming (10227 - 85542, n=103, 2 dernières années) | |
| Medion Erazer Beast 18 X1 MD62731 | |
| Acer Predator Helios 18 PH18-72-98MW | |
| AIDA64 / FPU Julia | |
| MSI Raider A18 HX A9WIG-080 | |
| MSI Vector A18 HX A9W | |
| MSI Titan 18 HX AI A2XWJG | |
| Asus Strix Scar 18 G835LX | |
| Moyenne Intel Core Ultra 9 275HX (140254 - 200744, n=30) | |
| Acer Predator Helios 18 AI | |
| Medion Erazer Beast 18 X1 MD62731 | |
| Moyenne de la classe Gaming (51376 - 238426, n=103, 2 dernières années) | |
| Acer Predator Helios 18 PH18-72-98MW | |
| AIDA64 / CPU SHA3 | |
| MSI Titan 18 HX AI A2XWJG | |
| MSI Vector A18 HX A9W | |
| MSI Raider A18 HX A9WIG-080 | |
| Asus Strix Scar 18 G835LX | |
| Moyenne Intel Core Ultra 9 275HX (6710 - 9817, n=30) | |
| Acer Predator Helios 18 AI | |
| Medion Erazer Beast 18 X1 MD62731 | |
| Moyenne de la classe Gaming (2180 - 9817, n=103, 2 dernières années) | |
| Acer Predator Helios 18 PH18-72-98MW | |
| AIDA64 / CPU Queen | |
| MSI Raider A18 HX A9WIG-080 | |
| MSI Vector A18 HX A9W | |
| MSI Titan 18 HX AI A2XWJG | |
| Asus Strix Scar 18 G835LX | |
| Acer Predator Helios 18 AI | |
| Acer Predator Helios 18 PH18-72-98MW | |
| Moyenne Intel Core Ultra 9 275HX (113887 - 140937, n=30) | |
| Moyenne de la classe Gaming (49785 - 173351, n=90, 2 dernières années) | |
| Medion Erazer Beast 18 X1 MD62731 | |
| AIDA64 / FPU SinJulia | |
| MSI Raider A18 HX A9WIG-080 | |
| MSI Vector A18 HX A9W | |
| Acer Predator Helios 18 PH18-72-98MW | |
| Moyenne de la classe Gaming (4424 - 33636, n=103, 2 dernières années) | |
| MSI Titan 18 HX AI A2XWJG | |
| Asus Strix Scar 18 G835LX | |
| Acer Predator Helios 18 AI | |
| Moyenne Intel Core Ultra 9 275HX (11172 - 14425, n=30) | |
| Medion Erazer Beast 18 X1 MD62731 | |
| AIDA64 / FPU Mandel | |
| MSI Vector A18 HX A9W | |
| MSI Raider A18 HX A9WIG-080 | |
| MSI Titan 18 HX AI A2XWJG | |
| Asus Strix Scar 18 G835LX | |
| Moyenne Intel Core Ultra 9 275HX (72596 - 104508, n=30) | |
| Acer Predator Helios 18 AI | |
| Medion Erazer Beast 18 X1 MD62731 | |
| Moyenne de la classe Gaming (25115 - 128721, n=103, 2 dernières années) | |
| Acer Predator Helios 18 PH18-72-98MW | |
| AIDA64 / CPU AES | |
| MSI Raider A18 HX A9WIG-080 | |
| MSI Vector A18 HX A9W | |
| Asus Strix Scar 18 G835LX | |
| MSI Titan 18 HX AI A2XWJG | |
| Moyenne Intel Core Ultra 9 275HX (105608 - 247074, n=30) | |
| Acer Predator Helios 18 AI | |
| Acer Predator Helios 18 PH18-72-98MW | |
| Medion Erazer Beast 18 X1 MD62731 | |
| Moyenne de la classe Gaming (39258 - 247074, n=103, 2 dernières années) | |
| AIDA64 / CPU ZLib | |
| MSI Vector A18 HX A9W | |
| MSI Raider A18 HX A9WIG-080 | |
| MSI Titan 18 HX AI A2XWJG | |
| Asus Strix Scar 18 G835LX | |
| Moyenne Intel Core Ultra 9 275HX (1582 - 2263, n=30) | |
| Acer Predator Helios 18 AI | |
| Medion Erazer Beast 18 X1 MD62731 | |
| Acer Predator Helios 18 PH18-72-98MW | |
| Moyenne de la classe Gaming (574 - 2531, n=103, 2 dernières années) | |
| AIDA64 / FP64 Ray-Trace | |
| MSI Vector A18 HX A9W | |
| MSI Raider A18 HX A9WIG-080 | |
| MSI Titan 18 HX AI A2XWJG | |
| Asus Strix Scar 18 G835LX | |
| Moyenne Intel Core Ultra 9 275HX (14847 - 21854, n=30) | |
| Acer Predator Helios 18 AI | |
| Moyenne de la classe Gaming (5509 - 45446, n=103, 2 dernières années) | |
| Medion Erazer Beast 18 X1 MD62731 | |
| Acer Predator Helios 18 PH18-72-98MW | |
| AIDA64 / CPU PhotoWorxx | |
| MSI Titan 18 HX AI A2XWJG | |
| Asus Strix Scar 18 G835LX | |
| Moyenne Intel Core Ultra 9 275HX (37482 - 62916, n=30) | |
| Medion Erazer Beast 18 X1 MD62731 | |
| Acer Predator Helios 18 PH18-72-98MW | |
| Moyenne de la classe Gaming (12271 - 89891, n=103, 2 dernières années) | |
| MSI Vector A18 HX A9W | |
| Acer Predator Helios 18 AI | |
| MSI Raider A18 HX A9WIG-080 | |
Performance du système

En ce qui concerne les performances du système, l'Helios 18 se situe légèrement en dessous de la moyenne avec 4 %. Mais subjectivement, l'ouverture des navigateurs de fichiers ou des menus contextuels prend toujours un peu plus de temps que d'habitude. Espérons que les prochaines mises à jour élimineront ces petits problèmes.
PCMark 10: Score | Essentials | Productivity | Digital Content Creation
CrossMark: Overall | Productivity | Creativity | Responsiveness
WebXPRT 3: Overall
WebXPRT 4: Overall
Mozilla Kraken 1.1: Total
| Performance rating | |
| MSI Raider A18 HX A9WIG-080 | |
| MSI Vector A18 HX A9W | |
| MSI Titan 18 HX AI A2XWJG | |
| Asus Strix Scar 18 G835LX | |
| Moyenne Intel Core Ultra 9 275HX, NVIDIA GeForce RTX 5080 Laptop | |
| Acer Predator Helios 18 AI | |
| Moyenne de la classe Gaming | |
| Medion Erazer Beast 18 X1 MD62731 | |
| Acer Predator Helios 18 PH18-72-98MW -6! | |
| PCMark 10 / Score | |
| MSI Vector A18 HX A9W | |
| MSI Raider A18 HX A9WIG-080 | |
| MSI Titan 18 HX AI A2XWJG | |
| Moyenne Intel Core Ultra 9 275HX, NVIDIA GeForce RTX 5080 Laptop (7805 - 10409, n=9) | |
| Asus Strix Scar 18 G835LX | |
| Acer Predator Helios 18 AI | |
| Moyenne de la classe Gaming (5828 - 11574, n=92, 2 dernières années) | |
| Medion Erazer Beast 18 X1 MD62731 | |
| Acer Predator Helios 18 PH18-72-98MW | |
| PCMark 10 / Essentials | |
| MSI Raider A18 HX A9WIG-080 | |
| MSI Vector A18 HX A9W | |
| Acer Predator Helios 18 PH18-72-98MW | |
| Asus Strix Scar 18 G835LX | |
| MSI Titan 18 HX AI A2XWJG | |
| Moyenne Intel Core Ultra 9 275HX, NVIDIA GeForce RTX 5080 Laptop (10206 - 11472, n=9) | |
| Acer Predator Helios 18 AI | |
| Moyenne de la classe Gaming (8810 - 11935, n=96, 2 dernières années) | |
| Medion Erazer Beast 18 X1 MD62731 | |
| PCMark 10 / Productivity | |
| Moyenne de la classe Gaming (6845 - 21327, n=94, 2 dernières années) | |
| MSI Vector A18 HX A9W | |
| MSI Raider A18 HX A9WIG-080 | |
| Moyenne Intel Core Ultra 9 275HX, NVIDIA GeForce RTX 5080 Laptop (8319 - 20616, n=9) | |
| Acer Predator Helios 18 PH18-72-98MW | |
| Acer Predator Helios 18 AI | |
| Medion Erazer Beast 18 X1 MD62731 | |
| MSI Titan 18 HX AI A2XWJG | |
| Asus Strix Scar 18 G835LX | |
| PCMark 10 / Digital Content Creation | |
| MSI Vector A18 HX A9W | |
| MSI Titan 18 HX AI A2XWJG | |
| Asus Strix Scar 18 G835LX | |
| Moyenne Intel Core Ultra 9 275HX, NVIDIA GeForce RTX 5080 Laptop (10505 - 19351, n=9) | |
| Acer Predator Helios 18 AI | |
| Medion Erazer Beast 18 X1 MD62731 | |
| MSI Raider A18 HX A9WIG-080 | |
| Moyenne de la classe Gaming (7602 - 19657, n=94, 2 dernières années) | |
| Acer Predator Helios 18 PH18-72-98MW | |
| CrossMark / Overall | |
| MSI Raider A18 HX A9WIG-080 | |
| MSI Titan 18 HX AI A2XWJG | |
| Asus Strix Scar 18 G835LX | |
| MSI Vector A18 HX A9W | |
| Moyenne Intel Core Ultra 9 275HX, NVIDIA GeForce RTX 5080 Laptop (1857 - 2244, n=9) | |
| Acer Predator Helios 18 AI | |
| Moyenne de la classe Gaming (1366 - 2409, n=93, 2 dernières années) | |
| Medion Erazer Beast 18 X1 MD62731 | |
| CrossMark / Productivity | |
| Asus Strix Scar 18 G835LX | |
| MSI Raider A18 HX A9WIG-080 | |
| MSI Titan 18 HX AI A2XWJG | |
| Moyenne Intel Core Ultra 9 275HX, NVIDIA GeForce RTX 5080 Laptop (1764 - 2122, n=9) | |
| MSI Vector A18 HX A9W | |
| Acer Predator Helios 18 AI | |
| Moyenne de la classe Gaming (1386 - 2254, n=93, 2 dernières années) | |
| Medion Erazer Beast 18 X1 MD62731 | |
| CrossMark / Creativity | |
| MSI Raider A18 HX A9WIG-080 | |
| MSI Titan 18 HX AI A2XWJG | |
| MSI Vector A18 HX A9W | |
| Asus Strix Scar 18 G835LX | |
| Moyenne Intel Core Ultra 9 275HX, NVIDIA GeForce RTX 5080 Laptop (2115 - 2498, n=9) | |
| Acer Predator Helios 18 AI | |
| Moyenne de la classe Gaming (1343 - 2729, n=93, 2 dernières années) | |
| Medion Erazer Beast 18 X1 MD62731 | |
| CrossMark / Responsiveness | |
| Moyenne Intel Core Ultra 9 275HX, NVIDIA GeForce RTX 5080 Laptop (1466 - 2096, n=9) | |
| MSI Raider A18 HX A9WIG-080 | |
| Asus Strix Scar 18 G835LX | |
| Acer Predator Helios 18 AI | |
| MSI Titan 18 HX AI A2XWJG | |
| Moyenne de la classe Gaming (1226 - 2334, n=93, 2 dernières années) | |
| MSI Vector A18 HX A9W | |
| Medion Erazer Beast 18 X1 MD62731 | |
| WebXPRT 3 / Overall | |
| MSI Raider A18 HX A9WIG-080 | |
| MSI Titan 18 HX AI A2XWJG | |
| MSI Vector A18 HX A9W | |
| Asus Strix Scar 18 G835LX | |
| Moyenne Intel Core Ultra 9 275HX, NVIDIA GeForce RTX 5080 Laptop (306 - 378, n=9) | |
| Medion Erazer Beast 18 X1 MD62731 | |
| Moyenne de la classe Gaming (220 - 532, n=97, 2 dernières années) | |
| Acer Predator Helios 18 AI | |
| WebXPRT 4 / Overall | |
| Asus Strix Scar 18 G835LX | |
| MSI Raider A18 HX A9WIG-080 | |
| Medion Erazer Beast 18 X1 MD62731 | |
| Moyenne Intel Core Ultra 9 275HX, NVIDIA GeForce RTX 5080 Laptop (285 - 336, n=9) | |
| MSI Vector A18 HX A9W | |
| MSI Titan 18 HX AI A2XWJG | |
| Acer Predator Helios 18 AI | |
| Moyenne de la classe Gaming (165 - 354, n=97, 2 dernières années) | |
| Mozilla Kraken 1.1 / Total | |
| Moyenne de la classe Gaming (391 - 590, n=99, 2 dernières années) | |
| Acer Predator Helios 18 PH18-72-98MW | |
| Acer Predator Helios 18 AI | |
| Medion Erazer Beast 18 X1 MD62731 | |
| Moyenne Intel Core Ultra 9 275HX, NVIDIA GeForce RTX 5080 Laptop (405 - 432, n=9) | |
| Asus Strix Scar 18 G835LX | |
| MSI Titan 18 HX AI A2XWJG | |
| MSI Vector A18 HX A9W | |
| MSI Raider A18 HX A9WIG-080 | |
* ... Moindre est la valeur, meilleures sont les performances
| PCMark 10 Score | 8511 points | |
Aide | ||
| AIDA64 / Memory Copy | |
| MSI Titan 18 HX AI A2XWJG | |
| Asus Strix Scar 18 G835LX | |
| Moyenne Intel Core Ultra 9 275HX (56003 - 94460, n=30) | |
| Acer Predator Helios 18 PH18-72-98MW | |
| Medion Erazer Beast 18 X1 MD62731 | |
| Moyenne de la classe Gaming (21750 - 129946, n=103, 2 dernières années) | |
| Acer Predator Helios 18 AI | |
| MSI Vector A18 HX A9W | |
| MSI Raider A18 HX A9WIG-080 | |
| AIDA64 / Memory Read | |
| MSI Titan 18 HX AI A2XWJG | |
| Medion Erazer Beast 18 X1 MD62731 | |
| Asus Strix Scar 18 G835LX | |
| Acer Predator Helios 18 PH18-72-98MW | |
| Moyenne Intel Core Ultra 9 275HX (55795 - 97151, n=30) | |
| Moyenne de la classe Gaming (22956 - 118858, n=103, 2 dernières années) | |
| Acer Predator Helios 18 AI | |
| MSI Vector A18 HX A9W | |
| MSI Raider A18 HX A9WIG-080 | |
| AIDA64 / Memory Write | |
| MSI Titan 18 HX AI A2XWJG | |
| Asus Strix Scar 18 G835LX | |
| Moyenne Intel Core Ultra 9 275HX (55663 - 116129, n=30) | |
| Medion Erazer Beast 18 X1 MD62731 | |
| Moyenne de la classe Gaming (22297 - 135096, n=103, 2 dernières années) | |
| Acer Predator Helios 18 PH18-72-98MW | |
| MSI Vector A18 HX A9W | |
| Acer Predator Helios 18 AI | |
| MSI Raider A18 HX A9WIG-080 | |
| AIDA64 / Memory Latency | |
| Acer Predator Helios 18 AI | |
| Moyenne Intel Core Ultra 9 275HX (105.8 - 161.6, n=30) | |
| Medion Erazer Beast 18 X1 MD62731 | |
| Asus Strix Scar 18 G835LX | |
| Moyenne de la classe Gaming (75.3 - 259, n=103, 2 dernières années) | |
| MSI Titan 18 HX AI A2XWJG | |
| MSI Vector A18 HX A9W | |
| MSI Raider A18 HX A9WIG-080 | |
| Acer Predator Helios 18 PH18-72-98MW | |
* ... Moindre est la valeur, meilleures sont les performances
Latences DPC
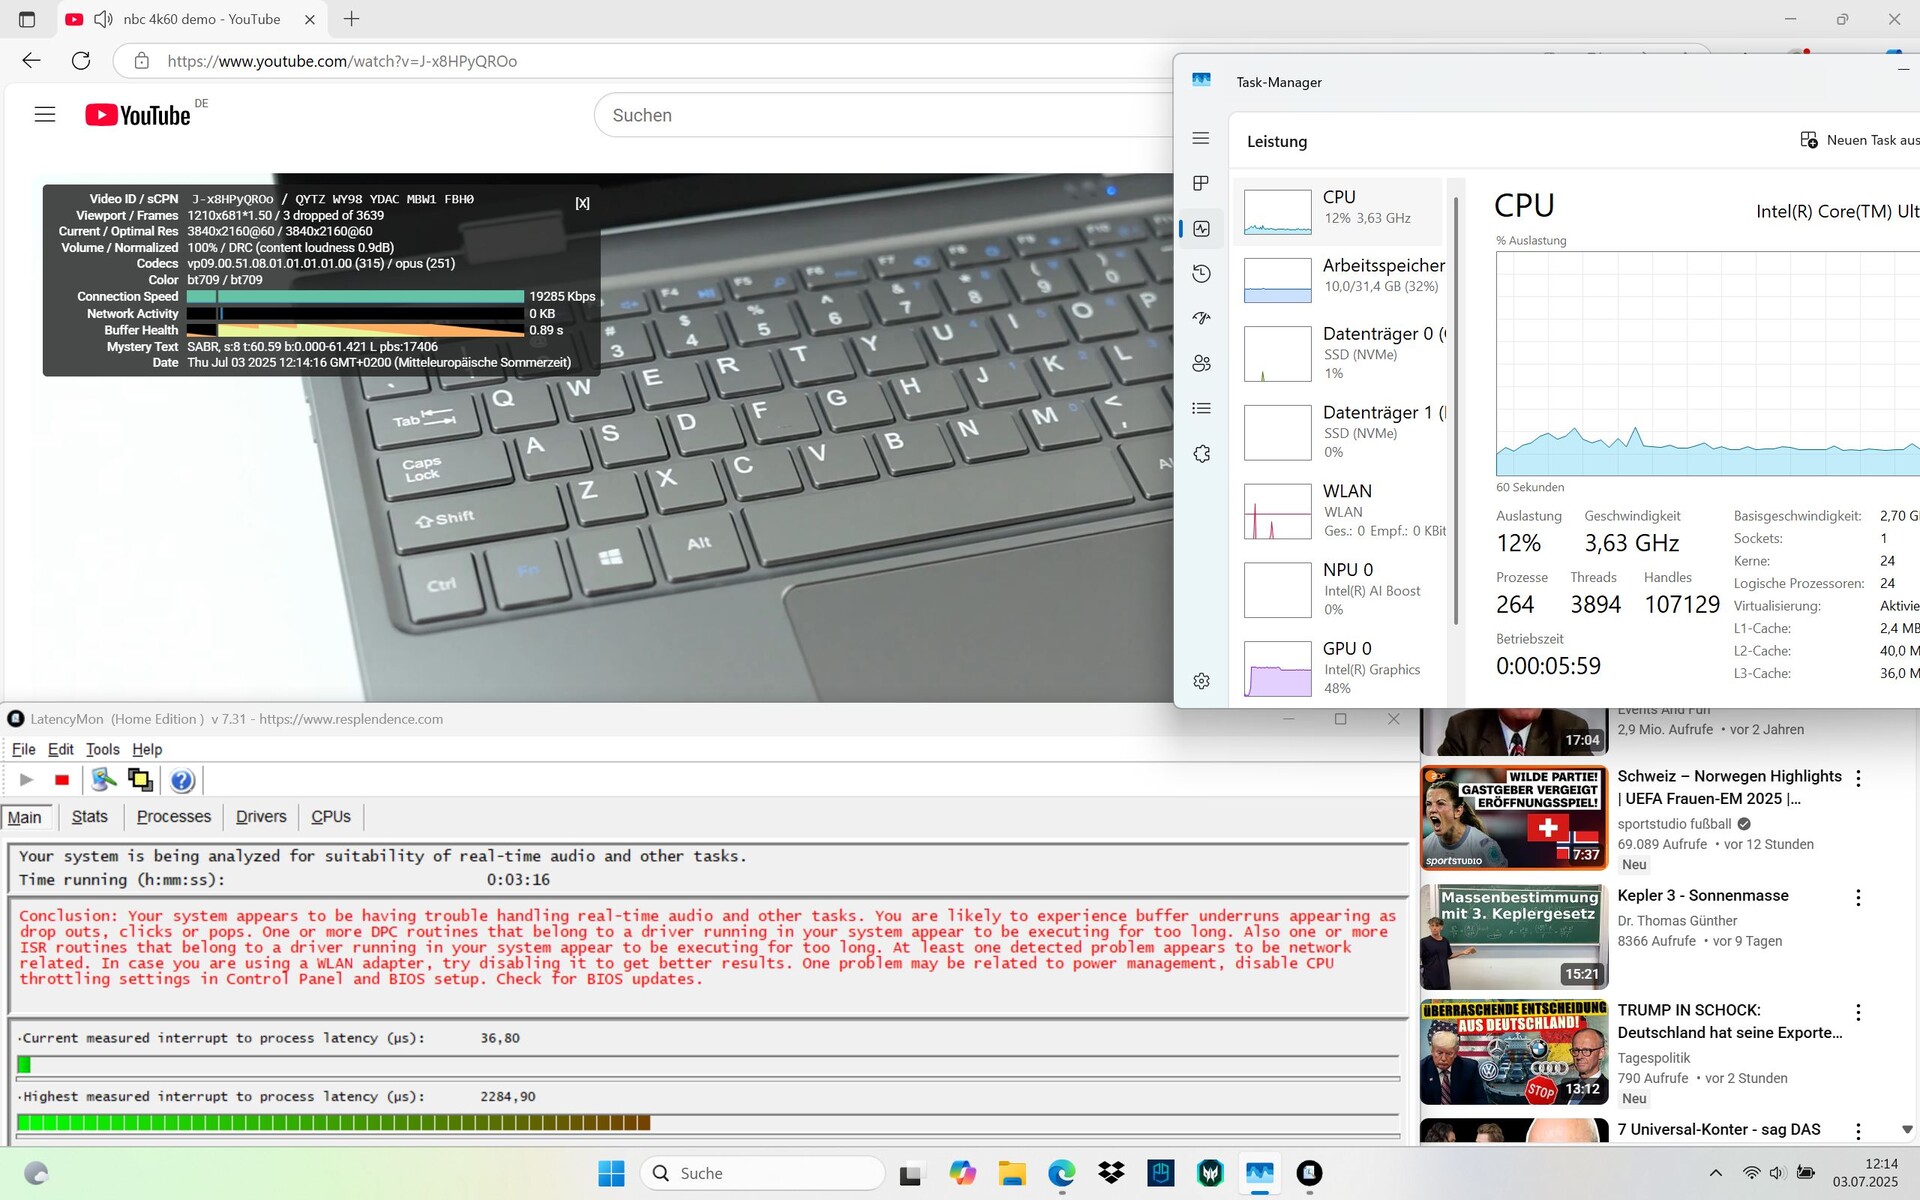
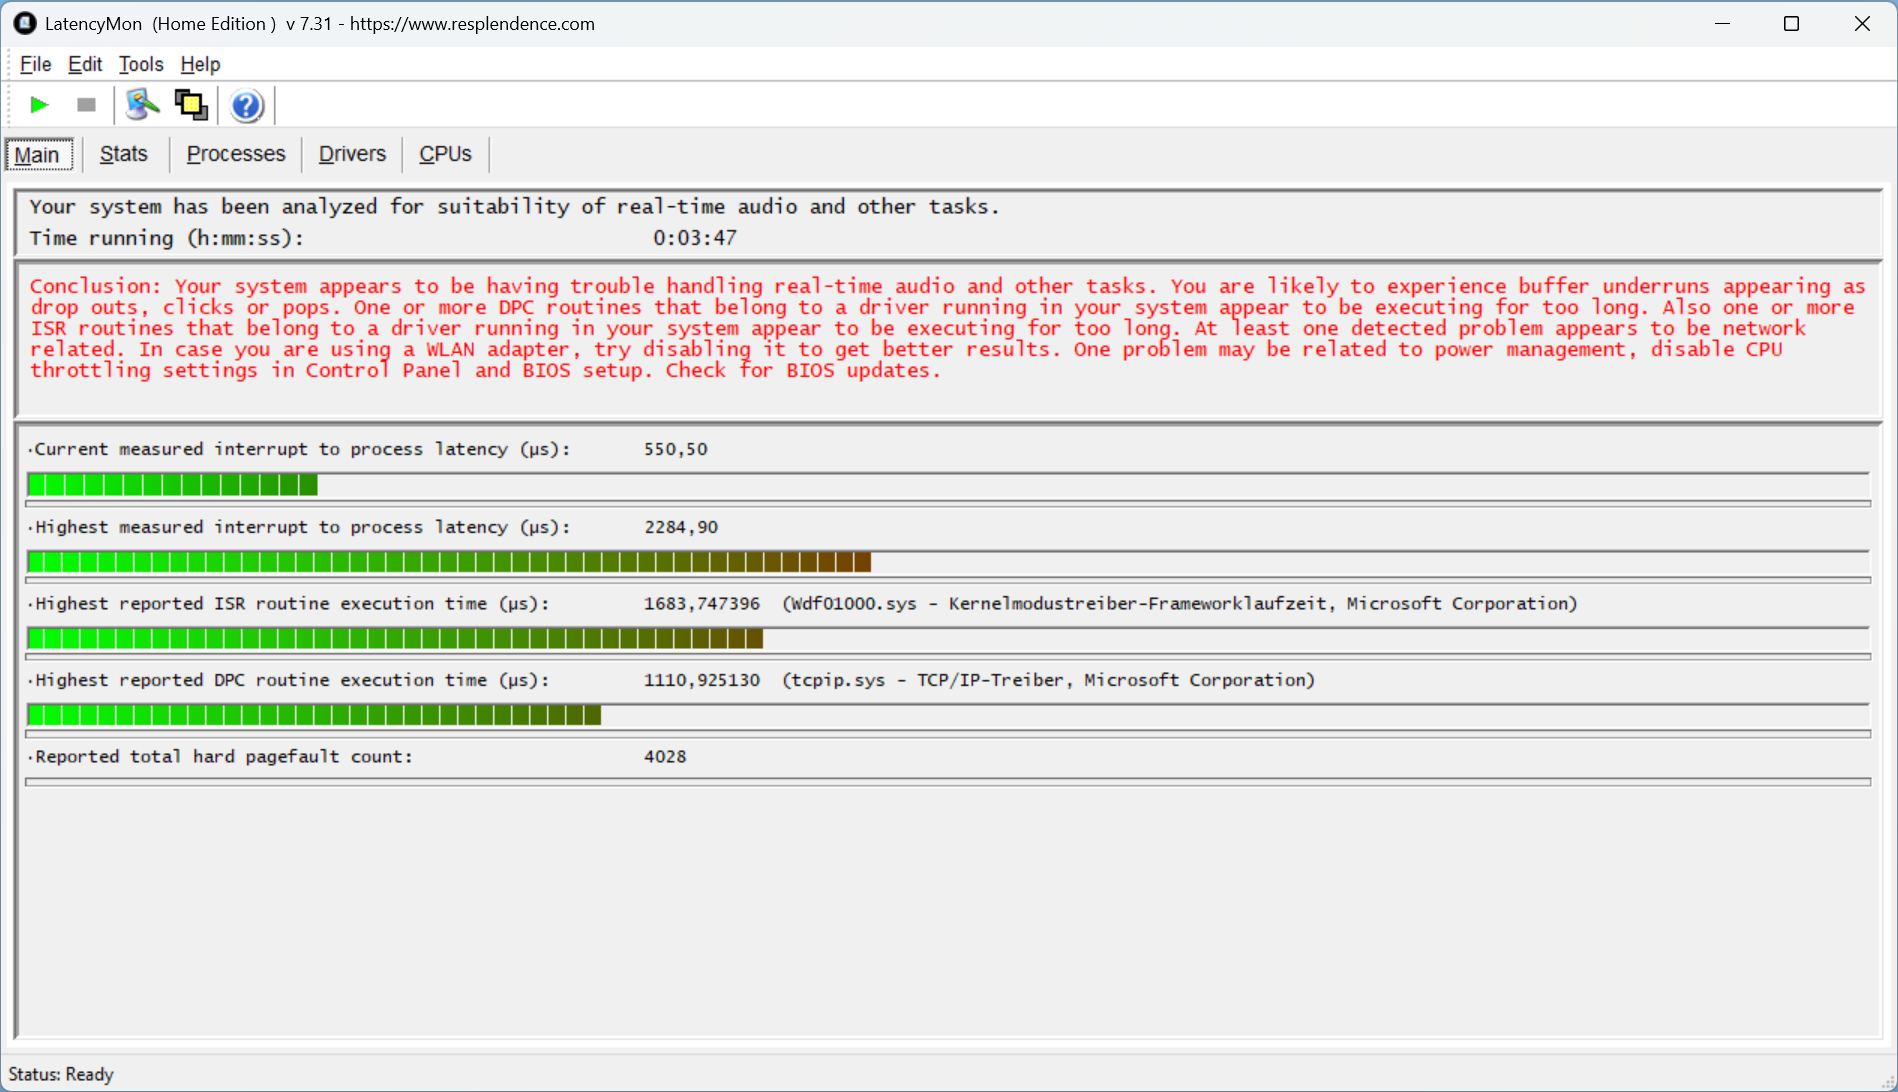
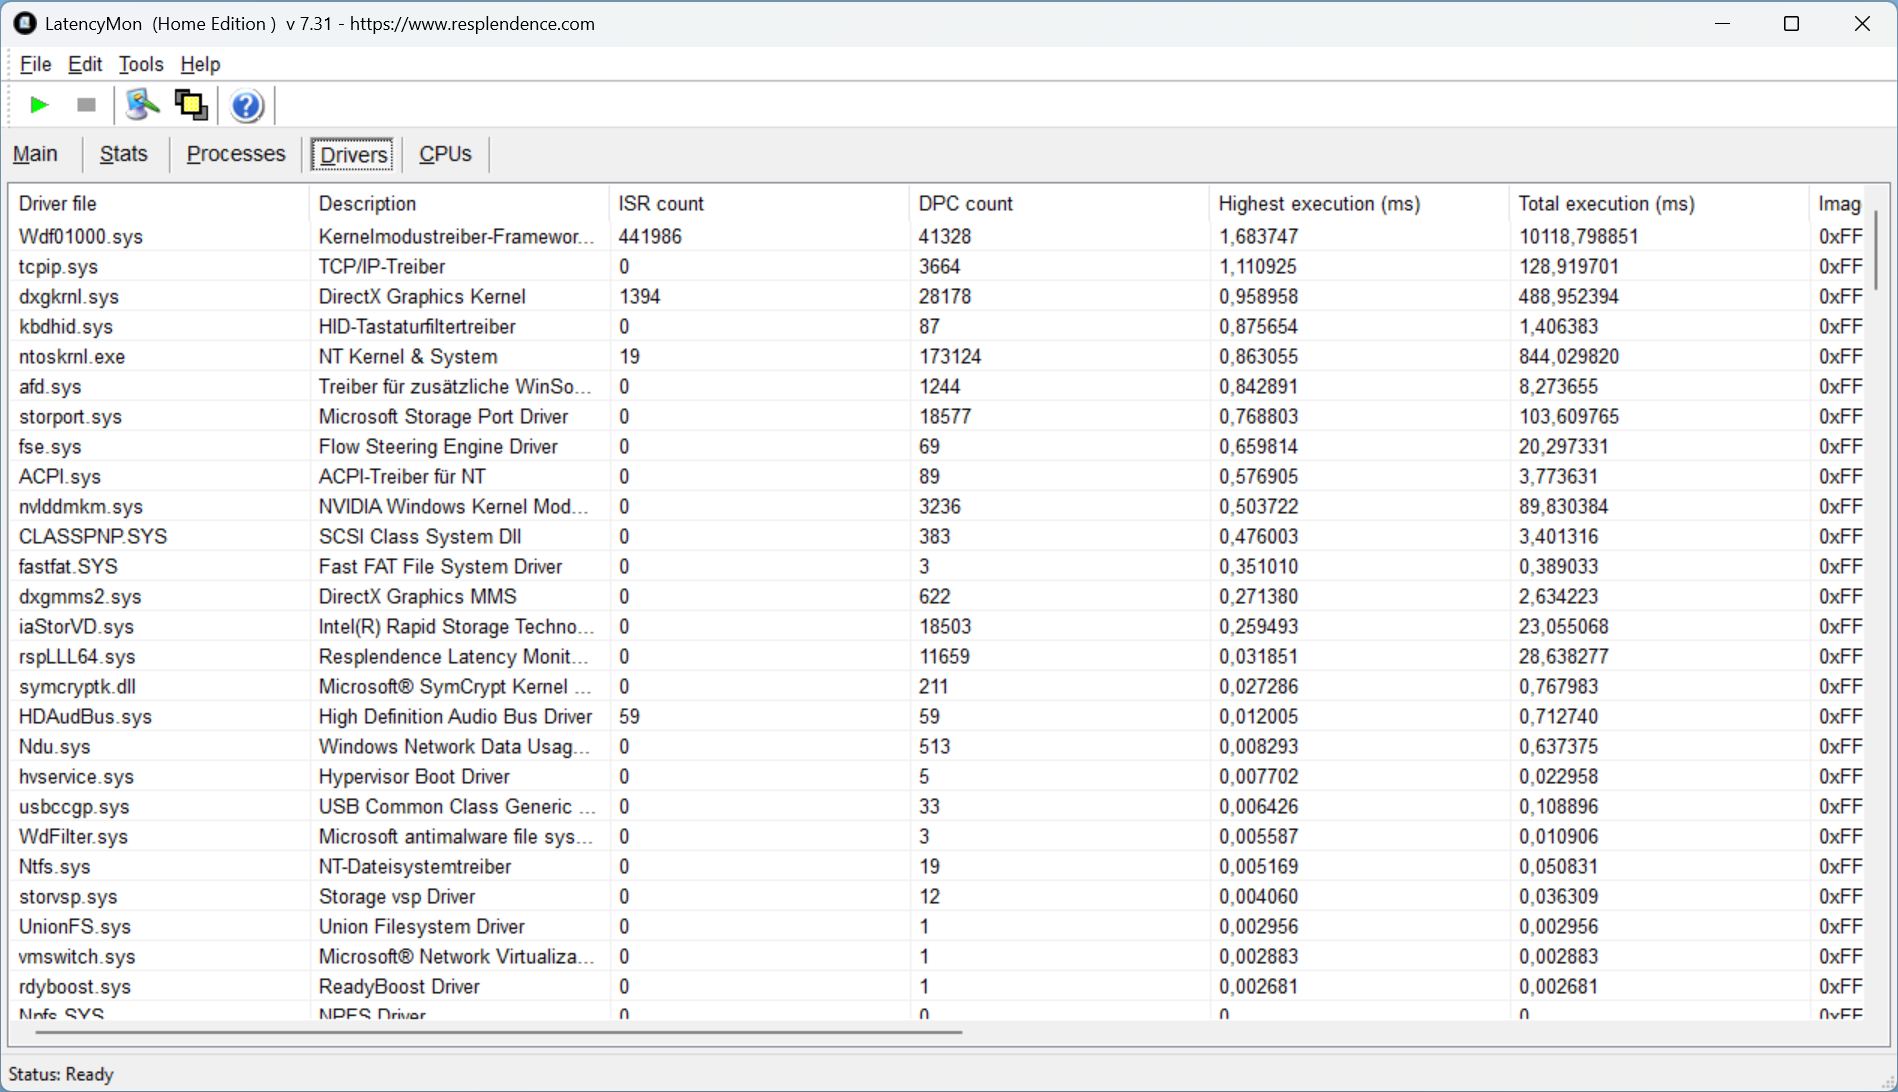
LatencyMon commence par les premières latences, qui augmentent lorsque le navigateur et d'autres onglets sont ouverts. Notre vidéo YouTube 4K 60 fps est lue avec 3 images omises.
| DPC Latencies / LatencyMon - interrupt to process latency (max), Web, Youtube, Prime95 | |
| Medion Erazer Beast 18 X1 MD62731 | |
| Acer Predator Helios 18 PH18-72-98MW | |
| Acer Predator Helios 18 AI | |
| MSI Titan 18 HX AI A2XWJG | |
| MSI Raider A18 HX A9WIG-080 | |
| Asus Strix Scar 18 G835LX | |
| MSI Vector A18 HX A9W | |
* ... Moindre est la valeur, meilleures sont les performances
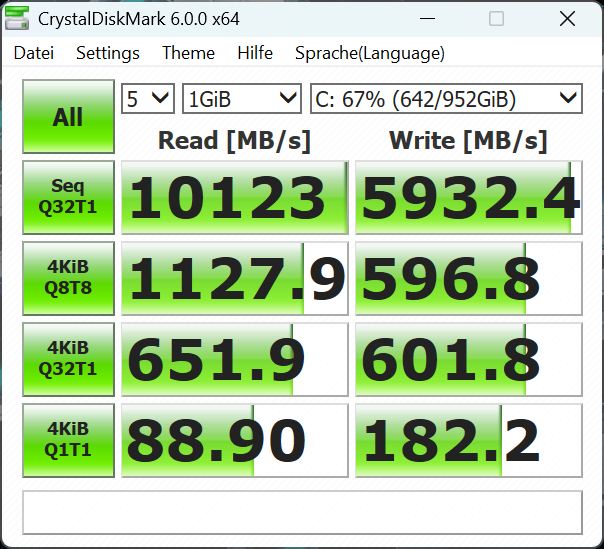
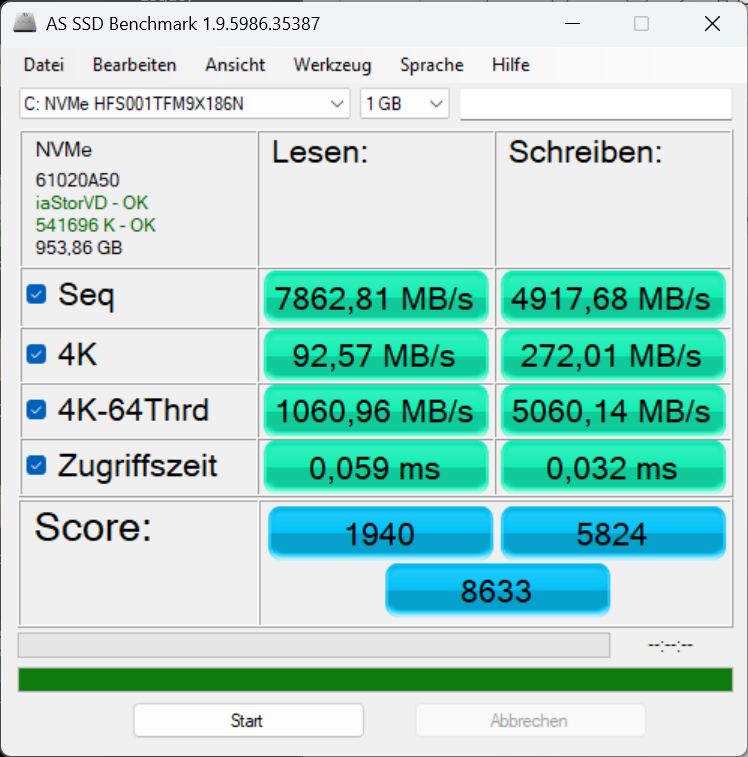
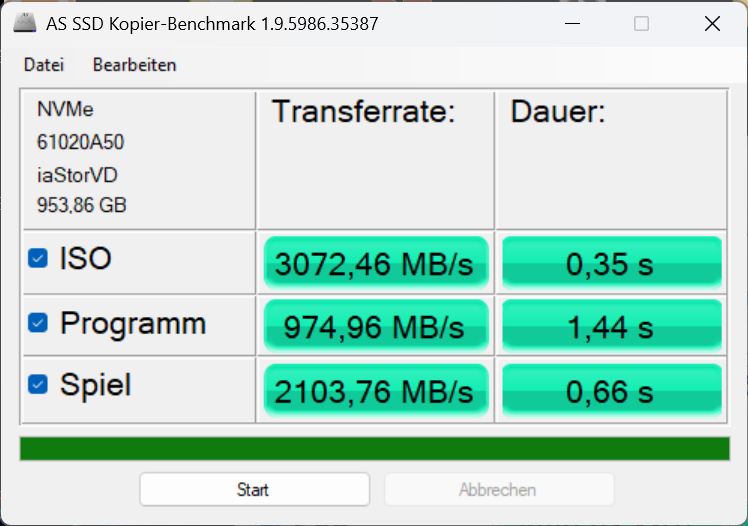
Mémoire de masse
Notre configuration contient deux disques SSD de SK Hynix (modèles différents), chacun avec 1 TB d'espace de stockage, qui ne sont apparemment pas connectés en RAID. Le disque SSD du système est très rapide, mais il est étranglé après la moitié du temps en cas de charge continue.

* ... Moindre est la valeur, meilleures sont les performances
Continuous read: DiskSpd Read Loop, Queue Depth 8
Performance du GPU
Dans le test synthétique 3DMarks, l'ordinateur portable GeForce RTX 5080 de notre Helios 18 est environ 3 pour cent en dessous de la moyenne ; l'ordinateur portable MSI Raider A18, quant à lui, est en dessous de la moyenne MSI Raider A18 avec le même GPU est 8 % plus rapide. En mode batterie, 85 % des performances 3D sont perdues !
La situation est similaire dans les tests de jeu : notre Helios 18 est aussi performant en Full HD que le MSI Raider A18 avec le même GPU Medion Erazer Beast 18 X1mais le MSI Vector A18 HX avec la RTX 5070 Ti est même 8 à 9 % plus rapide que les deux gamers équipés d'une RTX 5080 ! Le prédécesseur de l'Helios 18 équipé d'un ordinateur portable RTX 4090 n'est que 4 % plus lent dans tous les jeux. En QHD, les différences peuvent être encore plus importantes.
L'Helios 18 est particulièrement confortable en Full HD et QHD. Baldur's Gate 3, par exemple, plante à 7 fps en 4K, et d'autres titres, comme F1 25 ou Cyberpunk 2077, ne fonctionnent plus correctement en 4K. Notre graphique Cyberpunk montre, d'une part, que quelques images sont perdues au fil du temps et, d'autre part, que le MSI Vector 17 est au moins aussi rapide, malgré un GPU plus faible.
Certains titres, comme F1 25 en QHD, peuvent encore être améliorés via DLSS s'ils ne fonctionnent plus parfaitement en mode natif.
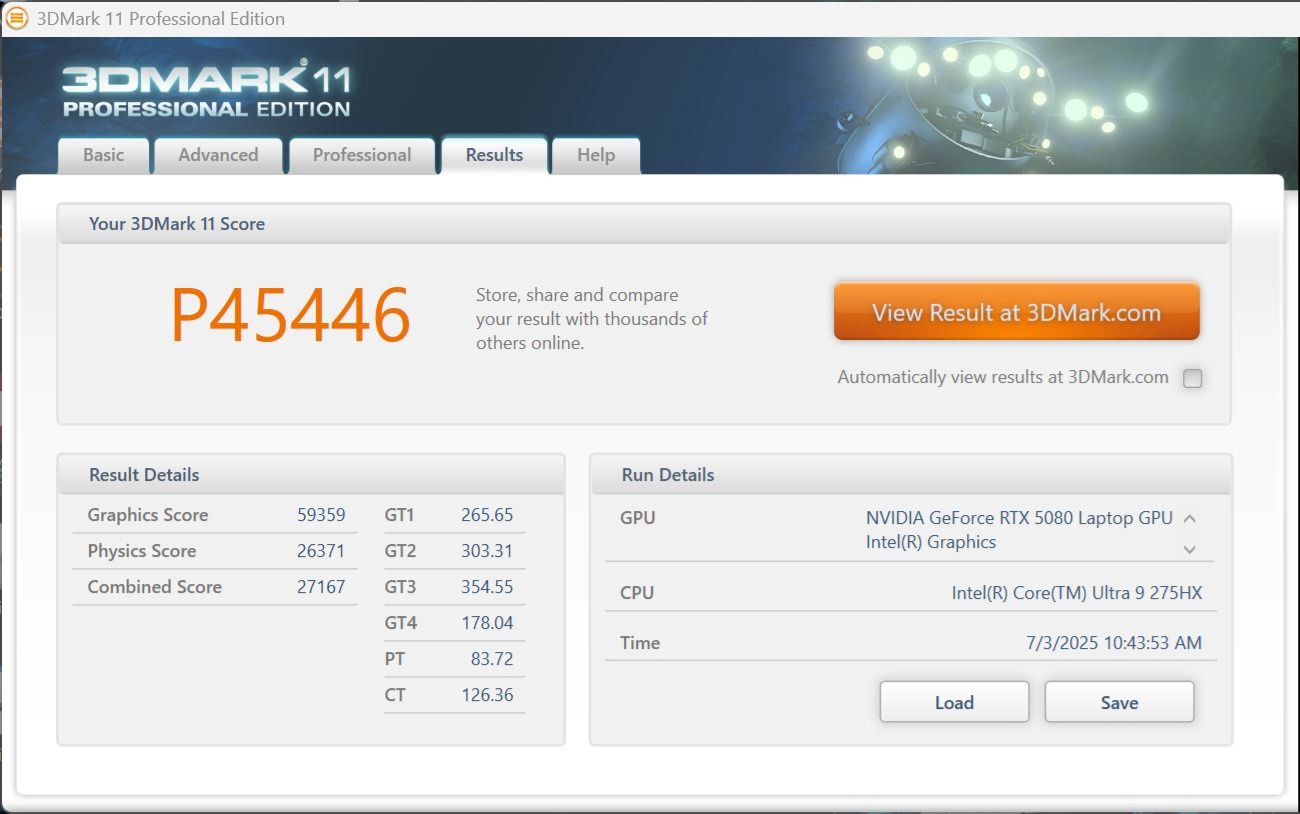
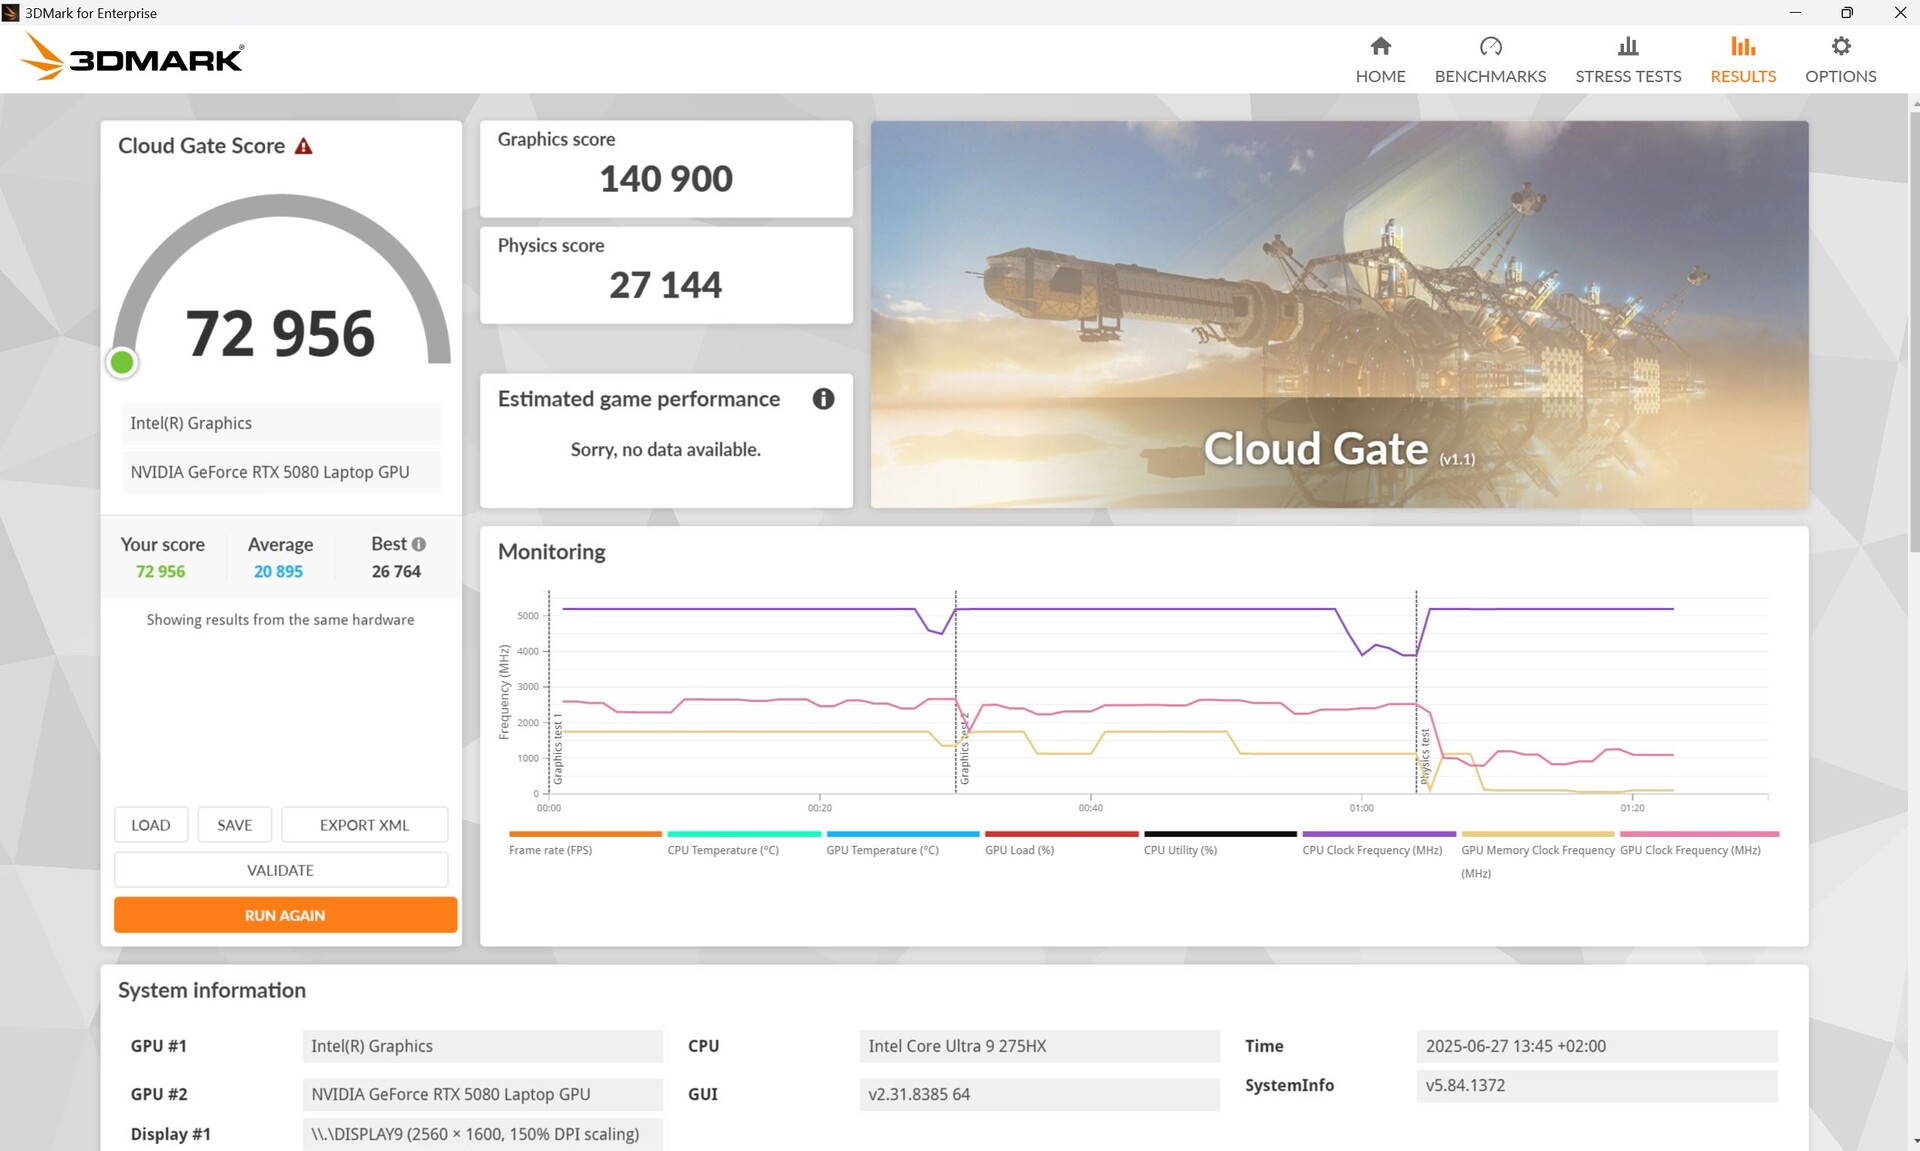
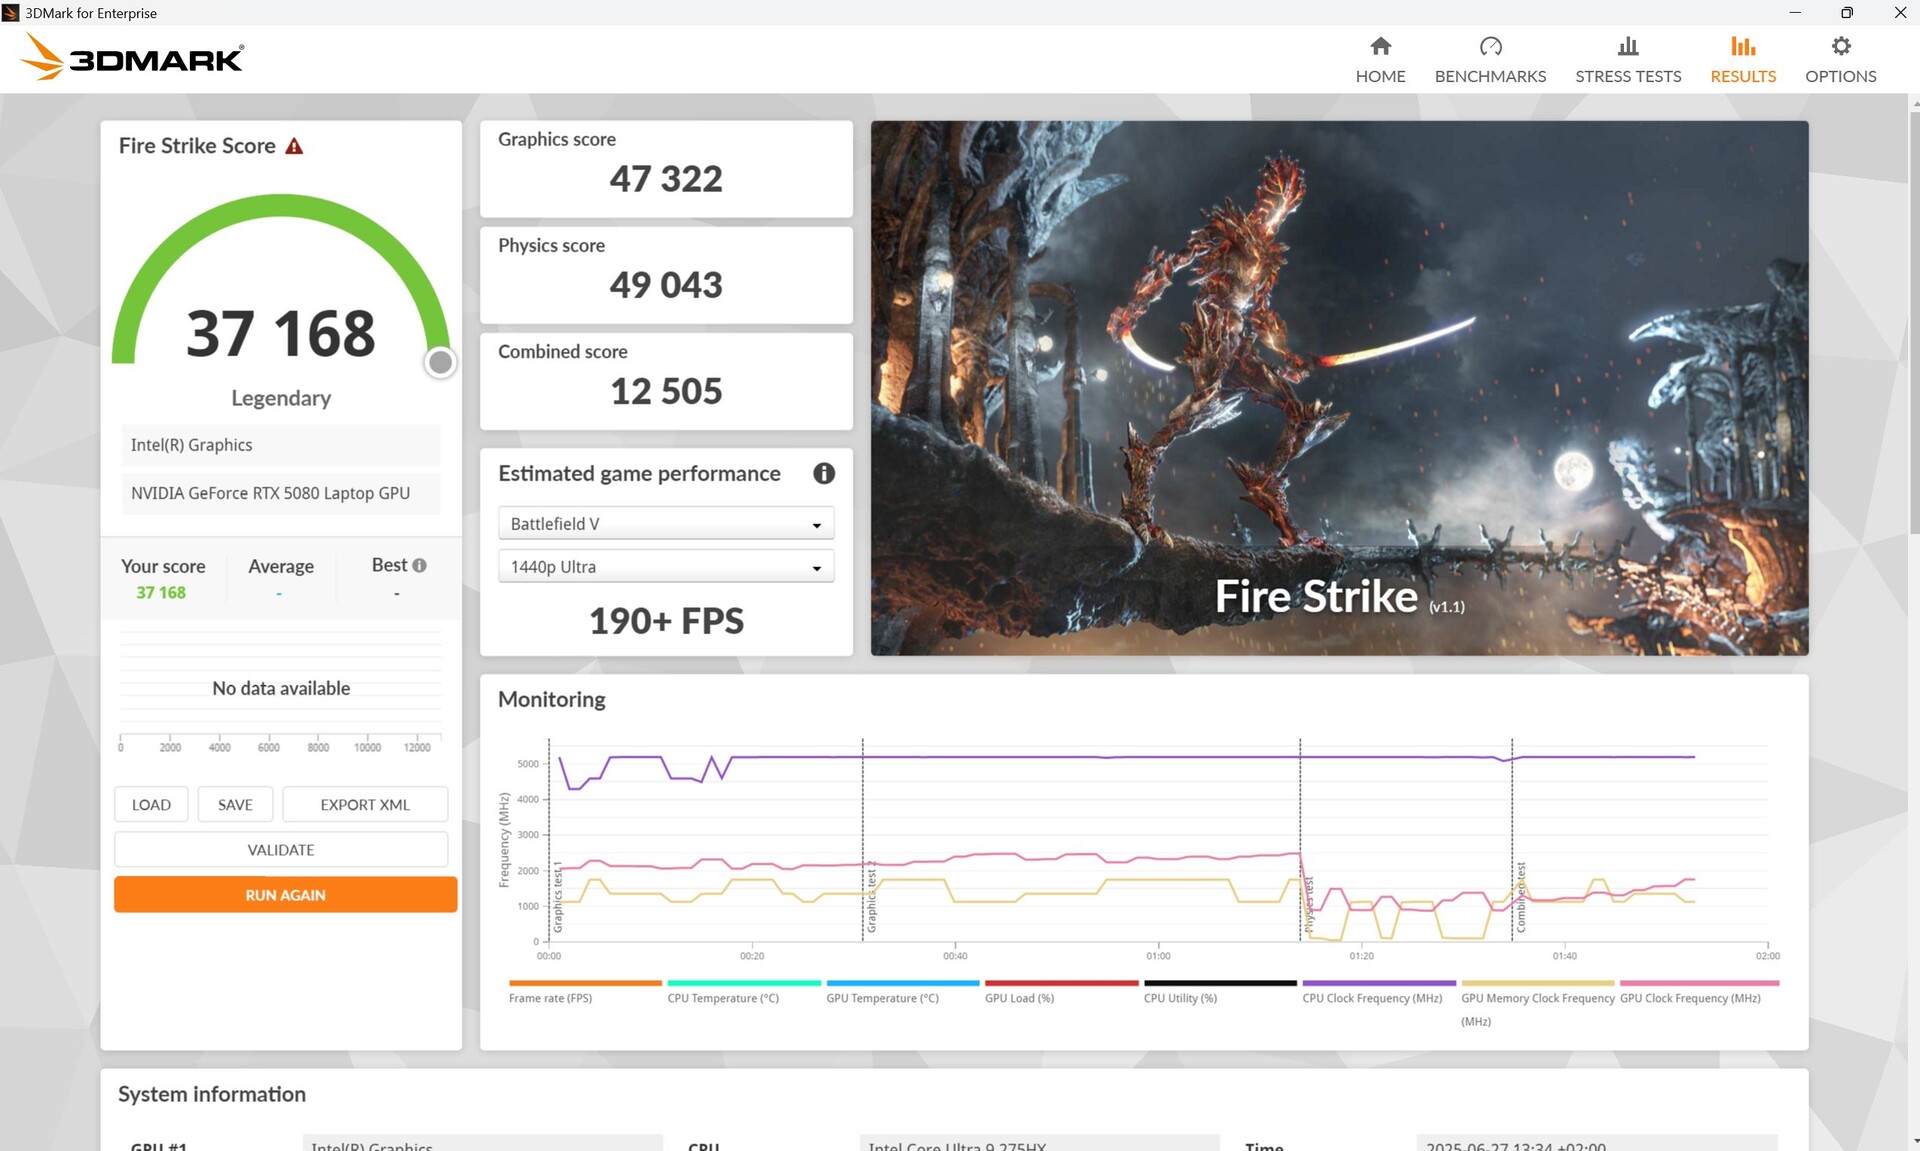
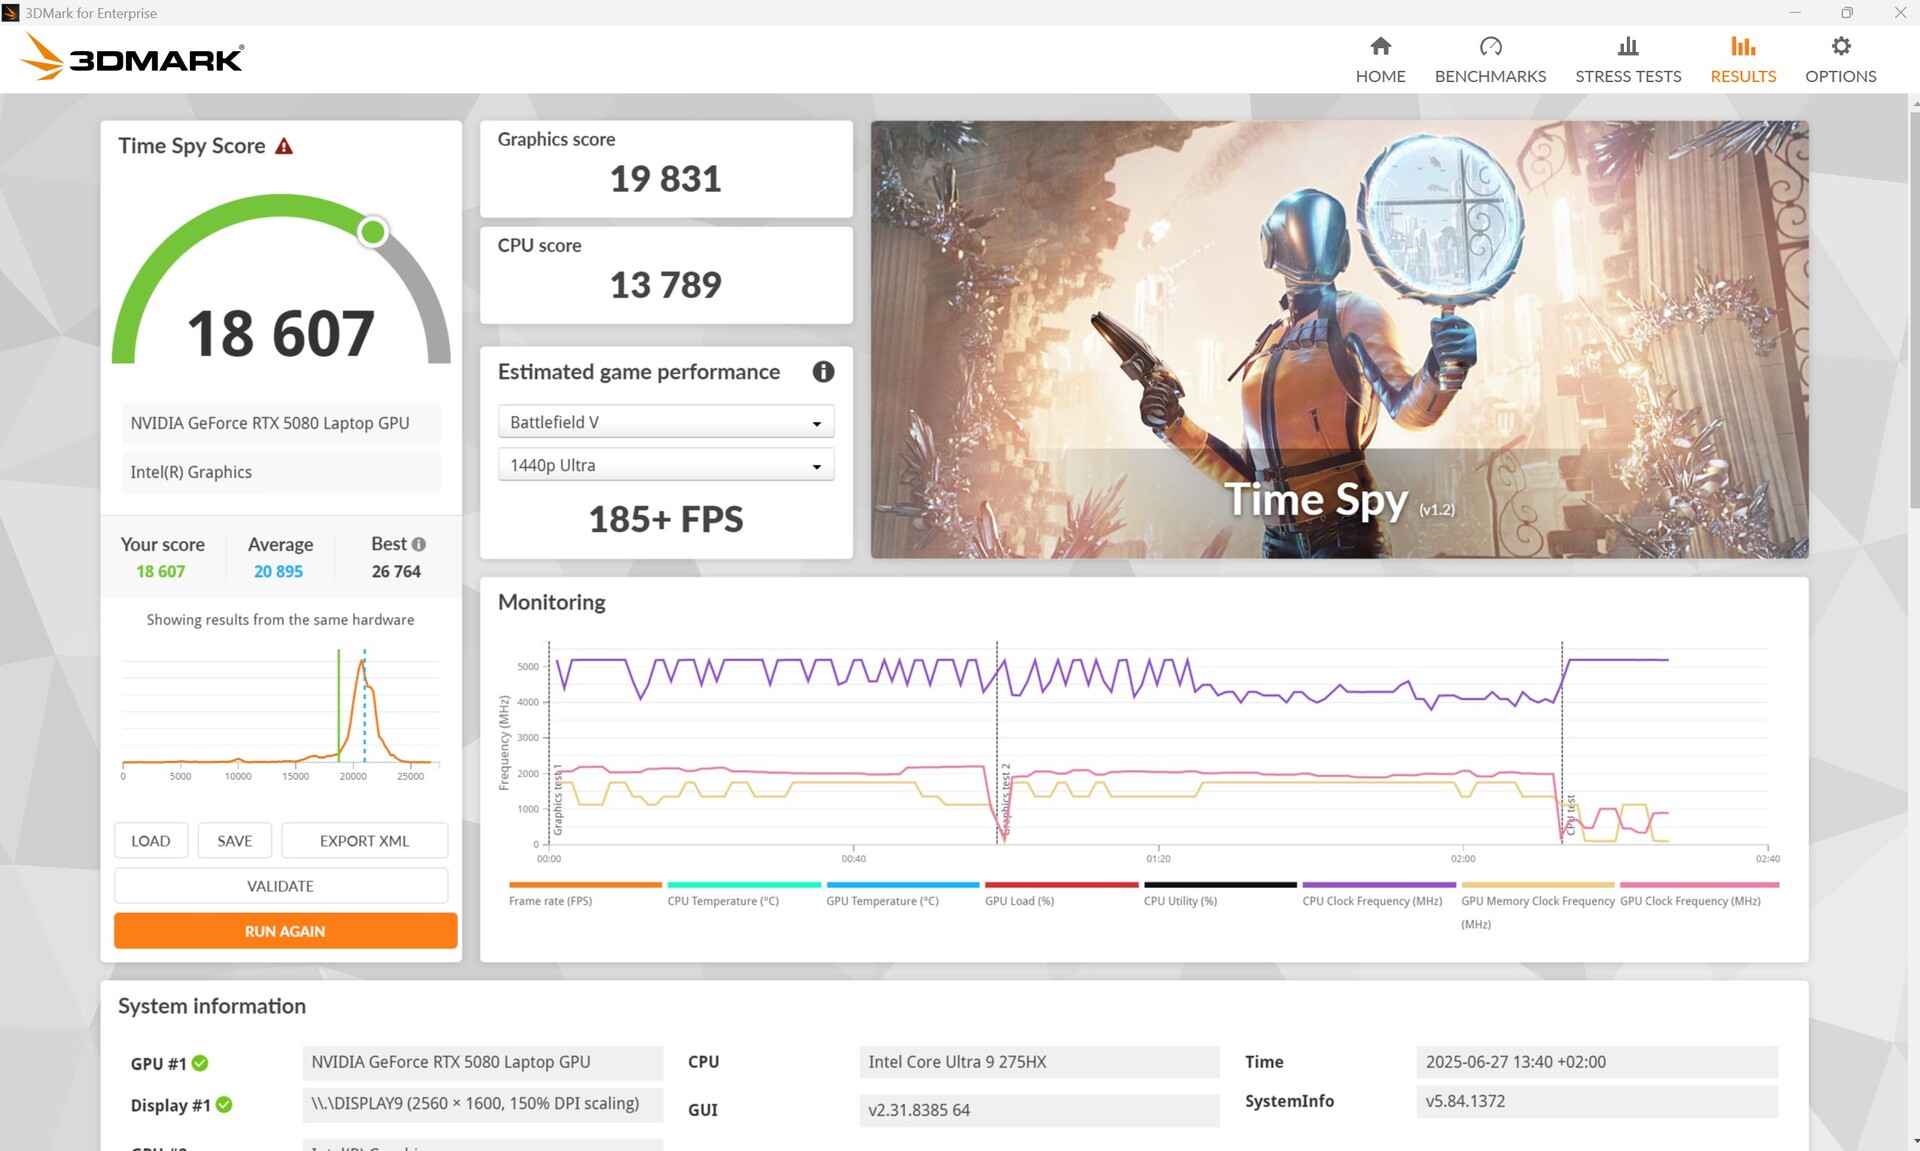
| 3DMark 11 Performance | 45446 points | |
| 3DMark Cloud Gate Standard Score | 72956 points | |
| 3DMark Fire Strike Score | 37168 points | |
| 3DMark Time Spy Score | 18607 points | |
Aide | ||
* ... Moindre est la valeur, meilleures sont les performances
Cyberpunk 2077 Ultra FPS chart
| Bas | Moyen | Élevé | Ultra | QHD DLSS | QHD | 4K DLSS | 4K | |
|---|---|---|---|---|---|---|---|---|
| GTA V (2015) | 185.9 | 184.6 | 181.3 | 146.1 | 143.9 | |||
| Dota 2 Reborn (2015) | 201 | 177.5 | 173.2 | 158.3 | 155.9 | |||
| Final Fantasy XV Benchmark (2018) | 233 | 220 | 176.3 | 144.5 | ||||
| X-Plane 11.11 (2018) | 145.8 | 131.1 | 105.1 | 90.8 | ||||
| Strange Brigade (2018) | 600 | 456 | 406 | 371 | 278 | 148.9 | ||
| Baldur's Gate 3 (2023) | 232 | 206 | 182.4 | 178 | 181 | 123 | 30.6 | |
| Cyberpunk 2077 (2023) | 176.3 | 170.3 | 150.4 | 139.6 | 103.8 | 94.6 | 42 | |
| F1 25 (2025) | 177.7 | 176.1 | 169.9 | 44.3 | 48.7 | 27.3 | 24.8 | 12.8 |
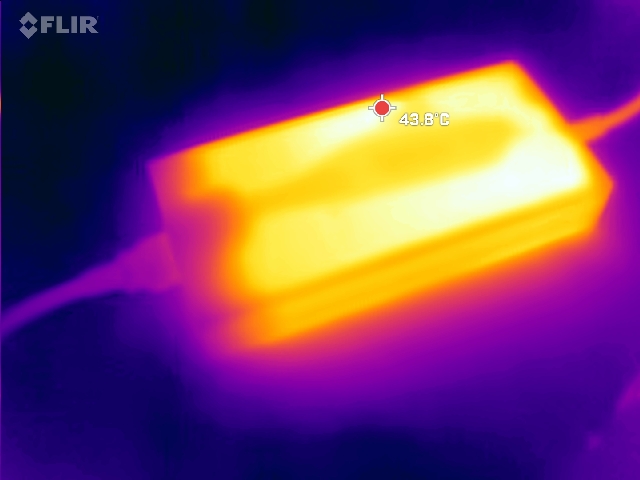
Émissions et énergie - Bloc d'alimentation de 400 W !
Émissions sonores
Les ventilateurs de l'Helios sont déjà perceptibles de temps en temps au ralenti, aussi bien en mode Turbo qu'en mode Performance.
Les 50 dB environ en charge se situent dans la partie inférieure de l'échelle de comparaison, alors qu'il y a des joueurs nettement plus bruyants. En mode Turbo, le niveau sonore atteint 60 dB. Si vous jouez en mode équilibré, plus silencieux, vous devez vous attendre à une baisse des performances 3D d'environ 13 %.
Degré de la nuisance sonore
| Au repos |
| 24 / 24 / 31.31 dB(A) |
| Fortement sollicité |
| 40.31 / 50.33 dB(A) |
 | ||
30 dB silencieux 40 dB(A) audible 50 dB(A) bruyant |
||
min: | ||
| Acer Predator Helios 18 AI GeForce RTX 5080 Laptop, Ultra 9 275HX, SK hynix PCB01 HFS001TFM9X186N | MSI Raider A18 HX A9WIG-080 GeForce RTX 5080 Laptop, R9 9955HX3D, Samsung PM9E1 MZVLC2T0HBLD | Medion Erazer Beast 18 X1 MD62731 GeForce RTX 5080 Laptop, Ultra 9 275HX, Phison E31 2 TB | Asus Strix Scar 18 G835LX GeForce RTX 5090 Laptop, Ultra 9 275HX, WD PC SN8000S 2TB | MSI Titan 18 HX AI A2XWJG GeForce RTX 5090 Laptop, Ultra 9 285HX, 1x Samsung PM9E1 MZVLC2T0HBLD-00BT7 + 2x Samsung PM9A1 MZVL22T0HDLB-00BT7 (RAID 0) | MSI Vector A18 HX A9W GeForce RTX 5070 Ti Laptop, R9 9955HX | |
|---|---|---|---|---|---|---|
| Noise | -7% | -21% | -9% | -12% | -6% | |
| arrêt / environnement * (dB) | 24 | 25.1 -5% | 25 -4% | 23.3 3% | 25.56 -7% | 22.5 6% |
| Idle Minimum * (dB) | 24 | 28.6 -19% | 25 -4% | 29.8 -24% | 27.68 -15% | 26 -8% |
| Idle Average * (dB) | 24 | 28.9 -20% | 39 -63% | 29.8 -24% | 27.68 -15% | 26 -8% |
| Idle Maximum * (dB) | 31.31 | 29.2 7% | 42 -34% | 29.8 5% | 31.54 -1% | 32 -2% |
| Load Average * (dB) | 40.31 | 45.6 -13% | 52 -29% | 42.9 -6% | 44 -9% | 44.4 -10% |
| Cyberpunk 2077 ultra * (dB) | 50.33 | 55.6 -10% | 53 -5% | 53.7 -7% | 58.7 -17% | 49.8 1% |
| Load Maximum * (dB) | 50.33 | 45.8 9% | 55 -9% | 53.7 -7% | 58.9 -17% | 61.6 -22% |
* ... Moindre est la valeur, meilleures sont les performances
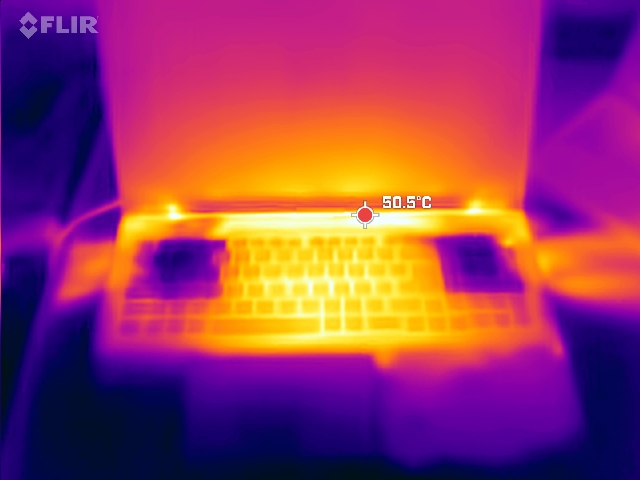
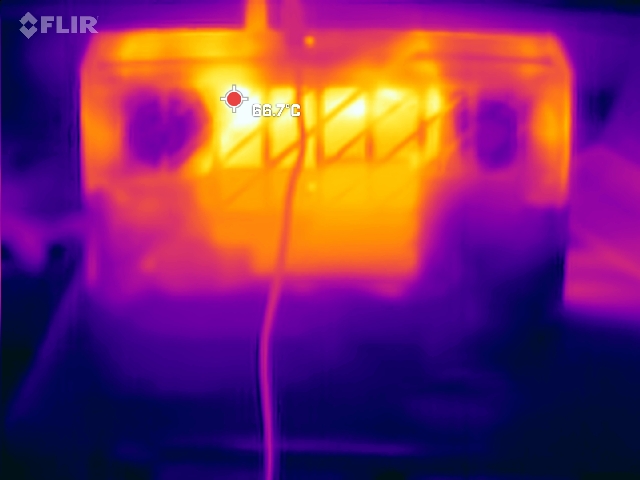
Température
Il devient chaud à pleine charge, surtout en bas, au centre de l'écran (jusqu'à 59 °C). Les touches WASD restent modérément chaudes (39 °C).
(-) La température maximale du côté supérieur est de 48 °C / 118 F, par rapport à la moyenne de 40.4 °C / 105 F, allant de 21.2 à 68.8 °C pour la classe Gaming.
(-) Le fond chauffe jusqu'à un maximum de 59 °C / 138 F, contre une moyenne de 43.2 °C / 110 F
(+) En utilisation inactive, la température moyenne du côté supérieur est de 30.3 °C / 87 F, par rapport à la moyenne du dispositif de 33.9 °C / 93 F.
(-) 3: The average temperature for the upper side is 39.7 °C / 103 F, compared to the average of 33.9 °C / 93 F for the class Gaming.
(+) Les repose-poignets et le pavé tactile atteignent la température maximale de la peau (34 °C / 93.2 F) et ne sont donc pas chauds.
(-) La température moyenne de la zone de l'appui-paume de dispositifs similaires était de 28.8 °C / 83.8 F (-5.2 °C / #-9.4 F).
| Acer Predator Helios 18 AI Intel Core Ultra 9 275HX, NVIDIA GeForce RTX 5080 Laptop | MSI Raider A18 HX A9WIG-080 AMD Ryzen 9 9955HX3D, NVIDIA GeForce RTX 5080 Laptop | Medion Erazer Beast 18 X1 MD62731 Intel Core Ultra 9 275HX, NVIDIA GeForce RTX 5080 Laptop | Asus Strix Scar 18 G835LX Intel Core Ultra 9 275HX, NVIDIA GeForce RTX 5090 Laptop | MSI Titan 18 HX AI A2XWJG Intel Core Ultra 9 285HX, NVIDIA GeForce RTX 5090 Laptop | MSI Vector A18 HX A9W AMD Ryzen 9 9955HX, NVIDIA GeForce RTX 5070 Ti Laptop | Acer Predator Helios 18 PH18-72-98MW Intel Core i9-14900HX, NVIDIA GeForce RTX 4090 Laptop GPU | |
|---|---|---|---|---|---|---|---|
| Heat | 1% | 8% | 13% | -7% | 11% | 3% | |
| Maximum Upper Side * (°C) | 48 | 49.3 -3% | 47 2% | 45.6 5% | 48.2 -0% | 46.6 3% | 43 10% |
| Maximum Bottom * (°C) | 59 | 50.9 14% | 48 19% | 46 22% | 53.6 9% | 45.6 23% | 59 -0% |
| Idle Upper Side * (°C) | 33 | 35.2 -7% | 29 12% | 28.9 12% | 37.2 -13% | 31.2 5% | 32 3% |
| Idle Bottom * (°C) | 33 | 33.5 -2% | 33 -0% | 29.2 12% | 40.4 -22% | 28.6 13% | 34 -3% |
* ... Moindre est la valeur, meilleures sont les performances
Intervenants
Le système à 6 haut-parleurs (selon Acer) joue assez fort, a des aigus équilibrés et, au moins, n'a pas la phobie des basses comme de nombreux collègues.
Un port pour casque d'écoute au format jack est disponible pour connecter des écouteurs et des appareils similaires.
Acer Predator Helios 18 AI analyse audio
(+) | les haut-parleurs peuvent jouer relativement fort (87.6# dB)
Basses 100 - 315 Hz
(±) | basse réduite - en moyenne 9.5% inférieure à la médiane
(±) | la linéarité des basses est moyenne (8.6% delta à la fréquence précédente)
Médiums 400 - 2000 Hz
(±) | médiane supérieure - en moyenne 9.1% supérieure à la médiane
(±) | la linéarité des médiums est moyenne (8.3% delta à la fréquence précédente)
Aiguës 2 - 16 kHz
(+) | des sommets équilibrés - à seulement 1.9% de la médiane
(+) | les aigus sont linéaires (3.8% delta à la fréquence précédente)
Globalement 100 - 16 000 Hz
(+) | le son global est linéaire (13.1% différence à la médiane)
Par rapport à la même classe
» 18% de tous les appareils testés de cette catégorie étaient meilleurs, 4% similaires, 78% pires
» Le meilleur avait un delta de 6%, la moyenne était de 18%, le pire était de 132%.
Par rapport à tous les appareils testés
» 13% de tous les appareils testés étaient meilleurs, 3% similaires, 84% pires
» Le meilleur avait un delta de 4%, la moyenne était de 23%, le pire était de 134%.
MSI Raider A18 HX A9WIG-080 analyse audio
(+) | les haut-parleurs peuvent jouer relativement fort (85.9# dB)
Basses 100 - 315 Hz
(-) | presque aucune basse - en moyenne 17.1% plus bas que la médiane
(±) | la linéarité des basses est moyenne (8.5% delta à la fréquence précédente)
Médiums 400 - 2000 Hz
(±) | médiane supérieure - en moyenne 9.4% supérieure à la médiane
(±) | la linéarité des médiums est moyenne (9.1% delta à la fréquence précédente)
Aiguës 2 - 16 kHz
(+) | des sommets équilibrés - à seulement 3.8% de la médiane
(+) | les aigus sont linéaires (5.8% delta à la fréquence précédente)
Globalement 100 - 16 000 Hz
(±) | la linéarité du son global est moyenne (18.9% de différence avec la médiane)
Par rapport à la même classe
» 63% de tous les appareils testés de cette catégorie étaient meilleurs, 8% similaires, 29% pires
» Le meilleur avait un delta de 6%, la moyenne était de 18%, le pire était de 132%.
Par rapport à tous les appareils testés
» 44% de tous les appareils testés étaient meilleurs, 8% similaires, 48% pires
» Le meilleur avait un delta de 4%, la moyenne était de 23%, le pire était de 134%.
Consommation électrique
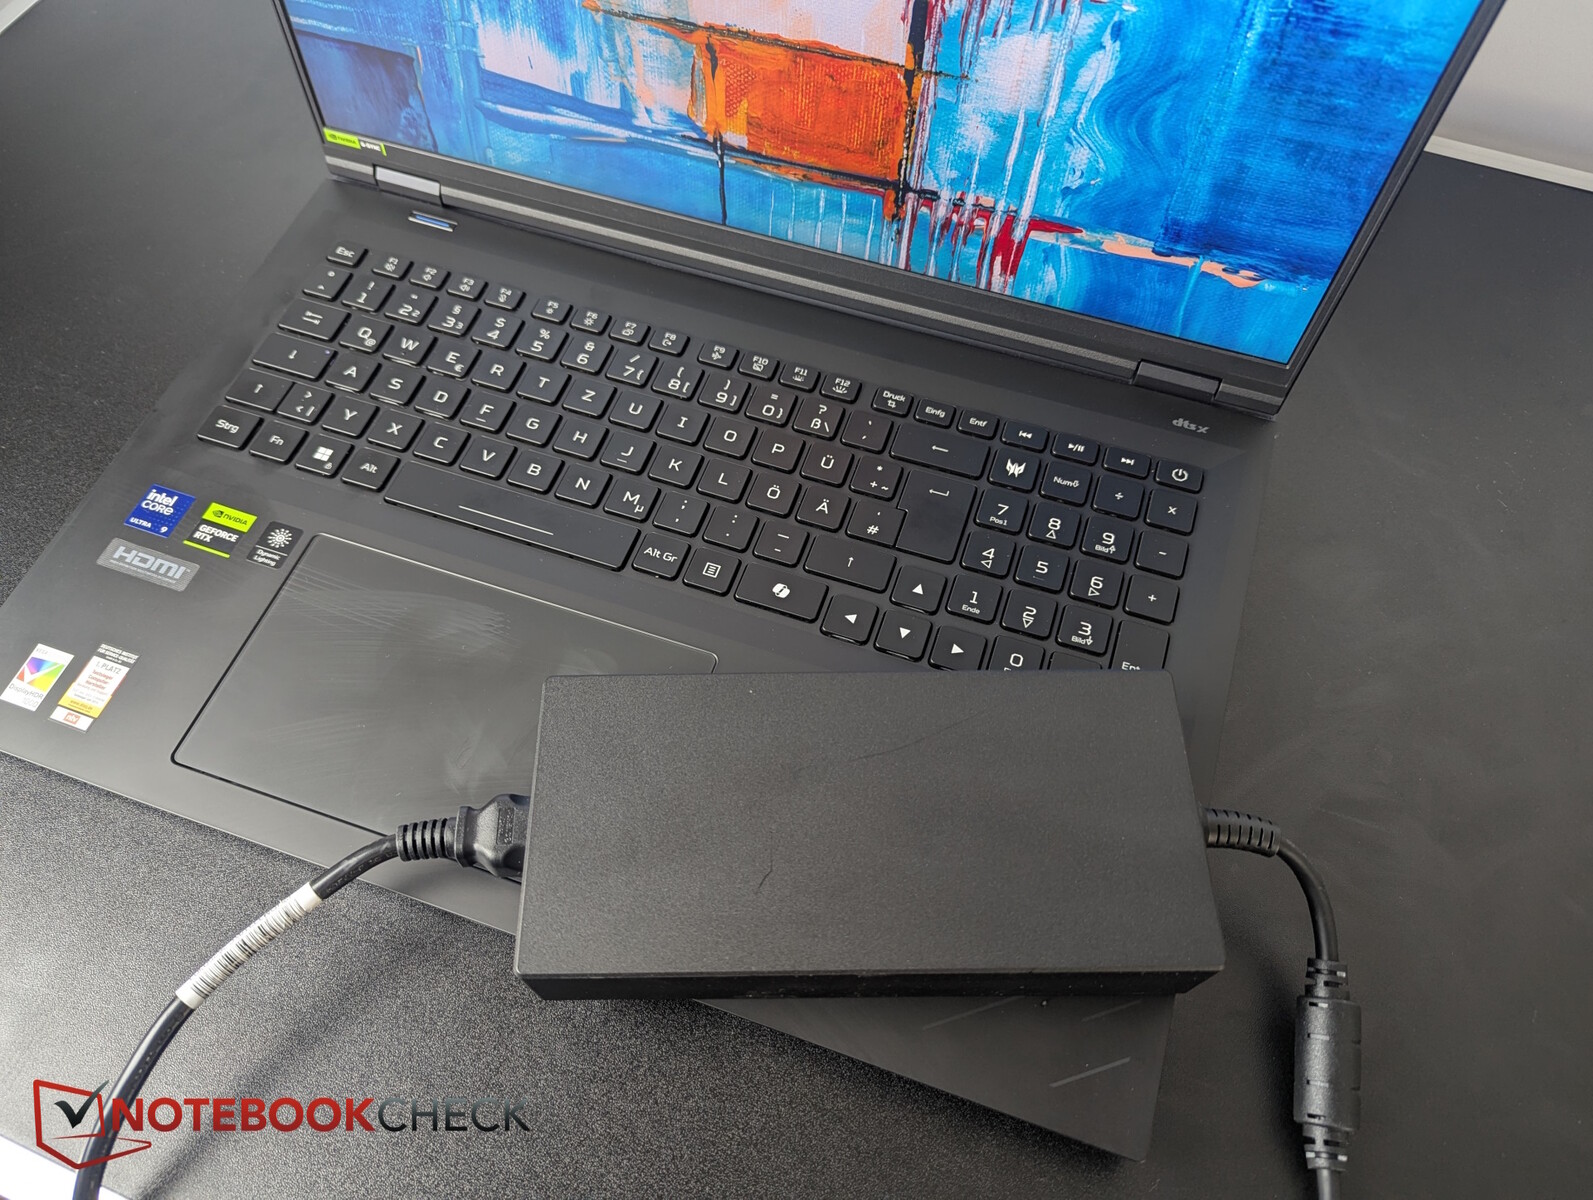
Dans les jeux, la consommation de 245 W est plutôt modérée en comparaison, mais il y a des pics de charge temporaires particulièrement élevés, jusqu'à 375 W, que le grand bloc d'alimentation de 400 W peut gérer.
Le dGPU est actif avec un écran externe (TB).
| Éteint/en veille | |
| Au repos | |
| Fortement sollicité |
|
Légende:
min: | |
| Acer Predator Helios 18 AI Ultra 9 275HX, GeForce RTX 5080 Laptop, SK hynix PCB01 HFS001TFM9X186N, IPS, 2560x1600, 18" | MSI Raider A18 HX A9WIG-080 R9 9955HX3D, GeForce RTX 5080 Laptop, Samsung PM9E1 MZVLC2T0HBLD, MiniLED IPS, 3840x2400, 18" | Medion Erazer Beast 18 X1 MD62731 Ultra 9 275HX, GeForce RTX 5080 Laptop, Phison E31 2 TB, IPS, 2560x1600, 18" | Asus Strix Scar 18 G835LX Ultra 9 275HX, GeForce RTX 5090 Laptop, WD PC SN8000S 2TB, Mini-LED, 2560x1600, 18" | MSI Titan 18 HX AI A2XWJG Ultra 9 285HX, GeForce RTX 5090 Laptop, 1x Samsung PM9E1 MZVLC2T0HBLD-00BT7 + 2x Samsung PM9A1 MZVL22T0HDLB-00BT7 (RAID 0), Mini-LED, 3840x2160, 18" | MSI Vector A18 HX A9W R9 9955HX, GeForce RTX 5070 Ti Laptop, , IPS, 2560x1600, 18" | Moyenne NVIDIA GeForce RTX 5080 Laptop | Moyenne de la classe Gaming | |
|---|---|---|---|---|---|---|---|---|
| Power Consumption | -65% | 20% | -27% | -19% | -42% | -6% | 18% | |
| Idle Minimum * (Watt) | 17.3 | 41.5 -140% | 7.9 54% | 11.4 34% | 19.01 -10% | 20.8 -20% | 19.1 ? -10% | 13 ? 25% |
| Idle Average * (Watt) | 23 | 53.5 -133% | 11.5 50% | 39.2 -70% | 30.92 -34% | 52.8 -130% | 25.3 ? -10% | 18.6 ? 19% |
| Idle Maximum * (Watt) | 25.3 | 53.8 -113% | 16.6 34% | 40.2 -59% | 33.84 -34% | 54.5 -115% | 30.4 ? -20% | 24.2 ? 4% |
| Load Average * (Watt) | 123 | 168.5 -37% | 130 -6% | 161.2 -31% | 105.4 14% | 146.6 -19% | 128.5 ? -4% | 109.2 ? 11% |
| Cyberpunk 2077 ultra * (Watt) | 244 | 298 -22% | 253 -4% | 303 -24% | 343 -41% | 285 -17% | ||
| Cyberpunk 2077 ultra external monitor * (Watt) | 243 | 295 -21% | 245 -1% | 295 -21% | 330 -36% | 278 -14% | ||
| Load Maximum * (Watt) | 375 | 323.7 14% | 330 12% | 430.9 -15% | 354 6% | 297.3 21% | 314 ? 16% | 256 ? 32% |
* ... Moindre est la valeur, meilleures sont les performances
Power consumption Cyberpunk / Stress test
Power consumption with the external monitor
Durée de vie de la batterie
L'ample batterie de 99 Wh offre une autonomie de 4,5 à 5 heures en mode Wi-Fi et vidéo avec la luminosité réduite, ce qui est moyen en comparaison.
| Acer Predator Helios 18 AI Ultra 9 275HX, GeForce RTX 5080 Laptop, 99 Wh | MSI Raider A18 HX A9WIG-080 R9 9955HX3D, GeForce RTX 5080 Laptop, 99 Wh | Medion Erazer Beast 18 X1 MD62731 Ultra 9 275HX, GeForce RTX 5080 Laptop, 99 Wh | Asus Strix Scar 18 G835LX Ultra 9 275HX, GeForce RTX 5090 Laptop, 90 Wh | MSI Titan 18 HX AI A2XWJG Ultra 9 285HX, GeForce RTX 5090 Laptop, 99 Wh | MSI Vector A18 HX A9W R9 9955HX, GeForce RTX 5070 Ti Laptop, 99 Wh | Acer Predator Helios 18 PH18-72-98MW i9-14900HX, GeForce RTX 4090 Laptop GPU, 90 Wh | Moyenne de la classe Gaming | |
|---|---|---|---|---|---|---|---|---|
| Autonomie de la batterie | -42% | 61% | 9% | -14% | -22% | -31% | 49% | |
| H.264 (h) | 4.3 | 5.8 35% | 3 -30% | 8.64 ? 101% | ||||
| WiFi v1.3 (h) | 4.9 | 2.1 -57% | 7.9 61% | 5.5 12% | 4.3 -12% | 3.8 -22% | 3.2 -35% | 7.11 ? 45% |
| Load (h) | 1.5 | 1.1 -27% | 1.2 -20% | 1.5 0% | 1.1 -27% | 1.502 ? 0% | ||
| Cyberpunk 2077 ultra 150cd (h) | 0.7 | 1.2 | ||||||
| Reader / Idle (h) | 7 | 8.71 ? |
Notebookcheck note globale
L'Helios 18 AI est un excellent gamer avec un bon écran, de bonnes caractéristiques et un grand potentiel d'évolution.
Acer Predator Helios 18 AI
- 07/04/2025 v8
Christian Hintze
 Total Sustainability Score:
 Comparaison des alternatives possibles
Transparency
La sélection des appareils à examiner est effectuée par notre équipe éditoriale. L'échantillon de test a été prêté à l'auteur par le fabricant ou le détaillant pour les besoins de cet examen. Le prêteur n'a pas eu d'influence sur cette évaluation et le fabricant n'a pas reçu de copie de cette évaluation avant sa publication. Il n'y avait aucune obligation de publier cet article. En tant que média indépendant, Notebookcheck n'est pas soumis à l'autorité des fabricants, des détaillants ou des éditeurs.
Voici comment Notebookcheck teste
Chaque année, Notebookcheck examine de manière indépendante des centaines d'ordinateurs portables et de smartphones en utilisant des procédures standardisées afin de garantir que tous les résultats sont comparables. Nous avons continuellement développé nos méthodes de test depuis environ 20 ans et avons établi des normes industrielles dans le processus. Dans nos laboratoires de test, des équipements de mesure de haute qualité sont utilisés par des techniciens et des rédacteurs expérimentés. Ces tests impliquent un processus de validation en plusieurs étapes. Notre système d'évaluation complexe repose sur des centaines de mesures et de points de référence bien fondés, ce qui garantit l'objectivité.