Critiques du Intel Core i9-14900HX processeur
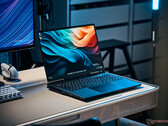
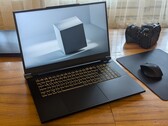
Test de l'Acer Predator Helios 16 (PH16-72) : prédateur aux dents acérées et aux pattes silencieuses
Un matériel haut de gamme, un mini-écran LED brillant et un refroidissement efficace font de l'Acer Predator Helios 16 un véritable rêve pour les joueurs. En réalité, le prédateur parmi les ordinateurs portables de jeu est silencieux. Néanmoins, notre examen révèle que les nombreux avantages de l'ordinateur portable vont de pair avec certains compromis.
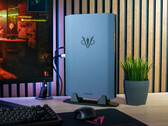
Intel Core i9-14900HX, NVIDIA GeForce RTX 4080 Laptop GPU, 16", 2.7 kgTest du Minisforum AtomMan G7 Ti : PC portable de jeu sans écran, alternative peu encombrante au PC de bureau
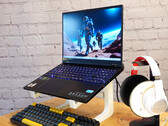
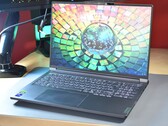
Le Minisforum AtomMan G7 Ti promet des performances de bureau dans un format compact. Équipé du puissant Intel Core i9-14900HX et du GPU portable Nvidia GeForce RTX 4070, il s'adresse aux joueurs, aux créatifs et aux professionnels qui ont besoin d'un maximum de performances dans un minimum d'espace. Dans ce test, nous examinons de près ce mini PC et vérifions s'il répond aux attentes élevées qu'il suscite.
Intel Core i9-14900HX, NVIDIA GeForce RTX 4070 Laptop GPU, 2.6 kgTest du XMG Neo 17 E24 : PC portable de jeu rapide avec refroidissement à eau en option
Avec le XMG Neo 17, vous obtenez un gamer pur-sang qui peut être équipé des composants les plus rapides du marché. Un clavier mécanique Cherry et un système de refroidissement externe à l'eau sont également disponibles en option, ce qui réduit non seulement les températures mais aussi le bruit de fond.
Intel Core i9-14900HX, NVIDIA GeForce RTX 4080 Laptop GPU, 17", 2.9 kgTest du Schenker Key 17 Pro (M24) : 2 Thunderbolt 5 ultra-rapides et puissance i9-14900HX
Le Schenker KEY 17 Pro est l'une des premières stations de travail mobiles haut de gamme à remplacer les ordinateurs de bureau et à disposer de deux ports Thunderbolt 5. Il intègre des composants de pointe, notamment un processeur Intel i9-14900HX mis à niveau, complété par la RTX 4090 de Nvidia, ainsi que la connectivité Wi-Fi 7 la plus rapide.
Intel Core i9-14900HX, NVIDIA GeForce RTX 4090 Laptop GPU, 17.3", 3.4 kgTest du Lenovo ThinkBook 16p Gen 5 : Le Lenovo Legion caché pour les créatifs
Le Lenovo ThinkBook 16p Gen 5 IRX est le modèle le plus puissant de la série d'ordinateurs portables ThinkBook pour PME. Doté d'un écran à large gamme de couleurs, de l'i9 le plus puissant pour les ordinateurs portables et de la Nvidia GeForce RTX 4060, il cible le marché des créateurs et du multimédia. Mais il n'y a pas que les créateurs qui peuvent être séduits : le ThinkBook est également prêt pour les jeux.
Intel Core i9-14900HX, NVIDIA GeForce RTX 4060 Laptop GPU, 16", 2.2 kgMSI Raider 18 HX A14V: NVIDIA GeForce RTX 4080 Laptop GPU, 18.00", 3.6 kg
Critique » Test du MSI Raider 18 HX A14V : les performances d'un Titan, le prix en moins
Nubia RedMagic Titan 16 Pro: NVIDIA GeForce RTX 4060 Laptop GPU, 16.00", 2.4 kg
Critique » Test du RedMagic Titan 16 Pro : PC portable de jeu conçu par un fabricant de smartphones
HP ZBook Fury 16 G11: NVIDIA RTX 3500 Ada Generation Laptop, 16.00", 2.6 kg
Critique » Test du HP ZBook Fury 16 G11 : les débuts de la Nvidia RTX 3500 Ada
Schenker XMG Pro 16 Studio (Mid 24): NVIDIA GeForce RTX 4070 Laptop GPU, 16.00", 2.3 kg
Critique » Test du XMG Pro 16 Studio (mi-2024) : Core i9 et RTX 4070 pour joueurs et créatifs
Lenovo Legion 9 16IRX9, RTX 4090: NVIDIA GeForce RTX 4090 Laptop GPU, 16.00", 2.5 kg
Critique » Test du Lenovo Legion 9 16IRX9 (Legion 9i) : RTX 4090 gamer haut-de-gamme ?
Schenker XMG Neo 16 (Early 24): NVIDIA GeForce RTX 4090 Laptop GPU, 16.00", 2.5 kg
Critique » Test du XMG Neo 16 (début 2024) : la puissance de la RTX 4090 dans un PC portable de jeu compact
Razer Blade 18 2024 RZ09-0509: NVIDIA GeForce RTX 4090 Laptop GPU, 18.00", 3.1 kg
Critique » Test du Razer Blade 18 2024 : 1er PC portable du marché avec mini-LED et Thunderbolt 5
Schenker XMG Fusion 15 (Early 24): NVIDIA GeForce RTX 4070 Laptop GPU, 15.30", 2.1 kg
Critique » Test du XMG Fusion 15 (début 2024) : PC portable RTX 4070 compact pour joueurs et créatifs
Asus ROG Strix Scar 16 G634JZR: NVIDIA GeForce RTX 4080 Laptop GPU, 16.00", 2.7 kg
Critique » Test de l'Asus ROG Strix Scar 16 (2024) : performances fulgurantes et mini-LED à un prix défiant toute concurrence
Lenovo Legion 7 16 IRX G9: NVIDIA GeForce RTX 4070 Laptop GPU, 16.00", 2.3 kg
Critique » Test du Lenovo Legion 7 16 G9 : du jeu avec écran 3,2K, processeur HX et RTX 4070 overclockée
Aorus 16X 2024: NVIDIA GeForce RTX 4070 Laptop GPU, 16.00", 2.3 kg
Critique » Test de l'Aorus 16X (2024) : Core i9 et RTX 4070 pour 2 000 $US
Lenovo Legion Pro 5 16IRX9: NVIDIA GeForce RTX 4070 Laptop GPU, 16.00", 2.5 kg
Critique » Test du Lenovo Legion Pro 5 16IRX9 : de bonnes performances, mais un peu lourd
Lenovo Legion Pro 7 16IRX9H: NVIDIA GeForce RTX 4080 Laptop GPU, 16.00", 2.7 kg
Critique » Test du Lenovo Legion Pro 7 16 (2024) : la crème de la crème des PC portables RTX 4080
Alienware m18 R2: NVIDIA GeForce RTX 4090 Laptop GPU, 18.00", 4 kg
Critique » Test de l'Alienware m18 R2 : passer du Core i9-13980HX au Core i9-14900HX
Eurocom Raptor X17 Core i9-14900HX: NVIDIA GeForce RTX 4090 Laptop GPU, 17.30", 3.4 kg
Critique » Test de l'Eurocom Raptor X17 Core i9-14900HX : GPU 175 W pour des performances maximales
Acer Predator Helios 18 PH18-72-98MW: NVIDIA GeForce RTX 4090 Laptop GPU, 18.00", 3.3 kg
Critique » Test de l'Acer Predator Helios 18 2024 : une nouvelle machine 18 pouces pour les joueurs
Medion Erazer Beast X40 2024: NVIDIA GeForce RTX 4090 Laptop GPU, 17.00", 2.9 kg
Critique » Test du Medion Erazer Beast X40 (2024) : gaming haut de gamme avec RTX 4090 et clavier mécanique
HP Omen 16 (2024): NVIDIA GeForce RTX 4080 Laptop GPU, 16.10", 2.4 kg
Critique » Test du HP Omen 16 (2024) : PC portable de jeu QHD avec Core i9 et RTX 4080 pour 3 200 €
Razer Blade 16 2024, RTX 4090: NVIDIA GeForce RTX 4090 Laptop GPU, 16.00", 2.5 kg
Critique » Test du Razer Blade 16 (2024) : maintenant doté d'un écran OLED Samsung ultra-rapide
HP Omen Transcend 16-u1095ng: NVIDIA GeForce RTX 4070 Laptop GPU, 16.00", 2.3 kg
Critique » Test du HP Omen Transcend 16 (2024) : machine de jeu RTX 4070 avec écran OLED
Asus ROG Strix Scar 18 G834JYR (2024): NVIDIA GeForce RTX 4090 Laptop GPU, 18.00", 3.1 kg
Critique » Test de l'Asus ROG Strix Scar 18 (2024) : PC portable de jeu avec RTX 4090 et mini-LED
MSI Vector 16 HX A14V: NVIDIA GeForce RTX 4080 Laptop GPU, 16.00", 2.7 kg
Critique » Test du MSI Vector 16 HX : les performances d'un Titan sans le prix d'un Titan
MSI Titan 18 HX A14VIG: NVIDIA GeForce RTX 4090 Laptop GPU, 18.00", 3.6 kg
Critique » Test du MSI Titan 18 HX A14VIG : l'année du dragon
Schenker XMG Neo 17 2024 Engineering Sample: NVIDIA GeForce RTX 4090 Laptop GPU
Critique » Test de l'Intel Raptor Lake-HX Refresh : Core i9-14900HX avec plus de performances à cœur unique
HP Omen 16-am0000ng: NVIDIA GeForce RTX 5060 Laptop, 16.00", 2.4 kg
Autres tests » HP Omen 16-am0000ng
MSI Katana 15 HX B14WGK: NVIDIA GeForce RTX 5070 Laptop, 15.60", 2.4 kg
Autres tests » MSI Katana 15 HX B14WGK
Lenovo Legion 5 15IRX10: NVIDIA GeForce RTX 5070 Laptop, 15.10", 1.9 kg
Autres tests » Lenovo Legion 5 15IRX10
Acer Predator Helios 16 PH16-72, RTX 4070: NVIDIA GeForce RTX 4070, 16.00", 2.7 kg
Autres tests » Acer Predator Helios 16 PH16-72, RTX 4070
Origin PC EON17-X 2024: NVIDIA GeForce RTX 4090 Laptop GPU, 17.30", 3.4 kg
Autres tests » Origin PC EON17-X 2024
Asus ROG Strix G18 G814JZR: NVIDIA GeForce RTX 4080 Laptop GPU, 18.00", 3 kg
Autres tests » Asus ROG Strix G18 G814JZR
Lenovo Legion 5 16IRX9, i9-14900HX: NVIDIA GeForce RTX 4060 Laptop GPU, 16.00", 2.3 kg
Autres tests » Lenovo Legion 5 16IRX9, i9-14900HX
MSI Raider GE78 HX 14VIG: NVIDIA GeForce RTX 4090 Laptop GPU, 17.00", 3.1 kg
Autres tests » MSI Raider GE78 HX 14VIG
Origin PC Eon16-X: NVIDIA GeForce RTX 4090 Laptop GPU, 16.00", 2.5 kg
Autres tests » Origin PC Eon16-X
HP ZBook Fury 16 G11: NVIDIA RTX 3500 Ada Generation Laptop, 16.00", 2.6 kg
Autres tests » HP ZBook Fury 16 G11
Lenovo ThinkBook 16p G5 IRX 21N50011GE: NVIDIA GeForce RTX 4060 Laptop GPU, 16.00", 2.2 kg
Autres tests » Lenovo ThinkBook 16p G5 IRX 21N50011GE
HP Omen 16-wf1: NVIDIA GeForce RTX 4060 Laptop GPU, 16.10", 2.4 kg
Autres tests » HP Omen 16-wf1
Aorus 17X AXG: NVIDIA GeForce RTX 4080 Laptop GPU, 17.30", 2.8 kg
Autres tests » Aorus 17X AXG
Nubia RedMagic Titan 16 Pro: NVIDIA GeForce RTX 4060 Laptop GPU, 16.00", 2.4 kg
Autres tests » Nubia RedMagic Titan 16 Pro
MSI Creator M16 HX C14VGG: NVIDIA GeForce RTX 4070 Laptop GPU, 16.00", 2.4 kg
Autres tests » MSI Creator M16 HX C14VGG
MSI Raider 18 HX A14V: NVIDIA GeForce RTX 4080 Laptop GPU, 18.00", 3.6 kg
Autres tests » MSI Raider 18 HX A14V
Lenovo Legion Pro 7 16IRX9H, RTX 4090: NVIDIA GeForce RTX 4090 Laptop GPU, 16.00", 2.6 kg
Autres tests » Lenovo Legion Pro 7 16IRX9H, RTX 4090
Schenker XMG Neo 16 (Early 24): NVIDIA GeForce RTX 4090 Laptop GPU, 16.00", 2.5 kg
Autres tests » SCHENKER XMG Neo 16 (Early 24)
Schenker XMG Fusion 15 (Early 24): NVIDIA GeForce RTX 4070 Laptop GPU, 15.30", 2.1 kg
Autres tests » SCHENKER XMG Fusion 15 (Early 24)
Medion Erazer Beast X40 2024, RTX 4070: NVIDIA GeForce RTX 4070 Laptop GPU, 17.00", 2.9 kg
Autres tests » Medion Erazer Beast X40 2024, RTX 4070
Acer Predator Helios 18 PH18-72: NVIDIA GeForce RTX 4080 Laptop GPU, 18.00", 3.3 kg
Autres tests » Acer Predator Helios 18 PH18-72
Lenovo Legion Pro 5 16IRX9, i9-14900HX RTX 4060: NVIDIA GeForce RTX 4060 Laptop GPU, 16.00", 2.5 kg
Autres tests » Lenovo Legion Pro 5 16IRX9, i9-14900HX RTX 4060
MSI Vector 16 HX A14V: NVIDIA GeForce RTX 4080 Laptop GPU, 16.00", 2.7 kg
Autres tests » MSI Vector 16 HX A14V
MSI Sword 16 HX B14VFKG, i9-14900HX: NVIDIA GeForce RTX 4060 Laptop GPU, 16.00", 2.3 kg
Autres tests » MSI Sword 16 HX B14VFKG, i9-14900HX
Asus ROG Strix G16 G614JZR: NVIDIA GeForce RTX 4070 Laptop GPU, 16.00", 2.8 kg
Autres tests » Asus ROG Strix G16 G614JZR
Asus ROG Strix G18 G814JIR: NVIDIA GeForce RTX 4070 Laptop GPU, 18.00", 3 kg
Autres tests » Asus ROG Strix G18 G814JIR
Acer Predator Helios Neo 16 PHN16-72, RTX 4060: NVIDIA GeForce RTX 4060 Laptop GPU, 16.00", 2.5 kg
Autres tests » Acer Predator Helios Neo 16 PHN16-72, RTX 4060
Asus ROG Strix G16 G614JIR: NVIDIA GeForce RTX 4070 Laptop GPU, 16.00", 2.8 kg
Autres tests » Asus ROG Strix G16 G614JIR
Acer Predator Helios 16 PH16-72: NVIDIA GeForce RTX 4080 Laptop GPU, 16.00", 2.7 kg
Autres tests » Acer Predator Helios 16 PH16-72
Lenovo Legion 7 16IRX9, i9-14900HX: NVIDIA GeForce RTX 4070 Laptop GPU, 16.00", 2.2 kg
Autres tests » Lenovo Legion 7 16IRX9, i9-14900HX
MSI Raider GE78 HX 14VHG: NVIDIA GeForce RTX 4080 Laptop GPU, 17.30", 3.1 kg
Autres tests » MSI Raider GE78 HX 14VHG
Razer Blade 18 2024 RZ09-0509: NVIDIA GeForce RTX 4090 Laptop GPU, 18.00", 3.1 kg
Autres tests » Razer Blade 18 2024 RZ09-0509
MSI Raider GE68 HX 14VHG: NVIDIA GeForce RTX 4080 Laptop GPU, 17.30", 3.1 kg
Autres tests » MSI Raider GE68 HX 14VHG
Aorus 17X AZG: NVIDIA GeForce RTX 4090 Laptop GPU, 17.30", 2.8 kg
Autres tests » Aorus 17X AZG
MSI Raider GE68 HX 14VIG: NVIDIA GeForce RTX 4090 Laptop GPU, 16.00", 2.8 kg
Autres tests » MSI Raider GE68 HX 14VIG
Asus ROG Strix Scar 16 G634JYR, RTX 4080: NVIDIA GeForce RTX 4080 Laptop GPU, 16.00", 2.7 kg
Autres tests » Asus ROG Strix Scar 16 G634JYR, RTX 4080
HP Omen 16 (2024): NVIDIA GeForce RTX 4080 Laptop GPU, 16.10", 2.4 kg
Autres tests » HP Omen 16 (2024)
Lenovo Legion 9 16IRX9: NVIDIA GeForce RTX 4090 Laptop GPU, 16.00", 2.6 kg
Autres tests » Lenovo Legion 9 16IRX9
HP Omen Transcend 16-u1095ng: NVIDIA GeForce RTX 4070 Laptop GPU, 16.00", 2.3 kg
Autres tests » HP Omen Transcend 16-u1095ng
MSI Vector 17 HX A14VGG: NVIDIA GeForce RTX 4070 Laptop GPU, 17.30", 3 kg
Autres tests » MSI Vector 17 HX A14VGG
Xiaomi Redmi G Pro 2024: NVIDIA GeForce RTX 4060 Laptop GPU, 16.00", 2.7 kg
Autres tests » Xiaomi Redmi G Pro 2024
Lenovo Legion Pro 7 16IRX9H: NVIDIA GeForce RTX 4080 Laptop GPU, 16.00", 2.7 kg
Autres tests » Lenovo Legion Pro 7 16IRX9H
Aorus 16X 2024: NVIDIA GeForce RTX 4070 Laptop GPU, 16.00", 2.3 kg
Autres tests » Aorus 16X 2024
Lenovo Legion Pro 5 16IRX9: NVIDIA GeForce RTX 4070 Laptop GPU, 16.00", 2.5 kg
Autres tests » Lenovo Legion Pro 5 16IRX9
Alienware m18 R2: NVIDIA GeForce RTX 4090 Laptop GPU, 18.00", 4 kg
Autres tests » Alienware m18 R2
Acer Predator Helios Neo 16 PHN16-72, i9-14900HX: NVIDIA GeForce RTX 4070, 18.00", 3.4 kg
Autres tests » Acer Predator Helios Neo 16 PHN16-72, i9-14900HX
Asus ROG Strix Scar 16 G634JYR: NVIDIA GeForce RTX 4090 Laptop GPU, 16.00", 2.7 kg
Autres tests » Asus ROG Strix Scar 16 G634JYR
Razer Blade 16 2024, RTX 4090: NVIDIA GeForce RTX 4090 Laptop GPU, 16.00", 2.5 kg
Autres tests » Razer Blade 16 2024, RTX 4090
Acer Predator Helios Neo 18 PHN18-71: NVIDIA GeForce RTX 4070 Laptop GPU, 18.00", 3.4 kg
Autres tests » Acer Predator Helios Neo 18 PHN18-71
Asus ROG Strix Scar 18 G834JYR (2024): NVIDIA GeForce RTX 4090 Laptop GPU, 18.00", 3.1 kg
Autres tests » Asus ROG Strix Scar 18 G834JYR (2024)
MSI Titan 18 HX A14VIG: NVIDIA GeForce RTX 4090 Laptop GPU, 18.00", 3.6 kg
Autres tests » MSI Titan 18 HX A14VIG
Acer Predator Helios 18 PH18-72-98MW: NVIDIA GeForce RTX 4090 Laptop GPU, 18.00", 3.3 kg
Autres tests » Acer Predator Helios 18 PH18-72-98MW
Medion Erazer Beast X40 2024: NVIDIA GeForce RTX 4090 Laptop GPU, 17.00", 2.9 kg
Autres tests » Medion Erazer Beast X40 2024
Schenker Key 17 Pro (M24): NVIDIA GeForce RTX 4090 Laptop GPU, 17.30", 3.4 kg
» Station de travail Schenker Key 17 Pro M24 : double ordinateur portable de jeu haut de gamme, doté de deux Thunderbolt 5