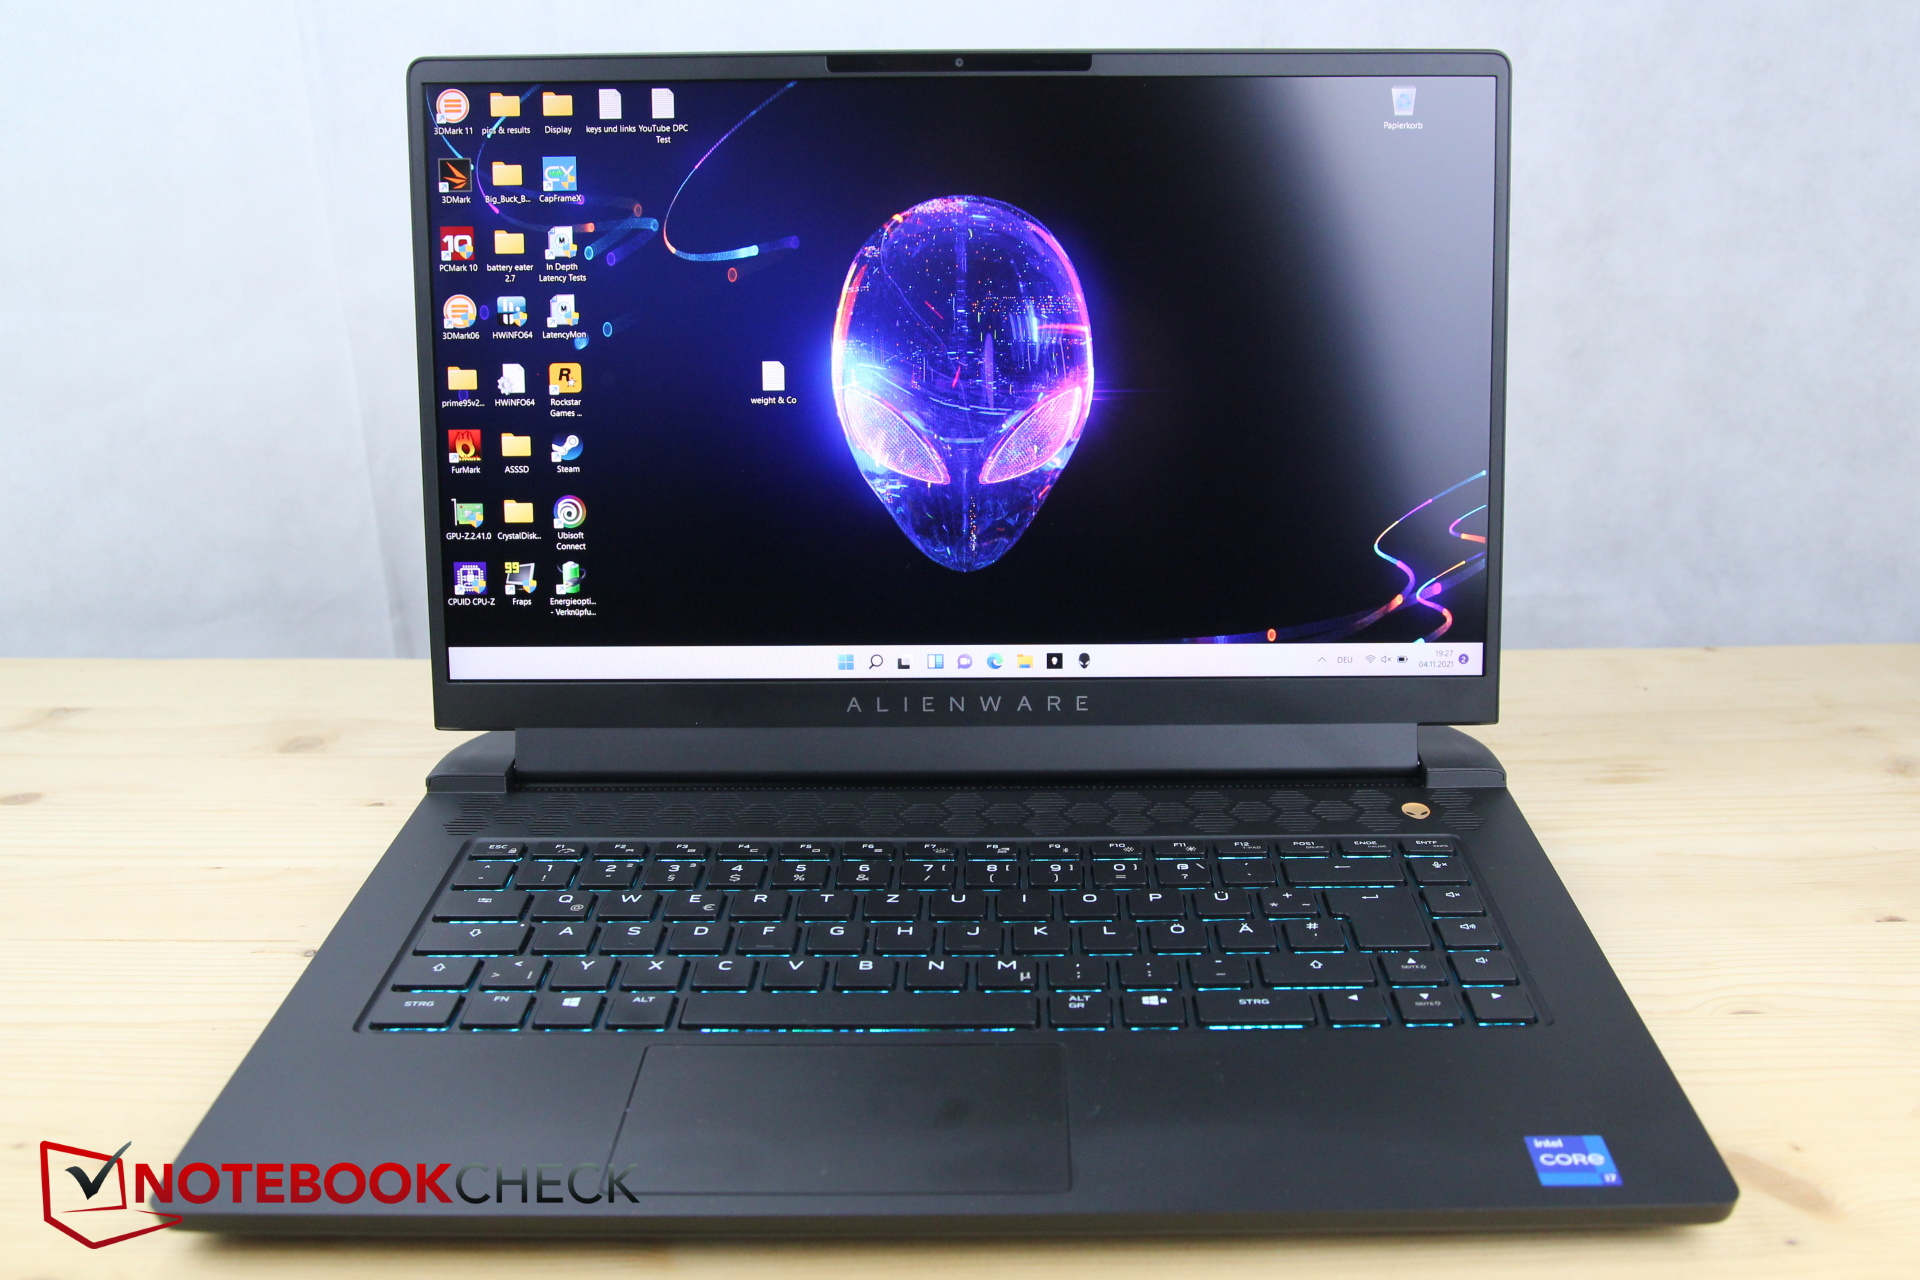
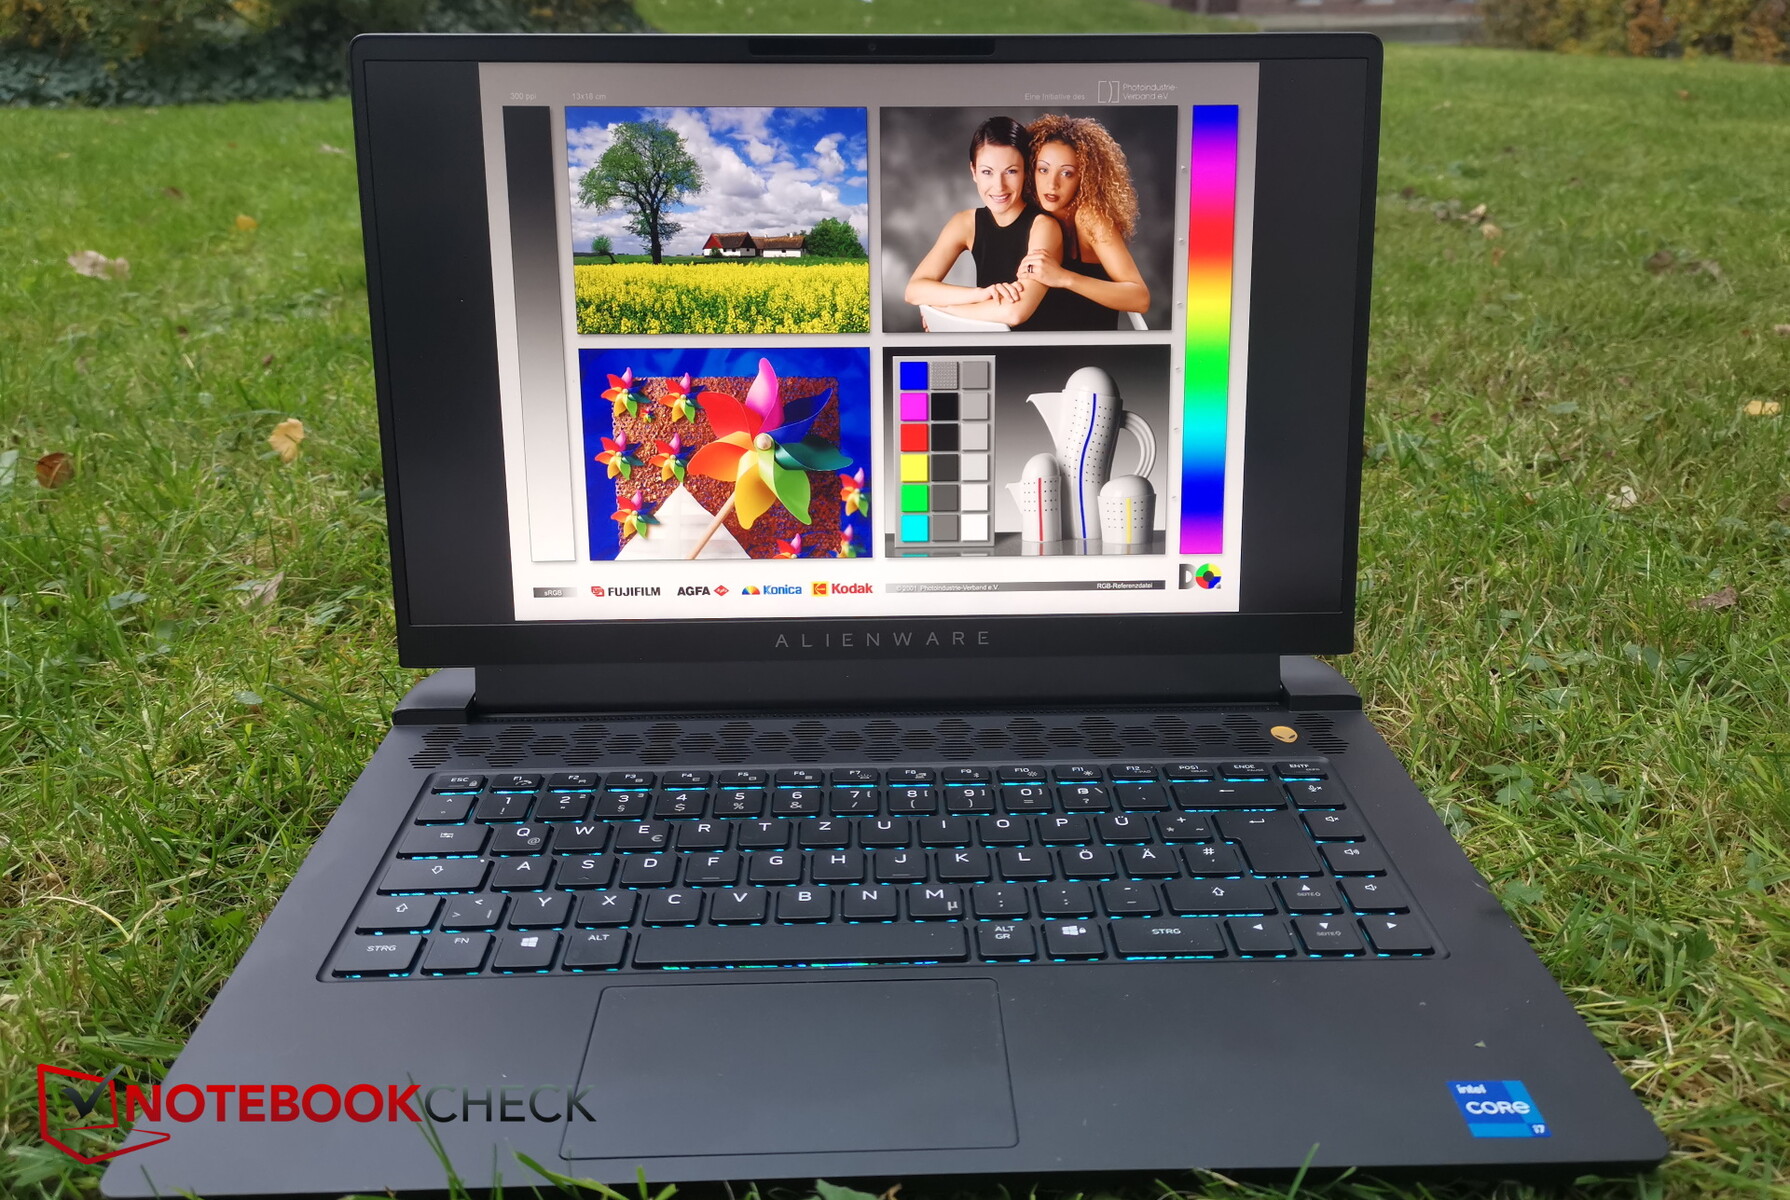
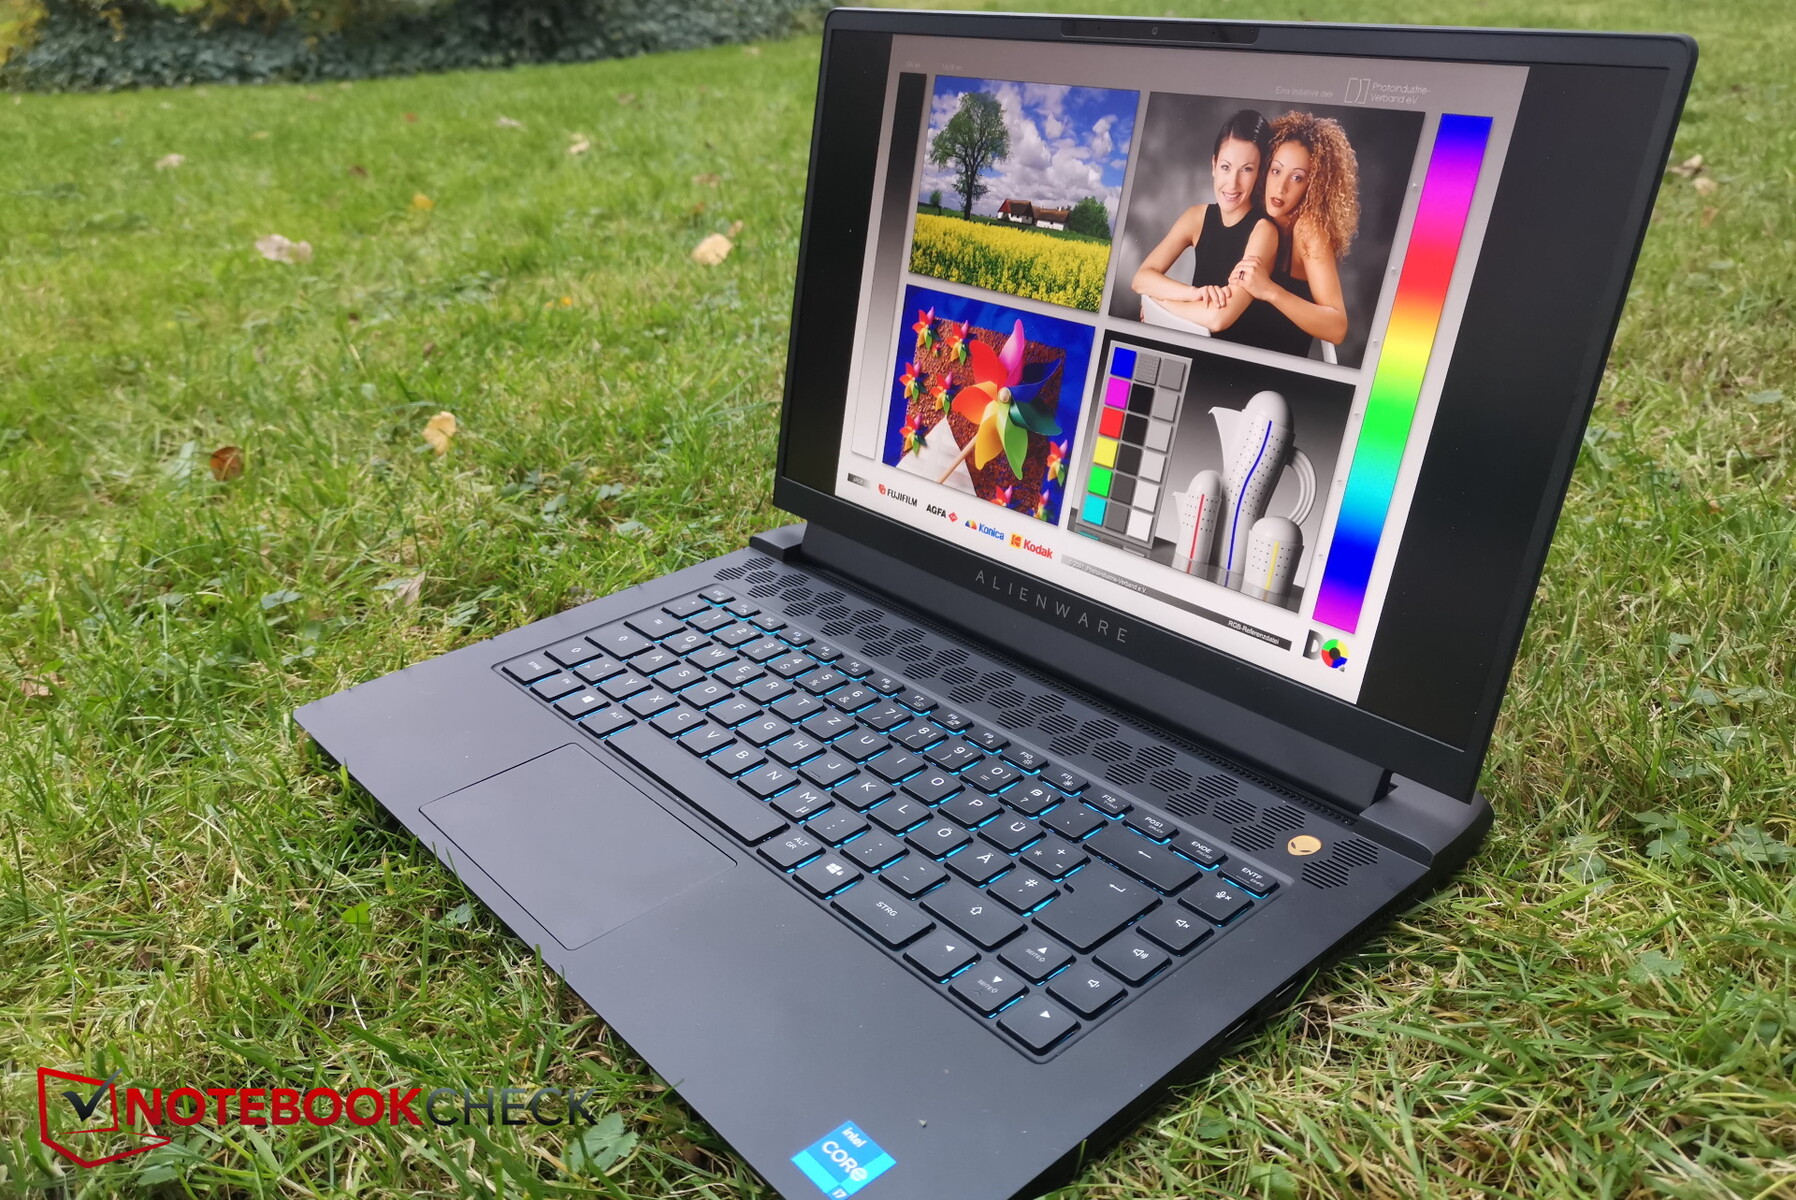
Test de l'Alienware m15 R6 : plus efficace, mais RTX 3080 plus lente qu'avec le prédécesseur
Il est assez surprenant de constater le nombre de modèles du m15 que Dell a présenté en si peu de temps. Nous avons déjà testé le m15 R4, le m15 R5, et maintenant le m15 R6 - tous ces modèles ont été lancés cette année.
Ce qui est déroutant, c'est que puisque le R6 contient maintenant un CPU Tiger Lake, il est vraiment un successeur du R4 avec le CPU Comet Lake et plus un frère du R5 avec le processeur AMD. Le boîtier et de nombreuses autres caractéristiques correspondent au m15 R5, c'est la raison pour laquelle nous ne parlerons pas des caractéristiques du boîtier, des périphériques d'entrée, du matériel de connexion, etc. sauf s'il y a des changements. Vous pouvez trouver des informations sur ces domaines dans notre revue de l'Alienware m15 R5.
Bien entendu, nous comparons également l'Intel m15 R6 avec l'AMD m15 R5 AMD m15 R5et le m15 R4, prédécesseur de Comet Lakeet en plus avec le Aorus 15P YDleModèle Razer Blade 15 proet le Schenker XMG Neo 15
Possible competitors in Comparison
Note | Date | Modèle | Poids | Épaisseur | Taille | Résolution | Prix |
|---|---|---|---|---|---|---|---|
| 86.1 % v7 (old) | 11/21 | Alienware m15 R6, i7-11800H RTX 3080 i7-11800H, GeForce RTX 3080 Laptop GPU | 2.5 kg | 22.85 mm | 15.60" | 1920x1080 | |
| 84.7 % v7 (old) | 06/21 | Alienware m15 R5 Ryzen Edition R7 5800H, GeForce RTX 3060 Laptop GPU | 2.5 kg | 22.85 mm | 15.60" | 1920x1080 | |
| 86.1 % v7 (old) | 06/21 | Alienware m15 R4 RTX 3080 i9-10980HK, GeForce RTX 3080 Laptop GPU | 2.4 kg | 20 mm | 15.60" | 1920x1080 | |
| 86.4 % v7 (old) | 06/21 | Aorus 15P YD i7-11800H, GeForce RTX 3080 Laptop GPU | 2.2 kg | 27 mm | 15.60" | 1920x1080 | |
| 87 % v7 (old) | 06/21 | Schenker XMG Neo 15 Tiger Lake i7-11800H, GeForce RTX 3080 Laptop GPU | 2.2 kg | 26 mm | 15.60" | 2560x1440 | |
| 88.9 % v7 (old) | 07/21 | Razer Blade 15 Advanced (Mid 2021) i7-11800H, GeForce RTX 3080 Laptop GPU | 2 kg | 16.99 mm | 15.60" | 1920x1080 |
Cas - Design bien connu
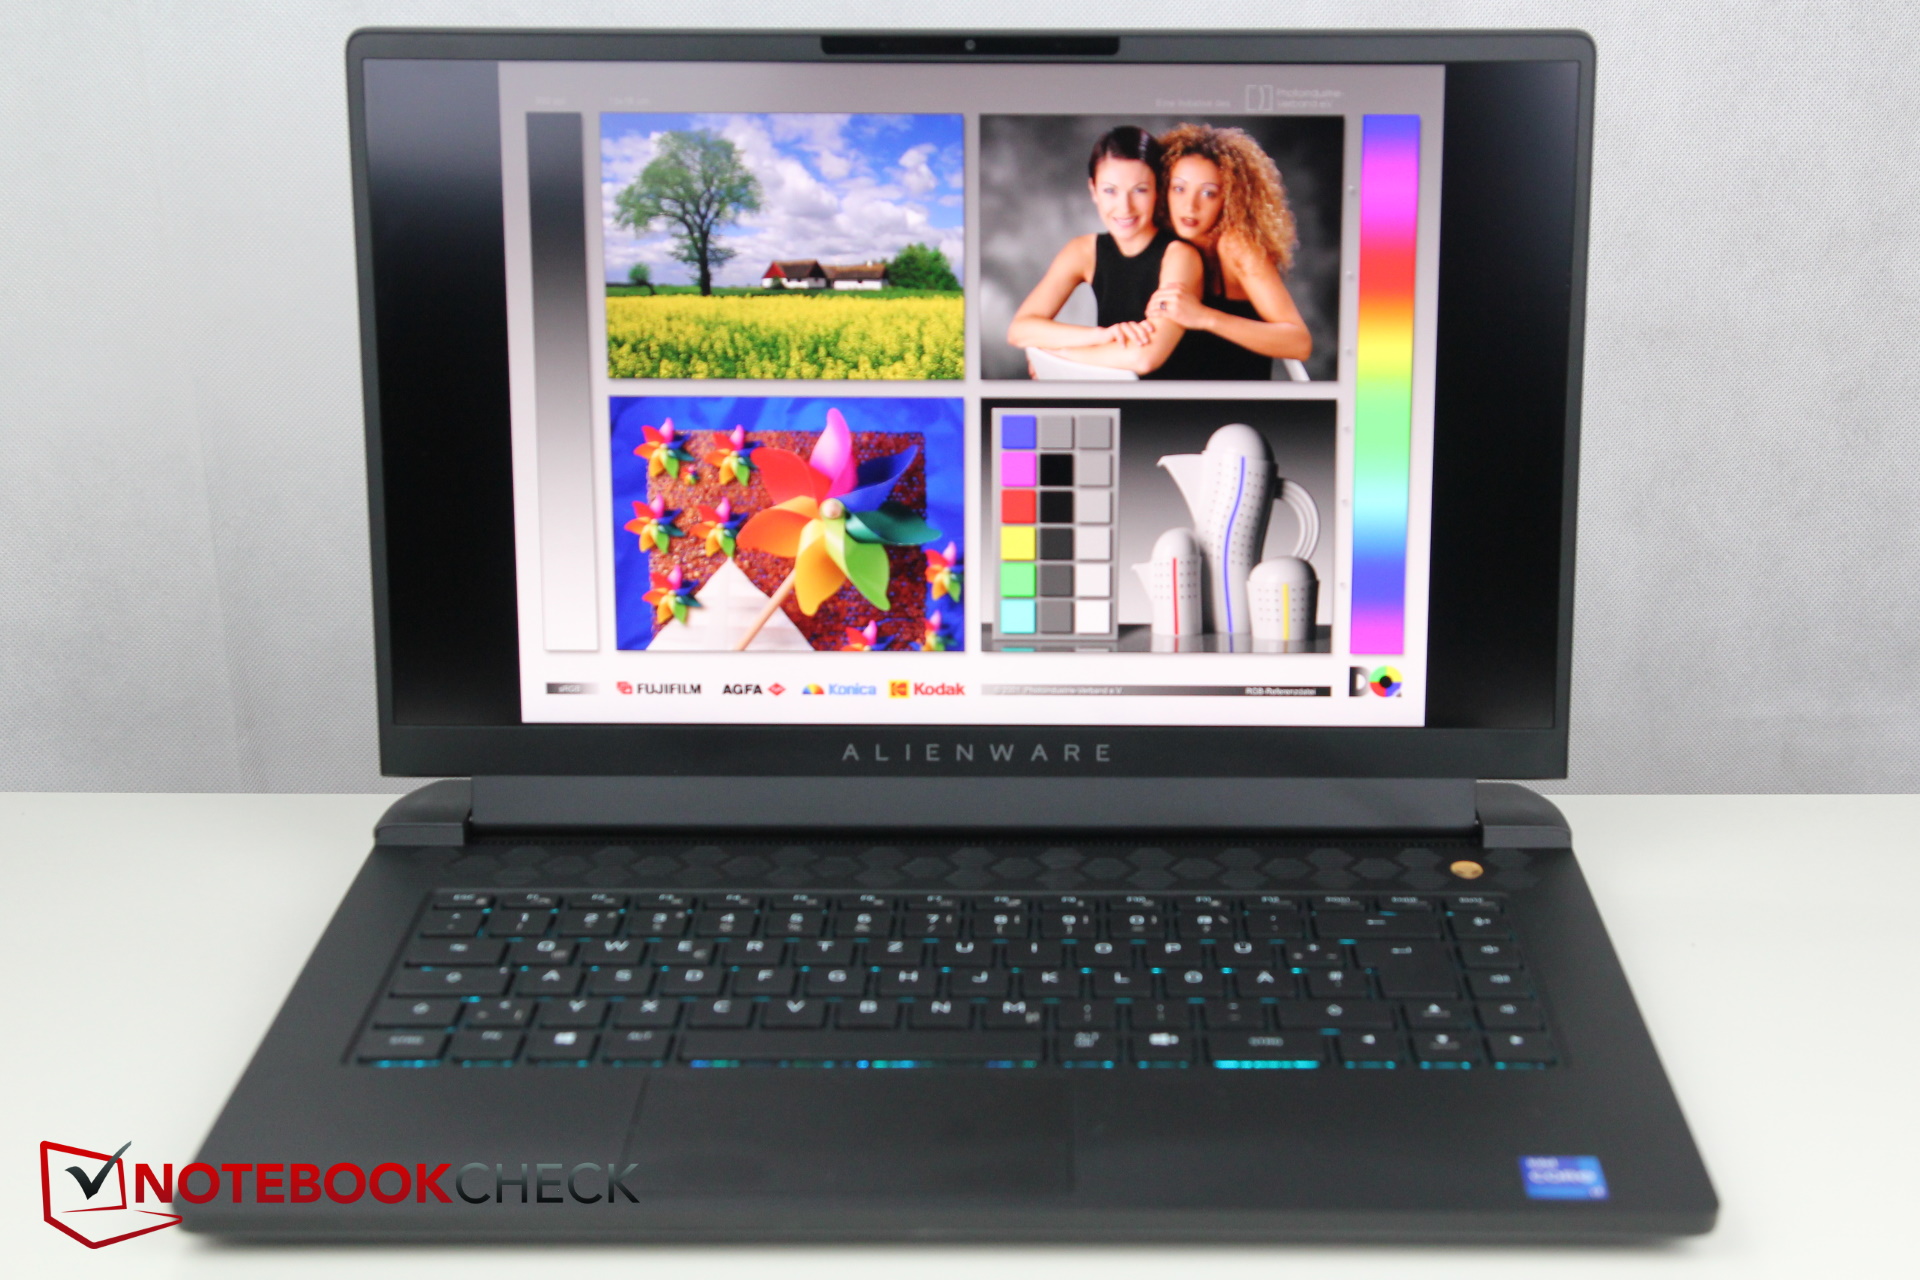
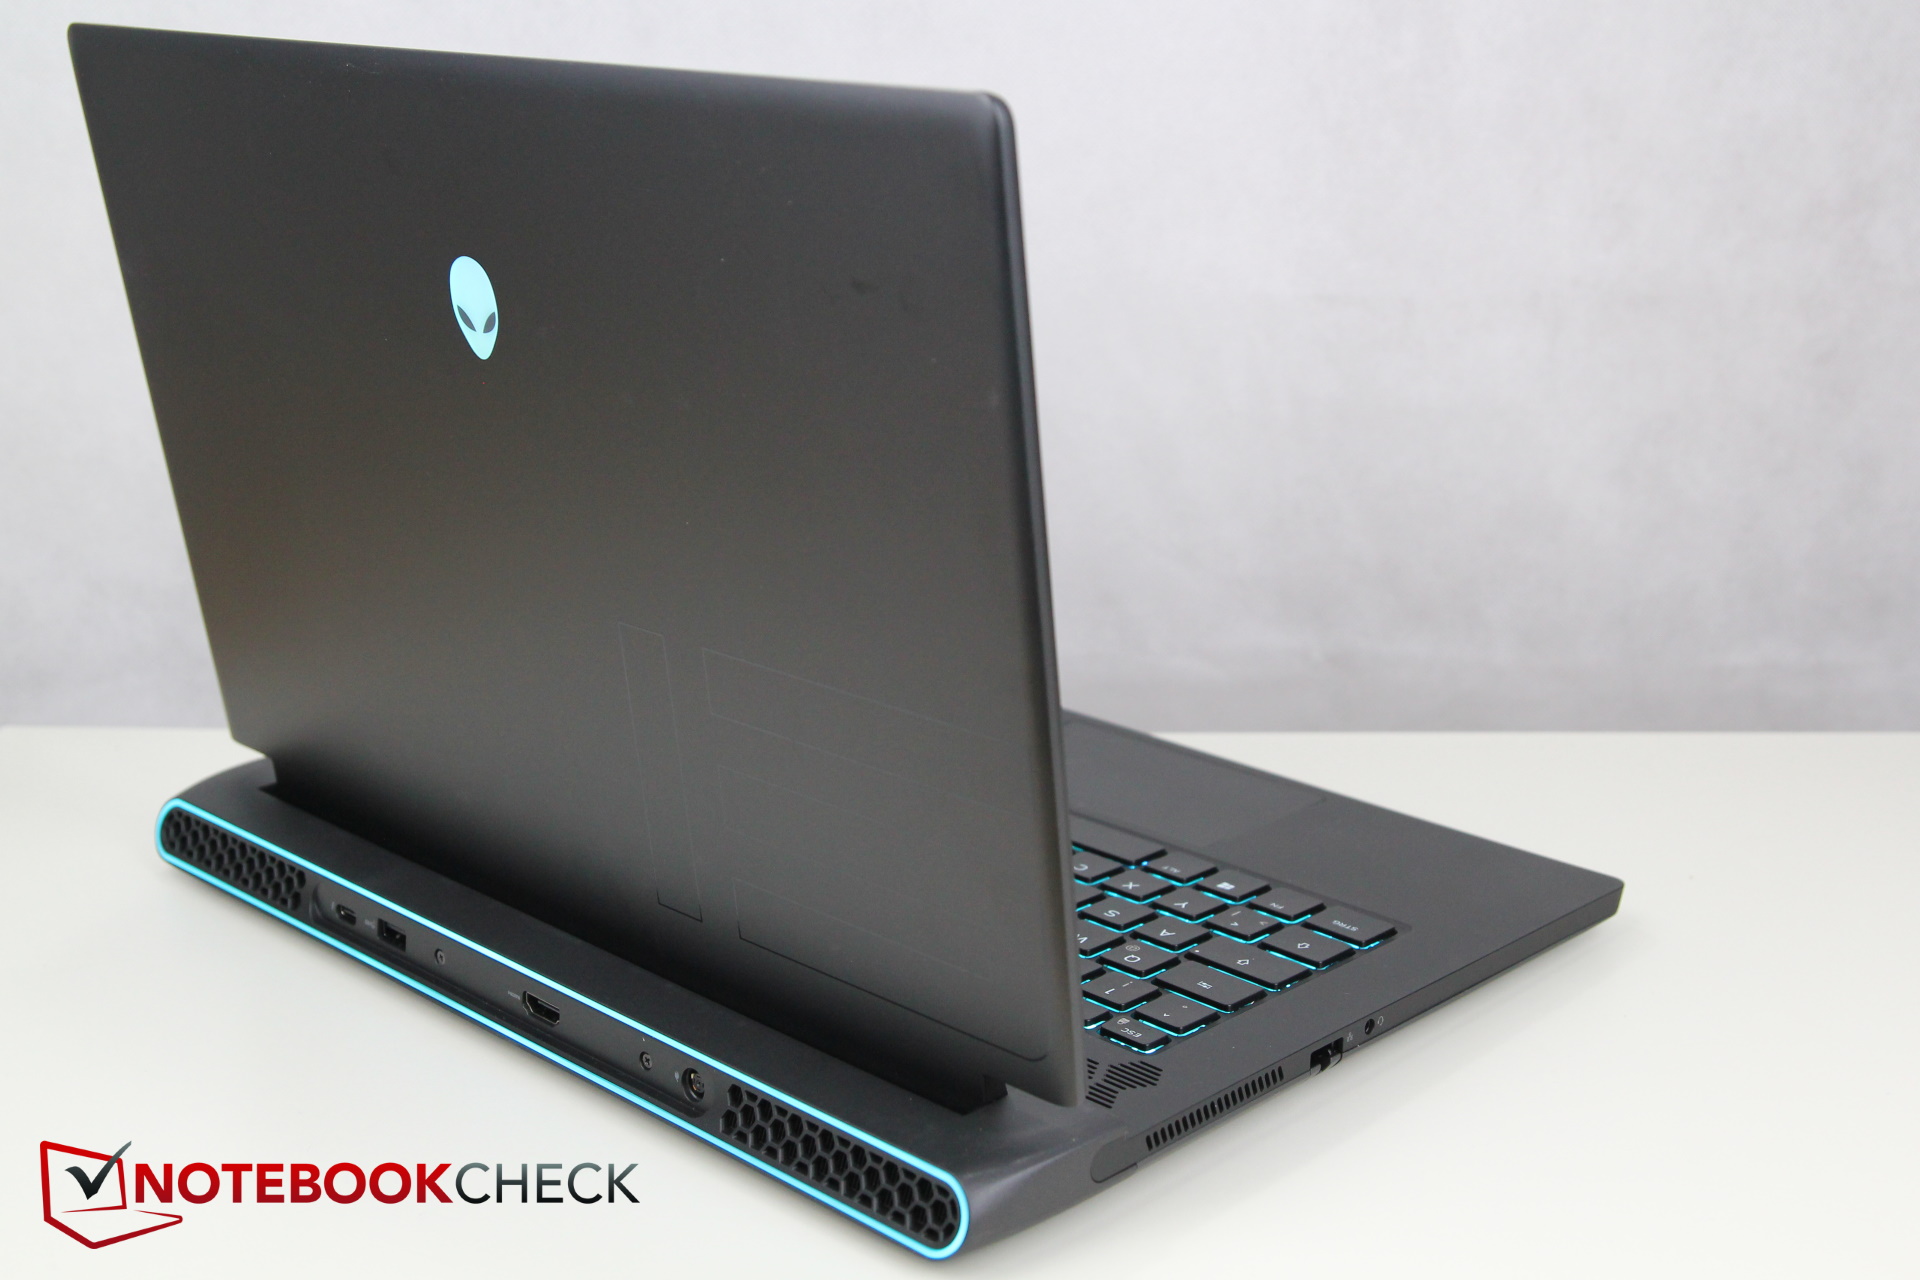
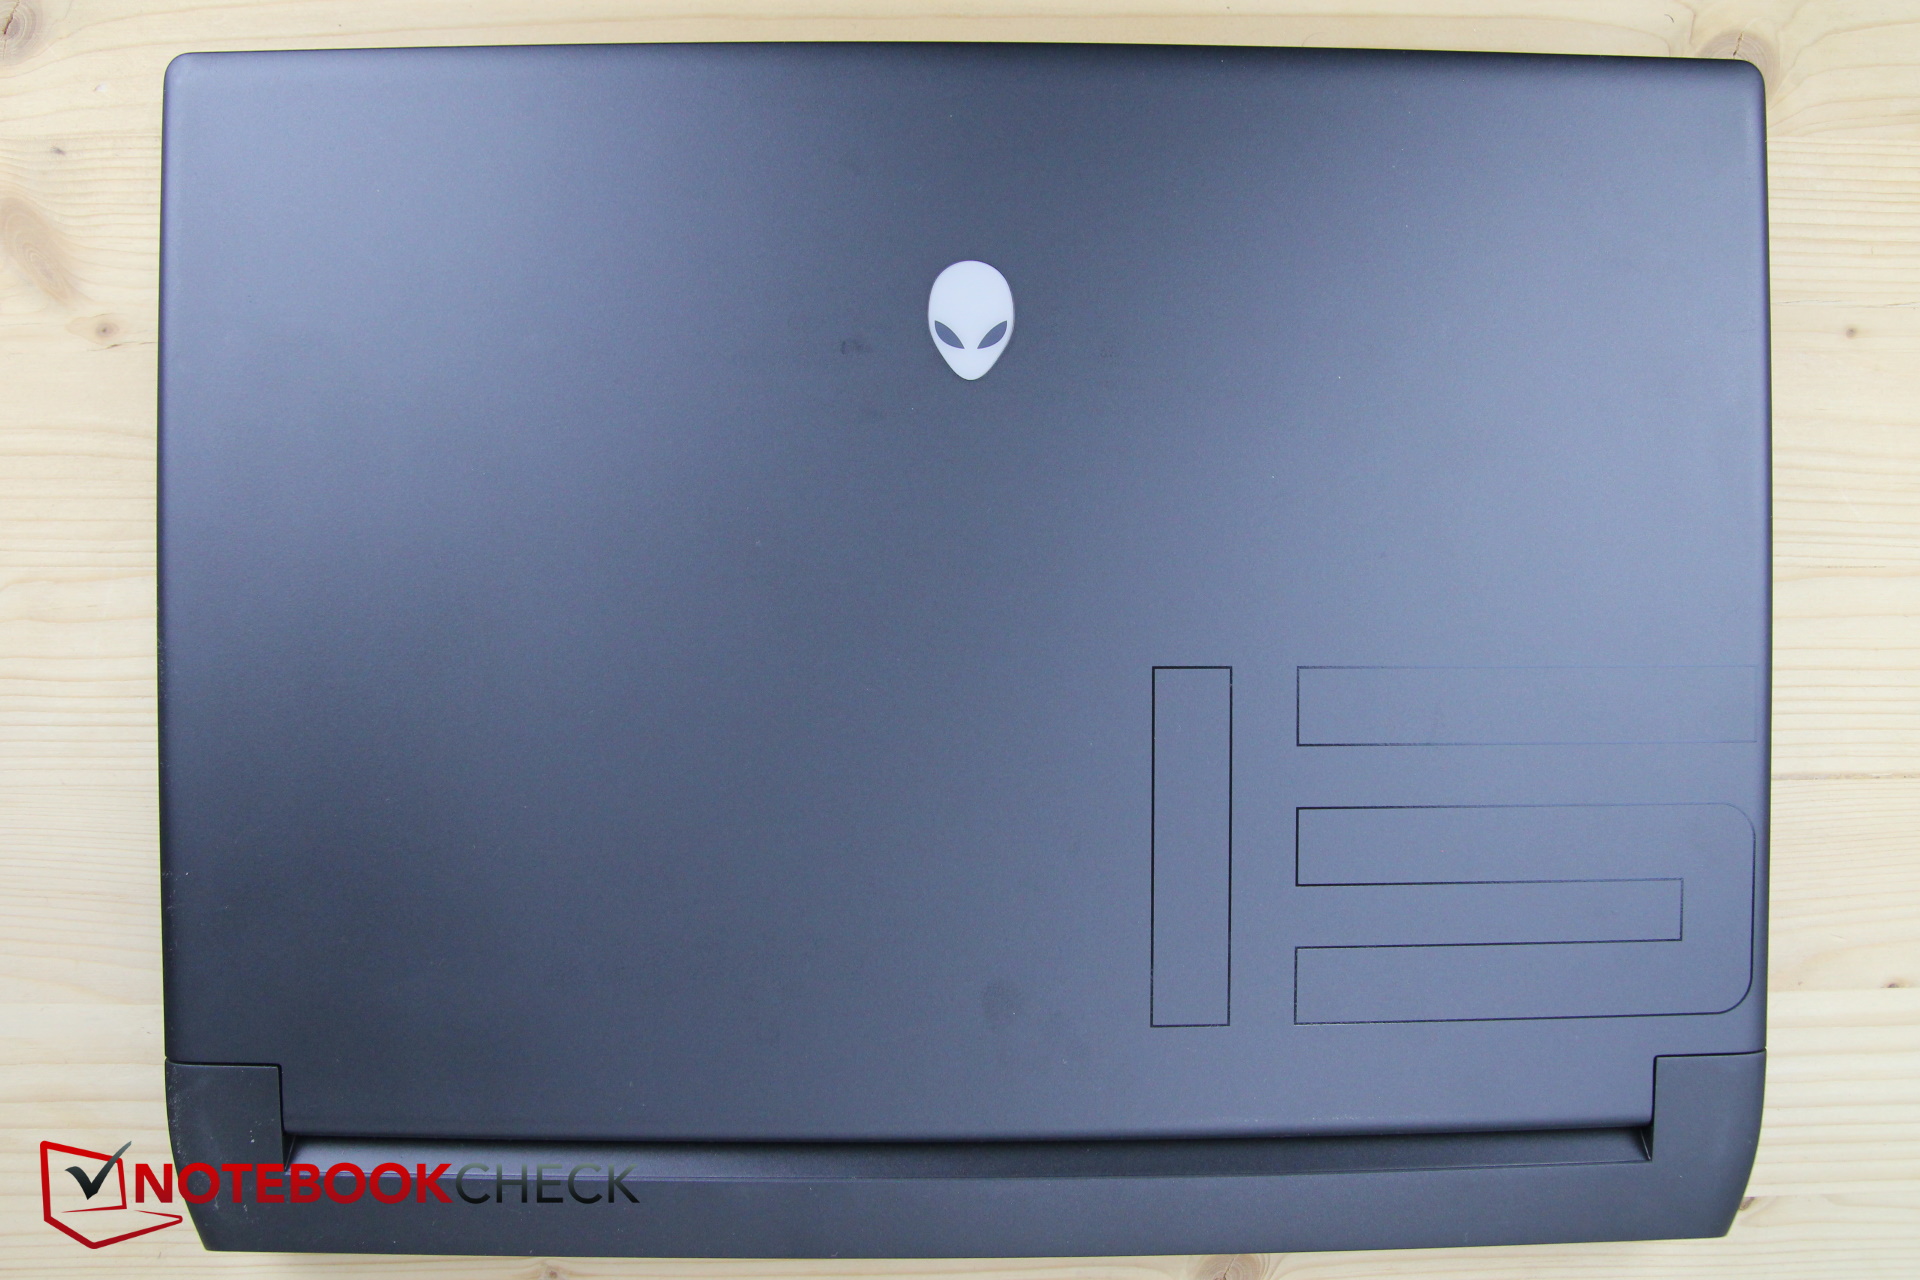
Les ordinateurs portables Alienware sont connus pour leur grand système de refroidissement à l'arrière, il n'est donc guère surprenant que le modèle actuel soit également nettement plus profond que les concurrents d'autres fabricants. Mais au moins, il est légèrement plus fin que le Schenker ou l'Aorus, même si aucun de ces modèles n'est capable de battre le Razer Blade à cet égard
Avec un poids de 2,5 kg (~5,5 lb), les ordinateurs portables Alienware sont également 200 à 500 g (~7 à 18 oz) plus lourds que les appareils de comparaison
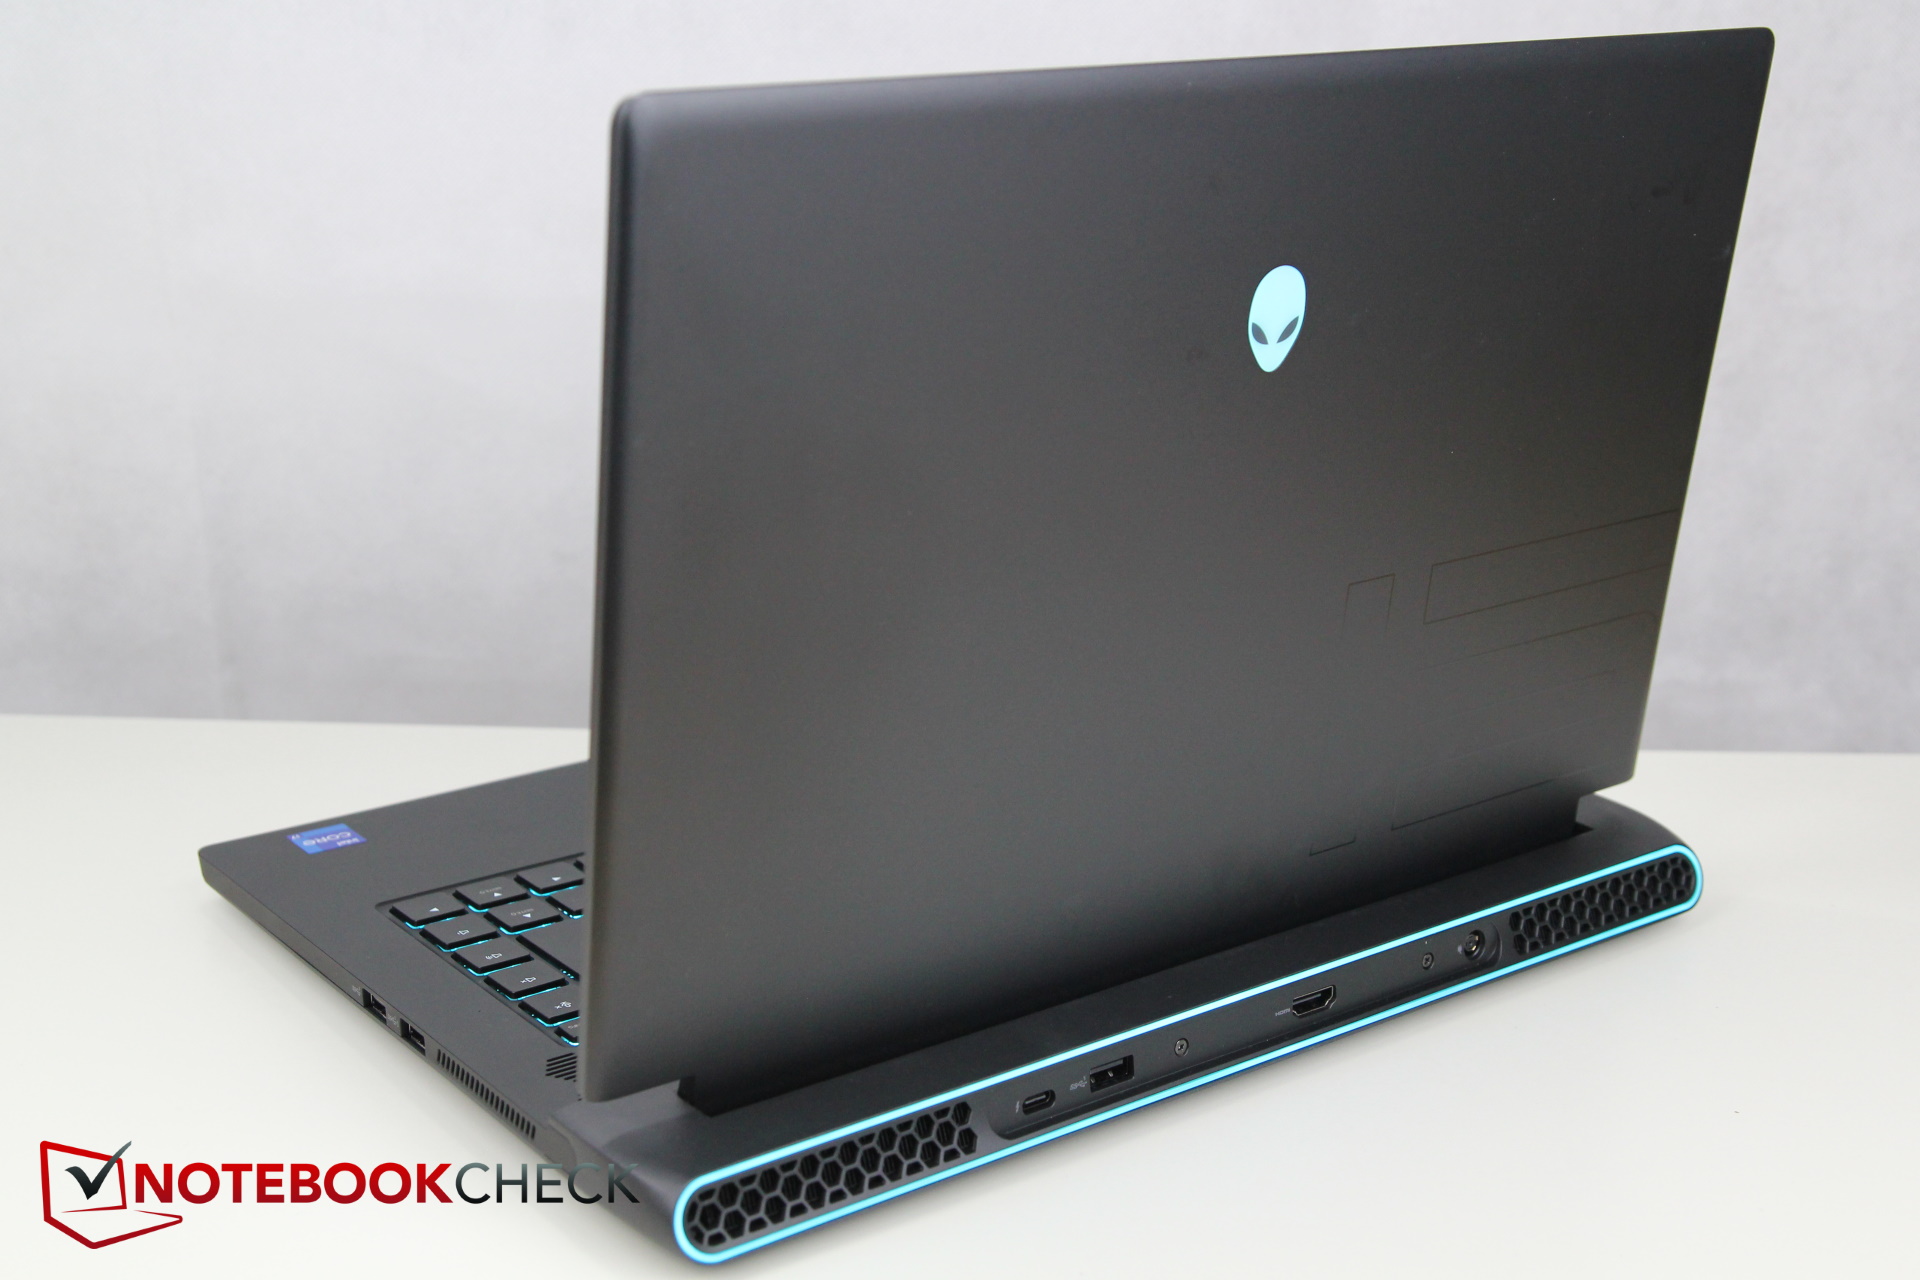
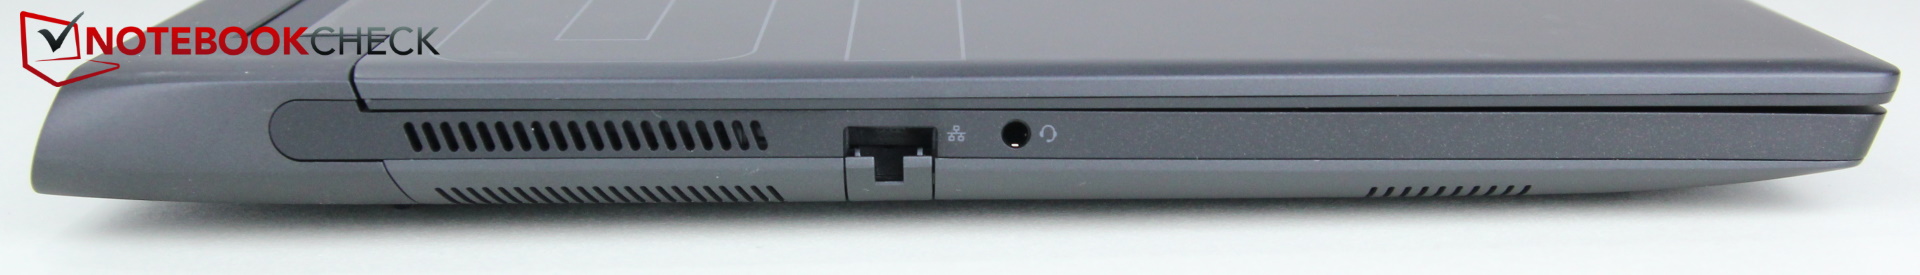
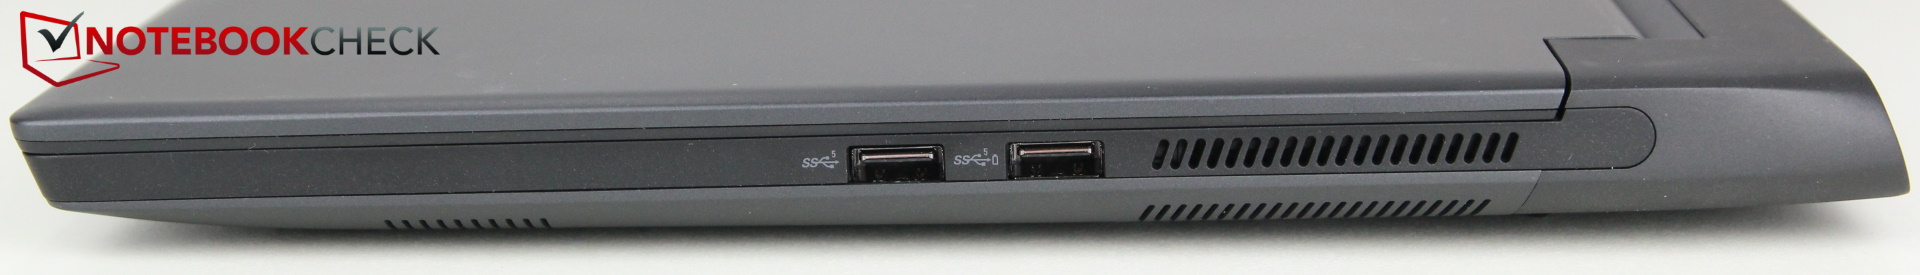
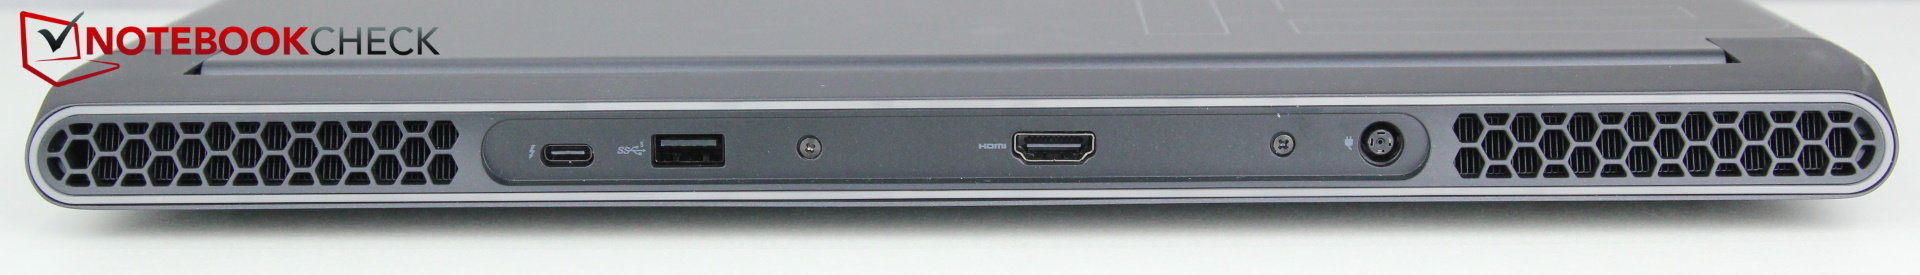
Matériel de connexion - Intel Alienware avec Thunderbolt
Contrairement à la version m15 R5 AMD, le m15 R6 prend désormais en charge Thunderbolt 4 grâce au CPU Intel, et le port USB-C correspondant prend également en charge l'USB 3.2 Gen 2 au lieu de Gen 1. En outre, le port USB-C prend désormais en charge Power Delivery, ce qui signifie qu'il peut être utilisé pour la recharge, mais seulement à hauteur de 15 watts. Pour le reste, les connexions sont restées les mêmes
Communication
Webcam


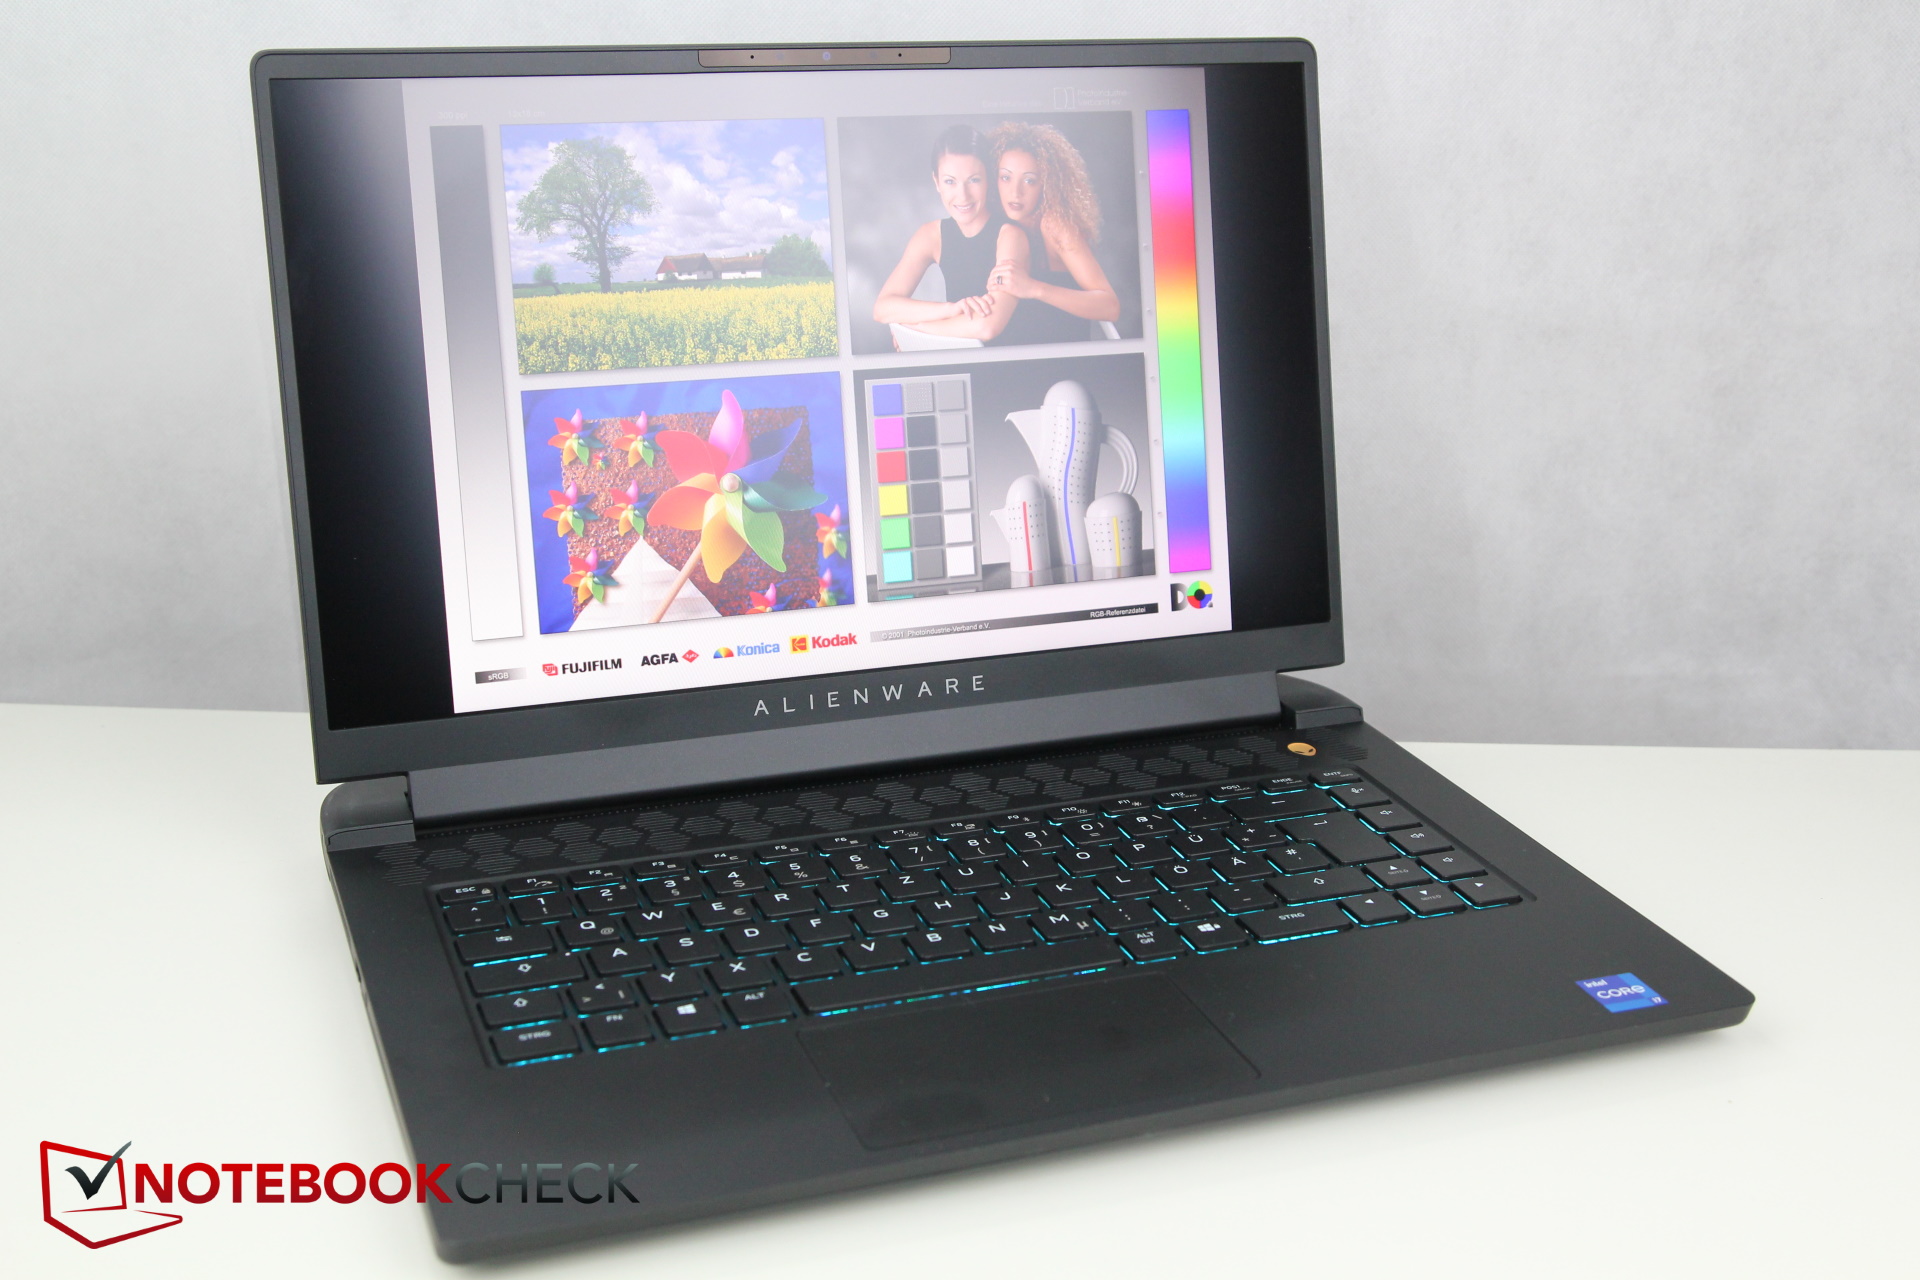
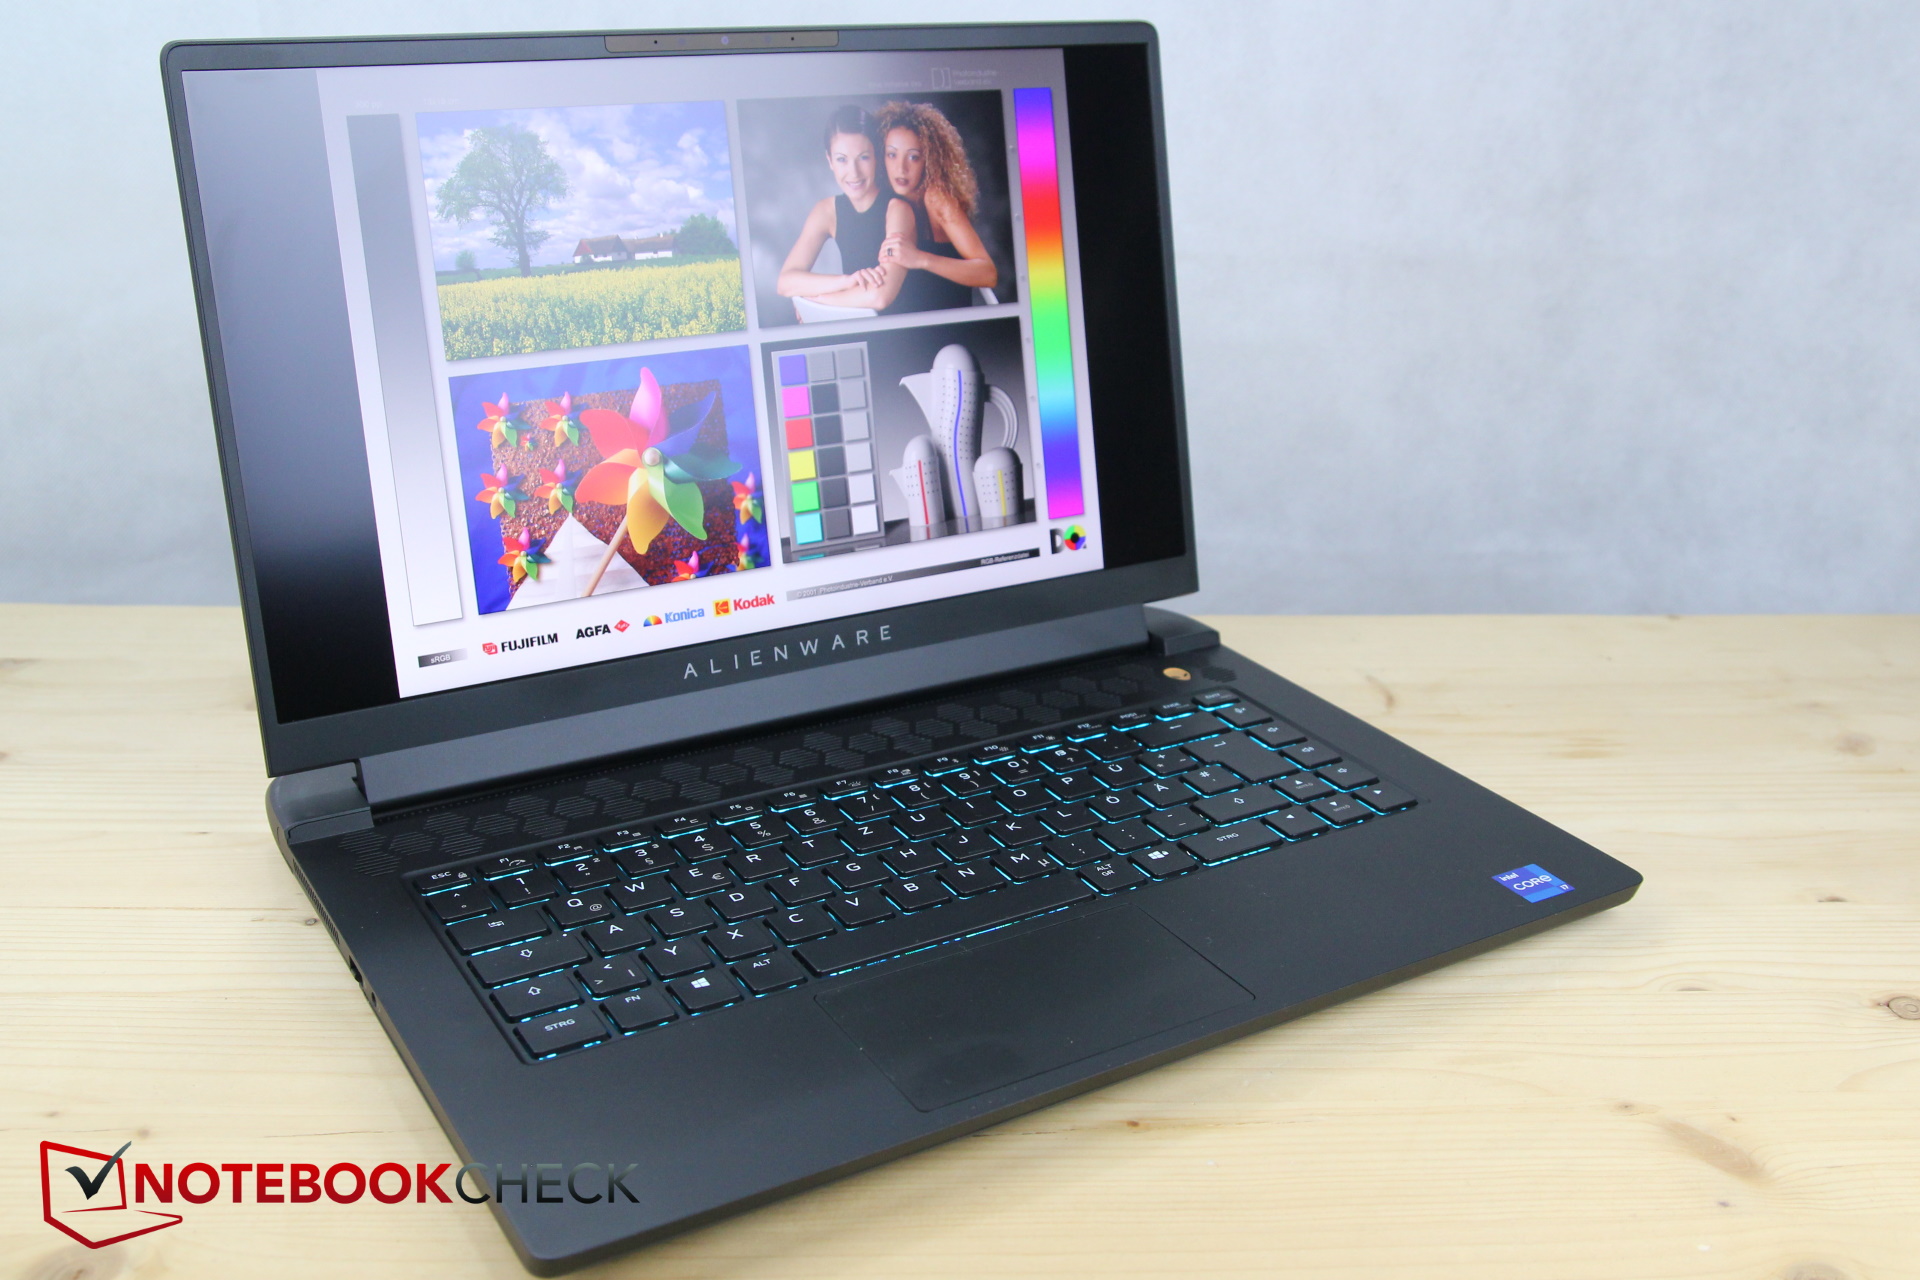
Affichage - Vitesse augmentée à 360 Hz
Selon HWinfo, l'écran est le même panneau FHD mat d'AU Optronics que dans le m15 R5. Cependant, le modèle actuel offre un taux de rafraîchissement d'une vitesse de 360 Hz, alors que celui du AMD m15 maîtrise "seulement" 165 Hz. Il est également possible d'acheter le R6 avec la même dalle de 165 Hz, et une dalle QHD de 240 Hz est également disponible. Mais pourquoi n'y a-t-il pas d'option 4K pour un ordinateur portable de jeu avec la RTX 3080 ?
Bien que partageant la même étiquette, les valeurs des deux panneaux sont également différentes. Si la luminosité est légèrement meilleure, sa répartition est moins bonne. La valeur du noir et le contraste sont également légèrement moins bons que sur le modèle frère
Les temps de réponse très courts et donc exceptionnels des deux panneaux sont positifs
| |||||||||||||||||||||||||
Homogénéité de la luminosité: 85 %
Valeur mesurée au centre, sur batterie: 360 cd/m²
Contraste: 1026:1 (Valeurs des noirs: 0.35 cd/m²)
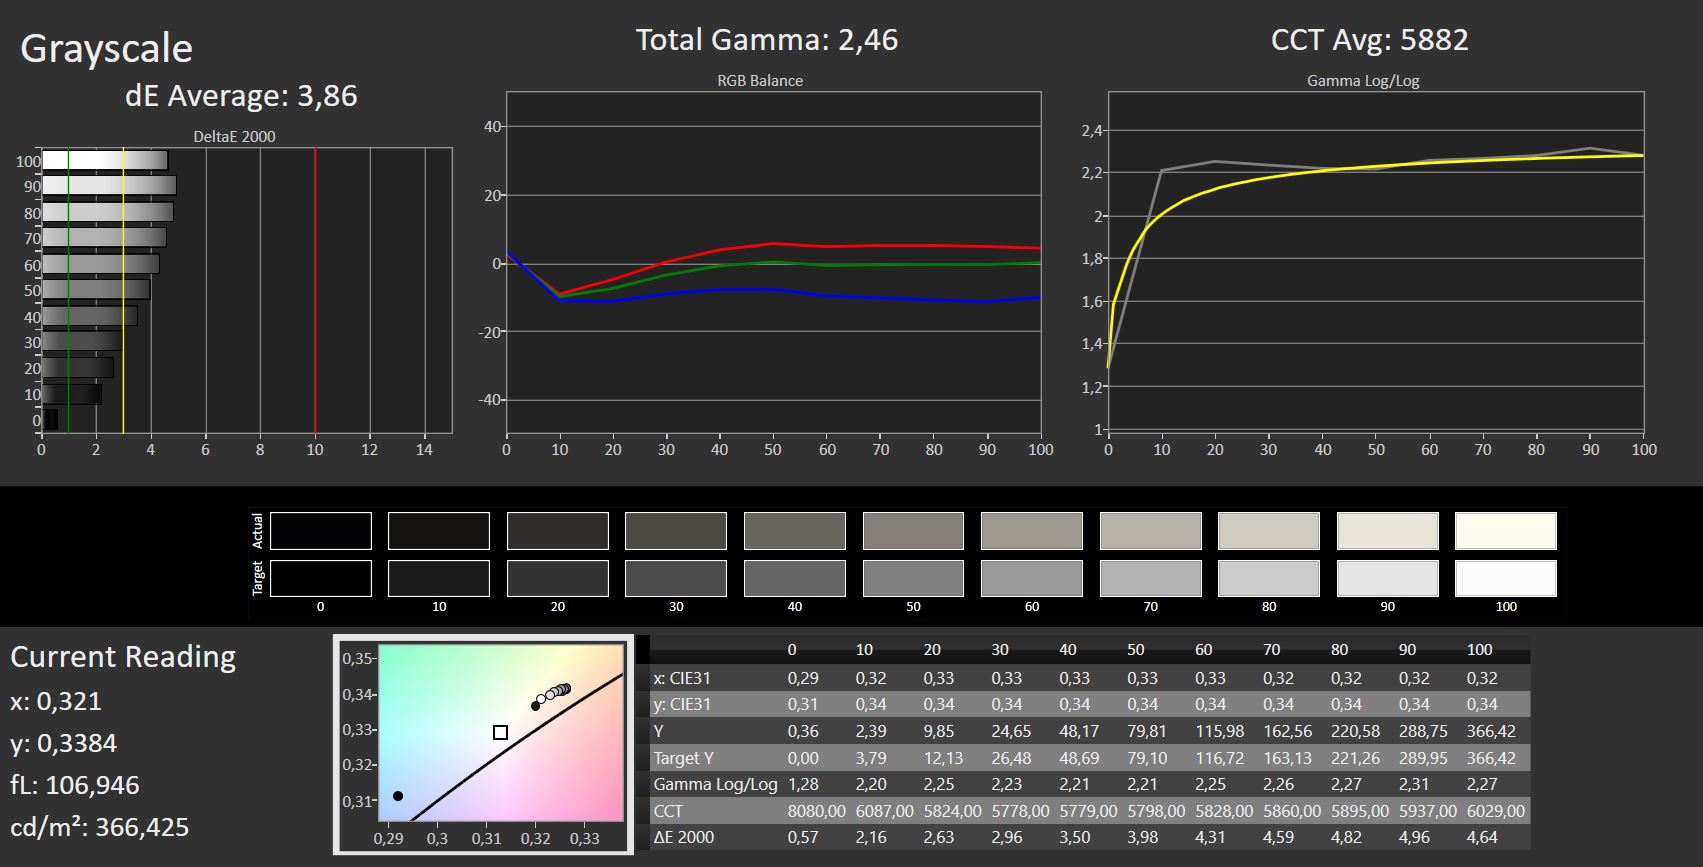
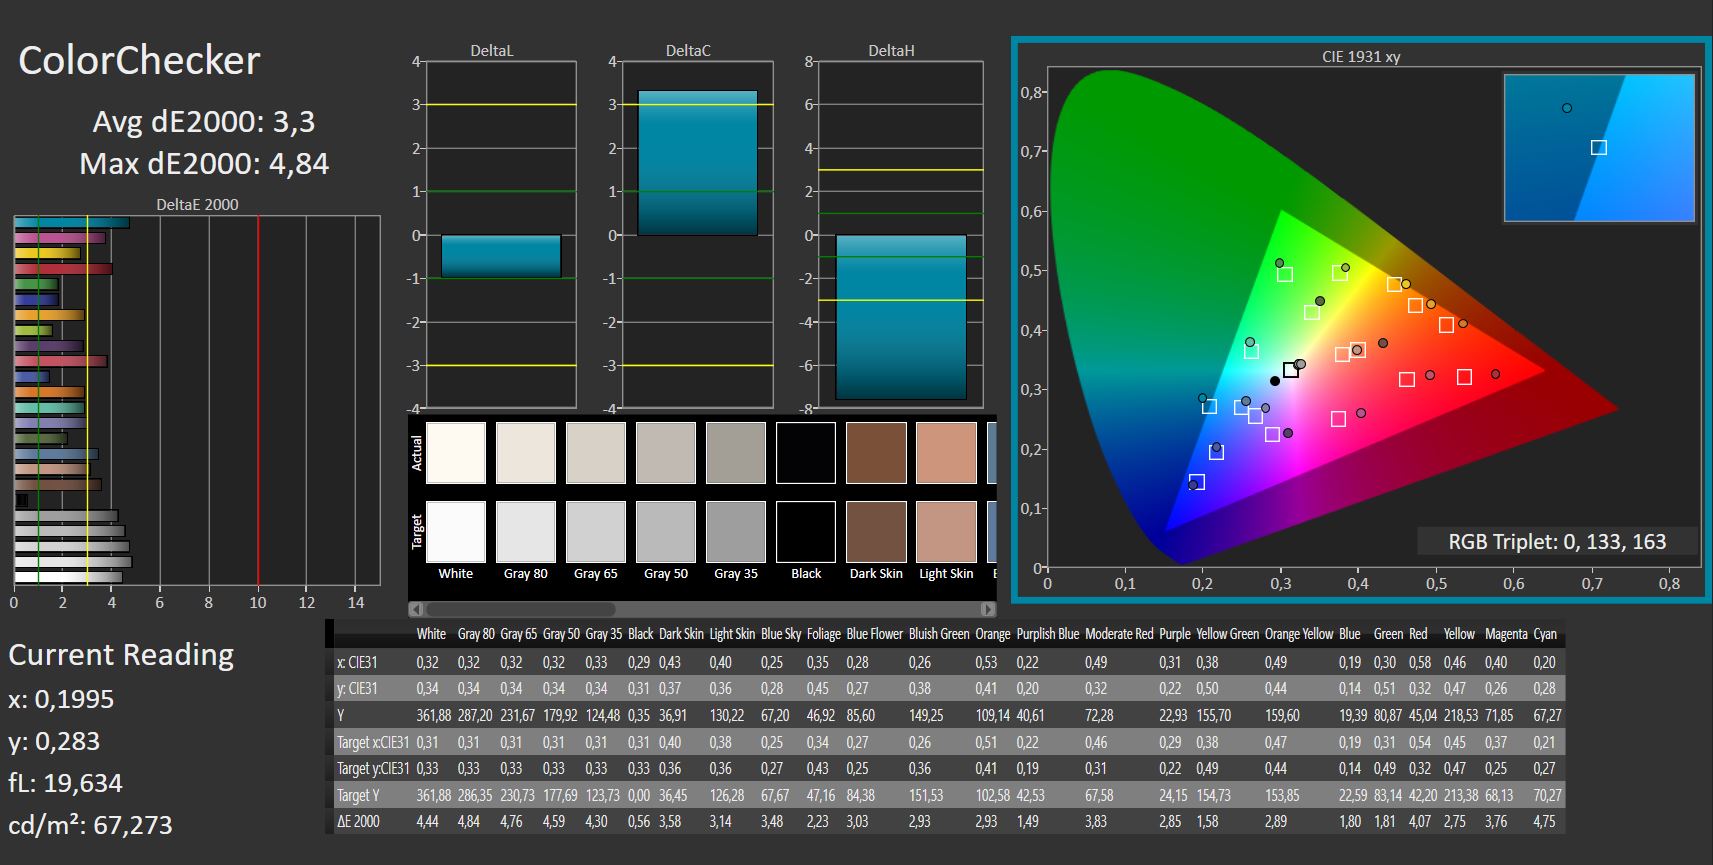
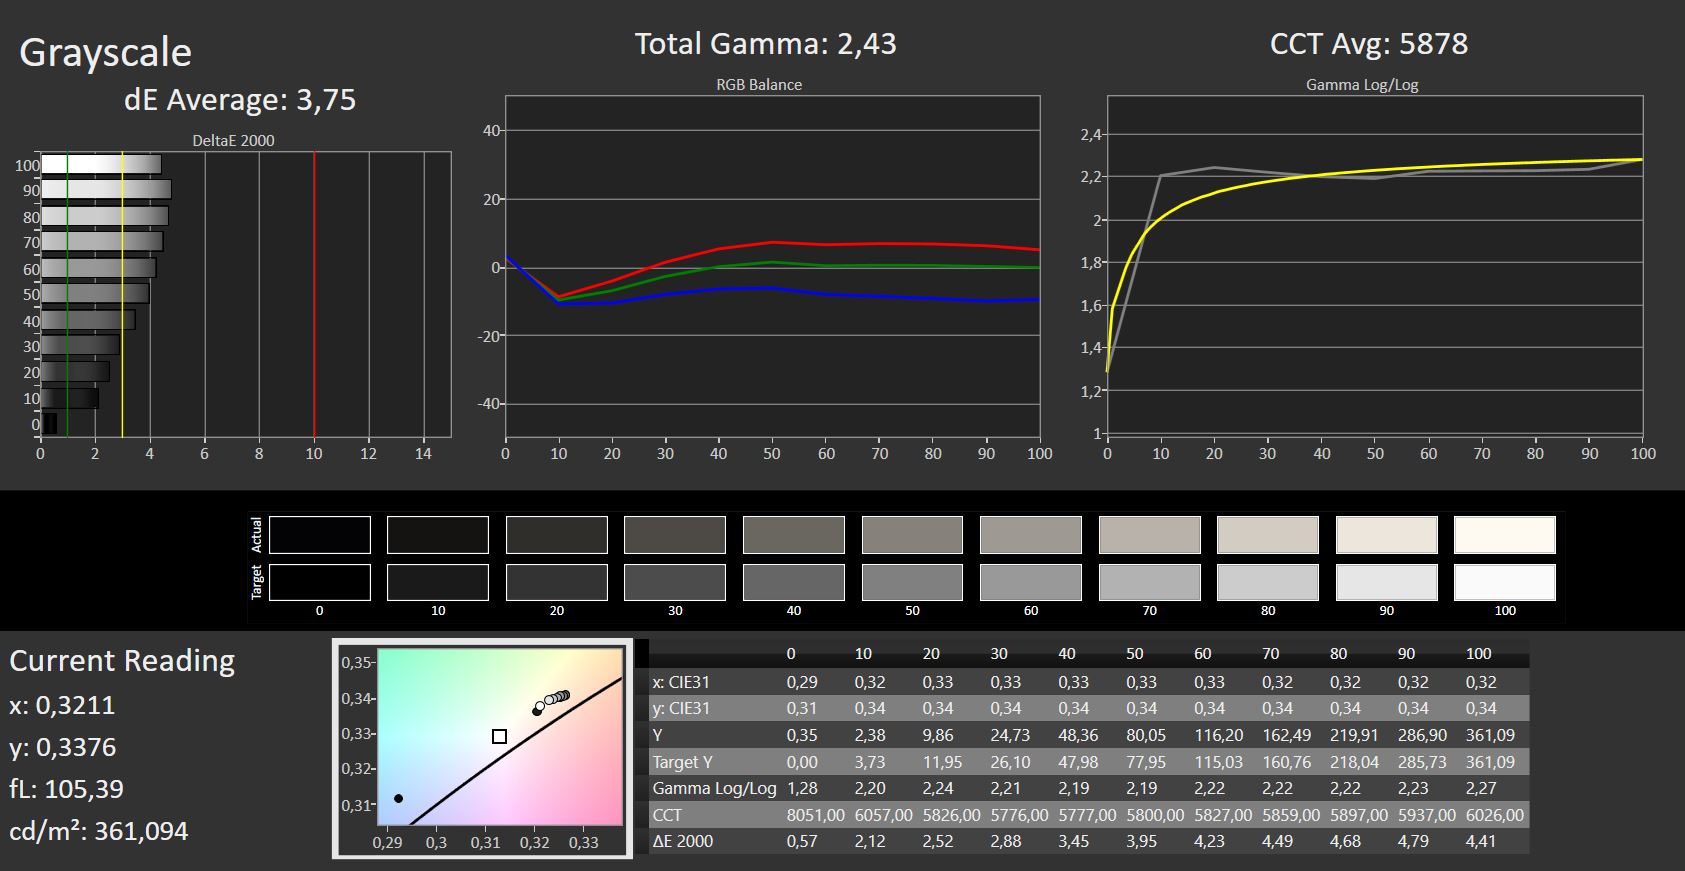
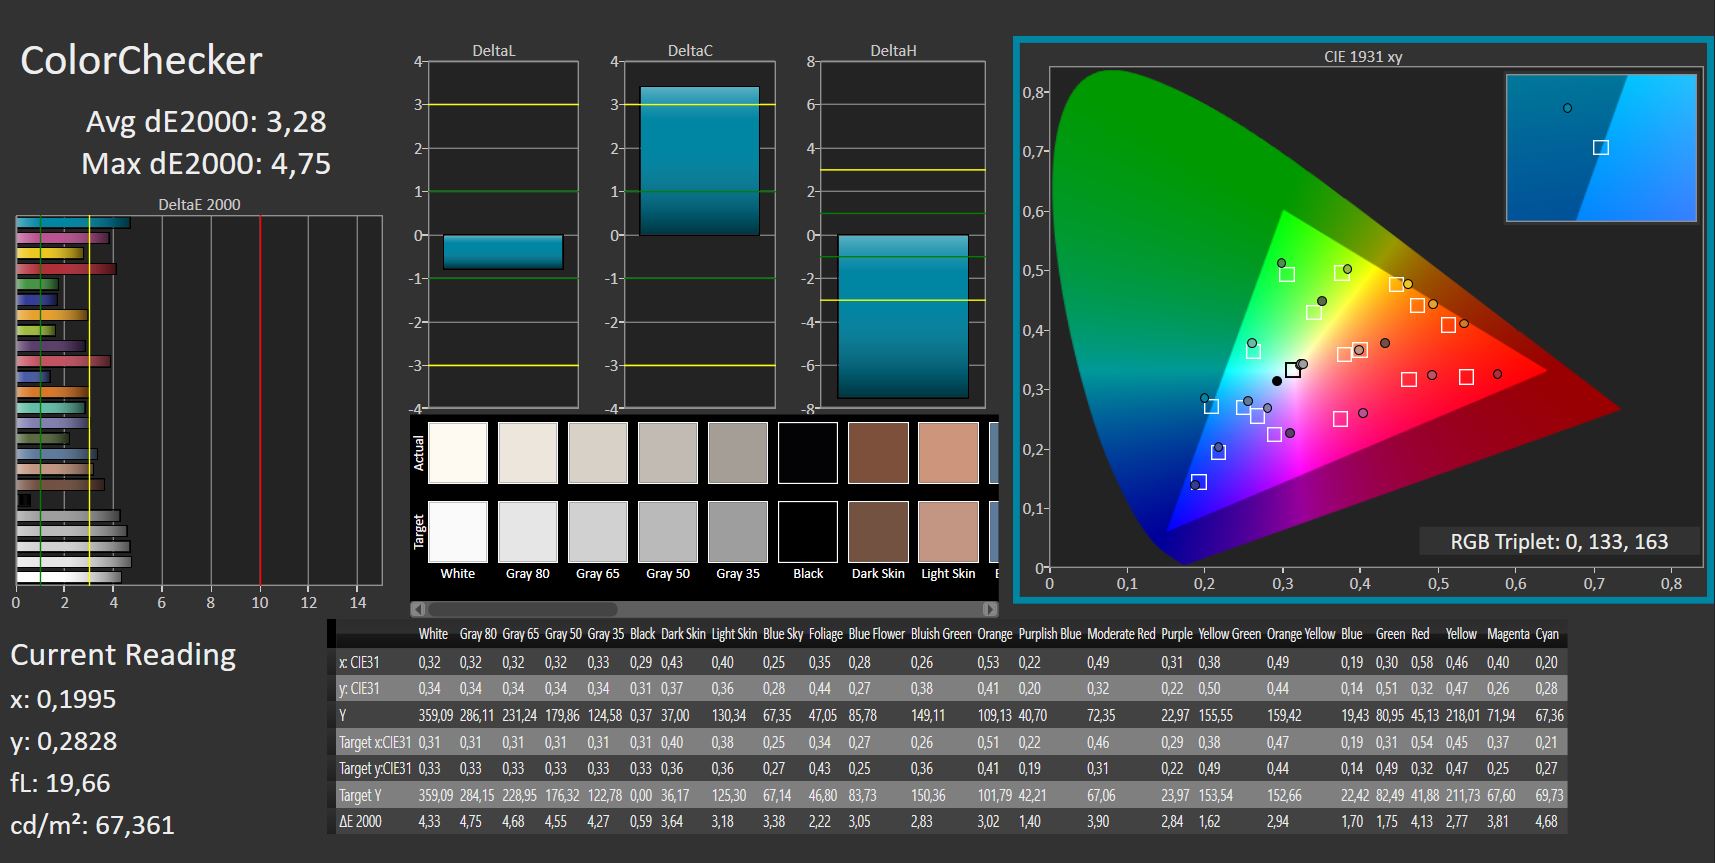
ΔE ColorChecker Calman: 3.3 | ∀{0.5-29.43 Ø4.72}
calibrated: 3.28
ΔE Greyscale Calman: 3.66 | ∀{0.09-98 Ø4.97}
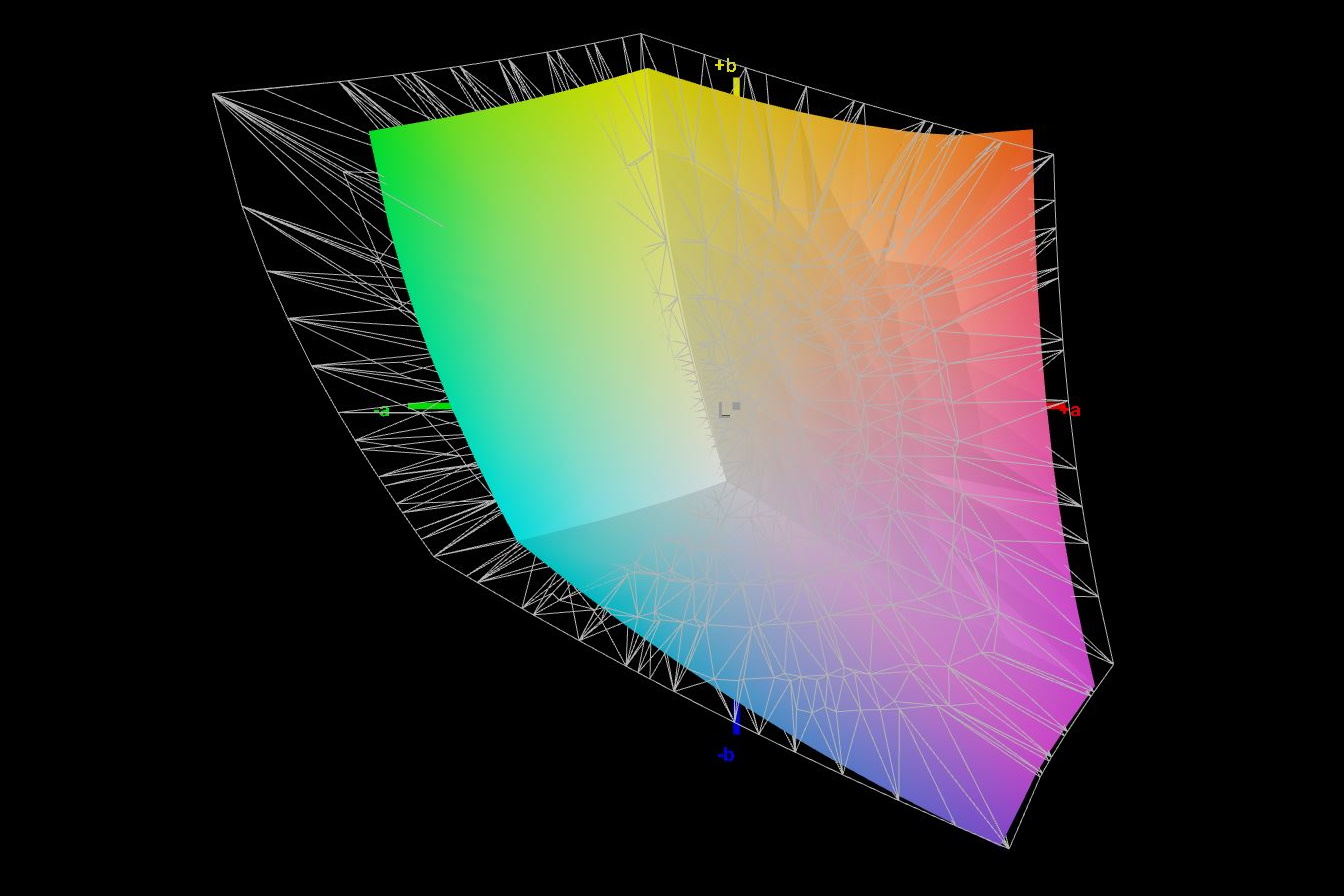
75.7% AdobeRGB 1998 (Argyll 3D)
99.5% sRGB (Argyll 3D)
74.1% Display P3 (Argyll 3D)
Gamma: 2.43
CCT: 5896 K
| Alienware m15 R6, i7-11800H RTX 3080 AU Optronics AUO9092 (B156HAN), IPS, 1920x1080, 15.6" | Alienware m15 R5 Ryzen Edition B156HAN, IPS, 1920x1080, 15.6" | Alienware m15 R4 RTX 3080 LG Philips LGD066E (156WFG), IPS, 1920x1080, 15.6" | Aorus 15P YD BOE09B9, IPS, 1920x1080, 15.6" | Schenker XMG Neo 15 Tiger Lake BOE CQ NE156QHM-NY2, IPS, 2560x1440, 15.6" | Razer Blade 15 Advanced (Mid 2021) TL156VDXP02-0, IPS, 1920x1080, 15.6" | |
|---|---|---|---|---|---|---|
| Display | -4% | -3% | -5% | -7% | ||
| Display P3 Coverage (%) | 74.1 | 70.1 -5% | 70.2 -5% | 68.6 -7% | 66.9 -10% | |
| sRGB Coverage (%) | 99.5 | 99.8 0% | 98.5 -1% | 98.6 -1% | 97.1 -2% | |
| AdobeRGB 1998 Coverage (%) | 75.7 | 71.5 -6% | 72.4 -4% | 69.3 -8% | 69 -9% | |
| Response Times | -47% | -121% | -236% | -293% | -65% | |
| Response Time Grey 50% / Grey 80% * (ms) | 2.8 | 4 ? -43% | 7.6 ? -171% | 14 ? -400% | 16 ? -471% | 4.2 ? -50% |
| Response Time Black / White * (ms) | 5.6 | 8.4 ? -50% | 9.6 ? -71% | 9.6 ? -71% | 12 ? -114% | 10 ? -79% |
| PWM Frequency (Hz) | ||||||
| Screen | 15% | 24% | -9% | -8% | 13% | |
| Brightness middle (cd/m²) | 359 | 329 -8% | 347 -3% | 337 -6% | 324 -10% | 353.4 -2% |
| Brightness (cd/m²) | 344 | 321 -7% | 318 -8% | 316 -8% | 307 -11% | 340 -1% |
| Brightness Distribution (%) | 85 | 92 8% | 86 1% | 85 0% | 91 7% | 92 8% |
| Black Level * (cd/m²) | 0.35 | 0.27 23% | 0.31 11% | 0.31 11% | 0.27 23% | 0.31 11% |
| Contrast (:1) | 1026 | 1219 19% | 1119 9% | 1087 6% | 1200 17% | 1140 11% |
| Colorchecker dE 2000 * | 3.3 | 2.78 16% | 1.68 49% | 3.87 -17% | 3.36 -2% | 2.17 34% |
| Colorchecker dE 2000 max. * | 4.84 | 4.88 -1% | 3.03 37% | 8.09 -67% | 9.87 -104% | 5.69 -18% |
| Colorchecker dE 2000 calibrated * | 3.28 | 1.63 50% | 1.08 67% | 1.15 65% | 1.23 62% | 1.05 68% |
| Greyscale dE 2000 * | 3.66 | 2.5 32% | 1.8 51% | 6.1 -67% | 5.8 -58% | 3.4 7% |
| Gamma | 2.43 91% | 2.106 104% | 2.262 97% | 2.132 103% | 2.311 95% | 2.2 100% |
| CCT | 5896 110% | 6201 105% | 6592 99% | 6891 94% | 7087 92% | 6830 95% |
| Color Space (Percent of AdobeRGB 1998) (%) | 76 | 71 | 72 | 69 | ||
| Color Space (Percent of sRGB) (%) | 99 | 94 | 94 | 93 | ||
| Moyenne finale (programmes/paramètres) | -16% /
4% | -34% /
-3% | -83% /
-40% | -102% /
-48% | -20% /
-2% |
* ... Moindre est la valeur, meilleures sont les performances
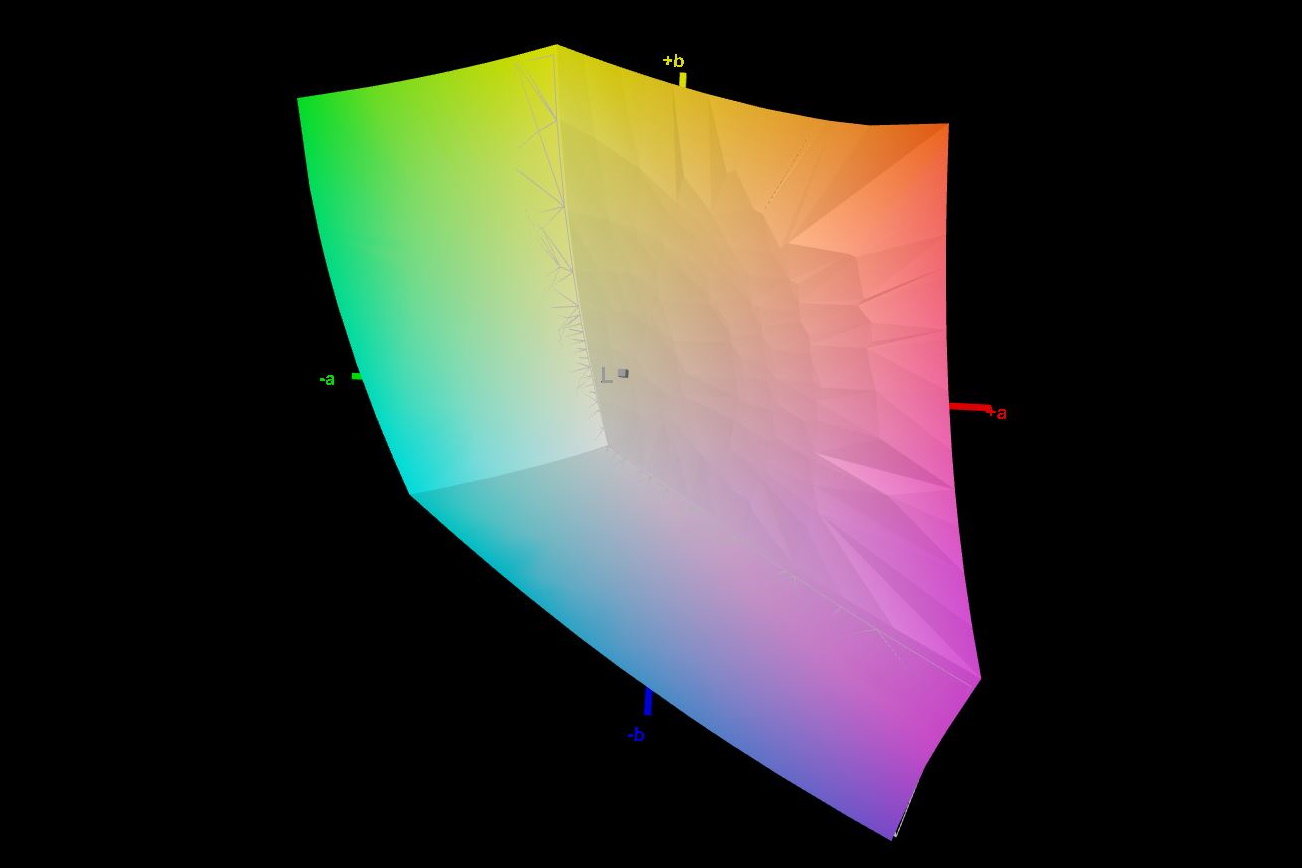
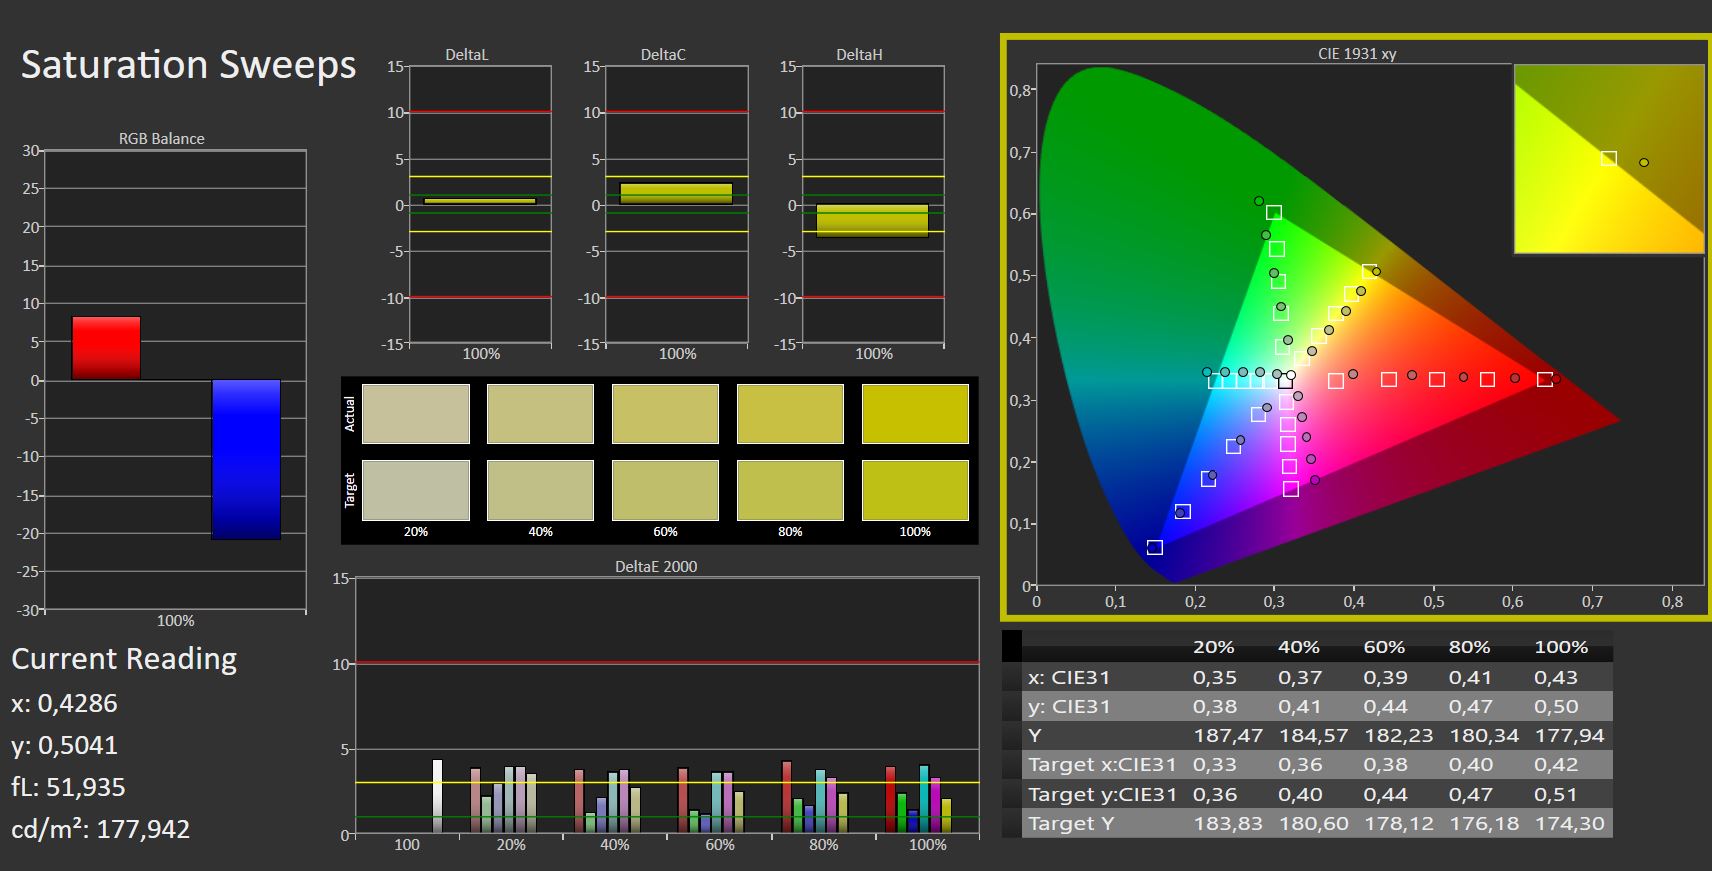
Avec près de 100 % de sRGB et environ 76 % d'AdobeRGB, la couverture de l'espace couleur est très bonne, alors que de nombreux concurrents n'atteignent pas tout à fait ces valeurs
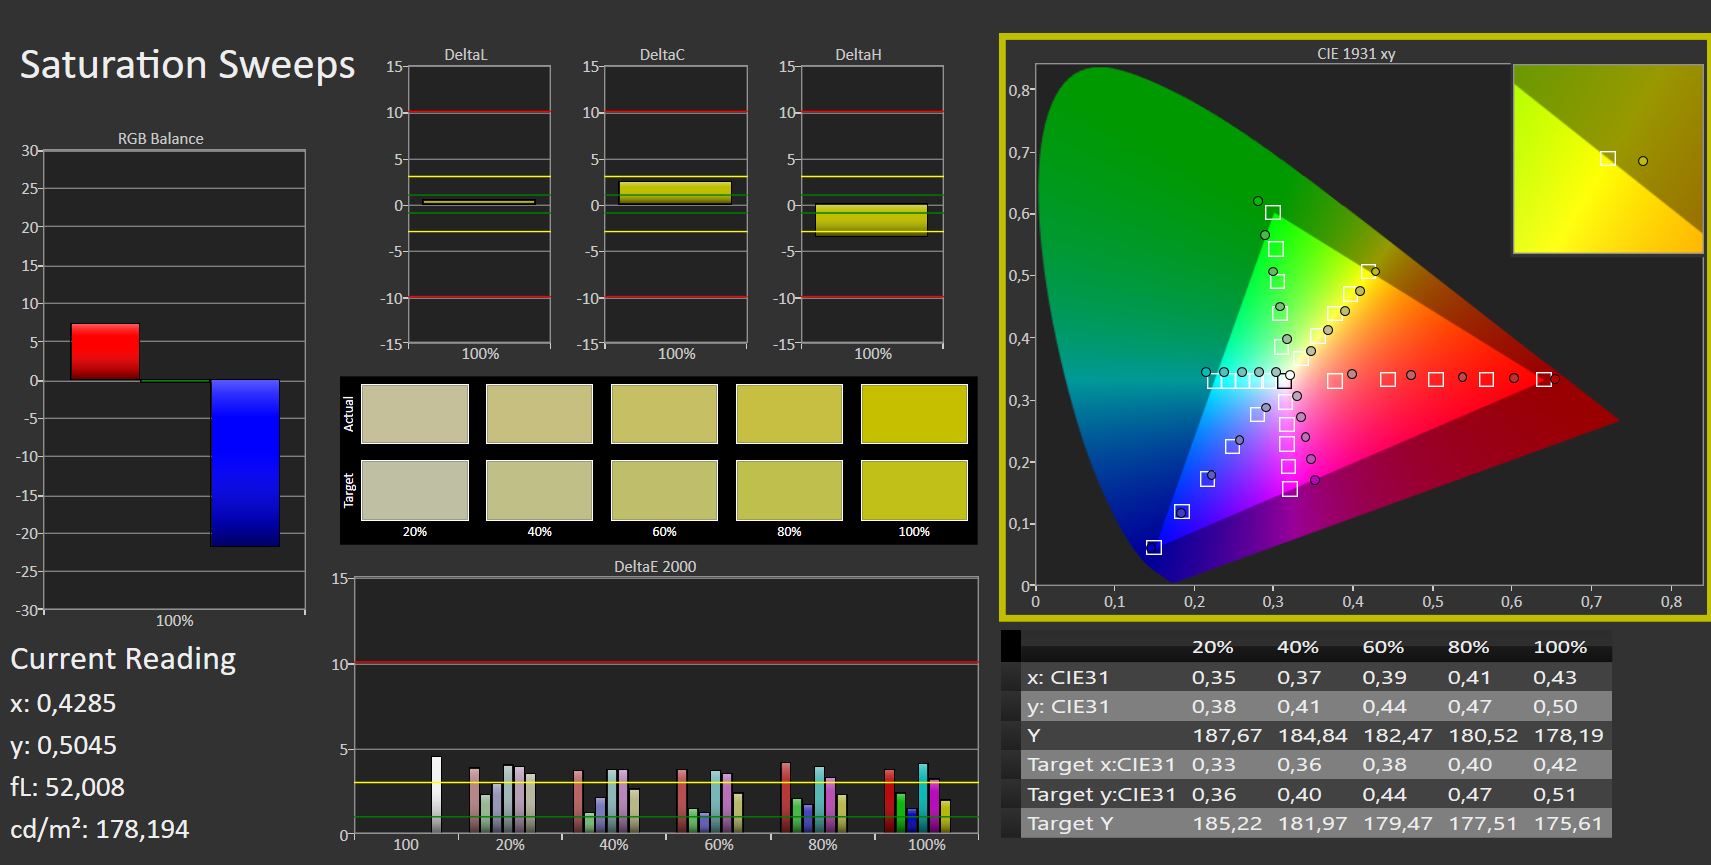
L'écran est déjà assez bien calibré à l'état de livraison, et un calibrage manuel n'apporte pratiquement aucune amélioration significative en termes d'écarts de couleurs.
Temps de réponse de l'écran
| ↔ Temps de réponse noir à blanc | ||
|---|---|---|
| 5.6 ms ... hausse ↗ et chute ↘ combinées | ↗ ms hausse | 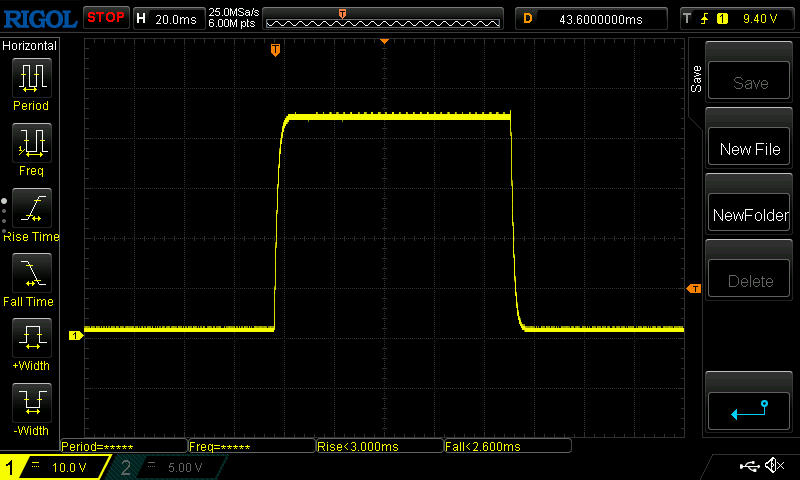 |
| ↘ ms chute | ||
| L'écran montre de très faibles temps de réponse, parfait pour le jeu. En comparaison, tous les appareils testés affichent entre 0.1 (minimum) et 240 (maximum) ms. » 18 % des appareils testés affichent de meilleures performances. Cela signifie que les latences relevées sont meilleures que la moyenne (19.8 ms) de tous les appareils testés. | ||
| ↔ Temps de réponse gris 50% à gris 80% | ||
| 2.8 ms ... hausse ↗ et chute ↘ combinées | ↗ ms hausse | 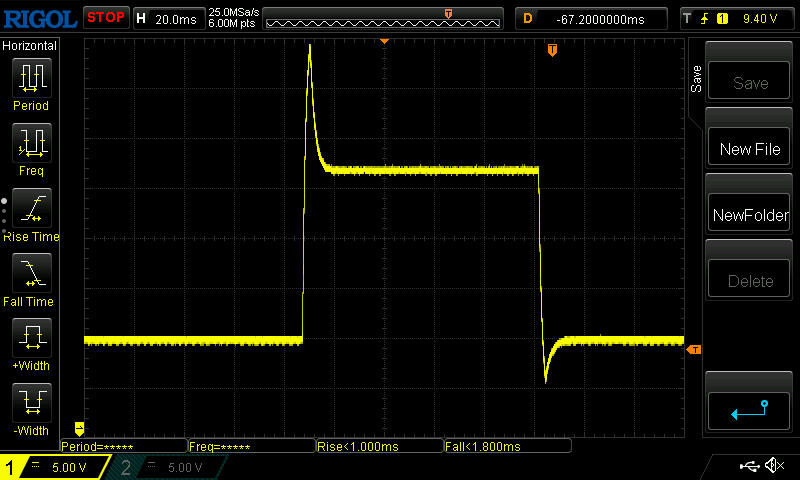 |
| ↘ ms chute | ||
| L'écran montre de très faibles temps de réponse, parfait pour le jeu. En comparaison, tous les appareils testés affichent entre 0.165 (minimum) et 636 (maximum) ms. » 12 % des appareils testés affichent de meilleures performances. Cela signifie que les latences relevées sont meilleures que la moyenne (31 ms) de tous les appareils testés. | ||
Scintillement / MLI (Modulation de largeur d'impulsion)
| Scintillement / MLI (Modulation de largeur d'impulsion) non décelé | 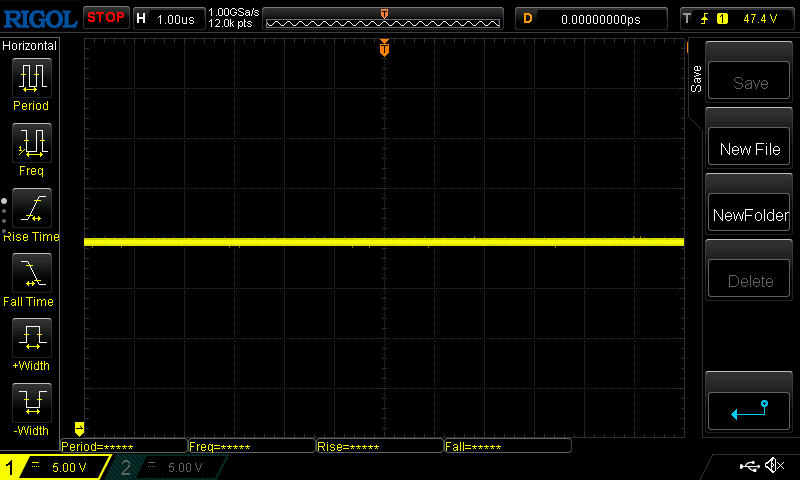 | ||
En comparaison, 52 % des appareils testés n'emploient pas MDI pour assombrir leur écran. Nous avons relevé une moyenne à 7753 (minimum : 5 - maximum : 343500) Hz dans le cas où une MDI était active. | |||
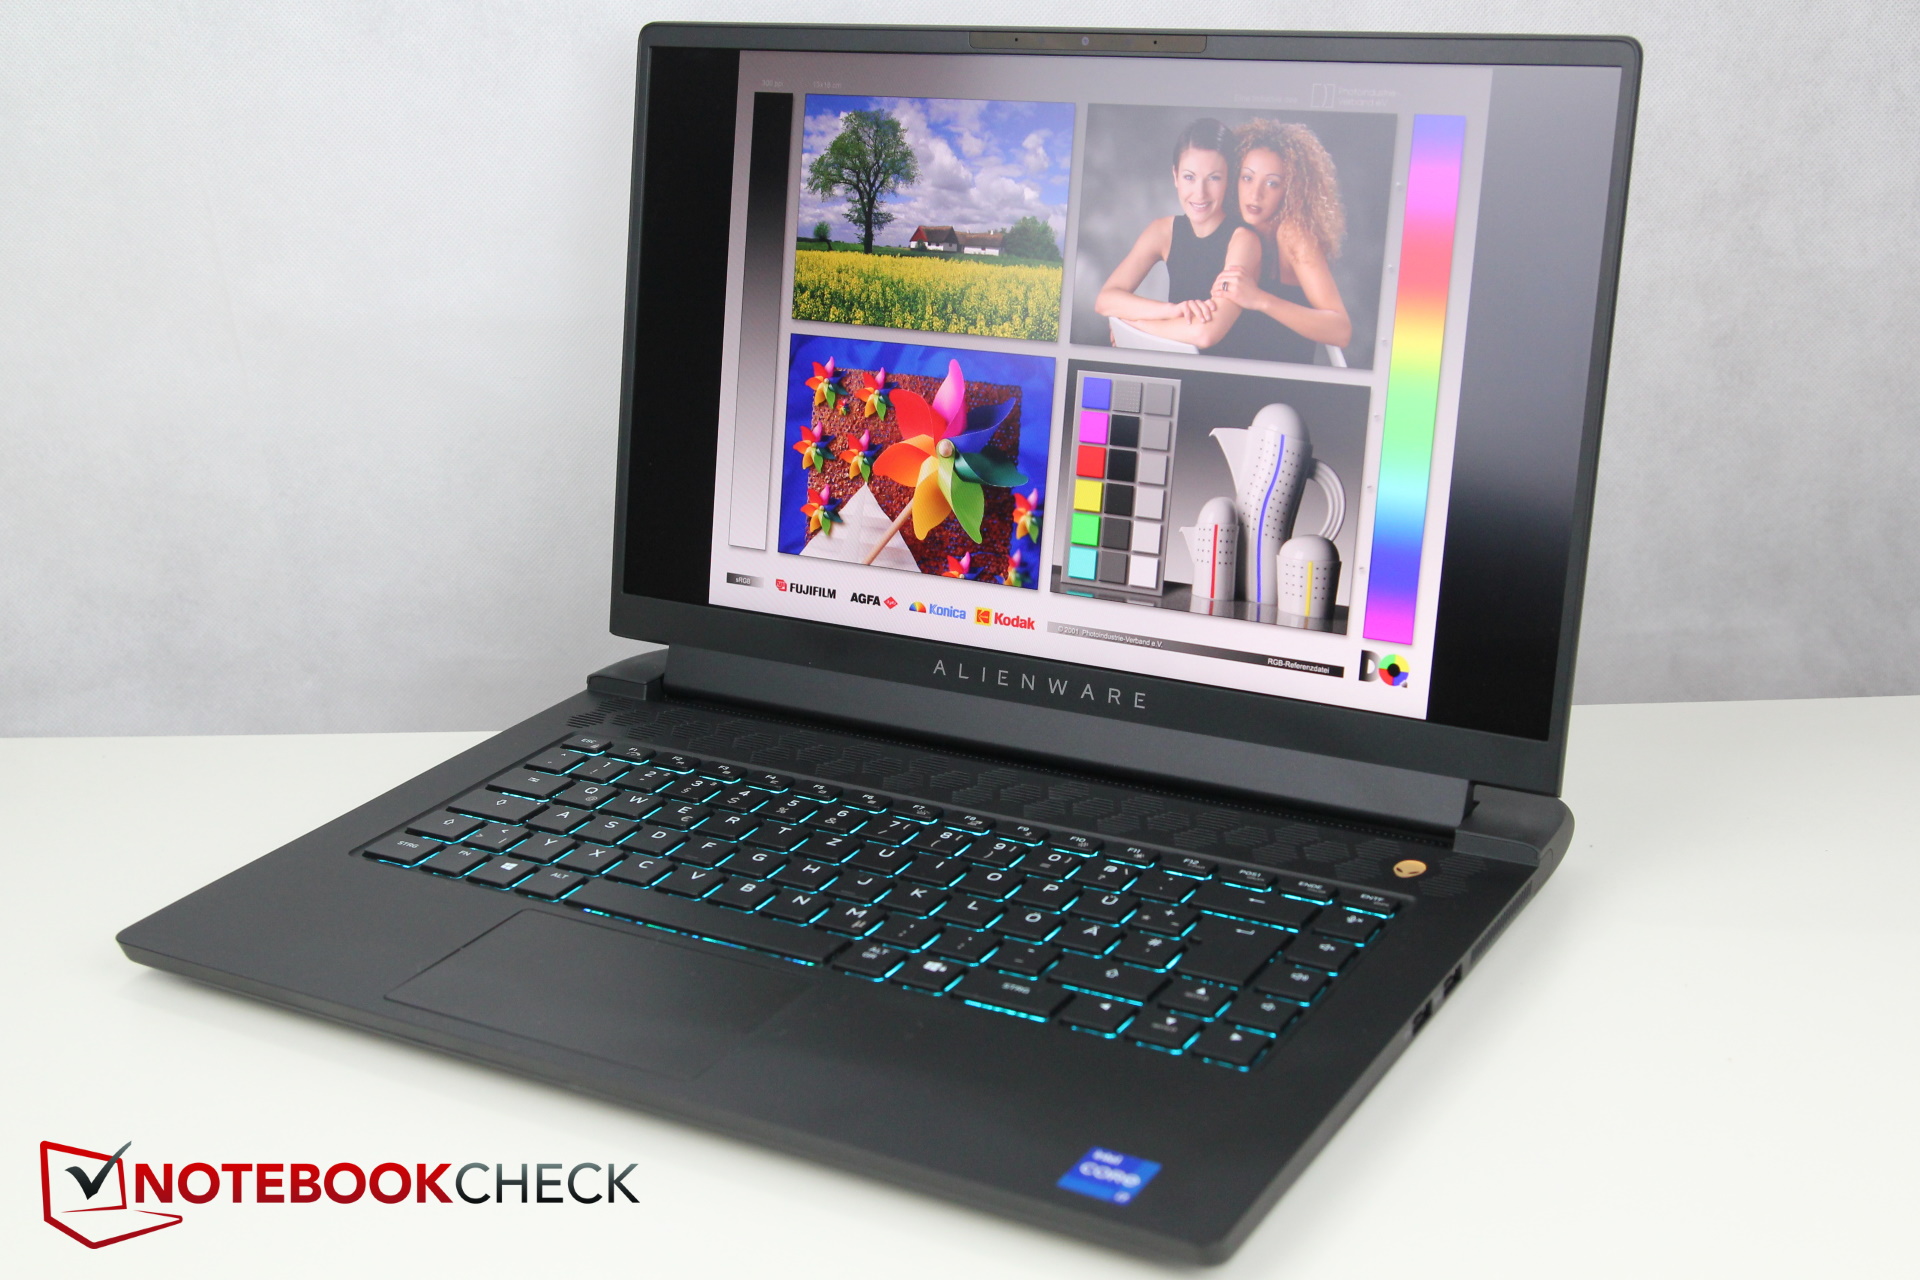
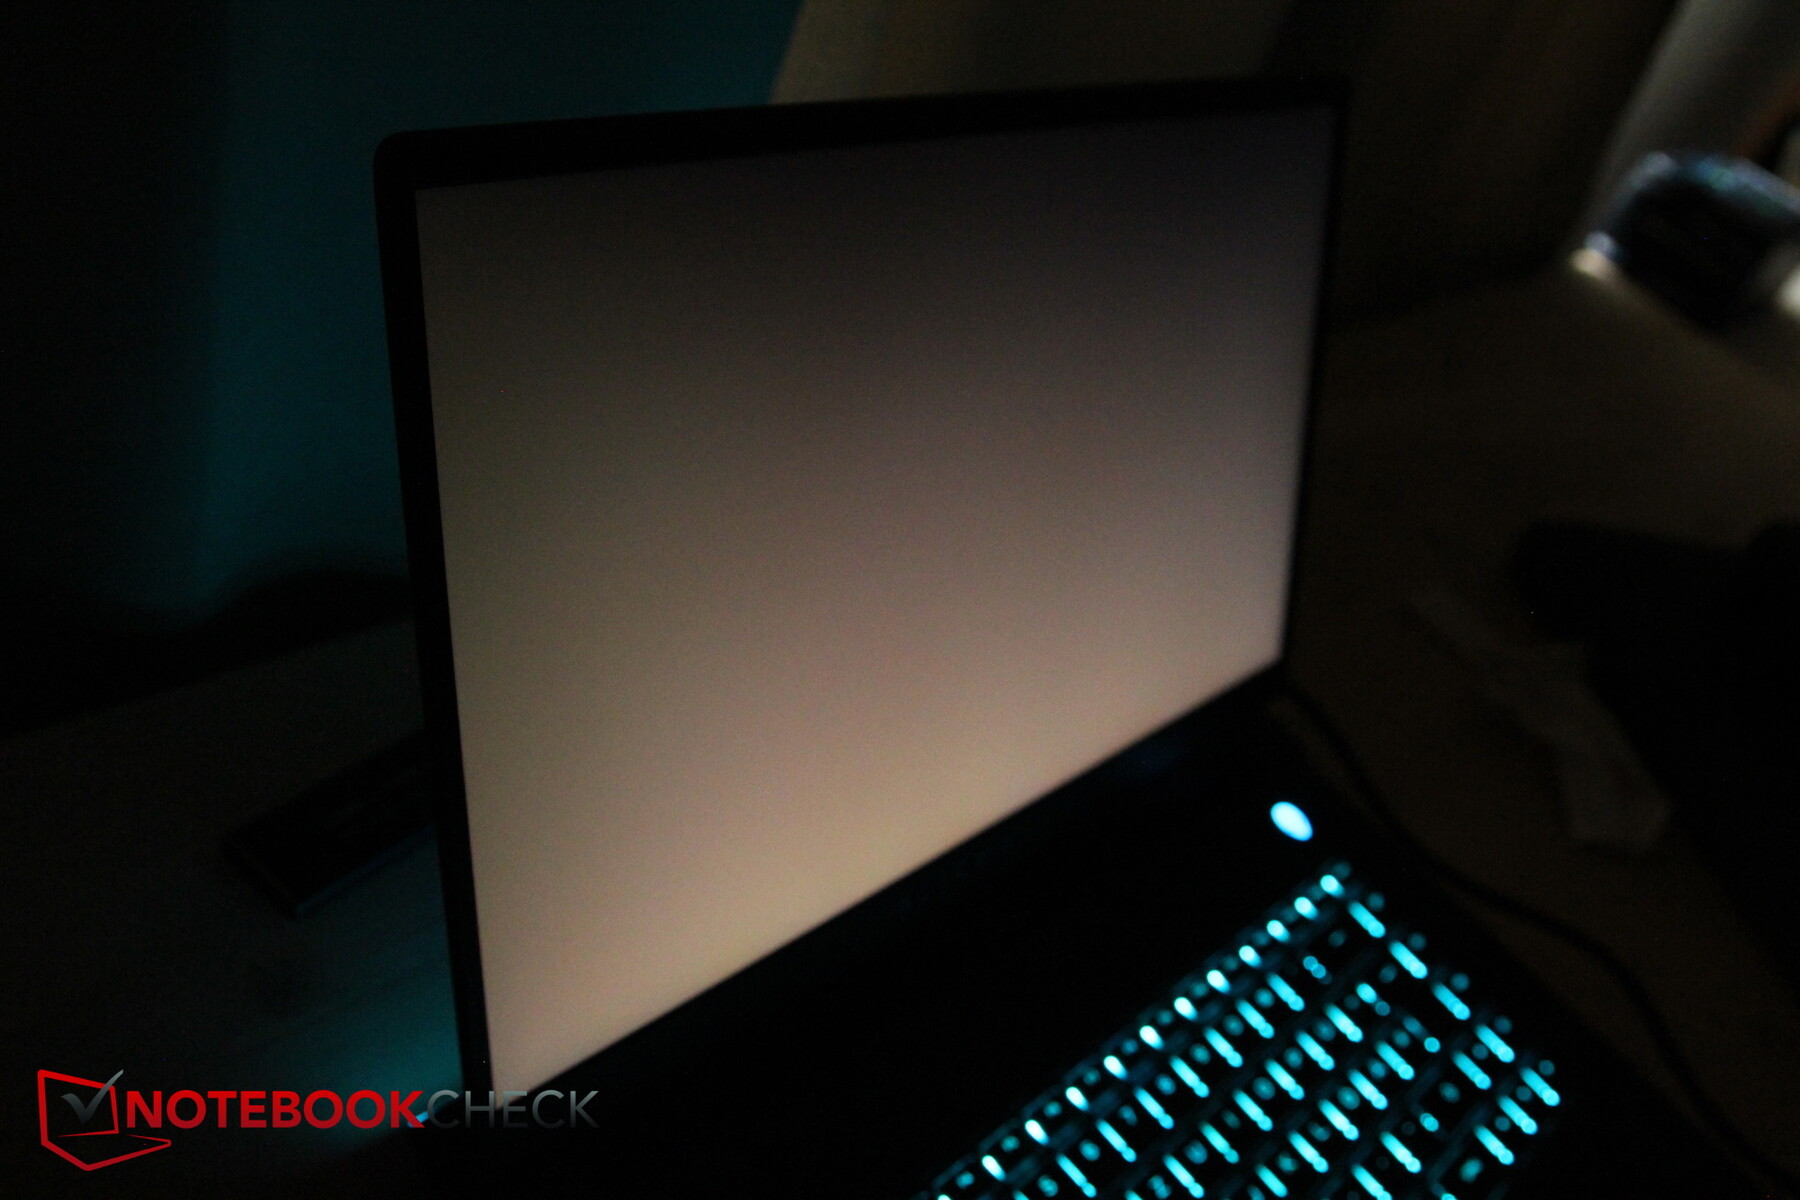
Le fait qu'il n'y ait pas beaucoup de soleil pendant ce test contribue à faciliter la lisibilité du contenu de l'écran de l'Alienware. Même avec des angles de vision très prononcés, l'écran mat et assez lumineux assure une bonne lisibilité, au moins par temps nuageux et à l'ombre
Comme c'est le cas pour les écrans IPS, la stabilité de l'angle de vision est moins problématique. Cependant, on remarque toujours que la luminosité est meilleure en regardant directement l'écran qu'à partir d'angles de vue abrupts, mais cette légère baisse reste acceptable.

Performance - Seulement 125 W pour la RTX 3080
Avec sonIntel Core i7-11800Het NVIDIA GeForce RTX 3080 Mobile GPUnotre unité de test représente le haut de gamme des configurations. Sinon, vous pouvez aussi configurer l'Alienware, qui peut clairement être considéré comme un ordinateur portable de jeu, avec un RTX 3070 ou RTX 3060, et même avec un plus faible Intel Core i5 11400HCPU

Conditions d'essai
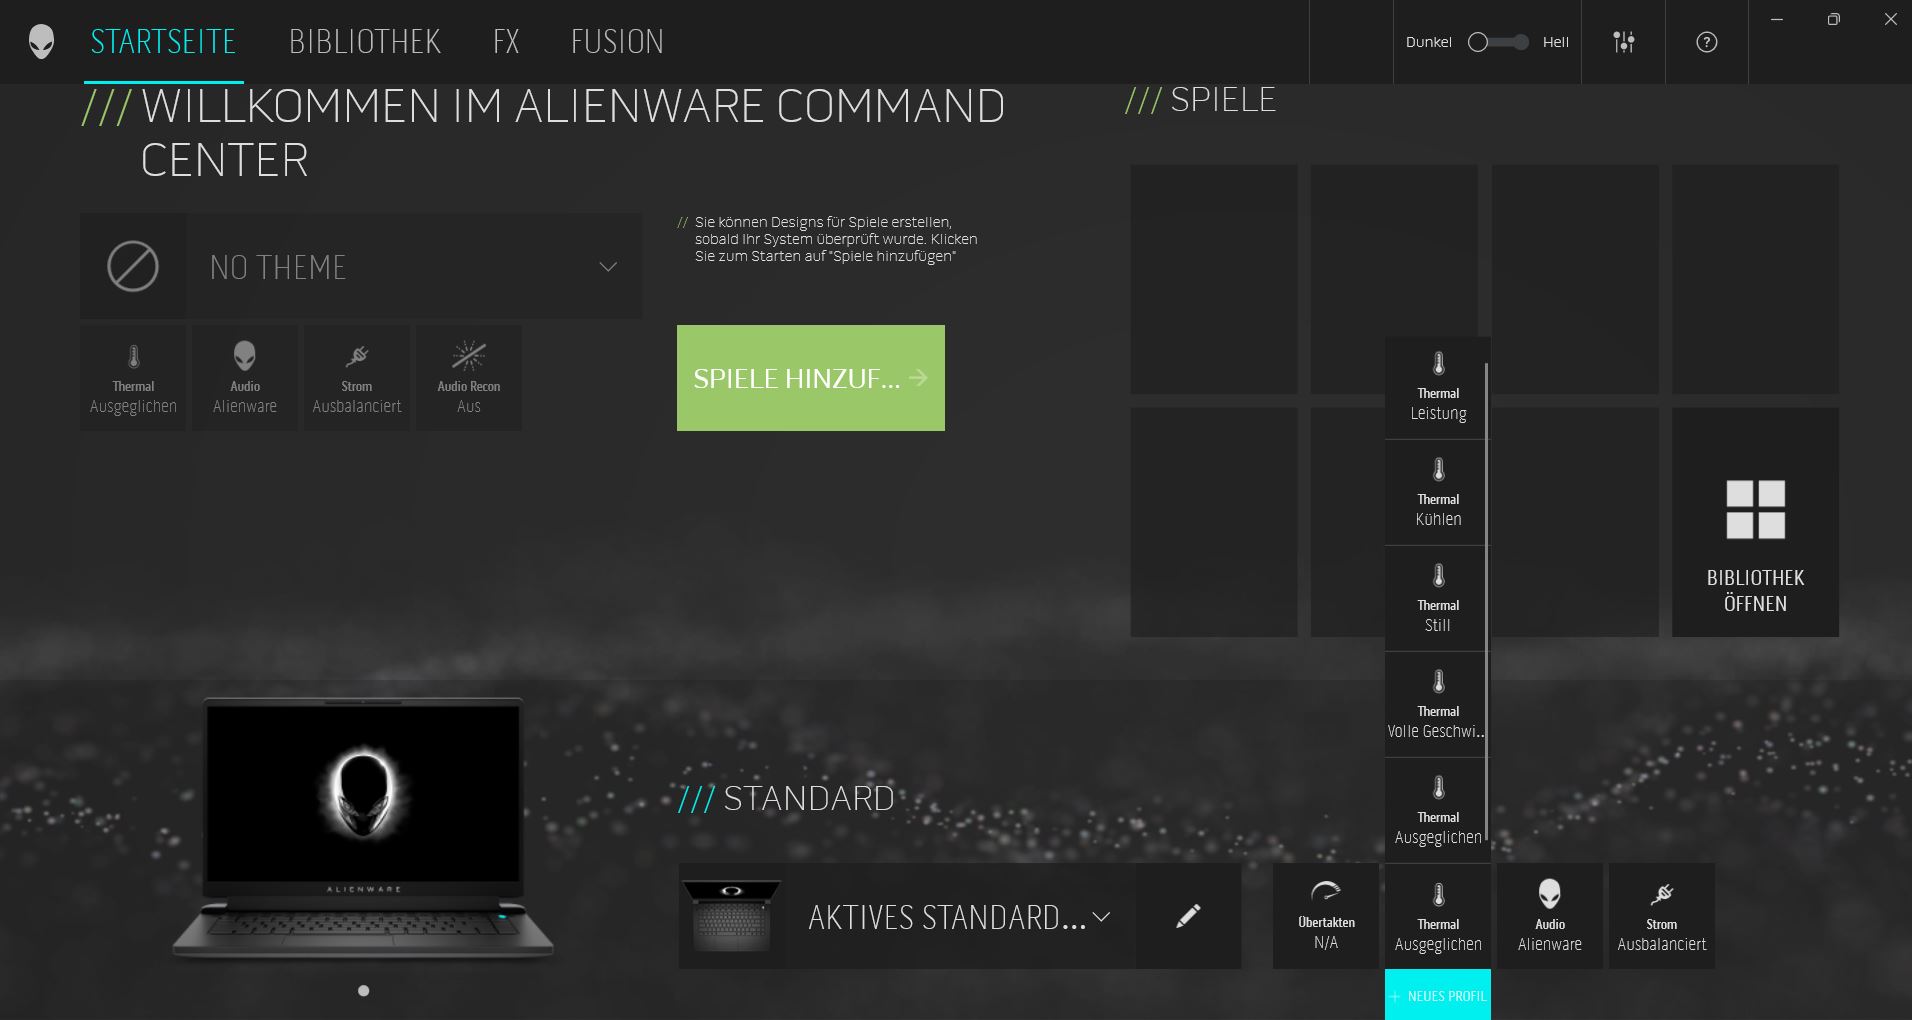
Le centre de commande Alienware propose de nombreux profils de ventilateurs avec des noms peu intuitifs, et la description des modes n'est réalisée que par un système de petites étoiles. Quelles peuvent être les différences entre "Performance", "Full Performance" et "Cooling" ? Étant donné que les ventilateurs tournent toujours bruyamment dans les trois modes, même en mode de repos (le mode "Full Performance" est encore plus bruyant que le mode "Performance"), nous avons effectué les tests et les mesures de bruit en mode "Balanced". Même si cela va à l'encontre de notre approche consistant à tester les ordinateurs portables de jeu en utilisant le mode le plus performant, au moins la mesure du bruit aura alors un sens.
L'Alienware Command Center (ACC) a également besoin d'un temps particulièrement long pour terminer son chargement lors de chaque démarrage du système. Même lorsque, subjectivement, tous les autres processus Windows ont fini de se charger, l'ACC a encore besoin de temps. Bien que vous puissiez déjà le démarrer, vous ne pouvez toujours pas sélectionner les modes de ventilation dans l'aperçu pendant un certain temps
Le comportement de l'Alienware lorsqu'on l'allume est également étrange. Lorsque vous appuyez sur le bouton d'alimentation, il s'allume en bleu pendant quelques secondes, mais ensuite rien d'autre ne se produit. Ce n'est que lorsque vous appuyez une deuxième fois sur le bouton que l'ordinateur portable démarre vraiment - très ennuyeux !
Windows 11 est installé comme système d'exploitation, ce qui peut encore entraîner quelques problèmes avec certains benchmarks
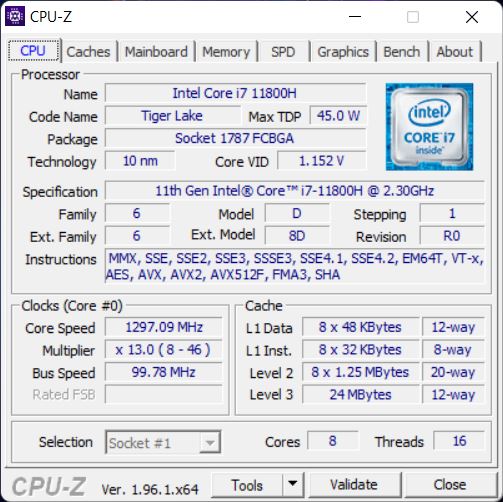
Processeur
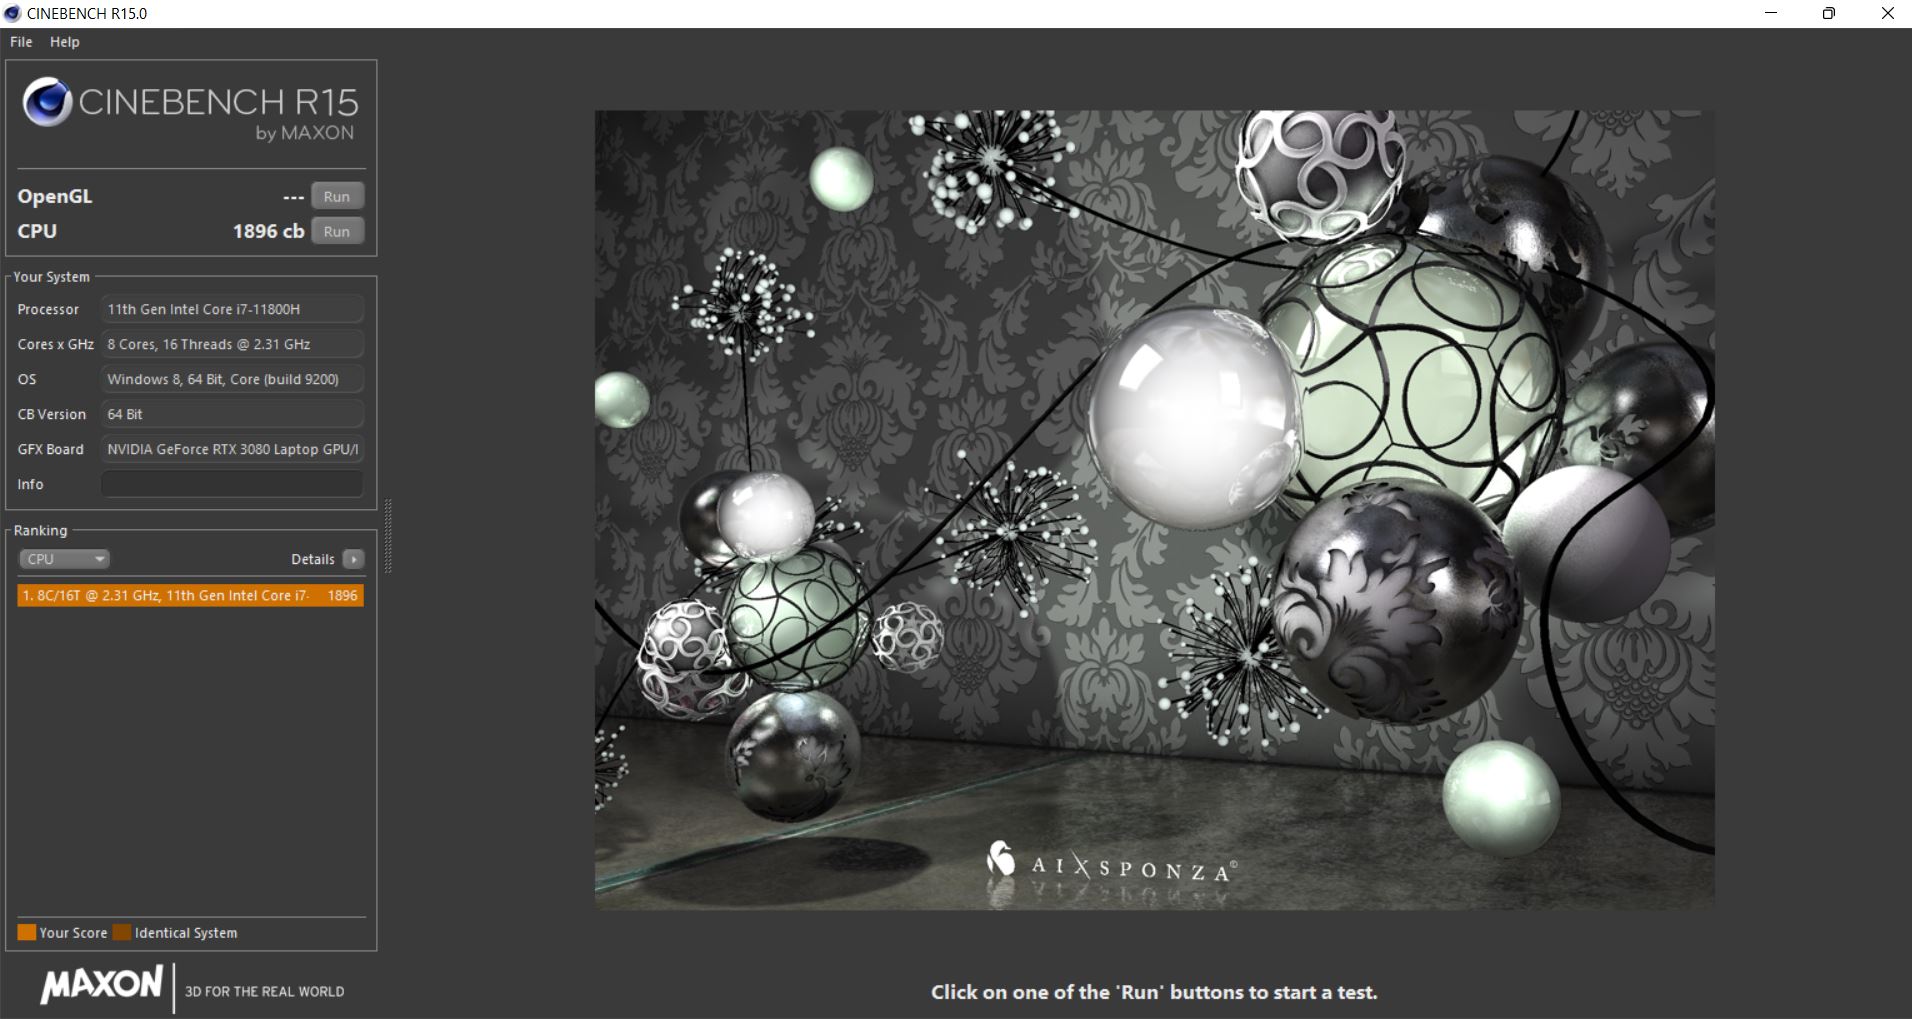
Le siteIntel Core i7-11800Hest issu de la série Tiger Lake, et ses 8 cœurs peuvent atteindre des fréquences d'horloge comprises entre 2,3 et 4,6 GHz (Turbo simple cœur)
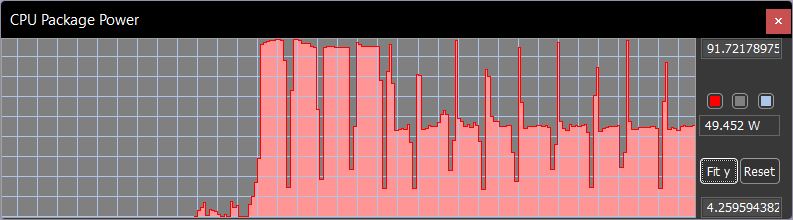
Dans la boucle Cinebench, nous mesurons une légère baisse de performance après les quatre premiers passages. Après cela, les performances sont comparables à celles de l'Intel Core i7-11800H de l'Aorus. Pendant les quatre premiers runs, le TDP est d'environ 90 watts. Ensuite, il commence à se limiter, et à chaque nouvelle exécution, le TDP n'atteindra le maximum que brièvement, avant de retomber à environ 50 watts
Dans la comparaison directe, le Core i7-11800H du Schenker offre les meilleures performances, mais la plupart du temps, l'Alienware accuse un retard d'environ 5 %.
En mode batterie, les performances du processeur Cinebench R15 ne baissent que d'environ 10% par rapport aux performances initiales
Cinebench R15 Multi Constant Load Test
Cinebench R23: Multi Core | Single Core
Cinebench R20: CPU (Multi Core) | CPU (Single Core)
Cinebench R15: CPU Multi 64Bit | CPU Single 64Bit
Blender: v2.79 BMW27 CPU
7-Zip 18.03: 7z b 4 | 7z b 4 -mmt1
Geekbench 5.5: Multi-Core | Single-Core
HWBOT x265 Benchmark v2.2: 4k Preset
LibreOffice : 20 Documents To PDF
R Benchmark 2.5: Overall mean
| CPU Performance rating | |
| Moyenne de la classe Gaming | |
| Schenker XMG Neo 15 Tiger Lake | |
| Alienware m15 R6, i7-11800H RTX 3080 | |
| Alienware m15 R5 Ryzen Edition | |
| Razer Blade 15 Advanced (Mid 2021) -2! | |
| Moyenne Intel Core i7-11800H | |
| Aorus 15P YD -2! | |
| Alienware m15 R4 RTX 3080 | |
| Cinebench R23 / Multi Core | |
| Moyenne de la classe Gaming (10488 - 40970, n=106, 2 dernières années) | |
| Schenker XMG Neo 15 Tiger Lake | |
| Alienware m15 R6, i7-11800H RTX 3080 | |
| Razer Blade 15 Advanced (Mid 2021) | |
| Alienware m15 R5 Ryzen Edition | |
| Moyenne Intel Core i7-11800H (6508 - 14088, n=48) | |
| Alienware m15 R4 RTX 3080 | |
| Cinebench R23 / Single Core | |
| Moyenne de la classe Gaming (1166 - 2356, n=106, 2 dernières années) | |
| Schenker XMG Neo 15 Tiger Lake | |
| Razer Blade 15 Advanced (Mid 2021) | |
| Moyenne Intel Core i7-11800H (1386 - 1522, n=45) | |
| Alienware m15 R6, i7-11800H RTX 3080 | |
| Alienware m15 R5 Ryzen Edition | |
| Alienware m15 R4 RTX 3080 | |
| Cinebench R20 / CPU (Multi Core) | |
| Moyenne de la classe Gaming (4029 - 16108, n=105, 2 dernières années) | |
| Schenker XMG Neo 15 Tiger Lake | |
| Aorus 15P YD | |
| Alienware m15 R5 Ryzen Edition | |
| Razer Blade 15 Advanced (Mid 2021) | |
| Alienware m15 R6, i7-11800H RTX 3080 | |
| Moyenne Intel Core i7-11800H (2498 - 5408, n=50) | |
| Alienware m15 R4 RTX 3080 | |
| Cinebench R20 / CPU (Single Core) | |
| Moyenne de la classe Gaming (442 - 895, n=105, 2 dernières années) | |
| Aorus 15P YD | |
| Razer Blade 15 Advanced (Mid 2021) | |
| Schenker XMG Neo 15 Tiger Lake | |
| Alienware m15 R6, i7-11800H RTX 3080 | |
| Moyenne Intel Core i7-11800H (520 - 586, n=47) | |
| Alienware m15 R5 Ryzen Edition | |
| Alienware m15 R4 RTX 3080 | |
| Cinebench R15 / CPU Multi 64Bit | |
| Moyenne de la classe Gaming (1578 - 6271, n=104, 2 dernières années) | |
| Schenker XMG Neo 15 Tiger Lake | |
| Alienware m15 R6, i7-11800H RTX 3080 | |
| Alienware m15 R5 Ryzen Edition | |
| Aorus 15P YD | |
| Moyenne Intel Core i7-11800H (1342 - 2173, n=50) | |
| Razer Blade 15 Advanced (Mid 2021) | |
| Alienware m15 R4 RTX 3080 | |
| Cinebench R15 / CPU Single 64Bit | |
| Moyenne de la classe Gaming (188.8 - 343, n=105, 2 dernières années) | |
| Alienware m15 R5 Ryzen Edition | |
| Aorus 15P YD | |
| Schenker XMG Neo 15 Tiger Lake | |
| Razer Blade 15 Advanced (Mid 2021) | |
| Alienware m15 R6, i7-11800H RTX 3080 | |
| Moyenne Intel Core i7-11800H (201 - 231, n=46) | |
| Alienware m15 R4 RTX 3080 | |
| Blender / v2.79 BMW27 CPU | |
| Aorus 15P YD | |
| Alienware m15 R4 RTX 3080 | |
| Moyenne Intel Core i7-11800H (217 - 454, n=46) | |
| Alienware m15 R6, i7-11800H RTX 3080 | |
| Razer Blade 15 Advanced (Mid 2021) | |
| Alienware m15 R5 Ryzen Edition | |
| Schenker XMG Neo 15 Tiger Lake | |
| Moyenne de la classe Gaming (80 - 330, n=103, 2 dernières années) | |
| 7-Zip 18.03 / 7z b 4 | |
| Moyenne de la classe Gaming (33491 - 148086, n=104, 2 dernières années) | |
| Schenker XMG Neo 15 Tiger Lake | |
| Alienware m15 R5 Ryzen Edition | |
| Razer Blade 15 Advanced (Mid 2021) | |
| Alienware m15 R6, i7-11800H RTX 3080 | |
| Alienware m15 R4 RTX 3080 | |
| Moyenne Intel Core i7-11800H (33718 - 56758, n=46) | |
| Aorus 15P YD | |
| 7-Zip 18.03 / 7z b 4 -mmt1 | |
| Moyenne de la classe Gaming (4199 - 7436, n=104, 2 dernières années) | |
| Schenker XMG Neo 15 Tiger Lake | |
| Alienware m15 R5 Ryzen Edition | |
| Aorus 15P YD | |
| Moyenne Intel Core i7-11800H (5138 - 5732, n=46) | |
| Razer Blade 15 Advanced (Mid 2021) | |
| Alienware m15 R6, i7-11800H RTX 3080 | |
| Alienware m15 R4 RTX 3080 | |
| Geekbench 5.5 / Multi-Core | |
| Moyenne de la classe Gaming (6460 - 27010, n=104, 2 dernières années) | |
| Schenker XMG Neo 15 Tiger Lake | |
| Alienware m15 R6, i7-11800H RTX 3080 | |
| Aorus 15P YD | |
| Moyenne Intel Core i7-11800H (4655 - 9851, n=40) | |
| Alienware m15 R4 RTX 3080 | |
| Alienware m15 R5 Ryzen Edition | |
| Geekbench 5.5 / Single-Core | |
| Moyenne de la classe Gaming (986 - 2474, n=104, 2 dernières années) | |
| Schenker XMG Neo 15 Tiger Lake | |
| Aorus 15P YD | |
| Alienware m15 R6, i7-11800H RTX 3080 | |
| Moyenne Intel Core i7-11800H (1429 - 1625, n=40) | |
| Alienware m15 R5 Ryzen Edition | |
| Alienware m15 R4 RTX 3080 | |
| HWBOT x265 Benchmark v2.2 / 4k Preset | |
| Moyenne de la classe Gaming (11.5 - 44.3, n=104, 2 dernières années) | |
| Schenker XMG Neo 15 Tiger Lake | |
| Razer Blade 15 Advanced (Mid 2021) | |
| Alienware m15 R5 Ryzen Edition | |
| Moyenne Intel Core i7-11800H (7.38 - 17.4, n=46) | |
| Alienware m15 R6, i7-11800H RTX 3080 | |
| Alienware m15 R4 RTX 3080 | |
| Aorus 15P YD | |
| LibreOffice / 20 Documents To PDF | |
| Alienware m15 R4 RTX 3080 | |
| Alienware m15 R5 Ryzen Edition | |
| Moyenne de la classe Gaming (33.2 - 88.8, n=104, 2 dernières années) | |
| Schenker XMG Neo 15 Tiger Lake | |
| Moyenne Intel Core i7-11800H (38.6 - 59.9, n=45) | |
| Razer Blade 15 Advanced (Mid 2021) | |
| Alienware m15 R6, i7-11800H RTX 3080 | |
| Aorus 15P YD | |
| R Benchmark 2.5 / Overall mean | |
| Alienware m15 R4 RTX 3080 | |
| Moyenne Intel Core i7-11800H (0.548 - 0.615, n=46) | |
| Aorus 15P YD | |
| Alienware m15 R6, i7-11800H RTX 3080 | |
| Schenker XMG Neo 15 Tiger Lake | |
| Razer Blade 15 Advanced (Mid 2021) | |
| Alienware m15 R5 Ryzen Edition | |
| Moyenne de la classe Gaming (0.3439 - 0.759, n=105, 2 dernières années) | |
* ... Moindre est la valeur, meilleures sont les performances
AIDA64: FP32 Ray-Trace | FPU Julia | CPU SHA3 | CPU Queen | FPU SinJulia | FPU Mandel | CPU AES | CPU ZLib | FP64 Ray-Trace | CPU PhotoWorxx
| Performance rating | |
| Moyenne de la classe Gaming | |
| Alienware m15 R6, i7-11800H RTX 3080 | |
| Alienware m15 R5 Ryzen Edition | |
| Moyenne Intel Core i7-11800H | |
| Alienware m15 R4 RTX 3080 | |
| Aorus 15P YD -9! | |
| Schenker XMG Neo 15 Tiger Lake -9! | |
| Razer Blade 15 Advanced (Mid 2021) -9! | |
| AIDA64 / FP32 Ray-Trace | |
| Moyenne de la classe Gaming (10227 - 85542, n=103, 2 dernières années) | |
| Alienware m15 R6, i7-11800H RTX 3080 | |
| Alienware m15 R5 Ryzen Edition | |
| Alienware m15 R4 RTX 3080 | |
| Moyenne Intel Core i7-11800H (8772 - 15961, n=20) | |
| AIDA64 / FPU Julia | |
| Moyenne de la classe Gaming (51376 - 238426, n=103, 2 dernières années) | |
| Alienware m15 R5 Ryzen Edition | |
| Alienware m15 R4 RTX 3080 | |
| Alienware m15 R6, i7-11800H RTX 3080 | |
| Moyenne Intel Core i7-11800H (39404 - 65636, n=20) | |
| AIDA64 / CPU SHA3 | |
| Moyenne de la classe Gaming (2180 - 9817, n=103, 2 dernières années) | |
| Alienware m15 R6, i7-11800H RTX 3080 | |
| Moyenne Intel Core i7-11800H (2599 - 4439, n=20) | |
| Alienware m15 R4 RTX 3080 | |
| Alienware m15 R5 Ryzen Edition | |
| AIDA64 / CPU Queen | |
| Moyenne de la classe Gaming (49785 - 173351, n=90, 2 dernières années) | |
| Alienware m15 R5 Ryzen Edition | |
| Alienware m15 R4 RTX 3080 | |
| Alienware m15 R6, i7-11800H RTX 3080 | |
| Moyenne Intel Core i7-11800H (85233 - 91941, n=20) | |
| AIDA64 / FPU SinJulia | |
| Moyenne de la classe Gaming (4424 - 33636, n=103, 2 dernières années) | |
| Alienware m15 R5 Ryzen Edition | |
| Alienware m15 R4 RTX 3080 | |
| Alienware m15 R6, i7-11800H RTX 3080 | |
| Moyenne Intel Core i7-11800H (6420 - 9792, n=20) | |
| AIDA64 / FPU Mandel | |
| Moyenne de la classe Gaming (25115 - 128721, n=103, 2 dernières années) | |
| Alienware m15 R5 Ryzen Edition | |
| Alienware m15 R6, i7-11800H RTX 3080 | |
| Moyenne Intel Core i7-11800H (23365 - 39464, n=20) | |
| Alienware m15 R4 RTX 3080 | |
| AIDA64 / CPU AES | |
| Alienware m15 R6, i7-11800H RTX 3080 | |
| Moyenne Intel Core i7-11800H (74617 - 149388, n=20) | |
| Alienware m15 R5 Ryzen Edition | |
| Moyenne de la classe Gaming (39258 - 247074, n=103, 2 dernières années) | |
| Alienware m15 R4 RTX 3080 | |
| AIDA64 / CPU ZLib | |
| Moyenne de la classe Gaming (574 - 2531, n=103, 2 dernières années) | |
| Alienware m15 R6, i7-11800H RTX 3080 | |
| Alienware m15 R5 Ryzen Edition | |
| Alienware m15 R4 RTX 3080 | |
| Moyenne Intel Core i7-11800H (461 - 830, n=43) | |
| Aorus 15P YD | |
| Schenker XMG Neo 15 Tiger Lake | |
| Razer Blade 15 Advanced (Mid 2021) | |
| AIDA64 / FP64 Ray-Trace | |
| Moyenne de la classe Gaming (5509 - 45446, n=103, 2 dernières années) | |
| Alienware m15 R6, i7-11800H RTX 3080 | |
| Alienware m15 R5 Ryzen Edition | |
| Alienware m15 R4 RTX 3080 | |
| Moyenne Intel Core i7-11800H (4545 - 8717, n=21) | |
| AIDA64 / CPU PhotoWorxx | |
| Moyenne de la classe Gaming (12271 - 89891, n=103, 2 dernières années) | |
| Alienware m15 R6, i7-11800H RTX 3080 | |
| Moyenne Intel Core i7-11800H (11898 - 26757, n=21) | |
| Alienware m15 R4 RTX 3080 | |
| Alienware m15 R5 Ryzen Edition | |
Performance du système
Le benchmark PCMark 10 ne différencie pas très bien les concurrents les uns des autres, du moins pas dans le score global. Le Razer Blade semble être légèrement en avance dans les sous tests, mais l'Alienware le défie, restant environ 5% derrière seulement dans le benchmark Essentials
| PCMark 10 / Score | |
| Moyenne de la classe Gaming (5828 - 11574, n=92, 2 dernières années) | |
| Razer Blade 15 Advanced (Mid 2021) | |
| Aorus 15P YD | |
| Schenker XMG Neo 15 Tiger Lake | |
| Alienware m15 R6, i7-11800H RTX 3080 | |
| Moyenne Intel Core i7-11800H, NVIDIA GeForce RTX 3080 Laptop GPU (6673 - 7470, n=11) | |
| Alienware m15 R4 RTX 3080 | |
| Alienware m15 R5 Ryzen Edition | |
| PCMark 10 / Essentials | |
| Razer Blade 15 Advanced (Mid 2021) | |
| Moyenne de la classe Gaming (8810 - 11935, n=96, 2 dernières années) | |
| Aorus 15P YD | |
| Moyenne Intel Core i7-11800H, NVIDIA GeForce RTX 3080 Laptop GPU (9862 - 11064, n=11) | |
| Schenker XMG Neo 15 Tiger Lake | |
| Alienware m15 R6, i7-11800H RTX 3080 | |
| Alienware m15 R4 RTX 3080 | |
| Alienware m15 R5 Ryzen Edition | |
| PCMark 10 / Productivity | |
| Moyenne de la classe Gaming (6845 - 21327, n=94, 2 dernières années) | |
| Alienware m15 R6, i7-11800H RTX 3080 | |
| Alienware m15 R4 RTX 3080 | |
| Aorus 15P YD | |
| Moyenne Intel Core i7-11800H, NVIDIA GeForce RTX 3080 Laptop GPU (8278 - 9803, n=11) | |
| Razer Blade 15 Advanced (Mid 2021) | |
| Schenker XMG Neo 15 Tiger Lake | |
| Alienware m15 R5 Ryzen Edition | |
| PCMark 10 / Digital Content Creation | |
| Moyenne de la classe Gaming (7602 - 19657, n=94, 2 dernières années) | |
| Schenker XMG Neo 15 Tiger Lake | |
| Razer Blade 15 Advanced (Mid 2021) | |
| Alienware m15 R6, i7-11800H RTX 3080 | |
| Moyenne Intel Core i7-11800H, NVIDIA GeForce RTX 3080 Laptop GPU (9881 - 11323, n=11) | |
| Aorus 15P YD | |
| Alienware m15 R4 RTX 3080 | |
| Alienware m15 R5 Ryzen Edition | |
| PCMark 10 Score | 7177 points | |
Aide | ||
| AIDA64 / Memory Copy | |
| Moyenne de la classe Gaming (21750 - 129946, n=103, 2 dernières années) | |
| Alienware m15 R6, i7-11800H RTX 3080 | |
| Moyenne Intel Core i7-11800H (24508 - 48144, n=21) | |
| Alienware m15 R5 Ryzen Edition | |
| Alienware m15 R4 RTX 3080 | |
| AIDA64 / Memory Read | |
| Moyenne de la classe Gaming (22956 - 118858, n=103, 2 dernières années) | |
| Alienware m15 R6, i7-11800H RTX 3080 | |
| Moyenne Intel Core i7-11800H (25882 - 50365, n=20) | |
| Alienware m15 R5 Ryzen Edition | |
| Alienware m15 R4 RTX 3080 | |
| AIDA64 / Memory Write | |
| Moyenne de la classe Gaming (22297 - 135096, n=103, 2 dernières années) | |
| Alienware m15 R6, i7-11800H RTX 3080 | |
| Moyenne Intel Core i7-11800H (22240 - 46214, n=20) | |
| Alienware m15 R4 RTX 3080 | |
| Alienware m15 R5 Ryzen Edition | |
| AIDA64 / Memory Latency | |
| Moyenne de la classe Gaming (75.3 - 259, n=103, 2 dernières années) | |
| Alienware m15 R6, i7-11800H RTX 3080 | |
| Alienware m15 R5 Ryzen Edition | |
| Alienware m15 R4 RTX 3080 | |
| Moyenne Intel Core i7-11800H (71.9 - 104.1, n=44) | |
| Aorus 15P YD | |
| Schenker XMG Neo 15 Tiger Lake | |
| Razer Blade 15 Advanced (Mid 2021) | |
* ... Moindre est la valeur, meilleures sont les performances
Latences DPC
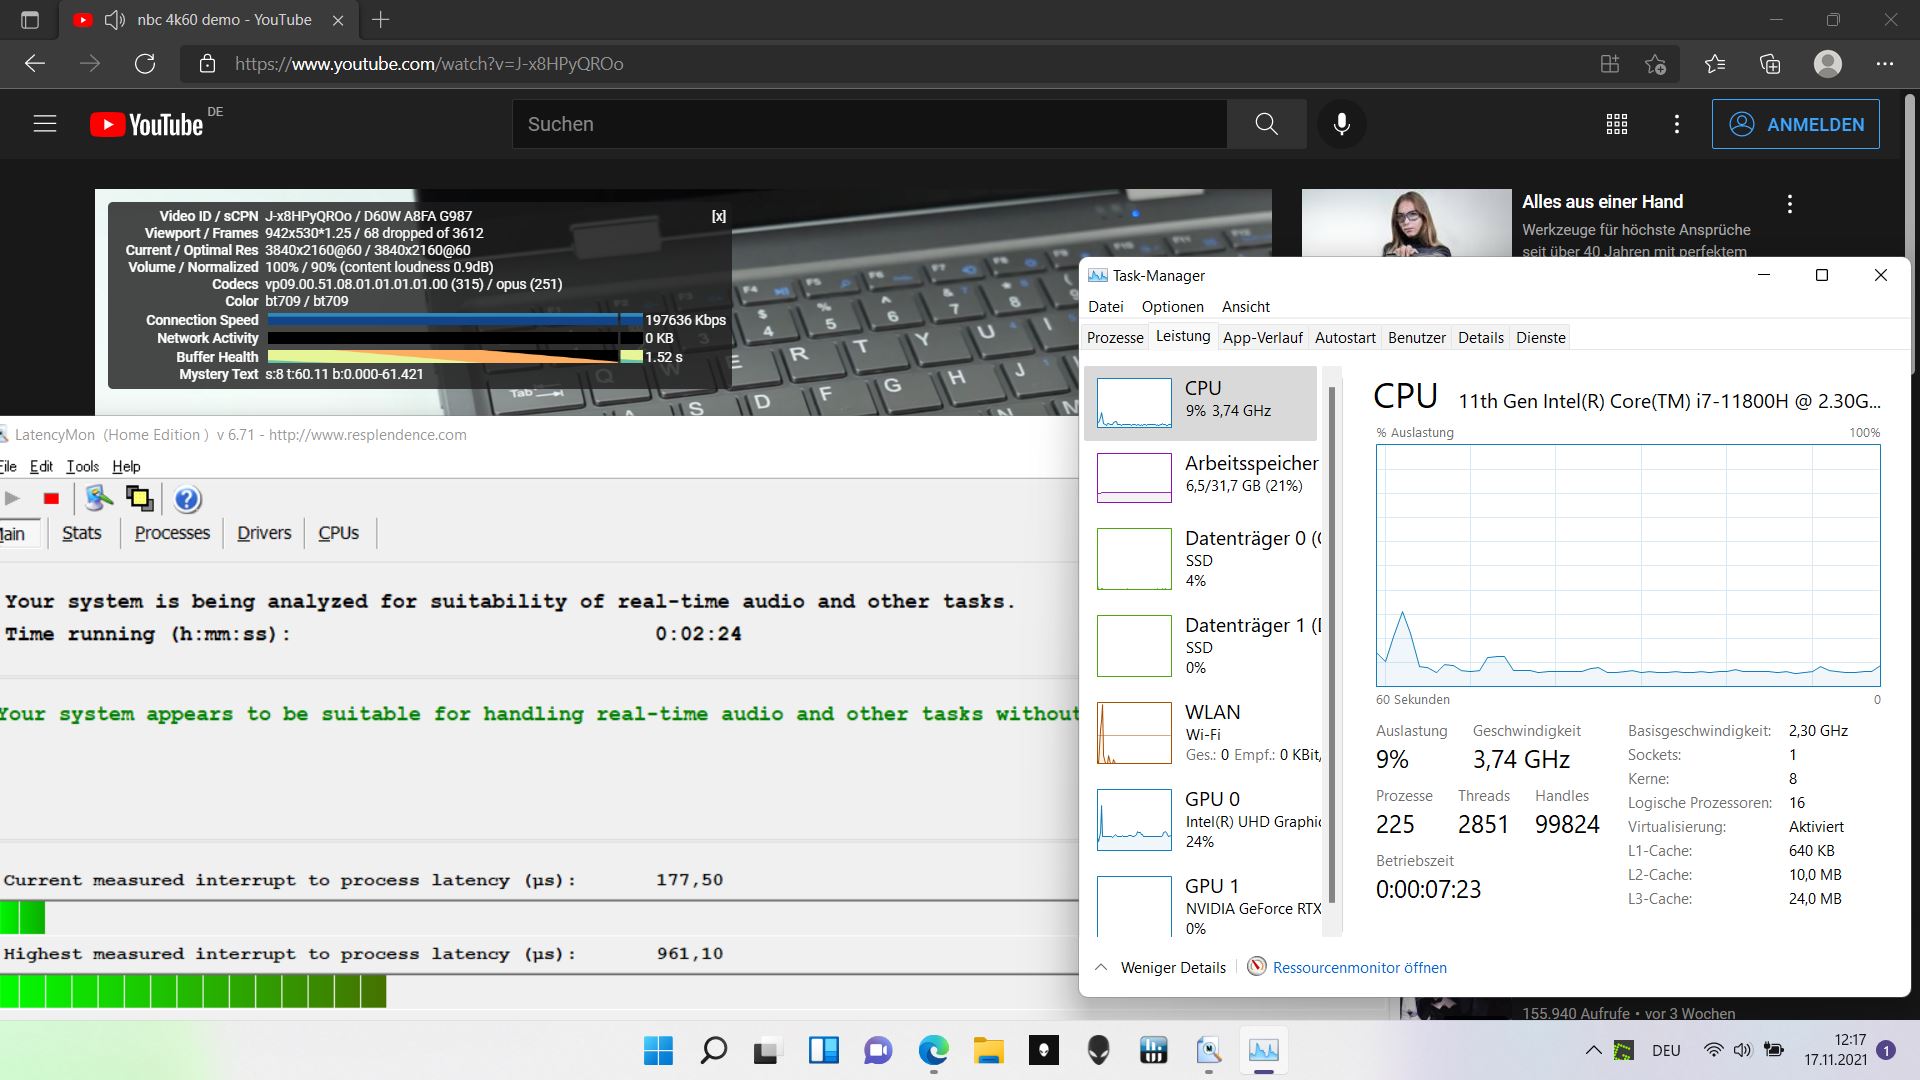
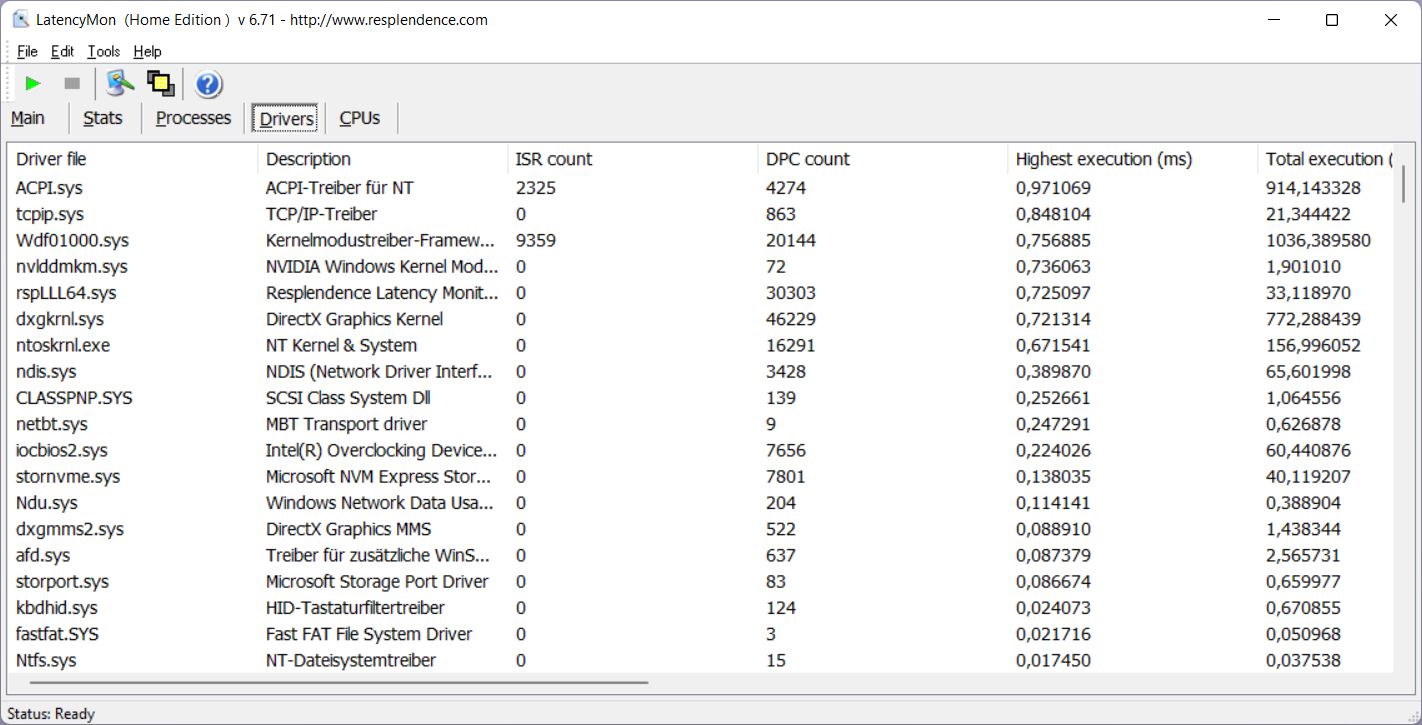
L'outil LatencyMon ne détecte aucun retard significatif, ni lors de l'ouverture de plusieurs onglets de navigateur, ni lors de la diffusion de vidéos en streaming ou lors de la charge CPU via Prime95. En revanche, notre vidéo YouTube 4K/60 fps a été reproduite avec un total de 68 images perdues

| DPC Latencies / LatencyMon - interrupt to process latency (max), Web, Youtube, Prime95 | |
| Razer Blade 15 Advanced (Mid 2021) | |
| Alienware m15 R6, i7-11800H RTX 3080 | |
| Aorus 15P YD | |
| Alienware m15 R4 RTX 3080 | |
| Schenker XMG Neo 15 Tiger Lake | |
| Alienware m15 R5 Ryzen Edition | |
* ... Moindre est la valeur, meilleures sont les performances
Solution de stockage
Dell a équipé le m15 R6 de deux SSD NVMe de 1 To de Samsung, ce qui permet de disposer d'une grande quantité de stockage avec un total de 2 To. Même si le Samsung PM9A1 occupe la troisième place dans notre Base de données SSDil n'est pas en mesure de s'approcher de ses vitesses théoriquement élevées dans le R6. Il y a un certain potentiel gaspillé ici, mais la vitesse n'est pas mauvaise du tout

* ... Moindre est la valeur, meilleures sont les performances
Constant Performance Reading: DiskSpd Read Loop, Queue Depth 8
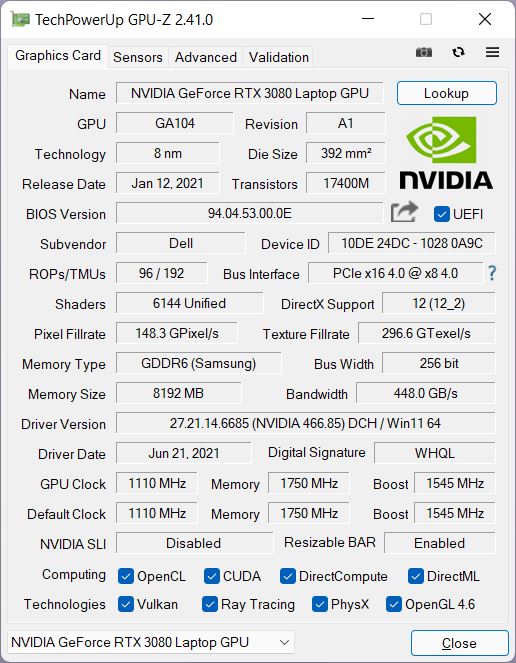
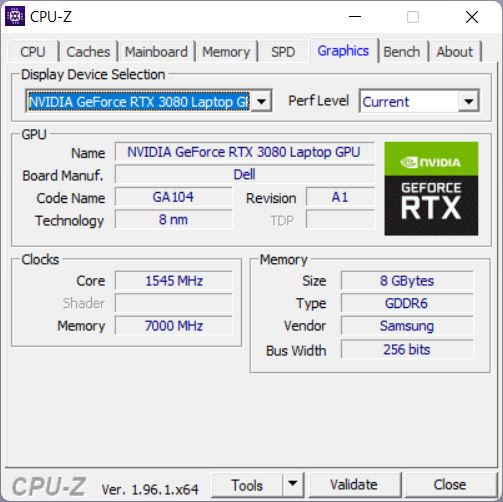
Carte graphique
Le R6 contient un NVIDIA GeForce RTX 3080 Mobile GPUqui est capable de consommer 125 watts, dont 10 watts de boost dynamique. Si l'on considère le fait que certains ordinateurs portables RTX 3080 sont configurés avec jusqu'à 165 watts, cela semble assez faible, en particulier pour un ordinateur portable Alienware. Par exemple, même le R6 avec l'option RTX 3070 est capable d'utiliser 130 watts
Dans les tests 3DMark, les performances de l'Alienware correspondent assez exactement à la moyenne, du fait de sa RTX 3080. Cependant, le "vieux" R4 avec la RTX 3080 et Intel Core i9-10980HK Comet Lake est sensiblement plus rapide la plupart du temps. Ce n'est pas une surprise, puisque le GPU de la R4 est capable de consommer 140 watts.
En mode batterie, l'exécution de 3DMark 11 ne donne que 16 083 points au lieu des 30 178 points précédents, ce qui correspond à une diminution de 47 %
| 3DMark 11 Performance | 30178 points | |
| 3DMark Cloud Gate Standard Score | 53399 points | |
| 3DMark Fire Strike Score | 24014 points | |
| 3DMark Time Spy Score | 10763 points | |
Aide | ||
Performances en matière de jeux
Malgré la RTX 3080 légèrement bridée, l'Alienware est capable d'afficher tous les jeux modernes au maximum de détails et en résolution Full HD, et il devrait même y avoir suffisamment de réserves pour les résolutions 4K.
Dans l'ensemble, les performances du R6 sont encore une fois assez proches de la moyenne des autres ordinateurs portables avec un RTX 3080 de notre base de données. Cependant, la plupart de ses concurrents directs sont encore plus rapides, avec l'ancien m15 R4 en tête. Il semble un peu étrange que l'on limite les performances par rapport à son prédécesseur, peut-être pour pouvoir assurer un meilleur refroidissement du système.
Les modes de ventilation semblent n'avoir que peu d'influence sur les performances. En mode Performance, de nombreux jeux ne profiteront que très peu ou pas du tout du refroidissement supplémentaire théorique (GTA V), mais dans certains jeux, nous pouvons voir un avantage minime (Strange Brigade, + 3-5%).
| New World | |
| 1920x1080 Medium Video Quality | |
| Alienware m15 R6, i7-11800H RTX 3080 | |
| Moyenne NVIDIA GeForce RTX 3080 Laptop GPU (80.8 - 105.4, n=4) | |
| 1920x1080 High Video Quality | |
| Alienware m15 R6, i7-11800H RTX 3080 | |
| Moyenne NVIDIA GeForce RTX 3080 Laptop GPU (75.1 - 96.7, n=4) | |
| 1920x1080 Very High Video Quality | |
| Alienware m15 R6, i7-11800H RTX 3080 | |
| Moyenne NVIDIA GeForce RTX 3080 Laptop GPU (71.5 - 90.4, n=4) | |
Pendant une heure d'utilisation de The Witcher 3, la fréquence d'images ne baisse que légèrement, ce qui signifie que les performances sont assez constantes, et que les aberrations ou les baisses restent l'exception
The Witcher 3 FPS Chart
| Bas | Moyen | Élevé | Ultra | |
|---|---|---|---|---|
| GTA V (2015) | 183 | 177 | 166 | 99.5 |
| The Witcher 3 (2015) | 312 | 276 | 149 | 108.4 |
| Dota 2 Reborn (2015) | 168 | 151 | 144 | 135 |
| X-Plane 11.11 (2018) | 127 | 110 | 87.9 | |
| Far Cry 5 (2018) | 132 | 126 | 119 | 113 |
| Strange Brigade (2018) | 424 | 261 | 216 | 190 |
| New World (2021) | 115.5 | 95.7 | 91.3 | 84 |
Émissions - Plus chaudes que celles de la plupart des concurrents
Émissions sonores
En fonctionnement au ralenti, les ventilateurs du 6 restent souvent éteints, du moins en mode Équilibré ou Silencieux. En mode Performance, ils sont également bruyants en fonctionnement au ralenti, et de même en mode "Refroidissement". En mode "Full Performance", ils sont encore plus bruyants.
En mode équilibré, les ventilateurs peuvent même monter en régime de temps à autre en mode de ralenti maximal, jusqu'à un niveau sonore d'environ 30 dB. En charge moyenne (3DMark06, premier repère), le R6 reste maintenant encore plus silencieux que certains de ses concurrents.
En revanche, les ventilateurs tournent à plein régime en cas de forte charge. Mais au moins, ici aussi, ils ne sont pas plus bruyants que ceux de l'Aorus ou du Schenker. Cependant, ce n'est pas le cas lorsque vous utilisez le mode Full Performance. Chaque utilisateur doit donc décider lui-même si quelques images de plus valent la peine d'augmenter le niveau sonore.
Sous certains types de charge (3DMark06), nous pouvons entendre un bruit électronique sous la forme d'un bourdonnement. Il est probable qu'il ne soit perceptible qu'à un niveau de charge moyen, et qu'il soit ensuite noyé dans le bruit du ventilateur.
Degré de la nuisance sonore
| Au repos |
| 23 / 23 / 30 dB(A) |
| Fortement sollicité |
| 41.26 / 53.37 dB(A) |
 | ||
30 dB silencieux 40 dB(A) audible 50 dB(A) bruyant |
||
min: | ||
| Alienware m15 R6, i7-11800H RTX 3080 GeForce RTX 3080 Laptop GPU, i7-11800H, Samsung PM9A1 MZVL21T0HCLR | Alienware m15 R5 Ryzen Edition GeForce RTX 3060 Laptop GPU, R7 5800H, Toshiba KBG40ZNS512G NVMe | Alienware m15 R4 RTX 3080 GeForce RTX 3080 Laptop GPU, i9-10980HK, 2x WDC PC SN730 SDBPNTY-512G (RAID 0) | Aorus 15P YD GeForce RTX 3080 Laptop GPU, i7-11800H, Samsung PM9A1 MZVL21T0HCLR | Schenker XMG Neo 15 Tiger Lake GeForce RTX 3080 Laptop GPU, i7-11800H, Samsung SSD 980 Pro 1TB MZ-V8P1T0BW | Razer Blade 15 Advanced (Mid 2021) GeForce RTX 3080 Laptop GPU, i7-11800H, SSSTC CA6-8D1024 | |
|---|---|---|---|---|---|---|
| Noise | -4% | -7% | -10% | -11% | 0% | |
| arrêt / environnement * (dB) | 23 | 24 -4% | 25 -9% | 25 -9% | 25 -9% | 25.1 -9% |
| Idle Minimum * (dB) | 23 | 24 -4% | 25 -9% | 26 -13% | 27 -17% | 25.3 -10% |
| Idle Average * (dB) | 23 | 25 -9% | 29 -26% | 30 -30% | 30 -30% | 25.3 -10% |
| Idle Maximum * (dB) | 30 | 35 -17% | 33 -10% | 34 -13% | 32 -7% | 25.3 16% |
| Load Average * (dB) | 41.26 | 44 -7% | 48 -16% | 43 -4% | 46 -11% | 42 -2% |
| Witcher 3 ultra * (dB) | 53.4 | 48 10% | 46 14% | 50 6% | 52 3% | 45.6 15% |
| Load Maximum * (dB) | 53.37 | 50 6% | 49 8% | 57 -7% | 55 -3% | 51.6 3% |
* ... Moindre est la valeur, meilleures sont les performances
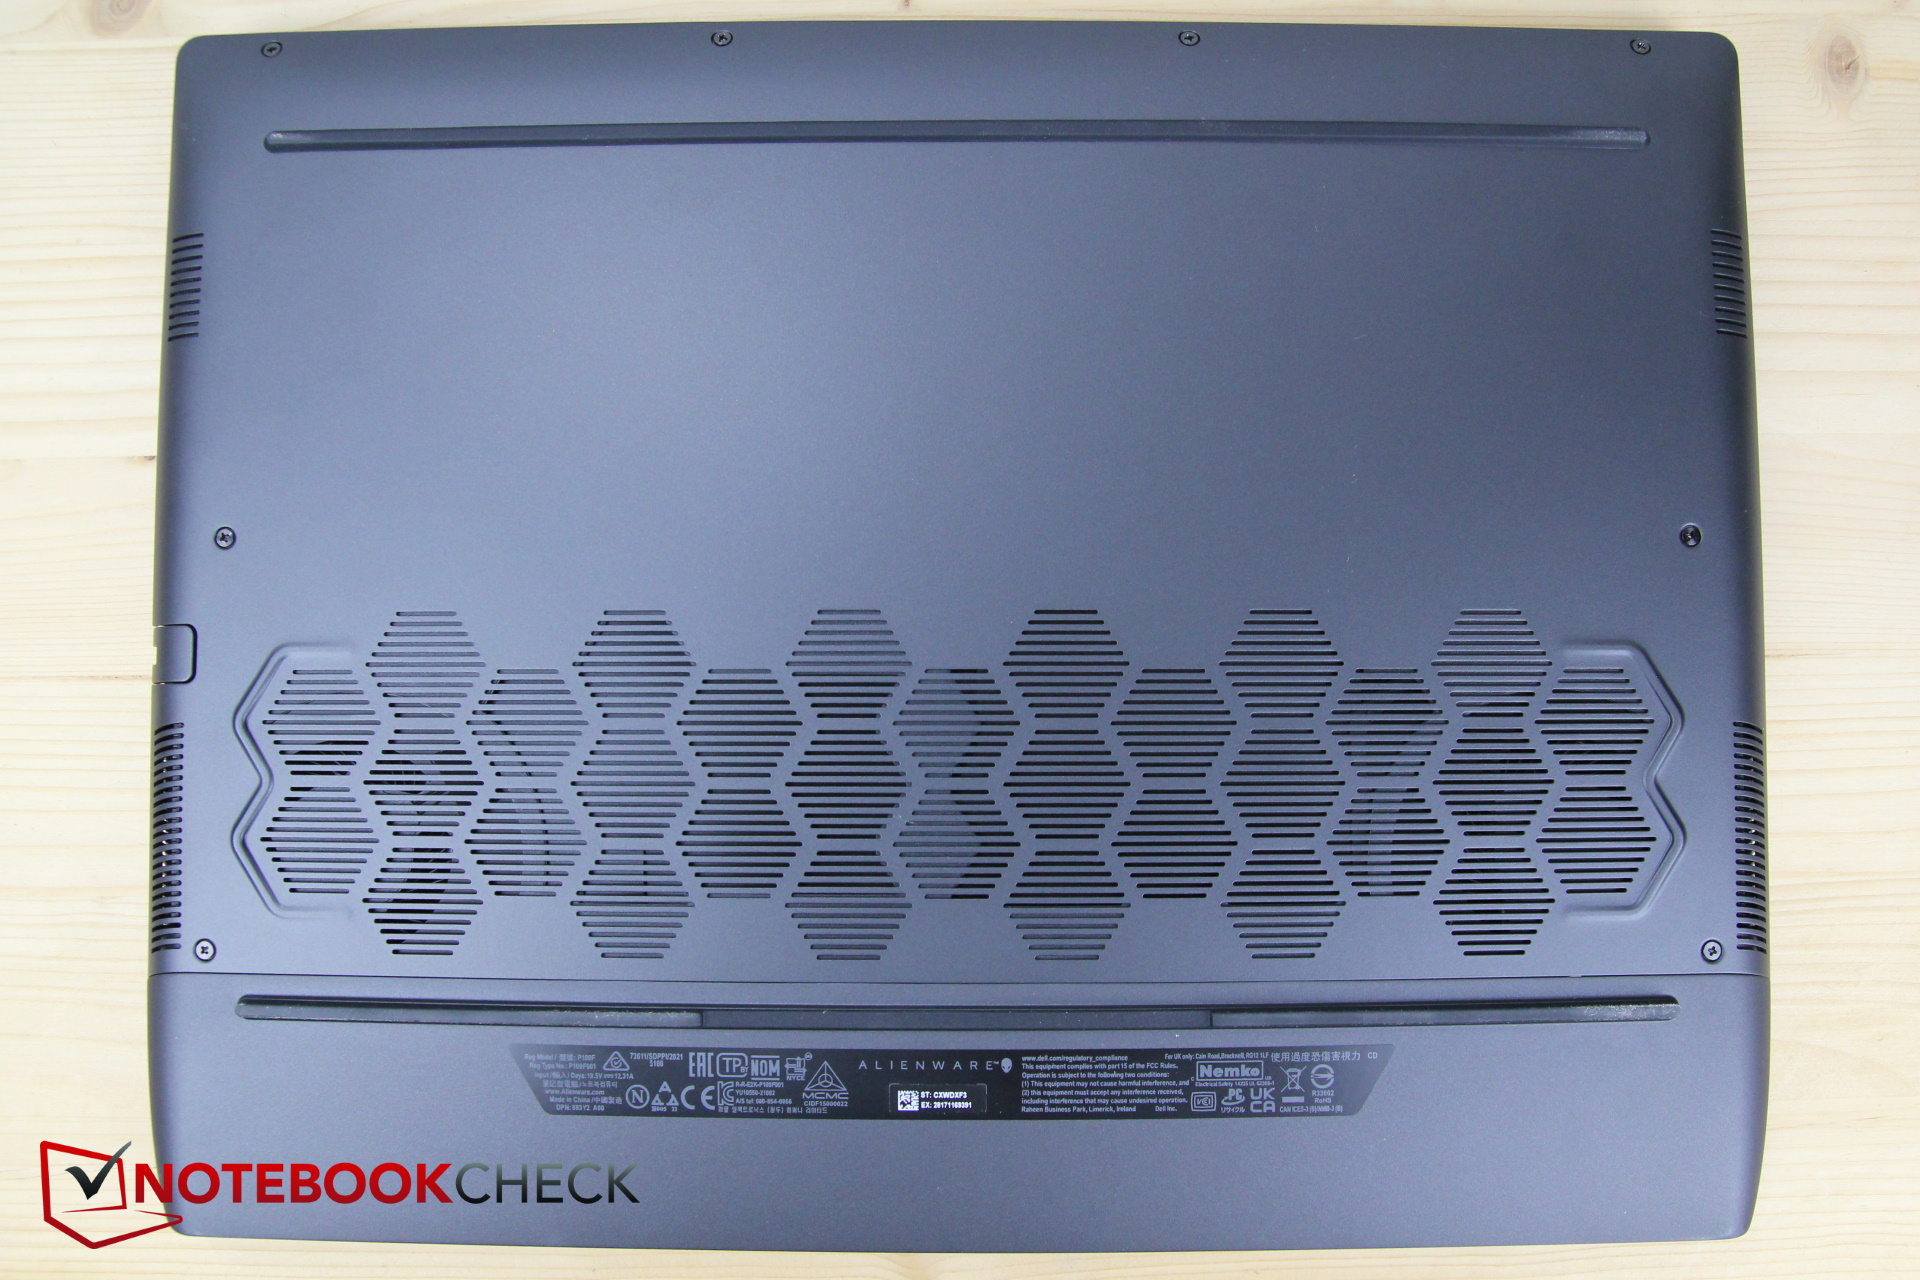
Température
En mode ralenti, la R6 reste maintenant plus froide que la R4. Cependant, en charge, il redevient tout aussi chaud, et ce bien que les performances 3D soient légèrement inférieures.
En cas de forte sollicitation, les surfaces supérieure et inférieure peuvent atteindre des températures d'environ 60 °C, ce qui n'est définitivement plus adapté à un fonctionnement sur les genoux. En revanche, ceux qui vivent dans une cabane de jardin froide peuvent profiter de la R6 à d'autres égards : Pendant le jeu, la température autour des touches WASD atteint toujours 40 à 45 °C (104 à 113 °F), mais au moins les repose-poignets restent relativement frais
Il est intéressant de noter que le R5 avec la RTX 3060 plus faible et le Ryzen 7 5800H devient aussi chaud. Cependant, le reste des concurrents reste sensiblement plus frais
(-) La température maximale du côté supérieur est de 61 °C / 142 F, par rapport à la moyenne de 40.4 °C / 105 F, allant de 21.2 à 68.8 °C pour la classe Gaming.
(-) Le fond chauffe jusqu'à un maximum de 58 °C / 136 F, contre une moyenne de 43.2 °C / 110 F
(+) En utilisation inactive, la température moyenne du côté supérieur est de 29.6 °C / 85 F, par rapport à la moyenne du dispositif de 33.9 °C / 93 F.
(-) En jouant à The Witcher 3, la température moyenne du côté supérieur est de 40.7 °C / 105 F, alors que la moyenne de l'appareil est de 33.9 °C / 93 F.
(±) Les repose-poignets et le pavé tactile peuvent devenir très chauds au toucher, avec un maximum de 39 °C / 102.2# F.
(-) La température moyenne de la zone de l'appui-paume de dispositifs similaires était de 28.8 °C / 83.8 F (-10.2 °C / #-18.4 F).
| Alienware m15 R6, i7-11800H RTX 3080 Intel Core i7-11800H, NVIDIA GeForce RTX 3080 Laptop GPU | Alienware m15 R5 Ryzen Edition AMD Ryzen 7 5800H, NVIDIA GeForce RTX 3060 Laptop GPU | Alienware m15 R4 RTX 3080 Intel Core i9-10980HK, NVIDIA GeForce RTX 3080 Laptop GPU | Aorus 15P YD Intel Core i7-11800H, NVIDIA GeForce RTX 3080 Laptop GPU | Schenker XMG Neo 15 Tiger Lake Intel Core i7-11800H, NVIDIA GeForce RTX 3080 Laptop GPU | Razer Blade 15 Advanced (Mid 2021) Intel Core i7-11800H, NVIDIA GeForce RTX 3080 Laptop GPU | |
|---|---|---|---|---|---|---|
| Heat | 2% | -7% | 9% | 15% | 7% | |
| Maximum Upper Side * (°C) | 61 | 62 -2% | 59 3% | 49 20% | 39 36% | 51 16% |
| Maximum Bottom * (°C) | 58 | 61 -5% | 61 -5% | 57 2% | 50 14% | 52 10% |
| Idle Upper Side * (°C) | 38 | 36 5% | 43 -13% | 33 13% | 34 11% | 35.2 7% |
| Idle Bottom * (°C) | 36 | 33 8% | 41 -14% | 36 -0% | 37 -3% | 37.8 -5% |
* ... Moindre est la valeur, meilleures sont les performances
Test de stress
Lors du test de stress d'une heure, les cœurs démarrent à environ 4,2 GHz. Après moins d'une demi-heure, la vitesse d'horloge n'est plus que de 2,7 GHz. Jusqu'à la fin, elle varie légèrement entre 2,7 et 2,9 GHz
Pendant ce temps, les températures du cœur restent à 80 °C (176 °F), ce qui n'est pas du tout critique, même si elles peuvent augmenter temporairement jusqu'à 98 °C (208 °F), ce qui déclenche l'étranglement thermique
Dans le même temps, la vitesse d'horloge du GPU varie entre 1,3 et 1,7 GHz pendant toute la durée du test. Sa température se situe autour de 77 °C (171 °F), et le point chaud atteint environ 85 °C (185 °F)
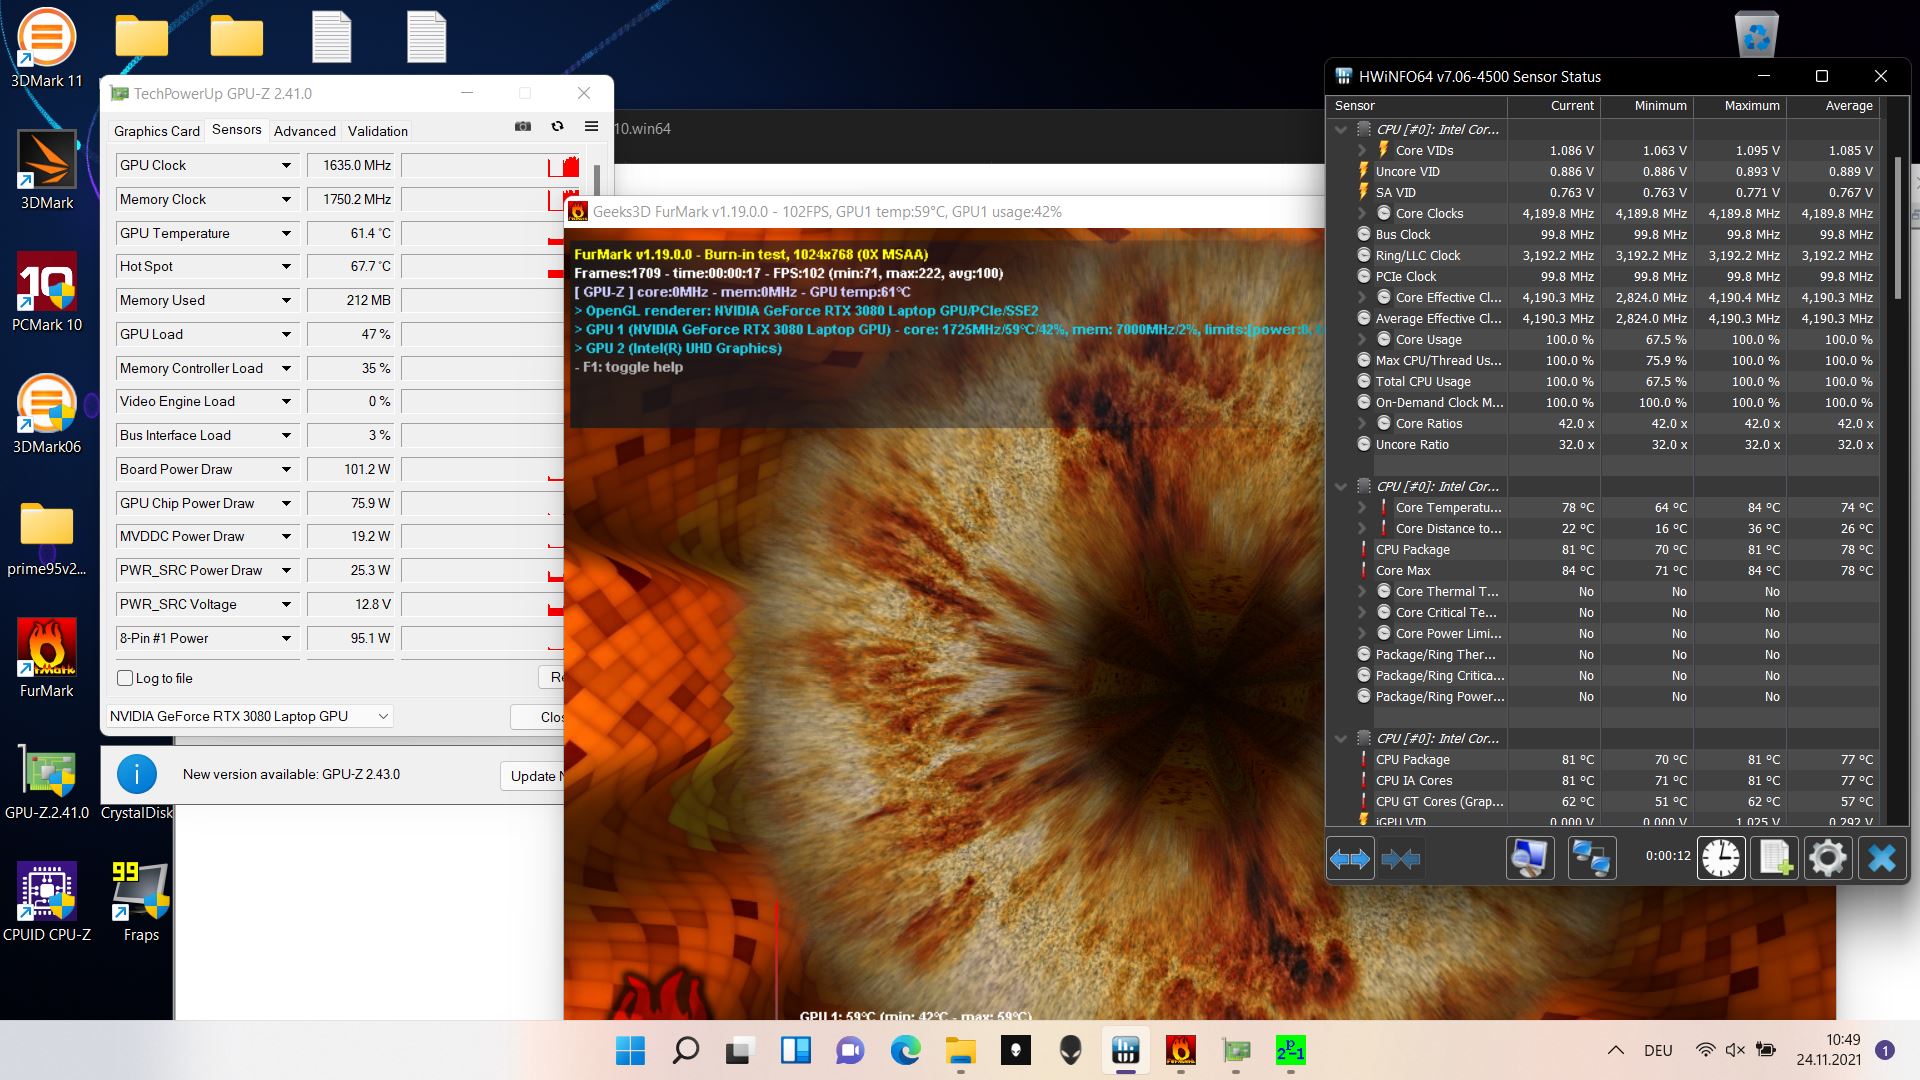
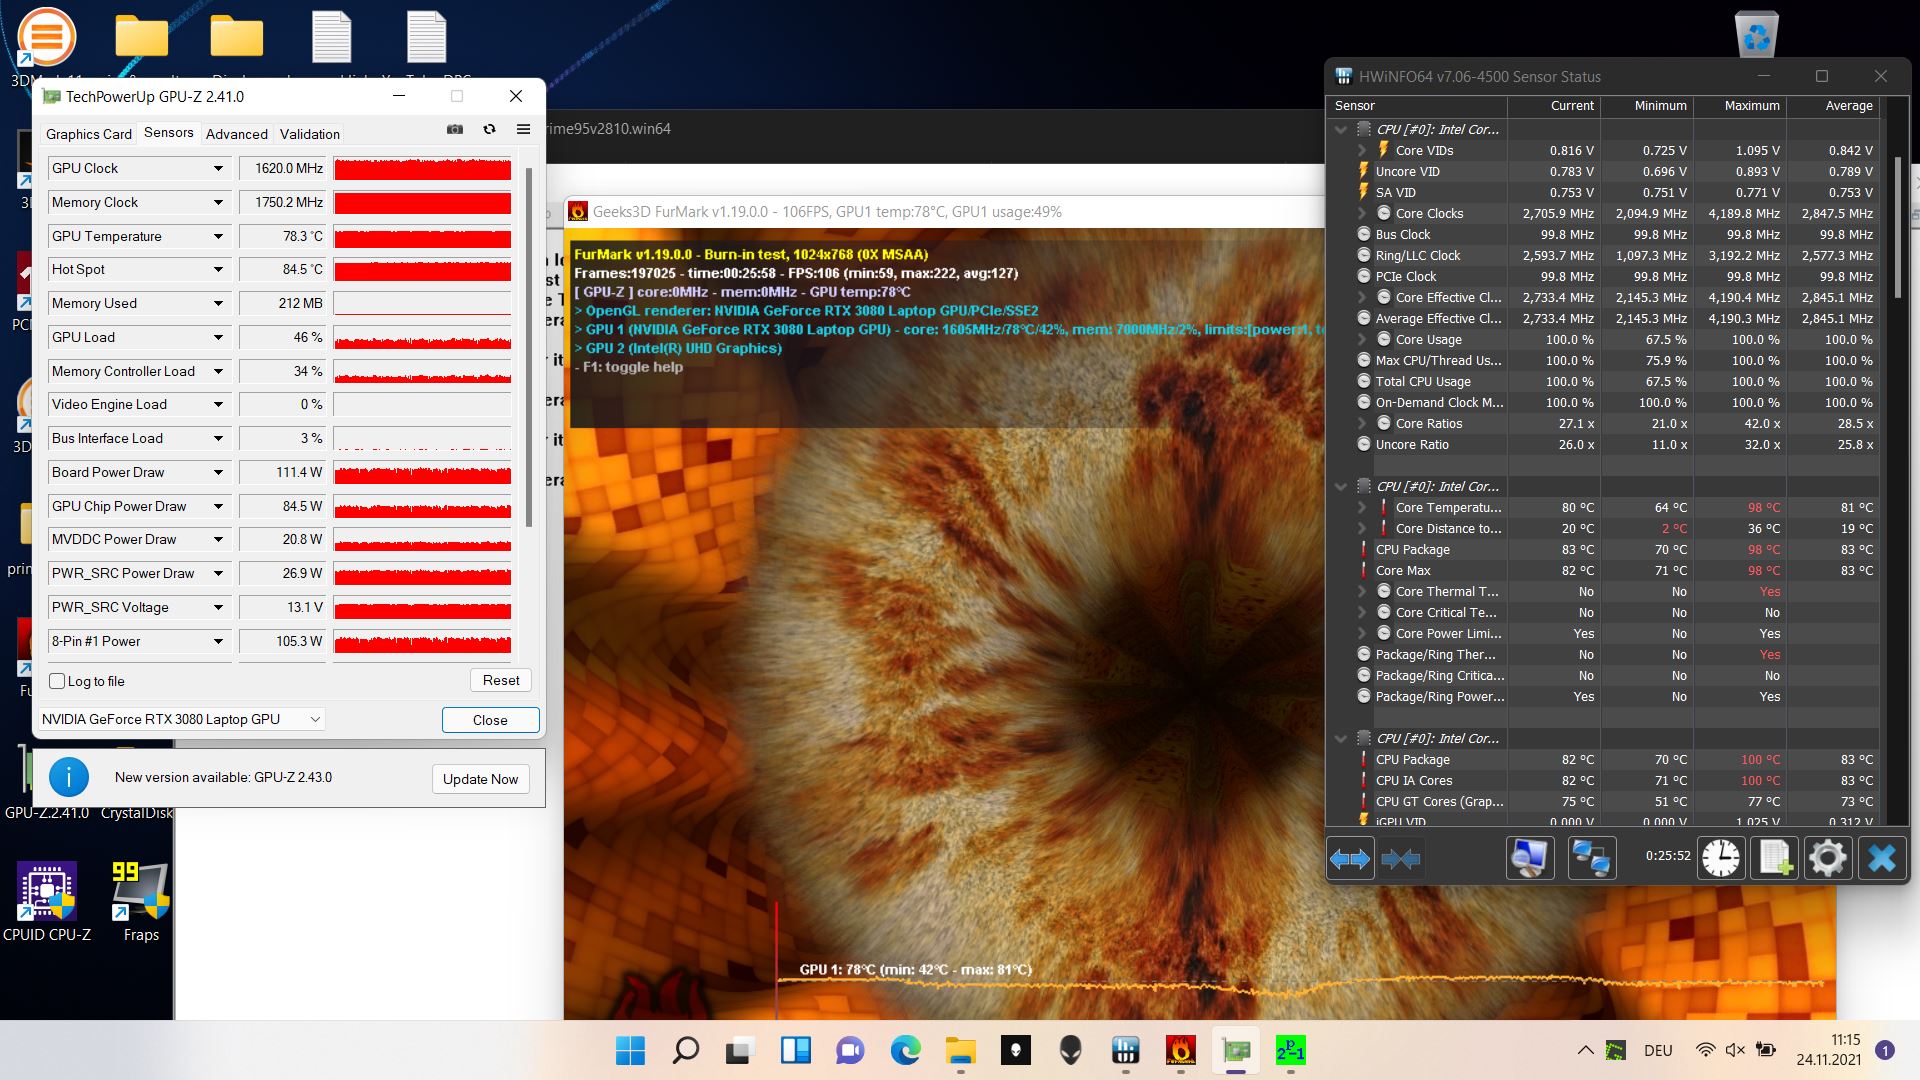
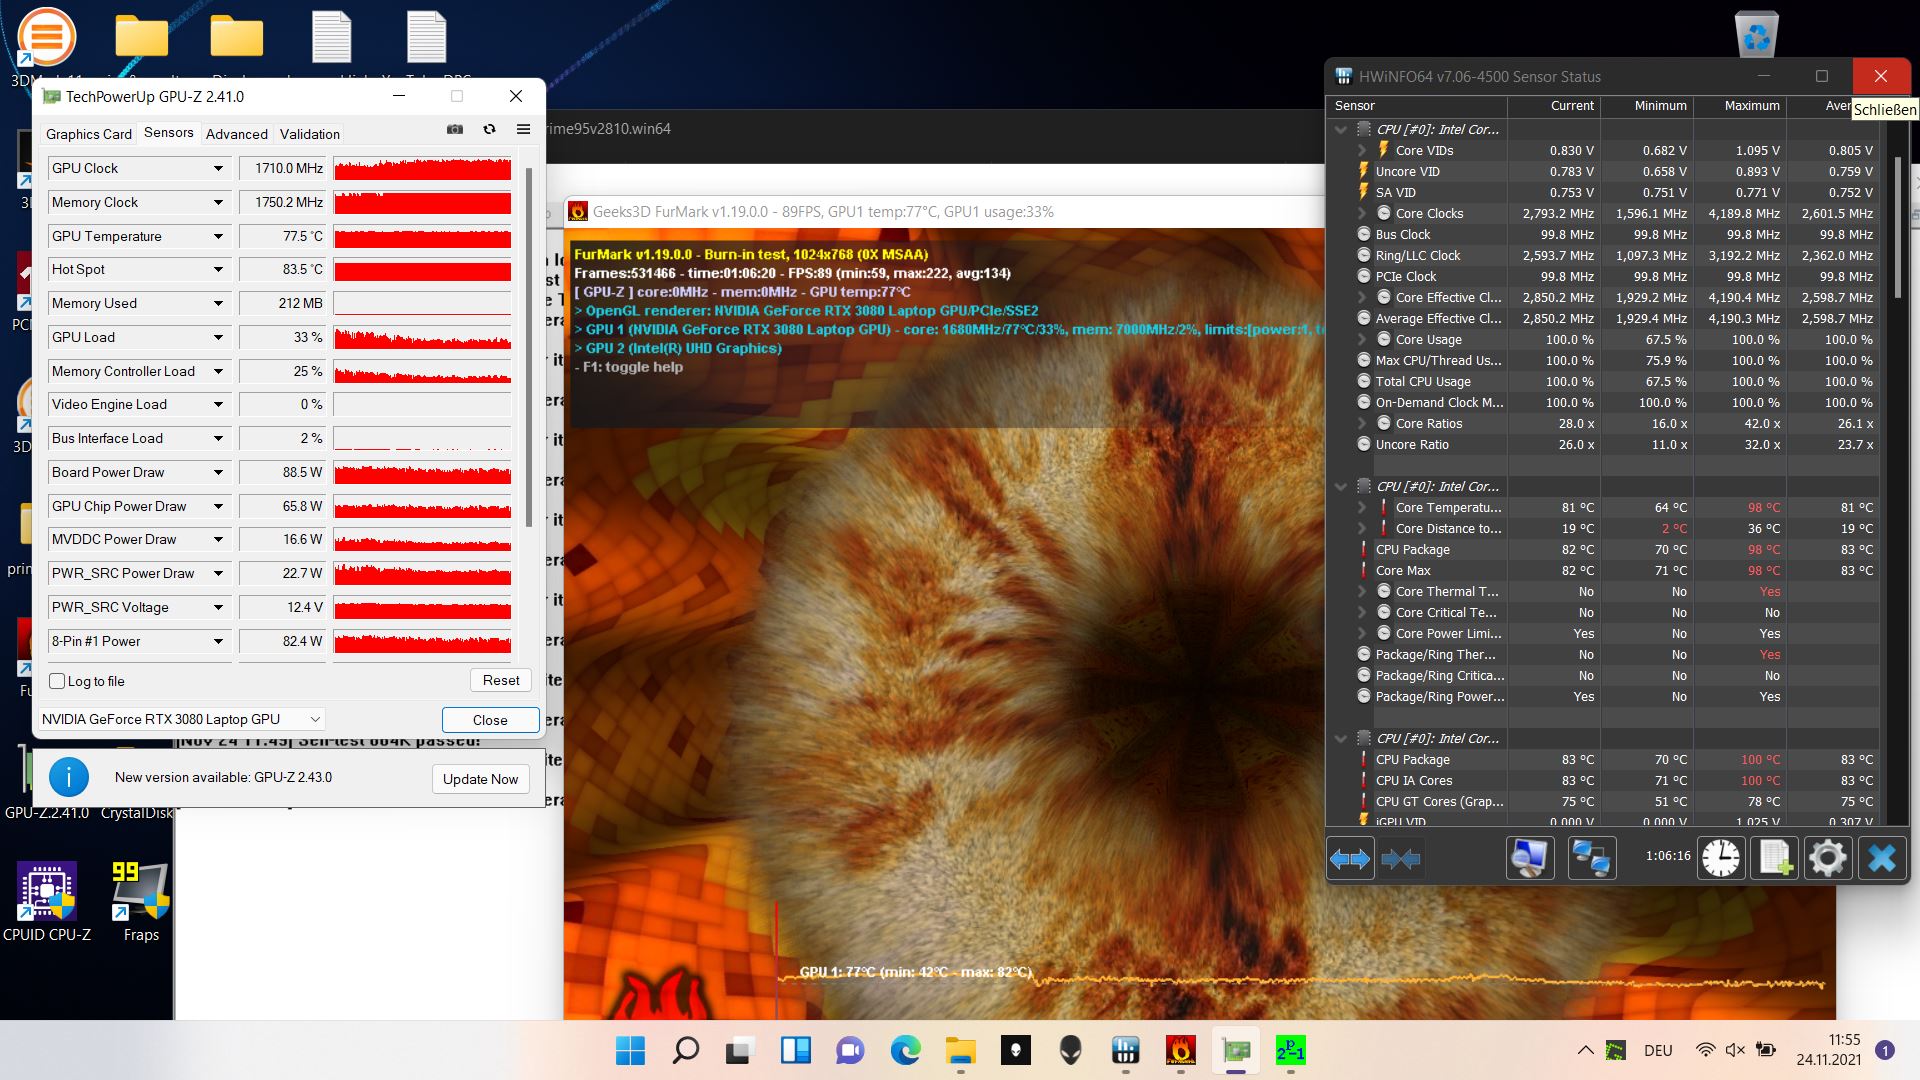
| Fréquence CPU(GHz) | Fréquence GPU(MHz) | Température CPU moyenne(°C) | Température GPUmoyenne(°C) | |
| Prime95 + FurMark Stress | 2.7 - 2.9 | 1,395 - 1,710 | 80 | 77 |
Haut-parleurs
L'aspect positif est que l'enceinte peut devenir assez forte. Mais malheureusement, ils manquent de basses, et nous avons également entendu de meilleurs modèles en termes de médiums. En raison de la puissance des ventilateurs, l'utilisation d'un casque est de toute façon recommandée, et il y a un port audio pour cela
Alienware m15 R6, i7-11800H RTX 3080 analyse audio
(+) | les haut-parleurs peuvent jouer relativement fort (85.2# dB)
Basses 100 - 315 Hz
(-) | presque aucune basse - en moyenne 23.8% plus bas que la médiane
(±) | la linéarité des basses est moyenne (12% delta à la fréquence précédente)
Médiums 400 - 2000 Hz
(±) | médiane supérieure - en moyenne 8.3% supérieure à la médiane
(+) | les médiums sont linéaires (6.9% delta à la fréquence précédente)
Aiguës 2 - 16 kHz
(+) | des sommets équilibrés - à seulement 3.3% de la médiane
(+) | les aigus sont linéaires (5.7% delta à la fréquence précédente)
Globalement 100 - 16 000 Hz
(±) | la linéarité du son global est moyenne (21.8% de différence avec la médiane)
Par rapport à la même classe
» 78% de tous les appareils testés de cette catégorie étaient meilleurs, 6% similaires, 16% pires
» Le meilleur avait un delta de 6%, la moyenne était de 18%, le pire était de 132%.
Par rapport à tous les appareils testés
» 62% de tous les appareils testés étaient meilleurs, 7% similaires, 31% pires
» Le meilleur avait un delta de 4%, la moyenne était de 23%, le pire était de 134%.
Apple MacBook 12 (Early 2016) 1.1 GHz analyse audio
(+) | les haut-parleurs peuvent jouer relativement fort (83.6# dB)
Basses 100 - 315 Hz
(±) | basse réduite - en moyenne 11.3% inférieure à la médiane
(±) | la linéarité des basses est moyenne (14.2% delta à la fréquence précédente)
Médiums 400 - 2000 Hz
(+) | médiane équilibrée - seulement 2.4% de la médiane
(+) | les médiums sont linéaires (5.5% delta à la fréquence précédente)
Aiguës 2 - 16 kHz
(+) | des sommets équilibrés - à seulement 2% de la médiane
(+) | les aigus sont linéaires (4.5% delta à la fréquence précédente)
Globalement 100 - 16 000 Hz
(+) | le son global est linéaire (10.2% différence à la médiane)
Par rapport à la même classe
» 7% de tous les appareils testés de cette catégorie étaient meilleurs, 2% similaires, 91% pires
» Le meilleur avait un delta de 5%, la moyenne était de 18%, le pire était de 53%.
Par rapport à tous les appareils testés
» 5% de tous les appareils testés étaient meilleurs, 1% similaires, 94% pires
» Le meilleur avait un delta de 4%, la moyenne était de 23%, le pire était de 134%.
Gestion de l'alimentation - Plus efficace que le prédécesseur
Consommation d'énergie
Grâce à la commutation Optimus, le R6 consomme désormais nettement moins d'énergie que le R4, du moins en mode veille. En charge, la consommation est également légèrement inférieure à celle des concurrents, mais cela pourrait également être dû à la performance 3D inférieure.
Nous mesurons une consommation maximale d'un peu plus de 200 watts, ce qui signifie que l'alimentation de 240 watts devrait être suffisante pour pouvoir recharger l'appareil de manière fiable dans n'importe quelle situation
| Au repos | |
| Fortement sollicité |
|
Légende:
min: | |
| Alienware m15 R6, i7-11800H RTX 3080 i7-11800H, GeForce RTX 3080 Laptop GPU, Samsung PM9A1 MZVL21T0HCLR, IPS, 1920x1080, 15.6" | Alienware m15 R5 Ryzen Edition R7 5800H, GeForce RTX 3060 Laptop GPU, Toshiba KBG40ZNS512G NVMe, IPS, 1920x1080, 15.6" | Alienware m15 R4 RTX 3080 i9-10980HK, GeForce RTX 3080 Laptop GPU, 2x WDC PC SN730 SDBPNTY-512G (RAID 0), IPS, 1920x1080, 15.6" | Aorus 15P YD i7-11800H, GeForce RTX 3080 Laptop GPU, Samsung PM9A1 MZVL21T0HCLR, IPS, 1920x1080, 15.6" | Schenker XMG Neo 15 Tiger Lake i7-11800H, GeForce RTX 3080 Laptop GPU, Samsung SSD 980 Pro 1TB MZ-V8P1T0BW, IPS, 2560x1440, 15.6" | Razer Blade 15 Advanced (Mid 2021) i7-11800H, GeForce RTX 3080 Laptop GPU, SSSTC CA6-8D1024, IPS, 1920x1080, 15.6" | Moyenne NVIDIA GeForce RTX 3080 Laptop GPU | Moyenne de la classe Gaming | |
|---|---|---|---|---|---|---|---|---|
| Power Consumption | 4% | -70% | -29% | -0% | -18% | -24% | -4% | |
| Idle Minimum * (Watt) | 14 | 11 21% | 37 -164% | 23 -64% | 15 -7% | 19.5 -39% | 19.8 ? -41% | 13 ? 7% |
| Idle Average * (Watt) | 18 | 14 22% | 40 -122% | 25 -39% | 17 6% | 23.3 -29% | 24.3 ? -35% | 18.6 ? -3% |
| Idle Maximum * (Watt) | 29 | 25 14% | 53 -83% | 35 -21% | 22 24% | 40.1 -38% | 33.3 ? -15% | 24.2 ? 17% |
| Load Average * (Watt) | 93 | 123 -32% | 121 -30% | 101 -9% | 101 -9% | 98.9 -6% | 108.1 ? -16% | 109.2 ? -17% |
| Witcher 3 ultra * (Watt) | 190 | 176 7% | 193 -2% | 190 -0% | 195 -3% | 174 8% | ||
| Load Maximum * (Watt) | 203 | 226 -11% | 246 -21% | 280 -38% | 230 -13% | 214 -5% | 230 ? -13% | 256 ? -26% |
* ... Moindre est la valeur, meilleures sont les performances
Power Consumption The Witcher 3 / Stress Test
Power Consumption with an External Monitor
Autonomie de la batterie
Malgré son GPU plus puissant, le R6 n'est pas équipé d'une batterie plus grande que le R5 avec la RTX 3060. Cependant, cela ne semble pas nécessairement avoir un effet négatif sur l'autonomie de la batterie, puisque lors de nos tests de batterie, le GPU intégré est actif la plupart du temps. Les résultats du test WLAN sont à hauteur d'yeux, et seulement lors de la lecture de vidéos, le R6 dure sensiblement moins longtemps avec 5,5 heures que le R5 avec 8 heures.
| Alienware m15 R6, i7-11800H RTX 3080 i7-11800H, GeForce RTX 3080 Laptop GPU, 84 Wh | Alienware m15 R5 Ryzen Edition R7 5800H, GeForce RTX 3060 Laptop GPU, 86 Wh | Alienware m15 R4 RTX 3080 i9-10980HK, GeForce RTX 3080 Laptop GPU, 86 Wh | Aorus 15P YD i7-11800H, GeForce RTX 3080 Laptop GPU, 99 Wh | Schenker XMG Neo 15 Tiger Lake i7-11800H, GeForce RTX 3080 Laptop GPU, 93 Wh | Razer Blade 15 Advanced (Mid 2021) i7-11800H, GeForce RTX 3080 Laptop GPU, 80 Wh | Moyenne de la classe Gaming | |
|---|---|---|---|---|---|---|---|
| Autonomie de la batterie | 5% | -60% | 19% | 29% | 18% | 30% | |
| H.264 (h) | 5.6 | 8.8 57% | 1.9 -66% | 5.9 5% | 8.64 ? 54% | ||
| WiFi v1.3 (h) | 5 | 5.1 2% | 1.8 -64% | 5.3 6% | 5.6 12% | 5.9 18% | 7.11 ? 42% |
| Load (h) | 1.6 | 0.9 -44% | 0.8 -50% | 2.1 31% | 2.7 69% | 1.502 ? -6% | |
| Reader / Idle (h) | 14.7 | 7.5 | 8.71 ? | ||||
| Witcher 3 ultra (h) | 1.6 | 0.8 |
Points positifs
Points négatifs
Verdict - Pourquoi si chaud ?
Par rapport au R4, la mise à jour Tiger Lake rend le R6 principalement plus efficace et frugal, mais pas nécessairement plus rapide. Même si la performance du CPU a augmenté, la performance 3D a diminué en raison de la baisse du TGP. Cela réduit également la consommation. Les modes de refroidissement semblent n'avoir que peu d'influence sur les performances, et la RTX 3080 n'obtient toujours pas une allocation de puissance plus élevée.
La performance du CPU est comparable à celle du Ryzen m15 R5. En outre, il y a l'avantage du support Thunderbolt. Mais autrement, le R5 et le R6 sont extrêmement similaires. Vous devez donc choisir en fonction du prix et de l'importance que vous accordez à Thunderbolt.
Le système de refroidissement révèle encore un besoin d'optimisation : Malgré la faible consommation d'énergie de la RTX 3080, les surfaces de l'Alienware chauffent plus que chez la plupart des concurrents, dont certains offrent des performances 3D supérieures.
Le m15 R6 est plus efficace et plus frugal que son prédécesseur R4. Cependant, la RTX 3080 est bridée ici, et les surfaces de l'Alienware chauffent toujours autant.
Le siteAorus 15P YDoffre des performances un peu plus élevées tout en restant plus froid, mais il a aussi une consommation plus élevée. LeSchenker XMG Neo 15offre également une performance 3D significativement plus élevée et reste également plus froid. En outre, il offre une plus longue durée de vie de la batterie, mais d'un autre côté, il est encore plus bruyant.
Prix et disponibilité
Différentes configurations du m15 R6 sont actuellement disponibles sur Dell à partir d'environ 1200 $. Amazon propose une configuration haut de gamme pour 1783 $
Alienware m15 R6, i7-11800H RTX 3080
- 11/25/2021 v7 (old)
Christian Hintze
Price comparison

