Test du Dell Alienware m15 R3(i7-10750H, RTX 2070, FHD, 300 Hz) : la chambre à vapeur sauve le tout
Note | Date | Modèle | Poids | Épaisseur | Taille | Résolution | Prix |
|---|---|---|---|---|---|---|---|
| 84.8 % v7 (old) | 09/20 | Alienware m15 R3 P87F i7-10750H, GeForce RTX 2070 Mobile | 2.3 kg | 19.9 mm | 15.60" | 1920x1080 | |
| 82.6 % v7 (old) | Eluktronics RP-15 R7 4800H, GeForce RTX 2060 Mobile | 1.9 kg | 20 mm | 15.60" | 1920x1080 | ||
| 86 % v7 (old) | 06/20 | Razer Blade 15 RZ09-0328 i7-10750H, GeForce RTX 2070 Max-Q | 2.1 kg | 19.9 mm | 15.60" | 3840x2160 | |
| 81.3 % v7 (old) | 06/19 | Asus Zephyrus S GX502GW i7-9750H, GeForce RTX 2070 Mobile | 2.1 kg | 19 mm | 15.60" | 1920x1080 | |
| 82.8 % v7 (old) | 05/20 | MSI GS66 Stealth 10SFS i9-10980HK, GeForce RTX 2070 Super Max-Q | 2.2 kg | 20 mm | 15.60" | 1920x1080 |
| SD Card Reader | |
| average JPG Copy Test (av. of 3 runs) | |
| MSI GS75 10SF-609US (Toshiba Exceria Pro M501 UHS-II) | |
| Dell XPS 15 9500 Core i7 4K UHD (Toshiba Exceria Pro SDXC 64 GB UHS-II) | |
| Gigabyte Aero 15 OLED XA (Toshiba Exceria Pro SDXC 64 GB UHS-II) | |
| Alienware m15 R3 P87F (Toshiba Exceria Pro M501 UHS-II) | |
| Eluktronics RP-15 (Toshiba Exceria Pro SDXC 64 GB UHS-II) | |
| maximum AS SSD Seq Read Test (1GB) | |
| Gigabyte Aero 15 OLED XA (Toshiba Exceria Pro SDXC 64 GB UHS-II) | |
| Alienware m15 R3 P87F (Toshiba Exceria Pro M501 UHS-II) | |
| MSI GS75 10SF-609US (Toshiba Exceria Pro M501 UHS-II) | |
| Dell XPS 15 9500 Core i7 4K UHD (Toshiba Exceria Pro SDXC 64 GB UHS-II) | |
| Eluktronics RP-15 (Toshiba Exceria Pro SDXC 64 GB UHS-II) | |
| Networking | |
| iperf3 transmit AX12 | |
| Eluktronics RP-15 | |
| MSI GS75 10SF-609US | |
| Alienware m15 R3 P87F | |
| Dell XPS 15 9500 Core i7 4K UHD | |
| Gigabyte Aero 15 OLED XA | |
| iperf3 receive AX12 | |
| Eluktronics RP-15 | |
| Dell XPS 15 9500 Core i7 4K UHD | |
| Alienware m15 R3 P87F | |
| MSI GS75 10SF-609US | |
| Gigabyte Aero 15 OLED XA | |

")
")
| |||||||||||||||||||||||||
Homogénéité de la luminosité: 87 %
Valeur mesurée au centre, sur batterie: 326.7 cd/m²
Contraste: 990:1 (Valeurs des noirs: 0.33 cd/m²)
ΔE ColorChecker Calman: 2.4 | ∀{0.5-29.43 Ø4.71}
calibrated: 1.51
ΔE Greyscale Calman: 3.2 | ∀{0.09-98 Ø4.96}
99.2% sRGB (Argyll 1.6.3 3D)
63.7% AdobeRGB 1998 (Argyll 1.6.3 3D)
69.8% AdobeRGB 1998 (Argyll 3D)
98.9% sRGB (Argyll 3D)
68.6% Display P3 (Argyll 3D)
Gamma: 2.13
CCT: 7129 K
| Alienware m15 R3 P87F AU Optronics B156HAN, IPS, 15.6", 1920x1080 | Alienware m15 P79F Samsung SDCA029, 156WR04, OLED, 15.6", 3840x2160 | Eluktronics RP-15 BOE NV156FHM-N4G, IPS, 15.6", 1920x1080 | Razer Blade 15 RZ09-0328 Samsung SDCA029, AMOLED, 15.6", 3840x2160 | Asus Zephyrus S GX502GW AU Optronics B156HAN08.2 (AUO82ED), IPS, 15.6", 1920x1080 | MSI GS66 Stealth 10SFS AUO B156HAN12.0 (AUO328E), IPS, 15.6", 1920x1080 | |
|---|---|---|---|---|---|---|
| Display | 30% | -7% | 29% | -6% | 1% | |
| Display P3 Coverage (%) | 68.6 | 99.9 46% | 63.7 -7% | 99.9 46% | 64.9 -5% | 69.5 1% |
| sRGB Coverage (%) | 98.9 | 100 1% | 92 -7% | 100 1% | 91 -8% | 99.6 1% |
| AdobeRGB 1998 Coverage (%) | 69.8 | 100 43% | 65.2 -7% | 97.4 40% | 65.9 -6% | 70.8 1% |
| Response Times | 57% | -163% | 54% | -31% | -120% | |
| Response Time Grey 50% / Grey 80% * (ms) | 4 ? | 2.6 ? 35% | 17.2 ? -330% | 2.7 ? 32% | 7.2 ? -80% | 14 ? -250% |
| Response Time Black / White * (ms) | 10.8 ? | 2.3 ? 79% | 10.4 ? 4% | 2.6 ? 76% | 8.8 ? 19% | 9.6 ? 11% |
| PWM Frequency (Hz) | 60.2 ? | 59.5 ? | ||||
| Screen | -17% | -28% | -5% | -5% | 5% | |
| Brightness middle (cd/m²) | 326.7 | 452.1 38% | 298.6 -9% | 366.7 12% | 286 -12% | 316 -3% |
| Brightness (cd/m²) | 316 | 452 43% | 289 -9% | 371 17% | 275 -13% | 311 -2% |
| Brightness Distribution (%) | 87 | 90 3% | 90 3% | 91 5% | 90 3% | 92 6% |
| Black Level * (cd/m²) | 0.33 | 0.35 -6% | 0.37 -12% | 0.21 36% | ||
| Contrast (:1) | 990 | 853 -14% | 773 -22% | 1505 52% | ||
| Colorchecker dE 2000 * | 2.4 | 6.34 -164% | 5.01 -109% | 5.21 -117% | 2.19 9% | 3.03 -26% |
| Colorchecker dE 2000 max. * | 6.06 | 12.97 -114% | 7.06 -17% | 7.92 -31% | 4.4 27% | 7.32 -21% |
| Colorchecker dE 2000 calibrated * | 1.51 | 2.52 -67% | 2.27 -50% | 1.1 27% | ||
| Greyscale dE 2000 * | 3.2 | 2.8 13% | 5.4 -69% | 2 37% | 2.2 31% | 3.9 -22% |
| Gamma | 2.13 103% | 2.21 100% | 2.54 87% | 2.17 101% | 2.41 91% | 2.42 91% |
| CCT | 7129 91% | 6114 106% | 7461 87% | 6514 100% | 6405 101% | 7439 87% |
| Color Space (Percent of AdobeRGB 1998) (%) | 63.7 | 91 43% | 59.1 -7% | 86.6 36% | 59 -7% | 65 2% |
| Color Space (Percent of sRGB) (%) | 99.2 | 100 1% | 91.6 -8% | 100 1% | 91 -8% | 100 1% |
| Moyenne finale (programmes/paramètres) | 23% /
5% | -66% /
-41% | 26% /
12% | -14% /
-8% | -38% /
-12% |
* ... Moindre est la valeur, meilleures sont les performances
Temps de réponse de l'écran
| ↔ Temps de réponse noir à blanc | ||
|---|---|---|
| 10.8 ms ... hausse ↗ et chute ↘ combinées | ↗ 5.2 ms hausse | 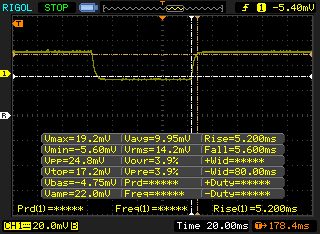 |
| ↘ 5.6 ms chute | ||
| L'écran montre de bons temps de réponse, mais insuffisant pour du jeu compétitif. En comparaison, tous les appareils testés affichent entre 0.1 (minimum) et 240 (maximum) ms. » 29 % des appareils testés affichent de meilleures performances. Cela signifie que les latences relevées sont meilleures que la moyenne (19.8 ms) de tous les appareils testés. | ||
| ↔ Temps de réponse gris 50% à gris 80% | ||
| 4 ms ... hausse ↗ et chute ↘ combinées | ↗ 1.6 ms hausse | 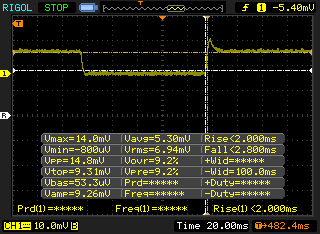 |
| ↘ 2.4 ms chute | ||
| L'écran montre de très faibles temps de réponse, parfait pour le jeu. En comparaison, tous les appareils testés affichent entre 0.165 (minimum) et 636 (maximum) ms. » 15 % des appareils testés affichent de meilleures performances. Cela signifie que les latences relevées sont meilleures que la moyenne (31 ms) de tous les appareils testés. | ||
Scintillement / MLI (Modulation de largeur d'impulsion)
| Scintillement / MLI (Modulation de largeur d'impulsion) non décelé | 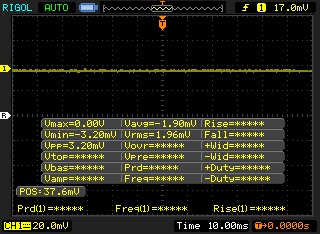 | ||
En comparaison, 52 % des appareils testés n'emploient pas MDI pour assombrir leur écran. Nous avons relevé une moyenne à 7757 (minimum : 5 - maximum : 343500) Hz dans le cas où une MDI était active. | |||
Cinebench R15: CPU Multi 64Bit | CPU Single 64Bit
Blender: v2.79 BMW27 CPU
7-Zip 18.03: 7z b 4 -mmt1 | 7z b 4
Geekbench 5.5: Single-Core | Multi-Core
HWBOT x265 Benchmark v2.2: 4k Preset
LibreOffice : 20 Documents To PDF
R Benchmark 2.5: Overall mean
| Cinebench R20 / CPU (Multi Core) | |
| Intel Core i9-10900K | |
| Dell G5 15 SE 5505 P89F | |
| Asus ROG Strix Scar 15 G532LWS | |
| Gigabyte Aero 15 OLED XB-8DE51B0SP | |
| MSI GE65 Raider 9SF-049US | |
| Alienware m15 R3 P87F | |
| Acer Nitro 5 AN515-44-R5FT | |
| Moyenne Intel Core i7-10750H (1749 - 3325, n=43) | |
| Maingear Vector 15 | |
| MSI GE63 Raider 8SG | |
| Asus Zephyrus GX501 | |
| Cinebench R20 / CPU (Single Core) | |
| Intel Core i9-10900K | |
| Gigabyte Aero 15 OLED XB-8DE51B0SP | |
| Asus ROG Strix Scar 15 G532LWS | |
| Dell G5 15 SE 5505 P89F | |
| Alienware m15 R3 P87F | |
| MSI GE65 Raider 9SF-049US | |
| Moyenne Intel Core i7-10750H (431 - 504, n=43) | |
| Maingear Vector 15 | |
| Acer Nitro 5 AN515-44-R5FT | |
| MSI GE63 Raider 8SG | |
| Asus Zephyrus GX501 | |
| Cinebench R15 / CPU Multi 64Bit | |
| Intel Core i9-10900K | |
| Dell G5 15 SE 5505 P89F | |
| Gigabyte Aero 15 OLED XB-8DE51B0SP | |
| Asus ROG Strix Scar 15 G532LWS | |
| MSI GE65 Raider 9SF-049US | |
| Acer Nitro 5 AN515-44-R5FT | |
| Alienware m15 R3 P87F | |
| Maingear Vector 15 | |
| Moyenne Intel Core i7-10750H (804 - 1418, n=50) | |
| MSI GE63 Raider 8SG | |
| Asus Zephyrus GX501 | |
| Cinebench R15 / CPU Single 64Bit | |
| Intel Core i9-10900K | |
| Gigabyte Aero 15 OLED XB-8DE51B0SP | |
| Asus ROG Strix Scar 15 G532LWS | |
| Alienware m15 R3 P87F | |
| MSI GE65 Raider 9SF-049US | |
| Moyenne Intel Core i7-10750H (184 - 213, n=45) | |
| Dell G5 15 SE 5505 P89F | |
| Maingear Vector 15 | |
| Acer Nitro 5 AN515-44-R5FT | |
| MSI GE63 Raider 8SG | |
| Asus Zephyrus GX501 | |
| Blender / v2.79 BMW27 CPU | |
| Moyenne Intel Core i7-10750H (322 - 587, n=43) | |
| Acer Nitro 5 AN515-44-R5FT | |
| Alienware m15 R3 P87F | |
| Gigabyte Aero 15 OLED XB-8DE51B0SP | |
| Asus ROG Strix Scar 15 G532LWS | |
| Dell G5 15 SE 5505 P89F | |
| Intel Core i9-10900K | |
| 7-Zip 18.03 / 7z b 4 -mmt1 | |
| Intel Core i9-10900K | |
| Asus ROG Strix Scar 15 G532LWS | |
| Gigabyte Aero 15 OLED XB-8DE51B0SP | |
| Moyenne Intel Core i7-10750H (4504 - 5470, n=43) | |
| Dell G5 15 SE 5505 P89F | |
| Alienware m15 R3 P87F | |
| Acer Nitro 5 AN515-44-R5FT | |
| 7-Zip 18.03 / 7z b 4 | |
| Intel Core i9-10900K | |
| Dell G5 15 SE 5505 P89F | |
| Asus ROG Strix Scar 15 G532LWS | |
| Gigabyte Aero 15 OLED XB-8DE51B0SP | |
| Acer Nitro 5 AN515-44-R5FT | |
| Alienware m15 R3 P87F | |
| Moyenne Intel Core i7-10750H (26040 - 37345, n=43) | |
| Geekbench 5.5 / Single-Core | |
| Intel Core i9-10900K | |
| Asus ROG Strix Scar 15 G532LWS | |
| Gigabyte Aero 15 OLED XB-8DE51B0SP | |
| Alienware m15 R3 P87F | |
| Moyenne Intel Core i7-10750H (1114 - 1333, n=43) | |
| Dell G5 15 SE 5505 P89F | |
| Acer Nitro 5 AN515-44-R5FT | |
| Geekbench 5.5 / Multi-Core | |
| Intel Core i9-10900K | |
| Asus ROG Strix Scar 15 G532LWS | |
| Gigabyte Aero 15 OLED XB-8DE51B0SP | |
| Dell G5 15 SE 5505 P89F | |
| Alienware m15 R3 P87F | |
| Moyenne Intel Core i7-10750H (4443 - 6674, n=43) | |
| Acer Nitro 5 AN515-44-R5FT | |
| HWBOT x265 Benchmark v2.2 / 4k Preset | |
| Intel Core i9-10900K | |
| Gigabyte Aero 15 OLED XB-8DE51B0SP | |
| Asus ROG Strix Scar 15 G532LWS | |
| Dell G5 15 SE 5505 P89F | |
| Alienware m15 R3 P87F | |
| Moyenne Intel Core i7-10750H (5.54 - 11.6, n=43) | |
| Acer Nitro 5 AN515-44-R5FT | |
| LibreOffice / 20 Documents To PDF | |
| Intel Core i9-10900K | |
| Dell G5 15 SE 5505 P89F | |
| Acer Nitro 5 AN515-44-R5FT | |
| Alienware m15 R3 P87F | |
| Moyenne Intel Core i7-10750H (43.1 - 99.2, n=43) | |
| Gigabyte Aero 15 OLED XB-8DE51B0SP | |
| Asus ROG Strix Scar 15 G532LWS | |
| R Benchmark 2.5 / Overall mean | |
| Alienware m15 R3 P87F | |
| Acer Nitro 5 AN515-44-R5FT | |
| Moyenne Intel Core i7-10750H (0.578 - 0.708, n=42) | |
| Dell G5 15 SE 5505 P89F | |
| Asus ROG Strix Scar 15 G532LWS | |
| Gigabyte Aero 15 OLED XB-8DE51B0SP | |
| Intel Core i9-10900K | |
* ... Moindre est la valeur, meilleures sont les performances
| PCMark 8 | |
| Home Score Accelerated v2 | |
| Alienware m15 R3 P87F | |
| Eluktronics RP-15 | |
| Moyenne Intel Core i7-10750H, NVIDIA GeForce RTX 2070 Mobile (3372 - 5702, n=4) | |
| Razer Blade 15 RZ09-0328 | |
| Alienware m15 P79F | |
| Work Score Accelerated v2 | |
| Alienware m15 R3 P87F | |
| Eluktronics RP-15 | |
| Moyenne Intel Core i7-10750H, NVIDIA GeForce RTX 2070 Mobile (5678 - 6224, n=4) | |
| Razer Blade 15 RZ09-0328 | |
| Alienware m15 P79F | |
| PCMark 8 Home Score Accelerated v2 | 5702 points | |
| PCMark 8 Work Score Accelerated v2 | 6224 points | |
| PCMark 10 Score | 6255 points | |
Aide | ||
| DPC Latencies / LatencyMon - interrupt to process latency (max), Web, Youtube, Prime95 | |
| Dell G5 15 SE 5505 P89F | |
| MSI GS66 Stealth 10SFS | |
| Gigabyte Aero 15 OLED XB-8DE51B0SP | |
| Asus ROG Strix Scar 15 G532LWS | |
| Alienware m15 R3 P87F | |
| MSI GS66 Stealth 10SE-045 | |
| Acer Nitro 5 AN515-44-R5FT | |
| Razer Blade 15 RZ09-0328 | |
| Eluktronics RP-15 | |
| MSI GS75 10SF-609US | |
* ... Moindre est la valeur, meilleures sont les performances
| Alienware m15 R3 P87F 2x Micron 2200S 512 GB (RAID 0) | Alienware m15 P79F Toshiba XG5 KXG50ZNV512G | Razer Blade 15 RZ09-0328 Lite-On CA5-8D512 | Asus Zephyrus S GX502GW 2x Intel SSD 660p SSDPEKNW512G8 (RAID 0) | MSI GS66 Stealth 10SFS Samsung SSD PM981 MZVLB1T0HALR | |
|---|---|---|---|---|---|
| AS SSD | -9% | 4% | 2% | 25% | |
| Seq Read (MB/s) | 2058 | 1937 -6% | 2021 -2% | 2506 22% | 1065 -48% |
| Seq Write (MB/s) | 2316 | 1066 -54% | 2090 -10% | 1712 -26% | 2360 2% |
| 4K Read (MB/s) | 39.72 | 31.76 -20% | 47.71 20% | 48.32 22% | 48.09 21% |
| 4K Write (MB/s) | 62.9 | 102.6 63% | 101.1 61% | 103.6 65% | 110.7 76% |
| 4K-64 Read (MB/s) | 1334 | 1140 -15% | 856 -36% | 624 -53% | 1635 23% |
| 4K-64 Write (MB/s) | 1271 | 938 -26% | 1041 -18% | 1253 -1% | 1829 44% |
| Access Time Read * (ms) | 0.062 | 0.058 6% | 0.052 16% | 0.08 -29% | 0.071 -15% |
| Access Time Write * (ms) | 0.388 | 0.04 90% | 0.111 71% | 0.04 90% | 0.034 91% |
| Score Read (Points) | 1580 | 1366 -14% | 1105 -30% | 923 -42% | 1790 13% |
| Score Write (Points) | 1565 | 1147 -27% | 1351 -14% | 1528 -2% | 2176 39% |
| Score Total (Points) | 3968 | 3168 -20% | 3037 -23% | 2896 -27% | 4950 25% |
| Copy ISO MB/s (MB/s) | 1685 | 946 -44% | 2474 47% | ||
| Copy Program MB/s (MB/s) | 669 | 452.8 -32% | 679 1% | ||
| Copy Game MB/s (MB/s) | 1493 | 1013 -32% | 1037 -31% | ||
| CrystalDiskMark 5.2 / 6 | 5% | 13% | -6% | 9% | |
| Write 4K (MB/s) | 67.3 | 148.4 121% | 118.7 76% | 97 44% | 131.3 95% |
| Read 4K (MB/s) | 41.47 | 49.65 20% | 52.4 26% | 49.58 20% | 45.84 11% |
| Write Seq (MB/s) | 2239 | 1139 -49% | 2247 0% | 1838 -18% | 2370 6% |
| Read Seq (MB/s) | 2112 | 2353 11% | 2234 6% | 2421 15% | 1509 -29% |
| Write 4K Q32T1 (MB/s) | 488.9 | 484.7 -1% | 515 5% | 326.9 -33% | 481.5 -2% |
| Read 4K Q32T1 (MB/s) | 557 | 542 -3% | 584 5% | 372.9 -33% | 560 1% |
| Write Seq Q32T1 (MB/s) | 2654 | 1139 -57% | 2235 -16% | 1894 -29% | 2392 -10% |
| Read Seq Q32T1 (MB/s) | 3137 | 3108 -1% | 3171 1% | 2828 -10% | 3232 3% |
| Moyenne finale (programmes/paramètres) | -2% /
-4% | 9% /
7% | -2% /
-1% | 17% /
18% |
* ... Moindre est la valeur, meilleures sont les performances

Disk Throttling: DiskSpd Read Loop, Queue Depth 8
| 3DMark 11 Performance | 21233 points | |
| 3DMark Cloud Gate Standard Score | 41006 points | |
| 3DMark Fire Strike Score | 18127 points | |
| 3DMark Time Spy Score | 7818 points | |
Aide | ||
| Bas | Moyen | Élevé | Ultra | |
|---|---|---|---|---|
| The Witcher 3 (2015) | 356.7 | 249.9 | 149.8 | 81 |
| Dota 2 Reborn (2015) | 142 | 133 | 125 | 120 |
| X-Plane 11.11 (2018) | 96.1 | 87.3 | 71.9 | |
| Shadow of the Tomb Raider (2018) | 138 | 111 | 103 | 93 |
| Alienware m15 R3 P87F GeForce RTX 2070 Mobile, i7-10750H, 2x Micron 2200S 512 GB (RAID 0) | Alienware m15 R2 P87F GeForce RTX 2080 Max-Q, i7-9750H, 2x Toshiba XG6 KXG60ZNV512G (RAID 0) | Razer Blade 15 RZ09-0328 GeForce RTX 2070 Max-Q, i7-10750H, Lite-On CA5-8D512 | Asus Zephyrus S GX502GW GeForce RTX 2070 Mobile, i7-9750H, 2x Intel SSD 660p SSDPEKNW512G8 (RAID 0) | MSI GS66 Stealth 10SFS GeForce RTX 2070 Super Max-Q, i9-10980HK, Samsung SSD PM981 MZVLB1T0HALR | Asus ROG Strix Scar 15 G532LWS GeForce RTX 2070 Super Mobile, i9-10980HK, 2x Intel SSD 660p 1TB SSDPEKNW010T8 (RAID 0) | |
|---|---|---|---|---|---|---|
| Noise | -13% | -3% | -14% | -15% | -10% | |
| arrêt / environnement * (dB) | 26.3 | 28.3 -8% | 28.4 -8% | 30 -14% | 30 -14% | 26.5 -1% |
| Idle Minimum * (dB) | 26.7 | 28.5 -7% | 28.4 -6% | 31 -16% | 32 -20% | 27.1 -1% |
| Idle Average * (dB) | 26.7 | 28.5 -7% | 28.4 -6% | 33 -24% | 34 -27% | 32.2 -21% |
| Idle Maximum * (dB) | 30.7 | 49 -60% | 31.7 -3% | 38 -24% | 39 -27% | 34 -11% |
| Load Average * (dB) | 40.2 | 49 -22% | 47.7 -19% | 50 -24% | 53 -32% | 52.4 -30% |
| Witcher 3 ultra * (dB) | 51 | 49 4% | 47.5 7% | 53 -4% | 48 6% | 57.5 -13% |
| Load Maximum * (dB) | 59.7 | 55 8% | 49.5 17% | 56 6% | 53 11% | 57.5 4% |
* ... Moindre est la valeur, meilleures sont les performances
Degré de la nuisance sonore
| Au repos |
| 26.7 / 26.7 / 30.7 dB(A) |
| Fortement sollicité |
| 40.2 / 59.7 dB(A) |
 | ||
30 dB silencieux 40 dB(A) audible 50 dB(A) bruyant |
||
min: | ||
(-) La température maximale du côté supérieur est de 55.8 °C / 132 F, par rapport à la moyenne de 40.4 °C / 105 F, allant de 21.2 à 68.8 °C pour la classe Gaming.
(-) Le fond chauffe jusqu'à un maximum de 62 °C / 144 F, contre une moyenne de 43.2 °C / 110 F
(±) En utilisation inactive, la température moyenne du côté supérieur est de 35.4 °C / 96 F, par rapport à la moyenne du dispositif de 33.9 °C / 93 F.
(±) En jouant à The Witcher 3, la température moyenne du côté supérieur est de 35.8 °C / 96 F, alors que la moyenne de l'appareil est de 33.9 °C / 93 F.
(+) Les repose-poignets et le pavé tactile sont plus froids que la température de la peau avec un maximum de 29.4 °C / 84.9 F et sont donc froids au toucher.
(±) La température moyenne de la zone de l'appui-paume de dispositifs similaires était de 28.8 °C / 83.8 F (-0.6 °C / #-1.1 F).
Alienware m15 R3 P87F analyse audio
(+) | les haut-parleurs peuvent jouer relativement fort (89.5# dB)
Basses 100 - 315 Hz
(-) | presque aucune basse - en moyenne 20.6% plus bas que la médiane
(±) | la linéarité des basses est moyenne (8.1% delta à la fréquence précédente)
Médiums 400 - 2000 Hz
(±) | médiane réduite - en moyenne 6.6% inférieure à la médiane
(+) | les médiums sont linéaires (6.7% delta à la fréquence précédente)
Aiguës 2 - 16 kHz
(±) | sommets plus élevés - en moyenne 5% plus élevés que la médiane
(±) | la linéarité des aigus est moyenne (7.5% delta à la fréquence précédente)
Globalement 100 - 16 000 Hz
(±) | la linéarité du son global est moyenne (16.5% de différence avec la médiane)
Par rapport à la même classe
» 42% de tous les appareils testés de cette catégorie étaient meilleurs, 7% similaires, 51% pires
» Le meilleur avait un delta de 6%, la moyenne était de 18%, le pire était de 132%.
Par rapport à tous les appareils testés
» 28% de tous les appareils testés étaient meilleurs, 6% similaires, 66% pires
» Le meilleur avait un delta de 4%, la moyenne était de 23%, le pire était de 134%.
Apple MacBook 12 (Early 2016) 1.1 GHz analyse audio
(+) | les haut-parleurs peuvent jouer relativement fort (83.6# dB)
Basses 100 - 315 Hz
(±) | basse réduite - en moyenne 11.3% inférieure à la médiane
(±) | la linéarité des basses est moyenne (14.2% delta à la fréquence précédente)
Médiums 400 - 2000 Hz
(+) | médiane équilibrée - seulement 2.4% de la médiane
(+) | les médiums sont linéaires (5.5% delta à la fréquence précédente)
Aiguës 2 - 16 kHz
(+) | des sommets équilibrés - à seulement 2% de la médiane
(+) | les aigus sont linéaires (4.5% delta à la fréquence précédente)
Globalement 100 - 16 000 Hz
(+) | le son global est linéaire (10.2% différence à la médiane)
Par rapport à la même classe
» 7% de tous les appareils testés de cette catégorie étaient meilleurs, 2% similaires, 90% pires
» Le meilleur avait un delta de 5%, la moyenne était de 18%, le pire était de 53%.
Par rapport à tous les appareils testés
» 5% de tous les appareils testés étaient meilleurs, 1% similaires, 94% pires
» Le meilleur avait un delta de 4%, la moyenne était de 23%, le pire était de 134%.
| Éteint/en veille | |
| Au repos | |
| Fortement sollicité |
|
Légende:
min: | |
| Alienware m15 R3 P87F i7-10750H, GeForce RTX 2070 Mobile, IPS, 1920x1080, 15.6" | Alienware m15 P79F i7-8750H, GeForce RTX 2070 Max-Q, OLED, 3840x2160, 15.6" | Eluktronics RP-15 R7 4800H, GeForce RTX 2060 Mobile, IPS, 1920x1080, 15.6" | Razer Blade 15 RZ09-0328 i7-10750H, GeForce RTX 2070 Max-Q, AMOLED, 3840x2160, 15.6" | Asus Zephyrus S GX502GW i7-9750H, GeForce RTX 2070 Mobile, IPS, 1920x1080, 15.6" | MSI GS66 Stealth 10SFS i9-10980HK, GeForce RTX 2070 Super Max-Q, IPS, 1920x1080, 15.6" | MSI GP65 10SFK-047US i7-10750H, GeForce RTX 2070 Mobile, IPS, 1920x1080, 15.6" | |
|---|---|---|---|---|---|---|---|
| Power Consumption | 45% | 31% | 41% | 25% | 39% | 38% | |
| Idle Minimum * (Watt) | 34 | 10.9 68% | 21.7 36% | 11.1 67% | 24 29% | 13 62% | 14.2 58% |
| Idle Average * (Watt) | 48.6 | 12.3 75% | 30.1 38% | 13.7 72% | 27 44% | 16 67% | 18.8 61% |
| Idle Maximum * (Watt) | 58.2 | 19 67% | 35 40% | 33.4 43% | 33 43% | 27 54% | 23.9 59% |
| Load Average * (Watt) | 129.4 | 96 26% | 112.6 13% | 104.4 19% | 129 -0% | 109 16% | 96.9 25% |
| Witcher 3 ultra * (Watt) | 214.5 | 161.7 25% | 134.4 37% | 159.9 25% | 176 18% | 155 28% | 185 14% |
| Load Maximum * (Watt) | 257.3 | 229.1 11% | 201.5 22% | 203.8 21% | 216 16% | 236 8% | 233.4 9% |
* ... Moindre est la valeur, meilleures sont les performances
| Alienware m15 R3 P87F i7-10750H, GeForce RTX 2070 Mobile, 86 Wh | Alienware m15 P79F i7-8750H, GeForce RTX 2070 Max-Q, 90 Wh | Eluktronics RP-15 R7 4800H, GeForce RTX 2060 Mobile, 46.7 Wh | Razer Blade 15 RZ09-0328 i7-10750H, GeForce RTX 2070 Max-Q, 65 Wh | Asus Zephyrus S GX502GW i7-9750H, GeForce RTX 2070 Mobile, 76 Wh | MSI GS66 Stealth 10SFS i9-10980HK, GeForce RTX 2070 Super Max-Q, 99.99 Wh | |
|---|---|---|---|---|---|---|
| Autonomie de la batterie | 86% | 29% | 43% | 31% | 110% | |
| Reader / Idle (h) | 5 | 5.9 18% | 8.4 68% | |||
| WiFi v1.3 (h) | 2.8 | 5.2 86% | 3.6 29% | 4 43% | 3.7 32% | 6.1 118% |
| Load (h) | 0.7 | 1 43% | 1.7 143% |
Points positifs
Points négatifs
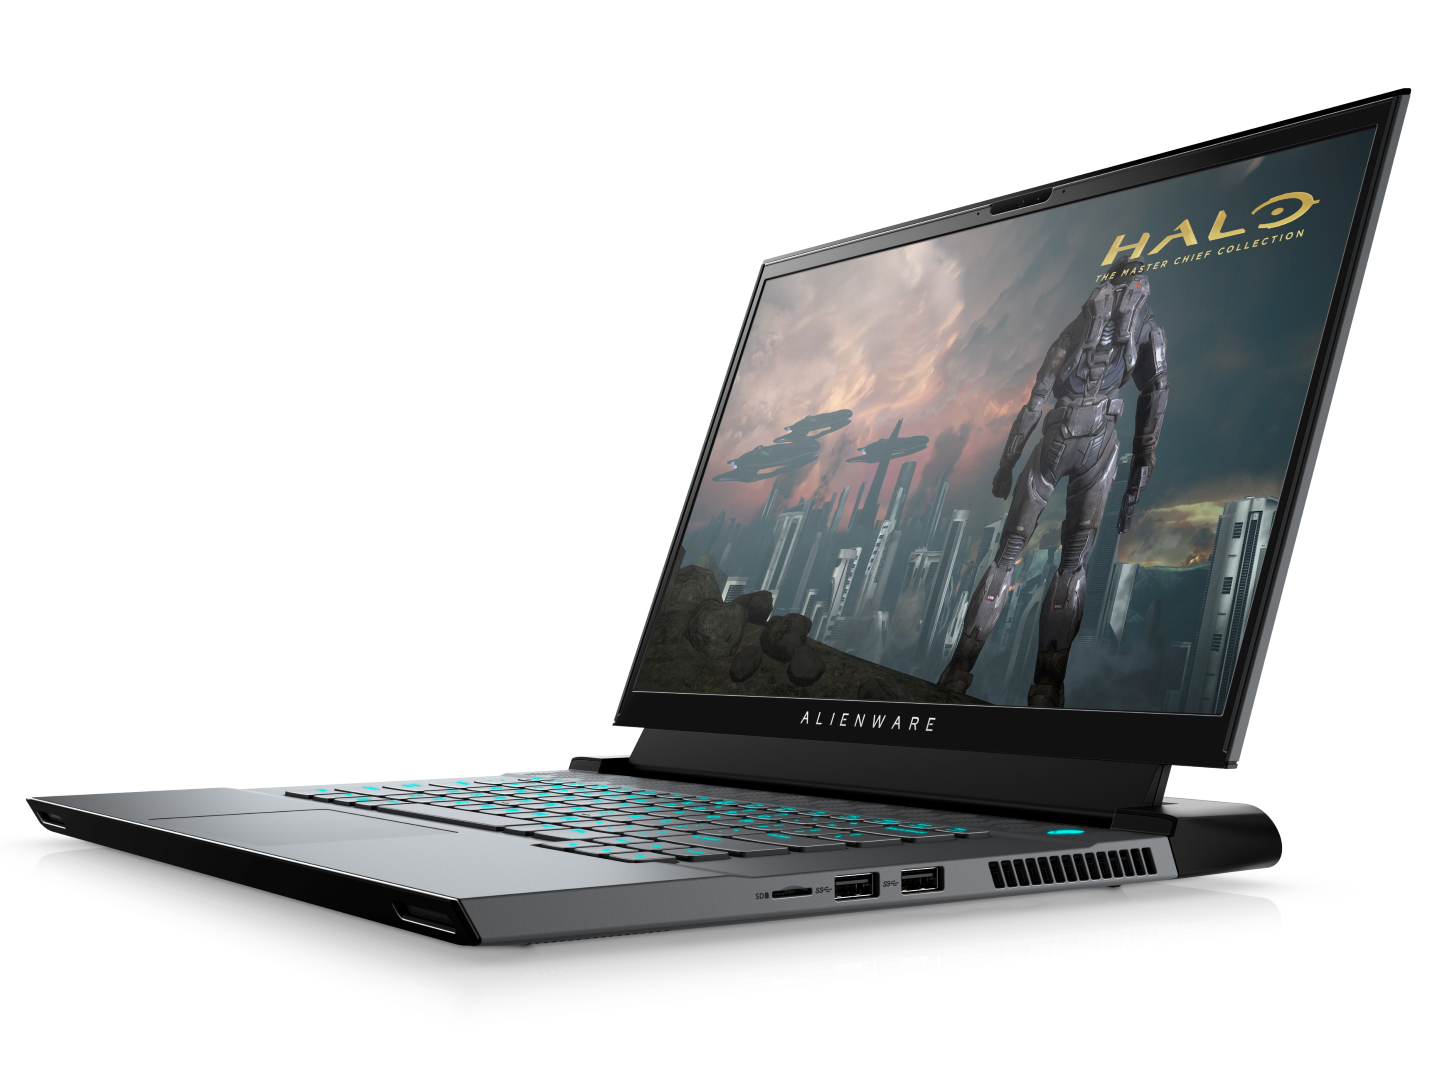
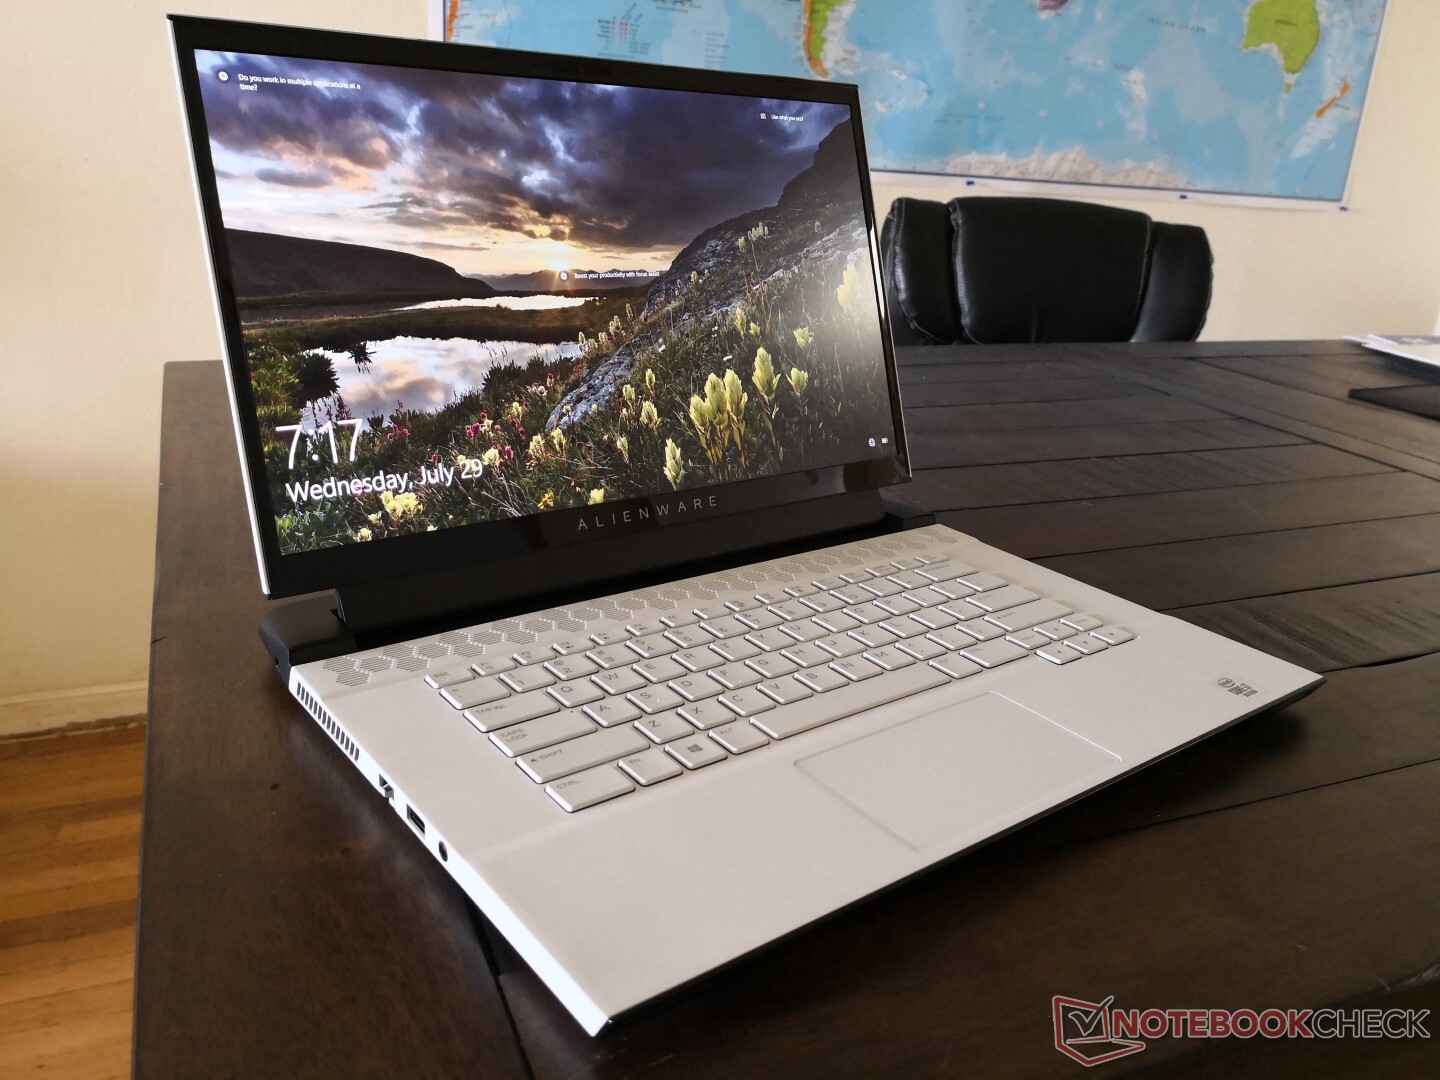
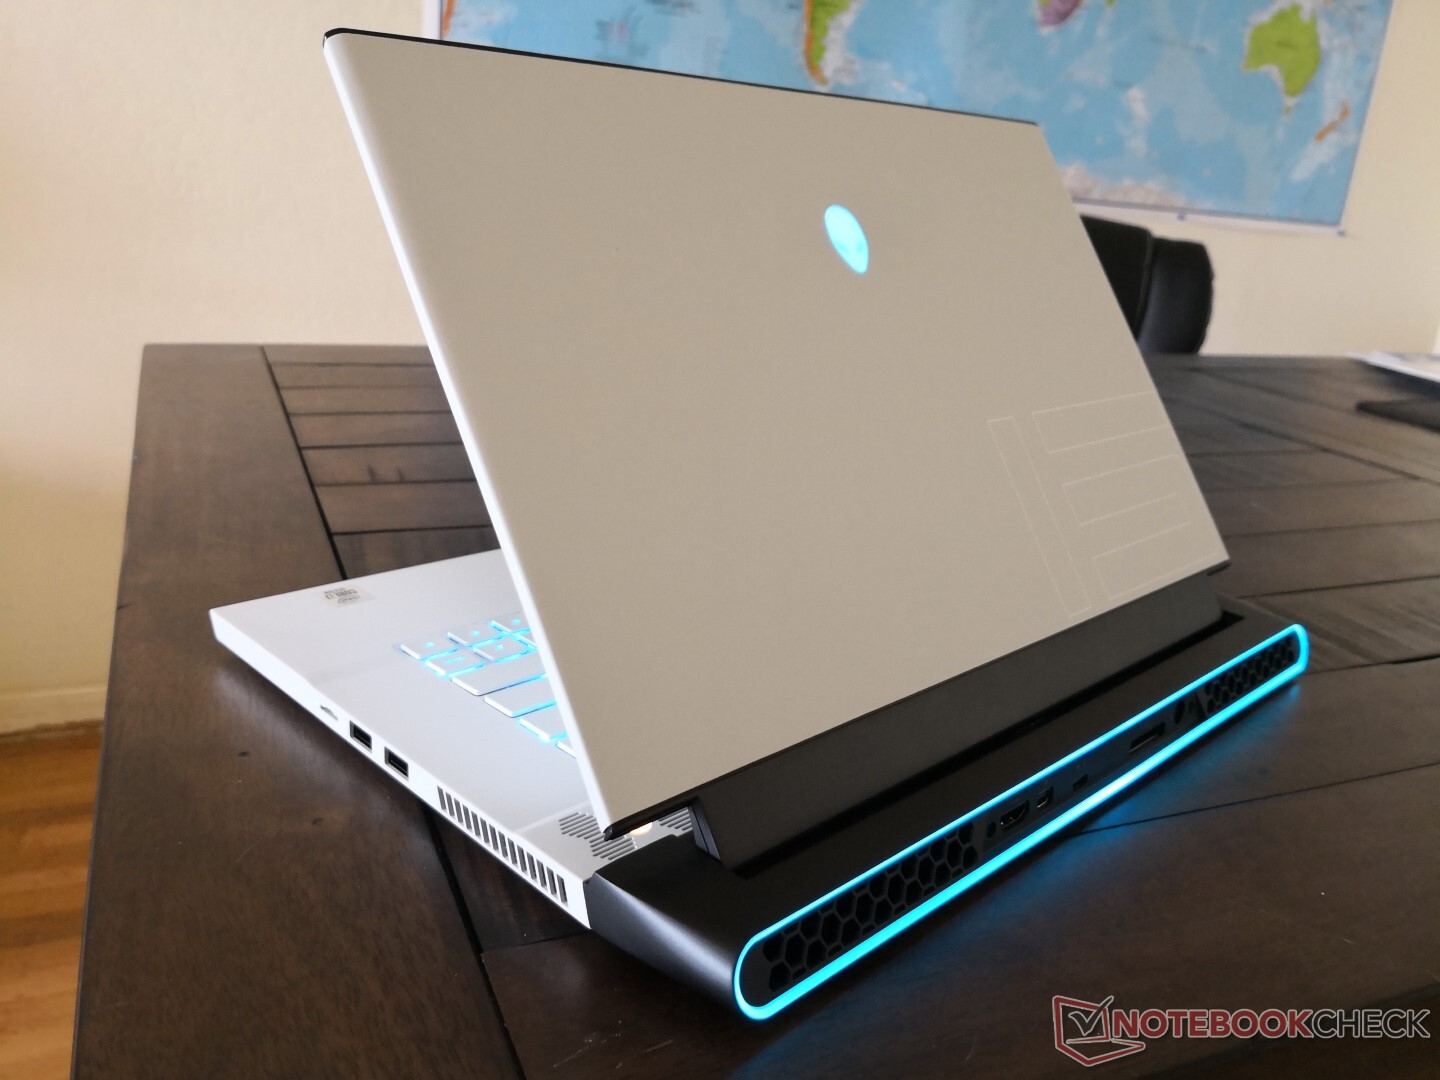
Extérieurement, l'Alienware m15 R3 ressemble au m15 R2 de l'an dernier. Et c'est dommage : ses composants ont été largement revus, et cela ne se voit pas visuellement. Dell a corrigé avec le m15 R3 l'un des principaux problèmes du m15 R2, en intégrant une solution de refroidissement plus puissante, permettant de réduire la température de 20 °C en jeu. Couplez cela à un nouveau duo CPU - GPU, et vous aurez une machine à la fois plus puissante et plus fraîche que son prédécesseur immédiat, tout en lui ressemblant beaucoup. En bref, l'Alienware m15 R3 est ce qu'aurait dû être le m15 R2.
L'un des plus gros problèmes du modèle de l'an dernier maintenant résolu, il est temps de corriger les autres défauts de la machine. Le niveau sonore des ventilateurs en particulier n'a pas changé, si bien qu'il faudra toujours des écouteurs pour jouer. Le châssis fin et léger ne l'est pas autant que certains concurrents, et la chambre a vapeur a même alourdi la machine. La consommation élevée et l'autonomie réduite rendent l'appareil moins adapté aux nomades que les MSI GS66 ou Razer Blade 15, qui ont à peu près les mêmes processeur et carte graphique.
Au final, l'Alienware m15 R3 est une belle amélioration du m15 R2, surtout au regard des températures. Le nouveau processeur est également le bienvenu, mais presque tout le reste est identique à ce qu'était le m15 R2, ce qui est vrai aussi des autres défauts...
L’intégralité de cette critique est disponible en anglais en suivant ce lien.
Alienware m15 R3 P87F
- 07/31/2020 v7 (old)
Allen Ngo
Price comparison
