Notebookcheck Logo

Test de l'Intel Core i7-1185G7 : première évaluation Tiger Lake

Tiger Lake face à Renoir. Intel nous a donné la possibilité de tester son nouveau processeur haut de gamme pour les PC portables fins. La nouvelle puce Tiger Lake d'Intel utilise une nouvelle et plus puissante carte graphique intégrée, si bien que l'écart avec AMD peut être réduit. Nous évaluons de plus près un PC portable de développement d'Intel, et testons les capacités de la nouvelle puce dans de nombreux tests avec différentes configurations d'enveloppe thermique.
L'Intel Core i7-1185G7 en test.
Intel Reference Design Laptop 28W
Processeur
Intel Core i7-1185G7 4 x 3 - 4.8 GHz, 28 W PL2 / Short Burst, 56 W PL1 / Sustained, Tiger Lake-UP3
Carte graphique
Mémoire
16 Go 
, LDDR4X-4266 double canal
Écran
14.00 pouces 16:9, 1920 x 1080 pixel 157 PPP, brillant: oui, 60 Hz
Disque dur
Samsung PM981a MZVLB1T0HBLR, 1024 Go 
Connexions
2 Thunderbolt
Réseau
Intel Wi-Fi 6 AX201 (a/b/g/h/n = Wi-Fi 4/ac = Wi-Fi 5/ax = Wi-Fi 6/)
Système d'exploitation
Microsoft Windows 10 Pro 64 Bit
Prix
0 euros
Remarque : le fabricant peut utiliser des composants provenant de différents fournisseurs, notamment des panneaux d'affichage, des lecteurs ou des clés USB ayant des spécifications similaires.


Performance Rating - Percent
Moyenne Intel Core i9-10980HK
 
84.4 pt
Moyenne Intel Core i7-10875H
 
78.9 pt
Lenovo Yoga Slim 7-14ARE
AMD Ryzen 7 4800U
74.7 pt
Intel Reference Design Laptop 35W Dynamic Tuning -4!
Intel Core i7-1185G7
72.9 pt
Moyenne Intel Core i7-10750H
 
69 pt
Intel Reference Design Laptop 28W
Intel Core i7-1185G7
62.7 pt
Moyenne AMD Ryzen 7 4700U
 
61.9 pt
Moyenne Intel Core i7-1165G7
 
58.2 pt
Xiaomi RedmiBook 16 R5
AMD Ryzen 5 4500U
56.8 pt
Moyenne Intel Core i5-10300H
 
54.1 pt
Moyenne AMD Ryzen 5 4500U
 
53.9 pt
Intel Reference Design Laptop 15W
Intel Core i7-1185G7
52.7 pt
Moyenne Intel Core i7-10710U
 
52.7 pt
Dell XPS 13 9300 4K UHD
Intel Core i7-1065G7
48.4 pt
Moyenne Intel Core i7-10810U
 
48.4 pt
Moyenne Intel Core i7-1065G7
 
41.9 pt
Moyenne AMD Ryzen 3 4300U
 
40.6 pt
Cinebench R20
CPU (Multi Core)
Moyenne Intel Core i9-10980HK
  (3526 - 4487, n=13)
3933 Points +78%
Moyenne Intel Core i7-10875H
  (1986 - 4176, n=32)
3455 Points +56%
Lenovo Yoga Slim 7-14ARE
AMD Ryzen 7 4800U
3213 Points +45%
Moyenne Intel Core i7-10750H
  (1749 - 3325, n=43)
2848 Points +29%
Moyenne AMD Ryzen 7 4700U
  (2401 - 3095, n=9)
2698 Points +22%
Xiaomi RedmiBook 16 R5
AMD Ryzen 5 4500U
2440 Points +10%
Intel Reference Design Laptop 35W Dynamic Tuning
Intel Core i7-1185G7
2402 Points +8%
Moyenne AMD Ryzen 5 4500U
  (1843 - 2530, n=13)
2236 Points +1%
Intel Reference Design Laptop 28W
Intel Core i7-1185G7
2214 Points
Moyenne Intel Core i5-10300H
  (1397 - 2240, n=15)
2046 Points -8%
Moyenne Intel Core i7-10710U
  (1181 - 2598, n=5)
2012 Points -9%
Moyenne Intel Core i7-1165G7
  (1060 - 2657, n=81)
1967 Points -11%
Moyenne Intel Core i7-10810U
  (1498 - 2344, n=5)
1778 Points -20%
Intel Reference Design Laptop 15W
Intel Core i7-1185G7
1560 Points -30%
Moyenne AMD Ryzen 3 4300U
  (1432 - 1609, n=3)
1537 Points -31%
Moyenne Intel Core i7-1065G7
  (1081 - 2024, n=31)
1510 Points -32%
Dell XPS 13 9300 4K UHD
Intel Core i7-1065G7
1396 Points -37%
CPU (Single Core)
Intel Reference Design Laptop 35W Dynamic Tuning
Intel Core i7-1185G7
593 Points +2%
Intel Reference Design Laptop 28W
Intel Core i7-1185G7
580 Points
Intel Reference Design Laptop 15W
Intel Core i7-1185G7
553 Points -5%
Moyenne Intel Core i7-1165G7
  (442 - 589, n=81)
552 Points -5%
Moyenne Intel Core i9-10980HK
  (465 - 507, n=13)
488 Points -16%
Moyenne Intel Core i7-10875H
  (430 - 524, n=32)
486 Points -16%
Lenovo Yoga Slim 7-14ARE
AMD Ryzen 7 4800U
474 Points -18%
Moyenne Intel Core i7-10750H
  (431 - 504, n=43)
473 Points -18%
Moyenne AMD Ryzen 7 4700U
  (448 - 478, n=9)
467 Points -19%
Moyenne Intel Core i7-10710U
  (429 - 480, n=4)
457 Points -21%
Dell XPS 13 9300 4K UHD
Intel Core i7-1065G7
453 Points -22%
Xiaomi RedmiBook 16 R5
AMD Ryzen 5 4500U
451 Points -22%
Moyenne AMD Ryzen 5 4500U
  (424 - 453, n=12)
446 Points -23%
Moyenne Intel Core i5-10300H
  (312 - 470, n=15)
443 Points -24%
Moyenne Intel Core i7-1065G7
  (358 - 474, n=31)
438 Points -24%
Moyenne Intel Core i7-10810U
  (396 - 447, n=5)
425 Points -27%
Moyenne AMD Ryzen 3 4300U
  (412 - 427, n=3)
420 Points -28%
Blender - v2.79 BMW27 CPU
Moyenne AMD Ryzen 3 4300U
  (868 - 907, n=2)
888 Seconds * -63%
Moyenne Intel Core i7-1065G7
  (675 - 1650, n=23)
882 Seconds * -62%
Intel Reference Design Laptop 15W
Intel Core i7-1185G7
745 Seconds * -37%
Moyenne Intel Core i7-10810U
  (571 - 875, n=5)
689 Seconds * -26%
Dell XPS 13 9300 4K UHD
Intel Core i7-1065G7
681 Seconds * -25%
Moyenne Intel Core i7-10710U
  (468 - 892, n=4)
649 Seconds * -19%
Moyenne Intel Core i7-1165G7
  (468 - 1138, n=80)
618 Seconds * -13%
Moyenne AMD Ryzen 5 4500U
  (533 - 748, n=11)
603 Seconds * -11%
Intel Reference Design Laptop 28W
Intel Core i7-1185G7
545 Seconds *
Xiaomi RedmiBook 16 R5
AMD Ryzen 5 4500U
533 Seconds * +2%
Moyenne Intel Core i5-10300H
  (479 - 555, n=14)
515 Seconds * +6%
Intel Reference Design Laptop 35W Dynamic Tuning
Intel Core i7-1185G7
513 Seconds * +6%
Moyenne AMD Ryzen 7 4700U
  (407 - 537, n=8)
480 Seconds * +12%
Moyenne Intel Core i7-10750H
  (322 - 587, n=43)
389 Seconds * +29%
Moyenne Intel Core i7-10875H
  (259 - 535, n=30)
327 Seconds * +40%
Lenovo Yoga Slim 7-14ARE
AMD Ryzen 7 4800U
322 Seconds * +41%
Moyenne Intel Core i9-10980HK
  (239 - 299, n=13)
277 Seconds * +49%
Cinebench R15
CPU Single 64Bit
Intel Reference Design Laptop 35W Dynamic Tuning
Intel Core i7-1185G7
230 Points +3%
Intel Reference Design Laptop 28W
Intel Core i7-1185G7
224 Points
Intel Reference Design Laptop 15W
Intel Core i7-1185G7
216 Points -4%
Moyenne Intel Core i7-1165G7
  (115 - 230, n=78)
212 Points -5%
Moyenne Intel Core i9-10980HK
  (198 - 219, n=15)
207 Points -8%
Moyenne Intel Core i7-10875H
  (190 - 220, n=37)
204 Points -9%
Moyenne Intel Core i7-10750H
  (184 - 213, n=45)
196.7 Points -12%
Lenovo Yoga Slim 7-14ARE
AMD Ryzen 7 4800U
182 Points -19%
Dell XPS 13 9300 4K UHD
Intel Core i7-1065G7
182 Points -19%
Moyenne AMD Ryzen 7 4700U
  (176 - 185, n=11)
180.3 Points -20%
Xiaomi RedmiBook 16 R5
AMD Ryzen 5 4500U
176 Points -21%
Moyenne Intel Core i7-10810U
  (161 - 183, n=5)
175.6 Points -22%
Moyenne Intel Core i7-10710U
  (138 - 194, n=8)
174.9 Points -22%
Moyenne Intel Core i7-1065G7
  (141 - 190, n=35)
174.2 Points -22%
Moyenne Intel Core i5-10300H
  (108 - 194, n=17)
174 Points -22%
Moyenne AMD Ryzen 5 4500U
  (156 - 177, n=13)
172.8 Points -23%
Moyenne AMD Ryzen 3 4300U
  (162.8 - 165, n=2)
163.9 Points -27%
CPU Multi 64Bit
Moyenne Intel Core i9-10980HK
  (1606 - 1862, n=15)
1739 Points +80%
Lenovo Yoga Slim 7-14ARE
AMD Ryzen 7 4800U
1639 (1505.17min - 1639.01max) Points +70%
Moyenne Intel Core i7-10875H
  (1003 - 1833, n=38)
1554 Points +61%
Moyenne Intel Core i7-10750H
  (804 - 1418, n=50)
1263 Points +31%
Moyenne AMD Ryzen 7 4700U
  (801 - 1253, n=12)
1091 Points +13%
Intel Reference Design Laptop 35W Dynamic Tuning
Intel Core i7-1185G7
1066 Points +10%
Xiaomi RedmiBook 16 R5
AMD Ryzen 5 4500U
966 (866.27min - 966.32max) Points 0%
Intel Reference Design Laptop 28W
Intel Core i7-1185G7
966 Points
Intel Reference Design Laptop 28W
Intel Core i7-1185G7
866 (754.55min - 866.1max) Points -10%
Moyenne Intel Core i7-10710U
  (513 - 1113, n=8)
957 Points -1%
Moyenne AMD Ryzen 5 4500U
  (715 - 1007, n=18)
896 Points -7%
Moyenne Intel Core i7-1165G7
  (553 - 1027, n=86)
846 Points -12%
Moyenne Intel Core i5-10300H
  (536 - 921, n=17)
825 Points -15%
Moyenne Intel Core i7-10810U
  (623 - 1064, n=4)
799 Points -17%
Dell XPS 13 9300 4K UHD
Intel Core i7-1065G7
760 (489.25min - 610.17max) Points -21%
Intel Reference Design Laptop 15W
Intel Core i7-1185G7
702 Points -27%
Intel Reference Design Laptop 15W
Intel Core i7-1185G7
628 (619.66min - 627.69max) Points -35%
Moyenne Intel Core i7-1065G7
  (288 - 836, n=36)
648 Points -33%
Moyenne AMD Ryzen 3 4300U
  (545 - 580, n=2)
563 Points -42%
7-Zip 18.03
7z b 4 -mmt1
Moyenne Intel Core i9-10980HK
  (5081 - 5542, n=13)
5386 MIPS 0%
Intel Reference Design Laptop 28W
Intel Core i7-1185G7
5368 MIPS
Moyenne Intel Core i7-10875H
  (5071 - 5780, n=31)
5360 MIPS 0%
Moyenne Intel Core i7-1165G7
  (4478 - 5507, n=80)
5182 MIPS -3%
Intel Reference Design Laptop 15W
Intel Core i7-1185G7
5153 MIPS -4%
Moyenne Intel Core i7-10750H
  (4504 - 5470, n=43)
5114 MIPS -5%
Moyenne Intel Core i5-10300H
  (2945 - 4956, n=14)
4704 MIPS -12%
Moyenne Intel Core i7-10710U
  (4425 - 4727, n=4)
4609 MIPS -14%
Moyenne Intel Core i7-10810U
  (4398 - 4794, n=5)
4561 MIPS -15%
Dell XPS 13 9300 4K UHD
Intel Core i7-1065G7
4438 MIPS -17%
Lenovo Yoga Slim 7-14ARE
AMD Ryzen 7 4800U
4436 MIPS -17%
Moyenne AMD Ryzen 7 4700U
  (4208 - 4470, n=8)
4361 MIPS -19%
Xiaomi RedmiBook 16 R5
AMD Ryzen 5 4500U
4321 MIPS -20%
Moyenne AMD Ryzen 5 4500U
  (4235 - 4338, n=11)
4290 MIPS -20%
Moyenne Intel Core i7-1065G7
  (3289 - 4589, n=24)
4284 MIPS -20%
Moyenne AMD Ryzen 3 4300U
  (4014 - 4113, n=2)
4064 MIPS -24%
7z b 4
Moyenne Intel Core i9-10980HK
  (43786 - 49275, n=13)
47126 MIPS +88%
Lenovo Yoga Slim 7-14ARE
AMD Ryzen 7 4800U
44804 MIPS +79%
Moyenne Intel Core i7-10875H
  (29844 - 49562, n=31)
43117 MIPS +72%
Moyenne Intel Core i7-10750H
  (26040 - 37345, n=43)
33946 MIPS +35%
Moyenne AMD Ryzen 7 4700U
  (26652 - 33890, n=8)
30273 MIPS +21%
Xiaomi RedmiBook 16 R5
AMD Ryzen 5 4500U
25891 MIPS +3%
Intel Reference Design Laptop 28W
Intel Core i7-1185G7
25086 MIPS
Moyenne AMD Ryzen 5 4500U
  (22466 - 25891, n=11)
24384 MIPS -3%
Moyenne Intel Core i7-10710U
  (16713 - 29948, n=4)
23912 MIPS -5%
Moyenne Intel Core i5-10300H
  (15146 - 24841, n=14)
23295 MIPS -7%
Moyenne Intel Core i7-1165G7
  (15347 - 27405, n=80)
22935 MIPS -9%
Moyenne Intel Core i7-10810U
  (16072 - 25244, n=5)
21290 MIPS -15%
Dell XPS 13 9300 4K UHD
Intel Core i7-1065G7
21139 MIPS -16%
Intel Reference Design Laptop 15W
Intel Core i7-1185G7
18936 MIPS -25%
Moyenne Intel Core i7-1065G7
  (10406 - 22898, n=24)
17024 MIPS -32%
Moyenne AMD Ryzen 3 4300U
  (15043 - 16605, n=2)
15824 MIPS -37%
HWBOT x265 Benchmark v2.2 - 4k Preset
Moyenne Intel Core i9-10980HK
  (12 - 14.6, n=13)
13 fps +101%
Moyenne Intel Core i7-10875H
  (7.27 - 14.1, n=27)
11.7 fps +81%
Lenovo Yoga Slim 7-14ARE
AMD Ryzen 7 4800U
10.77 fps +67%
Moyenne Intel Core i7-10750H
  (5.54 - 11.6, n=43)
9.61 fps +49%
Moyenne AMD Ryzen 7 4700U
  (6.79 - 10.1, n=8)
8.44 fps +31%
Xiaomi RedmiBook 16 R5
AMD Ryzen 5 4500U
7.16 fps +11%
Moyenne Intel Core i5-10300H
  (6.13 - 7.78, n=14)
7.1 fps +10%
Moyenne AMD Ryzen 5 4500U
  (5.86 - 7.33, n=10)
6.8 fps +5%
Intel Reference Design Laptop 28W
Intel Core i7-1185G7
6.46 fps
Moyenne Intel Core i7-1165G7
  (1.39 - 8.47, n=80)
6.3 fps -2%
Dell XPS 13 9300 4K UHD
Intel Core i7-1065G7
6.08 fps -6%
Moyenne Intel Core i7-10710U
  (4.2 - 7.95, n=4)
5.94 fps -8%
Moyenne Intel Core i7-10810U
  (3.81 - 6.45, n=5)
5.31 fps -18%
Intel Reference Design Laptop 15W
Intel Core i7-1185G7
5.02 fps -22%
Moyenne AMD Ryzen 3 4300U
  (4.37 - 5.36, n=2)
4.87 fps -25%
Moyenne Intel Core i7-1065G7
  (2.2 - 6.38, n=22)
4.58 fps -29%
R Benchmark 2.5 - Overall mean
Moyenne Intel Core i7-1065G7
  (0.661 - 0.798, n=18)
0.708 sec * -24%
Dell XPS 13 9300 4K UHD
Intel Core i7-1065G7
0.682 sec * -19%
Moyenne Intel Core i7-10810U
  (0.651 - 0.717, n=5)
0.682 sec * -19%
Moyenne Intel Core i5-10300H
  (0.625 - 1.088, n=14)
0.68 sec * -19%
Moyenne AMD Ryzen 3 4300U
  (0.652 - 0.686, n=2)
0.669 sec * -17%
Moyenne Intel Core i7-10710U
  (0.649 - 0.674, n=2)
0.662 sec * -16%
Moyenne AMD Ryzen 5 4500U
  (0.614 - 0.654, n=10)
0.636 sec * -11%
Xiaomi RedmiBook 16 R5
AMD Ryzen 5 4500U
0.634 sec * -11%
Moyenne AMD Ryzen 7 4700U
  (0.598 - 0.651, n=8)
0.618 sec * -8%
Lenovo Yoga Slim 7-14ARE
AMD Ryzen 7 4800U
0.613 sec * -7%
Moyenne Intel Core i7-10750H
  (0.578 - 0.708, n=42)
0.611 sec * -7%
Moyenne Intel Core i7-1165G7
  (0.552 - 1.002, n=80)
0.594 sec * -4%
Moyenne Intel Core i7-10875H
  (0.546 - 0.662, n=29)
0.582 sec * -2%
Intel Reference Design Laptop 15W
Intel Core i7-1185G7
0.579 sec * -1%
Moyenne Intel Core i9-10980HK
  (0.561 - 0.596, n=13)
0.576 sec * -1%
Intel Reference Design Laptop 28W
Intel Core i7-1185G7
0.571 sec *

* ... Moindre est la valeur, meilleures sont les performances

0501001502002503003504004505005506006507007508008509009501000105011001150120012501300135014001450150015501600Tooltip
Intel Reference Design Laptop 28W Intel Core i7-1185G7, Intel Core i7-1185G7: Ø853 (754.55-866.1)
Lenovo Yoga Slim 7-14ARE AMD Ryzen 7 4800U, AMD Ryzen 7 4800U: Ø1522 (1505.17-1639.01)
Dell XPS 13 9300 4K UHD Intel Core i7-1065G7, Intel Core i7-1065G7: Ø573 (480.43-760.86)
Intel Reference Design Laptop 15W Intel Core i7-1185G7, Intel Core i7-1185G7: Ø625 (619.66-627.69)
Cinebench R20
CPU (Multi Core)
Moyenne Intel Core i9-10980HK
  (3526 - 4487, n=13)
3933 Points +78%
Moyenne Intel Core i7-10875H
  (1986 - 4176, n=32)
3455 Points +56%
Lenovo Yoga Slim 7-14ARE
AMD Ryzen 7 4800U, AMD Radeon RX Vega 8 (Ryzen 4000/5000)
3213 Points +45%
Moyenne AMD Ryzen 7 4800U
  (2943 - 3306, n=4)
3178 Points +44%
Moyenne AMD Ryzen 7 4700U
  (2401 - 3095, n=9)
2698 Points +22%
Moyenne AMD Ryzen 5 4600U
  (2544 - 2796, n=3)
2628 Points +19%
Xiaomi RedmiBook 16 R5
AMD Ryzen 5 4500U, AMD Radeon RX Vega 6 (Ryzen 4000/5000)
2440 Points +10%
Intel Reference Design Laptop 35W Dynamic Tuning
Intel Core i7-1185G7, Intel Iris Xe Graphics G7 96EUs
2402 Points +8%
Moyenne AMD Ryzen 5 4500U
  (1843 - 2530, n=13)
2236 Points +1%
Intel Reference Design Laptop 28W
Intel Core i7-1185G7, Intel Iris Xe Graphics G7 96EUs
2214 Points
Moyenne Intel Core i5-10300H
  (1397 - 2240, n=15)
2046 Points -8%
Moyenne Intel Core i7-1165G7
  (1060 - 2657, n=81)
1967 Points -11%
Intel Reference Design Laptop 15W
Intel Core i7-1185G7, Intel Iris Xe Graphics G7 96EUs
1560 Points -30%
Moyenne AMD Ryzen 3 4300U
  (1432 - 1609, n=3)
1537 Points -31%
CPU (Single Core)
Intel Reference Design Laptop 35W Dynamic Tuning
Intel Core i7-1185G7, Intel Iris Xe Graphics G7 96EUs
593 Points +2%
Intel Reference Design Laptop 28W
Intel Core i7-1185G7, Intel Iris Xe Graphics G7 96EUs
580 Points
Intel Reference Design Laptop 15W
Intel Core i7-1185G7, Intel Iris Xe Graphics G7 96EUs
553 Points -5%
Moyenne Intel Core i7-1165G7
  (442 - 589, n=81)
552 Points -5%
Moyenne Intel Core i9-10980HK
  (465 - 507, n=13)
488 Points -16%
Moyenne Intel Core i7-10875H
  (430 - 524, n=32)
486 Points -16%
Moyenne AMD Ryzen 7 4800U
  (474 - 488, n=4)
481 Points -17%
Lenovo Yoga Slim 7-14ARE
AMD Ryzen 7 4800U, AMD Radeon RX Vega 8 (Ryzen 4000/5000)
474 Points -18%
Moyenne AMD Ryzen 7 4700U
  (448 - 478, n=9)
467 Points -19%
Xiaomi RedmiBook 16 R5
AMD Ryzen 5 4500U, AMD Radeon RX Vega 6 (Ryzen 4000/5000)
451 Points -22%
Moyenne AMD Ryzen 5 4600U
  (447 - 453, n=3)
449 Points -23%
Moyenne AMD Ryzen 5 4500U
  (424 - 453, n=12)
446 Points -23%
Moyenne Intel Core i5-10300H
  (312 - 470, n=15)
443 Points -24%
Moyenne AMD Ryzen 3 4300U
  (412 - 427, n=3)
420 Points -28%
Blender - v2.79 BMW27 CPU
Moyenne AMD Ryzen 3 4300U
  (868 - 907, n=2)
888 Seconds * -63%
Intel Reference Design Laptop 15W
Intel Core i7-1185G7, Intel Iris Xe Graphics G7 96EUs
745 Seconds * -37%
Moyenne Intel Core i7-1165G7
  (468 - 1138, n=80)
618 Seconds * -13%
Moyenne AMD Ryzen 5 4500U
  (533 - 748, n=11)
603 Seconds * -11%
Intel Reference Design Laptop 28W
Intel Core i7-1185G7, Intel Iris Xe Graphics G7 96EUs
545 Seconds *
Xiaomi RedmiBook 16 R5
AMD Ryzen 5 4500U, AMD Radeon RX Vega 6 (Ryzen 4000/5000)
533 Seconds * +2%
Moyenne Intel Core i5-10300H
  (479 - 555, n=14)
515 Seconds * +6%
Intel Reference Design Laptop 35W Dynamic Tuning
Intel Core i7-1185G7, Intel Iris Xe Graphics G7 96EUs
513 Seconds * +6%
Moyenne AMD Ryzen 7 4700U
  (407 - 537, n=8)
480 Seconds * +12%
Moyenne AMD Ryzen 5 4600U
 
402 Seconds * +26%
Moyenne AMD Ryzen 7 4800U
  (322 - 374, n=3)
345 Seconds * +37%
Moyenne Intel Core i7-10875H
  (259 - 535, n=30)
327 Seconds * +40%
Lenovo Yoga Slim 7-14ARE
AMD Ryzen 7 4800U, AMD Radeon RX Vega 8 (Ryzen 4000/5000)
322 Seconds * +41%
Moyenne Intel Core i9-10980HK
  (239 - 299, n=13)
277 Seconds * +49%

* ... Moindre est la valeur, meilleures sont les performances

PCMark 10 / Score
Moyenne Intel Core i9-10980HK
  (5277 - 6988, n=12)
6288 Points +13%
Moyenne Intel Core i7-10875H
  (4884 - 6739, n=24)
5970 Points +7%
Intel Reference Design Laptop 28W
Intel Core i7-1185G7, Intel Iris Xe Graphics G7 96EUs, Samsung PM981a MZVLB1T0HBLR
5561 Points
Lenovo Yoga Slim 7-14ARE
AMD Ryzen 7 4800U, AMD Radeon RX Vega 8 (Ryzen 4000/5000), Samsung SSD PM981a MZVLB512HBJQ
5383 Points -3%
Moyenne AMD Ryzen 7 4800U
  (5233 - 5383, n=3)
5291 Points -5%
Moyenne Intel Core i7-1165G7
  (4531 - 5931, n=72)
5070 Points -9%
Moyenne AMD Ryzen 7 4700U
  (4527 - 5307, n=8)
4898 Points -12%
Xiaomi RedmiBook 16 R5
AMD Ryzen 5 4500U, AMD Radeon RX Vega 6 (Ryzen 4000/5000), Samsung PM881 MZNLH512HALU-0000/07
4784 Points -14%
Moyenne AMD Ryzen 5 4600U
 
4772 Points -14%
Moyenne Intel Core i5-10300H
  (4077 - 5301, n=13)
4748 Points -15%
Moyenne AMD Ryzen 5 4500U
  (4393 - 5024, n=12)
4683 Points -16%
Dell XPS 13 9300 4K UHD
Intel Core i7-1065G7, Intel Iris Plus Graphics G7 (Ice Lake 64 EU), Intel SSDPEMKF512G8 NVMe SSD
4451 Points -20%
Moyenne AMD Ryzen 3 4300U
 
4322 Points -22%
PCMark 10 / Essentials
Intel Reference Design Laptop 28W
Intel Core i7-1185G7, Intel Iris Xe Graphics G7 96EUs, Samsung PM981a MZVLB1T0HBLR
10484 Points
Moyenne Intel Core i9-10980HK
  (9312 - 10829, n=12)
9798 Points -7%
Moyenne Intel Core i7-1165G7
  (8026 - 11505, n=72)
9763 Points -7%
Lenovo Yoga Slim 7-14ARE
AMD Ryzen 7 4800U, AMD Radeon RX Vega 8 (Ryzen 4000/5000), Samsung SSD PM981a MZVLB512HBJQ
9637 Points -8%
Moyenne Intel Core i7-10875H
  (7547 - 10458, n=24)
9567 Points -9%
Moyenne AMD Ryzen 7 4800U
  (9188 - 9637, n=3)
9403 Points -10%
Moyenne AMD Ryzen 5 4600U
 
9352 Points -11%
Dell XPS 13 9300 4K UHD
Intel Core i7-1065G7, Intel Iris Plus Graphics G7 (Ice Lake 64 EU), Intel SSDPEMKF512G8 NVMe SSD
9096 Points -13%
Moyenne AMD Ryzen 7 4700U
  (8303 - 9559, n=8)
9009 Points -14%
Xiaomi RedmiBook 16 R5
AMD Ryzen 5 4500U, AMD Radeon RX Vega 6 (Ryzen 4000/5000), Samsung PM881 MZNLH512HALU-0000/07
8905 Points -15%
Moyenne Intel Core i5-10300H
  (7148 - 9874, n=13)
8714 Points -17%
Moyenne AMD Ryzen 5 4500U
  (8204 - 9124, n=11)
8669 Points -17%
Moyenne AMD Ryzen 3 4300U
 
8600 Points -18%
PCMark 10 / Productivity
Intel Reference Design Laptop 28W
Intel Core i7-1185G7, Intel Iris Xe Graphics G7 96EUs, Samsung PM981a MZVLB1T0HBLR
8770 Points
Moyenne Intel Core i9-10980HK
  (7641 - 9337, n=12)
8502 Points -3%
Moyenne Intel Core i7-10875H
  (7534 - 9070, n=24)
8179 Points -7%
Moyenne AMD Ryzen 7 4800U
  (7631 - 8091, n=3)
7879 Points -10%
Lenovo Yoga Slim 7-14ARE
AMD Ryzen 7 4800U, AMD Radeon RX Vega 8 (Ryzen 4000/5000), Samsung SSD PM981a MZVLB512HBJQ
7631 Points -13%
Moyenne Intel Core i5-10300H
  (6732 - 8058, n=13)
7374 Points -16%
Moyenne Intel Core i7-1165G7
  (5570 - 9317, n=72)
7252 Points -17%
Moyenne AMD Ryzen 7 4700U
  (5348 - 7945, n=8)
7201 Points -18%
Xiaomi RedmiBook 16 R5
AMD Ryzen 5 4500U, AMD Radeon RX Vega 6 (Ryzen 4000/5000), Samsung PM881 MZNLH512HALU-0000/07
7096 Points -19%
Moyenne AMD Ryzen 5 4500U
  (6400 - 7752, n=11)
6987 Points -20%
Dell XPS 13 9300 4K UHD
Intel Core i7-1065G7, Intel Iris Plus Graphics G7 (Ice Lake 64 EU), Intel SSDPEMKF512G8 NVMe SSD
6912 Points -21%
Moyenne AMD Ryzen 3 4300U
 
6489 Points -26%
Moyenne AMD Ryzen 5 4600U
 
6230 Points -29%
PCMark 10 / Digital Content Creation
Moyenne Intel Core i9-10980HK
  (5177 - 10217, n=12)
8238 Points +62%
Moyenne Intel Core i7-10875H
  (4563 - 9448, n=24)
7517 Points +48%
Lenovo Yoga Slim 7-14ARE
AMD Ryzen 7 4800U, AMD Radeon RX Vega 8 (Ryzen 4000/5000), Samsung SSD PM981a MZVLB512HBJQ
5758 Points +13%
Moyenne AMD Ryzen 7 4800U
  (5123 - 5758, n=3)
5434 Points +7%
Intel Reference Design Laptop 28W
Intel Core i7-1185G7, Intel Iris Xe Graphics G7 96EUs, Samsung PM981a MZVLB1T0HBLR
5075 Points
Moyenne AMD Ryzen 5 4600U
 
5062 Points 0%
Moyenne Intel Core i7-1165G7
  (4083 - 6957, n=72)
5045 Points -1%
Moyenne AMD Ryzen 7 4700U
  (4459 - 5495, n=8)
4947 Points -3%
Xiaomi RedmiBook 16 R5
AMD Ryzen 5 4500U, AMD Radeon RX Vega 6 (Ryzen 4000/5000), Samsung PM881 MZNLH512HALU-0000/07
4704 Points -7%
Moyenne Intel Core i5-10300H
  (2928 - 6003, n=13)
4621 Points -9%
Moyenne AMD Ryzen 5 4500U
  (4189 - 4808, n=11)
4517 Points -11%
Moyenne AMD Ryzen 3 4300U
 
3926 Points -23%
Dell XPS 13 9300 4K UHD
Intel Core i7-1065G7, Intel Iris Plus Graphics G7 (Ice Lake 64 EU), Intel SSDPEMKF512G8 NVMe SSD
3807 Points -25%
3DMark
2560x1440 Time Spy Graphics
Moyenne NVIDIA GeForce MX450
  (1086 - 2300, n=16)
1796 Points +11%
Moyenne NVIDIA GeForce GTX 1050 Mobile
  (1416 - 2130, n=11)
1672 Points +3%
Intel Reference Design Laptop 28W
Intel Iris Xe Graphics G7 96EUs, Intel Core i7-1185G7
1618 Points
Moyenne NVIDIA GeForce GTX 1050 Max-Q
  (1596 - 1634, n=2)
1615 Points 0%
Apple MacBook Pro 15 2018 (2.6 GHz, 560X)
AMD Radeon Pro 560X, Intel Core i7-8850H
1614 Points 0%
Intel Reference Design Laptop 35W Dynamic Tuning
Intel Iris Xe Graphics G7 96EUs, Intel Core i7-1185G7
1614 Points 0%
Moyenne NVIDIA GeForce MX350
  (1123 - 1595, n=12)
1322 Points -18%
Lenovo Yoga Slim 7-14ARE
AMD Radeon RX Vega 8 (Ryzen 4000/5000), AMD Ryzen 7 4800U
1173 Points -28%
Moyenne AMD Radeon RX Vega 8 (Ryzen 4000/5000)
  (540 - 1557, n=53)
1156 Points -29%
Moyenne NVIDIA GeForce MX250
  (881 - 1169, n=22)
1070 Points -34%
Moyenne AMD Radeon RX Vega 7
  (496 - 1249, n=57)
991 Points -39%
Moyenne AMD Radeon RX Vega 9
 
872 Points -46%
Moyenne AMD Radeon RX Vega 6 (Ryzen 4000/5000)
  (650 - 996, n=22)
821 Points -49%
Xiaomi RedmiBook 16 R5
AMD Radeon RX Vega 6 (Ryzen 4000/5000), AMD Ryzen 5 4500U
783 Points -52%
Moyenne Intel Iris Plus Graphics G7 (Ice Lake 64 EU)
  (526 - 851, n=23)
744 Points -54%
1920x1080 Fire Strike Graphics
Moyenne NVIDIA GeForce GTX 1050 Mobile
  (4935 - 6651, n=43)
6022 Points +7%
Apple MacBook Pro 15 2018 (2.6 GHz, 560X)
AMD Radeon Pro 560X, Intel Core i7-8850H
5699 Points +1%
Moyenne NVIDIA GeForce GTX 1050 Max-Q
  (5616 - 5792, n=4)
5677 Points 0%
Intel Reference Design Laptop 28W
Intel Iris Xe Graphics G7 96EUs, Intel Core i7-1185G7
5652 Points
Moyenne NVIDIA GeForce MX450
  (4336 - 5753, n=17)
4869 Points -14%
Moyenne NVIDIA GeForce MX350
  (3999 - 4656, n=14)
4390 Points -22%
Lenovo Yoga Slim 7-14ARE
AMD Radeon RX Vega 8 (Ryzen 4000/5000), AMD Ryzen 7 4800U
3938 Points -30%
Moyenne AMD Radeon RX Vega 8 (Ryzen 4000/5000)
  (1694 - 5041, n=53)
3677 Points -35%
Moyenne NVIDIA GeForce MX250
  (2939 - 3885, n=29)
3531 Points -38%
Moyenne AMD Radeon RX Vega 7
  (1772 - 4037, n=62)
3189 Points -44%
Moyenne AMD Radeon RX Vega 9
 
2789 Points -51%
Moyenne AMD Radeon RX Vega 6 (Ryzen 4000/5000)
  (2122 - 3239, n=23)
2673 Points -53%
Xiaomi RedmiBook 16 R5
AMD Radeon RX Vega 6 (Ryzen 4000/5000), AMD Ryzen 5 4500U
2656 Points -53%
Moyenne Intel Iris Plus Graphics G7 (Ice Lake 64 EU)
  (1418 - 3156, n=27)
2594 Points -54%
Basemark GPU 1.2 - 1920x1080 Vulkan Medium Offscreen
Moyenne NVIDIA GeForce MX450
 
235 fps +16%
Intel Reference Design Laptop 28W
Intel Iris Xe Graphics G7 96EUs, Intel Core i7-1185G7
202 (105min, 155P1 - 432max) fps
Apple MacBook Pro 15 2018 (2.6 GHz, 560X)
AMD Radeon Pro 560X, Intel Core i7-8850H
182 (113min, 133P1 - 370max) fps -10%
Apple MacBook Pro 15 2018 (2.6 GHz, 560X)
AMD Radeon Pro 560X, Intel Core i7-8850H
177.5 (107min - 390max) fps -12%
Intel Reference Design Laptop 15W
Intel Iris Xe Graphics G7 96EUs, Intel Core i7-1185G7
172 (89.2min, 133P1 - 403max) fps -15%
Moyenne AMD Radeon RX Vega 8 (Ryzen 4000/5000)
  (76.9 - 289, n=8)
156.3 fps -23%
Moyenne AMD Radeon RX Vega 7
  (104.6 - 289, n=10)
134.4 fps -33%
Moyenne Intel Iris Plus Graphics G7 (Ice Lake 64 EU)
 
102 fps -50%
Moyenne AMD Radeon RX Vega 6 (Ryzen 4000/5000)
  (82.6 - 104.6, n=2)
93.6 fps -54%
Xiaomi RedmiBook 16 R5
AMD Radeon RX Vega 6 (Ryzen 4000/5000), AMD Ryzen 5 4500U
82.6 (47.9min, 62.3P1 - 176max) fps -59%
Cinebench R15 - OpenGL 64Bit
Moyenne NVIDIA GeForce MX450
  (84.6 - 150, n=19)
127 fps +19%
Moyenne NVIDIA GeForce MX350
  (97.5 - 140, n=11)
116.7 fps +9%
Moyenne AMD Radeon RX Vega 8 (Ryzen 4000/5000)
  (37.4 - 1714, n=54)
111.6 fps +4%
Intel Reference Design Laptop 28W
Intel Iris Xe Graphics G7 96EUs, Intel Core i7-1185G7
107 fps
Moyenne NVIDIA GeForce GTX 1050 Max-Q
  (64.5 - 119.9, n=4)
100.9 fps -6%
Apple MacBook Pro 15 2018 (2.6 GHz, 560X)
AMD Radeon Pro 560X, Intel Core i7-8850H
98.4 fps -8%
Moyenne NVIDIA GeForce GTX 1050 Mobile
  (0.99 - 122.9, n=41)
97.3 fps -9%
Moyenne NVIDIA GeForce MX250
  (48.5 - 114.8, n=30)
96.8 fps -10%
Intel Reference Design Laptop 15W
Intel Iris Xe Graphics G7 96EUs, Intel Core i7-1185G7
88.3 fps -17%
Lenovo Yoga Slim 7-14ARE
AMD Radeon RX Vega 8 (Ryzen 4000/5000), AMD Ryzen 7 4800U
75.4 fps -30%
Lenovo Yoga Slim 7-14ARE
AMD Radeon RX Vega 8 (Ryzen 4000/5000), AMD Ryzen 7 4800U
73.1 fps -32%
Lenovo Yoga Slim 7-14ARE
AMD Radeon RX Vega 8 (Ryzen 4000/5000), AMD Ryzen 7 4800U
72.7 fps -32%
Moyenne AMD Radeon RX Vega 7
  (37.3 - 123.2, n=59)
73.3 fps -31%
Moyenne Intel Iris Plus Graphics G7 (Ice Lake 64 EU)
  (38.4 - 74.5, n=30)
62.8 fps -41%
Moyenne AMD Radeon RX Vega 6 (Ryzen 4000/5000)
  (47.5 - 91.3, n=23)
59.6 fps -44%
Xiaomi RedmiBook 16 R5
AMD Radeon RX Vega 6 (Ryzen 4000/5000), AMD Ryzen 5 4500U
59.4 fps -44%
Moyenne AMD Radeon RX Vega 9
 
55 fps -49%
V-Ray Benchmark Next 4.10 - GPU
Moyenne NVIDIA GeForce GTX 1050 Mobile
 
61 mpaths +85%
Moyenne AMD Radeon RX Vega 8 (Ryzen 4000/5000)
  (31 - 83, n=47)
59.9 mpaths +82%
Lenovo Yoga Slim 7-14ARE
AMD Radeon RX Vega 8 (Ryzen 4000/5000), AMD Ryzen 7 4800U
47 mpaths +42%
Moyenne AMD Radeon RX Vega 7
  (14 - 70, n=47)
46.2 mpaths +40%
Moyenne AMD Radeon RX Vega 6 (Ryzen 4000/5000)
  (30 - 52, n=15)
39.4 mpaths +19%
Intel Reference Design Laptop 35W Dynamic Tuning
Intel Iris Xe Graphics G7 96EUs, Intel Core i7-1185G7
37 mpaths +12%
Moyenne NVIDIA GeForce MX350
  (33 - 41, n=10)
35.9 mpaths +9%
Moyenne NVIDIA GeForce MX450
  (28 - 40, n=17)
34.6 mpaths +5%
Xiaomi RedmiBook 16 R5
AMD Radeon RX Vega 6 (Ryzen 4000/5000), AMD Ryzen 5 4500U
33 mpaths 0%
Intel Reference Design Laptop 28W
Intel Iris Xe Graphics G7 96EUs, Intel Core i7-1185G7
33 mpaths
Intel Reference Design Laptop 28W
Intel Iris Xe Graphics G7 96EUs, Intel Core i7-1185G7
29 mpaths -12%
Moyenne NVIDIA GeForce MX250
  (24 - 34, n=5)
29.6 mpaths -10%
Intel Reference Design Laptop 15W
Intel Iris Xe Graphics G7 96EUs, Intel Core i7-1185G7
25 mpaths -24%
Moyenne Intel Iris Plus Graphics G7 (Ice Lake 64 EU)
  (17 - 28, n=5)
21.2 mpaths -36%
The Witcher 3 - 1920x1080 High Graphics & Postprocessing (Nvidia HairWorks Off)
Moyenne NVIDIA GeForce GTX 1050 Mobile
  (29.1 - 43, n=29)
38 fps +6%
Moyenne NVIDIA GeForce GTX 1050 Max-Q
  (34 - 41, n=3)
36.5 fps +2%
Intel Reference Design Laptop 28W
Intel Iris Xe Graphics G7 96EUs, Intel Core i7-1185G7
35.9 (31min - 41max) fps
Moyenne NVIDIA GeForce MX450
  (21 - 46, n=16)
34.8 fps -3%
Moyenne NVIDIA GeForce MX350
  (20.6 - 29.9, n=13)
26.3 fps -27%
Lenovo Yoga Slim 7-14ARE
AMD Radeon RX Vega 8 (Ryzen 4000/5000), AMD Ryzen 7 4800U
23.1 fps -36%
Moyenne AMD Radeon RX Vega 8 (Ryzen 4000/5000)
  (8.7 - 26.8, n=45)
20.6 fps -43%
Moyenne NVIDIA GeForce MX250
  (16.3 - 23.1, n=27)
20.1 fps -44%
Moyenne AMD Radeon RX Vega 7
  (8.96 - 26.2, n=49)
18.1 fps -50%
Moyenne Intel Iris Plus Graphics G7 (Ice Lake 64 EU)
  (10.9 - 20.1, n=18)
17 fps -53%
Xiaomi RedmiBook 16 R5
AMD Radeon RX Vega 6 (Ryzen 4000/5000), AMD Ryzen 5 4500U
15.7 (13min - 18max) fps -56%
Moyenne AMD Radeon RX Vega 6 (Ryzen 4000/5000)
  (10.7 - 19.4, n=20)
15 fps -58%
Moyenne AMD Radeon RX Vega 9
 
13.3 fps -63%
GTA V - 1920x1080 High/On (Advanced Graphics Off) AA:2xMSAA + FX AF:8x
Moyenne NVIDIA GeForce GTX 1050 Mobile
 
65.9 fps +119%
Moyenne NVIDIA GeForce GTX 1050 Max-Q
  (61.8 - 62.1, n=2)
62 fps +106%
Moyenne NVIDIA GeForce MX450
  (30.6 - 68.3, n=11)
54.1 fps +80%
Moyenne NVIDIA GeForce MX350
  (45.8 - 49.5, n=3)
47.4 fps +57%
Moyenne NVIDIA GeForce MX250
  (35.9 - 41.5, n=4)
38.4 fps +28%
Intel Reference Design Laptop 28W
Intel Iris Xe Graphics G7 96EUs, Intel Core i7-1185G7
30.1 (7.4min, 20P1 - 122max) fps
Lenovo Yoga Slim 7-14ARE
AMD Radeon RX Vega 8 (Ryzen 4000/5000), AMD Ryzen 7 4800U
29.8 (3.22min, 21.3P1 - 83.4max) fps -1%
Moyenne AMD Radeon RX Vega 8 (Ryzen 4000/5000)
  (13.8 - 40.6, n=44)
26.1 fps -13%
Moyenne AMD Radeon RX Vega 7
  (11.3 - 32.2, n=36)
22.7 fps -25%
Moyenne AMD Radeon RX Vega 6 (Ryzen 4000/5000)
  (20.1 - 24.6, n=6)
21.5 fps -29%
Xiaomi RedmiBook 16 R5
AMD Radeon RX Vega 6 (Ryzen 4000/5000), AMD Ryzen 5 4500U
20.5 (2.05min, 14.5P1 - 33.2max) fps -32%
Moyenne Intel Iris Plus Graphics G7 (Ice Lake 64 EU)
  (12.7 - 13.3, n=2)
13 fps -57%
Dota 2 Reborn - 1920x1080 ultra (3/3) best looking
Moyenne NVIDIA GeForce GTX 1050 Mobile
  (94.9 - 117, n=4)
106 fps +115%
Moyenne NVIDIA GeForce GTX 1050 Max-Q
 
104.1 fps +111%
Moyenne NVIDIA GeForce MX450
  (34.9 - 104.6, n=20)
79.9 fps +62%
Moyenne NVIDIA GeForce MX350
  (52.3 - 80.6, n=14)
72.5 fps +47%
Moyenne NVIDIA GeForce MX250
  (7.8 - 67.5, n=21)
53.6 fps +9%
Lenovo Yoga Slim 7-14ARE
AMD Radeon RX Vega 8 (Ryzen 4000/5000), AMD Ryzen 7 4800U
52.5 (47.3min) fps +6%
Intel Reference Design Laptop 28W
Intel Iris Xe Graphics G7 96EUs, Intel Core i7-1185G7
49.4 (33.1min) fps
Moyenne AMD Radeon RX Vega 8 (Ryzen 4000/5000)
  (23.3 - 72, n=56)
48.7 fps -1%
Moyenne AMD Radeon RX Vega 7
  (23.3 - 58.2, n=58)
41.9 fps -15%
Moyenne AMD Radeon RX Vega 6 (Ryzen 4000/5000)
  (30.4 - 66.1, n=21)
40 fps -19%
Xiaomi RedmiBook 16 R5
AMD Radeon RX Vega 6 (Ryzen 4000/5000), AMD Ryzen 5 4500U
39.8 (36.6min) fps -19%
Intel Reference Design Laptop 15W
Intel Iris Xe Graphics G7 96EUs, Intel Core i7-1185G7
38 (25.9min) fps -23%
Moyenne Intel Iris Plus Graphics G7 (Ice Lake 64 EU)
  (16.4 - 35.7, n=18)
26.9 fps -46%
X-Plane 11.11 - 1920x1080 high (fps_test=3)
Moyenne NVIDIA GeForce GTX 1050 Max-Q
 
65.1 fps +56%
Moyenne NVIDIA GeForce GTX 1050 Mobile
  (44.6 - 66.7, n=2)
55.7 fps +34%
Moyenne NVIDIA GeForce MX450
  (35.4 - 71.4, n=20)
54.9 fps +32%
Moyenne NVIDIA GeForce MX350
  (30.2 - 63.7, n=14)
48 fps +15%
Intel Reference Design Laptop 28W
Intel Iris Xe Graphics G7 96EUs, Intel Core i7-1185G7
41.7 fps
Moyenne NVIDIA GeForce MX250
  (9.8 - 52.6, n=17)
39.4 fps -6%
Intel Reference Design Laptop 15W
Intel Iris Xe Graphics G7 96EUs, Intel Core i7-1185G7
33.1 fps -21%
Moyenne AMD Radeon RX Vega 8 (Ryzen 4000/5000)
  (19.1 - 43.1, n=56)
30.6 fps -27%
Lenovo Yoga Slim 7-14ARE
AMD Radeon RX Vega 8 (Ryzen 4000/5000), AMD Ryzen 7 4800U
30.5 fps -27%
Moyenne AMD Radeon RX Vega 7
  (17.4 - 35.7, n=56)
27.2 fps -35%
Xiaomi RedmiBook 16 R5
AMD Radeon RX Vega 6 (Ryzen 4000/5000), AMD Ryzen 5 4500U
26.2 fps -37%
Moyenne AMD Radeon RX Vega 6 (Ryzen 4000/5000)
  (22.6 - 29.9, n=20)
25.8 fps -38%
Moyenne Intel Iris Plus Graphics G7 (Ice Lake 64 EU)
  (10.8 - 19.7, n=18)
15 fps -64%

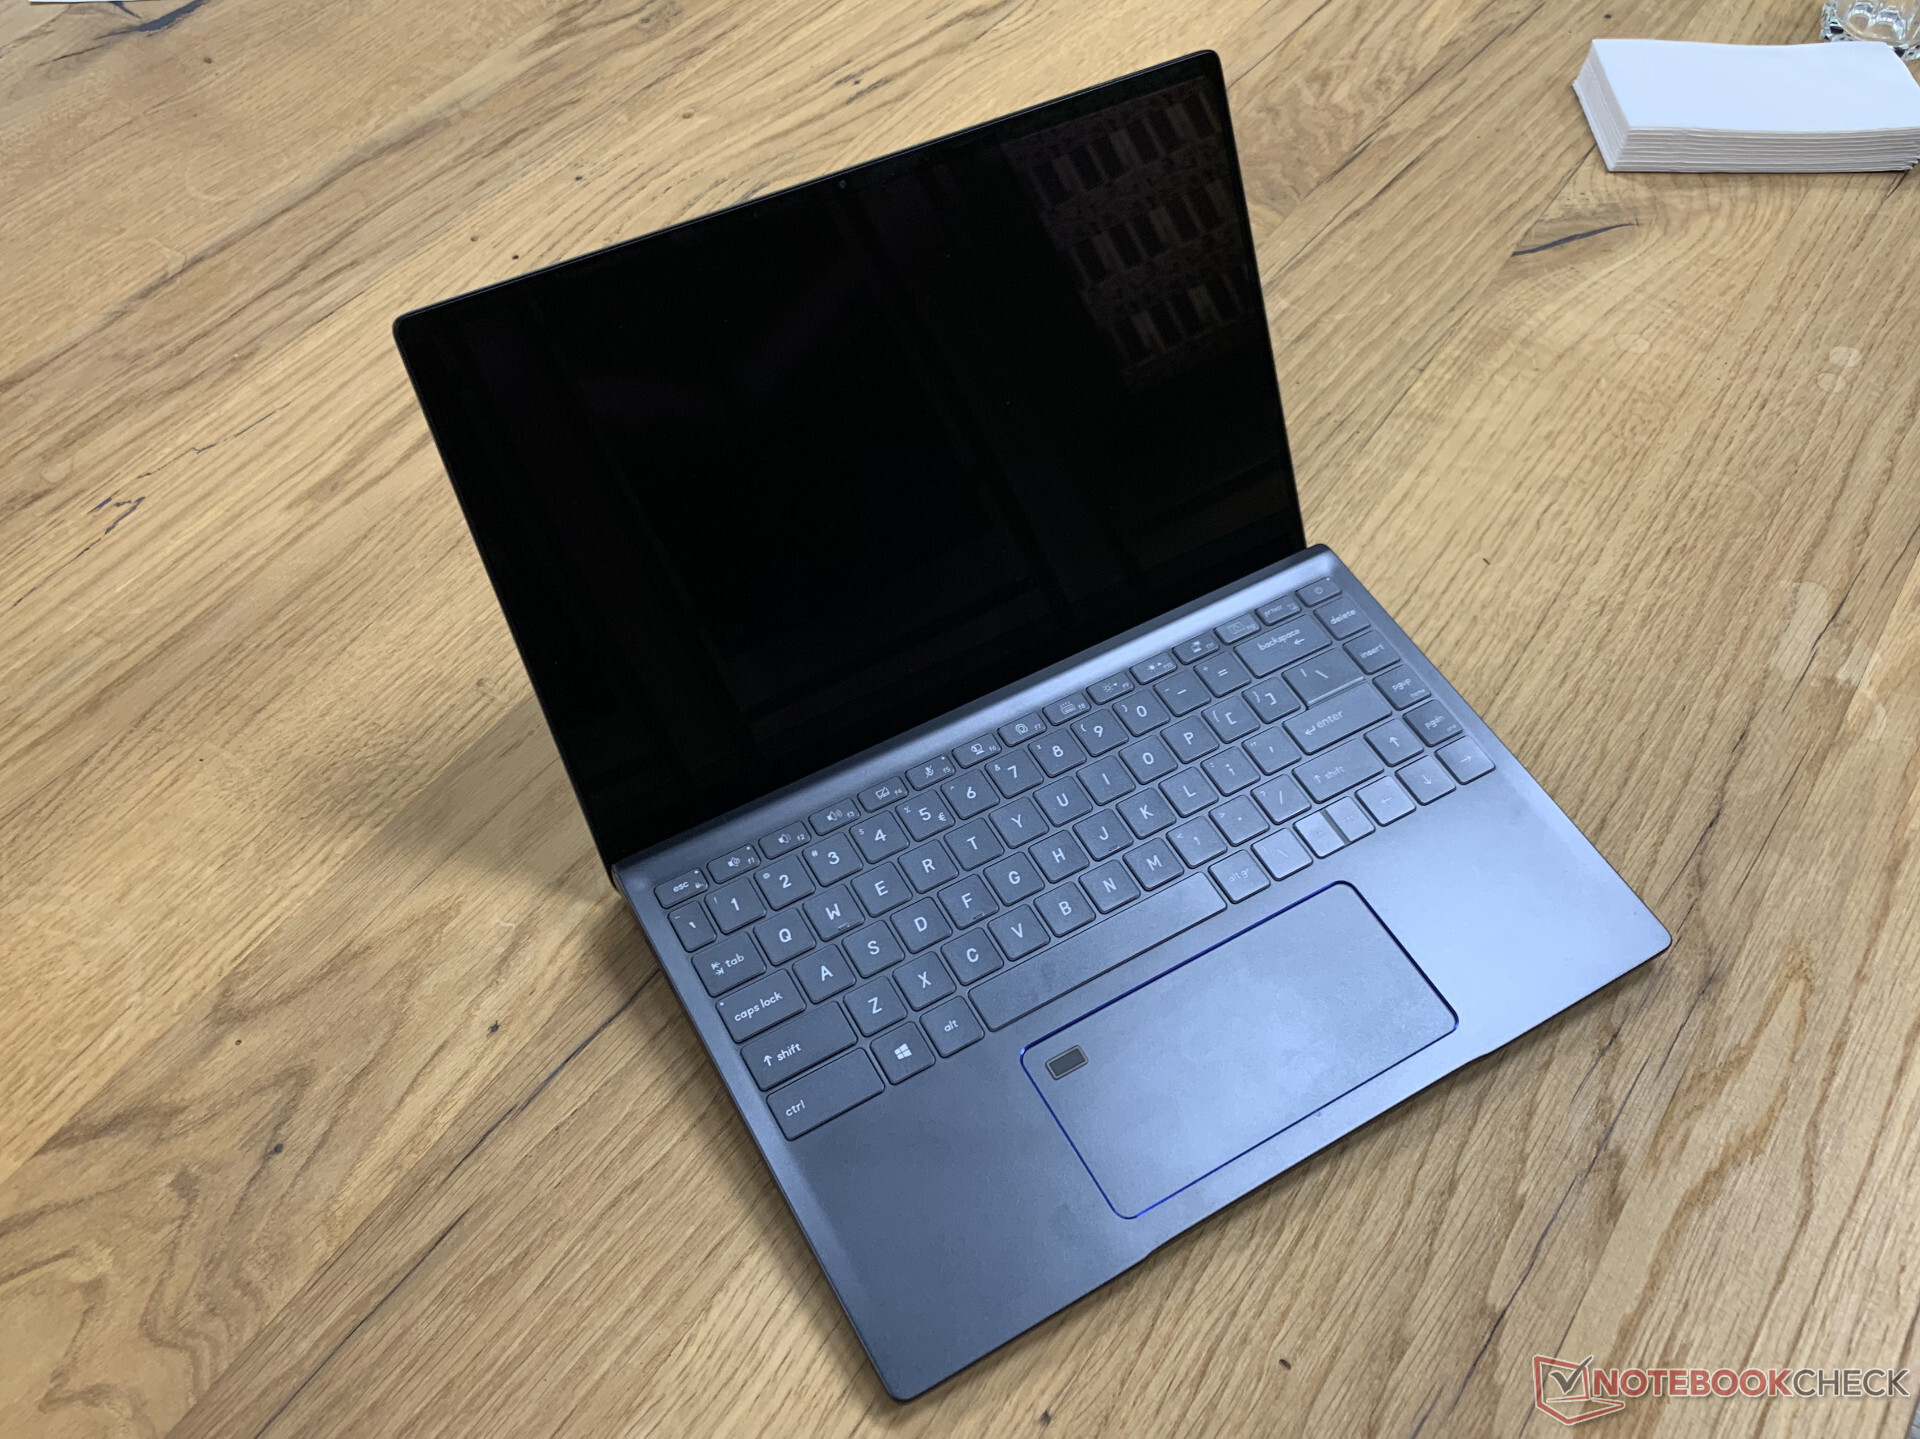
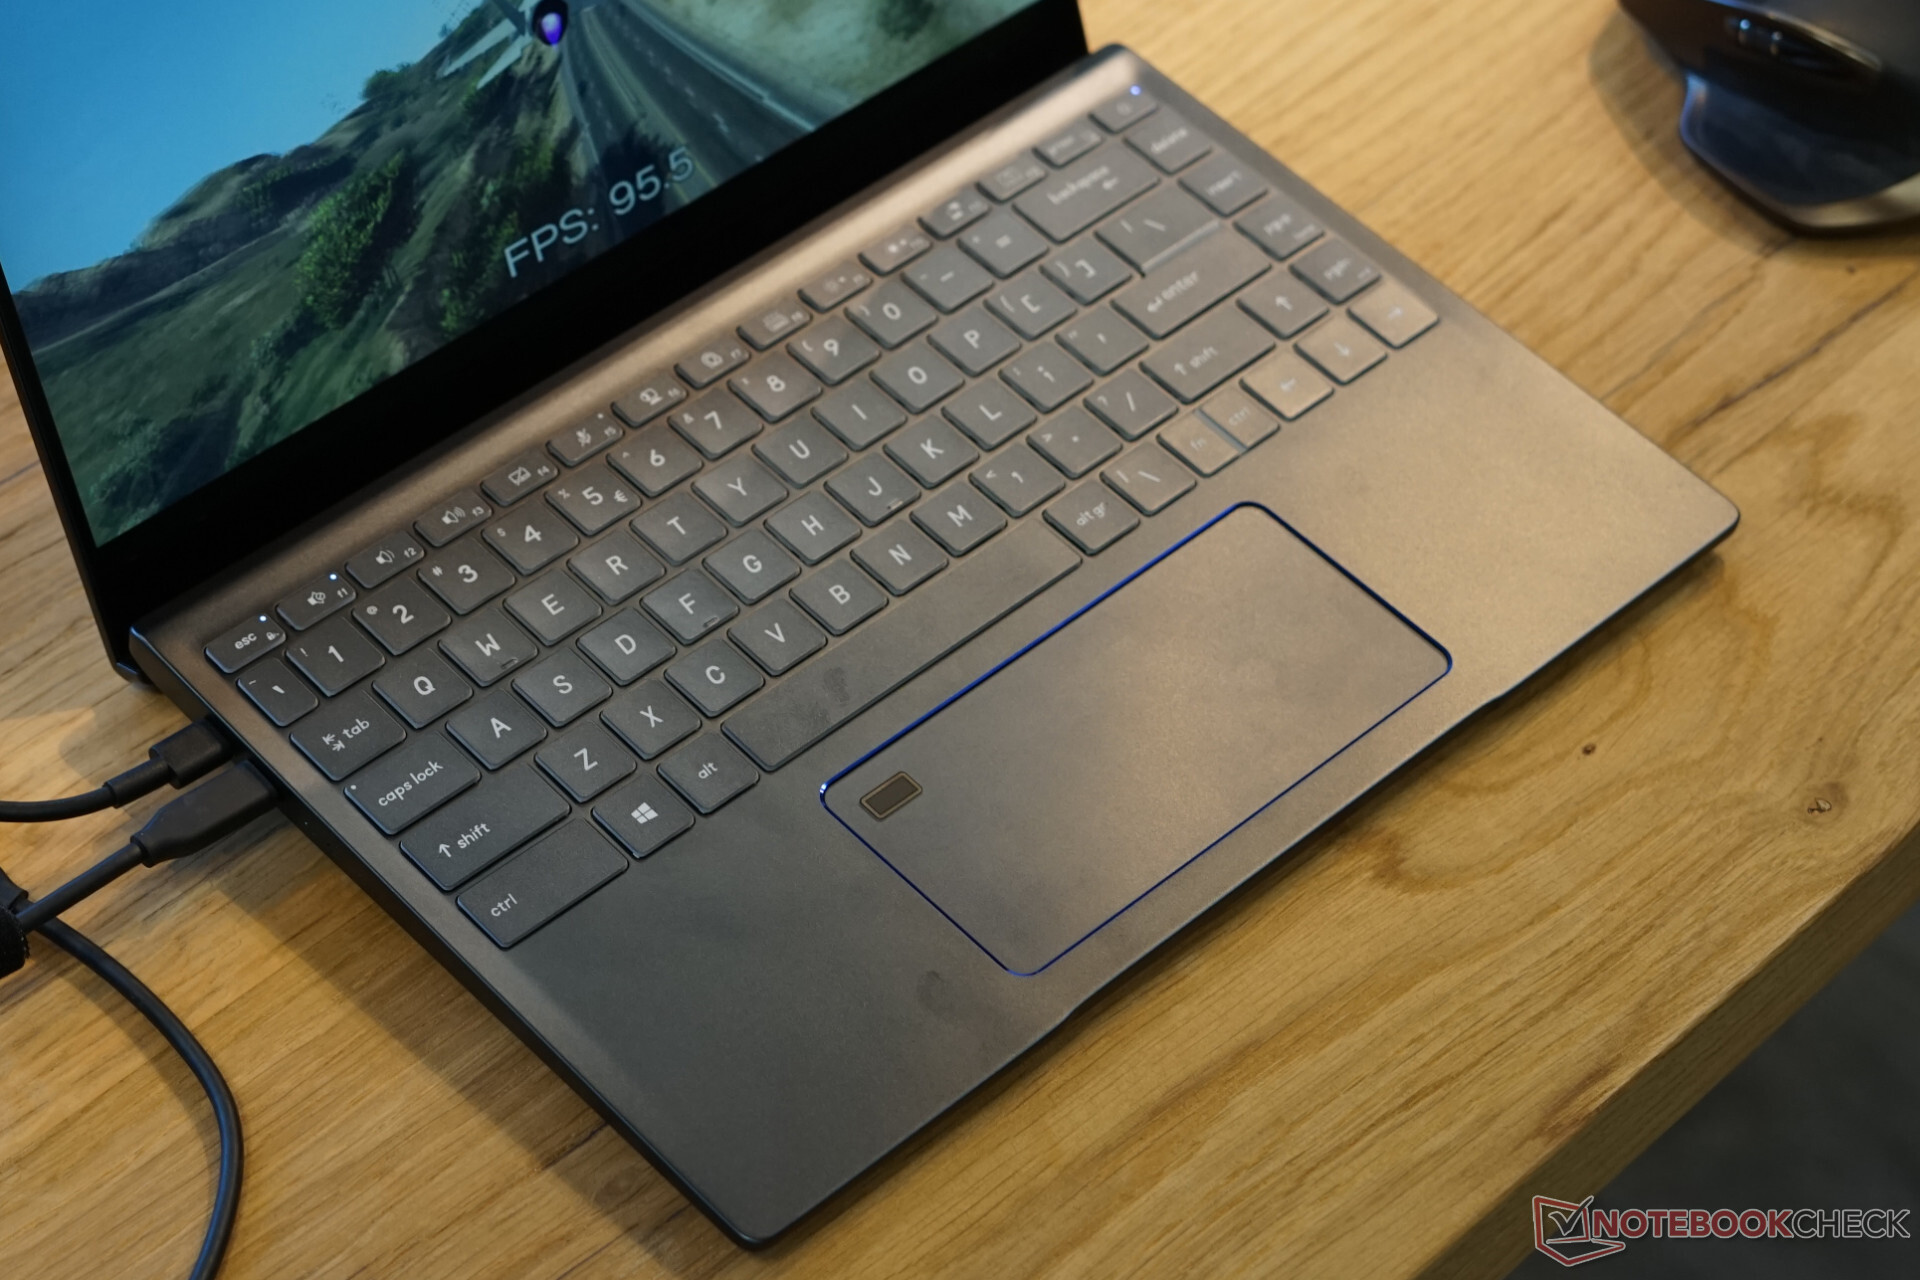
Ces premiers tests avec une machine de référence d'Intel embarquant la nouvelle puce Tiger Lake U haut de gamme, le Core i7-1185G7, sont très prometteurs, si bien que la puce laisse une excellent impression. Intel montre ce qu'une configuration bien paramétrée avec un refroidissement suffisant peut faire. Les performances impressionnant pour un processeur quadricœur, tant et si bien que les processeurs 6 pouces d'Intel comme d'AMD sont battus. Le Ryzen 7 4800U puissant à huit cœurs est toujours en avance dans de nombreux tests multicœur pour ce segment d'enveloppe thermique, mais le vrai point fort est la puissance monocœur, grâce aux fréquences élevées. Le processeur mobile efficient bat même des modèles de bureau haut de gamme comme l'i9-10900K. Cela débouche sur d'excellents résultats dans les tests de logiciels, comme le montre PCMark 10.

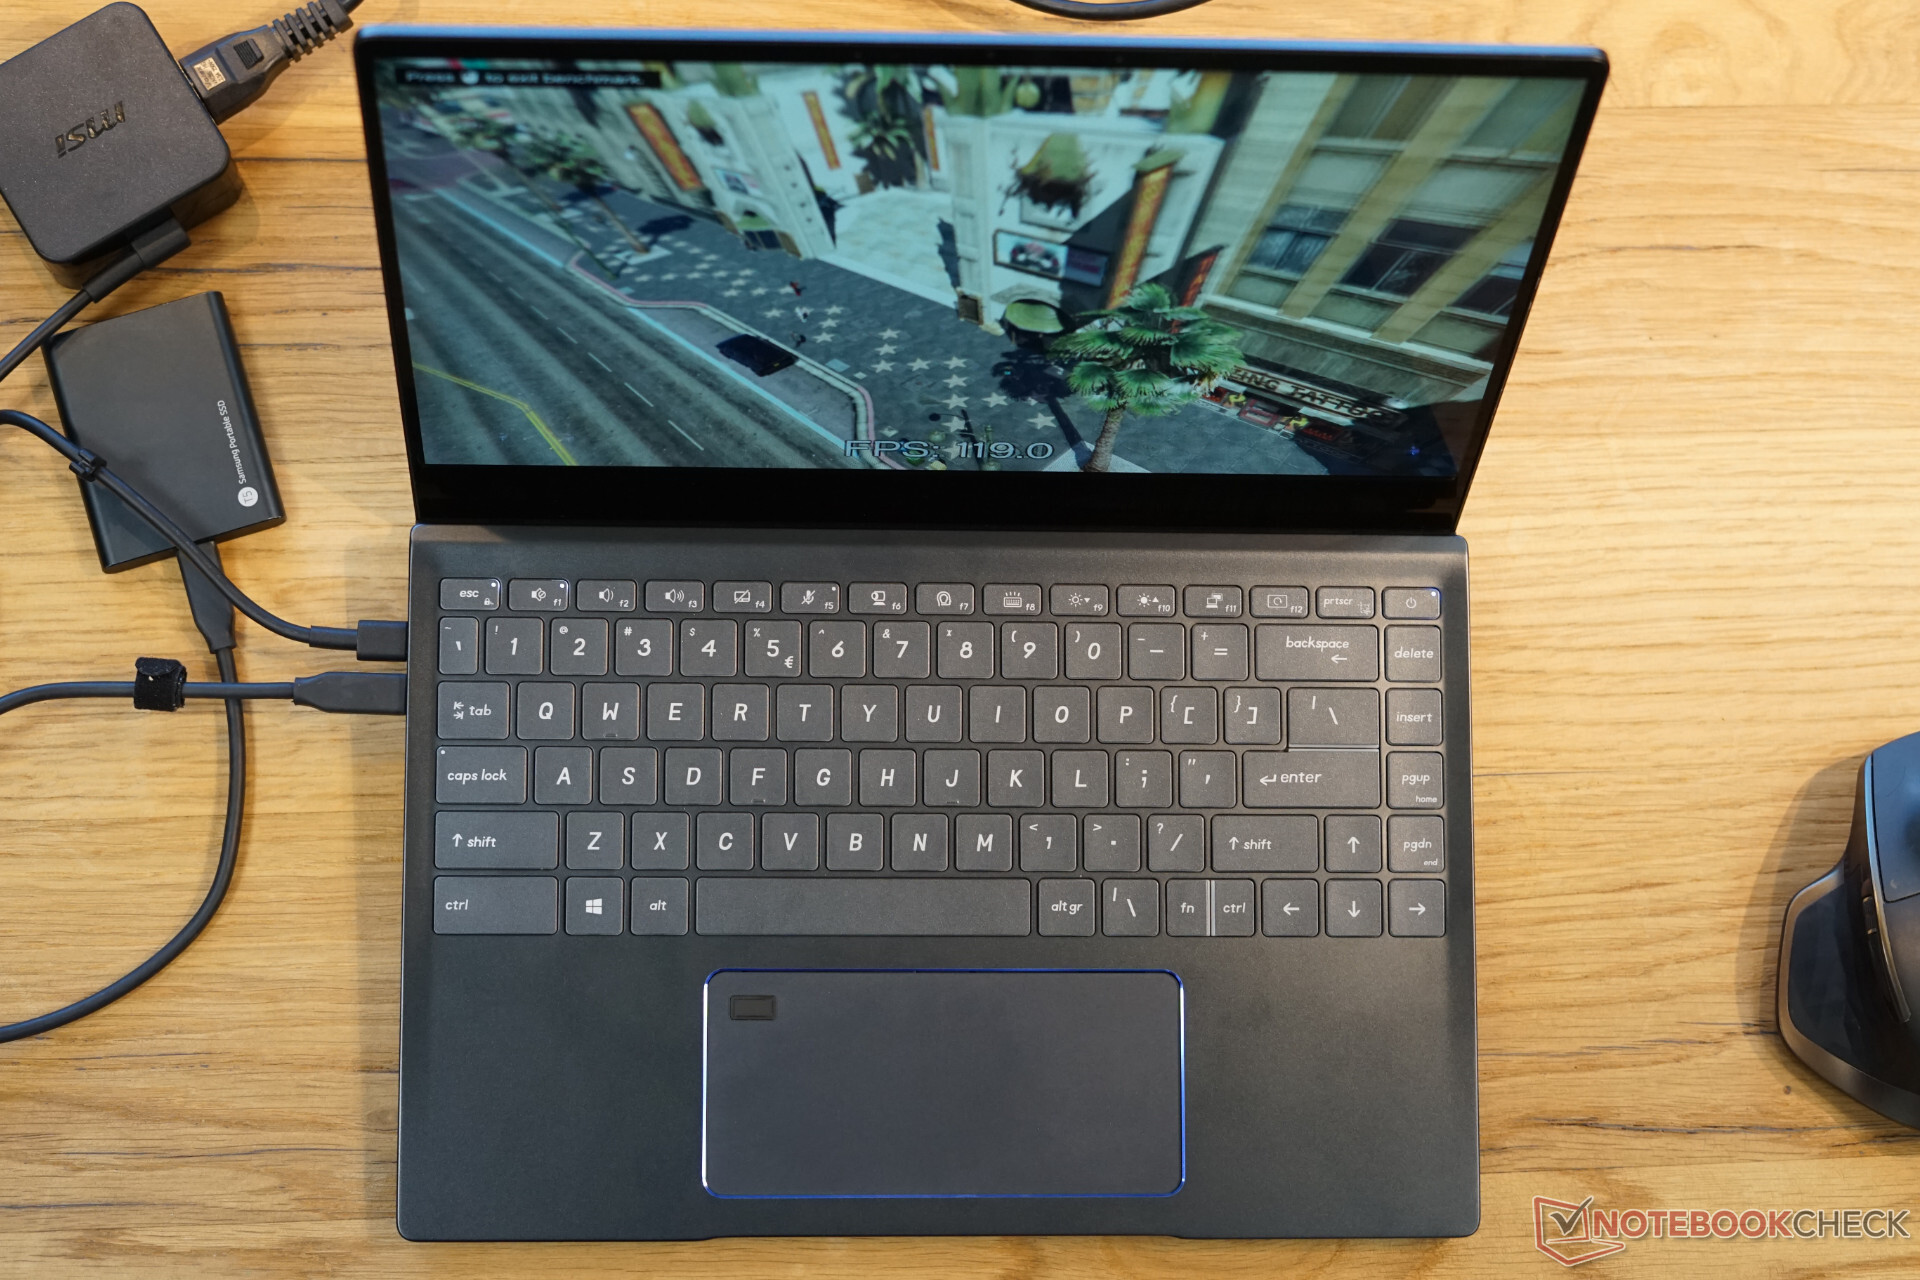
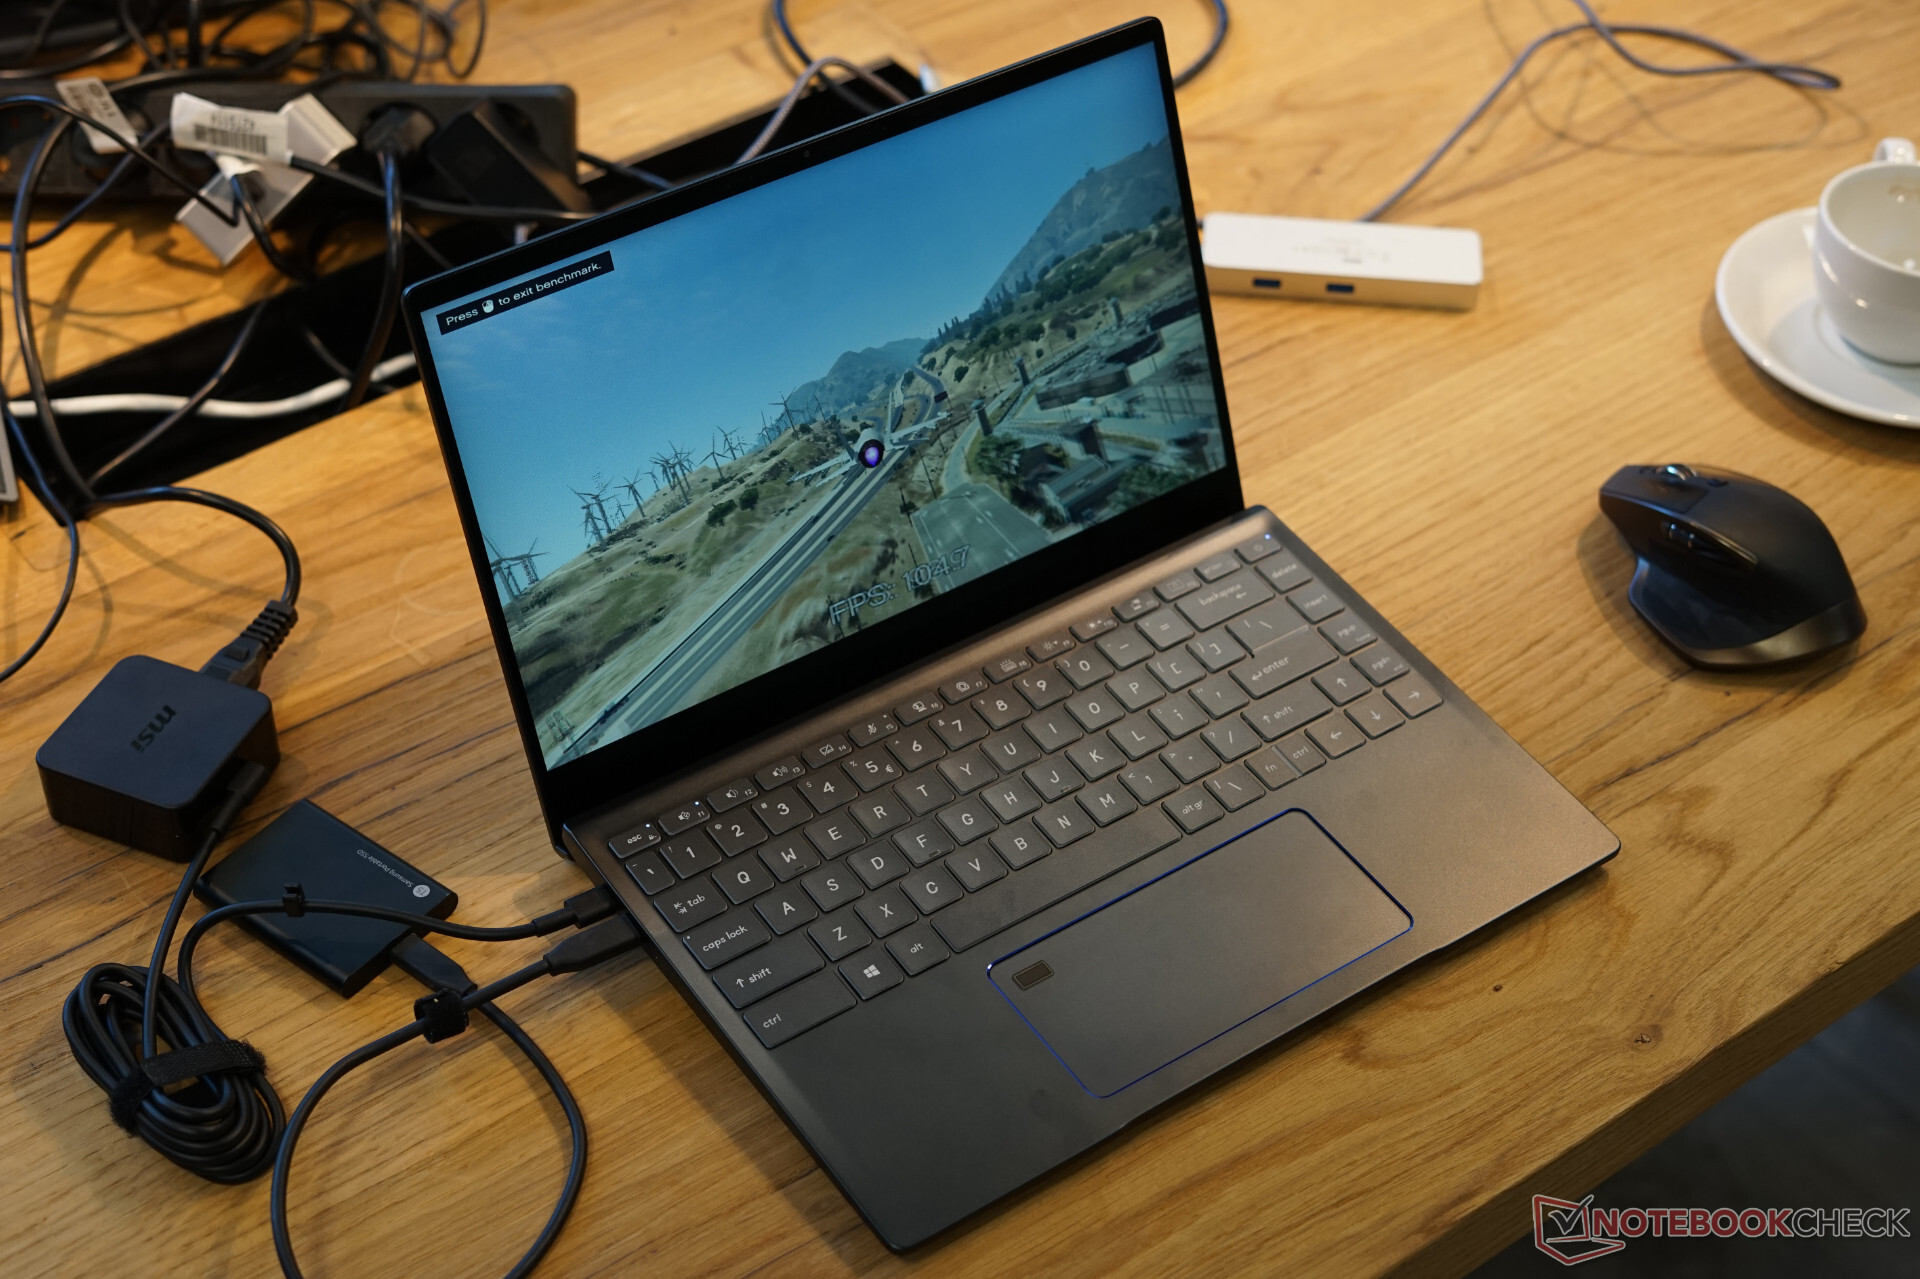
Le GPU intégré Iris Xe est un autre point fort. Intel parvient à battre les GPU dédiés d'entrée de gamme comme les GeForce MX300 ou MX350 dans les tests, mais il faut attendre pour voir ses résultats dans la réalité, avec des jeux. Mais nos premiers tests sont dans tous les cas prometteurs.

Les performances de Tiger Lake restent correctes en 15 W, si bien que nous espérons trouver également des modèles 6 W puissants. Mais la désignation du modèle ne suffit pas à assurer le niveau de performances, le véritable comportement du processeur dépendant de la configuration d'enveloppe thermique et des performances de refroidissement.

L’intégralité de cette critique est disponible en anglais en suivant ce lien.

Please share our article, every link counts!
> Revues et rapports de ordinateurs portatifs et smartphones, ordiphones > Critiques > Test de l'Intel Core i7-1185G7 : première évaluation Tiger Lake
Klaus Hinum, 2020-10- 1 (Update: 2020-10- 1)