Critiques du Intel Core i7-1185G7 processeur
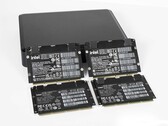
Test du boîtier Intel NUC Pro : un barebone modulaire pour de nombreux usages
L'élément de châssis NUC pro est avant tout un boîtier vide qui ne prend vie qu'avec un élément de calcul. Nous avons examiné de plus près l'appareil et analysé les performances de quatre éléments de calcul différents. Ceux-ci reposent sur les derniers processeurs Alder Lake-U d'Intel dans leur dernière version.
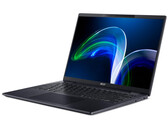
Intel Core i7-1185G7, Iris Xe G7 96EUsTest de l'Acer TravelMate P6 TMP614P-52 : PC portable de bureau léger avec une excellente autonomie
Le TravelMate offre un processeur Core i7 (Tiger Lake), 16 Go de RAM et une excellente autonomie. Acer a pris la bonne décision d'utiliser un écran de 14 pouces avec un rapport d'aspect 16:10 (1 920 x 1 200 pixels) adapté au travail et d'offrir une garantie de trois ans sur l'appareil en Allemagne (deux ans aux États-Unis).
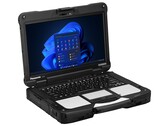
Intel Core i7-1185G7, Iris Xe G7 96EUs, 14", 1.2 kgTest du Panasonic Toughbook 40 : hautement adaptable et modulaire
Ce modèle peut prendre en charge jusqu'à quatre cartes d'extension individuelles afin de répondre aux diverses exigences des agents de police, des entreprises de services publics et d'autres conditions de travail du secteur public. Panasonic mise sur la polyvalence pour mieux distinguer la série Toughbook des autres.
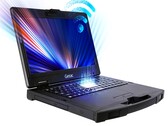
Intel Core i7-1185G7, Iris Xe G7 96EUs, 14", 3.9 kgTest de l'ordinateur portable Getac S410 Gen 4 : Des changements simples et des améliorations considérables
La série Tiger Lake-U d'Intel a fait des merveilles pour les ordinateurs portables grand public et il est donc formidable de voir enfin les mêmes options disponibles sur les modèles robustes conçus pour les entreprises ou les industries.
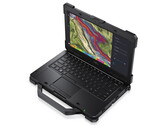
Intel Core i7-1185G7, Iris Xe G7 96EUs, 14", 3.2 kgTest du Dell Latitude 7330 Rugged Extreme : un des meilleurs PC portables robustes de 13 pouces
Il est certes lourd, mais tout a été si bien fait que le poids peut être négligé. L'écran lui-même est meilleur que sur la plupart des autres ordinateurs portables robustes en termes de couleurs, de contraste et de luminosité.
Intel Core i7-1185G7, Iris Xe G7 96EUs, 13.3", 2.7 kgMicrosoft Surface Pro 8, i7-1185G7: Intel Iris Xe Graphics G7 96EUs, 13.00", 0.9 kg
Critique » Test de la Microsoft Surface Pro 8 : convertible puissant, 120 Hz et enfin Thunderbolt
Dell Latitude 15 9520 2-in-1: Intel Iris Xe Graphics G7 96EUs, 15.00", 1.7 kg
Critique » Dell Latitude 15 9520 2-en-1 face au 9510 2-en-1 : le plus récent n'est pas toujours le meilleur
Panasonic Toughbook FZ-55 MK2: Intel Iris Xe Graphics G7 96EUs, 14.00", 2.3 kg
Critique » Test du Panasonic Toughbook FZ-55 MK2 : l'Iris Xe fait toute la différence
HP EliteBook 840 Aero G8 3E4Q6AA: Intel Iris Xe Graphics G7 96EUs, 14.00", 1.2 kg
Critique » Test du HP EliteBook 840 Aero G8 : le PC portable Intel EVO le plus silencieux jamais vu
MSI Summit E14 A11SCS: NVIDIA GeForce GTX 1650 Ti Max-Q, 14.00", 1.3 kg
Critique » Test du MSI Summit E14 : GeForce GTX sans le poids de la GeForce GTX
Dell Latitude 9420 2-in-1: Intel Iris Xe Graphics G7 96EUs, 14.00", 1.5 kg
Critique » Test du Dell Latitude 9420 2-en-1 : un convertible largement meilleur que le Latitude 9410
HP Elite Dragonfly Max: Intel Iris Xe Graphics G7 96EUs, 13.30", 1.2 kg
Critique » Test du HP EliteBook Dragonfly Max Convertible : La vue sûre sonne mieux qu'elle n'en a l'air
Lenovo ThinkPad P14s Gen2-20VX000GGE: NVIDIA T500 Laptop GPU, 14.00", 1.5 kg
Critique » Test du Lenovo ThinkPad P14s Gen 2 : station de travail compacte avec une nouvelle carte graphique
Dell XPS 13 9310 OLED: Intel Iris Xe Graphics G7 96EUs, 13.40", 1.2 kg
Critique » Test du Dell XPS 13 9310 OLED : est-il meilleur que l'IPS ?
Microsoft Surface Laptop 4 13 i7: Intel Iris Xe Graphics G7 96EUs, 13.50", 1.3 kg
Critique » Test du Microsoft Surface Laptop 4 13 : Trop cher avec un processeur Intel ?
MSI Summit E13 Flip Evo A11MT: Intel Iris Xe Graphics G7 96EUs, 13.40", 1.4 kg
Critique » Test du MSI Summit E13 Flip Evo : un convertible au design intemporel
MSI Stealth 15M A11SEK: NVIDIA GeForce RTX 2060 Max-Q, 15.60", 1.7 kg
Critique » Test du MSI Stealth 15M GeForce RTX : une puissance graphique supérieure à celle des Dell XPS 15, HP Spectre x360 ou Asus ZenBook
Lenovo Yoga 9 14 ITL 4K: Intel Iris Xe Graphics G7 96EUs, 14.00", 1.5 kg
Critique » Test du Lenovo Yoga 9i 14 4K : 2-en-1 de 14 pouces hautes performances avec écran tactile 4K et Intel Core i7-1185G7
MSI Summit E15 A11SCST: NVIDIA GeForce GTX 1650 Ti Max-Q, 15.60", 1.8 kg
Critique » Test du MSI Summit E15 : des avancées dans le premium mobile
MSI Prestige 14 Evo A11M-005: Intel Iris Xe Graphics G7 96EUs, 14.00", 1.2 kg
Critique » Test du MSI Prestige 14 Evo : Intel rattrape son retard
Dell XPS 13 9310 Core i7 4K: Intel Iris Xe Graphics G7 96EUs, 13.40", 1.3 kg
Critique » Test du Dell XPS 13 9310 4K : le Core i7-1165G7 face au Core i7-1185G7
Intel Reference Design Laptop 28W: Intel Iris Xe Graphics G7 96EUs, 14.00"
Critique » Test de l'Intel Core i7-1185G7 : première évaluation Tiger Lake
Panasonic Toughbook 40: Intel Iris Xe Graphics G7 96EUs, 14.00", 3.9 kg
Autres tests » Panasonic Toughbook 40
Acer TravelMate P6 TMP614P-52-724G: Intel Iris Xe Graphics G7 96EUs, 14.00", 1.2 kg
Autres tests » Acer TravelMate P6 TMP614P-52-724G
Dell Latitude 7330 Rugged Extreme: Intel Iris Xe Graphics G7 96EUs, 13.30", 2.7 kg
Autres tests » Dell Latitude 7330 Rugged Extreme
Dell Latitude 14 5430 Rugged, i7-1185G7: Intel Iris Xe Graphics G7 96EUs, 14.00", 2 kg
Autres tests » Dell Latitude 14 5430 Rugged, i7-1185G7
Dell Latitude 15 9520 2-in-1: Intel Iris Xe Graphics G7 96EUs, 15.00", 1.7 kg
Autres tests » Dell Latitude 15 9520 2-in-1
Dell Latitude 15 5520, i7-1185G7: Intel Iris Xe Graphics G7 96EUs, 15.60", 1.6 kg
Autres tests » Dell Latitude 15 5520, i7-1185G7
Dell XPS 13 9310 Core i7 4K: Intel Iris Xe Graphics G7 96EUs, 13.40", 1.3 kg
Autres tests » Dell XPS 13 9310 Core i7 4K
Microsoft Surface Pro 8, i7-1185G7: Intel Iris Xe Graphics G7 96EUs, 13.00", 0.9 kg
Autres tests » Microsoft Surface Pro 8, i7-1185G7
Dell Latitude 15 9520-NMM8M: Intel Iris Xe Graphics G7 96EUs, 15.60", 1.4 kg
Autres tests » Dell Latitude 15 9520-NMM8M
Panasonic Toughbook FZ-55 MK2: Intel Iris Xe Graphics G7 96EUs, 14.00", 2.3 kg
Autres tests » Panasonic Toughbook FZ-55 MK2
MSI Summit E14 A11SCST-069NE: NVIDIA GeForce GTX 1650 Ti Mobile, 14.00", 1.3 kg
Autres tests » MSI Summit E14 A11SCST-069NE
Dell Latitude 13 7320 2-in-1, i7-1185G7: Intel Iris Xe Graphics G7 96EUs, 13.30", 1.1 kg
Autres tests » Dell Latitude 13 7320 2-in-1, i7-1185G7
MSI Summit E14 A11SCS: NVIDIA GeForce GTX 1650 Ti Max-Q, 14.00", 1.3 kg
Autres tests » MSI Summit E14 A11SCS
Fujitsu LifeBook U9311X i7 LTE: Intel Iris Xe Graphics G7 96EUs, 13.30", 1 kg
Autres tests » Fujitsu LifeBook U9311X i7 LTE
HP ZBook Firefly 14 G8, i7-1185G7: NVIDIA T500 Laptop GPU, 14.00", 1.4 kg
Autres tests » HP ZBook Firefly 14 G8, i7-1185G7
Microsoft Surface Laptop 4 15, i7-1185G7: Intel Iris Xe Graphics G7 96EUs, 15.00", 1.5 kg
Autres tests » Microsoft Surface Laptop 4 15, i7-1185G7
Dell Latitude 9420 2-in-1: Intel Iris Xe Graphics G7 96EUs, 14.00", 1.5 kg
Autres tests » Dell Latitude 9420 2-in-1
MSI Prestige 14 A11SCS-036DC: NVIDIA GeForce GTX 1650 Ti Max-Q, 14.00", 1.3 kg
Autres tests » MSI Prestige 14 A11SCS-036DC
Lenovo ThinkPad X1 Yoga G6-20XY002VUS: Intel Iris Xe Graphics G7 96EUs, 14.00", 1.4 kg
Autres tests » Lenovo ThinkPad X1 Yoga G6-20XY002VUS
HP EliteBook 840 Aero G8 3E4Q6AA: Intel Iris Xe Graphics G7 96EUs, 14.00", 1.2 kg
Autres tests » HP EliteBook 840 G8 3E4Q6AA
MSI Summit E15 A11SCS-091AU: NVIDIA GeForce GTX 1650 Ti Max-Q, 15.60", 1.7 kg
Autres tests » MSI Summit E15 A11SCS-091AU
Asus ExpertBook B9 B9400CEA-KC0266R: Intel Iris Xe Graphics G7 96EUs, 14.00", 1 kg
Autres tests » Asus ExpertBook B9 B9400CEA-KC0266R
Lenovo ThinkPad X1 Carbon G9 FHD, i7-1185G7: Intel Iris Xe Graphics G7 96EUs, 15.60", 1.1 kg
Autres tests » Lenovo ThinkPad X1 Carbon G9 FHD, i7-1185G7
MSI Prestige 14 Evo A11M-266RU: Intel Iris Xe Graphics G7 96EUs, 14.00", 1.3 kg
Autres tests » MSI Prestige 14 Evo A11M-266RU
MSI Stealth 15M A11SEK-055XES: NVIDIA GeForce RTX 2060 Mobile, 15.60", 1.7 kg
Autres tests » MSI Stealth 15M A11SEK-055XES
HP ZBook Firefly 15 G8-313P1EA: NVIDIA T500 Laptop GPU, 15.60", 1.8 kg
Autres tests » HP ZBook Firefly 15 G8-313P1EA
Dell Latitude 14 7420, i7-1185G7: Intel Iris Xe Graphics G7 96EUs, 14.00", 1.2 kg
Autres tests » Dell Latitude 14 7420, i7-1185G7
Dell XPS 13 9310 OLED: Intel Iris Xe Graphics G7 96EUs, 13.40", 1.2 kg
Autres tests » Dell XPS 13 9310 OLED
MSI Summit E13 Flip Evo A11MT: Intel Iris Xe Graphics G7 96EUs, 13.40", 1.4 kg
Autres tests » MSI Summit E13 Flip Evo A11MT
Dell Latitude 13 7320, i7-1185G7: Intel Iris Xe Graphics G7 96EUs, 13.30", 1.3 kg
Autres tests » Dell Latitude 13 7320, i7-1185G7
Lenovo ThinkPad P14s Gen2-20VX000GGE: NVIDIA T500 Laptop GPU, 14.00", 1.5 kg
Autres tests » Lenovo ThinkPad P14s Gen2-20VX000GGE
HP Elite Dragonfly Max: Intel Iris Xe Graphics G7 96EUs, 13.30", 1.2 kg
Autres tests » HP Elite Dragonfly Max
Microsoft Surface Laptop 4 13 i7: Intel Iris Xe Graphics G7 96EUs, 13.50", 1.3 kg
Autres tests » Microsoft Surface Laptop 4 13 i7
MSI Prestige 15 A11SCS-033XES: NVIDIA GeForce GTX 1650 Ti Max-Q, 15.60", 1.7 kg
Autres tests » MSI Prestige 15 A11SCS-033XES
HP EliteBook 840 Aero G8, i7-1185G7: Intel Iris Xe Graphics G7 96EUs, 14.00", 1.2 kg
Autres tests » HP EliteBook 840 Aero G8, i7-1185G
Lenovo Yoga 9i 14ITL5-82BG004GGE: Intel Iris Xe Graphics G7 96EUs, 14.00", 1.4 kg
Autres tests » Lenovo Yoga 9i 14ITL5-82BG004GGE
MSI Summit E15 A11SCST-067RU: NVIDIA GeForce GTX 1650 Ti Max-Q, 15.60", 1.8 kg
Autres tests » MSI Summit E15 A11SCST-067RU
MSI Summit E15 A11SCST-227ID: NVIDIA GeForce GTX 1650 Ti Max-Q, 15.60"
Autres tests » MSI Summit E15 A11SCST-227ID
MSI Prestige 15 A11SCX-019XES: NVIDIA GeForce GTX 1650 Max-Q, 15.60", 1.7 kg
Autres tests » MSI Prestige 15 A11SCX-019XES
MSI Prestige 14 Evo A11M-014IT: Intel Iris Xe Graphics G7 96EUs, 14.00", 1.3 kg
Autres tests » MSI Prestige 14 Evo A11M-014IT
MSI Summit E15 A11SCST: NVIDIA GeForce GTX 1650 Ti Max-Q, 15.60", 1.8 kg
Autres tests » MSI Summit E15 A11SCST
Lenovo Yoga 9 14 ITL 4K: Intel Iris Xe Graphics G7 96EUs, 14.00", 1.5 kg
Autres tests » Lenovo Yoga 9 14 ITL 4K
MSI Stealth 15M A11SDK-085: NVIDIA GeForce GTX 1660 Ti Max-Q, 15.60"
Autres tests » MSI Stealth 15M A11SDK-085
MSI Stealth 15M A11SDK-032RU: NVIDIA GeForce GTX 1660 Ti Max-Q, 15.60"
Autres tests » MSI Stealth 15M A11SDK-032RU
MSI Prestige 14 Evo A11M-005: Intel Iris Xe Graphics G7 96EUs, 14.00", 1.2 kg
Autres tests » MSI Prestige 14 Evo A11M-005
Lenovo Yoga 9 14ITL5, i7-1185G7: Intel Iris Xe Graphics G7 96EUs, 14.00", 1.4 kg
Autres tests » Lenovo Yoga 9 14ITL5, i7-1185G7
HP EliteBook 840 Aero G8 3E4Q6AA: Intel Iris Xe Graphics G7 96EUs, 14.00", 1.2 kg
» Le HP EliteBook 840 G8 présente un avantage considérable par rapport à la plupart des autres ordinateurs portables professionnels, mais il a un coût
HP Elite Dragonfly Max: Intel Iris Xe Graphics G7 96EUs, 13.30", 1.2 kg
» Nous ne sommes pas si sûrs du HP Sure View
Dell XPS 13 9310 OLED: Intel Iris Xe Graphics G7 96EUs, 13.40", 1.2 kg
» Toutes les caractéristiques positives (et négatives) de l'écran Dell XPS 13 9310 OLED par rapport à l'écran IPS
MSI Summit E13 Flip Evo A11MT: Intel Iris Xe Graphics G7 96EUs, 13.40", 1.4 kg
» MSI Summit E13 Flip vs. XPS 13 2-en-1 : Dell en a pour son argent !
MSI Stealth 15M A11SEK: NVIDIA GeForce RTX 2060 Max-Q, 15.60", 1.7 kg
» Le MSI Stealth 15M est la preuve que les ordinateurs portables de jeu de 15 à 25 W Tiger Lake Core U CPUs can work
MSI Summit E15 A11SCST: NVIDIA GeForce GTX 1650 Ti Max-Q, 15.60", 1.8 kg
» Sommet MSI E15 - Un challenger pour le Dell XPS 15 et le Lenovo ThinkPad X1 Extreme
MSI Prestige 14 Evo A11M-005: Intel Iris Xe Graphics G7 96EUs, 14.00", 1.2 kg
» MSI Prestige 14 Evo : Intel contre AMD