Test du Lenovo Yoga Slim 7 14 (Ryzen 7 4800U, Vega 8, FHD) : le Ryzen 7 4800U est un monstre
Note | Date | Modèle | Poids | Épaisseur | Taille | Résolution | Prix |
|---|---|---|---|---|---|---|---|
| 85.3 % v7 (old) | 09/20 | Lenovo Yoga Slim 7-14ARE R7 4800U, Vega 8 | 1.4 kg | 14.9 mm | 14.00" | 1920x1080 | |
| 81.2 % v7 (old) | 02/20 | Asus ZenBook 14 UM431DA-AM020T R7 3700U, Vega 10 | 1.4 kg | 16 mm | 14.00" | 1920x1080 | |
| 85 % v6 (old) | 09/19 | Lenovo IdeaPad S940-14IWL i7-8565U, UHD Graphics 620 | 1.2 kg | 12 mm | 14.00" | 3840x2160 | |
| 86.3 % v7 (old) | 10/19 | Dell XPS 13 7390 2-in-1 Core i7 i7-1065G7, Iris Plus Graphics G7 (Ice Lake 64 EU) | 1.3 kg | 13 mm | 13.40" | 1920x1200 | |
| 84.3 % v7 (old) | 03/20 | Lenovo Yoga C740-14IML i5-10210U, UHD Graphics 620 | 1.4 kg | 16.9 mm | 14.00" | 1920x1080 |
| SD Card Reader | |
| average JPG Copy Test (av. of 3 runs) | |
| HP Spectre x360 13-aw0013dx (Toshiba Exceria Pro M501 microSDXC 64GB) | |
| Dell XPS 13 7390 2-in-1 Core i7 (Toshiba Exceria Pro M501 64 GB UHS-II) | |
| Lenovo Yoga Slim 7-14ARE (Toshiba Exceria Pro M501 64 GB UHS-II) | |
| MSI Modern 14 A10RB-459US (Toshiba Exceria Pro SDXC 64 GB UHS-II) | |
| Asus ZenBook 14 UM431DA-AM020T (Toshiba Exceria Pro SDXC 64 GB UHS-II) | |
| maximum AS SSD Seq Read Test (1GB) | |
| Dell XPS 13 7390 2-in-1 Core i7 (Toshiba Exceria Pro M501 64 GB UHS-II) | |
| HP Spectre x360 13-aw0013dx (Toshiba Exceria Pro M501 microSDXC 64GB) | |
| Lenovo Yoga Slim 7-14ARE (Toshiba Exceria Pro M501 64 GB UHS-II) | |
| Asus ZenBook 14 UM431DA-AM020T (Toshiba Exceria Pro SDXC 64 GB UHS-II) | |
| MSI Modern 14 A10RB-459US (Toshiba Exceria Pro SDXC 64 GB UHS-II) | |
| Networking | |
| iperf3 transmit AX12 | |
| Lenovo ThinkPad T490 20RY0002US | |
| Lenovo Yoga Slim 7-14ARE | |
| Lenovo Yoga C740-14IML | |
| Alienware m17 R2 P41E | |
| iperf3 receive AX12 | |
| Lenovo ThinkPad T490 20RY0002US | |
| Lenovo Yoga Slim 7-14ARE | |
| Lenovo Yoga C740-14IML | |
| Alienware m17 R2 P41E | |

| |||||||||||||||||||||||||
Homogénéité de la luminosité: 89 %
Valeur mesurée au centre, sur batterie: 399.6 cd/m²
Contraste: 1080:1 (Valeurs des noirs: 0.37 cd/m²)
ΔE ColorChecker Calman: 3.2 | ∀{0.5-29.43 Ø4.73}
calibrated: 1.73
ΔE Greyscale Calman: 4.7 | ∀{0.09-98 Ø4.97}
99.5% sRGB (Argyll 1.6.3 3D)
66.3% AdobeRGB 1998 (Argyll 1.6.3 3D)
72.9% AdobeRGB 1998 (Argyll 3D)
99.3% sRGB (Argyll 3D)
71.7% Display P3 (Argyll 3D)
Gamma: 2.21
CCT: 7184 K
| Lenovo Yoga Slim 7-14ARE AU Optronics B140HAN06.8, IPS, 14", 1920x1080 | Asus ZenBook 14 UM431DA-AM020T CEC PA LM140LF-3L03, IPS, 14", 1920x1080 | Lenovo IdeaPad S940-14IWL B140ZAN01.3, IPS, 14", 3840x2160 | Dell XPS 13 7390 2-in-1 Core i7 Sharp LQ134N1, IPS, 13.4", 1920x1200 | HP Spectre x360 13-aw0013dx AU Optronics AUO5E2D, IPS, 13.3", 1920x1080 | Lenovo Yoga C740-14IML CMN N140HCE-ET2, IPS, 14", 1920x1080 | |
|---|---|---|---|---|---|---|
| Display | -7% | 11% | -2% | -2% | -3% | |
| Display P3 Coverage (%) | 71.7 | 66.7 -7% | 87.5 22% | 69.9 -3% | 69.6 -3% | 67.9 -5% |
| sRGB Coverage (%) | 99.3 | 92.3 -7% | 99.7 0% | 99.2 0% | 98.9 0% | 98.3 -1% |
| AdobeRGB 1998 Coverage (%) | 72.9 | 67.5 -7% | 81.1 11% | 71.5 -2% | 71.5 -2% | 70.1 -4% |
| Response Times | 17% | -17% | -2% | -29% | -1% | |
| Response Time Grey 50% / Grey 80% * (ms) | 45.6 ? | 36 ? 21% | 57.2 ? -25% | 47.6 ? -4% | 60.8 ? -33% | 35.6 ? 22% |
| Response Time Black / White * (ms) | 29.6 ? | 26 ? 12% | 32 ? -8% | 29.2 ? 1% | 36.8 ? -24% | 36.8 ? -24% |
| PWM Frequency (Hz) | 44 ? | 2500 ? | 27030 ? | |||
| Screen | -39% | -7% | 22% | -2% | -5% | |
| Brightness middle (cd/m²) | 399.6 | 253 -37% | 594.5 49% | 549.8 38% | 447.4 12% | 329.9 -17% |
| Brightness (cd/m²) | 385 | 245 -36% | 536 39% | 520 35% | 420 9% | 315 -18% |
| Brightness Distribution (%) | 89 | 78 -12% | 83 -7% | 86 -3% | 85 -4% | 90 1% |
| Black Level * (cd/m²) | 0.37 | 0.225 39% | 0.43 -16% | 0.39 -5% | 0.31 16% | 0.29 22% |
| Contrast (:1) | 1080 | 1124 4% | 1383 28% | 1410 31% | 1443 34% | 1138 5% |
| Colorchecker dE 2000 * | 3.2 | 8.89 -178% | 4.87 -52% | 2.12 34% | 4.23 -32% | 3.68 -15% |
| Colorchecker dE 2000 max. * | 6.44 | 4.56 29% | 7.9 -23% | 3.66 43% | 9.34 -45% | 8.64 -34% |
| Colorchecker dE 2000 calibrated * | 1.73 | 4.9 -183% | 2.83 -64% | 1.37 21% | 1.32 24% | 1.03 40% |
| Greyscale dE 2000 * | 4.7 | 6.33 -35% | 6.7 -43% | 2.6 45% | 6.1 -30% | 6.4 -36% |
| Gamma | 2.21 100% | 2.52 87% | 2.091 105% | 2.3 96% | 2.11 104% | 2.17 101% |
| CCT | 7184 90% | 6745 96% | 6891 94% | 6884 94% | 6136 106% | 6195 105% |
| Color Space (Percent of AdobeRGB 1998) (%) | 66.3 | 60 -10% | 72 9% | 65.4 -1% | 64.8 -2% | 63.6 -4% |
| Color Space (Percent of sRGB) (%) | 99.5 | 91 -9% | 100 1% | 99.7 0% | 98.9 -1% | 98.4 -1% |
| Moyenne finale (programmes/paramètres) | -10% /
-26% | -4% /
-5% | 6% /
14% | -11% /
-5% | -3% /
-4% |
* ... Moindre est la valeur, meilleures sont les performances
Temps de réponse de l'écran
| ↔ Temps de réponse noir à blanc | ||
|---|---|---|
| 29.6 ms ... hausse ↗ et chute ↘ combinées | ↗ 14.8 ms hausse | 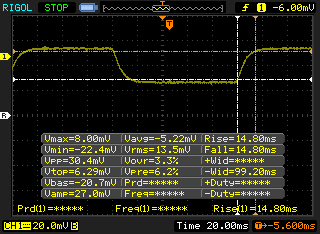 |
| ↘ 14.8 ms chute | ||
| L'écran souffre de latences relativement élevées, insuffisant pour le jeu. En comparaison, tous les appareils testés affichent entre 0.1 (minimum) et 240 (maximum) ms. » 79 % des appareils testés affichent de meilleures performances. Cela signifie que les latences relevées sont moins bonnes que la moyenne (19.9 ms) de tous les appareils testés. | ||
| ↔ Temps de réponse gris 50% à gris 80% | ||
| 45.6 ms ... hausse ↗ et chute ↘ combinées | ↗ 23.6 ms hausse | 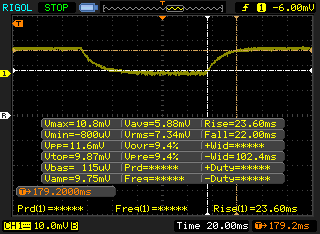 |
| ↘ 22 ms chute | ||
| L'écran souffre de latences très élevées, à éviter pour le jeu. En comparaison, tous les appareils testés affichent entre 0.165 (minimum) et 636 (maximum) ms. » 78 % des appareils testés affichent de meilleures performances. Cela signifie que les latences relevées sont moins bonnes que la moyenne (31.1 ms) de tous les appareils testés. | ||
Scintillement / MLI (Modulation de largeur d'impulsion)
| Scintillement / MLI (Modulation de largeur d'impulsion) non décelé |  | ||
En comparaison, 52 % des appareils testés n'emploient pas MDI pour assombrir leur écran. Nous avons relevé une moyenne à 7791 (minimum : 5 - maximum : 343500) Hz dans le cas où une MDI était active. | |||
| wPrime 2.10 - 1024m | |
| Microsoft Surface Laptop 3 13 Core i5-1035G7 | |
| Dell XPS 13 7390 Core i7-10710U | |
| MSI GE75 9SG | |
| Lenovo Yoga Slim 7-14ARE | |
* ... Moindre est la valeur, meilleures sont les performances
| PCMark 8 Home Score Accelerated v2 | 4657 points | |
| PCMark 8 Work Score Accelerated v2 | 5661 points | |
| PCMark 10 Score | 5383 points | |
Aide | ||
| Lenovo Yoga Slim 7-14ARE Samsung SSD PM981a MZVLB512HBJQ | Asus ZenBook 14 UM431DA-AM020T SK hynix BC501 HFM512GDHTNG-8310A | Lenovo IdeaPad S940-14IWL Samsung SSD PM981 MZVLB512HAJQ | Dell XPS 13 7390 2-in-1 Core i7 Toshiba BG4 KBG40ZPZ512G | Lenovo Yoga C740-14IML Samsung SSD PM981a MZVLB256HBHQ | |
|---|---|---|---|---|---|
| AS SSD | -35% | -5% | -78% | -23% | |
| Seq Read (MB/s) | 1658 | 1417 -15% | 2625 58% | 1801 9% | 1719 4% |
| Seq Write (MB/s) | 2464 | 781 -68% | 1360 -45% | 1125 -54% | 1211 -51% |
| 4K Read (MB/s) | 59.5 | 37.03 -38% | 47.71 -20% | 39.7 -33% | 53.1 -11% |
| 4K Write (MB/s) | 128.6 | 80.1 -38% | 115.5 -10% | 67 -48% | 131.4 2% |
| 4K-64 Read (MB/s) | 1576 | 740 -53% | 1492 -5% | 1253 -20% | 508 -68% |
| 4K-64 Write (MB/s) | 1986 | 748 -62% | 1154 -42% | 209 -89% | 883 -56% |
| Access Time Read * (ms) | 0.049 | 0.047 4% | 0.045 8% | 0.069 -41% | 0.05 -2% |
| Access Time Write * (ms) | 0.087 | 0.045 48% | 0.032 63% | 0.625 -618% | 0.085 2% |
| Score Read (Points) | 1802 | 918 -49% | 1802 0% | 1472 -18% | 733 -59% |
| Score Write (Points) | 2361 | 906 -62% | 1406 -40% | 388 -84% | 1135 -52% |
| Score Total (Points) | 5133 | 2270 -56% | 4069 -21% | 2583 -50% | 2235 -56% |
| Copy ISO MB/s (MB/s) | 1588 | 1293 -19% | 1636 3% | ||
| Copy Program MB/s (MB/s) | 550 | 560 2% | 698 27% | ||
| Copy Game MB/s (MB/s) | 1329 | 927 -30% | 1246 -6% | ||
| CrystalDiskMark 5.2 / 6 | -47% | -23% | -28% | -18% | |
| Write 4K (MB/s) | 146.1 | 118.8 -19% | 105.3 -28% | 106.7 -27% | 125.6 -14% |
| Read 4K (MB/s) | 47.18 | 41.62 -12% | 40.9 -13% | 49.94 6% | 43.46 -8% |
| Write Seq (MB/s) | 2896 | 796 -73% | 1914 -34% | 1223 -58% | 2011 -31% |
| Read Seq (MB/s) | 2754 | 1101 -60% | 2224 -19% | 1801 -35% | 2046 -26% |
| Write 4K Q32T1 (MB/s) | 425.8 | 234.7 -45% | 419.3 -2% | 325.3 -24% | 375.8 -12% |
| Read 4K Q32T1 (MB/s) | 514 | 313.8 -39% | 288.1 -44% | 551 7% | 338.1 -34% |
| Write Seq Q32T1 (MB/s) | 2989 | 842 -72% | 1954 -35% | 1224 -59% | 2346 -22% |
| Read Seq Q32T1 (MB/s) | 3568 | 1645 -54% | 3382 -5% | 2350 -34% | 3562 0% |
| Moyenne finale (programmes/paramètres) | -41% /
-40% | -14% /
-12% | -53% /
-60% | -21% /
-21% |
* ... Moindre est la valeur, meilleures sont les performances

Disk Throttling: DiskSpd Read Loop, Queue Depth 8
| 3DMark 06 Standard Score | 22966 points | |
| 3DMark Vantage P Result | 20018 points | |
| 3DMark 11 Performance | 6301 points | |
| 3DMark Ice Storm Standard Score | 101299 points | |
| 3DMark Cloud Gate Standard Score | 22962 points | |
| 3DMark Fire Strike Score | 3622 points | |
| 3DMark Time Spy Score | 1338 points | |
Aide | ||
| Rocket League | |
| 1280x720 Performance | |
| MSI GT62VR | |
| Lenovo Yoga Slim 7-14ARE | |
| MSI Modern 15 A10RB | |
| Lenovo IdeaPad S540-14API | |
| Dell Inspiron 14 3493-4KWCF | |
| Microsoft Surface Laptop 3 15 i7-1065G7 | |
| 1920x1080 Performance | |
| MSI GT62VR | |
| Lenovo Yoga Slim 7-14ARE | |
| MSI Modern 15 A10RB | |
| Microsoft Surface Laptop 3 15 i7-1065G7 | |
| 1920x1080 Quality AA:Medium FX | |
| MSI GT62VR | |
| MSI Modern 15 A10RB | |
| Lenovo Yoga Slim 7-14ARE | |
| Lenovo IdeaPad S540-14API | |
| Microsoft Surface Laptop 3 15 i7-1065G7 | |
| Dell Inspiron 14 3493-4KWCF | |
| 1920x1080 High Quality AA:High FX | |
| MSI GT62VR | |
| MSI Modern 15 A10RB | |
| Lenovo Yoga Slim 7-14ARE | |
| Microsoft Surface Laptop 3 15 i7-1065G7 | |
| Lenovo IdeaPad S540-14API | |
| Dell Inspiron 14 3493-4KWCF | |
| The Witcher 3 | |
| 1024x768 Low Graphics & Postprocessing | |
| Lenovo Legion Y7000P-1060 | |
| Lenovo Yoga Slim 7-14ARE | |
| MSI Modern 15 A10RB | |
| Lenovo Ideapad S540-15IML | |
| Microsoft Surface Laptop 3 15 i7-1065G7 | |
| Lenovo IdeaPad S540-14API | |
| Lenovo Yoga 530-14ARR-81H9000VGE | |
| 1366x768 Medium Graphics & Postprocessing | |
| Lenovo Legion Y7000P-1060 | |
| MSI Modern 15 A10RB | |
| Microsoft Surface Laptop 3 15 i7-1065G7 | |
| Lenovo Ideapad S540-15IML | |
| Lenovo Yoga 530-14ARR-81H9000VGE | |
| 1920x1080 High Graphics & Postprocessing (Nvidia HairWorks Off) | |
| Lenovo Legion Y7000P-1060 | |
| MSI Modern 15 A10RB | |
| Lenovo Yoga Slim 7-14ARE | |
| Lenovo Ideapad S540-15IML | |
| Microsoft Surface Laptop 3 15 i7-1065G7 | |
| Lenovo IdeaPad S540-14API | |
| Lenovo Yoga 530-14ARR-81H9000VGE | |
| Borderlands 3 | |
| 1280x720 Very Low Overall Quality (DX11) | |
| MSI GT62VR | |
| Lenovo Yoga Slim 7-14ARE | |
| Lenovo Ideapad S540-15IML | |
| Microsoft Surface Laptop 3 15 i7-1065G7 | |
| 1920x1080 Medium Overall Quality (DX11) | |
| MSI GT62VR | |
| Lenovo Yoga Slim 7-14ARE | |
| Lenovo Ideapad S540-15IML | |
| Microsoft Surface Laptop 3 15 i7-1065G7 | |
| Metro Exodus - 1280x720 Low Quality AF:4x | |
| MSI GT62VR | |
| Lenovo Yoga Slim 7-14ARE | |
| Lenovo Ideapad S540-15IML | |
| Lenovo Yoga 530-14ARR-81H9000VGE | |
| Dell Inspiron 14 3493-4KWCF | |
| Asus Zenbook 14 UX433FN-A6023T | |
| Shadow of the Tomb Raider | |
| 1280x720 Lowest Preset | |
| MSI GT62VR | |
| Lenovo Yoga Slim 7-14ARE | |
| MSI Modern 15 A10RB | |
| Microsoft Surface Laptop 3 15 i7-1065G7 | |
| 1920x1080 Medium Preset | |
| MSI GT62VR | |
| Lenovo Yoga Slim 7-14ARE | |
| MSI Modern 15 A10RB | |
| Bas | Moyen | Élevé | Ultra | |
|---|---|---|---|---|
| StarCraft II: Heart of the Swarm (2013) | 274.5 | 46.7 | ||
| BioShock Infinite (2013) | 160.5 | 34.2 | ||
| GTA V (2015) | 101 | 29.8 | 12.1 | |
| The Witcher 3 (2015) | 70.8 | 23.1 | 14.9 | |
| Metal Gear Solid V (2015) | 60 | 40.4 | 29.7 | |
| Dota 2 Reborn (2015) | 97.1 | 82.3 | 56 | 52.5 |
| Ashes of the Singularity (2016) | 19.5 | 16.8 | ||
| Overwatch (2016) | 146 | 59.7 | 30.7 | |
| Rocket League (2017) | 184 | 91.2 | 57.6 | |
| Fortnite (2018) | 79.6 | 46.7 | 30.9 | 17.6 |
| Final Fantasy XV Benchmark (2018) | 37.5 | 18.8 | 12 | |
| X-Plane 11.11 (2018) | 42.7 | 34.5 | 30.5 | |
| Monster Hunter World (2018) | 49.4 | 23.7 | 20.7 | 15.2 |
| F1 2018 (2018) | 68 | 36 | 28 | 19 |
| Strange Brigade (2018) | 79.7 | 32.5 | 27.4 | 23.4 |
| Shadow of the Tomb Raider (2018) | 59 | 21 | 19 | 16 |
| Apex Legends (2019) | 80.8 | 34.7 | 26.6 | 24 |
| Metro Exodus (2019) | 39.3 | 17 | 11.9 | 10 |
| The Division 2 (2019) | 44 | 21 | 17 | 10 |
| Total War: Three Kingdoms (2019) | 66.4 | 20.2 | 13.4 | 9.1 |
| F1 2019 (2019) | 84 | 36 | 32 | 28 |
| Borderlands 3 (2019) | 60.1 | 22.9 | 12.7 | 9 |
| Lenovo Yoga Slim 7-14ARE Vega 8, R7 4800U, Samsung SSD PM981a MZVLB512HBJQ | Asus ZenBook 14 UM431DA-AM020T Vega 10, R7 3700U, SK hynix BC501 HFM512GDHTNG-8310A | Lenovo IdeaPad S940-14IWL UHD Graphics 620, i7-8565U, Samsung SSD PM981 MZVLB512HAJQ | Dell XPS 13 7390 2-in-1 Core i7 Iris Plus Graphics G7 (Ice Lake 64 EU), i7-1065G7, Toshiba BG4 KBG40ZPZ512G | MSI Modern 14 A10RB-459US GeForce MX250, i5-10210U, Kingston RBUSNS8154P3512GJ | Lenovo Yoga C740-14IML UHD Graphics 620, i5-10210U, Samsung SSD PM981a MZVLB256HBHQ | |
|---|---|---|---|---|---|---|
| Noise | -9% | -7% | -10% | -9% | -9% | |
| arrêt / environnement * (dB) | 26.3 | 29.8 -13% | 28.3 -8% | 28.1 -7% | 28.7 -9% | 29 -10% |
| Idle Minimum * (dB) | 26.5 | 28 -6% | 28.3 -7% | 28.1 -6% | 29.5 -11% | 29 -9% |
| Idle Average * (dB) | 26.5 | 28 -6% | 28.3 -7% | 28.1 -6% | 29.5 -11% | 29 -9% |
| Idle Maximum * (dB) | 26.5 | 28 -6% | 31.3 -18% | 28.1 -6% | 29.5 -11% | 29.7 -12% |
| Load Average * (dB) | 31.8 | 36.8 -16% | 34.3 -8% | 31.7 -0% | 33.4 -5% | 32.6 -3% |
| Witcher 3 ultra * (dB) | 35.9 | 43.4 -21% | 37.9 -6% | |||
| Load Maximum * (dB) | 35.9 | 39 -9% | 34.3 4% | 43.4 -21% | 40.5 -13% | 39 -9% |
* ... Moindre est la valeur, meilleures sont les performances
Degré de la nuisance sonore
| Au repos |
| 26.5 / 26.5 / 26.5 dB(A) |
| Fortement sollicité |
| 31.8 / 35.9 dB(A) |
 | ||
30 dB silencieux 40 dB(A) audible 50 dB(A) bruyant |
||
min: | ||
(±) La température maximale du côté supérieur est de 43.8 °C / 111 F, par rapport à la moyenne de 36.8 °C / 98 F, allant de 21 à 71 °C pour la classe Multimedia.
(±) Le fond chauffe jusqu'à un maximum de 43 °C / 109 F, contre une moyenne de 39.1 °C / 102 F
(+) En utilisation inactive, la température moyenne du côté supérieur est de 23.7 °C / 75 F, par rapport à la moyenne du dispositif de 31.3 °C / 88 F.
(±) En jouant à The Witcher 3, la température moyenne du côté supérieur est de 33.1 °C / 92 F, alors que la moyenne de l'appareil est de 31.3 °C / 88 F.
(+) Les repose-poignets et le pavé tactile sont plus froids que la température de la peau avec un maximum de 27.8 °C / 82 F et sont donc froids au toucher.
(±) La température moyenne de la zone de l'appui-paume de dispositifs similaires était de 28.7 °C / 83.7 F (+0.9 °C / #1.7 F).
Lenovo Yoga Slim 7-14ARE analyse audio
(±) | le niveau sonore du haut-parleur est moyen mais bon (81.4# dB)
Basses 100 - 315 Hz
(±) | basse réduite - en moyenne 9.5% inférieure à la médiane
(±) | la linéarité des basses est moyenne (8.1% delta à la fréquence précédente)
Médiums 400 - 2000 Hz
(+) | médiane équilibrée - seulement 4.1% de la médiane
(+) | les médiums sont linéaires (6% delta à la fréquence précédente)
Aiguës 2 - 16 kHz
(+) | des sommets équilibrés - à seulement 4.2% de la médiane
(±) | la linéarité des aigus est moyenne (7.4% delta à la fréquence précédente)
Globalement 100 - 16 000 Hz
(+) | le son global est linéaire (13.9% différence à la médiane)
Par rapport à la même classe
» 31% de tous les appareils testés de cette catégorie étaient meilleurs, 4% similaires, 65% pires
» Le meilleur avait un delta de 5%, la moyenne était de 17%, le pire était de 45%.
Par rapport à tous les appareils testés
» 16% de tous les appareils testés étaient meilleurs, 4% similaires, 80% pires
» Le meilleur avait un delta de 4%, la moyenne était de 24%, le pire était de 134%.
Apple MacBook 12 (Early 2016) 1.1 GHz analyse audio
(+) | les haut-parleurs peuvent jouer relativement fort (83.6# dB)
Basses 100 - 315 Hz
(±) | basse réduite - en moyenne 11.3% inférieure à la médiane
(±) | la linéarité des basses est moyenne (14.2% delta à la fréquence précédente)
Médiums 400 - 2000 Hz
(+) | médiane équilibrée - seulement 2.4% de la médiane
(+) | les médiums sont linéaires (5.5% delta à la fréquence précédente)
Aiguës 2 - 16 kHz
(+) | des sommets équilibrés - à seulement 2% de la médiane
(+) | les aigus sont linéaires (4.5% delta à la fréquence précédente)
Globalement 100 - 16 000 Hz
(+) | le son global est linéaire (10.2% différence à la médiane)
Par rapport à la même classe
» 7% de tous les appareils testés de cette catégorie étaient meilleurs, 2% similaires, 91% pires
» Le meilleur avait un delta de 5%, la moyenne était de 18%, le pire était de 53%.
Par rapport à tous les appareils testés
» 5% de tous les appareils testés étaient meilleurs, 1% similaires, 94% pires
» Le meilleur avait un delta de 4%, la moyenne était de 24%, le pire était de 134%.
| Éteint/en veille | |
| Au repos | |
| Fortement sollicité |
|
Légende:
min: | |
| Lenovo Yoga Slim 7-14ARE R7 4800U, Vega 8, Samsung SSD PM981a MZVLB512HBJQ, IPS, 1920x1080, 14" | Asus ZenBook 14 UM431DA-AM020T R7 3700U, Vega 10, SK hynix BC501 HFM512GDHTNG-8310A, IPS, 1920x1080, 14" | Lenovo IdeaPad S940-14IWL i7-8565U, UHD Graphics 620, Samsung SSD PM981 MZVLB512HAJQ, IPS, 3840x2160, 14" | Dell XPS 13 7390 2-in-1 Core i7 i7-1065G7, Iris Plus Graphics G7 (Ice Lake 64 EU), Toshiba BG4 KBG40ZPZ512G, IPS, 1920x1200, 13.4" | Dell XPS 13 7390 Core i7-10710U i7-10710U, UHD Graphics 620, SK Hynix PC601 NVMe 512 GB, IPS, 3840x2160, 13.3" | MSI Modern 14 A10RB-459US i5-10210U, GeForce MX250, Kingston RBUSNS8154P3512GJ, IPS, 1920x1080, 14" | |
|---|---|---|---|---|---|---|
| Power Consumption | -0% | -25% | 16% | -8% | -8% | |
| Idle Minimum * (Watt) | 4 | 3.6 10% | 5.2 -30% | 2.6 35% | 4.7 -18% | 4.2 -5% |
| Idle Average * (Watt) | 6.3 | 7.2 -14% | 10.2 -62% | 5.3 16% | 8.3 -32% | 5.9 6% |
| Idle Maximum * (Watt) | 7.7 | 10.8 -40% | 11.9 -55% | 7 9% | 9 -17% | 7.2 6% |
| Load Average * (Watt) | 48.3 | 38 21% | 42.1 13% | 43.1 11% | 42 13% | 63.4 -31% |
| Witcher 3 ultra * (Watt) | 49 | 43.1 12% | 53.5 -9% | |||
| Load Maximum * (Watt) | 57.6 | 45.2 22% | 53.6 7% | 49 15% | 49 15% | 67.4 -17% |
* ... Moindre est la valeur, meilleures sont les performances
| Lenovo Yoga Slim 7-14ARE R7 4800U, Vega 8, 61 Wh | Asus ZenBook 14 UM431DA-AM020T R7 3700U, Vega 10, 47 Wh | Lenovo IdeaPad S940-14IWL i7-8565U, UHD Graphics 620, 52 Wh | Dell XPS 13 7390 2-in-1 Core i7 i7-1065G7, Iris Plus Graphics G7 (Ice Lake 64 EU), 51 Wh | MSI Modern 14 A10RB-459US i5-10210U, GeForce MX250, 50 Wh | Lenovo Yoga C740-14IML i5-10210U, UHD Graphics 620, 51 Wh | HP Spectre x360 13-aw0013dx i7-1065G7, Iris Plus Graphics G7 (Ice Lake 64 EU), 60 Wh | |
|---|---|---|---|---|---|---|---|
| Autonomie de la batterie | -2% | -30% | -13% | -6% | -4% | 47% | |
| Reader / Idle (h) | 27.1 | 17.8 -34% | 8.4 -69% | 16.4 -39% | 18.6 -31% | 37.1 37% | |
| WiFi v1.3 (h) | 10.3 | 6.7 -35% | 5 -51% | 9 -13% | 8.6 -17% | 9.2 -11% | 9.9 -4% |
| Load (h) | 1.3 | 2.1 62% | 1.7 31% | 1.8 38% | 1.7 31% | 2.7 108% |
Points positifs
Points négatifs
Verdict — Oubliez Ice Lake et Comet Lake-U
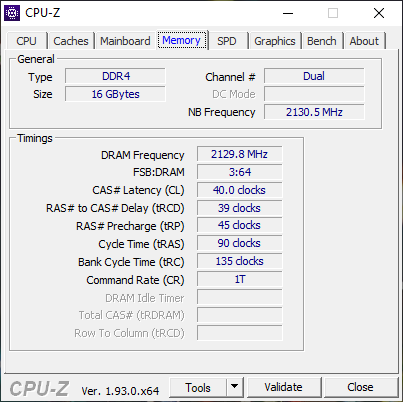
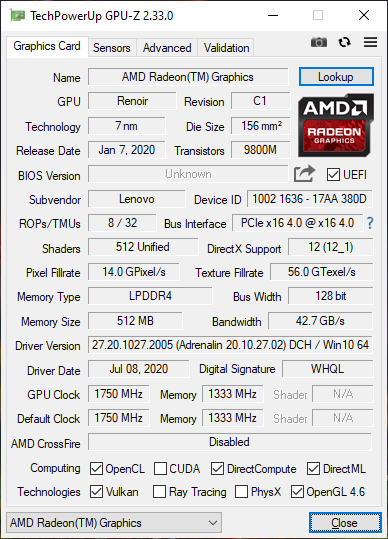
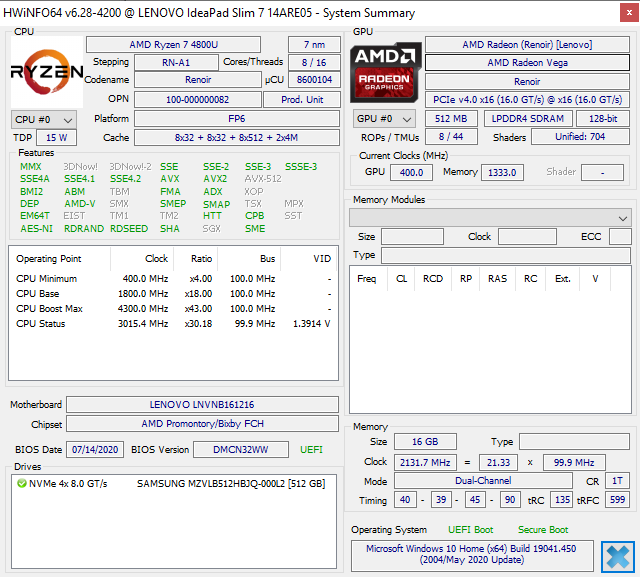
La star du Lenovo Yoga Slim 7 est indubitablement son APU Ryzen 7 4800U. Mis à part dans quelques tests monocœur, il n'y a pas de test ou de jeu dans lesquels le nouveau processeur AMD ne se situe pas bien mieux que ce que peuvent proposer les séries Intel Iris Plus G7 ou Comet Lake U. Et nous ne parlons pas d'une petite avance ! les performances processeur multithread et graphiques peuvent être supérieures de 40 à 50 % supérieures que celles du Core i7-10710U ou du Core i7-1065U, tout en consommant que quelques watts de plus. Les clients ont ici le meilleur des deux mondes Intel - les performances graphiques du 10 nm Ice Lake, et les performances du processeur des Comet Lake U 14 nm - le tout dans un ensemble encore plus puissant et plus efficient en 7 nm et 8 cœurs.
Le challenge pour AMD est maintenant de fournir un niveau de performances stable d'un modèle et d'un constructeur à l'autre. Le Yoga Slim 7 est censé montrer ce que peut faire au mieux le Ryzen 7 4800U, ce qui signifie qu'il pourrait être moins bien exploité dans d'autres portables. Il sera intéressant de voir le type d'écart entre deux portables différents équipés du même APU Ryzen 7 4800U, d'autant que nous avons déjà constaté d'énormes différences entre différentes machines Ice Lake de 10e génération. En bref, nous serions très déçus de voir un PC portable Ryzen 7 4800U être de 40 ou 50 % plus lent que notre Yoga Slim 7, surtout en cas de sollicitations prolongées.
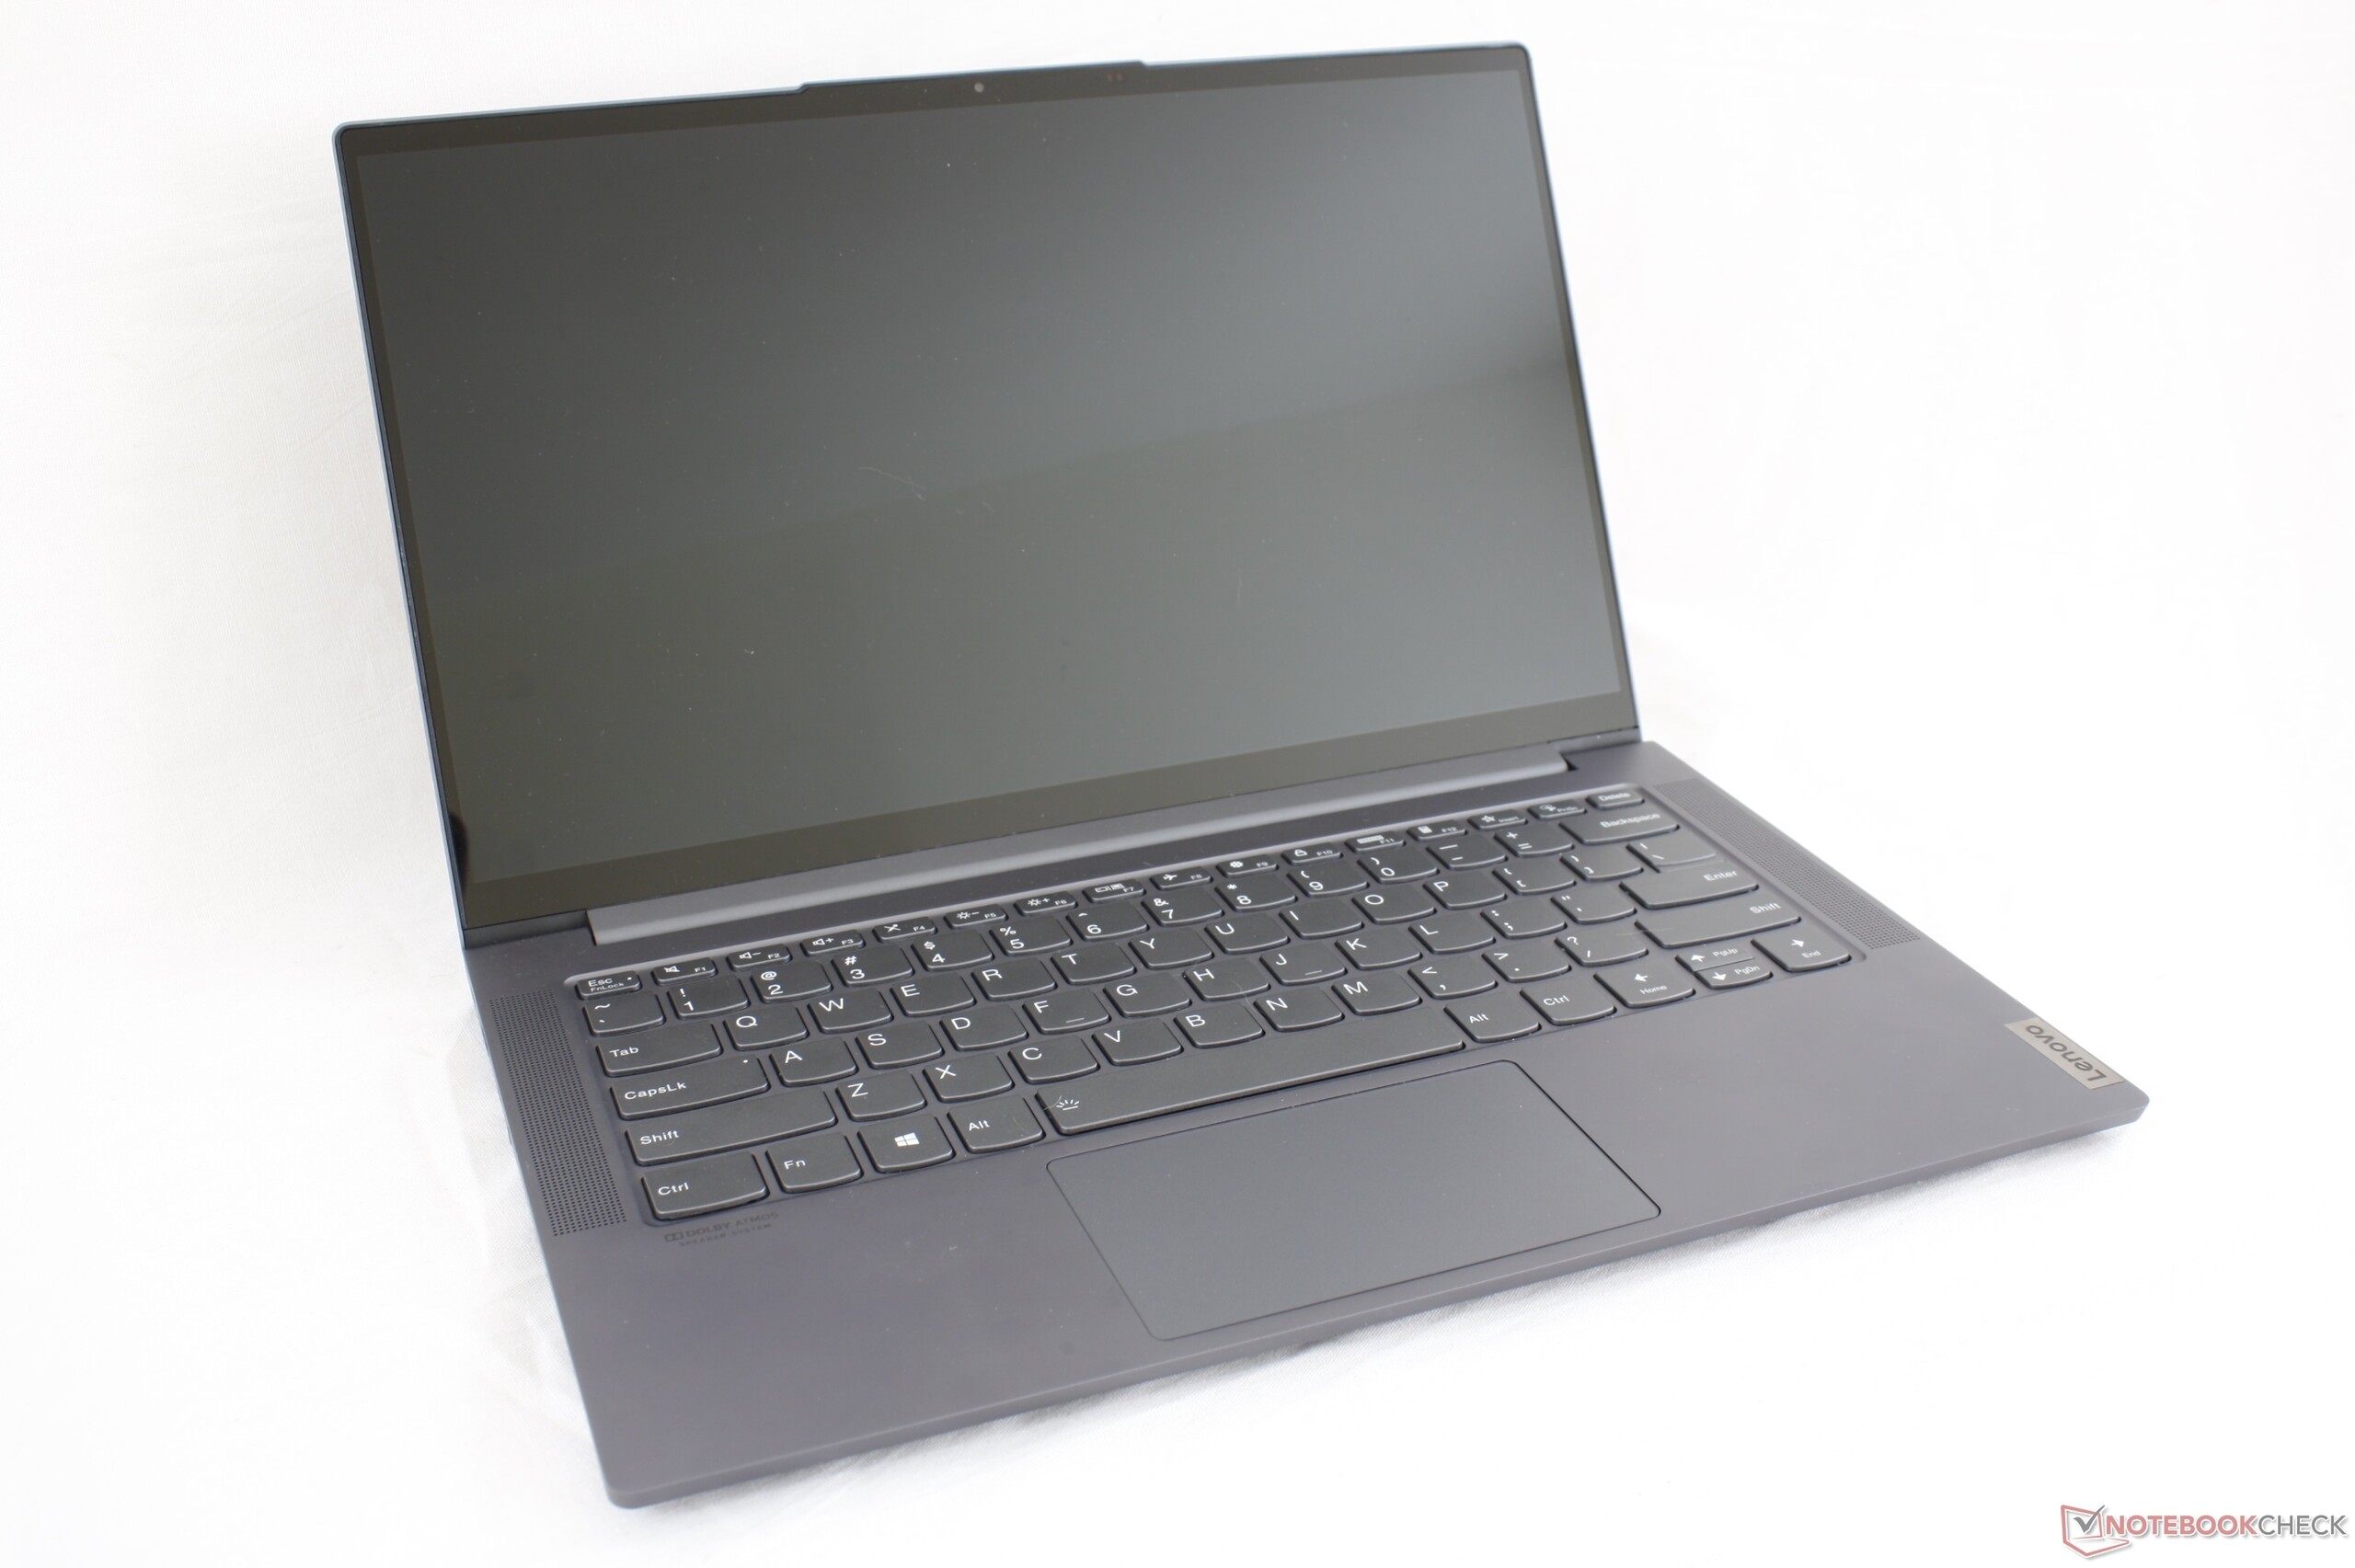
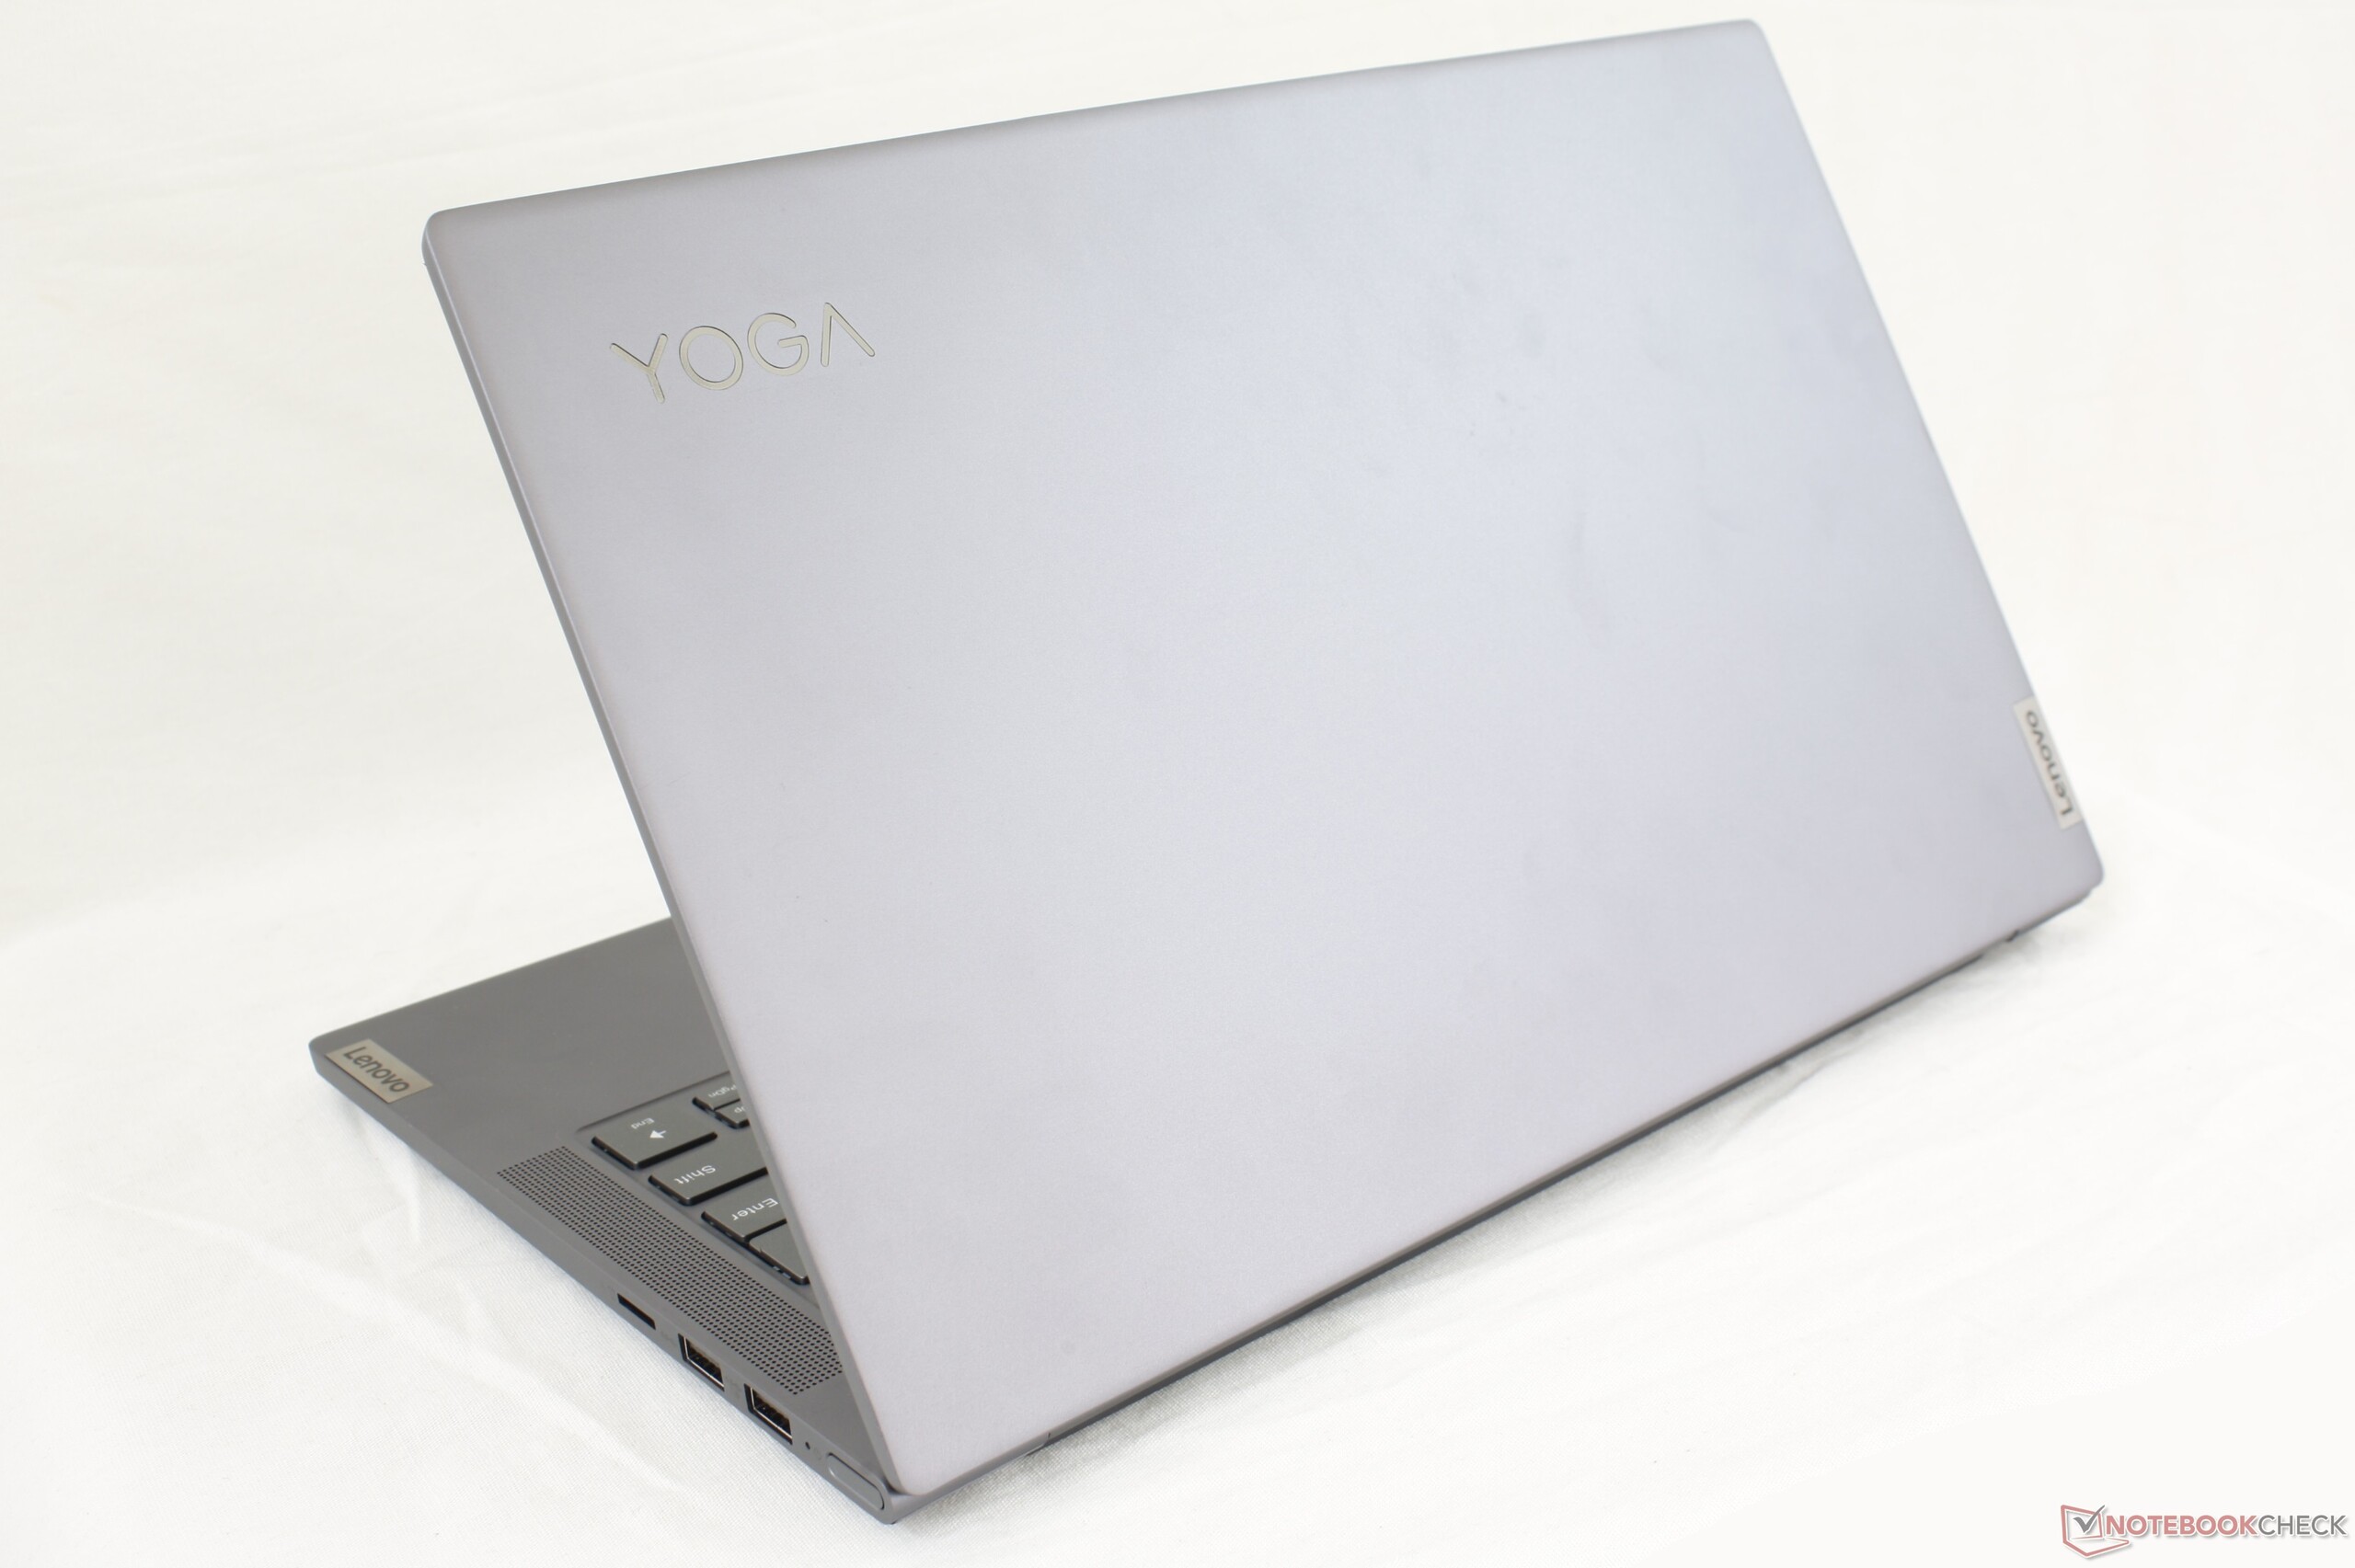
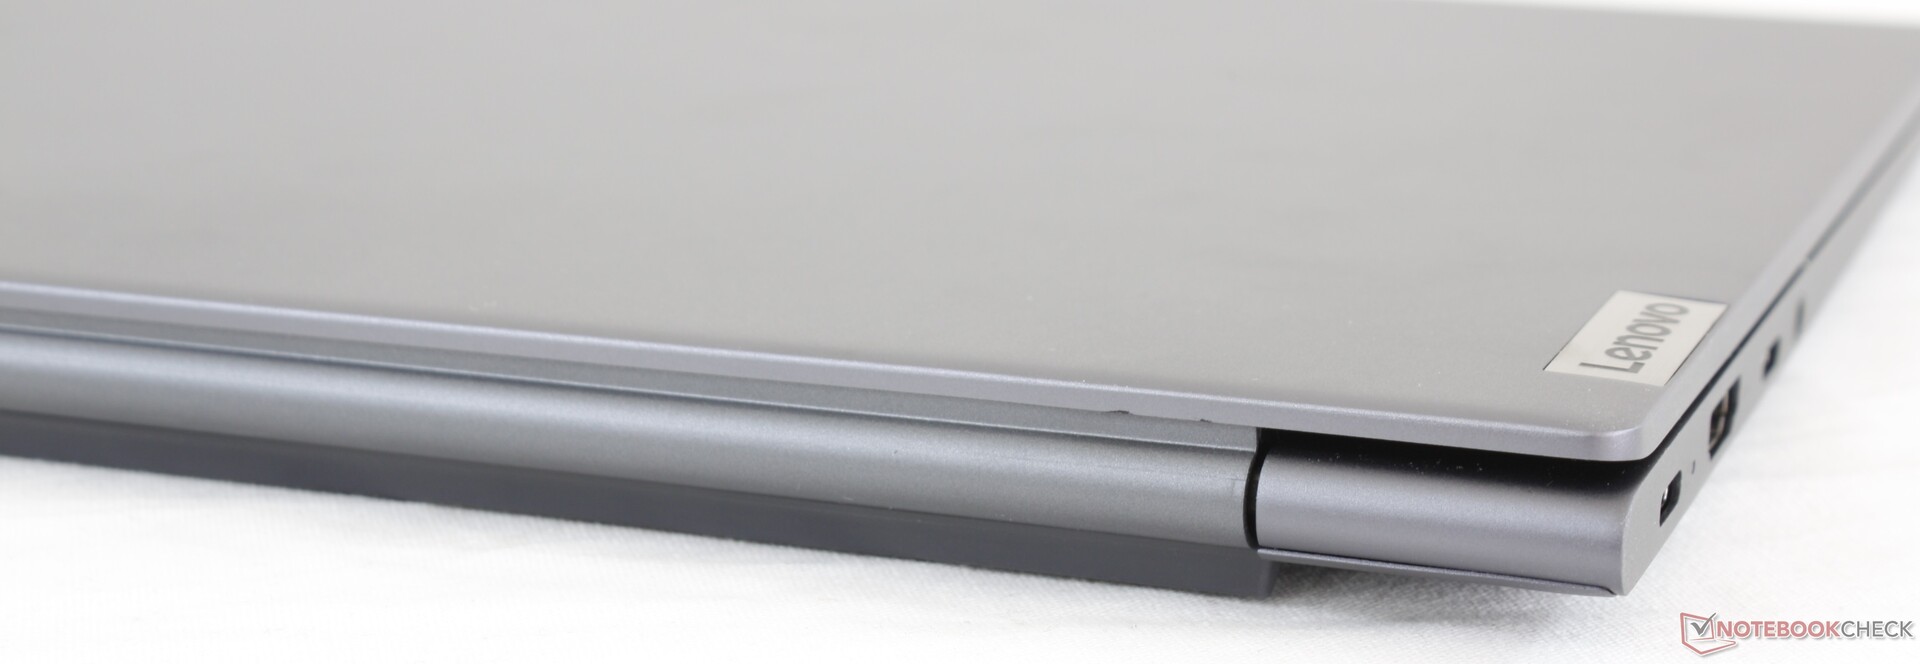
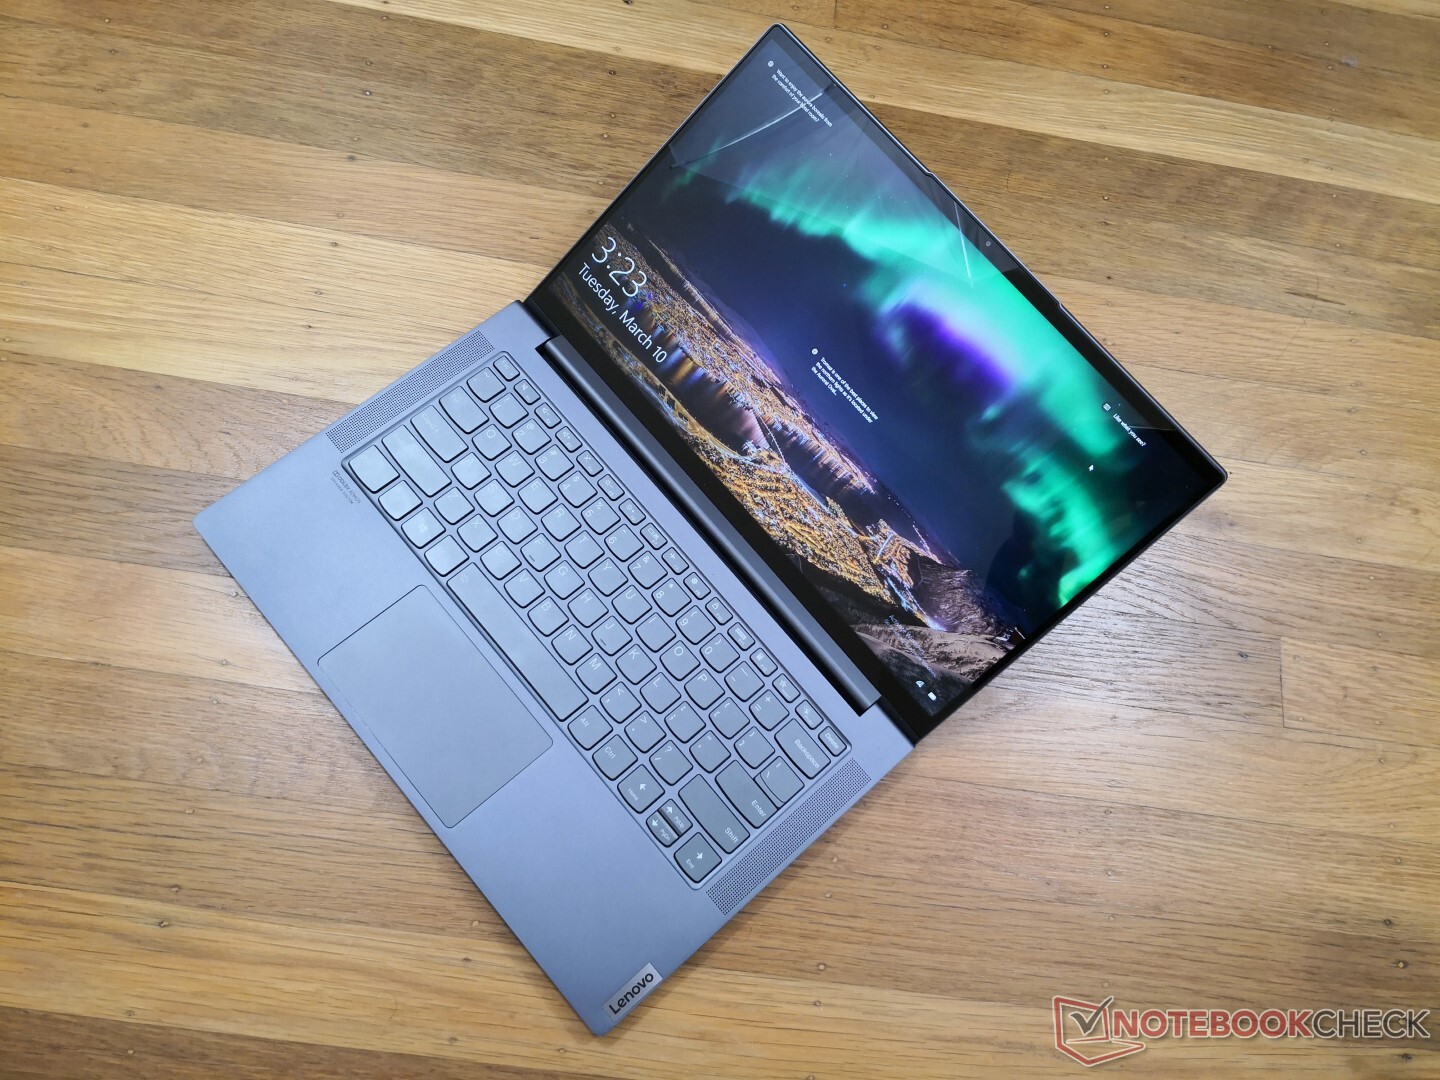
Le PC portable Lenovo en lui-même est un IdeaPad S940 agrandi. Nous pensons qu'il ne pouvait être de la même taille que l'IdeaPad S940, parce que Lenovo voulait plus d'espace pour améliorer le refroidissement et pleinement exploiter le processeur octocoeur de 25 W. Cela signifie que le Yoga Slim 7 sera légèrement plus lourd que la plupart des autres ultrabook de 14 pouces du marché.
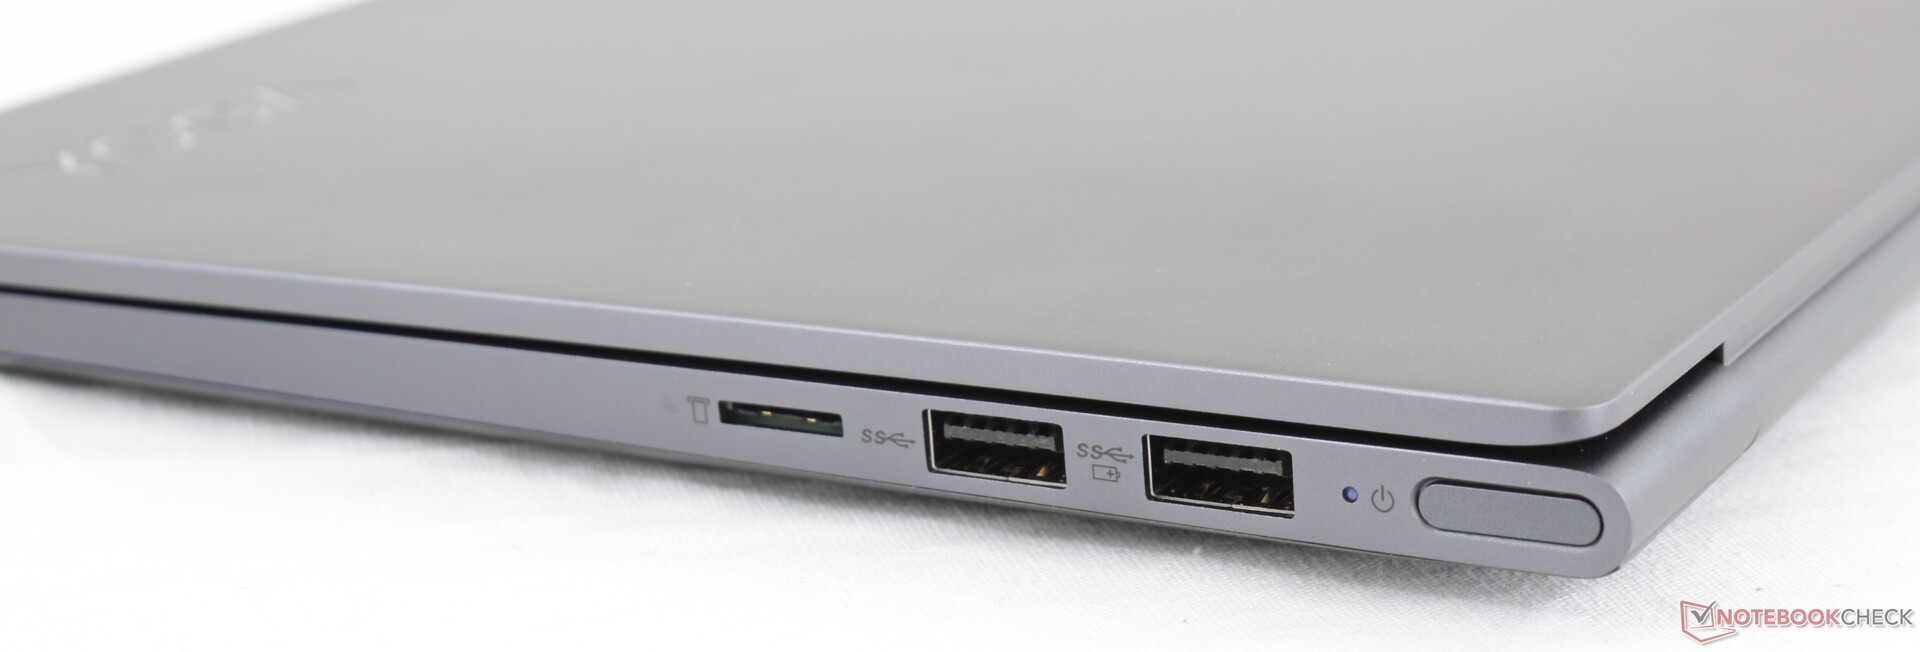
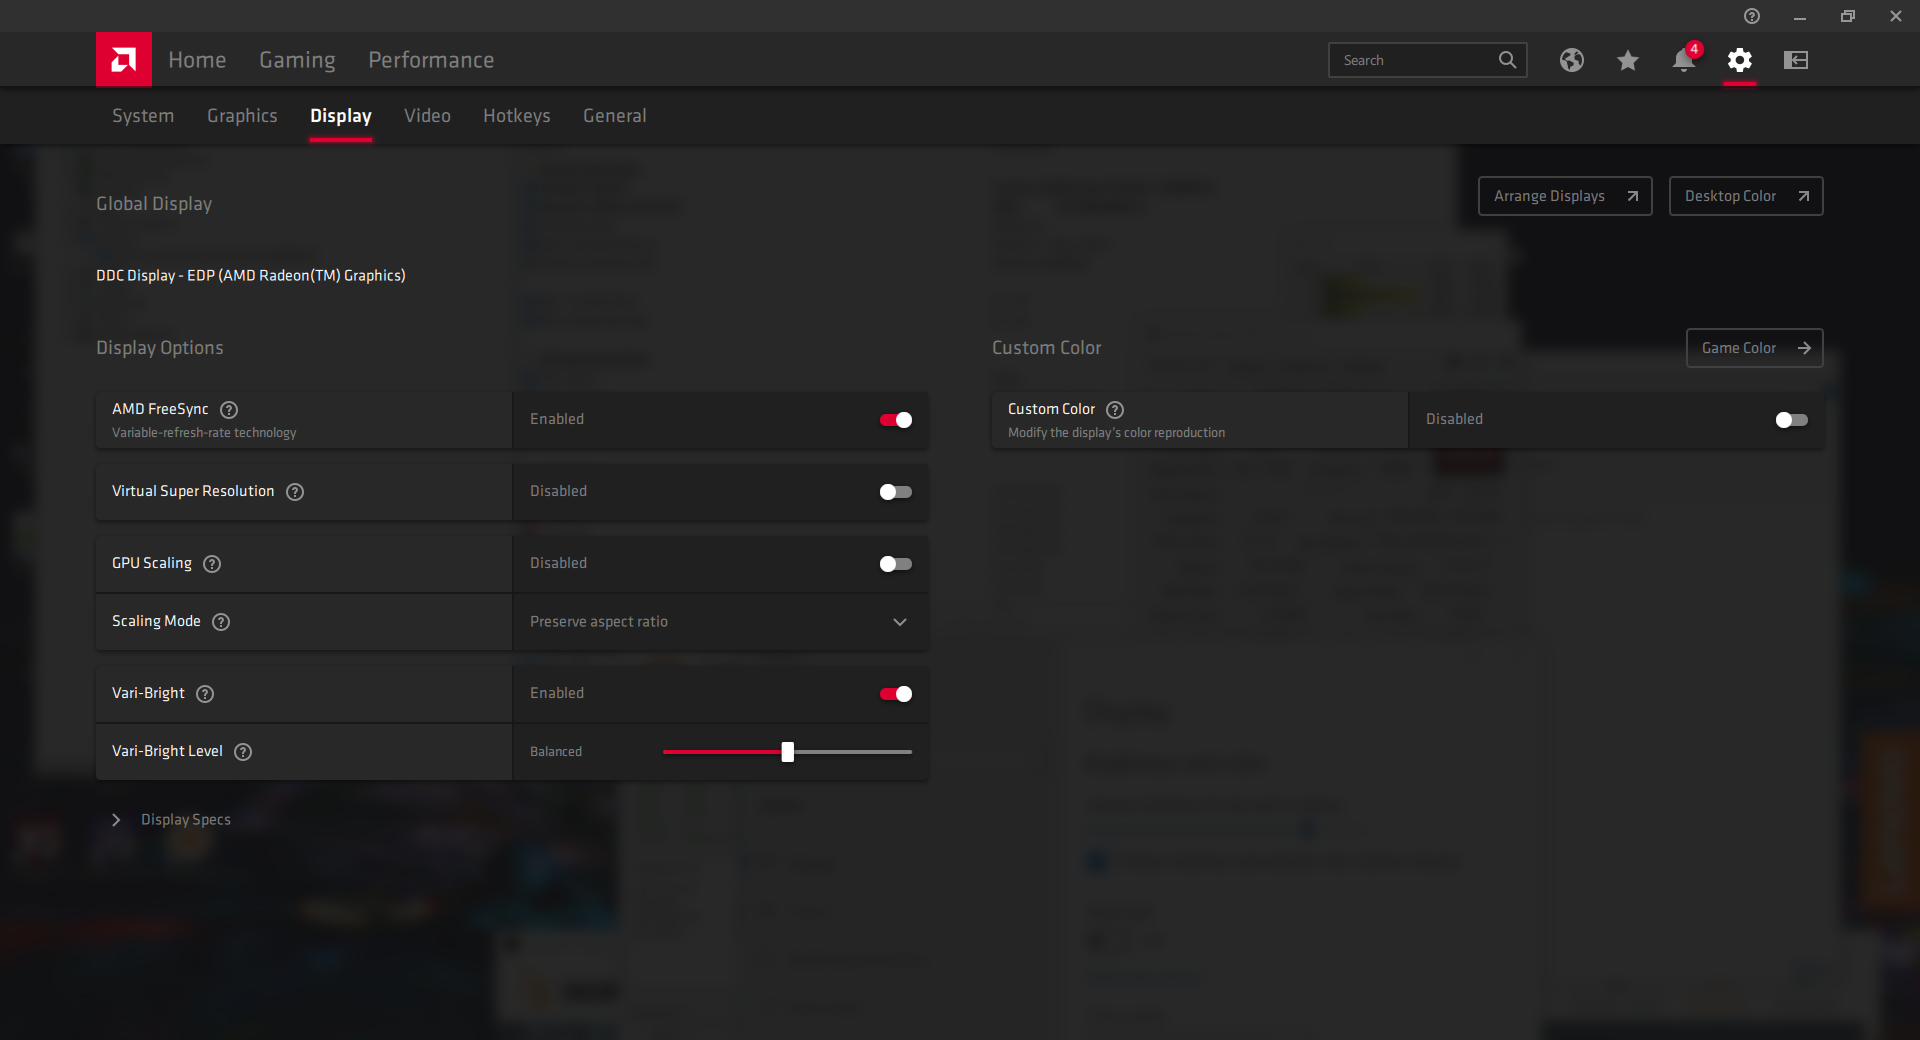
Le clavier possède quelques bizarreries et défauts. L'absence de cache de webcam, par exemple, alors que l'IdeaPad S340 moins cher en possède un. L'écran n'est pas aussi lumineux que celui de l'IdeaPad S940, et donc que beaucoup d'autres ultraportables premium. Nous pouvons en revanche apprécier le double stockage et la pris en charge du FreeSync, que ne proposent généralement pas les ultrabooks.
L’intégralité de cette critique est disponible en anglais en suivant ce lien.
Lenovo Yoga Slim 7-14ARE
- 08/26/2020 v7 (old)
Allen Ngo
Price comparison
