Test du Dell XPS 13 9300 4K UHD (i7-1065G7, Iris Plus G7, 4K UHD) : le 16/10 est le nouveau 16/9
Note | Date | Modèle | Poids | Épaisseur | Taille | Résolution | Prix |
|---|---|---|---|---|---|---|---|
| 88 % v7 (old) | 06/20 | Dell XPS 13 9300 4K UHD i7-1065G7, Iris Plus Graphics G7 (Ice Lake 64 EU) | 1.2 kg | 14.8 mm | 13.40" | 3840x2400 | |
| 86.3 % v7 (old) | 10/19 | Dell XPS 13 7390 2-in-1 Core i7 i7-1065G7, Iris Plus Graphics G7 (Ice Lake 64 EU) | 1.3 kg | 13 mm | 13.40" | 1920x1200 | |
| 85.9 % v7 (old) | 11/19 | Dell XPS 13 7390 Core i7-10710U i7-10710U, UHD Graphics 620 | 1.2 kg | 11.6 mm | 13.30" | 3840x2160 | |
| 90.6 % v7 (old) | 02/20 | Apple MacBook Pro 13 2019 2TB3 i5-8257U, Iris Plus Graphics 645 | 1.4 kg | 14.9 mm | 13.30" | 2560x1600 | |
| 83.9 % v7 (old) | 01/20 | Microsoft Surface Laptop 3 15 i7-1065G7 i7-1065G7, Iris Plus Graphics G7 (Ice Lake 64 EU) | 1.5 kg | 14.7 mm | 15.00" | 2496x1664 | |
| 83.7 % v7 (old) | 11/19 | Razer Blade Stealth 13, Core i7-1065G7 i7-1065G7, GeForce GTX 1650 Max-Q | 1.5 kg | 15.3 mm | 13.30" | 3840x2160 |
| SD Card Reader | |
| average JPG Copy Test (av. of 3 runs) | |
| Dell XPS 13 9300 4K UHD (Toshiba Exceria Pro M501 64 GB UHS-II) | |
| Dell XPS 13 7390 Core i7-10710U (Toshiba Exceria Pro M501 64 GB UHS-II) | |
| HP Spectre x360 13-aw0013dx (Toshiba Exceria Pro M501 microSDXC 64GB) | |
| Dell XPS 13 7390 2-in-1 Core i7 (Toshiba Exceria Pro M501 64 GB UHS-II) | |
| Asus ZenBook Duo UX481FL (Toshiba Exceria Pro M501 microSDXC 64GB) | |
| maximum AS SSD Seq Read Test (1GB) | |
| Dell XPS 13 9300 4K UHD (Toshiba Exceria Pro M501 64 GB UHS-II) | |
| Dell XPS 13 7390 Core i7-10710U (Toshiba Exceria Pro M501 64 GB UHS-II) | |
| Dell XPS 13 7390 2-in-1 Core i7 (Toshiba Exceria Pro M501 64 GB UHS-II) | |
| HP Spectre x360 13-aw0013dx (Toshiba Exceria Pro M501 microSDXC 64GB) | |
| Asus ZenBook Duo UX481FL (Toshiba Exceria Pro M501 microSDXC 64GB) | |
| Networking | |
| iperf3 transmit AX12 | |
| Asus ZenBook Duo UX481FL | |
| MSI GP65 10SFK-047US | |
| Gigabyte Aero 17 HDR XB | |
| Dell XPS 13 9300 4K UHD | |
| iperf3 receive AX12 | |
| Gigabyte Aero 17 HDR XB | |
| Dell XPS 13 9300 4K UHD | |
| Asus ZenBook Duo UX481FL | |
| MSI GP65 10SFK-047US | |

, i7-1065G7, Intel SSDPEMKF512G8 NVMe SSD")
, i7-1065G7, Intel SSDPEMKF512G8 NVMe SSD")
| |||||||||||||||||||||||||
Homogénéité de la luminosité: 94 %
Valeur mesurée au centre, sur batterie: 414 cd/m²
Contraste: 1479:1 (Valeurs des noirs: 0.28 cd/m²)
ΔE ColorChecker Calman: 3.06 | ∀{0.5-29.43 Ø4.72}
calibrated: 3.5
ΔE Greyscale Calman: 3 | ∀{0.09-98 Ø4.97}
91.4% sRGB (Argyll 1.6.3 3D)
61.1% AdobeRGB 1998 (Argyll 1.6.3 3D)
66.6% AdobeRGB 1998 (Argyll 3D)
91.4% sRGB (Argyll 3D)
64.5% Display P3 (Argyll 3D)
Gamma: 2.42
CCT: 6840 K
| Dell XPS 13 9300 4K UHD Sharp LQ134R1, IPS, 13.4", 3840x2400 | Dell XPS 13 9300 Core i7-1065G7 Sharp LQ134N1, IPS, 13.4", 1920x1200 | Dell XPS 13 7390 2-in-1 Core i7 Sharp LQ134N1, IPS, 13.4", 1920x1200 | Dell XPS 13 7390 Core i7-10710U AU Optronics B133ZAN, Dell P/N: 90NTH, IPS, 13.3", 3840x2160 | Apple MacBook Pro 13 2019 2TB3 APPA03D, IPS, 13.3", 2560x1600 | Microsoft Surface Laptop 3 13 Core i5-1035G7 Sharp LQ135P1JX51, IPS, 13.5", 2256x1504 | |
|---|---|---|---|---|---|---|
| Display | 4% | 8% | -1% | 29% | 4% | |
| Display P3 Coverage (%) | 64.5 | 66.3 3% | 69.9 8% | 63.4 -2% | 96.1 49% | 65.7 2% |
| sRGB Coverage (%) | 91.4 | 97.3 6% | 99.2 9% | 93.7 3% | 99.4 9% | 98.6 8% |
| AdobeRGB 1998 Coverage (%) | 66.6 | 68.5 3% | 71.5 7% | 64.3 -3% | 85.6 29% | 67.8 2% |
| Response Times | -25% | -14% | -28% | -30% | -53% | |
| Response Time Grey 50% / Grey 80% * (ms) | 41.6 ? | 50 ? -20% | 47.6 ? -14% | 51.6 ? -24% | 50.4 ? -21% | 59.2 ? -42% |
| Response Time Black / White * (ms) | 25.6 ? | 33.2 ? -30% | 29.2 ? -14% | 33.6 ? -31% | 35.2 ? -38% | 41.6 ? -63% |
| PWM Frequency (Hz) | 2500 ? | 2500 ? | 116300 ? | 21740 ? | ||
| Screen | 1% | 16% | -29% | 29% | 21% | |
| Brightness middle (cd/m²) | 414 | 607.6 47% | 549.8 33% | 408.2 -1% | 603 46% | 403.4 -3% |
| Brightness (cd/m²) | 401 | 595 48% | 520 30% | 399 0% | 577 44% | 397 -1% |
| Brightness Distribution (%) | 94 | 96 2% | 86 -9% | 89 -5% | 92 -2% | 89 -5% |
| Black Level * (cd/m²) | 0.28 | 0.4 -43% | 0.39 -39% | 0.39 -39% | 0.35 -25% | 0.34 -21% |
| Contrast (:1) | 1479 | 1519 3% | 1410 -5% | 1047 -29% | 1723 16% | 1186 -20% |
| Colorchecker dE 2000 * | 3.06 | 3.23 -6% | 2.12 31% | 4.6 -50% | 1.7 44% | 0.94 69% |
| Colorchecker dE 2000 max. * | 6.5 | 8.67 -33% | 3.66 44% | 11.84 -82% | 3.1 52% | 2.92 55% |
| Colorchecker dE 2000 calibrated * | 3.5 | 1.01 71% | 1.37 61% | 2.03 42% | 0.7 80% | 0.99 72% |
| Greyscale dE 2000 * | 3 | 5.5 -83% | 2.6 13% | 7.5 -150% | 2.1 30% | 0.9 70% |
| Gamma | 2.42 91% | 2.12 104% | 2.3 96% | 2.12 104% | 2.18 101% | 2.13 103% |
| CCT | 6840 95% | 6413 101% | 6884 94% | 7966 82% | 6843 95% | 6620 98% |
| Color Space (Percent of AdobeRGB 1998) (%) | 61.1 | 63 3% | 65.4 7% | 59.5 -3% | 76.7 26% | 62.3 2% |
| Color Space (Percent of sRGB) (%) | 91.4 | 97.5 7% | 99.7 9% | 93.5 2% | 99.4 9% | 98.7 8% |
| Moyenne finale (programmes/paramètres) | -7% /
-1% | 3% /
11% | -19% /
-23% | 9% /
22% | -9% /
8% |
* ... Moindre est la valeur, meilleures sont les performances
Temps de réponse de l'écran
| ↔ Temps de réponse noir à blanc | ||
|---|---|---|
| 25.6 ms ... hausse ↗ et chute ↘ combinées | ↗ 15.6 ms hausse | 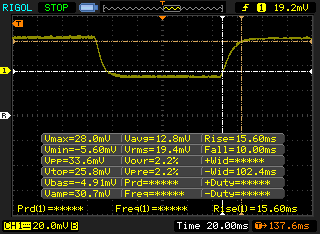 |
| ↘ 10 ms chute | ||
| L'écran souffre de latences relativement élevées, insuffisant pour le jeu. En comparaison, tous les appareils testés affichent entre 0.1 (minimum) et 240 (maximum) ms. » 61 % des appareils testés affichent de meilleures performances. Cela signifie que les latences relevées sont moins bonnes que la moyenne (19.9 ms) de tous les appareils testés. | ||
| ↔ Temps de réponse gris 50% à gris 80% | ||
| 41.6 ms ... hausse ↗ et chute ↘ combinées | ↗ 23.2 ms hausse | 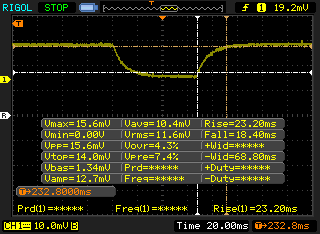 |
| ↘ 18.4 ms chute | ||
| L'écran souffre de latences très élevées, à éviter pour le jeu. En comparaison, tous les appareils testés affichent entre 0.165 (minimum) et 636 (maximum) ms. » 67 % des appareils testés affichent de meilleures performances. Cela signifie que les latences relevées sont moins bonnes que la moyenne (31.1 ms) de tous les appareils testés. | ||
Scintillement / MLI (Modulation de largeur d'impulsion)
| Scintillement / MLI (Modulation de largeur d'impulsion) non décelé | 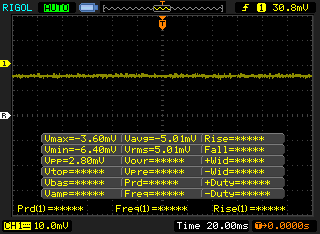 | ||
En comparaison, 52 % des appareils testés n'emploient pas MDI pour assombrir leur écran. Nous avons relevé une moyenne à 7784 (minimum : 5 - maximum : 343500) Hz dans le cas où une MDI était active. | |||
Cinebench R15: CPU Single 64Bit | CPU Multi 64Bit
Blender: v2.79 BMW27 CPU
7-Zip 18.03: 7z b 4 -mmt1 | 7z b 4
Geekbench 5.5: Single-Core | Multi-Core
HWBOT x265 Benchmark v2.2: 4k Preset
LibreOffice : 20 Documents To PDF
R Benchmark 2.5: Overall mean
| Blender / v2.79 BMW27 CPU | |
| Dell XPS 13 7390 2-in-1 Core i3 | |
| Moyenne Intel Core i7-1065G7 (675 - 1650, n=23) | |
| Acer Aspire 5 A515-54G | |
| Asus ZenBook Duo UX481FL | |
| Dell XPS 13 9300 i5 FHD | |
| Huawei MateBook D 14-53010TVS | |
| Huawei MateBook D 14-53010TVS | |
| Dell XPS 13 9300 4K UHD | |
| Dell XPS 13 7390 Core i7-10710U | |
| 7-Zip 18.03 / 7z b 4 -mmt1 | |
| Asus ZenBook Duo UX481FL | |
| Dell XPS 13 9300 4K UHD | |
| Dell XPS 13 7390 Core i7-10710U | |
| Moyenne Intel Core i7-1065G7 (3289 - 4589, n=24) | |
| Acer Aspire 5 A515-54G | |
| Dell XPS 13 9300 i5 FHD | |
| Dell XPS 13 7390 2-in-1 Core i3 | |
| Huawei MateBook D 14-53010TVS | |
| Huawei MateBook D 14-53010TVS | |
| Geekbench 5.5 / Single-Core | |
| Dell XPS 13 9300 4K UHD | |
| Moyenne Intel Core i7-1065G7 (948 - 1348, n=18) | |
| Asus ZenBook Duo UX481FL | |
| Dell XPS 13 9300 i5 FHD | |
| Acer Aspire 5 A515-54G | |
| Huawei MateBook D 14-53010TVS | |
| Huawei MateBook D 14-53010TVS | |
| Geekbench 5.5 / Multi-Core | |
| Dell XPS 13 9300 4K UHD | |
| Dell XPS 13 9300 i5 FHD | |
| Moyenne Intel Core i7-1065G7 (2464 - 4855, n=18) | |
| Asus ZenBook Duo UX481FL | |
| Acer Aspire 5 A515-54G | |
| Huawei MateBook D 14-53010TVS | |
| Huawei MateBook D 14-53010TVS | |
| HWBOT x265 Benchmark v2.2 / 4k Preset | |
| Dell XPS 13 9300 4K UHD | |
| Dell XPS 13 7390 Core i7-10710U | |
| Asus ZenBook Duo UX481FL | |
| Moyenne Intel Core i7-1065G7 (2.2 - 6.38, n=22) | |
| Acer Aspire 5 A515-54G | |
| Dell XPS 13 9300 i5 FHD | |
| Huawei MateBook D 14-53010TVS | |
| Huawei MateBook D 14-53010TVS | |
| Dell XPS 13 7390 2-in-1 Core i3 | |
| LibreOffice / 20 Documents To PDF | |
| Dell XPS 13 9300 4K UHD | |
| Asus ZenBook Duo UX481FL | |
| Acer Aspire 5 A515-54G | |
| Moyenne Intel Core i7-1065G7 (46.9 - 85.3, n=19) | |
| R Benchmark 2.5 / Overall mean | |
| Asus ZenBook Duo UX481FL | |
| Huawei MateBook D 14-53010TVS | |
| Huawei MateBook D 14-53010TVS | |
| Dell XPS 13 9300 i5 FHD | |
| Acer Aspire 5 A515-54G | |
| Moyenne Intel Core i7-1065G7 (0.661 - 0.798, n=18) | |
| Dell XPS 13 9300 4K UHD | |
* ... Moindre est la valeur, meilleures sont les performances
| PCMark 8 Home Score Accelerated v2 | 3397 points | |
| PCMark 8 Work Score Accelerated v2 | 4314 points | |
| PCMark 10 Score | 4451 points | |
Aide | ||
| DPC Latencies / LatencyMon - interrupt to process latency (max), Web, Youtube, Prime95 | |
| Dell XPS 13 9300 4K UHD | |
* ... Moindre est la valeur, meilleures sont les performances
| Dell XPS 13 9300 4K UHD Intel SSDPEMKF512G8 NVMe SSD | Dell XPS 13 9300 Core i7-1065G7 Intel SSDPEMKF512G8 NVMe SSD | Dell XPS 13 7390 2-in-1 Core i7 Toshiba BG4 KBG40ZPZ512G | Dell XPS 13 7390 Core i7-10710U SK Hynix PC601 NVMe 512 GB | Apple MacBook Pro 13 2019 2TB3 Apple SSD AP0256 | |
|---|---|---|---|---|---|
| AS SSD | 1% | -21% | 22% | -77% | |
| Seq Read (MB/s) | 1821 | 1956 7% | 1801 -1% | 1804 -1% | 974 -47% |
| Seq Write (MB/s) | 931 | 1227 32% | 1125 21% | 1000 7% | 1340 44% |
| 4K Read (MB/s) | 56.4 | 63 12% | 39.7 -30% | 45.1 -20% | 11.35 -80% |
| 4K Write (MB/s) | 127.2 | 156.6 23% | 67 -47% | 115 -10% | 15.95 -87% |
| 4K-64 Read (MB/s) | 462.6 | 475.6 3% | 1253 171% | 893 93% | 643 39% |
| 4K-64 Write (MB/s) | 541 | 539 0% | 209 -61% | 732 35% | 163 -70% |
| Access Time Read * (ms) | 0.04 | 0.042 -5% | 0.069 -73% | 0.044 -10% | 0.316 -690% |
| Access Time Write * (ms) | 0.123 | 0.105 15% | 0.625 -408% | 0.095 23% | 0.258 -110% |
| Score Read (Points) | 701 | 734 5% | 1472 110% | 1119 60% | 752 7% |
| Score Write (Points) | 762 | 818 7% | 388 -49% | 947 24% | 313 -59% |
| Score Total (Points) | 1797 | 1915 7% | 2583 44% | 2608 45% | 1465 -18% |
| Copy ISO MB/s (MB/s) | 1068 | 1022 -4% | 1293 21% | 1515 42% | 1404 31% |
| Copy Program MB/s (MB/s) | 446.4 | 302.8 -32% | 560 25% | 535 20% | 406.9 -9% |
| Copy Game MB/s (MB/s) | 1163 | 491.4 -58% | 927 -20% | 1211 4% | 850 -27% |
| CrystalDiskMark 5.2 / 6 | 20% | 1% | 27% | ||
| Write 4K (MB/s) | 126.2 | 186.8 48% | 106.7 -15% | 134 6% | |
| Read 4K (MB/s) | 61.1 | 71.4 17% | 49.94 -18% | 42.91 -30% | |
| Write Seq (MB/s) | 1049 | 1203 15% | 1223 17% | 1841 76% | |
| Read Seq (MB/s) | 2231 | 2600 17% | 1801 -19% | 1707 -23% | |
| Write 4K Q32T1 (MB/s) | 410.1 | 514 25% | 325.3 -21% | 394.7 -4% | |
| Read 4K Q32T1 (MB/s) | 418.9 | 570 36% | 551 32% | 398.5 -5% | |
| Write Seq Q32T1 (MB/s) | 784 | 786 0% | 1224 56% | 2250 187% | |
| Read Seq Q32T1 (MB/s) | 2964 | 2947 -1% | 2350 -21% | 3265 10% | |
| Moyenne finale (programmes/paramètres) | 11% /
8% | -10% /
-13% | 25% /
24% | -77% /
-77% |
* ... Moindre est la valeur, meilleures sont les performances

Disk Throttling: DiskSpd Read Loop, Queue Depth 8
| 3DMark 11 Performance | 4478 points | |
| 3DMark Cloud Gate Standard Score | 12940 points | |
| 3DMark Fire Strike Score | 2707 points | |
| 3DMark Time Spy Score | 847 points | |
Aide | ||
| Bas | Moyen | Élevé | Ultra | |
|---|---|---|---|---|
| Dota 2 Reborn (2015) | 80.2 | 48.6 | 30.1 | 27.6 |
| X-Plane 11.11 (2018) | 27.6 | 15.2 | 17.3 |
| Dell XPS 13 9300 4K UHD Iris Plus Graphics G7 (Ice Lake 64 EU), i7-1065G7, Intel SSDPEMKF512G8 NVMe SSD | Dell XPS 13 9300 Core i7-1065G7 Iris Plus Graphics G7 (Ice Lake 64 EU), i7-1065G7, Intel SSDPEMKF512G8 NVMe SSD | Dell XPS 13 7390 2-in-1 Core i7 Iris Plus Graphics G7 (Ice Lake 64 EU), i7-1065G7, Toshiba BG4 KBG40ZPZ512G | Dell XPS 13 7390 Core i7-10710U UHD Graphics 620, i7-10710U, SK Hynix PC601 NVMe 512 GB | Apple MacBook Pro 13 2019 2TB3 Iris Plus Graphics 645, i5-8257U, Apple SSD AP0256 | Microsoft Surface Laptop 3 13 Core i5-1035G7 Iris Plus Graphics G7 (Ice Lake 64 EU), i5-1035G7, SK hynix BC501 HFM256GDGTNG | |
|---|---|---|---|---|---|---|
| Noise | 2% | 0% | -1% | 0% | 3% | |
| arrêt / environnement * (dB) | 29 | 28.3 2% | 28.1 3% | 28 3% | 29.5 -2% | 28.5 2% |
| Idle Minimum * (dB) | 29 | 28.3 2% | 28.1 3% | 28 3% | 29.5 -2% | 28.5 2% |
| Idle Average * (dB) | 29 | 28.3 2% | 28.1 3% | 28 3% | 29.5 -2% | 28.5 2% |
| Idle Maximum * (dB) | 29 | 28.3 2% | 28.1 3% | 28 3% | 29.5 -2% | 28.5 2% |
| Load Average * (dB) | 33.5 | 32.5 3% | 31.7 5% | 33.7 -1% | 31.1 7% | 28.5 15% |
| Witcher 3 ultra * (dB) | 40.5 | 39.3 3% | 43.4 -7% | 40.4 -0% | ||
| Load Maximum * (dB) | 40.5 | 39.3 3% | 43.4 -7% | 46.5 -15% | 39.3 3% | 40.4 -0% |
* ... Moindre est la valeur, meilleures sont les performances
Degré de la nuisance sonore
| Au repos |
| 29 / 29 / 29 dB(A) |
| Fortement sollicité |
| 33.5 / 40.5 dB(A) |
 | ||
30 dB silencieux 40 dB(A) audible 50 dB(A) bruyant |
||
min: | ||
(-) La température maximale du côté supérieur est de 48.4 °C / 119 F, par rapport à la moyenne de 35.9 °C / 97 F, allant de 21.4 à 59 °C pour la classe Subnotebook.
(±) Le fond chauffe jusqu'à un maximum de 44.4 °C / 112 F, contre une moyenne de 39.2 °C / 103 F
(+) En utilisation inactive, la température moyenne du côté supérieur est de 27.3 °C / 81 F, par rapport à la moyenne du dispositif de 30.8 °C / 87 F.
(+) Les repose-poignets et le pavé tactile atteignent la température maximale de la peau (32 °C / 89.6 F) et ne sont donc pas chauds.
(-) La température moyenne de la zone de l'appui-paume de dispositifs similaires était de 28.2 °C / 82.8 F (-3.8 °C / #-6.8 F).
| Éteint/en veille | |
| Au repos | |
| Fortement sollicité |
|
Légende:
min: | |
| Dell XPS 13 9300 4K UHD i7-1065G7, Iris Plus Graphics G7 (Ice Lake 64 EU), Intel SSDPEMKF512G8 NVMe SSD, IPS, 3840x2400, 13.4" | Dell XPS 13 9300 Core i7-1065G7 i7-1065G7, Iris Plus Graphics G7 (Ice Lake 64 EU), Intel SSDPEMKF512G8 NVMe SSD, IPS, 1920x1200, 13.4" | Dell XPS 13 7390 2-in-1 Core i7 i7-1065G7, Iris Plus Graphics G7 (Ice Lake 64 EU), Toshiba BG4 KBG40ZPZ512G, IPS, 1920x1200, 13.4" | Dell XPS 13 7390 Core i7-10710U i7-10710U, UHD Graphics 620, SK Hynix PC601 NVMe 512 GB, IPS, 3840x2160, 13.3" | Apple MacBook Pro 13 2019 2TB3 i5-8257U, Iris Plus Graphics 645, Apple SSD AP0256, IPS, 2560x1600, 13.3" | Microsoft Surface Laptop 3 13 Core i5-1035G7 i5-1035G7, Iris Plus Graphics G7 (Ice Lake 64 EU), SK hynix BC501 HFM256GDGTNG, IPS, 2256x1504, 13.5" | |
|---|---|---|---|---|---|---|
| Power Consumption | 16% | 20% | 4% | 13% | 4% | |
| Idle Minimum * (Watt) | 5.3 | 4.2 21% | 2.6 51% | 4.7 11% | 2.1 60% | 4.4 17% |
| Idle Average * (Watt) | 7.8 | 6.9 12% | 5.3 32% | 8.3 -6% | 6.9 12% | 7.5 4% |
| Idle Maximum * (Watt) | 9.8 | 7.5 23% | 7 29% | 9 8% | 7.8 20% | 7.8 20% |
| Load Average * (Watt) | 46 | 33.3 28% | 43.1 6% | 42 9% | 42 9% | 41.9 9% |
| Witcher 3 ultra * (Watt) | 43 | 37.1 14% | 43.1 -0% | 40.8 5% | ||
| Load Maximum * (Watt) | 48.3 | 48.4 -0% | 49 -1% | 49 -1% | 64.5 -34% | 63.9 -32% |
* ... Moindre est la valeur, meilleures sont les performances
| Dell XPS 13 9300 4K UHD i7-1065G7, Iris Plus Graphics G7 (Ice Lake 64 EU), 52 Wh | Dell XPS 13 9300 Core i7-1065G7 i7-1065G7, Iris Plus Graphics G7 (Ice Lake 64 EU), 52 Wh | Dell XPS 13 7390 2-in-1 Core i7 i7-1065G7, Iris Plus Graphics G7 (Ice Lake 64 EU), 51 Wh | Dell XPS 13 7390 Core i7-10710U i7-10710U, UHD Graphics 620, 52 Wh | Apple MacBook Pro 13 2019 2TB3 i5-8257U, Iris Plus Graphics 645, 58.2 Wh | Microsoft Surface Laptop 3 13 Core i5-1035G7 i5-1035G7, Iris Plus Graphics G7 (Ice Lake 64 EU), 45 Wh | |
|---|---|---|---|---|---|---|
| Autonomie de la batterie | 11% | -21% | -26% | 14% | -27% | |
| WiFi v1.3 (h) | 11.4 | 12.7 11% | 9 -21% | 8.4 -26% | 13 14% | 8.3 -27% |
| Reader / Idle (h) | 34.4 | |||||
| Load (h) | 1.9 |
Points positifs
Points négatifs
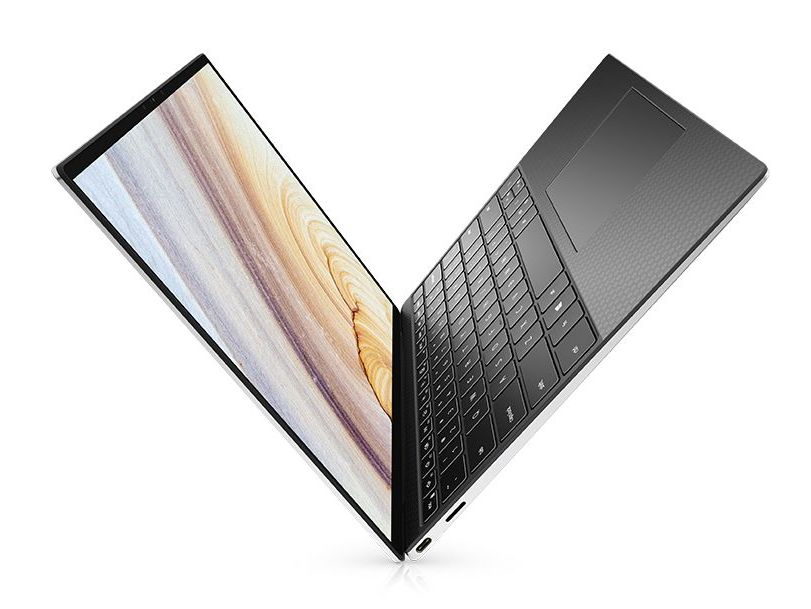
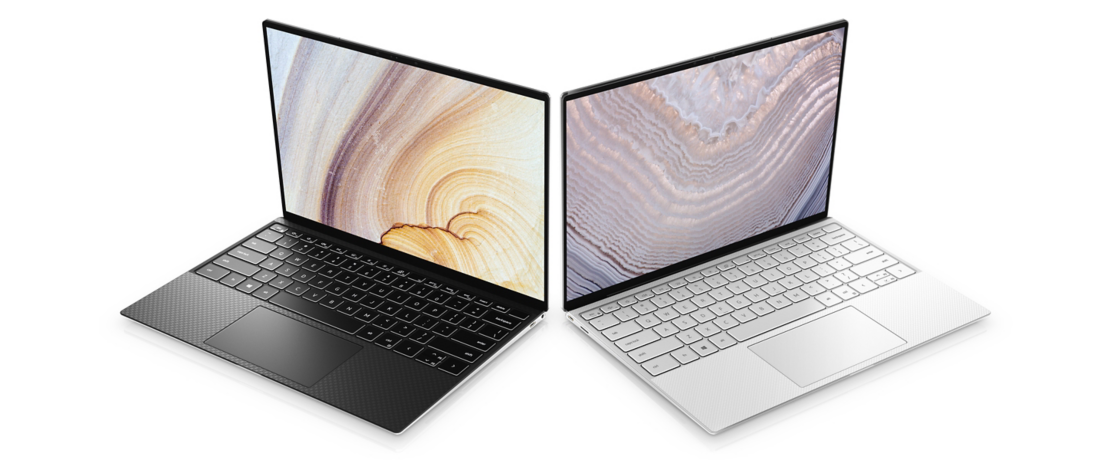
Le Dell XPS 13 9300 est unique en son genre, puisqu'il s'agit d'un des seuls (si ce n'est LE seul) ultraportable Windows avec un écran tactile 4K UHD 16:10. Ceux qui choisiraient ainsi la version 4K UHD sur la version FHD de base devront garder à l'esprit quelques avantages et inconvénients.
Commençons par les avantages : mis à part la résolution supérieure et l'écran plus net, la version 4K offre des temps de réponse du noir au blanc et du gris au gris meilleurs que la version FHD, permettant de rendre le ghosting moins visible. La MLI est complètement absente, alors qu'elle est présente dans les versions FHD. Le contraste et l'espace colorimétrique sont similaires à ceux des dalles FHD, si bien que les utilisateurs n'y perdront rien à prendre la résolution plus élevée.
Le principal désavantage de la version 4K est qu'elle n'est pas aussi lumineuse que la version FHD. Cela ne suffit pas pour faire une différence à l'intérieur, mais cela est notable quand une luminosité supérieure est nécessaire, pour l'extérieur. L'autonomie est également un peu plus courte d'une ou deux heures, mais ce n'est pas trop grave vu l'excellente autonomie du XPS 13.
La 4K offre quelques avantages inattendus, comme des temps de réponse plus rapides et l'absence de MLI par rapport à la version FHD. Ceux qui apprécient travailler en déplacements pourraient préférer la version FHD, parce qu'elle de 50 % plus lumineuse que la version 4K.
L’intégralité de cette critique est disponible en anglais en suivant ce lien.
Dell XPS 13 9300 4K UHD
- 05/15/2020 v7 (old)
Allen Ngo
Price comparison
