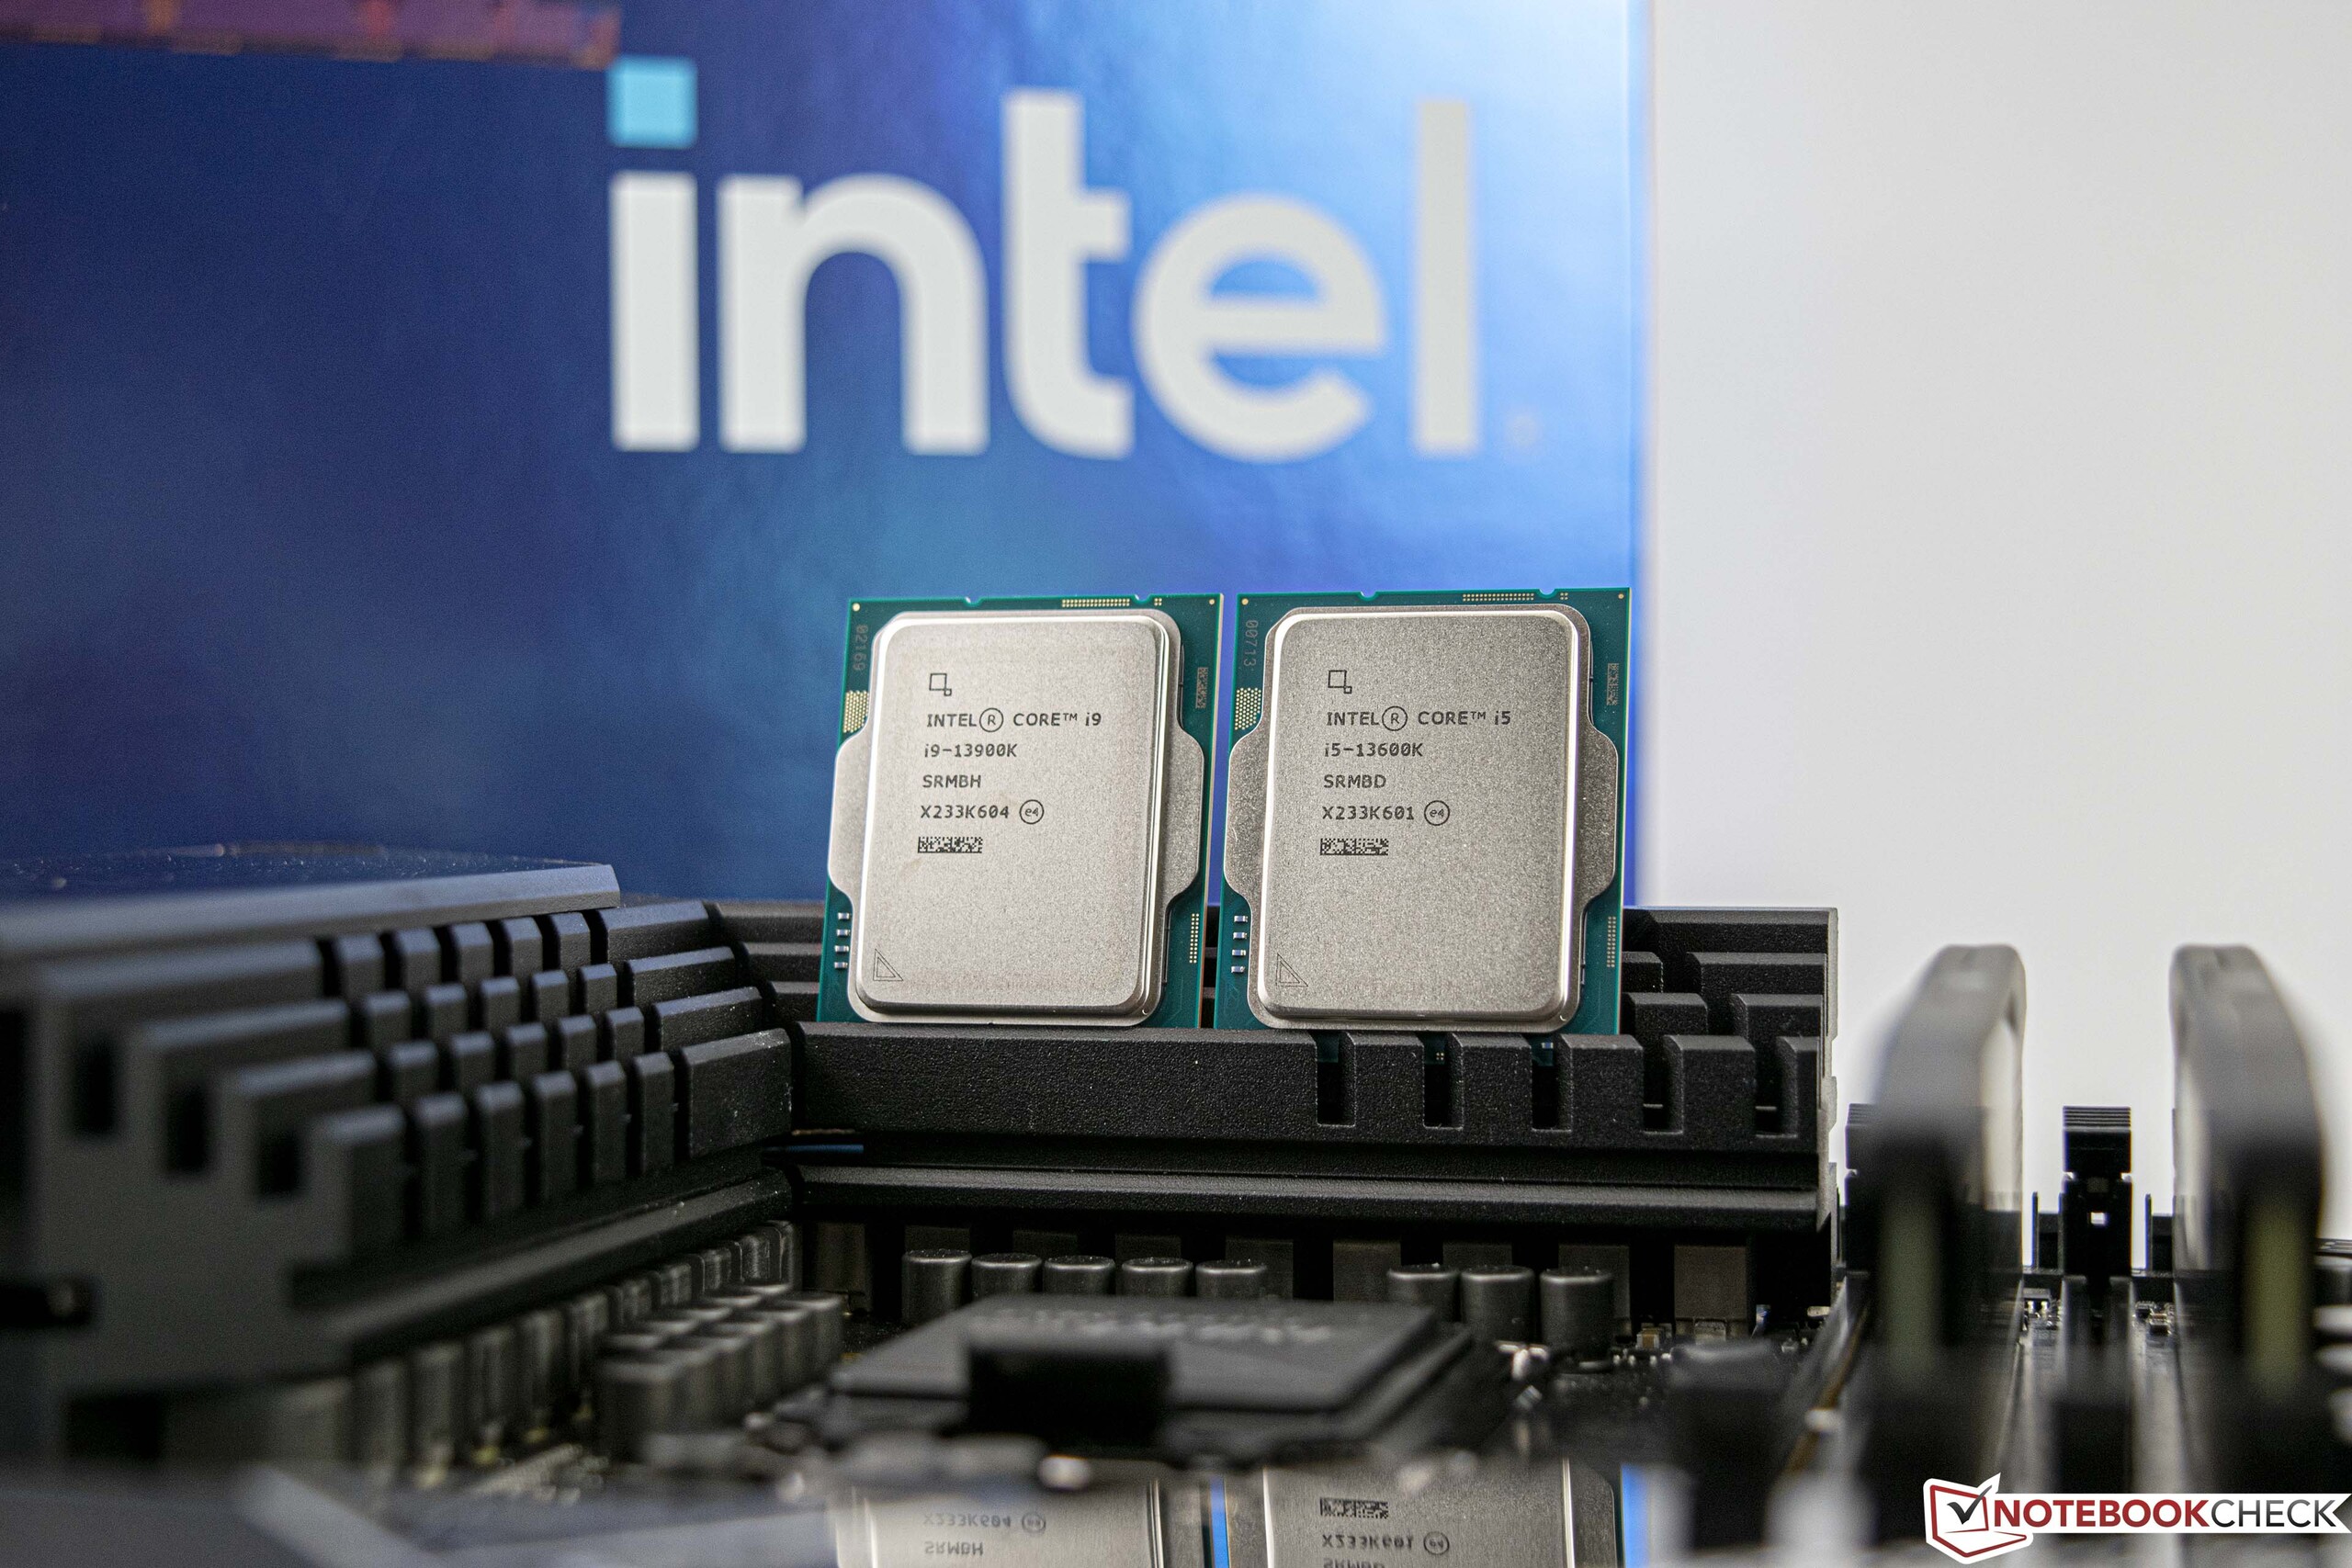
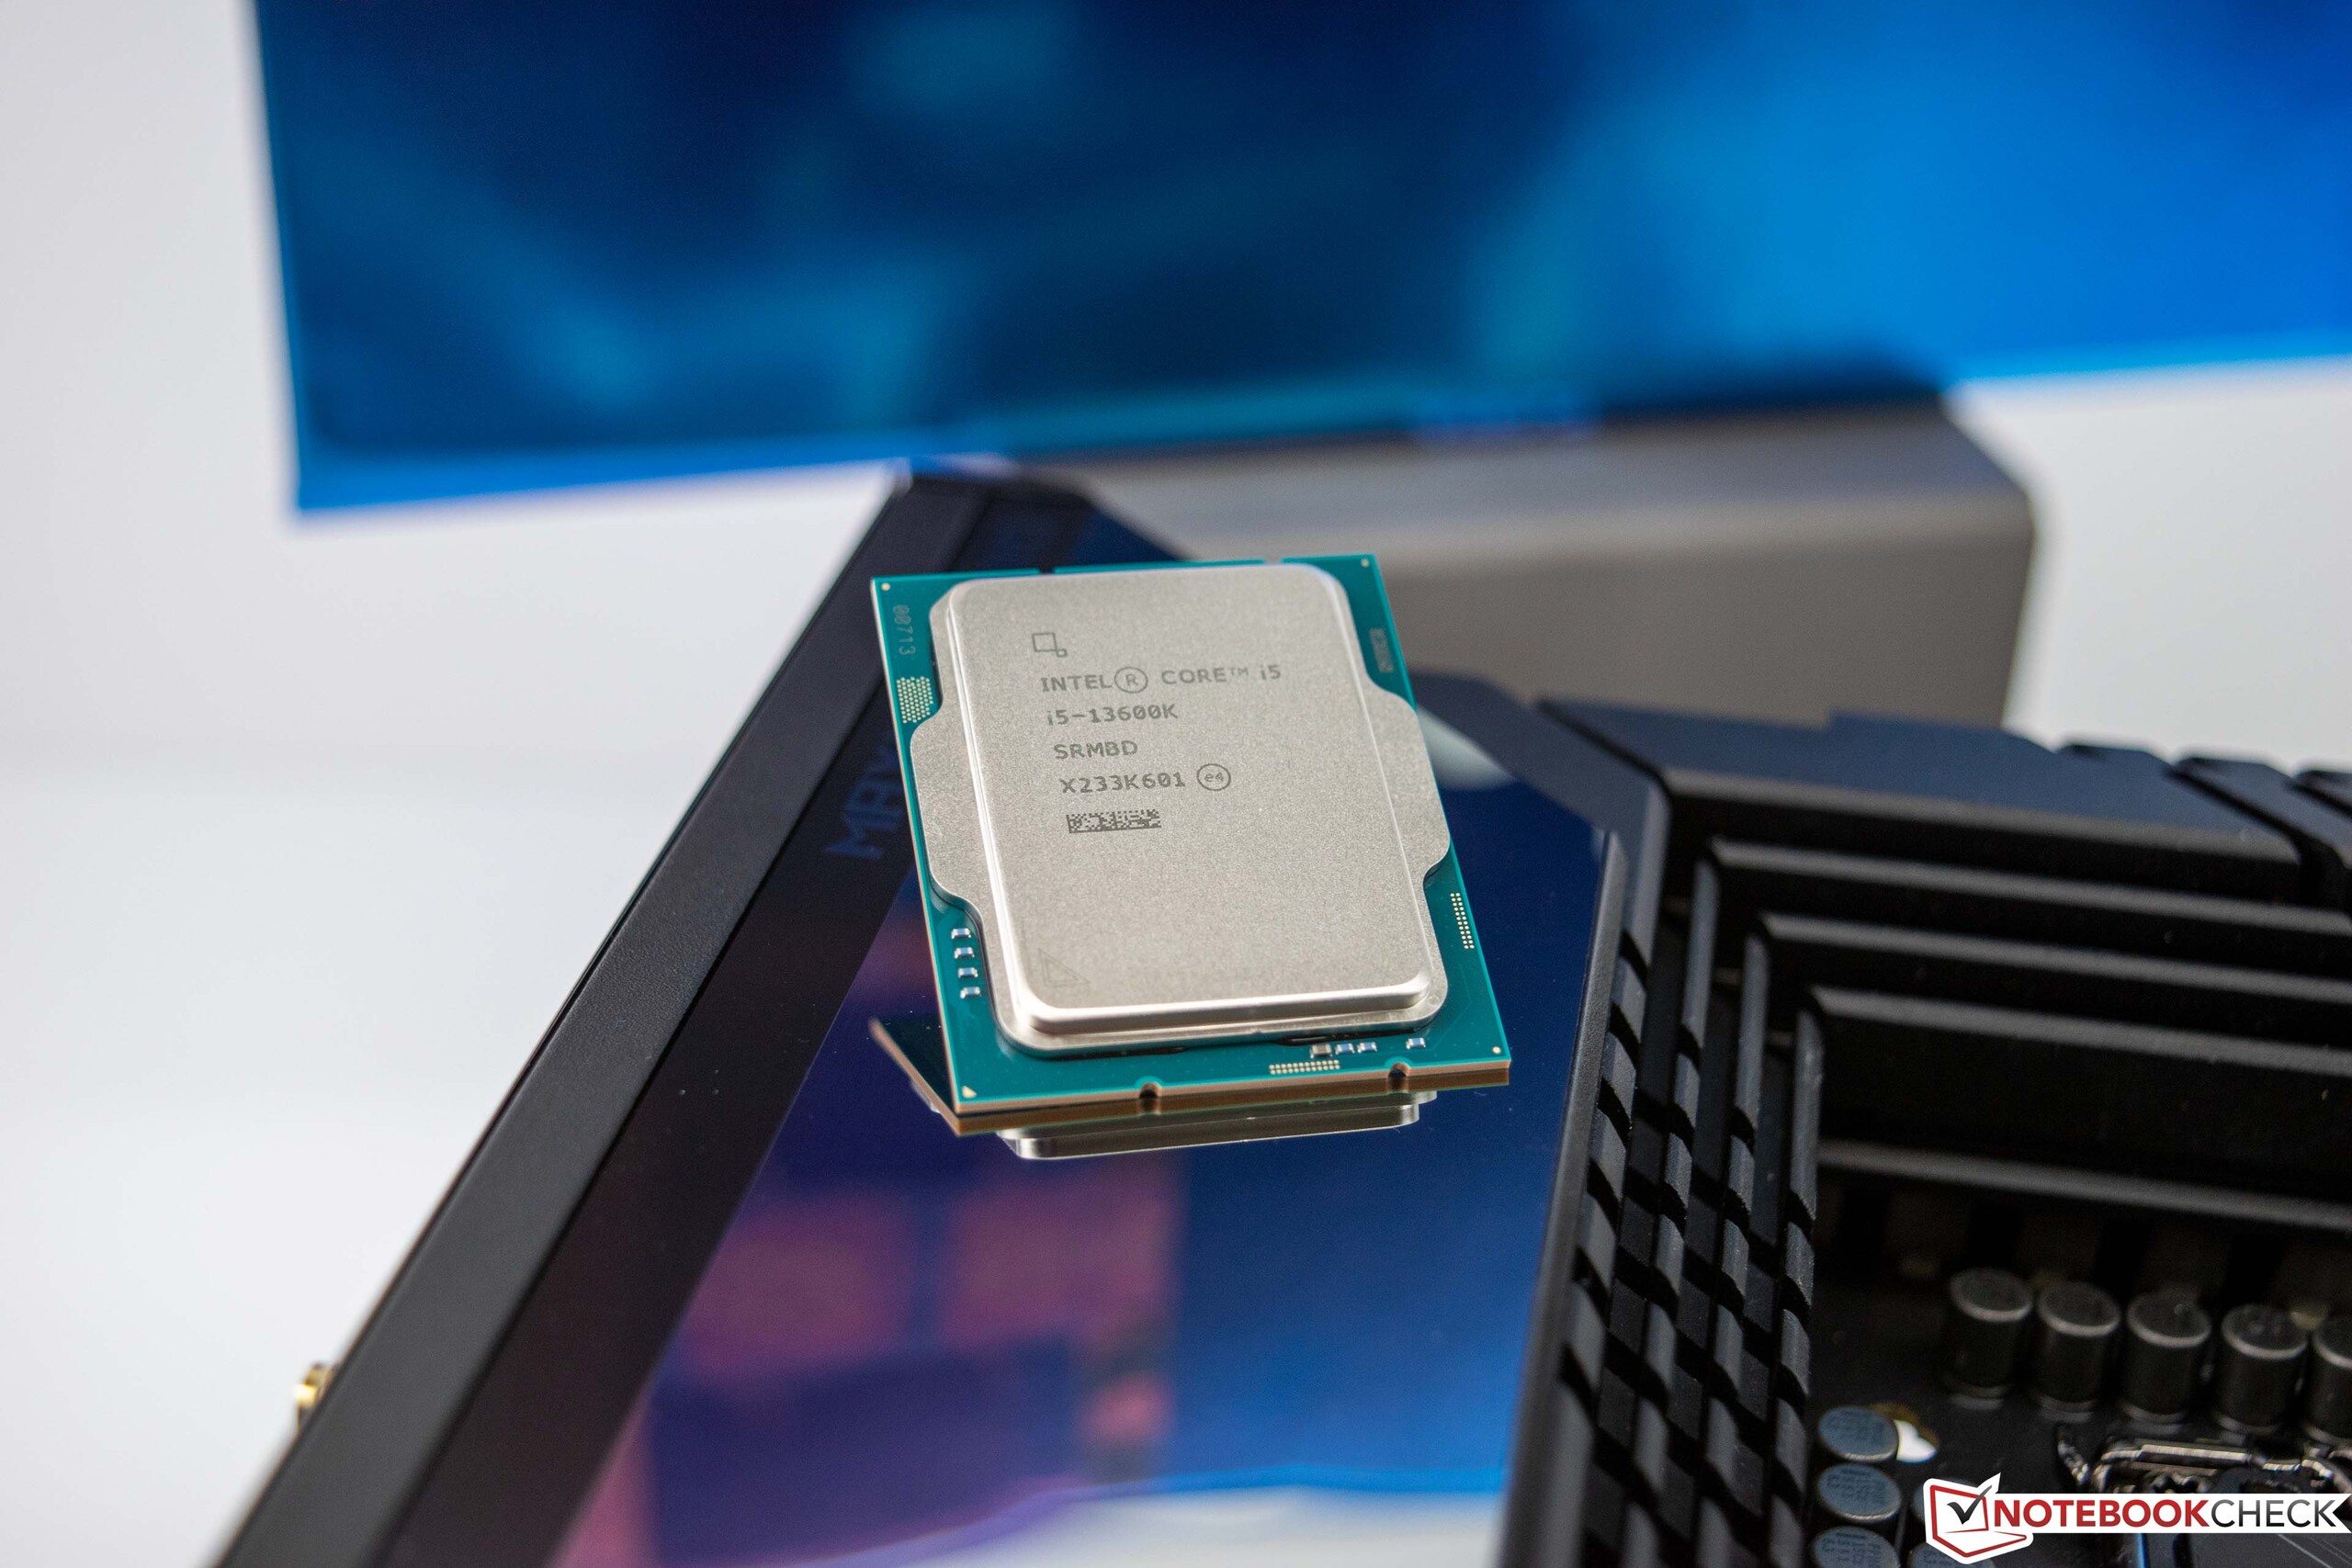
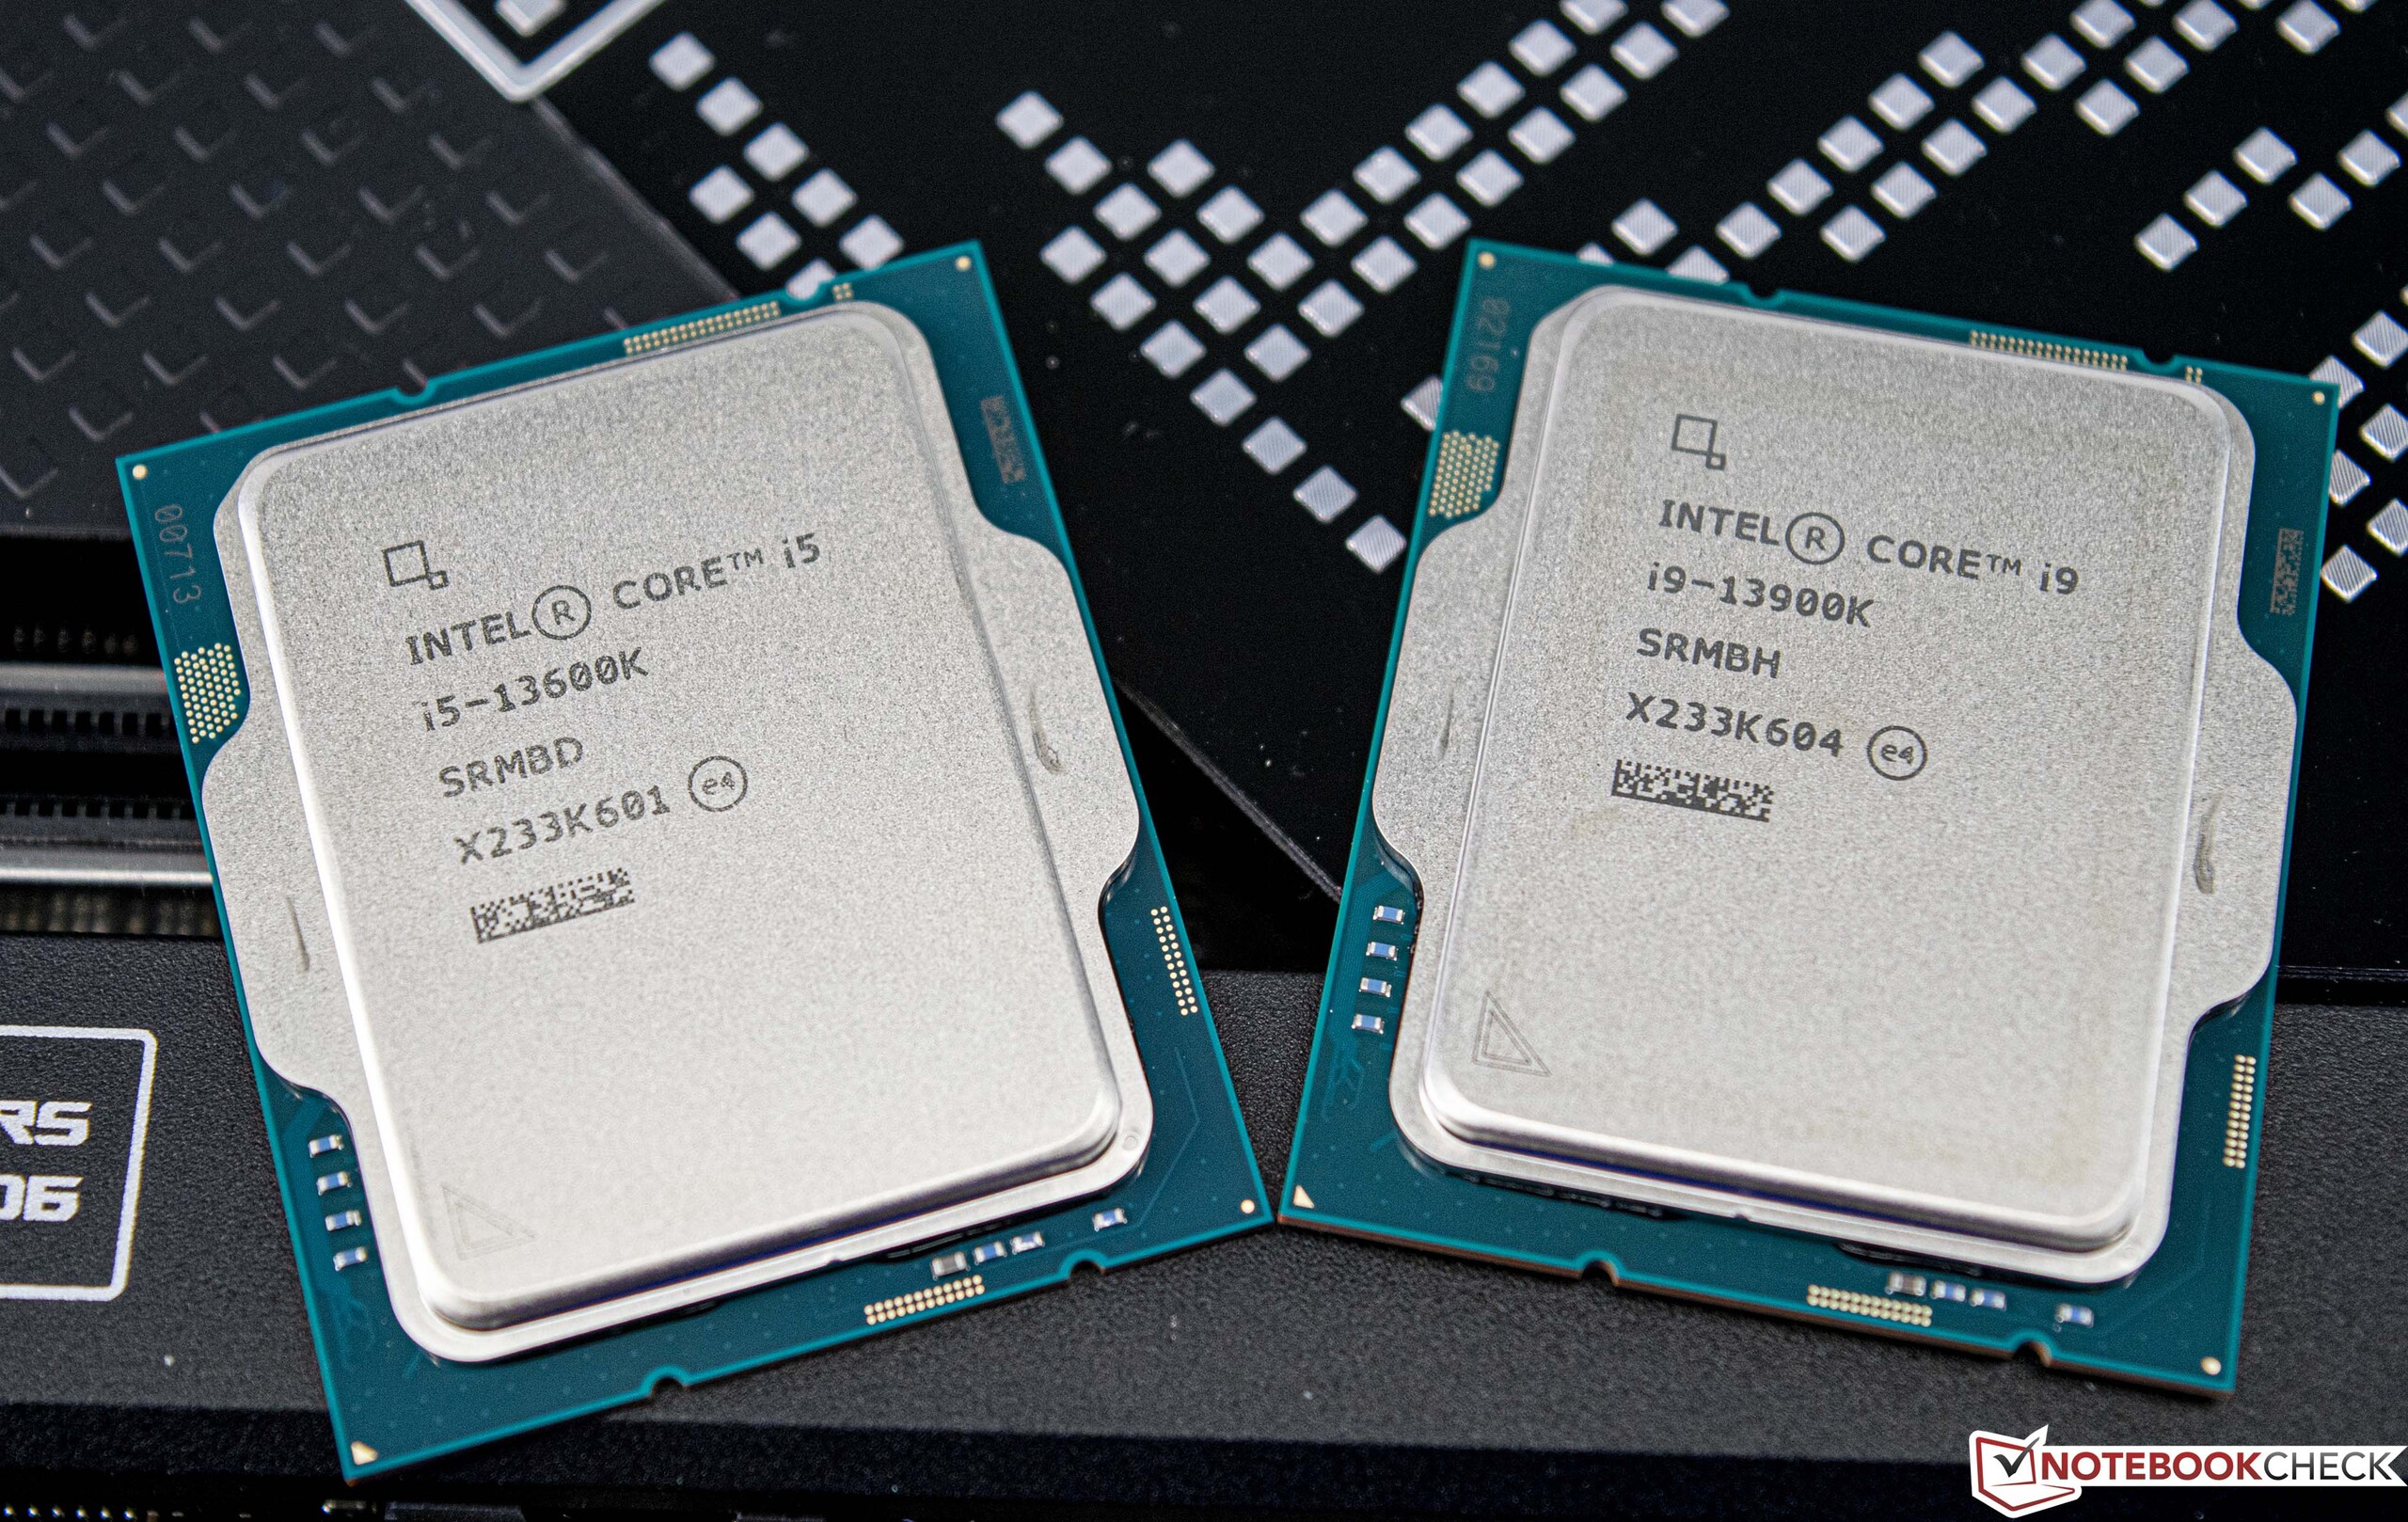
Test des Intel Core i9-13900K et i5-13600K : cœurs et vitesse en hausse avec Raptor Lake

Avec l'introduction des processeurs hybrides dans l'arène des ordinateurs de bureau, Intel a pu réaliser un saut de performance significatif l'année dernière. Pour la première fois, laPlateforme Alder Lakea utilisé des cœurs P et E pour améliorer la répartition des performances. AMD poursuit une approche différente avec son architecture chiplet et est également en mesure d'atteindre une très bonne performance à ce stade. Avec les processeurs Zen 4 récemment introduits, AMD a de nouveau été en mesure d'obtenir une augmentation significative des performances. Raptor Lake doit maintenant rattraper ce retard et permettre à Intel de regagner la couronne des performances.
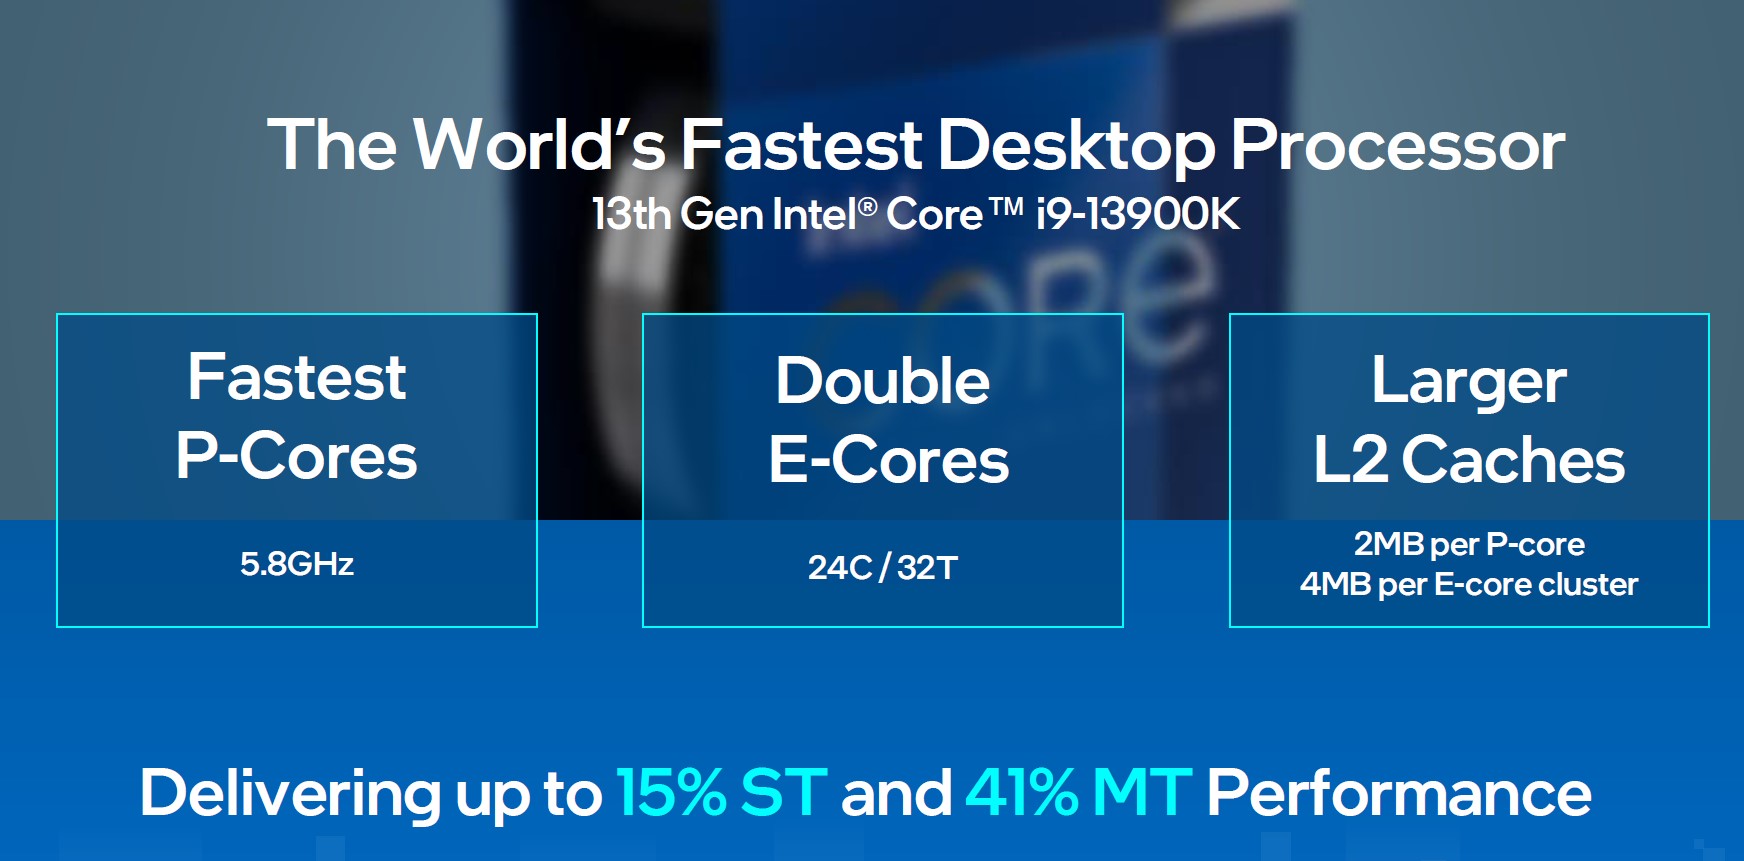
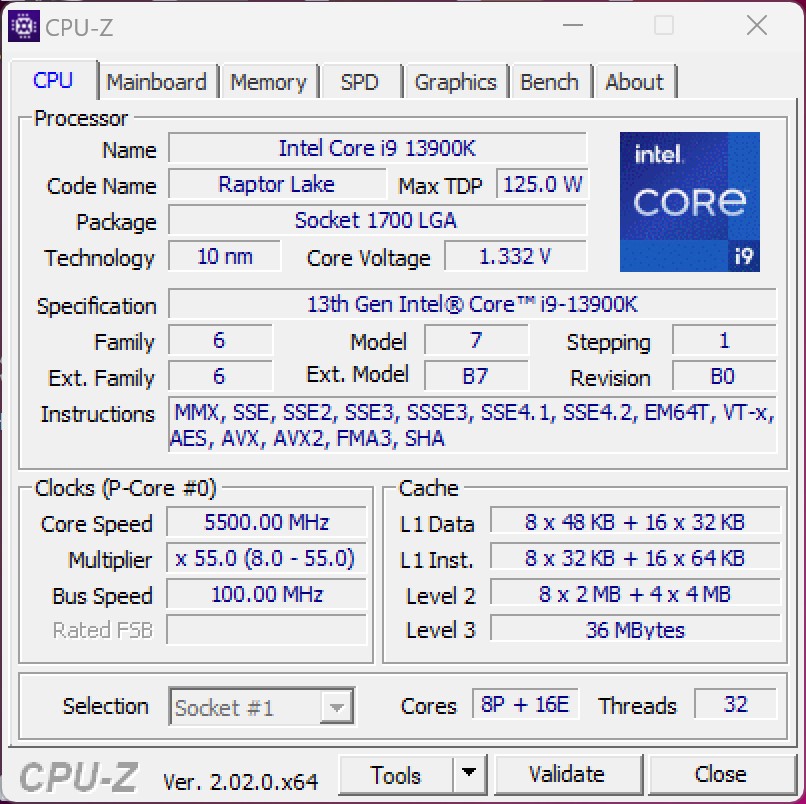
Intel reste fondamentalement fidèle au socket 1700 dans cette génération. Cependant, il y a encore de nombreux changements qui, en somme, se traduisent par un tête-à-tête avec le Ryzen 9 7950X d'AMD. Par exemple, le cache est nettement plus grand et il y a plus de threads au total et des cœurs P redessinés avec un IPC plus élevé. En outre, Intel a augmenté le turbo de 600 MHz pour atteindre un maximum de 5,8 GHz. Ces changements s'appliquent à toute la gamme de la nouvelle série Raptor Lake.
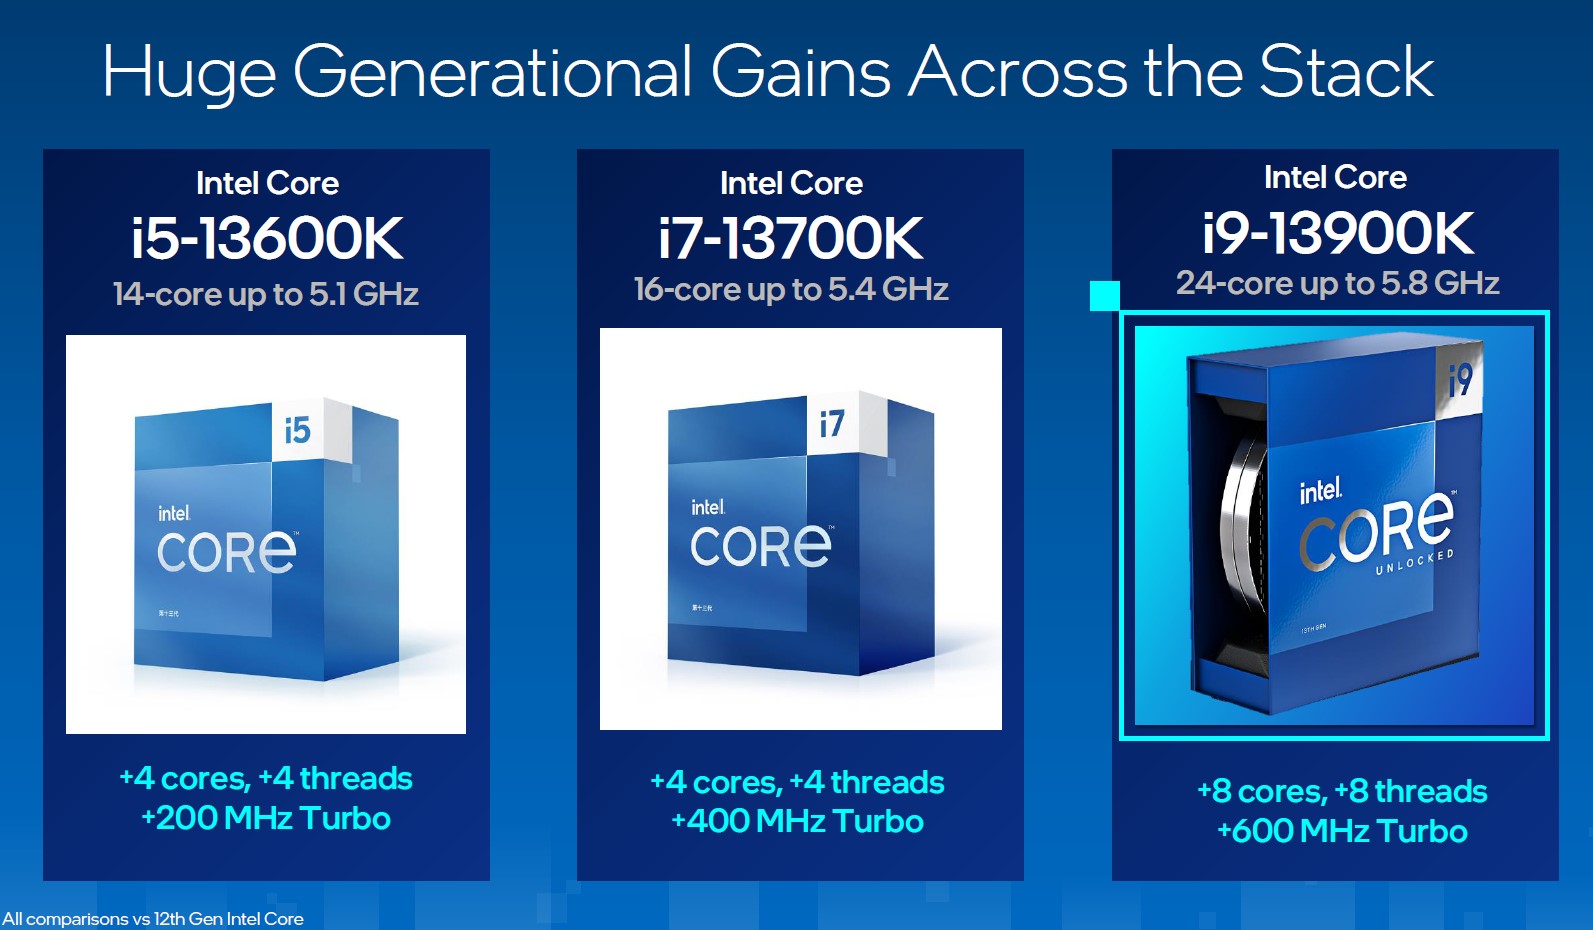
Nous listons pour vous les représentants les plus importants de la nouvelle famille Raptor Lake S dans le tableau ci-dessous.
Bien qu'Intel suive la série Alder Lake en termes de prix, le faible taux de change actuel entre l'euro et le dollar américain fera que les prix des nouveaux processeurs sembleront subjectivement plus chers.
les processeurs Intel Core de 13e génération en un coup d'œil
| Modèle | Cœurs / Threads |
Vitesse d'horloge P Core / Turbo | Vitesse d'horloge E Core / Turbo | Cache L2 + L3 | Graphique | PBP | MTB | Prix (MSRP) |
| Core i9-13900K | 16 (8P + 16E) /32 | 3,0 GHz / 5,8 GHz | 2,2 GHz / 4,3 GHz | 32 + 36 Mo | UHD 770 | 125 Watt | 253 Watt | 589 |
| Core i9-13900KF | 16 (8P + 16E) /32 | 3,0 GHz / 5,8 GHz | 2,2 GHz / 4,3 GHz | 32 + 36 Mo | - | 125 Watt | 253 Watt | $564 |
| Core i9-12900K | 16 (8P + 8E) /24 | 3,2 GHz / 5,1 GHz | 2,4 GHz / 3,9 GHz | 14 + 30 Mo | UHD 770 | 125 Watt | 241 Watt | 589 |
| Core i9-12900KF | 16 (8P + 8E) /24 | 3,2 GHz / 5,1 GHz | 2,4 GHz / 3,9 GHz | 14 + 30 Mo | - | 125 Watt | 241 Watt | $564 |
| Core i7-13700K | 16 (8P + 8E) /24 | 3,4 GHz / 5,4 GHz | 2,5 GHz / 4,2 GHz | 24 + 30 Mo | UHD 770 | 125 Watt | 253 Watt | $409 |
| Core i7-13700KF | 16 (8P + 8E) /24 | 3,4 GHz / 5,4 GHz | 2,5 GHz / 4,2 GHz | 24 + 30 Mo | - | 125 Watt | 253 Watt | $384 |
| Core i7-12700K | 12 (8P + 4E) /20 | 3,6 GHz / 4,9 GHz | 2,7 GHz / 3,8 GHz | 12 + 25 Mo | UHD 770 | 125 Watt | 190 Watt | $409 |
| Core i7-12700KF | 12 (8P + 4E) /20 | 3,6 GHz / 4,9 GHz | 2,7 GHz / 3,8 GHz | 12 + 25 Mo | - | 125 Watt | 190 Watt | $384 |
| Core i5-13600K | 14 (6P + 8E) /20 | 3,5 GHz / 5,1 GHz | 2,6 GHz / 3,9 GHz | 20 + 24 Mo | UHD 770 | 125 Watt | 181 Watt | $319 |
| Core i5-13600KF | 14 (6P + 8E) /20 | 3,5 GHz / 5,1 GHz | 2,6 GHz / 3,9 GHz | 20 + 24 Mo | - | 125 Watt | 181 Watt | $294 |
| Core i5-12600K | 10 (6P + 4E) /16 | 3,7 GHz / 4,9 GHz | 2,8 GHz / 3,6 GHz | 9,5 + 20 Mo | UHD 770 | 125 Watt | 150 Watt | $289 |
| Core i5-12600KF | 10 (6P + 4E) /16 | 3,7 GHz / 4,9 GHz | 2,8 GHz / 3,6 GHz | 9,5 + 20 Mo | - | 125 Watt | 150 Watt | $264 |
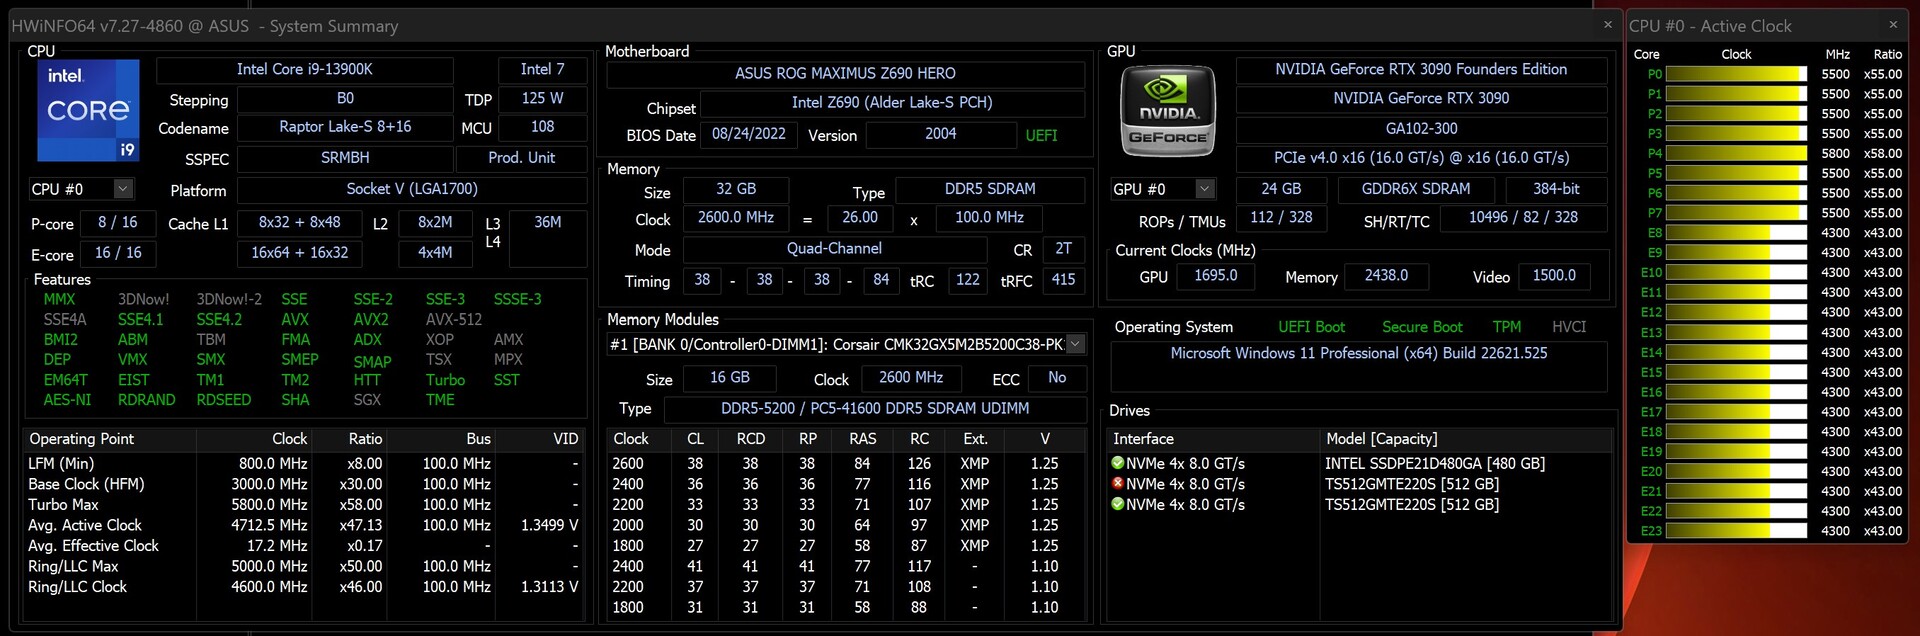
Détails de notre système de test
Nous utilisons le système suivant pour les benchmarks et les tests ci-dessous :
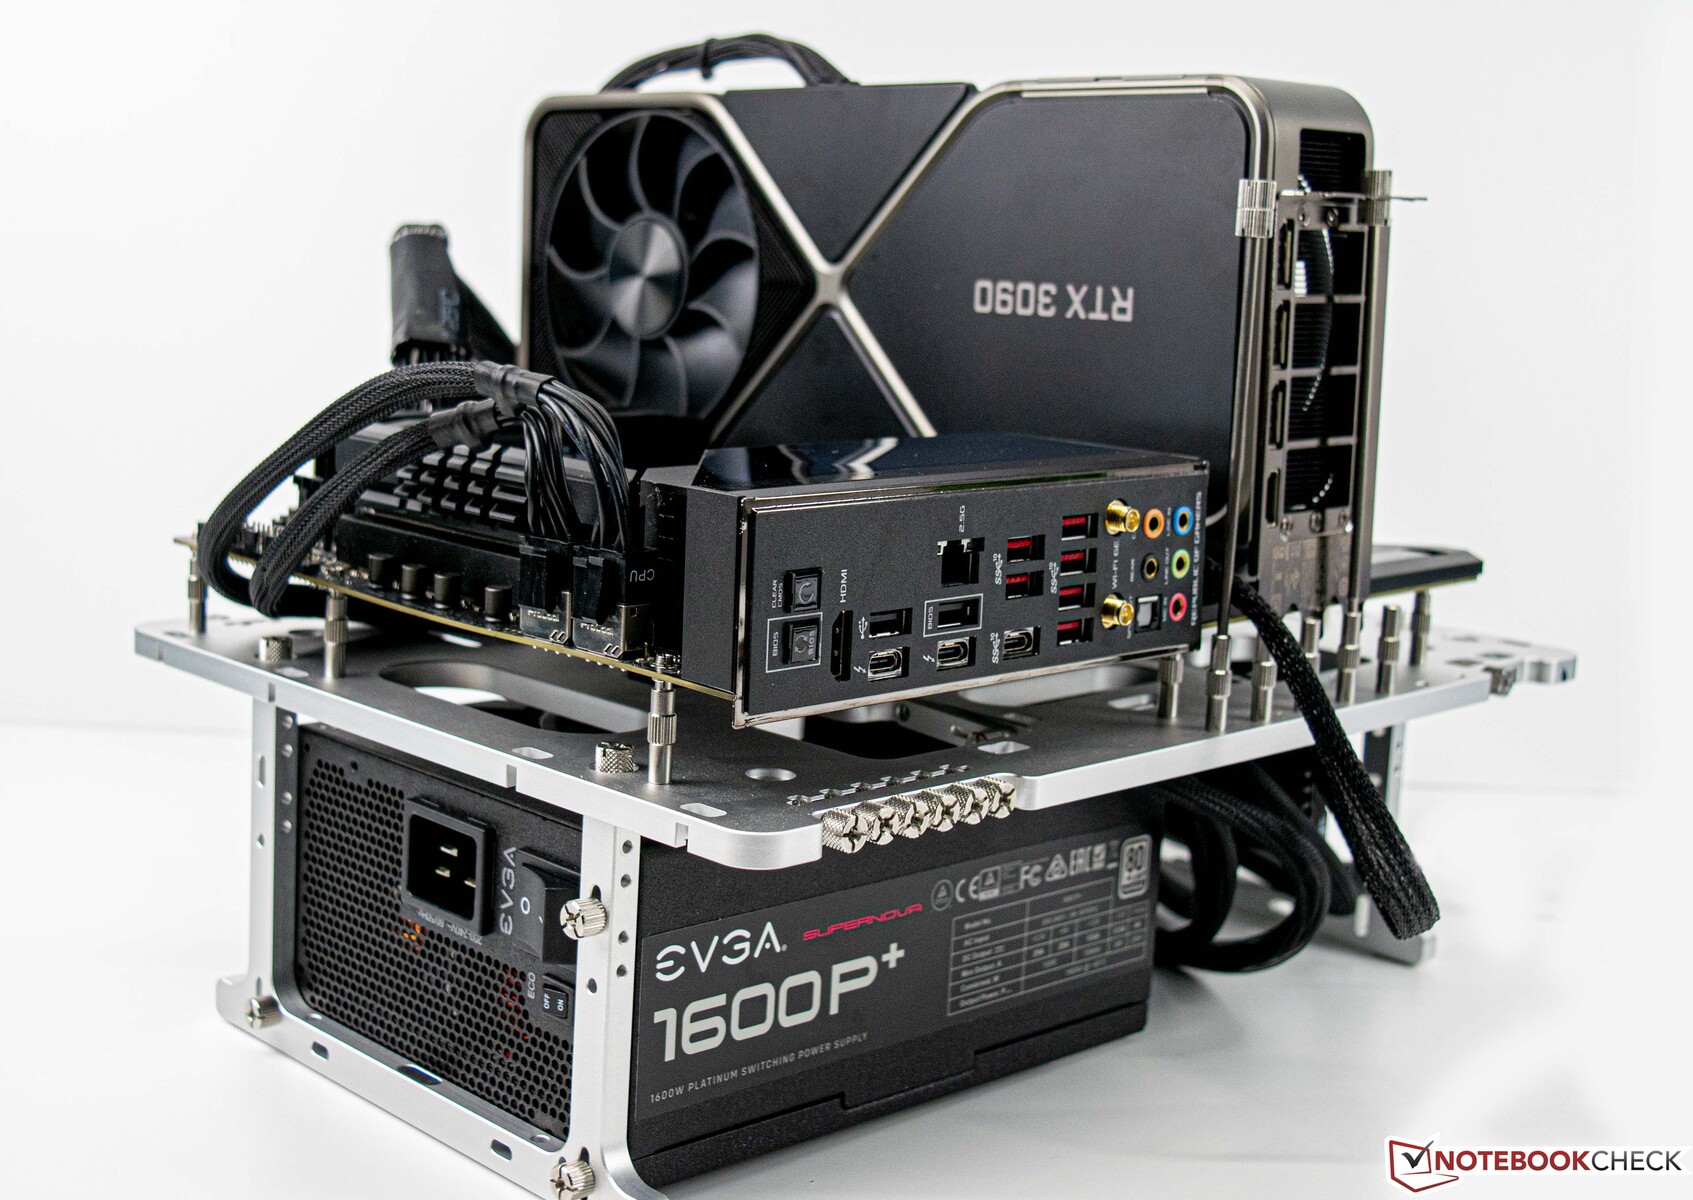
- Table de banc ouverte Streacom BC1 V2
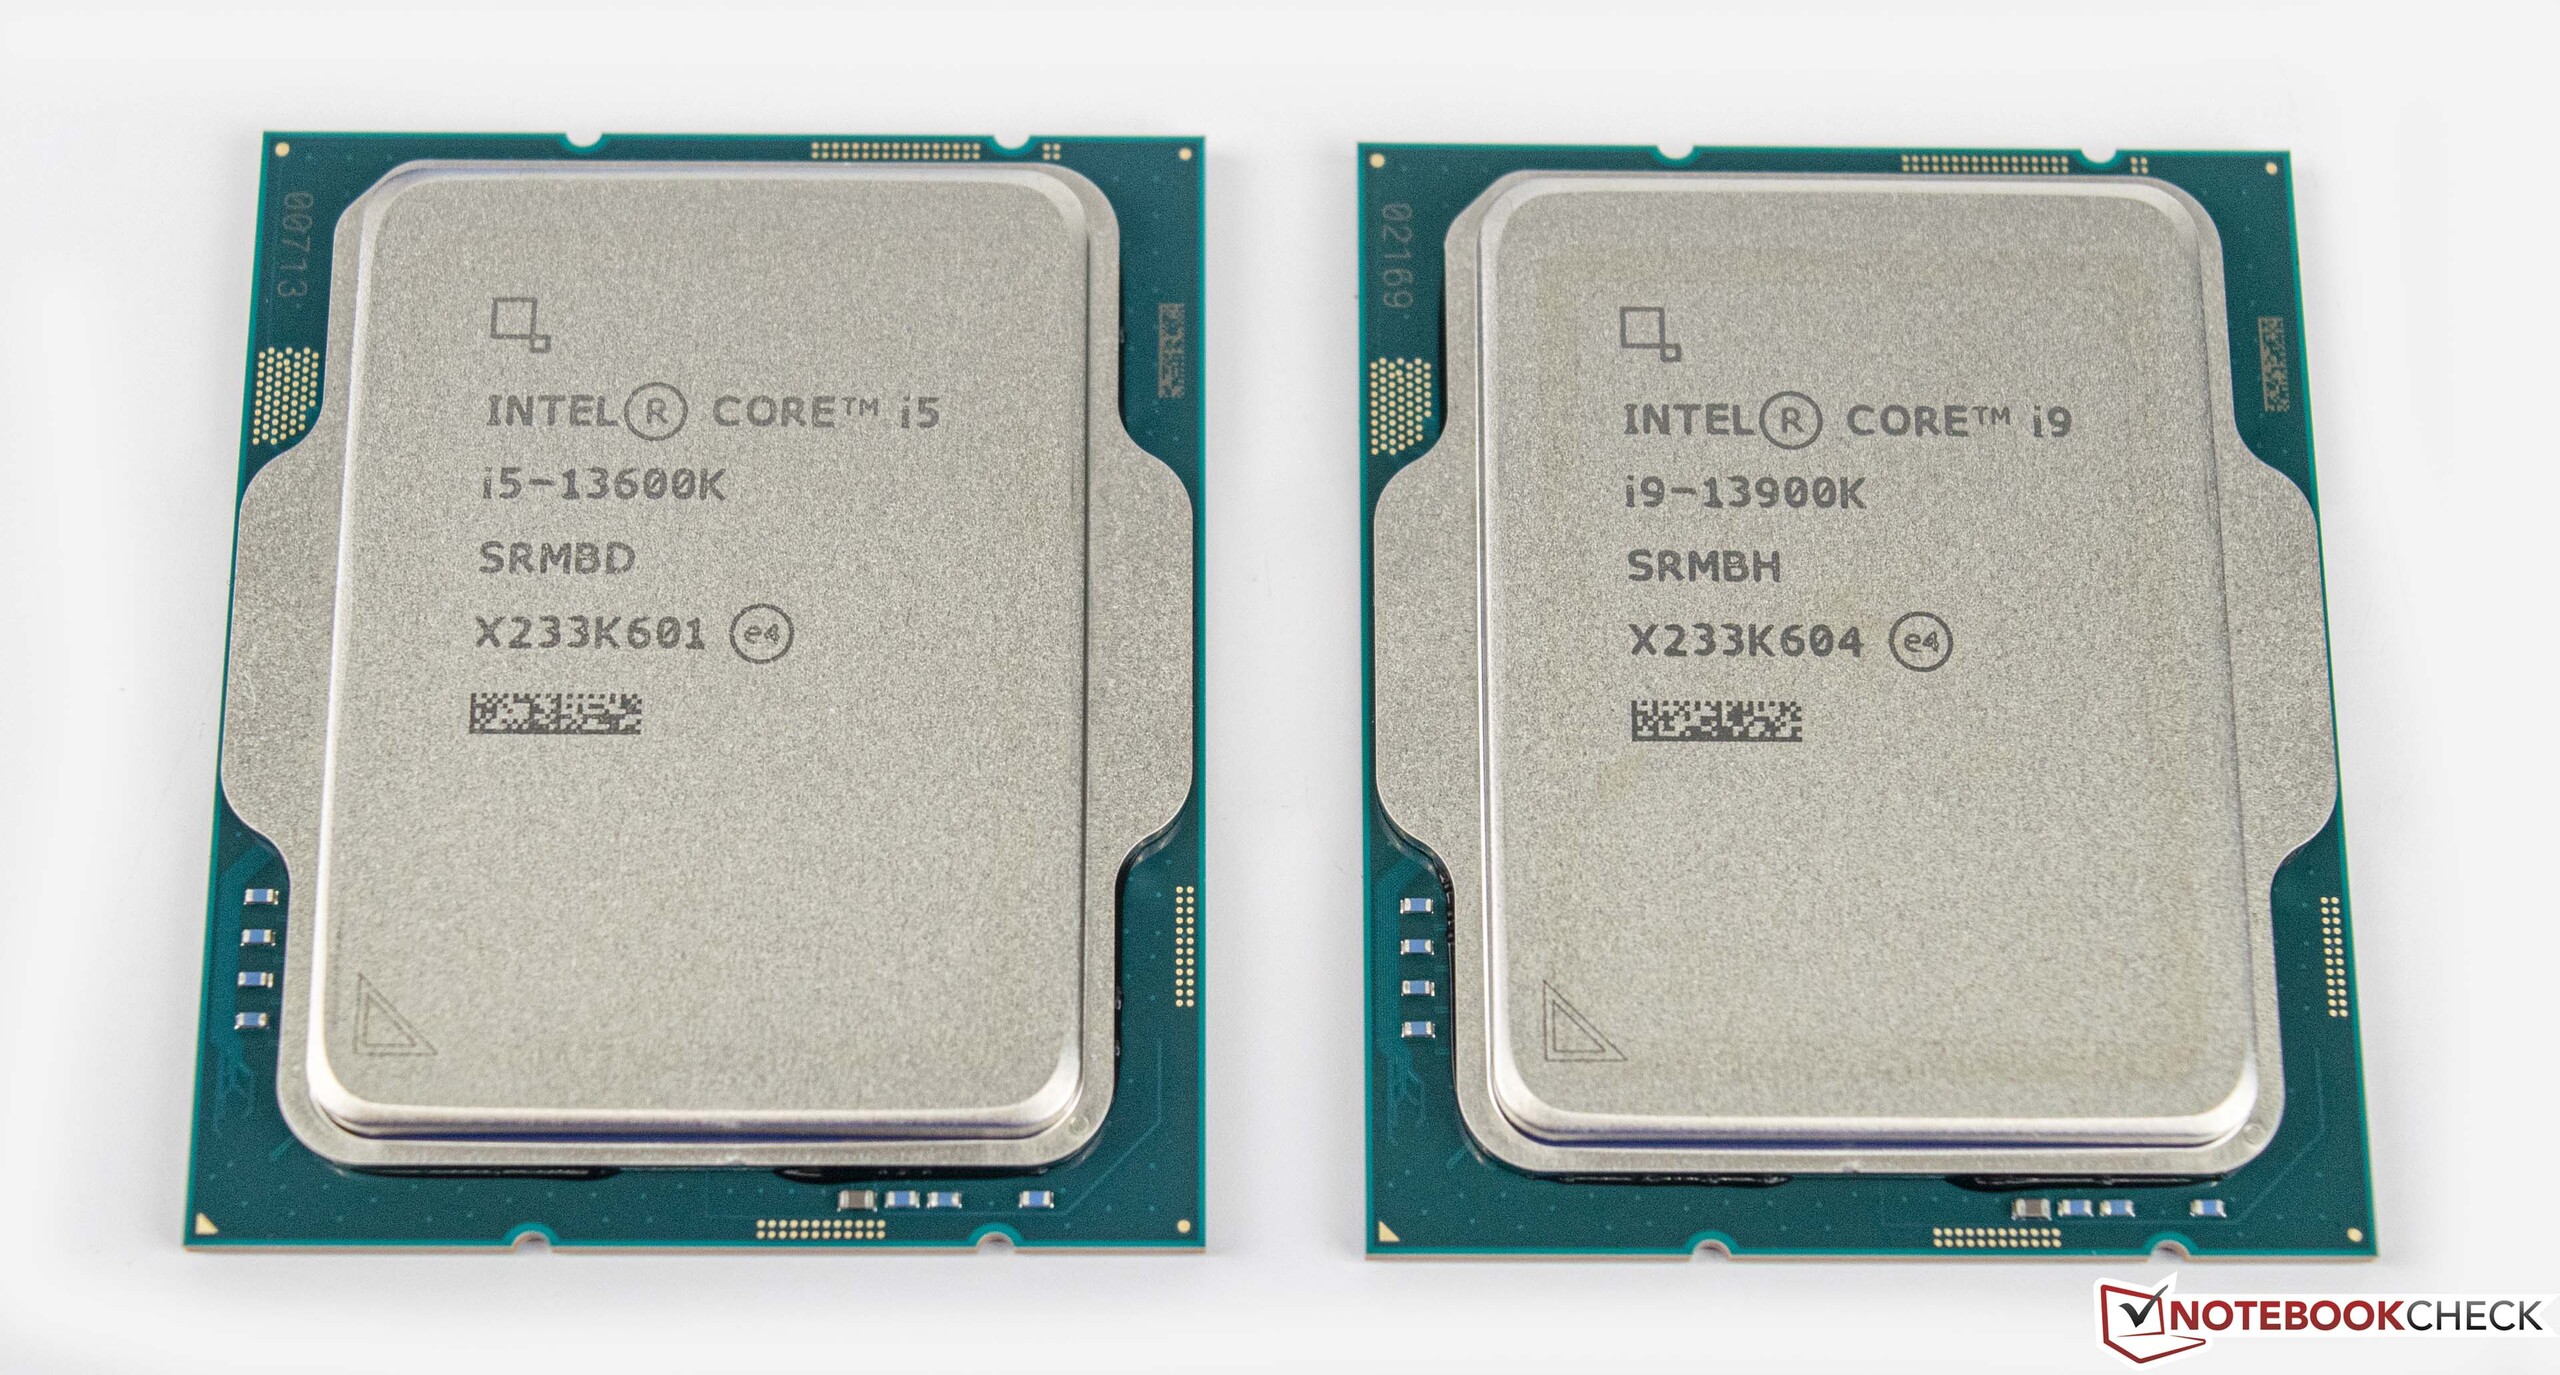
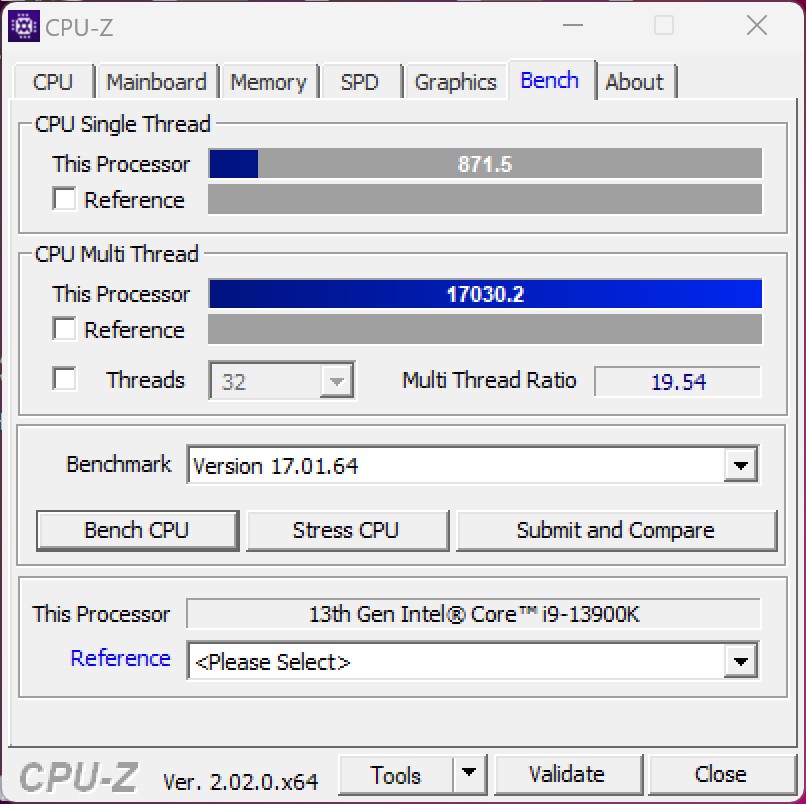
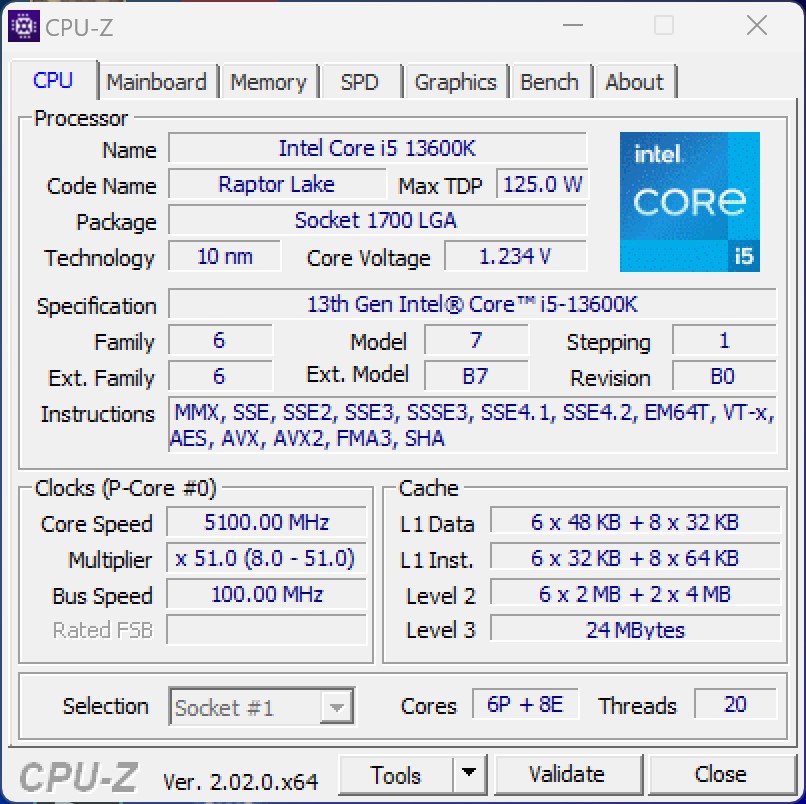
- Intel Core i9-13900K, Intel Core i5-13600K
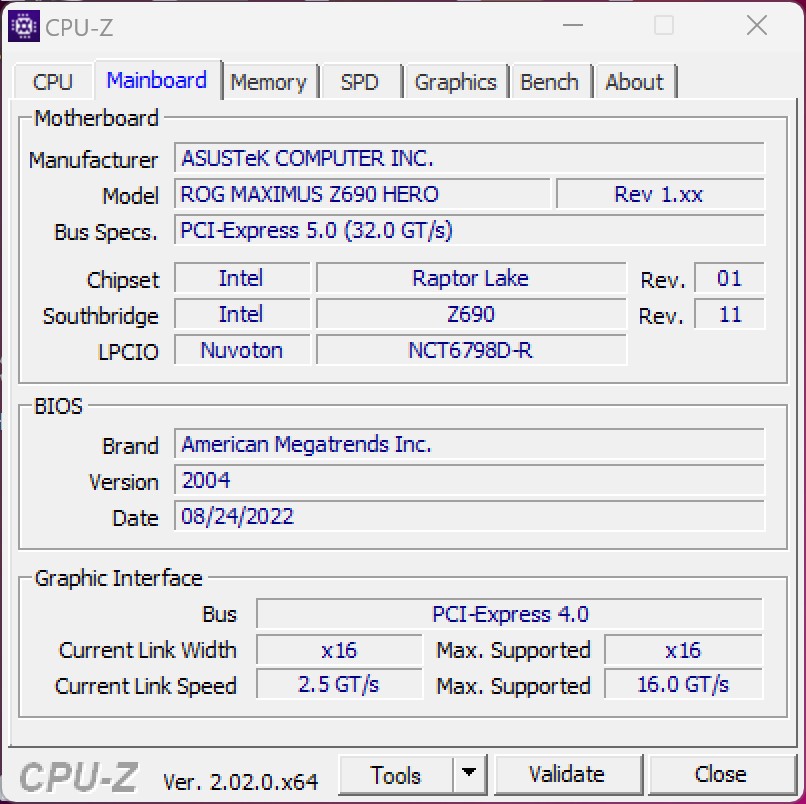
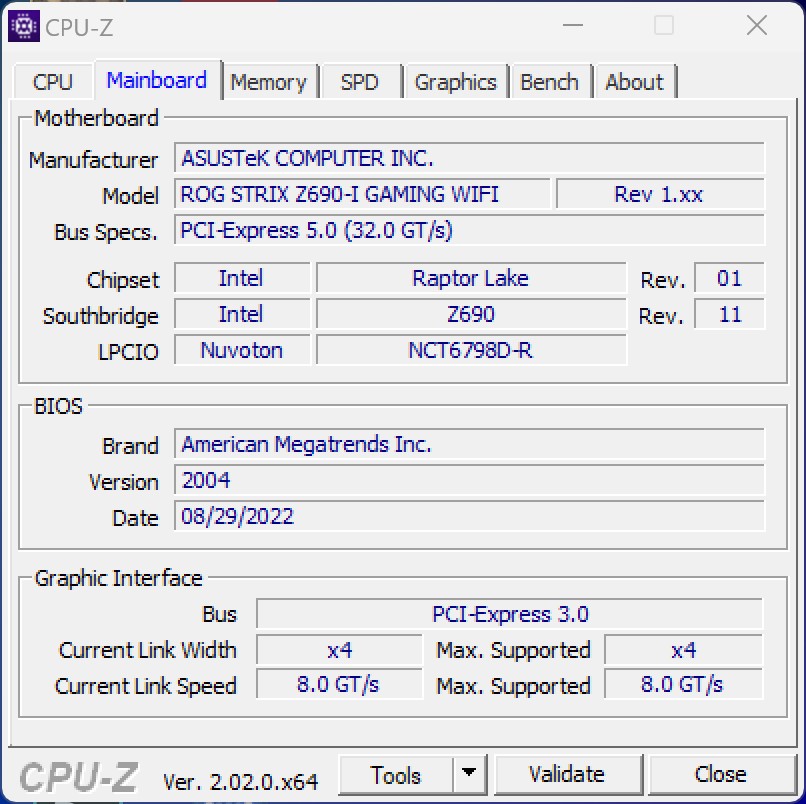
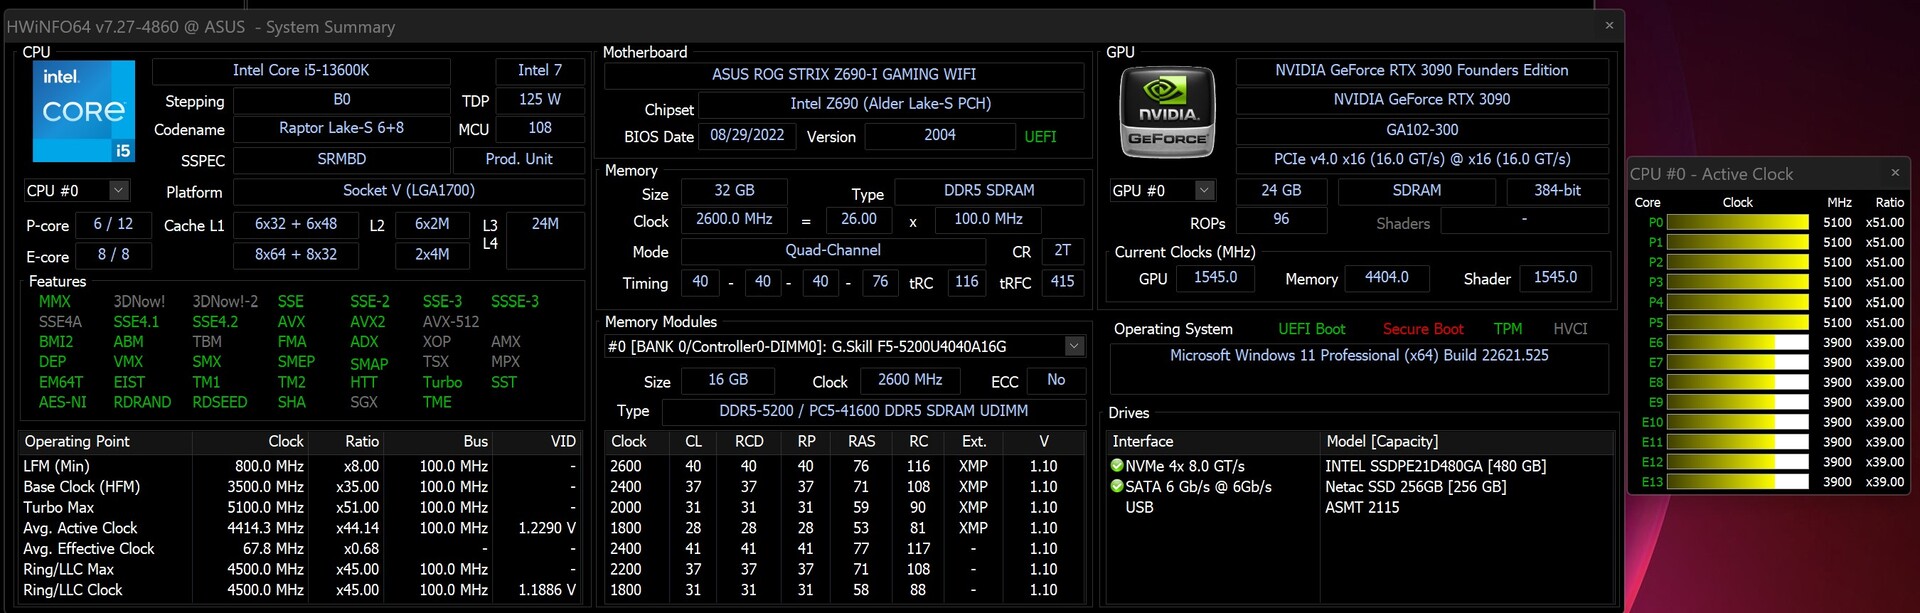
- Asus ROG Maximus Z690 Hero (BIOS v2004) / Asus ROG Strix Z690-I Gaming WiFi (BIOS v2004)
- Refroidissement par eau en boucle personnalisée (Pompe : Alphacool Aquastream XT Ultra, Radiateur : EK MO-RA3 420 LT BLACK)
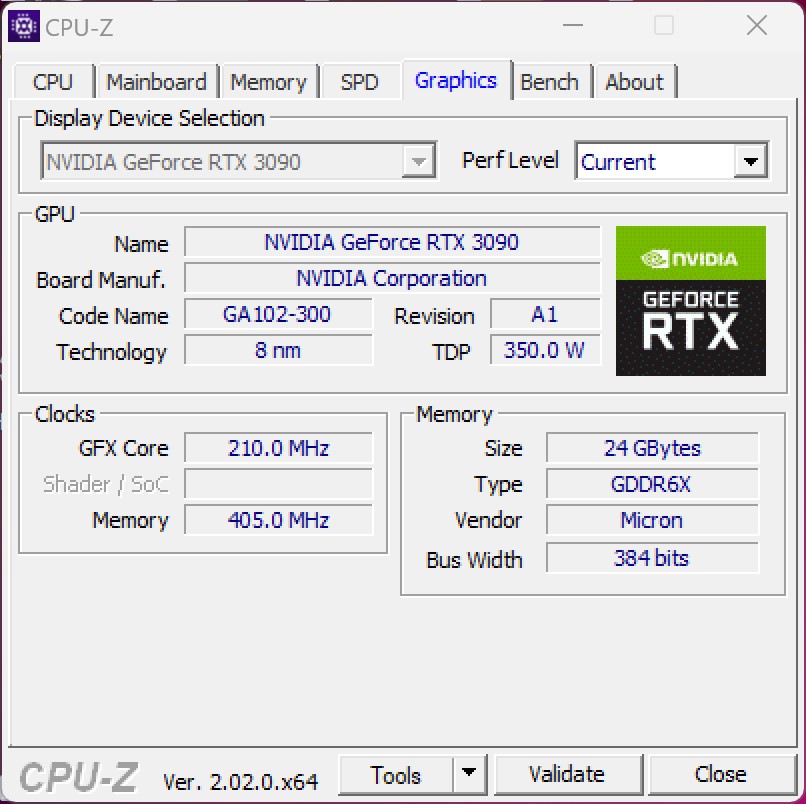
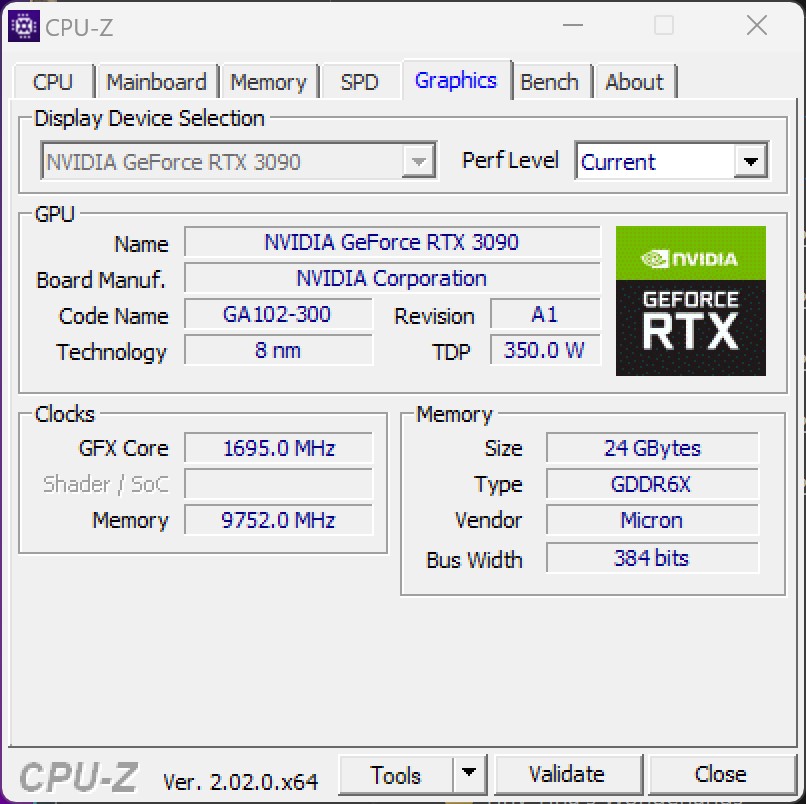
- Nvidia GeForce RTX 3090 Founders Edition (driver : 517.48)
- EVGA SuperNOVA P+ 1600W
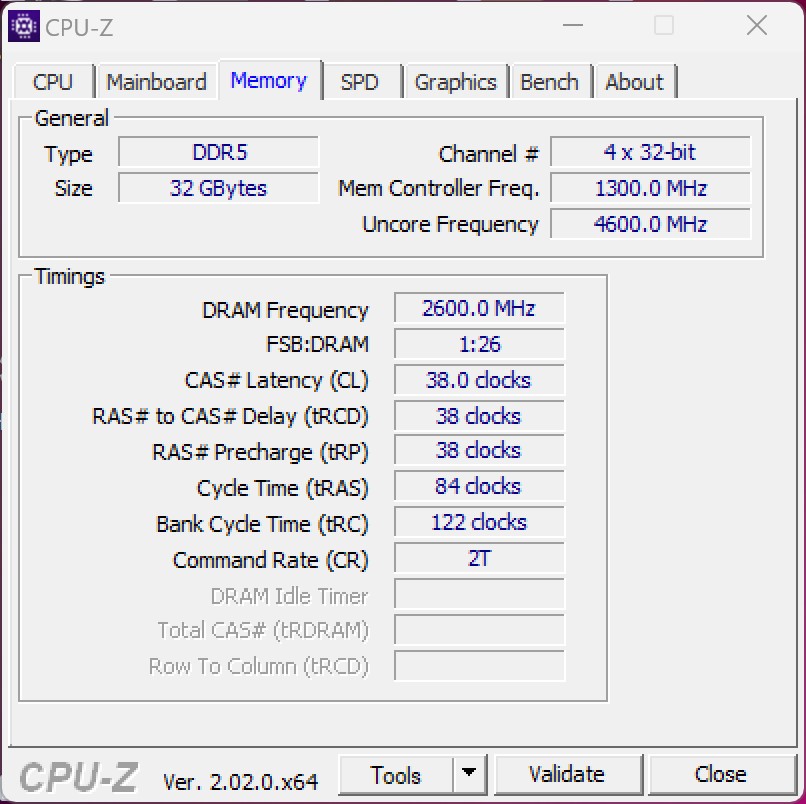
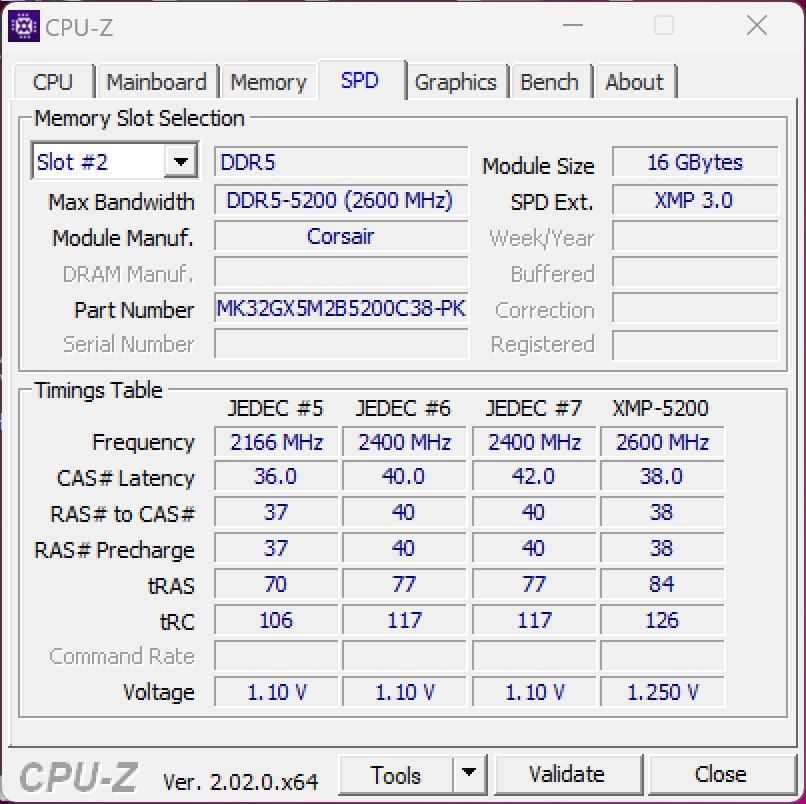
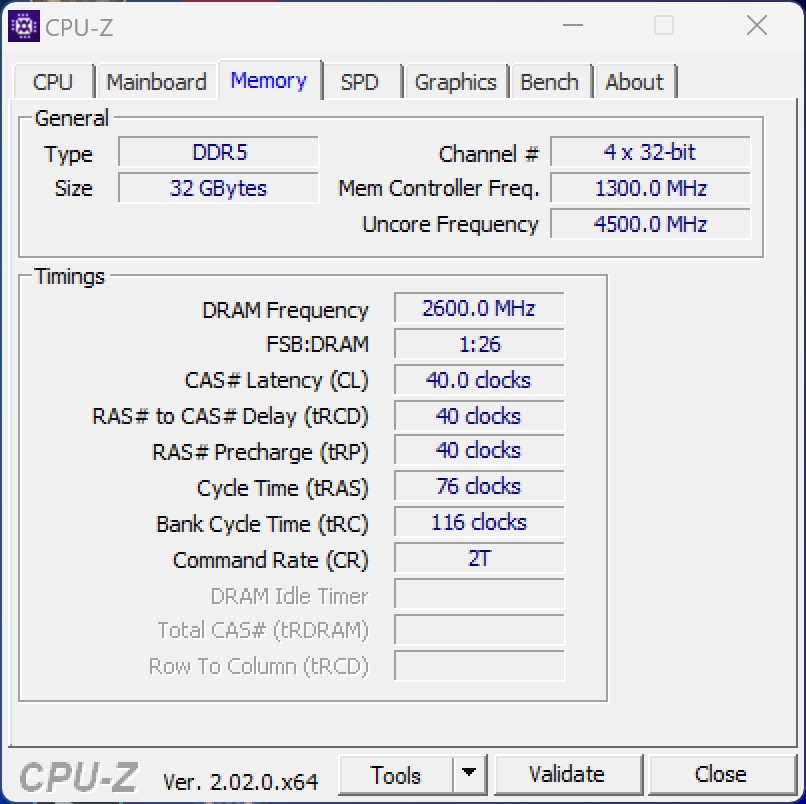
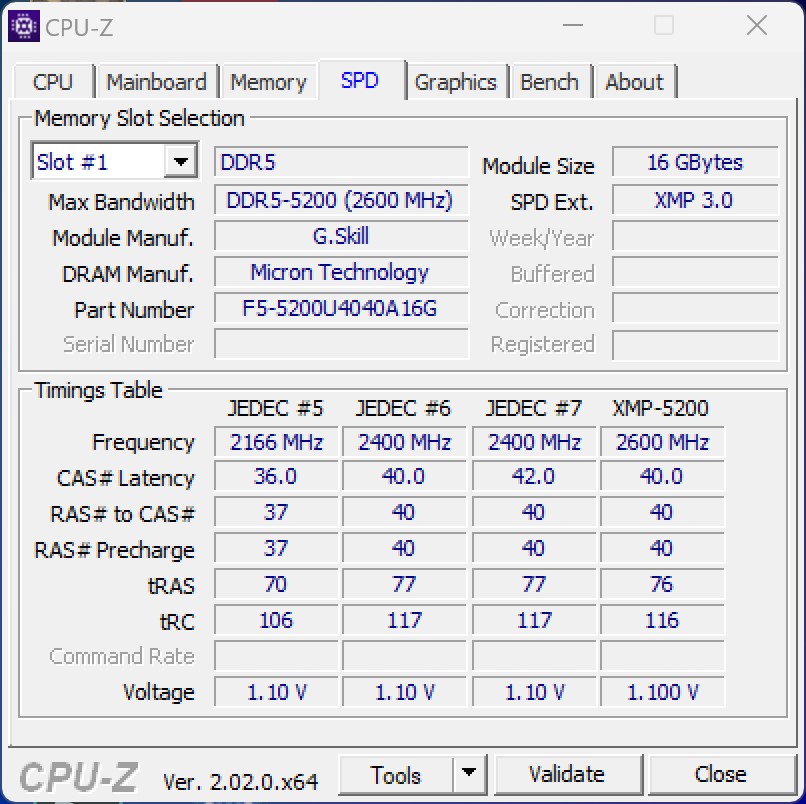
- G.Skill Ripjaws S5 (2x 16 GB - DDR5-5200)
- Intel Optane 905p (480 GB système + benchmarks)
- Microsoft Windows 11 Professional 64 Bit (Version 22H2)
Conditions de test - Z690 utilisable après la mise à jour du BIOS
Pour ce test, nous utilisons le Asus ROG Maximus Z690 Hero, qui a déjà été utilisé lors du lancement d'Alder Lake S. Néanmoins, avec le nouveau chipset Z790, il y aura des cartes mères mises à jour qui supporteront la 12e ainsi que la 13e génération des processeurs Intel. Cependant, vous devez garder à l'esprit que la série Intel Rocket Lake sera probablement la dernière génération à utiliser le socket 1700.
Tous les tests sont effectués avec le BIOS le plus récent et le profil XMP activé. En outre, toutes les limitations de puissance sont désactivées afin d'obtenir les pleines performances des processeurs.
Note :
En raison de certains problèmes avec l'Asus ROG Maximus Z690 Hero pendant nos tests, nous avons dû utiliser l'Asus ROG Strix Z690-I Gaming WiFi à la place pour tous les benchmarks avec l'Intel Core i5-13600K. Une brève comparaison des performances avec l'Asus ROG Maximus Z690 Hero n'a pas montré de différences significatives. Après avoir parlé à Asus, nous avons pu déterminer qu'il y avait un problème avec le BIOS de la version utilisée jusqu'alors. Asus a réagi immédiatement et a remédié aux problèmes avec la version 2103.
Bancs d'essai des processeurs
Par rapport aux anciens processeurs Alder Lake S, l'augmentation des performances est énorme dans tous les domaines. L'augmentation de l'IPC s'accompagne d'une vitesse de Boost nettement plus élevée, ce qui, par voie de conséquence, suffit également pour une augmentation de 19 % des performances du Intel Core i9-13900K par rapport au Intel Core i9-12900K. Dans les comparaisons individuelles, des hausses de performances allant jusqu'à 49 % sont même possibles. Avec le plus petit modèle Core-i5, on mesure une augmentation des performances de 14% par rapport à l'ancien échantillon Alder Lake
Dans le duel des meilleurs modèles, l'Intel Core i9-13900K se place juste devant l'AMD Ryzen 9 7950X. Subjectivement, les deux modèles supérieurs fonctionnent à hauteur d'yeux, mais nous constatons tout de même que dans certains tests, Intel est en tête, et dans d'autres, AMD. À titre d'exemple, nous pouvons prendre le 3DMark, où le processeur Intel est nettement en avance sur les modèles AMD en termes de benchmarks CPU. D'autre part, AMD est capable de marquer des points dans le test wPrime, où Intel est clairement laissé derrière.
Le petit Intel Core i5-13600K rivalise avec le AMD Ryzen 5 7600X. Ici, le nombre nettement plus élevé de threads (20 contre 12) est la clé de son succès. Toutefois, un avantage de 7 % dans le classement des performances n'est pas très significatif. Mais les deux processeurs restent comparables, puisqu'ils appartiennent tous deux à la même classe de prix.
Pour être complet, nous avons également effectué tous les tests CPU avec le PL2 activé. Comme vous pouvez le voir dans les résultats, il n'y a aucun inconvénient si vous fixez la limite de puissance. De meilleures valeurs sont même possibles dans les pièces, puisque les CPU n'atteignent pas de températures critiques ici.
Vous pouvez trouver des benchmarks supplémentaires sur les processeurs ici
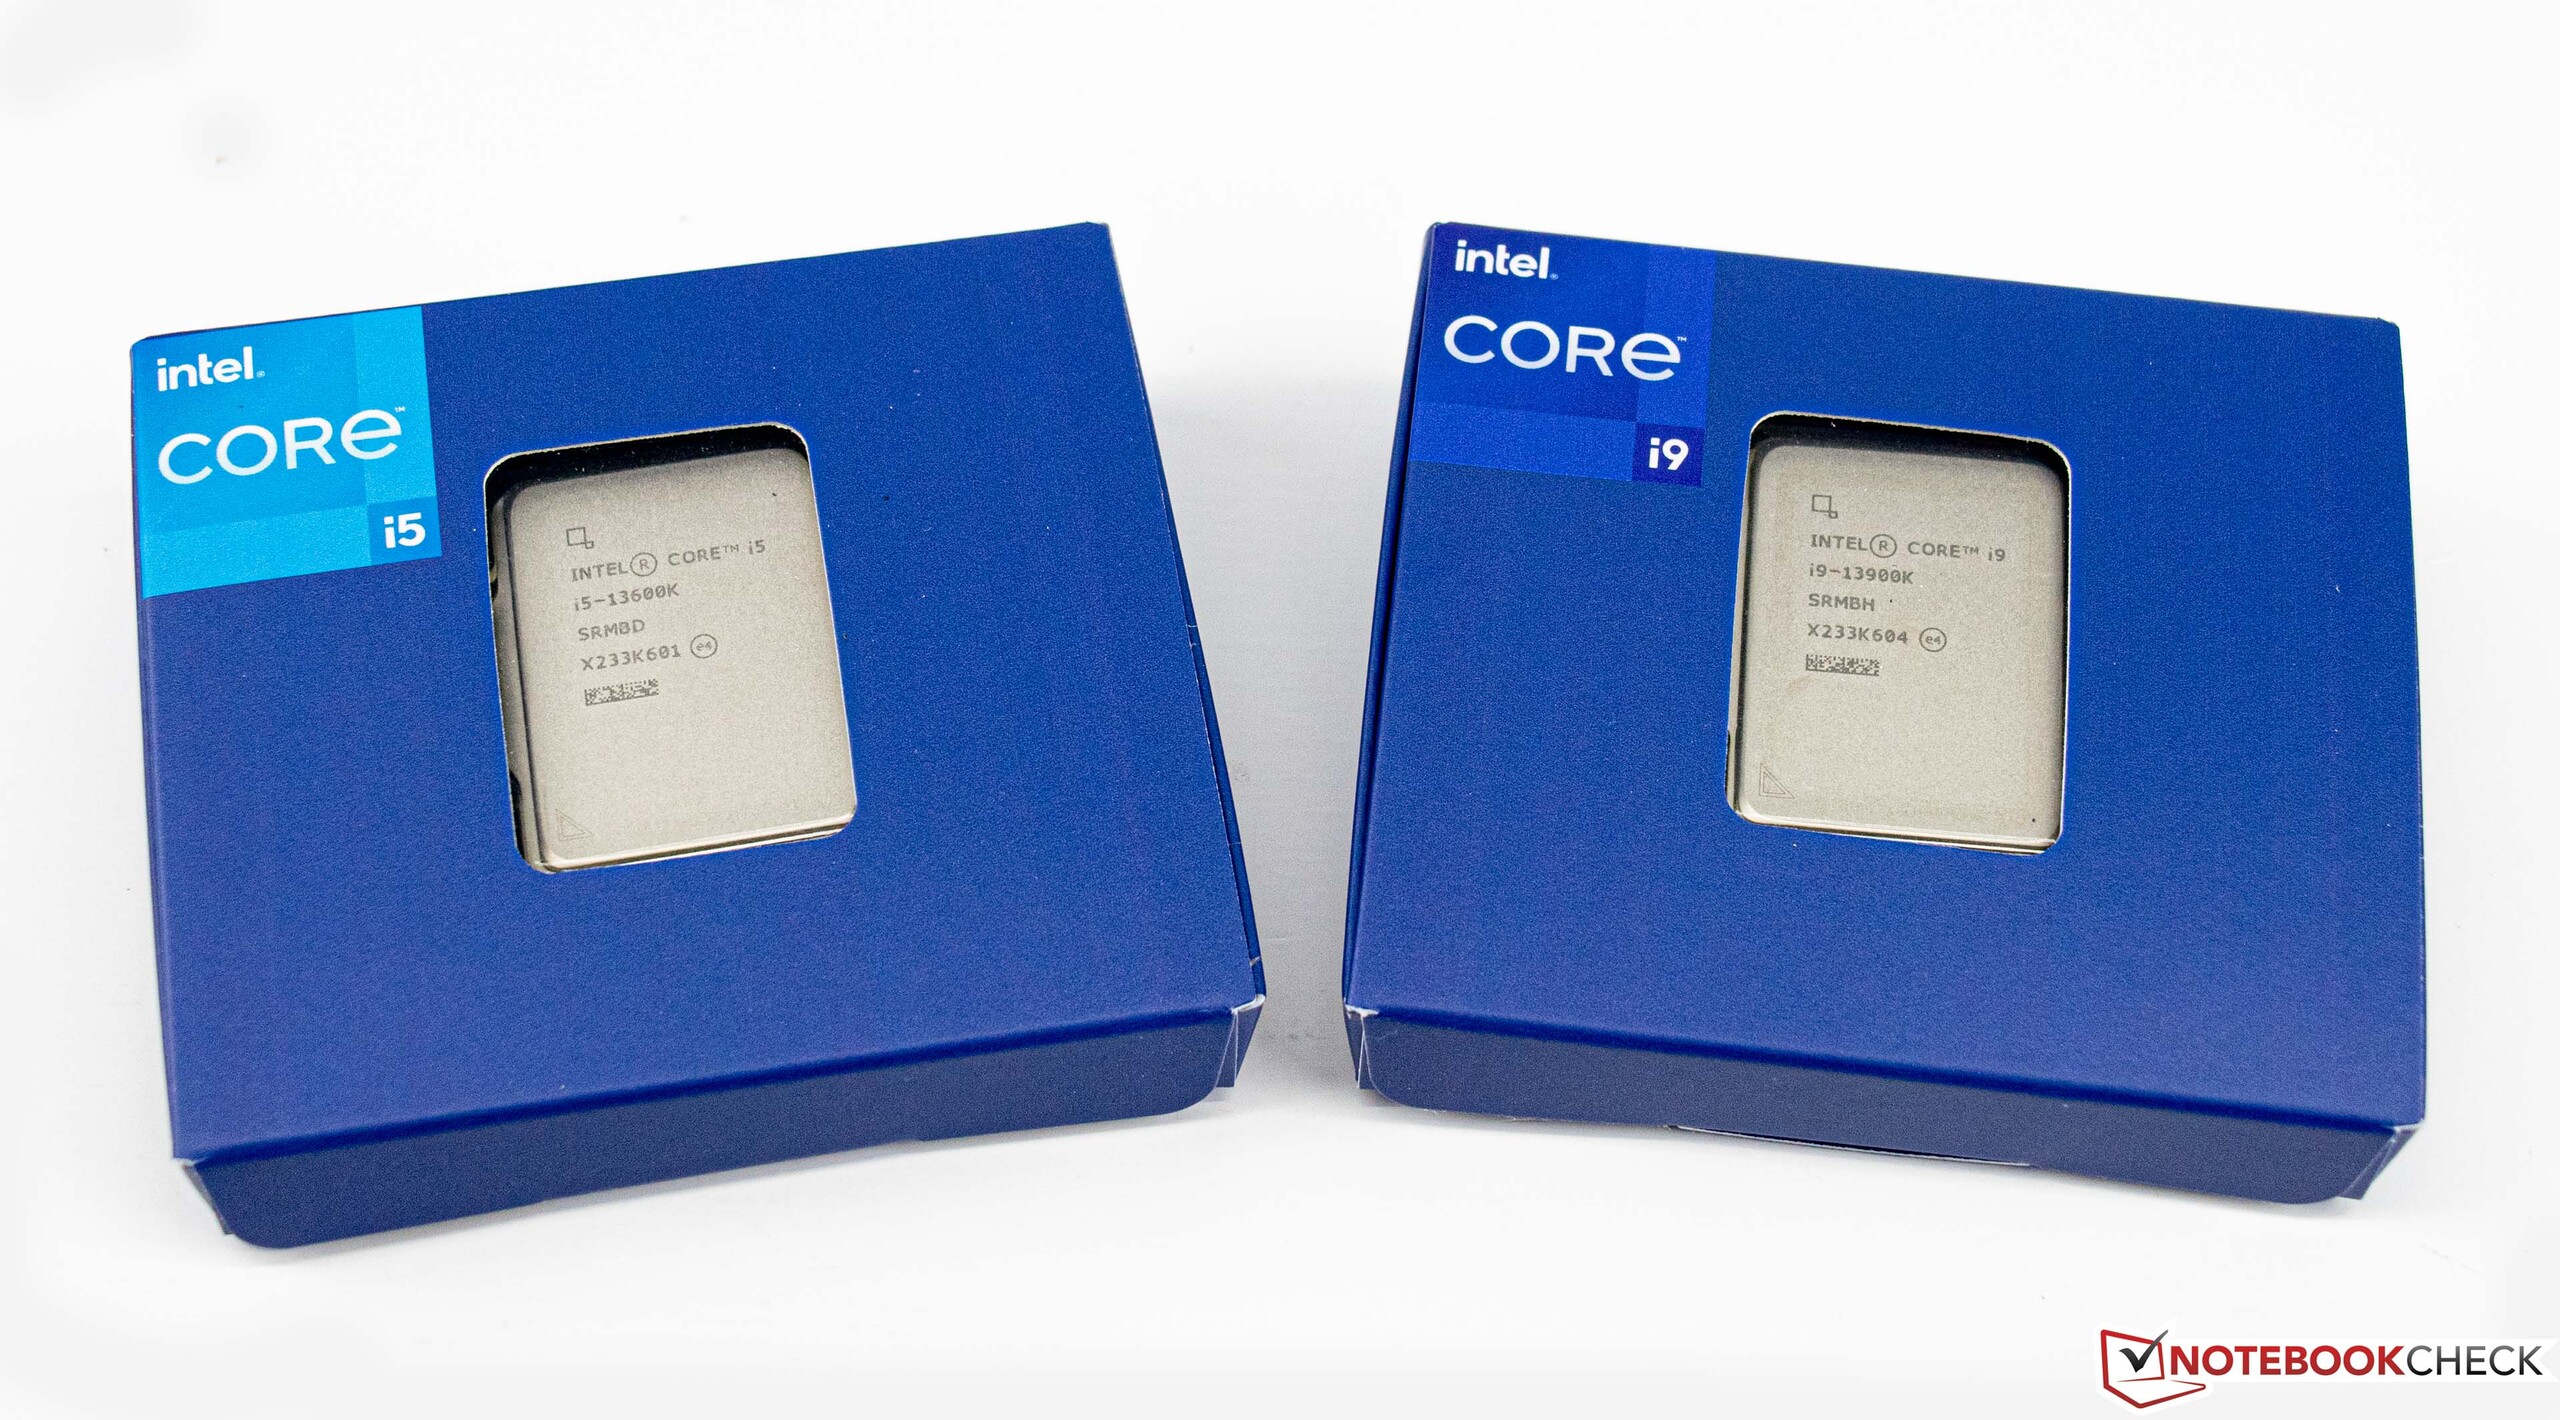
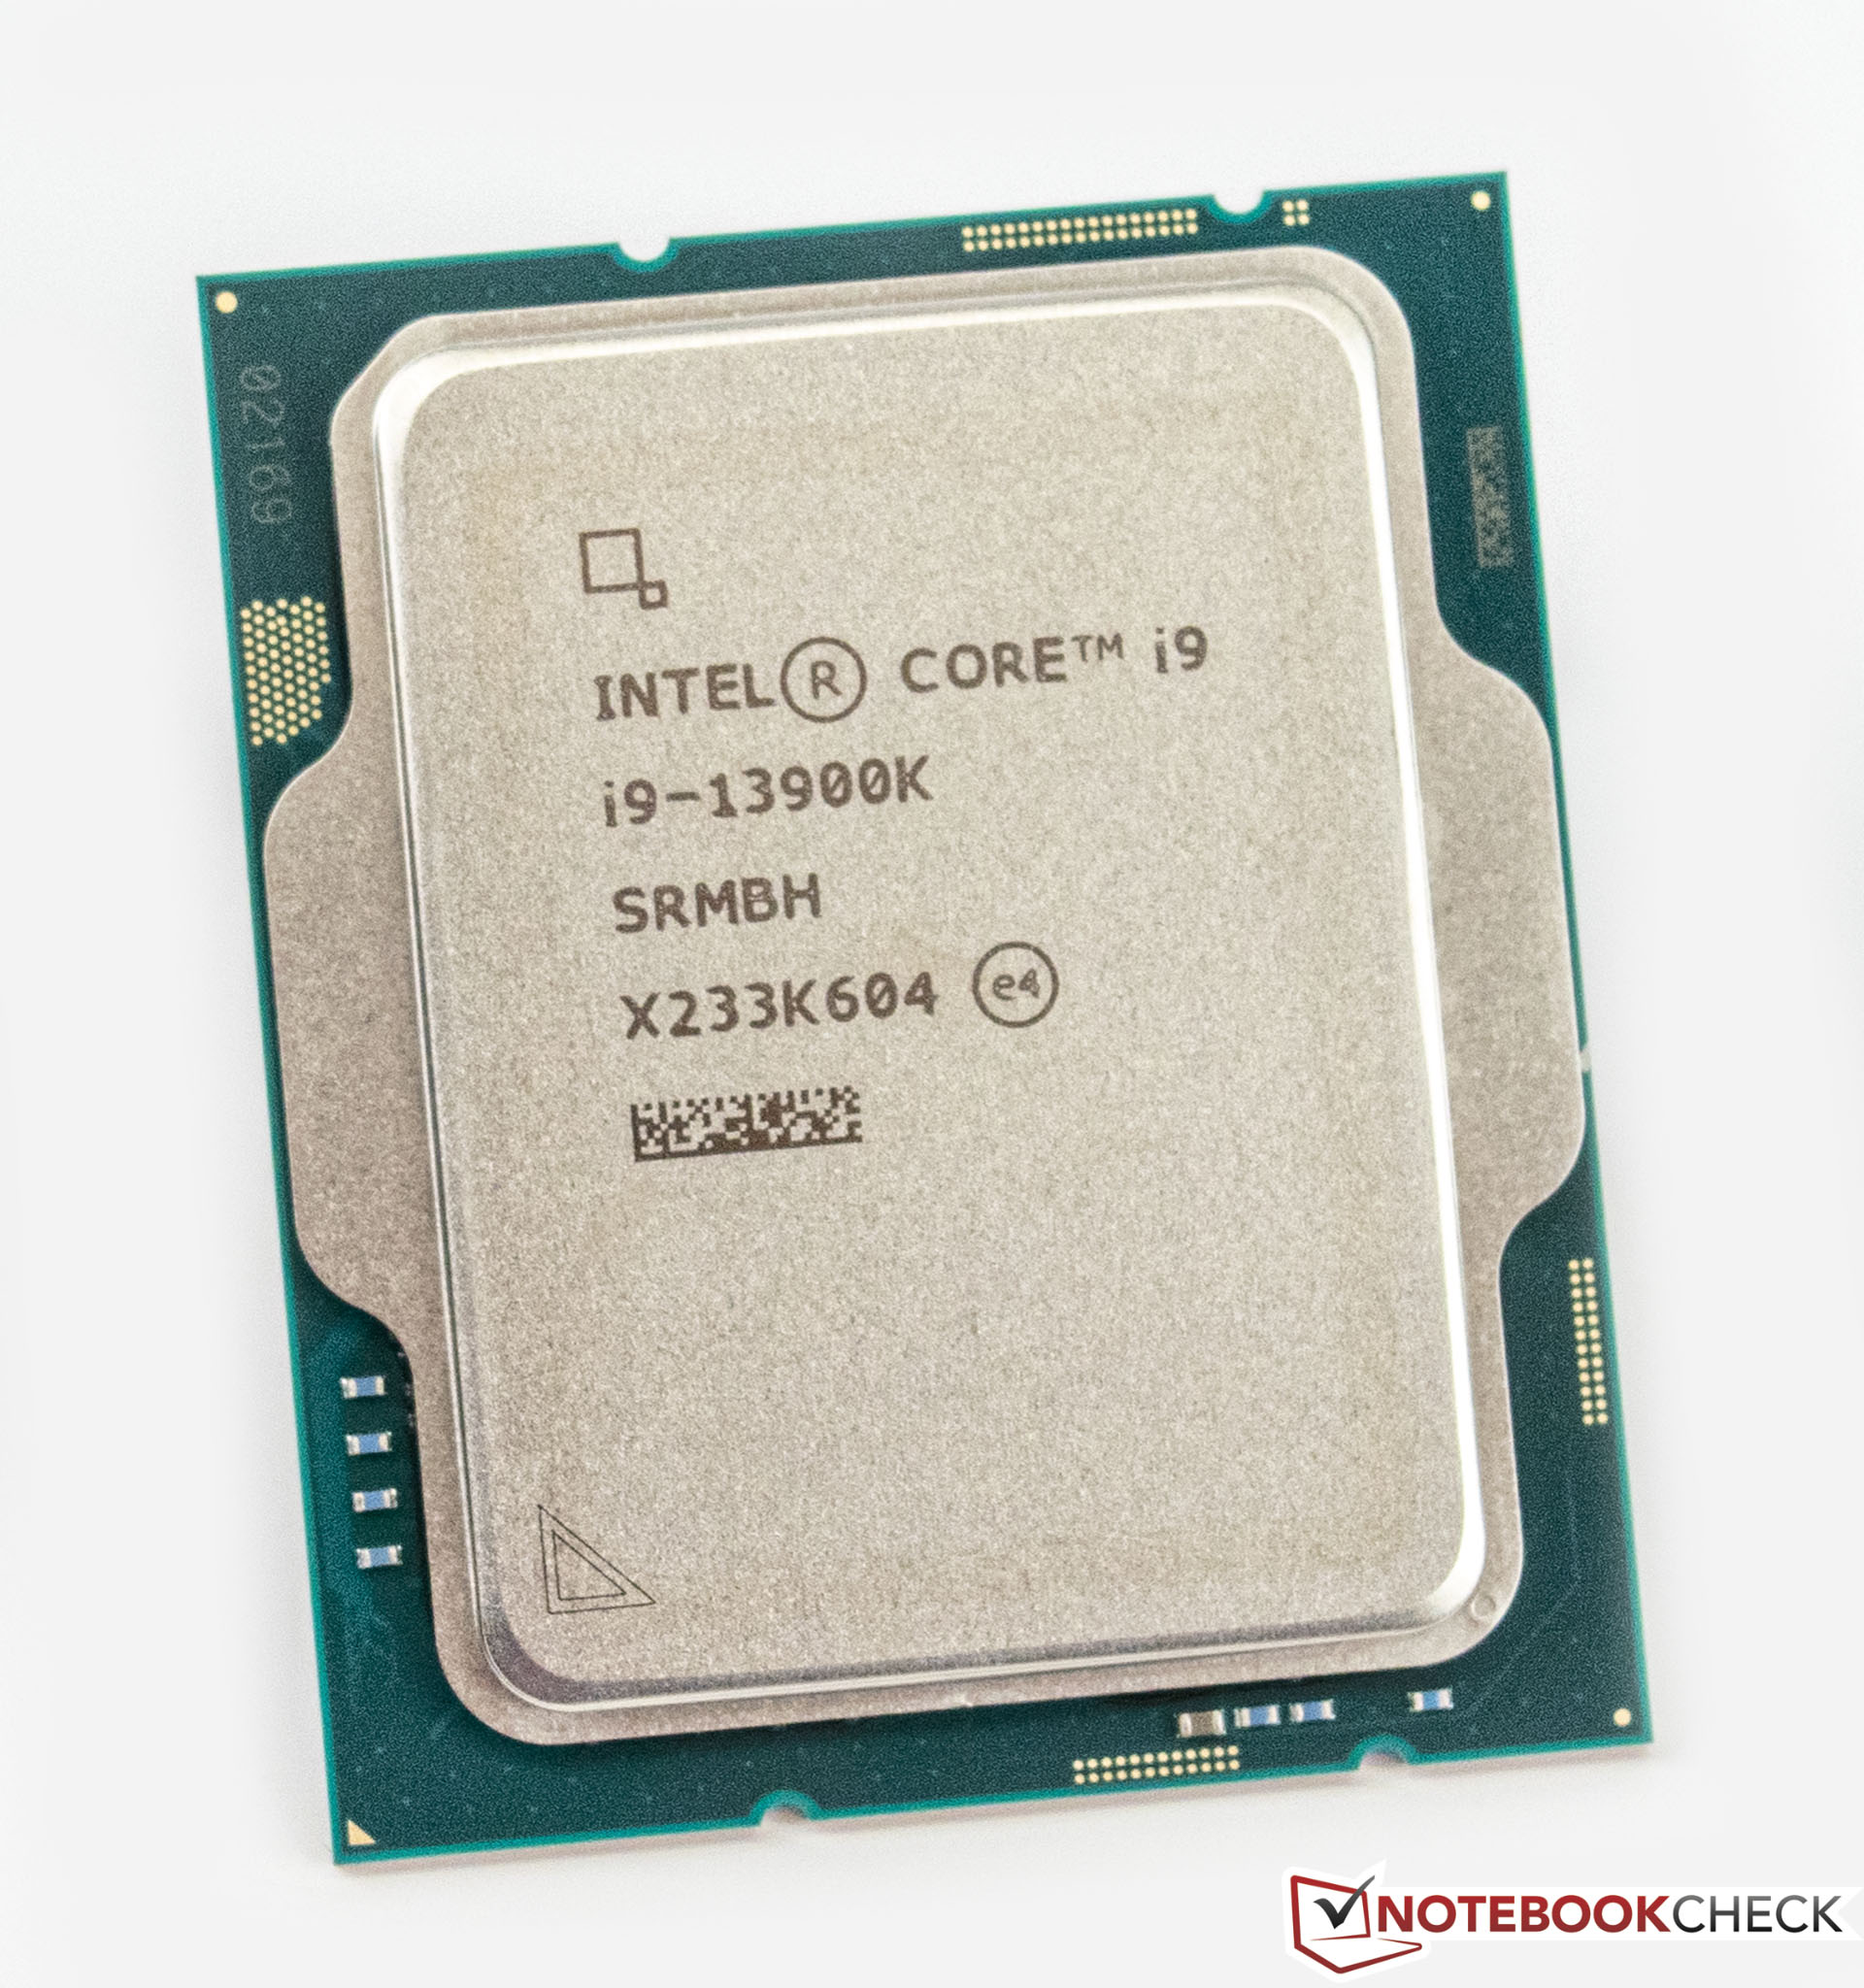
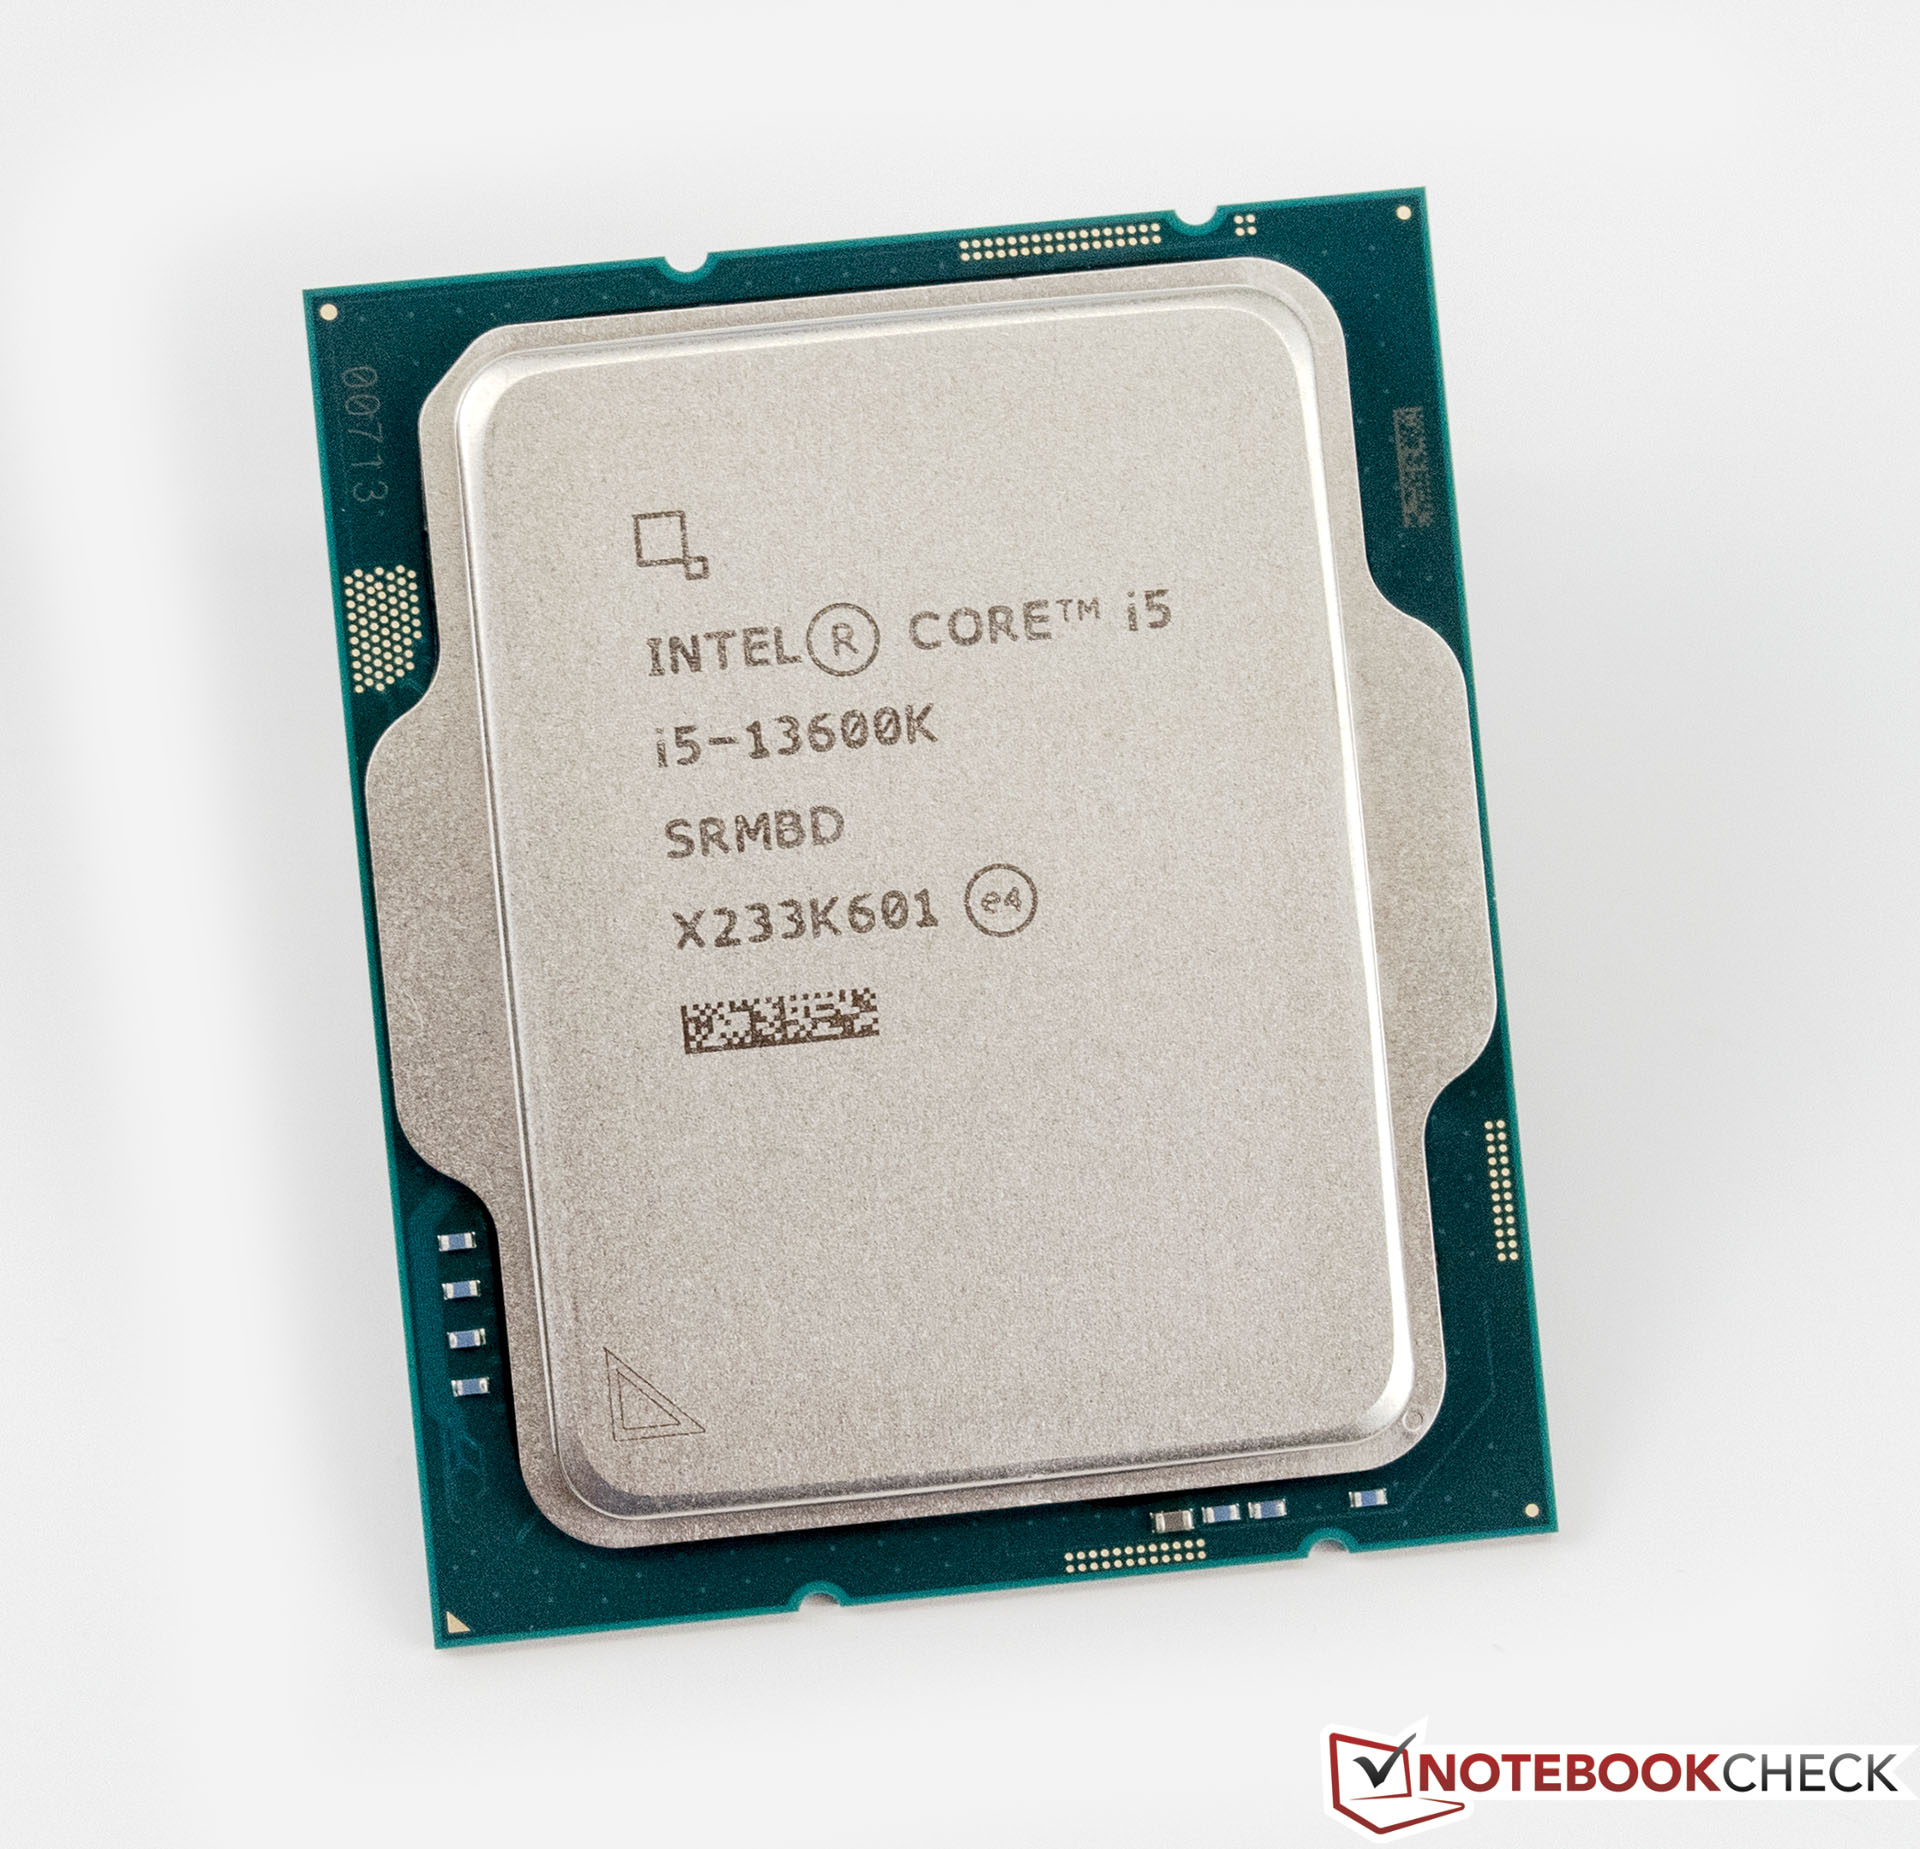
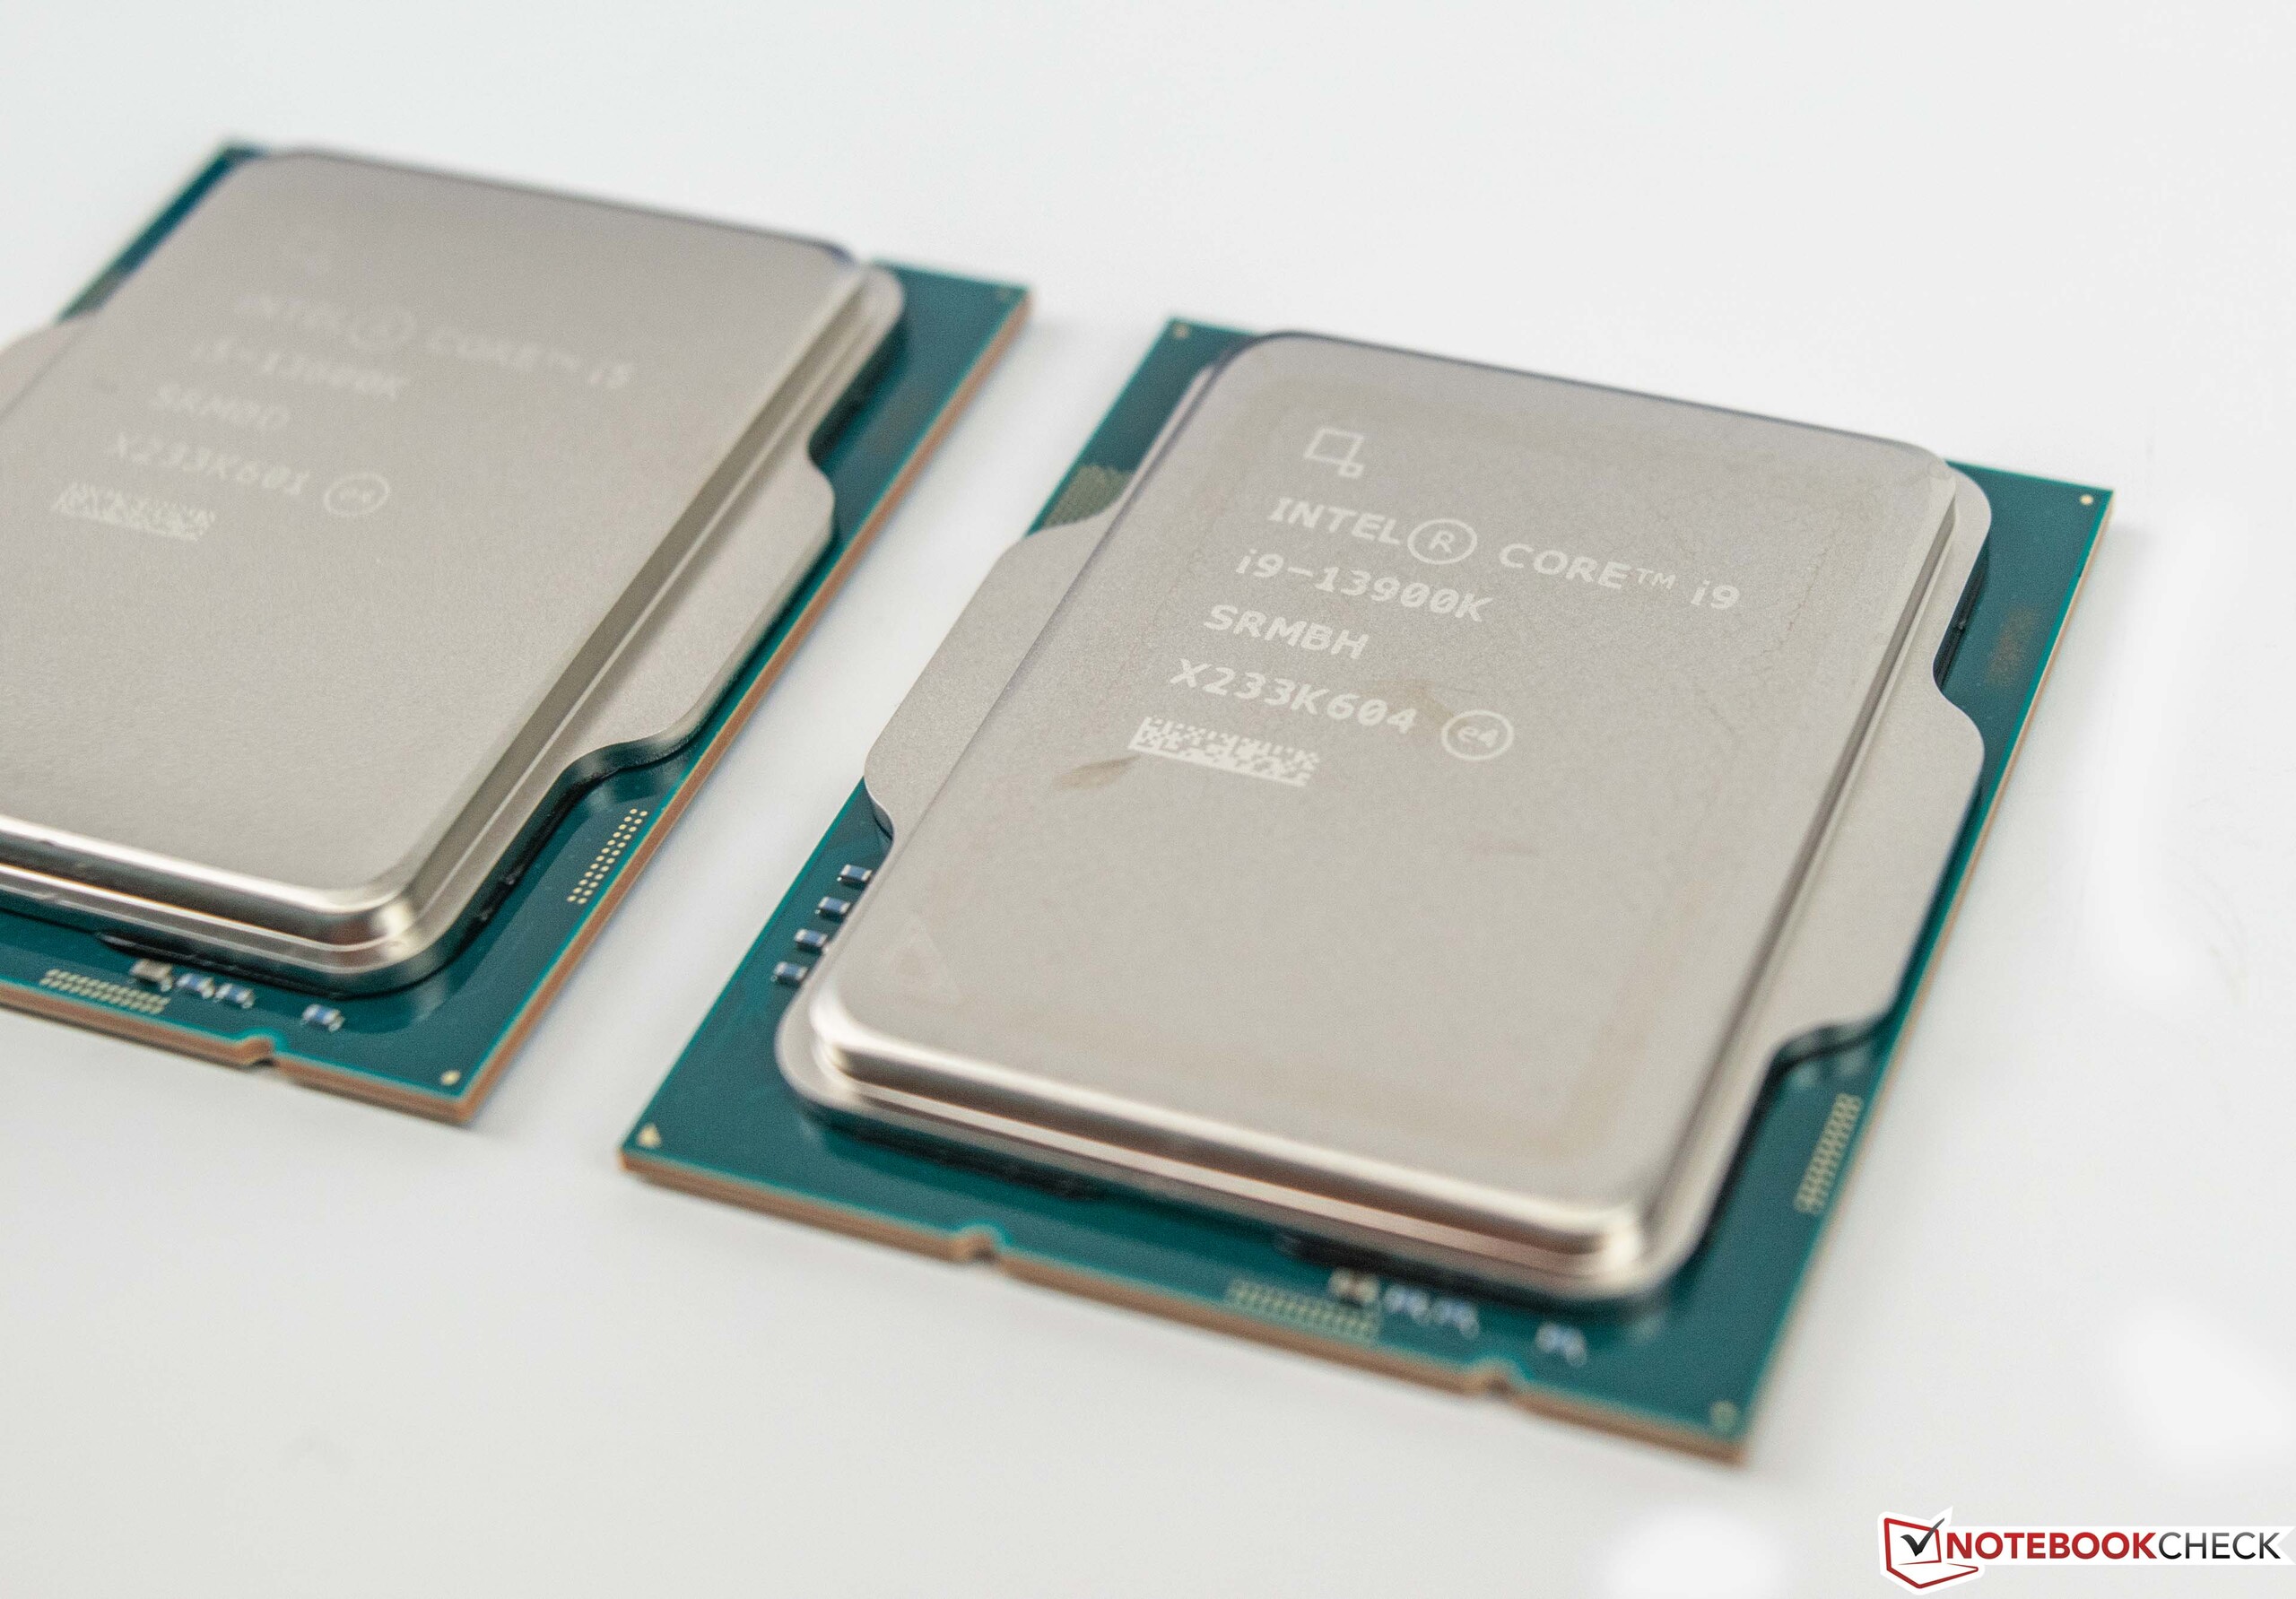
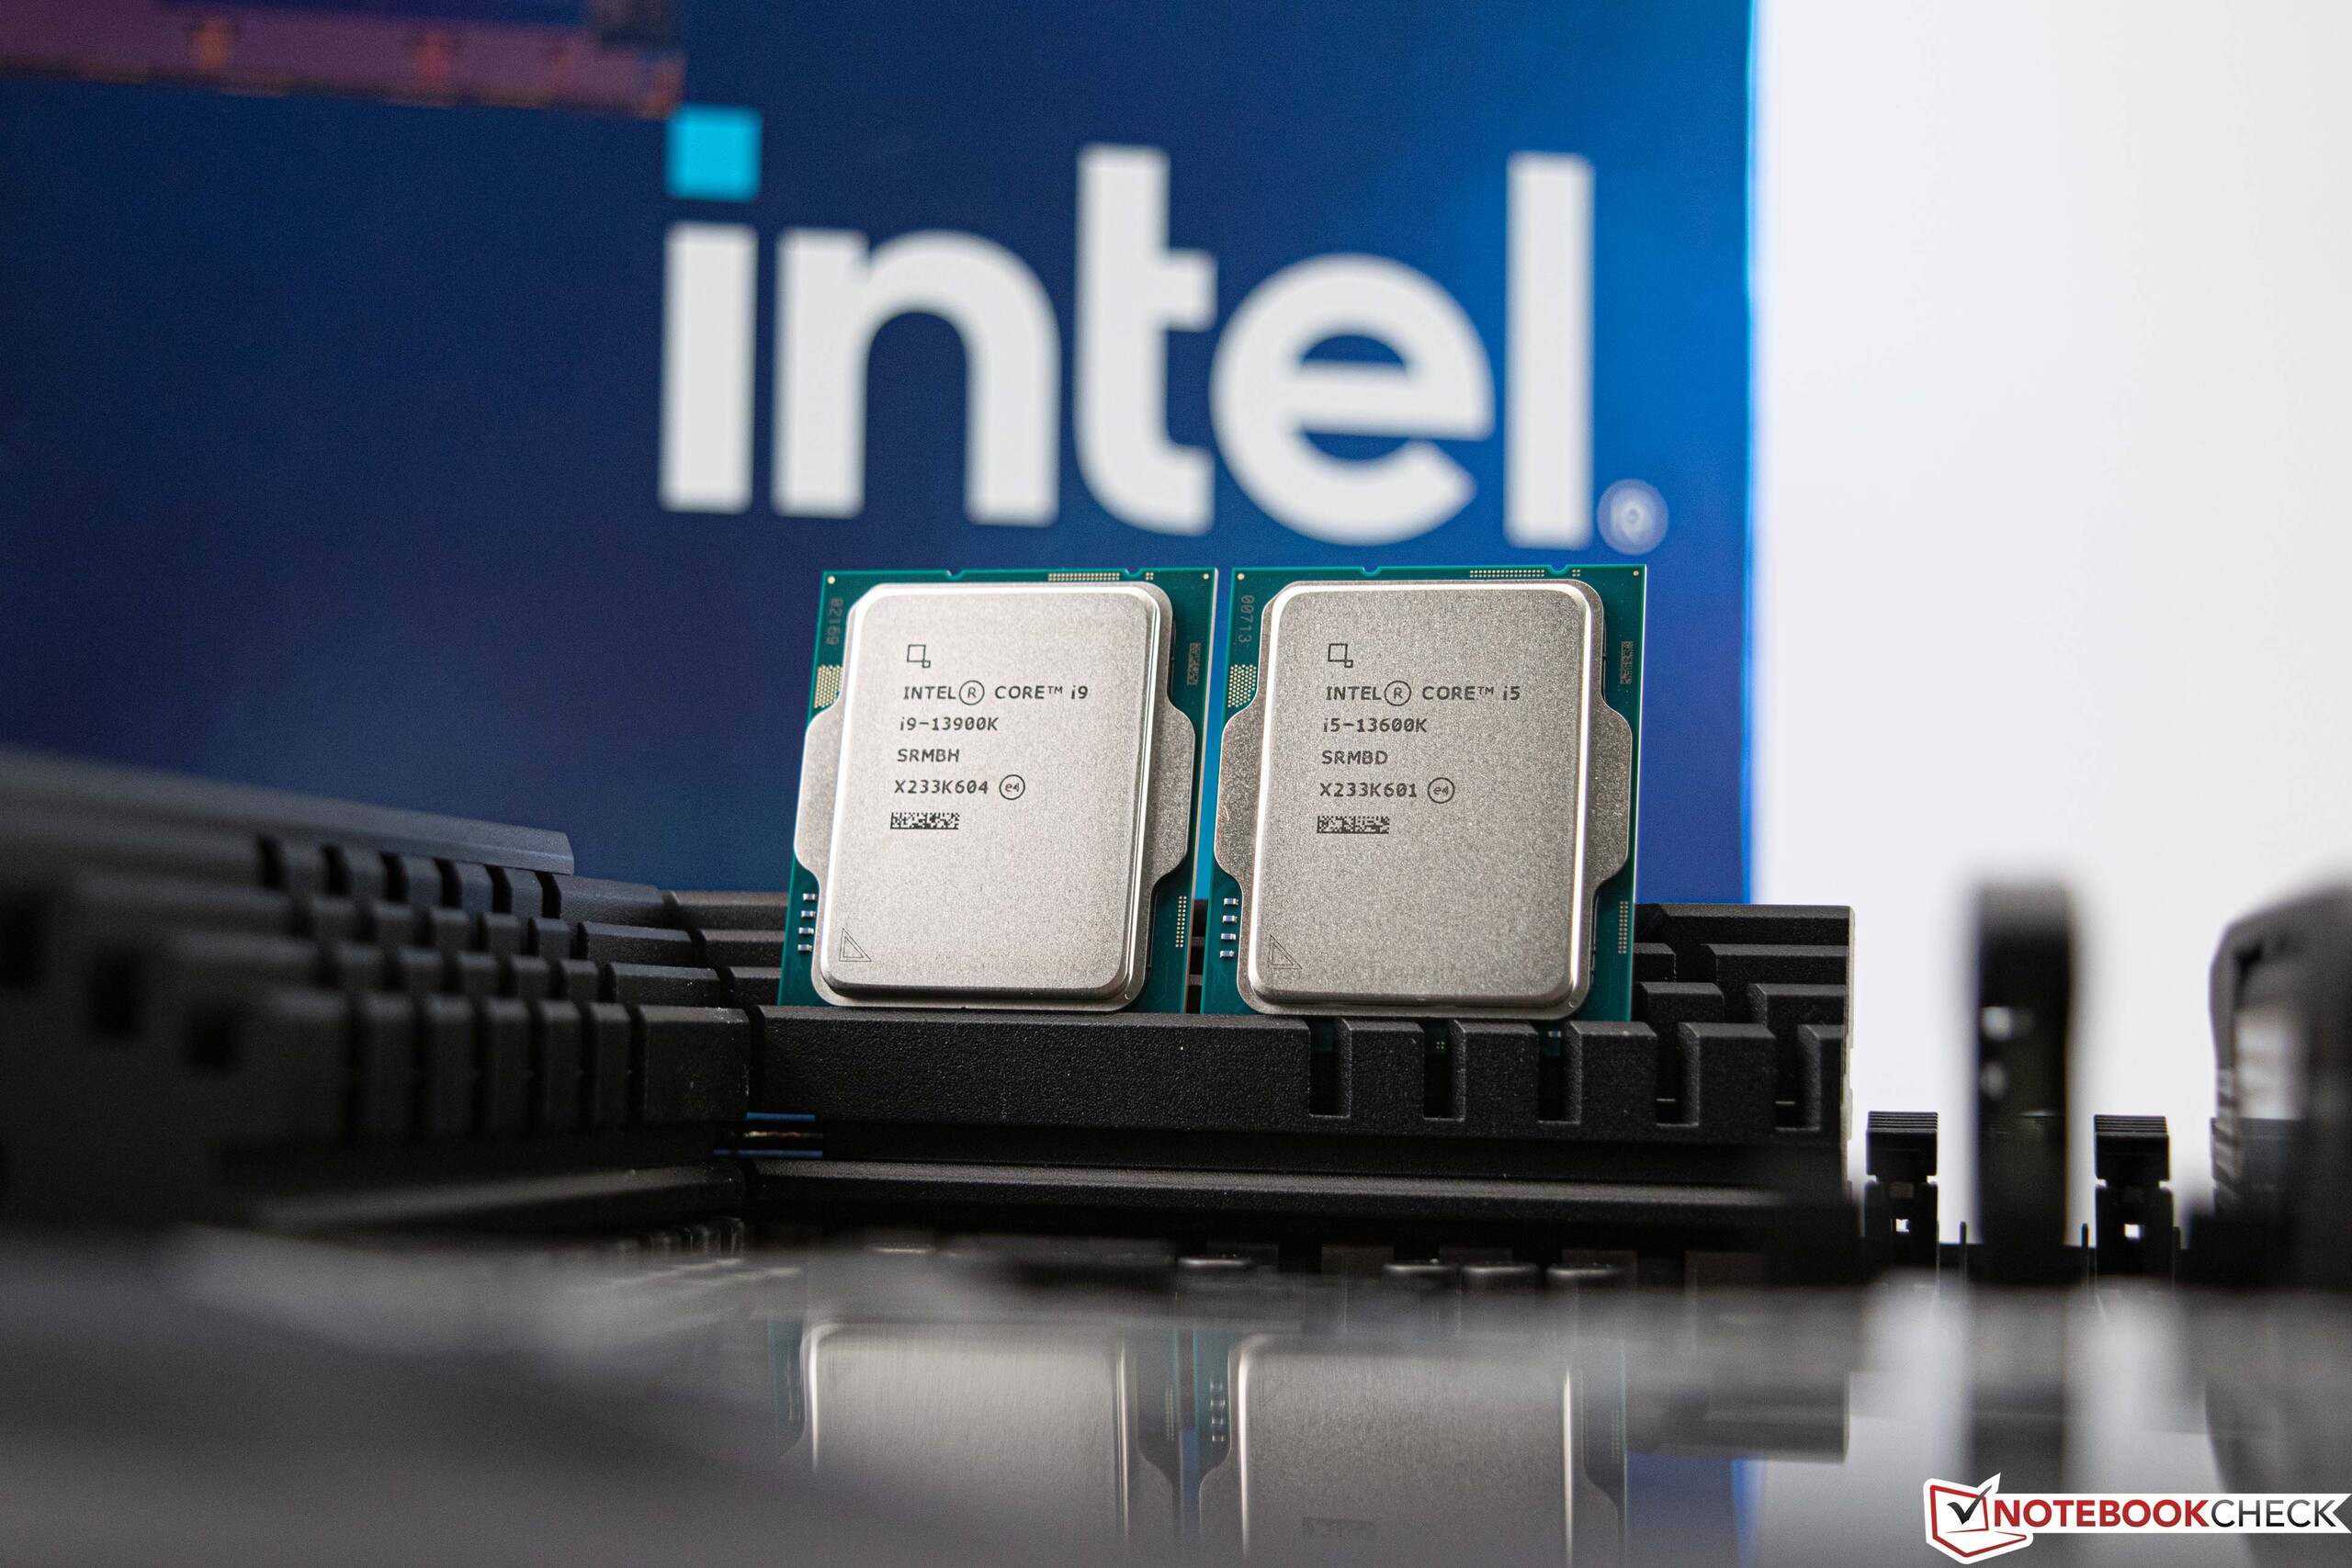
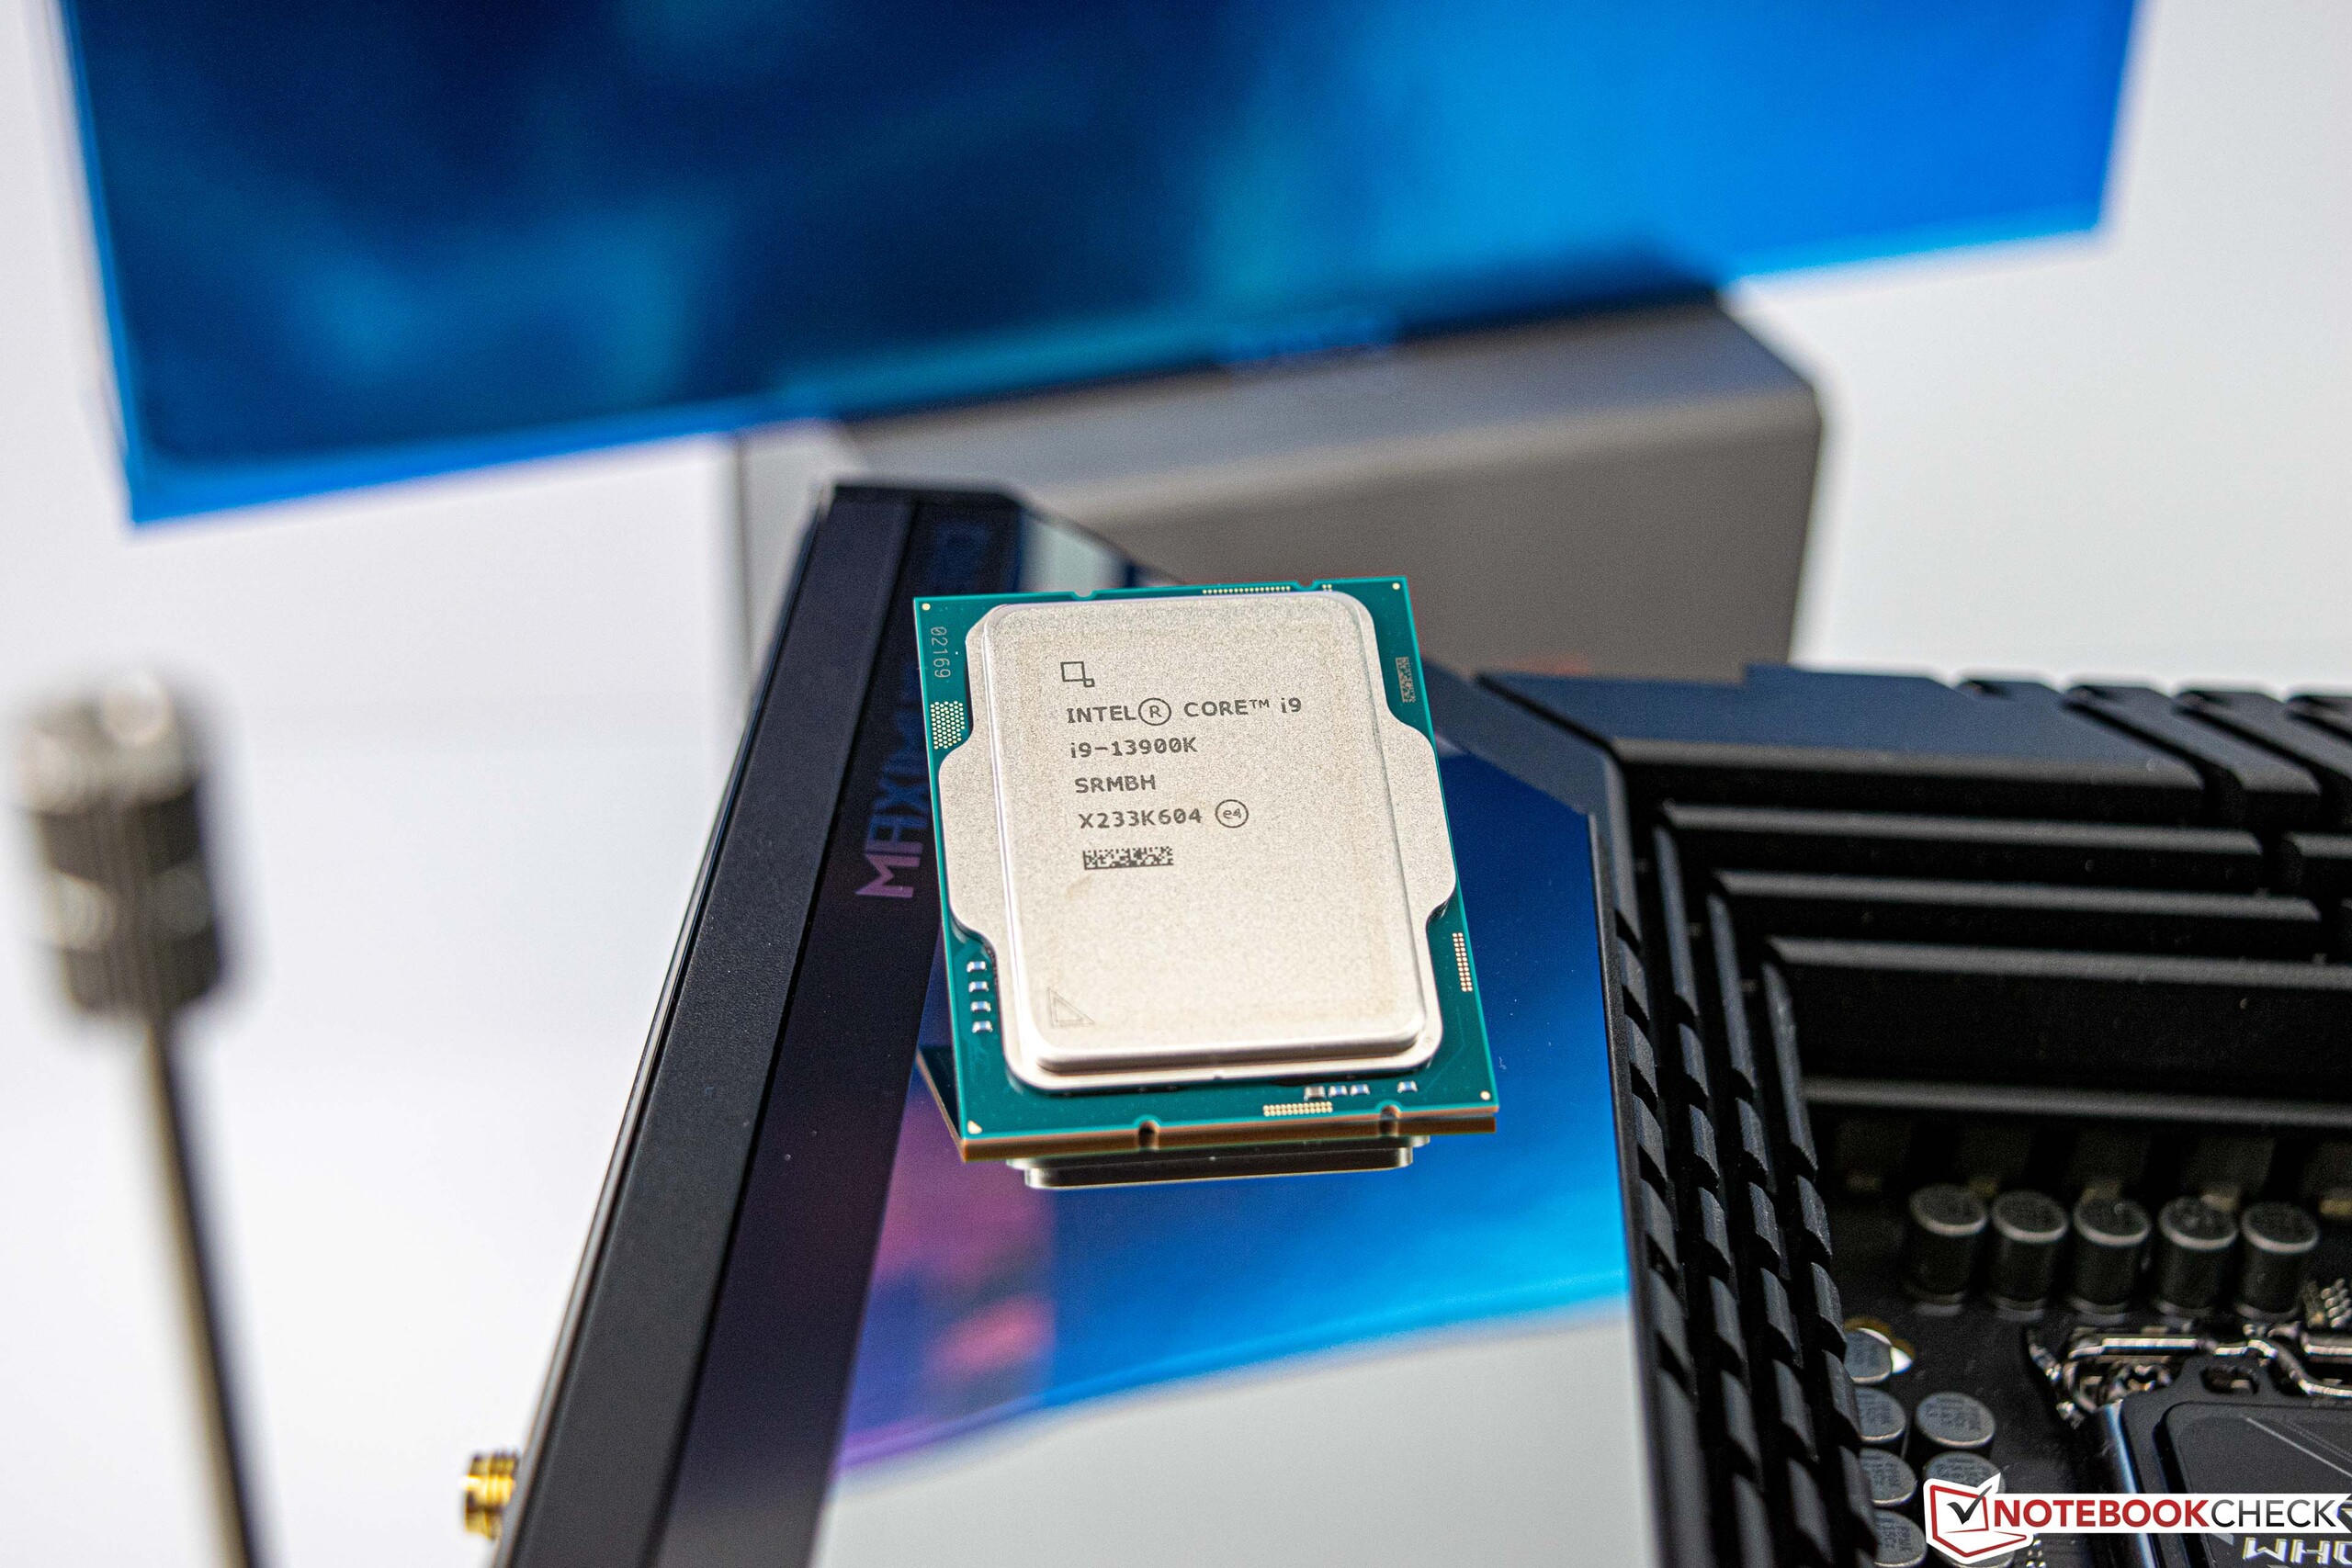
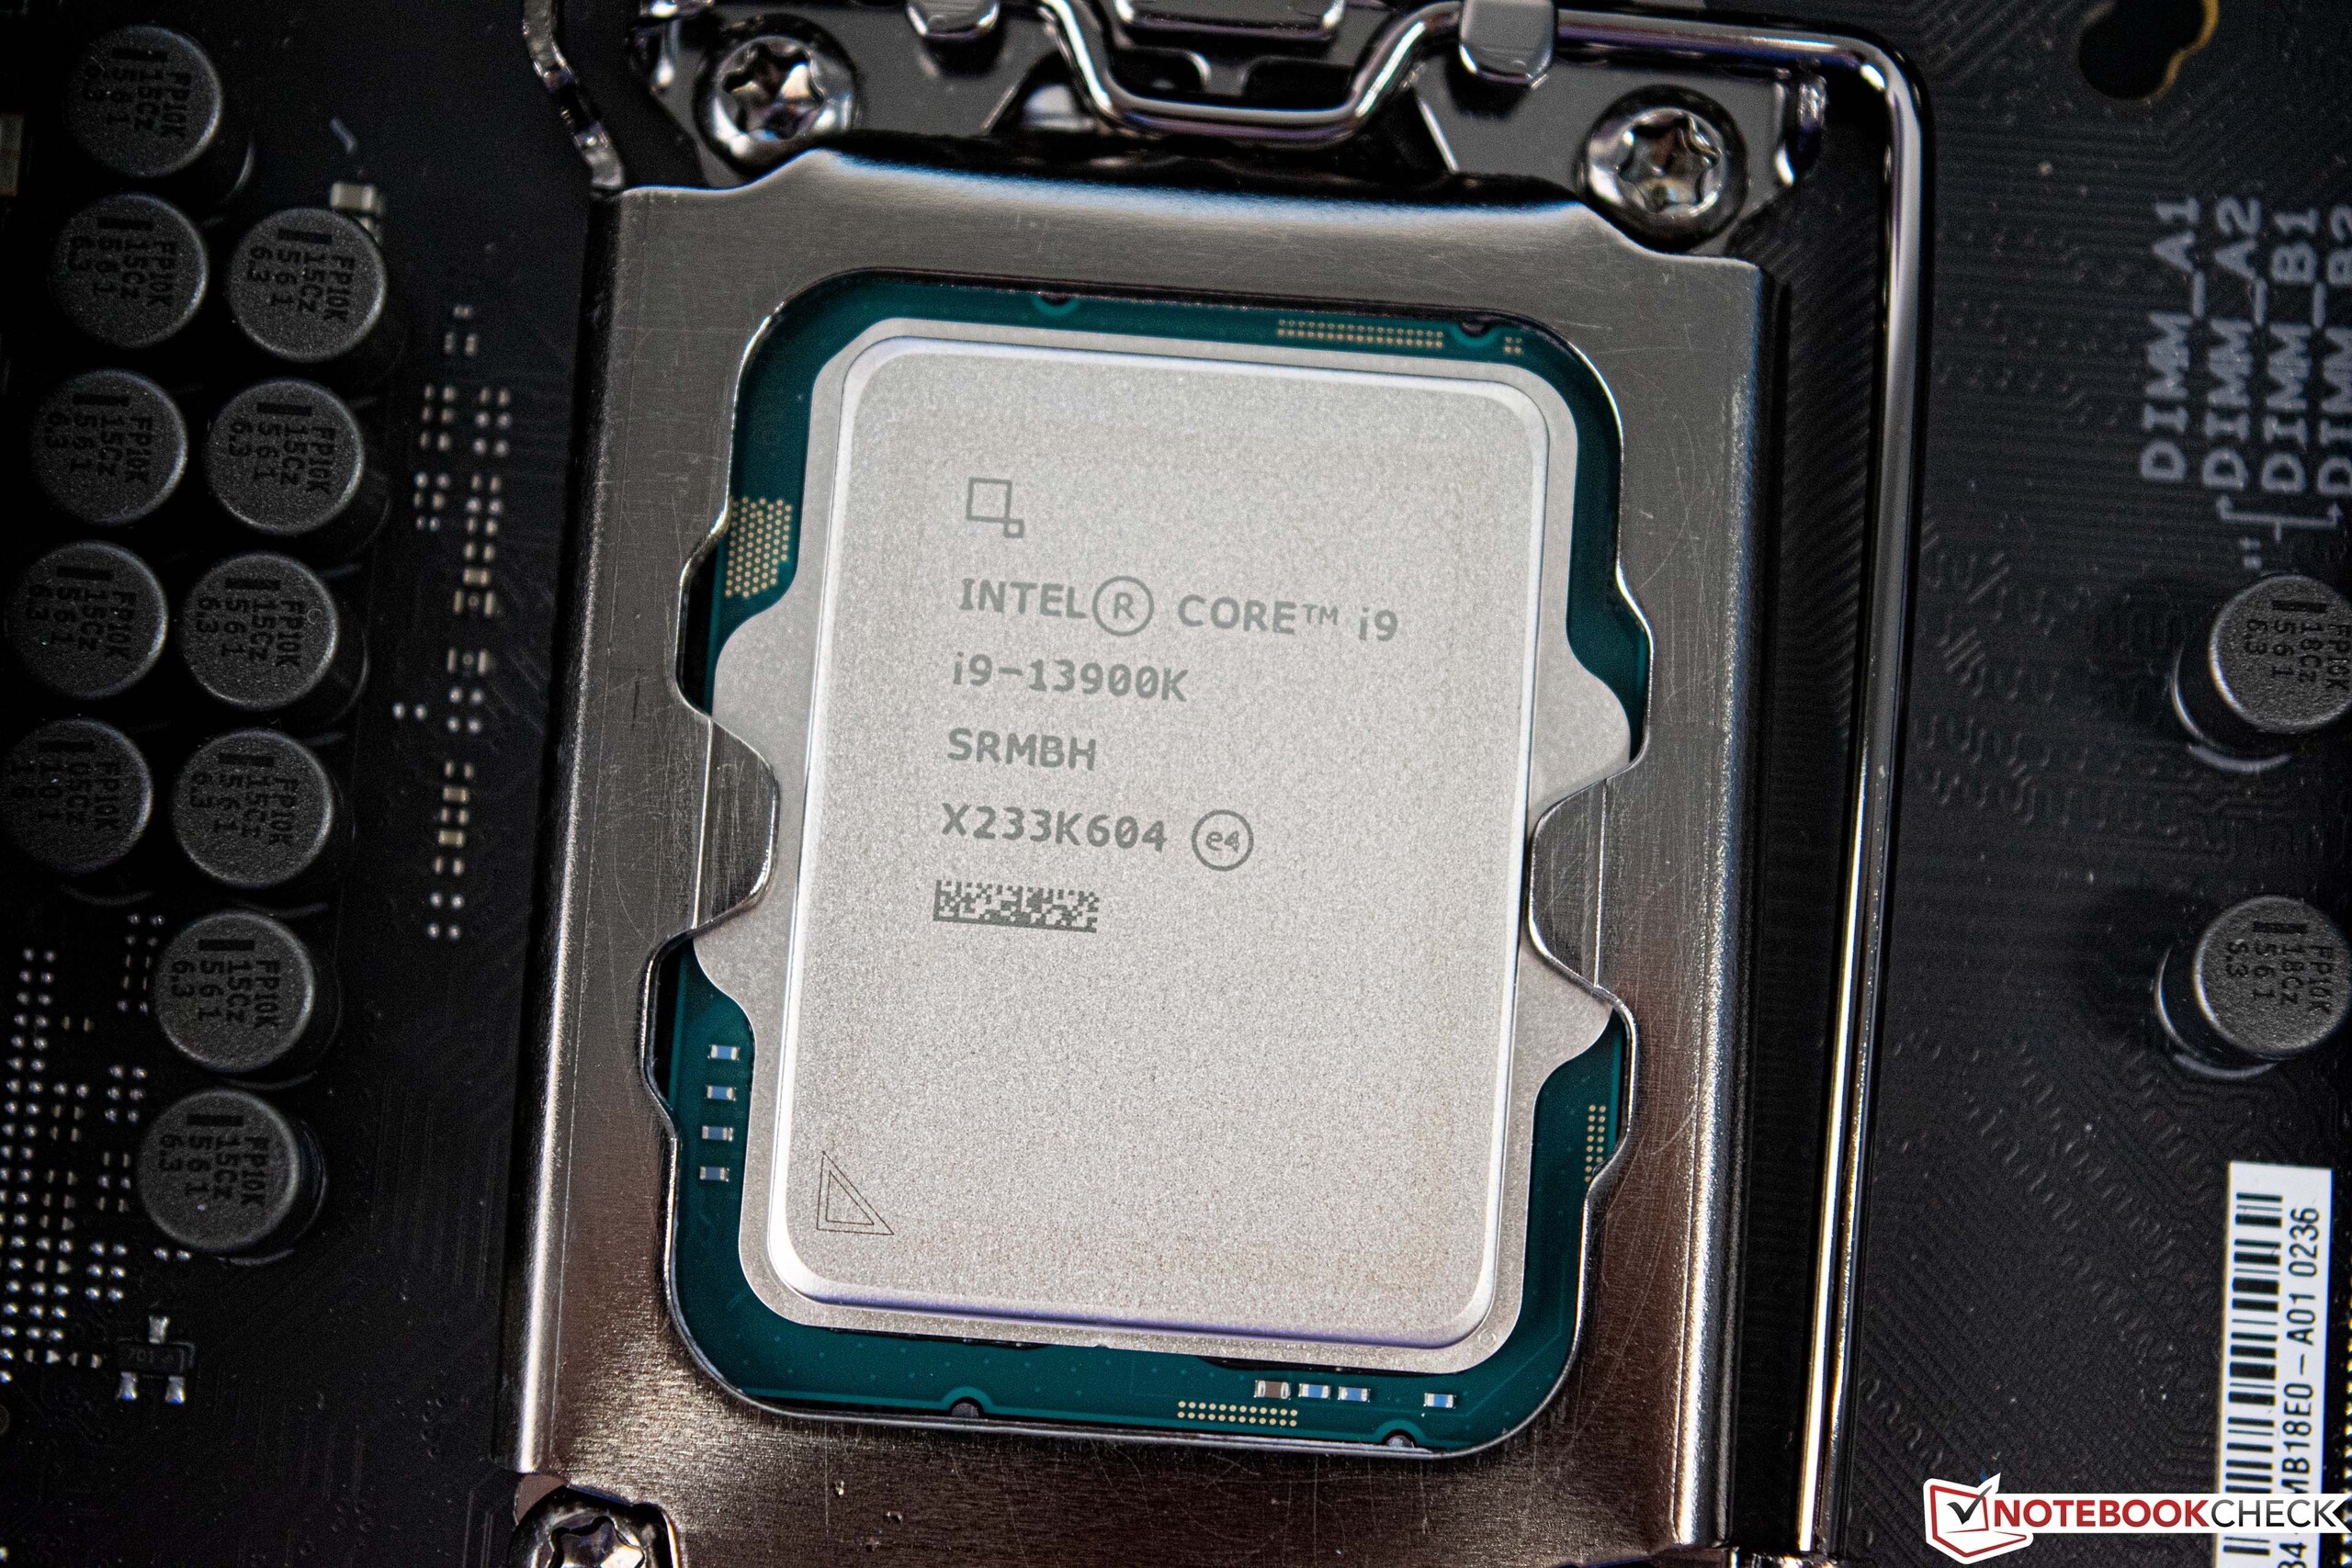
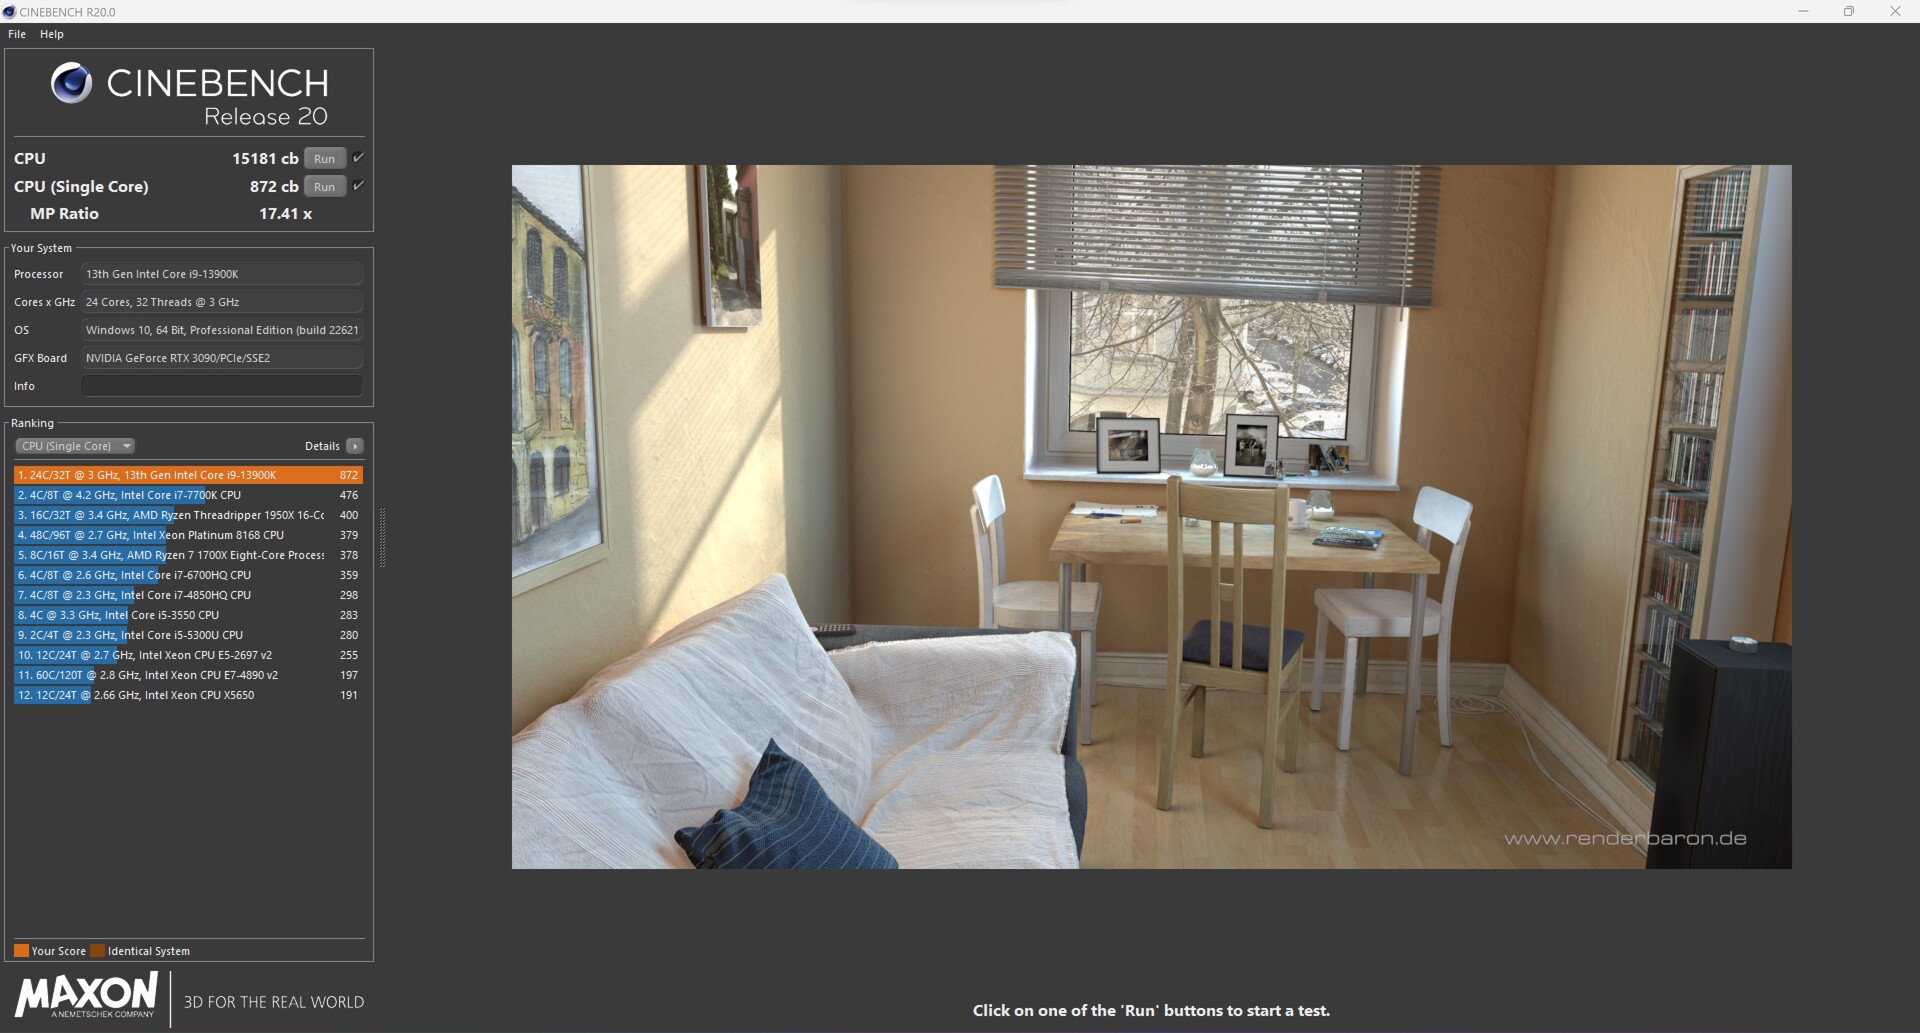
Intel Core i9-13900K
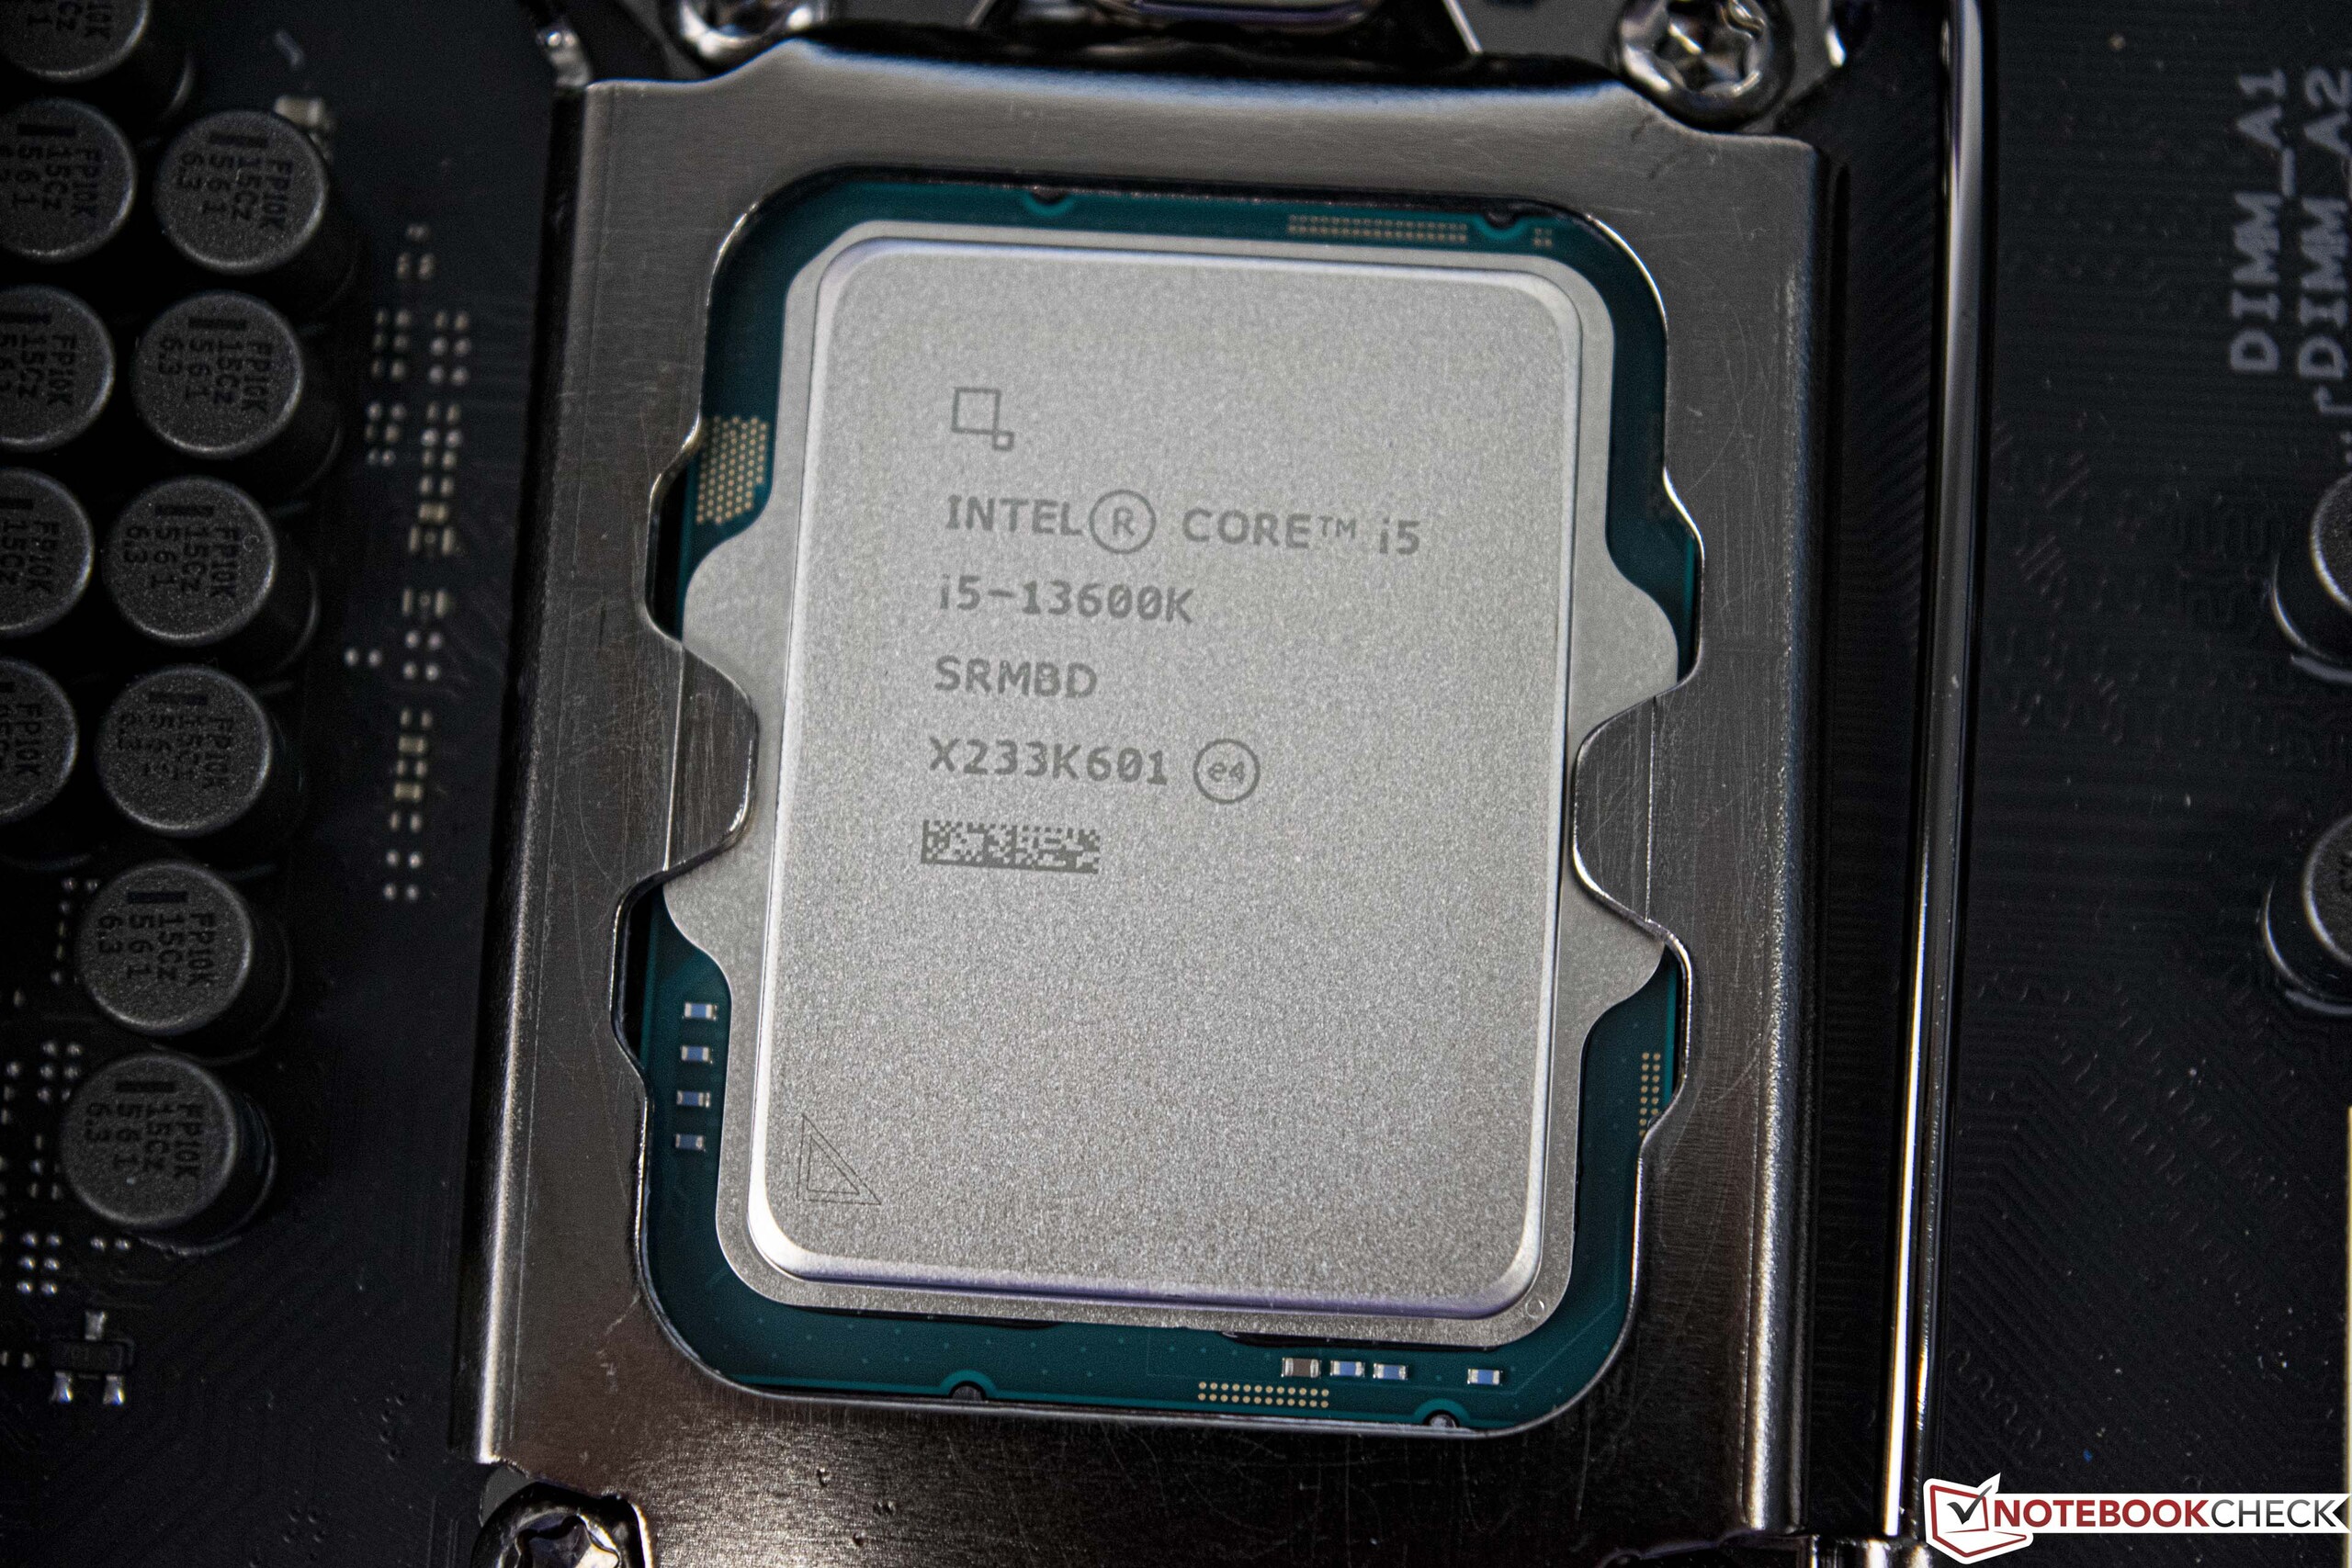
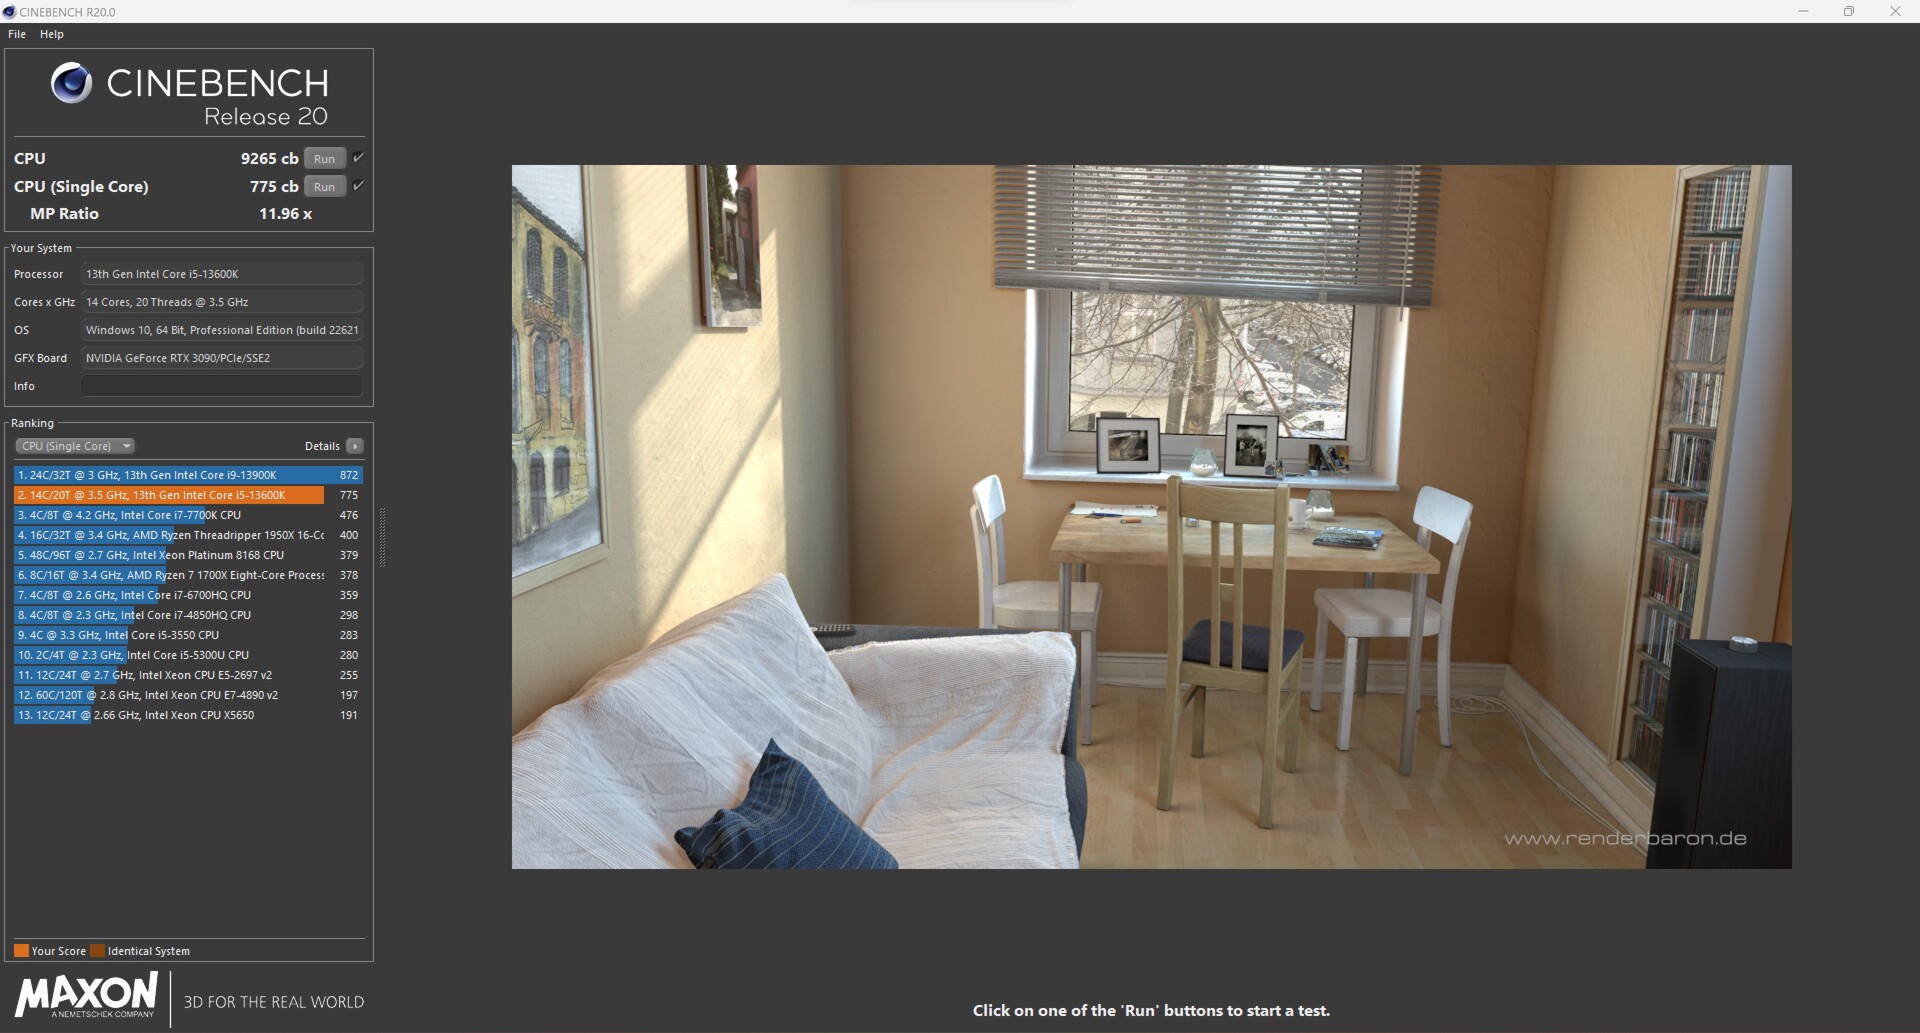
Intel Core i5-13600K

| Performance rating - Percent | |
| Intel Core i9-13900K | |
| Intel Core i9-13900K @253W | |
| NVIDIA GeForce RTX 3090 Founders Edition | |
| AMD Ryzen 9 7900X | |
| Intel Core i9-12900K | |
| Intel Core i5-13600K | |
| Intel Core i5-13600K @181W | |
| AMD Ryzen 5 7600X | |
| Intel Core i5-12600K | |
| Cinebench R15 | |
| CPU Single 64Bit | |
| NVIDIA GeForce RTX 3090 Founders Edition | |
| Intel Core i9-13900K @253W | |
| Intel Core i9-13900K | |
| AMD Ryzen 9 7900X | |
| AMD Ryzen 5 7600X | |
| Intel Core i5-13600K | |
| Intel Core i9-12900K | |
| Intel Core i5-13600K @181W | |
| Intel Core i5-12600K | |
| CPU Multi 64Bit | |
| NVIDIA GeForce RTX 3090 Founders Edition | |
| Intel Core i9-13900K | |
| Intel Core i9-13900K @253W | |
| AMD Ryzen 9 7900X | |
| Intel Core i9-12900K | |
| Intel Core i5-13600K | |
| Intel Core i5-13600K @181W | |
| Intel Core i5-12600K | |
| AMD Ryzen 5 7600X | |
| Cinebench R20 | |
| CPU (Single Core) | |
| Intel Core i9-13900K @253W | |
| Intel Core i9-13900K | |
| NVIDIA GeForce RTX 3090 Founders Edition | |
| AMD Ryzen 9 7900X | |
| Intel Core i5-13600K | |
| Intel Core i9-12900K | |
| Intel Core i5-13600K @181W | |
| AMD Ryzen 5 7600X | |
| Intel Core i5-12600K | |
| CPU (Multi Core) | |
| Intel Core i9-13900K | |
| NVIDIA GeForce RTX 3090 Founders Edition | |
| Intel Core i9-13900K @253W | |
| AMD Ryzen 9 7900X | |
| Intel Core i9-12900K | |
| Intel Core i5-13600K | |
| Intel Core i5-13600K @181W | |
| Intel Core i5-12600K | |
| AMD Ryzen 5 7600X | |
| Cinebench R23 | |
| Single Core | |
| Intel Core i9-13900K @253W | |
| Intel Core i9-13900K | |
| NVIDIA GeForce RTX 3090 Founders Edition | |
| AMD Ryzen 9 7900X | |
| Intel Core i5-13600K | |
| Intel Core i9-12900K | |
| Intel Core i5-13600K @181W | |
| AMD Ryzen 5 7600X | |
| Intel Core i5-12600K | |
| Multi Core | |
| Intel Core i9-13900K | |
| Intel Core i9-13900K @253W | |
| NVIDIA GeForce RTX 3090 Founders Edition | |
| AMD Ryzen 9 7900X | |
| Intel Core i9-12900K | |
| Intel Core i5-13600K | |
| Intel Core i5-13600K @181W | |
| Intel Core i5-12600K | |
| AMD Ryzen 5 7600X | |
| Cinebench R11.5 | |
| CPU Single 64Bit | |
| Intel Core i9-13900K @253W | |
| Intel Core i9-13900K | |
| NVIDIA GeForce RTX 3090 Founders Edition | |
| AMD Ryzen 9 7900X | |
| AMD Ryzen 5 7600X | |
| Intel Core i9-12900K | |
| Intel Core i5-13600K | |
| Intel Core i5-13600K @181W | |
| Intel Core i5-12600K | |
| CPU Multi 64Bit | |
| Intel Core i9-13900K | |
| NVIDIA GeForce RTX 3090 Founders Edition | |
| Intel Core i9-13900K @253W | |
| AMD Ryzen 9 7900X | |
| Intel Core i9-12900K | |
| Intel Core i5-13600K | |
| Intel Core i5-13600K @181W | |
| Intel Core i5-12600K | |
| AMD Ryzen 5 7600X | |
| Cinebench R10 | |
| Rendering Single CPUs 64Bit | |
| Intel Core i9-13900K @253W | |
| Intel Core i9-13900K | |
| AMD Ryzen 9 7900X | |
| NVIDIA GeForce RTX 3090 Founders Edition | |
| Intel Core i5-13600K | |
| Intel Core i9-12900K | |
| Intel Core i5-13600K @181W | |
| AMD Ryzen 5 7600X | |
| Intel Core i5-12600K | |
| Rendering Multiple CPUs 64Bit | |
| Intel Core i9-13900K @253W | |
| Intel Core i9-13900K | |
| NVIDIA GeForce RTX 3090 Founders Edition | |
| AMD Ryzen 9 7900X | |
| Intel Core i9-12900K | |
| Intel Core i5-13600K @181W | |
| Intel Core i5-13600K | |
| AMD Ryzen 5 7600X | |
| Intel Core i5-12600K | |
| Blender - v2.79 BMW27 CPU | |
| AMD Ryzen 5 7600X | |
| Intel Core i5-12600K | |
| Intel Core i5-13600K | |
| Intel Core i5-13600K @181W | |
| Intel Core i9-12900K | |
| AMD Ryzen 9 7900X | |
| NVIDIA GeForce RTX 3090 Founders Edition | |
| Intel Core i9-13900K @253W | |
| Intel Core i9-13900K | |
| wPrime 2.10 | |
| 32m | |
| Intel Core i9-12900K | |
| Intel Core i5-12600K | |
| AMD Ryzen 5 7600X | |
| Intel Core i5-13600K | |
| Intel Core i5-13600K @181W | |
| Intel Core i9-13900K @253W | |
| Intel Core i9-13900K | |
| AMD Ryzen 9 7900X | |
| NVIDIA GeForce RTX 3090 Founders Edition | |
| 1024m | |
| Intel Core i5-12600K | |
| Intel Core i9-12900K | |
| Intel Core i5-13600K | |
| Intel Core i5-13600K @181W | |
| Intel Core i9-13900K @253W | |
| Intel Core i9-13900K | |
| AMD Ryzen 5 7600X | |
| AMD Ryzen 9 7900X | |
| NVIDIA GeForce RTX 3090 Founders Edition | |
| X264 HD Benchmark 4.0 | |
| Pass 1 | |
| Intel Core i9-13900K @253W | |
| Intel Core i9-13900K | |
| Intel Core i5-13600K | |
| Intel Core i5-13600K @181W | |
| NVIDIA GeForce RTX 3090 Founders Edition | |
| AMD Ryzen 9 7900X | |
| Intel Core i9-12900K | |
| AMD Ryzen 5 7600X | |
| Intel Core i5-12600K | |
| Pass 2 | |
| Intel Core i9-13900K | |
| NVIDIA GeForce RTX 3090 Founders Edition | |
| Intel Core i9-13900K @253W | |
| AMD Ryzen 9 7900X | |
| Intel Core i9-12900K | |
| Intel Core i5-13600K | |
| Intel Core i5-13600K @181W | |
| Intel Core i5-12600K | |
| AMD Ryzen 5 7600X | |
| WinRAR - Result | |
| AMD Ryzen 9 7900X | |
| NVIDIA GeForce RTX 3090 Founders Edition | |
| AMD Ryzen 5 7600X | |
| Intel Core i9-13900K @253W | |
| Intel Core i9-13900K | |
| Intel Core i5-13600K @181W | |
| Intel Core i5-13600K | |
| Intel Core i9-12900K | |
| Intel Core i5-12600K | |
| TrueCrypt | |
| AES Mean 100MB | |
| NVIDIA GeForce RTX 3090 Founders Edition | |
| Intel Core i9-13900K | |
| Intel Core i9-13900K @253W | |
| Intel Core i5-13600K @181W | |
| Intel Core i5-13600K | |
| Intel Core i9-12900K | |
| AMD Ryzen 9 7900X | |
| AMD Ryzen 5 7600X | |
| Intel Core i5-12600K | |
| Twofish Mean 100MB | |
| Intel Core i9-13900K | |
| Intel Core i9-13900K @253W | |
| NVIDIA GeForce RTX 3090 Founders Edition | |
| Intel Core i9-12900K | |
| Intel Core i5-13600K @181W | |
| Intel Core i5-13600K | |
| AMD Ryzen 9 7900X | |
| Intel Core i5-12600K | |
| AMD Ryzen 5 7600X | |
| Serpent Mean 100MB | |
| Intel Core i9-13900K | |
| Intel Core i9-13900K @253W | |
| NVIDIA GeForce RTX 3090 Founders Edition | |
| Intel Core i9-12900K | |
| Intel Core i5-13600K | |
| Intel Core i5-13600K @181W | |
| AMD Ryzen 9 7900X | |
| Intel Core i5-12600K | |
| AMD Ryzen 5 7600X | |
| Geekbench 5.5 | |
| Multi-Core | |
| NVIDIA GeForce RTX 3090 Founders Edition | |
| Intel Core i9-13900K | |
| Intel Core i9-13900K @253W | |
| AMD Ryzen 9 7900X | |
| Intel Core i9-12900K | |
| Intel Core i5-13600K @181W | |
| Intel Core i5-13600K | |
| Intel Core i5-12600K | |
| AMD Ryzen 5 7600X | |
| Single-Core | |
| NVIDIA GeForce RTX 3090 Founders Edition | |
| Intel Core i9-13900K | |
| Intel Core i9-13900K @253W | |
| AMD Ryzen 9 7900X | |
| AMD Ryzen 5 7600X | |
| Intel Core i9-12900K | |
| Intel Core i5-13600K @181W | |
| Intel Core i5-13600K | |
| Intel Core i5-12600K | |
| Geekbench 5.0 | |
| 5.0 Multi-Core | |
| NVIDIA GeForce RTX 3090 Founders Edition | |
| Intel Core i9-13900K | |
| Intel Core i9-13900K @253W | |
| AMD Ryzen 9 7900X | |
| Intel Core i9-12900K | |
| Intel Core i5-13600K | |
| Intel Core i5-13600K @181W | |
| Intel Core i5-12600K | |
| AMD Ryzen 5 7600X | |
| 5.0 Single-Core | |
| Intel Core i9-13900K @253W | |
| NVIDIA GeForce RTX 3090 Founders Edition | |
| Intel Core i9-13900K | |
| AMD Ryzen 9 7900X | |
| AMD Ryzen 5 7600X | |
| Intel Core i9-12900K | |
| Intel Core i5-13600K @181W | |
| Intel Core i5-13600K | |
| Intel Core i5-12600K | |
| Geekbench 4.4 | |
| 64 Bit Single-Core Score | |
| Intel Core i9-13900K @253W | |
| Intel Core i9-13900K | |
| NVIDIA GeForce RTX 3090 Founders Edition | |
| AMD Ryzen 9 7900X | |
| AMD Ryzen 5 7600X | |
| Intel Core i9-12900K | |
| Intel Core i5-13600K @181W | |
| Intel Core i5-13600K | |
| Intel Core i5-12600K | |
| 64 Bit Multi-Core Score | |
| NVIDIA GeForce RTX 3090 Founders Edition | |
| Intel Core i9-13900K | |
| Intel Core i9-13900K @253W | |
| AMD Ryzen 9 7900X | |
| Intel Core i9-12900K | |
| Intel Core i5-13600K @181W | |
| Intel Core i5-13600K | |
| AMD Ryzen 5 7600X | |
| Intel Core i5-12600K | |
| 3DMark 11 - 1280x720 Performance Physics | |
| Intel Core i9-13900K | |
| Intel Core i9-13900K @253W | |
| Intel Core i5-13600K | |
| Intel Core i5-13600K @181W | |
| AMD Ryzen 9 7900X | |
| NVIDIA GeForce RTX 3090 Founders Edition | |
| Intel Core i9-12900K | |
| AMD Ryzen 5 7600X | |
| Intel Core i5-12600K | |
| 7-Zip 18.03 | |
| 7z b 4 | |
| NVIDIA GeForce RTX 3090 Founders Edition | |
| Intel Core i9-13900K | |
| Intel Core i9-13900K @253W | |
| AMD Ryzen 9 7900X | |
| Intel Core i9-12900K | |
| Intel Core i5-13600K | |
| Intel Core i5-13600K @181W | |
| AMD Ryzen 5 7600X | |
| Intel Core i5-12600K | |
| 7z b 4 -mmt1 | |
| NVIDIA GeForce RTX 3090 Founders Edition | |
| AMD Ryzen 9 7900X | |
| AMD Ryzen 5 7600X | |
| Intel Core i9-13900K @253W | |
| Intel Core i9-13900K | |
| Intel Core i9-12900K | |
| Intel Core i5-13600K | |
| Intel Core i5-13600K @181W | |
| Intel Core i5-12600K | |
| HWBOT x265 Benchmark v2.2 - 4k Preset | |
| NVIDIA GeForce RTX 3090 Founders Edition | |
| Intel Core i9-13900K | |
| Intel Core i9-13900K @253W | |
| AMD Ryzen 9 7900X | |
| Intel Core i5-12600K | |
| Intel Core i9-12900K | |
| Intel Core i5-13600K | |
| Intel Core i5-13600K @181W | |
| AMD Ryzen 5 7600X | |
| R Benchmark 2.5 - Overall mean | |
| Intel Core i5-12600K | |
| Intel Core i9-12900K | |
| Intel Core i5-13600K | |
| Intel Core i5-13600K @181W | |
| AMD Ryzen 5 7600X | |
| AMD Ryzen 9 7900X | |
| NVIDIA GeForce RTX 3090 Founders Edition | |
| Intel Core i9-13900K | |
| Intel Core i9-13900K @253W | |
| LibreOffice - 20 Documents To PDF | |
| Intel Core i5-12600K | |
| Intel Core i9-12900K | |
| AMD Ryzen 5 7600X | |
| Intel Core i9-13900K | |
| Intel Core i5-13600K @181W | |
| NVIDIA GeForce RTX 3090 Founders Edition | |
| Intel Core i5-13600K | |
| AMD Ryzen 9 7900X | |
| Intel Core i9-13900K @253W | |
| WebXPRT 3 - Overall | |
| AMD Ryzen 9 7900X | |
| Intel Core i9-13900K @253W | |
| NVIDIA GeForce RTX 3090 Founders Edition | |
| AMD Ryzen 5 7600X | |
| Intel Core i9-13900K | |
| Intel Core i5-13600K | |
| Intel Core i5-13600K @181W | |
| Intel Core i9-12900K | |
| Intel Core i5-12600K | |
| Mozilla Kraken 1.1 - Total | |
| Intel Core i5-12600K | |
| Intel Core i9-12900K | |
| Intel Core i5-13600K | |
| Intel Core i5-13600K @181W | |
| AMD Ryzen 5 7600X | |
| NVIDIA GeForce RTX 3090 Founders Edition | |
| Intel Core i9-13900K | |
| AMD Ryzen 9 7900X | |
| Intel Core i9-13900K @253W | |
| 3DMark | |
| 3840x2160 Fire Strike Ultra Physics | |
| Intel Core i9-13900K @253W | |
| Intel Core i9-13900K | |
| AMD Ryzen 9 7900X | |
| NVIDIA GeForce RTX 3090 Founders Edition | |
| Intel Core i9-12900K | |
| Intel Core i5-13600K @181W | |
| Intel Core i5-13600K | |
| AMD Ryzen 5 7600X | |
| Intel Core i5-12600K | |
| 1920x1080 Fire Strike Physics | |
| Intel Core i9-13900K @253W | |
| Intel Core i9-13900K | |
| AMD Ryzen 9 7900X | |
| NVIDIA GeForce RTX 3090 Founders Edition | |
| Intel Core i9-12900K | |
| Intel Core i5-13600K @181W | |
| Intel Core i5-13600K | |
| AMD Ryzen 5 7600X | |
| Intel Core i5-12600K | |
| 2560x1440 Time Spy CPU | |
| Intel Core i9-13900K @253W | |
| Intel Core i9-13900K | |
| Intel Core i9-12900K | |
| Intel Core i5-13600K | |
| Intel Core i5-13600K @181W | |
| AMD Ryzen 9 7900X | |
| NVIDIA GeForce RTX 3090 Founders Edition | |
| Intel Core i5-12600K | |
| AMD Ryzen 5 7600X | |
* ... Moindre est la valeur, meilleures sont les performances
Intel Core i9-13900K + Intel Core i5-13600K vs. Cinebench R15 multi boucle
Dans le test de charge, où nous exécutons la boucle constante Cinebench R15, les deux unités de test montrent une performance très stable. Cependant, nous devons tout de même mentionner que l'Intel Core i9-13900K fonctionne constamment à la limite de la température. Mais à plus de 2 000 points, l'augmentation des performances par rapport au Intel Core i9-12900Kest encore énorme. Avec une moyenne de 3 620 points sur l'ensemble des 50 tests, l'Intel Core i5-13600K mérite également d'être mentionné.
Bancs d'essai synthétiques et performances des applications
Alors que les benchmarks synthétiques étaient encore clairement le domaine d'Intel dans la version Alder Lake de l'année dernière, les choses ne semblent pas aussi claires cette année. AMD est capable de maintenir le rythme avec ses processeurs Ryzen 9, et Intel n'obtient que la troisième place dans le benchmark PCMark 10. Cependant, par rapport à Alder Lake, Raptor Lake est capable de se placer en tête tout au long de l'année, mettant en œuvre une bonne performance.
| PCMark 10 - Score | |
| AMD Ryzen 9 7900X, NVIDIA GeForce RTX 3090 | |
| NVIDIA GeForce RTX 3090 Founders Edition, NVIDIA GeForce RTX 3090 | |
| Intel Core i9-13900K, NVIDIA GeForce RTX 3090 | |
| AMD Ryzen 5 7600X, NVIDIA GeForce RTX 3090 | |
| Intel Core i5-13600K, NVIDIA GeForce RTX 3090 | |
| Intel Core i9-12900K, NVIDIA Titan RTX | |
| Intel Core i5-12600K, NVIDIA Titan RTX | |
| 3DMark | |
| 1920x1080 Fire Strike Physics | |
| Intel Core i9-13900K @253W, NVIDIA GeForce RTX 3090 | |
| Intel Core i9-13900K, NVIDIA GeForce RTX 3090 | |
| AMD Ryzen 9 7900X, NVIDIA GeForce RTX 3090 | |
| NVIDIA GeForce RTX 3090 Founders Edition, NVIDIA GeForce RTX 3090 | |
| Intel Core i9-12900K, NVIDIA Titan RTX | |
| Intel Core i5-13600K @181W, NVIDIA GeForce RTX 3090 | |
| Intel Core i5-13600K, NVIDIA GeForce RTX 3090 | |
| AMD Ryzen 5 7600X, NVIDIA GeForce RTX 3090 | |
| Intel Core i5-12600K, NVIDIA Titan RTX | |
| 2560x1440 Time Spy CPU | |
| Intel Core i9-13900K @253W, NVIDIA GeForce RTX 3090 | |
| Intel Core i9-13900K, NVIDIA GeForce RTX 3090 | |
| Intel Core i9-12900K, NVIDIA Titan RTX | |
| Intel Core i5-13600K, NVIDIA GeForce RTX 3090 | |
| Intel Core i5-13600K @181W, NVIDIA GeForce RTX 3090 | |
| AMD Ryzen 9 7900X, NVIDIA GeForce RTX 3090 | |
| NVIDIA GeForce RTX 3090 Founders Edition, NVIDIA GeForce RTX 3090 | |
| Intel Core i5-12600K, NVIDIA Titan RTX | |
| AMD Ryzen 5 7600X, NVIDIA GeForce RTX 3090 | |
| 3DMark 11 - 1280x720 Performance Physics | |
| Intel Core i9-13900K, NVIDIA GeForce RTX 3090 | |
| Intel Core i9-13900K @253W, NVIDIA GeForce RTX 3090 | |
| Intel Core i5-13600K, NVIDIA GeForce RTX 3090 | |
| Intel Core i5-13600K @181W, NVIDIA GeForce RTX 3090 | |
| AMD Ryzen 9 7900X, NVIDIA GeForce RTX 3090 | |
| NVIDIA GeForce RTX 3090 Founders Edition, NVIDIA GeForce RTX 3090 | |
| Intel Core i9-12900K, NVIDIA Titan RTX | |
| AMD Ryzen 5 7600X, NVIDIA GeForce RTX 3090 | |
| Intel Core i5-12600K, NVIDIA Titan RTX | |
| Desktop-PC, NVIDIA GeForce RTX 3090 | |
| CrossMark - Overall | |
| Intel Core i9-13900K, NVIDIA GeForce RTX 3090 | |
| Intel Core i9-13900K @253W, NVIDIA GeForce RTX 3090 | |
| NVIDIA GeForce RTX 3090 Founders Edition, NVIDIA GeForce RTX 3090 | |
| AMD Ryzen 9 7900X, NVIDIA GeForce RTX 3090 | |
| Intel Core i5-13600K, NVIDIA GeForce RTX 3090 | |
| Intel Core i5-13600K @181W, NVIDIA GeForce RTX 3090 | |
| AMD Ryzen 5 7600X, NVIDIA GeForce RTX 3090 | |
| Intel Core i5-12600K, NVIDIA GeForce RTX 3090 | |
| AIDA64 / Memory Copy | |
| Intel Core i9-13900K @253W | |
| Intel Core i9-13900K | |
| Intel Core i5-13600K @181W | |
| Intel Core i9-12900K | |
| NVIDIA GeForce RTX 3090 Founders Edition | |
| Intel Core i5-13600K | |
| Intel Core i5-12600K | |
| AMD Ryzen 9 7900X | |
| AMD Ryzen 5 7600X | |
| Moyenne de la classe (4514 - 234662, n=2209) | |
| AIDA64 / Memory Read | |
| Intel Core i9-13900K | |
| Intel Core i9-13900K @253W | |
| Intel Core i9-12900K | |
| NVIDIA GeForce RTX 3090 Founders Edition | |
| Intel Core i5-13600K @181W | |
| Intel Core i5-12600K | |
| Intel Core i5-13600K | |
| AMD Ryzen 9 7900X | |
| AMD Ryzen 5 7600X | |
| Moyenne de la classe (4031 - 271066, n=2171) | |
| AIDA64 / Memory Write | |
| AMD Ryzen 5 7600X | |
| NVIDIA GeForce RTX 3090 Founders Edition | |
| AMD Ryzen 9 7900X | |
| Intel Core i9-13900K | |
| Intel Core i5-13600K @181W | |
| Intel Core i9-13900K @253W | |
| Intel Core i5-12600K | |
| Intel Core i9-12900K | |
| Intel Core i5-13600K | |
| Moyenne de la classe (3506 - 242868, n=2176) | |
| AIDA64 / Memory Latency | |
| Moyenne de la classe (6.1 - 536, n=2238) | |
| Intel Core i5-13600K | |
| Intel Core i9-13900K @253W | |
| Intel Core i9-13900K | |
| Intel Core i5-13600K @181W | |
| AMD Ryzen 5 7600X | |
| AMD Ryzen 9 7900X | |
| NVIDIA GeForce RTX 3090 Founders Edition | |
* ... Moindre est la valeur, meilleures sont les performances
Performances en matière de jeux
Les années précédentes, s'il s'agissait de trouver le processeur de jeu le plus rapide, on pouvait toujours compter sur Intel. Cependant, AMD a ensuite su mélanger les choses avec ses processeurs Zen 4, de sorte qu'il n'y a pas de gagnant clair ici. Dans la comparaison cumulée des onze jeux, l'Intel Core i9-13900K se place à peine derrière l'AMD Ryzen 9 7950X. Cependant, si l'on considère également la catégorie de prix des processeurs, le Core i9-13900K d'Intel est capable de se placer juste devant l'AMD Ryzen 9 7900X. Mais il ne faut pas oublier qu'il y a des jeux qui fonctionnent mieux avec les processeurs Intel, et d'autres, où les processeurs AMD fournissent les meilleures performances. Dans la comparaison interne entre les deux processeurs Raptor Lake S, le Intel Core i5-13600Kne perd que 7 % par rapport au processeur phare. Ceux qui utilisent toujours une carte mère AM4 peuvent également jeter un coup d'œil au AMD Ryzen 7 5800X3Dcar ce processeur offre également de très bonnes performances dans les jeux.
Les processeurs Intel Core i9-13900K et Intel Core i5-13600K offrent tous deux de très bonnes performances de jeu. Dans la limite du CPU, nous mesurons quelques différences de performance significatives entre les deux concurrents, mais avec l'augmentation de la résolution et des détails, cela devient de moins en moins significatif. Nous ne sommes pas en mesure de donner à Intel la couronne du CPU de jeu le plus rapide cette année, car AMD est un peu plus rapide avec le Ryzen 9 7950X. Les scores de tous les concurrents se rapprochent à nouveau. Ceux qui, outre le jeu, font également du streaming et veulent inclure le public bénéficieront du nombre plus élevé de threads, ce qui rend également les processeurs Raptor Lake actuels très intéressants pour les créateurs de contenu.
Gaming Performance - Raptor Lake vs. Alder Lake
| Performance rating - Percent | |
| Intel Core i9-13900K | |
| Intel Core i9-12900K | |
| Intel Core i5-13600K | |
| Intel Core i5-12600K -2! | |
| F1 22 | |
| 1920x1080 Low Preset AA:T AF:16x | |
| Intel Core i5-13600K | |
| Intel Core i9-13900K | |
| Intel Core i9-12900K | |
| Intel Core i5-12600K | |
| 1920x1080 Ultra High Preset AA:T AF:16x | |
| Intel Core i9-12900K | |
| Intel Core i5-12600K | |
| Intel Core i5-13600K | |
| Intel Core i9-13900K | |
| Far Cry 5 | |
| 1920x1080 Ultra Preset AA:T | |
| Intel Core i9-13900K | |
| Intel Core i5-13600K | |
| Intel Core i9-12900K | |
| Intel Core i5-12600K | |
| 1280x720 Low Preset AA:T | |
| Intel Core i9-13900K | |
| Intel Core i5-13600K | |
| Intel Core i9-12900K | |
| Intel Core i5-12600K | |
| X-Plane 11.11 | |
| 1920x1080 high (fps_test=3) | |
| Intel Core i9-13900K | |
| Intel Core i9-12900K | |
| Intel Core i5-13600K | |
| Intel Core i5-12600K | |
| 1280x720 low (fps_test=1) | |
| Intel Core i9-13900K | |
| Intel Core i9-12900K | |
| Intel Core i5-13600K | |
| Intel Core i5-12600K | |
| Final Fantasy XV Benchmark | |
| 1920x1080 High Quality | |
| Intel Core i5-13600K | |
| Intel Core i9-13900K | |
| Intel Core i9-12900K | |
| Intel Core i5-12600K | |
| 1280x720 Lite Quality | |
| Intel Core i5-13600K | |
| Intel Core i9-13900K | |
| Intel Core i9-12900K | |
| Intel Core i5-12600K | |
| Dota 2 Reborn | |
| 1920x1080 ultra (3/3) best looking | |
| Intel Core i9-13900K | |
| Intel Core i5-13600K | |
| Intel Core i9-12900K | |
| Intel Core i5-12600K | |
| 1280x720 min (0/3) fastest | |
| Intel Core i9-13900K | |
| Intel Core i5-13600K | |
| Intel Core i9-12900K | |
| Intel Core i5-12600K | |
| The Witcher 3 | |
| 1920x1080 Ultra Graphics & Postprocessing (HBAO+) | |
| Intel Core i5-13600K | |
| Intel Core i9-12900K | |
| Intel Core i9-13900K | |
| 1024x768 Low Graphics & Postprocessing | |
| Intel Core i9-13900K | |
| Intel Core i9-12900K | |
| Intel Core i5-13600K | |
| GTA V | |
| 1920x1080 Highest AA:4xMSAA + FX AF:16x | |
| Intel Core i9-13900K | |
| Intel Core i5-13600K | |
| Intel Core i9-12900K | |
| Intel Core i5-12600K | |
| 1024x768 Lowest Settings possible | |
| Intel Core i9-13900K | |
| Intel Core i5-13600K | |
| Intel Core i9-12900K | |
| Intel Core i5-12600K | |
Gaming Performance in Direct Comparison with AMD
| Performance rating - Percent | |
| AMD Ryzen 9 7950X | |
| Intel Core i9-13900K | |
| AMD Ryzen 9 7900X | |
| AMD Ryzen 5 7600X | |
| Intel Core i5-13600K | |
| F1 22 | |
| 1920x1080 Low Preset AA:T AF:16x | |
| AMD Ryzen 9 7950X | |
| AMD Ryzen 9 7900X | |
| AMD Ryzen 5 7600X | |
| Intel Core i5-13600K | |
| Intel Core i9-13900K | |
| 1920x1080 Ultra High Preset AA:T AF:16x | |
| AMD Ryzen 9 7950X | |
| Intel Core i5-13600K | |
| AMD Ryzen 5 7600X | |
| AMD Ryzen 9 7900X | |
| Intel Core i9-13900K | |
| Far Cry 5 | |
| 1920x1080 Ultra Preset AA:T | |
| Intel Core i9-13900K | |
| AMD Ryzen 9 7950X | |
| Intel Core i5-13600K | |
| AMD Ryzen 9 7900X | |
| AMD Ryzen 5 7600X | |
| 1280x720 Low Preset AA:T | |
| Intel Core i9-13900K | |
| AMD Ryzen 9 7900X | |
| Intel Core i5-13600K | |
| AMD Ryzen 9 7950X | |
| AMD Ryzen 5 7600X | |
| X-Plane 11.11 | |
| 1920x1080 high (fps_test=3) | |
| AMD Ryzen 9 7900X | |
| AMD Ryzen 9 7950X | |
| AMD Ryzen 5 7600X | |
| Intel Core i9-13900K | |
| Intel Core i5-13600K | |
| 1280x720 low (fps_test=1) | |
| Intel Core i9-13900K | |
| AMD Ryzen 5 7600X | |
| AMD Ryzen 9 7900X | |
| AMD Ryzen 9 7950X | |
| Intel Core i5-13600K | |
| Final Fantasy XV Benchmark | |
| 1920x1080 High Quality | |
| AMD Ryzen 9 7900X | |
| Intel Core i5-13600K | |
| Intel Core i9-13900K | |
| AMD Ryzen 9 7950X | |
| AMD Ryzen 5 7600X | |
| 1280x720 Lite Quality | |
| AMD Ryzen 9 7900X | |
| Intel Core i5-13600K | |
| AMD Ryzen 9 7950X | |
| Intel Core i9-13900K | |
| AMD Ryzen 5 7600X | |
| Dota 2 Reborn | |
| 1920x1080 ultra (3/3) best looking | |
| AMD Ryzen 9 7950X | |
| AMD Ryzen 9 7900X | |
| Intel Core i9-13900K | |
| AMD Ryzen 5 7600X | |
| Intel Core i5-13600K | |
| 1280x720 min (0/3) fastest | |
| AMD Ryzen 5 7600X | |
| AMD Ryzen 9 7900X | |
| AMD Ryzen 9 7950X | |
| Intel Core i9-13900K | |
| Intel Core i5-13600K | |
| The Witcher 3 | |
| 1920x1080 Ultra Graphics & Postprocessing (HBAO+) | |
| AMD Ryzen 9 7950X | |
| AMD Ryzen 9 7900X | |
| AMD Ryzen 5 7600X | |
| Intel Core i5-13600K | |
| Intel Core i9-13900K | |
| 1024x768 Low Graphics & Postprocessing | |
| AMD Ryzen 9 7950X | |
| AMD Ryzen 9 7900X | |
| Intel Core i9-13900K | |
| AMD Ryzen 5 7600X | |
| Intel Core i5-13600K | |
| GTA V | |
| 1920x1080 Highest AA:4xMSAA + FX AF:16x | |
| Intel Core i9-13900K | |
| AMD Ryzen 9 7950X | |
| AMD Ryzen 9 7900X | |
| AMD Ryzen 5 7600X | |
| Intel Core i5-13600K | |
| 1024x768 Lowest Settings possible | |
| Intel Core i9-13900K | |
| AMD Ryzen 9 7900X | |
| AMD Ryzen 5 7600X | |
| Intel Core i5-13600K | |
| AMD Ryzen 9 7950X | |
| Borderlands 3 | |
| 1280x720 Very Low Overall Quality (DX11) | |
| AMD Ryzen 9 7900X | |
| Intel Core i9-13900K | |
| AMD Ryzen 9 7950X | |
| AMD Ryzen 5 7600X | |
| Intel Core i5-13600K | |
| 1920x1080 Badass Overall Quality (DX11) | |
| AMD Ryzen 9 7950X | |
| AMD Ryzen 9 7900X | |
| Intel Core i9-13900K | |
| AMD Ryzen 5 7600X | |
| Intel Core i5-13600K | |
| Far Cry New Dawn | |
| 1280x720 Low Preset | |
| Intel Core i9-13900K | |
| AMD Ryzen 9 7950X | |
| Intel Core i5-13600K | |
| AMD Ryzen 9 7900X | |
| AMD Ryzen 5 7600X | |
| 1920x1080 Ultra Preset | |
| Intel Core i9-13900K | |
| AMD Ryzen 9 7950X | |
| Intel Core i5-13600K | |
| AMD Ryzen 9 7900X | |
| AMD Ryzen 5 7600X | |
| Shadow of the Tomb Raider | |
| 1280x720 Lowest Preset | |
| AMD Ryzen 9 7950X | |
| AMD Ryzen 9 7900X | |
| Intel Core i9-13900K | |
| AMD Ryzen 5 7600X | |
| Intel Core i5-13600K | |
| 1920x1080 Highest Preset AA:T | |
| AMD Ryzen 9 7900X | |
| AMD Ryzen 9 7950X | |
| Intel Core i9-13900K | |
| AMD Ryzen 5 7600X | |
| Intel Core i5-13600K | |
| Tiny Tina's Wonderlands | |
| 1920x1080 Low Preset (DX12) | |
| AMD Ryzen 9 7950X | |
| Intel Core i9-13900K | |
| AMD Ryzen 5 7600X | |
| AMD Ryzen 9 7900X | |
| Intel Core i5-13600K | |
| 1920x1080 Badass Preset (DX12) | |
| AMD Ryzen 9 7900X | |
| AMD Ryzen 5 7600X | |
| AMD Ryzen 9 7950X | |
| Intel Core i9-13900K | |
| Intel Core i5-13600K | |
Intel Core i9-13900K with Nvidia GeForce RTX 3090
| Bas | Moyen | Élevé | Ultra | QHD | 4K | |
|---|---|---|---|---|---|---|
| GTA V (2015) | 187.7 | 187.7 | 187.4 | 165.6 | 156.7 | 182.5 |
| The Witcher 3 (2015) | 752 | 584 | 368 | 179.8 | 151.6 | |
| Dota 2 Reborn (2015) | 285.3 | 256.1 | 243.7 | 229.2 | 215.9 | |
| Final Fantasy XV Benchmark (2018) | 234 | 233 | 188.9 | 148.2 | 88.5 | |
| X-Plane 11.11 (2018) | 234 | 202 | 148.4 | 128.4 | ||
| Far Cry 5 (2018) | 263 | 232 | 220 | 205 | 186 | 110 |
| Strange Brigade (2018) | 749 | 506 | 402 | 350 | 266 | 159 |
| Shadow of the Tomb Raider (2018) | 314 | 265 | 250 | 230 | 167.4 | 97.1 |
| Far Cry New Dawn (2019) | 221 | 191 | 183 | 166 | 156 | 111 |
| Metro Exodus (2019) | 285 | 217 | 173.9 | 141.3 | 116.4 | 76.2 |
| Borderlands 3 (2019) | 243 | 215 | 190.3 | 163 | 128.3 | 73.1 |
| F1 2020 (2020) | 515 | 438 | 407 | 297 | 233 | 142.4 |
| F1 2021 (2021) | 590 | 520 | 435 | 224 | 171.8 | 103.4 |
| Far Cry 6 (2021) | 226 | 192.3 | 169.2 | 159.1 | 133.5 | 84.5 |
| Forza Horizon 5 (2021) | 334 | 214 | 196 | 127 | 113 | 85 |
| God of War (2022) | 240 | 204 | 170.8 | 121.9 | 108.4 | 77.1 |
| Tiny Tina's Wonderlands (2022) | 368 | 297 | 209 | 165.8 | 121.7 | 69.2 |
| F1 22 (2022) | 320 | 338 | 308 | 122.6 | 82.5 | 41.8 |
| The Quarry (2022) | 279 | 217 | 177.3 | 146.1 | 104.6 | 59 |
Intel Core i5-13600K with Nvidia GeForce RTX 3090
| Bas | Moyen | Élevé | Ultra | QHD | 4K | |
|---|---|---|---|---|---|---|
| GTA V (2015) | 187.5 | 187.5 | 186.7 | 154.9 | 148.5 | 180.7 |
| The Witcher 3 (2015) | 611 | 551 | 369 | 183.2 | 152.8 | |
| Dota 2 Reborn (2015) | 246.2 | 224.6 | 216.8 | 205.4 | 200.4 | |
| Final Fantasy XV Benchmark (2018) | 235 | 230 | 189.7 | 145.6 | 86.8 | |
| X-Plane 11.11 (2018) | 200 | 175.3 | 131.4 | 112.7 | ||
| Far Cry 5 (2018) | 240 | 212 | 201 | 188 | 177 | 108 |
| Strange Brigade (2018) | 679 | 487 | 398 | 348 | 265 | 158.4 |
| Shadow of the Tomb Raider (2018) | 269 | 240 | 234 | 220 | 167.1 | 96.4 |
| Far Cry New Dawn (2019) | 201 | 176 | 170 | 153 | 146 | 108 |
| Metro Exodus (2019) | 272 | 218 | 173 | 140.8 | 115.5 | 75.7 |
| Borderlands 3 (2019) | 223 | 195.3 | 176.3 | 156.3 | 128.3 | 73.2 |
| F1 2020 (2020) | 456 | 383 | 376 | 295 | 233 | 142.1 |
| F1 2021 (2021) | 512 | 474 | 399 | 223 | 171.8 | 101.8 |
| Far Cry 6 (2021) | 195.3 | 183.1 | 170.8 | 151.2 | 132.4 | 84.1 |
| God of War (2022) | 228 | 205 | 168.9 | 122 | 106.5 | 76.5 |
| GRID Legends (2022) | 287 | 261 | 232 | 156 | 177.8 | 115.1 |
| Tiny Tina's Wonderlands (2022) | 358 | 290 | 208 | 165.1 | 120.8 | 68.8 |
| F1 22 (2022) | 322 | 373 | 432 | 128.1 | 84.1 | 42.4 |
| The Quarry (2022) | 270 | 213 | 177.9 | 145.9 | 105 | 59.4 |
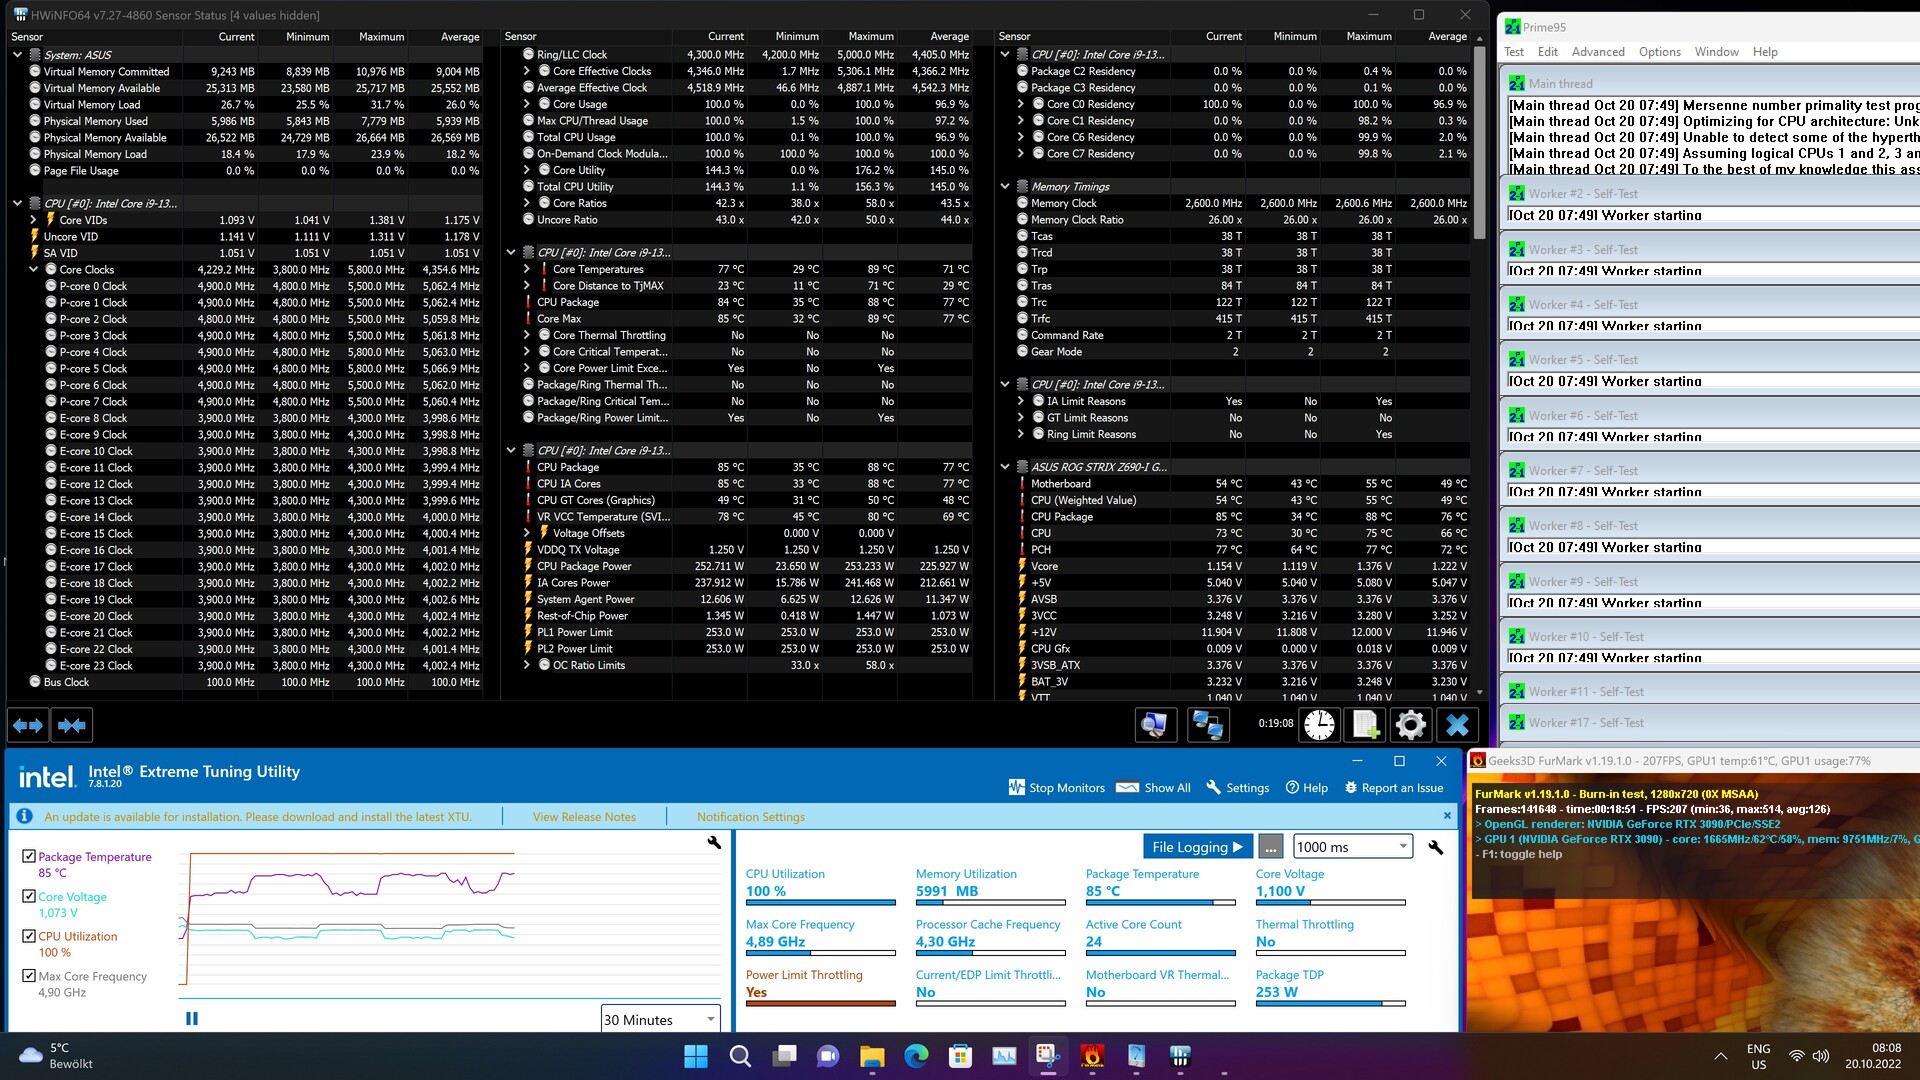
Consommation d'énergie
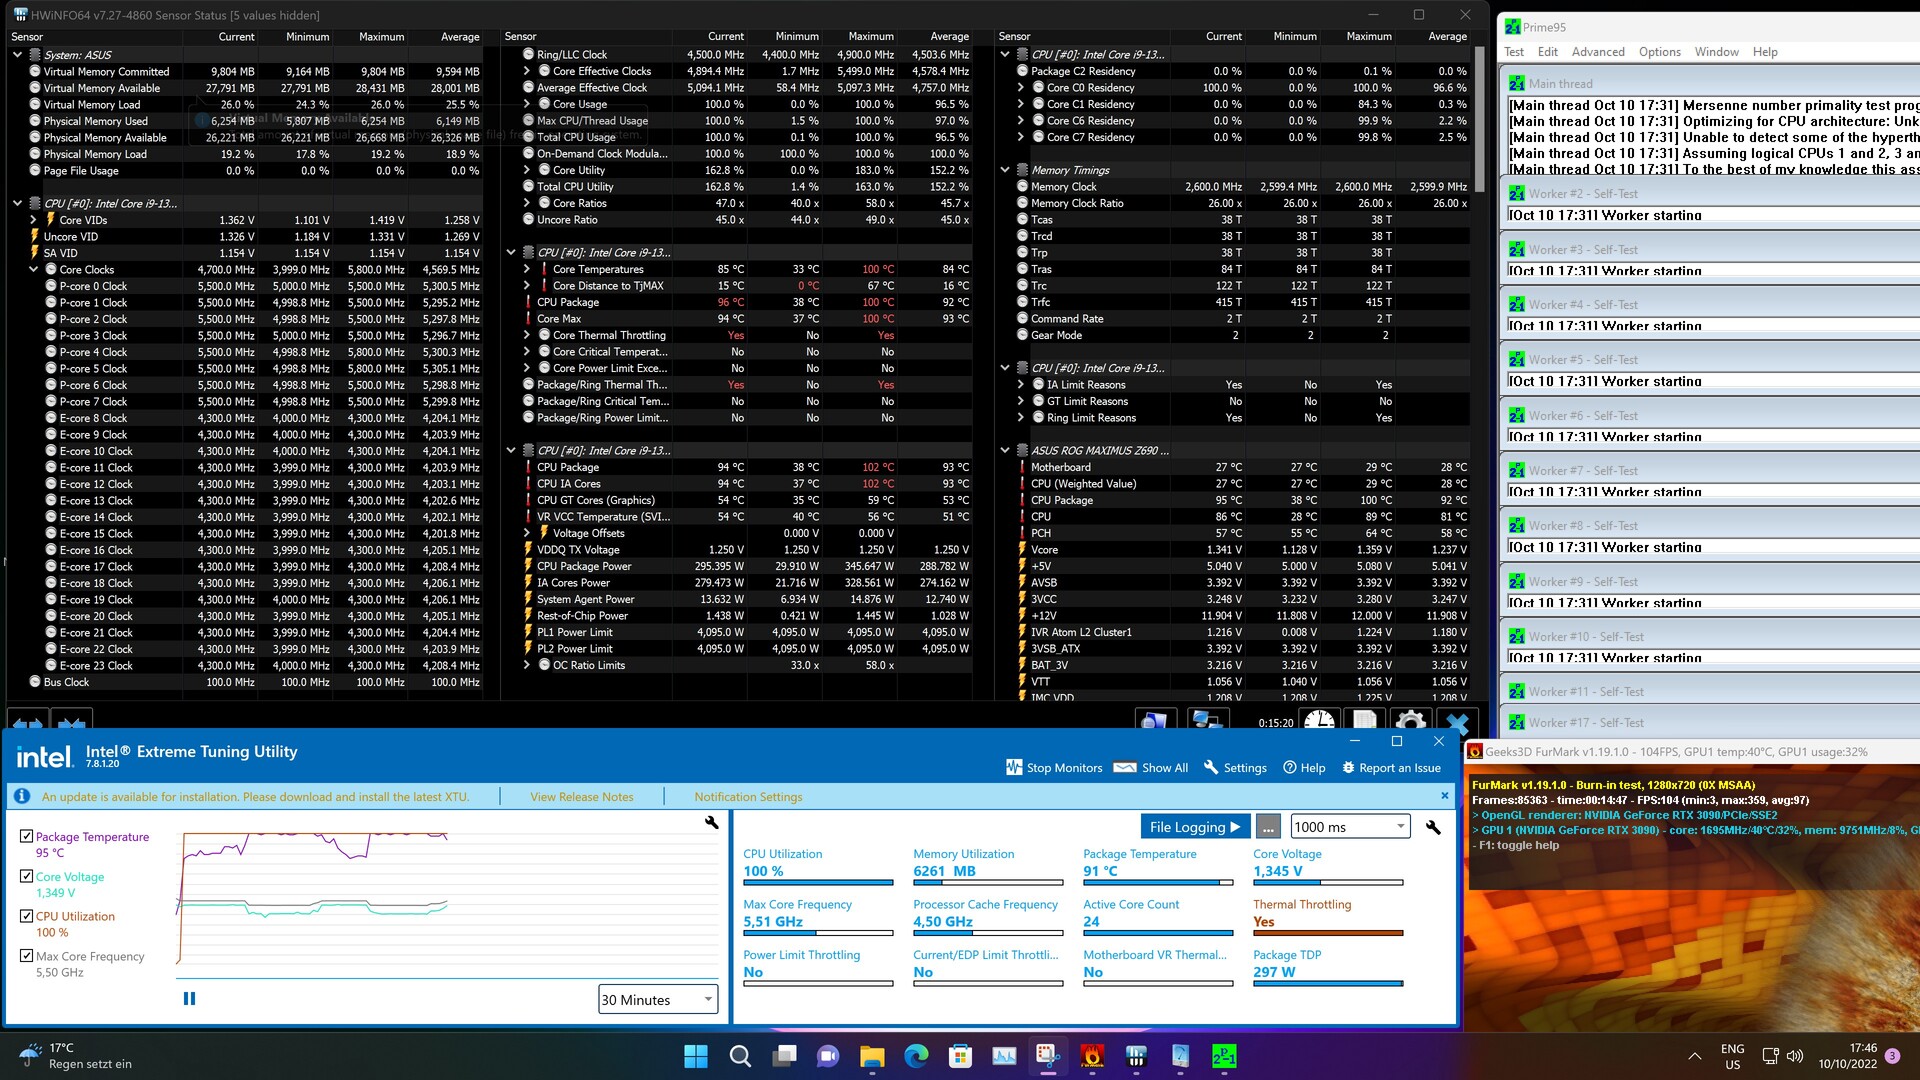
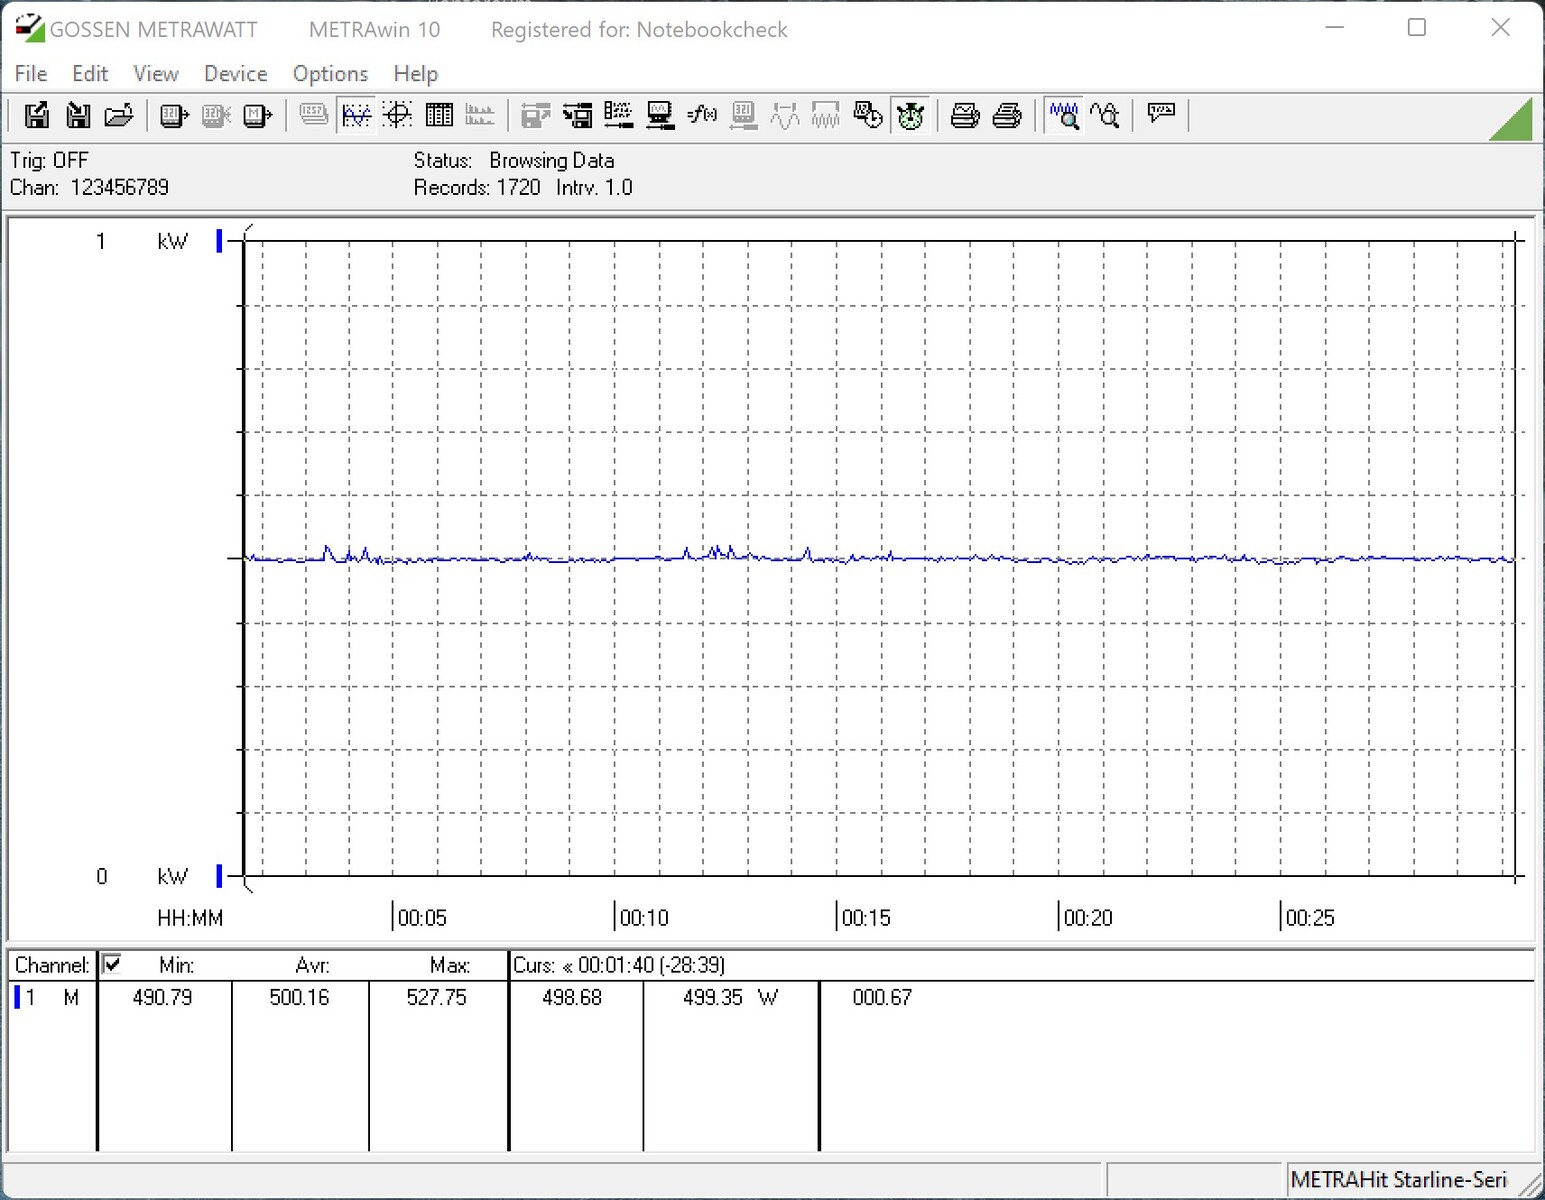
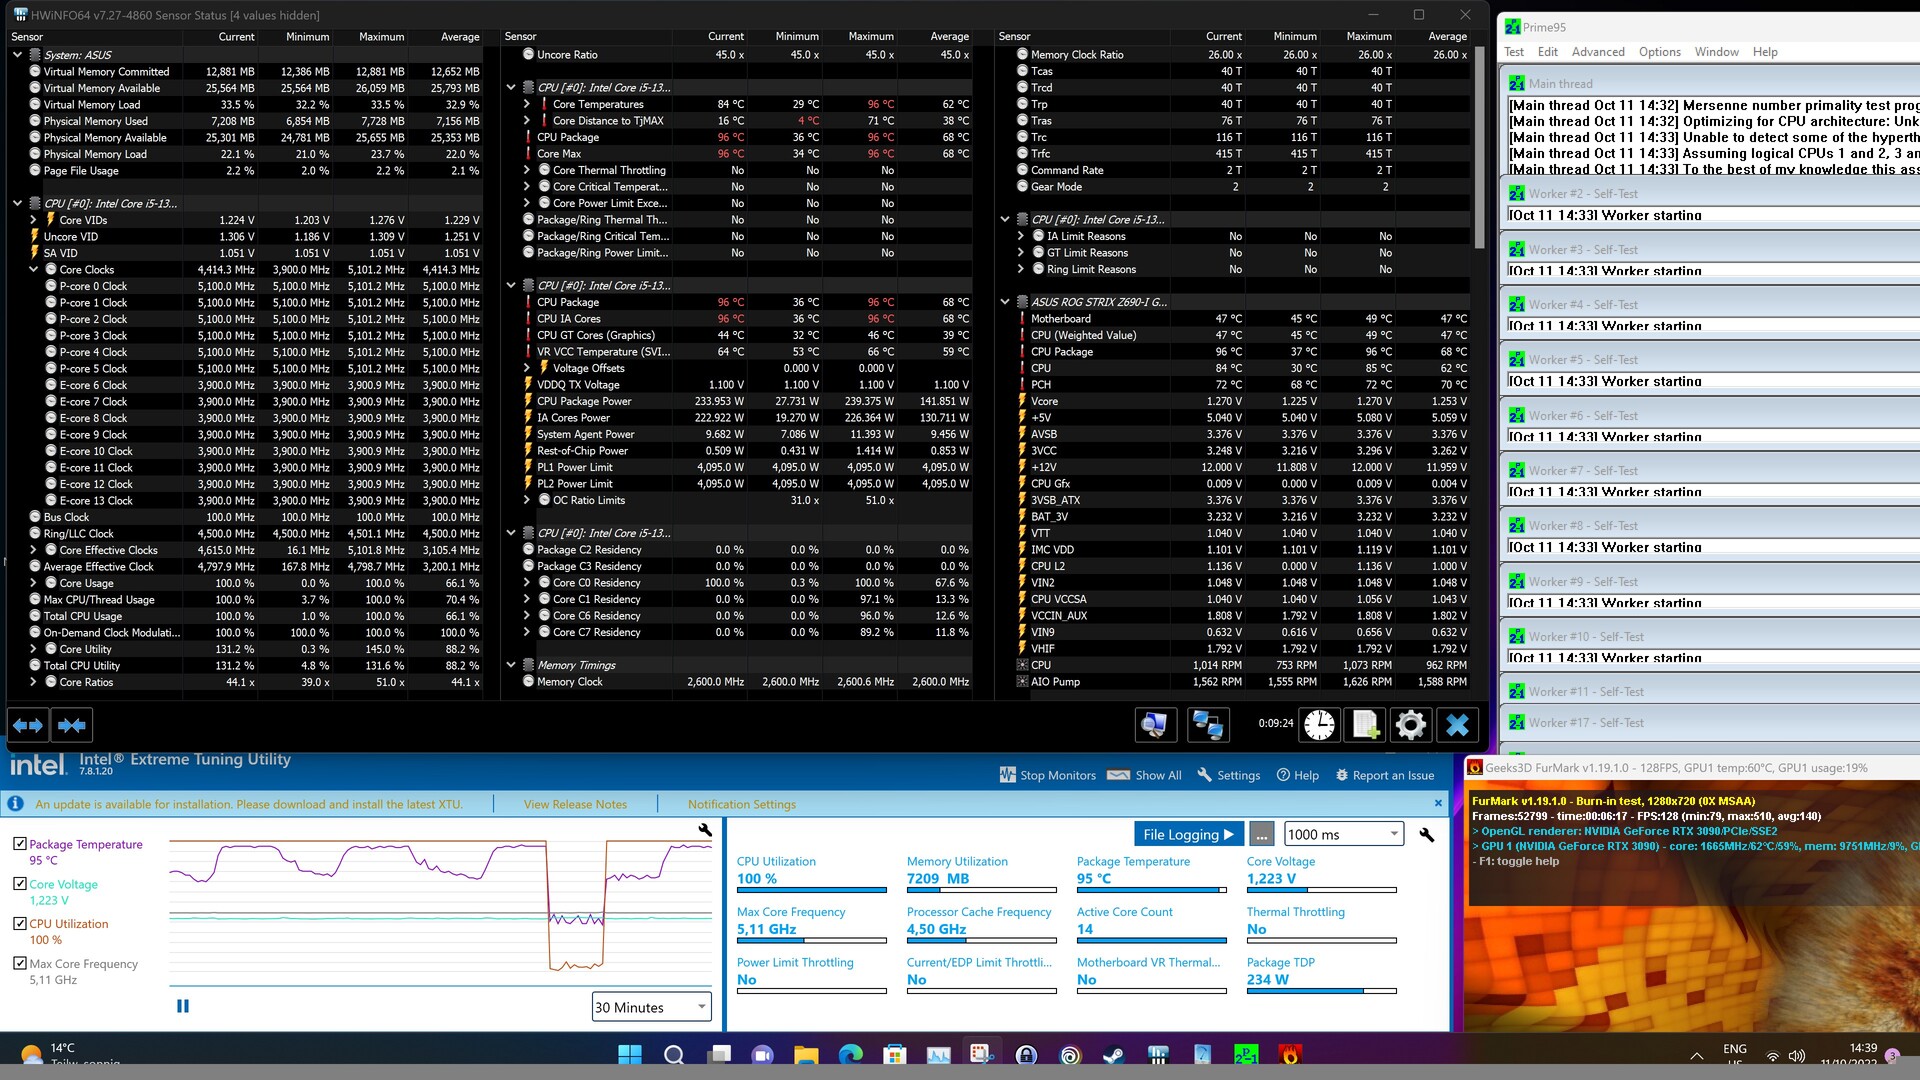
Selon les spécifications techniques, les processeurs continuent d'offrir un TDP de 125 watts. Il s'agit de la valeur PL1. La valeur PL2 indique combien de watts le processeur est autorisé à consommer à pleine charge, si toutes les conditions sont remplies. Si toutes les restrictions sont activées dans le BIOS, l'Intel Core i9-13900K peut consommer un maximum de 253 watts. Pour l'Intel Core i5-13600K, c'est encore 181 watts. Si toutes les restrictions sont désactivées, il n'y a pas de limitation directe de la consommation électrique, ce qui signifie implicitement que seule la limite de température est capable de ralentir le CPU. Il n'est donc pas surprenant que nous continuions à atteindre la barre des 100 °C (212 °F) pendant nos tests de stress. À ce moment-là, nous mesurons 345 watts pour le Core i9-13900K et 240 watts pour le Core i5-13600K. Avec cela, l'utilisation d'un bon système de refroidissement augmentera la consommation d'énergie de manière assez importante
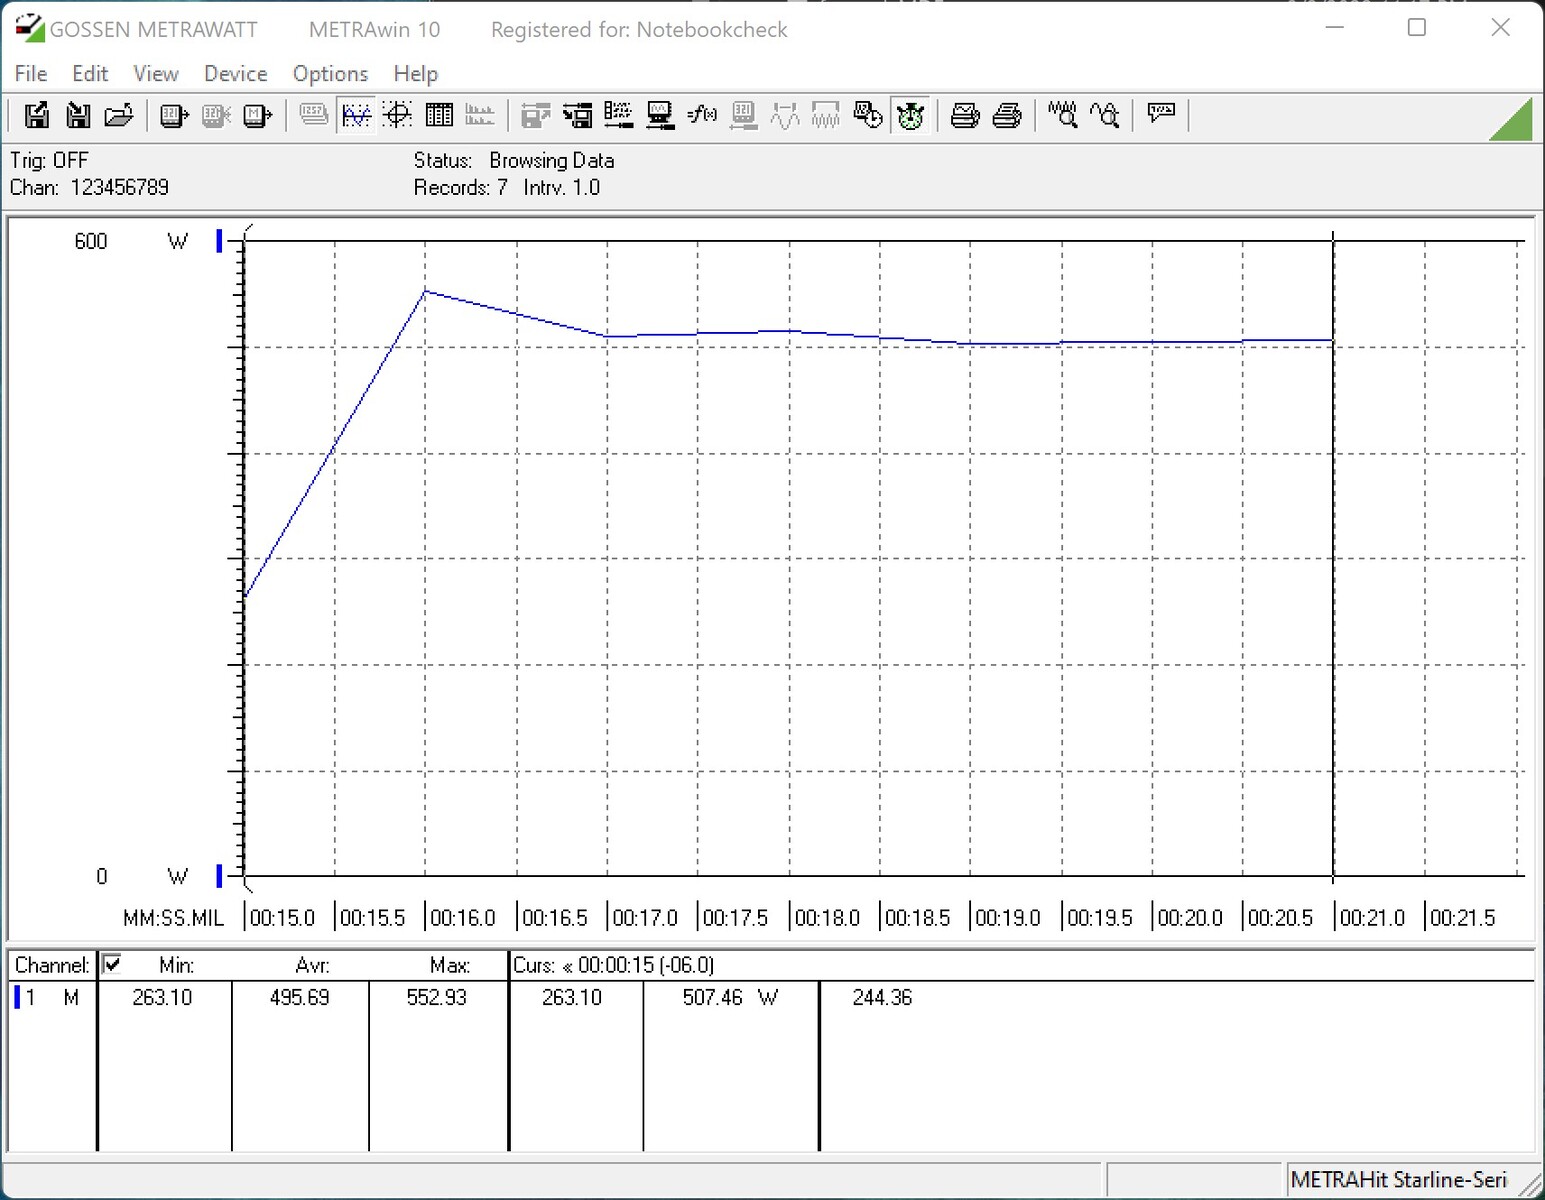
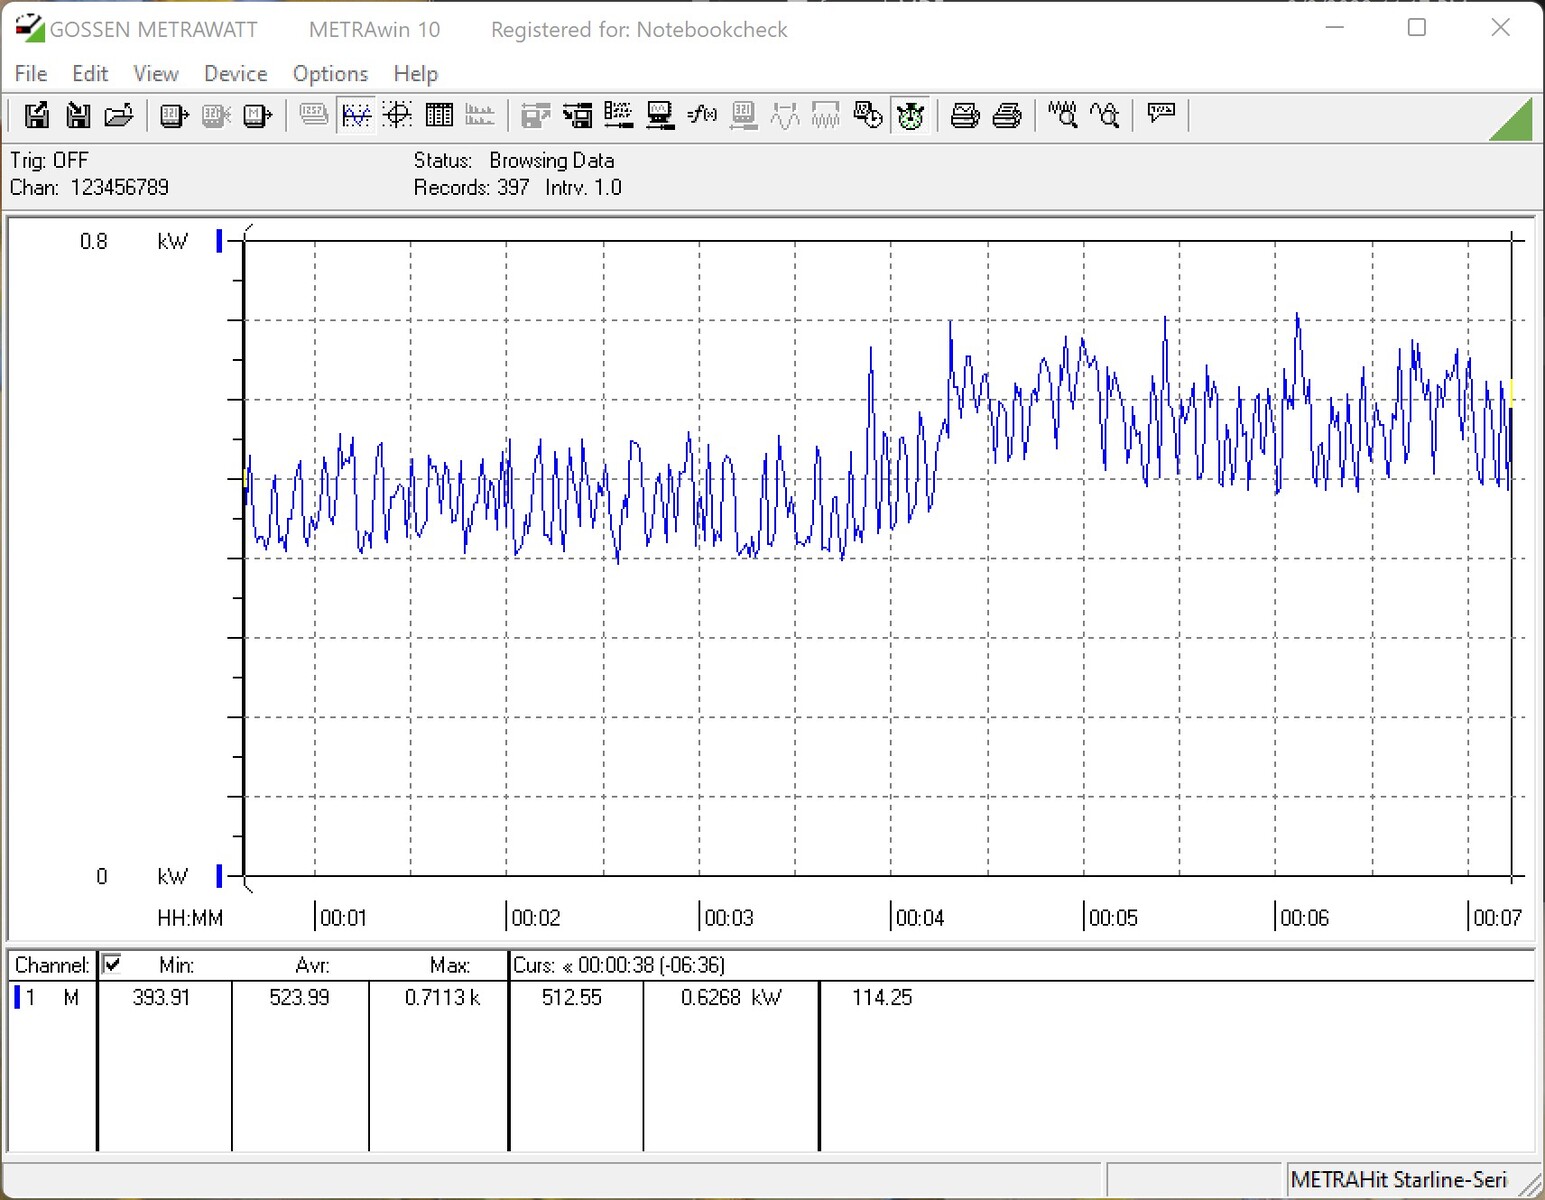
Nous avons mesuré une consommation d'énergie de 480 watts pour notre système de test pendant le test multi Cinebench R15. Cela représente 48% ou presque 160 watts de plus à fournir par le bloc d'alimentation par rapport à l'Intel Core i9-12900K. Pour l'Intel Core i5-13600K, l'augmentation n'est pas non plus négligeable avec 39% ou 80 watts supplémentaires. En jouant, la consommation d'énergie est légèrement inférieure. Cependant, nous mesurons toujours au moins 500 watts en moyenne.
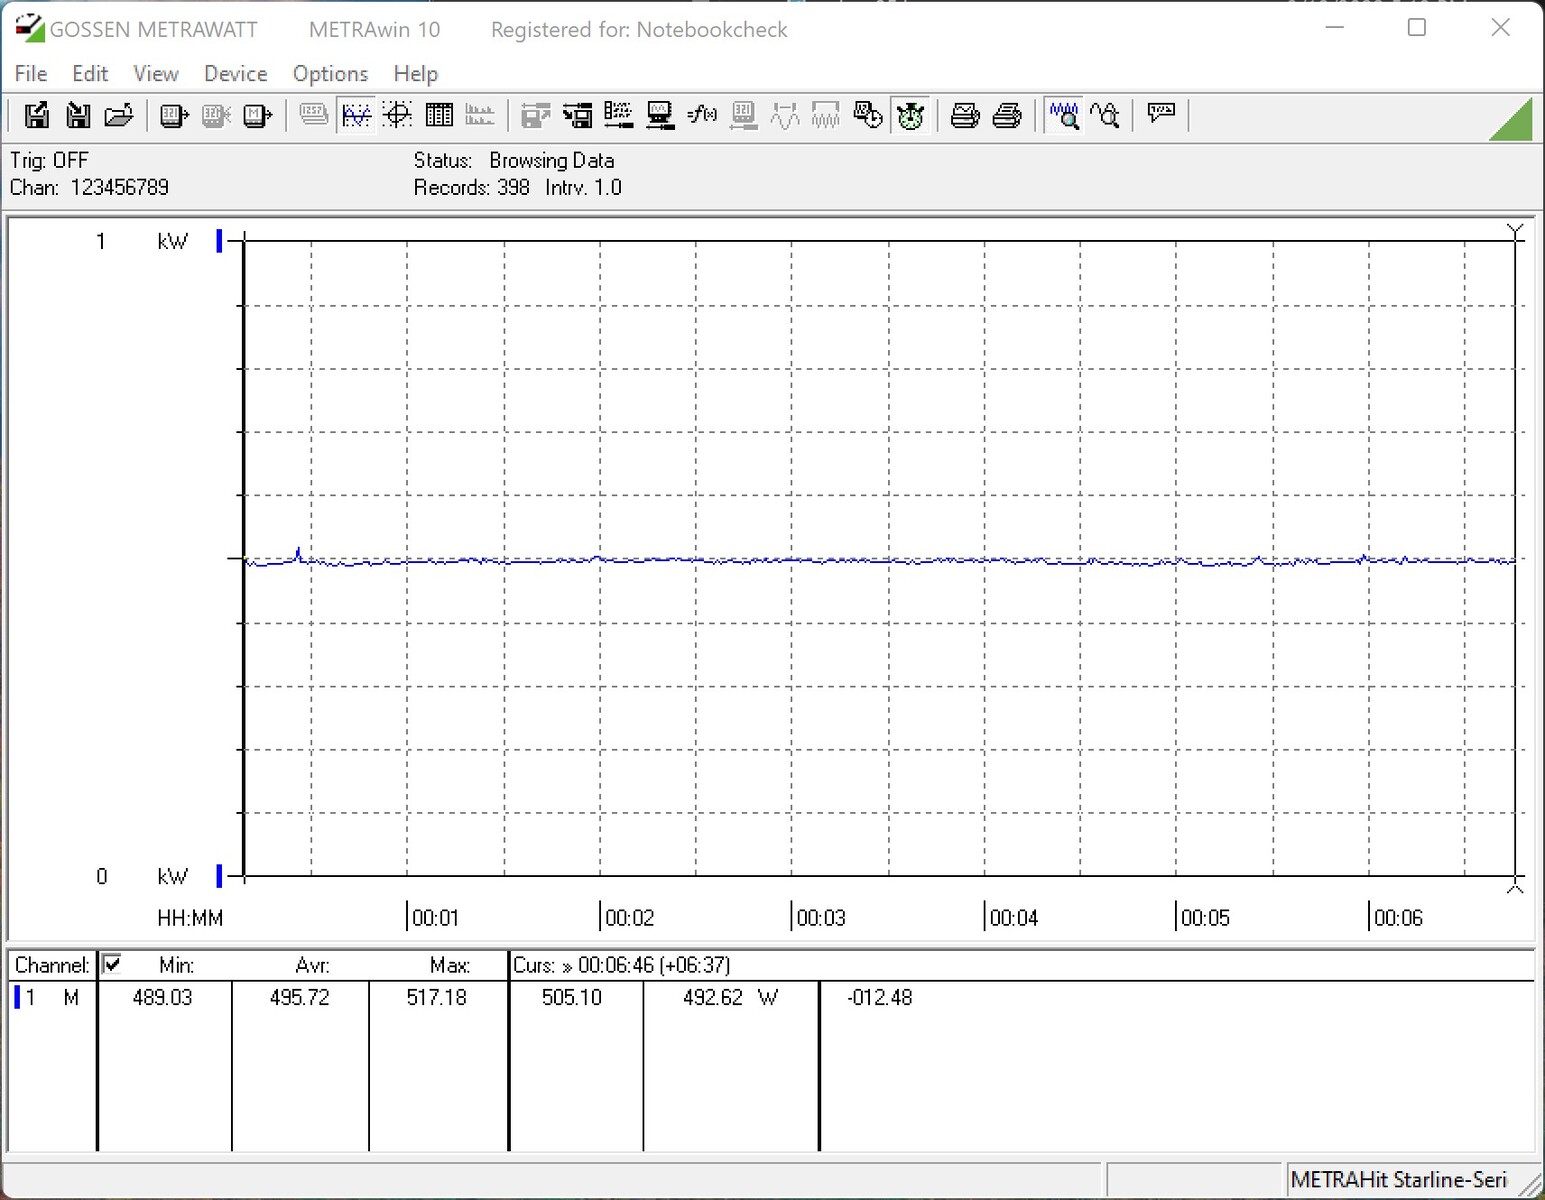
Il faut un très bon système de refroidissement pour gérer les processeurs Raptor Lake. Avec un système de refroidissement à eau personnalisé, vous pouvez également laisser les nouveaux Raptor fonctionner sans aucune limite, à condition que vous n'ayez aucun problème avec les températures élevées. Ceux qui veulent être sûrs d'eux doivent activer la limitation PL2, avec un maximum de 253 ou 181 watts respectivement. Nous recommandons vivement de rester dans les limites de puissance des processeurs Raptor Lake. Une consommation d'énergie nettement inférieure et des températures basses sont de bonnes raisons pour le faire. Il n'y a également aucun inconvénient en termes de performance pure, comme nous l'avons déjà mentionné ci-dessus.
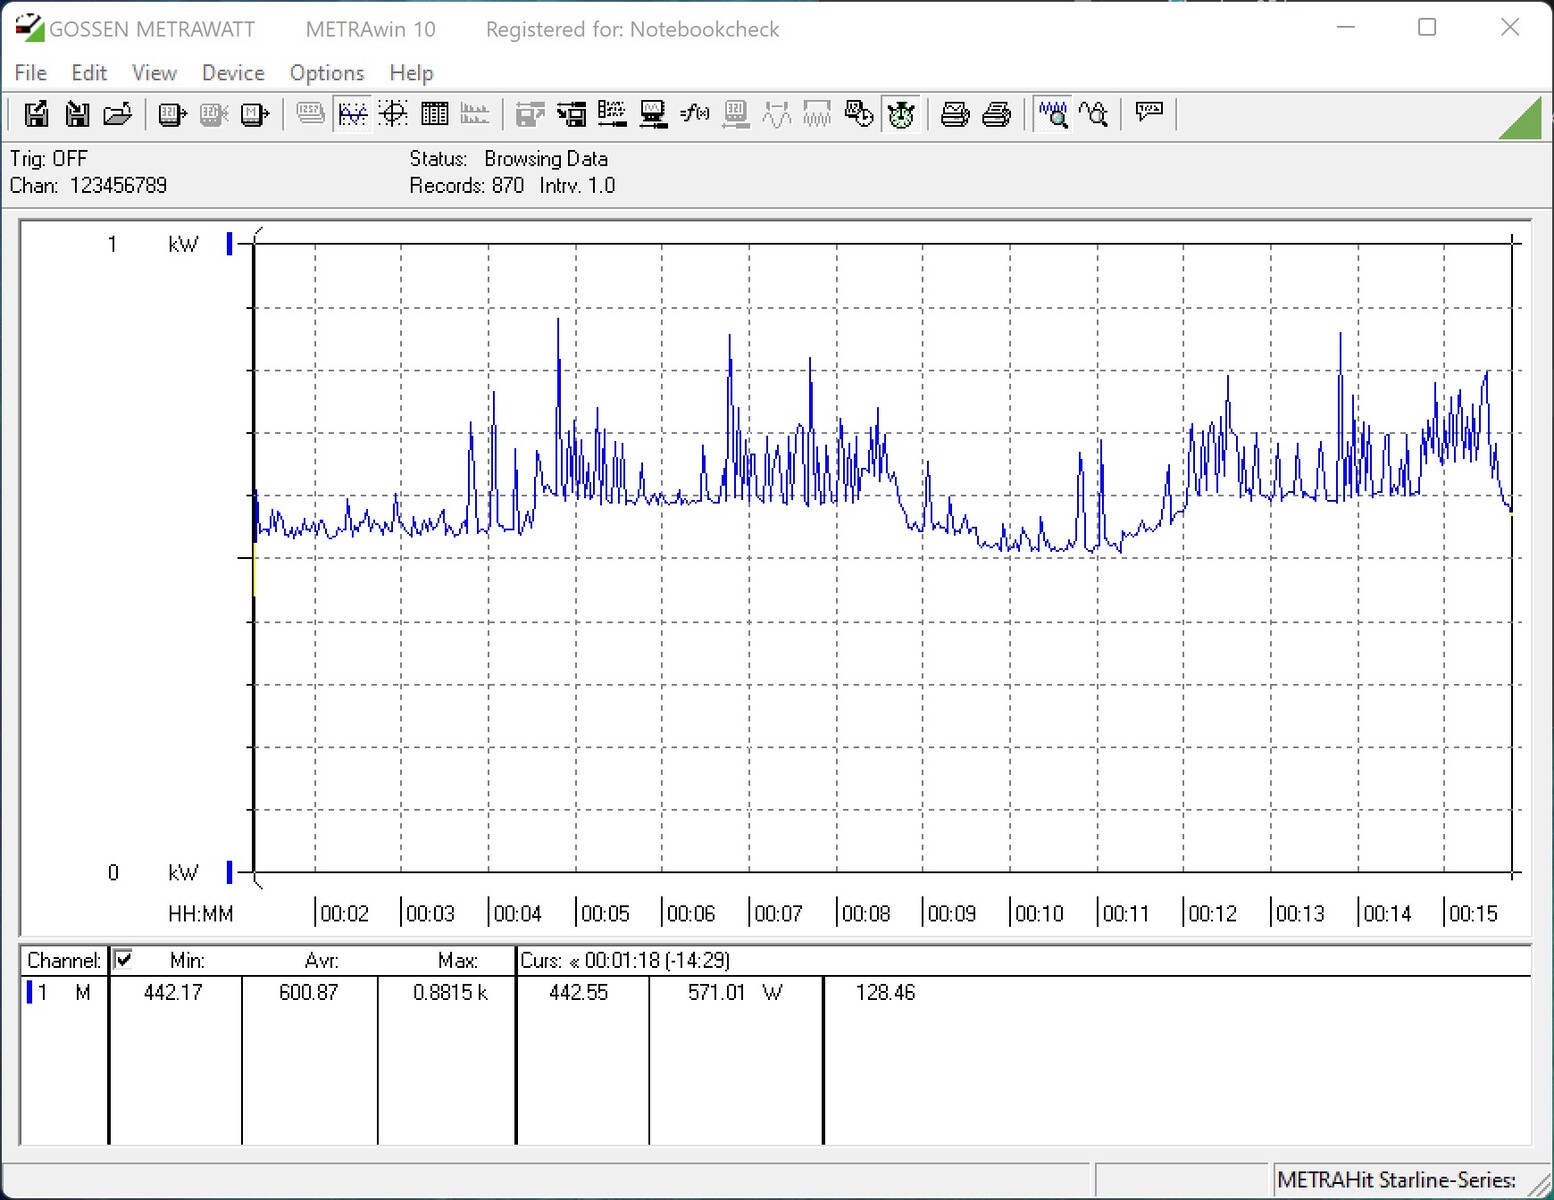
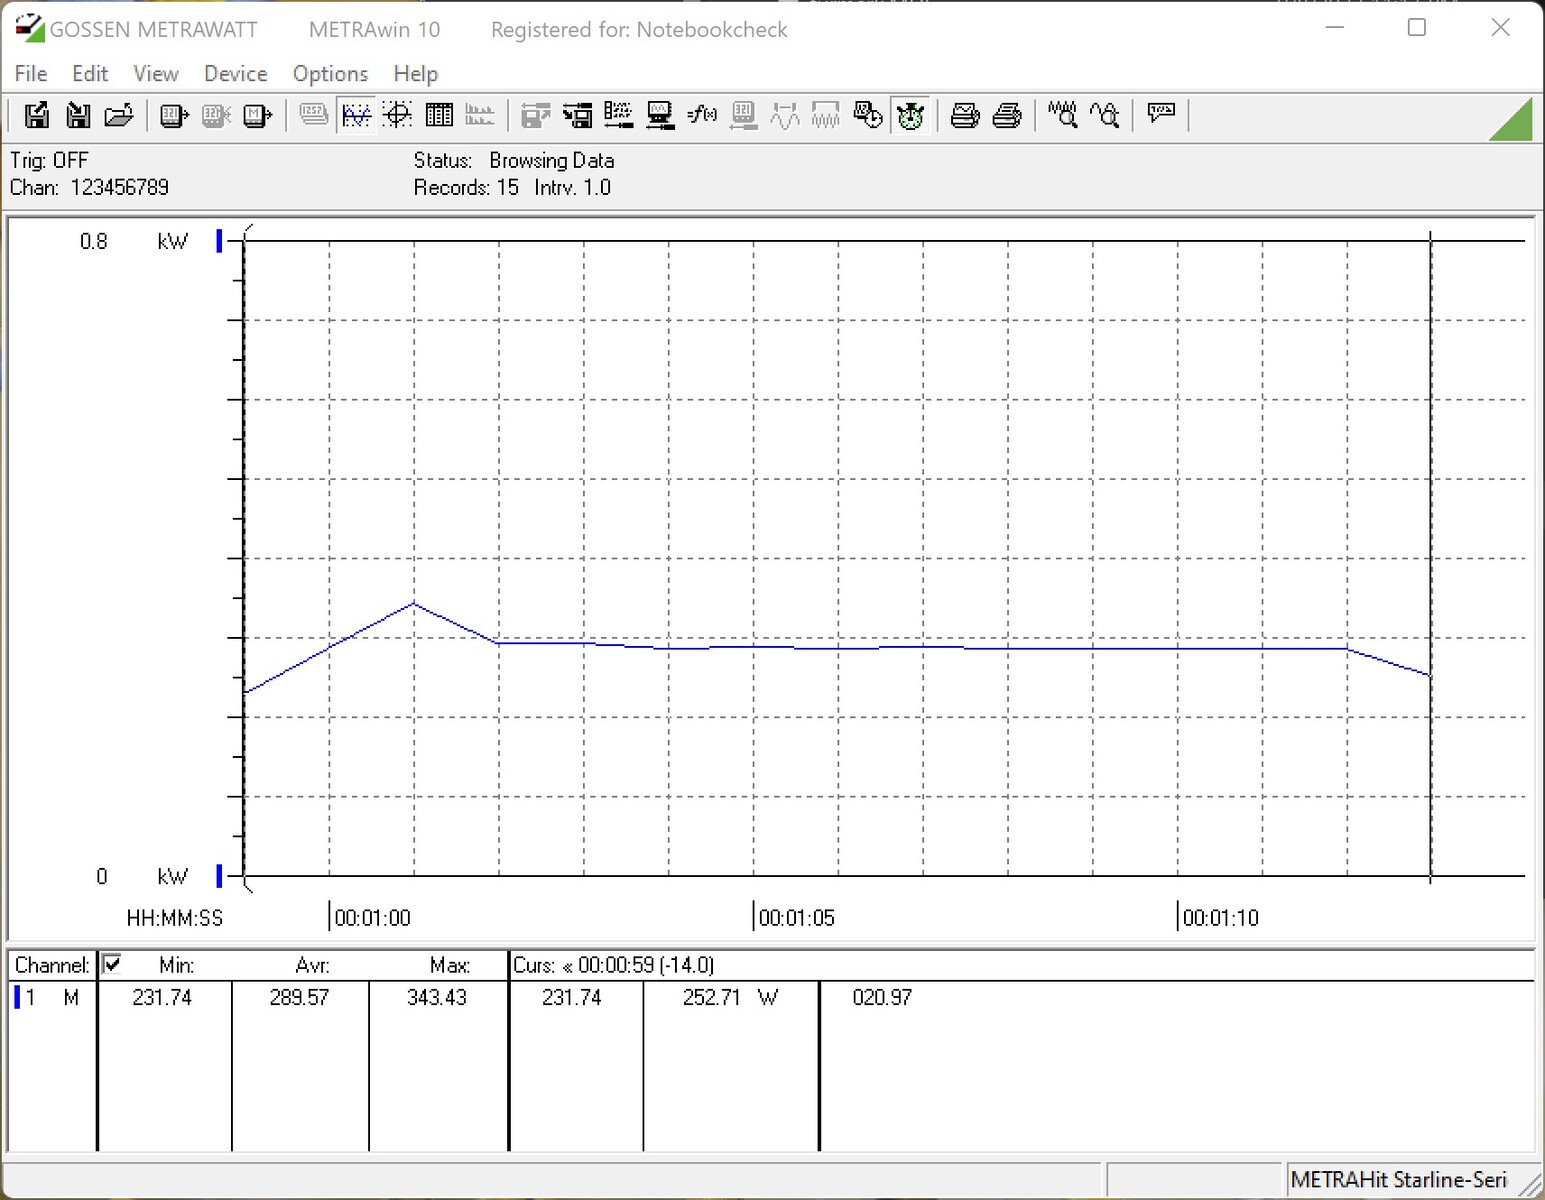
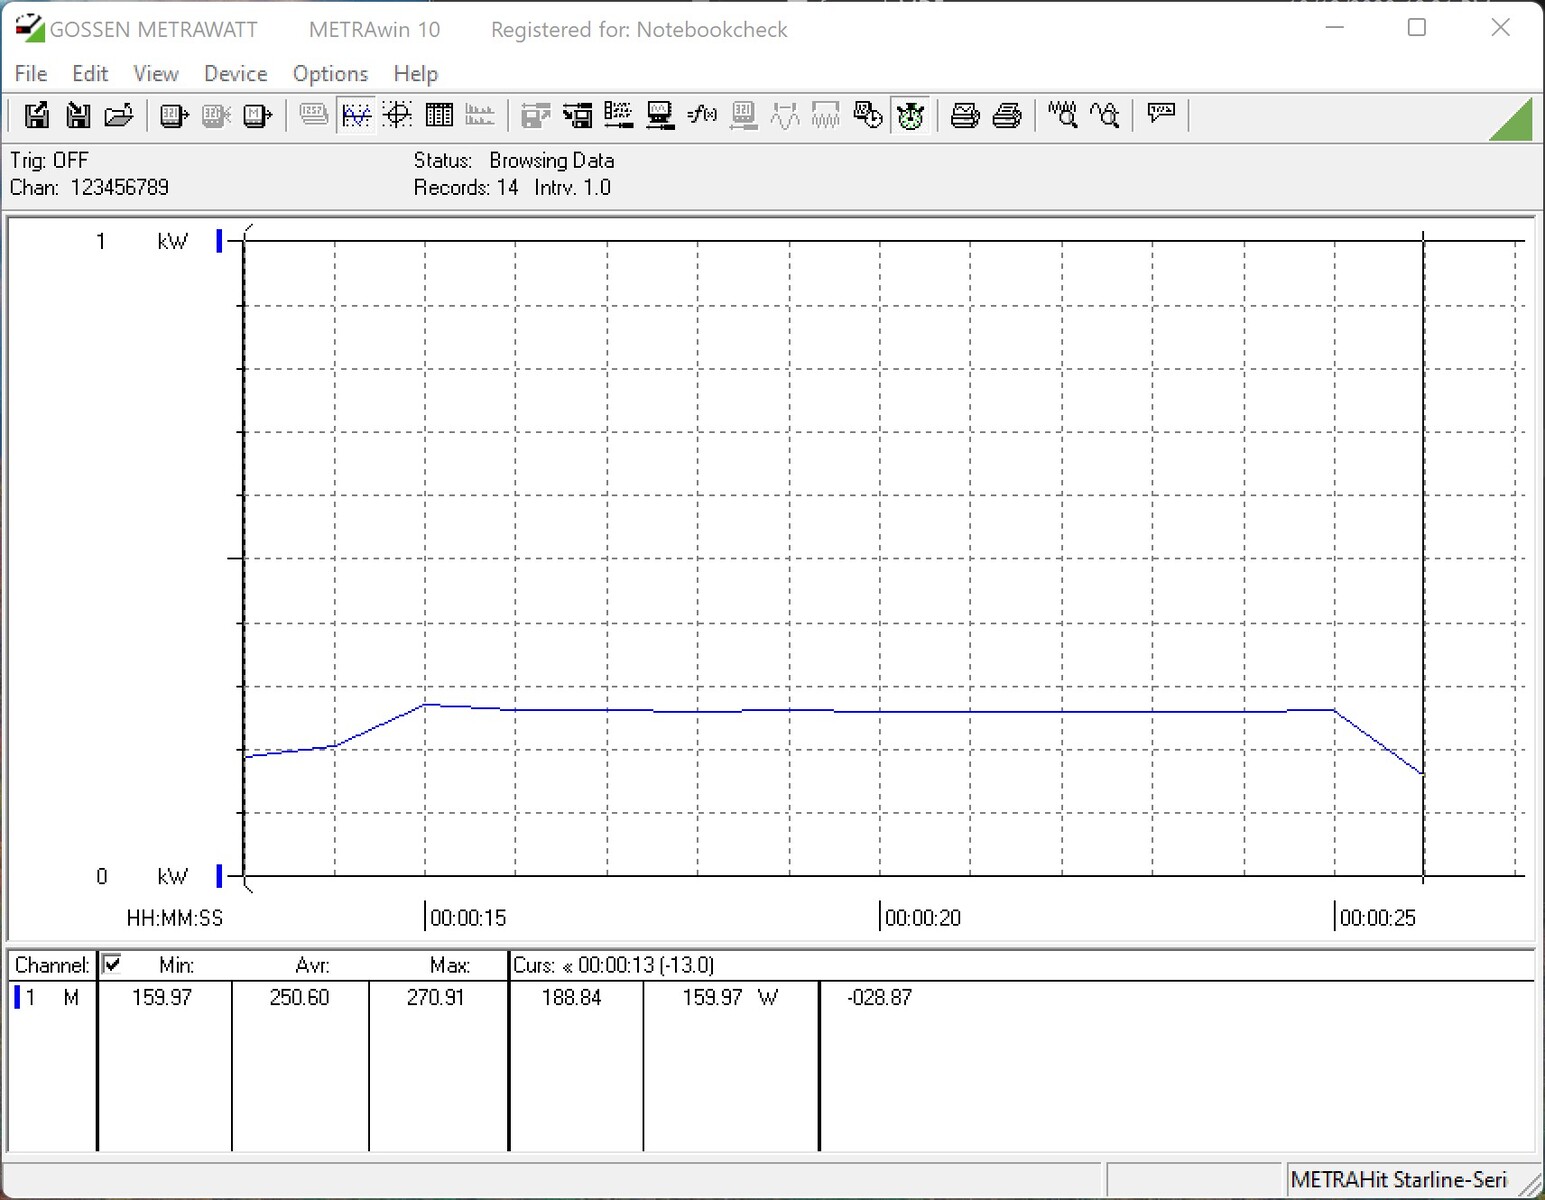
Intel Core i9-13900K - Limite de puissance ouverte

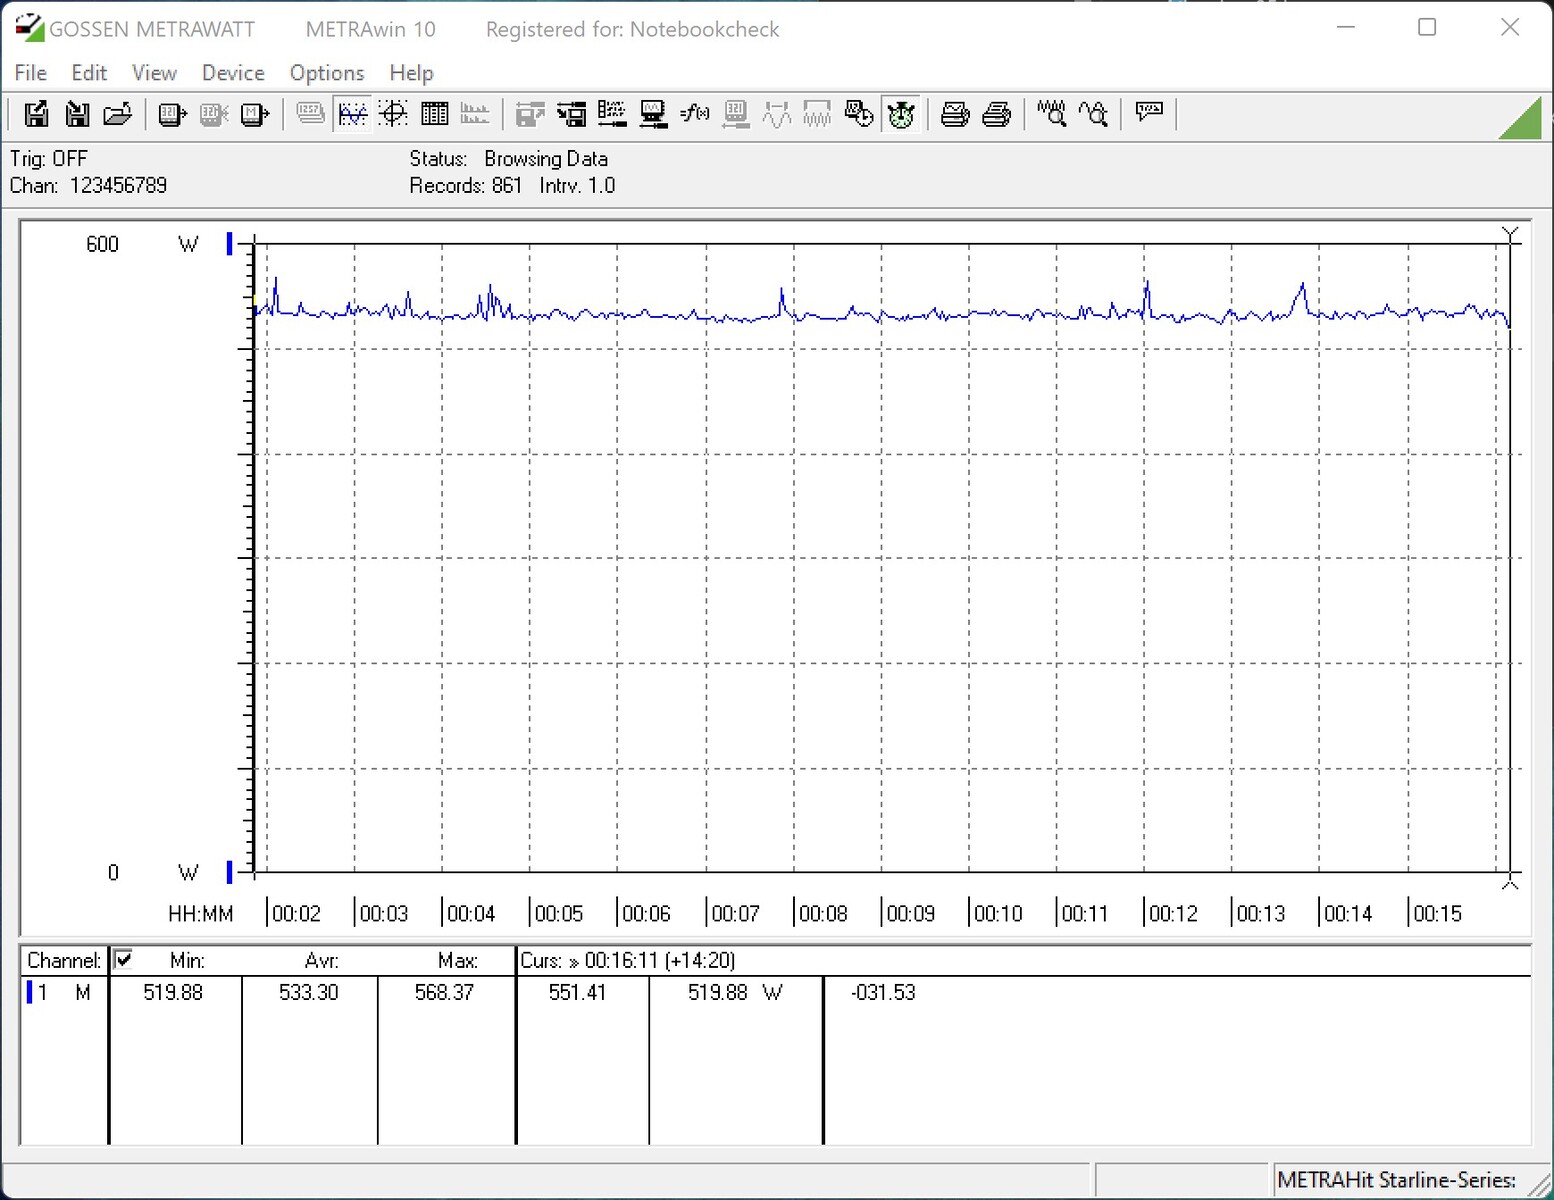
Intel Core i9-13900K - Limite de puissance de 253 watts
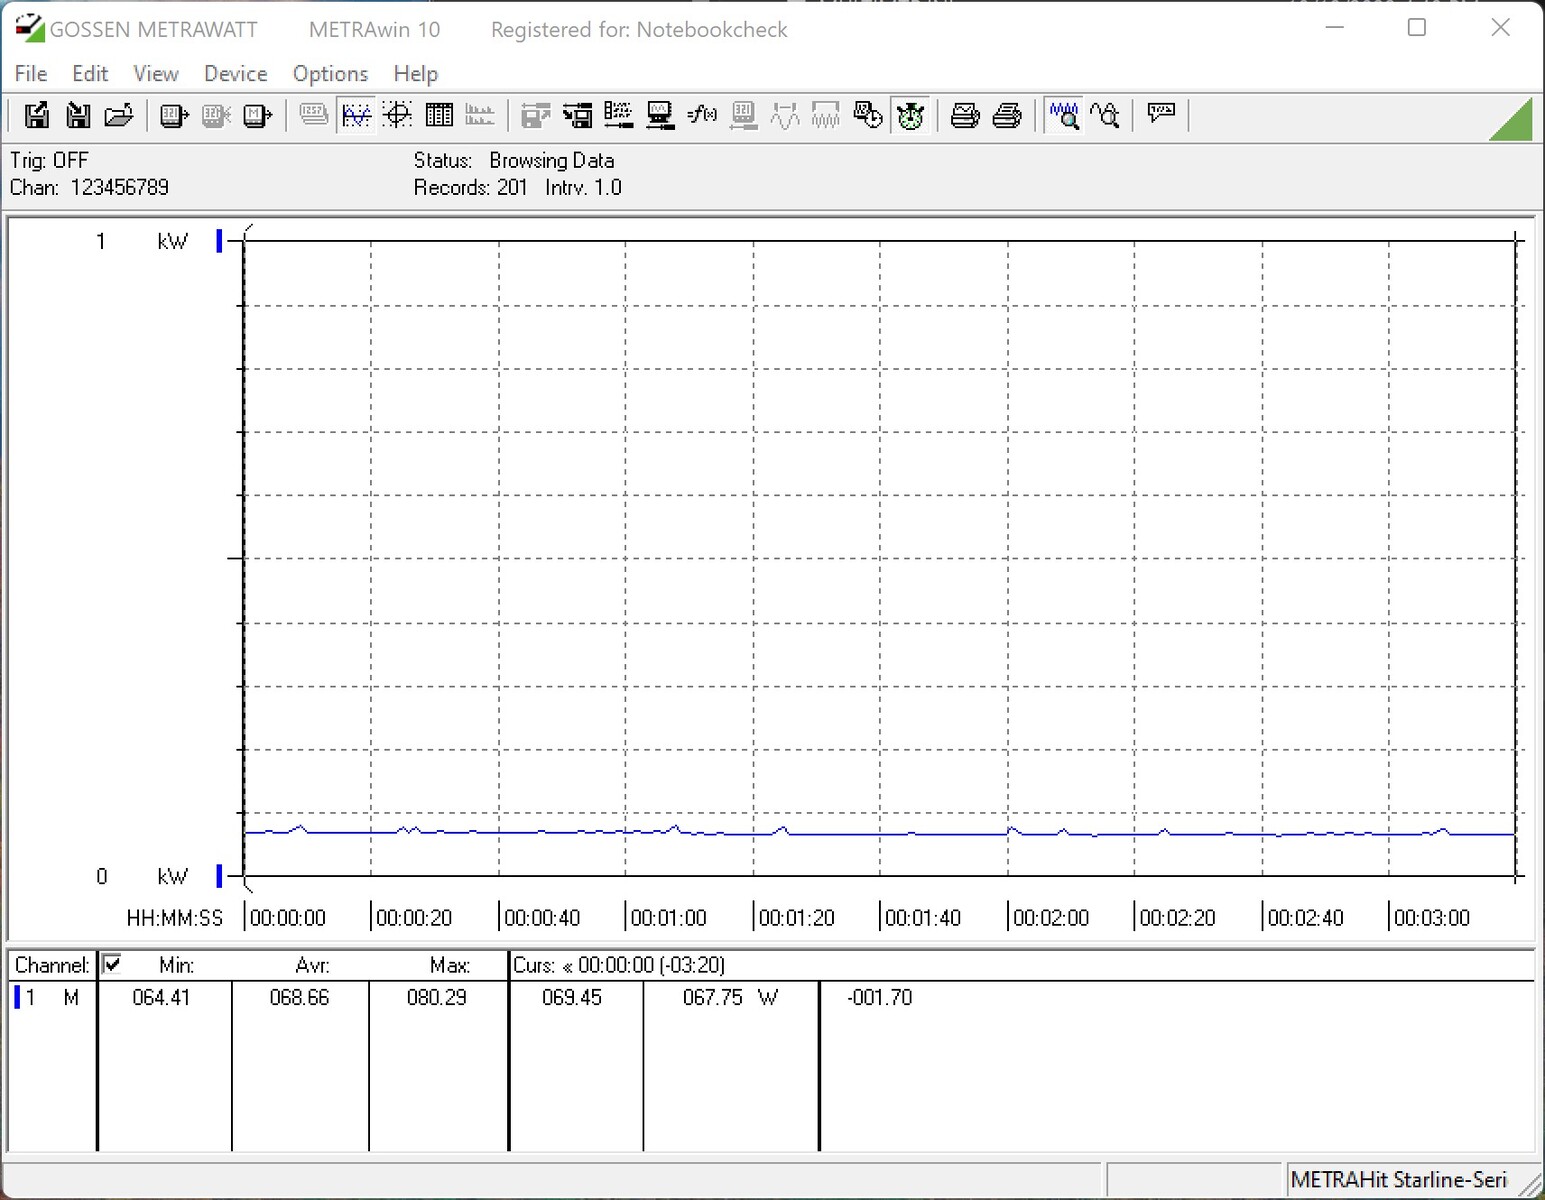
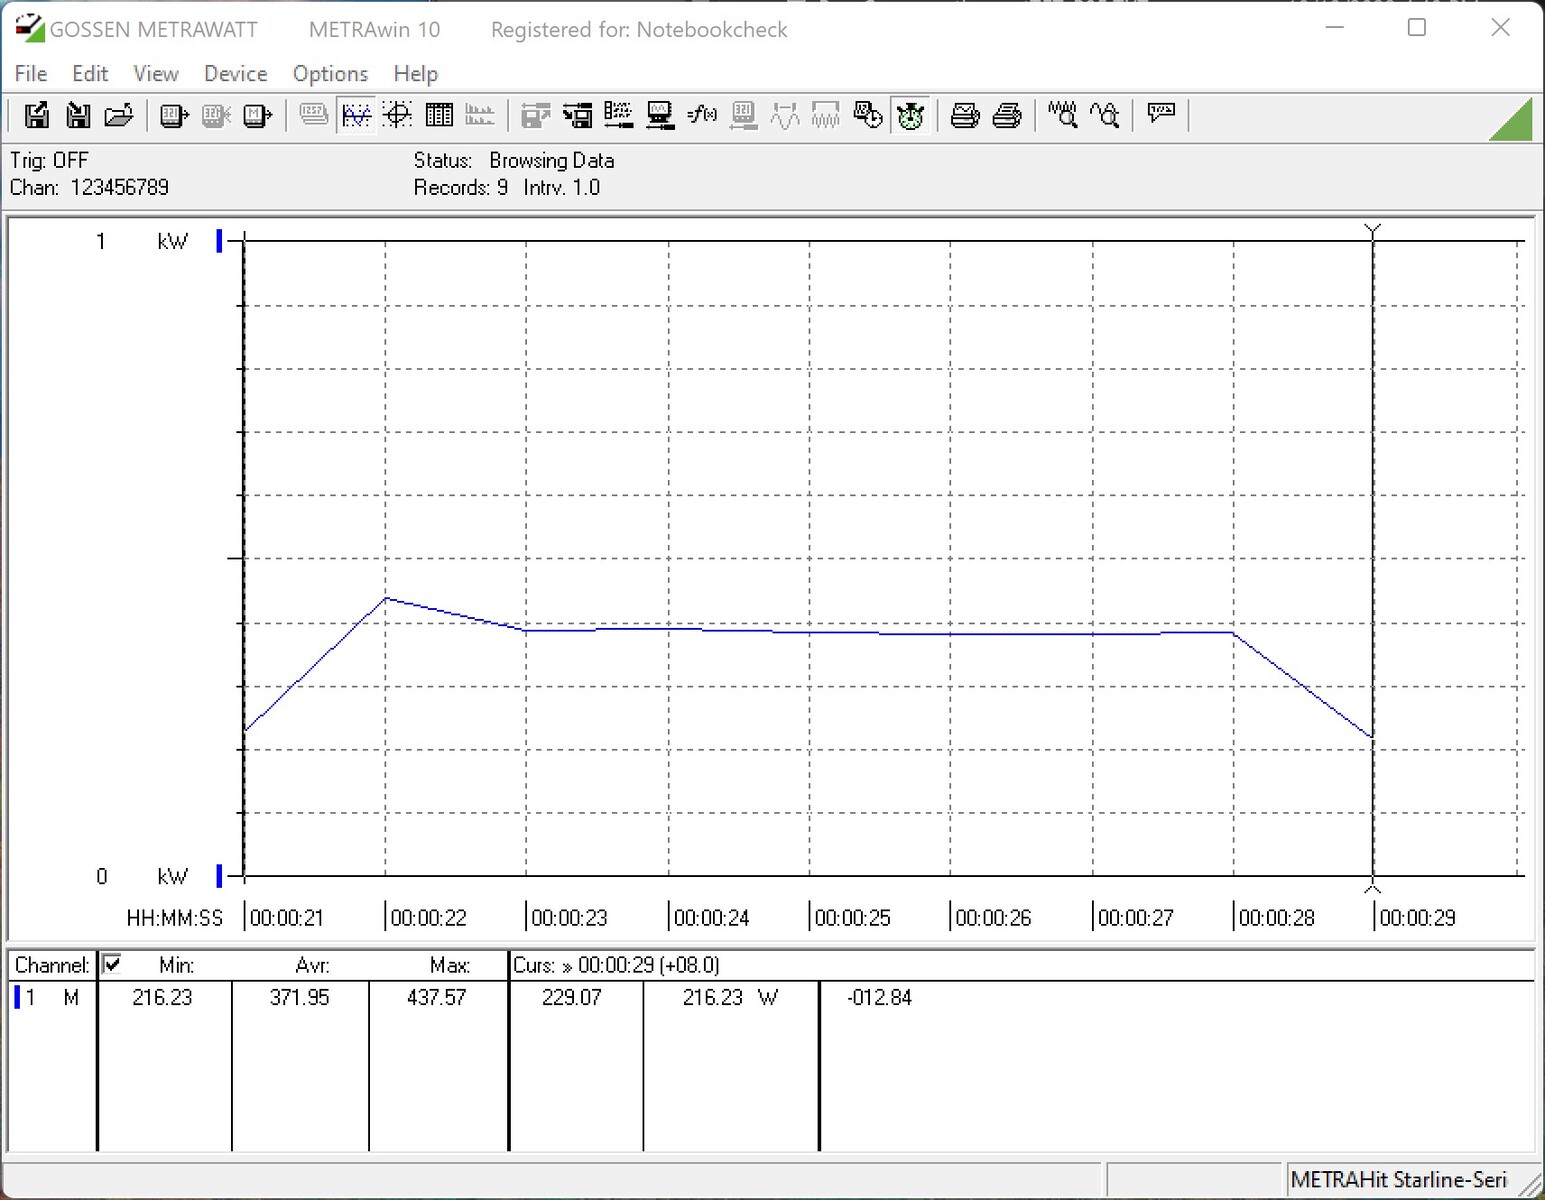
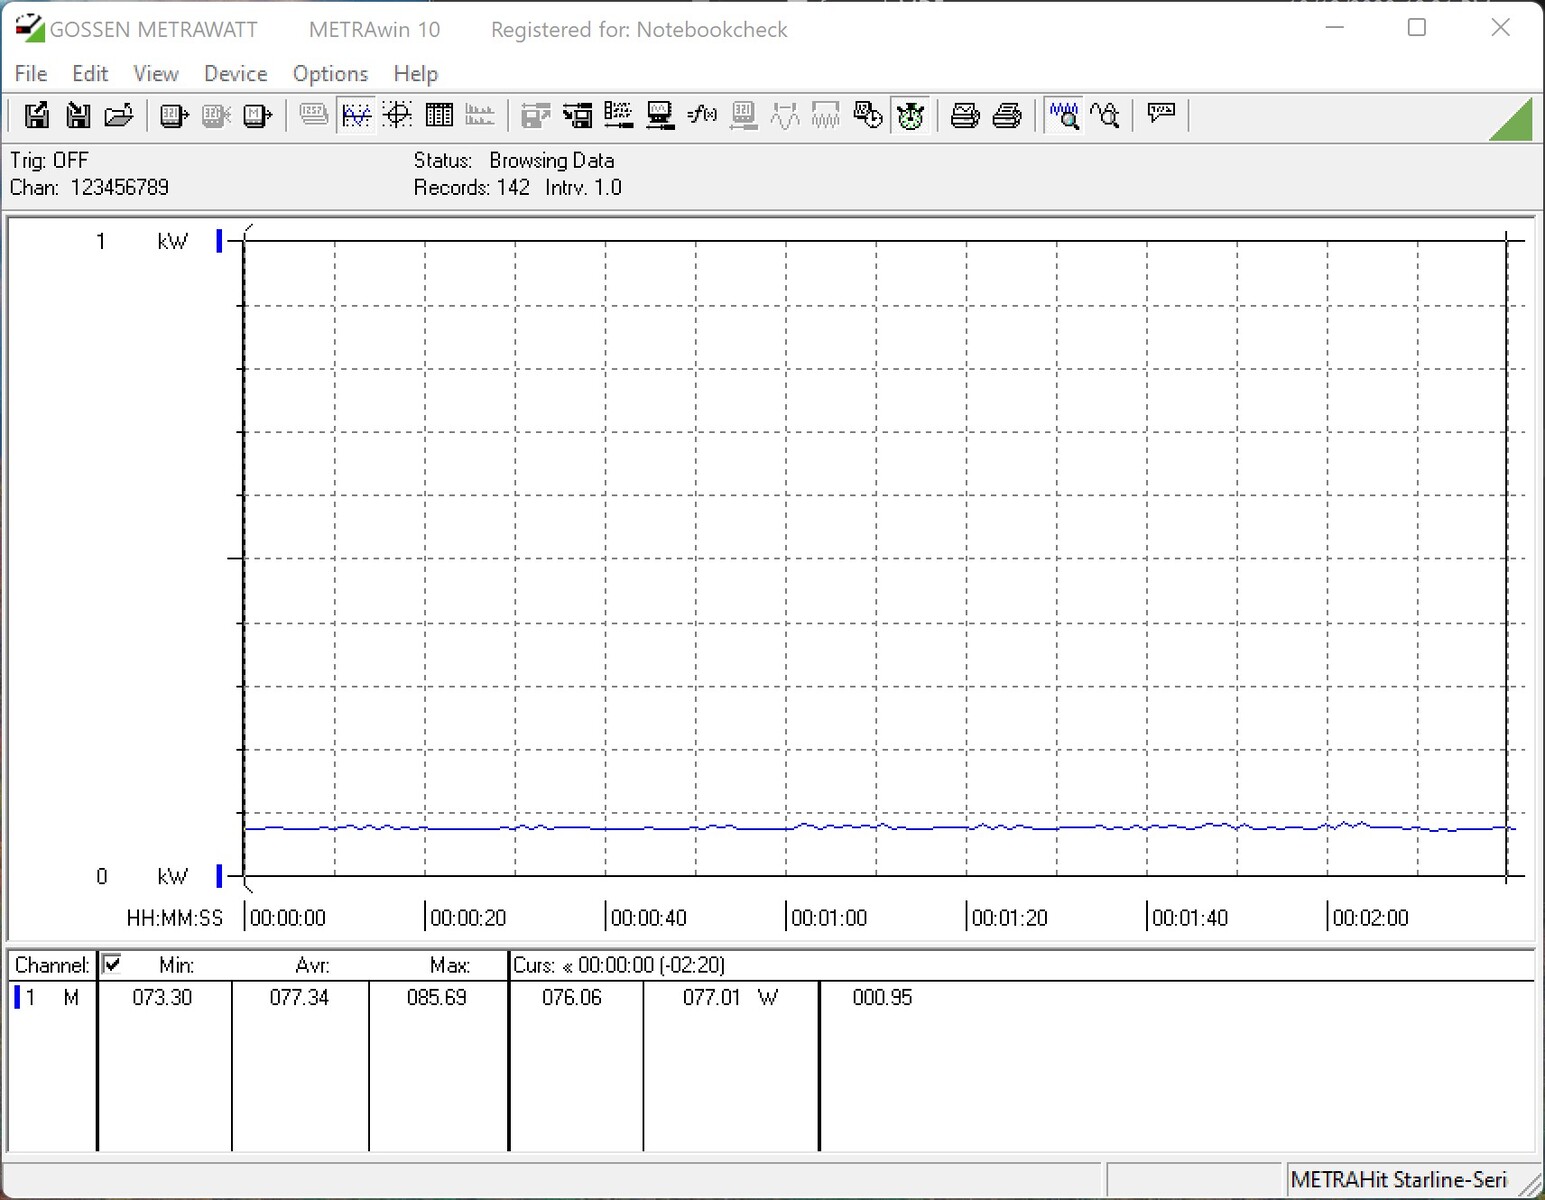
Intel Core i5-13600K - Limite de puissance ouverte

Intel Core i5-13600K - limite de puissance de 181 watts
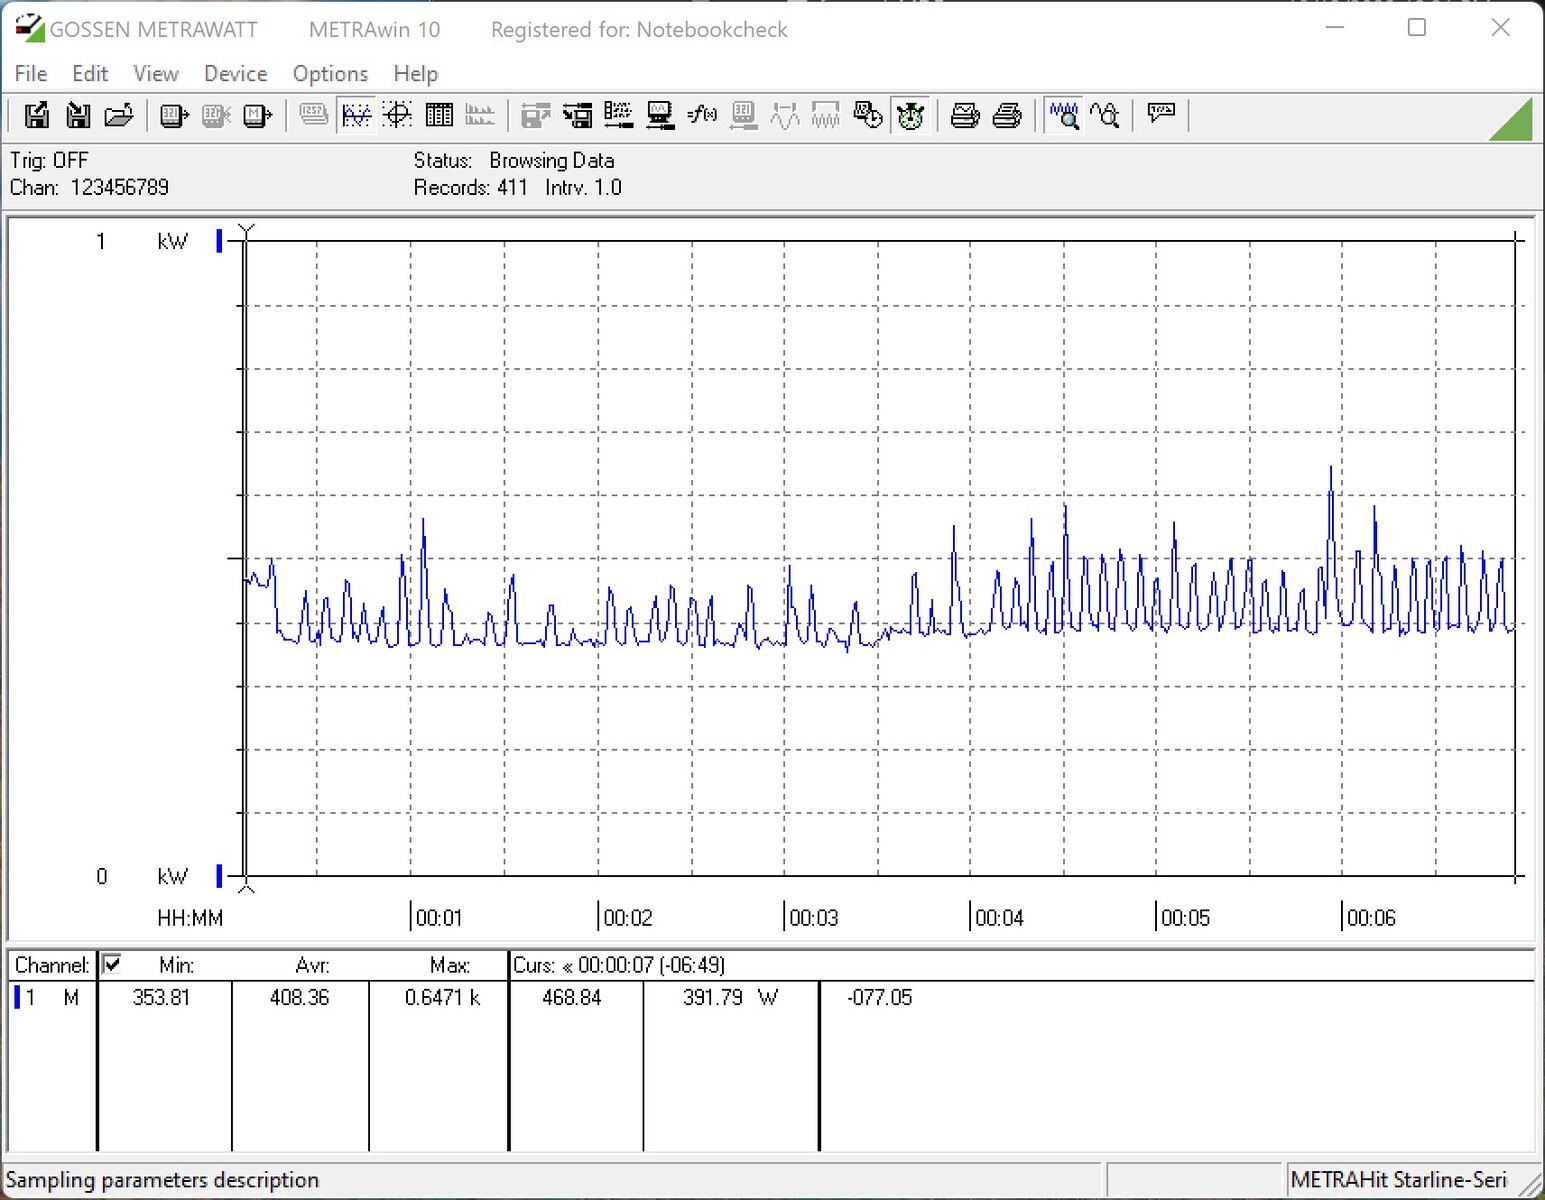

| Power Consumption / Cinebench R15 Multi (external Monitor) | |
| Intel Core i9-13900K | |
| Intel Core i9-13900K @253W | |
| Intel Core i9-12900K (Idle: 70.5 W) | |
| NVIDIA GeForce RTX 3090 Founders Edition | |
| AMD Ryzen 9 7900X | |
| Intel Core i5-13600K | |
| Intel Core i5-13600K @181W | |
| AMD Ryzen 5 7600X | |
| Intel Core i5-12600K (Idle: 70.45 W) | |
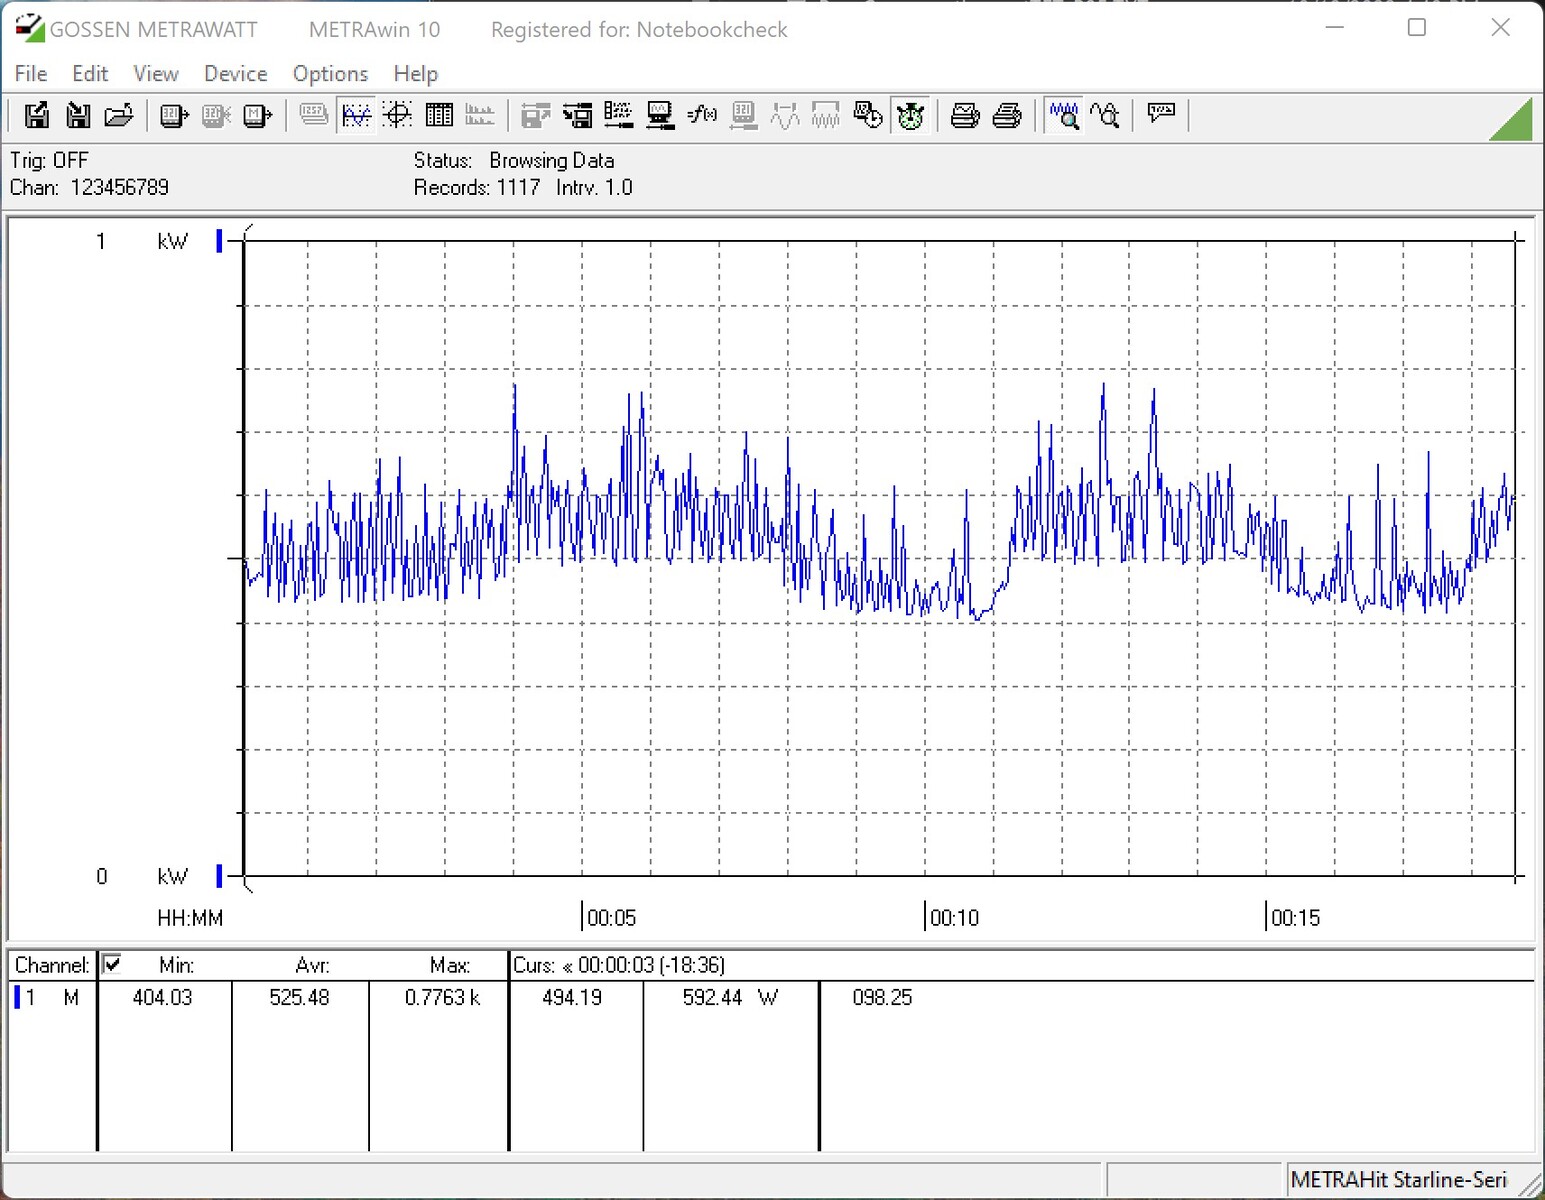
| Power Consumption / Prime95 V2810 Stress (external Monitor) | |
| Intel Core i9-13900K | |
| Intel Core i9-13900K @253W | |
| Intel Core i5-13600K | |
| NVIDIA GeForce RTX 3090 Founders Edition | |
| AMD Ryzen 9 7900X | |
| Intel Core i9-12900K (Idle: 70.5 W) | |
| Intel Core i5-13600K @181W | |
| Intel Core i5-12600K (Idle: 70.45 W) | |
| AMD Ryzen 5 7600X | |
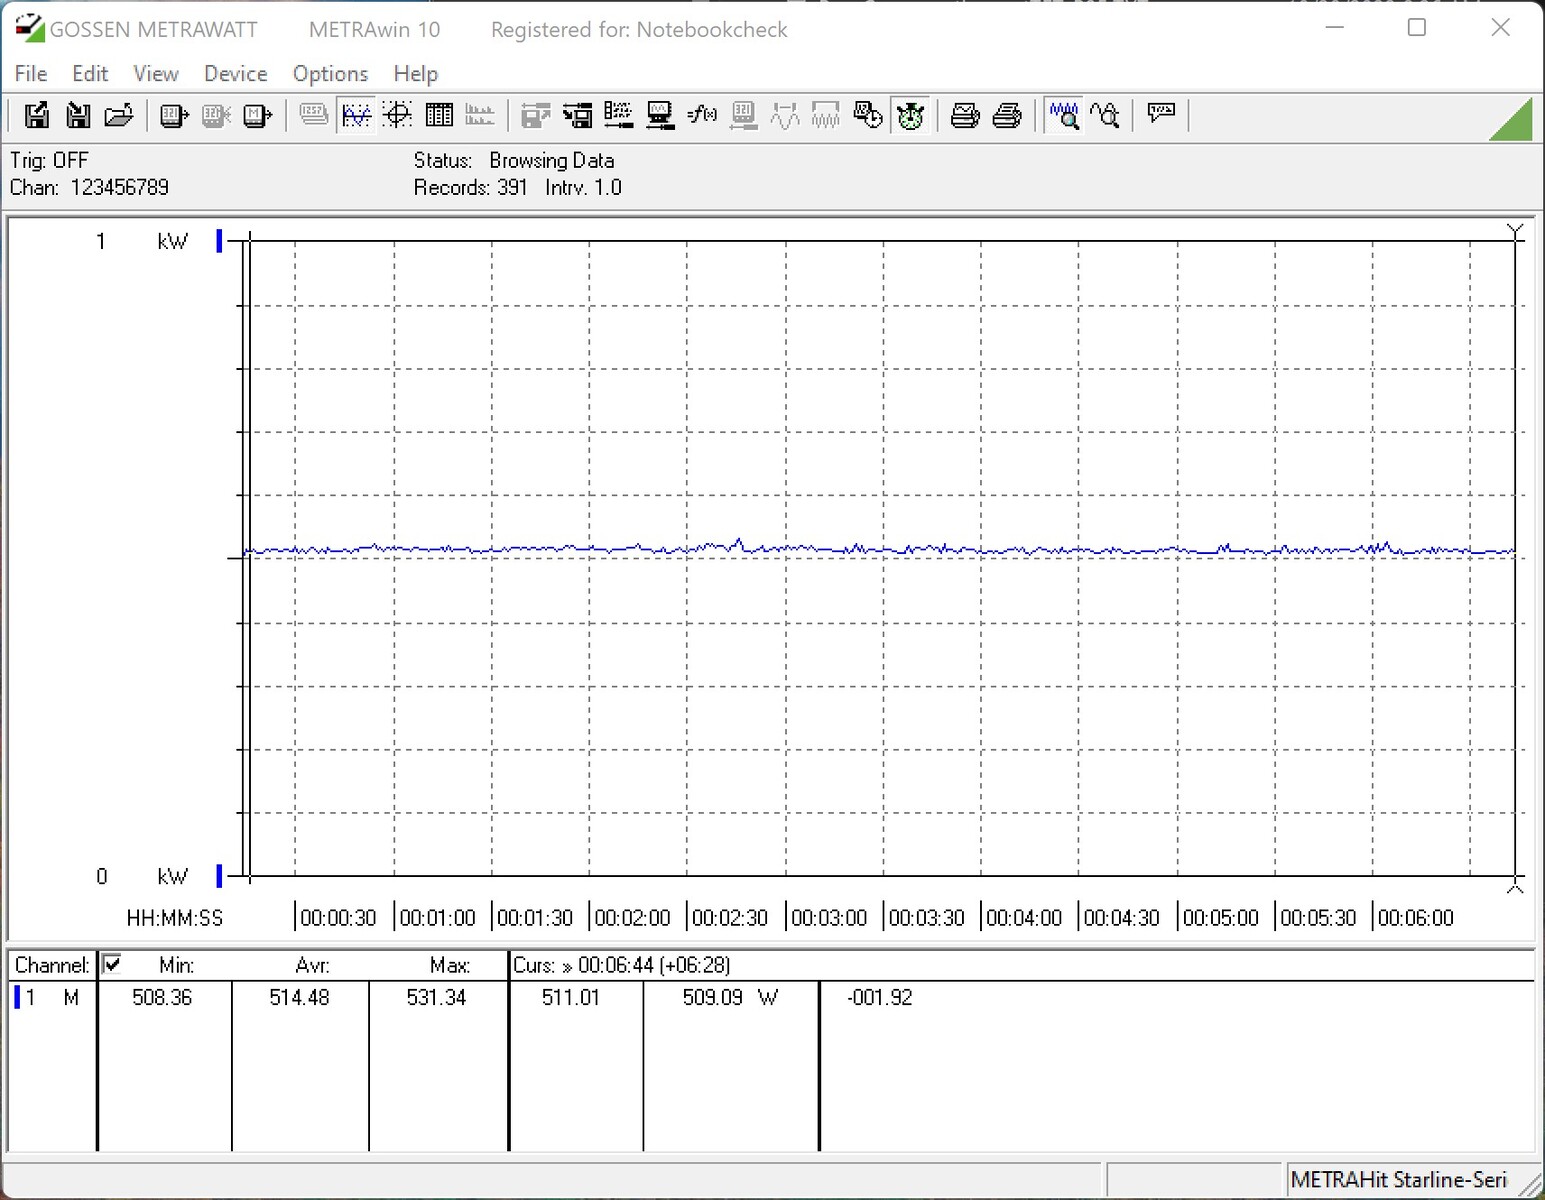
| Power Consumption / The Witcher 3 ultra (external Monitor) | |
| AMD Ryzen 9 7900X | |
| NVIDIA GeForce RTX 3090 Founders Edition | |
| Intel Core i9-13900K | |
| AMD Ryzen 5 7600X | |
| Intel Core i9-13900K @253W | |
| Intel Core i5-13600K | |
| Intel Core i5-13600K @181W | |
| Intel Core i9-12900K (Idle: 70.5 W) | |
| Intel Core i5-12600K (Idle: 70.45 W) | |
* ... Moindre est la valeur, meilleures sont les performances
Points positifs
Points négatifs
Verdict - Consommation électrique extrême

Avec Raptor Lake, Intel envoie sur le ring un digne successeur de la génération Alder Lake. Il était également temps, car avec sa gamme actuelle, AMD a fait la course en tête face aux processeurs Alder Lake. Cependant, Intel n'est pas en mesure de devancer complètement ses concurrents avec ses processeurs actuels. Il parvient cependant à rattraper son retard, et parfois même à dépasser légèrement ses concurrents. Les différences entre les deux modèles de pointe sont très faibles et ne sont pas vraiment perceptibles. Toutefois, si nous basons notre comparaison des performances sur les prix de vente conseillés actuels, l'Intel Core i9-13900K devance le AMD Ryzen 9 7900X dans de nombreux benchmarks.
Intel se bat pour cette position avec une vitesse d'horloge plus élevée, plus de cœurs, et une consommation d'énergie plus élevée. Cette dernière est également une approche que poursuit AMD, bien que le TDP de l'Intel Core i9-13900K atteigne une nouvelle valeur maximale à 253 watts (PL2). Dans le plus petit Intel Core i5-13600K, il est encore de 181 watts à pleine charge. Cela signifie qu'un très bon refroidissement est nécessaire, si le modèle supérieur est sur votre liste de souhaits.
Les processeurs Intel Raptor Lake actuels offrent de très bonnes performances pour les jeux et les applications. Ses très hautes performances font de l'Intel Core i9-13900K le processeur optimal pour les créateurs de contenu
Pour la base, vous ne risquez rien en utilisant un chipset 600, puisque Raptor Lake est compatible après une mise à jour du BIOS. Cela ne grèvera pas trop votre budget pour une mise à niveau. Cependant, il y aura également de nouvelles cartes mères avec le nouveau chipset 700. Mais vous devez également savoir qu'il n'y aura pas de nouvelle génération de CPU pour l'actuel socket 1700. Les rumeurs actuelles disent que le socket 1851 sera introduit avec Meteor Lake, qui n'est plus compatible avec les sockets actuels.
Prix et disponibilité
Certains magasins proposent déjà les nouveaux processeurs Raptor Lake. Par exemple, le Intel Core i5-13600K est disponible chez Amazon pour 340 $et le modèle supérieur, le Intel Core i9-13900K, y est listé pour 750 $.

