Test de l'AMD Ryzen 7 5800X3D : Un meilleur processeur de jeu que le Core i9-12900K pour 120 dollars de moins
AMD a finalement fait la transition vers une nouvelle plateforme de socket et de chipset avec le Ryzen 7000 mais l'entreprise cherche toujours à tirer le maximum du socket AM4. AMD a d'abord annoncé son design 3D V-cache basé sur la technologie de packaging 3DFabric de TSMC au Computex 2021, montrant des améliorations massives dans les performances de jeu à 1080p
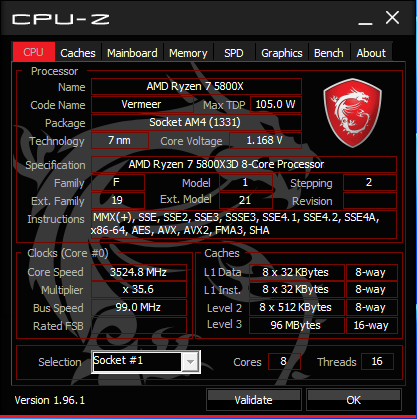
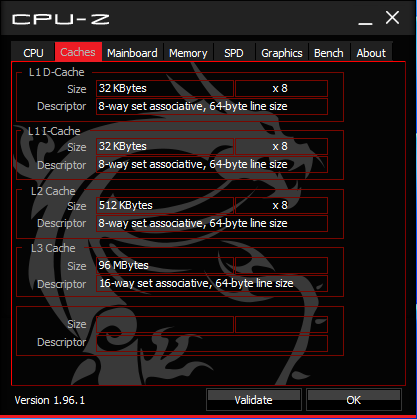
Avance rapide jusqu'au CES 2022, et AMD a dévoilé le Ryzen 7 5800X3D, un processeur de 105 W à 8 cœurs et 16 threads, doté de 64 Mo de V-Cache 3D en plus des 32 Mo de cache 2D existants.
Alors qu'AMD s'est fait la main avec la gamme Zen 3 Vermeer pour la plupart, Intel a rapidement fait un bond en avant avec l'architecture hybride Alder Lake Architecture hybride Core Alder Lake menée par le Core i9-12900K et plus tard, le Core i9-12900KS.
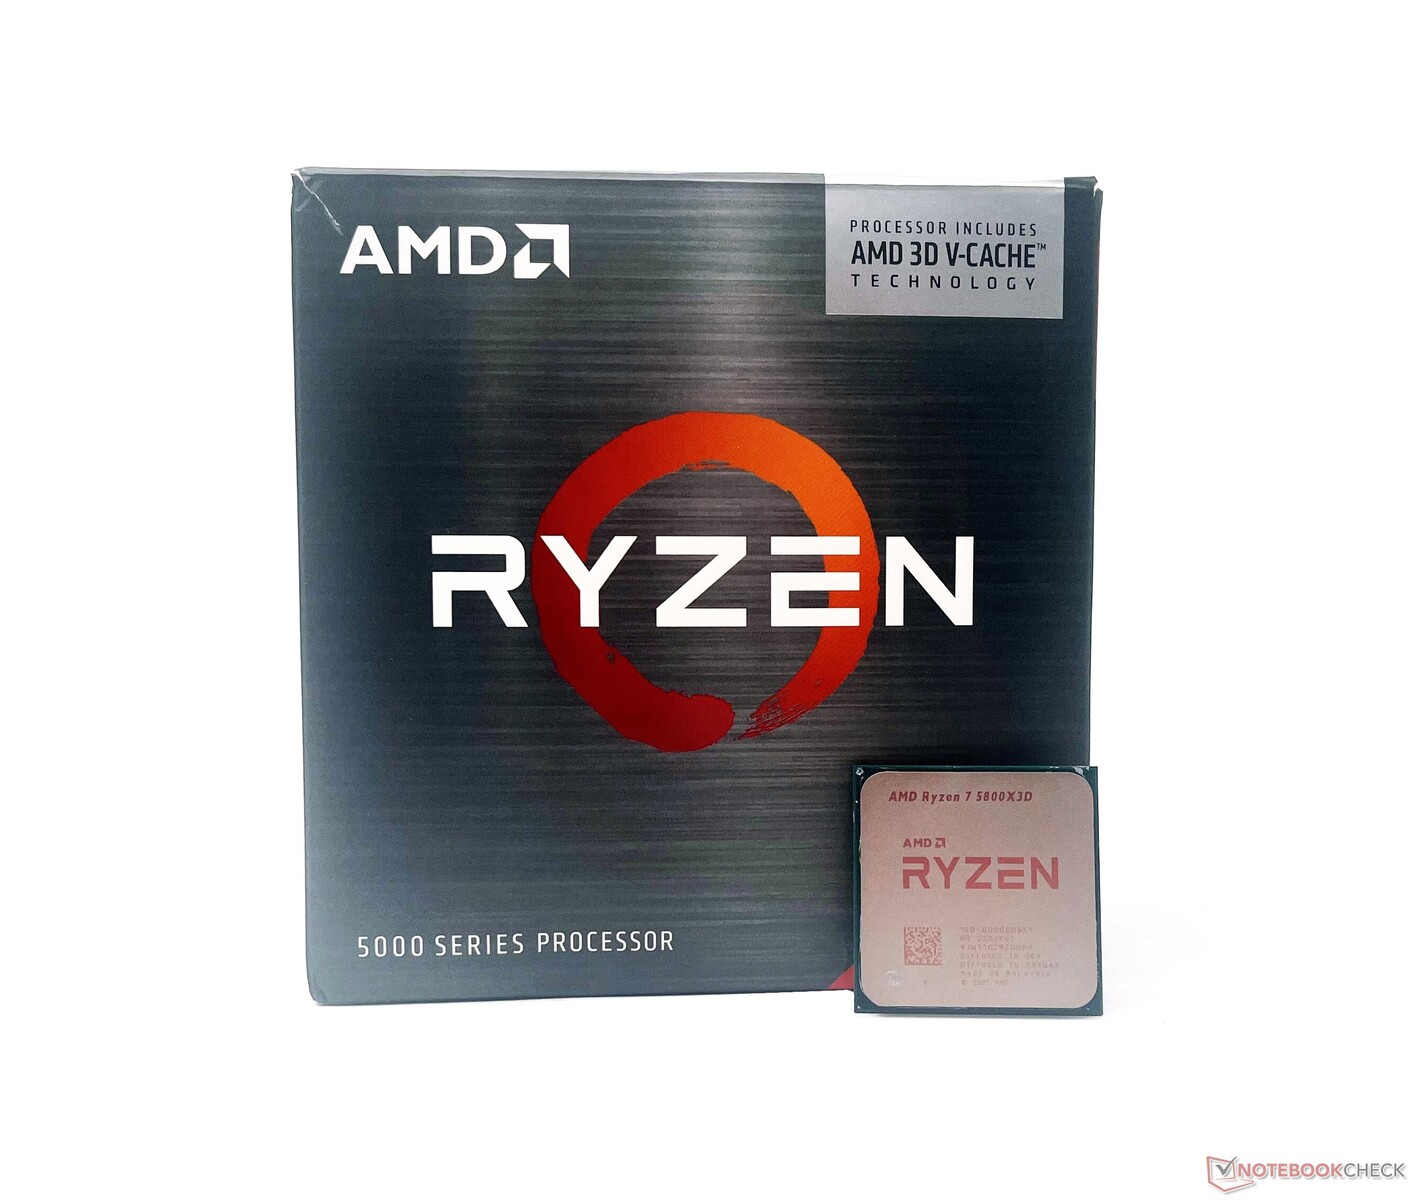
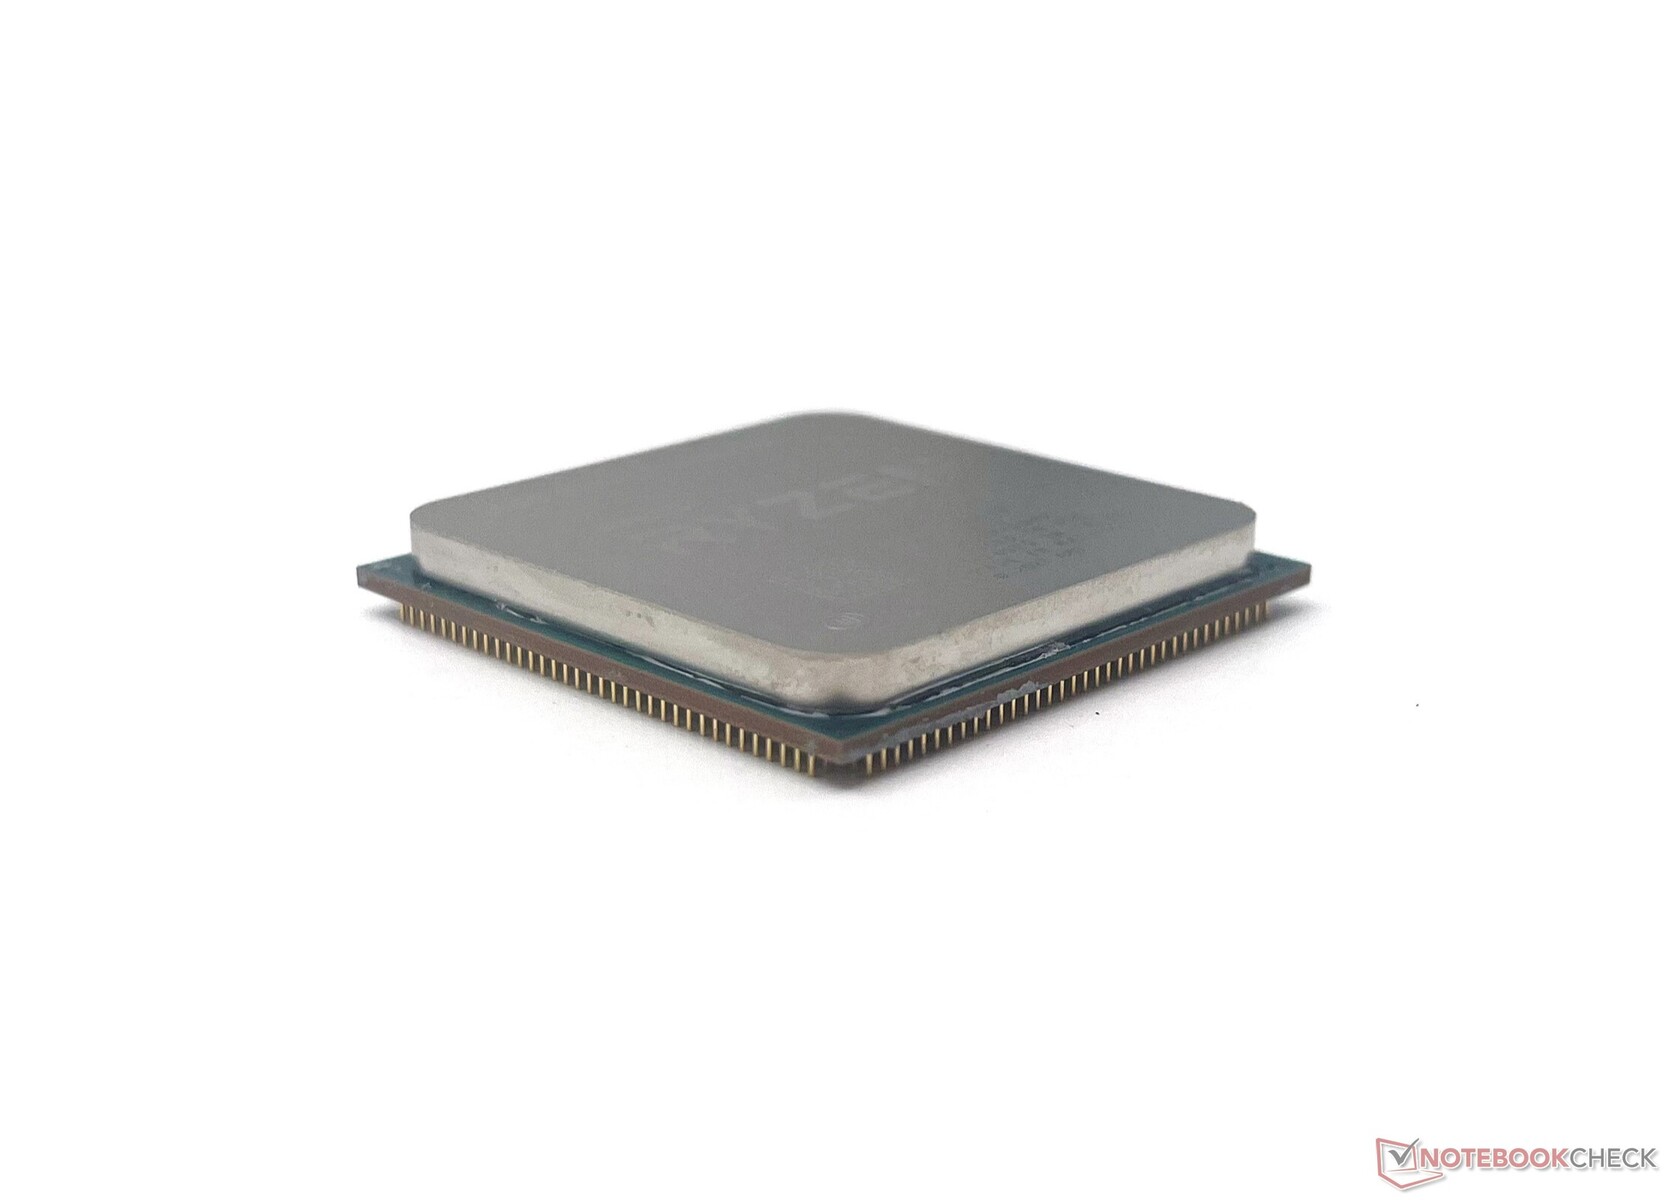
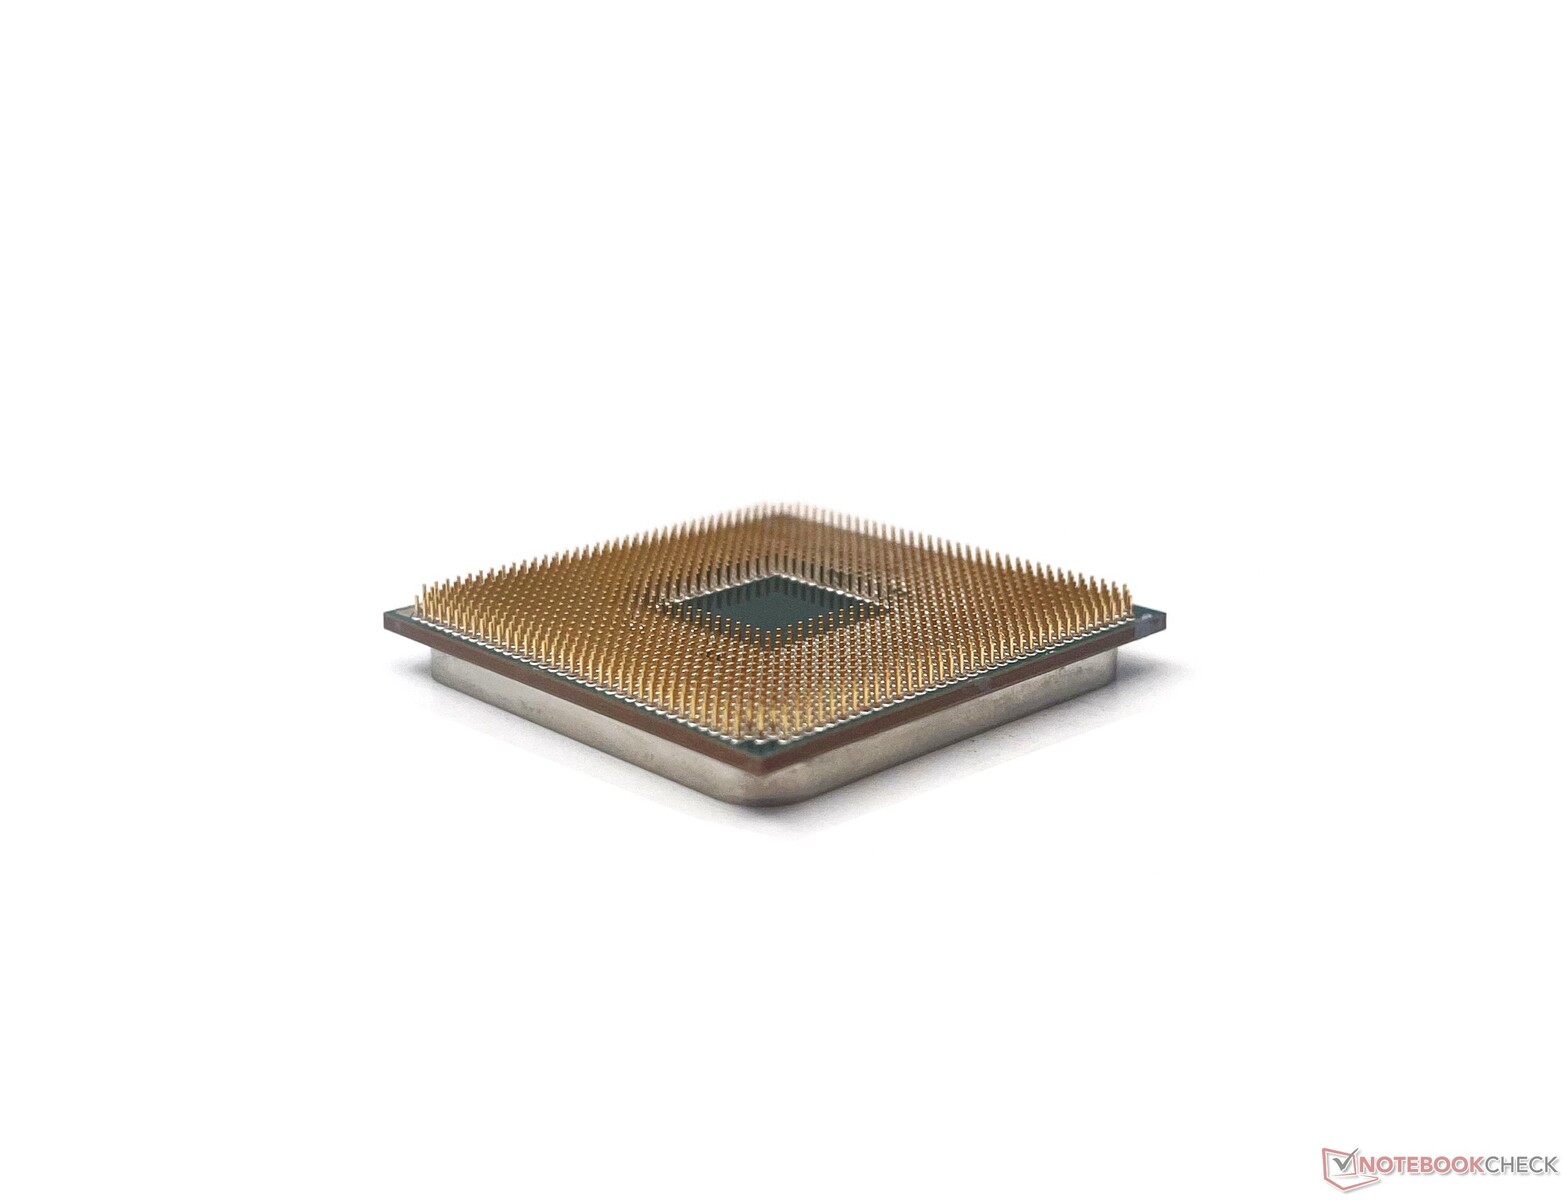
Bien qu'il soit doté d'une nouvelle technologie de cache, le Ryzen 7 5800X3D est exactement identique aux autres processeurs Zen 3, y compris en ce qui concerne la hauteur de l'axe Z. Par conséquent, les refroidisseurs AM4 existants fonctionnent parfaitement avec ce processeur. Par conséquent, les refroidisseurs socket AM4 existants fonctionnent très bien avec ce processeur.
Dans cet article, nous examinons le AMD Ryzen 7 5800X3D, nous voyons comment il se positionne par rapport à la concurrence actuelle d'Alder Lake d'Intel, et si c'est un investissement que vous devriez envisager en 2022.

La gamme de CPU de bureau AMD Ryzen Zen 3 Vermeer
| SKU | Cœurs/Treads | Fréquence de base (GHz) | Fréquence turbo (GHz) | L3-Cache (Mo) | TDP (W) | MSRP au lancement (US$) |
|---|---|---|---|---|---|---|
| Ryzen 9 5950X | 16/32 | 3,4 | 4,9 | 64 | 105 | 799 |
| Ryzen 9 5900X | 12/24 | 3,7 | 4,8 | 64 | 105 | 549 |
| Ryzen 7 5800X3D | 8/16 | 3,4 | 4,5 | 32+64 | 105 | 449 |
| Ryzen 7 5800X | 8/16 | 3,8 | 4,7 | 32 | 105 | 449 |
| Ryzen 7 5700X | 8/16 | 3,4 | 4,6 | 32 | 65 | 299 |
| Ryzen 5 5600X | 6/12 | 3,7 | 4,6 | 32 | 65 | 299 |
| Ryzen 5 5600 | 6/12 | 3,5 | 4,4 | 32 | 65 | 199 |
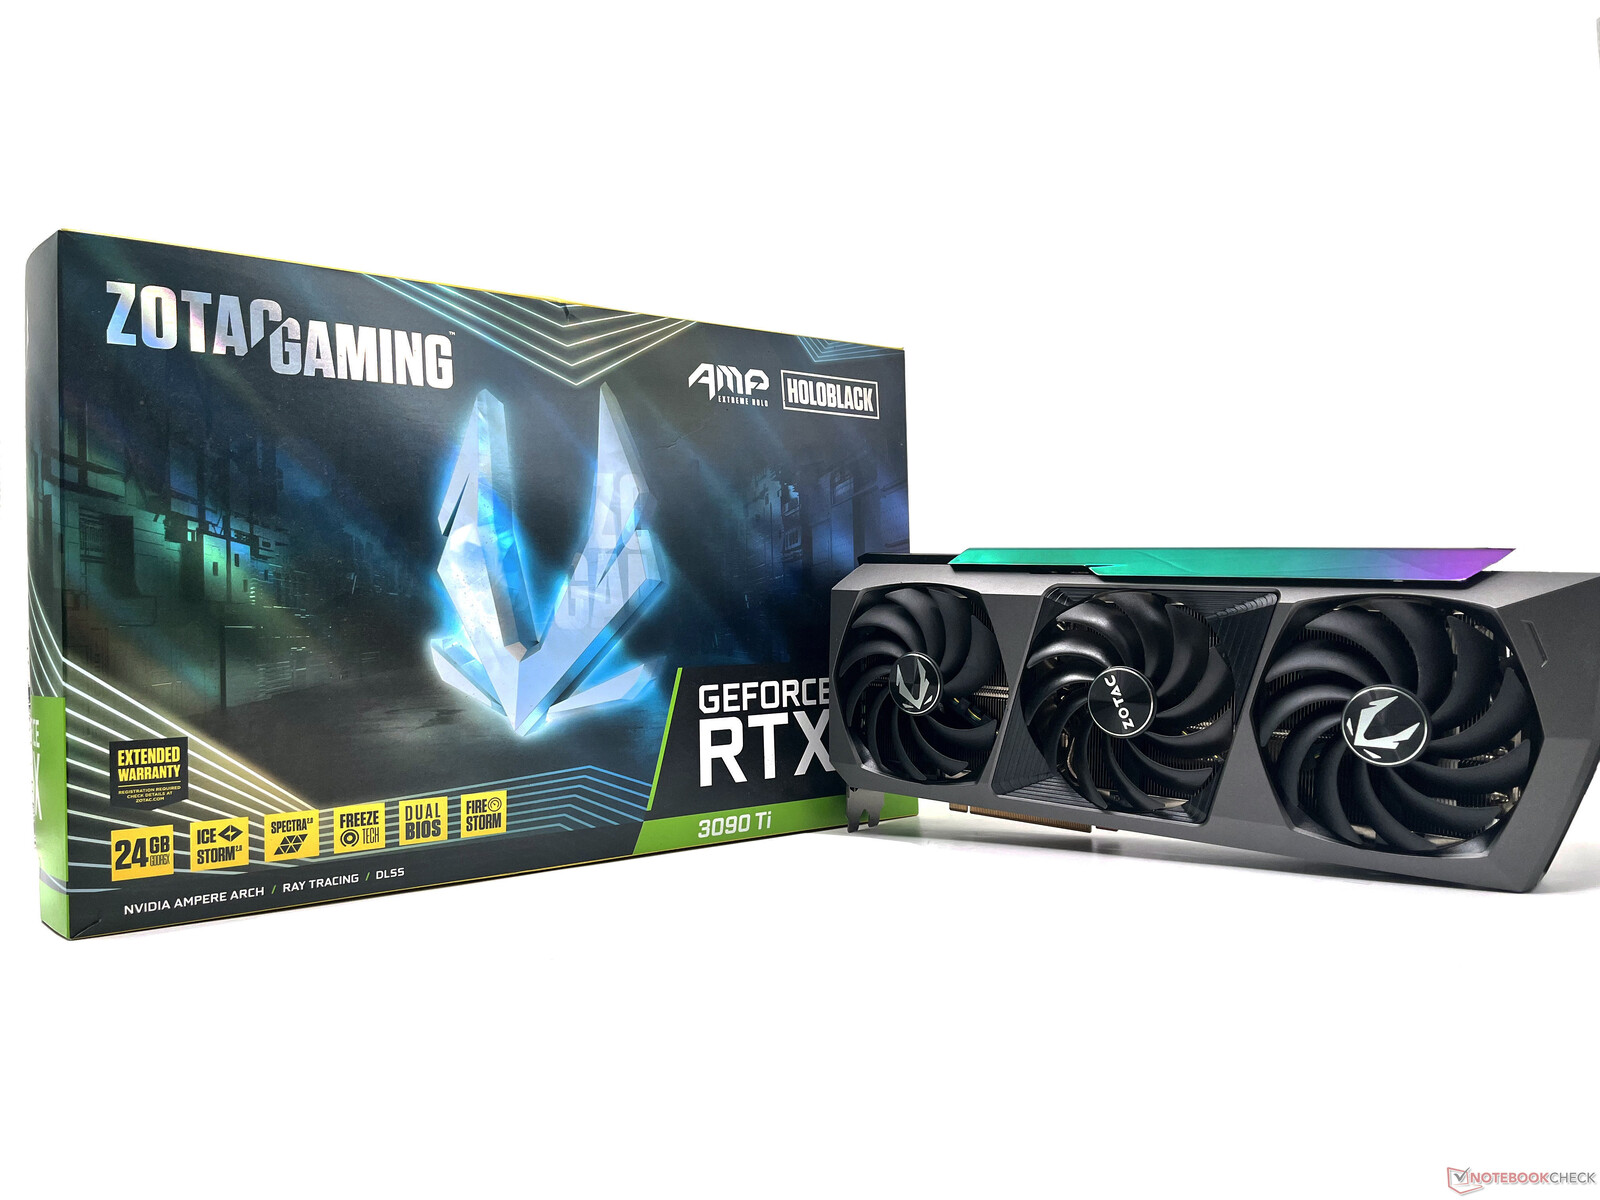
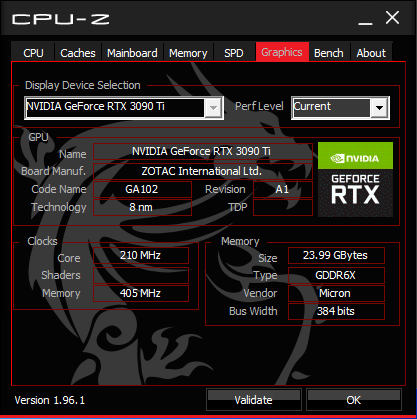
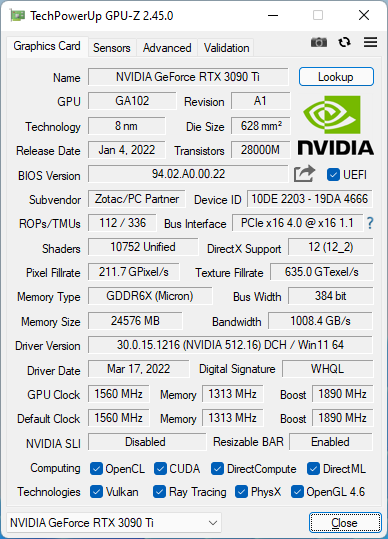
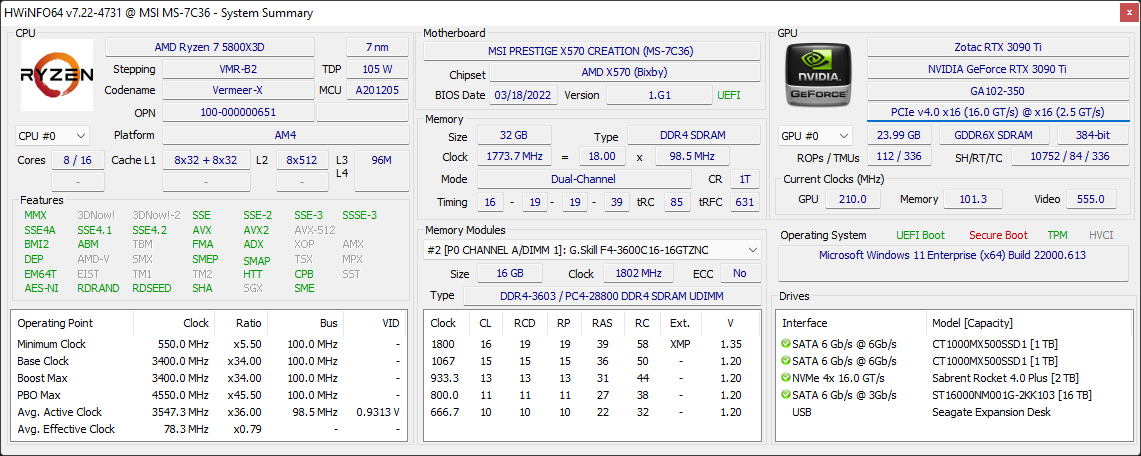
Le banc d'essai : Le Ryzen 7 5800X3D rencontre la RTX 3090 Ti
Notre banc d'essai est basé sur ce que nous avions utilisé précédemment pour la Zotac Gaming GeForce RTX 3090 Ti AMP Extreme Holo GPU de Zotac Gaming. Il comprend les éléments suivants :
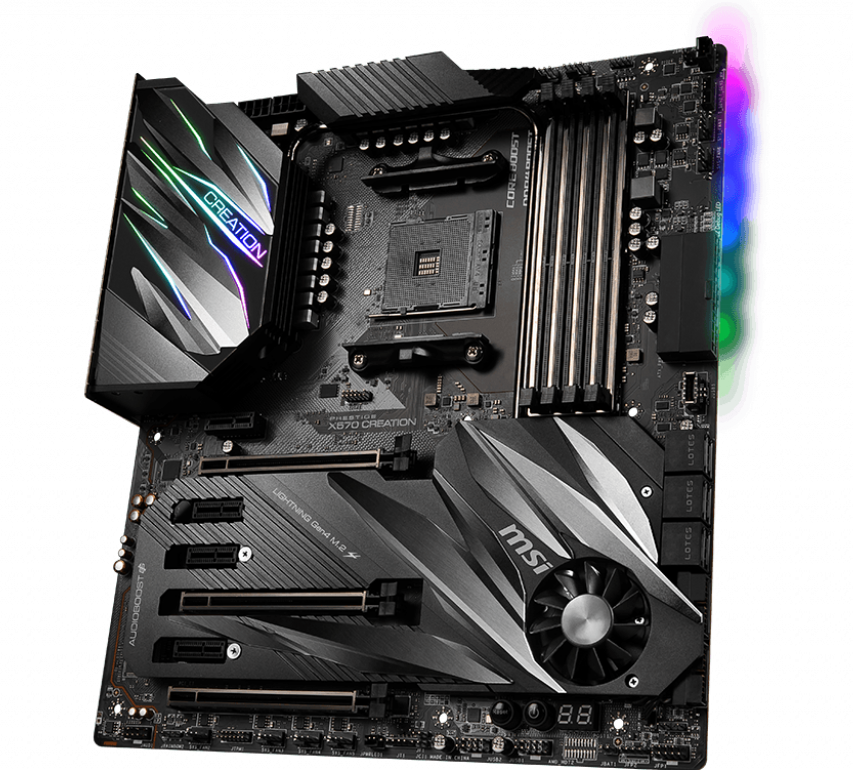
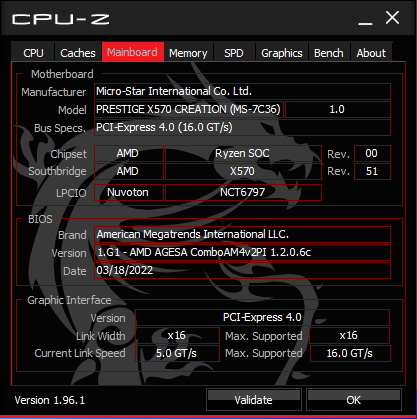
- Carte mère MSI Prestige X570 Creation avec AGESA 1.2.0.6c
- GPU Zotac Gaming GeForce RTX 3090 Ti AMP Extreme Holo
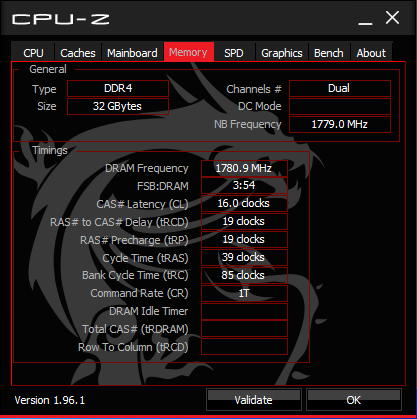
- 2x 16 GB G.SKILL Trident Z Neo DDR4-3600 RAM avec timings 16-19-19-39
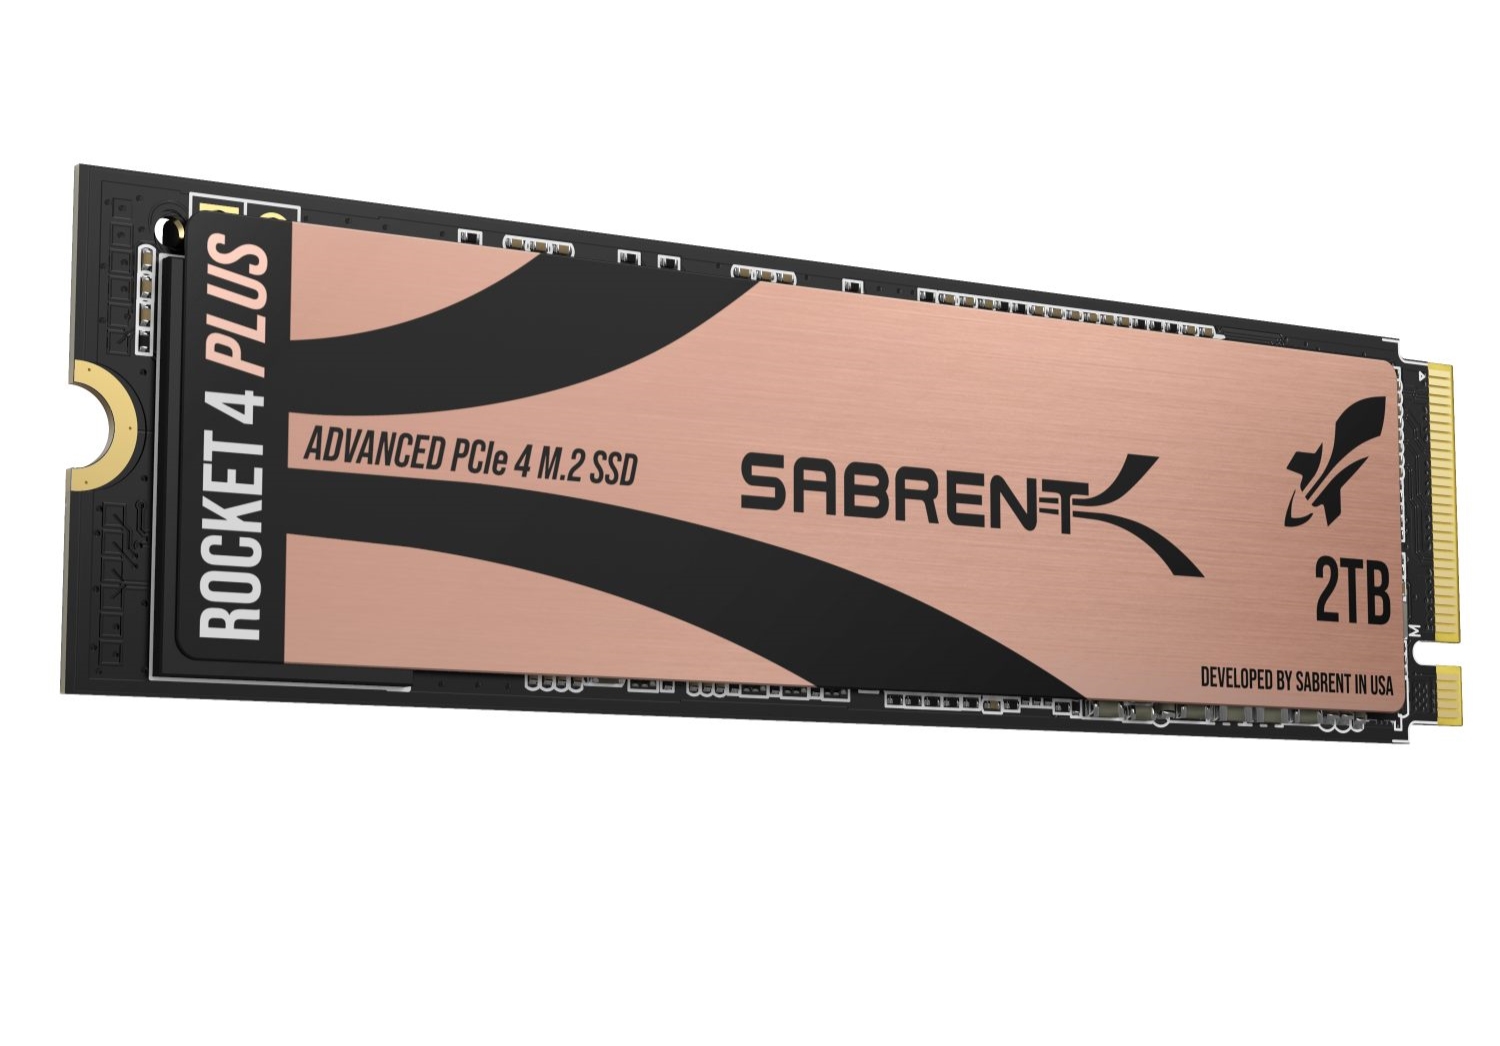
- 2 To de SSD NVMe Sabrent Rocket 4 Plus Gen4
- 2x 1 To SSD Crucial MX500 SATA
- Bloc d'alimentation Thermaltake Toughpower 850 W Plus Gold
- Refroidisseur AIO Corsair iCUE H115i Elite Capellix
- Boîtier Corsair iCUE 4000X RGB
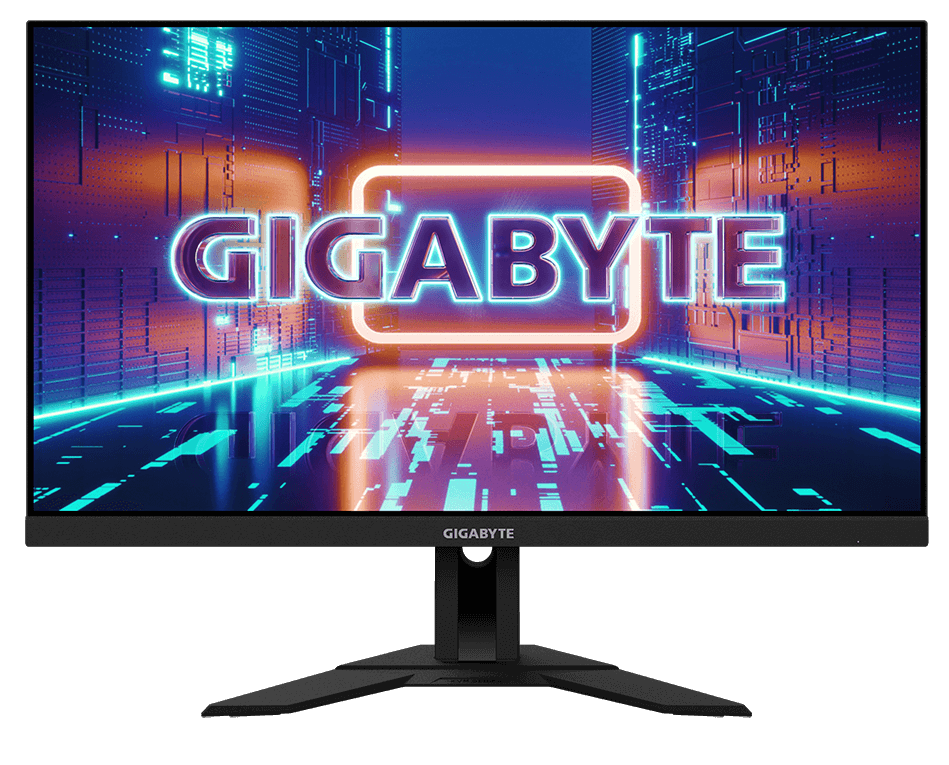
- Moniteur Gigabyte M28U 4K 144 Hz AMD FreeSync Premium Pro
Nous tenons à remercier AMD pour avoir fourni l'échantillon Ryzen 7 5800X3D, Nvidia pour le GPU Zotac RTX 3090 Ti, Sabrent pour le SSD Rocket 4 Plus Gen4, Corsair pour le refroidisseur Elite Capellix iCUE H115i et le boîtier 4000X, et Gigabyte pour le moniteur de jeu M28U.
Bancs d'essai synthétiques : Le Ryzen 7 5800X3D est en retrait
Les performances brutes du CPU ne sont certainement pas le point fort du Ryzen 7 5800X3D. Ceci est principalement dû à deux raisons :
- Le Ryzen 7 5800X3D est cadencé plus bas - 400 MHz de moins en base et 200 MHz de moins en boost - que le Ryzen 7 5800X
- Bien que le 5800X3D supporte l'overclocking de la mémoire et de l'Infinity Fabric, l'ajout de 3D V-Cache empêche toute forme d'overclocking du cœur, y compris Precision Boost Overdrive
Ainsi, les performances multi-core dans Cinebench R15, R20 et R23 sont environ 6-10% plus faibles que celles d'un Ryzen 7 5800X. En single-core, même le Ryzen 5 5600X est plus rapide d'environ 6% par rapport au 5800X3D.
Une tendance similaire se reflète dans d'autres benchmarks CPU synthétiques où le Ryzen 7 5800X a une avance confortable sur le Ryzen 7 5800X3D, sauf pour les tests CPU wPrime, 3DMark 11 Physics et 3DMark Time Spy.
Le Core i9-12900K d'Intel, grâce à sa configuration à 16 cœurs et 24 threads et à son horloge boostée à 5,1 GHz, conserve une avance confortable dans nos tests sans transpirer.
| Cinebench R23 | |
| Single Core | |
| Intel Core i9-12900K | |
| Intel Core i5-12600K | |
| AMD Ryzen 9 5950X | |
| AMD Ryzen 9 5900X | |
| AMD Ryzen 7 5800X | |
| AMD Ryzen 5 5600X | |
| AMD Ryzen 7 5800X3D | |
| Multi Core | |
| AMD Ryzen 9 5950X | |
| Intel Core i9-12900K | |
| AMD Ryzen 9 5900X | |
| Intel Core i5-12600K | |
| AMD Ryzen 7 5800X | |
| AMD Ryzen 7 5800X3D | |
| AMD Ryzen 5 5600X | |
| Cinebench R20 | |
| CPU (Single Core) | |
| Intel Core i9-12900K | |
| Intel Core i5-12600K | |
| AMD Ryzen 9 5950X | |
| AMD Ryzen 9 5900X | |
| AMD Ryzen 7 5800X | |
| AMD Ryzen 5 5600X | |
| AMD Ryzen 7 5800X3D | |
| CPU (Multi Core) | |
| AMD Ryzen 9 5950X | |
| Intel Core i9-12900K | |
| AMD Ryzen 9 5900X | |
| Intel Core i5-12600K | |
| AMD Ryzen 7 5800X | |
| AMD Ryzen 7 5800X3D | |
| AMD Ryzen 5 5600X | |
| Cinebench R15 | |
| CPU Single 64Bit | |
| Intel Core i9-12900K | |
| Intel Core i5-12600K | |
| AMD Ryzen 9 5950X | |
| AMD Ryzen 9 5900X | |
| AMD Ryzen 7 5800X | |
| AMD Ryzen 5 5600X | |
| AMD Ryzen 7 5800X3D | |
| CPU Multi 64Bit | |
| AMD Ryzen 9 5950X | |
| Intel Core i9-12900K | |
| AMD Ryzen 9 5900X | |
| AMD Ryzen 7 5800X | |
| Intel Core i5-12600K | |
| AMD Ryzen 7 5800X3D | |
| AMD Ryzen 5 5600X | |
| Blender - v2.79 BMW27 CPU | |
| AMD Ryzen 5 5600X | |
| AMD Ryzen 7 5800X3D | |
| AMD Ryzen 7 5800X | |
| Intel Core i5-12600K | |
| AMD Ryzen 9 5900X | |
| Intel Core i9-12900K | |
| AMD Ryzen 9 5950X | |
| wPrime 2.10 | |
| 32m | |
| Intel Core i9-12900K | |
| Intel Core i5-12600K | |
| AMD Ryzen 5 5600X | |
| AMD Ryzen 7 5800X3D | |
| AMD Ryzen 7 5800X | |
| AMD Ryzen 9 5950X | |
| 1024m | |
| Intel Core i5-12600K | |
| Intel Core i9-12900K | |
| AMD Ryzen 5 5600X | |
| AMD Ryzen 7 5800X3D | |
| AMD Ryzen 7 5800X | |
| AMD Ryzen 9 5950X | |
| X264 HD Benchmark 4.0 | |
| Pass 1 | |
| Intel Core i9-12900K | |
| AMD Ryzen 7 5800X | |
| AMD Ryzen 9 5950X | |
| AMD Ryzen 9 5900X | |
| Intel Core i5-12600K | |
| AMD Ryzen 5 5600X | |
| AMD Ryzen 7 5800X3D | |
| Pass 2 | |
| AMD Ryzen 9 5950X | |
| Intel Core i9-12900K | |
| AMD Ryzen 9 5900X | |
| AMD Ryzen 7 5800X | |
| Intel Core i5-12600K | |
| AMD Ryzen 7 5800X3D | |
| AMD Ryzen 5 5600X | |
| WinRAR - Result | |
| AMD Ryzen 7 5800X | |
| AMD Ryzen 7 5800X3D | |
| AMD Ryzen 9 5900X | |
| AMD Ryzen 5 5600X | |
| AMD Ryzen 9 5950X | |
| Intel Core i9-12900K | |
| Intel Core i5-12600K | |
| TrueCrypt | |
| AES Mean 100MB | |
| AMD Ryzen 9 5950X | |
| AMD Ryzen 9 5900X | |
| Intel Core i9-12900K | |
| AMD Ryzen 7 5800X | |
| AMD Ryzen 7 5800X3D | |
| Intel Core i5-12600K | |
| AMD Ryzen 5 5600X | |
| Twofish Mean 100MB | |
| AMD Ryzen 9 5950X | |
| Intel Core i9-12900K | |
| AMD Ryzen 9 5900X | |
| Intel Core i5-12600K | |
| AMD Ryzen 7 5800X | |
| AMD Ryzen 7 5800X3D | |
| AMD Ryzen 5 5600X | |
| Serpent Mean 100MB | |
| AMD Ryzen 9 5950X | |
| Intel Core i9-12900K | |
| AMD Ryzen 9 5900X | |
| AMD Ryzen 7 5800X | |
| Intel Core i5-12600K | |
| AMD Ryzen 7 5800X3D | |
| AMD Ryzen 5 5600X | |
| Geekbench 5.5 | |
| Single-Core | |
| Intel Core i9-12900K | |
| Intel Core i5-12600K | |
| AMD Ryzen 9 5950X | |
| AMD Ryzen 9 5900X | |
| AMD Ryzen 7 5800X | |
| AMD Ryzen 5 5600X | |
| AMD Ryzen 7 5800X3D | |
| Multi-Core | |
| Intel Core i9-12900K | |
| AMD Ryzen 9 5950X | |
| AMD Ryzen 9 5900X | |
| Intel Core i5-12600K | |
| AMD Ryzen 7 5800X | |
| AMD Ryzen 7 5800X3D | |
| AMD Ryzen 5 5600X | |
| Geekbench 5.0 | |
| 5.0 Single-Core | |
| Intel Core i9-12900K | |
| Intel Core i5-12600K | |
| AMD Ryzen 9 5950X | |
| AMD Ryzen 7 5800X | |
| AMD Ryzen 9 5900X | |
| AMD Ryzen 5 5600X | |
| AMD Ryzen 7 5800X3D | |
| 5.0 Multi-Core | |
| Intel Core i9-12900K | |
| AMD Ryzen 9 5950X | |
| AMD Ryzen 9 5900X | |
| Intel Core i5-12600K | |
| AMD Ryzen 7 5800X | |
| AMD Ryzen 7 5800X3D | |
| AMD Ryzen 5 5600X | |
| Geekbench 4.4 | |
| 64 Bit Single-Core Score | |
| Intel Core i9-12900K | |
| Intel Core i5-12600K | |
| AMD Ryzen 7 5800X | |
| AMD Ryzen 9 5900X | |
| AMD Ryzen 9 5950X | |
| AMD Ryzen 7 5800X3D | |
| AMD Ryzen 5 5600X | |
| 64 Bit Multi-Core Score | |
| Intel Core i9-12900K | |
| AMD Ryzen 9 5950X | |
| AMD Ryzen 9 5900X | |
| Intel Core i5-12600K | |
| AMD Ryzen 7 5800X | |
| AMD Ryzen 7 5800X3D | |
| AMD Ryzen 5 5600X | |
| 7-Zip 18.03 | |
| 7z b 4 | |
| AMD Ryzen 9 5950X | |
| Intel Core i9-12900K | |
| AMD Ryzen 9 5900X | |
| AMD Ryzen 7 5800X | |
| AMD Ryzen 7 5800X3D | |
| Intel Core i5-12600K | |
| AMD Ryzen 5 5600X | |
| 7z b 4 -mmt1 | |
| AMD Ryzen 9 5950X | |
| AMD Ryzen 7 5800X | |
| AMD Ryzen 7 5800X3D | |
| AMD Ryzen 9 5900X | |
| AMD Ryzen 5 5600X | |
| Intel Core i9-12900K | |
| Intel Core i5-12600K | |
| HWBOT x265 Benchmark v2.2 - 4k Preset | |
| AMD Ryzen 9 5950X | |
| Intel Core i5-12600K | |
| Intel Core i9-12900K | |
| AMD Ryzen 9 5900X | |
| AMD Ryzen 7 5800X | |
| AMD Ryzen 7 5800X3D | |
| AMD Ryzen 5 5600X | |
| R Benchmark 2.5 - Overall mean | |
| AMD Ryzen 7 5800X3D | |
| AMD Ryzen 5 5600X | |
| AMD Ryzen 9 5950X | |
| AMD Ryzen 9 5900X | |
| AMD Ryzen 7 5800X | |
| Intel Core i5-12600K | |
| Intel Core i9-12900K | |
| LibreOffice - 20 Documents To PDF | |
| Intel Core i5-12600K | |
| AMD Ryzen 7 5800X3D | |
| AMD Ryzen 9 5900X | |
| AMD Ryzen 9 5950X | |
| AMD Ryzen 5 5600X | |
| AMD Ryzen 7 5800X | |
| Intel Core i9-12900K | |
| 3DMark 11 - 1280x720 Performance Physics | |
| Intel Core i9-12900K | |
| AMD Ryzen 7 5800X3D | |
| AMD Ryzen 9 5950X | |
| Intel Core i5-12600K | |
| AMD Ryzen 9 5900X | |
| AMD Ryzen 7 5800X | |
| AMD Ryzen 5 5600X | |
| 3DMark | |
| 3840x2160 Fire Strike Ultra Physics | |
| Intel Core i9-12900K | |
| AMD Ryzen 9 5950X | |
| AMD Ryzen 9 5900X | |
| AMD Ryzen 7 5800X | |
| Intel Core i5-12600K | |
| AMD Ryzen 7 5800X3D | |
| AMD Ryzen 5 5600X | |
| 1920x1080 Fire Strike Physics | |
| AMD Ryzen 9 5950X | |
| Intel Core i9-12900K | |
| AMD Ryzen 9 5900X | |
| AMD Ryzen 7 5800X | |
| Intel Core i5-12600K | |
| AMD Ryzen 7 5800X3D | |
| AMD Ryzen 5 5600X | |
| 2560x1440 Time Spy CPU | |
| Intel Core i9-12900K | |
| Intel Core i5-12600K | |
| AMD Ryzen 9 5950X | |
| AMD Ryzen 9 5900X | |
| AMD Ryzen 7 5800X3D | |
| AMD Ryzen 7 5800X | |
| AMD Ryzen 5 5600X | |
* ... Moindre est la valeur, meilleures sont les performances
Le refroidisseur Corsair H115i Elite Capellix AIO combiné au radiateur de 280 mm est capable de faire un excellent travail pour garder le Ryzen 7 5800X3D au frais. Nous n'avons remarqué aucun ralentissement dans notre test en boucle multi-core Cinebench R15.
Performances des applications : Aucun problème majeur dans la productivité quotidienne et certains flux de travail créatifs
Le Ryzen 7 5800X3D est capable de gérer habilement les tâches de productivité quotidiennes, comme en témoignent les résultats de PCMark 10. Son classement en bas du tableau peut être attribué à des horloges plus basses, mais nous ne voyons qu'un déficit de performance d'environ 8% par rapport au Ryzen 7 5800X.
Comme nous n'avions pas de Titan RTX pour cette comparaison, nous avons dû nous contenter de la RTX 3090 Ti comme GPU de choix. Bien qu'il s'agisse d'une carte de classe Titan sur le papier, la RTX 3090 Ti utilise les pilotes conventionnels de GeForce, ce qui entraîne des pénalités de performance artificielles dans certaines applications professionnelles.
Néanmoins, la combinaison Ryzen 7 5800X3D et RTX 3090 Ti permet d'obtenir de bons résultats dans certains sous-ensembles des tests SPECviewperf tels que 3ds Max, Maya, Showcase et Medical.
| PCMark 10 - Score | |
| AMD Ryzen 9 5950X, NVIDIA Titan RTX | |
| Intel Core i9-12900K, NVIDIA Titan RTX | |
| AMD Ryzen 9 5900X, NVIDIA Titan RTX | |
| AMD Ryzen 5 5600X, NVIDIA Titan RTX | |
| Intel Core i5-12600K, NVIDIA Titan RTX | |
| AMD Ryzen 7 5800X, NVIDIA Titan RTX | |
| AMD Ryzen 7 5800X3D, NVIDIA GeForce RTX 3090 Ti | |
| PCMark 10 Score | 7607 points | |
Aide | ||
performances 3D et de jeu : Le Ryzen 7 5800X3D dépasse le Core i9-12900K à 1080p
AMD commercialise le Ryzen 7 5800X3D comme étant principalement un processeur de jeu. Alors que le 5800X3D a clairement du mal avec les performances brutes du processeur, les choses changent lorsqu'il s'agit d'applications de jeu. Nous le constatons notamment à des résolutions inférieures telles que 1080p.
Le combo Ryzen 7 5800X3D+RTX 3090 Ti est clairement en tête du peloton et parvient même à battre de manière convaincante la configuration Core i9-12900K+Titan RTX dans une bonne majorité de tests 3DMark et Unigine avec une marge significative. Notez que le Ryzen 7 5800X3D perd toujours face aux offres d'Intel Alder Lake et la plupart de ses cousins Zen 3 dans les aspects CPU seulement de ces benchmarks comme indiqué précédemment. La RTX 3090 Ti semble avoir apporté sa pierre à l'édifice dans ces tests, car elle est clairement une carte beaucoup plus puissante que la Titan RTX que nous avions utilisée dans nos précédents tests.
Pour une analyse plus détaillée des résultats des benchmarks 3D synthétiques, nous vous renvoyons à notre revue du GPU Zotac GeForce RTX 3090 Ti AMP Extreme Holo.
| 3DMark 11 - 1280x720 Performance GPU | |
| AMD Ryzen 7 5800X3D, NVIDIA GeForce RTX 3090 Ti | |
| Intel Core i5-12600K, NVIDIA Titan RTX | |
| AMD Ryzen 9 5950X, NVIDIA Titan RTX | |
| AMD Ryzen 7 5800X, NVIDIA Titan RTX | |
| Intel Core i9-12900K, NVIDIA Titan RTX | |
| AMD Ryzen 5 5600X, NVIDIA Titan RTX | |
| AMD Ryzen 9 5900X, NVIDIA Titan RTX | |
| Unigine Valley 1.0 | |
| 1920x1080 Extreme HD DirectX AA:x8 | |
| AMD Ryzen 7 5800X3D, NVIDIA GeForce RTX 3090 Ti | |
| Intel Core i9-12900K, NVIDIA Titan RTX | |
| AMD Ryzen 9 5950X, NVIDIA Titan RTX | |
| AMD Ryzen 9 5900X, NVIDIA Titan RTX | |
| AMD Ryzen 7 5800X, NVIDIA Titan RTX | |
| AMD Ryzen 5 5600X, NVIDIA Titan RTX | |
| Intel Core i5-12600K, NVIDIA Titan RTX | |
| 1920x1080 Extreme HD Preset OpenGL AA:x8 | |
| AMD Ryzen 7 5800X3D, NVIDIA GeForce RTX 3090 Ti | |
| Intel Core i5-12600K, NVIDIA Titan RTX | |
| Intel Core i9-12900K, NVIDIA Titan RTX | |
| AMD Ryzen 9 5900X, NVIDIA Titan RTX | |
| AMD Ryzen 7 5800X, NVIDIA Titan RTX | |
| AMD Ryzen 9 5950X, NVIDIA Titan RTX | |
| AMD Ryzen 5 5600X, NVIDIA Titan RTX | |
| Unigine Heaven 4.0 | |
| Extreme Preset DX11 | |
| AMD Ryzen 7 5800X3D, NVIDIA GeForce RTX 3090 Ti | |
| Intel Core i9-12900K, NVIDIA Titan RTX | |
| Intel Core i5-12600K, NVIDIA Titan RTX | |
| AMD Ryzen 9 5900X, NVIDIA Titan RTX | |
| AMD Ryzen 9 5950X, NVIDIA Titan RTX | |
| AMD Ryzen 7 5800X, NVIDIA Titan RTX | |
| AMD Ryzen 5 5600X, NVIDIA Titan RTX | |
| Extreme Preset OpenGL | |
| Intel Core i5-12600K, NVIDIA Titan RTX | |
| AMD Ryzen 7 5800X3D, NVIDIA GeForce RTX 3090 Ti | |
| Intel Core i9-12900K, NVIDIA Titan RTX | |
| AMD Ryzen 7 5800X, NVIDIA Titan RTX | |
| AMD Ryzen 9 5900X, NVIDIA Titan RTX | |
| AMD Ryzen 9 5950X, NVIDIA Titan RTX | |
| AMD Ryzen 5 5600X, NVIDIA Titan RTX | |
| 3DMark 11 Performance | 49471 points | |
| 3DMark Ice Storm Standard Score | 233264 points | |
| 3DMark Cloud Gate Standard Score | 75753 points | |
| 3DMark Fire Strike Score | 36563 points | |
| 3DMark Fire Strike Extreme Score | 24198 points | |
| 3DMark Time Spy Score | 19241 points | |
Aide | ||
Le Ryzen 7 5800X3D est le vainqueur incontestable si vous recherchez l'un des processeurs de jeu les plus rapides actuellement disponibles. Malheureusement, nous n'avons pas encore pu trouver un échantillon de Core i9-12900KS, donc la comparaison ci-dessous est limitée au Core i9-12900K et au Core i5-12600K de l'écurie Team Blue.
Les résolutions à 1080p sont celles qui bénéficient le plus de l'augmentation de la mémoire cache, car ces paramètres sont plus limités par le CPU par rapport à 2K et plus. En conséquence, le Ryzen 7 5800X3D semble être un partenaire idéal pour la RTX 3090 Ti pour pousser autant d'images que possible à cette résolution. L'augmentation par rapport au Core i9-12900K peut atteindre 40% (Borderlands 3, 1080p Badass Quality) selon le jeu et les paramètres de qualité choisis.
| Borderlands 3 | |
| 1920x1080 Medium Overall Quality (DX11) | |
| AMD Ryzen 7 5800X3D, NVIDIA GeForce RTX 3090 Ti | |
| AMD Ryzen 9 5900X, NVIDIA Titan RTX | |
| AMD Ryzen 7 5800X, NVIDIA Titan RTX | |
| AMD Ryzen 9 5950X, NVIDIA Titan RTX | |
| AMD Ryzen 5 5600X, NVIDIA Titan RTX | |
| Intel Core i9-12900K, NVIDIA Titan RTX | |
| Intel Core i5-12600K, NVIDIA Titan RTX | |
| 1920x1080 High Overall Quality (DX11) | |
| AMD Ryzen 7 5800X3D, NVIDIA GeForce RTX 3090 Ti | |
| Intel Core i9-12900K, NVIDIA Titan RTX | |
| AMD Ryzen 9 5900X, NVIDIA Titan RTX | |
| AMD Ryzen 7 5800X, NVIDIA Titan RTX | |
| AMD Ryzen 9 5950X, NVIDIA Titan RTX | |
| AMD Ryzen 5 5600X, NVIDIA Titan RTX | |
| Intel Core i5-12600K, NVIDIA Titan RTX | |
| 1920x1080 Badass Overall Quality (DX11) | |
| AMD Ryzen 7 5800X3D, NVIDIA GeForce RTX 3090 Ti | |
| Intel Core i9-12900K, NVIDIA Titan RTX | |
| Intel Core i5-12600K, NVIDIA Titan RTX | |
| AMD Ryzen 9 5900X, NVIDIA Titan RTX | |
| AMD Ryzen 9 5950X, NVIDIA Titan RTX | |
| AMD Ryzen 7 5800X, NVIDIA Titan RTX | |
| AMD Ryzen 5 5600X, NVIDIA Titan RTX | |
| The Witcher 3 | |
| 1920x1080 High Graphics & Postprocessing (Nvidia HairWorks Off) | |
| AMD Ryzen 7 5800X3D, NVIDIA GeForce RTX 3090 Ti | |
| Intel Core i5-12600K, NVIDIA Titan RTX | |
| AMD Ryzen 9 5900X, NVIDIA Titan RTX | |
| AMD Ryzen 7 5800X, NVIDIA Titan RTX | |
| AMD Ryzen 9 5950X, NVIDIA Titan RTX | |
| Intel Core i9-12900K, NVIDIA Titan RTX | |
| AMD Ryzen 5 5600X, NVIDIA Titan RTX | |
| 1920x1080 Ultra Graphics & Postprocessing (HBAO+) | |
| AMD Ryzen 7 5800X3D, NVIDIA GeForce RTX 3090 Ti | |
| Intel Core i5-12600K, NVIDIA Titan RTX | |
| AMD Ryzen 9 5900X, NVIDIA Titan RTX | |
| AMD Ryzen 9 5950X, NVIDIA Titan RTX | |
| AMD Ryzen 7 5800X, NVIDIA Titan RTX | |
| AMD Ryzen 5 5600X, NVIDIA Titan RTX | |
| Intel Core i9-12900K, NVIDIA Titan RTX | |
| F1 2021 | |
| 1920x1080 Medium Preset AA:T AF:16x | |
| AMD Ryzen 7 5800X3D, NVIDIA GeForce RTX 3090 Ti | |
| AMD Ryzen 9 5900X, NVIDIA Titan RTX | |
| Intel Core i9-12900K, NVIDIA Titan RTX | |
| Intel Core i5-12600K, NVIDIA Titan RTX | |
| 1920x1080 High Preset AA:T AF:16x | |
| AMD Ryzen 7 5800X3D, NVIDIA GeForce RTX 3090 Ti | |
| AMD Ryzen 9 5900X, NVIDIA Titan RTX | |
| Intel Core i9-12900K, NVIDIA Titan RTX | |
| Intel Core i5-12600K, NVIDIA Titan RTX | |
| 1920x1080 Ultra High Preset + Raytracing AA:T AF:16x | |
| AMD Ryzen 7 5800X3D, NVIDIA GeForce RTX 3090 Ti | |
| AMD Ryzen 9 5900X, NVIDIA Titan RTX | |
| Intel Core i9-12900K, NVIDIA Titan RTX | |
| Intel Core i5-12600K, NVIDIA Titan RTX | |
| Final Fantasy XV Benchmark | |
| 1280x720 Lite Quality | |
| Intel Core i9-12900K, NVIDIA Titan RTX | |
| AMD Ryzen 9 5900X, NVIDIA Titan RTX | |
| AMD Ryzen 7 5800X, NVIDIA Titan RTX | |
| AMD Ryzen 9 5950X, NVIDIA Titan RTX | |
| AMD Ryzen 5 5600X, NVIDIA Titan RTX | |
| AMD Ryzen 7 5800X3D, NVIDIA GeForce RTX 3090 Ti | |
| Intel Core i5-12600K, NVIDIA Titan RTX | |
| 1920x1080 Standard Quality | |
| AMD Ryzen 7 5800X3D, NVIDIA GeForce RTX 3090 Ti | |
| Intel Core i9-12900K, NVIDIA Titan RTX | |
| Intel Core i5-12600K, NVIDIA Titan RTX | |
| AMD Ryzen 7 5800X, NVIDIA Titan RTX | |
| AMD Ryzen 9 5950X, NVIDIA Titan RTX | |
| AMD Ryzen 9 5900X, NVIDIA Titan RTX | |
| AMD Ryzen 5 5600X, NVIDIA Titan RTX | |
| 1920x1080 High Quality | |
| AMD Ryzen 7 5800X3D, NVIDIA GeForce RTX 3090 Ti | |
| Intel Core i9-12900K, NVIDIA Titan RTX | |
| AMD Ryzen 9 5950X, NVIDIA Titan RTX | |
| Intel Core i5-12600K, NVIDIA Titan RTX | |
| AMD Ryzen 7 5800X, NVIDIA Titan RTX | |
| AMD Ryzen 9 5900X, NVIDIA Titan RTX | |
| AMD Ryzen 5 5600X, NVIDIA Titan RTX | |
| Metro Exodus | |
| 1920x1080 Medium Quality AF:4x | |
| AMD Ryzen 7 5800X3D, NVIDIA GeForce RTX 3090 Ti | |
| Intel Core i5-12600K, NVIDIA Titan RTX | |
| AMD Ryzen 9 5900X, NVIDIA Titan RTX | |
| AMD Ryzen 7 5800X, NVIDIA Titan RTX | |
| AMD Ryzen 9 5950X, NVIDIA Titan RTX | |
| AMD Ryzen 5 5600X, NVIDIA Titan RTX | |
| 1920x1080 High Quality AF:16x | |
| AMD Ryzen 7 5800X3D, NVIDIA GeForce RTX 3090 Ti | |
| Intel Core i5-12600K, NVIDIA Titan RTX | |
| AMD Ryzen 9 5900X, NVIDIA Titan RTX | |
| AMD Ryzen 7 5800X, NVIDIA Titan RTX | |
| AMD Ryzen 9 5950X, NVIDIA Titan RTX | |
| AMD Ryzen 5 5600X, NVIDIA Titan RTX | |
| 1920x1080 Ultra Quality AF:16x | |
| AMD Ryzen 7 5800X3D, NVIDIA GeForce RTX 3090 Ti | |
| Intel Core i5-12600K, NVIDIA Titan RTX | |
| AMD Ryzen 5 5600X, NVIDIA Titan RTX | |
| AMD Ryzen 9 5900X, NVIDIA Titan RTX | |
| AMD Ryzen 7 5800X, NVIDIA Titan RTX | |
| AMD Ryzen 9 5950X, NVIDIA Titan RTX | |
| Bas | Moyen | Élevé | Ultra | QHD | 4K | |
|---|---|---|---|---|---|---|
| GTA V (2015) | 185.59 | 160.67 | 155.26 | 182.63 | ||
| The Witcher 3 (2015) | 394 | 193.4 | 172.9 | |||
| Dota 2 Reborn (2015) | 257.7 | 231.2 | 217.1 | 195.8 | 184.2 | |
| Final Fantasy XV Benchmark (2018) | 222 | 226 | 186.1 | 151.6 | 96.3 | |
| X-Plane 11.11 (2018) | 169.1 | 158.1 | 135.9 | 115.7 | ||
| Shadow of the Tomb Raider (2018) | 265 | 257 | 244 | 184 | 106 | |
| Metro Exodus (2019) | 213 | 175.2 | 145.9 | 125.3 | 84.3 | |
| Total War: Three Kingdoms (2019) | 342.6 | 248.9 | 176.6 | 117.9 | 59.9 | |
| Control (2019) | 240 | 209 | 142.5 | 73.9 | ||
| Borderlands 3 (2019) | 204 | 187.6 | 173.3 | 143.1 | 83.8 | |
| Mafia Definitive Edition (2020) | 240 | 231 | 173.9 | 99.2 | ||
| Watch Dogs Legion (2020) | 171.4 | 154.2 | 130.2 | 107.8 | 70.1 | |
| Assassin´s Creed Valhalla (2020) | 160 | 138 | 123 | 108 | 73 | |
| F1 2021 (2021) | 537 | 470 | 242 | 189.3 | 114.9 | |
| Far Cry 6 (2021) | 179 | 161.6 | 142 | 132.9 | 89.9 | |
| Call of Duty Vanguard (2021) | 195.5 | 207 | 191.2 | 149.9 | 93.7 | |
| Forza Horizon 5 (2021) | 231 | 200 | 188 | 127 | 114 | 89 |
| Rainbow Six Extraction (2022) | 411 | 347 | 315 | 290 | 208 | 116 |
| Dying Light 2 (2022) | 202 | 171.4 | 153 | 113.2 | 64.3 | |
| GRID Legends (2022) | 228 | 202 | 173.4 | 156.6 | 153.2 | 120.5 |
| Elden Ring (2022) | 60 | 60 | 60 | 60 | 60 | 60 |
| Cyberpunk 2077 1.6 (2022) | 219 | 201 | 172.8 | 151.8 | 103.9 | 53.3 |
| Ghostwire Tokyo (2022) | 263 | 260 | 261 | 261 | 210 | 113.2 |
| Tiny Tina's Wonderlands (2022) | 324 | 277 | 231 | 190.2 | 142.6 | 81.1 |
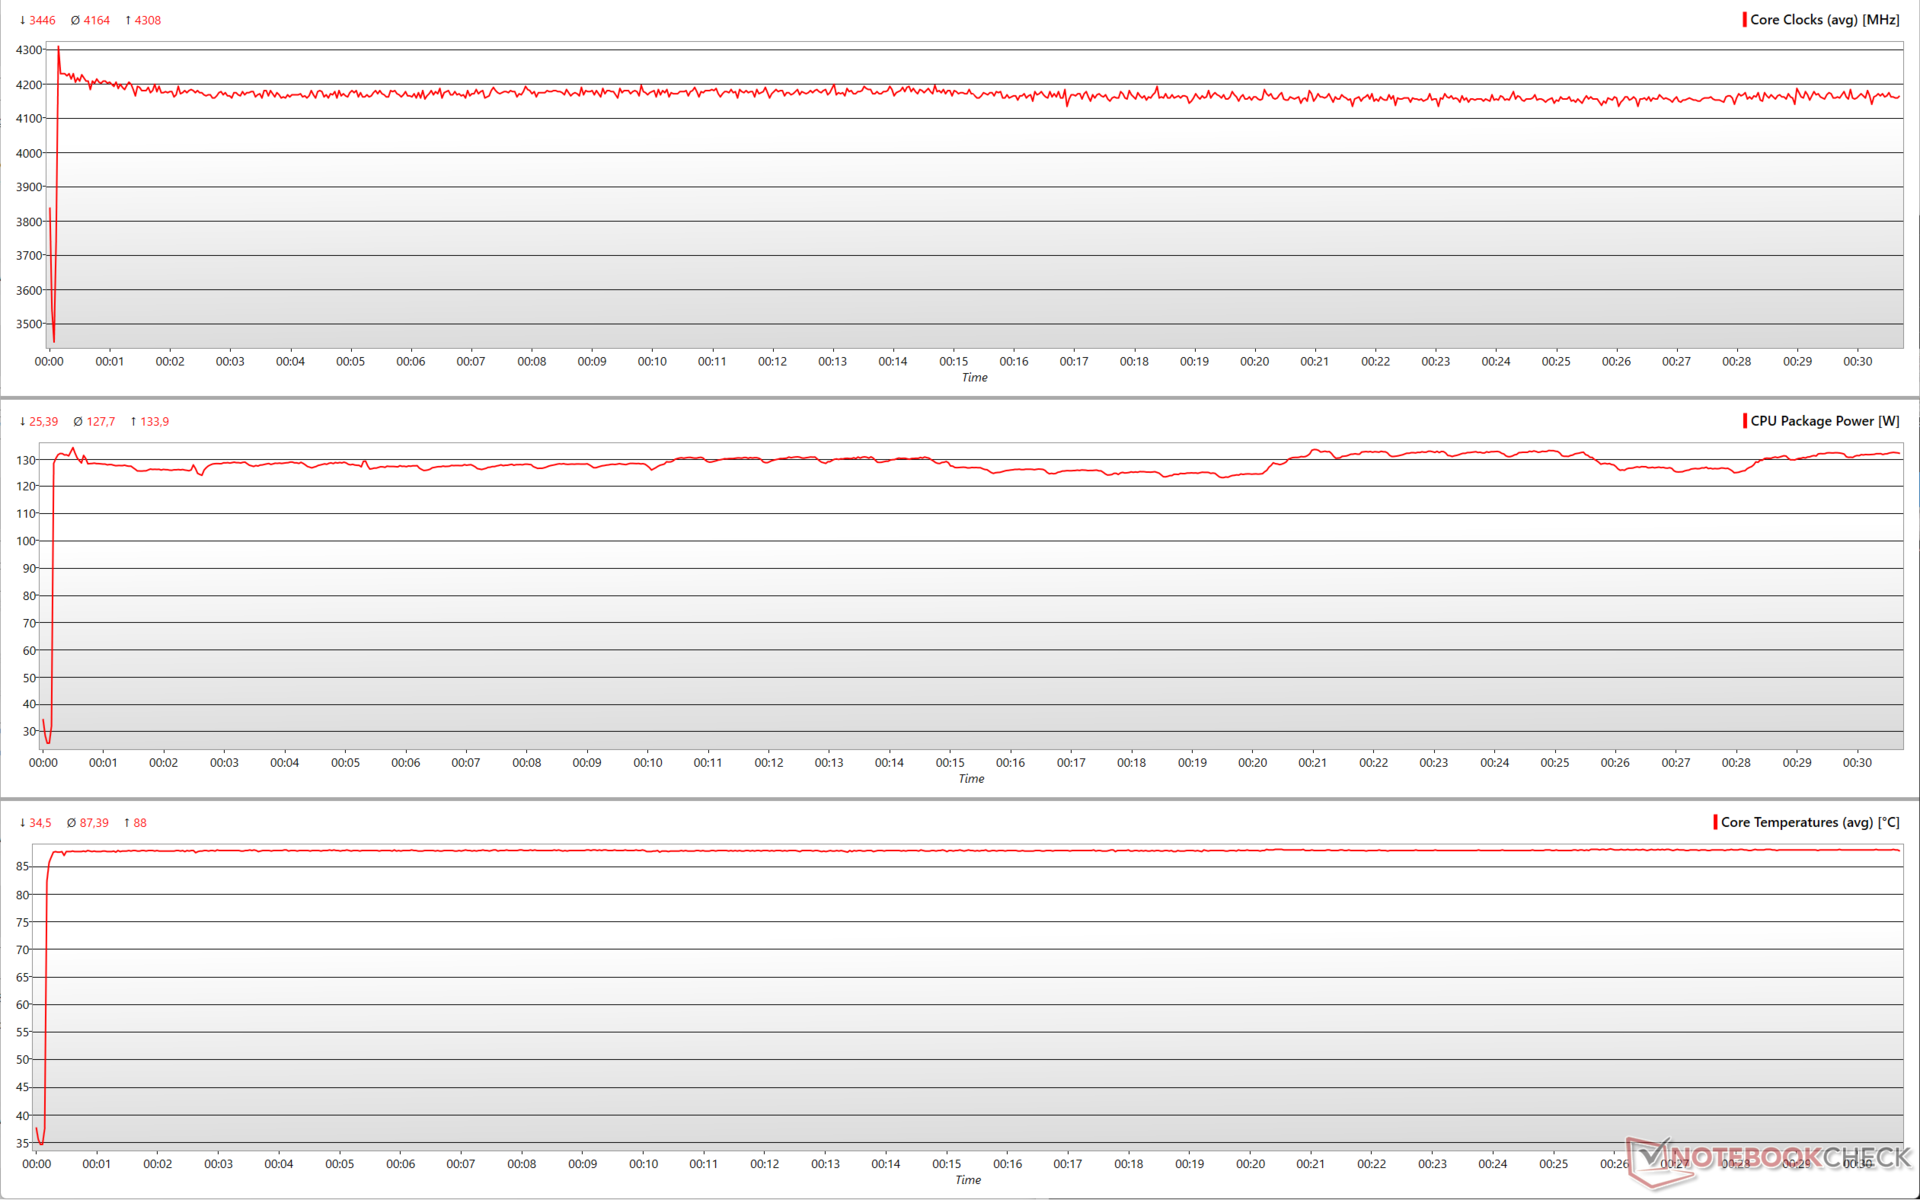
Test de stress et températures : Pas de problèmes d'étranglement
En soumettant le Ryzen 7 5800X3D à des contraintes avec Prime95, on constate que la puissance du processeur se situe juste au-dessus de la barre des 130 W et que les vitesses d'horloge sont assez constantes, proches de 4,2 GHz. Les températures du processeur tournent autour de 90 °C sans étranglement.
Cette constance dans les performances a également été observée dans le test en boucle multi-core Cinebench R15 ci-dessus. Cela peut être attribué en partie au Ryzen 7 5800X3D et aussi en partie à l'excellente performance de refroidissement du refroidisseur Corsair H115i Elite Capellix AIO.
Consommation d'énergie : Moins économique que le Core i5-12600K malgré des performances inférieures
Notre système de test consomme environ 102 W en mode veille avec un total de cinq ventilateurs de boîtier (trois ventilateurs de boîtier Corsair SP 120 mm et deux ventilateurs de radiateur Corsair ML 120 mm) et le refroidisseur Elite Capellix fonctionnant dans le profil Balanced. Tous les éclairages RGB ont été désactivés.
La consommation d'énergie est plus ou moins similaire à celle du Ryzen 9 5900X et environ 29% de plus que le Ryzen 5 5600X dans le stress Prime95 in-place FFT. Cinebench R15 multi-core voit le Ryzen 7 5800X3D être légèrement moins économique que le Core i5-12600K même si la puce d'AMD affiche un déficit de performance de 6 %. Un profil similaire est observé avec Cinebench R20 multi également, cette fois avec un écart de performance encore plus grand de 18% par rapport au Core i5-12600K.
Le Ryzen 7 5800X3D est à la traîne derrière le Core i9-12900K de 26 % dans Cinebench R20 single-core mais semble consommer un peu plus d'énergie. En général, cependant, la consommation totale du système avec le Ryzen 7 5800X3D est toujours limitée à environ 230 W, alors que le PC équipé du Core i9-12900K peut consommer près de 57% de plus dans les tests de CPU multi-cœurs.
Power Consumption: External Monitor
* ... Moindre est la valeur, meilleures sont les performances
Points positifs
Points négatifs
Verdict : Strictement pour les joueurs et les utilisateurs de Zen OG seulement
AMD s'est accroché au socket AM4 pendant longtemps. Même avec le lancement de la série Ryzen 7000 sur le socket AM5, la société s'attend à ce que l'ancien socket se comporte bien dans la plupart des cas. Le Ryzen 7 5800X3D est plus un banc d'essai pour AMD, dont les enseignements seront incorporés dans les itérations futures. Cela étant dit, le Ryzen 7 5800X3D apparaît clairement comme un excellent choix si votre utilisation principale est le jeu, en particulier à des résolutions inférieures.
L'utilisation d'un cache empilé 3D donne aux jeux une marge de manœuvre importante. Toutefois, elle comporte plusieurs inconvénients, notamment l'impossibilité d'overclocker les cœurs eux-mêmes et de réduire les horloges de base/boost pour s'assurer que le TDP ne dépasse pas 105 W
3D V-cache est un moyen ingénieux d'améliorer les performances de jeu sans augmenter le TDP. Les joueurs trouveront le 3D V-cache utile en poussant des images plus élevées que le Core i9-12900K pour environ 120 dollars de moins. Pour toutes les autres tâches, les horloges plus basses et le manque d'overclocking s'avèrent être des limitations majeures.
Le Ryzen 7 5800X3D souffre quand il s'agit de la performance brute du processeur par rapport à ses frères de la famille Zen 3, et perd définitivement face au Alder Lake Core i5-12600K et Core i9-12900K d'Alder Lake. Le revers de la médaille est que ce déficit de performances ne s'accompagne pas d'une consommation d'énergie plus faible
Bien que le Ryzen 7 5800X3D soit à la traîne en ce qui concerne la composante physique des benchmarks 3D synthétiques, le processeur commence à montrer sa valeur dans les composantes graphiques de ces tests. Le jeu à 1080p ou QHD est le meilleur cas d'utilisation pour ce processeur. Couplé au bon GPU, le Ryzen 7 5800X3D peut pousser les images bien plus loin que ne le permet le Core i9-12900K.
D'où la question suivante. Ce processeur vaut-il la peine d'être mis à niveau ?
Le socket AM4 est désormais une plateforme très stable. Le socket AM5 n'en est encore qu'à ses débuts et les utilisateurs voudront attendre de voir comment les nouveaux CPU Ryzen 7000 se comportent dans les tests réels et de découvrir les meilleures combinaisons possibles de mémoire DDR5 avant de faire le grand saut.
Les joueurs qui utilisent encore des processeurs Zen d'ancienne génération, comme un Ryzen 7 2700Xpar exemple, trouveront que le Ryzen 7 5800X3D est une mise à niveau intéressante et seront ravis d'empocher les 120 dollars d'économie par rapport au Core i9-12900K, en plus d'économiser sur les mises à niveau de la carte mère (en supposant que votre carte actuelle offre toujours une alimentation électrique décente). Cependant, les créateurs de contenu et ceux qui ont besoin d'une meilleure performance globale pourraient vouloir chercher d'autres options telles que le Ryzen 7 5800X pour le même MSRP de 449 $ US.
Le Core i5-12600K est une meilleure affaire encore à seulement 289 USD MSRP, à condition que l'investissement supplémentaire dans l'écosystème d'Intel ne soit pas une contrainte.
Prix et disponibilité
Price comparison

