Test du Dell G5 15 5590 (i7-9750H, RTX 2070 Max-Q, FHD 144 Hz) : jeu en 15 pouces avec carte graphique Max-Q
Note | Date | Modèle | Poids | Épaisseur | Taille | Résolution | Prix |
|---|---|---|---|---|---|---|---|
| 82.6 % v7 (old) | 11/19 | Dell G5 15 5590-P8RVW i7-9750H, GeForce RTX 2070 Max-Q | 2.8 kg | 23.7 mm | 15.60" | 1920x1080 | |
| 84 % v7 (old) | 08/19 | Acer Predator Triton 500 PT515-51-71PZ i7-9750H, GeForce RTX 2070 Max-Q | 2.1 kg | 18 mm | 15.60" | 1920x1080 | |
| 84 % v7 (old) | 06/19 | Gigabyte Aero 15 Classic-XA i7-9750H, GeForce RTX 2070 Max-Q | 2.1 kg | 19 mm | 15.60" | 1920x1080 | |
| 82.3 % v7 (old) | 09/19 | HP Omen X 2S 15-dg0075cl i7-9750H, GeForce RTX 2070 Max-Q | 2.4 kg | 19.8 mm | 15.60" | 1920x1080 | |
| 81.3 % v7 (old) | 06/19 | Asus Zephyrus S GX502GW i7-9750H, GeForce RTX 2070 Mobile | 2.1 kg | 19 mm | 15.60" | 1920x1080 |
| SD Card Reader | |
| average JPG Copy Test (av. of 3 runs) | |
| Gigabyte Aero 15 Classic-XA (Toshiba Exceria Pro SDXC 64 GB UHS-II) | |
| Moyenne de la classe Gaming (20.9 - 210, n=54, 2 dernières années) | |
| Dell G5 15 5590-P8RVW (Toshiba Exceria Pro SDXC 64 GB UHS-II) | |
| maximum AS SSD Seq Read Test (1GB) | |
| Gigabyte Aero 15 Classic-XA (Toshiba Exceria Pro SDXC 64 GB UHS-II) | |
| Moyenne de la classe Gaming (25.5 - 261, n=51, 2 dernières années) | |
| Dell G5 15 5590-P8RVW (Toshiba Exceria Pro SDXC 64 GB UHS-II) | |
| |||||||||||||||||||||||||
Homogénéité de la luminosité: 83 %
Valeur mesurée au centre, sur batterie: 291 cd/m²
Contraste: 1323:1 (Valeurs des noirs: 0.22 cd/m²)
ΔE ColorChecker Calman: 3.95 | ∀{0.5-29.43 Ø4.73}
calibrated: 2.05
ΔE Greyscale Calman: 3.82 | ∀{0.09-98 Ø4.97}
91% sRGB (Argyll 1.6.3 3D)
59% AdobeRGB 1998 (Argyll 1.6.3 3D)
66.7% AdobeRGB 1998 (Argyll 3D)
91.2% sRGB (Argyll 3D)
65.7% Display P3 (Argyll 3D)
Gamma: 2.49
CCT: 7317 K
| Dell G5 15 5590-P8RVW AU Optronics B156HAN (AUO80ED), IPS, 1920x1080 | Acer Predator Triton 500 PT515-51-71PZ NV156FHM-N4K (BOE082A), IPS, 1920x1080 | Gigabyte Aero 15 Classic-XA Sharp LQ156M1JW03 (SHP14C5), IGZO, 1920x1080 | HP Omen X 2S 15-dg0075cl AU Optronics AUO82ED, IPS, 1920x1080 | Asus Zephyrus S GX502GW AU Optronics B156HAN08.2 (AUO82ED), IPS, 1920x1080 | |
|---|---|---|---|---|---|
| Display | -0% | 1% | 1% | -1% | |
| Display P3 Coverage (%) | 65.7 | 64.6 -2% | 65.3 -1% | 66.2 1% | 64.9 -1% |
| sRGB Coverage (%) | 91.2 | 92.6 2% | 95.5 5% | 92.3 1% | 91 0% |
| AdobeRGB 1998 Coverage (%) | 66.7 | 66 -1% | 66.5 0% | 67.2 1% | 65.9 -1% |
| Response Times | 41% | 10% | 12% | 44% | |
| Response Time Grey 50% / Grey 80% * (ms) | 16.4 ? | 5.2 ? 68% | 15.2 ? 7% | 15.2 ? 7% | 7.2 ? 56% |
| Response Time Black / White * (ms) | 12.8 ? | 11.2 ? 13% | 11.2 ? 13% | 10.8 ? 16% | 8.8 ? 31% |
| PWM Frequency (Hz) | 23580 ? | ||||
| Screen | 6% | 3% | -12% | 1% | |
| Brightness middle (cd/m²) | 291 | 288 -1% | 266 -9% | 324.8 12% | 286 -2% |
| Brightness (cd/m²) | 295 | 265 -10% | 248 -16% | 316 7% | 275 -7% |
| Brightness Distribution (%) | 83 | 84 1% | 89 7% | 84 1% | 90 8% |
| Black Level * (cd/m²) | 0.22 | 0.22 -0% | 0.31 -41% | 0.26 -18% | 0.37 -68% |
| Contrast (:1) | 1323 | 1309 -1% | 858 -35% | 1249 -6% | 773 -42% |
| Colorchecker dE 2000 * | 3.95 | 3.22 18% | 2.78 30% | 4.96 -26% | 2.19 45% |
| Colorchecker dE 2000 max. * | 7.46 | 6.26 16% | 5.96 20% | 8.95 -20% | 4.4 41% |
| Colorchecker dE 2000 calibrated * | 2.05 | 1.5 27% | 0.91 56% | 3.23 -58% | 2.27 -11% |
| Greyscale dE 2000 * | 3.82 | 3.43 10% | 3.58 6% | 5 -31% | 2.2 42% |
| Gamma | 2.49 88% | 2.41 91% | 2.46 89% | 2.21 100% | 2.41 91% |
| CCT | 7317 89% | 7290 89% | 7186 90% | 7742 84% | 6405 101% |
| Color Space (Percent of AdobeRGB 1998) (%) | 59 | 60 2% | 62 5% | 59.8 1% | 59 0% |
| Color Space (Percent of sRGB) (%) | 91 | 93 2% | 96 5% | 91.8 1% | 91 0% |
| Moyenne finale (programmes/paramètres) | 16% /
9% | 5% /
3% | 0% /
-7% | 15% /
6% |
* ... Moindre est la valeur, meilleures sont les performances
Temps de réponse de l'écran
| ↔ Temps de réponse noir à blanc | ||
|---|---|---|
| 12.8 ms ... hausse ↗ et chute ↘ combinées | ↗ 7.6 ms hausse | 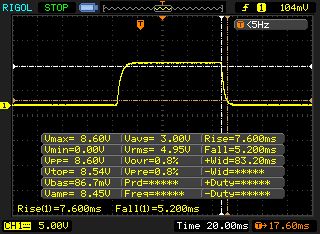 |
| ↘ 5.2 ms chute | ||
| L'écran montre de bons temps de réponse, mais insuffisant pour du jeu compétitif. En comparaison, tous les appareils testés affichent entre 0.1 (minimum) et 240 (maximum) ms. » 33 % des appareils testés affichent de meilleures performances. Cela signifie que les latences relevées sont meilleures que la moyenne (19.9 ms) de tous les appareils testés. | ||
| ↔ Temps de réponse gris 50% à gris 80% | ||
| 16.4 ms ... hausse ↗ et chute ↘ combinées | ↗ 8.4 ms hausse | 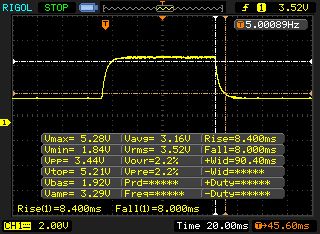 |
| ↘ 8 ms chute | ||
| L'écran montre de bons temps de réponse, mais insuffisant pour du jeu compétitif. En comparaison, tous les appareils testés affichent entre 0.165 (minimum) et 636 (maximum) ms. » 30 % des appareils testés affichent de meilleures performances. Cela signifie que les latences relevées sont meilleures que la moyenne (31.1 ms) de tous les appareils testés. | ||
Scintillement / MLI (Modulation de largeur d'impulsion)
| Scintillement / MLI (Modulation de largeur d'impulsion) non décelé | 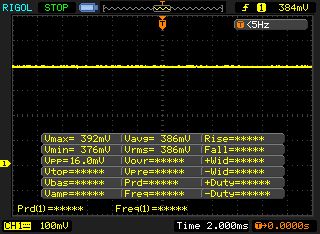 | ||
En comparaison, 52 % des appareils testés n'emploient pas MDI pour assombrir leur écran. Nous avons relevé une moyenne à 7794 (minimum : 5 - maximum : 343500) Hz dans le cas où une MDI était active. | |||
| Dell G5 15 5590-P8RVW SK Hynix BC501 HFM512GDJTNG | Acer Predator Triton 500 PT515-51-71PZ WDC PC SN720 SDAPNTW-512G | Gigabyte Aero 15 Classic-XA Intel SSD 760p SSDPEKKW512G8 | HP Omen X 2S 15-dg0075cl WDC PC SN720 SDAPNTW-1T00 | Asus Zephyrus S GX502GW 2x Intel SSD 660p SSDPEKNW512G8 (RAID 0) | |
|---|---|---|---|---|---|
| CrystalDiskMark 5.2 / 6 | 92% | 76% | 105% | 71% | |
| Write 4K (MB/s) | 64.6 | 108.8 68% | 115.5 79% | 137.4 113% | 97 50% |
| Read 4K (MB/s) | 35.64 | 40.31 13% | 58 63% | 41.37 16% | 49.58 39% |
| Write Seq (MB/s) | 748 | 2488 233% | 1555 108% | 2500 234% | 1838 146% |
| Read Seq (MB/s) | 1039 | 1916 84% | 2590 149% | 1576 52% | 2421 133% |
| Write 4K Q32T1 (MB/s) | 435.7 | 382.4 -12% | 369.3 -15% | 446.7 3% | 326.9 -25% |
| Read 4K Q32T1 (MB/s) | 292.4 | 421.8 44% | 441.7 51% | 522 79% | 372.9 28% |
| Write Seq Q32T1 (MB/s) | 870 | 2542 192% | 1547 78% | 2796 221% | 1894 118% |
| Read Seq Q32T1 (MB/s) | 1557 | 3320 113% | 2969 91% | 3415 119% | 2828 82% |

| 3DMark 11 Performance | 18202 points | |
| 3DMark Cloud Gate Standard Score | 36724 points | |
| 3DMark Fire Strike Score | 15046 points | |
| 3DMark Time Spy Score | 6557 points | |
Aide | ||
| The Witcher 3 - 1920x1080 Ultra Graphics & Postprocessing (HBAO+) | |
| Moyenne de la classe Gaming (95 - 240, n=8, 2 dernières années) | |
| Asus Zephyrus S GX502GW | |
| HP Omen X 2S 15-dg0075cl | |
| Acer Predator Triton 500 PT515-51-71PZ | |
| Gigabyte Aero 15 Classic-XA | |
| Dell G5 15 5590-P8RVW | |
| Bas | Moyen | Élevé | Ultra | |
|---|---|---|---|---|
| The Witcher 3 (2015) | 111 | 61.5 | ||
| Apex Legends (2019) | 106 | 105 | ||
| Far Cry New Dawn (2019) | 86 | 78 | ||
| Anthem (2019) | 71.9 | 67.8 | ||
| Dirt Rally 2.0 (2019) | 112 | 68.8 | ||
| Rage 2 (2019) | 74.8 | 71.5 | ||
| F1 2019 (2019) | 130 | 97 | ||
| Control (2019) | 57.4 | |||
| Borderlands 3 (2019) | 65.3 | 51.1 | ||
| FIFA 20 (2019) | 180 | 179 | ||
| Ghost Recon Breakpoint (2019) | 70 | 52 | ||
| GRID 2019 (2019) | 92.6 | 67 |
Degré de la nuisance sonore
| Au repos |
| 32 / 33 / 34 dB(A) |
| Disque dur |
| 32 dB(A) |
| Fortement sollicité |
| 50 / 52 dB(A) |
 | ||
30 dB silencieux 40 dB(A) audible 50 dB(A) bruyant |
||
min: | ||
| Dell G5 15 5590-P8RVW i7-9750H, GeForce RTX 2070 Max-Q | Acer Predator Triton 500 PT515-51-71PZ i7-9750H, GeForce RTX 2070 Max-Q | Gigabyte Aero 15 Classic-XA i7-9750H, GeForce RTX 2070 Max-Q | HP Omen X 2S 15-dg0075cl i7-9750H, GeForce RTX 2070 Max-Q | Asus Zephyrus S GX502GW i7-9750H, GeForce RTX 2070 Mobile | Moyenne de la classe Gaming | |
|---|---|---|---|---|---|---|
| Noise | 1% | -3% | 5% | -3% | 13% | |
| arrêt / environnement * (dB) | 30 | 30 -0% | 30 -0% | 29 3% | 30 -0% | 24.1 ? 20% |
| Idle Minimum * (dB) | 32 | 30 6% | 31 3% | 30.5 5% | 31 3% | 25.8 ? 19% |
| Idle Average * (dB) | 33 | 33 -0% | 34 -3% | 31.5 5% | 33 -0% | 27.4 ? 17% |
| Idle Maximum * (dB) | 34 | 39 -15% | 39 -15% | 31.5 7% | 38 -12% | 30 ? 12% |
| Load Average * (dB) | 50 | 45 10% | 46 8% | 40.6 19% | 50 -0% | 43 ? 14% |
| Witcher 3 ultra * (dB) | 50 | 49 2% | 53 -6% | 49.5 1% | 53 -6% | |
| Load Maximum * (dB) | 52 | 51 2% | 55 -6% | 53.4 -3% | 56 -8% | 54 ? -4% |
* ... Moindre est la valeur, meilleures sont les performances
(-) La température maximale du côté supérieur est de 54 °C / 129 F, par rapport à la moyenne de 40.4 °C / 105 F, allant de 21.2 à 68.8 °C pour la classe Gaming.
(-) Le fond chauffe jusqu'à un maximum de 61 °C / 142 F, contre une moyenne de 43.2 °C / 110 F
(+) En utilisation inactive, la température moyenne du côté supérieur est de 24.7 °C / 76 F, par rapport à la moyenne du dispositif de 33.9 °C / 93 F.
(-) En jouant à The Witcher 3, la température moyenne du côté supérieur est de 40.7 °C / 105 F, alors que la moyenne de l'appareil est de 33.9 °C / 93 F.
(+) Les repose-poignets et le pavé tactile atteignent la température maximale de la peau (33 °C / 91.4 F) et ne sont donc pas chauds.
(-) La température moyenne de la zone de l'appui-paume de dispositifs similaires était de 28.8 °C / 83.8 F (-4.2 °C / #-7.6 F).
| Dell G5 15 5590-P8RVW i7-9750H, GeForce RTX 2070 Max-Q | Acer Predator Triton 500 PT515-51-71PZ i7-9750H, GeForce RTX 2070 Max-Q | Gigabyte Aero 15 Classic-XA i7-9750H, GeForce RTX 2070 Max-Q | HP Omen X 2S 15-dg0075cl i7-9750H, GeForce RTX 2070 Max-Q | Asus Zephyrus S GX502GW i7-9750H, GeForce RTX 2070 Mobile | Moyenne de la classe Gaming | |
|---|---|---|---|---|---|---|
| Heat | -3% | -13% | -30% | -10% | -5% | |
| Maximum Upper Side * (°C) | 54 | 49 9% | 58 -7% | 48.8 10% | 54 -0% | 45.2 ? 16% |
| Maximum Bottom * (°C) | 61 | 59 3% | 64 -5% | 55 10% | 47 23% | 48 ? 21% |
| Idle Upper Side * (°C) | 25 | 28 -12% | 30 -20% | 41 -64% | 33 -32% | 31.1 ? -24% |
| Idle Bottom * (°C) | 26 | 29 -12% | 31 -19% | 45.6 -75% | 34 -31% | 34.2 ? -32% |
* ... Moindre est la valeur, meilleures sont les performances
Dell G5 15 5590-P8RVW analyse audio
(+) | les haut-parleurs peuvent jouer relativement fort (89# dB)
Basses 100 - 315 Hz
(-) | presque aucune basse - en moyenne 19.4% plus bas que la médiane
(±) | la linéarité des basses est moyenne (10.5% delta à la fréquence précédente)
Médiums 400 - 2000 Hz
(+) | médiane équilibrée - seulement 3.5% de la médiane
(+) | les médiums sont linéaires (4.9% delta à la fréquence précédente)
Aiguës 2 - 16 kHz
(±) | sommets réduits - en moyenne 5.5% plus bas que la médiane
(±) | la linéarité des aigus est moyenne (8.6% delta à la fréquence précédente)
Globalement 100 - 16 000 Hz
(±) | la linéarité du son global est moyenne (15.6% de différence avec la médiane)
Par rapport à la même classe
» 36% de tous les appareils testés de cette catégorie étaient meilleurs, 6% similaires, 58% pires
» Le meilleur avait un delta de 6%, la moyenne était de 18%, le pire était de 132%.
Par rapport à tous les appareils testés
» 23% de tous les appareils testés étaient meilleurs, 5% similaires, 72% pires
» Le meilleur avait un delta de 4%, la moyenne était de 24%, le pire était de 134%.
Asus Zephyrus S GX502GW analyse audio
(+) | les haut-parleurs peuvent jouer relativement fort (90# dB)
Basses 100 - 315 Hz
(±) | basse réduite - en moyenne 12.7% inférieure à la médiane
(±) | la linéarité des basses est moyenne (8.5% delta à la fréquence précédente)
Médiums 400 - 2000 Hz
(+) | médiane équilibrée - seulement 4.5% de la médiane
(+) | les médiums sont linéaires (4.1% delta à la fréquence précédente)
Aiguës 2 - 16 kHz
(±) | sommets plus élevés - en moyenne 6.7% plus élevés que la médiane
(±) | la linéarité des aigus est moyenne (10.8% delta à la fréquence précédente)
Globalement 100 - 16 000 Hz
(+) | le son global est linéaire (14.6% différence à la médiane)
Par rapport à la même classe
» 28% de tous les appareils testés de cette catégorie étaient meilleurs, 7% similaires, 65% pires
» Le meilleur avait un delta de 6%, la moyenne était de 18%, le pire était de 132%.
Par rapport à tous les appareils testés
» 19% de tous les appareils testés étaient meilleurs, 4% similaires, 77% pires
» Le meilleur avait un delta de 4%, la moyenne était de 24%, le pire était de 134%.
| Éteint/en veille | |
| Au repos | |
| Fortement sollicité |
|
Légende:
min: | |
| Dell G5 15 5590-P8RVW i7-9750H, GeForce RTX 2070 Max-Q | Acer Predator Triton 500 PT515-51-71PZ i7-9750H, GeForce RTX 2070 Max-Q | Gigabyte Aero 15 Classic-XA i7-9750H, GeForce RTX 2070 Max-Q | HP Omen X 2S 15-dg0075cl i7-9750H, GeForce RTX 2070 Max-Q | Asus Zephyrus S GX502GW i7-9750H, GeForce RTX 2070 Mobile | Moyenne de la classe Gaming | |
|---|---|---|---|---|---|---|
| Power Consumption | -1% | -74% | -230% | -98% | -48% | |
| Idle Minimum * (Watt) | 5 | 7 -40% | 21 -320% | 46 -820% | 24 -380% | 13.2 ? -164% |
| Idle Average * (Watt) | 13 | 12 8% | 23 -77% | 59 -354% | 27 -108% | 18.9 ? -45% |
| Idle Maximum * (Watt) | 23 | 22 4% | 32 -39% | 65.5 -185% | 33 -43% | 24.3 ? -6% |
| Load Average * (Watt) | 121 | 86 29% | 97 20% | 99.8 18% | 129 -7% | 108 ? 11% |
| Witcher 3 ultra * (Watt) | 133 | 144 -8% | 148 -11% | 154.1 -16% | 176 -32% | |
| Load Maximum * (Watt) | 184 | 177 4% | 213 -16% | 222.7 -21% | 216 -17% | 254 ? -38% |
* ... Moindre est la valeur, meilleures sont les performances
| Dell G5 15 5590-P8RVW i7-9750H, GeForce RTX 2070 Max-Q, 90 Wh | Acer Predator Triton 500 PT515-51-71PZ i7-9750H, GeForce RTX 2070 Max-Q, Wh | Gigabyte Aero 15 Classic-XA i7-9750H, GeForce RTX 2070 Max-Q, 94.24 Wh | HP Omen X 2S 15-dg0075cl i7-9750H, GeForce RTX 2070 Max-Q, 72 Wh | Asus Zephyrus S GX502GW i7-9750H, GeForce RTX 2070 Mobile, 76 Wh | Moyenne de la classe Gaming | |
|---|---|---|---|---|---|---|
| Autonomie de la batterie | 23% | 39% | -46% | -34% | 5% | |
| Reader / Idle (h) | 8.6 | 11.1 29% | 9.1 6% | 3.7 -57% | 5.9 -31% | 8.71 ? 1% |
| WiFi v1.3 (h) | 5.7 | 8 40% | 7 23% | 2.2 -61% | 3.7 -35% | 7.02 ? 23% |
| Load (h) | 1.6 | 1.6 0% | 3 88% | 1.3 -19% | 1 -37% | 1.47 ? -8% |
| H.264 (h) | 6.8 | 8.26 ? |
Points positifs
Points négatifs
À l’exception de l’autonomie, le Dell G5 15 5590-P8RVW à 2 000 € est bien meilleur que le G5 15 5590-PCNJJ à 1 000 €.
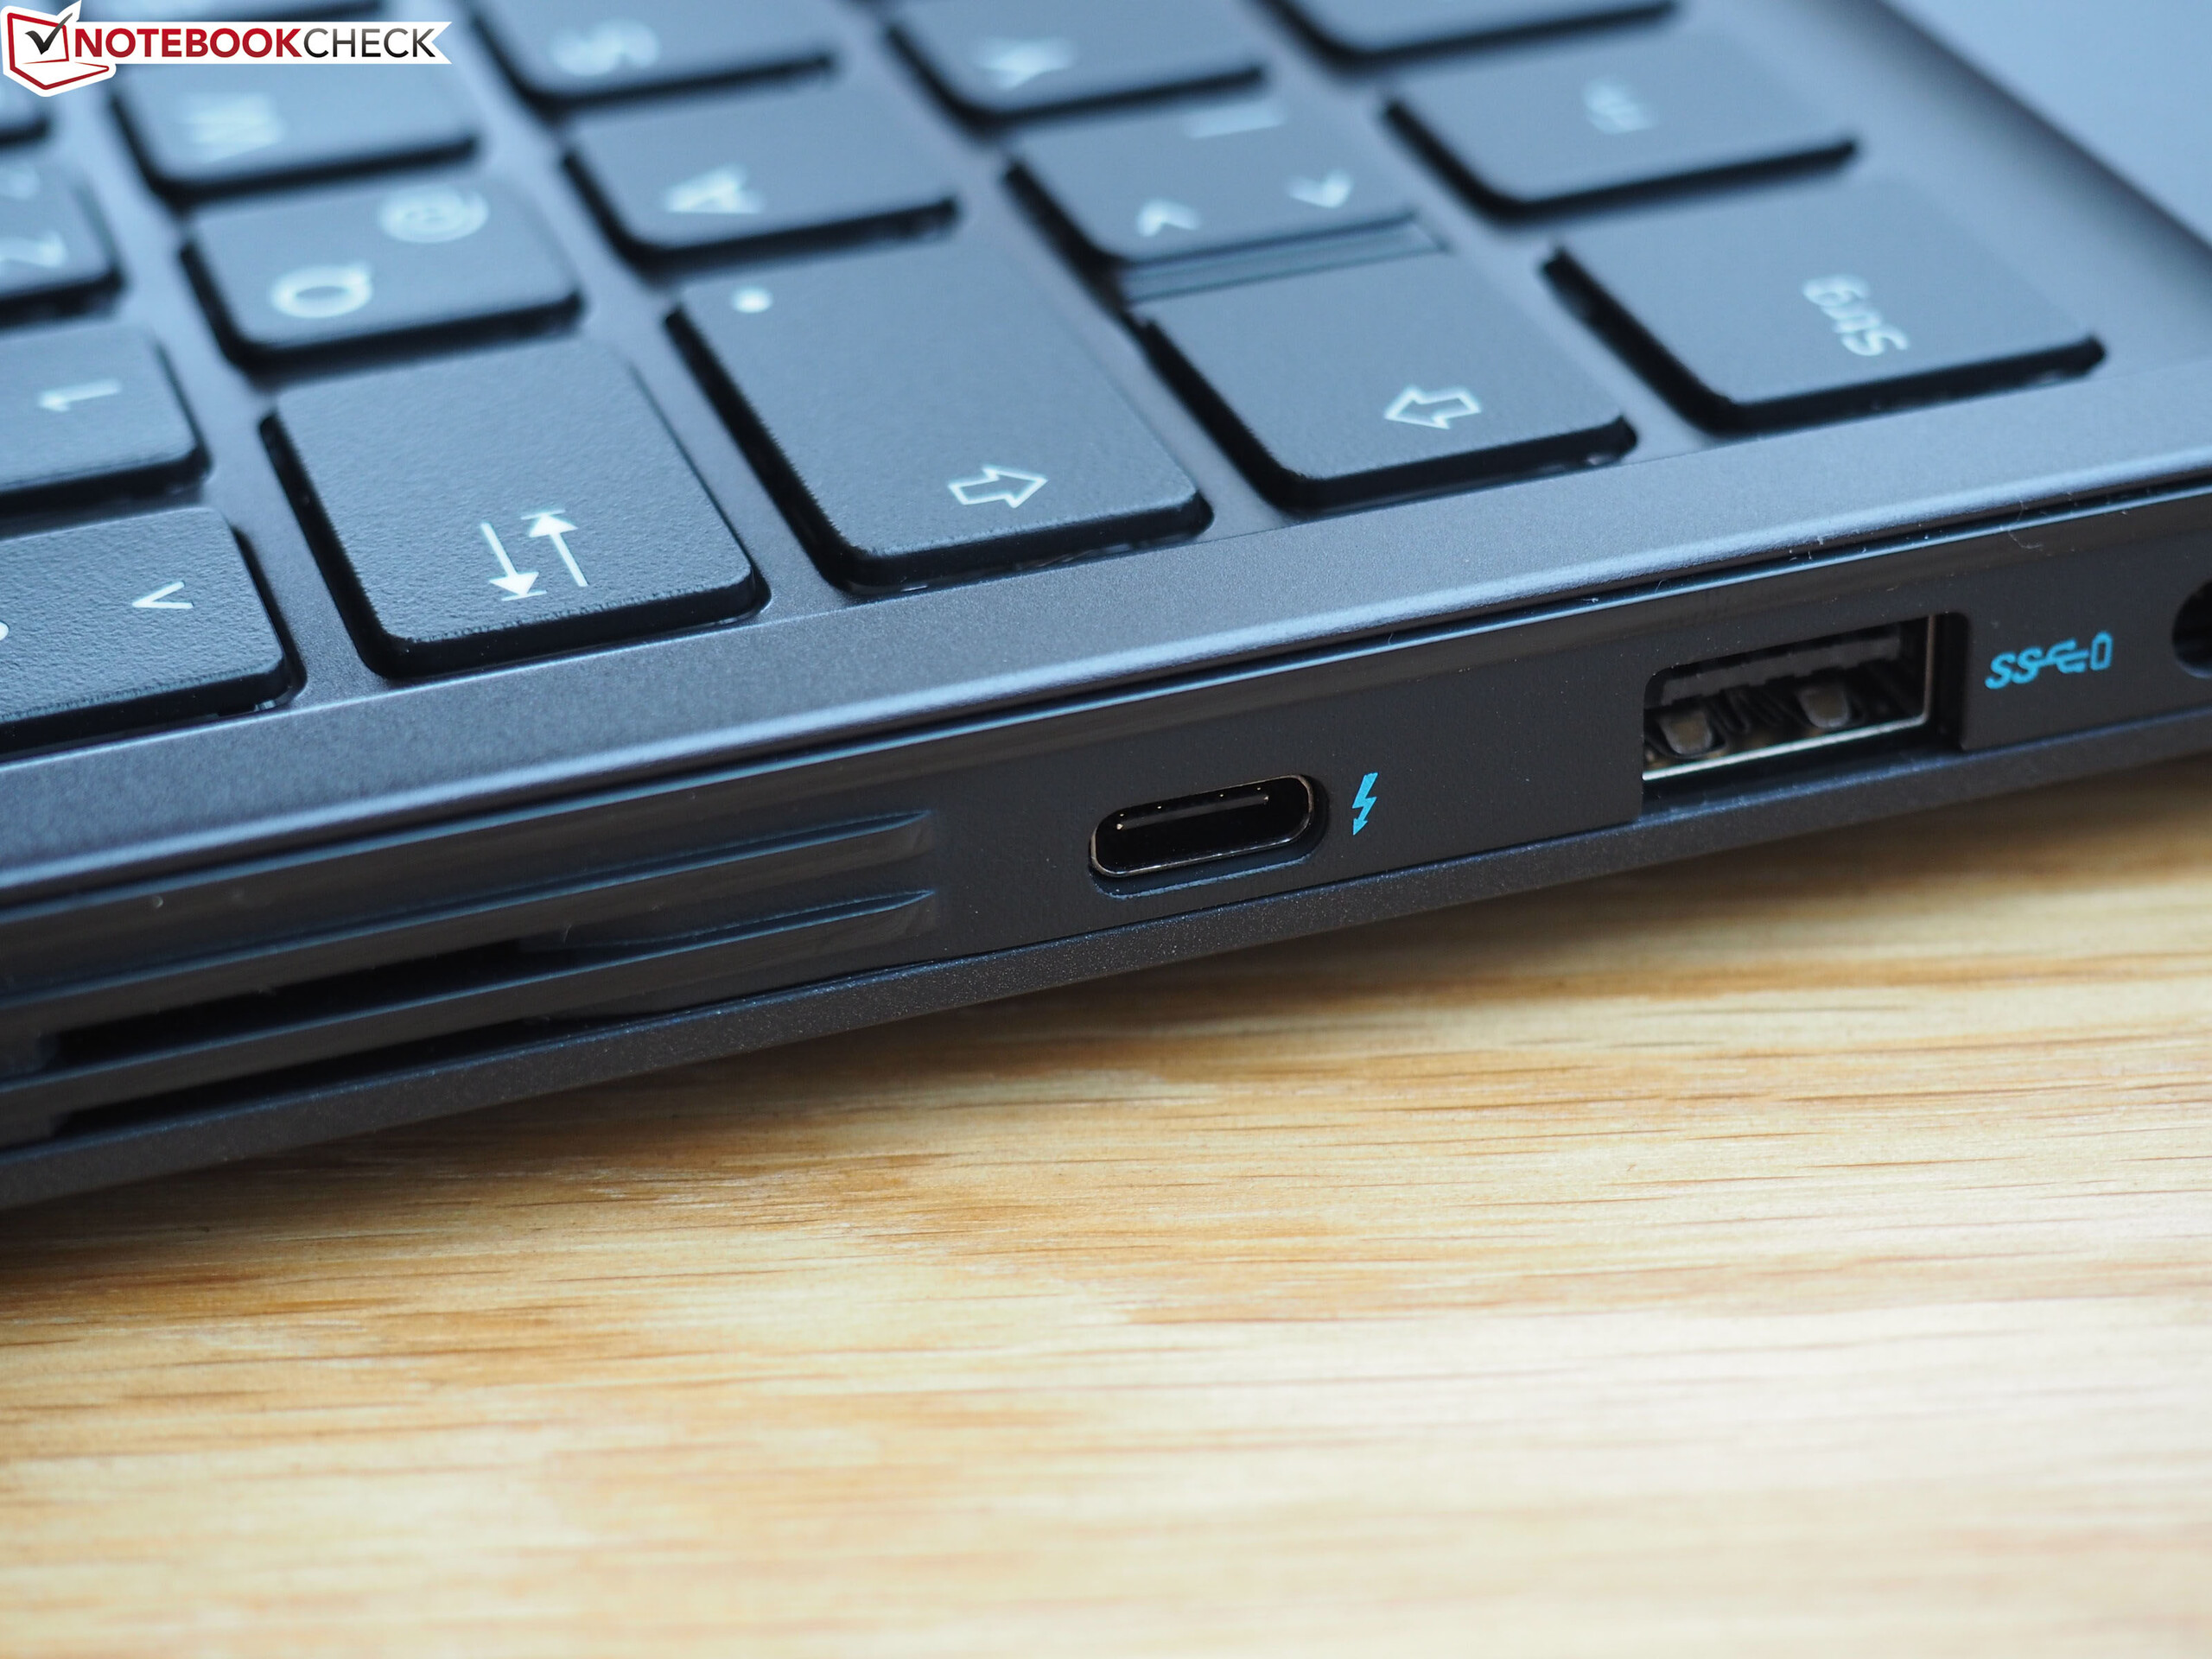
En plus de meilleures performances (processeur, carte graphique, SSD, etc.) et d’un port Thunderbolt 3 en plus, le 5590-P8RVW possède un écran bien plus réactif. À la différence des versions d’entrée de gamme, l’écran 144 Hz haut de gamme possède une luminosité correcte, des couleurs fidèles, et des temps de réponse plus réduits.
Cependant, le modèle à 2 000 € possède les mêmes défauts que la version à petit prix, tels un lecteur de carte lent ou un throttling du processeur avec les logiciels 3D - ce qui empêche au portable de 15 pouces d’avoir une meilleure note.
L’intégralité de cette critique est disponible en anglais en suivant ce lien.
Dell G5 15 5590-P8RVW
- 05/14/2020 v7 (old)
Florian Glaser
Price comparison