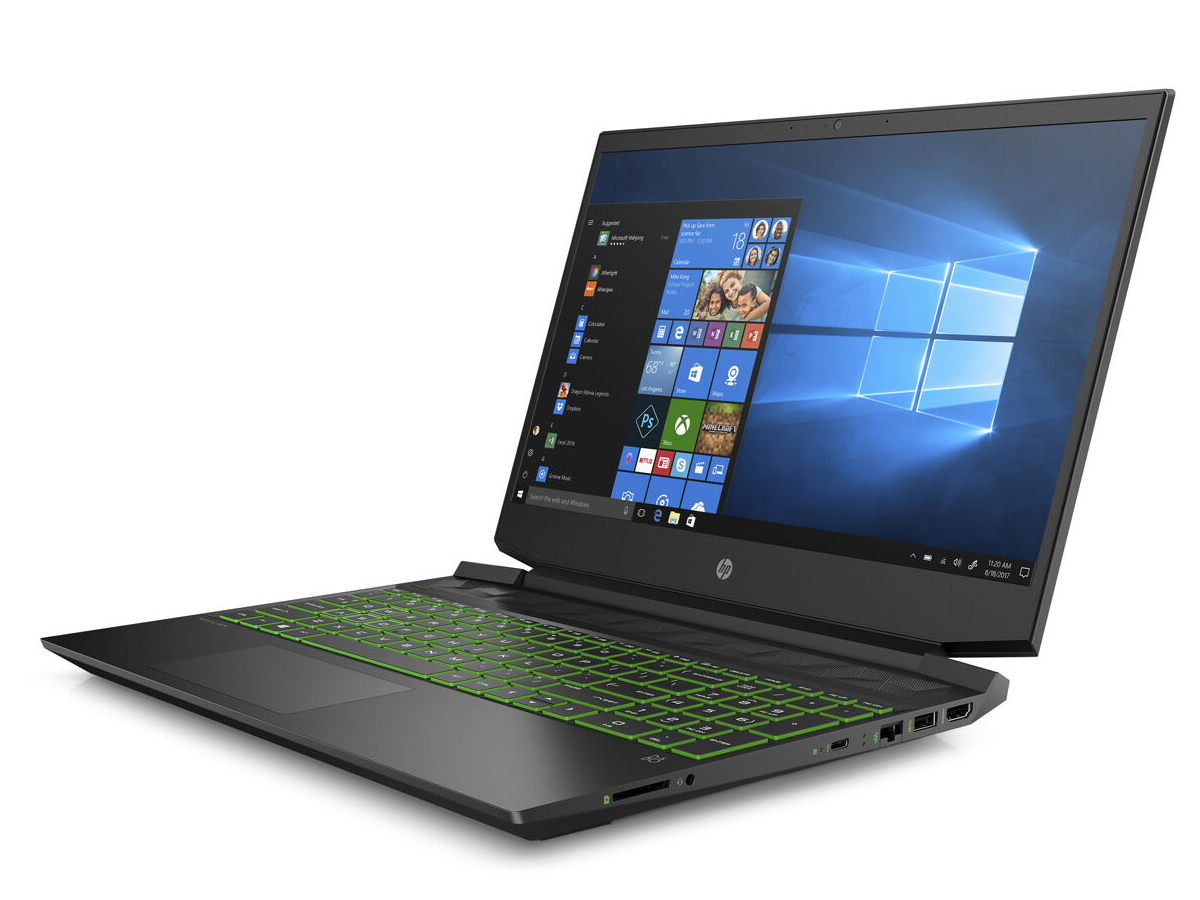
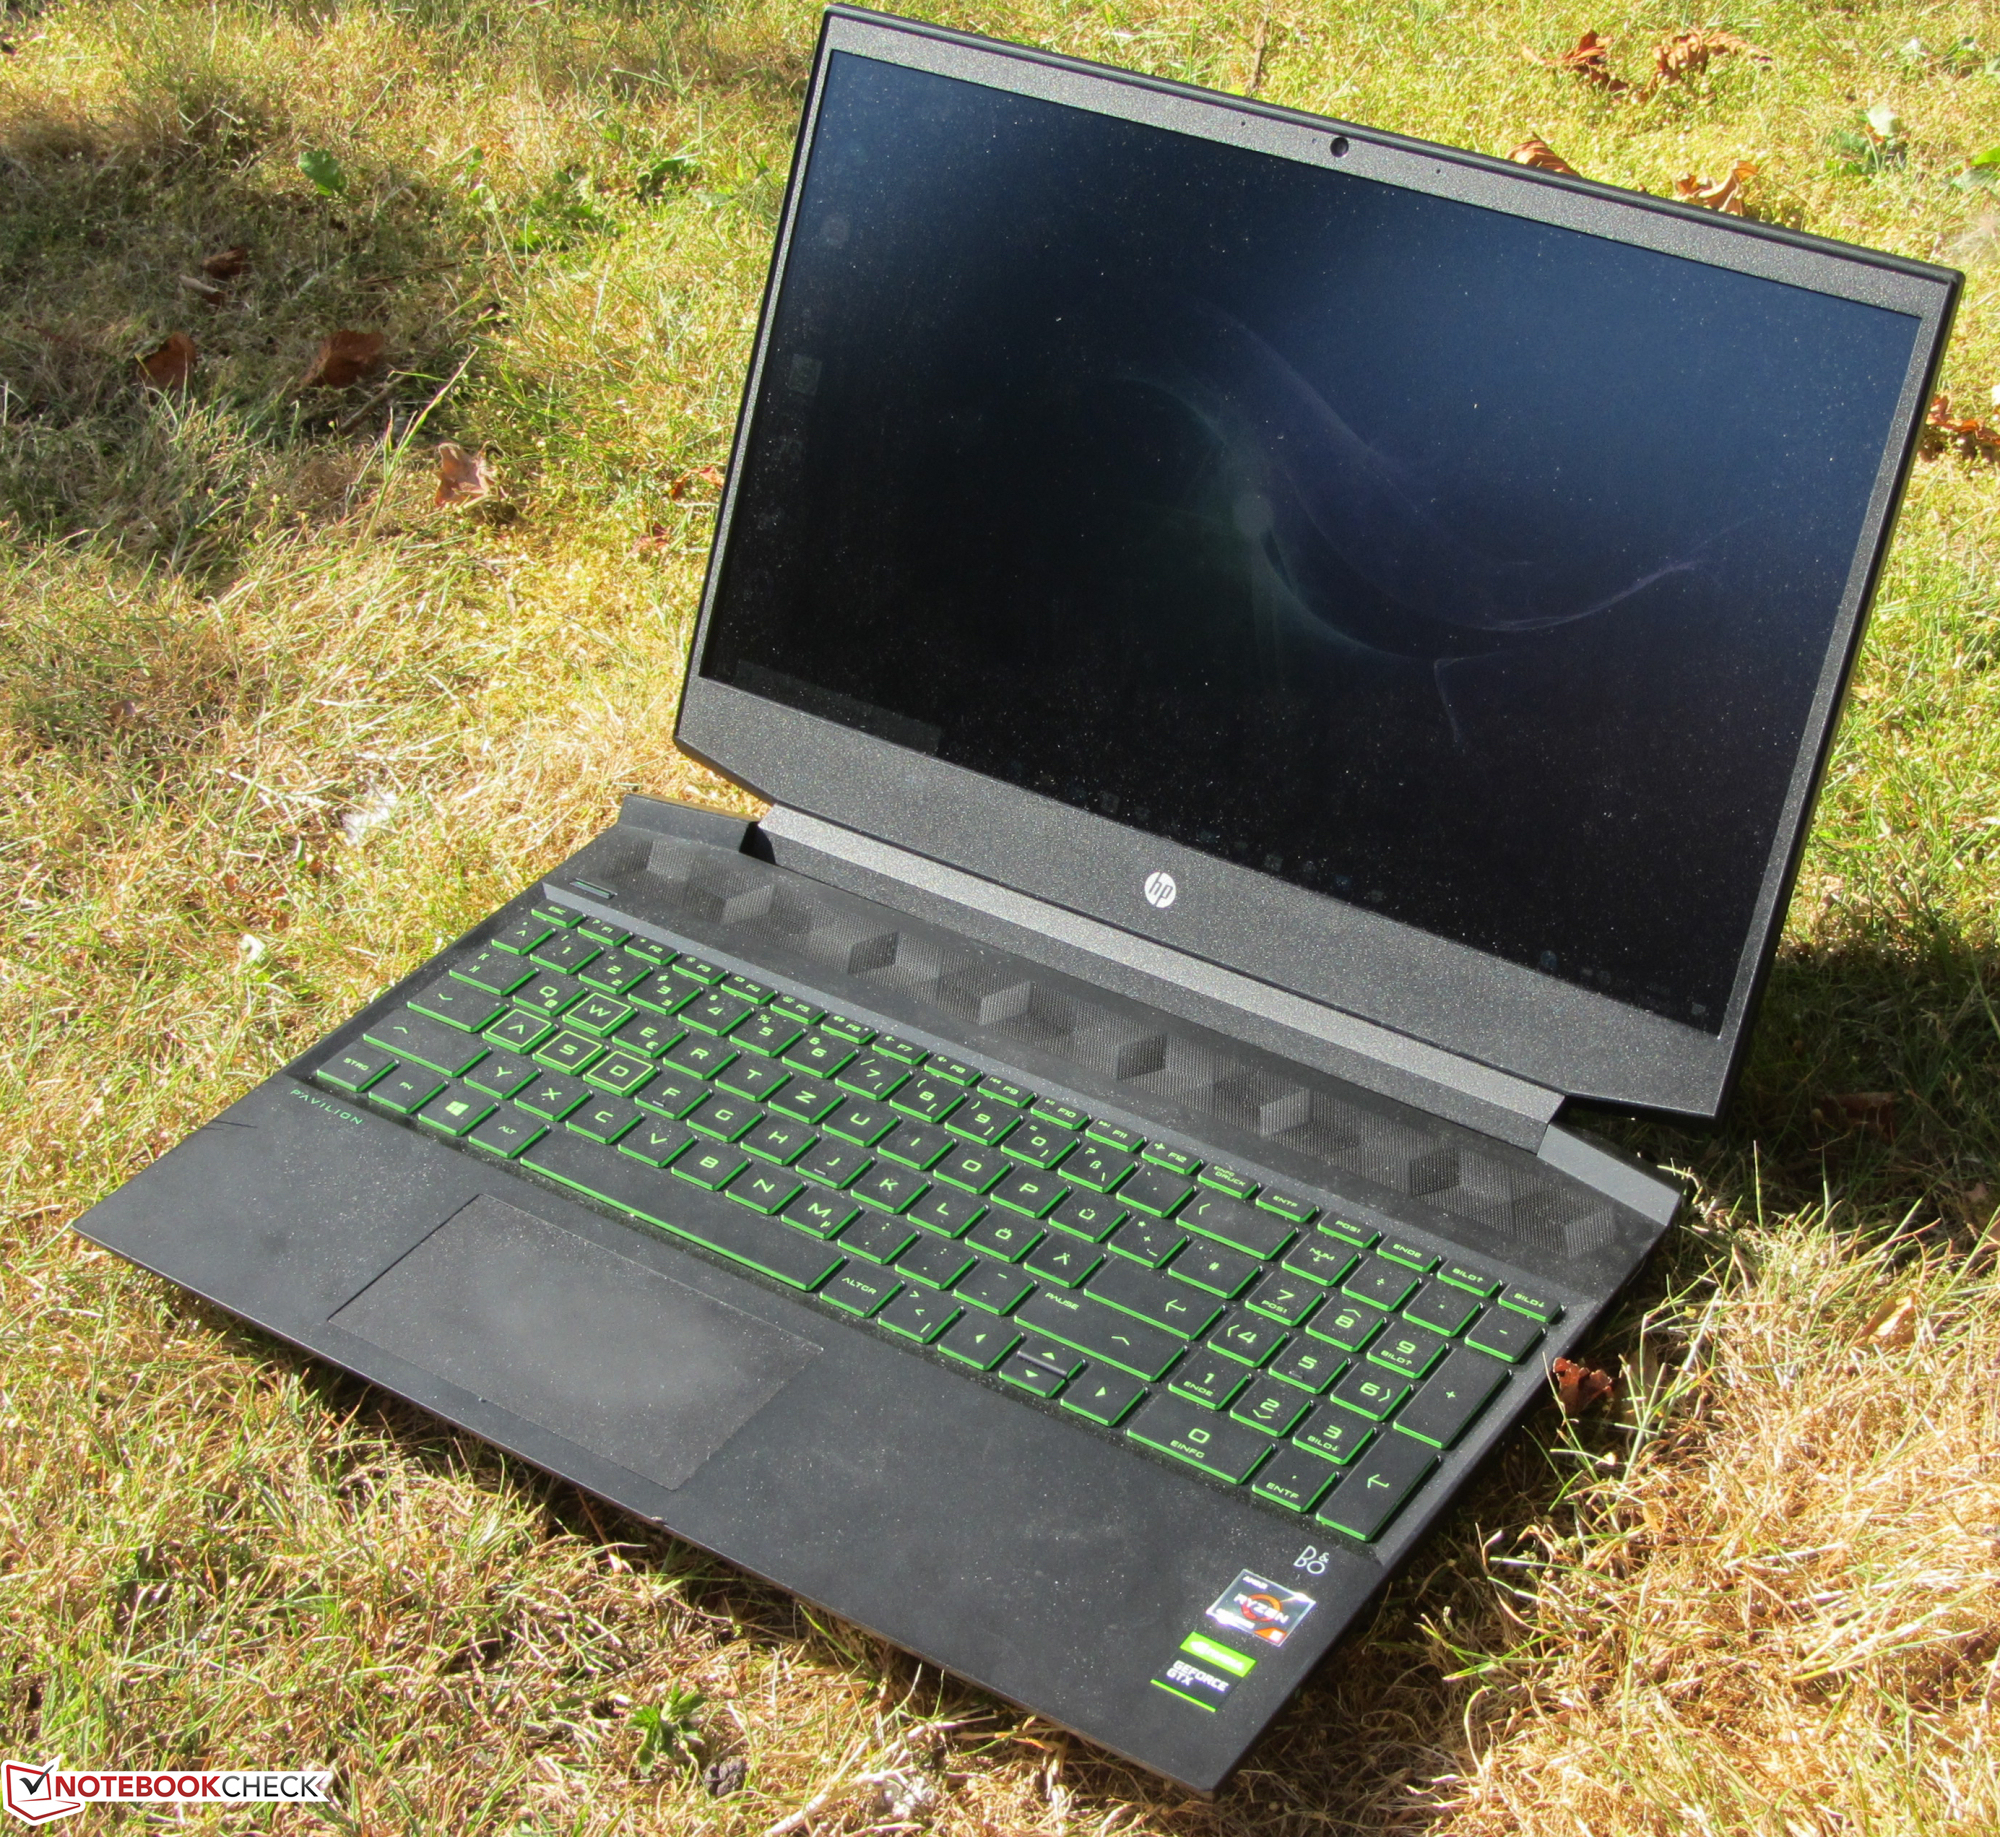
Test du HP Pavilion Gaming 15 (Ryzen 5 4600H, GTX 1650, FHD) : PC portable de jeu à petit prix avec une bonne autonomie
Note | Date | Modèle | Poids | Épaisseur | Taille | Résolution | Prix |
|---|---|---|---|---|---|---|---|
| 81.2 % v7 (old) | 09/20 | HP Pavilion Gaming 15-ec1206ng R5 4600H, GeForce GTX 1650 Mobile | 2.1 kg | 23.5 mm | 15.60" | 1920x1080 | |
| 81.2 % v7 (old) | Nexoc GH5 515IG i5-10300H, GeForce GTX 1650 Mobile | 2.1 kg | 24.9 mm | 15.60" | 1920x1080 | ||
| 78.4 % v7 (old) | 08/20 | Lenovo IdeaPad Gaming 3i 15IMH05 i5-10300H, GeForce GTX 1650 Mobile | 2.2 kg | 24.9 mm | 15.60" | 1920x1080 | |
| 80.4 % v6 (old) | 08/19 | Asus TUF FX505DT-EB73 R7 3750H, GeForce GTX 1650 Mobile | 2.2 kg | 26.8 mm | 15.60" | 1920x1080 | |
| 79.6 % v7 (old) | 10/19 | Dell G5 15 5590-PCNJJ i5-9300H, GeForce GTX 1650 Mobile | 2.7 kg | 23.7 mm | 15.60" | 1920x1080 | |
| 79.8 % v7 (old) | 08/20 | Acer Nitro 5 AN515-44-R5FT R5 4600H, GeForce GTX 1650 Ti Mobile | 2.2 kg | 24 mm | 15.60" | 1920x1080 | |
| 79.5 % v7 (old) | 08/20 | MSI Bravo 15 A4DCR R7 4800H, Radeon RX 5300M | 2 kg | 22 mm | 15.60" | 1920x1080 |
| SD Card Reader | |
| average JPG Copy Test (av. of 3 runs) | |
| Moyenne de la classe Gaming (20.9 - 210, n=54, 2 dernières années) | |
| Nexoc GH5 515IG (Toshiba Exceria Pro SDXC 64 GB UHS-II) | |
| HP Pavilion Gaming 15-ec1206ng (Toshiba Exceria Pro SDXC 64 GB UHS-II) | |
| HP Pavilion Gaming 15-ec0002ng (Toshiba Exceria Pro SDXC 64 GB UHS-II) | |
| Dell G5 15 5590-PCNJJ (Toshiba Exceria Pro SDXC 64 GB UHS-II) | |
| maximum AS SSD Seq Read Test (1GB) | |
| Moyenne de la classe Gaming (25.5 - 261, n=51, 2 dernières années) | |
| Nexoc GH5 515IG (Toshiba Exceria Pro SDXC 64 GB UHS-II) | |
| HP Pavilion Gaming 15-ec0002ng (Toshiba Exceria Pro SDXC 64 GB UHS-II) | |
| HP Pavilion Gaming 15-ec1206ng (Toshiba Exceria Pro SDXC 64 GB UHS-II) | |
| Dell G5 15 5590-PCNJJ (Toshiba Exceria Pro SDXC 64 GB UHS-II) | |


| |||||||||||||||||||||||||
Homogénéité de la luminosité: 83 %
Valeur mesurée au centre, sur batterie: 277 cd/m²
Contraste: 1731:1 (Valeurs des noirs: 0.16 cd/m²)
ΔE ColorChecker Calman: 3.6 | ∀{0.5-29.43 Ø4.72}
calibrated: 2.88
ΔE Greyscale Calman: 1.75 | ∀{0.09-98 Ø4.97}
62% sRGB (Argyll 1.6.3 3D)
39% AdobeRGB 1998 (Argyll 1.6.3 3D)
42.76% AdobeRGB 1998 (Argyll 3D)
62% sRGB (Argyll 3D)
41.36% Display P3 (Argyll 3D)
Gamma: 2.23
CCT: 6695 K
| HP Pavilion Gaming 15-ec1206ng Chi Mei CMN150D, IPS, 1920x1080, 15.6" | HP Pavilion Gaming 15-ec0002ng Chi Mei N156HGA-EA3, TN LED, 1920x1080, 15.6" | Nexoc GH5 515IG LG Philips LP156WFC-SPD1, IPS, 1920x1080, 15.6" | Lenovo IdeaPad Gaming 3i 15IMH05 BOE CQ NV156FHM-NX1, IPS, 1920x1080, 15.6" | Asus TUF FX505DT-EB73 Panda LM156LF-GL, IPS, 1920x1080, 15.6" | Dell G5 15 5590-PCNJJ AU Optronics B156HAN (AUO23ED), IPS, 1920x1080, 15.6" | Acer Nitro 5 AN515-44-R5FT Panda LM156LF-2F01 (NCP004D), IPS, 1920x1080, 15.6" | MSI Bravo 15 A4DCR AU Optronics B156HAN08.0 (AUO80ED), IPS-Level, 1920x1080, 15.6" | |
|---|---|---|---|---|---|---|---|---|
| Display | 0% | -8% | -8% | -4% | 96% | 0% | 46% | |
| Display P3 Coverage (%) | 41.36 | 41.22 0% | 37.91 -8% | 38.04 -8% | 39.56 -4% | 83.1 101% | 41.16 0% | 62 50% |
| sRGB Coverage (%) | 62 | 61.8 0% | 57 -8% | 56.6 -9% | 59.5 -4% | 99.9 61% | 61.8 0% | 86.8 40% |
| AdobeRGB 1998 Coverage (%) | 42.76 | 42.62 0% | 39.19 -8% | 39.3 -8% | 40.91 -4% | 96.8 126% | 42.56 0% | 62.7 47% |
| Response Times | 1% | -9% | 25% | -7% | -39% | -28% | 53% | |
| Response Time Grey 50% / Grey 80% * (ms) | 33.6 ? | 44 ? -31% | 34.8 ? -4% | 25 ? 26% | 30.4 ? 10% | 48 ? -43% | 40.8 ? -21% | 16 ? 52% |
| Response Time Black / White * (ms) | 22.4 ? | 15 ? 33% | 25.2 ? -13% | 17 ? 24% | 27.6 ? -23% | 30 ? -34% | 30 ? -34% | 10.4 ? 54% |
| PWM Frequency (Hz) | 24750 ? | 250 ? | ||||||
| Screen | -98% | -18% | -55% | -52% | -41% | -26% | -16% | |
| Brightness middle (cd/m²) | 277 | 233 -16% | 261 -6% | 305 10% | 286.2 3% | 234 -16% | 287 4% | 311 12% |
| Brightness (cd/m²) | 248 | 211 -15% | 254 2% | 294 19% | 267 8% | 216 -13% | 271 9% | 313 26% |
| Brightness Distribution (%) | 83 | 82 -1% | 93 12% | 70 -16% | 84 1% | 87 5% | 88 6% | 88 6% |
| Black Level * (cd/m²) | 0.16 | 0.405 -153% | 0.23 -44% | 0.405 -153% | 0.33 -106% | 0.22 -38% | 0.25 -56% | 0.43 -169% |
| Contrast (:1) | 1731 | 575 -67% | 1135 -34% | 753 -56% | 867 -50% | 1064 -39% | 1148 -34% | 723 -58% |
| Colorchecker dE 2000 * | 3.6 | 8.22 -128% | 4.71 -31% | 6.01 -67% | 5.45 -51% | 6.52 -81% | 4.77 -33% | 4.5 -25% |
| Colorchecker dE 2000 max. * | 8.53 | 18.6 -118% | 7.6 11% | 21.9 -157% | 18.08 -112% | 10.58 -24% | 17.15 -101% | 7.97 7% |
| Colorchecker dE 2000 calibrated * | 2.88 | 3.67 -27% | 5.12 -78% | 4.47 -55% | 3.56 -24% | 3.73 -30% | 2.65 8% | |
| Greyscale dE 2000 * | 1.75 | 10.13 -479% | 2.76 -58% | 3.23 -85% | 5.3 -203% | 5.33 -205% | 2.7 -54% | 3.3 -89% |
| Gamma | 2.23 99% | 2.27 97% | 2.42 91% | 2.43 91% | 2.1 105% | 2.86 77% | 2.115 104% | 2.129 103% |
| CCT | 6695 97% | 11323 57% | 7090 92% | 6818 95% | 7679 85% | 5983 109% | 7187 90% | 7227 90% |
| Color Space (Percent of AdobeRGB 1998) (%) | 39 | 39 0% | 36 -8% | 36 -8% | 37.6 -4% | 36 -8% | 43 10% | 63 62% |
| Color Space (Percent of sRGB) (%) | 62 | 62 0% | 56 -10% | 56 -10% | 59.1 -5% | 57 -8% | 61 -2% | 86 39% |
| Moyenne finale (programmes/paramètres) | -32% /
-65% | -12% /
-15% | -13% /
-36% | -21% /
-37% | 5% /
-15% | -18% /
-21% | 28% /
4% |
* ... Moindre est la valeur, meilleures sont les performances
Temps de réponse de l'écran
| ↔ Temps de réponse noir à blanc | ||
|---|---|---|
| 22.4 ms ... hausse ↗ et chute ↘ combinées | ↗ 12.8 ms hausse | 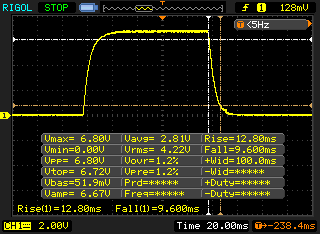 |
| ↘ 9.6 ms chute | ||
| L'écran montre de bons temps de réponse, mais insuffisant pour du jeu compétitif. En comparaison, tous les appareils testés affichent entre 0.1 (minimum) et 240 (maximum) ms. » 51 % des appareils testés affichent de meilleures performances. Cela signifie que les latences relevées sont moins bonnes que la moyenne (19.8 ms) de tous les appareils testés. | ||
| ↔ Temps de réponse gris 50% à gris 80% | ||
| 33.6 ms ... hausse ↗ et chute ↘ combinées | ↗ 17.2 ms hausse | 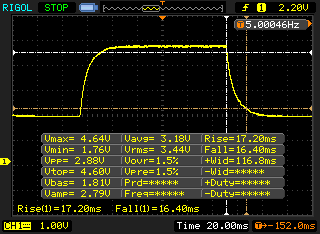 |
| ↘ 16.4 ms chute | ||
| L'écran souffre de latences très élevées, à éviter pour le jeu. En comparaison, tous les appareils testés affichent entre 0.165 (minimum) et 636 (maximum) ms. » 46 % des appareils testés affichent de meilleures performances. Cela signifie que les latences relevées sont similaires à la moyenne (31 ms) de tous les appareils testés. | ||
Scintillement / MLI (Modulation de largeur d'impulsion)
| Scintillement / MLI (Modulation de largeur d'impulsion) décelé | 24750 Hz | ≤ 42 Niveau de luminosité | 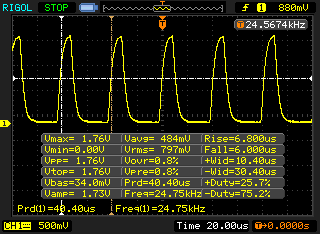 |
Le rétroéclairage de l'écran scintille à la fréquence de 24750 Hz (certainement du fait de l'utilisation d'une MDI - Modulation de largeur d'impulsion) à un niveau de luminosité inférieur ou égal à 42 % . Aucun scintillement ne devrait être perceptible au-dessus de cette valeur. La fréquence de rafraîchissement de 24750 Hz est élevée, la grande majorité des utilisateurs ne devrait pas percevoir de scintillements et être sujette à une fatigue oculaire accrue. En comparaison, 52 % des appareils testés n'emploient pas MDI pour assombrir leur écran. Nous avons relevé une moyenne à 7769 (minimum : 5 - maximum : 343500) Hz dans le cas où une MDI était active. | |||
| Blender - v2.79 BMW27 CPU | |
| Nexoc GH5 515IG | |
| Lenovo IdeaPad Gaming 3i 15IMH05 | |
| Acer Nitro 5 AN515-44-R5FT | |
| HP Pavilion Gaming 15-ec1206ng | |
| MSI Bravo 15 A4DCR | |
| 7-Zip 18.03 | |
| 7z b 4 -mmt1 | |
| Nexoc GH5 515IG | |
| Lenovo IdeaPad Gaming 3i 15IMH05 | |
| MSI Bravo 15 A4DCR | |
| Acer Nitro 5 AN515-44-R5FT | |
| HP Pavilion Gaming 15-ec1206ng | |
| 7z b 4 | |
| MSI Bravo 15 A4DCR | |
| HP Pavilion Gaming 15-ec1206ng | |
| Acer Nitro 5 AN515-44-R5FT | |
| Lenovo IdeaPad Gaming 3i 15IMH05 | |
| Nexoc GH5 515IG | |
| HWBOT x265 Benchmark v2.2 - 4k Preset | |
| MSI Bravo 15 A4DCR | |
| HP Pavilion Gaming 15-ec1206ng | |
| Acer Nitro 5 AN515-44-R5FT | |
| Lenovo IdeaPad Gaming 3i 15IMH05 | |
| Nexoc GH5 515IG | |
| LibreOffice - 20 Documents To PDF | |
| MSI Bravo 15 A4DCR | |
| HP Pavilion Gaming 15-ec1206ng | |
| Acer Nitro 5 AN515-44-R5FT | |
| Nexoc GH5 515IG | |
| Lenovo IdeaPad Gaming 3i 15IMH05 | |
| R Benchmark 2.5 - Overall mean | |
| Lenovo IdeaPad Gaming 3i 15IMH05 | |
| Acer Nitro 5 AN515-44-R5FT | |
| Nexoc GH5 515IG | |
| HP Pavilion Gaming 15-ec1206ng | |
| MSI Bravo 15 A4DCR | |
* ... Moindre est la valeur, meilleures sont les performances
| PCMark 8 Home Score Accelerated v2 | 4332 points | |
| PCMark 8 Creative Score Accelerated v2 | 5215 points | |
| PCMark 8 Work Score Accelerated v2 | 5164 points | |
| PCMark 10 Score | 5221 points | |
Aide | ||
| PCMark 8 | |
| Home Score Accelerated v2 | |
| HP Pavilion Gaming 15-ec1206ng | |
| Nexoc GH5 515IG | |
| Asus TUF FX505DT-EB73 | |
| Lenovo IdeaPad Gaming 3i 15IMH05 | |
| HP Pavilion Gaming 15-ec0002ng | |
| Work Score Accelerated v2 | |
| Lenovo IdeaPad Gaming 3i 15IMH05 | |
| Nexoc GH5 515IG | |
| HP Pavilion Gaming 15-ec1206ng | |
| HP Pavilion Gaming 15-ec0002ng | |
| Asus TUF FX505DT-EB73 | |
| DPC Latencies / LatencyMon - interrupt to process latency (max), Web, Youtube, Prime95 | |
| MSI Bravo 15 A4DCR | |
| Acer Nitro 5 AN515-44-R5FT | |
| Lenovo IdeaPad Gaming 3i 15IMH05 | |
| HP Pavilion Gaming 15-ec1206ng | |
| Nexoc GH5 515IG | |
* ... Moindre est la valeur, meilleures sont les performances

| HP Pavilion Gaming 15-ec1206ng Toshiba KBG40ZNV512G | Nexoc GH5 515IG Samsung SSD 860 Evo 512GB | Lenovo IdeaPad Gaming 3i 15IMH05 SK hynix BC511 HFM512GDHTNI-87A0B | Asus TUF FX505DT-EB73 Intel SSD 660p SSDPEKNW512G8 | Dell G5 15 5590-PCNJJ KBG30ZMS128G | Acer Nitro 5 AN515-44-R5FT SK Hynix BC511 HFM512GDJTNI | MSI Bravo 15 A4DCR Samsung PM981a MZVLB1T0HBLR | HP Pavilion Gaming 15-ec0002ng Intel SSD 660p SSDPEKNW512G8 | |
|---|---|---|---|---|---|---|---|---|
| CrystalDiskMark 5.2 / 6 | -42% | -8% | -12% | -59% | -11% | 41% | -11% | |
| Write 4K (MB/s) | 111.5 | 89.6 -20% | 130 17% | 137.5 23% | 65.3 -41% | 94.7 -15% | 118.3 6% | 136.9 23% |
| Read 4K (MB/s) | 38.17 | 40.88 7% | 44.44 16% | 57 49% | 29.71 -22% | 38.91 2% | 43.73 15% | 57 49% |
| Write Seq (MB/s) | 1515 | 518 -66% | 1059 -30% | 984 -35% | 128.8 -91% | 1056 -30% | 2854 88% | 968 -36% |
| Read Seq (MB/s) | 1576 | 539 -66% | 1105 -30% | 1564 -1% | 859 -45% | 1183 -25% | 2302 46% | 1631 3% |
| Write 4K Q32T1 (MB/s) | 365.4 | 304 -17% | 490.3 34% | 237.4 -35% | 95.8 -74% | 445.3 22% | 418.5 15% | 237 -35% |
| Read 4K Q32T1 (MB/s) | 504 | 329 -35% | 309.2 -39% | 340.7 -32% | 197.6 -61% | 477.7 -5% | 517 3% | 337.1 -33% |
| Write Seq Q32T1 (MB/s) | 1493 | 529 -65% | 1053 -29% | 959 -36% | 132.5 -91% | 1063 -29% | 3008 101% | 963 -35% |
| Read Seq Q32T1 (MB/s) | 2340 | 561 -76% | 2261 -3% | 1732 -26% | 1208 -48% | 2154 -8% | 3568 52% | 1863 -20% |
| AS SSD | -32% | -2% | -1% | -62% | -2% | 70% | -36% | |
| Seq Read (MB/s) | 2048 | 524 -74% | 1348 -34% | 1019 -50% | 1022 -50% | 1504 -27% | 2730 33% | 1623 -21% |
| Seq Write (MB/s) | 1039 | 495 -52% | 1000 -4% | 889 -14% | 117 -89% | 1064 2% | 2513 142% | 891 -14% |
| 4K Read (MB/s) | 52.8 | 38.93 -26% | 48.04 -9% | 48.22 -9% | 30.03 -43% | 51.5 -2% | 61.4 16% | 48.06 -9% |
| 4K Write (MB/s) | 146 | 87.3 -40% | 103.3 -29% | 115.5 -21% | 65.1 -55% | 123.2 -16% | 156.1 7% | 102.1 -30% |
| 4K-64 Read (MB/s) | 1285 | 380 -70% | 755 -41% | 321.5 -75% | 181.4 -86% | 703 -45% | 1780 39% | 325.6 -75% |
| 4K-64 Write (MB/s) | 758 | 335.7 -56% | 749 -1% | 787 4% | 87.1 -89% | 730 -4% | 1920 153% | 94.1 -88% |
| Access Time Read * (ms) | 0.155 | 0.073 53% | 0.061 61% | 0.065 58% | 0.152 2% | 0.064 59% | 0.063 59% | 0.171 -10% |
| Access Time Write * (ms) | 0.202 | 0.039 81% | 0.036 82% | 0.047 77% | 0.25 -24% | 0.031 85% | 0.025 88% | 0.048 76% |
| Score Read (Points) | 1543 | 471 -69% | 938 -39% | 472 -69% | 314 -80% | 905 -41% | 2114 37% | 536 -65% |
| Score Write (Points) | 1008 | 472 -53% | 952 -6% | 992 -2% | 164 -84% | 960 -5% | 2327 131% | 285 -72% |
| Score Total (Points) | 3298 | 1198 -64% | 2365 -28% | 1717 -48% | 604 -82% | 2321 -30% | 5518 67% | 1077 -67% |
| Copy ISO MB/s (MB/s) | 691 | 500 -28% | 749 8% | 942 36% | 566 -18% | |||
| Copy Program MB/s (MB/s) | 345.8 | 283.8 -18% | 342.5 -1% | 444.5 29% | 223.8 -35% | |||
| Copy Game MB/s (MB/s) | 517 | 319.6 -38% | 571 10% | 867 68% | 104.3 -80% | |||
| Moyenne finale (programmes/paramètres) | -37% /
-36% | -5% /
-4% | -7% /
-5% | -61% /
-61% | -7% /
-6% | 56% /
58% | -24% /
-27% |
* ... Moindre est la valeur, meilleures sont les performances
Continuous load read: DiskSpd Read Loop, Queue Depth 8
| 3DMark 11 Performance | 12463 points | |
| 3DMark Cloud Gate Standard Score | 30251 points | |
| 3DMark Fire Strike Score | 8985 points | |
| 3DMark Time Spy Score | 3765 points | |
Aide | ||
| 3DMark 11 - 1280x720 Performance GPU | |
| MSI Bravo 15 A4DCR | |
| Acer Nitro 5 AN515-44-R5FT | |
| Asus TUF FX505DT-EB73 | |
| Dell G5 15 5590-PCNJJ | |
| HP Pavilion Gaming 15-ec1206ng | |
| Lenovo IdeaPad Gaming 3i 15IMH05 | |
| Nexoc GH5 515IG | |
| HP Pavilion Gaming 15-ec0002ng | |
| 3DMark | |
| 1280x720 Cloud Gate Standard Graphics | |
| Lenovo IdeaPad Gaming 3i 15IMH05 | |
| Nexoc GH5 515IG | |
| Dell G5 15 5590-PCNJJ | |
| MSI Bravo 15 A4DCR | |
| HP Pavilion Gaming 15-ec1206ng | |
| Acer Nitro 5 AN515-44-R5FT | |
| Asus TUF FX505DT-EB73 | |
| HP Pavilion Gaming 15-ec0002ng | |
| 1920x1080 Fire Strike Graphics | |
| MSI Bravo 15 A4DCR | |
| Acer Nitro 5 AN515-44-R5FT | |
| HP Pavilion Gaming 15-ec1206ng | |
| Lenovo IdeaPad Gaming 3i 15IMH05 | |
| Asus TUF FX505DT-EB73 | |
| Nexoc GH5 515IG | |
| Dell G5 15 5590-PCNJJ | |
| HP Pavilion Gaming 15-ec0002ng | |
| 2560x1440 Time Spy Graphics | |
| Acer Nitro 5 AN515-44-R5FT | |
| Asus TUF FX505DT-EB73 | |
| MSI Bravo 15 A4DCR | |
| HP Pavilion Gaming 15-ec1206ng | |
| Dell G5 15 5590-PCNJJ | |
| Lenovo IdeaPad Gaming 3i 15IMH05 | |
| Nexoc GH5 515IG | |
| HP Pavilion Gaming 15-ec0002ng | |
| The Witcher 3 - 1920x1080 High Graphics & Postprocessing (Nvidia HairWorks Off) | |
| HP Pavilion Gaming 15-ec1206ng | |
| Acer Nitro 5 AN515-44-R5FT | |
| Nexoc GH5 515IG | |
| Lenovo IdeaPad Gaming 3i 15IMH05 | |
| Asus TUF FX505DT-EB73 | |
| MSI Bravo 15 A4DCR | |
| Dell G5 15 5590-PCNJJ | |
| HP Pavilion Gaming 15-ec0002ng | |
| BioShock Infinite - 1920x1080 Ultra Preset, DX11 (DDOF) | |
| Lenovo IdeaPad Gaming 3i 15IMH05 | |
| Nexoc GH5 515IG | |
| HP Pavilion Gaming 15-ec1206ng | |
| Dell G5 15 5590-PCNJJ | |
| Asus TUF FX505DT-EB73 | |
| HP Pavilion Gaming 15-ec0002ng | |
| Shadow of the Tomb Raider - 1920x1080 Highest Preset AA:T | |
| Acer Nitro 5 AN515-44-R5FT | |
| Lenovo IdeaPad Gaming 3i 15IMH05 | |
| HP Pavilion Gaming 15-ec1206ng | |
| Nexoc GH5 515IG | |
| Dell G5 15 5590-PCNJJ | |
| Asus TUF FX505DT-EB73 | |
| MSI Bravo 15 A4DCR | |
| HP Pavilion Gaming 15-ec0002ng | |
| Call of Duty Modern Warfare 2019 - 1920x1080 Maximum Settings AA:T2X Filmic SM | |
| Acer Nitro 5 AN515-44-R5FT | |
| MSI Bravo 15 A4DCR | |
| Lenovo IdeaPad Gaming 3i 15IMH05 | |
| HP Pavilion Gaming 15-ec1206ng | |
| Nexoc GH5 515IG | |
| HP Pavilion Gaming 15-ec0002ng | |
| Doom Eternal - 1920x1080 High Preset | |
| Lenovo IdeaPad Gaming 3i 15IMH05 | |
| HP Pavilion Gaming 15-ec1206ng | |
| Nexoc GH5 515IG | |
| MSI Bravo 15 A4DCR | |
| F1 2020 - 1920x1080 Ultra High Preset AA:T AF:16x | |
| HP Pavilion Gaming 15-ec1206ng | |
| Nexoc GH5 515IG | |
| Death Stranding - 1920x1080 Very High Preset | |
| HP Pavilion Gaming 15-ec1206ng | |
| Nexoc GH5 515IG | |
| Horizon Zero Dawn - 1920x1080 Favor Quality | |
| Nexoc GH5 515IG | |
| HP Pavilion Gaming 15-ec1206ng | |
| Bas | Moyen | Élevé | Ultra | |
|---|---|---|---|---|
| BioShock Infinite (2013) | 251.9 | 213.5 | 195.4 | 92.6 |
| The Witcher 3 (2015) | 189.4 | 118.5 | 68.9 | 39.8 |
| Shadow of the Tomb Raider (2018) | 95 | 62 | 52 | 45 |
| Total War: Three Kingdoms (2019) | 162.9 | 65.5 | 39.9 | 26.6 |
| Call of Duty Modern Warfare 2019 (2019) | 98.3 | 58.1 | 51.4 | 44.6 |
| Doom Eternal (2020) | 118.9 | 78.6 | 62.9 | |
| Gears Tactics (2020) | 161.6 | 100.4 | 66.4 | 43.6 |
| F1 2020 (2020) | 185 | 104 | 83 | 58 |
| Death Stranding (2020) | 105.6 | 64.2 | 60.4 | 57.8 |
| Horizon Zero Dawn (2020) | 84 | 52 | 44 | 34 |
Degré de la nuisance sonore
| Au repos |
| 25 / 26 / 33 dB(A) |
| Fortement sollicité |
| 41 / 47 dB(A) |
 | ||
30 dB silencieux 40 dB(A) audible 50 dB(A) bruyant |
||
min: | ||
| HP Pavilion Gaming 15-ec1206ng R5 4600H, GeForce GTX 1650 Mobile | Nexoc GH5 515IG i5-10300H, GeForce GTX 1650 Mobile | Lenovo IdeaPad Gaming 3i 15IMH05 i5-10300H, GeForce GTX 1650 Mobile | Asus TUF FX505DT-EB73 R7 3750H, GeForce GTX 1650 Mobile | Dell G5 15 5590-PCNJJ i5-9300H, GeForce GTX 1650 Mobile | Acer Nitro 5 AN515-44-R5FT R5 4600H, GeForce GTX 1650 Ti Mobile | MSI Bravo 15 A4DCR R7 4800H, Radeon RX 5300M | HP Pavilion Gaming 15-ec0002ng R5 3550H, GeForce GTX 1050 Mobile | |
|---|---|---|---|---|---|---|---|---|
| Noise | -12% | -15% | -8% | -18% | -15% | -20% | -7% | |
| arrêt / environnement * (dB) | 25 | 25 -0% | 30.7 -23% | 28.2 -13% | 30 -20% | 30 -20% | 30 -20% | 30.3 -21% |
| Idle Minimum * (dB) | 25 | 25 -0% | 30.7 -23% | 28.2 -13% | 31 -24% | 30 -20% | 31 -24% | 30.3 -21% |
| Idle Average * (dB) | 26 | 31 -19% | 30.7 -18% | 28.2 -8% | 32 -23% | 32 -23% | 32 -23% | 30.3 -17% |
| Idle Maximum * (dB) | 33 | 33 -0% | 30.7 7% | 31.4 5% | 35 -6% | 34 -3% | 40 -21% | 31 6% |
| Load Average * (dB) | 41 | 53 -29% | 49.7 -21% | 39.8 3% | 49 -20% | 46 -12% | 48 -17% | 39.3 4% |
| Witcher 3 ultra * (dB) | 39 | 48 -23% | 47 -21% | 47 -21% | 47 -21% | 47 -21% | 48 -23% | 42.9 -10% |
| Load Maximum * (dB) | 47 | 53 -13% | 50.3 -7% | 50.2 -7% | 53 -13% | 49 -4% | 54 -15% | 43.3 8% |
* ... Moindre est la valeur, meilleures sont les performances
(-) La température maximale du côté supérieur est de 49 °C / 120 F, par rapport à la moyenne de 40.4 °C / 105 F, allant de 21.2 à 68.8 °C pour la classe Gaming.
(-) Le fond chauffe jusqu'à un maximum de 49 °C / 120 F, contre une moyenne de 43.2 °C / 110 F
(+) En utilisation inactive, la température moyenne du côté supérieur est de 27.7 °C / 82 F, par rapport à la moyenne du dispositif de 33.9 °C / 93 F.
(-) En jouant à The Witcher 3, la température moyenne du côté supérieur est de 40.7 °C / 105 F, alors que la moyenne de l'appareil est de 33.9 °C / 93 F.
(-) Les repose-poignets et le pavé tactile peuvent devenir très chauds au toucher, avec un maximum de 40 °C / 104# F.
(-) La température moyenne de la zone de l'appui-paume de dispositifs similaires était de 28.8 °C / 83.8 F (-11.2 °C / #-20.2 F).
| HP Pavilion Gaming 15-ec1206ng R5 4600H, GeForce GTX 1650 Mobile | Nexoc GH5 515IG i5-10300H, GeForce GTX 1650 Mobile | Lenovo IdeaPad Gaming 3i 15IMH05 i5-10300H, GeForce GTX 1650 Mobile | Asus TUF FX505DT-EB73 R7 3750H, GeForce GTX 1650 Mobile | Dell G5 15 5590-PCNJJ i5-9300H, GeForce GTX 1650 Mobile | Acer Nitro 5 AN515-44-R5FT R5 4600H, GeForce GTX 1650 Ti Mobile | MSI Bravo 15 A4DCR R7 4800H, Radeon RX 5300M | HP Pavilion Gaming 15-ec0002ng R5 3550H, GeForce GTX 1050 Mobile | |
|---|---|---|---|---|---|---|---|---|
| Heat | 2% | 4% | -2% | 2% | 0% | -5% | 13% | |
| Maximum Upper Side * (°C) | 49 | 48 2% | 43 12% | 41.2 16% | 49 -0% | 49 -0% | 51 -4% | 41 16% |
| Maximum Bottom * (°C) | 49 | 47 4% | 50.6 -3% | 40 18% | 55 -12% | 50 -2% | 50 -2% | 39.1 20% |
| Idle Upper Side * (°C) | 29 | 28 3% | 27.2 6% | 34.6 -19% | 25 14% | 28 3% | 30 -3% | 26 10% |
| Idle Bottom * (°C) | 28 | 28 -0% | 27.5 2% | 34.4 -23% | 26 7% | 28 -0% | 31 -11% | 26.5 5% |
* ... Moindre est la valeur, meilleures sont les performances
HP Pavilion Gaming 15-ec1206ng analyse audio
(±) | le niveau sonore du haut-parleur est moyen mais bon (79# dB)
Basses 100 - 315 Hz
(-) | presque aucune basse - en moyenne 17.3% plus bas que la médiane
(±) | la linéarité des basses est moyenne (12.1% delta à la fréquence précédente)
Médiums 400 - 2000 Hz
(+) | médiane équilibrée - seulement 4.1% de la médiane
(+) | les médiums sont linéaires (4% delta à la fréquence précédente)
Aiguës 2 - 16 kHz
(+) | des sommets équilibrés - à seulement 3.9% de la médiane
(+) | les aigus sont linéaires (5.7% delta à la fréquence précédente)
Globalement 100 - 16 000 Hz
(±) | la linéarité du son global est moyenne (17.9% de différence avec la médiane)
Par rapport à la même classe
» 54% de tous les appareils testés de cette catégorie étaient meilleurs, 9% similaires, 37% pires
» Le meilleur avait un delta de 6%, la moyenne était de 18%, le pire était de 132%.
Par rapport à tous les appareils testés
» 37% de tous les appareils testés étaient meilleurs, 8% similaires, 55% pires
» Le meilleur avait un delta de 4%, la moyenne était de 24%, le pire était de 134%.
| Éteint/en veille | |
| Au repos | |
| Fortement sollicité |
|
Légende:
min: | |
| HP Pavilion Gaming 15-ec1206ng R5 4600H, GeForce GTX 1650 Mobile | Nexoc GH5 515IG i5-10300H, GeForce GTX 1650 Mobile | Lenovo IdeaPad Gaming 3i 15IMH05 i5-10300H, GeForce GTX 1650 Mobile | Asus TUF FX505DT-EB73 R7 3750H, GeForce GTX 1650 Mobile | Dell G5 15 5590-PCNJJ i5-9300H, GeForce GTX 1650 Mobile | Acer Nitro 5 AN515-44-R5FT R5 4600H, GeForce GTX 1650 Ti Mobile | MSI Bravo 15 A4DCR R7 4800H, Radeon RX 5300M | HP Pavilion Gaming 15-ec0002ng R5 3550H, GeForce GTX 1050 Mobile | |
|---|---|---|---|---|---|---|---|---|
| Power Consumption | -22% | -51% | -55% | -26% | -30% | -125% | 3% | |
| Idle Minimum * (Watt) | 2 | 3 -50% | 5.1 -155% | 7 -250% | 4 -100% | 5 -150% | 11 -450% | 1.9 5% |
| Idle Average * (Watt) | 6 | 7 -17% | 8.2 -37% | 9.9 -65% | 7 -17% | 8 -33% | 14 -133% | 7.2 -20% |
| Idle Maximum * (Watt) | 11 | 16 -45% | 10.6 4% | 12 -9% | 12 -9% | 13 -18% | 25 -127% | 9.6 13% |
| Load Average * (Watt) | 77 | 85 -10% | 128 -66% | 68.4 11% | 95 -23% | 69 10% | 72 6% | 74 4% |
| Witcher 3 ultra * (Watt) | 76 | 86 -13% | 109 -43% | 94.9 -25% | 86 -13% | 78 -3% | 100 -32% | 75 1% |
| Load Maximum * (Watt) | 142 | 134 6% | 150 -6% | 130.9 8% | 135 5% | 124 13% | 163 -15% | 124 13% |
* ... Moindre est la valeur, meilleures sont les performances
| HP Pavilion Gaming 15-ec1206ng R5 4600H, GeForce GTX 1650 Mobile, 52.5 Wh | Nexoc GH5 515IG i5-10300H, GeForce GTX 1650 Mobile, 48.96 Wh | Lenovo IdeaPad Gaming 3i 15IMH05 i5-10300H, GeForce GTX 1650 Mobile, 45 Wh | Asus TUF FX505DT-EB73 R7 3750H, GeForce GTX 1650 Mobile, 48 Wh | Dell G5 15 5590-PCNJJ i5-9300H, GeForce GTX 1650 Mobile, 60 Wh | Acer Nitro 5 AN515-44-R5FT R5 4600H, GeForce GTX 1650 Ti Mobile, 57.48 Wh | MSI Bravo 15 A4DCR R7 4800H, Radeon RX 5300M, 51 Wh | HP Pavilion Gaming 15-ec0002ng R5 3550H, GeForce GTX 1050 Mobile, 52.5 Wh | |
|---|---|---|---|---|---|---|---|---|
| Autonomie de la batterie | -18% | -5% | -19% | 28% | 2% | -42% | -8% | |
| Reader / Idle (h) | 19.4 | 14.9 -23% | 12.4 -36% | 7.8 -60% | 14.5 -25% | 13.8 -29% | 7 -64% | |
| H.264 (h) | 10.9 | 6.5 -40% | 7.3 -33% | |||||
| WiFi v1.3 (h) | 9.1 | 6.4 -30% | 6.3 -31% | 4.8 -47% | 8 -12% | 8.7 -4% | 4.5 -51% | 8.4 -8% |
| Load (h) | 1 | 1.2 20% | 1.8 80% | 1.5 50% | 2.2 120% | 1.4 40% | 0.9 -10% |
Points positifs
Points négatifs
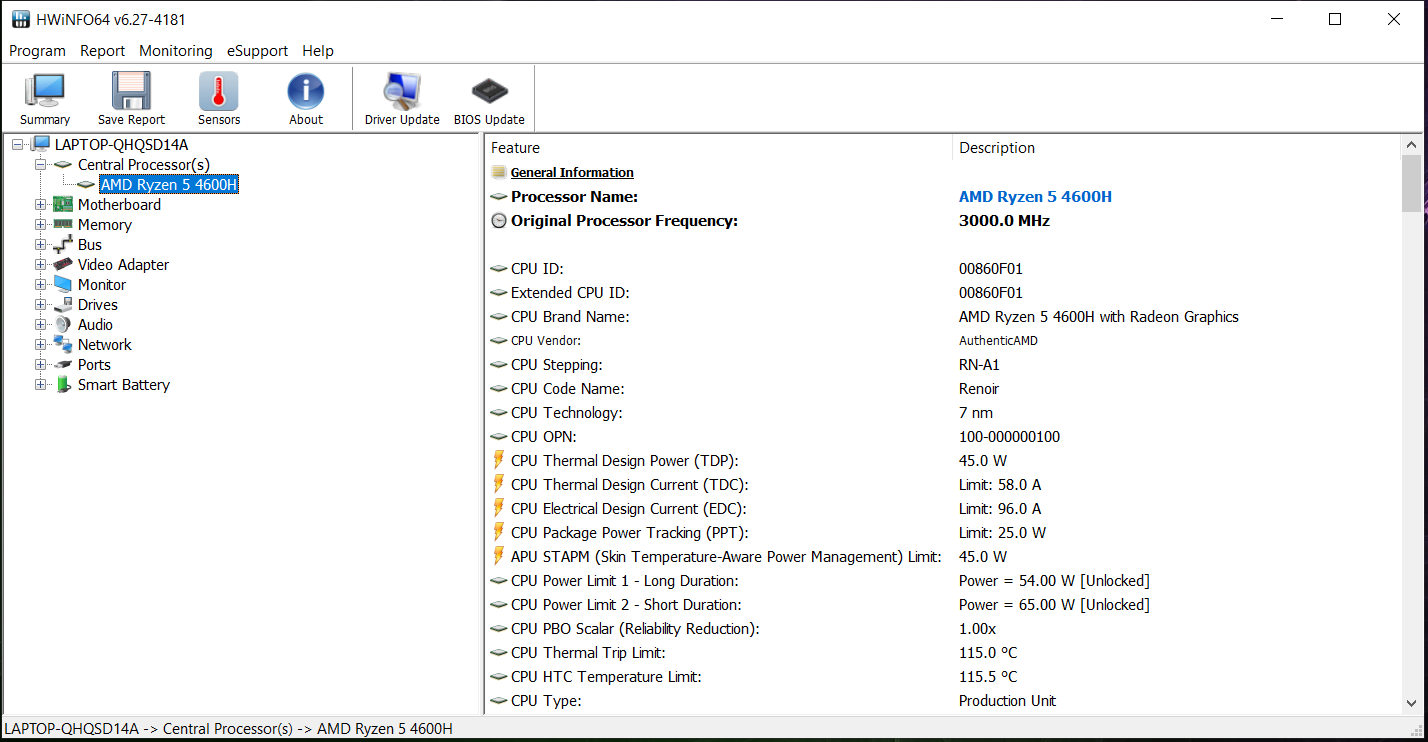
Pour un prix légèrement inférieur à 800 €, le Pavilion 15-ec1206ng appartient à la catégorie de PC portables de jeu à petit prix. L'appareil fait ce pour quoi il est conçu : il permet de jouer fluidement à n'importe quel jeu récent. Cependant, il ne faut pas vouloir une résolution et des réglages les plus élevés, avec l'APU Ryzen 5 4600H et le GPU GeForce GTX 1650.
Avec le Pavilion Gaming 15-ex1206ng, HP porpose un PC portable de jeu équilibré, à un prix réduit.
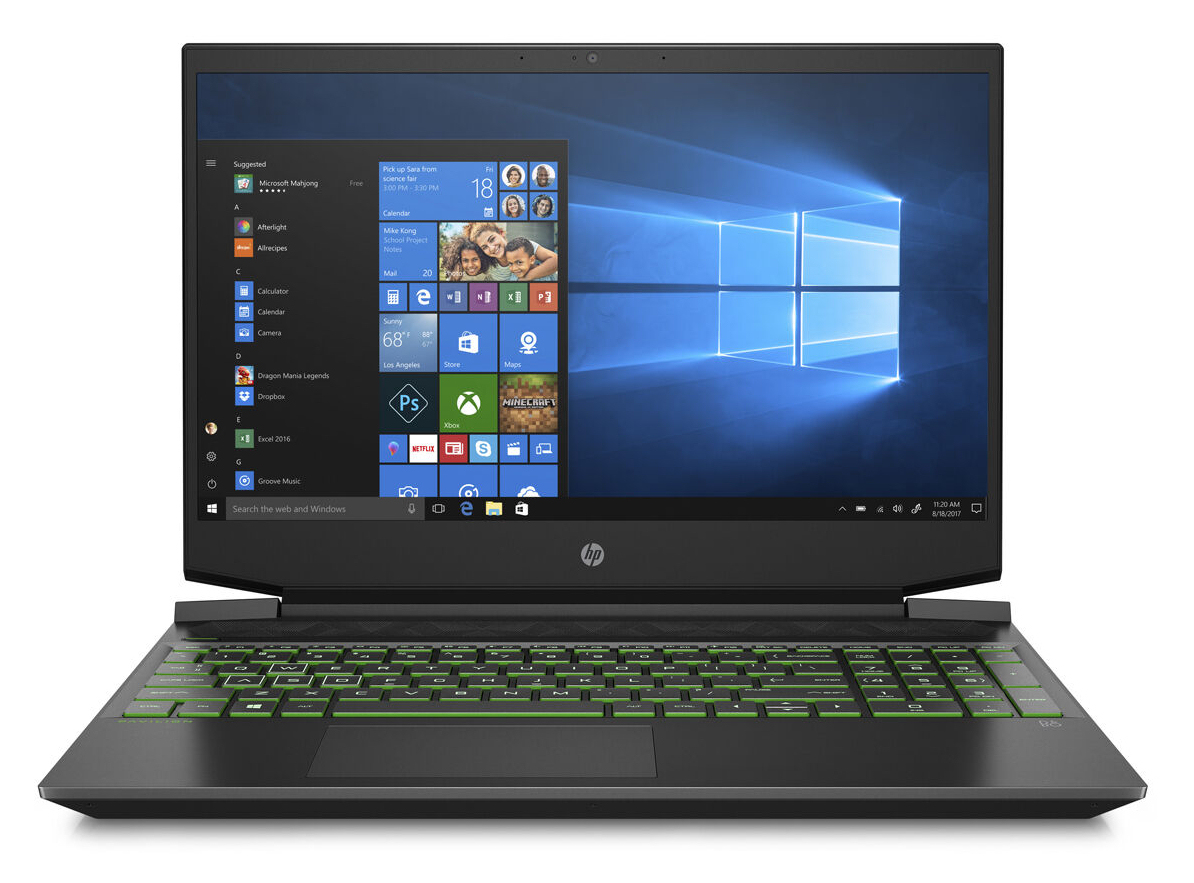
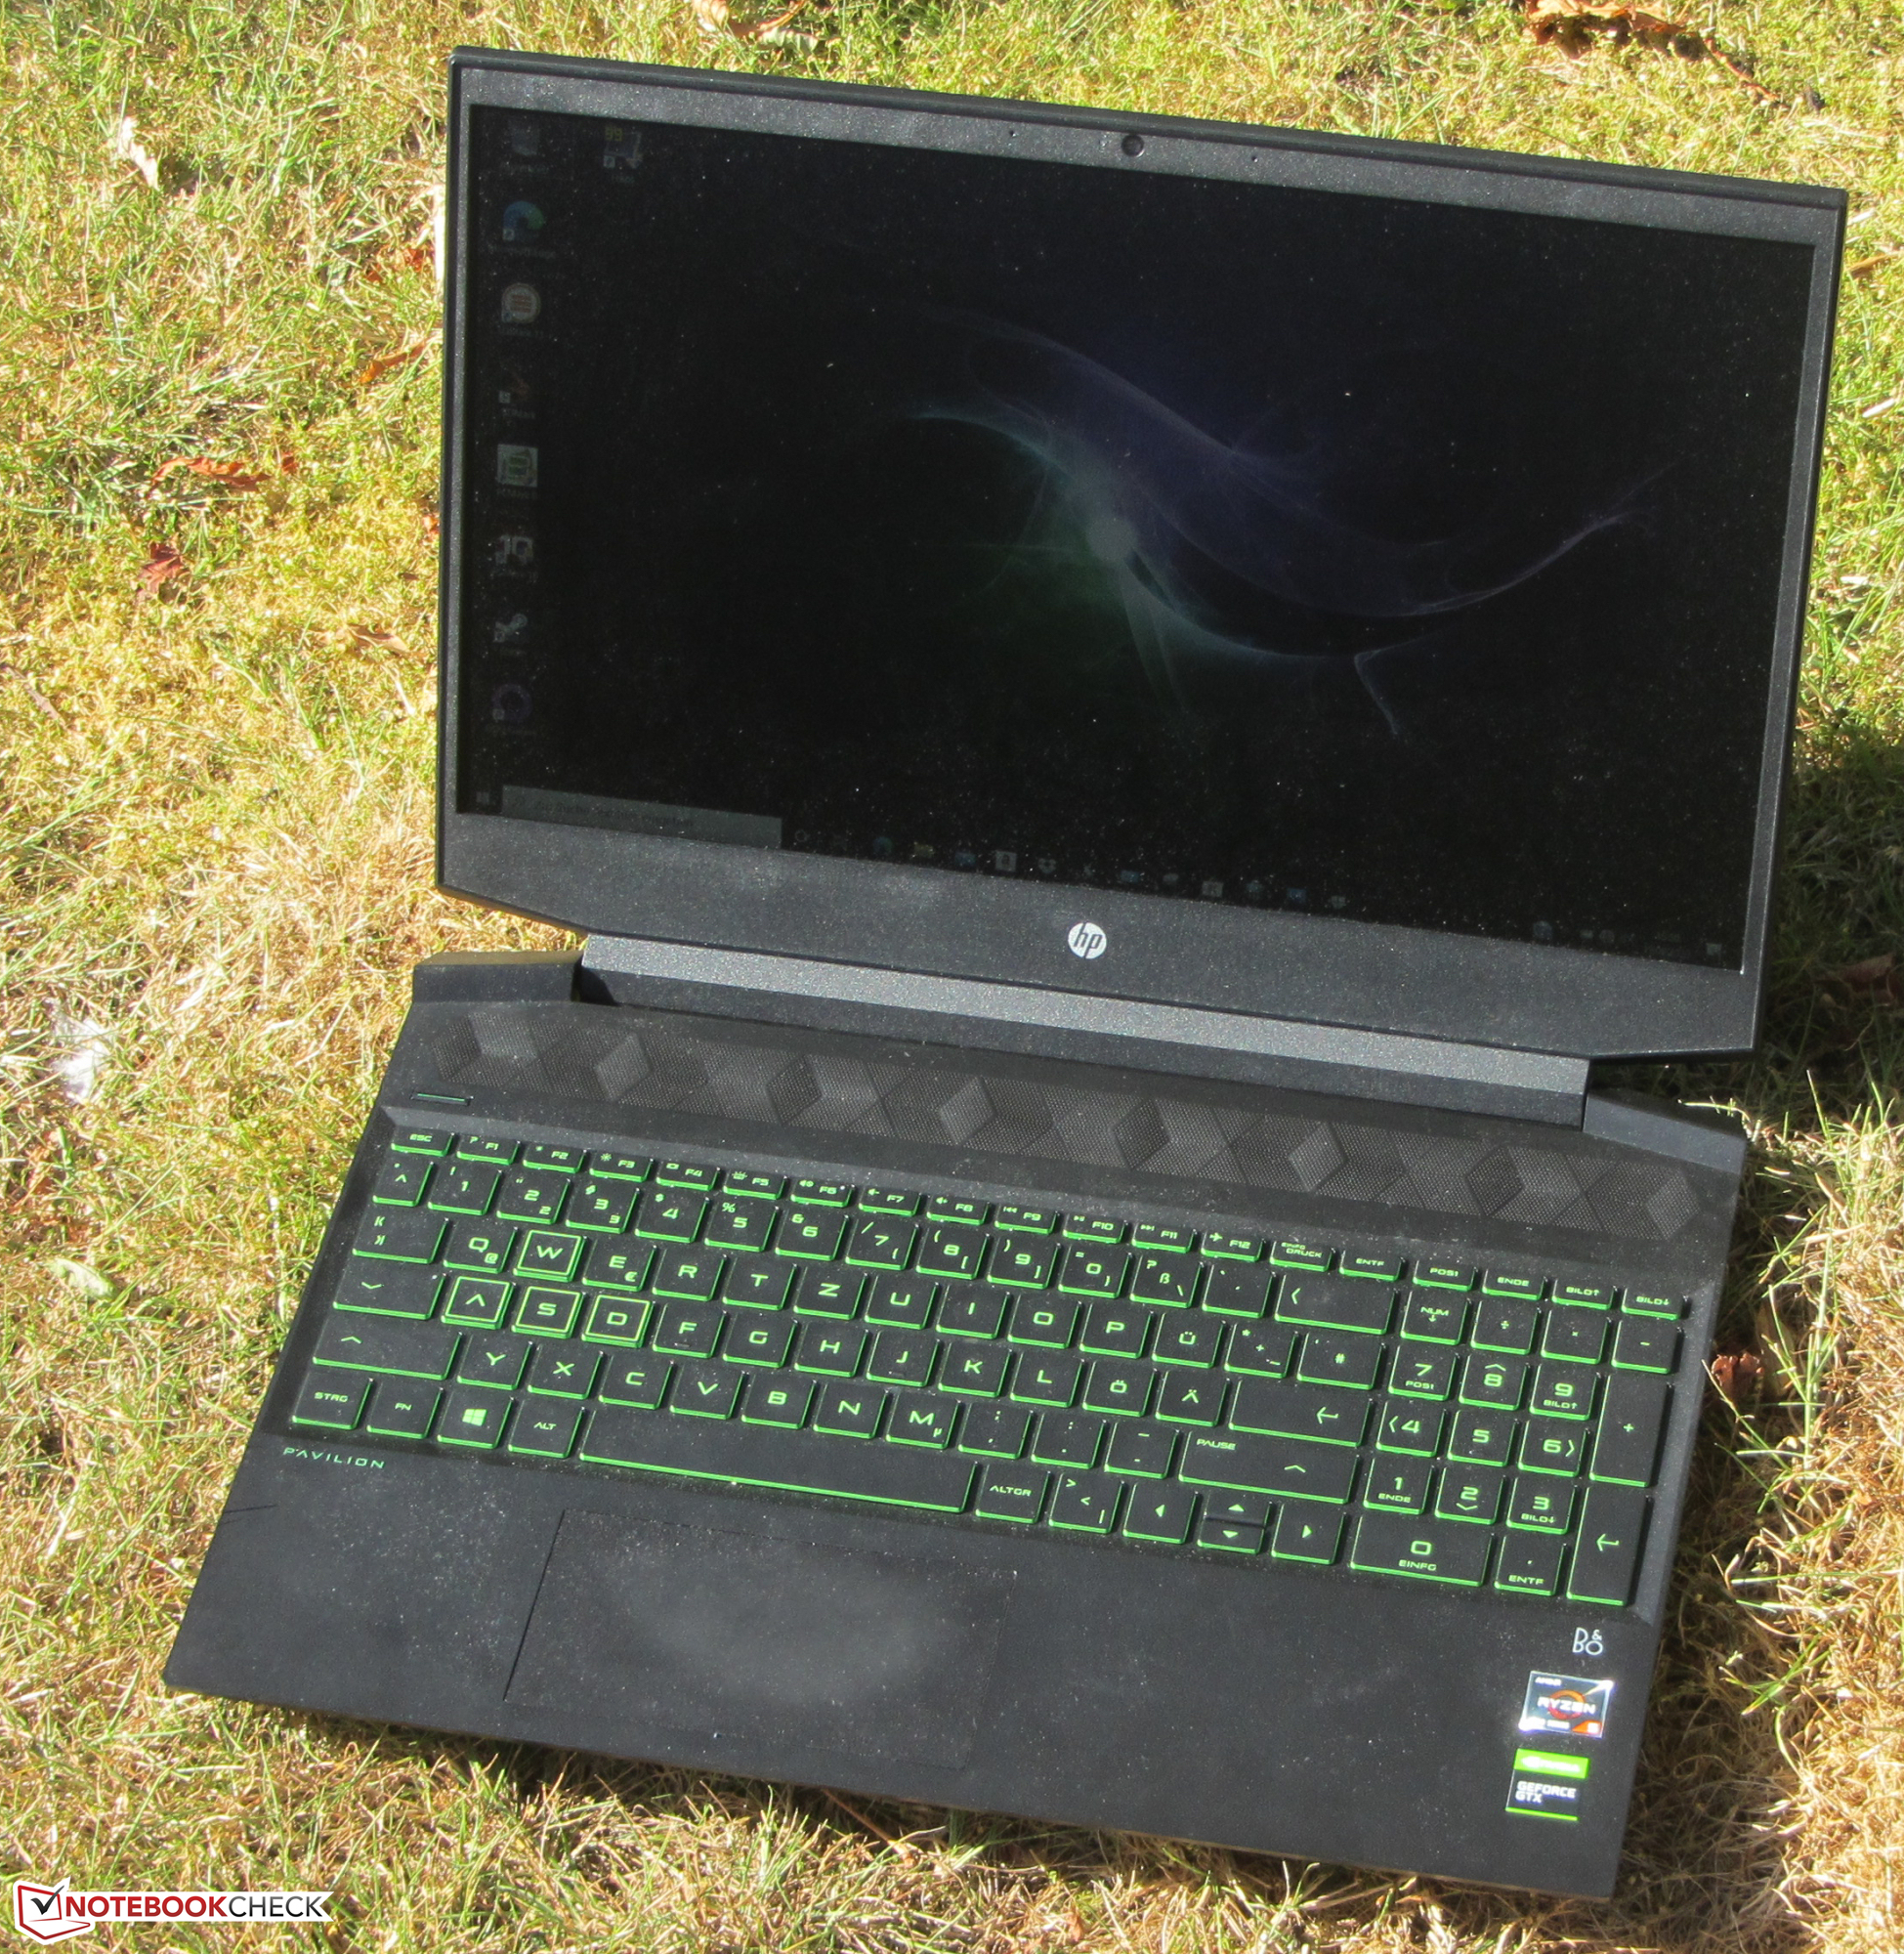
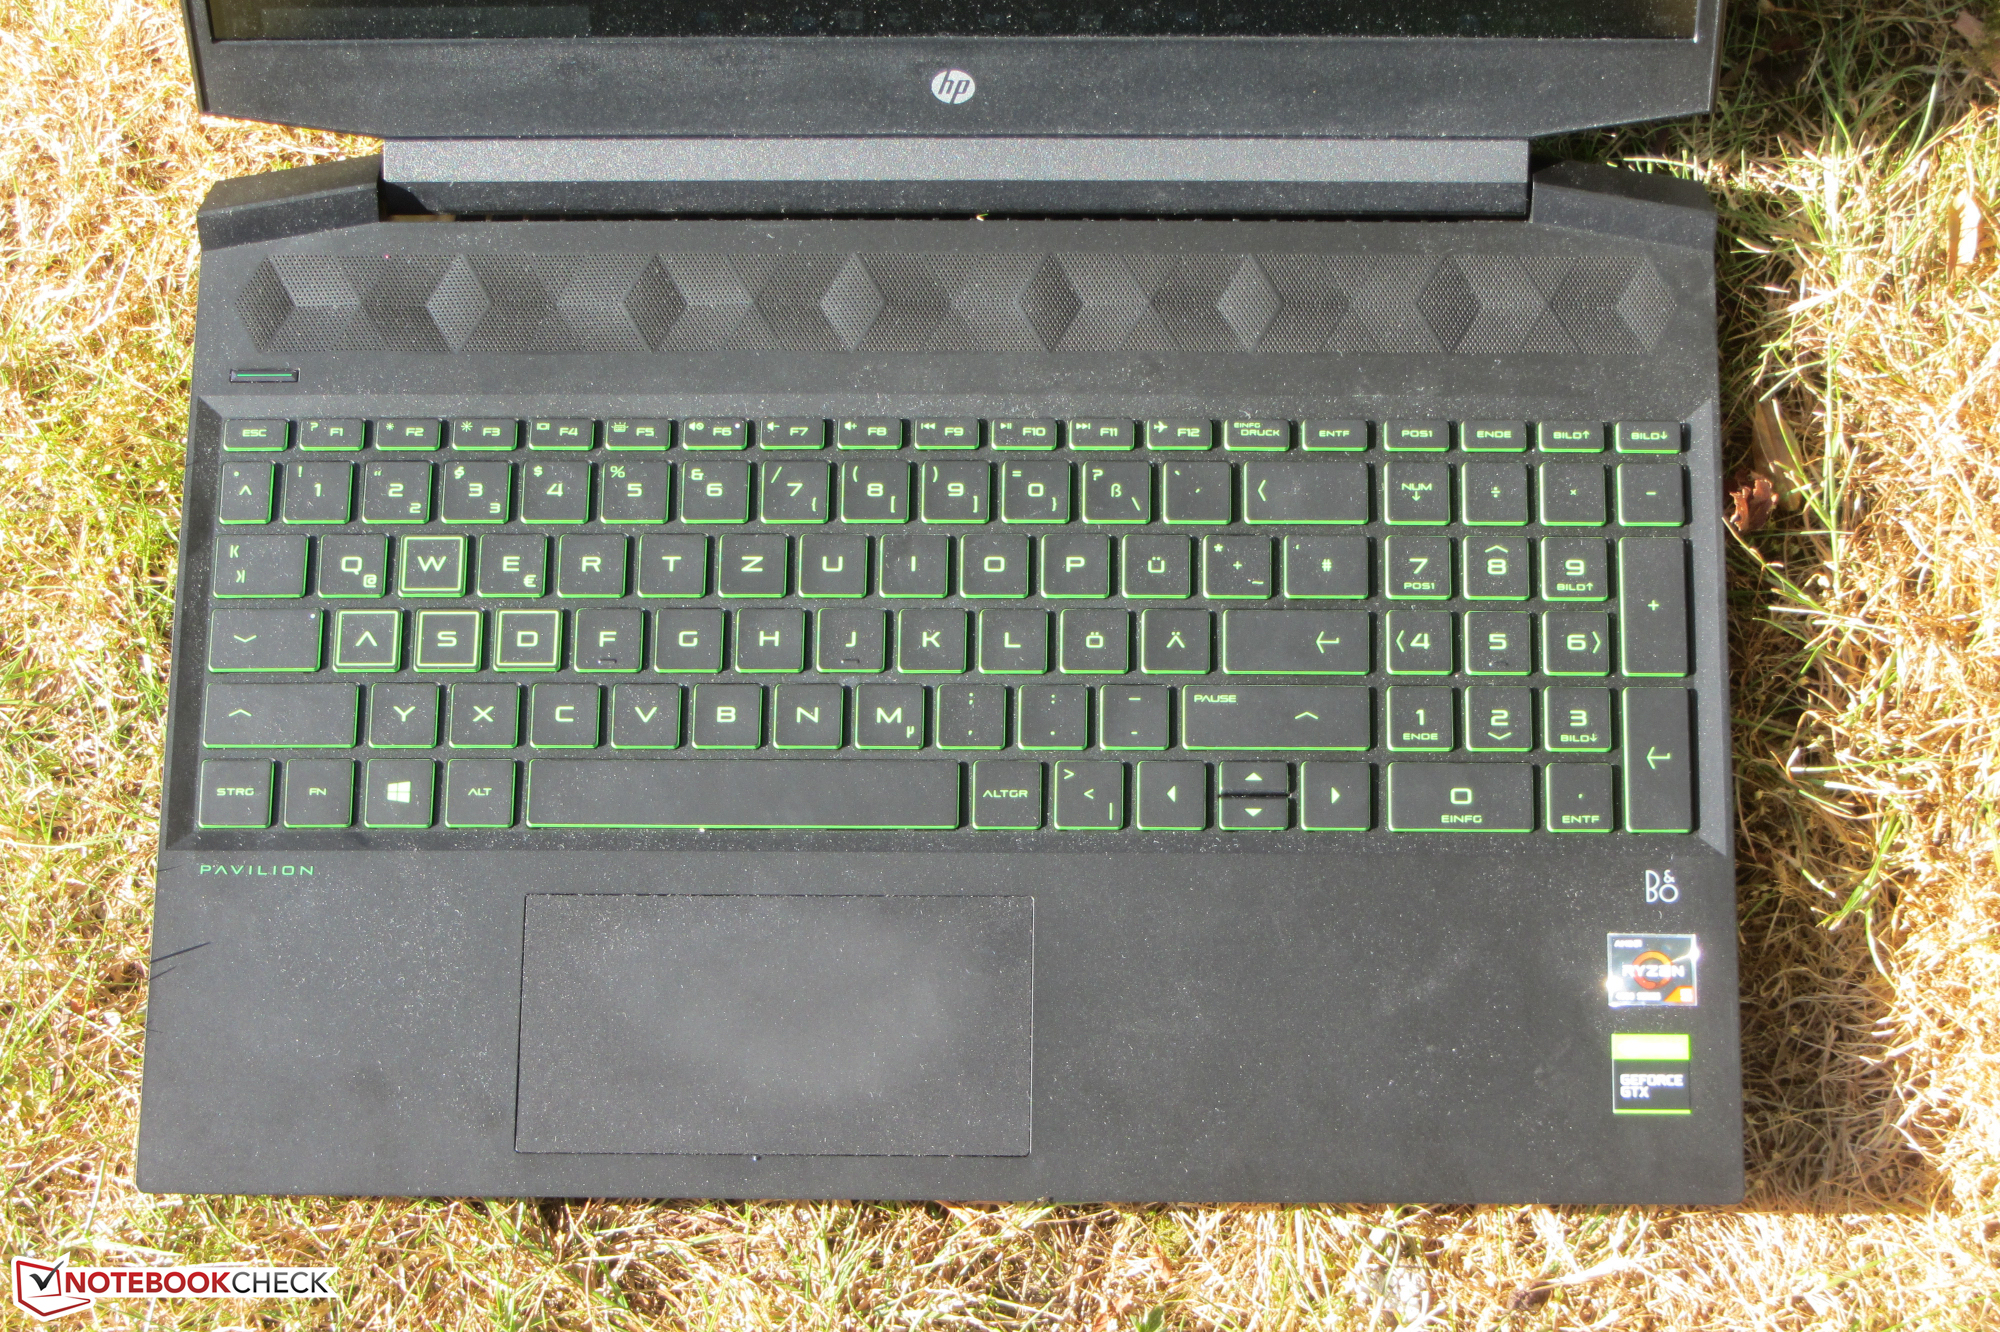
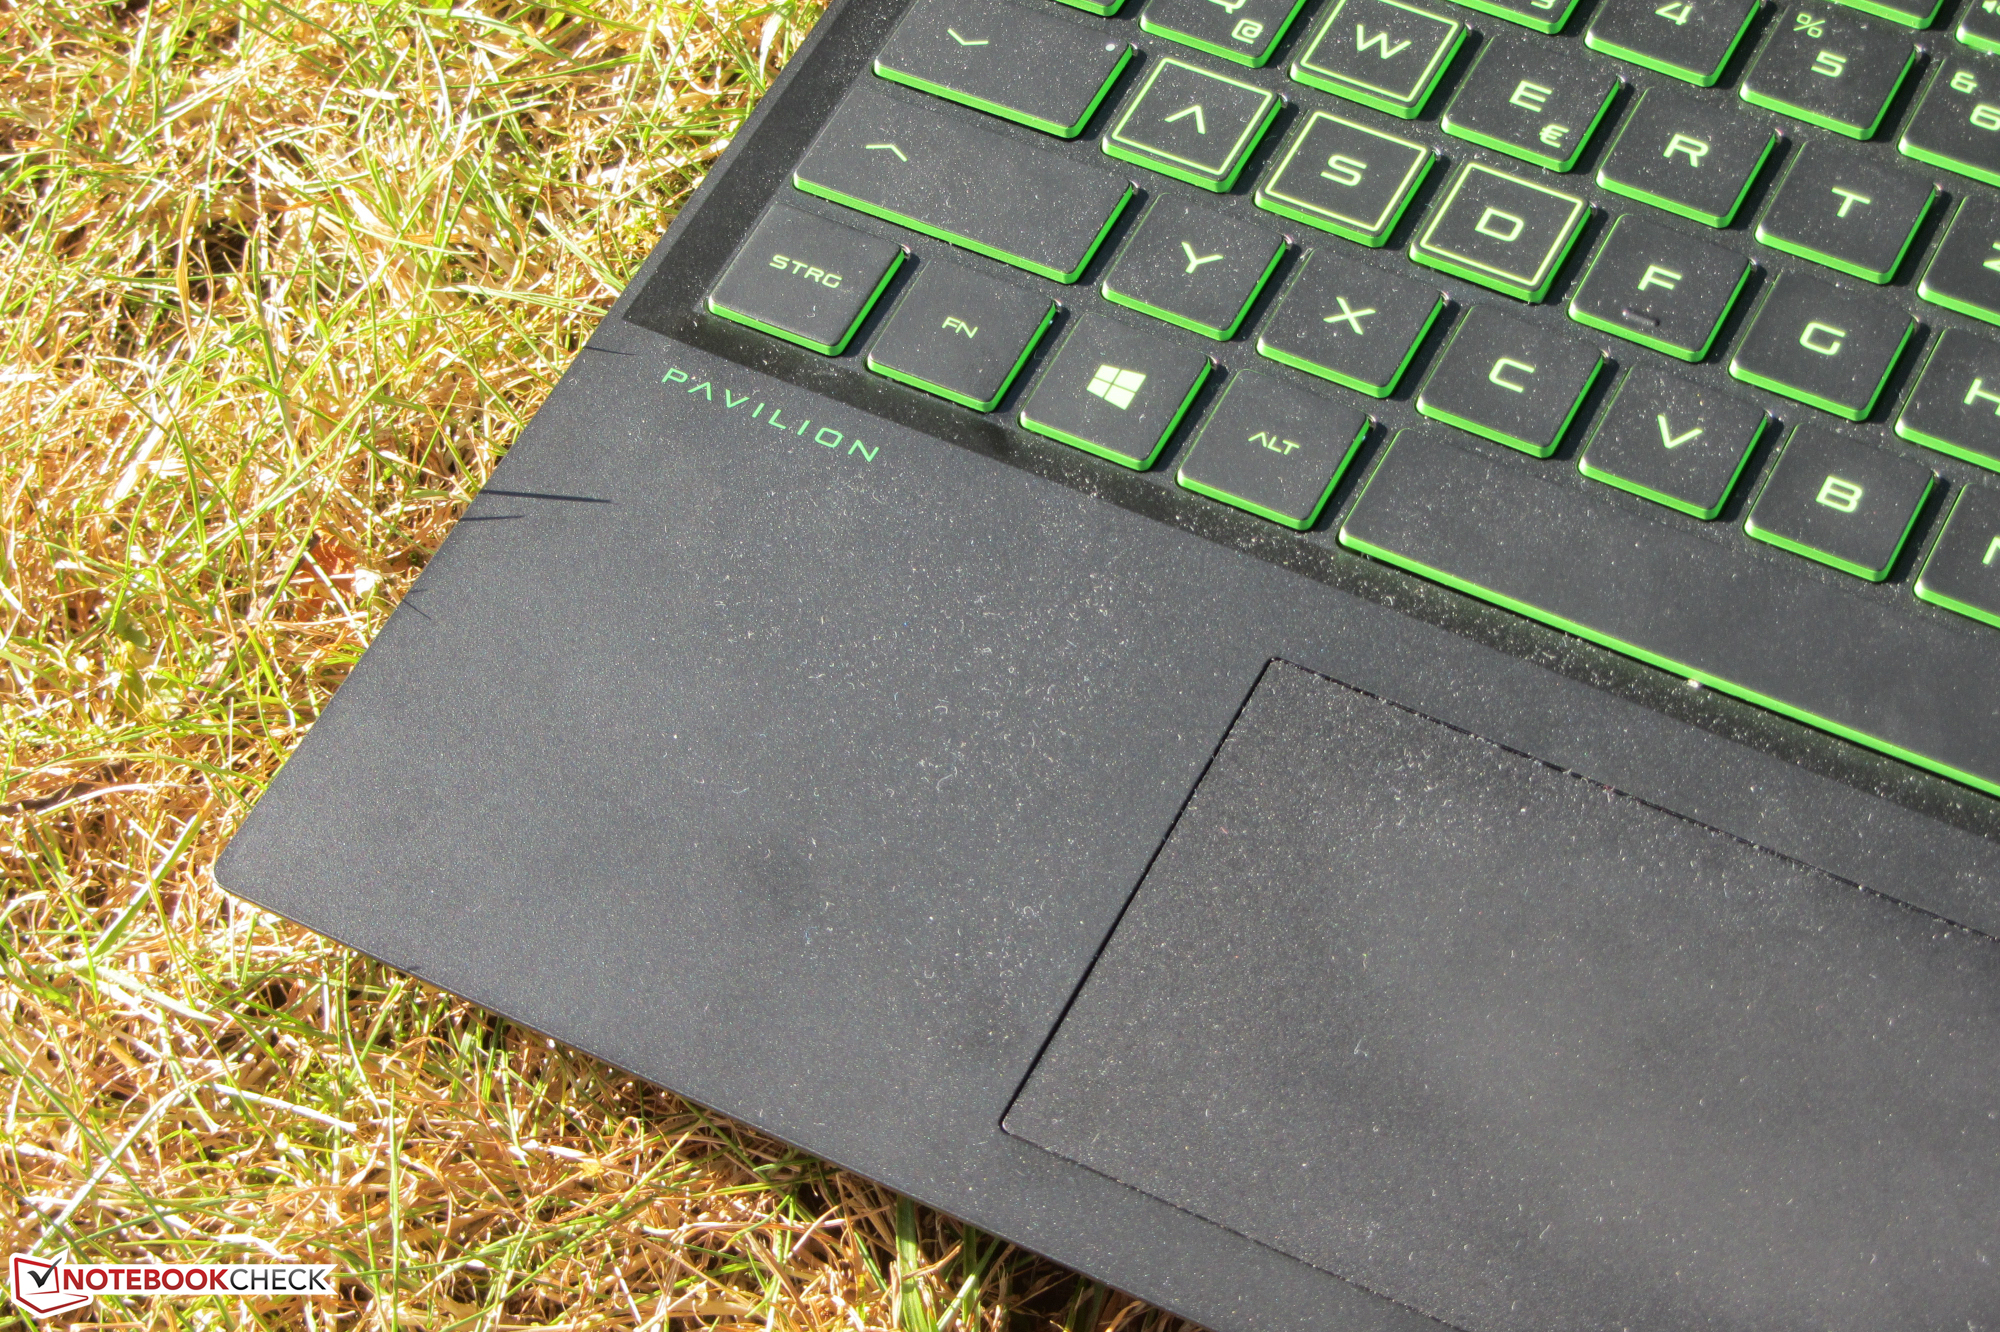
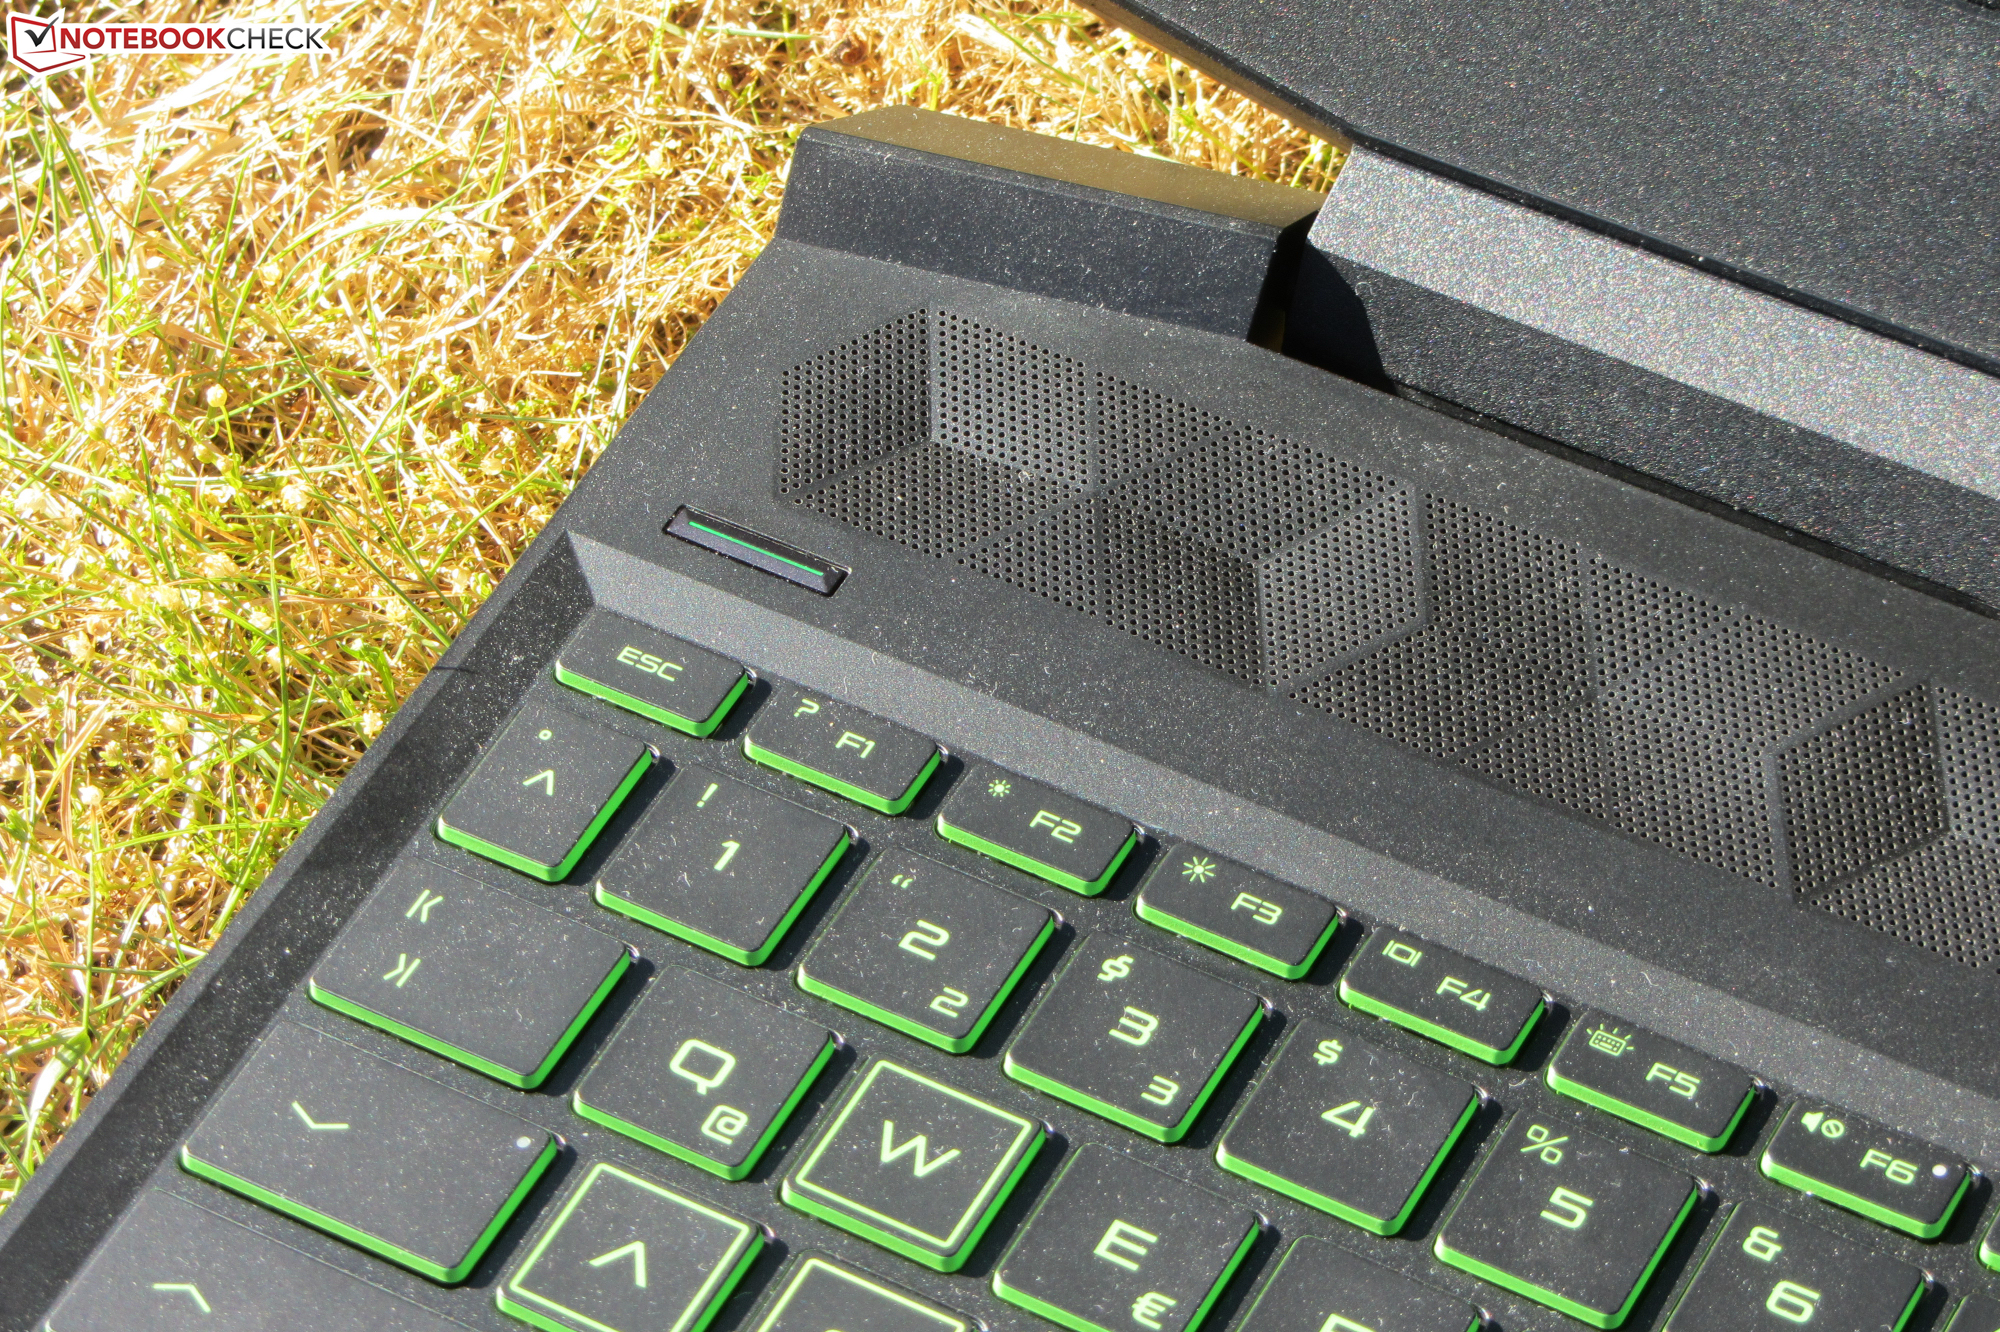
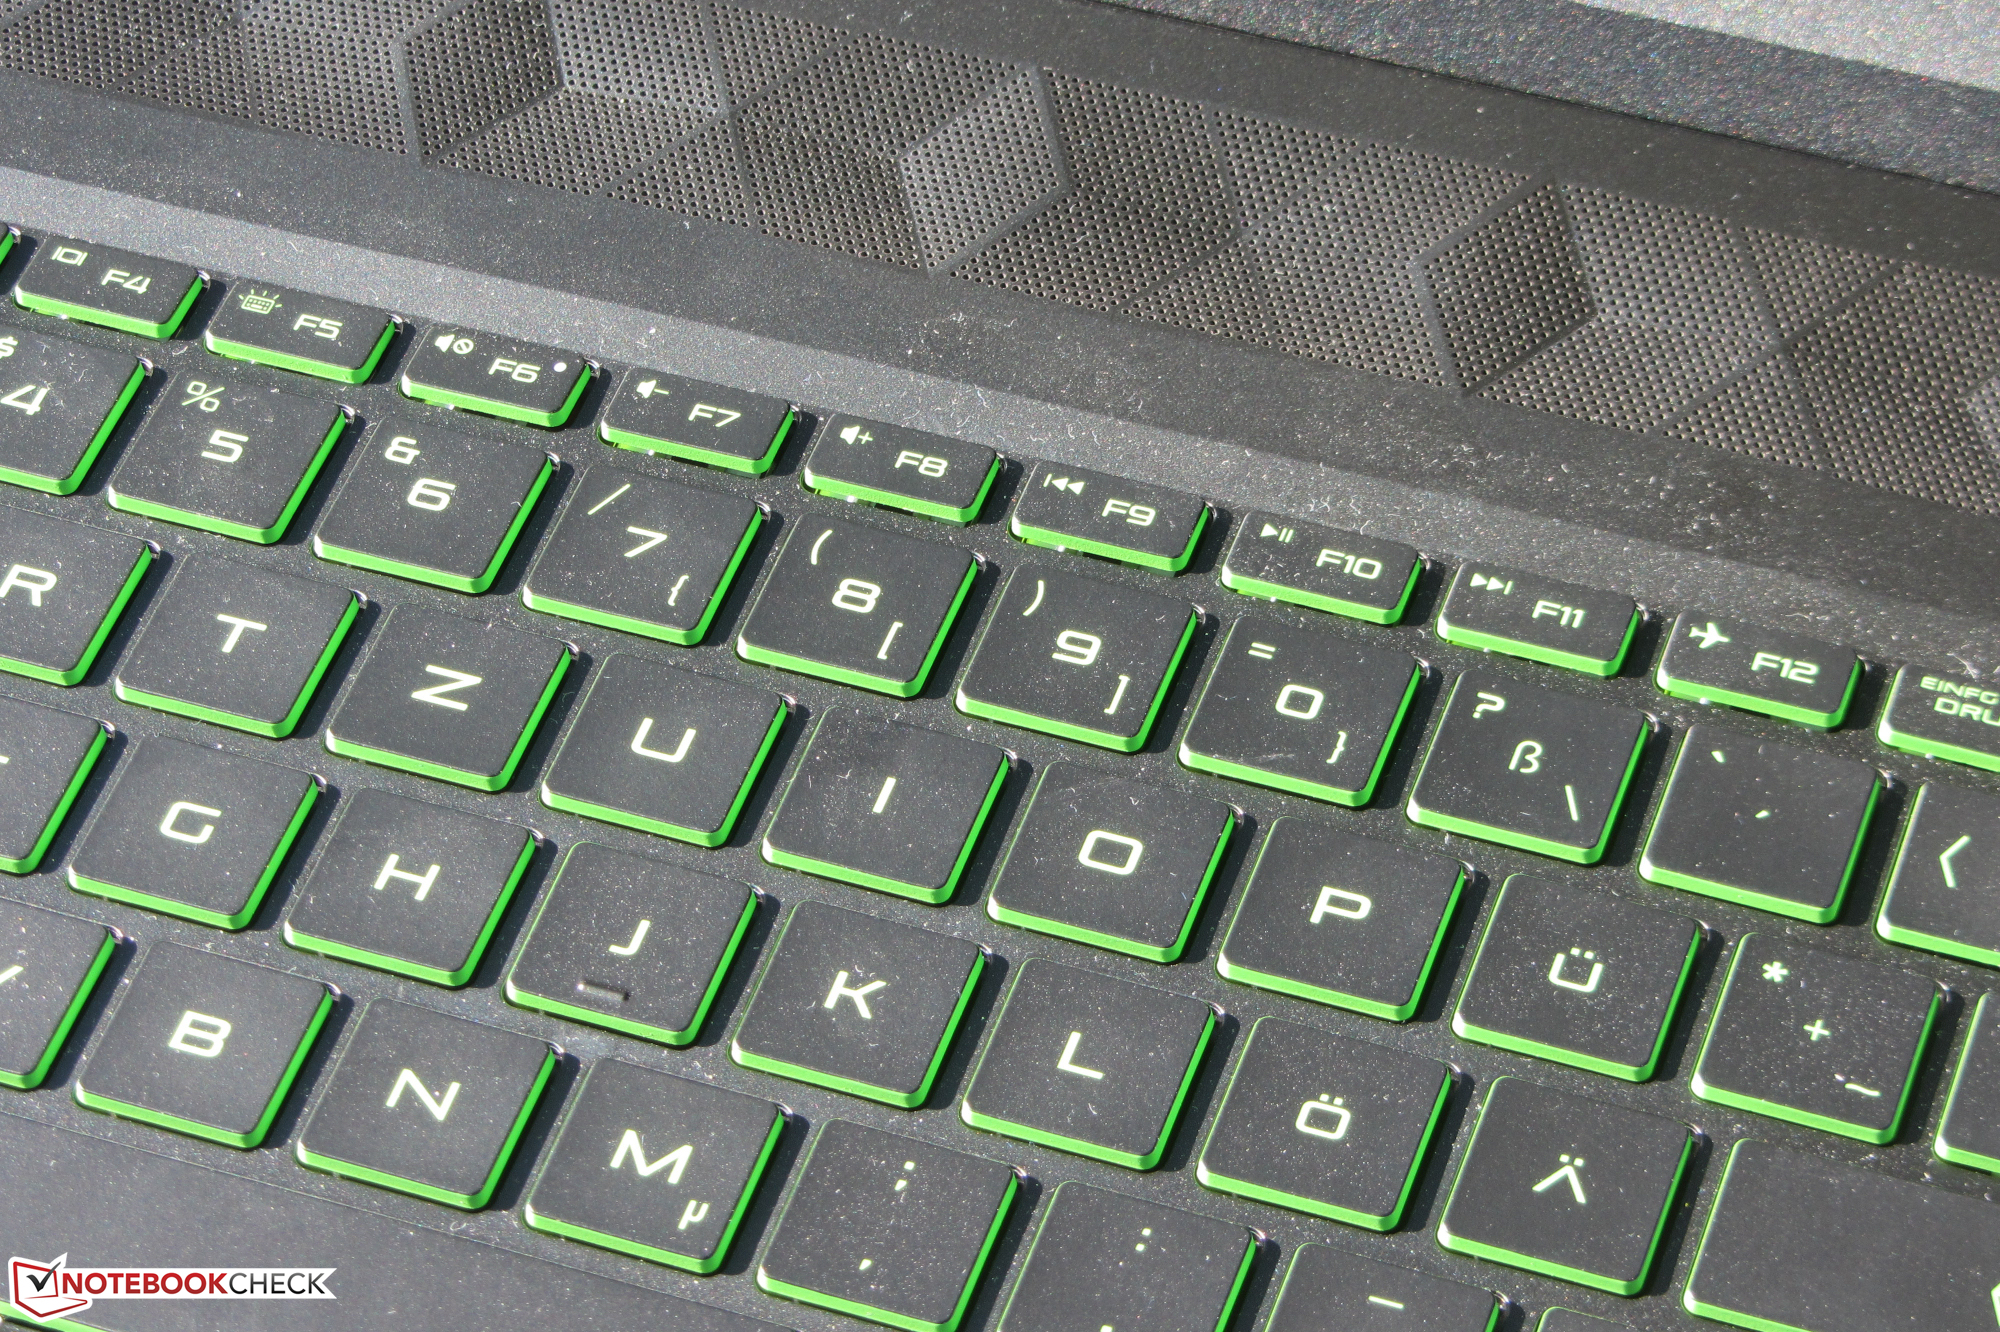
Malgré la puissance de l'appareil, l'autonomie n'est pas sacrifiée. Avec une seule charge, le PC HP atteint une autonomie pratique de 9 à 11h - ce que peu de portables de jeu atteignent. Avec un clavier rétroéclairé honnête, le portable peut également servir d'appareil de bureautique et pour Internet.
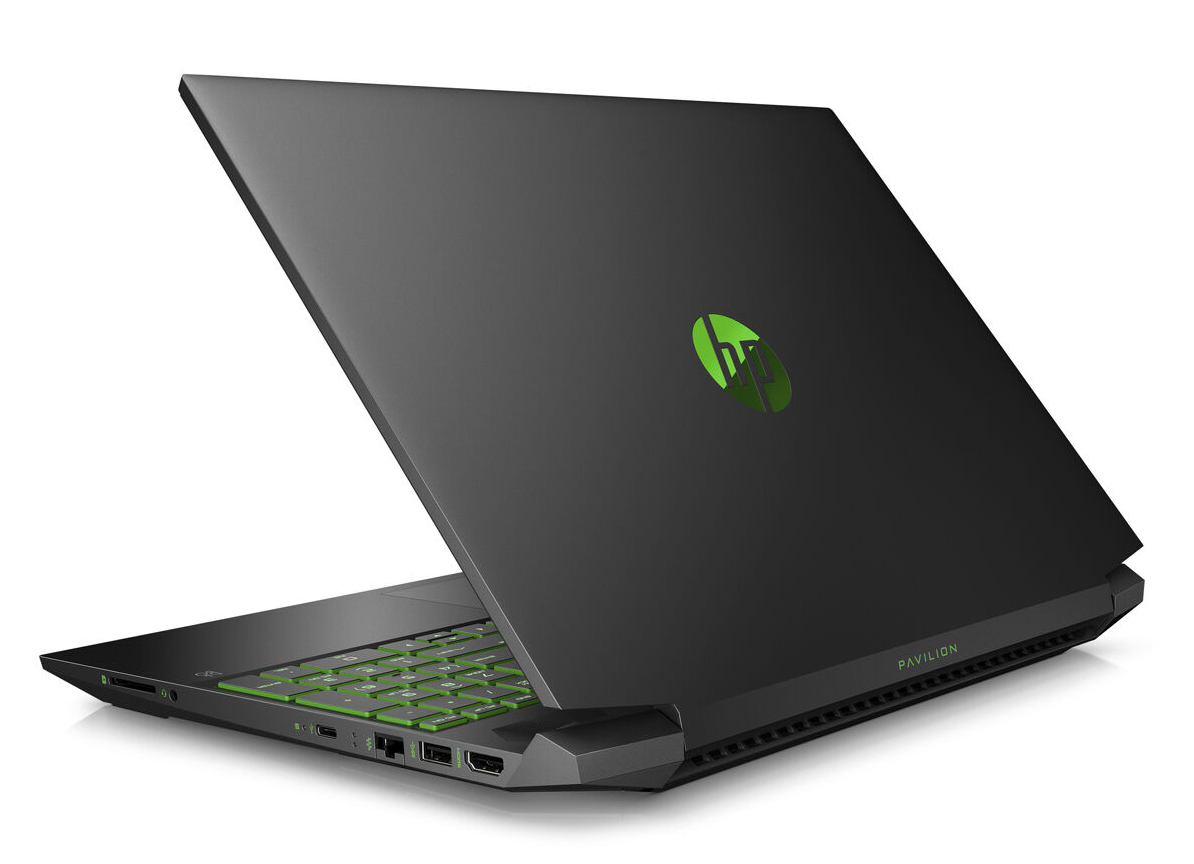
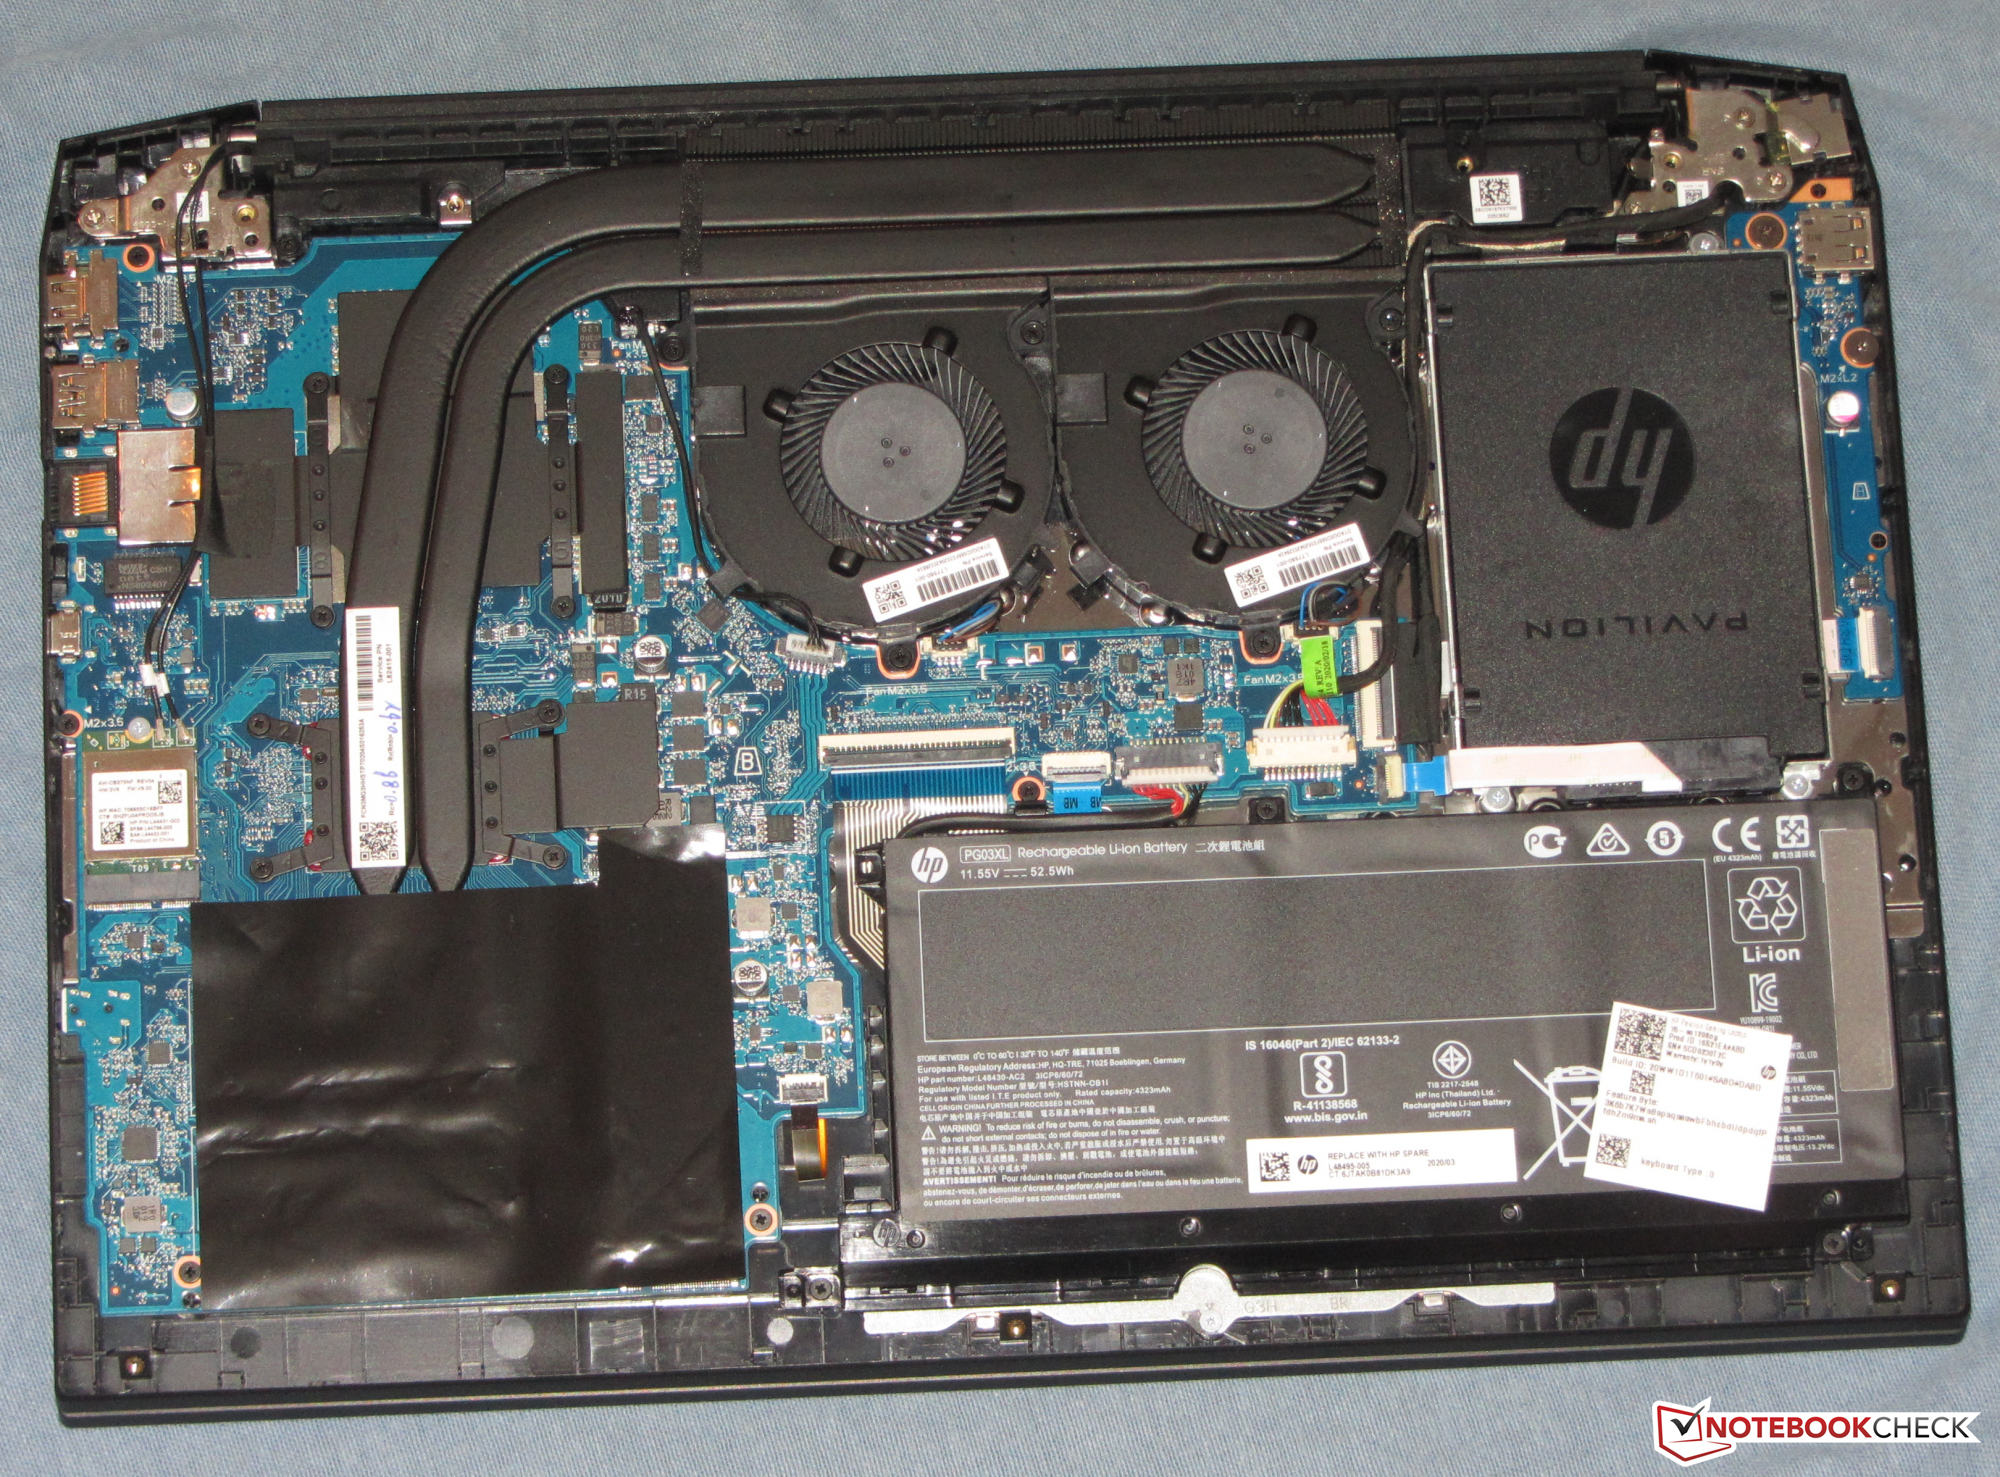
Le SSD (M.2 2280) NVMe de 512 Go permet au système d'être réactif. Et si le stockage est trop juste, il peut être remplacé, et un disque de 2,5 pouces peut être ajouté. L'emplacement SATA et le cadre sont présents. Mais l'appareil n'ayant pas de trappe de maintenance, il faudra retirer toute la coque.
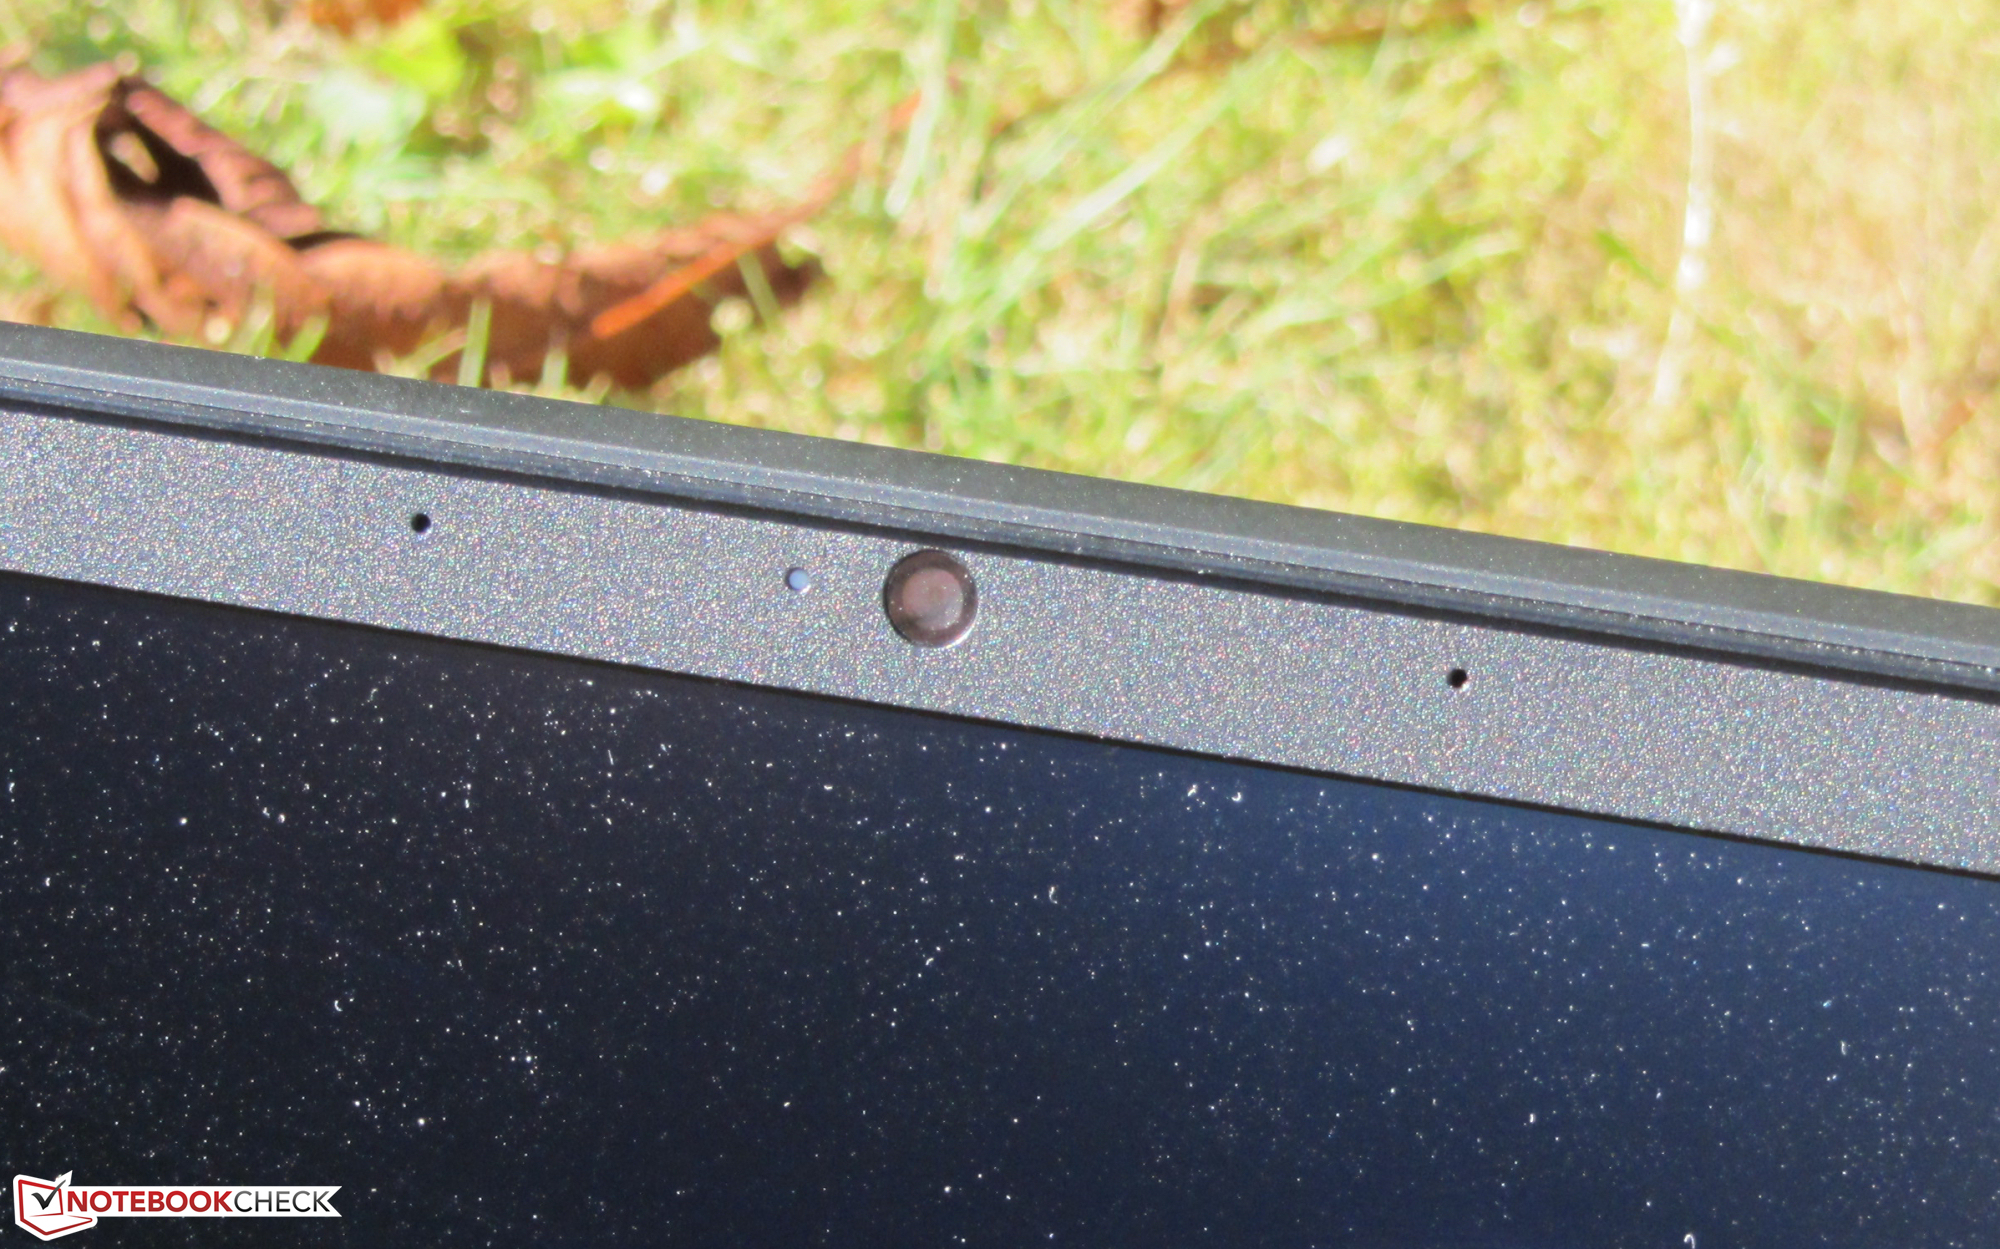
L'écran IPS Full HD possède de bons angles de vision, une surface matte, un bon contraste, et une fidélité des couleurs très correcte. En revanche, la luminosité maximale est trop faible, et il y a une marge de progression en ce qui concerne la couverture des espaces colorimétriques.
L’intégralité de cette critique est disponible en anglais en suivant ce lien.
HP Pavilion Gaming 15-ec1206ng
- 08/25/2020 v7 (old)
Sascha Mölck
Price comparison
