Testés dans les ordinateurs portables : NVIDIA GeForce GTX 1650 Mobile carte graphique
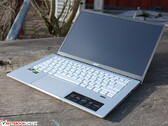
Test de l'Acer Swift X SFX14 avec GTX 1650 : PC portable Swift Ryzen
L'ordinateur portable de 14 pouces d'Acer a tout d'un ultrabook de jeu mobile. Bien que la carte graphique 2020 Turing ne soit pas la dernière et la meilleure, elle offre une puissance de jeu modérée associée au Ryzen 5000 dans un boîtier de 19 mm d'épaisseur. La qualité de construction est solide et l'écran étonnamment bon.
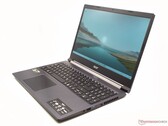
AMD Ryzen 5 5500U, NVIDIA GeForce GTX 1650 Mobile, 14", 1.4 kgTest de l'Acer Aspire 7 A715-42G : PC polyvalent déguisé avec un potentiel pour le jeu
Non seulement l'écran de 15,6 pouces fournit suffisamment de puissance pour la bureautique et l'Internet, mais il s'efforce également d'obtenir des fréquences d'images nettes. L'ordinateur portable multimédia transfère en douceur de nombreux jeux modernes à l'écran.
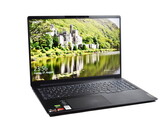
AMD Ryzen 5 5500U, NVIDIA GeForce GTX 1650 Mobile, 15.6", 2.2 kgTest du Lenovo IdeaPad 5 Pro 16ACH : PC portable Ryzen 5000 avec grand écran LCD 120 Hz
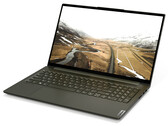
Le Lenovo IdeaPad 5 Pro 16ACH pourrait être le résultat de la combinaison de la tendance aux écrans 16:10 et des processeurs AMD. L'ordinateur portable multimédia se distingue par son grand écran LCD haute résolution de 120 Hz dans un format moins large et par ses processeurs rapides Ryzen 5000H.
AMD Ryzen 7 5800H, NVIDIA GeForce GTX 1650 Mobile, 16", 2 kgTest du Lenovo Yoga Creator 7 15IMH05 : Dolby Vision, très bonne autonomie et garantie de trois ans
Le Lenovo Yoga Creator 7, fin et compact, offre de nombreuses performances informatiques et un niveau d'équipement bien équilibré. Cela s'accompagne d'une très bonne autonomie et d'une garantie de trois ans.
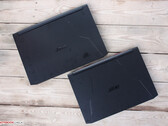
Intel Core i7-10750H, NVIDIA GeForce GTX 1650 Mobile, 15.6", 1.8 kgAperçu de l'Acer Nitro 5 en 15 et 17 pouces : Ryzen 5000H pour les joueurs
Le Ryzen 5000H accélère et surpasse de nombreuses machines de jeu équipées d'une puce Intel. Cependant, la configuration avec un affichage réactif et des options de stockage de masse est également attrayante. Nous avons testé deux modèles de pré-production.
AMD Ryzen 5 5600H, NVIDIA GeForce GTX 1650 Mobile, 15.6", 2.3 kgSchenker XMG Core 14: Intel Core i5-1135G7, 14.00", 1.4 kg
Critique » Test du Schenker XMG Core 14 (Clevo NV40MB) : joueur compact
Lenovo Legion 5 17IMH05: Intel Core i5-10300H, 17.30", 2.9 kg
Critique » Test du Lenovo Legion 5 17IMH (i5-10300H, GTX 1650, FHD) : autonomie sans fin
LG Ultra 17U70N: Intel Core i5-10210U, 17.00", 2 kg
Critique » Test du LG Ultra 17 (i5-10210U, GTX 1650, FHD+) : tel un Dell XPS 17, mais en moins bien
HP Pavilion Gaming 15-ec1206ng: AMD Ryzen 5 4600H, 15.60", 2.1 kg
Critique » Test du HP Pavilion Gaming 15 (Ryzen 5 4600H, GTX 1650, FHD) : PC portable de jeu à petit prix avec une bonne autonomie
Lenovo IdeaPad Gaming 3i 15IMH05: Intel Core i5-10300H, 15.60", 2.2 kg
Critique » Test du Lenovo IdeaPad Gaming 3i 15IMH05 (i5-10300H, GTX 1650, FHD, 120 Hz) : Core i5 à plein régime
MSI GF75 Thin 10SCXR: Intel Core i5-10300H, 17.30", 2.2 kg
Critique » Test du MSI GF75 Thin 10SCXR (i5-10300H, GTX 1650, FHD, 120 Hz) : les débuts de l'i5 Comet Lake H
Lenovo ThinkPad X1 Extreme 2019 20QV000WGE: Intel Core i7-9750H, 15.60", 1.7 kg
Critique » Test du Lenovo ThinkPad X1 Extreme 2019 (i7-9750H, GTX 1650, 4K UHD) : 2e génération premium en berne
Dell G5 15 5590-PCNJJ: Intel Core i5-9300H, 15.60", 2.7 kg
Critique » Test du Dell G5 15 5590 (i5-9300H, GTX 1650, FHD) : performances / prix au top mais avec des problèmes élémentaires
Dell XPS 15 7590 9980HK GTX 1650: Intel Core i9-9980HK, 15.60", 2 kg
Critique » Test complet du Dell XPS 15 7590 (i9-9980HK, GTX 1650, 4K UHD OLED) : surpuissant
Dell G3 3590: Intel Core i5-9300H, 15.60", 2.5 kg
Critique » Test du Dell G3 15 3590 (i5-9300H, GTX 1650, FHD) : peu cher et évolutif
Lenovo IdeaPad L340-15IRH 81LK00BMGE: Intel Core i5-9300H, 15.60", 2.1 kg
Critique » Test du Lenovo IdeaPad L340-15IRH (i5-9300H, GTX 1650, FHD) : portable de jeu à petit prix
Acer Aspire 7 A715-74G-50U5: Intel Core i5-9300H, 15.60", 2.4 kg
Critique » Test de l'Acer Aspire 7 A715 (i5-9300H, GTX 1650, FHD) : mise à jour du portable avec potentiel de jeu et bonne autonomie
Lenovo Ideapad L340-17IRH 81LL001YGE: Intel Core i5-9300H, 17.30", 2.5 kg
Critique » Test du Lenovo IdeaPad L340-17IRH (i5-9300H, GTX 1650, FHD) : portable de jeu du milieu de gamme en demi-teinte
Asus TUF FX505DT-EB73: AMD Ryzen 7 3750H, 15.60", 2.2 kg
Critique » Courte critique de l'Asus TUF FX505DT (Ryzen 7, GTX 1650, FHD) : pas besoin d'Intel dans ce PC portable de jeu !
HP Omen 15-dc1020ng: Intel Core i5-9300H, 15.60", 2.3 kg
Critique » Courte critique du HP Omen 15-dc1020ng (i5-9300H, GTX 1650, FHD) : portable de jeu abordable avec autonomie correcte
MSI GF75 Thin 9SC: Intel Core i7-9750H, 17.30", 2.3 kg
Critique » Courte critique du MSI GF75 Thin 9SC (i7-9750H, GTX 1650, FHD) : un PC portable à la prestation mitigéé
Asus TUF FX705DT-AU068T: AMD Ryzen 5 3550H, 17.30", 2.7 kg
Critique » Courte critique du PC portable de jeu Asus TUF Gaming FX705DT (Ryzen 5 3550H, GTX 1650, FHD, SSD)
Acer Aspire Nitro 5 AN515-54-53Z2: Intel Core i5-9300H, 15.60", 2.2 kg
Critique » Critique complète du PC portable de jeu Acer Nitro 5 (i5-9300H, GTX 1650, FHD)
Acer Nitro 5 AN515-57, GTX 1650: Intel Core i5-11400H, 15.60", 2.3 kg
Autres tests » Acer Nitro 5 AN515-57, GTX 1650
Lenovo IdeaPad 5 Pro 16ACH6-82L500VKMH: AMD Ryzen 7 5800H, 16.00", 1.9 kg
Autres tests » Lenovo IdeaPad 5 Pro 16ACH6-82L500VKMH
Acer Aspire 7 A715-76G: Intel Core i5-12450H, 15.60", 2.1 kg
Autres tests » Acer Aspire 7 A715-76G
HP Victus 15-fa0031dx: Intel Core i5-12450H, 15.60", 2.3 kg
Autres tests » HP Victus 15-fa0031dx
Asus TUF Gaming F15 FX506LHB-HN324: Intel Core i5-10300H, 15.60", 2.3 kg
Autres tests » Asus TUF Gaming F15 FX506LHB-HN324
HP Victus 16-d0019ns: Intel Core i5-11400H, 16.10", 2.5 kg
Autres tests » HP Victus 16-d0019ns
HP Victus 16-e0085ns: AMD Ryzen 5 5600H, 16.10", 2.5 kg
Autres tests » HP Victus 16-e0085ns
HP Victus 15-fb0152ng: AMD Ryzen 5 5600H, 16.00", 2.3 kg
Autres tests » HP Victus 15-fb0152ng
MSI GF63 Thin 11SC: Intel Core i5-11400H, 15.60", 1.9 kg
Autres tests » MSI GF63 Thin 11SC
Lenovo IdeaPad Gaming 3 15IHU6-82K1019DSP: Intel Core i5-11320H, 15.60", 2.3 kg
Autres tests » Lenovo IdeaPad Gaming 3 15IHU6-82K1019DSP
HP Victus 15-fa0038nf: Intel Core i5-12450H, 15.60", 2.3 kg
Autres tests » HP Victus 15-fa0038nf
Lenovo IdeaPad Gaming 3 15ACH6-82K201SRSP: AMD Ryzen 5 5600H, 15.60", 2.3 kg
Autres tests » Lenovo IdeaPad Gaming 3 15ACH6-82K201SRSP
MSI Prestige 14 A12SC-086CA: Intel Core i7-1280P, 14.00", 1.6 kg
Autres tests » MSI Prestige 14 A12SC-086CA
HP Victus 15t-fa000: Intel Core i5-12450H, 15.60", 2.3 kg
Autres tests » HP Victus 15t-fa000
Lenovo IdeaPad Gaming 3 15ACH6-82K201HEMH: AMD Ryzen 5 5600H, 15.60", 2.3 kg
Autres tests » Lenovo IdeaPad Gaming 3 15ACH6-82K201HEMH
Asus TUF Gaming F15 FX506LH-AS51: Intel Core i5-10300H, 15.60", 2.3 kg
Autres tests » Asus TUF Gaming F15 FX506LH-AS51
Acer Nitro 5 AN515-55-72P7: Intel Core i7-10750H, 15.60", 2.5 kg
Autres tests » Acer Nitro 5 AN515-55-72P7
Lenovo IdeaPad 5 Pro 16ACH: AMD Ryzen 7 5800H, 16.00", 2 kg
Autres tests » Lenovo IdeaPad 5 Pro 16ACH
Acer Nitro 5 AN515-56-54DF: Intel Core i5-11300H, 15.60", 2.3 kg
Autres tests » Acer Nitro 5 AN515-56-54DF
Acer Nitro 5 AN515-56-51V8: Intel Core i5-11300H, 15.60", 2.3 kg
Autres tests » Acer Nitro 5 AN515-56-51V8
HP Victus 16-e0040ns: AMD Ryzen 5 5600H, 16.10", 2.5 kg
Autres tests » HP Victus 16-e0040ns
Lenovo IdeaPad Gaming 3 15ACH6-82K201DHMH: AMD Ryzen 5 5600H, 15.60", 2.3 kg
Autres tests » Lenovo IdeaPad Gaming 3 15ACH6-82K201DHMH
Lenovo ThinkBook 15p G2 ITH-21B1001LUS: Intel Core i7-11800H, 15.60", 1.9 kg
Autres tests » Lenovo ThinkBook 15p G2 ITH-21B1001LUS
HP Victus 16-e0010ns: AMD Ryzen 5 5600H, 16.10", 2.5 kg
Autres tests » HP Victus 16-e0010ns
Lenovo IdeaPad Gaming 3 15ACH6-82K200UTUS: AMD Ryzen 5 5600H, 15.60", 2.3 kg
Autres tests » Lenovo IdeaPad Gaming 3 15ACH6-82K200UTUS
Dell G15 5510-8R03T: Intel Core i5-10200H, 15.60", 2.7 kg
Autres tests » Dell G15 5510-8R03T
Asus Vivobook Pro 14 K3400, i5-11300H GTX 1650: Intel Core i5-11300H, 14.00", 1.4 kg
Autres tests » Asus Vivobook Pro 14 K3400, i5-11300H GTX 1650
HP Pavilion Gaming 15-ec2004ns: AMD Ryzen 7 5800H, 15.60", 2 kg
Autres tests » HP Pavilion Gaming 15-ec2004ns
HP Pavilion Gaming 15-ec2047AX: AMD Ryzen 5 5600H, 15.60", 2 kg
Autres tests » HP Pavilion Gaming 15-ec2047AX
HP Pavilion Gaming 15-ec2005ns: AMD Ryzen 5 5600H, 15.60", 2 kg
Autres tests » HP Pavilion Gaming 15-ec2005ns
Asus ROG Strix G513IC-HN004: AMD Ryzen 7 4800H, 15.60", 2.3 kg
Autres tests » Asus ROG Strix G513IC-HN004
MSI GF75 Thin 10SCXR: Intel Core i5-10300H, 17.30", 2.2 kg
Autres tests » MSI GF75 Thin 10SCXR
HP Pavilion Gaming 15-ec2002ns: AMD Ryzen 5 5600H, 15.60", 2 kg
Autres tests » HP Pavilion Gaming 15-ec2002ns
Acer Aspire 7 A715-42G-R1DD: AMD Ryzen 5 5500U, 15.60", 2.2 kg
Autres tests » Acer Aspire 7 A715-42G-R1DD
Lenovo IdeaPad Gaming 3 15ACH6-82K20015US: AMD Ryzen 5 5600H, 15.60", 2.3 kg
Autres tests » Lenovo IdeaPad Gaming 3 15ACH6-82K20015US
HP Pavilion Gaming 15-ec2009ns: AMD Ryzen 5 5600H, 15.60", 2 kg
Autres tests » HP Pavilion Gaming 15-ec2009ns
Acer Swift X SFX14-41G-R9KC: AMD Ryzen 5 5500U, 14.00", 1.5 kg
Autres tests » Acer Swift X SFX14-41G-R9KC
Lenovo IdeaPad Gaming 3 15IMH05-81Y400YFSP: Intel Core i7-10750H, 15.60", 2.2 kg
Autres tests » Lenovo IdeaPad Gaming 3 15IMH05-81Y400YFSP
HP Victus 16-e0004ns: AMD Ryzen 5 5600H, 16.10", 2.5 kg
Autres tests » HP Victus 16-e0004ns
HP Pavilion Gaming 15-ec2007ns: AMD Ryzen 5 5600H, 15.60", 2 kg
Autres tests » HP Pavilion Gaming 15-ec2007ns
Acer Nitro 5 AN515-55-56F5: Intel Core i5-10300H, 15.60", 2.3 kg
Autres tests » Acer Nitro 5 AN515-55-56F5
Acer Nitro 5 AN515-55-72GW: Intel Core i7-10750H, 15.60", 2.3 kg
Autres tests » Acer Nitro 5 AN515-55-72GW
HP Pavilion Gaming 15-ec2008ns: AMD Ryzen 5 5600H, 15.60", 2 kg
Autres tests » HP Pavilion Gaming 15-ec2008ns
Lenovo IdeaPad Gaming 3 15ARH05-82EY00RDSP: AMD Ryzen 5 4600H, 15.60", 2.2 kg
Autres tests » Lenovo IdeaPad Gaming 3 15ARH05-82EY00RDSP
Asus TUF Gaming F15 FX506LH-HN129: Intel Core i7-10875H, 15.60", 2.3 kg
Autres tests » Asus TUF Gaming F15 FX506LH-HN129
HP Pavilion Gaming 15z-ec200: AMD Ryzen 5 5600H, 15.60", 2.3 kg
Autres tests » HP Pavilion Gaming 15z-ec200
HP Pavilion Gaming 15-ec2025ns: AMD Ryzen 7 5800H, 15.60", 2.3 kg
Autres tests » HP Pavilion Gaming 15-ec2025ns
Asus ROG Strix G15 G513IH-HN008: AMD Ryzen 7 4800H, 15.60", 2.1 kg
Autres tests » Asus ROG Strix G15 G513IH-HN008
Lenovo Legion 5 17ACH6-82K0000RMH: AMD Ryzen 5 5600H, 17.30", 3 kg
Autres tests » Lenovo Legion 5 17ACH6-82K0000RMH
Lenovo IdeaPad Gaming 3 15ARH05-82EY00RESP: AMD Ryzen 7 4800H, 15.60", 2.2 kg
Autres tests » Lenovo IdeaPad Gaming 3 15ARH05-82EY00RESP
Asus TUF Gaming F15 FX506LH-HN042T: Intel Core i5-10300H, 15.60", 2.3 kg
Autres tests » Asus TUF Gaming F15 FX506LH-HN042T
Acer Swift X SFX14-41G-R2DS: AMD Ryzen 7 5700U, 14.00", 1.5 kg
Autres tests » Acer Swift X SFX14-41G-R2DS
Lenovo Ideapad L340-17IRH 81LL001YGE: Intel Core i5-9300H, 17.30", 2.5 kg
Autres tests » Lenovo Ideapad L340-17IRH 81LL001YGE
Lenovo Ideapad L340 17IRH-81LL003BMH: Intel Core i7-9750H, 17.30", 2.8 kg
Autres tests » Lenovo Ideapad L340 17IRH-81LL003BMH
HP Pavilion Gaming 15-ec2253ng: AMD Ryzen 5 5600H, 15.60", 2.3 kg
Autres tests » HP Pavilion Gaming 15-ec2253ng
Acer Aspire 7 A715-42G-R9LH: AMD Ryzen 7 5700U, 15.60", 2.2 kg
Autres tests » Acer Aspire 7 A715-42G-R9LH
HP Pavilion Gaming 15-ec1073dx: AMD Ryzen 5 4600H, 15.60", 2 kg
Autres tests » HP Pavilion Gaming 15-ec1073dx
Dell Vostro 15 7500-0323: Intel Core i7-10750H, 15.60", 1.9 kg
Autres tests » Dell Vostro 15 7500-0323
Medion Erazer Crawler E10: Intel Core i5-10300H, 15.60", 2.2 kg
Autres tests » Medion Erazer Crawler E10
Acer Nitro 5 AN515-56-75HR: Intel Core i7-11370H, 15.60", 2.3 kg
Autres tests » Acer Nitro 5 AN515-56-75HR
Asus ROG Flow X13 GV301QH-K5228T: AMD Ryzen 9 5980HS, 13.40", 1.3 kg
Autres tests » Asus ROG Flow X13 GV301QH-K5228T
Acer Nitro 5 AN515-56-58CQ: Intel Core i5-11300H, 15.60", 2.3 kg
Autres tests » Acer Nitro 5 AN515-56-58CQ
Asus TUF FX505DT-HN540: AMD Ryzen 7 3750H, 15.60", 2.2 kg
Autres tests » Asus TUF FX505DT-HN540
Asus ROG Flow X13 GV301QH-K5232T: AMD Ryzen 9 5980HS, 13.40", 1.3 kg
Autres tests » Asus ROG Flow X13 GV301QH-K5232T
Lenovo IdeaPad Gaming 3 15ARH05-82EY00CQSP: AMD Ryzen 7 4800H, 15.60", 2.2 kg
Autres tests » Lenovo IdeaPad Gaming 3 15ARH05-82EY00CQSP
Acer Nitro 5 AN515-43-R6BW: AMD Ryzen 5 3550H, 15.60", 2.3 kg
Autres tests » Acer Nitro 5 AN515-43-R6BW
Acer Aspire 7 A715-42G-R0XB: AMD Ryzen 5 5500U, 15.60", 2.2 kg
Autres tests » Acer Aspire 7 A715-42G-R0XB
Lenovo IdeaPad 3 15IMH05-81Y400DWMH: Intel Core i5-10300H, 15.60", 2.2 kg
Autres tests » Lenovo IdeaPad 3 15IMH05-81Y400DWMH
Acer Aspire Nitro 5 AN517-53-51FQ: Intel Core i5-11300H, 17.30", 2.7 kg
Autres tests » Acer Aspire Nitro 5 AN517-53-51FQ
LG Ultra 17U70N-J.AA78B: Intel Core i7-10510U, 17.30"
Autres tests » LG Ultra 17U70N-J.AA78B
Lenovo IdeaPad 3 15ARH05-82EY00CNSP: AMD Ryzen 7 4800H, 15.60", 2.2 kg
Autres tests » Lenovo IdeaPad 3 15ARH05-82EY00CNSP
HP Pavilion 15-ec1155nd: AMD Ryzen 5 4600H, 15.60", 2 kg
Autres tests » HP Pavilion 15-ec1155nd
Acer Nitro 5 AN515-44-R8QT: AMD Ryzen 5 4600H, 15.60", 2.4 kg
Autres tests » Acer Nitro 5 AN515-44-R8QT
Asus TUF Gaming F15 FX506LH-BQ116: Intel Core i7-10870H, 15.60", 2.3 kg
Autres tests » Asus TUF Gaming F15 FX506LH-BQ116
HP Gaming Pavilion 15-ec1005ns: AMD Ryzen 5 4600H, 15.60", 2 kg
Autres tests » HP Gaming Pavilion 15-ec1005ns
Lenovo IdeaPad 3 15ARH05-82EY00BSMH: AMD Ryzen 7 4800H, 15.60", 2.2 kg
Autres tests » Lenovo IdeaPad 3 15ARH05-82EY00BSMH
Lenovo Yoga Creator 7 15IMH05 82DS000VGE: Intel Core i7-10750H, 15.60", 1.8 kg
Autres tests » Lenovo Yoga Creator 7 15IMH05-82DS000VGE
Asus TUF Gaming A15 FA506IH-AS53: AMD Ryzen 5 4600H, 15.60", 2.3 kg
Autres tests » Asus TUF Gaming A15 FA506IH-AS53
Acer ConceptD 3 CN314-72G-744X: Intel Core i7-10750H, 14.00", 1.5 kg
Autres tests » Acer ConceptD 3 CN314-72G-744X
Lenovo Ideapad Creator 5 15IMH05-82D4003UCK: Intel Core i5-10300H, 15.60", 2.2 kg
Autres tests » Lenovo Ideapad Creator 5 15IMH05-82D4003UCK
HP Pavilion Gaming 16-a0031ns: Intel Core i5-10300H, 16.10", 2.4 kg
Autres tests » HP Pavilion Gaming 16-a0031ns
Acer Aspire Nitro 5 AN515-44-R329: AMD Ryzen 5 4600H, 15.60", 2.4 kg
Autres tests » Acer Aspire Nitro 5 AN515-44-R329
Acer Aspire 7 A715-75G-59MG: Intel Core i5-10300H, 15.60", 2.2 kg
Autres tests » Acer Aspire 7 A715-75G-59MG
Lenovo Legion 5 17IMH05: Intel Core i5-10300H, 17.30", 2.9 kg
Autres tests » Lenovo Legion 5 17IMH05
Asus TUF Gaming A15 FA506IH-BQ027T: AMD Ryzen 7 4800H, 15.60", 2.3 kg
Autres tests » Asus TUF Gaming A15 FA506IH-BQ027T
Acer Nitro 5 AN515-44-R99Q: AMD Ryzen 5 4600H, 15.60", 2.4 kg
Autres tests » Acer Nitro 5 AN515-44-R99Q
Lenovo Yoga Slim 7 15IMH05-82AB003CUK: Intel Core i7-10750H, 15.60", 1.8 kg
Autres tests » Lenovo Yoga Slim 7 15IMH05-82AB003CUK
LG Ultra 17U70N-R.AAS8U1: Intel Core i7-10510U, 17.00", 2 kg
Autres tests » LG Ultra 17U70N-R.AAS8U1
HP Pavilion Gaming 15-dk1041tx: Intel Core i7-10750H, 15.60", 2.3 kg
Autres tests » HP Pavilion Gaming 15-dk1041tx
HP Pavilion Gaming 16-a0006ns: Intel Core i5-10300H, 15.60", 2.4 kg
Autres tests » HP Pavilion Gaming 16-a0006ns
Lenovo Legion 5 15IMH05-82AU00B1SP: Intel Core i7-10750H, 15.60", 2.3 kg
Autres tests » Lenovo Legion 5 15IMH05-82AU00B1SP
Asus TUF Gaming F15 FX506LH-BQ030: Intel Core i7-10750H, 15.60", 2.3 kg
Autres tests » Asus TUF FX506LH-BQ030
Asus TUF Gaming F15 FX506LH-BQ034: Intel Core i5-10300H, 15.60", 2.3 kg
Autres tests » Asus TUF FX506LH-BQ034
Lenovo Legion Y7000SE: Intel Core i5-9300HF, 15.60"
Autres tests » Lenovo Legion Y7000SE
HP Pavilion Gaming 16-a0022ns: Intel Core i5-10300H, 16.10", 2.4 kg
Autres tests » HP Pavilion Gaming 16-a0022ns
Asus TUF FX505DT-BQ613T: AMD Ryzen 7 3750H, 15.60", 2.2 kg
Autres tests » Asus TUF FX505DT-BQ613T
Lenovo Yoga Slim 7 15IMH05-82AB002WMH: Intel Core i5-10300H, 15.60", 1.8 kg
Autres tests » Lenovo Yoga Slim 7 15IMH05-82AB002WMH
Acer Nitro 5 AN515-44-R4P7: AMD Ryzen 7 4800H, 15.60", 2.4 kg
Autres tests » Acer Nitro 5 AN515-44-R4P7
MSI GF63 Thin 10SCXR-042XES: Intel Core i7-10750H, 15.60", 1.9 kg
Autres tests » MSI GF63 Thin 10SCXR-042XES
Lenovo Legion 5 15ARH05-82B500D3SP: AMD Ryzen 7 4800H, 15.60", 2.3 kg
Autres tests » Lenovo Legion 5 15ARH05-82B500D3SP
Asus TUF FX505GT-BQ108: Intel Core i5-9300H, 15.60", 2.2 kg
Autres tests » Asus TUF FX505GT-BQ108
HP Pavilion Gaming 16-a0000ns: Intel Core i5-10300H, 16.10", 2.4 kg
Autres tests » HP Pavilion Gaming 16-a0000ns
HP Pavilion Gaming 15-ec1009ns: AMD Ryzen 5 4600H, 15.60", 2 kg
Autres tests » HP Pavilion Gaming 15-ec1009ns
Asus F571GT-AL311T: Intel Core i7-9750H, 15.60", 1.8 kg
Autres tests » Asus F571GT-AL311T
Acer Nitro 5 AN515-44-R55M: AMD Ryzen 5 4600H, 15.60", 2.4 kg
Autres tests » Acer Nitro 5 AN515-44-R55M
Lenovo IdeaPad S540-15IWL-81SW002AGE: Intel Core i7-8565U, 15.60", 1.8 kg
Autres tests » Lenovo IdeaPad S540-15IWL-81SW002AGE
HP Gaming Pavilion 15-dk0025ns: Intel Core i5-9300H, 15.60", 2.2 kg
Autres tests » HP Gaming Pavilion 15-dk0025ns
Acer Nitro 5 AN515-55-598S: Intel Core i5-10300H, 15.60", 2.3 kg
Autres tests » Acer Nitro 5 AN515-55-598S
MSI GF63 Thin 10SCXR-405XES: Intel Core i7-10750H, 15.60", 1.9 kg
Autres tests » MSI GF63 Thin 10SCXR-405XES
Dell G3 15 3500-3KJ99: Intel Core i5-10300H, 15.60", 2.6 kg
Autres tests » Dell G3 15 3500-3KJ99
Lenovo IdeaPad Gaming 3i 15IMH05: Intel Core i5-10300H, 15.60", 2.2 kg
Autres tests » Lenovo IdeaPad Gaming 3i 15IMH05
Acer Nitro 5 AN515-55-7075: Intel Core i7-10750H, 15.60", 2.3 kg
Autres tests » Acer Nitro 5 AN515-55-7075
Acer Aspire 7 A715-41G-R8MJ: AMD Ryzen 5 3550H, 15.60", 2.2 kg
Autres tests » Acer Aspire 7 A715-41G-R8MJ
HP Omen 15-dc1049ns: Intel Core i5-9300H, 15.60", 2.3 kg
Autres tests » HP Omen 15-dc1049ns
Lenovo Legion Y540-15IRH-PG0: Intel Core i7-9750H, 15.60", 1.3 kg
Autres tests » Lenovo Legion Y540-15IRH-PG0
Lenovo Legion 5 15IMH05-82AU004YVN: Intel Core i7-10750H, 15.60", 2.4 kg
Autres tests » Lenovo Legion 5 15IMH05-82AU004YVN
Acer Nitro 5 AN517-52-7995: Intel Core i7-10750H, 17.30", 2.2 kg
Autres tests » Acer Nitro 5 AN517-52-7995
Lenovo IdeaPad Gaming 3i 15-81Y400NESB: Intel Core i7-10750H, 15.60", 2.2 kg
Autres tests » Lenovo IdeaPad Gaming 3i 15-81Y400NESB
Acer Aspire 7 A715-41G-R5LR: AMD Ryzen 5 3550H, 15.60", 2.4 kg
Autres tests » Acer Aspire 7 A715-41G-R5LR
HP Pavilion Gaming 15-ec1011ns: AMD Ryzen 5 4600H, 15.60", 2 kg
Autres tests » HP Pavilion Gaming 15-ec1011ns
Asus TUF FX505DT-BQ600: AMD Ryzen 7 3750H, 15.60", 2.2 kg
Autres tests » Asus TUF FX505DT-BQ600
HP Gaming Pavilion 15-dk0031ns: Intel Core i7-9750H, 15.60", 2.3 kg
Autres tests » HP Gaming Pavilion 15-dk0031ns
Asus X571GT-BQ597: Intel Core i5-8300H, 15.60", 2 kg
Autres tests » Asus X571GT-BQ597
Lenovo Legion 5 15ARH05-82B500CFGE: AMD Ryzen 7 4800H, 15.60", 2.3 kg
Autres tests » Lenovo Legion 5 15ARH05-82B500CFGE
Asus TUF FX505DT-BQ208: AMD Ryzen 7 3750H, 15.60", 2.2 kg
Autres tests » Asus TUF FX505DT-BQ208
Acer Nitro 5 AN515-55-53YW: Intel Core i5-10300H, 15.60", 2.3 kg
Autres tests » Acer Nitro 5 AN515-55-53YW
Acer Aspire 7 A715-41G-R3J5: AMD Ryzen 7 3750H, 15.60", 2.4 kg
Autres tests » Acer Aspire 7 A715-41G-R3J5
Acer Aspire 7 A715-74G-77AW: Intel Core i7-9750H, 15.60", 2.4 kg
Autres tests » Acer Aspire 7 A715-74G-77AW
Asus ROG Strix G531GT-BQ165: Intel Core i7-9750H, 15.60", 2.4 kg
Autres tests » Asus ROG Strix G531GT-BQ165
MSI Prestige 14 A10SC-067XES: Intel Core i7-10710U, 14.00", 1.3 kg
Autres tests » MSI Prestige 14 A10SC-067XES
Acer ConceptD 3 CN315-71-76MR: Intel Core i7-9750H, 15.60", 2.4 kg
Autres tests » Acer ConceptD 3 CN315-71-76MR
Asus TUF FX505DT-BQ051: AMD Ryzen 5 3550H, 15.60", 2.2 kg
Autres tests » Asus TUF FX505DT-BQ051
HP Gaming Pavilion 15-dk0026ns: Intel Core i7-9750H, 15.60", 2.2 kg
Autres tests » HP Gaming Pavilion 15-dk0026ns
Acer Nitro 5 AN515-43-R84P: AMD Ryzen 5 3550H, 15.60"
Autres tests » Acer Nitro 5 AN515-43-R84P
HP Pavilion Gaming 15-ec0014nl: AMD Ryzen 7 3750H, 15.60", 2.3 kg
Autres tests » HP Pavilion Gaming 15-ec0014nl
Asus TUF FX505GT-BQ025: Intel Core i5-9300H, 15.60", 2.2 kg
Autres tests » Asus TUF FX505GT-BQ025
MSI Prestige 14 A10SC-096NE: Intel Core i7-10710U, 14.00", 1.3 kg
Autres tests » MSI Prestige 14 A10SC-096NE
Acer Nitro 5 AN517-51-55ML: Intel Core i5-9300H, 17.30", 2.7 kg
Autres tests » Acer Nitro 5 AN517-51-55ML
Lenovo Ideapad L340-15IRH-81LK00CDSP: Intel Core i7-9750H, 15.60", 2.2 kg
Autres tests » Lenovo Ideapad L340-15IRH-81LK00CDSP
Acer Aspire Nitro 5 AN515-54-7793: Intel Core i7-9750H, 15.60", 2.5 kg
Autres tests » Acer Aspire Nitro 5 AN515-54-7793
HP Pavilion Gaming 15-dk0002ns: Intel Core i5-9300H, 15.60", 2.3 kg
Autres tests » HP Pavilion Gaming 15-dk0002ns
Asus TUF FX505GT-BQ028: Intel Core i7-9750H, 15.60", 2.2 kg
Autres tests » Asus TUF FX505GT-BQ028
MSI Prestige 15 A10SC-007ES: Intel Core i7-10710U, 15.60", 1.7 kg
Autres tests » MSI Prestige 15 A10SC-007ES
Asus TUF FX505DT-BQ121: AMD Ryzen 7 3750H, 15.60", 2.2 kg
Autres tests » Asus TUF FX505DT-BQ121
MSI GF75 Thin 9SC-277XES: Intel Core i7-9750H, 17.30", 2.2 kg
Autres tests » MSI GF75 Thin 9SC-277XES
HP Pavilion Gaming 15-ec0003ns: AMD Ryzen 7 3750H, 15.60", 2.3 kg
Autres tests » HP Pavilion Gaming 15-ec0003ns
MSI Prestige 14 A10SC-012ES: Intel Core i7-10710U, 14.00", 1.3 kg
Autres tests » MSI Prestige 14 A10SC-012ES
HP Omen 15-dc1010nr: Intel Core i7-9750H, 15.60", 2.6 kg
Autres tests » HP Omen 15-dc1010nr
Acer Aspire Nitro 5 AN517-51-76MG: Intel Core i7-9750H, 15.60", 2.5 kg
Autres tests » Acer Aspire Nitro 5 AN517-51-76MG
Samsung Odyssey 2 NP850XBD-XG1BR: Intel Core i5-9300H, 15.60", 2.4 kg
Autres tests » Samsung Odyssey 2 NP850XBD-XG1BR
HP Pavilion 15-BC520NS: Intel Core i7-9750H, 15.60", 2.2 kg
Autres tests » HP Pavilion 15-BC520NS
Acer Aspire Nitro 7 AN715-51-76XG: Intel Core i7-8750H, 15.60", 2.5 kg
Autres tests » Acer Aspire Nitro 7 AN715-51-76XG
Acer Predator Triton 300 PT315-51-58BG: Intel Core i5-9300H, 15.60", 2.5 kg
Autres tests » Acer Predator Triton 300 PT315-51-58BG
Lenovo Legion Y540-15IRH-81SY00A2SP: Intel Core i5-9300H, 15.60", 2.3 kg
Autres tests » Lenovo Legion Y540-15IRH-81SY00A2SP
Asus TUF FX505GT-BQ024: Intel Core i7-9750H, 15.60", 2.2 kg
Autres tests » Asus TUF FX505GT-BQ024
HP Pavilion 15-bc521ns: Intel Core i5-9300H, 15.60", 2.1 kg
Autres tests » HP Pavilion 15-bc521ns
Dell G3 15 3590-GN3R591AU: Intel Core i7-9750H, 15.60", 2.7 kg
Autres tests » Dell G3 15 3590-GN3R591AU
Acer Nitro 5 AN515-54-749V: Intel Core i7-9750H, 15.60", 2.5 kg
Autres tests » Acer Nitro 5 AN515-54-749V
Dell G3 3590: Intel Core i5-9300H, 15.60", 2.5 kg
Autres tests » Dell G3 3590
Acer Predator Triton 300 PT315-51-7815: Intel Core i7-9750H, 15.60", 2.3 kg
Autres tests » Acer Predator Triton 300 PT315-51-7815
HP Gaming Pavilion 15-dk0046nr: Intel Core i7-9750H, 15.60", 2.3 kg
Autres tests » HP Gaming Pavilion 15-dk0046nr
MSI GL65 9SC-004: Intel Core i5-9300H, 15.60", 2.3 kg
Autres tests » MSI GL65 9SC-004
MSI GF63 9SC-621: Intel Core i5-9300H, 15.60", 1.9 kg
Autres tests » MSI GF63 9SC-621
Lenovo IdeaPad L340-15IRH 81LK00BMGE: Intel Core i5-9300H, 15.60", 2.1 kg
Autres tests » Lenovo IdeaPad L340-15IRH 81LK00BMGE
Acer Aspire 7 A715-74G-743J: Intel Core i7-9750H, 15.60", 2.4 kg
Autres tests » Acer Aspire 7 A715-74G-743J
MSI GF75 Thin 9SC-061XES: Intel Core i7-9750H, 17.30", 2.2 kg
Autres tests » MSI GF75 Thin 9SC-061XES
Acer Nitro 5 AN517-51-77B8: Intel Core i7-9750H, 17.30", 2.7 kg
Autres tests » Acer Nitro 5 AN517-51-77B8
HP Gaming Pavilion 17-cd0222ng: Intel Core i5-9300H, 17.30", 2.8 kg
Autres tests » HP Gaming Pavilion 17-cd0222ng
Asus ROG Strix G531GT-BQ012 : Intel Core i7-9750H, 15.60", 2.4 kg
Autres tests » Asus ROG Strix G531GT-BQ012
Acer Aspire 7 A715-74G-53YM: Intel Core i5-9300H, 15.60", 2.4 kg
Autres tests » Acer Aspire 7 A715-74G-53YM
Asus Strix G G531GT-BI7N6: Intel Core i7-9750H, 15.60", 2.4 kg
Autres tests » Asus Strix G G531GT-BI7N6
Acer Nitro 5 AN517-51-56YW: Intel Core i5-9300H, 17.30", 2.7 kg
Autres tests » Acer Nitro 5 AN517-51-56YW
Acer Predator Triton 300-15: Intel Core i7-9750H, 15.60", 2.3 kg
Autres tests » Acer Predator Triton 300-15
Lenovo Legion Y540-15IRH-81SY00A6SP: Intel Core i7-9750H, 15.60", 2.3 kg
Autres tests » Lenovo Legion Y540-15IRH-81SY00A6SP
Dell XPS 15 7590-K6XWV: Intel Core i7-9750H, 15.60", 2 kg
Autres tests » Dell XPS 15 7590-K6XWV
Acer Nitro 5 AN517-51-70U7: Intel Core i7-9750H, 17.30", 2.7 kg
Autres tests » Acer Nitro 5 AN517-51-70U7
Lenovo Ideapad L340-15IRH-81LK0093MB: Intel Core i7-9750H, 15.60", 2.2 kg
Autres tests » Lenovo Ideapad L340-15IRH-81LK0093MB
Dell G3 15 3590-cn35917: Intel Core i5-9300H, 15.60", 2.4 kg
Autres tests » Dell G3 15 3590-cn35917
HP Pavilion 15-dk0042tx: Intel Core i7-9750H, 15.60", 2.3 kg
Autres tests » HP Pavilion 15-dk0042tx
Lenovo Legion Y545-15-81T20005US: Intel Core i7-9750H, 15.60", 2.3 kg
Autres tests » Lenovo Legion Y545-15-81T20005US
Asus ROG Strix G531GT-BQ020: Intel Core i7-9750H, 15.60", 2.4 kg
Autres tests » Asus ROG Strix G531GT-BQ020
Acer Nitro 7 AN715-51-752B: Intel Core i7-9750H, 15.60", 2.7 kg
Autres tests » Acer Nitro 7 AN715-51-752B
Lenovo Legion Y540 15-IRH-81SY001KSB: Intel Core i7-9750H, 15.60", 2.3 kg
Autres tests » Lenovo Legion Y540 15-IRH-81SY001KSB
Acer Nitro 5 AN515-54-73KT: Intel Core i7-9750H, 15.60", 2.7 kg
Autres tests » Acer Nitro 5 AN515-54-73KT
Asus ROG Strix G531GT-BQ005: Intel Core i5-9300H, 15.60", 2.4 kg
Autres tests » Asus ROG Strix G531GT-BQ005
MSI PS63 Modern 8SC-054ES: Intel Core i7-8565U, 15.60", 1.6 kg
Autres tests » MSI PS63 Modern 8SC-054ES
Asus Strix G531GT-BI7N6: Intel Core i7-9750H, 15.60", 2.4 kg
Autres tests » Asus Strix G531GT-BI7N6
Asus TUF FX705DT-AU028T: AMD Ryzen 7 3750H, 17.30", 2.6 kg
Autres tests » Asus TUF FX705DT-AU028T
Dell G5 15 5590-PCNJJ: Intel Core i5-9300H, 15.60", 2.7 kg
Autres tests » Dell G5 15 5590-PCNJJ
Dell XPS 15 7590 9980HK GTX 1650: Intel Core i9-9980HK, 15.60", 2 kg
Autres tests » Dell XPS 15 7590 9980HK GTX 1650
Asus TUF FX505DT-EB73: AMD Ryzen 7 3750H, 15.60", 2.2 kg
Autres tests » Asus TUF FX505DT-EB73
Dell XPS 15 7590: Intel Core i9-9980HK, 15.60", 2 kg
Autres tests » Dell XPS 15 7590
Acer Aspire Nitro 5 AN515-54-72J1: Intel Core i7-9750H, 15.60", 2.3 kg
Autres tests » Acer Aspire Nitro 5 AN515-54-72J1
MSI GF63 Thin 9SC-047XES: Intel Core i7-9750H, 15.60", 1.9 kg
Autres tests » MSI GF63 Thin 9SC-047XES
Lenovo Ideapad L340-17IRH-81LL001YGE: Intel Core i5-9300H, 17.30", 2.5 kg
Autres tests » Lenovo Ideapad L340-17IRH-81LL001YGE
Lenovo Ideapad L340-15IRH-81LK0001UK: Intel Core i5-9300H, 15.60", 2.2 kg
Autres tests » Lenovo Ideapad L340-15IRH-81LK0001UK
Acer Aspire Nitro 5 AN515-54-53Z2: Intel Core i5-9300H, 15.60", 2.2 kg
Autres tests » Acer Aspire Nitro 5 AN515-54-53Z2
Acer Aspire Nitro 7 AN715-51: Intel Core i7-8750H, 15.60", 2.2 kg
Autres tests » Acer Aspire Nitro 7 AN715-51
Lenovo IdeaPad Gaming 3i 15IMH05: Intel Core i5-10300H, 15.60", 2.2 kg
» Le Lenovo IdeaPad Gaming 3i 15IMH05 exploite pleinement son CPU et son GPU