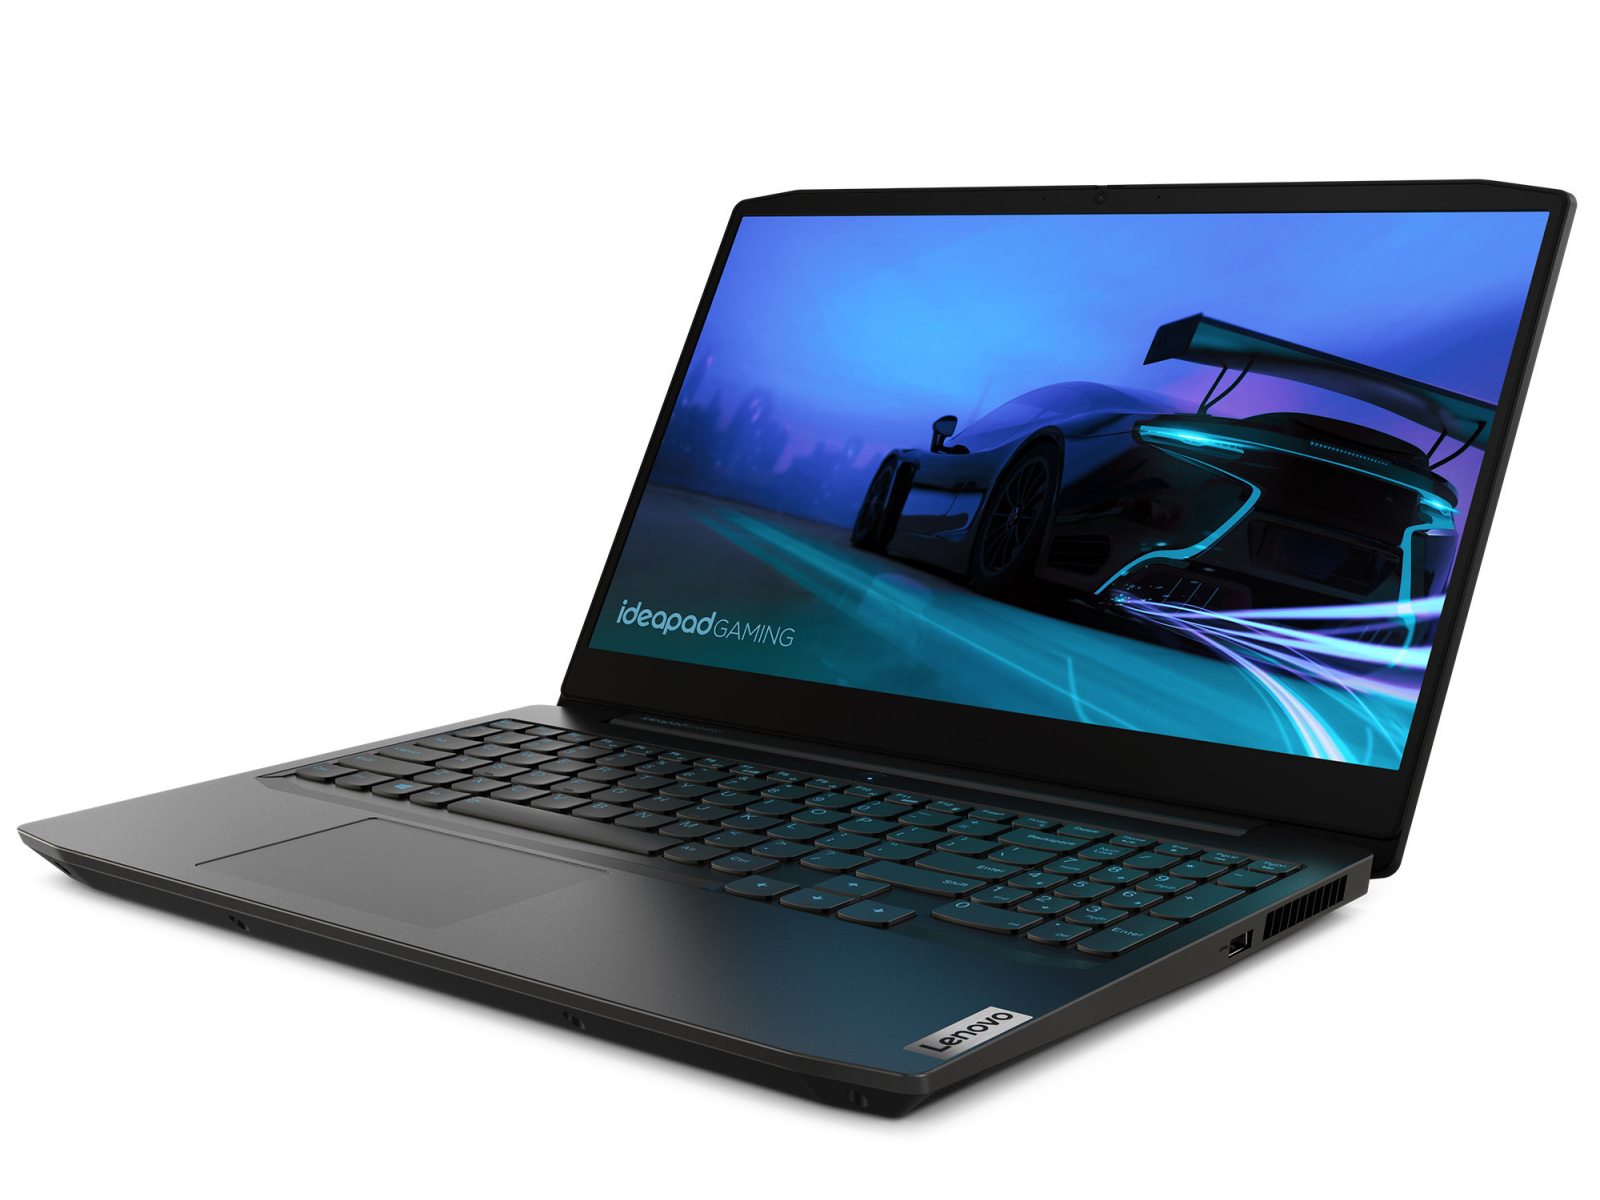
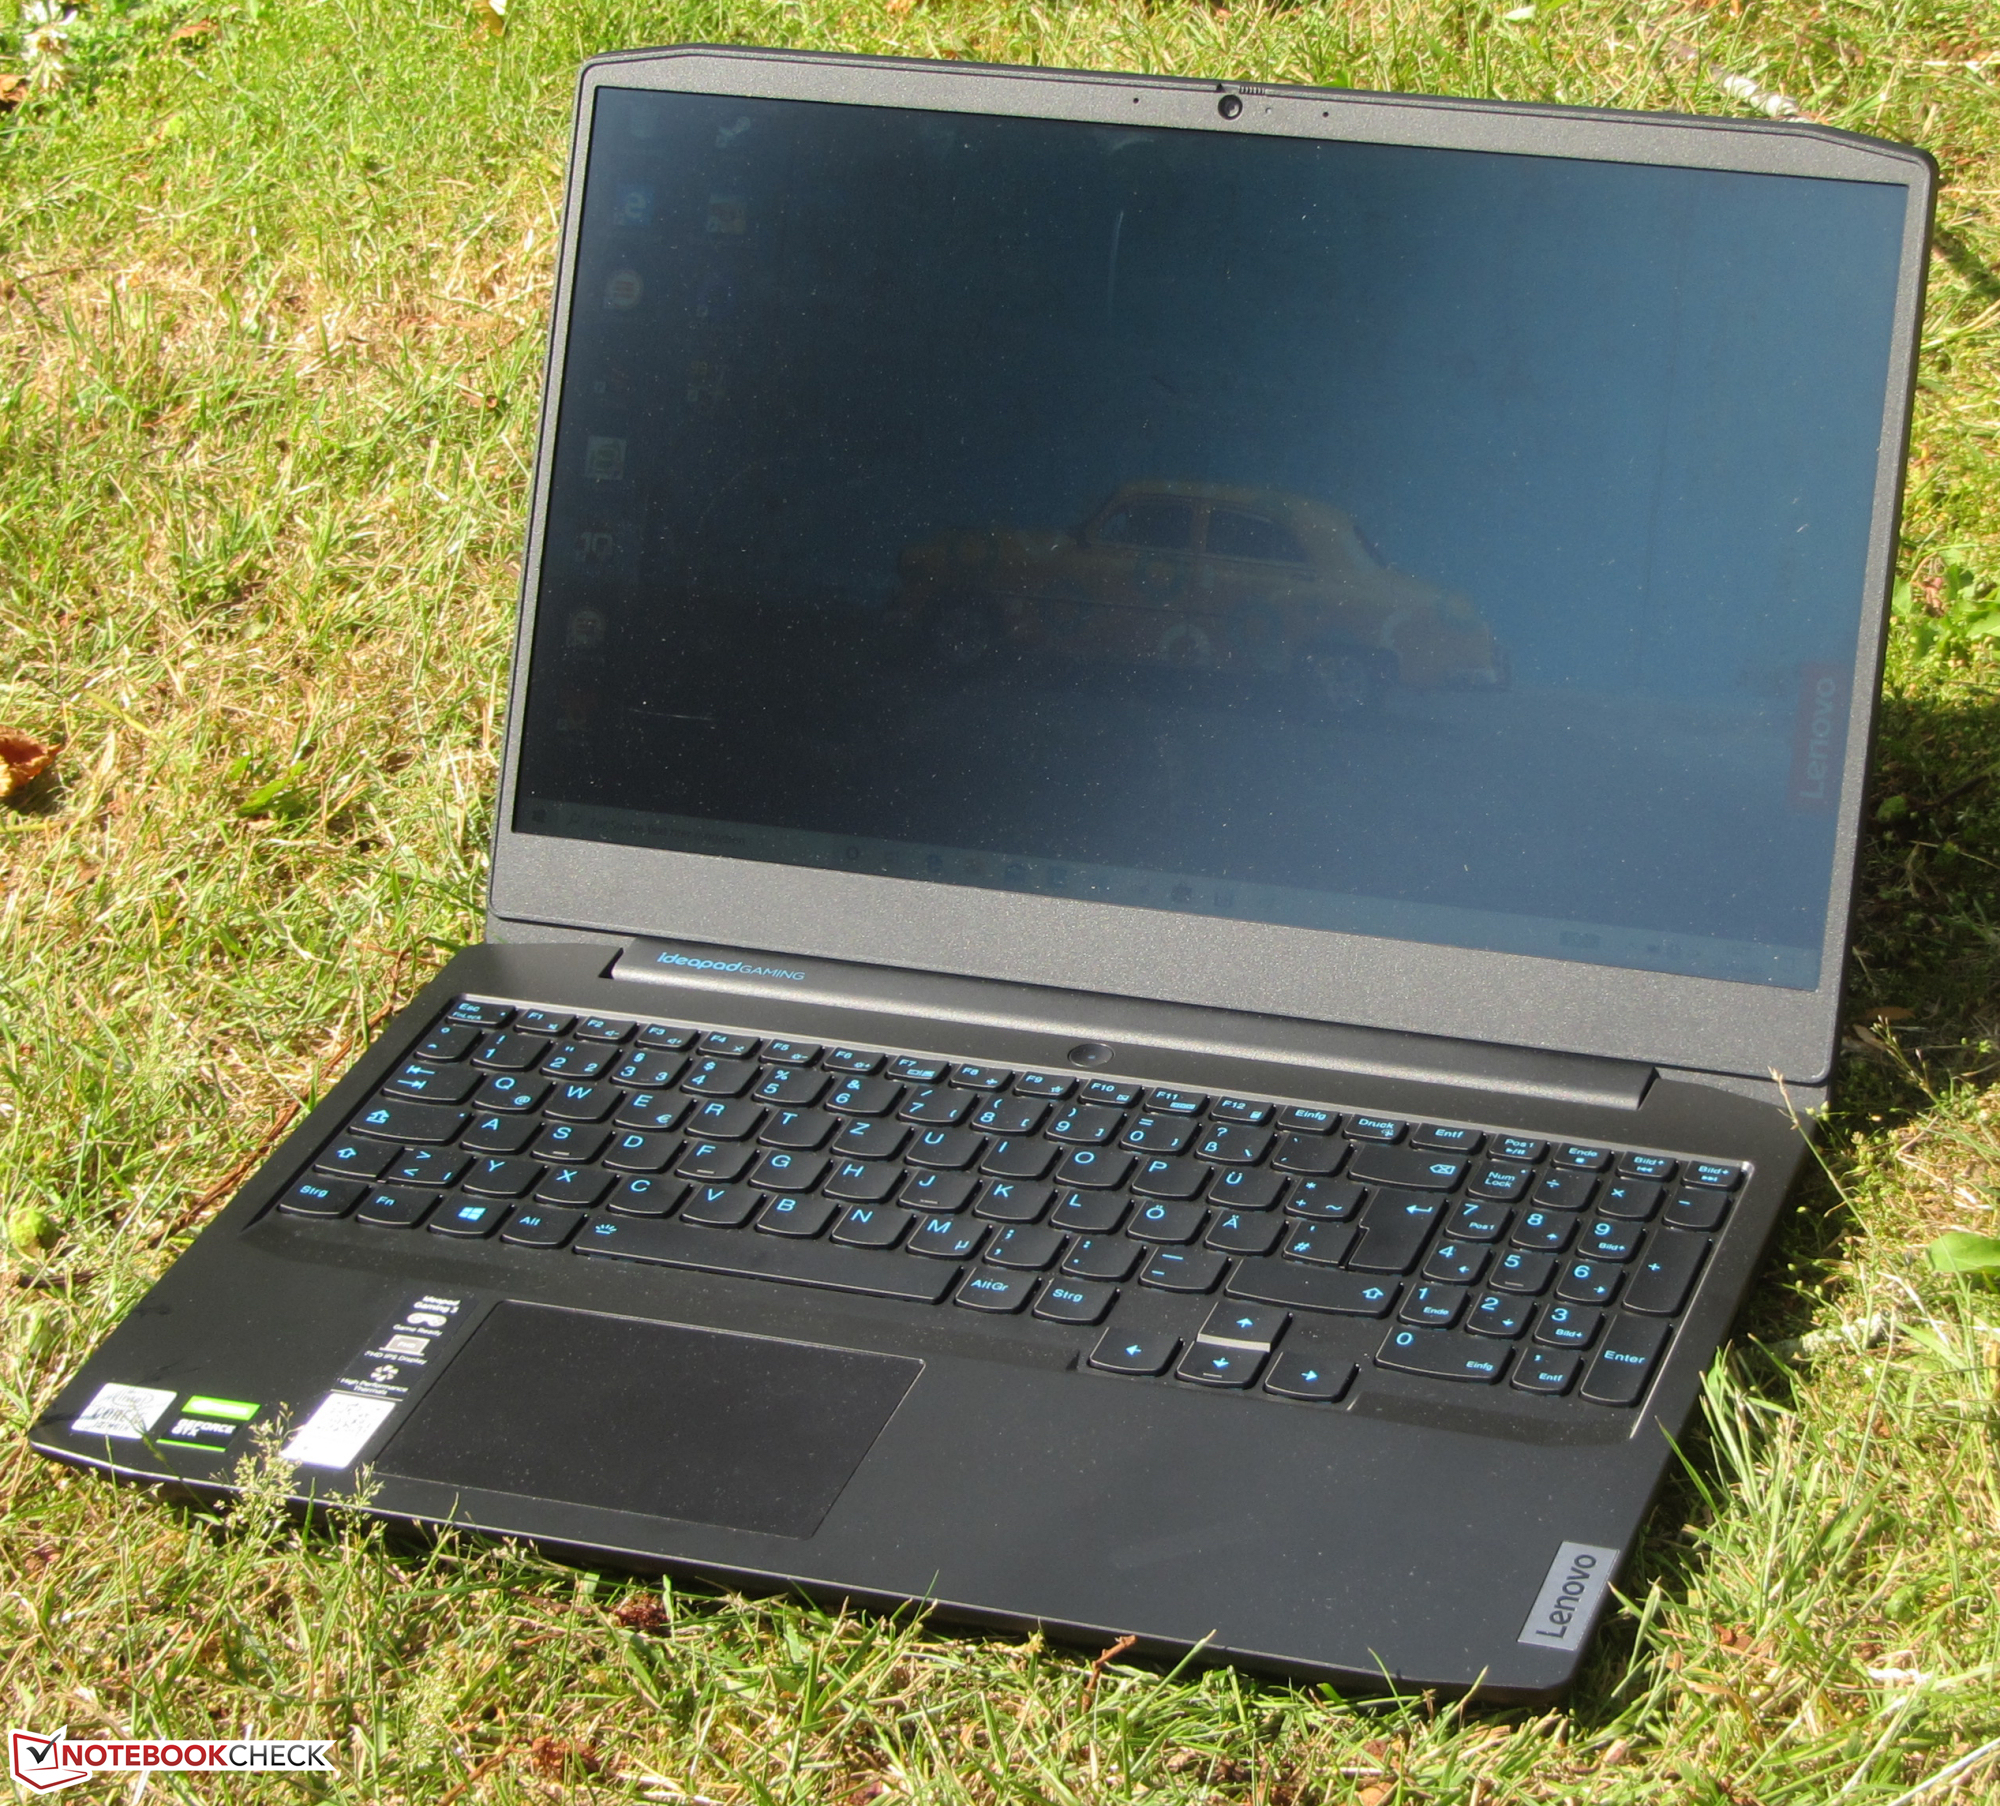
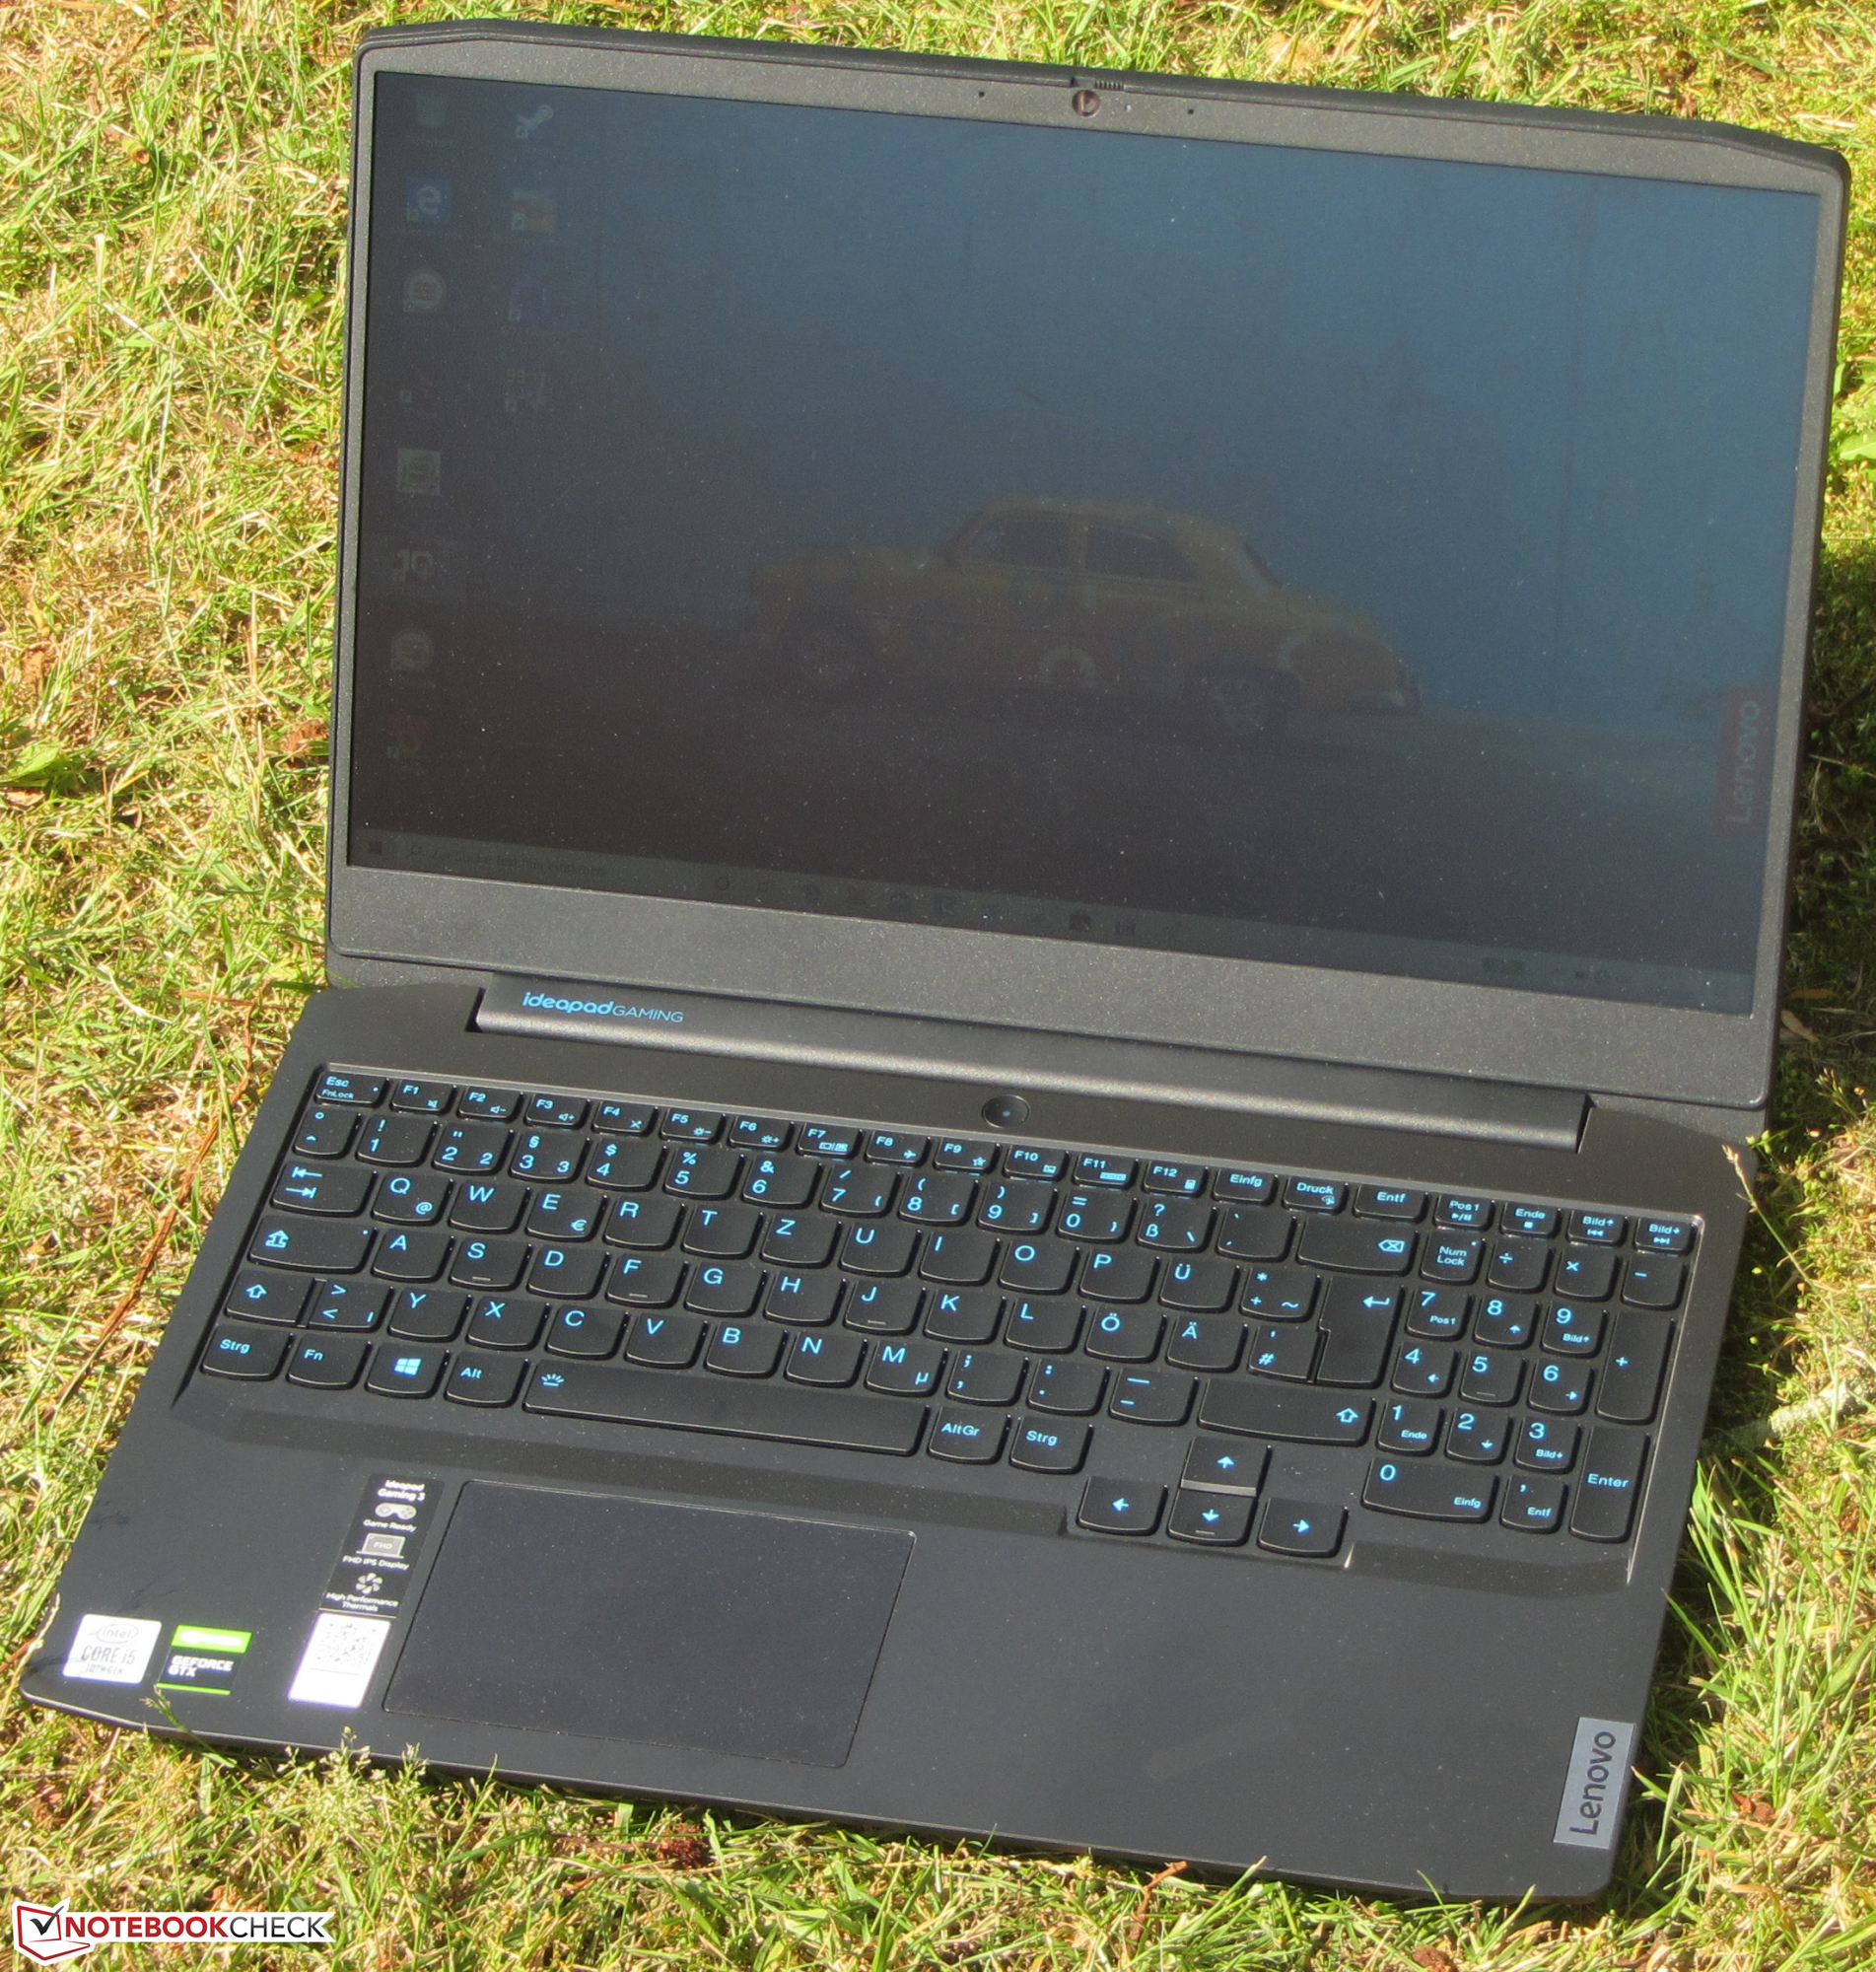
Test du Lenovo IdeaPad Gaming 3i 15IMH05 (i5-10300H, GTX 1650, FHD, 120 Hz) : Core i5 à plein régime
Note | Date | Modèle | Poids | Épaisseur | Taille | Résolution | Prix |
|---|---|---|---|---|---|---|---|
| 78.4 % v7 (old) | 08/20 | Lenovo IdeaPad Gaming 3i 15IMH05 i5-10300H, GeForce GTX 1650 Mobile | 2.2 kg | 24.9 mm | 15.60" | 1920x1080 | |
| 80.4 % v6 (old) | 08/19 | Asus TUF FX505DT-EB73 R7 3750H, GeForce GTX 1650 Mobile | 2.2 kg | 26.8 mm | 15.60" | 1920x1080 | |
| 79.3 % v7 (old) | 10/19 | Dell G3 3590 i5-9300H, GeForce GTX 1650 Mobile | 2.5 kg | 21.6 mm | 15.60" | 1920x1080 | |
| 77.6 % v7 (old) | 01/20 | MSI GF63 Thin 9SC i5-9300H, GeForce GTX 1650 Max-Q | 1.8 kg | 22 mm | 15.60" | 1920x1080 | |
| 75.4 % v7 (old) | 04/20 | HP Pavilion Gaming 15-ec0002ng R5 3550H, GeForce GTX 1050 Mobile | 2.3 kg | 23.5 mm | 15.60" | 1920x1080 | |
| 78.8 % v7 (old) | 02/20 | MSI Alpha 15 A3DDK-034 R7 3750H, Radeon RX 5500M | 2.3 kg | 27.5 mm | 15.60" | 1920x1080 | |
| 79.8 % v7 (old) | 08/20 | Acer Nitro 5 AN515-44-R5FT R5 4600H, GeForce GTX 1650 Ti Mobile | 2.2 kg | 24 mm | 15.60" | 1920x1080 |


| |||||||||||||||||||||||||
Homogénéité de la luminosité: 70 %
Valeur mesurée au centre, sur batterie: 300 cd/m²
Contraste: 753:1 (Valeurs des noirs: 0.405 cd/m²)
ΔE ColorChecker Calman: 6.01 | ∀{0.5-29.43 Ø4.72}
calibrated: 5.12
ΔE Greyscale Calman: 3.23 | ∀{0.09-98 Ø4.97}
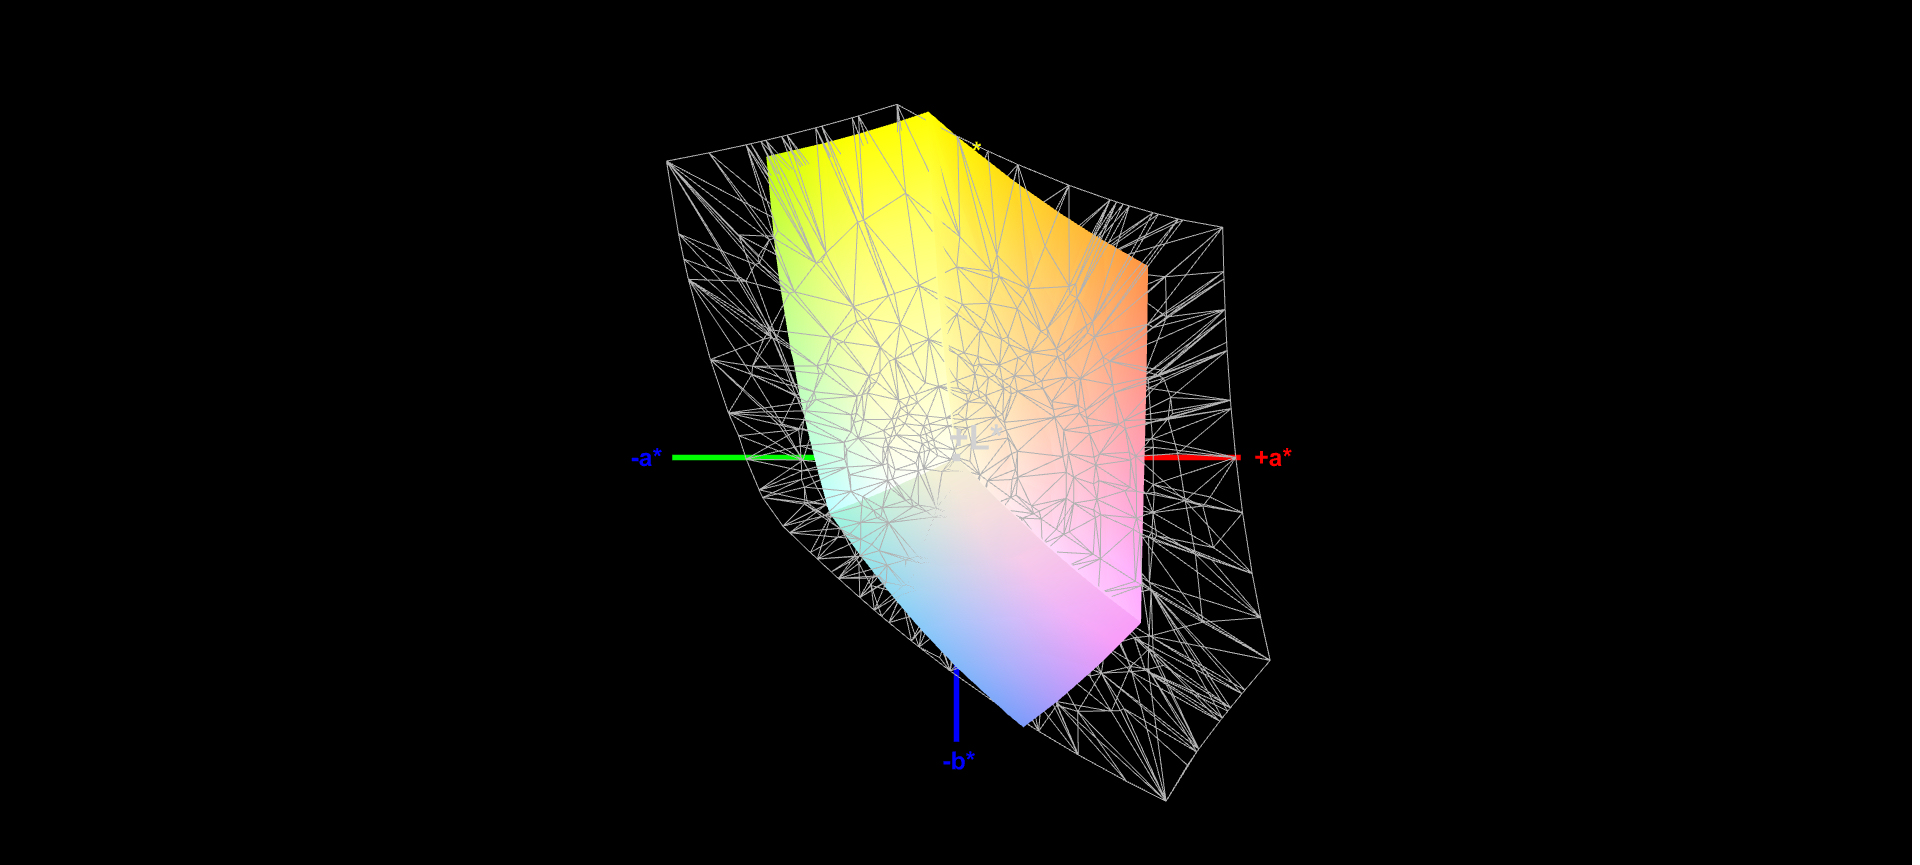
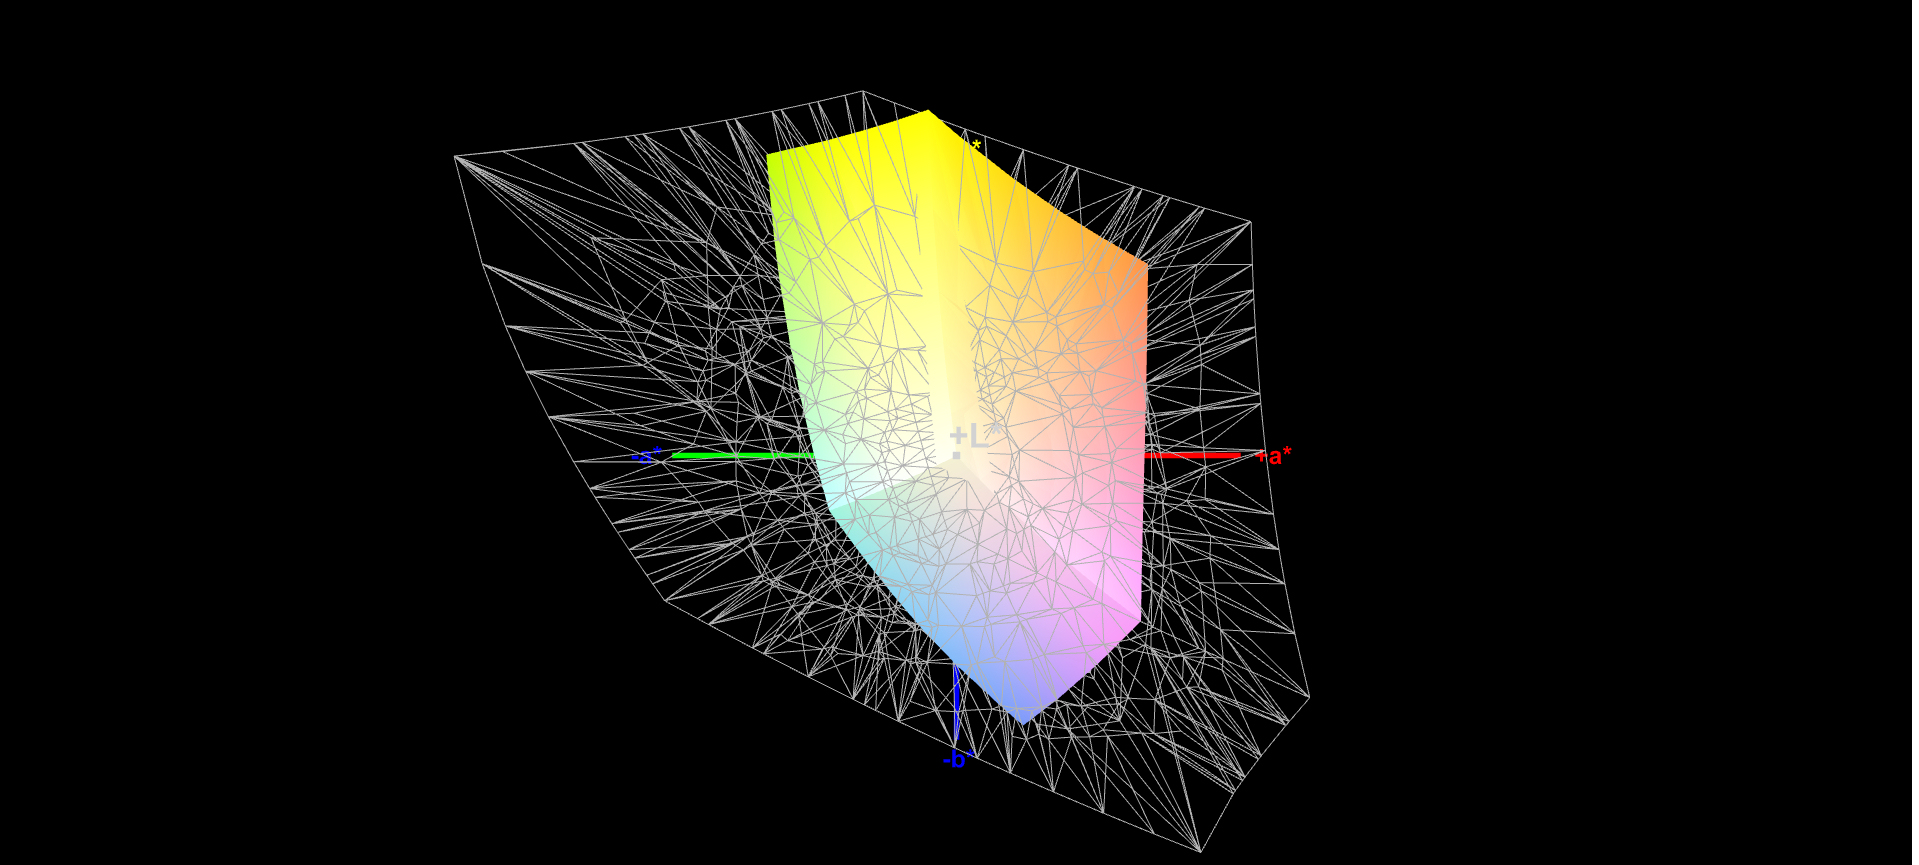
56% sRGB (Argyll 1.6.3 3D)
36% AdobeRGB 1998 (Argyll 1.6.3 3D)
39.3% AdobeRGB 1998 (Argyll 3D)
56.6% sRGB (Argyll 3D)
38.04% Display P3 (Argyll 3D)
Gamma: 2.43
CCT: 6818 K
| Lenovo IdeaPad Gaming 3i 15IMH05 IPS, 1920x1080, 15.6" | Asus TUF FX505DT-EB73 IPS, 1920x1080, 15.6" | Dell G3 3590 IPS, 1920x1080, 15.6" | MSI GF63 Thin 9SC IPS, 1920x1080, 15.6" | HP Pavilion Gaming 15-ec0002ng TN LED, 1920x1080, 15.6" | MSI Alpha 15 A3DDK-034 IPS, 1920x1080, 15.6" | Acer Nitro 5 AN515-44-R5FT IPS, 1920x1080, 15.6" | Lenovo IdeaPad L340-15IRH 81LK00BMGE IPS, 1920x1080, 15.6" | |
|---|---|---|---|---|---|---|---|---|
| Display | 4% | 6% | -1% | 8% | 68% | 8% | 13% | |
| Display P3 Coverage (%) | 38.04 | 39.56 4% | 40.13 5% | 37.76 -1% | 41.22 8% | 66.4 75% | 41.16 8% | 42.81 13% |
| sRGB Coverage (%) | 56.6 | 59.5 5% | 59.8 6% | 56.5 0% | 61.8 9% | 91 61% | 61.8 9% | 63.8 13% |
| AdobeRGB 1998 Coverage (%) | 39.3 | 40.91 4% | 41.47 6% | 39.01 -1% | 42.62 8% | 66.6 69% | 42.56 8% | 44.31 13% |
| Response Times | -42% | -88% | -83% | -32% | 56% | -70% | -82% | |
| Response Time Grey 50% / Grey 80% * (ms) | 25 ? | 30.4 ? -22% | 46 ? -84% | 44.8 ? -79% | 44 ? -76% | 7 ? 72% | 40.8 ? -63% | 45.6 ? -82% |
| Response Time Black / White * (ms) | 17 ? | 27.6 ? -62% | 32.4 ? -91% | 31.6 ? -86% | 15 ? 12% | 10.4 ? 39% | 30 ? -76% | 30.8 ? -81% |
| PWM Frequency (Hz) | 200 ? | 250 ? | 25910 ? | |||||
| Screen | 2% | 11% | 21% | -28% | 29% | 20% | 18% | |
| Brightness middle (cd/m²) | 305 | 286.2 -6% | 276.2 -9% | 260 -15% | 233 -24% | 310 2% | 287 -6% | 275 -10% |
| Brightness (cd/m²) | 294 | 267 -9% | 261 -11% | 249 -15% | 211 -28% | 310 5% | 271 -8% | 253 -14% |
| Brightness Distribution (%) | 70 | 84 20% | 86 23% | 92 31% | 82 17% | 86 23% | 88 26% | 83 19% |
| Black Level * (cd/m²) | 0.405 | 0.33 19% | 0.24 41% | 0.23 43% | 0.405 -0% | 0.29 28% | 0.25 38% | 0.18 56% |
| Contrast (:1) | 753 | 867 15% | 1151 53% | 1130 50% | 575 -24% | 1069 42% | 1148 52% | 1528 103% |
| Colorchecker dE 2000 * | 6.01 | 5.45 9% | 5.56 7% | 4.1 32% | 8.22 -37% | 4.78 20% | 4.77 21% | 5.4 10% |
| Colorchecker dE 2000 max. * | 21.9 | 18.08 17% | 23.45 -7% | 7.93 64% | 18.6 15% | 8.1 63% | 17.15 22% | 21.3 3% |
| Colorchecker dE 2000 calibrated * | 5.12 | 4.47 13% | 5.23 -2% | 3.56 30% | 2.36 54% | 3.73 27% | 4.4 14% | |
| Greyscale dE 2000 * | 3.23 | 5.3 -64% | 2.8 13% | 2.83 12% | 10.13 -214% | 4.78 -48% | 2.7 16% | 3.7 -15% |
| Gamma | 2.43 91% | 2.1 105% | 2.37 93% | 2.53 87% | 2.27 97% | 2.43 91% | 2.115 104% | 2.12 104% |
| CCT | 6818 95% | 7679 85% | 6710 97% | 6158 106% | 11323 57% | 7739 84% | 7187 90% | 6376 102% |
| Color Space (Percent of AdobeRGB 1998) (%) | 36 | 37.6 4% | 37.8 5% | 36 0% | 39 8% | 59 64% | 43 19% | 40.8 13% |
| Color Space (Percent of sRGB) (%) | 56 | 59.1 6% | 59 5% | 56 0% | 62 11% | 91 63% | 61 9% | 63.6 14% |
| Moyenne finale (programmes/paramètres) | -12% /
-3% | -24% /
-3% | -21% /
4% | -17% /
-21% | 51% /
40% | -14% /
6% | -17% /
4% |
* ... Moindre est la valeur, meilleures sont les performances
Temps de réponse de l'écran
| ↔ Temps de réponse noir à blanc | ||
|---|---|---|
| 17 ms ... hausse ↗ et chute ↘ combinées | ↗ 9 ms hausse | 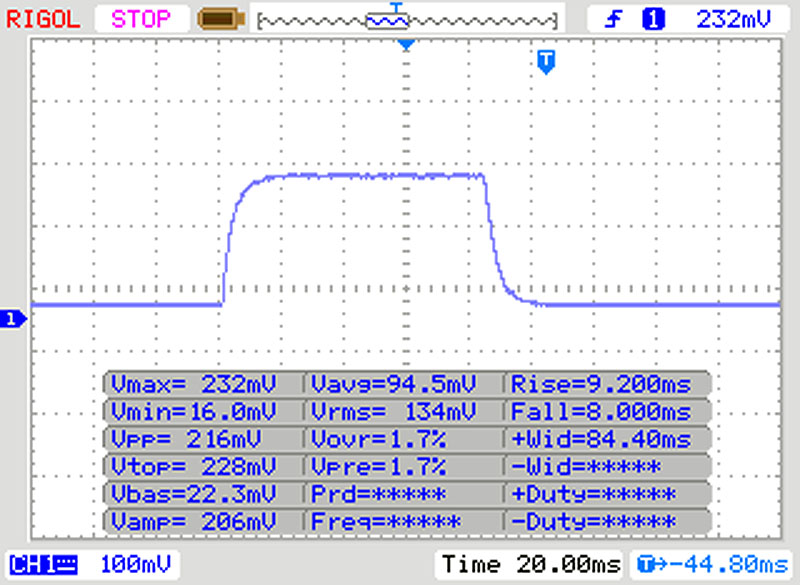 |
| ↘ 8 ms chute | ||
| L'écran montre de bons temps de réponse, mais insuffisant pour du jeu compétitif. En comparaison, tous les appareils testés affichent entre 0.1 (minimum) et 240 (maximum) ms. » 39 % des appareils testés affichent de meilleures performances. Cela signifie que les latences relevées sont meilleures que la moyenne (19.8 ms) de tous les appareils testés. | ||
| ↔ Temps de réponse gris 50% à gris 80% | ||
| 25 ms ... hausse ↗ et chute ↘ combinées | ↗ 13 ms hausse | 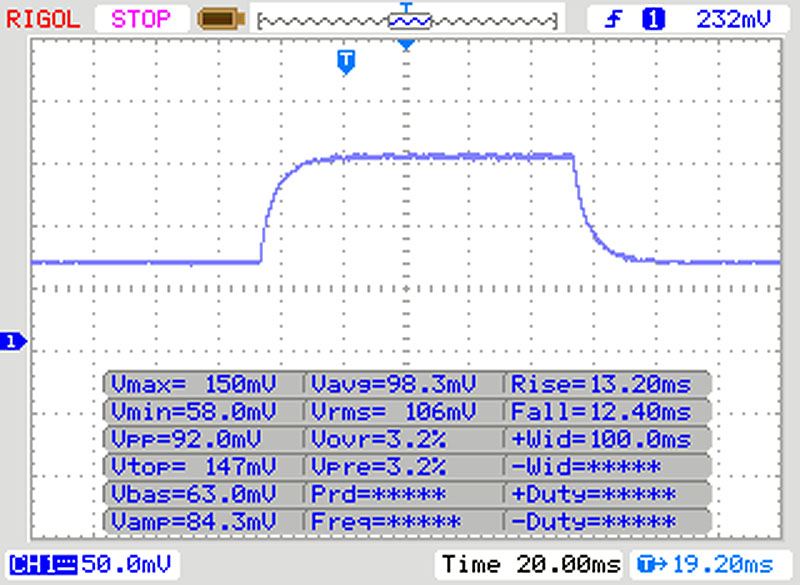 |
| ↘ 12 ms chute | ||
| L'écran souffre de latences relativement élevées, insuffisant pour le jeu. En comparaison, tous les appareils testés affichent entre 0.165 (minimum) et 636 (maximum) ms. » 35 % des appareils testés affichent de meilleures performances. Cela signifie que les latences relevées sont meilleures que la moyenne (31 ms) de tous les appareils testés. | ||
Scintillement / MLI (Modulation de largeur d'impulsion)
| Scintillement / MLI (Modulation de largeur d'impulsion) non décelé | 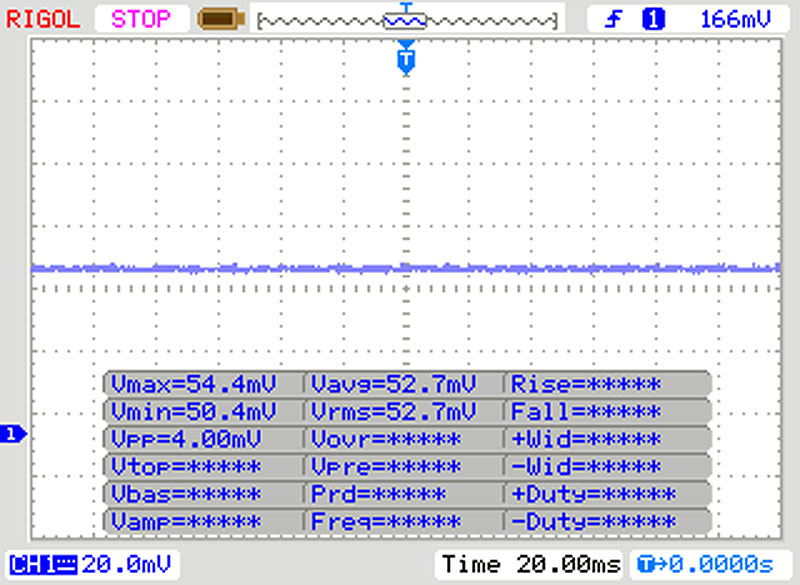 | ||
En comparaison, 52 % des appareils testés n'emploient pas MDI pour assombrir leur écran. Nous avons relevé une moyenne à 7763 (minimum : 5 - maximum : 343500) Hz dans le cas où une MDI était active. | |||


* ... Moindre est la valeur, meilleures sont les performances
| PCMark 8 Home Score Accelerated v2 | 3841 points | |
| PCMark 8 Creative Score Accelerated v2 | 3644 points | |
| PCMark 8 Work Score Accelerated v2 | 5210 points | |
| PCMark 10 Score | 4612 points | |
Aide | ||
| DPC Latencies / LatencyMon - interrupt to process latency (max), Web, Youtube, Prime95 | |
| Acer Nitro 5 AN515-44-R5FT | |
| Lenovo IdeaPad Gaming 3i 15IMH05 | |
* ... Moindre est la valeur, meilleures sont les performances

| Lenovo IdeaPad Gaming 3i 15IMH05 SK hynix BC511 HFM512GDHTNI-87A0B | Asus TUF FX505DT-EB73 Intel SSD 660p SSDPEKNW512G8 | MSI GF63 Thin 9SC Toshiba KBG30ZMV512G | HP Pavilion Gaming 15-ec0002ng Intel SSD 660p SSDPEKNW512G8 | MSI Alpha 15 A3DDK-034 Kingston RBUSNS8154P3512GJ | Acer Nitro 5 AN515-44-R5FT SK Hynix BC511 HFM512GDJTNI | Lenovo IdeaPad L340-15IRH 81LK00BMGE WDC PC SN520 SDAPMUW-512 | Moyenne SK hynix BC511 HFM512GDHTNI-87A0B | |
|---|---|---|---|---|---|---|---|---|
| CrystalDiskMark 5.2 / 6 | -1% | -25% | 0% | -12% | 1% | -6% | 5% | |
| Write 4K (MB/s) | 130 | 137.5 6% | 80.6 -38% | 136.9 5% | 105.4 -19% | 94.7 -27% | 103.6 -20% | 135.9 ? 5% |
| Read 4K (MB/s) | 44.44 | 57 28% | 41.82 -6% | 57 28% | 33.24 -25% | 38.91 -12% | 39.91 -10% | 45.3 ? 2% |
| Write Seq (MB/s) | 1059 | 984 -7% | 597 -44% | 968 -9% | 1029 -3% | 1056 0% | 1160 10% | 1057 ? 0% |
| Read Seq (MB/s) | 1105 | 1564 42% | 963 -13% | 1631 48% | 1098 -1% | 1183 7% | 990 -10% | 1144 ? 4% |
| Write 4K Q32T1 (MB/s) | 490.3 | 237.4 -52% | 188.8 -61% | 237 -52% | 322.1 -34% | 445.3 -9% | 283.4 -42% | 458 ? -7% |
| Read 4K Q32T1 (MB/s) | 309.2 | 340.7 10% | 403.7 31% | 337.1 9% | 352 14% | 477.7 54% | 344.5 11% | 425 ? 37% |
| Write Seq Q32T1 (MB/s) | 1053 | 959 -9% | 689 -35% | 963 -9% | 1036 -2% | 1063 1% | 1455 38% | 1040 ? -1% |
| Read Seq Q32T1 (MB/s) | 2261 | 1732 -23% | 1583 -30% | 1863 -18% | 1606 -29% | 2154 -5% | 1690 -25% | 2274 ? 1% |
Continuous load read: DiskSpd Read Loop, Queue Depth 8
| 3DMark 11 Performance | 11788 points | |
| 3DMark Ice Storm Standard Score | 118141 points | |
| 3DMark Cloud Gate Standard Score | 27773 points | |
| 3DMark Fire Strike Score | 8526 points | |
| 3DMark Time Spy Score | 3621 points | |
Aide | ||
| BioShock Infinite - 1920x1080 Ultra Preset, DX11 (DDOF) | |
| Lenovo IdeaPad Gaming 3i 15IMH05 | |
| MSI Alpha 15 A3DDK-034 | |
| Moyenne NVIDIA GeForce GTX 1650 Mobile (68.5 - 99.4, n=18) | |
| Dell G3 3590 | |
| Lenovo IdeaPad L340-15IRH 81LK00BMGE | |
| Asus TUF FX505DT-EB73 | |
| HP Pavilion Gaming 15-ec0002ng | |
| Escape from Tarkov - 1920x1080 Ultra Preset | |
| Lenovo IdeaPad Gaming 3i 15IMH05 | |
| Moyenne NVIDIA GeForce GTX 1650 Mobile (45.8 - 62.2, n=2) | |
| Shadow of the Tomb Raider - 1920x1080 Highest Preset AA:T | |
| Moyenne de la classe Gaming (96 - 116, n=2, 2 dernières années) | |
| Acer Nitro 5 AN515-44-R5FT | |
| Lenovo IdeaPad Gaming 3i 15IMH05 | |
| Moyenne NVIDIA GeForce GTX 1650 Mobile (34 - 47, n=15) | |
| Asus TUF FX505DT-EB73 | |
| HP Pavilion Gaming 15-ec0002ng | |
| Doom Eternal - 1920x1080 High Preset | |
| Lenovo IdeaPad Gaming 3i 15IMH05 | |
| Moyenne NVIDIA GeForce GTX 1650 Mobile (62.6 - 69.2, n=4) | |
| Gears Tactics - 1920x1080 Ultra Preset | |
| Acer Nitro 5 AN515-44-R5FT | |
| Lenovo IdeaPad Gaming 3i 15IMH05 | |
| Moyenne NVIDIA GeForce GTX 1650 Mobile (41.9 - 48.3, n=5) | |
| Call of Duty Modern Warfare 2019 - 1920x1080 Maximum Settings AA:T2X Filmic SM | |
| Acer Nitro 5 AN515-44-R5FT | |
| Moyenne NVIDIA GeForce GTX 1650 Mobile (43.3 - 53.5, n=4) | |
| Lenovo IdeaPad Gaming 3i 15IMH05 | |
| MSI GF63 Thin 9SC | |
| HP Pavilion Gaming 15-ec0002ng | |
| Far Cry 5 - 1920x1080 Ultra Preset AA:T | |
| Moyenne de la classe Gaming (70 - 151, n=9, 2 dernières années) | |
| Lenovo IdeaPad Gaming 3i 15IMH05 | |
| Moyenne NVIDIA GeForce GTX 1650 Mobile (44 - 57, n=9) | |
| HP Pavilion Gaming 15-ec0002ng | |
| Bas | Moyen | Élevé | Ultra | |
|---|---|---|---|---|
| BioShock Infinite (2013) | 288.3 | 242.3 | 224.2 | 96.5 |
| The Witcher 3 (2015) | 184.5 | 119.2 | 66 | 37.4 |
| Dota 2 Reborn (2015) | 133.9 | 121.5 | 113.2 | 107.5 |
| X-Plane 11.11 (2018) | 82.8 | 74.1 | 64.8 | |
| Far Cry 5 (2018) | 97 | 66 | 61 | 57 |
| Shadow of the Tomb Raider (2018) | 101 | 63 | 53 | 47 |
| Metro Exodus (2019) | 98.9 | 46.1 | 34.2 | 26.6 |
| Control (2019) | 138.5 | 46 | 33.5 | |
| Borderlands 3 (2019) | 115.7 | 60.1 | 39.2 | 34.6 |
| Call of Duty Modern Warfare 2019 (2019) | 99.6 | 64.3 | 53.3 | 45.4 |
| Need for Speed Heat (2019) | 75.6 | 57.8 | 51 | 48.7 |
| Star Wars Jedi Fallen Order (2019) | 69.6 | 59.8 | 52.1 | |
| Red Dead Redemption 2 (2019) | 93.6 | 50.8 | 33.1 | 21.2 |
| Escape from Tarkov (2020) | 121.2 | 78.6 | 67.9 | 62.2 |
| Hunt Showdown (2020) | 144.4 | 56.8 | 46.4 | |
| Doom Eternal (2020) | 151.5 | 84.6 | 68.1 | |
| Gears Tactics (2020) | 191.1 | 94 | 65.2 | 48.3 |
Degré de la nuisance sonore
| Au repos |
| 30.7 / 30.7 / 30.7 dB(A) |
| Disque dur |
| 30.7 dB(A) |
| Fortement sollicité |
| 49.7 / 50.3 dB(A) |
 | ||
30 dB silencieux 40 dB(A) audible 50 dB(A) bruyant |
||
min: | ||
| Lenovo IdeaPad Gaming 3i 15IMH05 i5-10300H, GeForce GTX 1650 Mobile | Lenovo IdeaPad L340-15IRH 81LK00BMGE i5-9300H, GeForce GTX 1650 Mobile | Asus TUF FX505DT-EB73 R7 3750H, GeForce GTX 1650 Mobile | Dell G3 3590 i5-9300H, GeForce GTX 1650 Mobile | MSI GF63 Thin 9SC i5-9300H, GeForce GTX 1650 Max-Q | HP Pavilion Gaming 15-ec0002ng R5 3550H, GeForce GTX 1050 Mobile | Acer Nitro 5 AN515-44-R5FT R5 4600H, GeForce GTX 1650 Ti Mobile | MSI Alpha 15 A3DDK-034 R7 3750H, Radeon RX 5500M | Moyenne NVIDIA GeForce GTX 1650 Mobile | Moyenne de la classe Gaming | |
|---|---|---|---|---|---|---|---|---|---|---|
| Noise | 14% | 6% | 5% | -2% | 7% | -0% | -15% | 8% | 9% | |
| arrêt / environnement * (dB) | 30.7 | 28.4 7% | 28.2 8% | 28.4 7% | 30 2% | 30.3 1% | 30 2% | 29 6% | 27.6 ? 10% | 24.1 ? 21% |
| Idle Minimum * (dB) | 30.7 | 28.4 7% | 28.2 8% | 29.2 5% | 35 -14% | 30.3 1% | 30 2% | 36 -17% | 28.1 ? 8% | 25.9 ? 16% |
| Idle Average * (dB) | 30.7 | 28.4 7% | 28.2 8% | 29.4 4% | 36 -17% | 30.3 1% | 32 -4% | 37 -21% | 28.8 ? 6% | 27.4 ? 11% |
| Idle Maximum * (dB) | 30.7 | 28.4 7% | 31.4 -2% | 29.4 4% | 37 -21% | 31 -1% | 34 -11% | 46 -50% | 31 ? -1% | 29.9 ? 3% |
| Load Average * (dB) | 49.7 | 30.1 39% | 39.8 20% | 39 22% | 44 11% | 39.3 21% | 46 7% | 50 -1% | 41.7 ? 16% | 43 ? 13% |
| Witcher 3 ultra * (dB) | 47 | 40.2 14% | 47 -0% | 49.5 -5% | 41 13% | 42.9 9% | 47 -0% | 51 -9% | ||
| Load Maximum * (dB) | 50.3 | 40.2 20% | 50.2 -0% | 49.7 1% | 43 15% | 43.3 14% | 49 3% | 57 -13% | 46.4 ? 8% | 54.1 ? -8% |
* ... Moindre est la valeur, meilleures sont les performances
(±) La température maximale du côté supérieur est de 43 °C / 109 F, par rapport à la moyenne de 40.4 °C / 105 F, allant de 21.2 à 68.8 °C pour la classe Gaming.
(-) Le fond chauffe jusqu'à un maximum de 50.6 °C / 123 F, contre une moyenne de 43.2 °C / 110 F
(+) En utilisation inactive, la température moyenne du côté supérieur est de 25.7 °C / 78 F, par rapport à la moyenne du dispositif de 33.9 °C / 93 F.
(±) En jouant à The Witcher 3, la température moyenne du côté supérieur est de 34.2 °C / 94 F, alors que la moyenne de l'appareil est de 33.9 °C / 93 F.
(+) Les repose-poignets et le pavé tactile atteignent la température maximale de la peau (32.4 °C / 90.3 F) et ne sont donc pas chauds.
(-) La température moyenne de la zone de l'appui-paume de dispositifs similaires était de 28.8 °C / 83.8 F (-3.6 °C / #-6.5 F).
| Lenovo IdeaPad Gaming 3i 15IMH05 i5-10300H, GeForce GTX 1650 Mobile | Lenovo IdeaPad L340-15IRH 81LK00BMGE i5-9300H, GeForce GTX 1650 Mobile | Asus TUF FX505DT-EB73 R7 3750H, GeForce GTX 1650 Mobile | Dell G3 3590 i5-9300H, GeForce GTX 1650 Mobile | MSI GF63 Thin 9SC i5-9300H, GeForce GTX 1650 Max-Q | HP Pavilion Gaming 15-ec0002ng R5 3550H, GeForce GTX 1050 Mobile | Acer Nitro 5 AN515-44-R5FT R5 4600H, GeForce GTX 1650 Ti Mobile | MSI Alpha 15 A3DDK-034 R7 3750H, Radeon RX 5500M | Moyenne NVIDIA GeForce GTX 1650 Mobile | Moyenne de la classe Gaming | |
|---|---|---|---|---|---|---|---|---|---|---|
| Heat | -6% | -7% | -15% | 2% | 9% | -5% | 1% | -3% | -10% | |
| Maximum Upper Side * (°C) | 43 | 44.8 -4% | 41.2 4% | 49 -14% | 47 -9% | 41 5% | 49 -14% | 44 -2% | 46 ? -7% | 45.2 ? -5% |
| Maximum Bottom * (°C) | 50.6 | 58.1 -15% | 40 21% | 49.8 2% | 47 7% | 39.1 23% | 50 1% | 49 3% | 49.2 ? 3% | 48.1 ? 5% |
| Idle Upper Side * (°C) | 27.2 | 27.9 -3% | 34.6 -27% | 32.4 -19% | 26 4% | 26 4% | 28 -3% | 26 4% | 28.3 ? -4% | 31.1 ? -14% |
| Idle Bottom * (°C) | 27.5 | 27.9 -1% | 34.4 -25% | 35.6 -29% | 26 5% | 26.5 4% | 28 -2% | 28 -2% | 28.9 ? -5% | 34.3 ? -25% |
* ... Moindre est la valeur, meilleures sont les performances
Lenovo IdeaPad Gaming 3i 15IMH05 analyse audio
(-) | haut-parleurs pas très forts (70 dB)
Basses 100 - 315 Hz
(-) | presque aucune basse - en moyenne 21.8% plus bas que la médiane
(±) | la linéarité des basses est moyenne (11.9% delta à la fréquence précédente)
Médiums 400 - 2000 Hz
(±) | médiane supérieure - en moyenne 5.9% supérieure à la médiane
(±) | la linéarité des médiums est moyenne (9.4% delta à la fréquence précédente)
Aiguës 2 - 16 kHz
(+) | des sommets équilibrés - à seulement 1.1% de la médiane
(+) | les aigus sont linéaires (4.6% delta à la fréquence précédente)
Globalement 100 - 16 000 Hz
(±) | la linéarité du son global est moyenne (22.8% de différence avec la médiane)
Par rapport à la même classe
» 82% de tous les appareils testés de cette catégorie étaient meilleurs, 5% similaires, 13% pires
» Le meilleur avait un delta de 6%, la moyenne était de 18%, le pire était de 132%.
Par rapport à tous les appareils testés
» 67% de tous les appareils testés étaient meilleurs, 6% similaires, 27% pires
» Le meilleur avait un delta de 4%, la moyenne était de 24%, le pire était de 134%.
| Éteint/en veille | |
| Au repos | |
| Fortement sollicité |
|
Légende:
min: | |
| Lenovo IdeaPad Gaming 3i 15IMH05 i5-10300H, GeForce GTX 1650 Mobile | Lenovo IdeaPad L340-15IRH 81LK00BMGE i5-9300H, GeForce GTX 1650 Mobile | Asus TUF FX505DT-EB73 R7 3750H, GeForce GTX 1650 Mobile | Dell G3 3590 i5-9300H, GeForce GTX 1650 Mobile | MSI GF63 Thin 9SC i5-9300H, GeForce GTX 1650 Max-Q | HP Pavilion Gaming 15-ec0002ng R5 3550H, GeForce GTX 1050 Mobile | Acer Nitro 5 AN515-44-R5FT R5 4600H, GeForce GTX 1650 Ti Mobile | MSI Alpha 15 A3DDK-034 R7 3750H, Radeon RX 5500M | Moyenne NVIDIA GeForce GTX 1650 Mobile | Moyenne de la classe Gaming | |
|---|---|---|---|---|---|---|---|---|---|---|
| Power Consumption | 24% | 0% | -22% | -1% | 29% | 12% | -82% | 1% | -94% | |
| Idle Minimum * (Watt) | 5.1 | 3.8 25% | 7 -37% | 6.2 -22% | 7 -37% | 1.9 63% | 5 2% | 14 -175% | 4.96 ? 3% | 13.1 ? -157% |
| Idle Average * (Watt) | 8.2 | 6.6 20% | 9.9 -21% | 8.4 -2% | 9 -10% | 7.2 12% | 8 2% | 18 -120% | 8.61 ? -5% | 18.8 ? -129% |
| Idle Maximum * (Watt) | 10.6 | 8.9 16% | 12 -13% | 27.7 -161% | 13 -23% | 9.6 9% | 13 -23% | 32 -202% | 14.8 ? -40% | 24.4 ? -130% |
| Load Average * (Watt) | 128 | 78.4 39% | 68.4 47% | 91 29% | 79 38% | 74 42% | 69 46% | 64 50% | 81.7 ? 36% | 108.6 ? 15% |
| Witcher 3 ultra * (Watt) | 109 | 82 25% | 94.9 13% | 94.4 13% | 73 33% | 75 31% | 78 28% | 123 -13% | ||
| Load Maximum * (Watt) | 150 | 124 17% | 130.9 13% | 131.5 12% | 164 -9% | 124 17% | 124 17% | 193 -29% | 131.9 ? 12% | 254 ? -69% |
* ... Moindre est la valeur, meilleures sont les performances
| Lenovo IdeaPad Gaming 3i 15IMH05 i5-10300H, GeForce GTX 1650 Mobile, 45 Wh | Asus TUF FX505DT-EB73 R7 3750H, GeForce GTX 1650 Mobile, 48 Wh | Dell G3 3590 i5-9300H, GeForce GTX 1650 Mobile, 51 Wh | MSI GF63 Thin 9SC i5-9300H, GeForce GTX 1650 Max-Q, 51 Wh | HP Pavilion Gaming 15-ec0002ng R5 3550H, GeForce GTX 1050 Mobile, 52.5 Wh | MSI Alpha 15 A3DDK-034 R7 3750H, Radeon RX 5500M, 51 Wh | Acer Nitro 5 AN515-44-R5FT R5 4600H, GeForce GTX 1650 Ti Mobile, 57.48 Wh | Lenovo IdeaPad L340-15IRH 81LK00BMGE i5-9300H, GeForce GTX 1650 Mobile, 45 Wh | Moyenne de la classe Gaming | |
|---|---|---|---|---|---|---|---|---|---|
| Autonomie de la batterie | -26% | -2% | -31% | 33% | -48% | 9% | -28% | -6% | |
| Reader / Idle (h) | 12.4 | 7.8 -37% | 13.5 9% | 8.5 -31% | 5.8 -53% | 13.8 11% | 7.8 -37% | 8.71 ? -30% | |
| H.264 (h) | 7.3 | 3.9 -47% | 8.28 ? 13% | ||||||
| WiFi v1.3 (h) | 6.3 | 4.8 -24% | 6.7 6% | 4.4 -30% | 8.4 33% | 4.1 -35% | 8.7 38% | 6.1 -3% | 6.96 ? 10% |
| Load (h) | 1.8 | 1.5 -17% | 1.4 -22% | 1.2 -33% | 0.8 -56% | 1.4 -22% | 1 -44% | 1.47 ? -18% |
Points positifs
Points négatifs
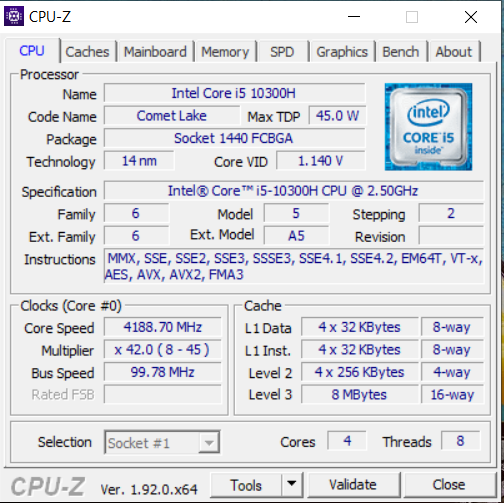
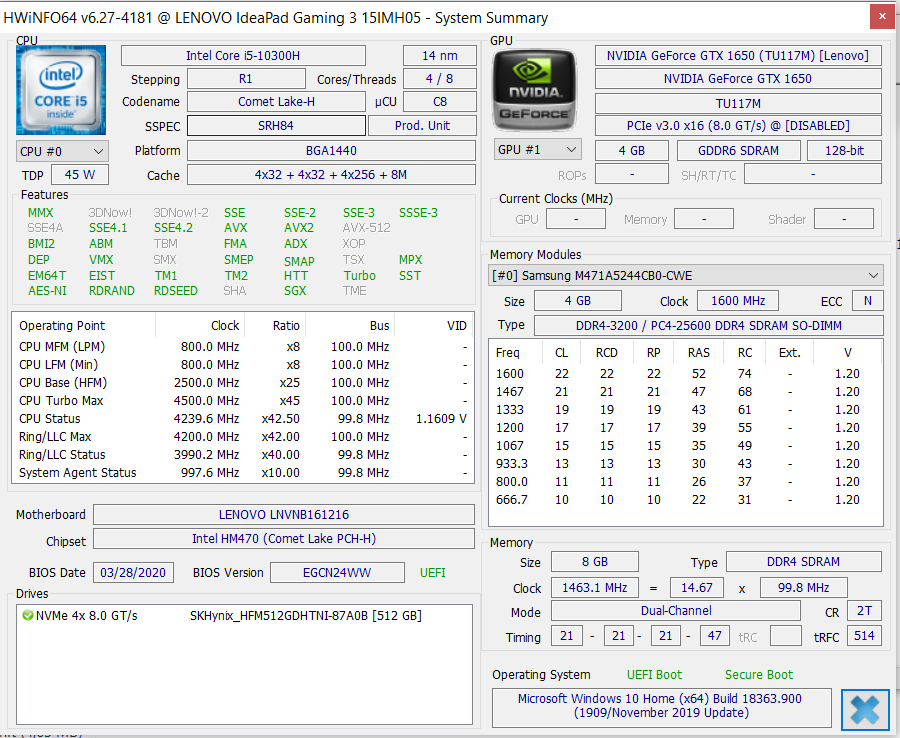
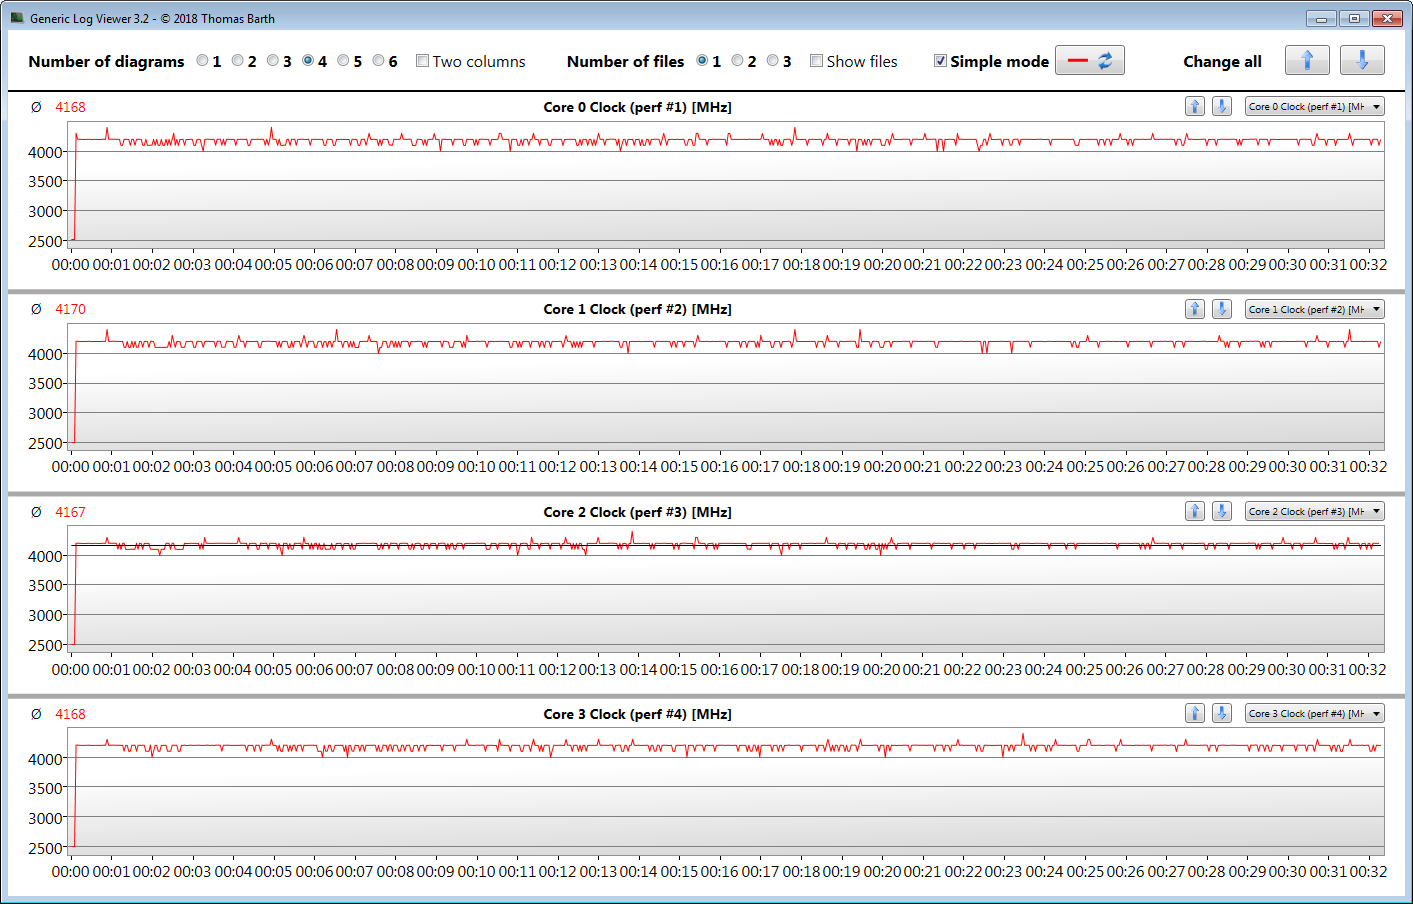
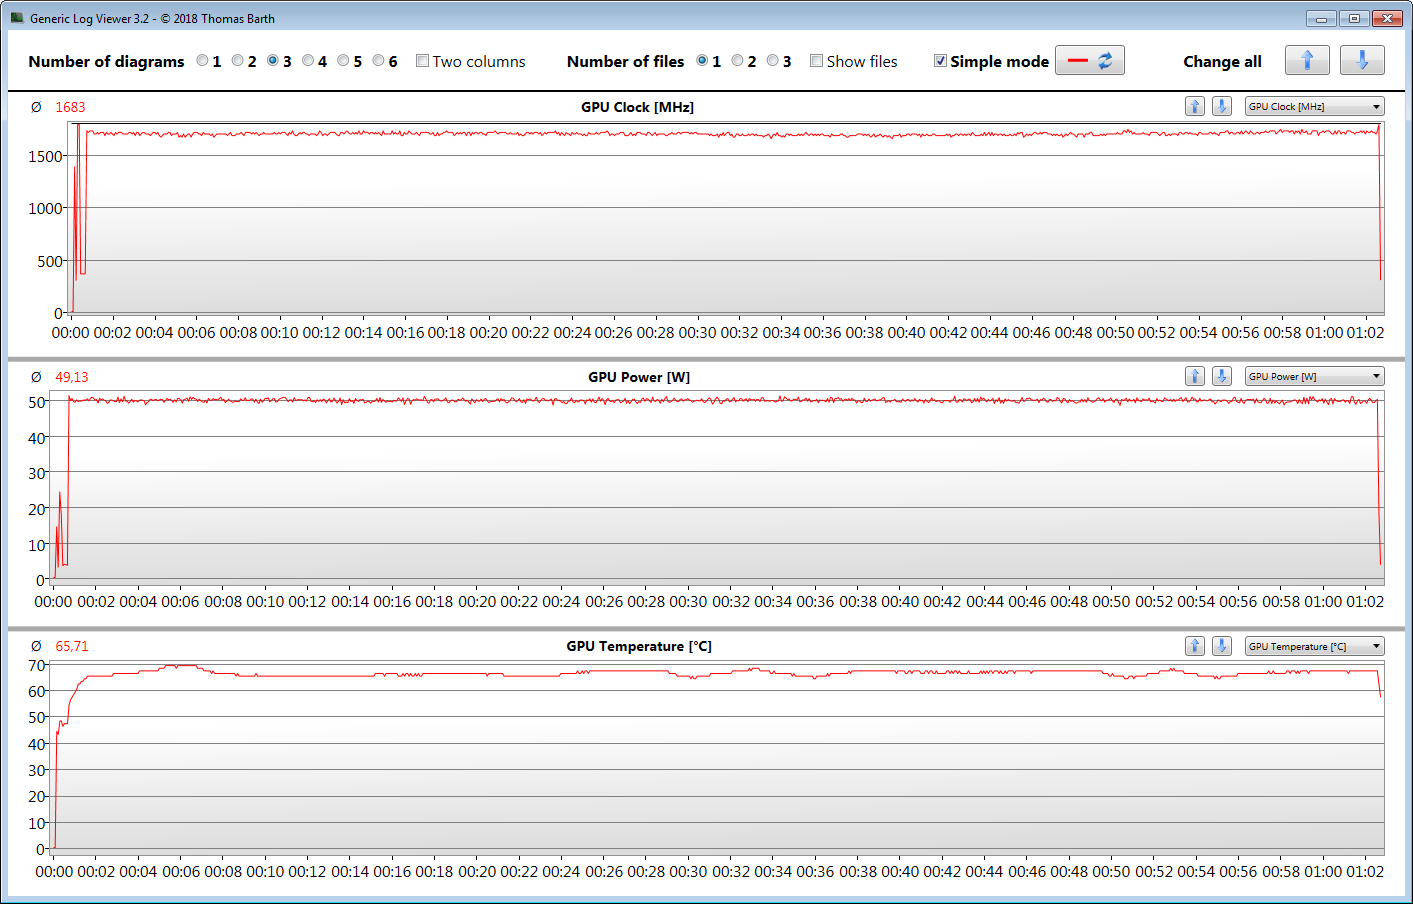
Le PC portable de jeu de Lenovo de 15,6 pouces à petit prix (environ 800 €) possède un processeur Core i5-10300H (Comet Lake), assez puissant pour tous les usages classiques. Combiné à une carte graphique GeForce GTX 1650, le processeur permet de faire tourner fluidement tous les jeux récents. A noter : le CPU et le GPU peuvent tous les deux tourner longtemps à des fréquences élevées.
L'IdeaPad Gaming 3i 15IMH05 est un PC portable de jeu équilibré de l'entrée de gamme, avec un bon rapport performances / prix.
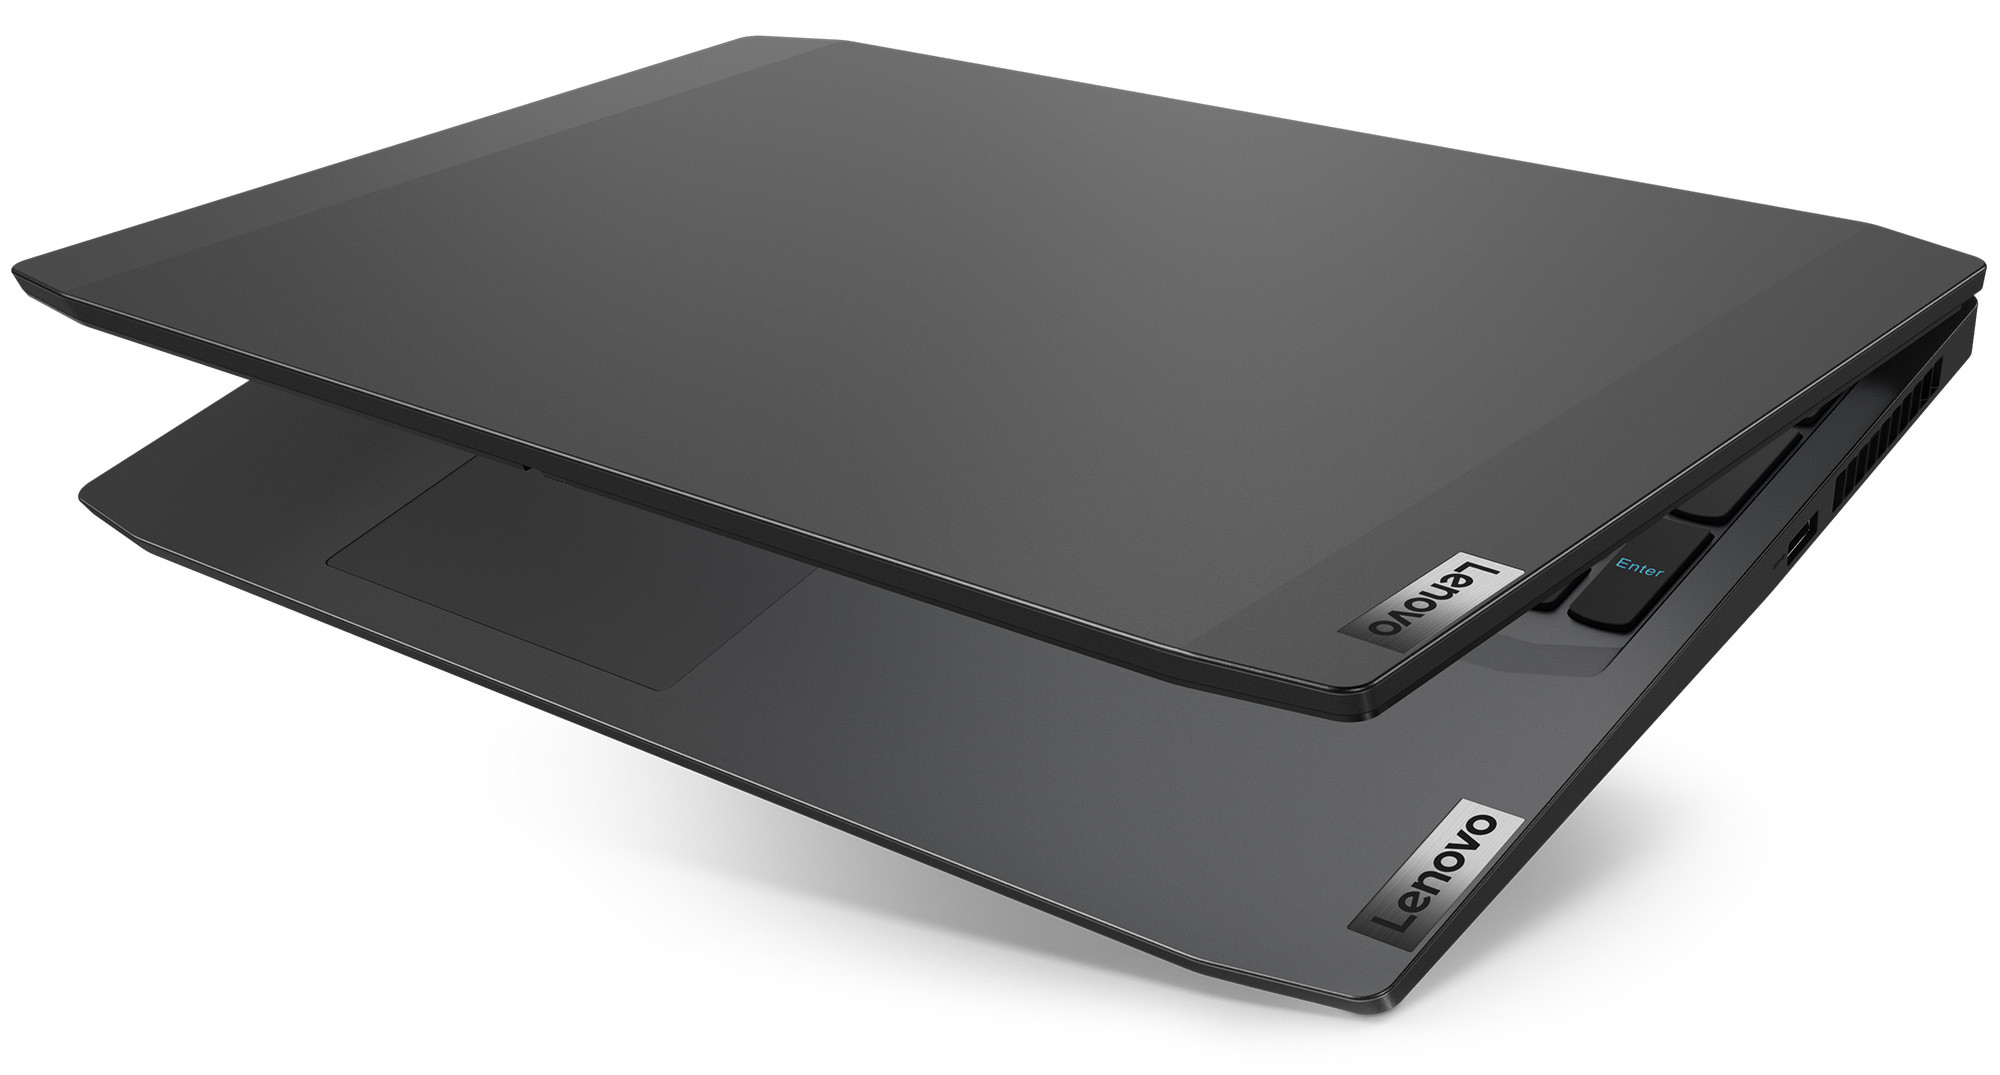
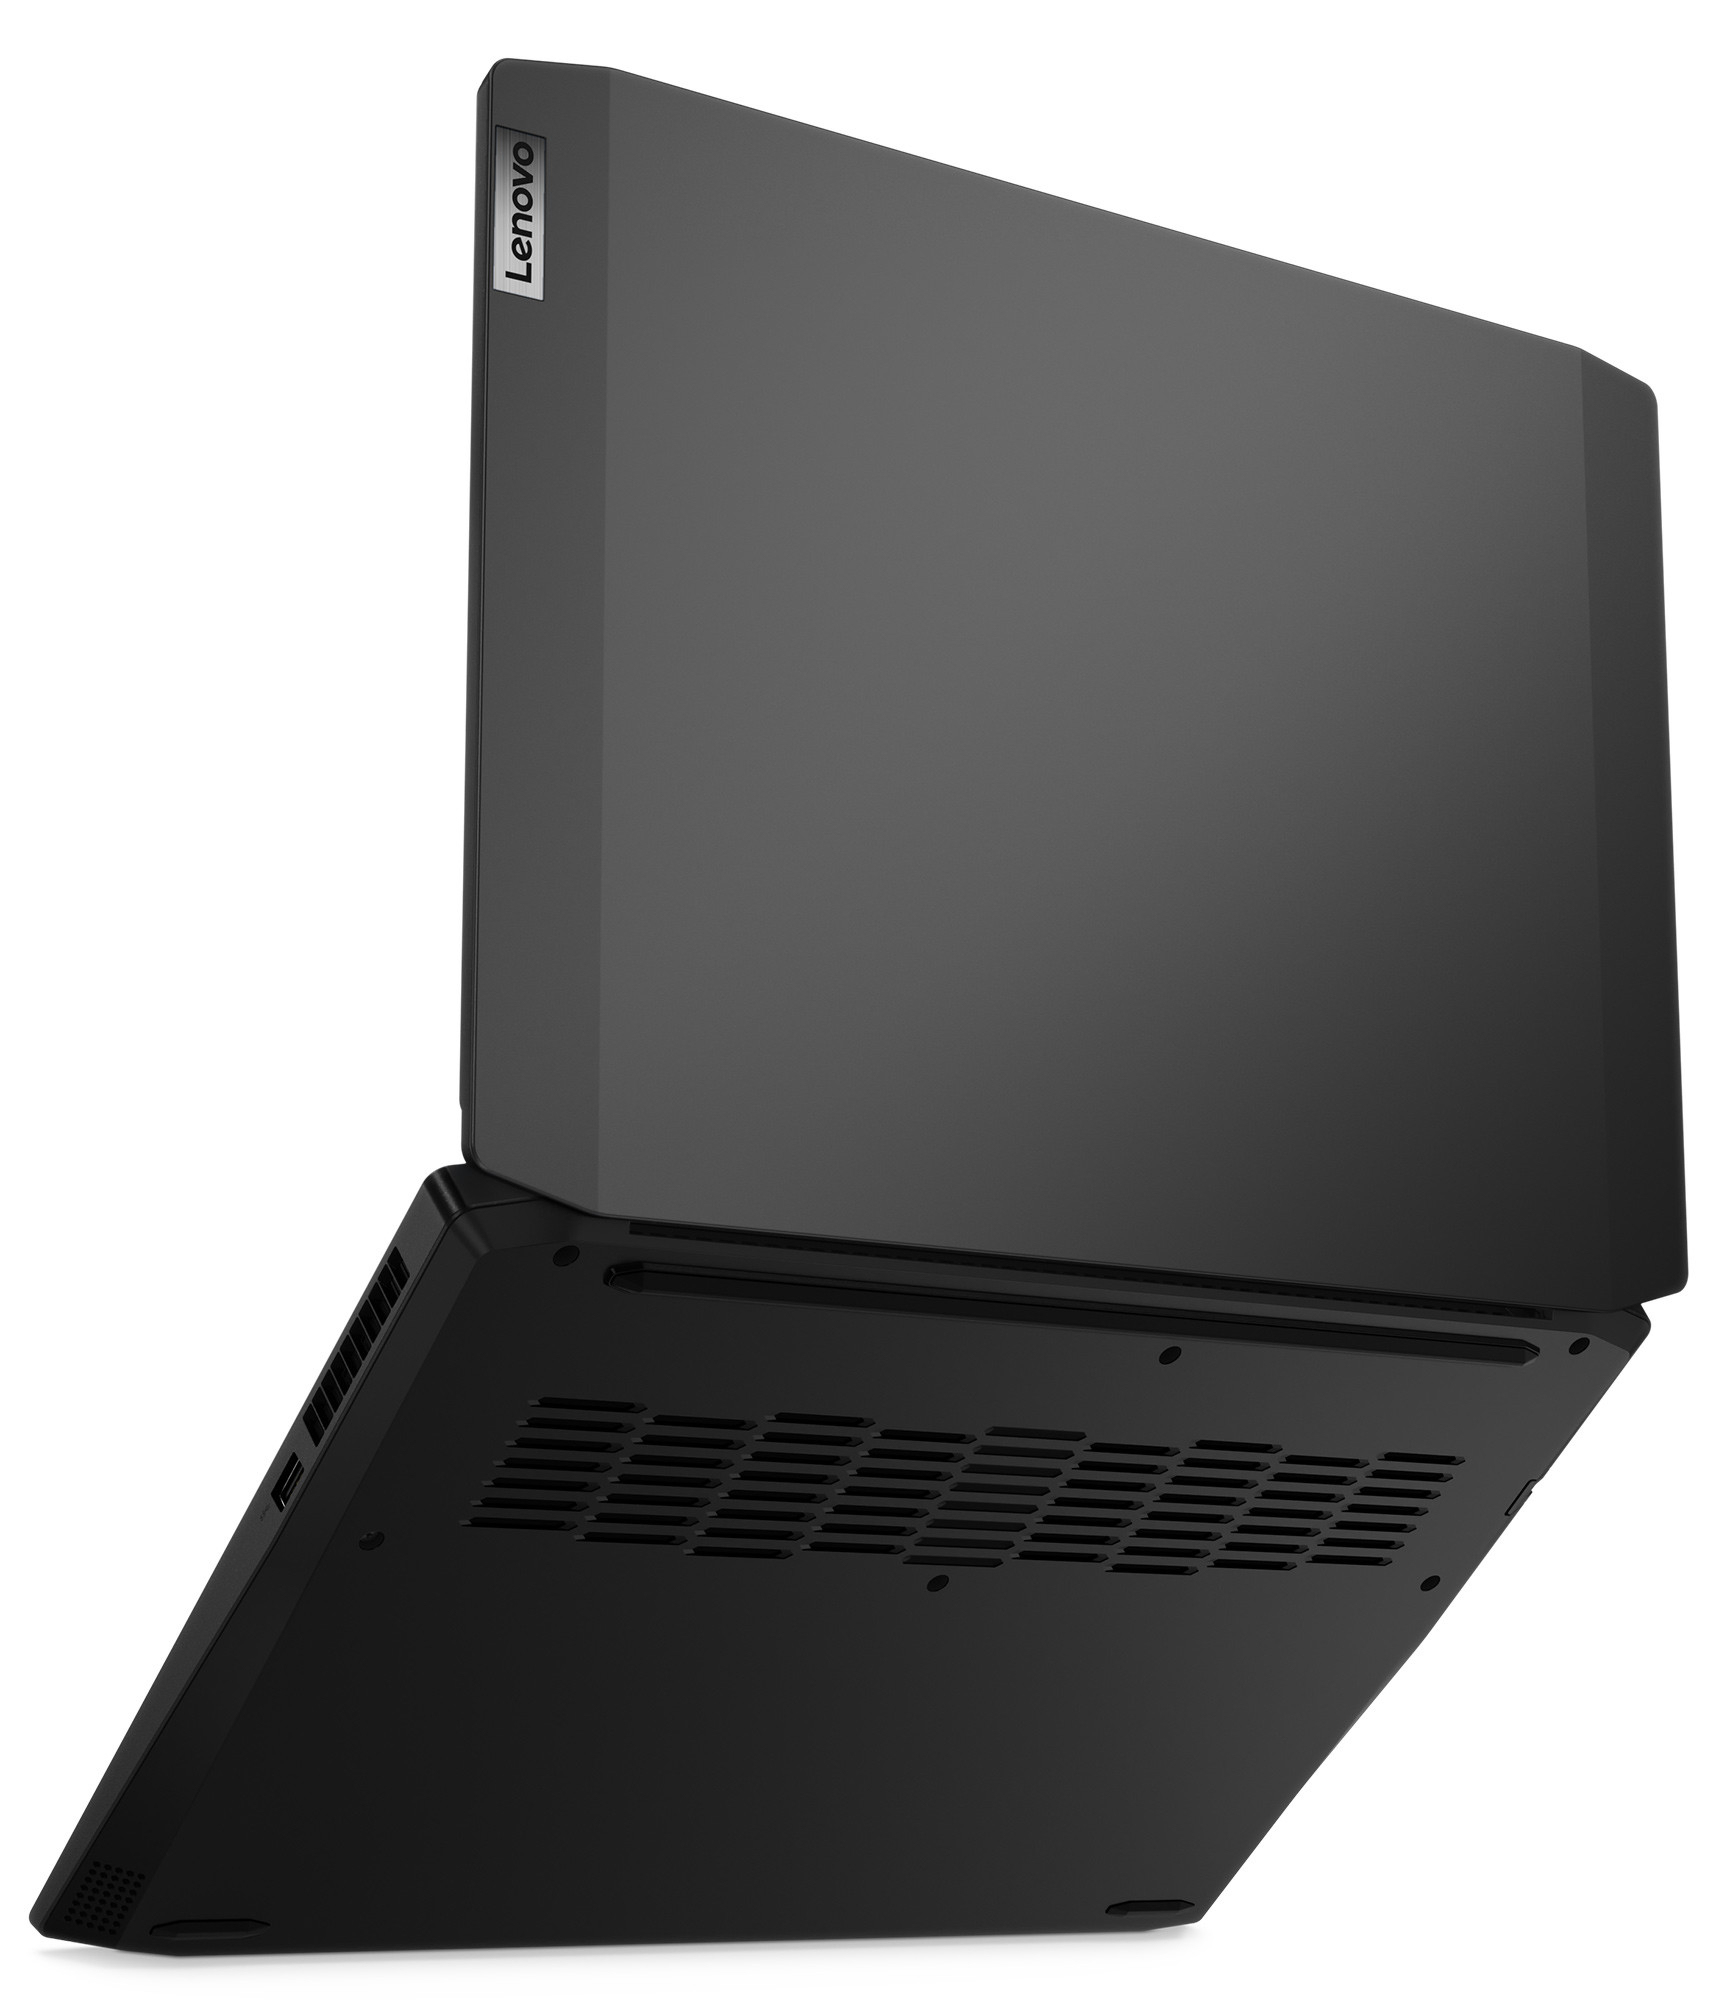
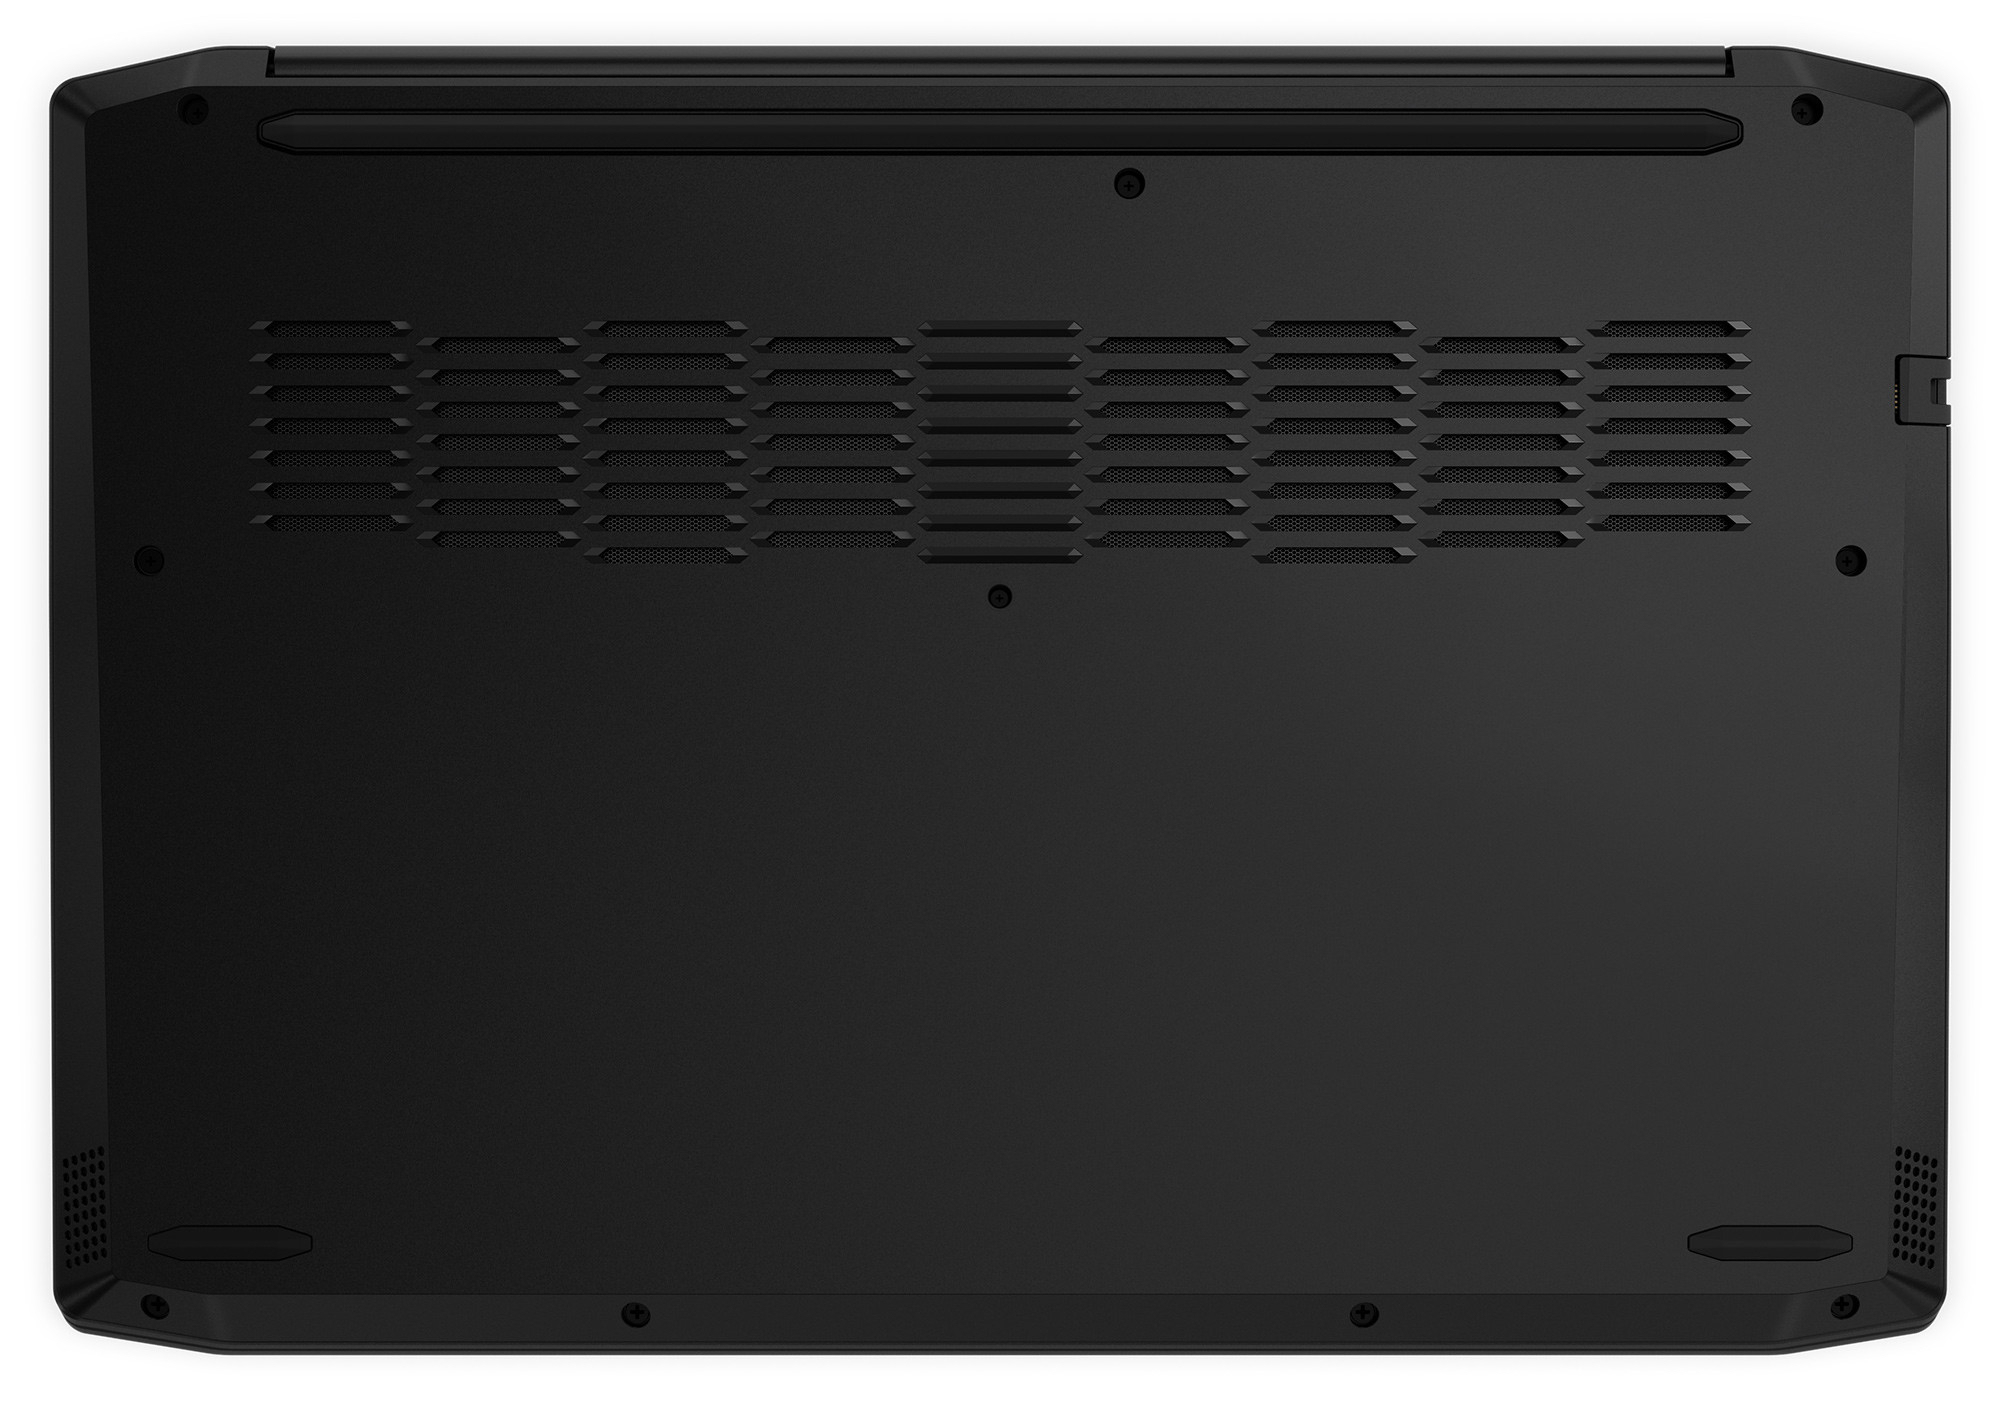
Le SSD NVMe de 512 Go (M.2 2242) permet au système d'être fluide, et peut être changé sans problèmes. Le PC possède un deuxième emplacement M.2, pour un SSD NVMe aux formats 2280 ou 2230. Mais l'appareil n'ayant pas de trappe, il faut ouvrir la coque pour accéder aux composants.
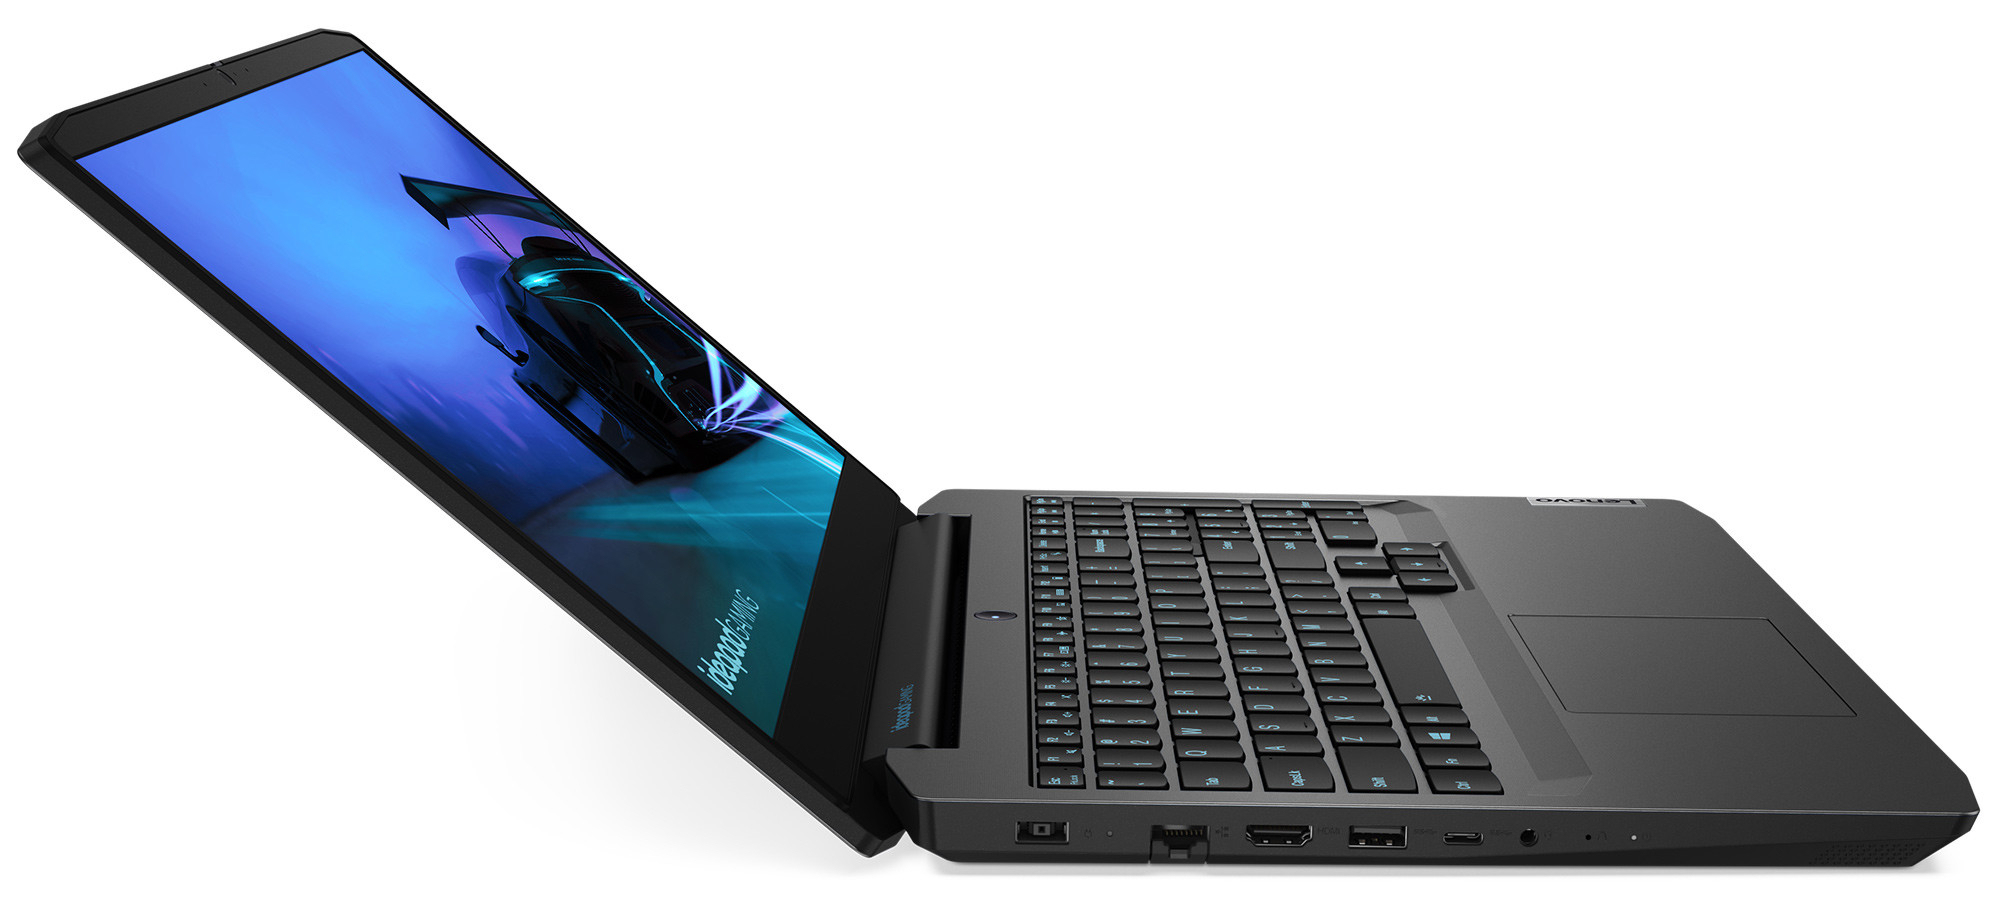
L'écran IPS Full HD 120 Hz possède de larges angles de vision, une surface matte, des temps de réponse corrects, et des couleurs fidèles. En revanche la luminosité est tout juste suffisante, et le contraste et la couverture des espaces colorimétriques trop faibles. Même un PC portable d'entrée de gamme devrait faire mieux.
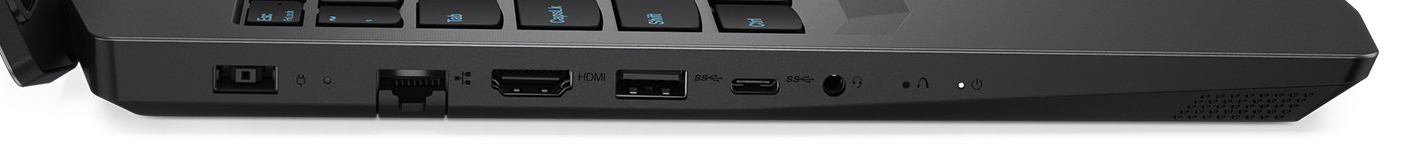
L'appareil n'a pas beaucoup de ports (ni de lecteur de carte, ni de port Thunderbolt 3). Le port USB C 3.2 Gen 1 disponible ne prend pas même en charge le DisplayPort via USB C. Le clavier (deux niveaux de rétroéclairage) s'avère suffisant pour le quotidien, et l'autonomie et bonne.
L’intégralité de cette critique est disponible en anglais en suivant ce lien.
Lenovo IdeaPad Gaming 3i 15IMH05
- 07/02/2020 v7 (old)
Sascha Mölck
Price comparison
