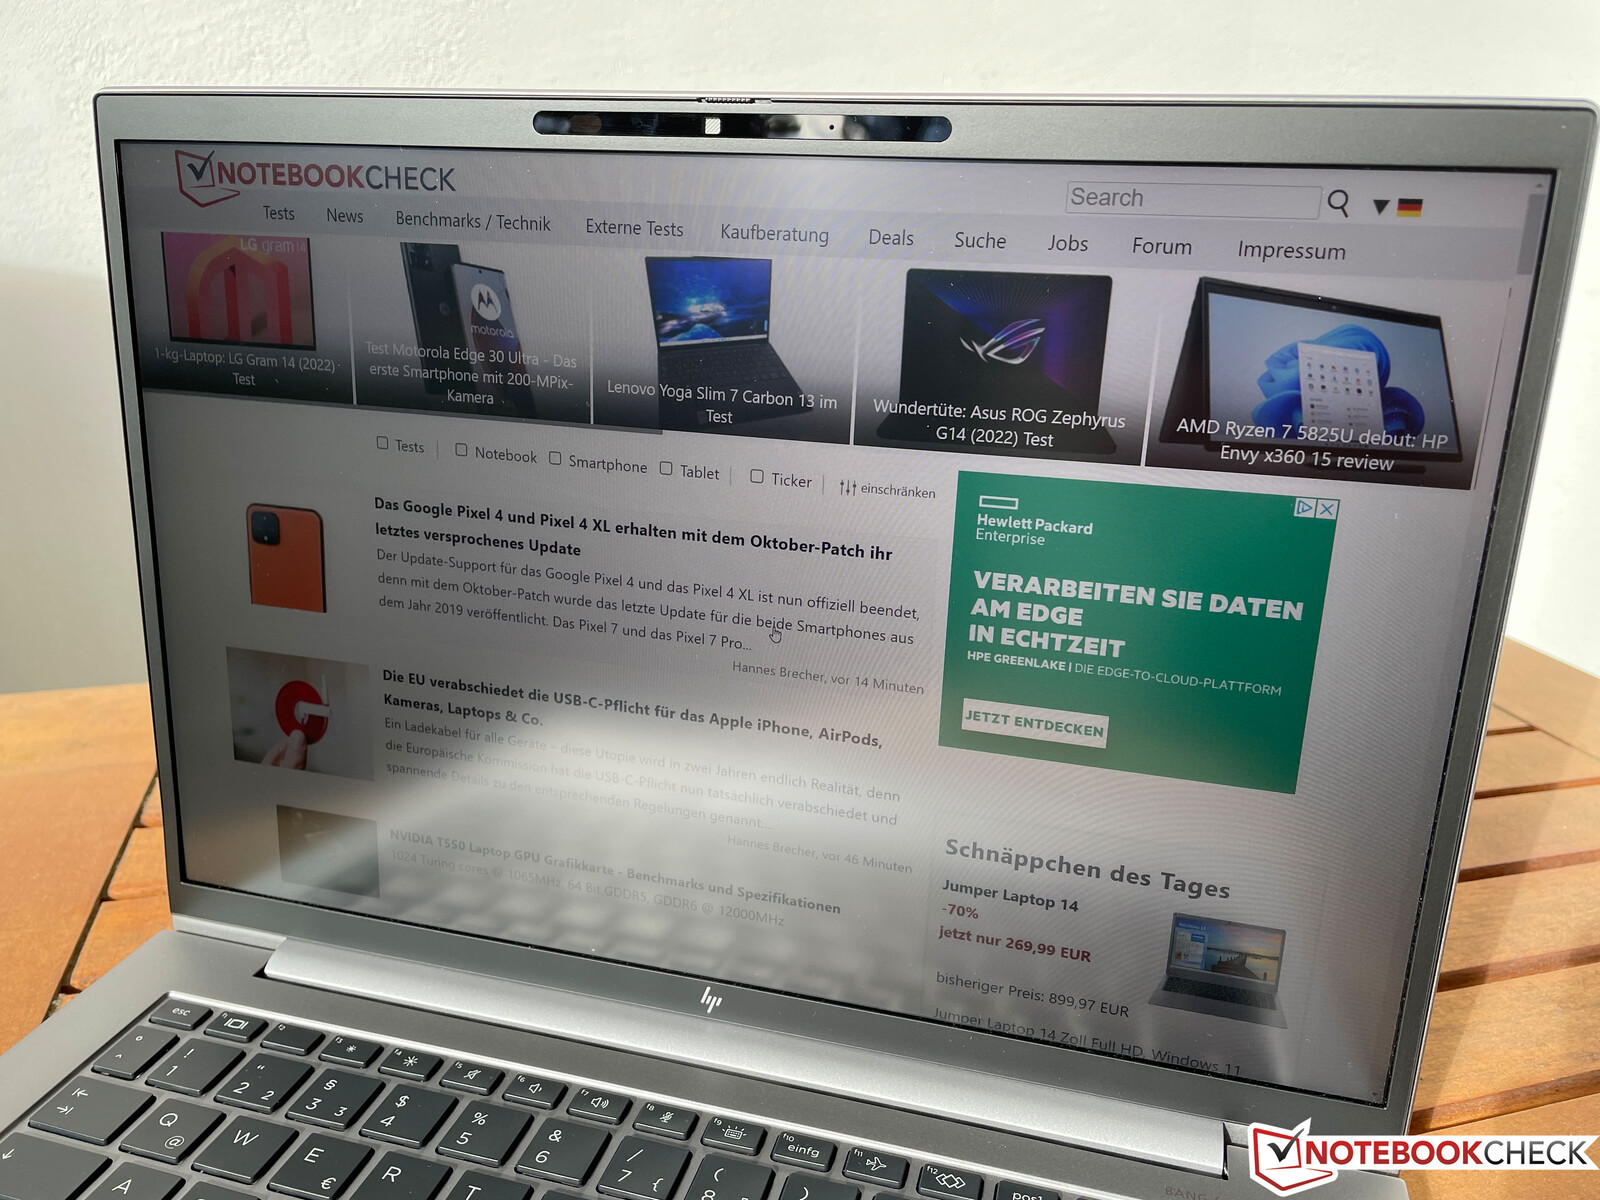
Test du HP ZBook Firefly 14 G9 : Intel Alder Lake-U ralentit cette station de travail mobile
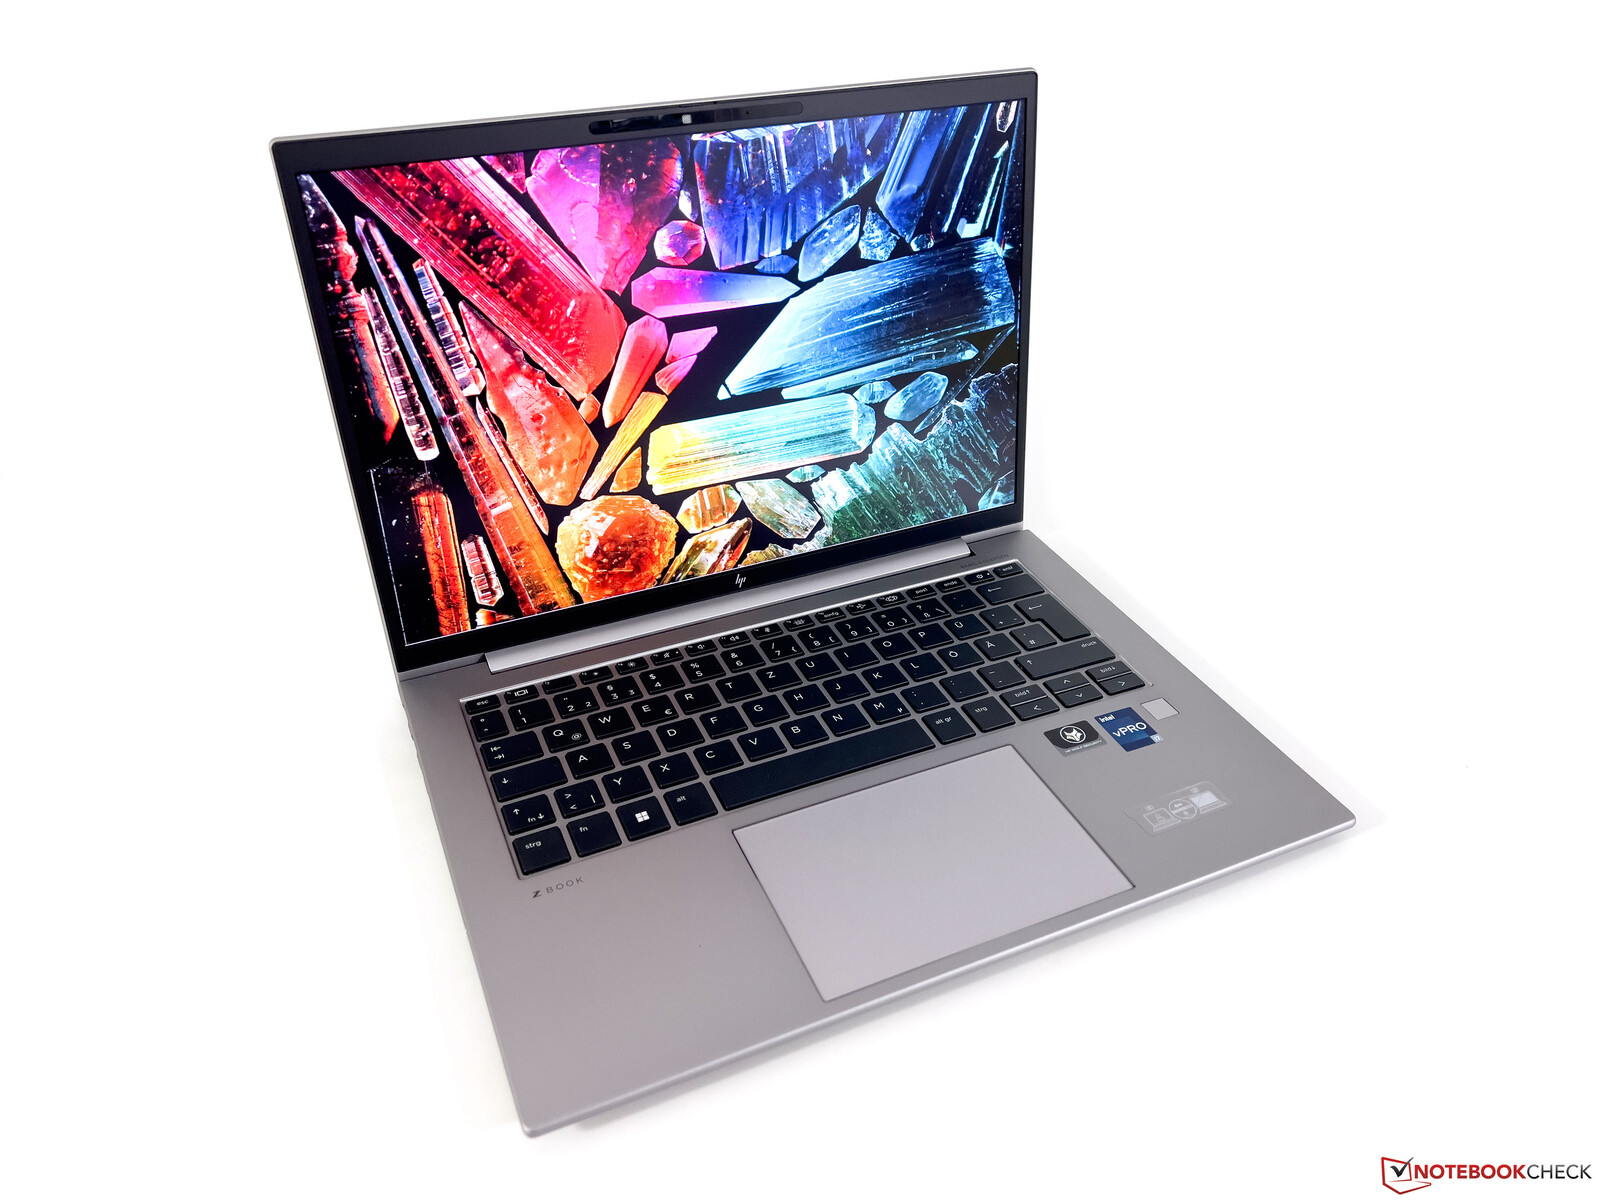
Nous avons récemment examiné le plus grand ZBook Firefly 16 G9 et maintenant nous jetons un coup d'œil à la station de travail mobile de HP avec un écran de 14 pouces. Comme son grand cousin, le ZBook Firefly 14 G9 est également équipé d'un processeur Intel Alder Lake actuel et d'un processeur Nvidia T550 dédié Nvidia T550 et vise donc le secteur professionnel d'entrée de gamme.
Notre configuration portant la désignation 6B8A2EA utilise leCore i7-1265Ule Nvidia T550, 32 Go de RAM, un SSD de 1 To et une dalle Full HD mate au format 16:10. Cette configuration est actuellement vendue au détail pour environ 2 100 € (~2 075 $ US).
Comparaison avec les concurrents potentiels
Note | Date | Modèle | Poids | Épaisseur | Taille | Résolution | Prix |
|---|---|---|---|---|---|---|---|
| 83.6 % v7 (old) | 10/22 | HP ZBook Firefly 14 G9-6B8A2EA i7-1265U, T550 Laptop GPU | 1.5 kg | 19.9 mm | 14.00" | 1920x1200 | |
| 87.6 % v7 (old) | 09/22 | Dell Precision 5000 5470 i9-12900H, RTX A1000 Laptop GPU | 1.6 kg | 18.95 mm | 14.00" | 2560x1600 | |
| 85.1 % v7 (old) | 06/21 | Lenovo ThinkPad P14s Gen2-20VX000GGE i7-1185G7, T500 Laptop GPU | 1.5 kg | 18 mm | 14.00" | 1920x1080 | |
| 89 % v7 (old) | 03/22 | Microsoft Surface Laptop Studio i7 RTX 3050 Ti i7-11370H, GeForce RTX 3050 Ti Laptop GPU | 1.8 kg | 19 mm | 14.40" | 2400x1600 | |
| 92.7 % v7 (old) | 11/21 | Apple MacBook Pro 14 2021 M1 Pro Entry M1 Pro 8-Core, M1 Pro 14-Core GPU | 1.6 kg | 15.5 mm | 14.20" | 3024x1964 |
Mallette et équipement
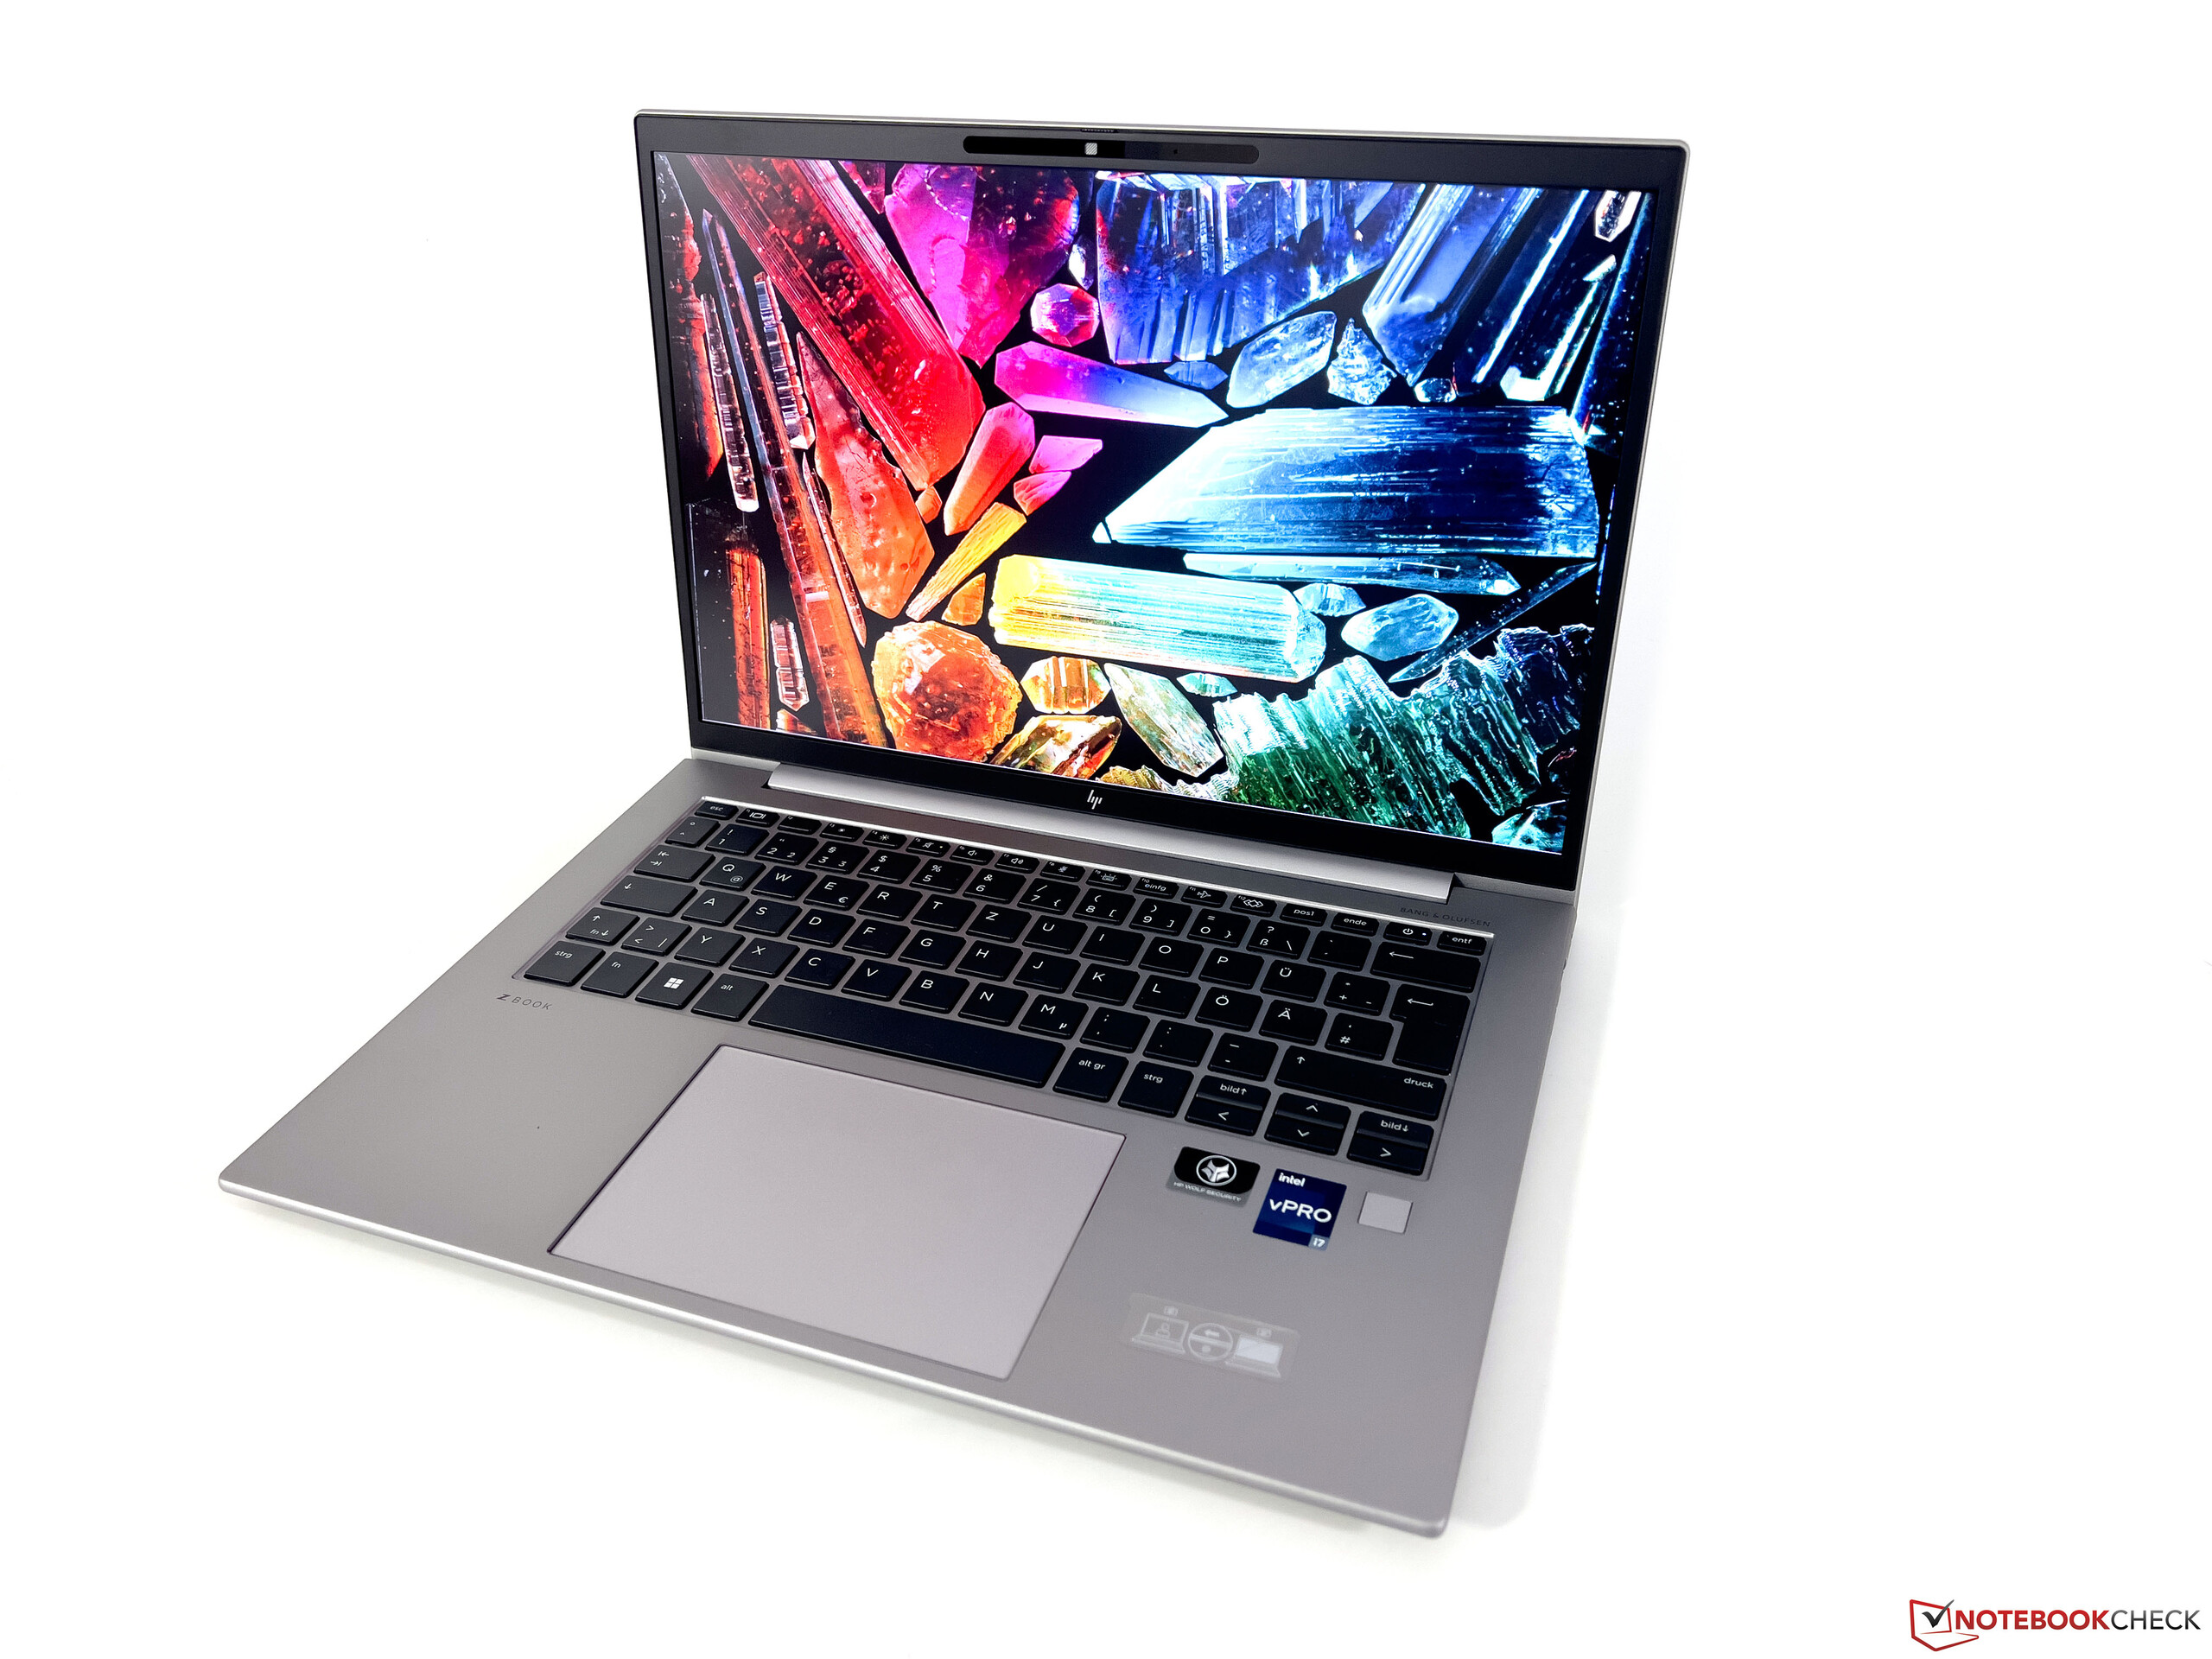
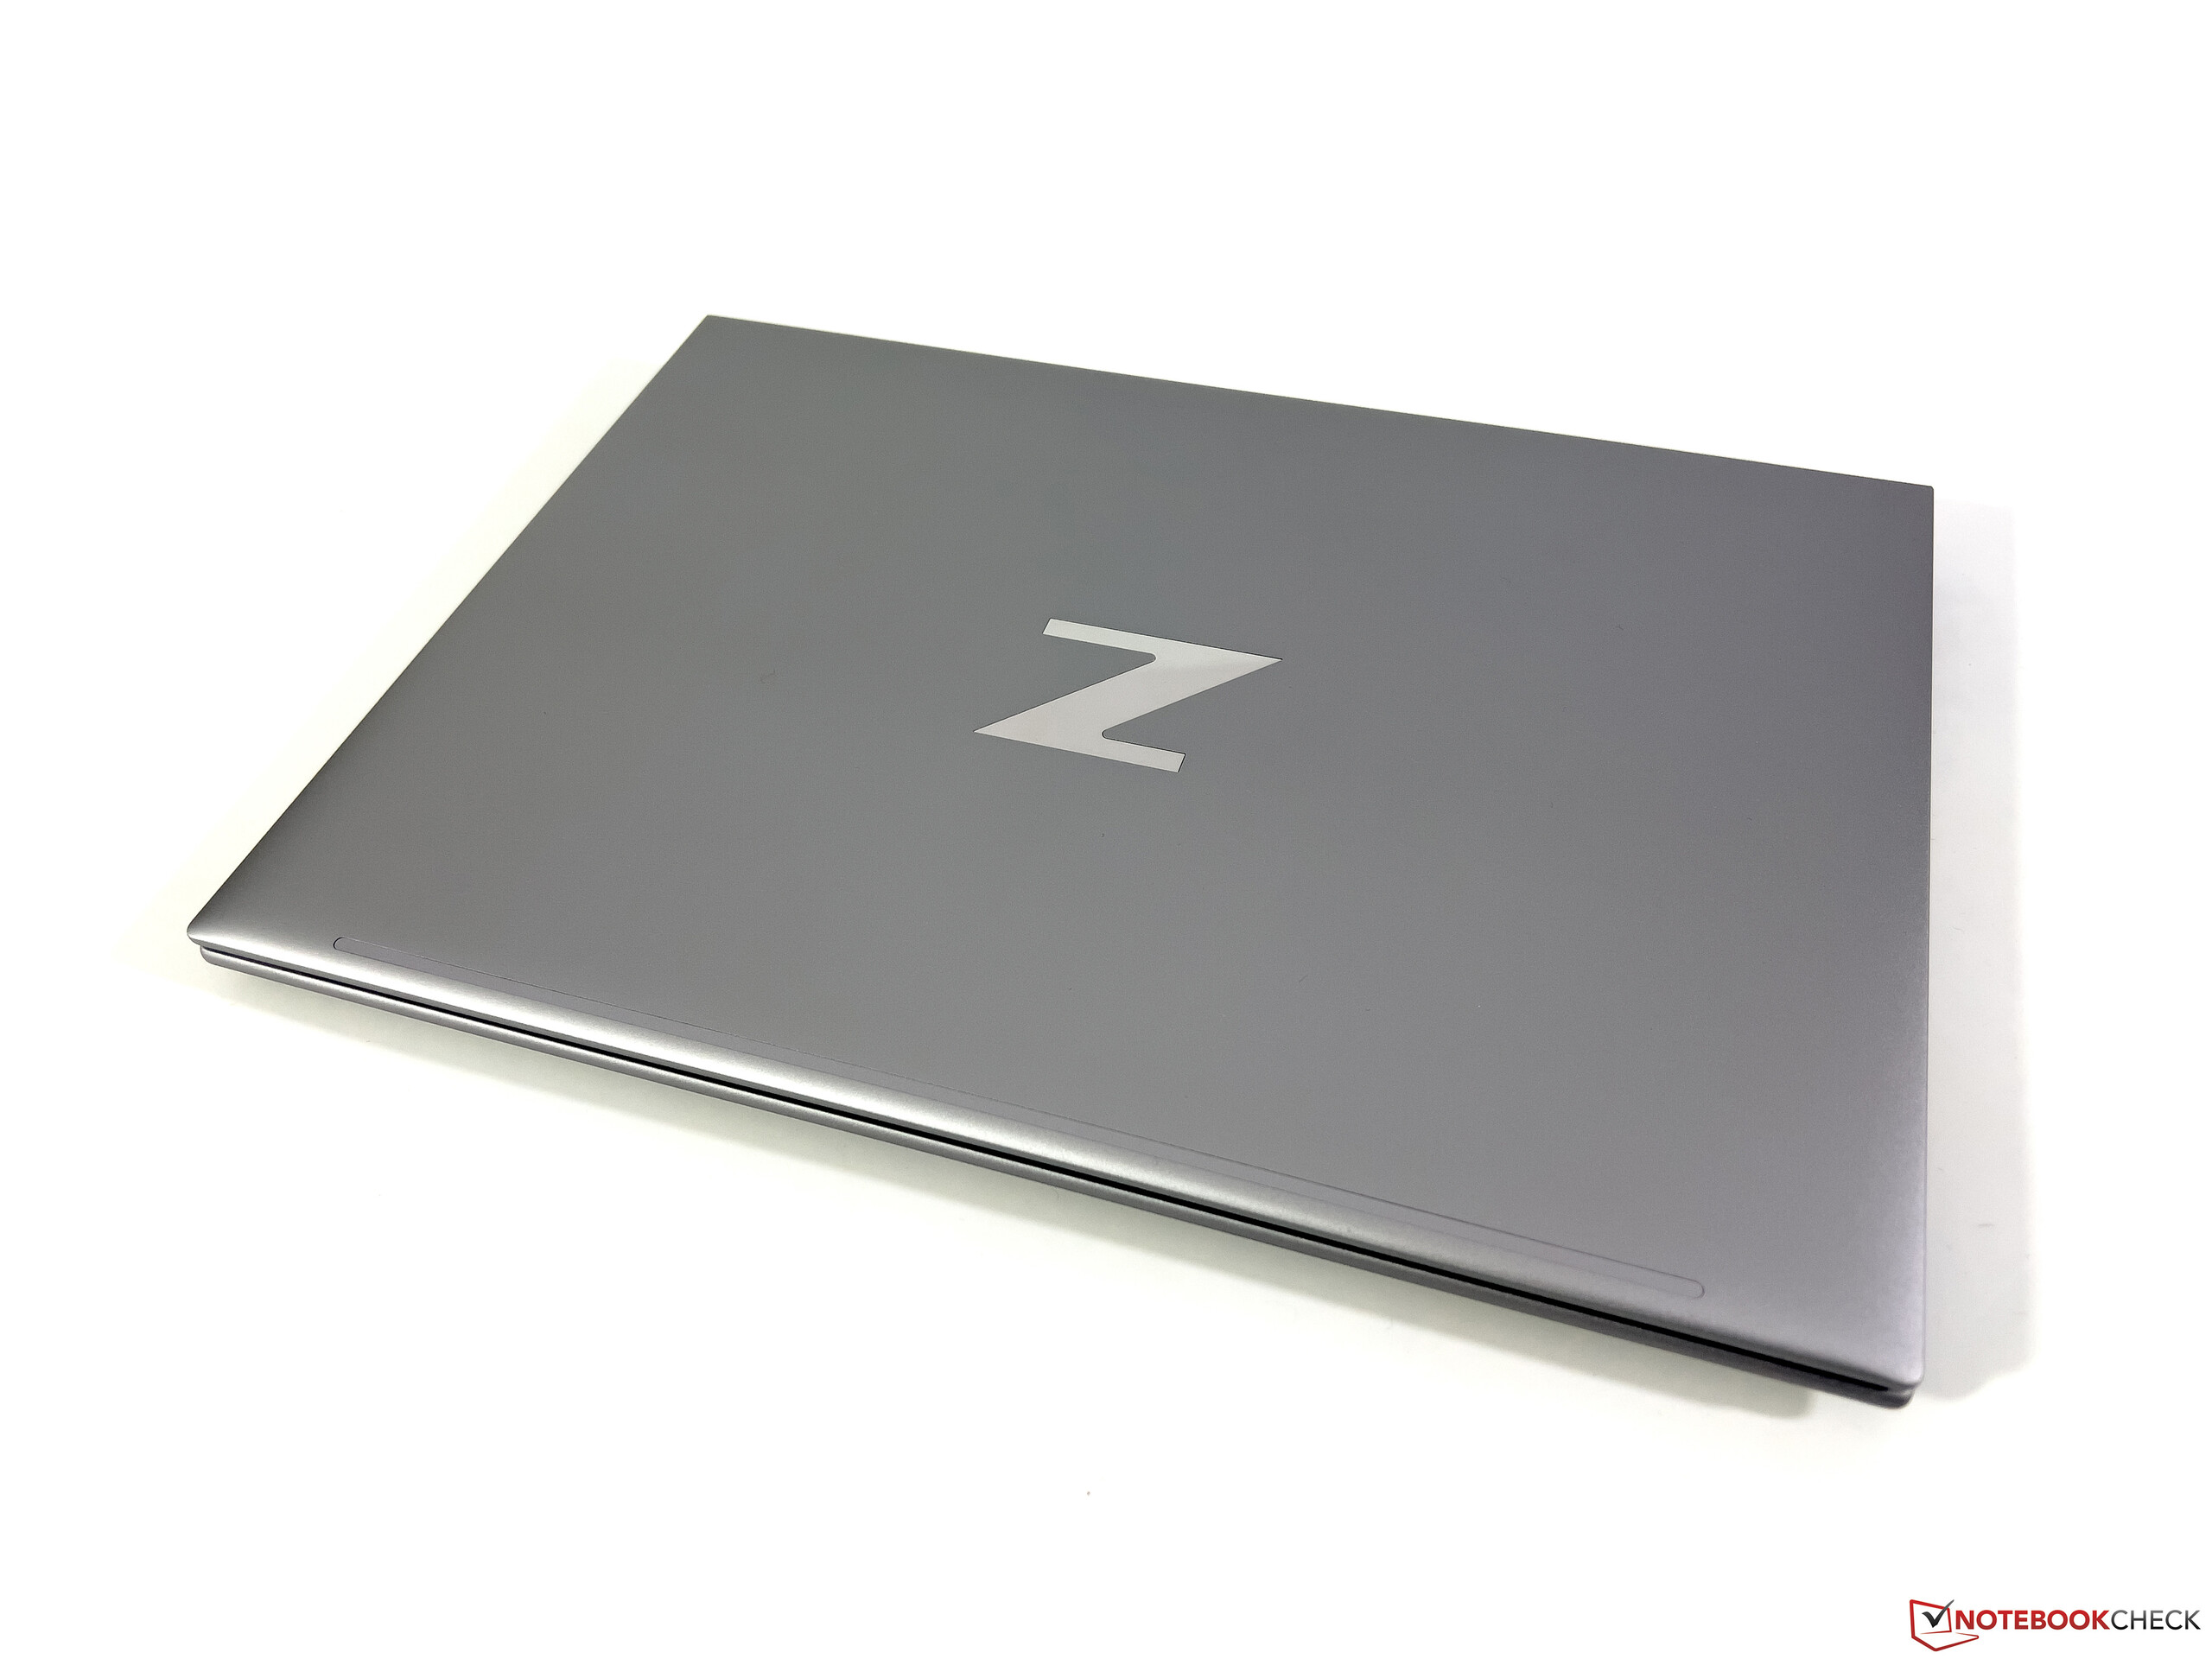
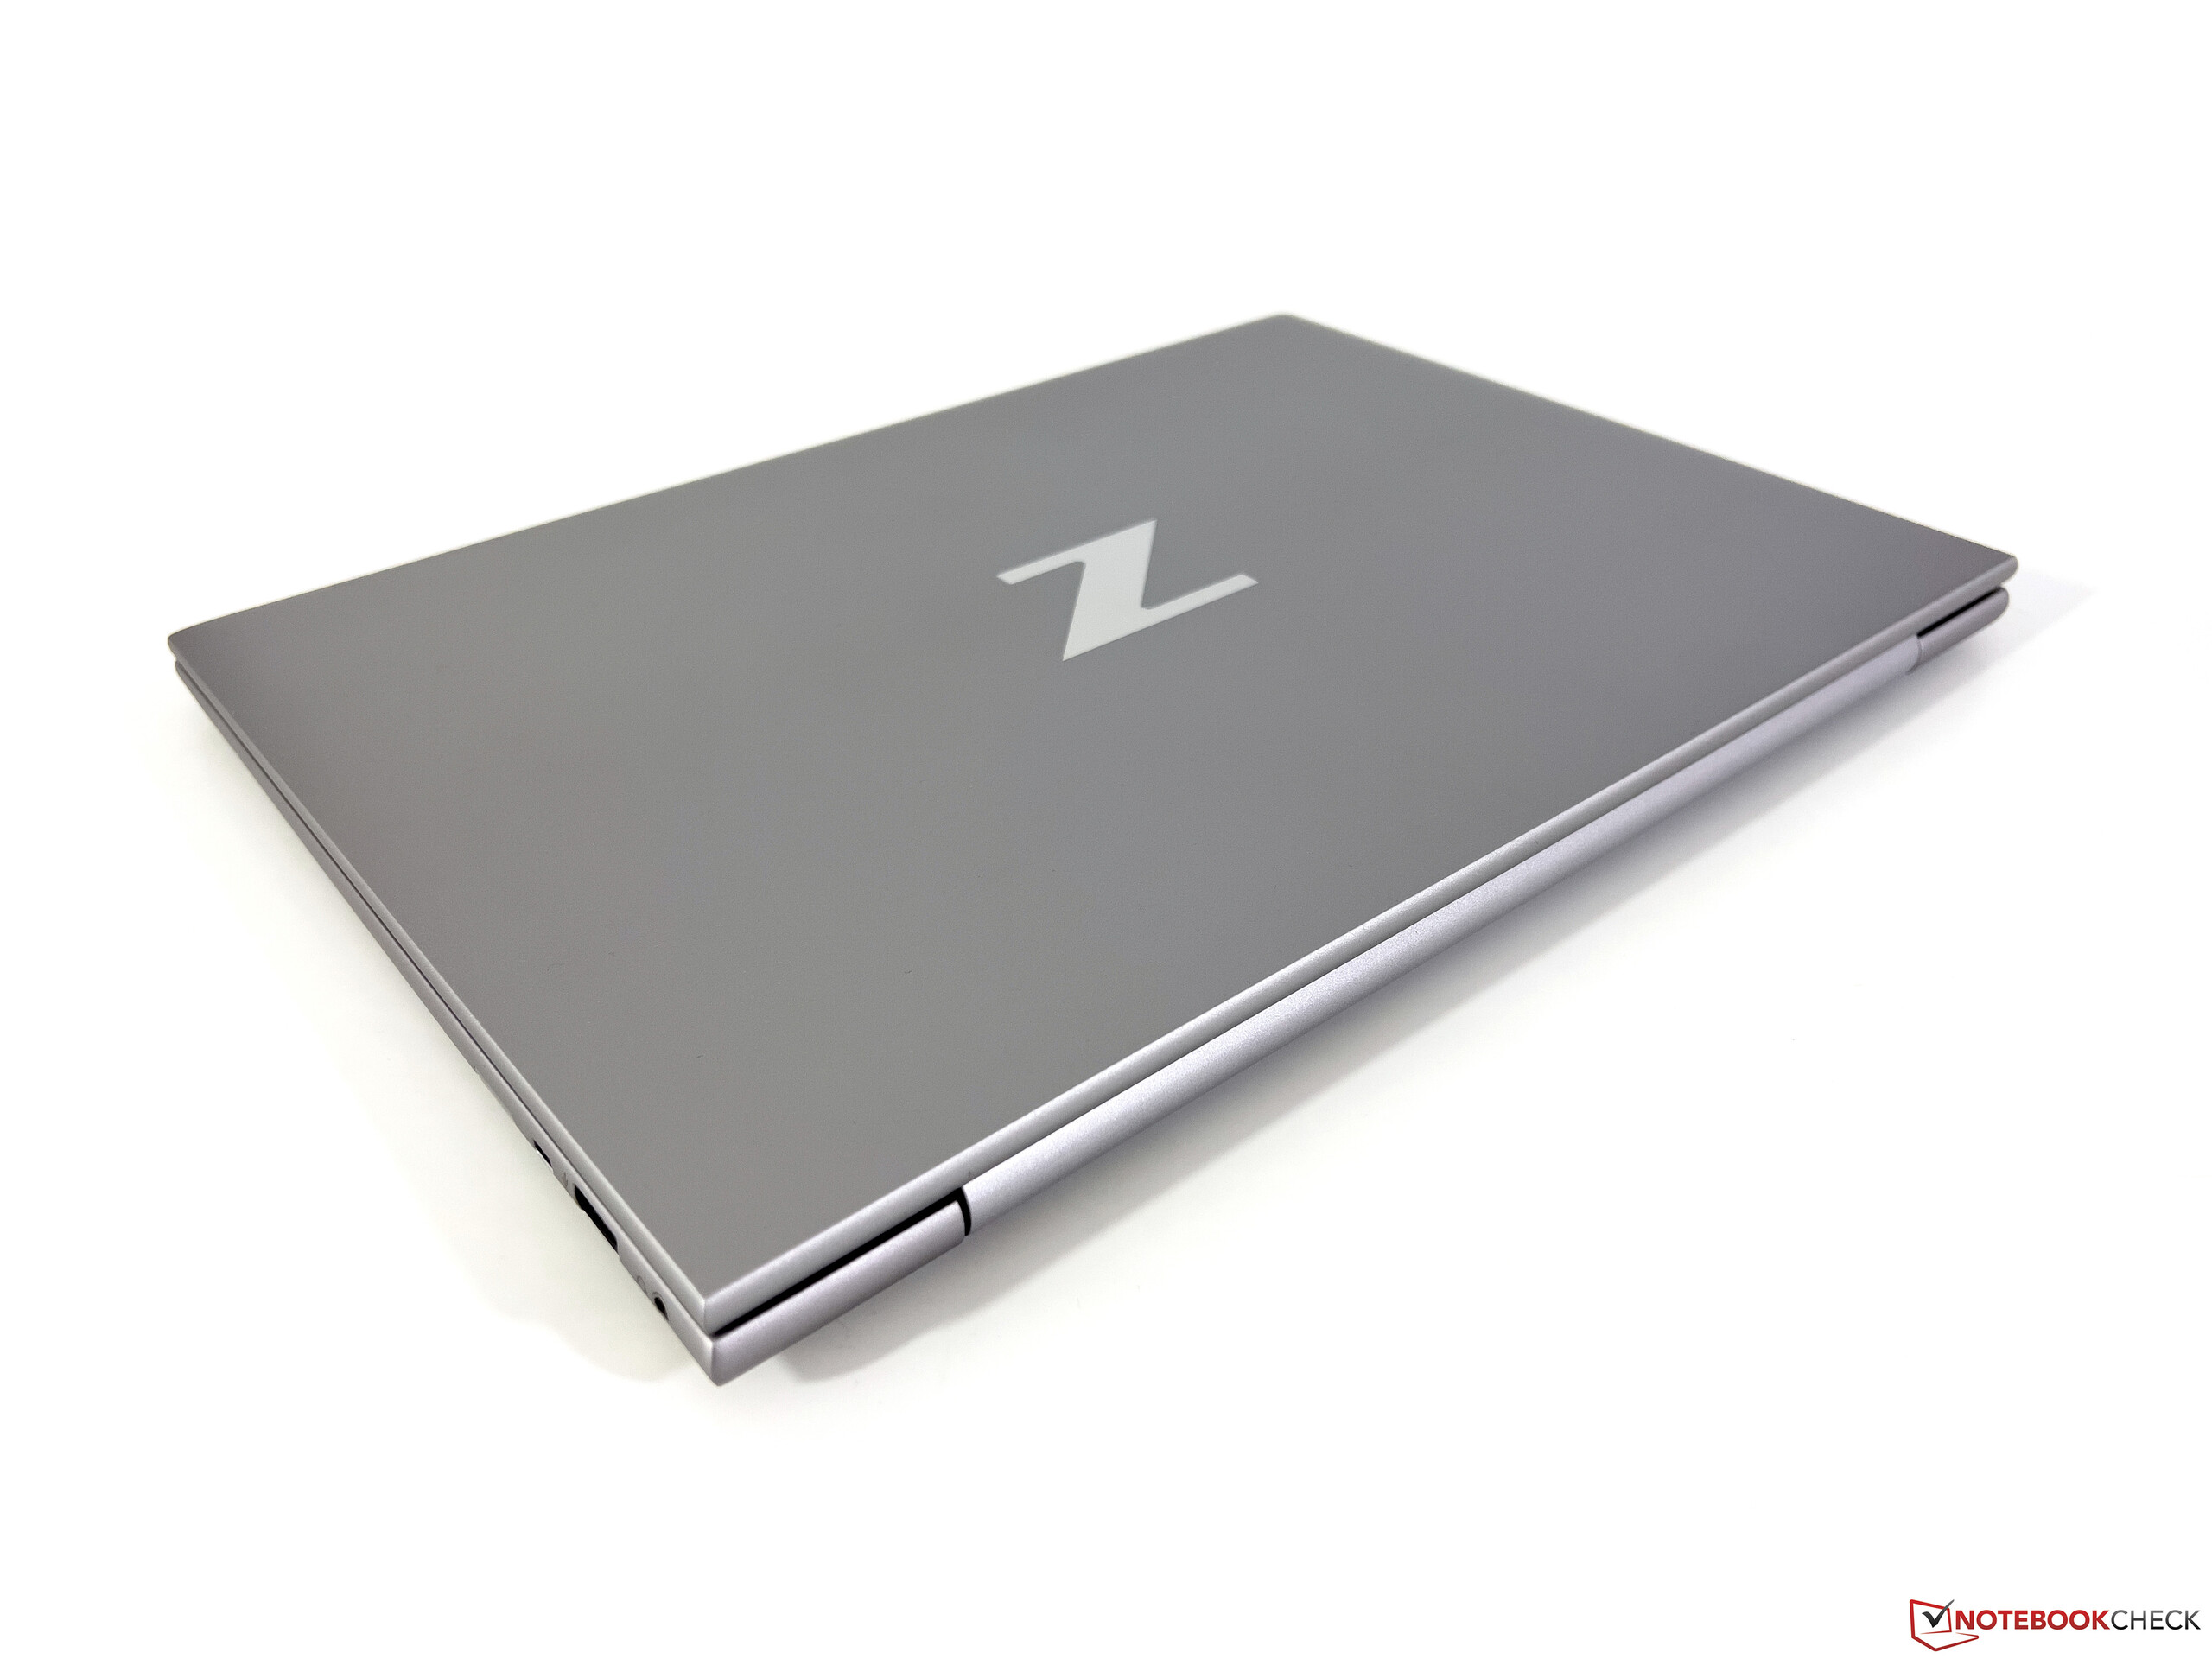
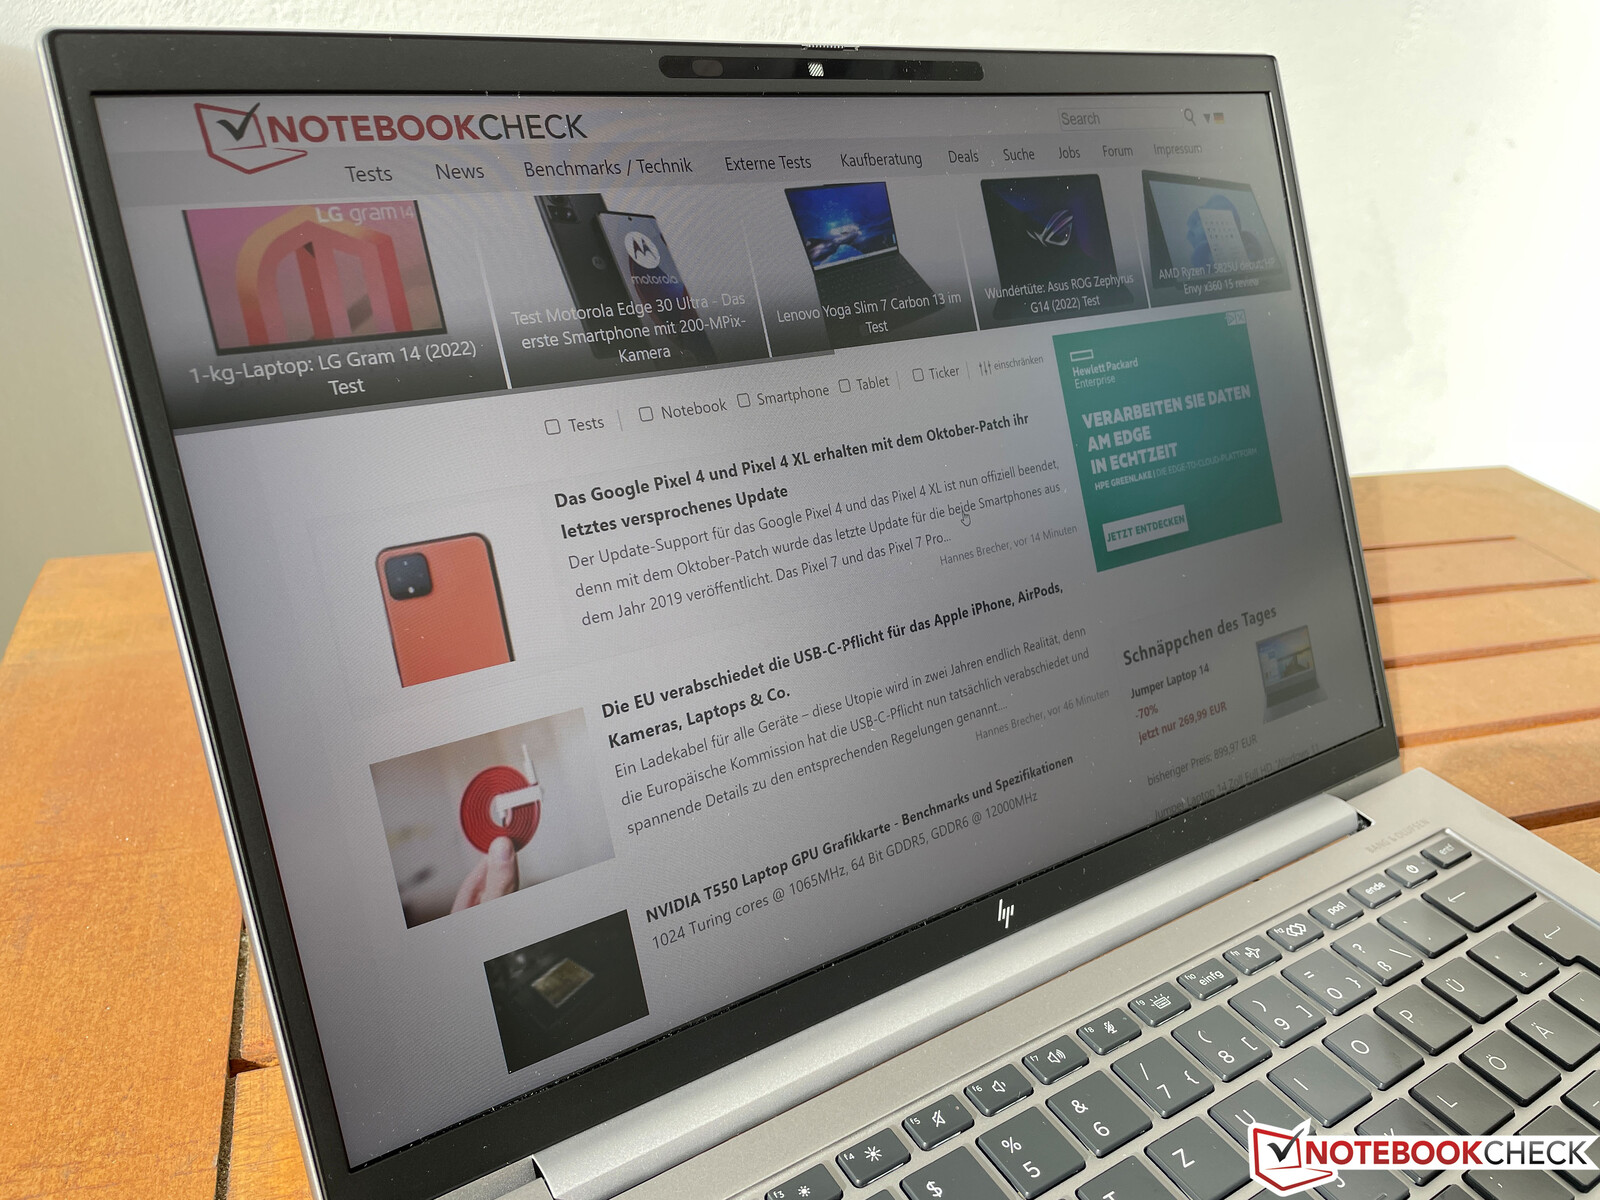
Le HP ZBook Firefly G9 utilise le même châssis que celui des modèles professionnels habituels de l'entreprise, tels que les EliteBook 840 G9 ou 845 G9mais la couleur argentée semble légèrement plus foncée sur cette station de travail mobile. Le boîtier en aluminium laisse une impression de haute qualité et est également très stable. Nous n'avons pas rencontré de problèmes tels que la lunette de l'écran qui se détache (voir l'article sur l'EliteBook 845 G9) critique de l'EliteBook 845 G9). Grâce à l'affichage 16:10 et aux bords étroits de l'écran, ce 14 pouces compact a l'air assez moderne mais ne se distingue pas particulièrement dans un environnement professionnel avec son design plutôt sobre. L'angle d'ouverture maximal est d'environ 170 degrés et les charnières sont bien ajustées. Il est possible d'ouvrir le couvercle d'une seule main sans problème tout en évitant presque totalement de vaciller en même temps.
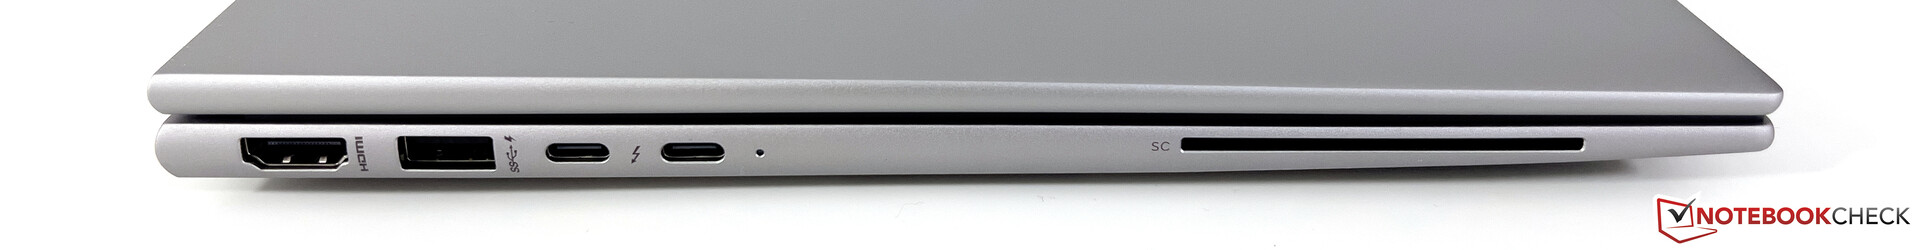
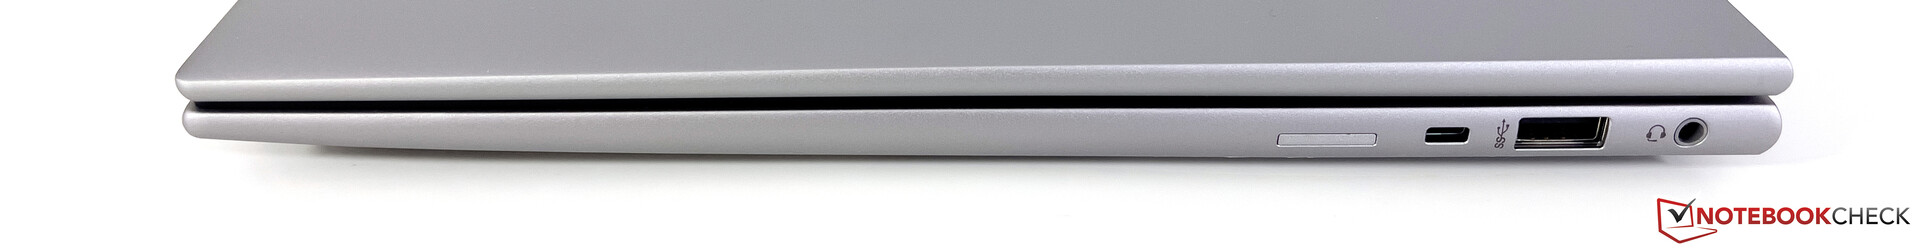
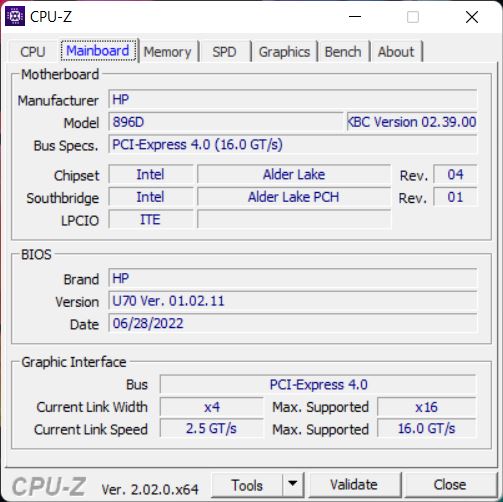
Le ZBook offre tous les ports importants, notamment deux ports USB-C avec prise en charge de Thunderbolt 4, qui permettent également l'alimentation électrique ou la connexion à une station d'accueil. Outre une sortie HDMI à part entière, on trouve également un lecteur de carte à puce et un emplacement pour une carte nano-SIM dans les modèles WWAN (en option avec 5G). Le module WWAN ne peut toutefois pas être mis à niveau. HP utilise le module WLAN moderne AX211 d'Intel, qui prend en charge la norme Wi-Fi 6E. Nous avons pu nous connecter au réseau 6 GHz de notre routeur de référence d'Asus sans aucun problème lors du test et les taux de transfert sont très bons. Un port Ethernet et un lecteur de cartes ne sont pas inclus.
En plus d'une caméra IR, HP a installé une webcam de 5 MP avec une ouverture mécanique, qui n'enregistre que des photos d'un maximum de 2 560 x 1 440 pixels (3,7 MP). Les vidéos peuvent être enregistrées au maximum en 1440p à 30 images par seconde. La caméra laisse une bonne impression et peut se démarquer des habituels modules 720p ou 1080p en termes de netteté d'image ainsi que de fidélité des couleurs.


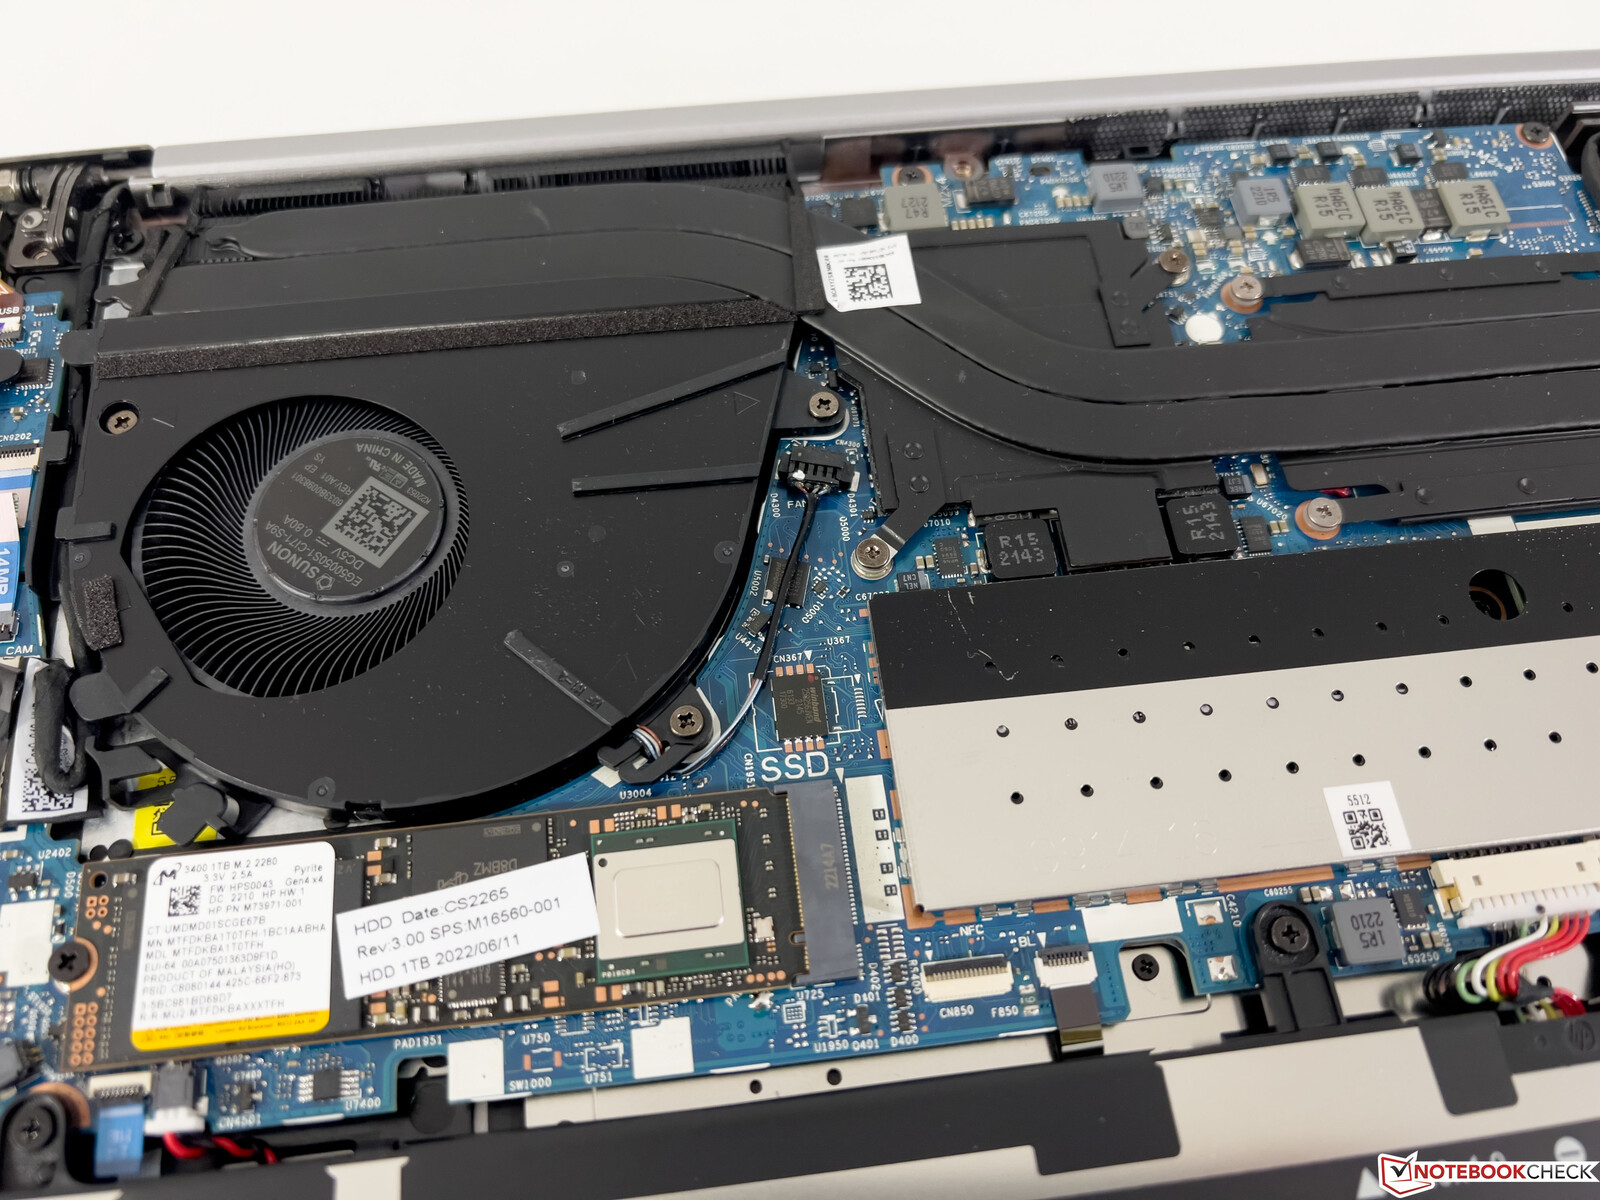
Maintenance
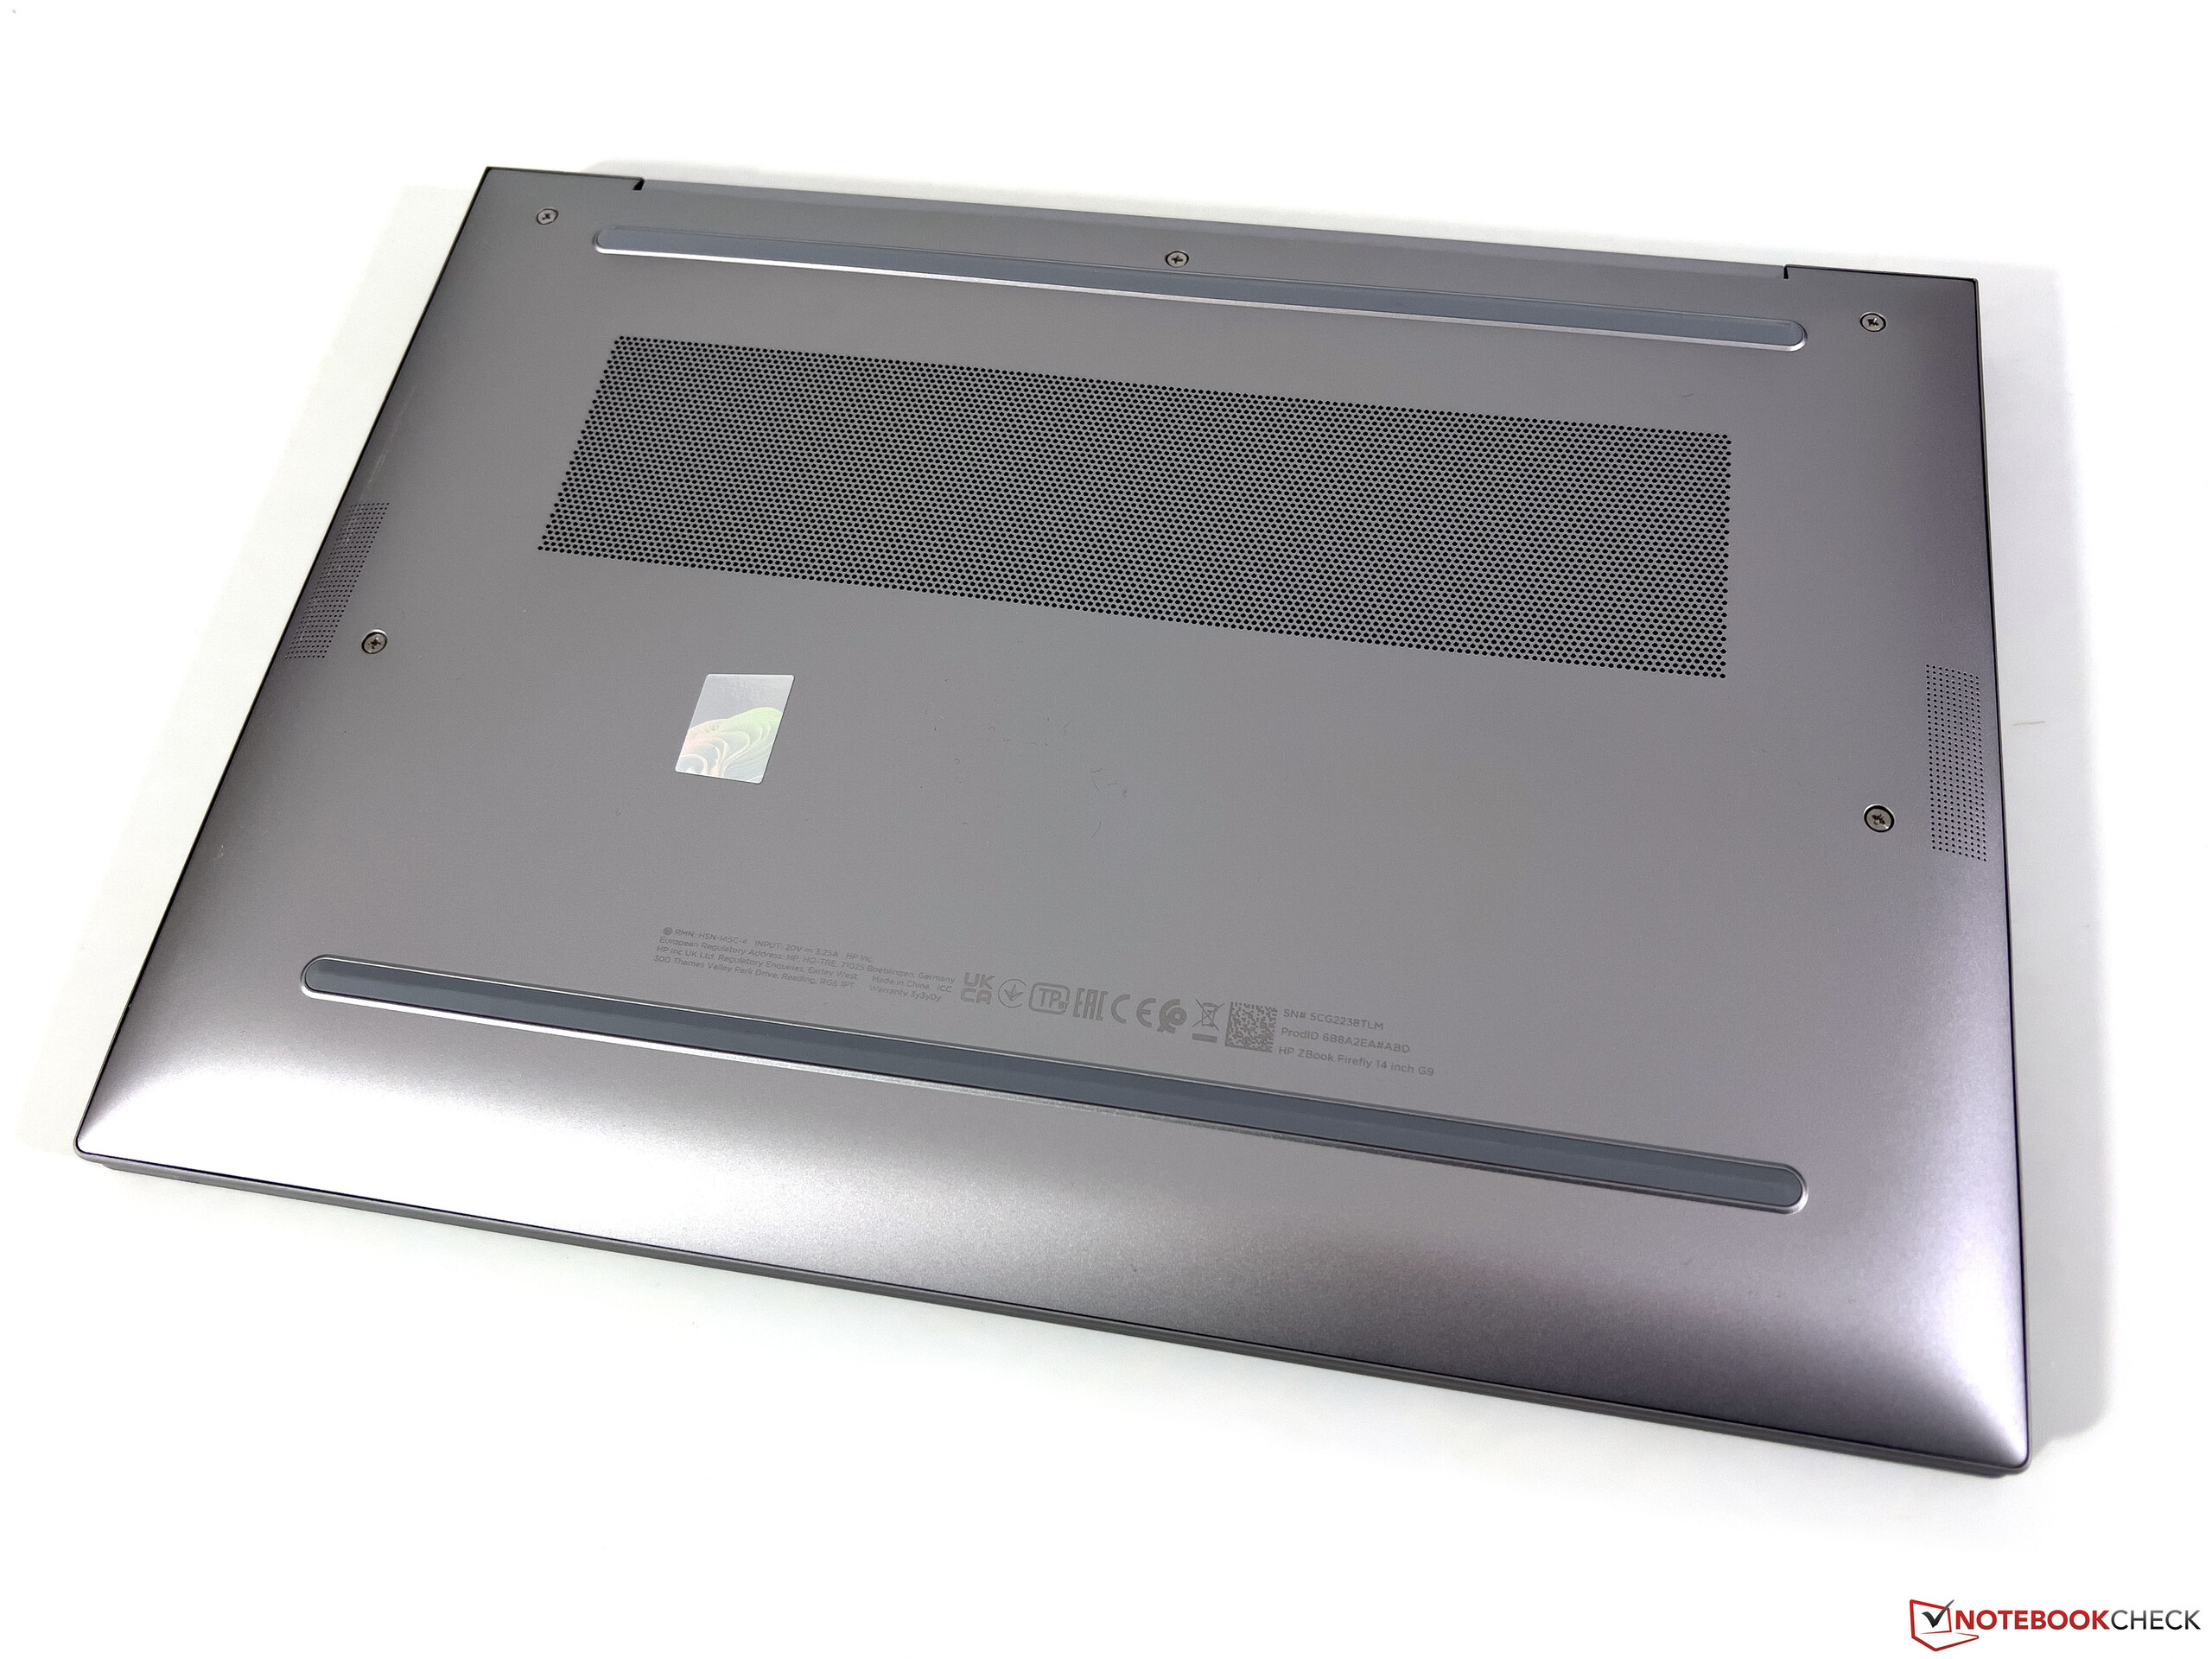
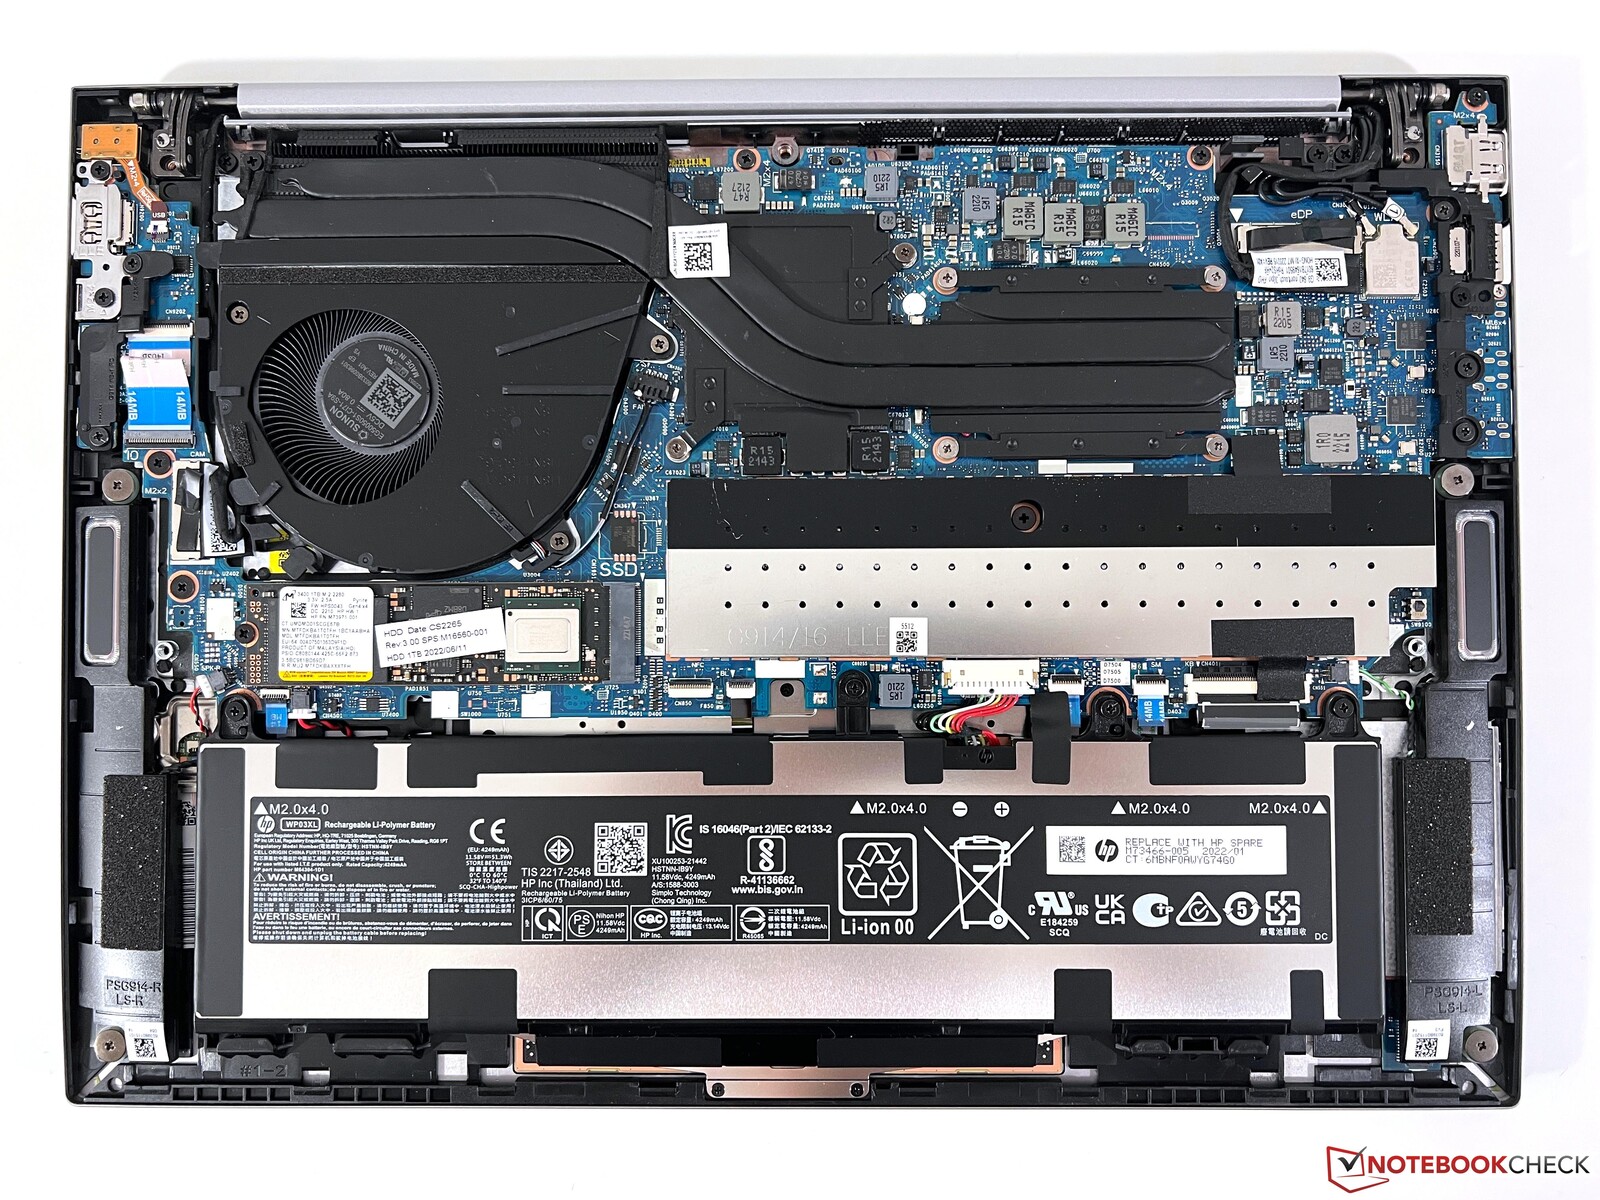
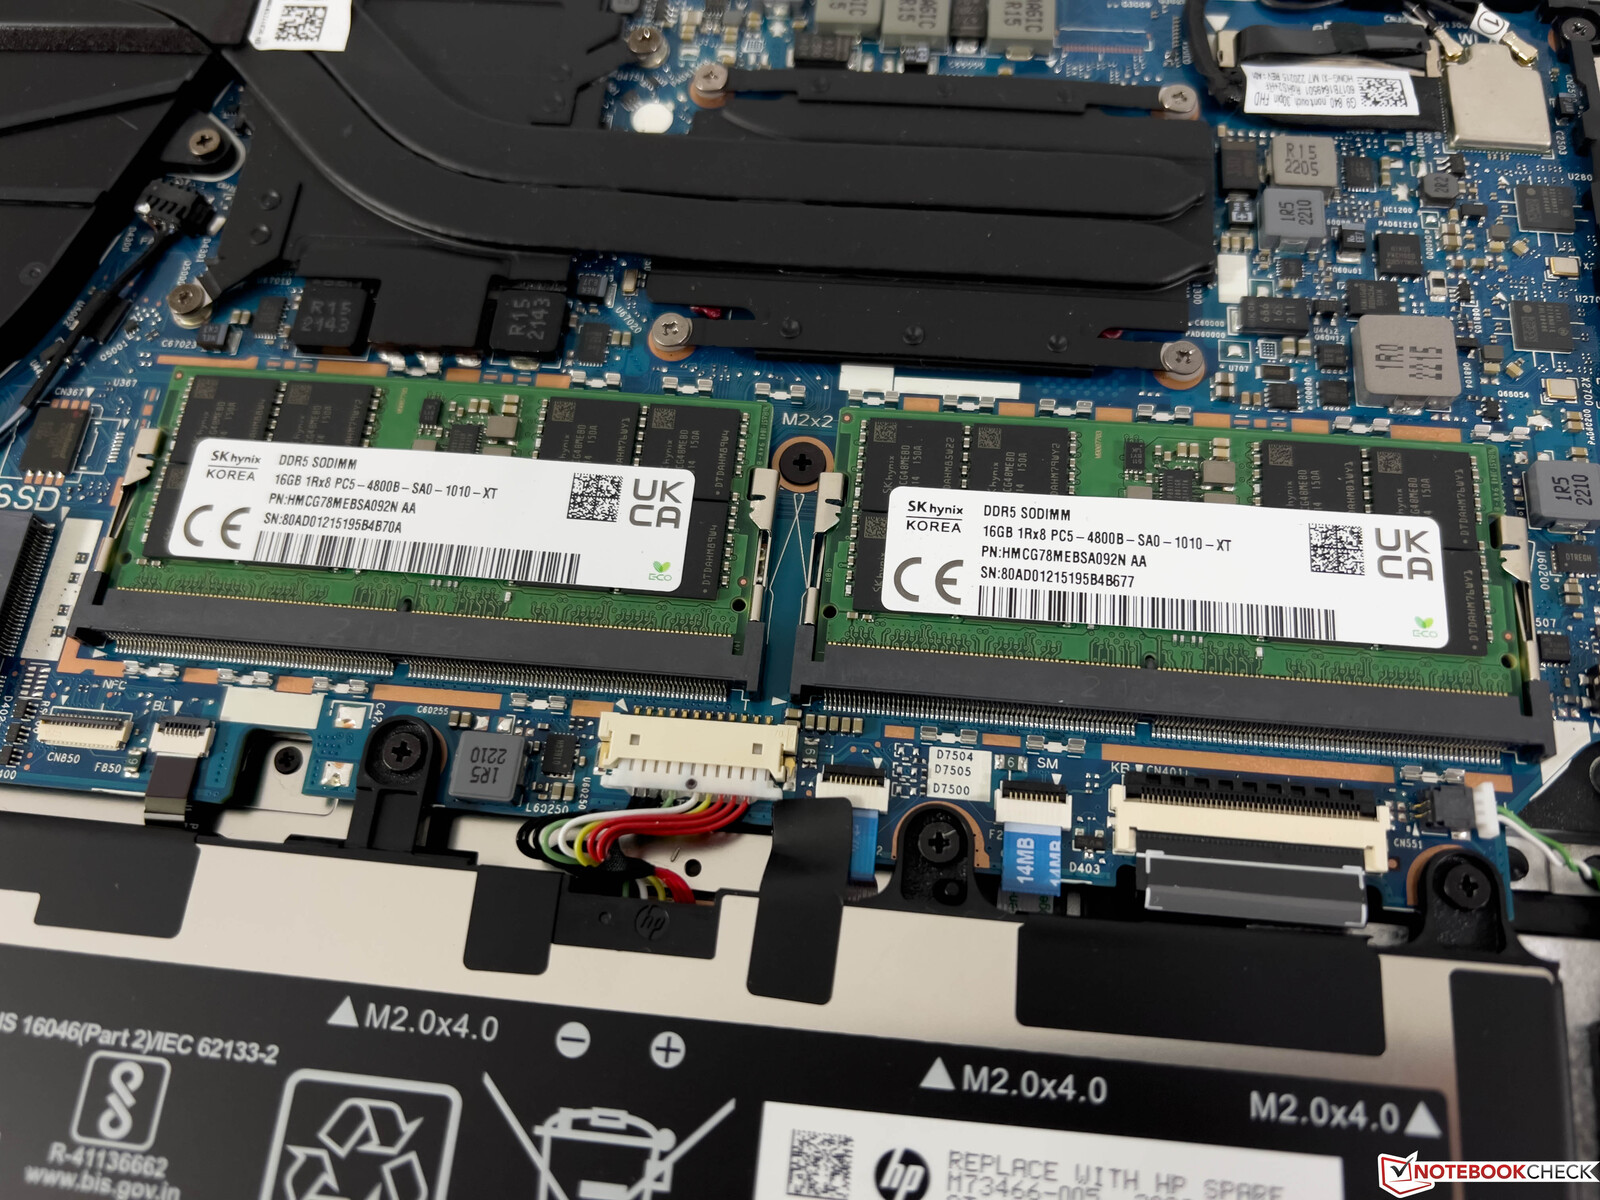
Le couvercle inférieur du boîtier est fixé par des vis Philips classiques (elles se desserrent seulement et ne se dévissent pas complètement) et peut être facilement retiré. A l'intérieur, vous avez accès au ventilateur, à la batterie vissée, au slot M.2-2280 ainsi qu'aux deux slots SO-DIMM, qui sont situés sous un couvercle supplémentaire. En revanche, le module WLAN est soudé sur la carte mère.
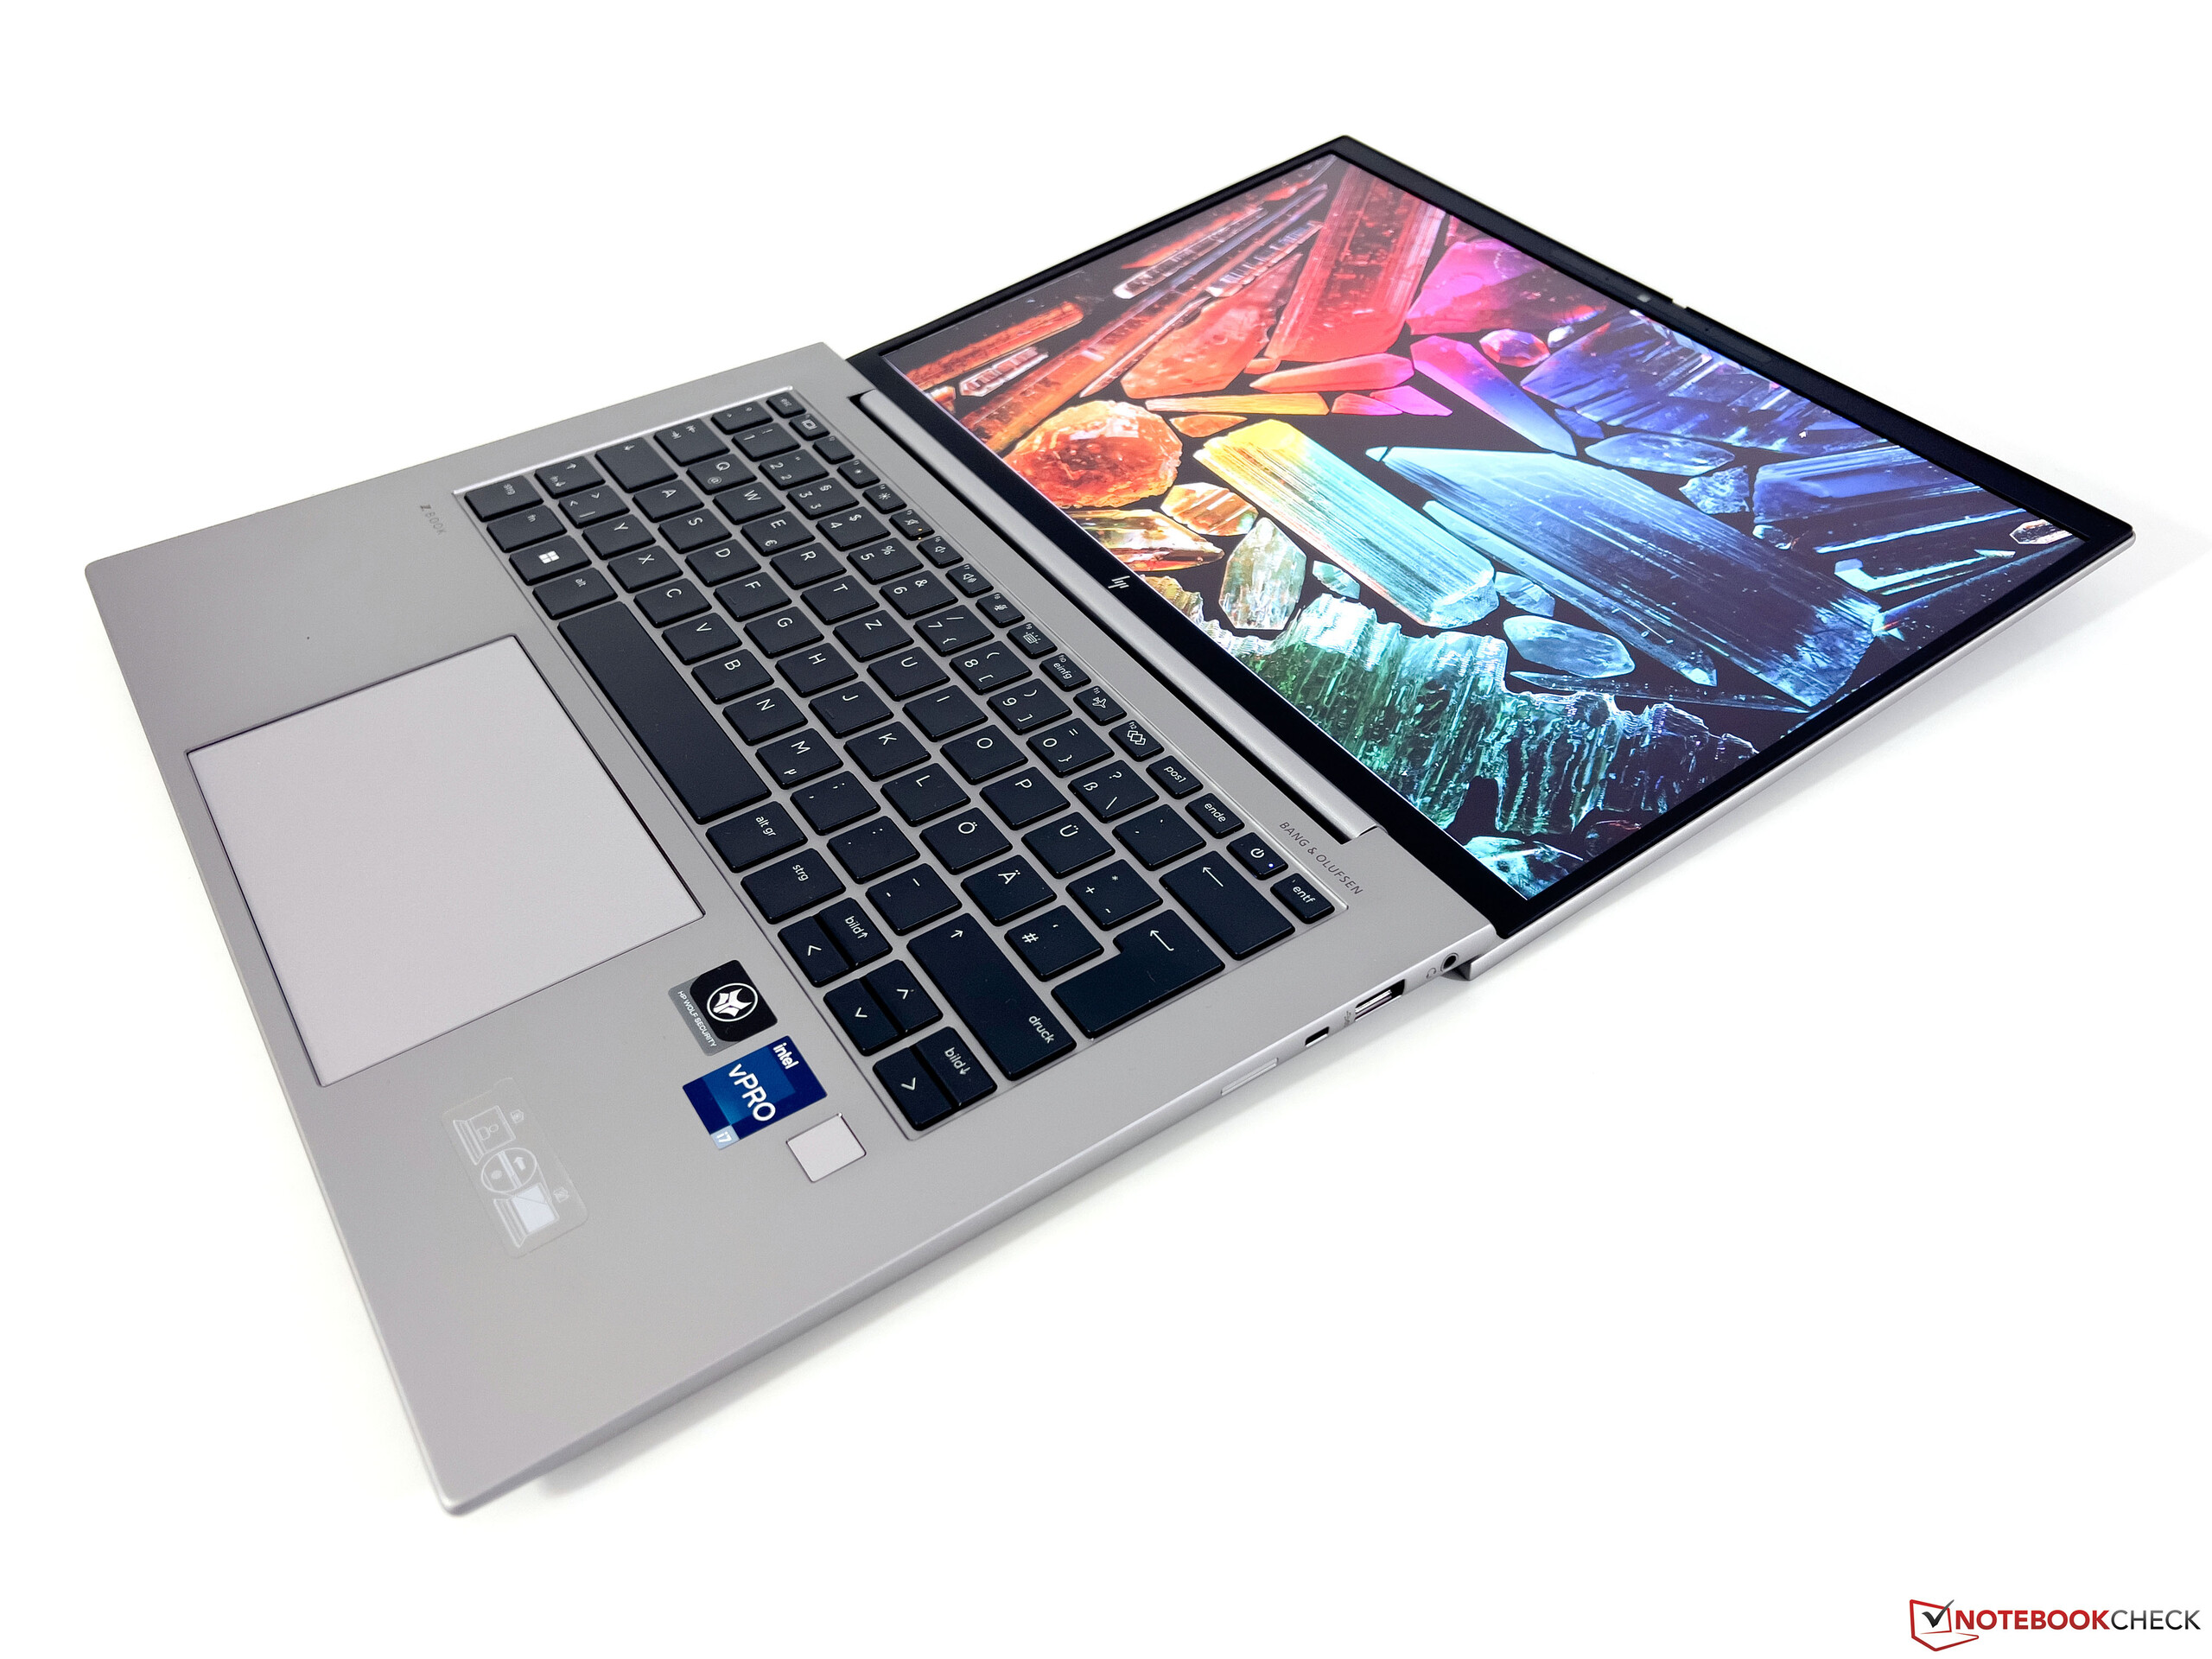
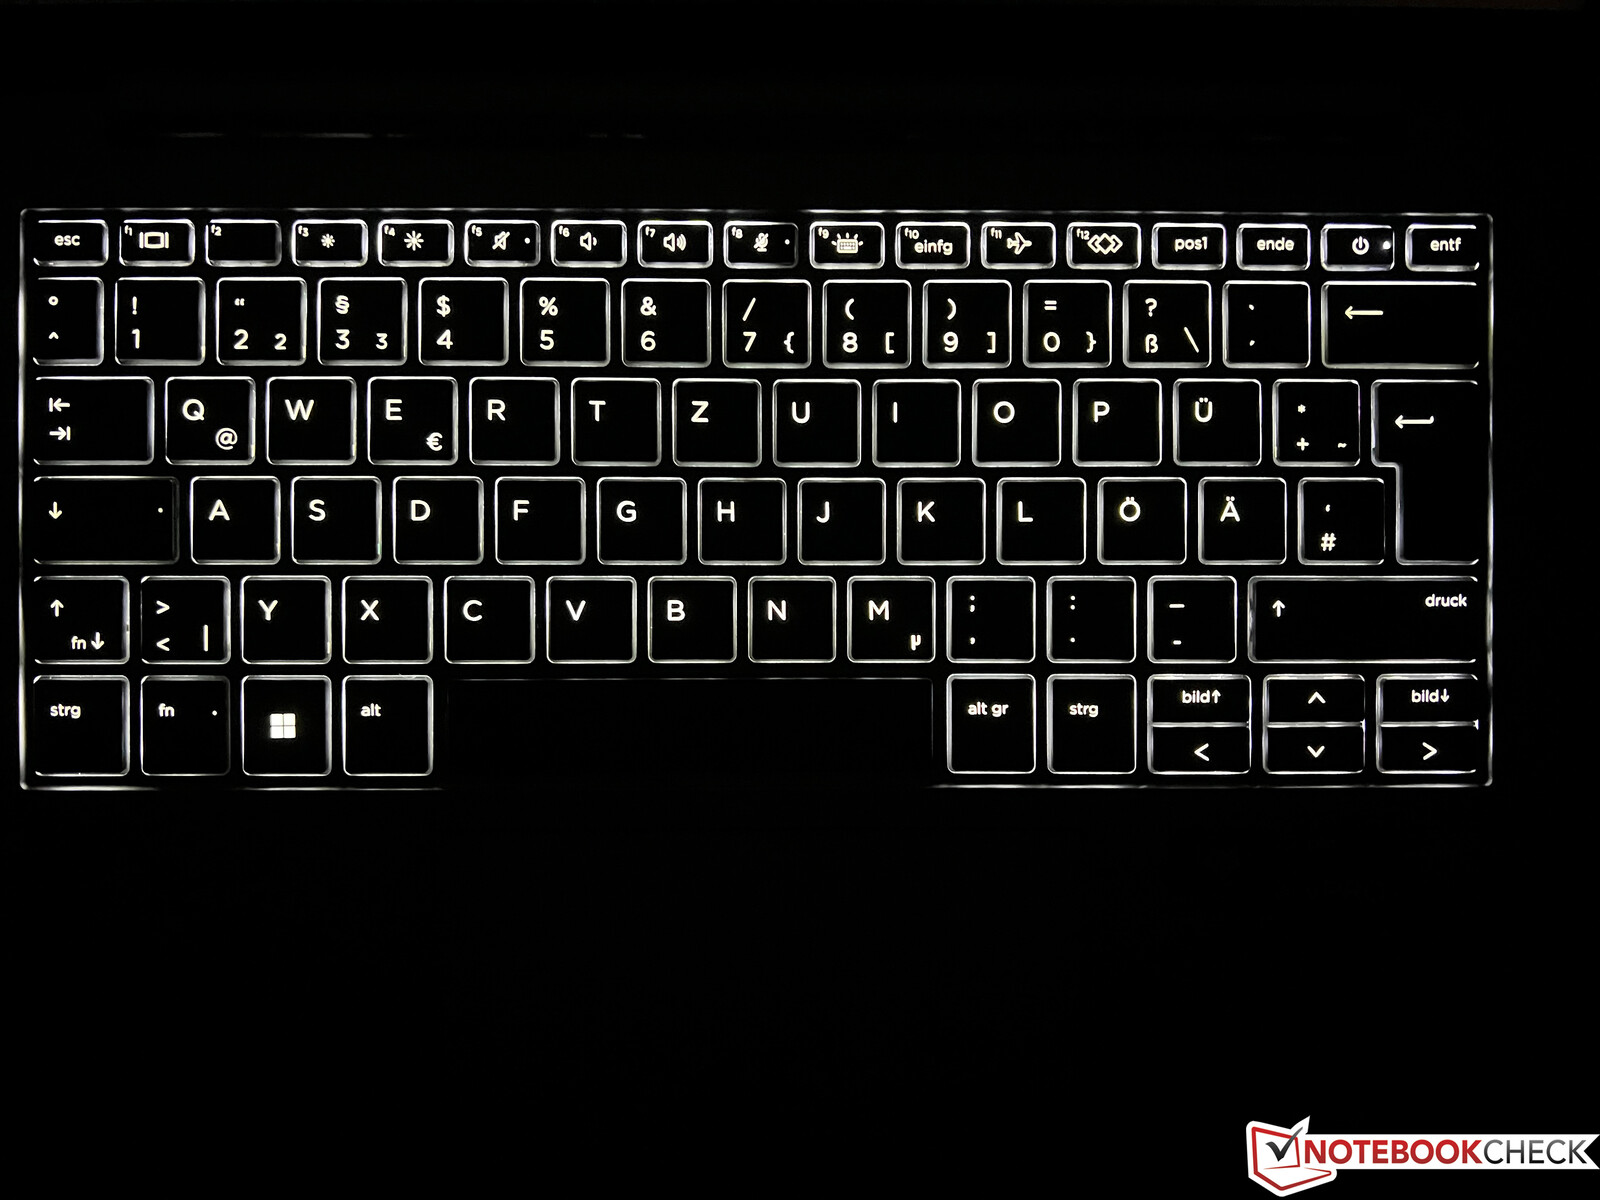
Périphériques d'entrée : Zbook avec un très bon clavier
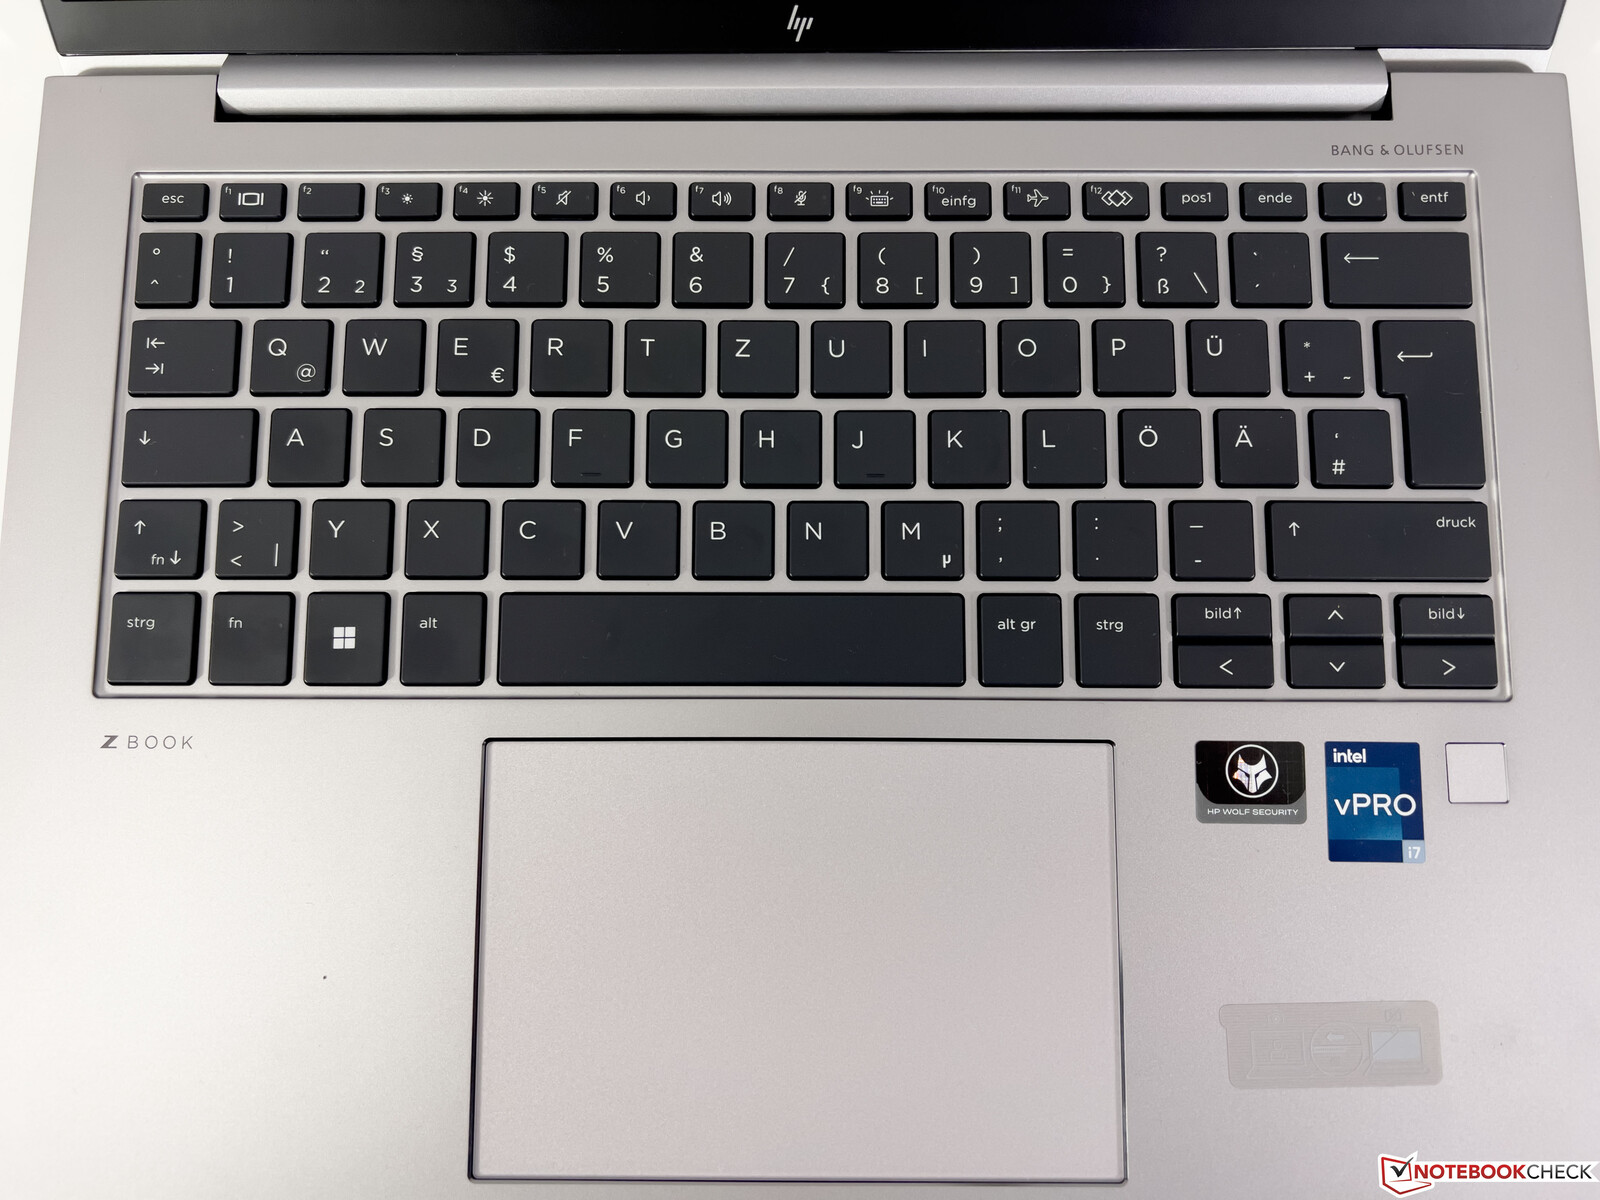
Le clavier rétroéclairé offre un point de pression ferme et une expérience de frappe très confortable dans l'ensemble, ce qui rend le ZBook adapté à la rédaction de très longs textes. Le bouton d'alimentation est intégré dans la partie supérieure droite du clavier et il y a un risque de toucher accidentellement la touche. En outre, les touches fléchées sont très petites. Le scanner d'empreintes digitales est situé sous le clavier, sur le côté droit.
Le grand pavé tactile (12 x 8 cm) offre de bonnes propriétés de glisse et fonctionne très bien dans une utilisation quotidienne. Il est possible d'appuyer sur la partie inférieure du pavé, ce qui se traduit par un bruit de clic riche et silencieux, comme il se doit.
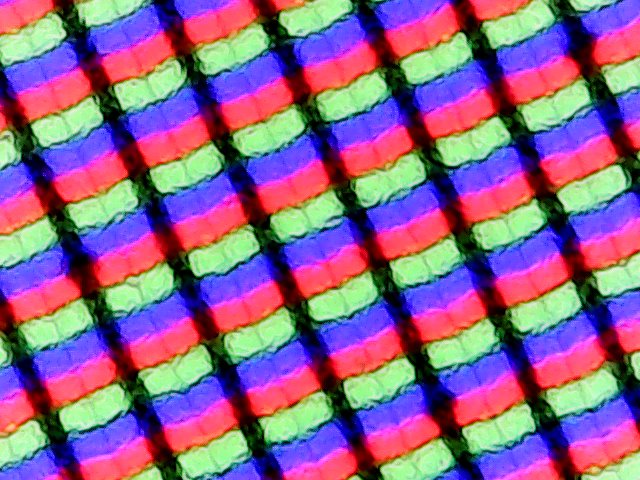
Affichage : ZBook avec panneau IPS mat
HP propose un total de quatre choix de dalles 16:10 différentes pour le ZBook Firefly 14 G9, qui sont toutes basées sur la technologie IPS et présentent une surface mate. Cependant, le modèle standard avec une luminosité de 250 cd/m² et un écran tactile est à éviter si possible. La dalle SureView avec filtre de confidentialité intégré présente également quelques inconvénients, comme nous l'avions constaté dans notre revue du EliteBook 845 G9. La dalle de 400 nits avec une résolution de 1920 x 1200 pixels (100% sRGB) est installée dans notre appareil de test, mais une dalle DreamColor avec une couverture de l'espace couleur P3 et une résolution de 2660 x 1600 pixels ainsi que 120 Hz est disponible en option.
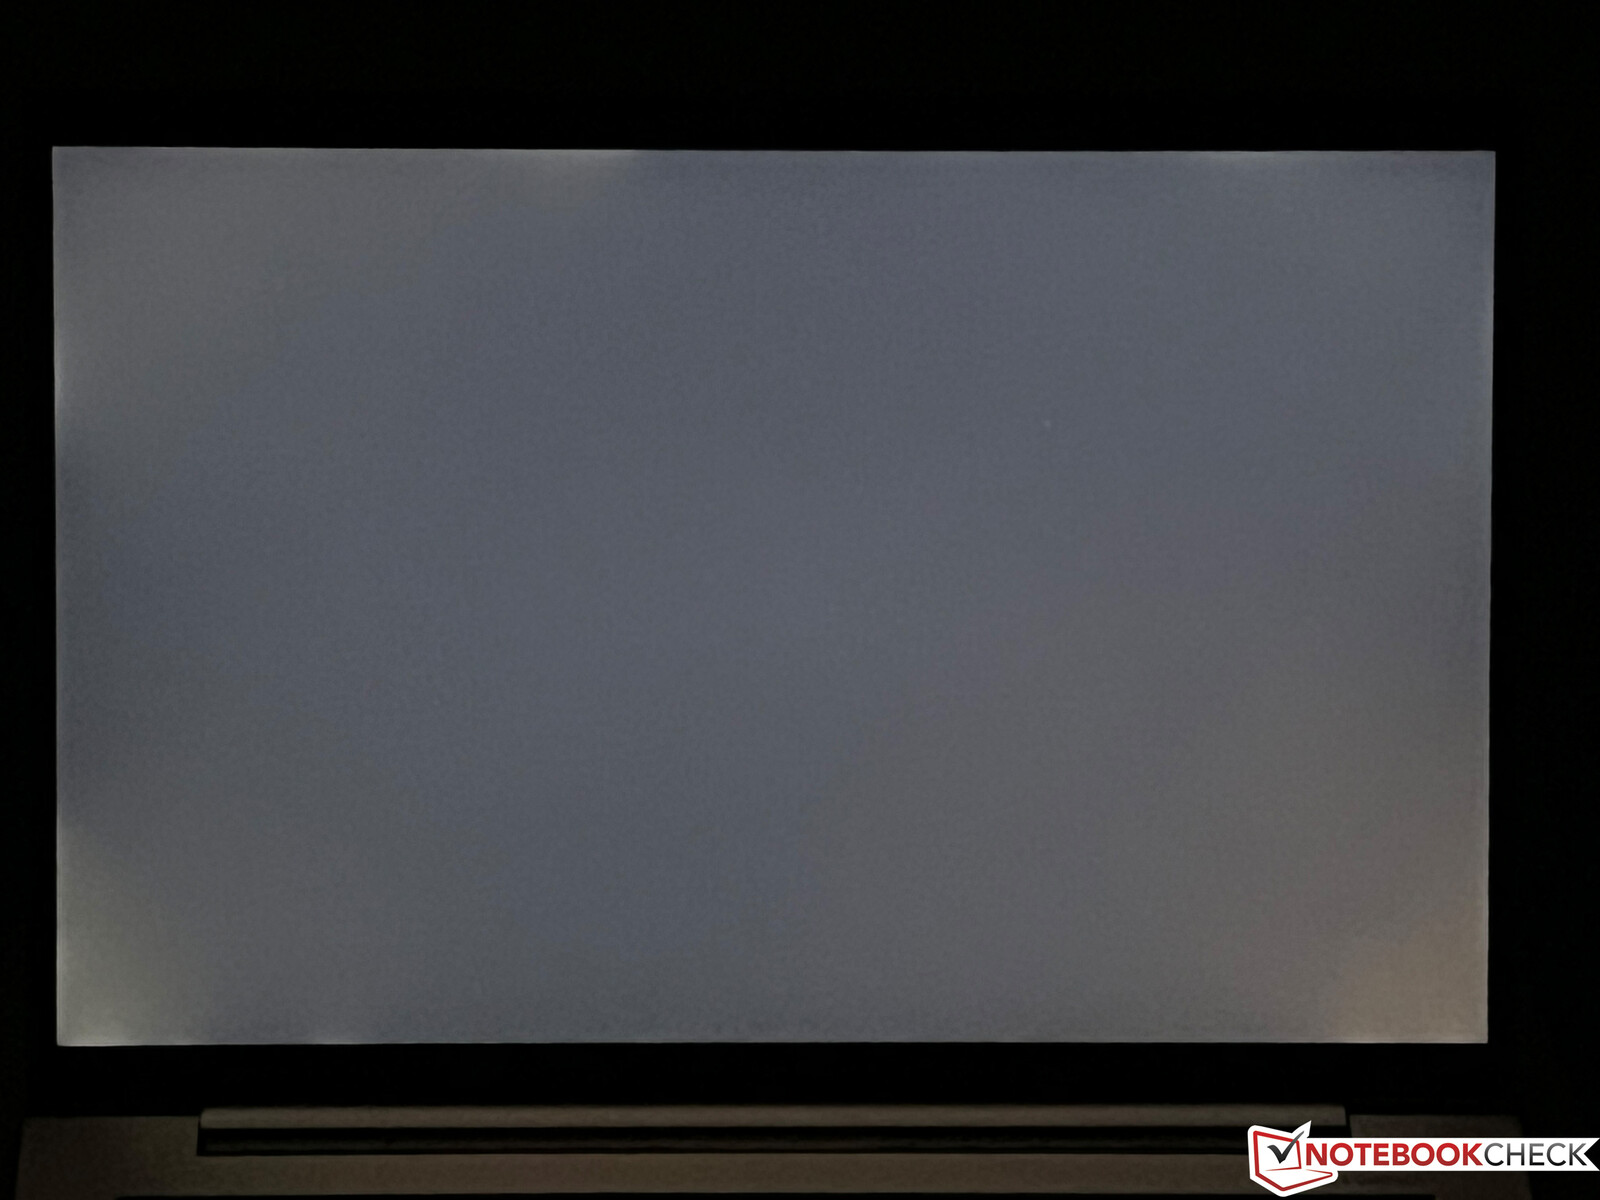
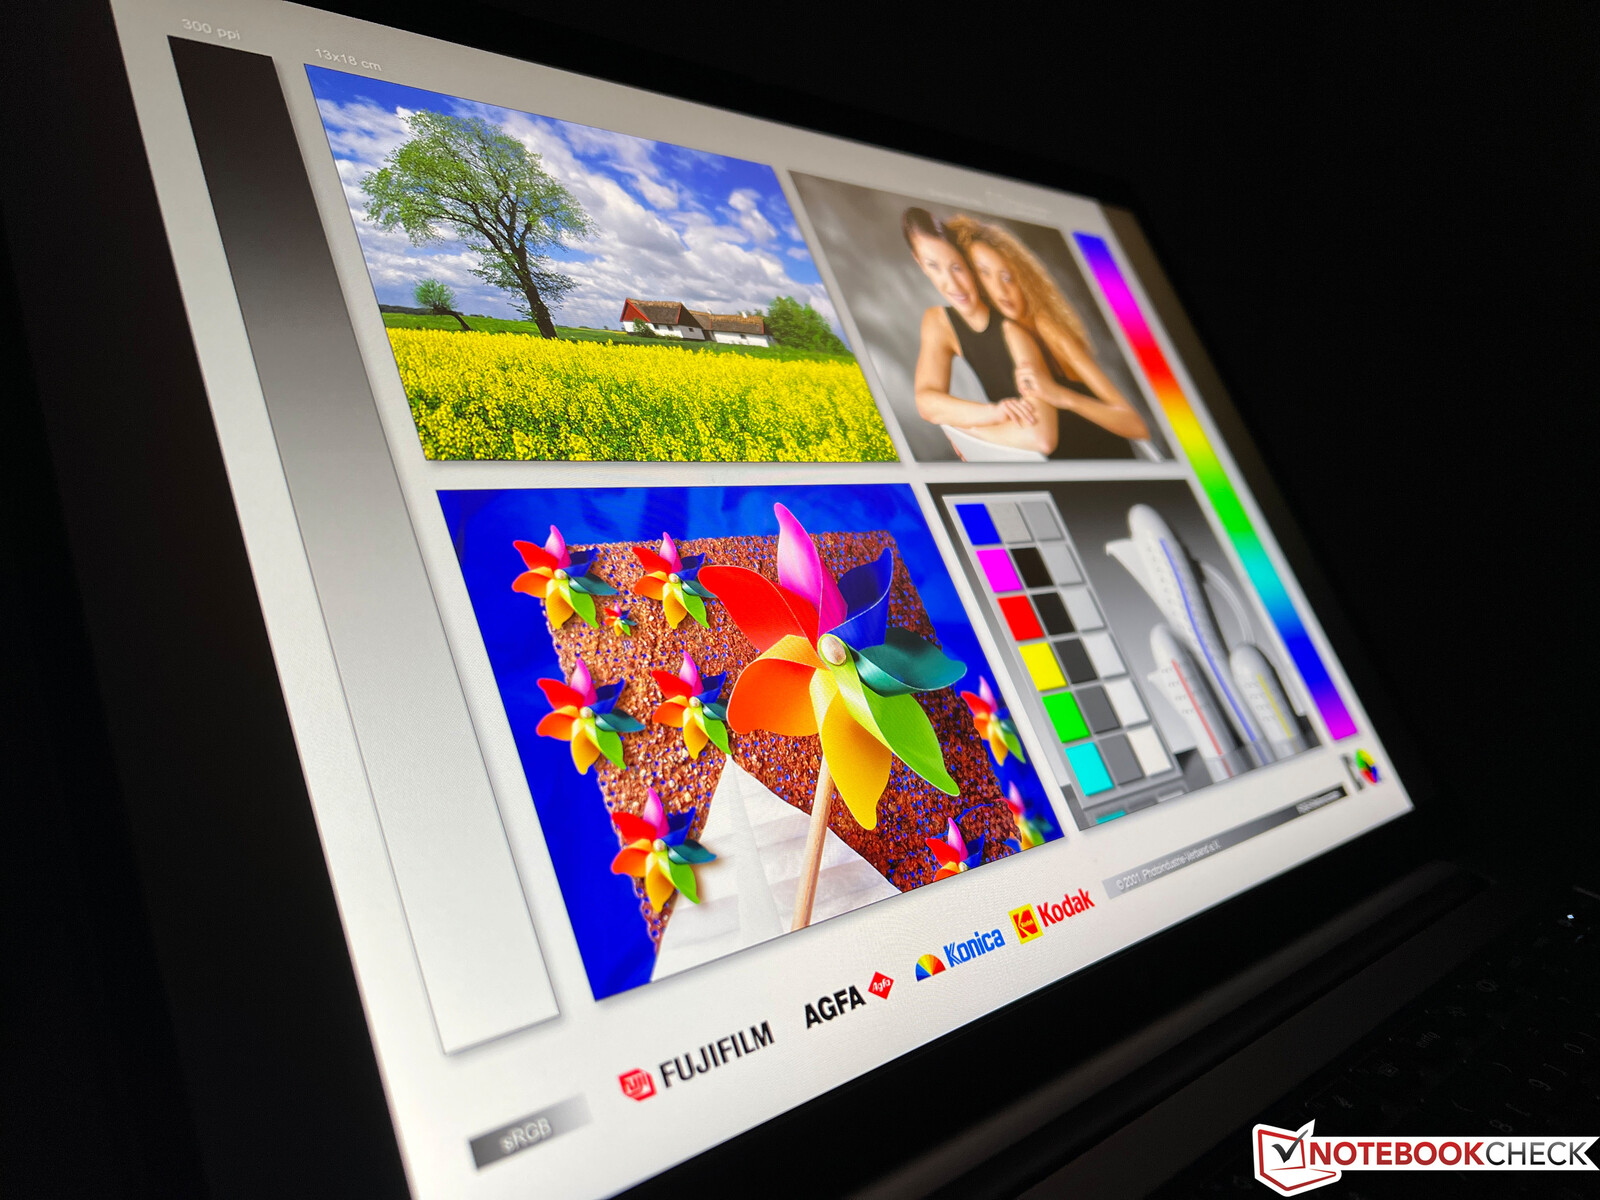
Subjectivement, le panneau offre une excellente qualité d'image, car même les surfaces brillantes ne semblent pas granuleuses malgré le revêtement mat. La luminosité moyenne est supérieure à 400 cd/m² et le taux de contraste est élevé. Nous n'avons pas remarqué de scintillement PWM et la stabilité de l'angle de vision est très bonne. Ce n'est qu'à la luminosité maximale que nous avons remarqué de légers halos sur les bords inférieurs sur des fonds sombres.
| |||||||||||||||||||||||||
Homogénéité de la luminosité: 91 %
Valeur mesurée au centre, sur batterie: 431 cd/m²
Contraste: 1543:1 (Valeurs des noirs: 0.28 cd/m²)
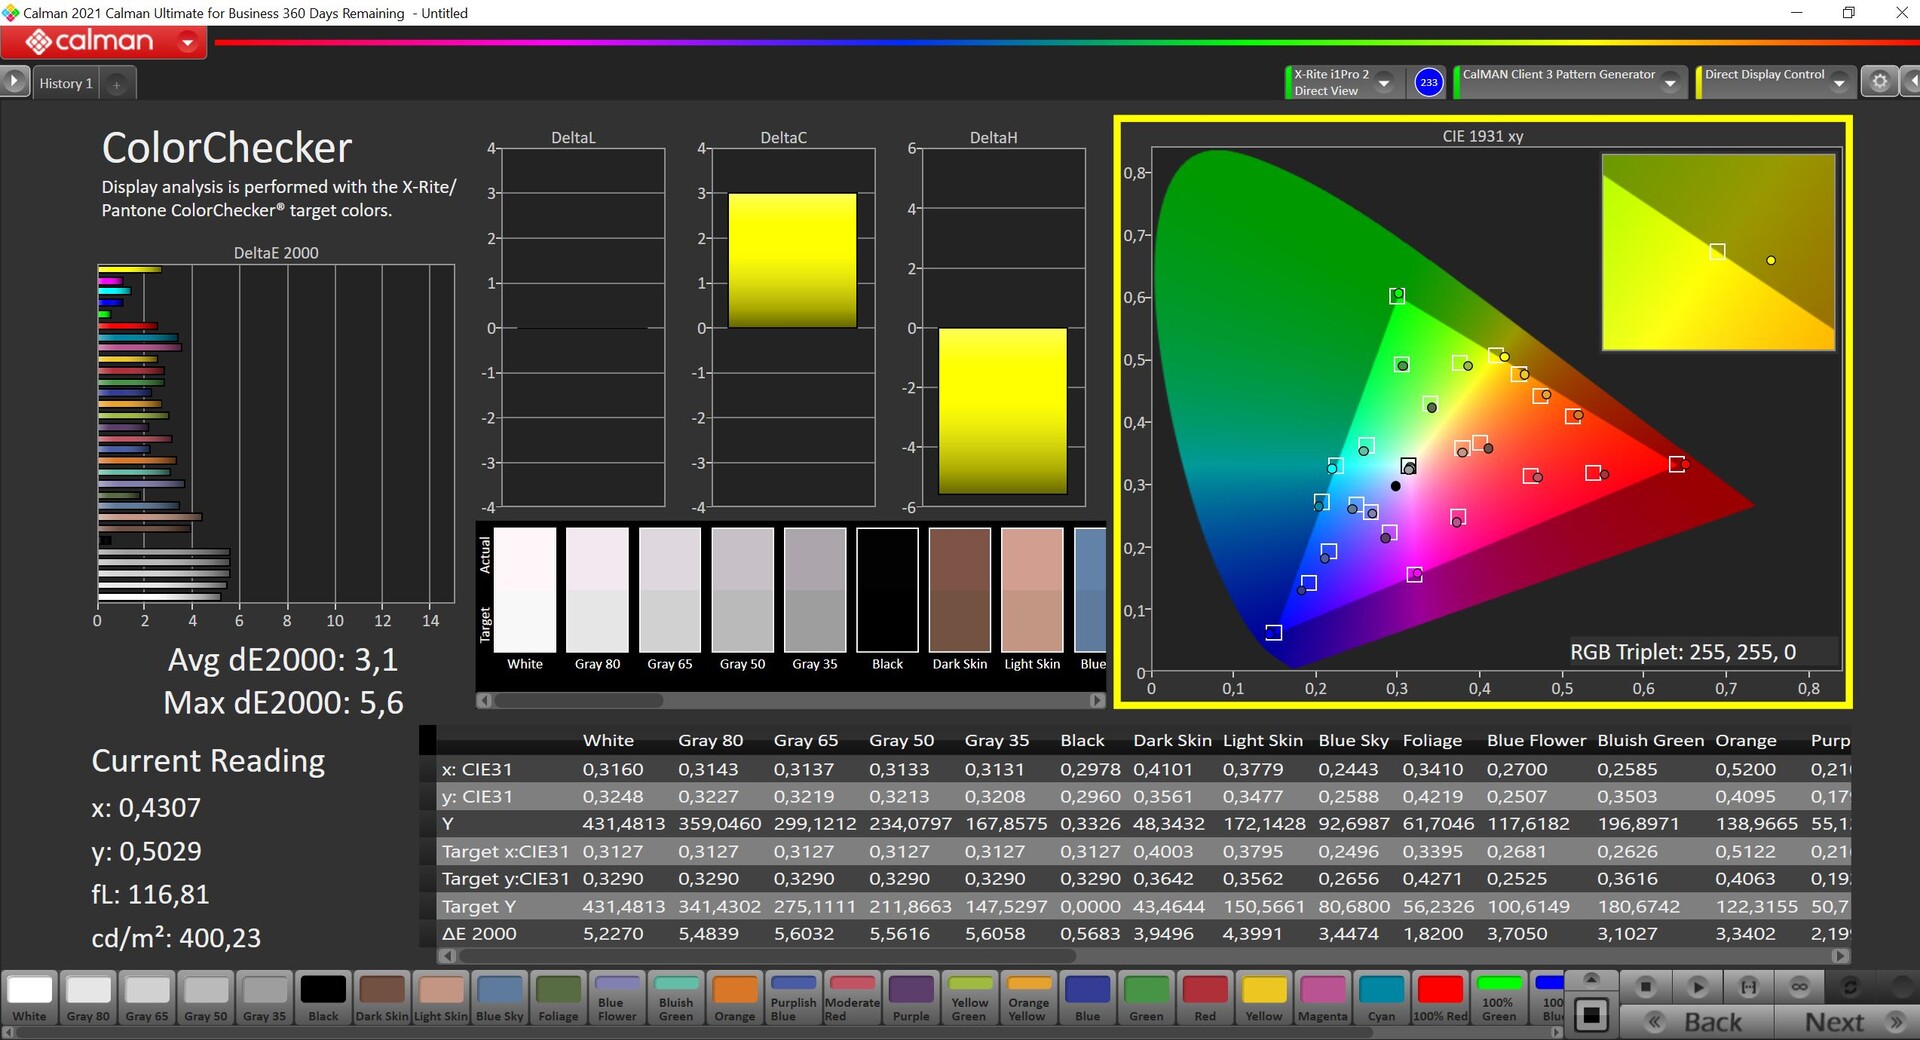
ΔE ColorChecker Calman: 3.1 | ∀{0.5-29.43 Ø4.71}
calibrated: 0.8
ΔE Greyscale Calman: 4.5 | ∀{0.09-98 Ø4.96}
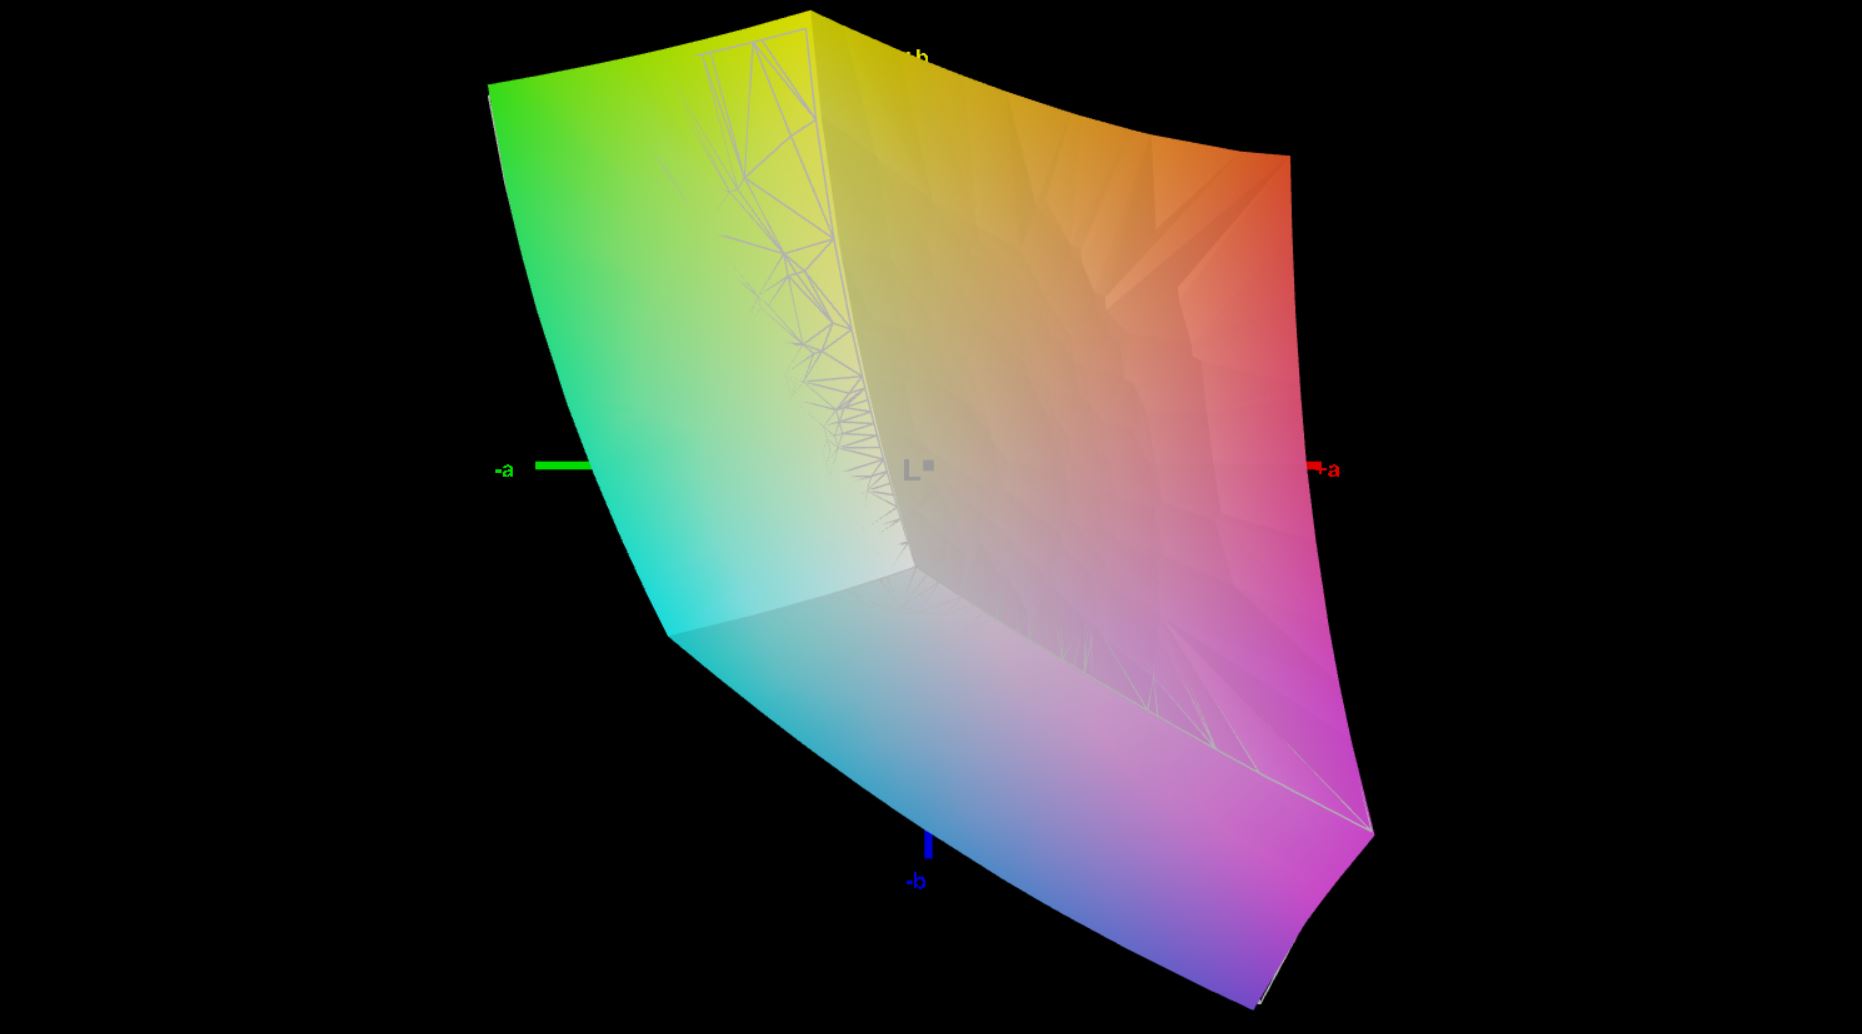
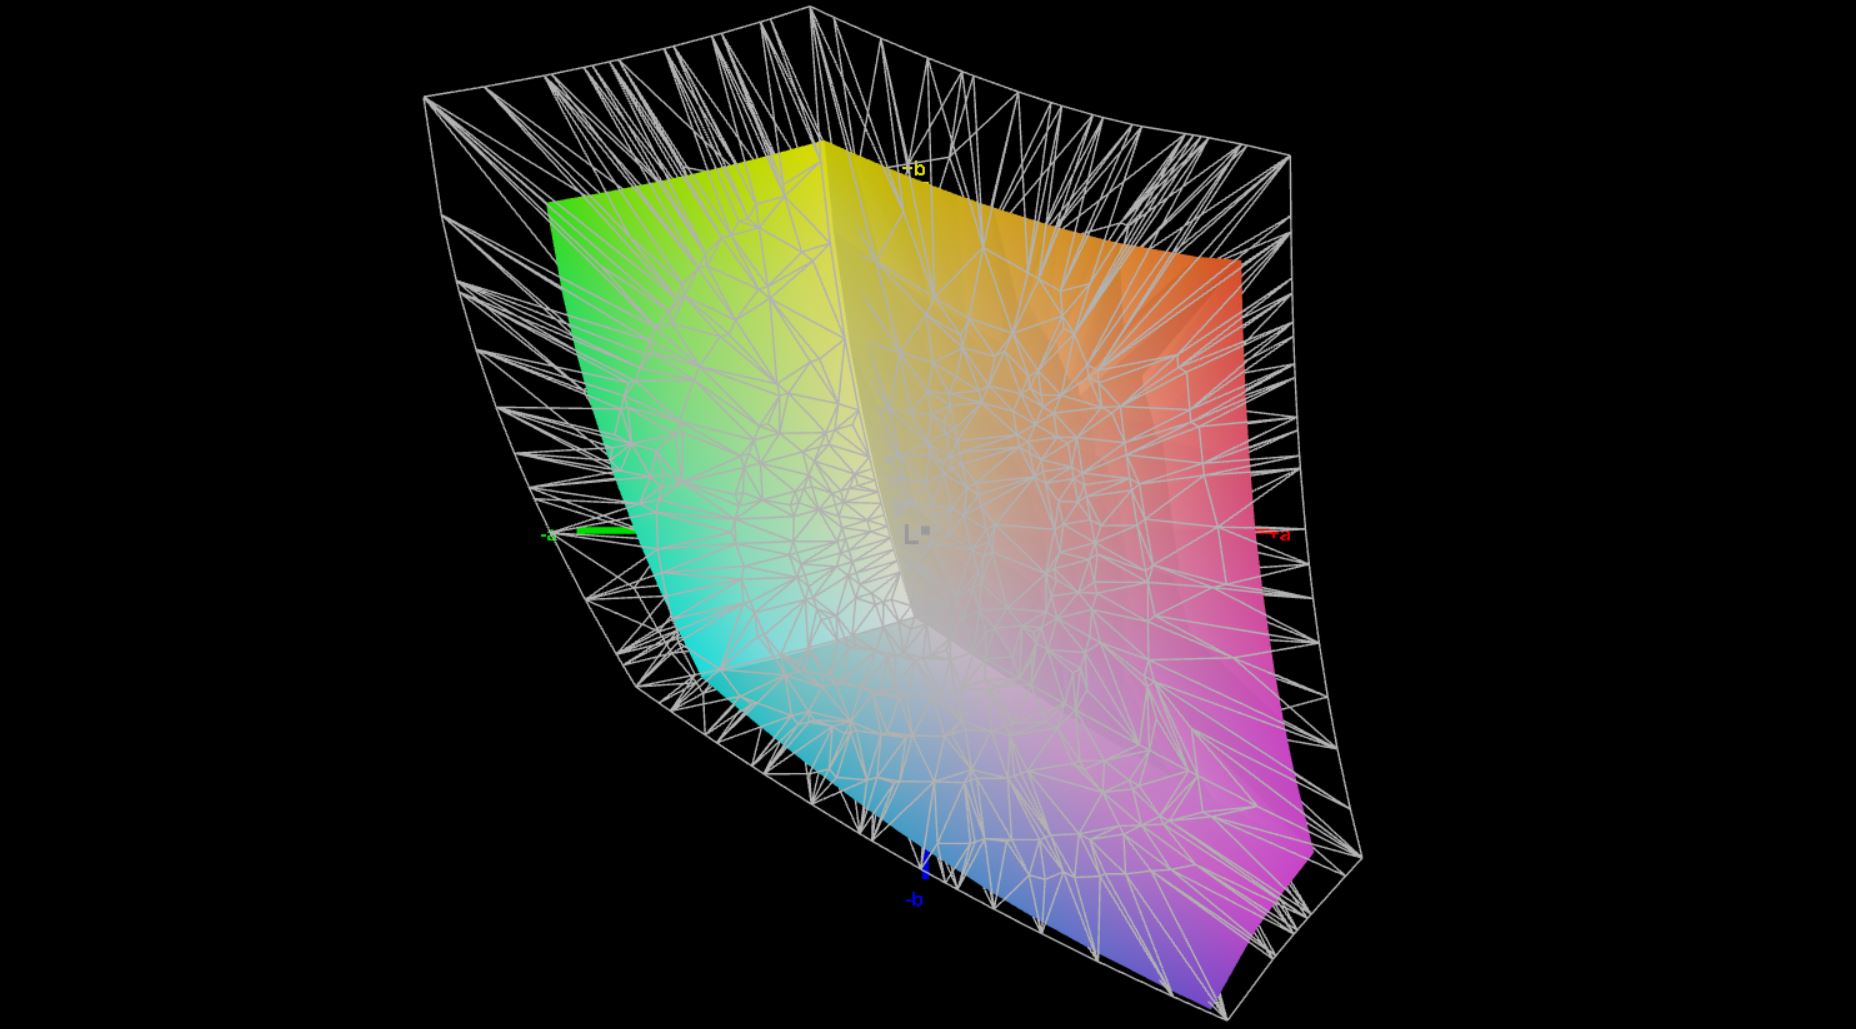
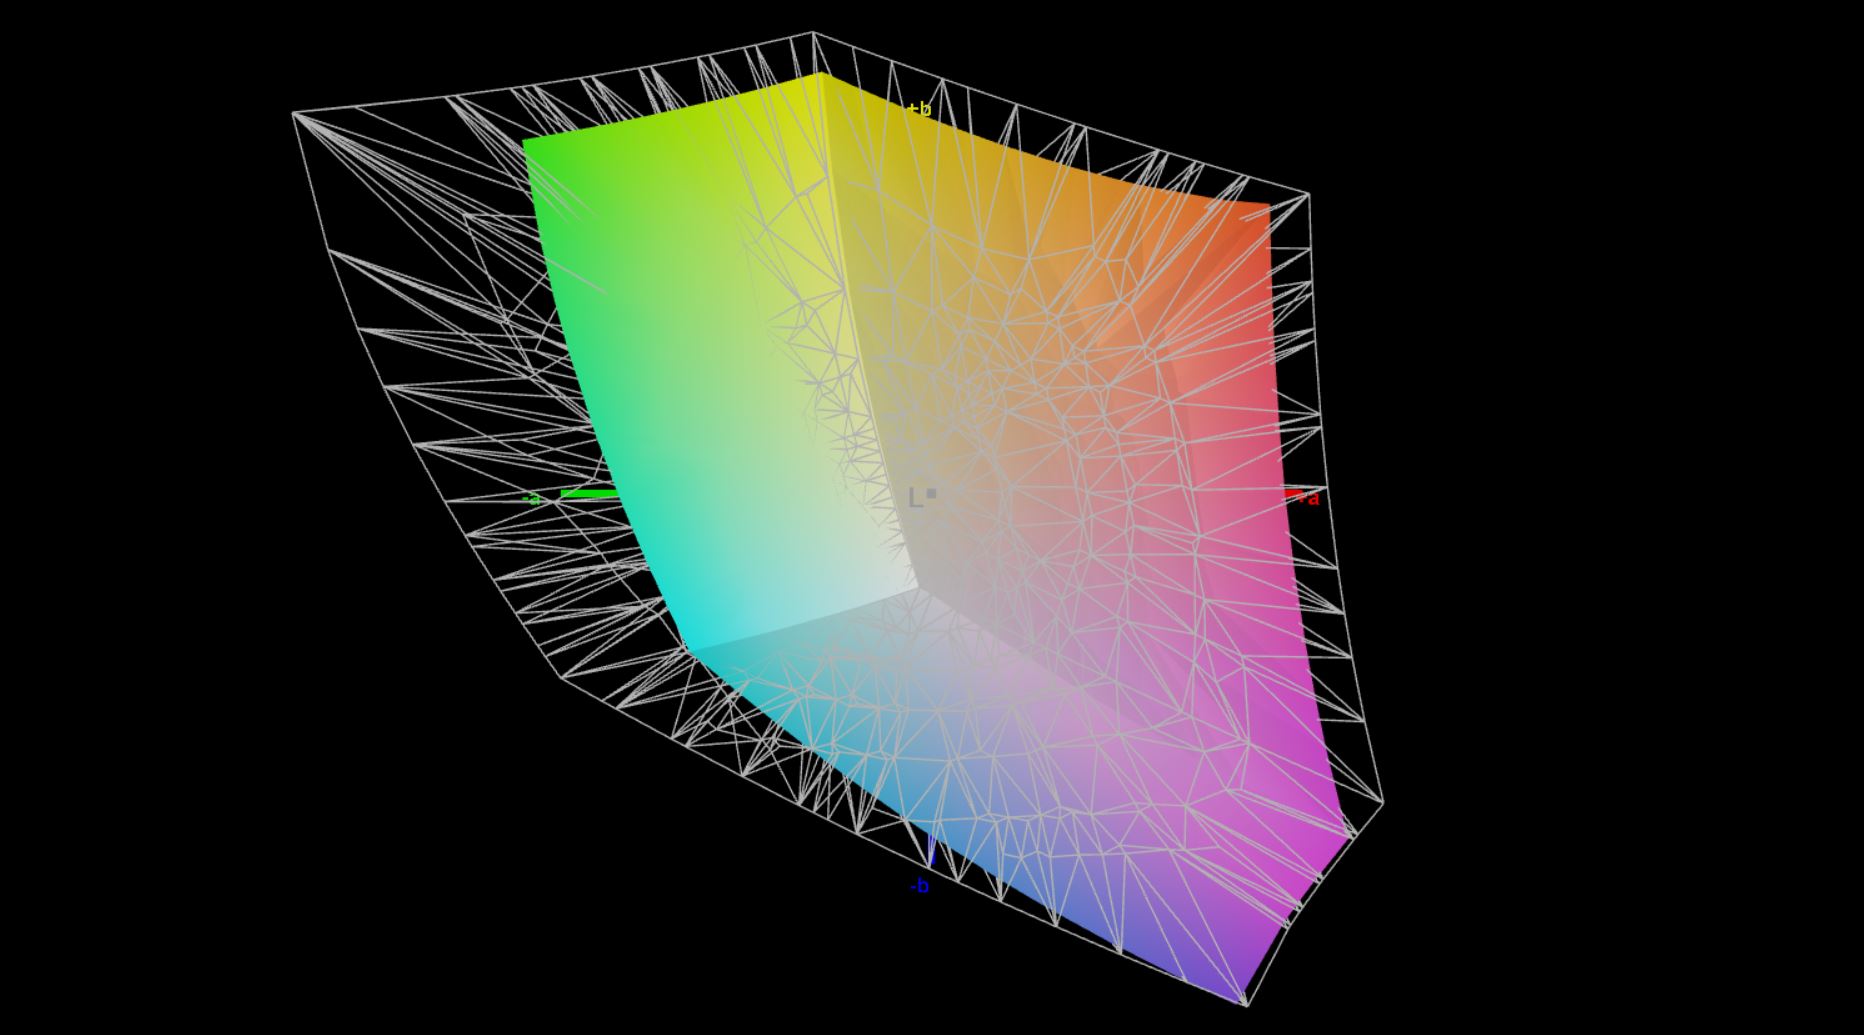
71.1% AdobeRGB 1998 (Argyll 3D)
99.9% sRGB (Argyll 3D)
69.6% Display P3 (Argyll 3D)
Gamma: 2
CCT: 6528 K
| HP ZBook Firefly 14 G9-6B8A2EA CMN1435, IPS, 1920x1200, 14" | Dell Precision 5000 5470 AU Optronics B140QAN, IPS, 2560x1600, 14" | Lenovo ThinkPad P14s Gen2-20VX000GGE B140HAN05.7, IPS, 1920x1080, 14" | Microsoft Surface Laptop Studio i7 RTX 3050 Ti LQ144P1JX01, IPS, 2400x1600, 14.4" | Apple MacBook Pro 14 2021 M1 Pro Entry Mini-LED, 3024x1964, 14.2" | HP ZBook Firefly 14 G8 2C9Q2EA AU Optronics AUO068B, IPS, 1920x1080, 14" | |
|---|---|---|---|---|---|---|
| Display | 8% | -5% | 9% | 43% | 0% | |
| Display P3 Coverage (%) | 69.6 | 79.3 14% | 65.4 -6% | 80.6 16% | 99.3 43% | 70 1% |
| sRGB Coverage (%) | 99.9 | 100 0% | 96.6 -3% | 99.9 0% | 99.5 0% | |
| AdobeRGB 1998 Coverage (%) | 71.1 | 78.7 11% | 66.5 -6% | 78.5 10% | 71.4 0% | |
| Response Times | -9% | -15% | 2% | -29% | -13% | |
| Response Time Grey 50% / Grey 80% * (ms) | 56.3 ? | 52.4 ? 7% | 58.8 ? -4% | 58.4 ? -4% | 58.4 ? -4% | 64.4 ? -14% |
| Response Time Black / White * (ms) | 26.2 ? | 32.4 ? -24% | 32.8 ? -25% | 24 ? 8% | 40.4 ? -54% | 29.2 ? -11% |
| PWM Frequency (Hz) | 5000 ? | 14880 | ||||
| Screen | 10% | -9% | 24% | 428% | 3% | |
| Brightness middle (cd/m²) | 432 | 537 24% | 350 -19% | 497 15% | 489 13% | 461 7% |
| Brightness (cd/m²) | 407 | 518 27% | 348 -14% | 491 21% | 479 18% | 439 8% |
| Brightness Distribution (%) | 91 | 94 3% | 94 3% | 92 1% | 94 3% | 89 -2% |
| Black Level * (cd/m²) | 0.28 | 0.33 -18% | 0.14 50% | 0.29 -4% | 0.01 96% | 0.24 14% |
| Contrast (:1) | 1543 | 1627 5% | 2500 62% | 1714 11% | 48900 3069% | 1921 24% |
| Colorchecker dE 2000 * | 3.1 | 2.97 4% | 4.3 -39% | 1.2 61% | 0.8 74% | 2.6 16% |
| Colorchecker dE 2000 max. * | 5.6 | 5.33 5% | 6.7 -20% | 2.8 50% | 1.3 77% | 5.8 -4% |
| Colorchecker dE 2000 calibrated * | 0.8 | 0.88 -10% | 1.5 -88% | 0.8 -0% | 1.1 -38% | |
| Greyscale dE 2000 * | 4.5 | 2.4 47% | 5.3 -18% | 1.9 58% | 1.1 76% | 4.4 2% |
| Gamma | 2 110% | 2.06 107% | 2.42 91% | 2.14 103% | 2.24 98% | 2.29 96% |
| CCT | 6528 100% | 6668 97% | 7631 85% | 6821 95% | 6478 100% | |
| Color Space (Percent of AdobeRGB 1998) (%) | 61.1 | 65.2 | ||||
| Color Space (Percent of sRGB) (%) | 96.4 | 99.4 | ||||
| Moyenne finale (programmes/paramètres) | 3% /
7% | -10% /
-9% | 12% /
17% | 147% /
310% | -3% /
0% |
* ... Moindre est la valeur, meilleures sont les performances
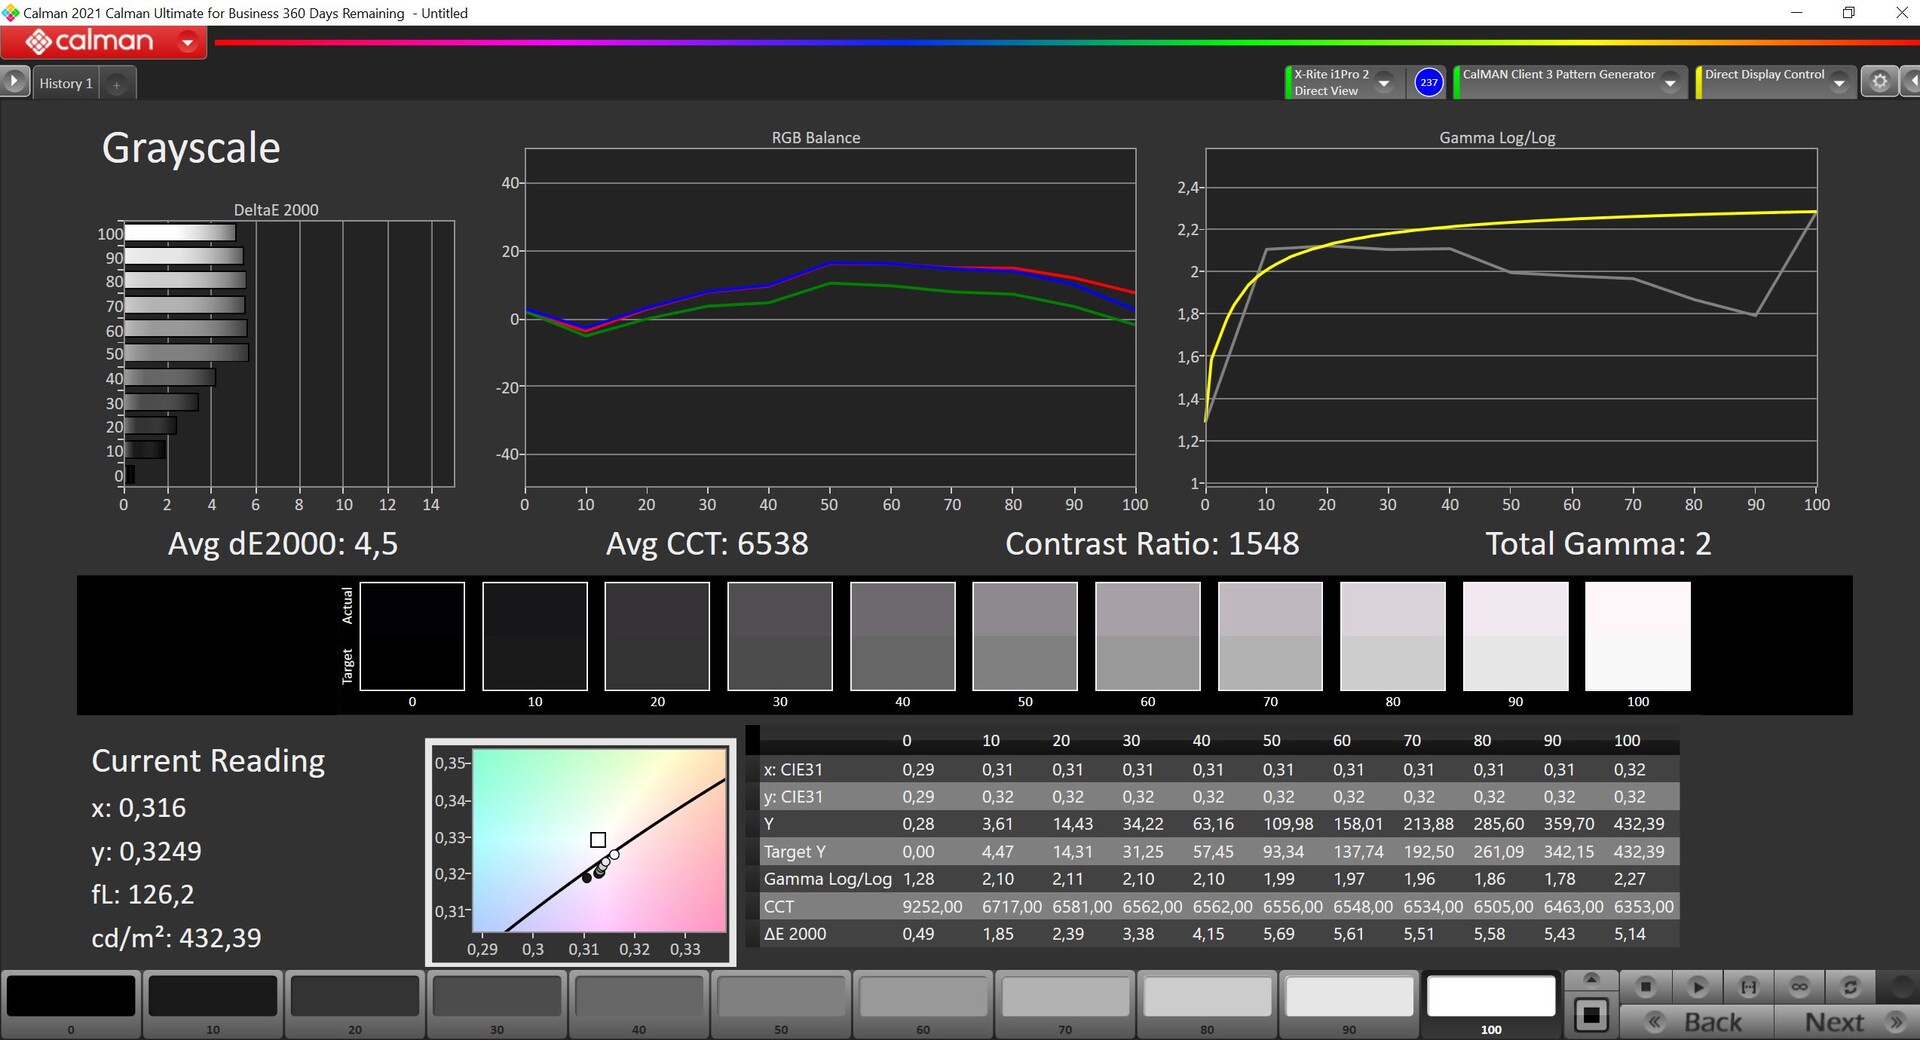
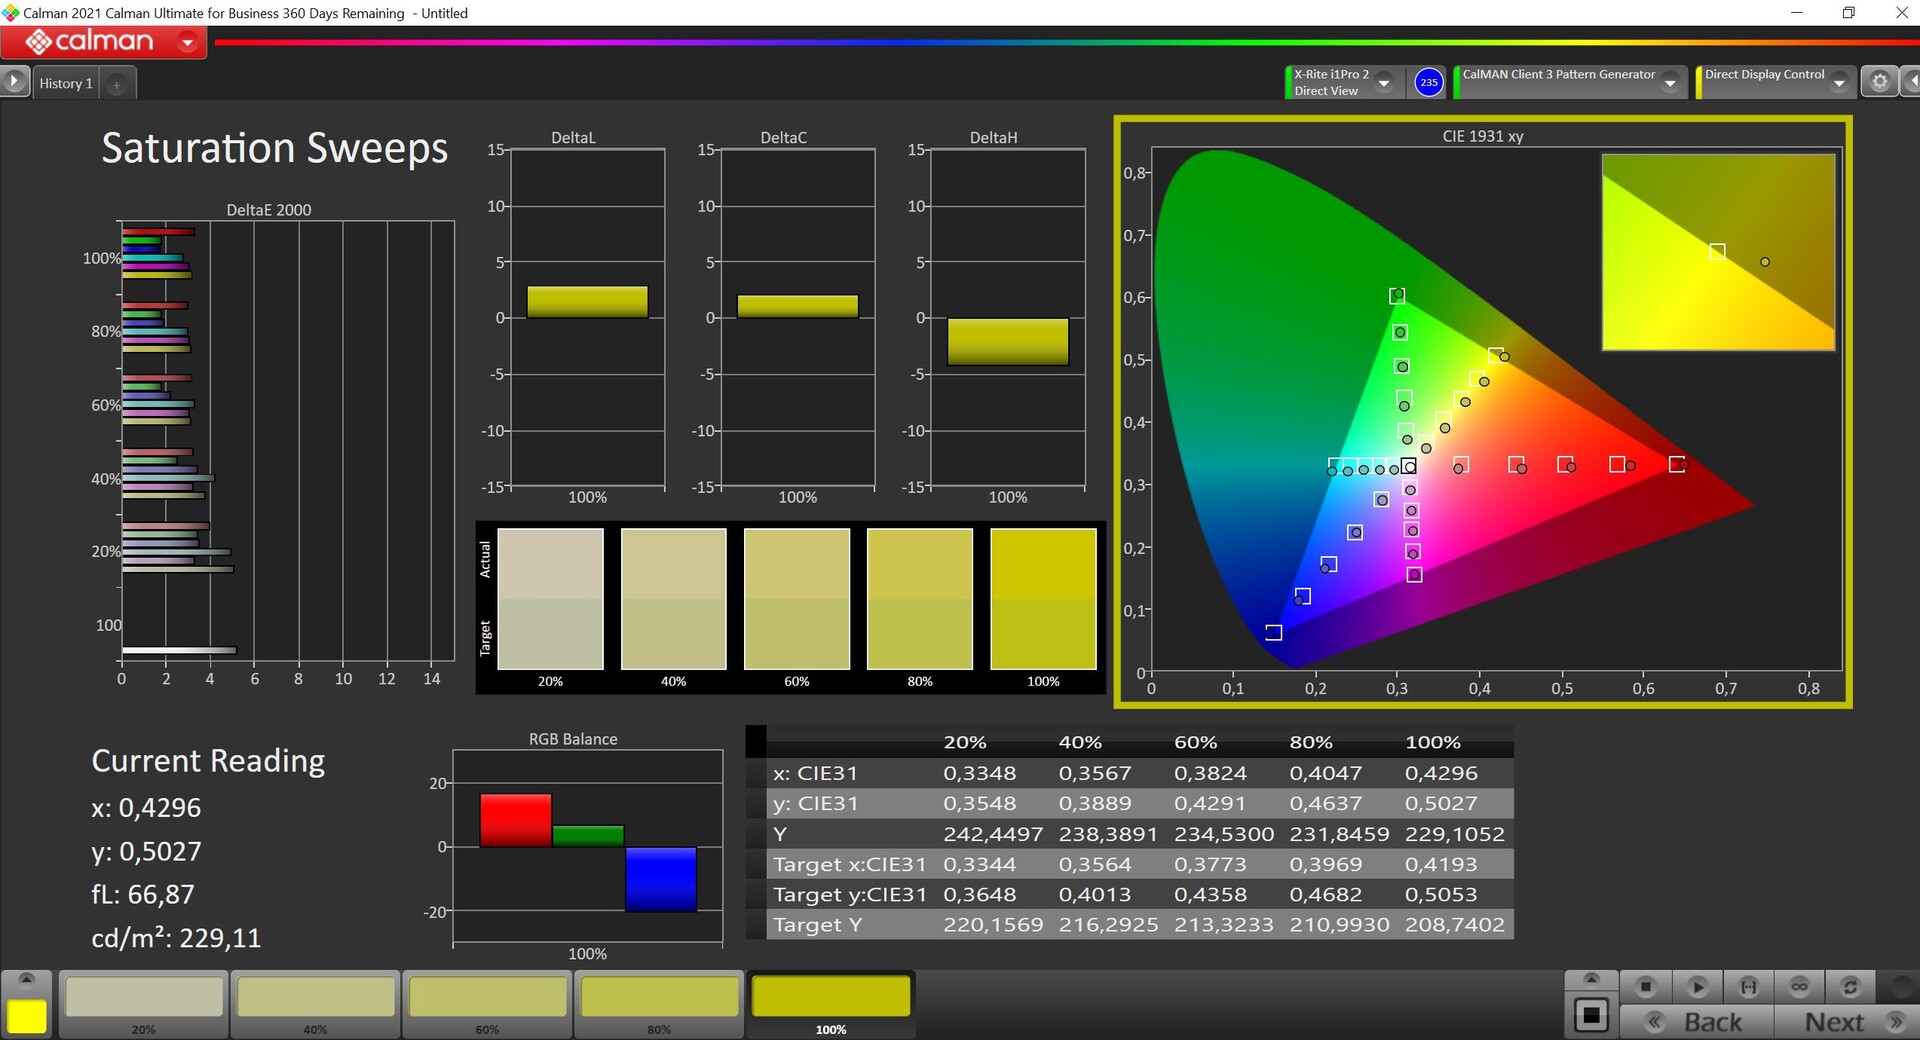
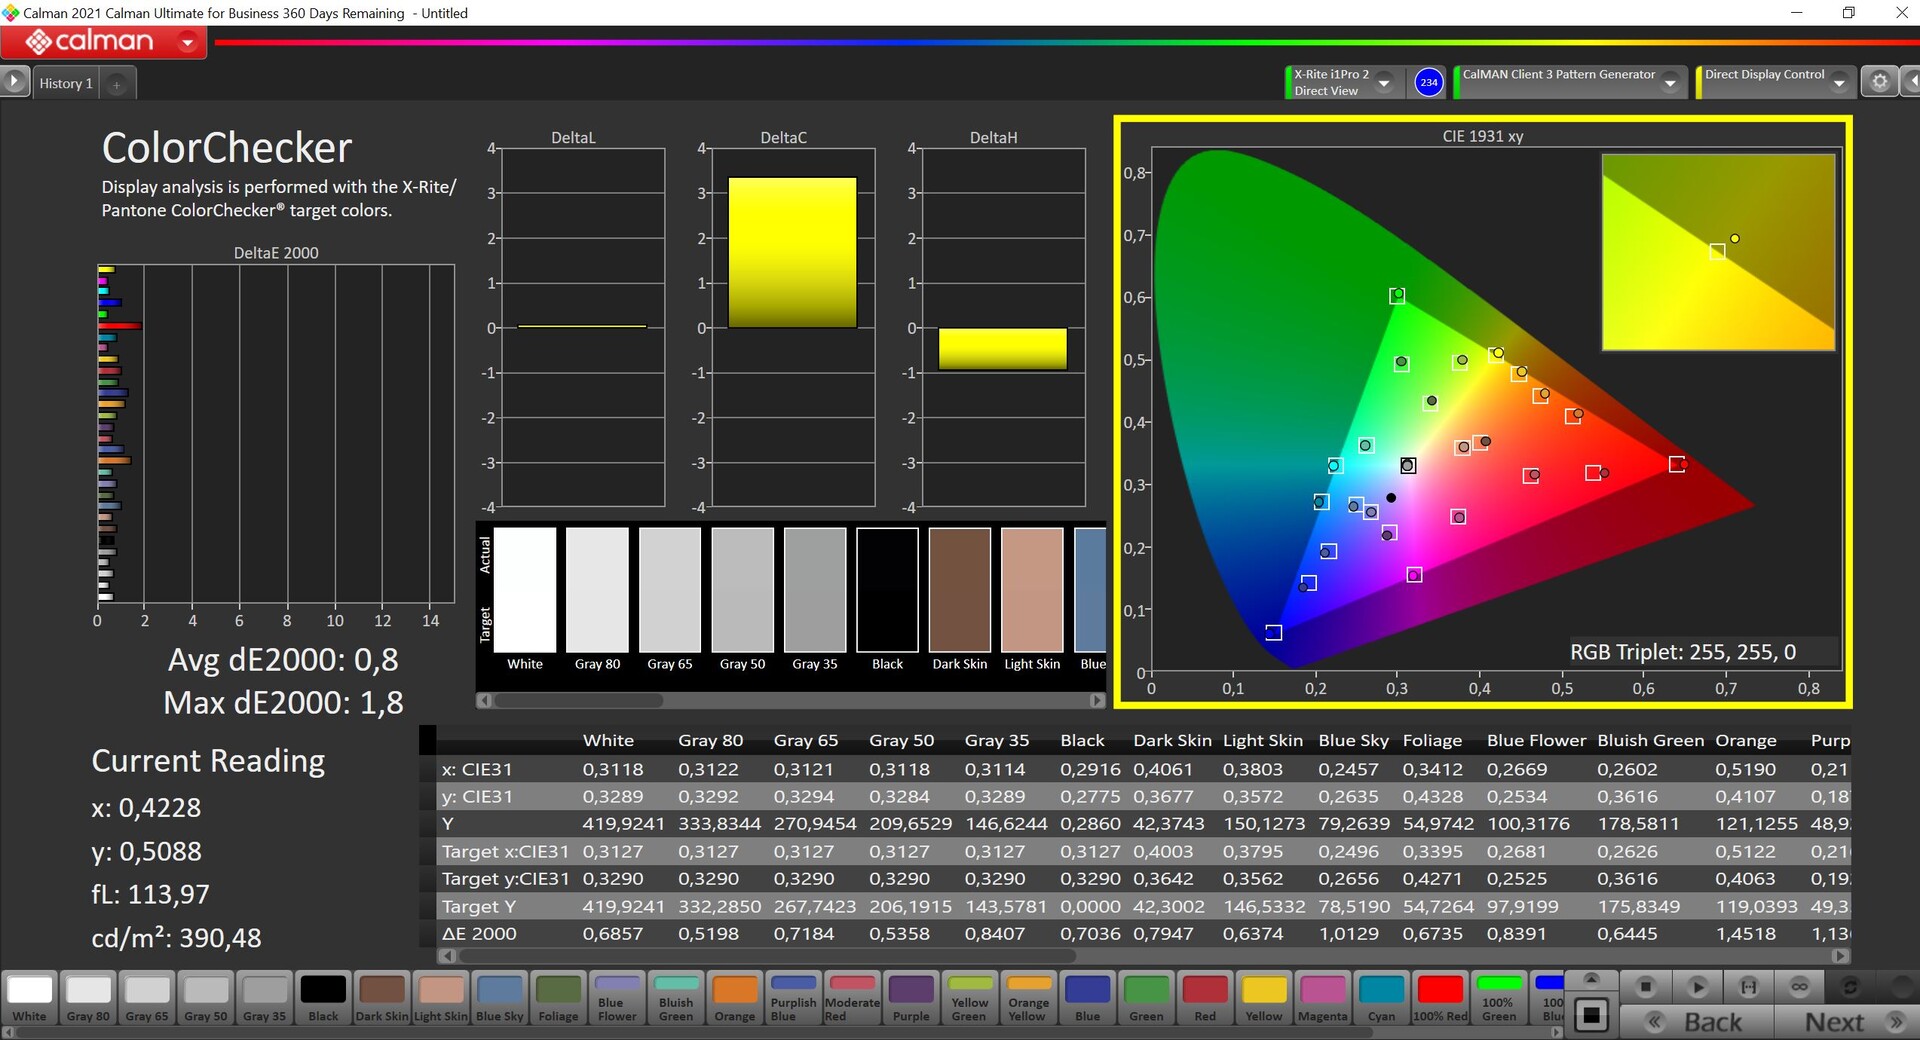
Notre analyse avec le logiciel professionnel CalMAN montre une légère dominante de couleur vers le bleu/rouge dans l'état de livraison, et de nombreuses couleurs sont également légèrement au-dessus de l'écart DeltaE 2000 de 3 par rapport à l'espace couleur de référence sRGB. Tant que vous n'éditez pas de photos, cela est parfaitement suffisant pour une utilisation quotidienne
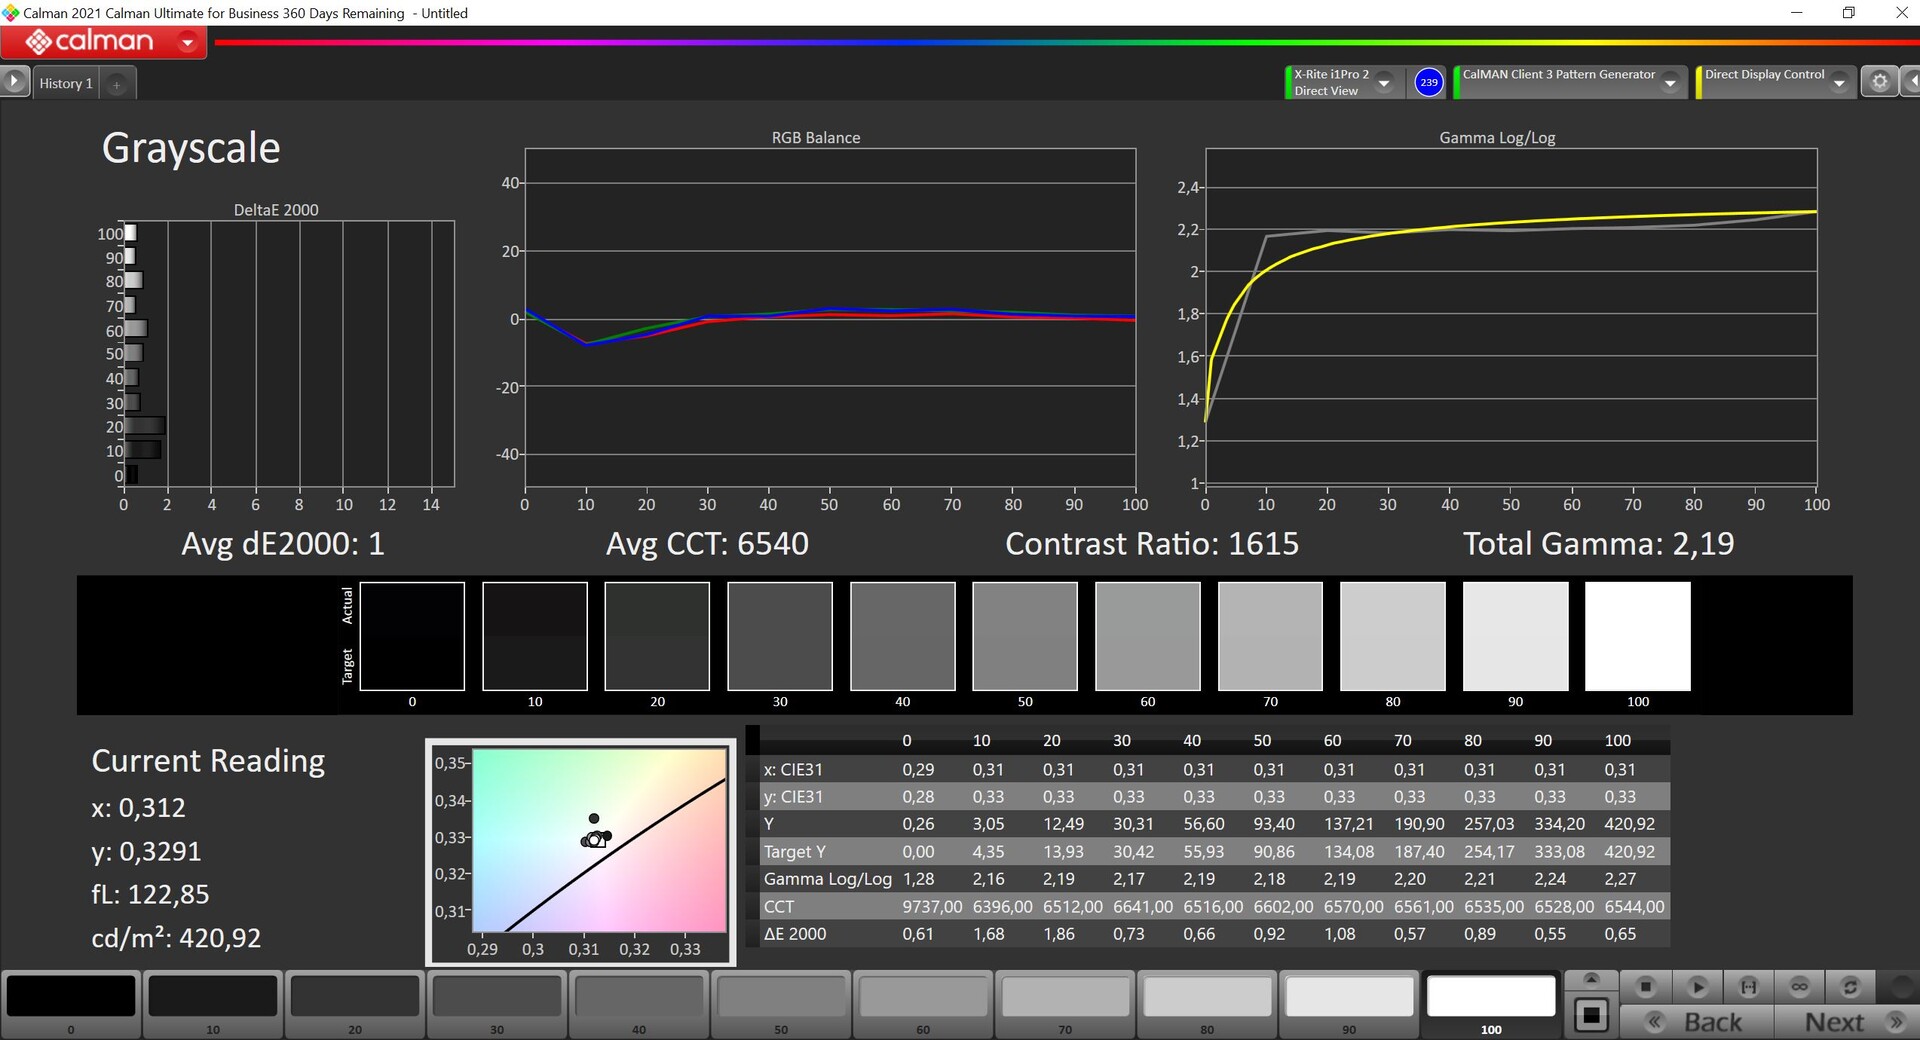
Cependant, notre propre étalonnage montre tout le potentiel de ce panneau. Nous avons pu éliminer complètement la dominante de couleur et la déviation moyenne des couleurs tombe à seulement 0,8 (maximum 1,8), ce qui est une excellente performance.

Temps de réponse de l'écran
| ↔ Temps de réponse noir à blanc | ||
|---|---|---|
| 26.2 ms ... hausse ↗ et chute ↘ combinées | ↗ 9.7 ms hausse | 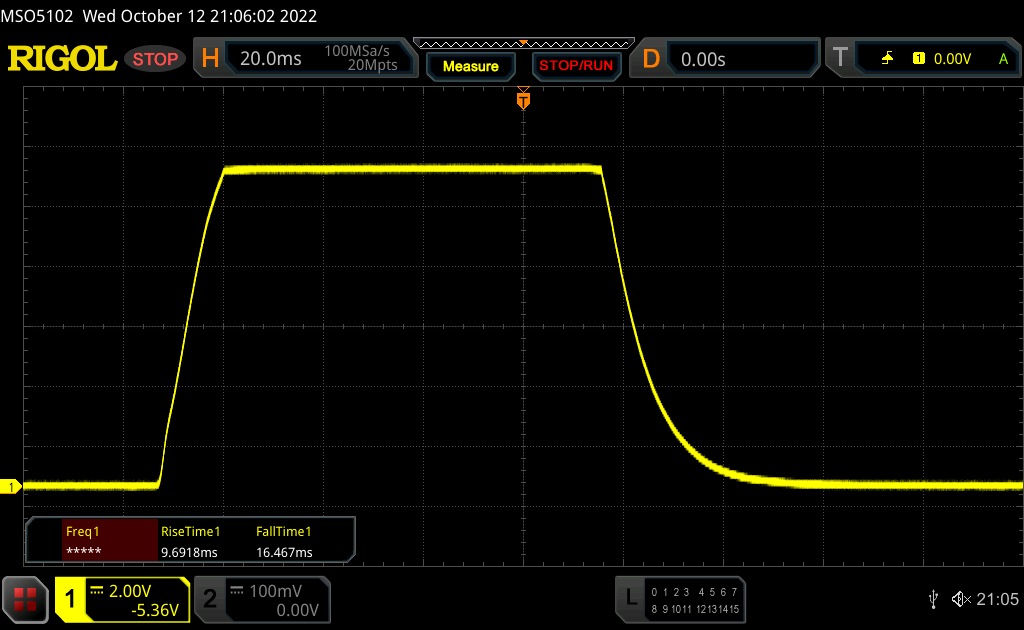 |
| ↘ 16.5 ms chute | ||
| L'écran souffre de latences relativement élevées, insuffisant pour le jeu. En comparaison, tous les appareils testés affichent entre 0.1 (minimum) et 240 (maximum) ms. » 66 % des appareils testés affichent de meilleures performances. Cela signifie que les latences relevées sont moins bonnes que la moyenne (19.8 ms) de tous les appareils testés. | ||
| ↔ Temps de réponse gris 50% à gris 80% | ||
| 56.3 ms ... hausse ↗ et chute ↘ combinées | ↗ 25 ms hausse | 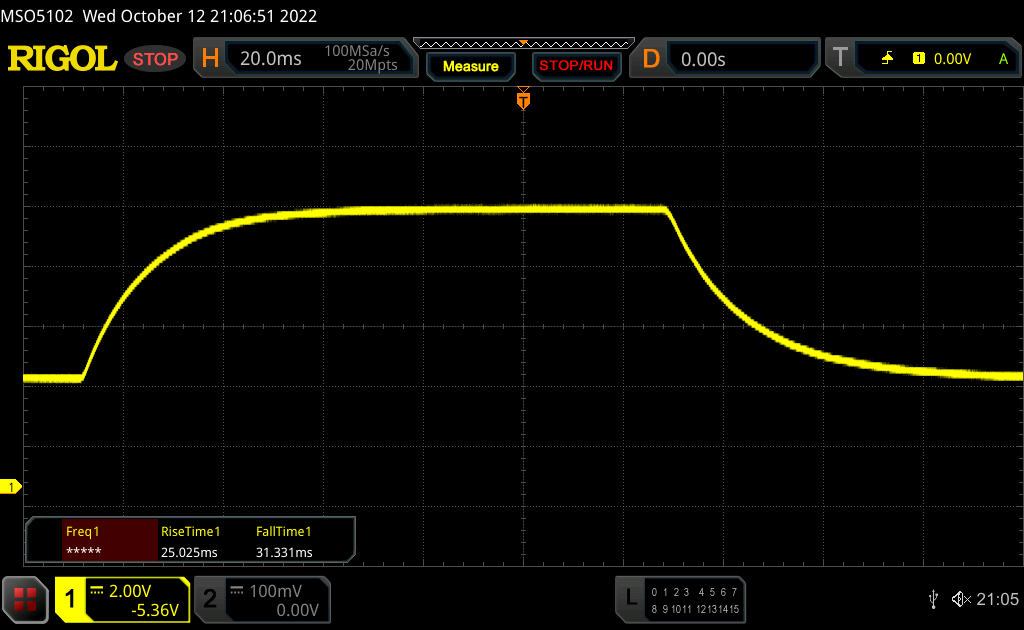 |
| ↘ 31.3 ms chute | ||
| L'écran souffre de latences très élevées, à éviter pour le jeu. En comparaison, tous les appareils testés affichent entre 0.165 (minimum) et 636 (maximum) ms. » 93 % des appareils testés affichent de meilleures performances. Cela signifie que les latences relevées sont moins bonnes que la moyenne (31 ms) de tous les appareils testés. | ||
Scintillement / MLI (Modulation de largeur d'impulsion)
| Scintillement / MLI (Modulation de largeur d'impulsion) non décelé | 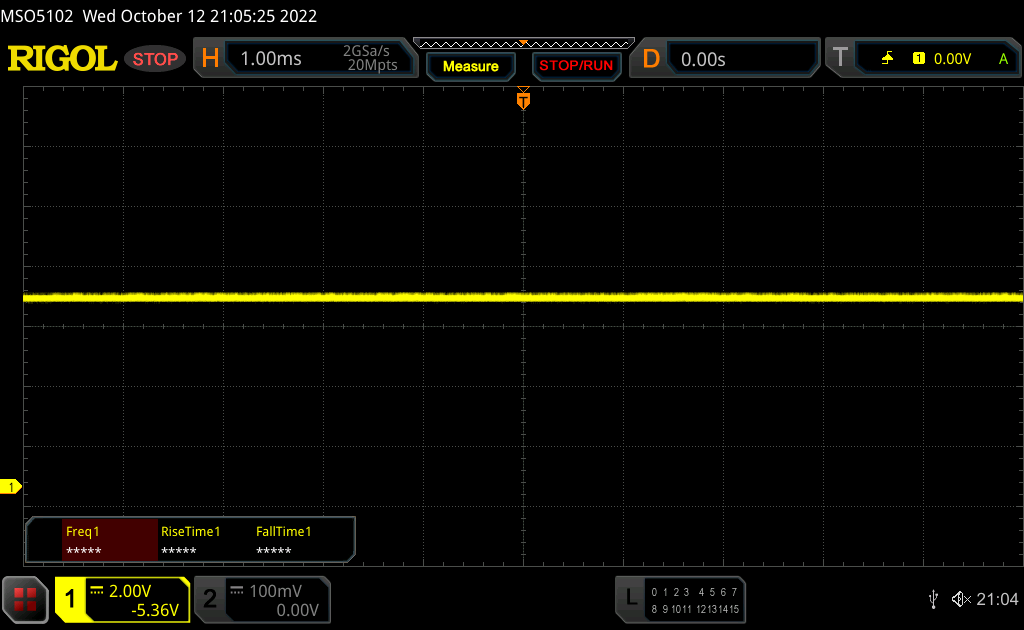 | ||
En comparaison, 52 % des appareils testés n'emploient pas MDI pour assombrir leur écran. Nous avons relevé une moyenne à 7757 (minimum : 5 - maximum : 343500) Hz dans le cas où une MDI était active. | |||
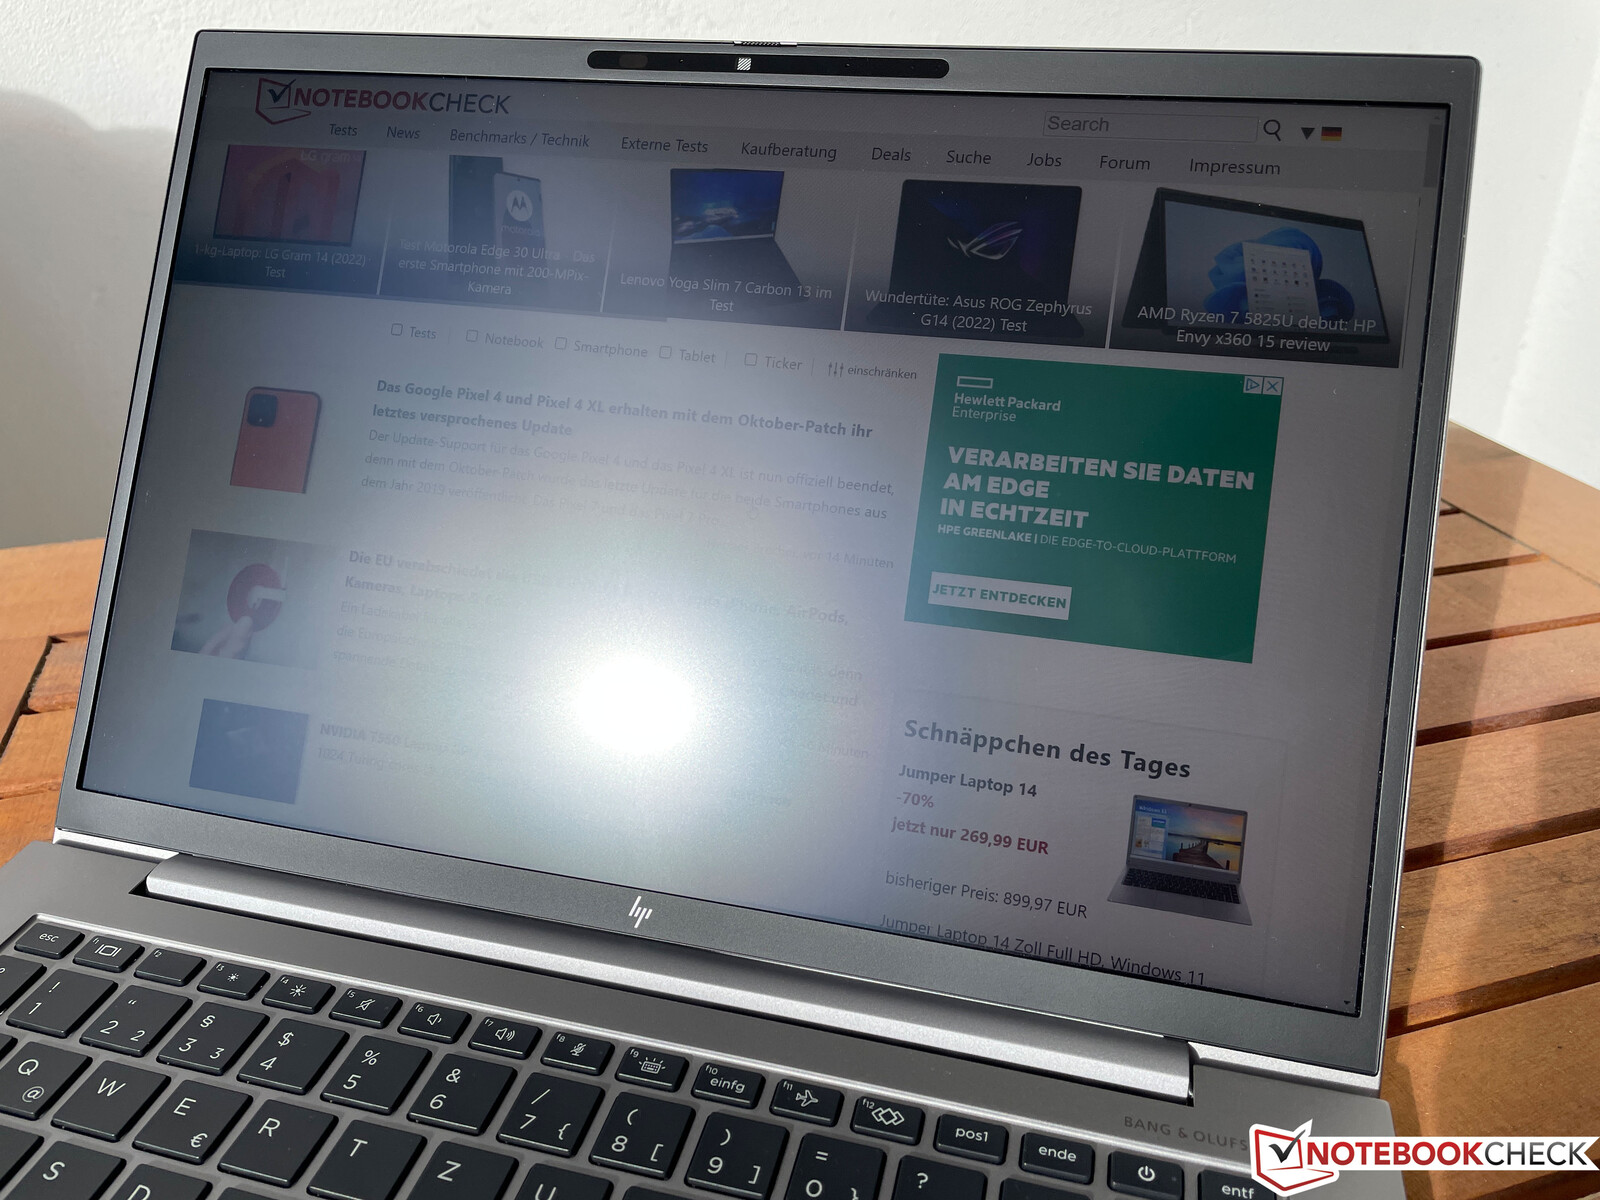
L'écran mat se comporte très bien en extérieur. Le panneau pourrait seulement être un peu plus lumineux en plein soleil.
Performance : 12 W Alder Lake-U
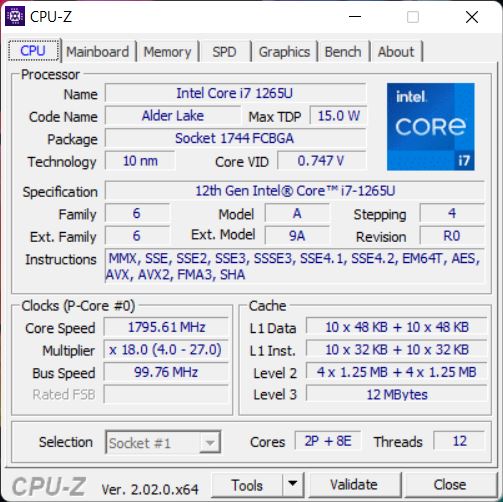
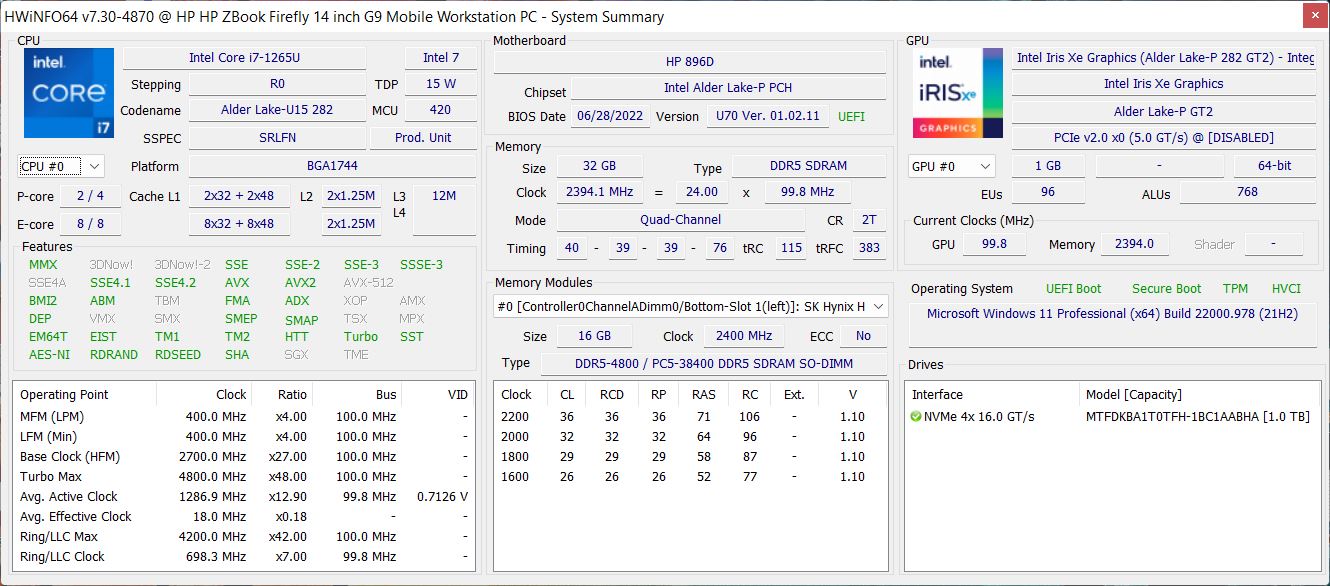
Processeur : Intel Core i7-1265U
Le Core i7-1265U est une puce Alder Lake actuelle (12e génération) avec deux cœurs de performance rapide et huit cœurs d'efficacité. Le potentiel de performance est théoriquement aussi très élevé, mais la puce du ZBook Firefly 14 G9 est ralentie par la très faible limite de puissance de 12 W, qui se déclenche après quelques secondes. C'est suffisant pour les tâches simples, mais les performances globales sont un peu inférieures à celles d'un Core i7-1165G7 Tiger Lake du modèle précédent Test du HP ZBook Firefly 14 G8 : station de travail compacte avec des ports plus rapides si l'on considère l'ensemble des benchmarks CPU.
Nous avons également rencontré un problème similaire dans la plus grande
Firefly 16 G9 et sommes donc en contact avec le fabricant. Les performances sont définitivement décevantes pour une station de travail mobile. A titre de comparaison, la variante professionnelle normale EliteBook 845 G9 avec le AMD Ryzen 9 Pro 6950HS offre environ trois fois plus de performances multi-cœurs.Plus de benchmarks CPU sont disponibles dans notre section technologie.
Cinebench R15 multi-core loop
Cinebench R23: Multi Core | Single Core
Cinebench R20: CPU (Multi Core) | CPU (Single Core)
Cinebench R15: CPU Multi 64Bit | CPU Single 64Bit
Blender: v2.79 BMW27 CPU
7-Zip 18.03: 7z b 4 | 7z b 4 -mmt1
Geekbench 5.5: Multi-Core | Single-Core
HWBOT x265 Benchmark v2.2: 4k Preset
LibreOffice : 20 Documents To PDF
R Benchmark 2.5: Overall mean
| CPU Performance rating | |
| Moyenne de la classe Workstation | |
| Dell Precision 5000 5470 | |
| Apple MacBook Pro 14 2021 M1 Pro Entry -8! | |
| HP EliteBook 845 G9 6F6H6EA | |
| Moyenne Intel Core i7-1265U | |
| Microsoft Surface Laptop Studio i7 RTX 3050 Ti | |
| Lenovo ThinkPad P14s Gen2-20VX000GGE | |
| HP ZBook Firefly 14 G8 2C9Q2EA -2! | |
| HP ZBook Firefly 14 G9-6B8A2EA | |
| HP ZBook Firefly 16 G9-6B897EA | |
| Cinebench R23 / Multi Core | |
| Moyenne de la classe Workstation (14621 - 38520, n=23, 2 dernières années) | |
| Dell Precision 5000 5470 | |
| HP EliteBook 845 G9 6F6H6EA | |
| Apple MacBook Pro 14 2021 M1 Pro Entry | |
| Moyenne Intel Core i7-1265U (4332 - 9219, n=10) | |
| Microsoft Surface Laptop Studio i7 RTX 3050 Ti | |
| Lenovo ThinkPad P14s Gen2-20VX000GGE | |
| HP ZBook Firefly 16 G9-6B897EA | |
| HP ZBook Firefly 14 G9-6B8A2EA | |
| Cinebench R23 / Single Core | |
| Moyenne de la classe Workstation (1712 - 2228, n=23, 2 dernières années) | |
| Dell Precision 5000 5470 | |
| Moyenne Intel Core i7-1265U (1144 - 1820, n=10) | |
| Apple MacBook Pro 14 2021 M1 Pro Entry | |
| HP EliteBook 845 G9 6F6H6EA | |
| Microsoft Surface Laptop Studio i7 RTX 3050 Ti | |
| Lenovo ThinkPad P14s Gen2-20VX000GGE | |
| HP ZBook Firefly 14 G9-6B8A2EA | |
| HP ZBook Firefly 16 G9-6B897EA | |
| Cinebench R20 / CPU (Multi Core) | |
| Moyenne de la classe Workstation (5760 - 15043, n=23, 2 dernières années) | |
| Dell Precision 5000 5470 | |
| HP EliteBook 845 G9 6F6H6EA | |
| Moyenne Intel Core i7-1265U (1669 - 3584, n=10) | |
| Microsoft Surface Laptop Studio i7 RTX 3050 Ti | |
| Lenovo ThinkPad P14s Gen2-20VX000GGE | |
| HP ZBook Firefly 14 G8 2C9Q2EA | |
| HP ZBook Firefly 14 G9-6B8A2EA | |
| HP ZBook Firefly 16 G9-6B897EA | |
| Cinebench R20 / CPU (Single Core) | |
| Moyenne de la classe Workstation (671 - 857, n=23, 2 dernières années) | |
| Dell Precision 5000 5470 | |
| Moyenne Intel Core i7-1265U (528 - 701, n=10) | |
| HP EliteBook 845 G9 6F6H6EA | |
| HP ZBook Firefly 14 G8 2C9Q2EA | |
| Microsoft Surface Laptop Studio i7 RTX 3050 Ti | |
| HP ZBook Firefly 16 G9-6B897EA | |
| Lenovo ThinkPad P14s Gen2-20VX000GGE | |
| HP ZBook Firefly 14 G9-6B8A2EA | |
| Cinebench R15 / CPU Multi 64Bit | |
| Moyenne de la classe Workstation (2489 - 5810, n=23, 2 dernières années) | |
| Dell Precision 5000 5470 | |
| HP EliteBook 845 G9 6F6H6EA | |
| Apple MacBook Pro 14 2021 M1 Pro Entry | |
| Moyenne Intel Core i7-1265U (706 - 1572, n=10) | |
| Microsoft Surface Laptop Studio i7 RTX 3050 Ti | |
| Lenovo ThinkPad P14s Gen2-20VX000GGE | |
| HP ZBook Firefly 14 G8 2C9Q2EA | |
| HP ZBook Firefly 16 G9-6B897EA | |
| HP ZBook Firefly 14 G9-6B8A2EA | |
| Cinebench R15 / CPU Single 64Bit | |
| Moyenne de la classe Workstation (191.4 - 328, n=23, 2 dernières années) | |
| Dell Precision 5000 5470 | |
| HP EliteBook 845 G9 6F6H6EA | |
| Moyenne Intel Core i7-1265U (165.3 - 260, n=10) | |
| HP ZBook Firefly 14 G8 2C9Q2EA | |
| Microsoft Surface Laptop Studio i7 RTX 3050 Ti | |
| HP ZBook Firefly 14 G9-6B8A2EA | |
| Lenovo ThinkPad P14s Gen2-20VX000GGE | |
| Apple MacBook Pro 14 2021 M1 Pro Entry | |
| HP ZBook Firefly 16 G9-6B897EA | |
| Blender / v2.79 BMW27 CPU | |
| HP ZBook Firefly 16 G9-6B897EA | |
| HP ZBook Firefly 14 G9-6B8A2EA | |
| Lenovo ThinkPad P14s Gen2-20VX000GGE | |
| HP ZBook Firefly 14 G8 2C9Q2EA | |
| Microsoft Surface Laptop Studio i7 RTX 3050 Ti | |
| Moyenne Intel Core i7-1265U (364 - 684, n=10) | |
| HP EliteBook 845 G9 6F6H6EA | |
| Dell Precision 5000 5470 | |
| Moyenne de la classe Workstation (91 - 222, n=23, 2 dernières années) | |
| 7-Zip 18.03 / 7z b 4 | |
| Moyenne de la classe Workstation (60489 - 116969, n=23, 2 dernières années) | |
| Dell Precision 5000 5470 | |
| HP EliteBook 845 G9 6F6H6EA | |
| Moyenne Intel Core i7-1265U (20087 - 38715, n=10) | |
| Microsoft Surface Laptop Studio i7 RTX 3050 Ti | |
| HP ZBook Firefly 14 G8 2C9Q2EA | |
| HP ZBook Firefly 14 G9-6B8A2EA | |
| Lenovo ThinkPad P14s Gen2-20VX000GGE | |
| HP ZBook Firefly 16 G9-6B897EA | |
| 7-Zip 18.03 / 7z b 4 -mmt1 | |
| Moyenne de la classe Workstation (5126 - 6960, n=23, 2 dernières années) | |
| HP EliteBook 845 G9 6F6H6EA | |
| Lenovo ThinkPad P14s Gen2-20VX000GGE | |
| Dell Precision 5000 5470 | |
| HP ZBook Firefly 14 G8 2C9Q2EA | |
| Moyenne Intel Core i7-1265U (4614 - 5617, n=10) | |
| Microsoft Surface Laptop Studio i7 RTX 3050 Ti | |
| HP ZBook Firefly 16 G9-6B897EA | |
| HP ZBook Firefly 14 G9-6B8A2EA | |
| Geekbench 5.5 / Multi-Core | |
| Moyenne de la classe Workstation (11542 - 25554, n=23, 2 dernières années) | |
| Dell Precision 5000 5470 | |
| Apple MacBook Pro 14 2021 M1 Pro Entry | |
| Moyenne Intel Core i7-1265U (5022 - 8981, n=10) | |
| HP EliteBook 845 G9 6F6H6EA | |
| HP ZBook Firefly 14 G9-6B8A2EA | |
| Microsoft Surface Laptop Studio i7 RTX 3050 Ti | |
| Lenovo ThinkPad P14s Gen2-20VX000GGE | |
| HP ZBook Firefly 16 G9-6B897EA | |
| HP ZBook Firefly 14 G8 2C9Q2EA | |
| Geekbench 5.5 / Single-Core | |
| Moyenne de la classe Workstation (1783 - 2183, n=23, 2 dernières années) | |
| HP ZBook Firefly 14 G9-6B8A2EA | |
| Dell Precision 5000 5470 | |
| HP ZBook Firefly 16 G9-6B897EA | |
| Apple MacBook Pro 14 2021 M1 Pro Entry | |
| Moyenne Intel Core i7-1265U (1429 - 1806, n=10) | |
| Lenovo ThinkPad P14s Gen2-20VX000GGE | |
| HP ZBook Firefly 14 G8 2C9Q2EA | |
| Microsoft Surface Laptop Studio i7 RTX 3050 Ti | |
| HP EliteBook 845 G9 6F6H6EA | |
| HWBOT x265 Benchmark v2.2 / 4k Preset | |
| Moyenne de la classe Workstation (17.8 - 40.5, n=23, 2 dernières années) | |
| Dell Precision 5000 5470 | |
| HP EliteBook 845 G9 6F6H6EA | |
| Moyenne Intel Core i7-1265U (5.09 - 10.6, n=10) | |
| Microsoft Surface Laptop Studio i7 RTX 3050 Ti | |
| Lenovo ThinkPad P14s Gen2-20VX000GGE | |
| HP ZBook Firefly 14 G8 2C9Q2EA | |
| HP ZBook Firefly 14 G9-6B8A2EA | |
| HP ZBook Firefly 16 G9-6B897EA | |
| LibreOffice / 20 Documents To PDF | |
| HP EliteBook 845 G9 6F6H6EA | |
| Microsoft Surface Laptop Studio i7 RTX 3050 Ti | |
| HP ZBook Firefly 14 G8 2C9Q2EA | |
| HP ZBook Firefly 16 G9-6B897EA | |
| Moyenne Intel Core i7-1265U (44 - 61.6, n=10) | |
| Moyenne de la classe Workstation (37.1 - 74.7, n=23, 2 dernières années) | |
| HP ZBook Firefly 14 G9-6B8A2EA | |
| Dell Precision 5000 5470 | |
| Lenovo ThinkPad P14s Gen2-20VX000GGE | |
| R Benchmark 2.5 / Overall mean | |
| Microsoft Surface Laptop Studio i7 RTX 3050 Ti | |
| HP ZBook Firefly 14 G8 2C9Q2EA | |
| Lenovo ThinkPad P14s Gen2-20VX000GGE | |
| HP ZBook Firefly 16 G9-6B897EA | |
| HP ZBook Firefly 14 G9-6B8A2EA | |
| HP EliteBook 845 G9 6F6H6EA | |
| Moyenne Intel Core i7-1265U (0.4666 - 0.578, n=10) | |
| Dell Precision 5000 5470 | |
| Moyenne de la classe Workstation (0.3825 - 0.603, n=23, 2 dernières années) | |
* ... Moindre est la valeur, meilleures sont les performances
AIDA64: FP32 Ray-Trace | FPU Julia | CPU SHA3 | CPU Queen | FPU SinJulia | FPU Mandel | CPU AES | CPU ZLib | FP64 Ray-Trace | CPU PhotoWorxx
| Performance rating | |
| Moyenne de la classe Workstation | |
| HP EliteBook 845 G9 6F6H6EA | |
| Dell Precision 5000 5470 | |
| Microsoft Surface Laptop Studio i7 RTX 3050 Ti | |
| Moyenne Intel Core i7-1265U | |
| HP ZBook Firefly 14 G8 2C9Q2EA | |
| HP ZBook Firefly 14 G9-6B8A2EA | |
| HP ZBook Firefly 16 G9-6B897EA | |
| AIDA64 / FP32 Ray-Trace | |
| Moyenne de la classe Workstation (16730 - 61611, n=23, 2 dernières années) | |
| HP EliteBook 845 G9 6F6H6EA | |
| Dell Precision 5000 5470 | |
| Microsoft Surface Laptop Studio i7 RTX 3050 Ti | |
| HP ZBook Firefly 14 G8 2C9Q2EA | |
| Moyenne Intel Core i7-1265U (2619 - 8178, n=10) | |
| HP ZBook Firefly 14 G9-6B8A2EA | |
| HP ZBook Firefly 16 G9-6B897EA | |
| AIDA64 / FPU Julia | |
| Moyenne de la classe Workstation (89597 - 186971, n=23, 2 dernières années) | |
| HP EliteBook 845 G9 6F6H6EA | |
| Dell Precision 5000 5470 | |
| Moyenne Intel Core i7-1265U (12909 - 41649, n=10) | |
| Microsoft Surface Laptop Studio i7 RTX 3050 Ti | |
| HP ZBook Firefly 14 G8 2C9Q2EA | |
| HP ZBook Firefly 14 G9-6B8A2EA | |
| HP ZBook Firefly 16 G9-6B897EA | |
| AIDA64 / CPU SHA3 | |
| Moyenne de la classe Workstation (4178 - 8975, n=23, 2 dernières années) | |
| HP EliteBook 845 G9 6F6H6EA | |
| Dell Precision 5000 5470 | |
| Microsoft Surface Laptop Studio i7 RTX 3050 Ti | |
| HP ZBook Firefly 14 G8 2C9Q2EA | |
| Moyenne Intel Core i7-1265U (824 - 2183, n=10) | |
| HP ZBook Firefly 14 G9-6B8A2EA | |
| HP ZBook Firefly 16 G9-6B897EA | |
| AIDA64 / CPU Queen | |
| Dell Precision 5000 5470 | |
| Moyenne de la classe Workstation (60778 - 144411, n=23, 2 dernières années) | |
| HP EliteBook 845 G9 6F6H6EA | |
| HP ZBook Firefly 14 G9-6B8A2EA | |
| Moyenne Intel Core i7-1265U (63615 - 67065, n=10) | |
| HP ZBook Firefly 16 G9-6B897EA | |
| HP ZBook Firefly 14 G8 2C9Q2EA | |
| Microsoft Surface Laptop Studio i7 RTX 3050 Ti | |
| AIDA64 / FPU SinJulia | |
| Moyenne de la classe Workstation (8165 - 29343, n=23, 2 dernières années) | |
| HP EliteBook 845 G9 6F6H6EA | |
| Dell Precision 5000 5470 | |
| HP ZBook Firefly 14 G8 2C9Q2EA | |
| Microsoft Surface Laptop Studio i7 RTX 3050 Ti | |
| Moyenne Intel Core i7-1265U (3105 - 5135, n=10) | |
| HP ZBook Firefly 14 G9-6B8A2EA | |
| HP ZBook Firefly 16 G9-6B897EA | |
| AIDA64 / FPU Mandel | |
| Moyenne de la classe Workstation (44497 - 98153, n=23, 2 dernières années) | |
| HP EliteBook 845 G9 6F6H6EA | |
| Dell Precision 5000 5470 | |
| Microsoft Surface Laptop Studio i7 RTX 3050 Ti | |
| HP ZBook Firefly 14 G8 2C9Q2EA | |
| Moyenne Intel Core i7-1265U (6967 - 20804, n=10) | |
| HP ZBook Firefly 14 G9-6B8A2EA | |
| HP ZBook Firefly 16 G9-6B897EA | |
| AIDA64 / CPU AES | |
| Moyenne de la classe Workstation (73133 - 187841, n=23, 2 dernières années) | |
| HP ZBook Firefly 14 G8 2C9Q2EA | |
| HP EliteBook 845 G9 6F6H6EA | |
| Microsoft Surface Laptop Studio i7 RTX 3050 Ti | |
| Dell Precision 5000 5470 | |
| Moyenne Intel Core i7-1265U (19489 - 42966, n=10) | |
| HP ZBook Firefly 14 G9-6B8A2EA | |
| HP ZBook Firefly 16 G9-6B897EA | |
| AIDA64 / CPU ZLib | |
| Moyenne de la classe Workstation (929 - 2148, n=23, 2 dernières années) | |
| HP EliteBook 845 G9 6F6H6EA | |
| Moyenne Intel Core i7-1265U (314 - 632, n=10) | |
| Dell Precision 5000 5470 | |
| HP ZBook Firefly 14 G8 2C9Q2EA | |
| HP ZBook Firefly 14 G9-6B8A2EA | |
| Microsoft Surface Laptop Studio i7 RTX 3050 Ti | |
| HP ZBook Firefly 16 G9-6B897EA | |
| AIDA64 / FP64 Ray-Trace | |
| Moyenne de la classe Workstation (8545 - 32891, n=23, 2 dernières années) | |
| Dell Precision 5000 5470 | |
| HP EliteBook 845 G9 6F6H6EA | |
| Microsoft Surface Laptop Studio i7 RTX 3050 Ti | |
| HP ZBook Firefly 14 G8 2C9Q2EA | |
| Moyenne Intel Core i7-1265U (1473 - 4376, n=10) | |
| HP ZBook Firefly 14 G9-6B8A2EA | |
| HP ZBook Firefly 16 G9-6B897EA | |
| AIDA64 / CPU PhotoWorxx | |
| Moyenne de la classe Workstation (37151 - 93684, n=23, 2 dernières années) | |
| Dell Precision 5000 5470 | |
| Microsoft Surface Laptop Studio i7 RTX 3050 Ti | |
| Moyenne Intel Core i7-1265U (20213 - 47031, n=10) | |
| HP ZBook Firefly 14 G9-6B8A2EA | |
| HP ZBook Firefly 14 G8 2C9Q2EA | |
| HP ZBook Firefly 16 G9-6B897EA | |
| HP EliteBook 845 G9 6F6H6EA | |
Performance du système
Les performances subjectives du système sont très bonnes malgré la performance relativement faible du CPU, ce qui peut également être attribué au SSD PCIe 4.0 rapide. Nous n'avons pas non plus détecté de problèmes pendant le test.
CrossMark: Overall | Productivity | Creativity | Responsiveness
| PCMark 10 / Score | |
| Moyenne de la classe Workstation (6563 - 10409, n=19, 2 dernières années) | |
| Dell Precision 5000 5470 | |
| HP EliteBook 845 G9 6F6H6EA | |
| Moyenne Intel Core i7-1265U, NVIDIA T550 Laptop GPU (5488 - 6181, n=3) | |
| Lenovo ThinkPad P14s Gen2-20VX000GGE | |
| HP ZBook Firefly 16 G9-6B897EA | |
| Microsoft Surface Laptop Studio i7 RTX 3050 Ti | |
| HP ZBook Firefly 14 G9-6B8A2EA | |
| HP ZBook Firefly 14 G8 2C9Q2EA | |
| PCMark 10 / Essentials | |
| Dell Precision 5000 5470 | |
| Moyenne de la classe Workstation (9622 - 11157, n=19, 2 dernières années) | |
| HP ZBook Firefly 16 G9-6B897EA | |
| Moyenne Intel Core i7-1265U, NVIDIA T550 Laptop GPU (9960 - 10250, n=3) | |
| HP ZBook Firefly 14 G9-6B8A2EA | |
| Lenovo ThinkPad P14s Gen2-20VX000GGE | |
| HP EliteBook 845 G9 6F6H6EA | |
| HP ZBook Firefly 14 G8 2C9Q2EA | |
| Microsoft Surface Laptop Studio i7 RTX 3050 Ti | |
| PCMark 10 / Productivity | |
| Moyenne de la classe Workstation (8789 - 20616, n=19, 2 dernières années) | |
| Lenovo ThinkPad P14s Gen2-20VX000GGE | |
| Moyenne Intel Core i7-1265U, NVIDIA T550 Laptop GPU (8315 - 9474, n=3) | |
| HP ZBook Firefly 16 G9-6B897EA | |
| Dell Precision 5000 5470 | |
| Microsoft Surface Laptop Studio i7 RTX 3050 Ti | |
| HP ZBook Firefly 14 G8 2C9Q2EA | |
| HP ZBook Firefly 14 G9-6B8A2EA | |
| HP EliteBook 845 G9 6F6H6EA | |
| PCMark 10 / Digital Content Creation | |
| Moyenne de la classe Workstation (8108 - 15631, n=19, 2 dernières années) | |
| Dell Precision 5000 5470 | |
| HP EliteBook 845 G9 6F6H6EA | |
| Microsoft Surface Laptop Studio i7 RTX 3050 Ti | |
| Moyenne Intel Core i7-1265U, NVIDIA T550 Laptop GPU (5399 - 6793, n=3) | |
| Lenovo ThinkPad P14s Gen2-20VX000GGE | |
| HP ZBook Firefly 16 G9-6B897EA | |
| HP ZBook Firefly 14 G8 2C9Q2EA | |
| HP ZBook Firefly 14 G9-6B8A2EA | |
| CrossMark / Overall | |
| Moyenne de la classe Workstation (1307 - 2267, n=22, 2 dernières années) | |
| Dell Precision 5000 5470 | |
| HP ZBook Firefly 16 G9-6B897EA | |
| HP ZBook Firefly 14 G9-6B8A2EA | |
| Moyenne Intel Core i7-1265U, NVIDIA T550 Laptop GPU (1591 - 1623, n=3) | |
| Apple MacBook Pro 14 2021 M1 Pro Entry | |
| Microsoft Surface Laptop Studio i7 RTX 3050 Ti | |
| HP EliteBook 845 G9 6F6H6EA | |
| CrossMark / Productivity | |
| Moyenne de la classe Workstation (1130 - 2122, n=22, 2 dernières années) | |
| Dell Precision 5000 5470 | |
| HP ZBook Firefly 16 G9-6B897EA | |
| HP ZBook Firefly 14 G9-6B8A2EA | |
| Moyenne Intel Core i7-1265U, NVIDIA T550 Laptop GPU (1553 - 1592, n=3) | |
| Microsoft Surface Laptop Studio i7 RTX 3050 Ti | |
| HP EliteBook 845 G9 6F6H6EA | |
| Apple MacBook Pro 14 2021 M1 Pro Entry | |
| CrossMark / Creativity | |
| Moyenne de la classe Workstation (1657 - 2725, n=22, 2 dernières années) | |
| Dell Precision 5000 5470 | |
| Apple MacBook Pro 14 2021 M1 Pro Entry | |
| HP ZBook Firefly 16 G9-6B897EA | |
| HP ZBook Firefly 14 G9-6B8A2EA | |
| Moyenne Intel Core i7-1265U, NVIDIA T550 Laptop GPU (1723 - 1751, n=3) | |
| Microsoft Surface Laptop Studio i7 RTX 3050 Ti | |
| HP EliteBook 845 G9 6F6H6EA | |
| CrossMark / Responsiveness | |
| Moyenne de la classe Workstation (993 - 2096, n=22, 2 dernières années) | |
| Dell Precision 5000 5470 | |
| HP ZBook Firefly 14 G9-6B8A2EA | |
| HP ZBook Firefly 16 G9-6B897EA | |
| Moyenne Intel Core i7-1265U, NVIDIA T550 Laptop GPU (1344 - 1376, n=3) | |
| Microsoft Surface Laptop Studio i7 RTX 3050 Ti | |
| HP EliteBook 845 G9 6F6H6EA | |
| Apple MacBook Pro 14 2021 M1 Pro Entry | |
| PCMark 10 Score | 5488 points | |
Aide | ||
| AIDA64 / Memory Copy | |
| Moyenne de la classe Workstation (56003 - 164795, n=23, 2 dernières années) | |
| Dell Precision 5000 5470 | |
| Moyenne Intel Core i7-1265U (40212 - 72204, n=10) | |
| Microsoft Surface Laptop Studio i7 RTX 3050 Ti | |
| HP ZBook Firefly 14 G9-6B8A2EA | |
| HP ZBook Firefly 14 G8 2C9Q2EA | |
| AIDA64 / Memory Read | |
| Moyenne de la classe Workstation (55795 - 121563, n=23, 2 dernières années) | |
| Dell Precision 5000 5470 | |
| HP ZBook Firefly 14 G9-6B8A2EA | |
| Moyenne Intel Core i7-1265U (41808 - 69493, n=10) | |
| Microsoft Surface Laptop Studio i7 RTX 3050 Ti | |
| HP ZBook Firefly 14 G8 2C9Q2EA | |
| AIDA64 / Memory Write | |
| Moyenne de la classe Workstation (55663 - 214520, n=23, 2 dernières années) | |
| Dell Precision 5000 5470 | |
| HP ZBook Firefly 14 G9-6B8A2EA | |
| Microsoft Surface Laptop Studio i7 RTX 3050 Ti | |
| Moyenne Intel Core i7-1265U (41382 - 76027, n=10) | |
| HP ZBook Firefly 14 G8 2C9Q2EA | |
| AIDA64 / Memory Latency | |
| Moyenne de la classe Workstation (84.5 - 165.2, n=23, 2 dernières années) | |
| Dell Precision 5000 5470 | |
| Microsoft Surface Laptop Studio i7 RTX 3050 Ti | |
| Moyenne Intel Core i7-1265U (74.6 - 112.4, n=10) | |
| HP ZBook Firefly 14 G9-6B8A2EA | |
| HP ZBook Firefly 14 G8 2C9Q2EA | |
* ... Moindre est la valeur, meilleures sont les performances
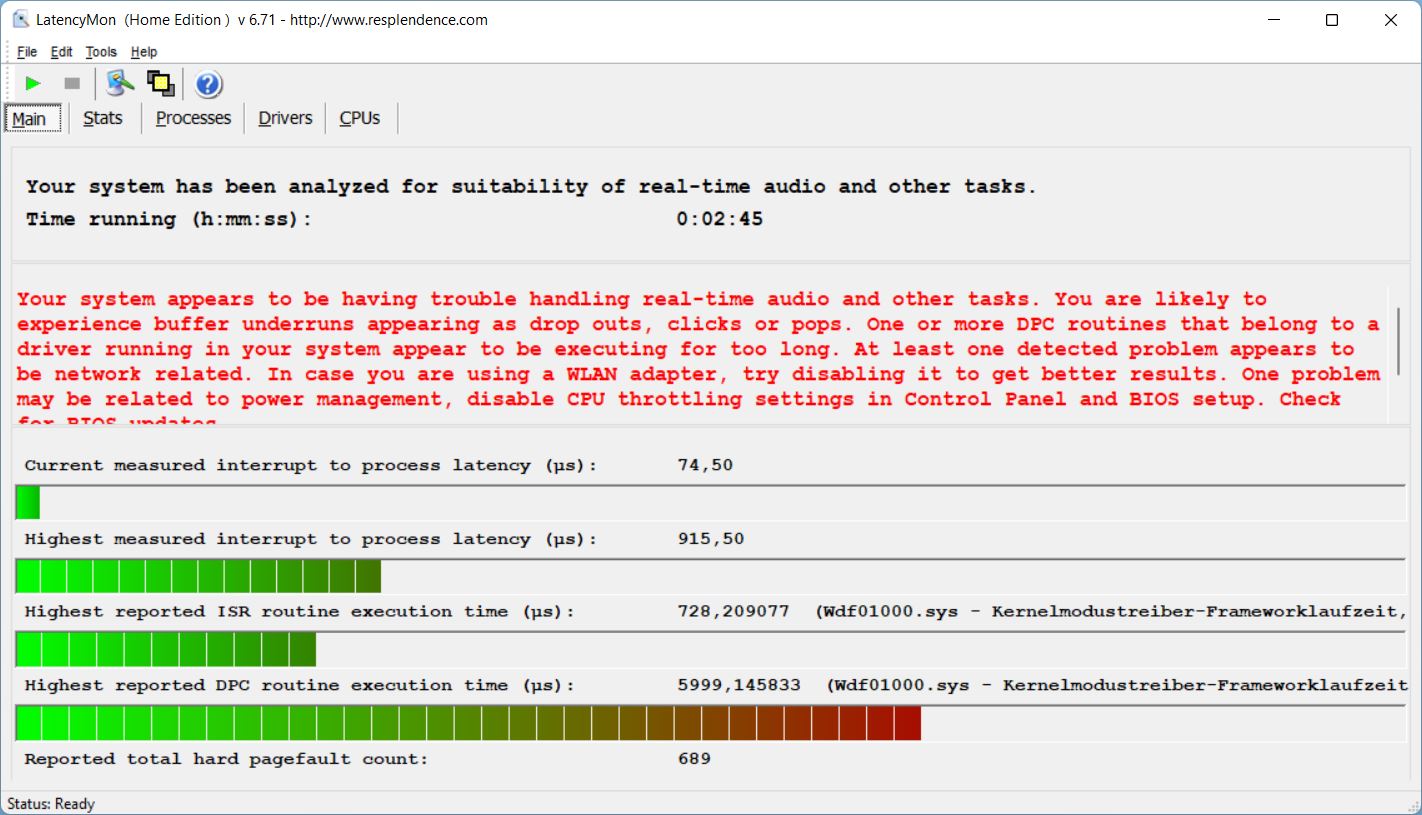
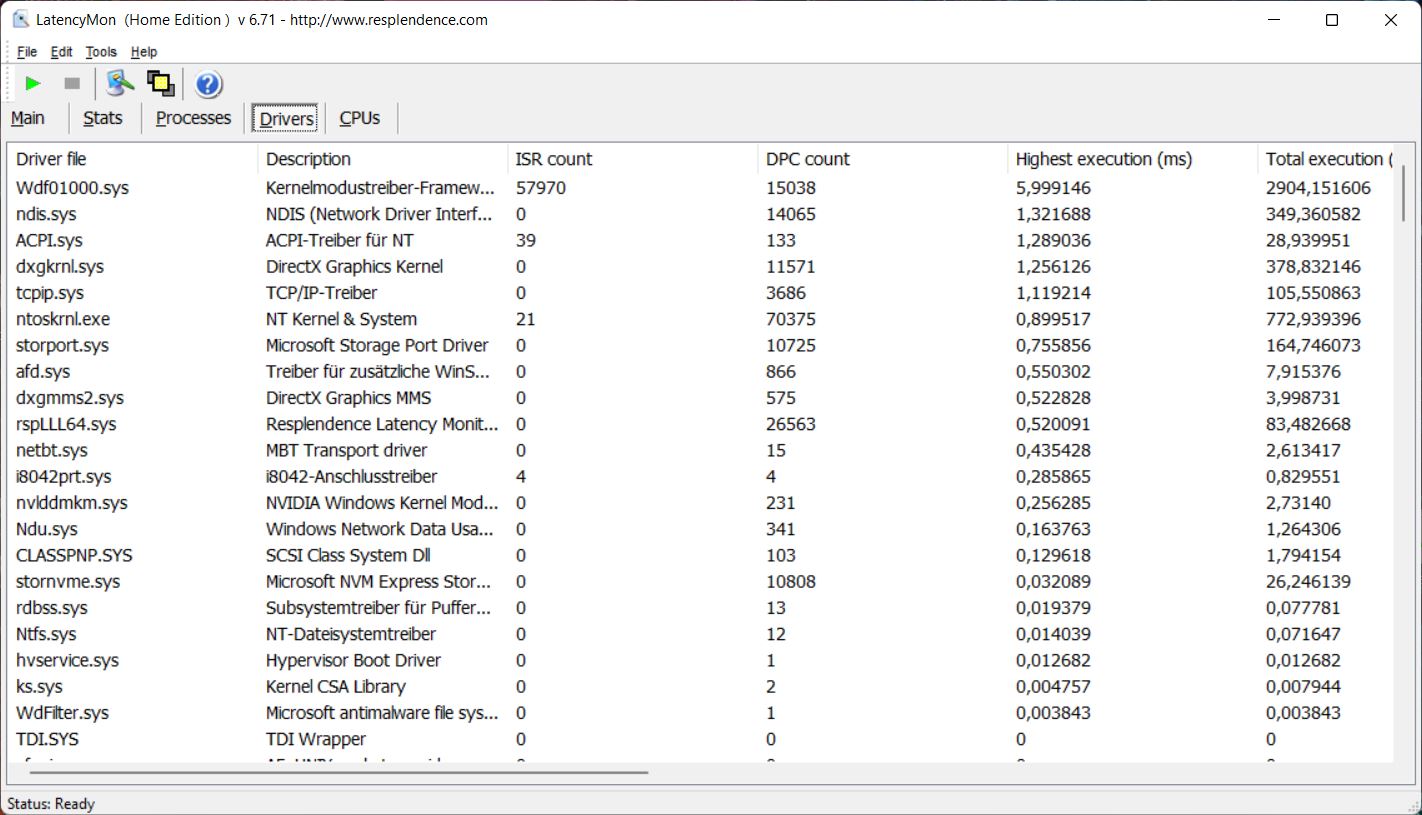
Latence DPC
Avec la version du BIOS en main, le ZBook montre des limitations dans notre test de latence et n'est donc pas idéalement adapté aux applications audio en temps réel.
| DPC Latencies / LatencyMon - interrupt to process latency (max), Web, Youtube, Prime95 | |
| HP ZBook Firefly 14 G8 2C9Q2EA | |
| Dell Precision 5000 5470 | |
| HP EliteBook 845 G9 6F6H6EA | |
| Lenovo ThinkPad P14s Gen2-20VX000GGE | |
| HP ZBook Firefly 16 G9-6B897EA | |
| HP ZBook Firefly 14 G9-6B8A2EA | |
| Microsoft Surface Laptop Studio i7 RTX 3050 Ti | |
* ... Moindre est la valeur, meilleures sont les performances
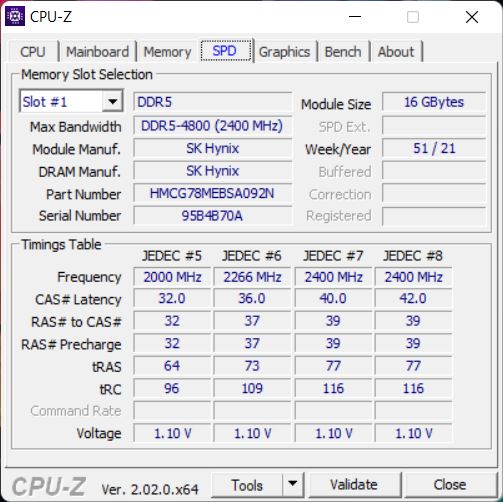
Mémoire de masse
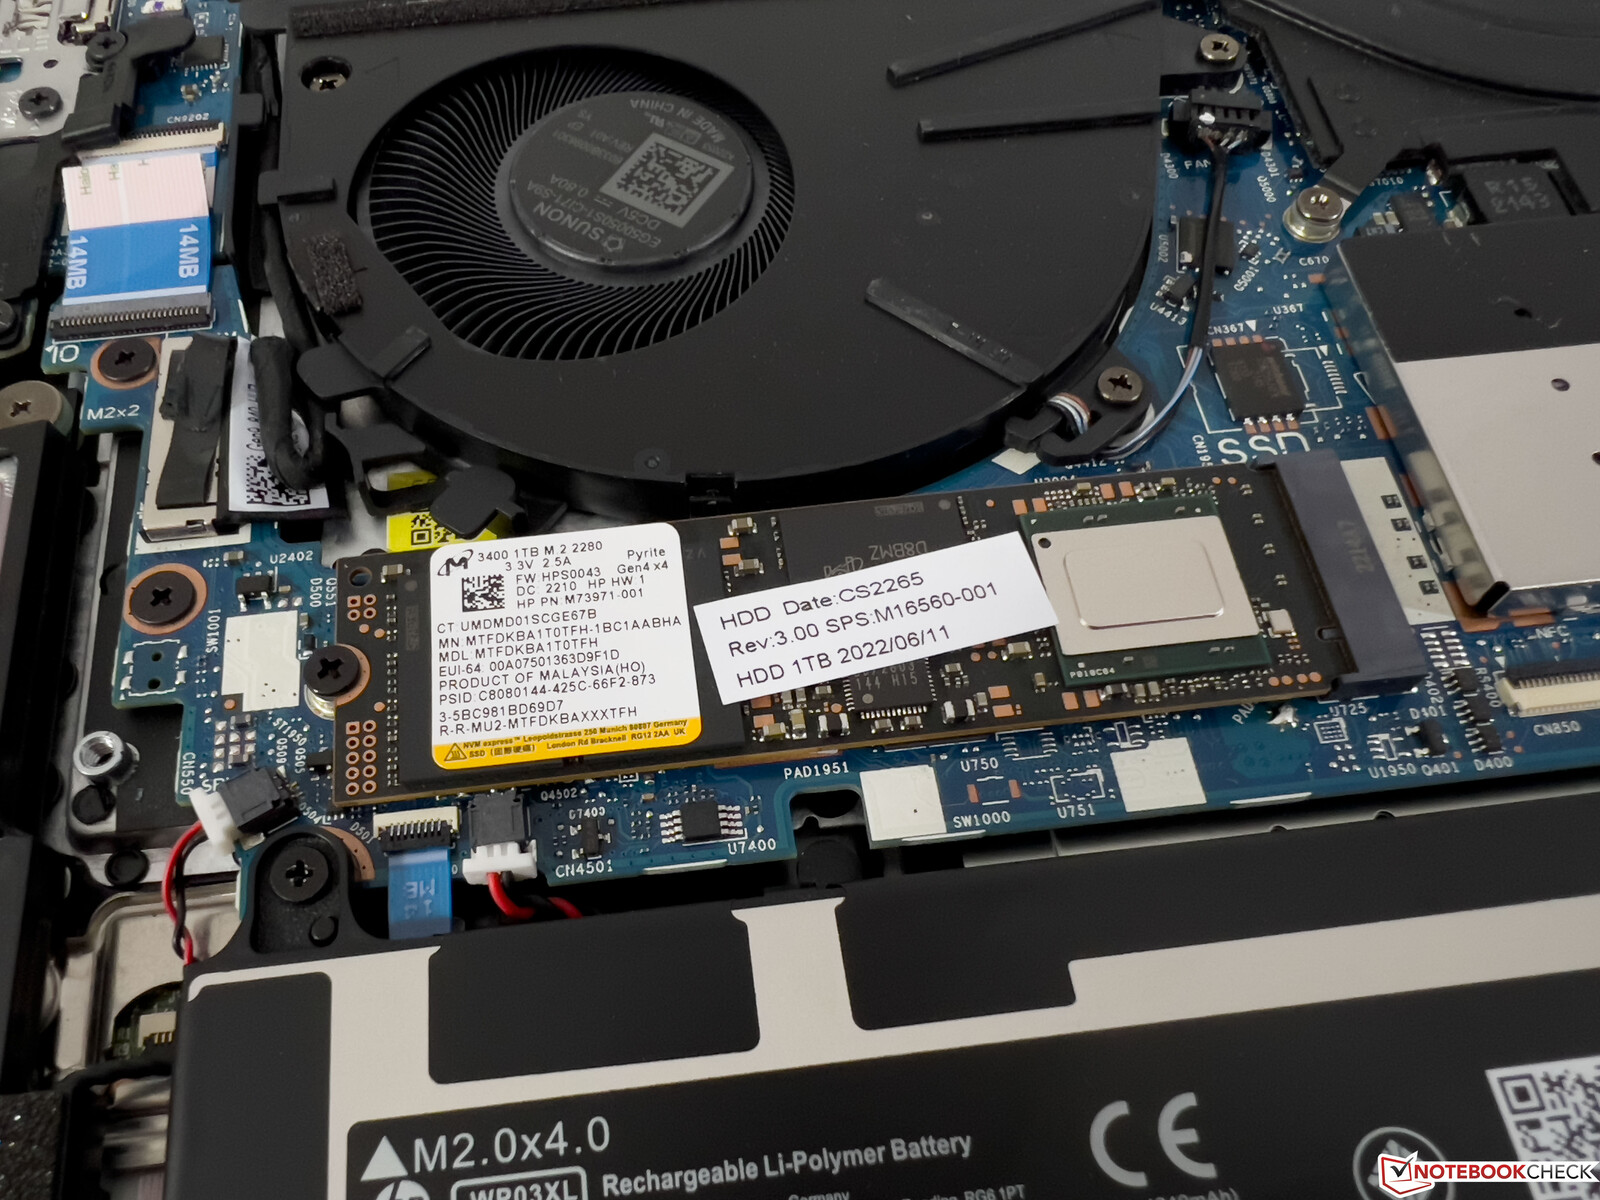
HP installe un SSD PCIe 4.0 Micron 3400 rapide avec une capacité de stockage de 1 To, dont 885 Go sont encore disponibles après le premier démarrage. Les taux de transfert de plus de 6 Go/s sont bons à prendre, mais des fluctuations de performance se produisent après quelques minutes lors d'une charge permanente en raison des températures élevées.
D'autres benchmarks SSD sont disponiblesici.

* ... Moindre est la valeur, meilleures sont les performances
Dauerleistung Lesen: DiskSpd Read Loop, Queue Depth 8
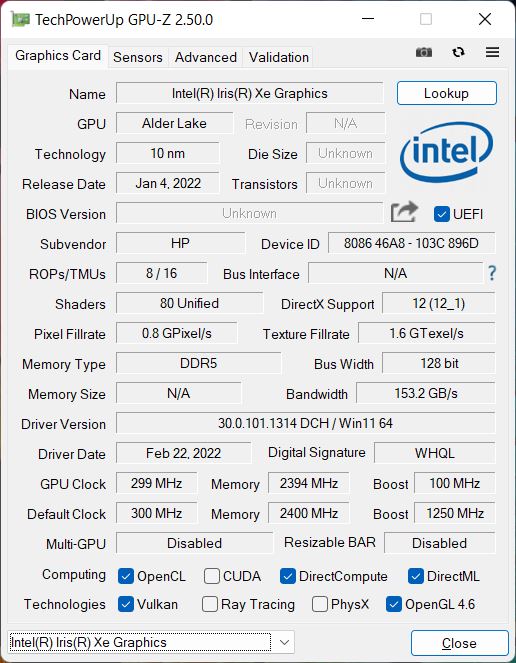
Carte graphique
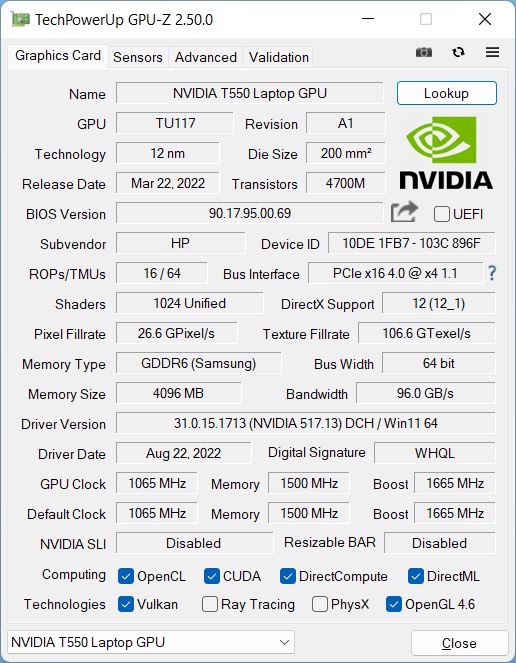
Comme c'est le cas avec la plus grande Firefly 16 G9le processeur dédié Nvidia T550fonctionne à un TGP de seulement 20 W, ce qui correspond à la valeur minimale spécifiée par Nvidia (20-60 W). Comme il s'agit d'un GPU professionnel, vous obtenez des pilotes optimisés, y compris des certifications pour les applications professionnelles. Par conséquent, ce GPU reste intéressant malgré sa classification d'entrée de gamme.
En termes de performances pures, le nouveau T550 est un peu décevant et n'est que marginalement en avance sur le GPU T500 dans l'ancien ZBook Firefly 14 G8. Les performances restent stables sous charge permanente et en mode batterie
Vous trouverez d'autres benchmarks GPU dans notre section technologie.
Les performances de jeu se situent également dans la gamme d'entrée de gamme, mais au moins les titres casual modernes peuvent souvent être joués raisonnablement avec des détails réduits, tant que les exigences ne sont pas trop élevées.
3DMark: 1280x720 Cloud Gate Standard Graphics | 1920x1080 Fire Strike Graphics | 2560x1440 Time Spy Graphics | Wild Life Extreme Unlimited | Wild Life Extreme
| 3DMark Performance rating | |
| Moyenne de la classe Workstation -1! | |
| Apple MacBook Pro 14 2021 M1 Pro Entry -3! | |
| Microsoft Surface Laptop Studio i7 RTX 3050 Ti | |
| Dell Precision 5000 5470 -2! | |
| HP ZBook Firefly 16 G9-6B897EA | |
| Moyenne NVIDIA T550 Laptop GPU | |
| HP ZBook Firefly 14 G9-6B8A2EA | |
| HP ZBook Firefly 14 G8 2C9Q2EA -2! | |
| HP EliteBook 845 G9 6F6H6EA -2! | |
| Lenovo ThinkPad P14s Gen2-20VX000GGE -2! | |
| 3DMark / Cloud Gate Standard Graphics | |
| Moyenne de la classe Workstation (58392 - 152418, n=14, 2 dernières années) | |
| Dell Precision 5000 5470 | |
| Microsoft Surface Laptop Studio i7 RTX 3050 Ti | |
| HP ZBook Firefly 16 G9-6B897EA | |
| Moyenne NVIDIA T550 Laptop GPU (32743 - 33694, n=2) | |
| HP ZBook Firefly 14 G9-6B8A2EA | |
| HP EliteBook 845 G9 6F6H6EA | |
| HP ZBook Firefly 14 G8 2C9Q2EA | |
| Lenovo ThinkPad P14s Gen2-20VX000GGE | |
| 3DMark / Fire Strike Graphics | |
| Moyenne de la classe Workstation (8293 - 52560, n=23, 2 dernières années) | |
| Microsoft Surface Laptop Studio i7 RTX 3050 Ti | |
| Dell Precision 5000 5470 | |
| Moyenne NVIDIA T550 Laptop GPU (4816 - 5593, n=3) | |
| HP ZBook Firefly 16 G9-6B897EA | |
| HP ZBook Firefly 14 G9-6B8A2EA | |
| HP ZBook Firefly 14 G8 2C9Q2EA | |
| Lenovo ThinkPad P14s Gen2-20VX000GGE | |
| HP EliteBook 845 G9 6F6H6EA | |
| 3DMark / Time Spy Graphics | |
| Moyenne de la classe Workstation (2725 - 24806, n=23, 2 dernières années) | |
| Microsoft Surface Laptop Studio i7 RTX 3050 Ti | |
| Dell Precision 5000 5470 | |
| Moyenne NVIDIA T550 Laptop GPU (1882 - 2252, n=3) | |
| HP ZBook Firefly 14 G8 2C9Q2EA | |
| HP ZBook Firefly 16 G9-6B897EA | |
| HP ZBook Firefly 14 G9-6B8A2EA | |
| Lenovo ThinkPad P14s Gen2-20VX000GGE | |
| HP EliteBook 845 G9 6F6H6EA | |
| 3DMark / Wild Life Extreme Unlimited | |
| Microsoft Surface Laptop Studio i7 RTX 3050 Ti | |
| Apple MacBook Pro 14 2021 M1 Pro Entry | |
| HP ZBook Firefly 16 G9-6B897EA | |
| Moyenne NVIDIA T550 Laptop GPU (3530 - 3649, n=2) | |
| HP ZBook Firefly 14 G9-6B8A2EA | |
| 3DMark / Wild Life Extreme | |
| Moyenne de la classe Workstation (5189 - 30182, n=10, 2 dernières années) | |
| Microsoft Surface Laptop Studio i7 RTX 3050 Ti | |
| Apple MacBook Pro 14 2021 M1 Pro Entry | |
| HP ZBook Firefly 16 G9-6B897EA | |
| Moyenne NVIDIA T550 Laptop GPU (3617 - 3739, n=2) | |
| HP ZBook Firefly 14 G9-6B8A2EA | |
| 3DMark Cloud Gate Standard Score | 17829 points | |
| 3DMark Fire Strike Score | 4559 points | |
| 3DMark Time Spy Score | 2031 points | |
Aide | ||
* ... Moindre est la valeur, meilleures sont les performances
The Witcher 3 FPS chart
| Bas | Moyen | Élevé | Ultra | |
|---|---|---|---|---|
| GTA V (2015) | 116 | 117.2 | 61.6 | 29 |
| The Witcher 3 (2015) | 121 | 73 | 39 | 19.6 |
| Dota 2 Reborn (2015) | 113.3 | 103.8 | 92.3 | 84 |
| Final Fantasy XV Benchmark (2018) | 60.2 | 30.5 | 22 | |
| X-Plane 11.11 (2018) | 68.1 | 64.1 | 58.8 | |
| Strange Brigade (2018) | 126.1 | 47.7 | 38.7 | 33.2 |
| F1 2021 (2021) | 152.7 | 70.7 | 56.5 | 36.1 |
| F1 22 (2022) | 66.4 | 59.9 | 41.4 | 29.5 |
Émissions et énergie
Émissions sonores
Dans l'utilisation quotidienne, la faible performance du processeur se remarque positivement dans le comportement du ventilateur car le ZBook Firefly 14 G9 reste extrêmement silencieux tant que vous n'utilisez pas le GPU dédié. Même à pleine charge du processeur, le ventilateur vrombit à moins de 30 dB(A) et est donc à peine audible dans des environnements normaux
Lorsque le T550 est également actif, le ventilateur atteint rapidement ~40 dB(A). Nous n'avons pas pu détecter d'autres bruits électroniques.
Degré de la nuisance sonore
| Au repos |
| 24.3 / 24.3 / 24.3 dB(A) |
| Fortement sollicité |
| 35.6 / 41 dB(A) |
 | ||
30 dB silencieux 40 dB(A) audible 50 dB(A) bruyant |
||
min: | ||
| HP ZBook Firefly 14 G9-6B8A2EA T550 Laptop GPU, i7-1265U, Micron 3400 1TB MTFDKBA1T0TFH | Dell Precision 5000 5470 RTX A1000 Laptop GPU, i9-12900H, Samsung PM9A1 MZVL21T0HCLR | Lenovo ThinkPad P14s Gen2-20VX000GGE T500 Laptop GPU, i7-1185G7, Toshiba XG6 KXG6AZNV1T02 | Microsoft Surface Laptop Studio i7 RTX 3050 Ti GeForce RTX 3050 Ti Laptop GPU, i7-11370H, SK Hynix PC711 1TB HFS001TDE9X084N | Apple MacBook Pro 14 2021 M1 Pro Entry M1 Pro 14-Core GPU, M1 Pro 8-Core, Apple SSD AP0512 | HP ZBook Firefly 14 G8 2C9Q2EA T500 Laptop GPU, i7-1165G7, Toshiba XG6 KXG60ZNV1T02 | HP EliteBook 845 G9 6F6H6EA Radeon 680M, R9 PRO 6950HS, WDC PC SN810 1TB | HP ZBook Firefly 16 G9-6B897EA T550 Laptop GPU, i7-1265U, Samsung PM9A1 MZVL21T0HCLR | |
|---|---|---|---|---|---|---|---|---|
| Noise | -10% | -1% | -4% | 3% | -10% | -6% | -1% | |
| arrêt / environnement * (dB) | 24.3 | 23 5% | 24.6 -1% | 24.7 -2% | 24.8 -2% | 28.7 -18% | 25.5 -5% | 23.8 2% |
| Idle Minimum * (dB) | 24.3 | 23.3 4% | 24.6 -1% | 24.7 -2% | 24.8 -2% | 28.7 -18% | 25.5 -5% | 23.8 2% |
| Idle Average * (dB) | 24.3 | 23.3 4% | 24.6 -1% | 24.7 -2% | 24.8 -2% | 28.7 -18% | 25.5 -5% | 23.8 2% |
| Idle Maximum * (dB) | 24.3 | 23.3 4% | 24.6 -1% | 24.7 -2% | 24.8 -2% | 28.7 -18% | 25.5 -5% | 23.8 2% |
| Load Average * (dB) | 35.6 | 48.5 -36% | 38.9 -9% | 33.2 7% | 27.8 22% | 34 4% | 38.1 -7% | 39.4 -11% |
| Witcher 3 ultra * (dB) | 38.2 | 48.6 -27% | 44.5 -16% | 27.8 27% | 40.1 -5% | 40.5 -6% | ||
| Load Maximum * (dB) | 41 | 50.4 -23% | 38.9 5% | 46.7 -14% | 49.5 -21% | 40.1 2% | 44 -7% | 41.4 -1% |
* ... Moindre est la valeur, meilleures sont les performances
Température
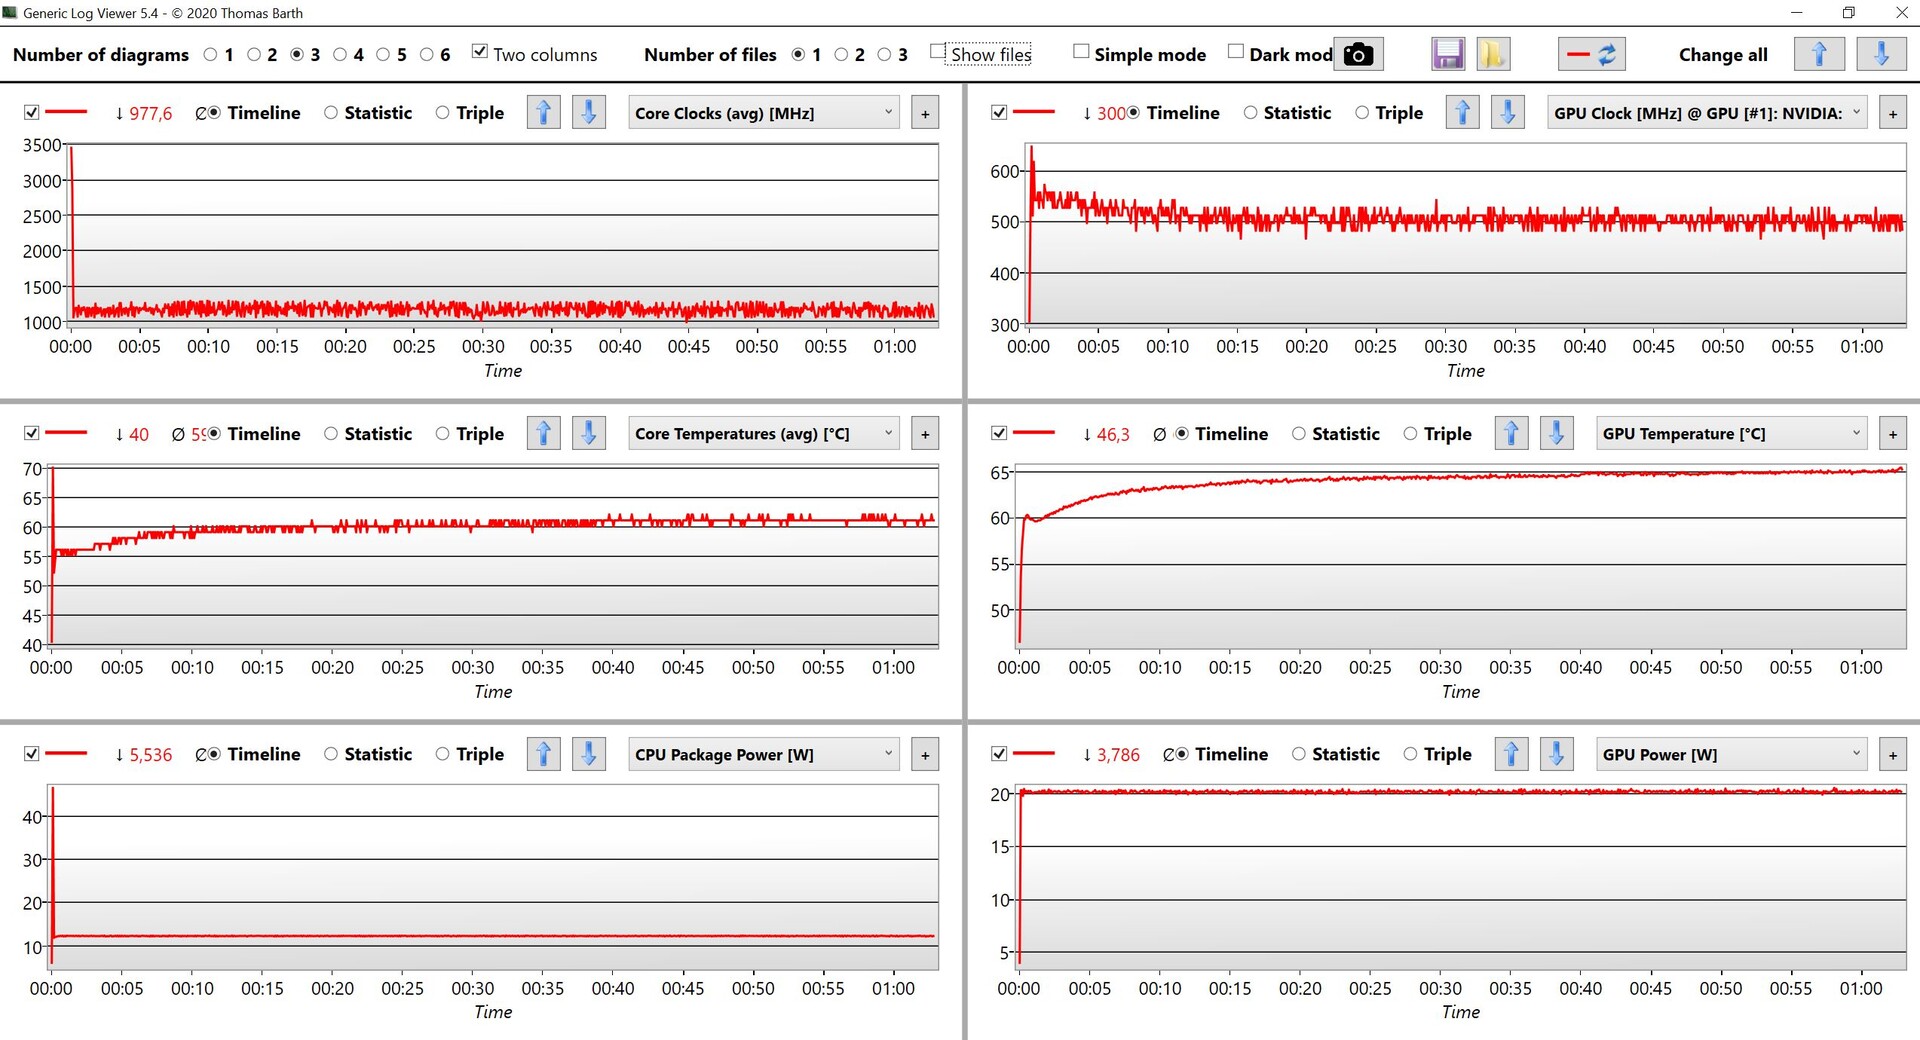
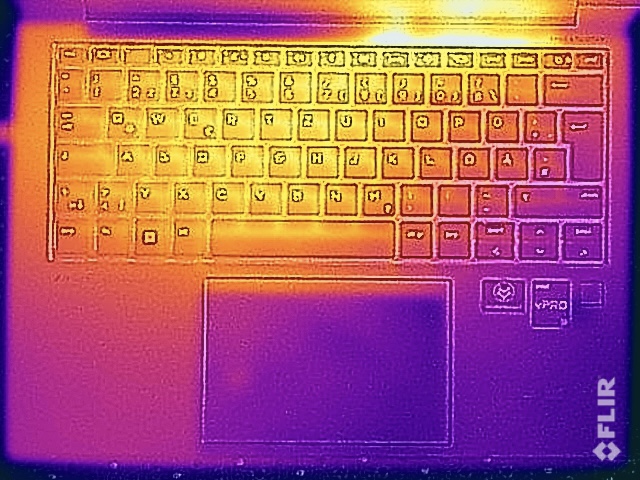
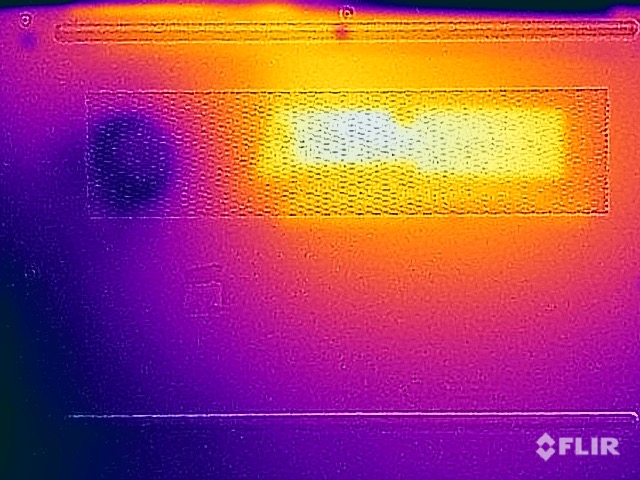
Le ZBook Firefly 14 G9 n'a pas de problème de température en utilisation normale, et les surfaces restent agréablement fraîches. En pleine charge (surtout avec un GPU actif), les températures ne deviennent pas critiques, mais certains endroits sur la face inférieure dépassent les 47 °C malgré les performances comparativement faibles.
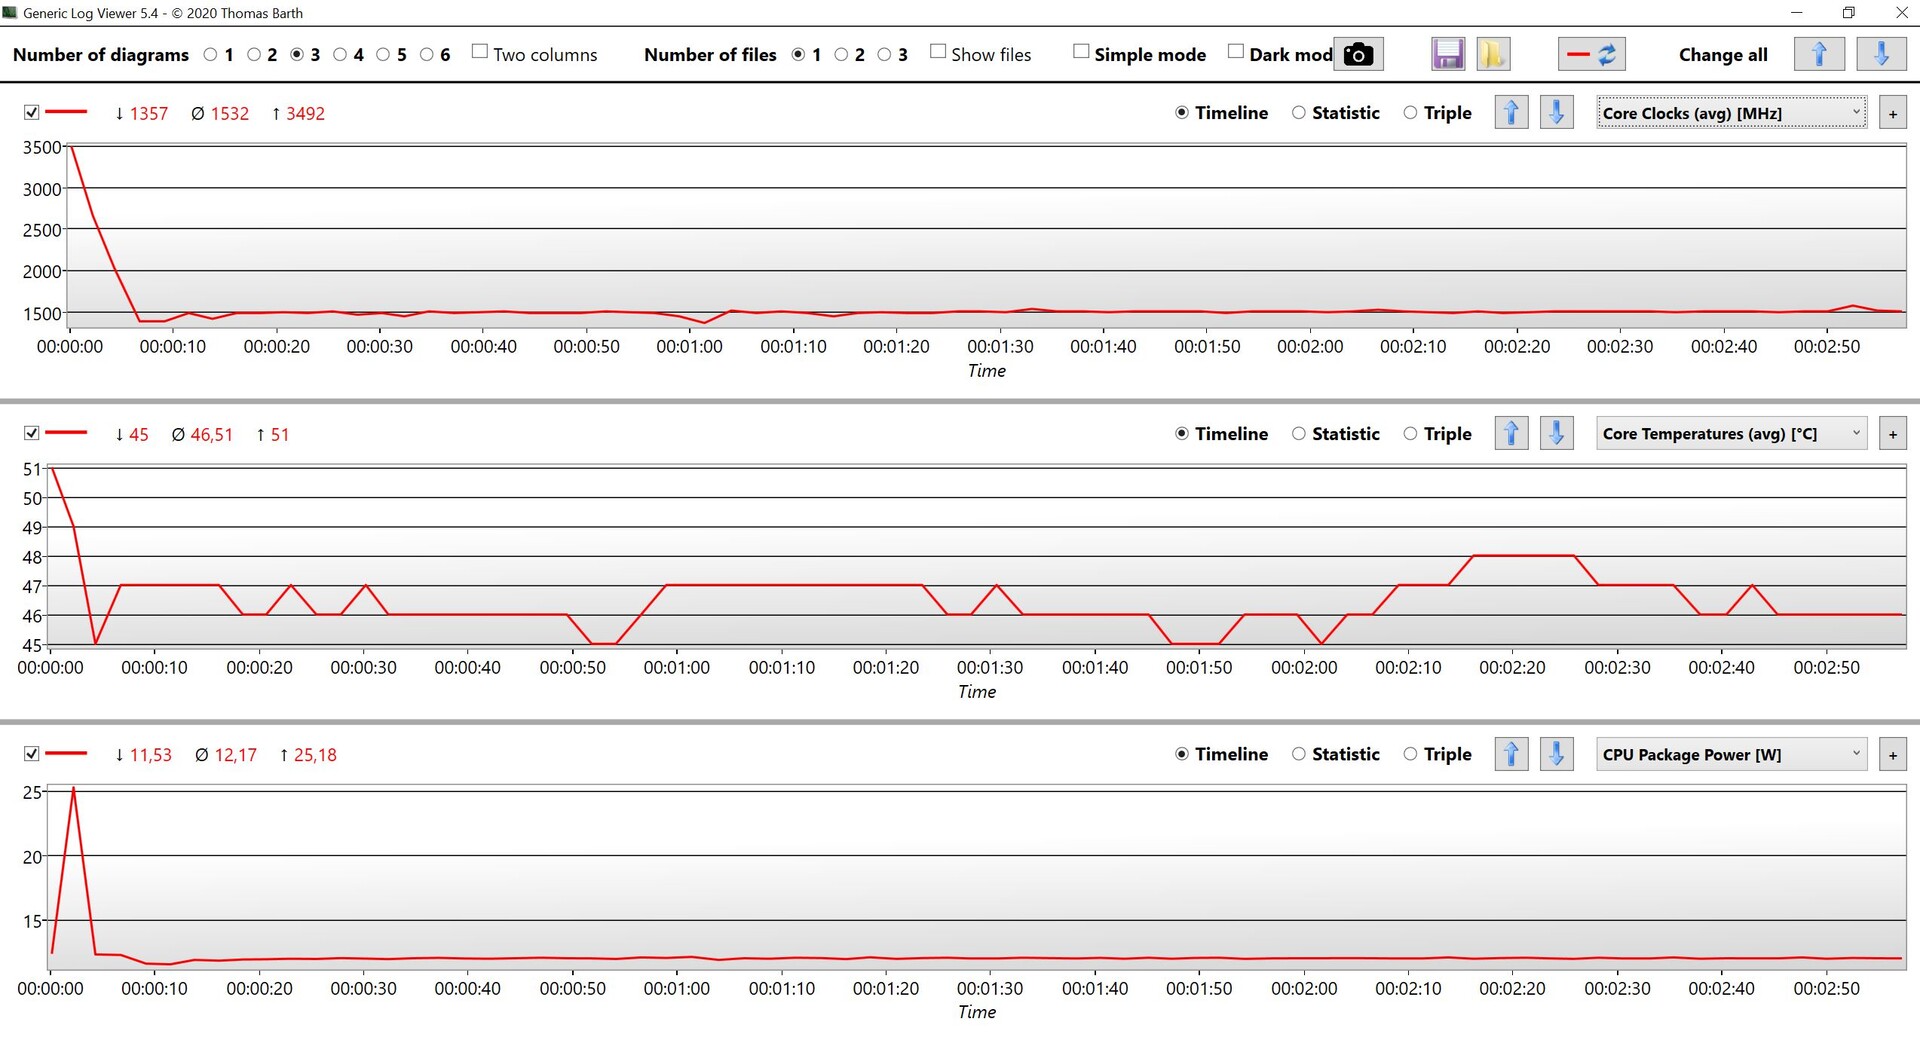
Le comportement habituel se produit ensuite lors du test de stress : Le CPU s'installe immédiatement à 12 W et le GPU reste stable à 20 W.
(±) La température maximale du côté supérieur est de 41.2 °C / 106 F, par rapport à la moyenne de 38.2 °C / 101 F, allant de 22.2 à 69.8 °C pour la classe Workstation.
(-) Le fond chauffe jusqu'à un maximum de 47.9 °C / 118 F, contre une moyenne de 41.1 °C / 106 F
(+) En utilisation inactive, la température moyenne du côté supérieur est de 25.8 °C / 78 F, par rapport à la moyenne du dispositif de 32 °C / 90 F.
(±) En jouant à The Witcher 3, la température moyenne du côté supérieur est de 32.7 °C / 91 F, alors que la moyenne de l'appareil est de 32 °C / 90 F.
(+) Les repose-poignets et le pavé tactile atteignent la température maximale de la peau (32.1 °C / 89.8 F) et ne sont donc pas chauds.
(-) La température moyenne de la zone de l'appui-paume de dispositifs similaires était de 27.8 °C / 82 F (-4.3 °C / #-7.8 F).
| HP ZBook Firefly 14 G9-6B8A2EA Intel Core i7-1265U, NVIDIA T550 Laptop GPU | Dell Precision 5000 5470 Intel Core i9-12900H, NVIDIA RTX A1000 Laptop GPU | Lenovo ThinkPad P14s Gen2-20VX000GGE Intel Core i7-1185G7, NVIDIA T500 Laptop GPU | Microsoft Surface Laptop Studio i7 RTX 3050 Ti Intel Core i7-11370H, NVIDIA GeForce RTX 3050 Ti Laptop GPU | Apple MacBook Pro 14 2021 M1 Pro Entry Apple M1 Pro 8-Core, Apple M1 Pro 14-Core GPU | HP ZBook Firefly 14 G8 2C9Q2EA Intel Core i7-1165G7, NVIDIA T500 Laptop GPU | HP EliteBook 845 G9 6F6H6EA AMD Ryzen 9 PRO 6950HS, AMD Radeon 680M | |
|---|---|---|---|---|---|---|---|
| Heat | -8% | -12% | 11% | 5% | 3% | -13% | |
| Maximum Upper Side * (°C) | 41.2 | 41.8 -1% | 52.4 -27% | 42.3 -3% | 46.8 -14% | 42.6 -3% | 49.4 -20% |
| Maximum Bottom * (°C) | 47.9 | 36 25% | 63.7 -33% | 38.2 20% | 40.9 15% | 49.4 -3% | 48 -0% |
| Idle Upper Side * (°C) | 26.5 | 34.6 -31% | 24.6 7% | 23.4 12% | 24.2 9% | 24.2 9% | 30.8 -16% |
| Idle Bottom * (°C) | 27 | 33.6 -24% | 26 4% | 23.5 13% | 24.2 10% | 24.6 9% | 31.4 -16% |
* ... Moindre est la valeur, meilleures sont les performances
Haut-parleurs
Les deux haut-parleurs stéréo offrent un son décent - seules les basses sont très faibles et le son ne semble donc pas très puissant. Cependant, les haut-parleurs conviennent parfaitement aux conférences et à la reproduction de la voix.
HP ZBook Firefly 14 G9-6B8A2EA analyse audio
(+) | les haut-parleurs peuvent jouer relativement fort (84.5# dB)
Basses 100 - 315 Hz
(-) | presque aucune basse - en moyenne 19.6% plus bas que la médiane
(±) | la linéarité des basses est moyenne (13% delta à la fréquence précédente)
Médiums 400 - 2000 Hz
(+) | médiane équilibrée - seulement 2.5% de la médiane
(+) | les médiums sont linéaires (3.5% delta à la fréquence précédente)
Aiguës 2 - 16 kHz
(+) | des sommets équilibrés - à seulement 1.9% de la médiane
(+) | les aigus sont linéaires (3.2% delta à la fréquence précédente)
Globalement 100 - 16 000 Hz
(+) | le son global est linéaire (12.7% différence à la médiane)
Par rapport à la même classe
» 21% de tous les appareils testés de cette catégorie étaient meilleurs, 4% similaires, 74% pires
» Le meilleur avait un delta de 7%, la moyenne était de 17%, le pire était de 35%.
Par rapport à tous les appareils testés
» 12% de tous les appareils testés étaient meilleurs, 3% similaires, 86% pires
» Le meilleur avait un delta de 4%, la moyenne était de 23%, le pire était de 134%.
Apple MacBook Pro 14 2021 M1 Pro Entry analyse audio
(+) | les haut-parleurs peuvent jouer relativement fort (84.9# dB)
Basses 100 - 315 Hz
(+) | bonne basse - seulement 4.3% loin de la médiane
(+) | les basses sont linéaires (5.9% delta à la fréquence précédente)
Médiums 400 - 2000 Hz
(+) | médiane équilibrée - seulement 1.1% de la médiane
(+) | les médiums sont linéaires (1.9% delta à la fréquence précédente)
Aiguës 2 - 16 kHz
(+) | des sommets équilibrés - à seulement 2.9% de la médiane
(+) | les aigus sont linéaires (3% delta à la fréquence précédente)
Globalement 100 - 16 000 Hz
(+) | le son global est linéaire (5.6% différence à la médiane)
Par rapport à la même classe
» 2% de tous les appareils testés de cette catégorie étaient meilleurs, 1% similaires, 97% pires
» Le meilleur avait un delta de 5%, la moyenne était de 17%, le pire était de 45%.
Par rapport à tous les appareils testés
» 0% de tous les appareils testés étaient meilleurs, 0% similaires, 100% pires
» Le meilleur avait un delta de 4%, la moyenne était de 23%, le pire était de 134%.
Consommation d'énergie
Dans l'ensemble, le ZBook Firefly 14 G9 est un ordinateur portable très efficace, bien que les effets de ses faibles performances soient perceptibles en charge. Il atteint 68 W pendant un très court moment dans le test de stress, mais la consommation se stabilise immédiatement à ~45 W et reste à ce niveau. L'alimentation de 65 W fournie est donc suffisante.
| Éteint/en veille | |
| Au repos | |
| Fortement sollicité |
|
Légende:
min: | |
Power consumption - The Witcher 3 / Stress test
Power consumption - External monitor
Durée de vie de la batterie
Avec la batterie de 51 Whr, le ZBook Firefly 14 G9 offre une autonomie décente de presque 9 heures dans notre test WLAN à 150 cd/m² (correspond à 63% de la luminosité maximale) ; et ~7.5 heures à la luminosité de l'écran complet. Cependant, les rivaux offrent plus d'endurance à l'exception du Surface Studio - même le vieux ZBook Firefly 14 G8 a duré beaucoup plus longtemps.
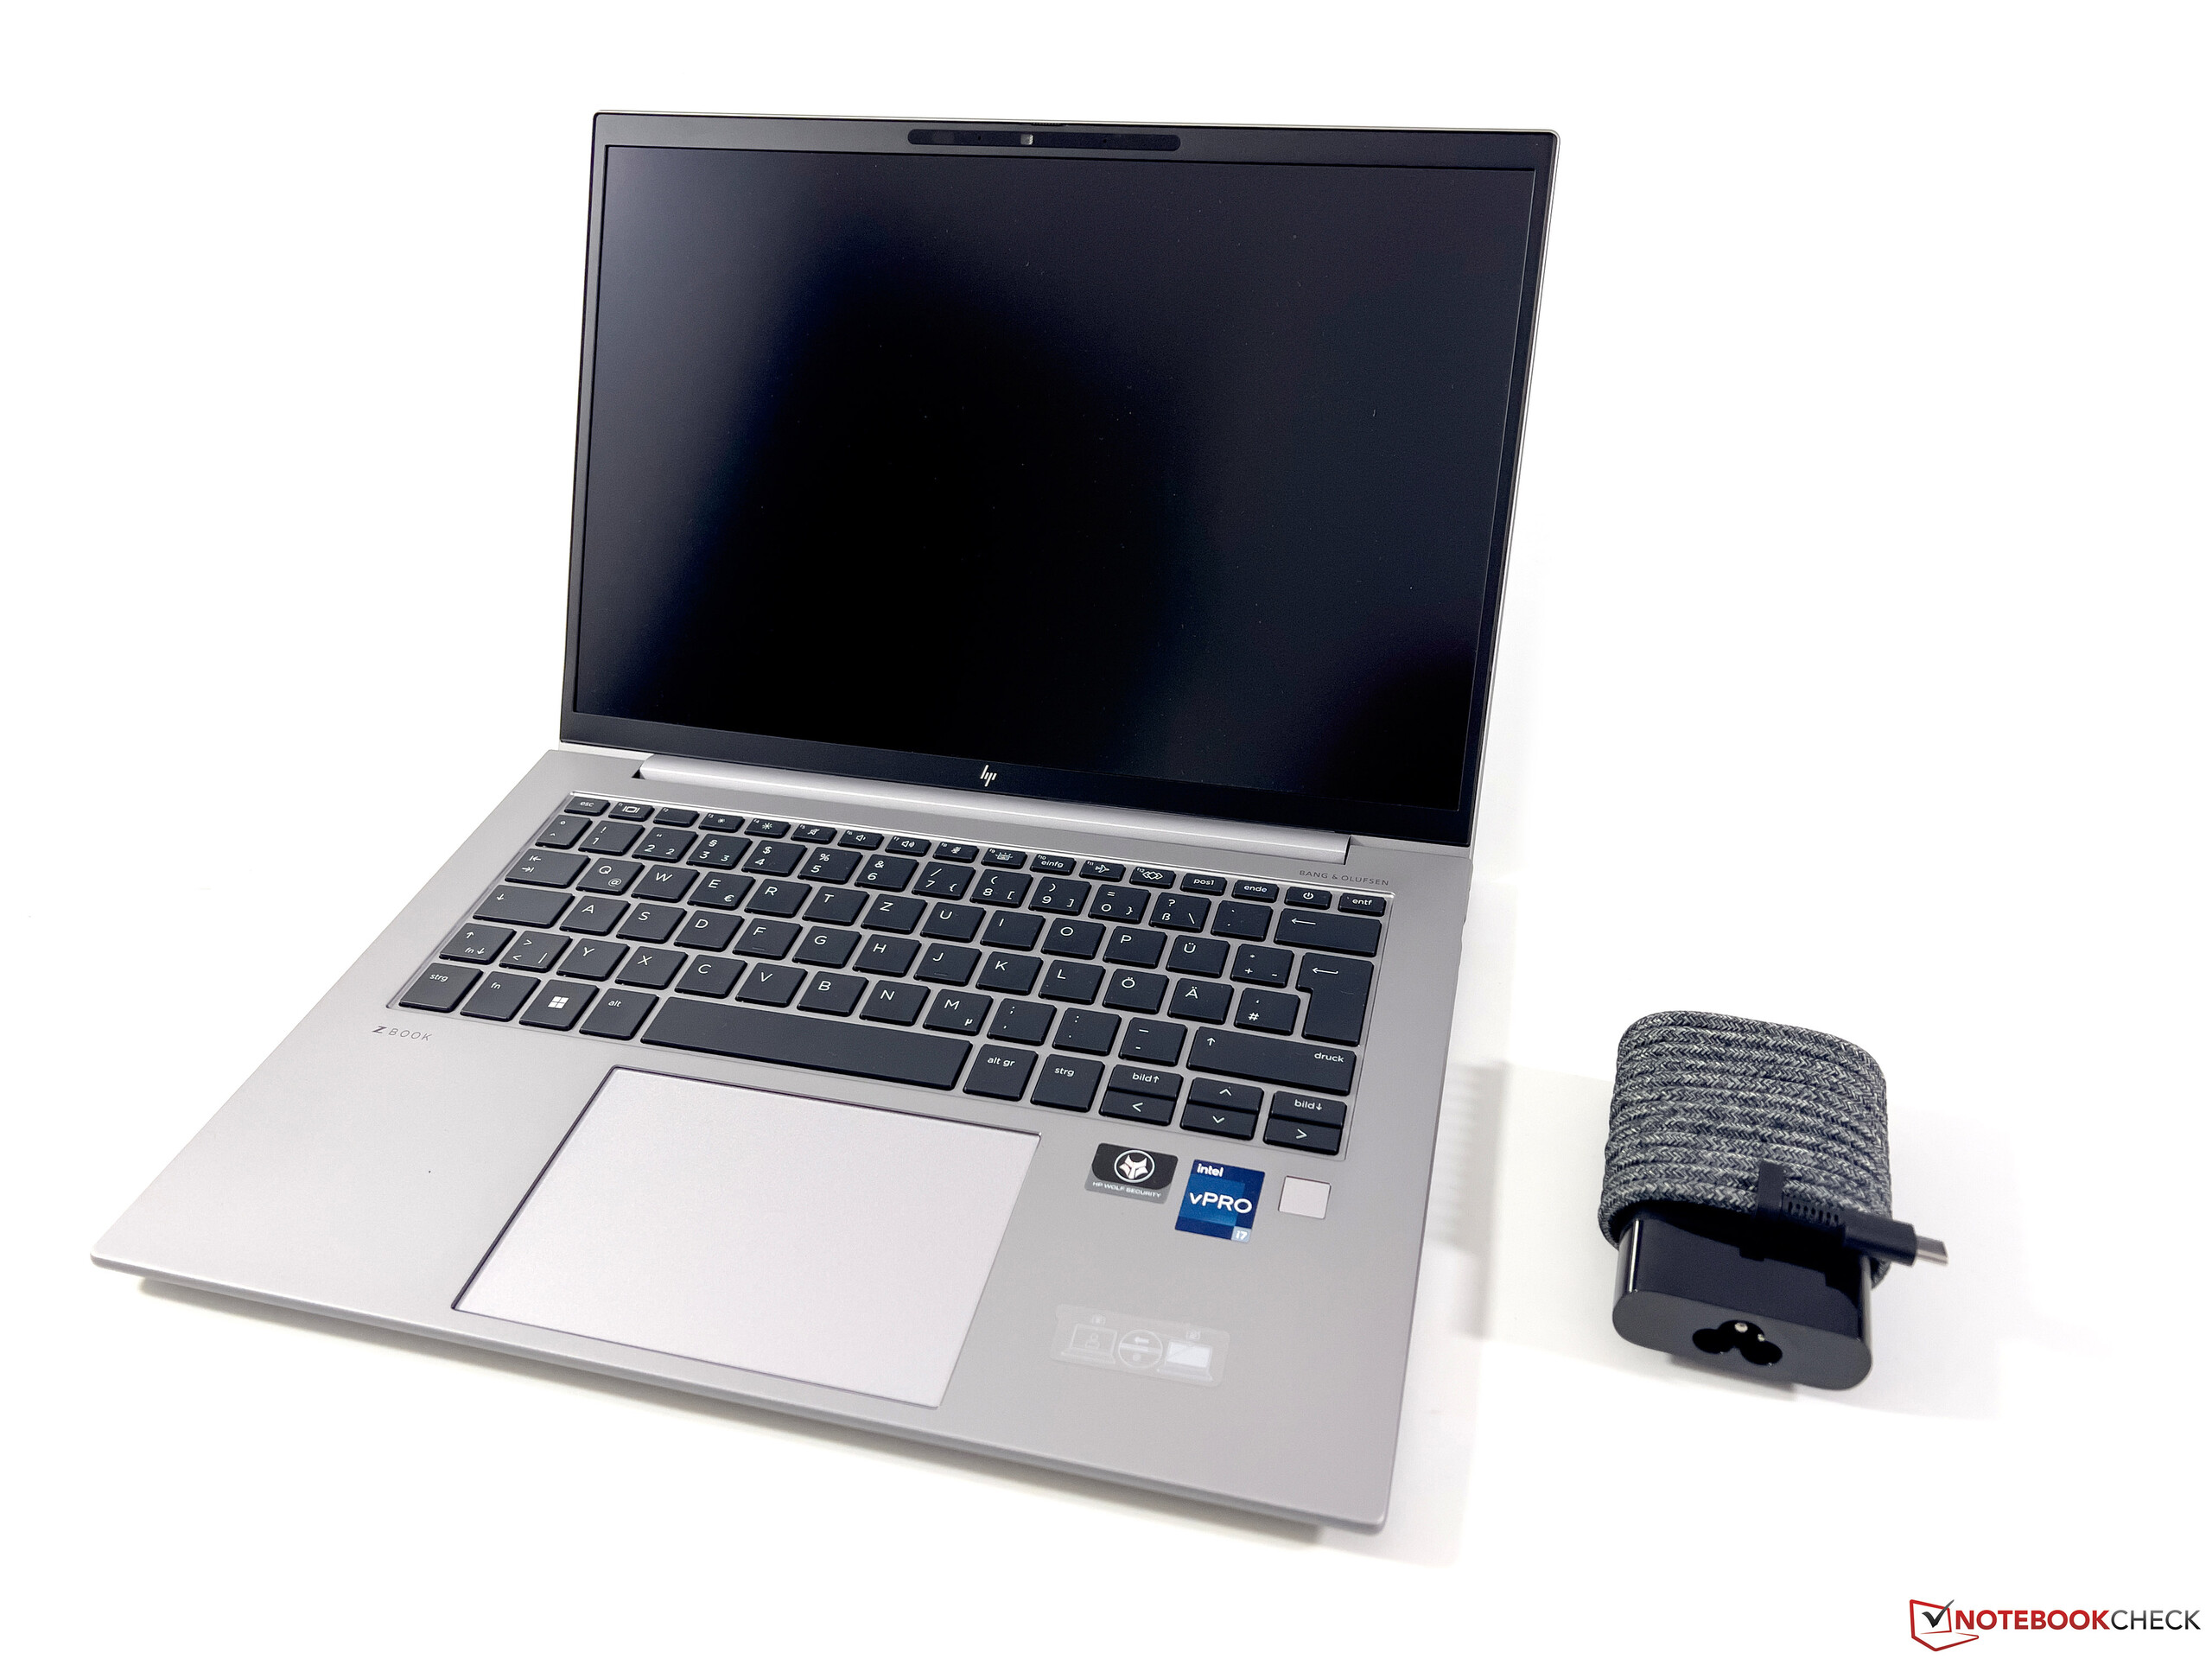
Une charge complète prend 140 minutes lorsque l'appareil est allumé, avec 80% de charge disponible après 72 minutes. Il n'y a pas de fonction de charge rapide.
| HP ZBook Firefly 14 G9-6B8A2EA i7-1265U, T550 Laptop GPU, 51 Wh | Dell Precision 5000 5470 i9-12900H, RTX A1000 Laptop GPU, 72 Wh | Lenovo ThinkPad P14s Gen2-20VX000GGE i7-1185G7, T500 Laptop GPU, 50 Wh | Microsoft Surface Laptop Studio i7 RTX 3050 Ti i7-11370H, GeForce RTX 3050 Ti Laptop GPU, 58 Wh | Apple MacBook Pro 14 2021 M1 Pro Entry M1 Pro 8-Core, M1 Pro 14-Core GPU, 69.9 Wh | HP ZBook Firefly 14 G8 2C9Q2EA i7-1165G7, T500 Laptop GPU, 53 Wh | HP EliteBook 845 G9 6F6H6EA R9 PRO 6950HS, Radeon 680M, 51 Wh | Moyenne de la classe Workstation | |
|---|---|---|---|---|---|---|---|---|
| Autonomie de la batterie | ||||||||
| WiFi v1.3 (h) | 8.8 | 9.6 9% | 9.2 5% | 8 -9% | 13.6 55% | 12.8 45% | 9.3 6% | 8.55 ? -3% |
Points positifs
Points négatifs
Verdict : le ZBook Firefly 14 est trop lent
Notre conclusion sur le ZBook Firefly 14 G9 correspond en gros à celle du plus grand Firefly 16 G9car il s'agit d'un bon ordinateur portable dans de nombreux domaines. Des aspects comme le boîtier, l'écran, l'équipement et les périphériques d'entrée sont tout à fait convaincants, mais les performances sont le point central d'une station de travail mobile
Le processeur, en particulier, ne répond pas à cette exigence, et le nouveau Firefly 14 G9 est également plus lent que son prédécesseur avec un processeur Tiger Lake. Le processeur dédié Nvidia T550a du sens pour les applications professionnelles, mais c'est aussi la version la plus lente avec un TGP de 20 W seulement
Le HP ZBook Firefly 14 G9 peut convaincre dans de nombreux domaines, mais les performances sont tout simplement trop faibles pour une station de travail mobile
Si vous avez besoin de plus de puissance CPU, vous devriez vous tourner vers la variante professionnelle normale HP EliteBook 845 G9 qui est équipée d'un processeur AMD de 35 W tout en évitant le panneau SureView.
Note : Nous sommes actuellement en contact avec HP concernant la faible performance du processeur et nous mettrons à jour l'article en conséquence dès que nous recevrons de nouvelles informations.
Prix et disponibilité
Le ZBook Firefly 14 G9 peut être configuré directement chez HP directement. Alternativement, notre configuration de test est également disponible dans les magasins en ligne, tels que Cyberport pour environ €2,100 (~US$2,075).
HP ZBook Firefly 14 G9-6B8A2EA
- 10/19/2022 v7 (old)
Andreas Osthoff
Price comparison
