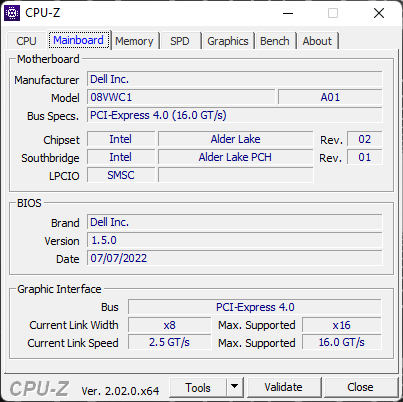
Test du Dell Precision 5470 : les débuts de la Nvidia RTX A1000
Le Precision 5470 est la plus petite station de travail mobile de Dell à ce jour. Tout comme le XPS 17, inspiré du Precision 5750 et le XPS 15 Precision 5560la Precision 5470 de 14 pouces s'inspire des XPS 13 9300/9310 en termes de look et de design. Si vous avez joué avec un système XPS dans le passé, alors le Precision 5470 devrait vous sembler très familier.
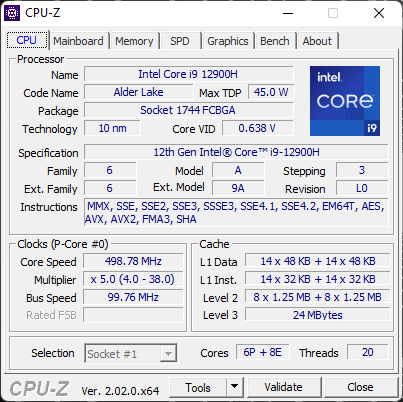
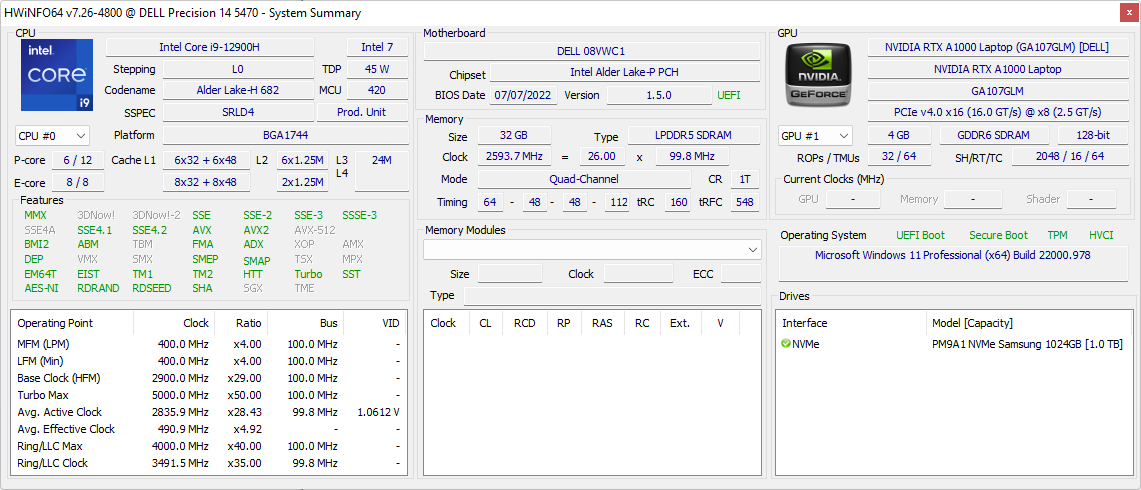
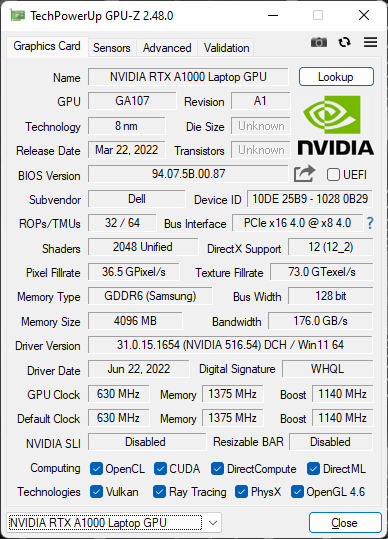
Les deux facteurs distinctifs du Precision 5470 sont le CPU Core série H de 12e génération et le GPU Nvidia RTX A1000 en option, qui offrent une puissance de traitement considérable pour un écran de 14 pouces. Notre unité d'examen est livrée avec le CPU Core i9-12900H, le GPU A1000 et l'écran tactile brillant 1600p pour un prix de détail d'environ 3 000 USD. D'autres unités de stock avec les processeurs i5-12500H à i7-12800H, la carte graphique Iris Xe intégrée uniquement et l'écran 1200p mat sont également disponibles à des prix de départ inférieurs.
Les concurrents directs sont d'autres stations de travail mobiles haut de gamme de 14 pouces comme le HP ZBook Firefly 14 ou Lenovo ThinkPad P14s. Cette catégorie de taille est encore nouvelle en ce qui concerne les stations de travail et nous allons donc également comparer la Precision 5470 à quelques modèles plus grands comme le ThinkPad P15 G2 ou le propre Precision 5560 de Dell.
Plus de commentaires sur Dell :
Comparaison avec les concurrents potentiels
Note | Date | Modèle | Poids | Épaisseur | Taille | Résolution | Prix |
|---|---|---|---|---|---|---|---|
| 87.6 % v7 (old) | 09/22 | Dell Precision 5000 5470 i9-12900H, RTX A1000 Laptop GPU | 1.6 kg | 18.95 mm | 14.00" | 2560x1600 | |
| 86.2 % v7 (old) | 06/22 | Lenovo ThinkPad P15v G2 21A9000XGE i7-11800H, T1200 Laptop GPU | 2.3 kg | 22.7 mm | 15.60" | 1920x1080 | |
| 88.3 % v7 (old) | 10/21 | Dell Precision 5000 5560 i7-11850H, RTX A2000 Laptop GPU | 2 kg | 18 mm | 15.60" | 3840x2400 | |
| 85.2 % v7 (old) | 09/21 | Lenovo ThinkPad P14s G2 AMD R7 PRO 5850U, Vega 8 | 1.5 kg | 17.9 mm | 14.00" | 3840x2160 | |
| 85.2 % v7 (old) | 04/21 | HP ZBook Firefly 14 G8 2C9Q2EA i7-1165G7, T500 Laptop GPU | 1.4 kg | 17.9 mm | 14.00" | 1920x1080 | |
| 82.4 % v7 (old) | 01/21 | HP ZBook Firefly 14 G7 i7-10610U, Quadro P520 | 1.4 kg | 17.9 mm | 14.00" | 1920x1080 |
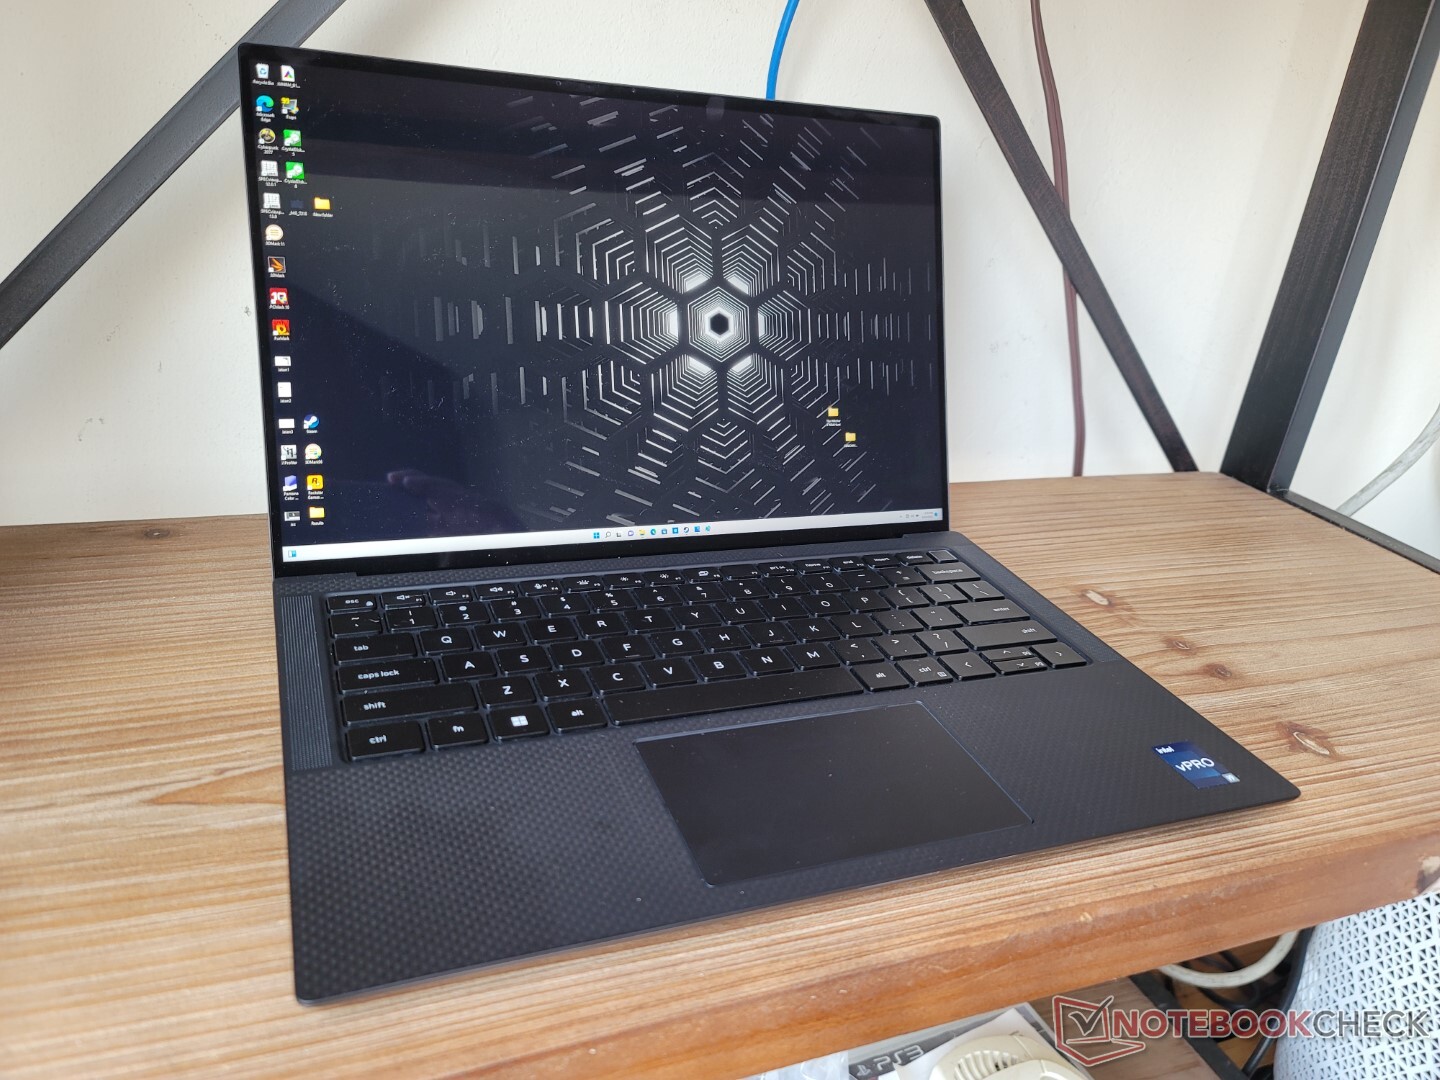
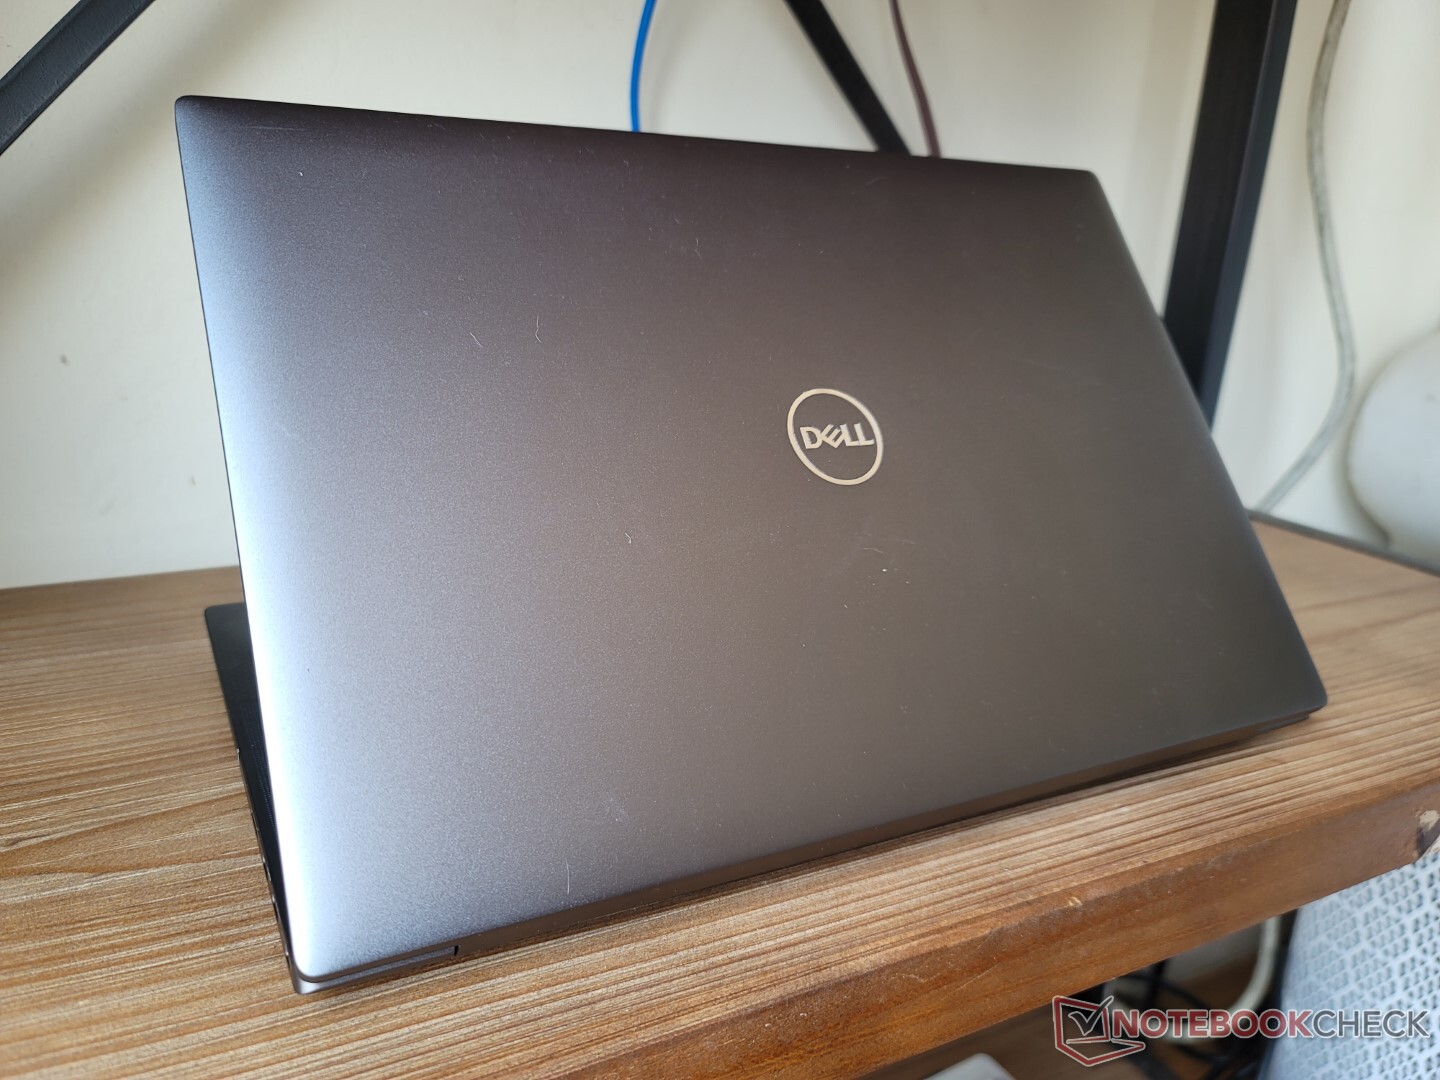
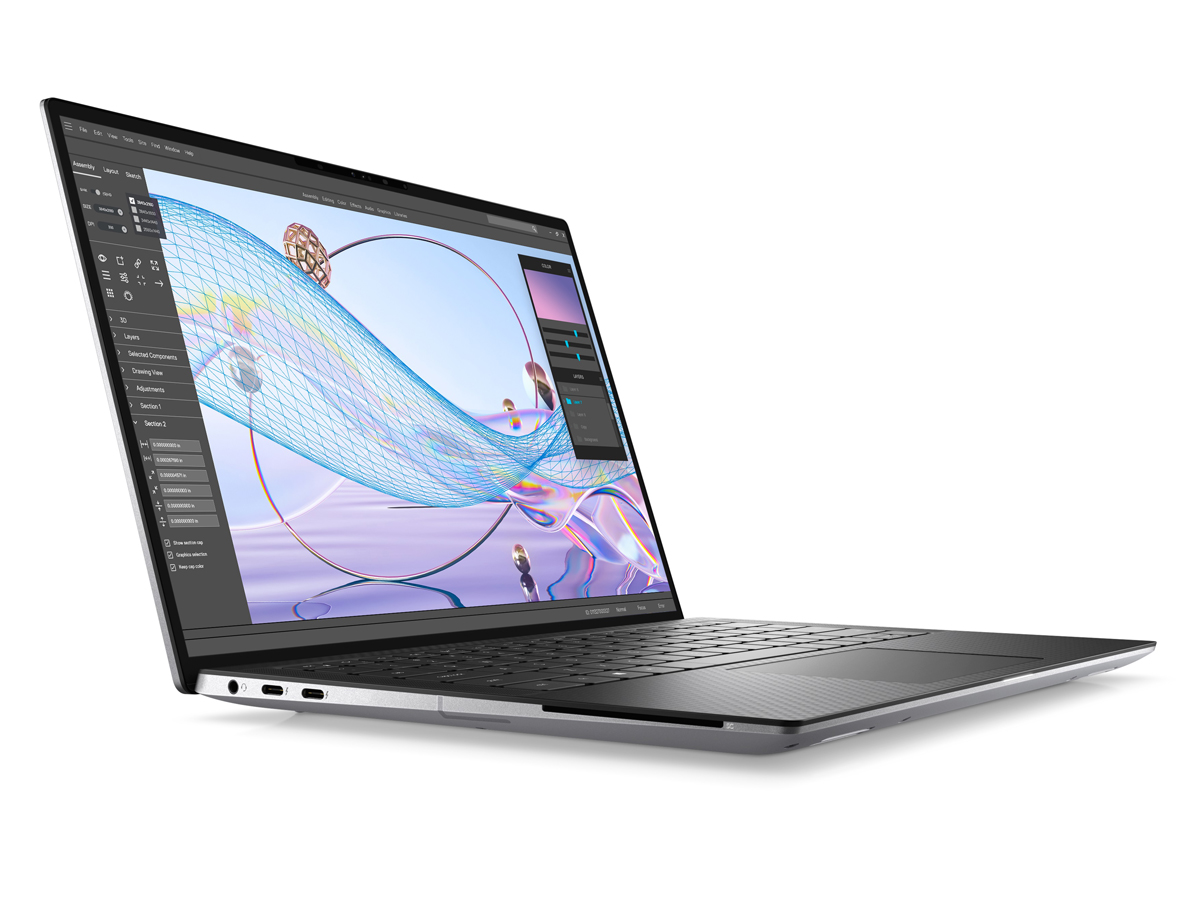
Affaire - XPS Look And Feel
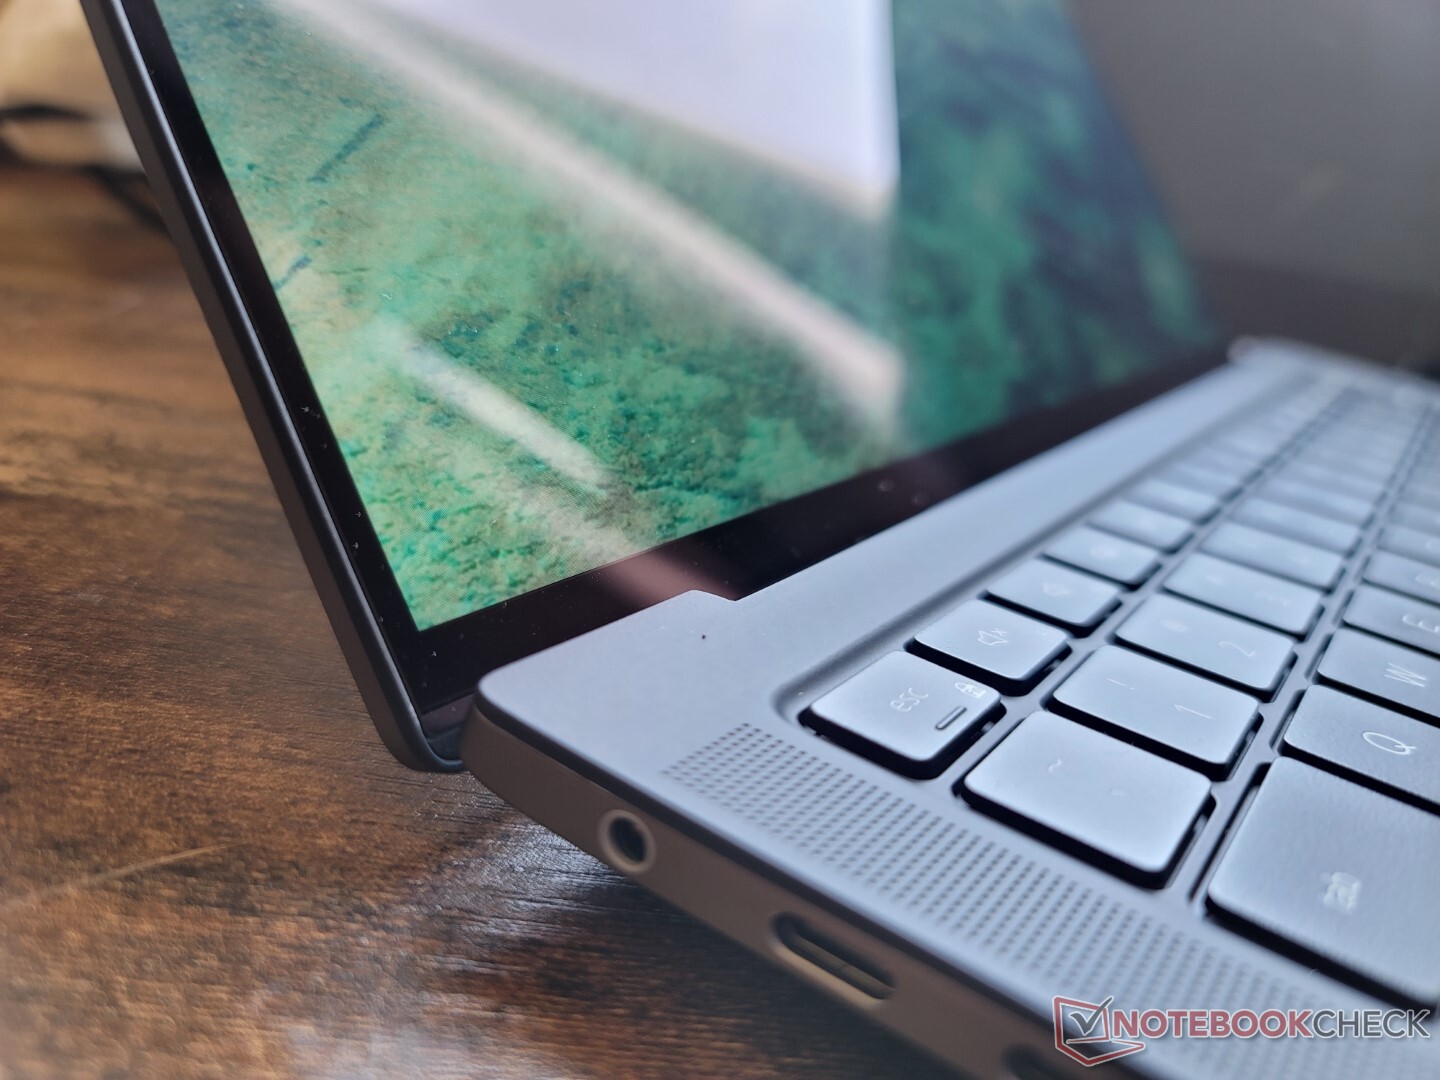
Il n'existe pas de XPS 14 à l'heure où nous écrivons ces lignes, mais le Precision 5470 en est essentiellement le précurseur. Il se situe confortablement entre le XPS 13 de 13 pouces et le XPS 15 de 15 pouces XPS 15 tout en utilisant la même coque grise en alliage de magnésium et le même plateau en fibre de carbone qui sont devenus la norme sur les modèles XPS.
La qualité du châssis est excellente, avec seulement des craquements ou des déformations mineures lorsqu'on essaie de tordre ou de plier ses surfaces. Il semble certainement plus solide et plus professionnel que le nouveau XPS 13 9320 design. Néanmoins, les charnières auraient pu être plus rigides pour donner une meilleure impression de longévité.
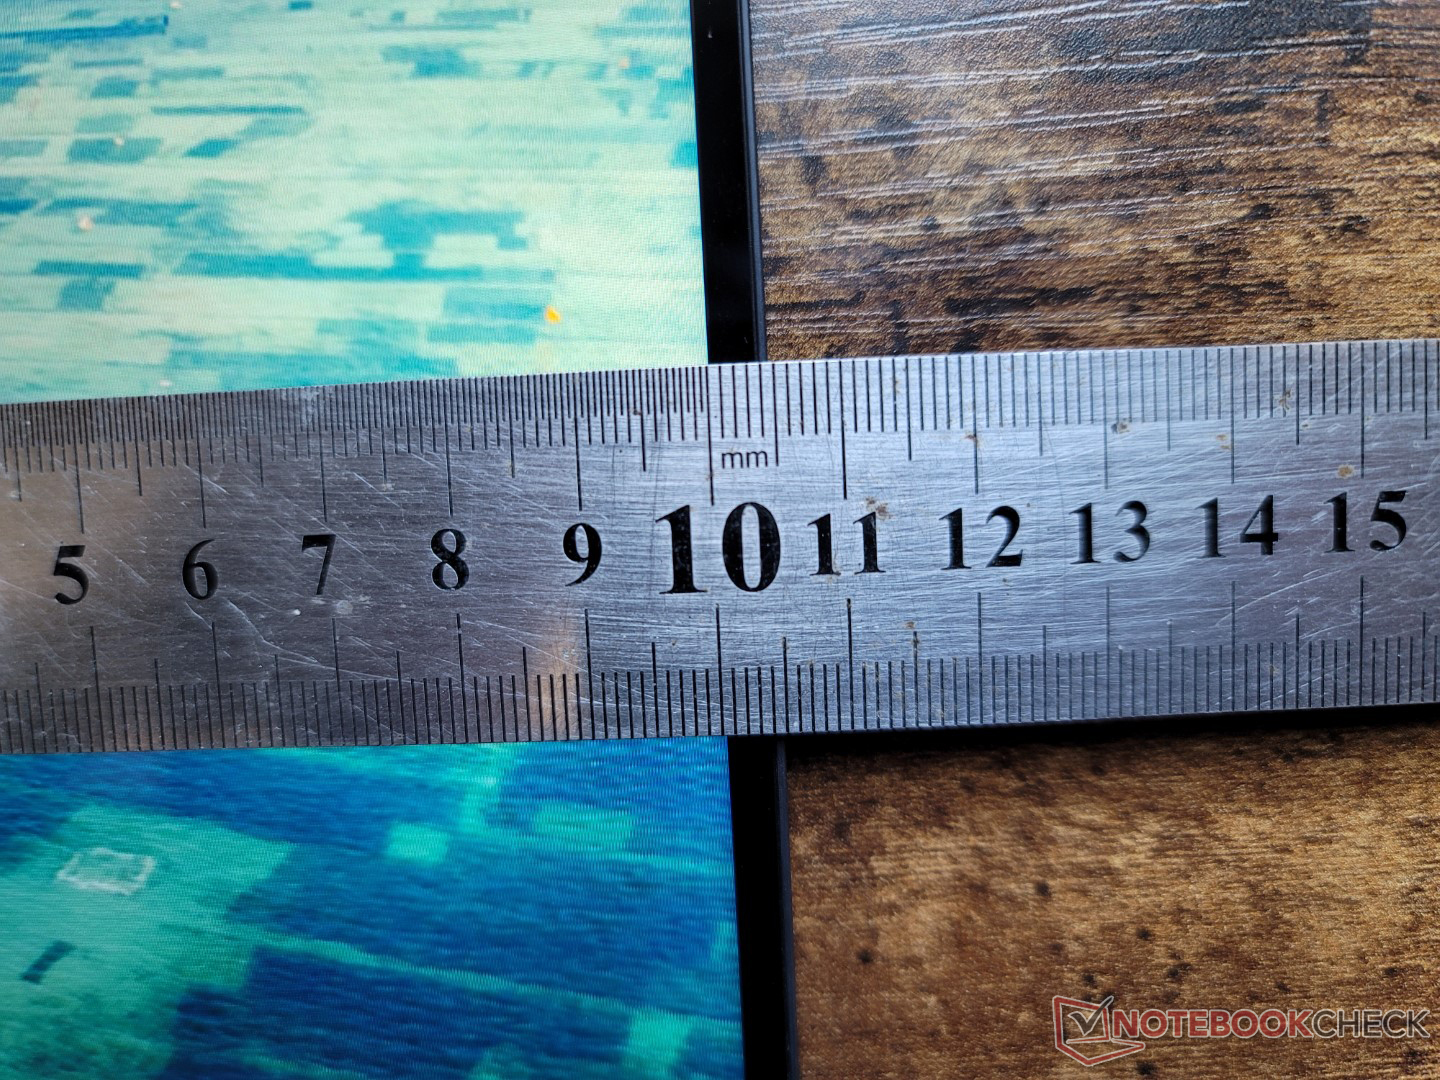
Le 14 pouces Precision 5470 est plus grand et plus lourd que le 13 pouces XPS 13 9300 par des marges notables. Il est même un peu plus épais que le XPS 15 tout en étant plus proche en poids du XPS 15 que du XPS 13. Il reste néanmoins très compact pour sa catégorie, notamment en termes d'encombrement par rapport au HP Firefly 14 G8 ou au ThinkPad P14.
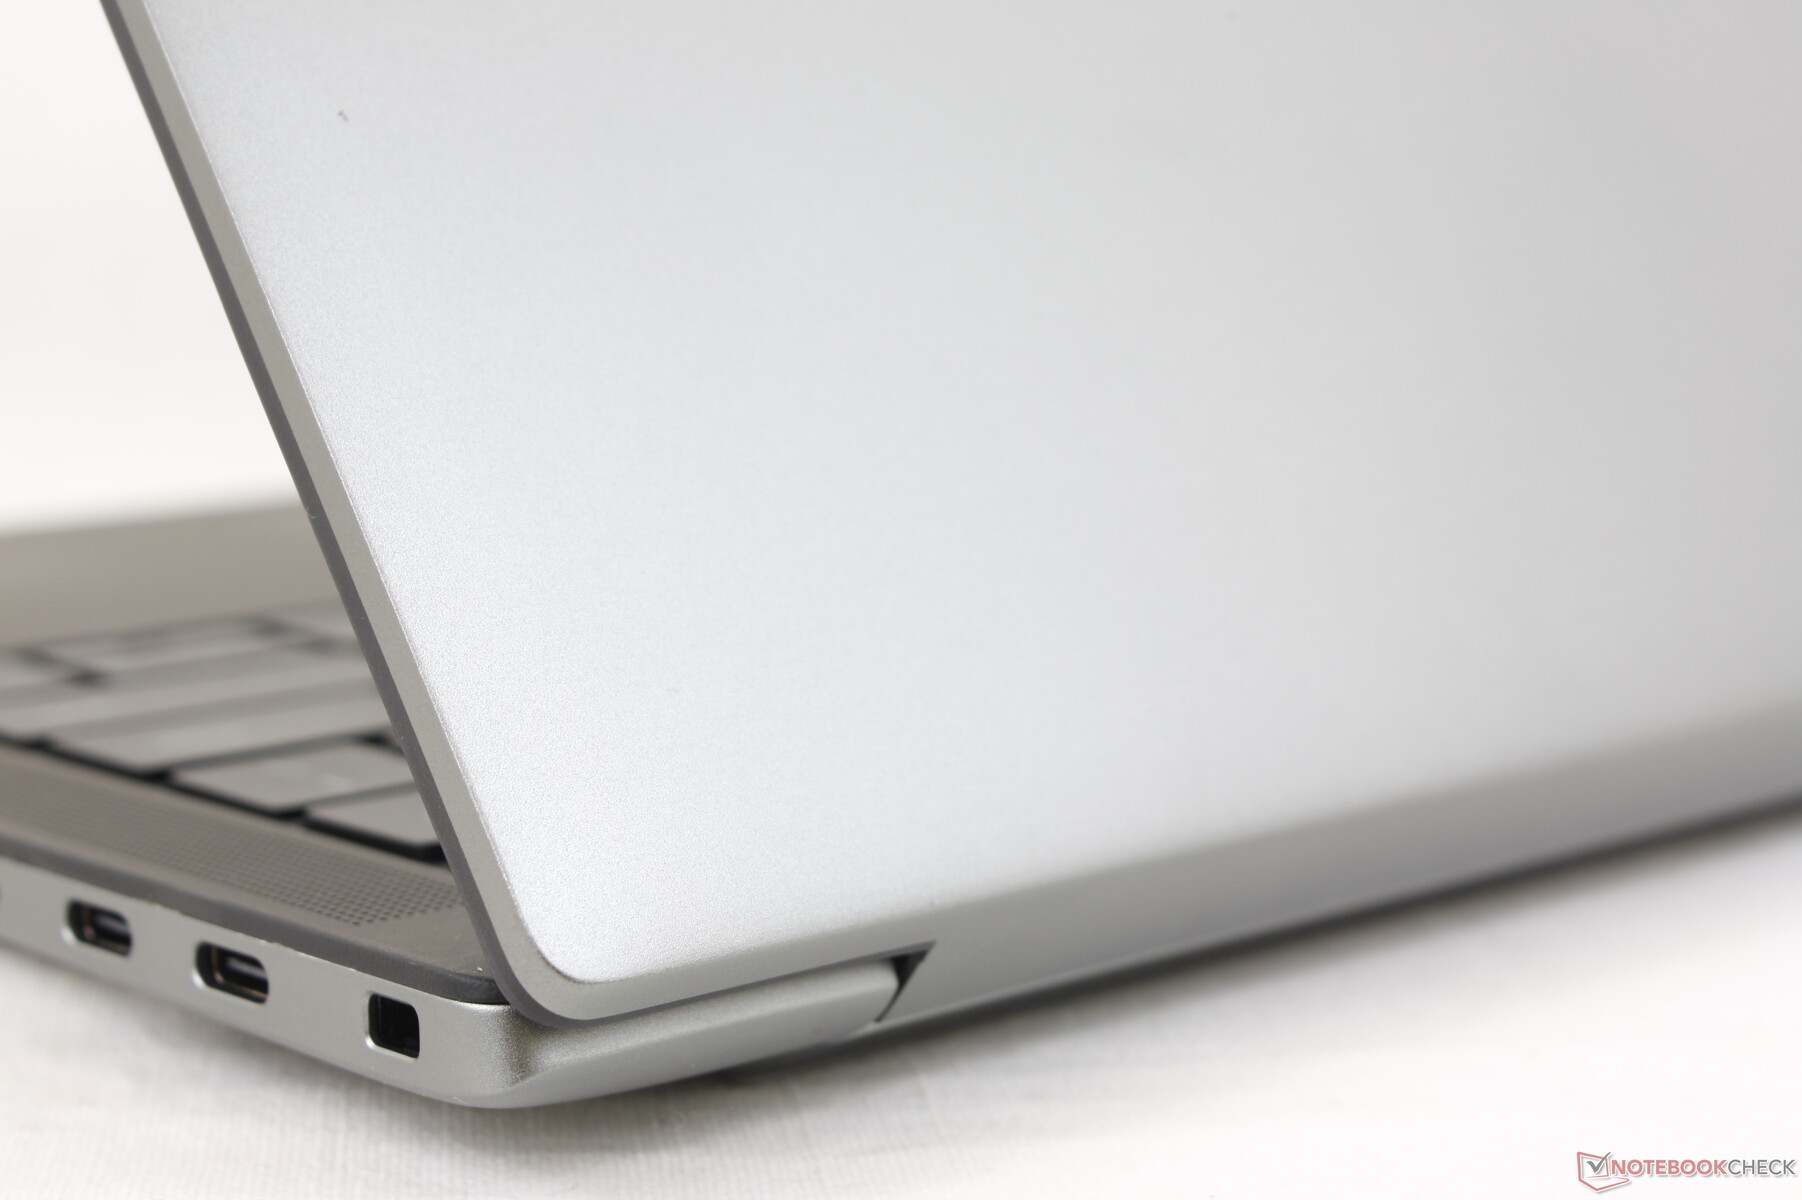
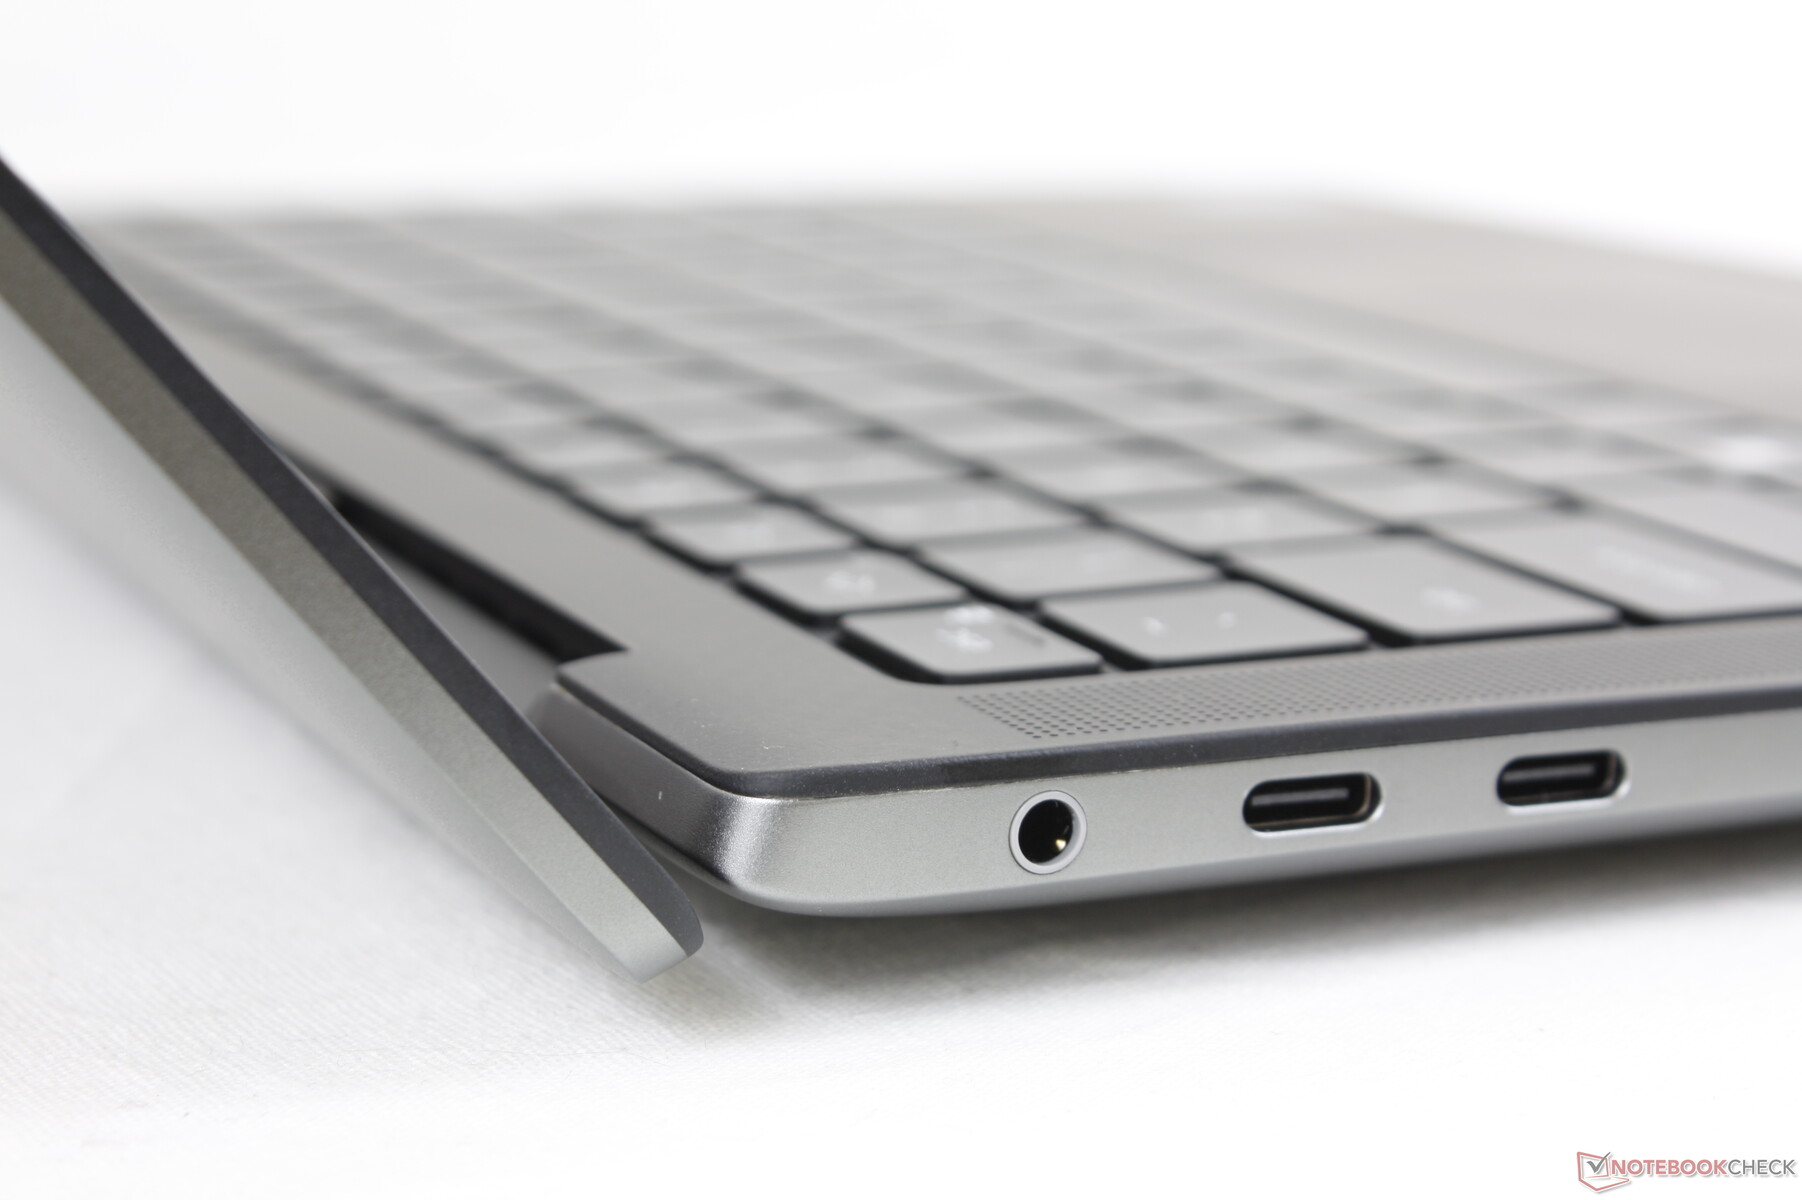
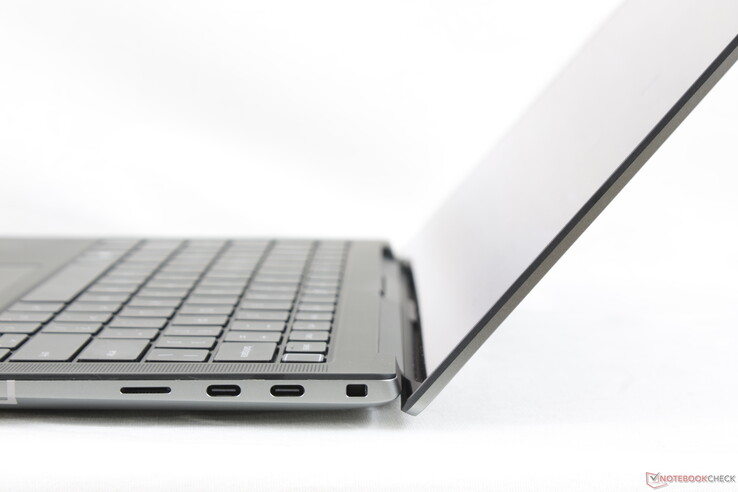
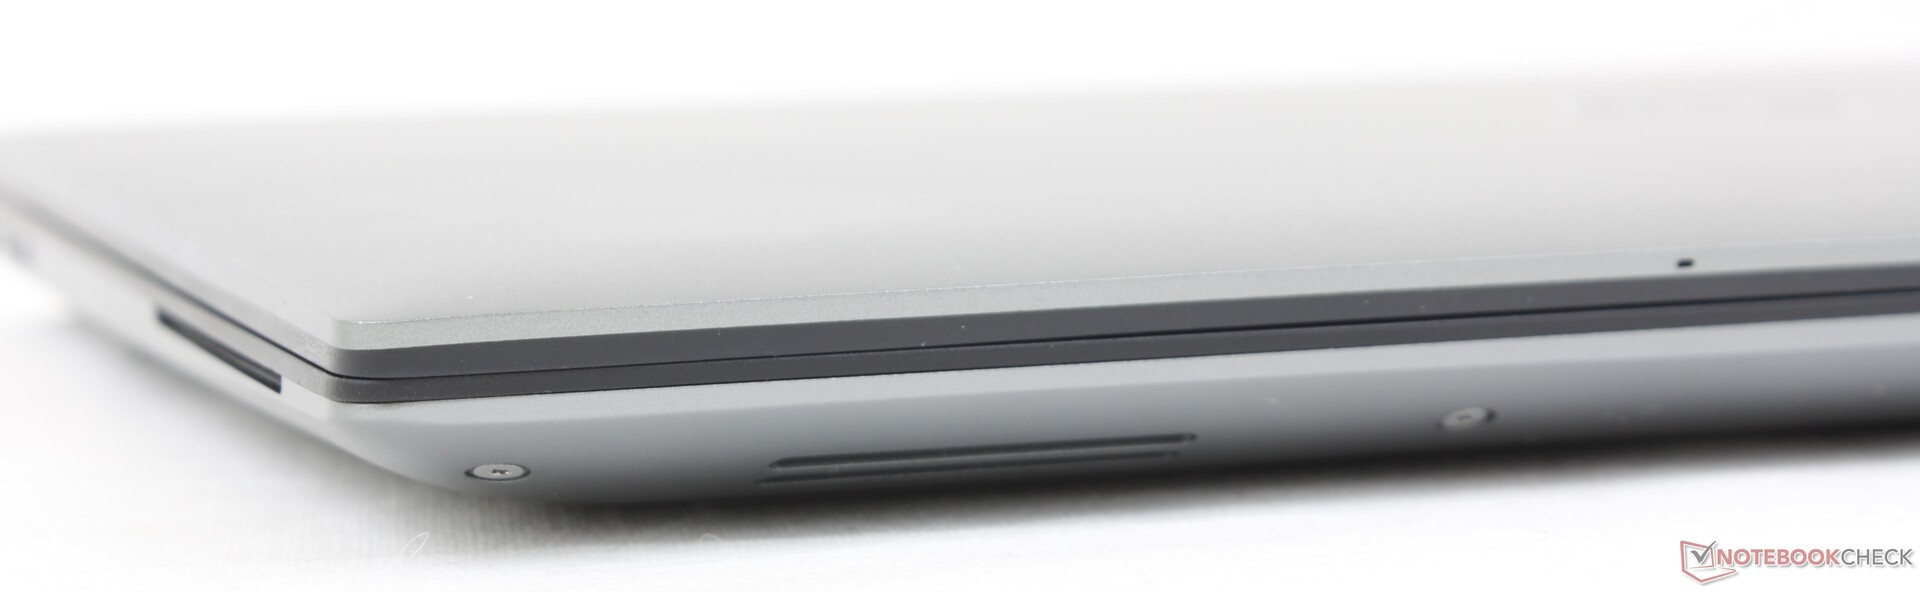
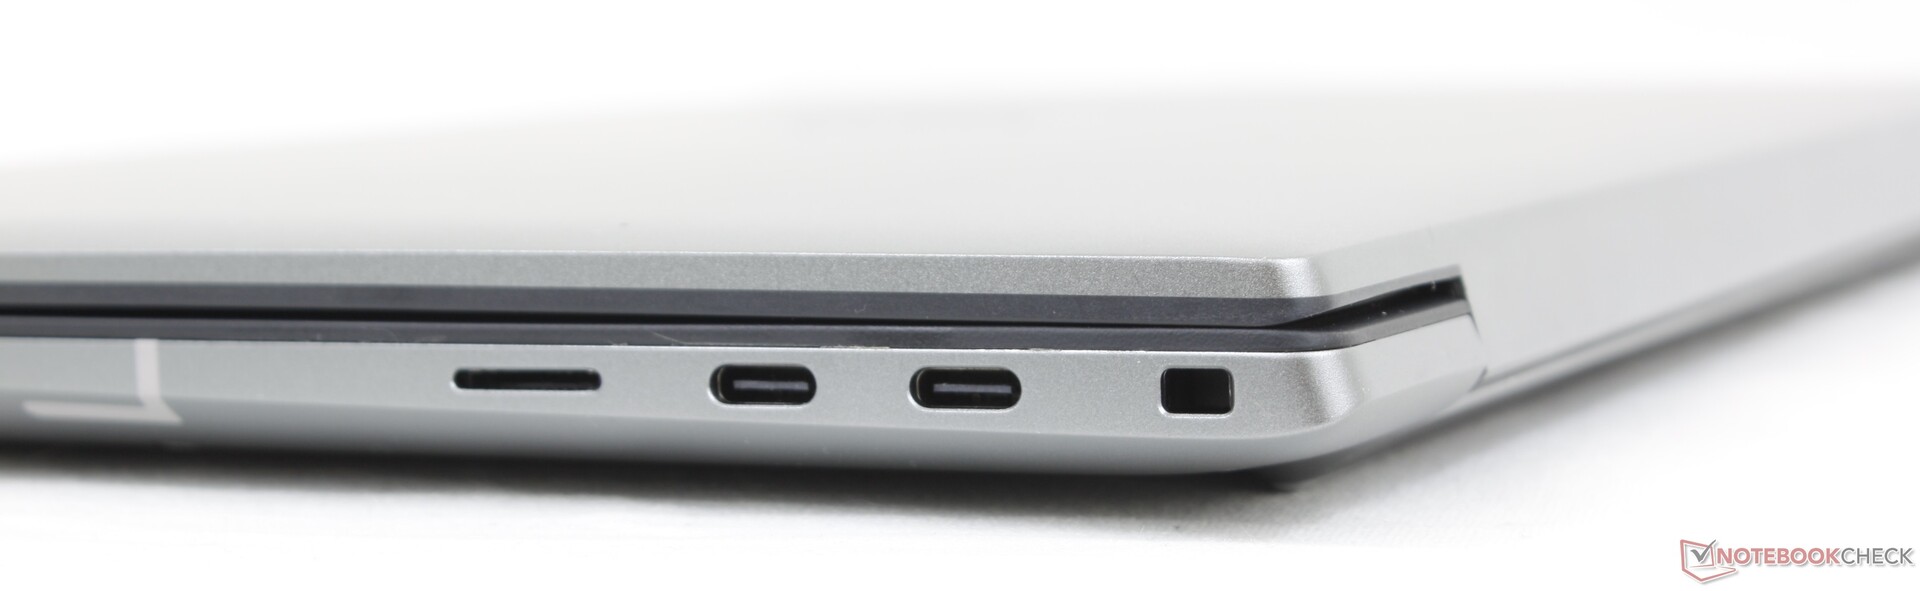
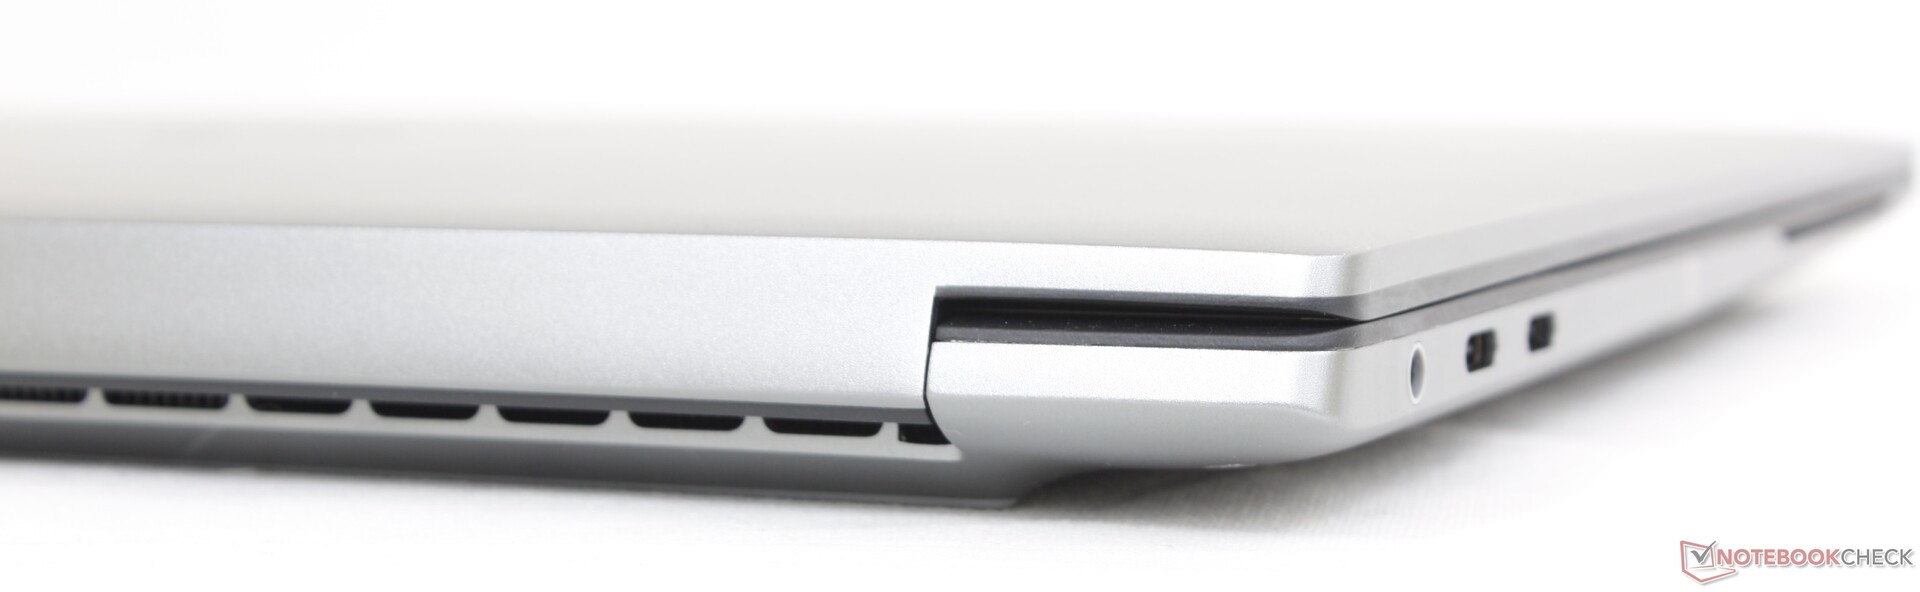
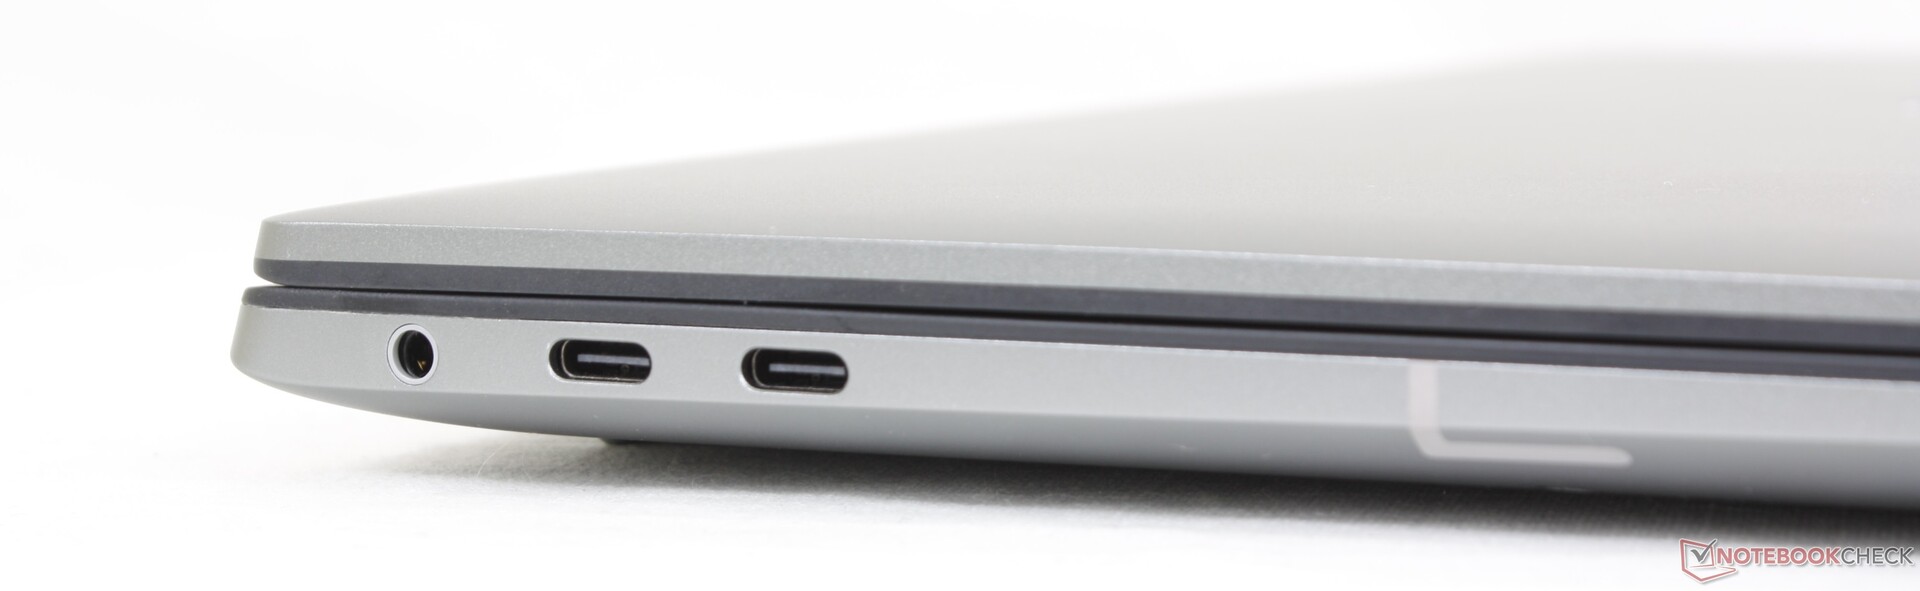
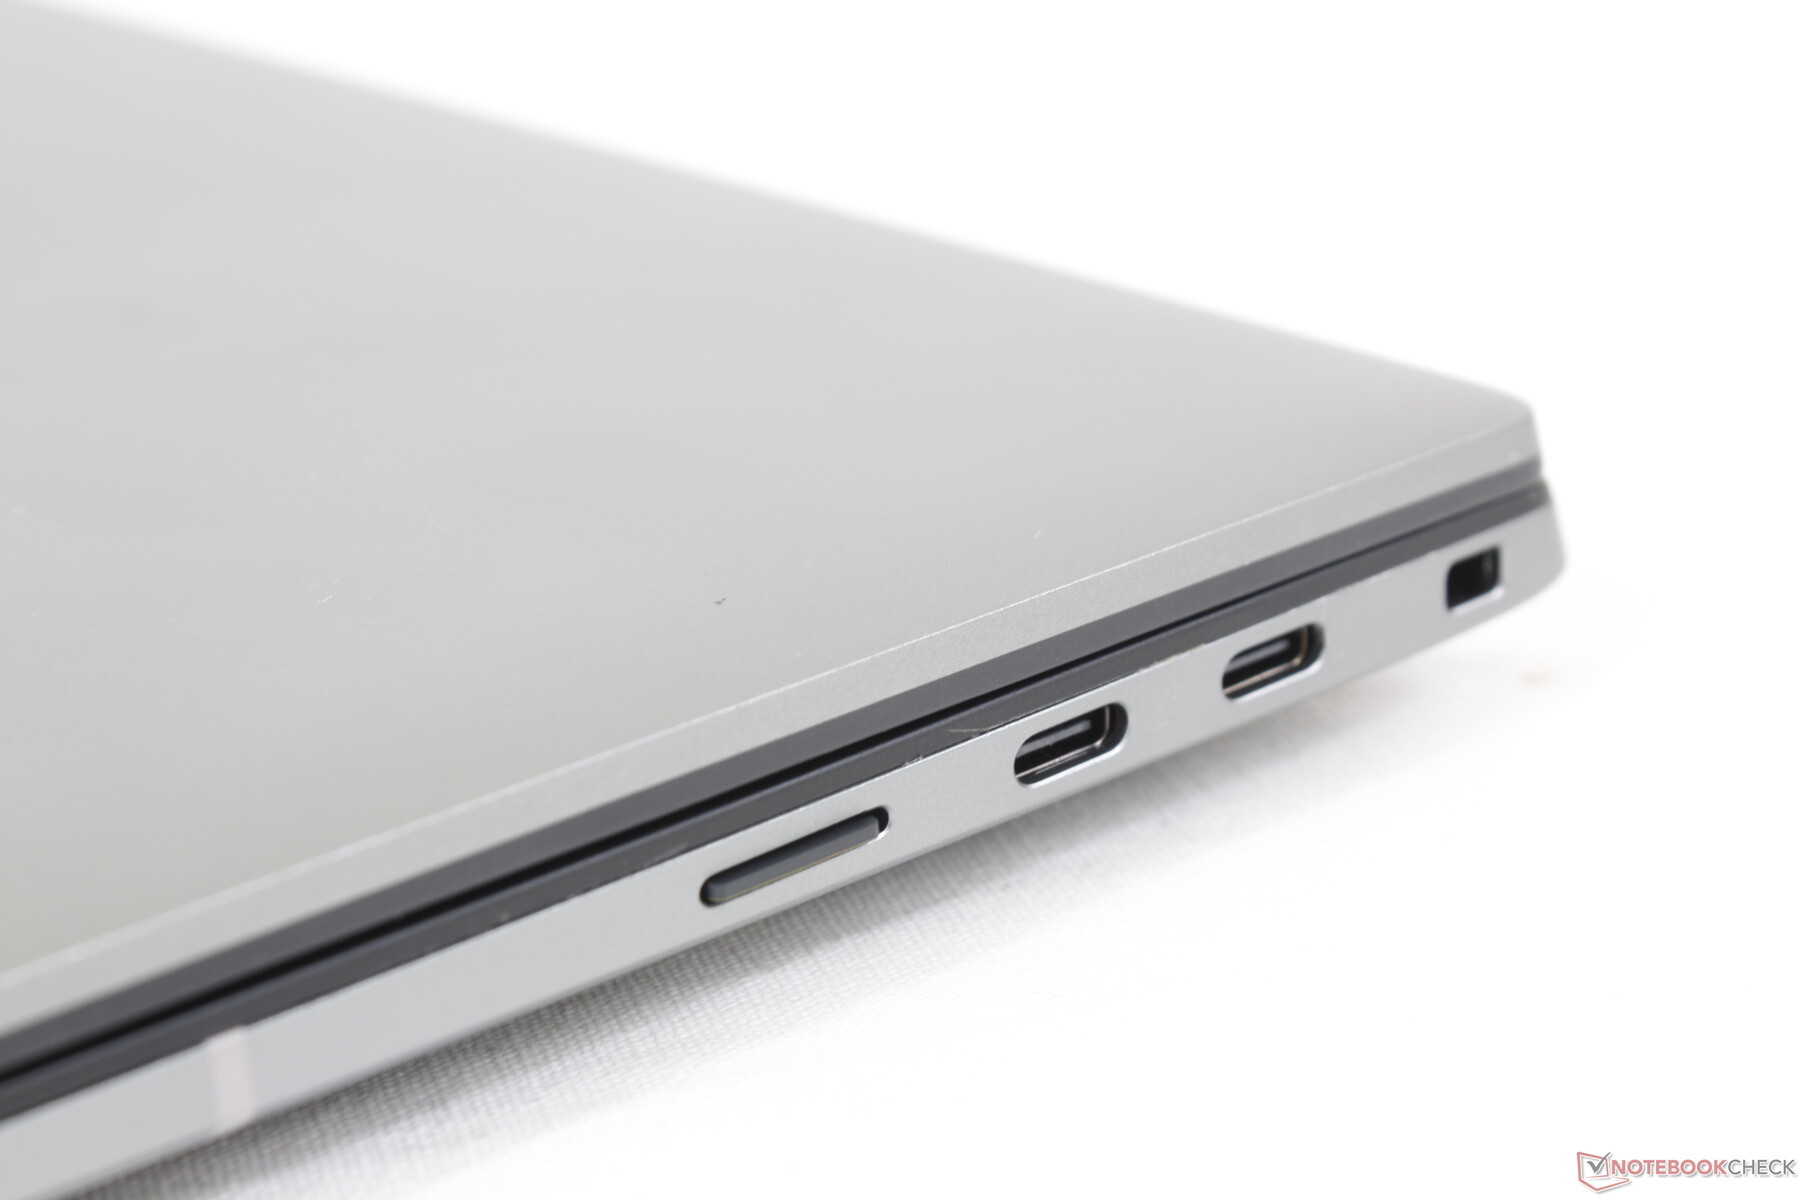
Connectivité - USB-C uniquement
Les options de port sont limitées à l'USB-C uniquement alors que la plupart des stations de travail disposent d'une variété beaucoup plus large. Precision les propriétaires de 5470 doivent donc compter sur des adaptateurs ou des stations d'accueil pour connecter la plupart des appareils.
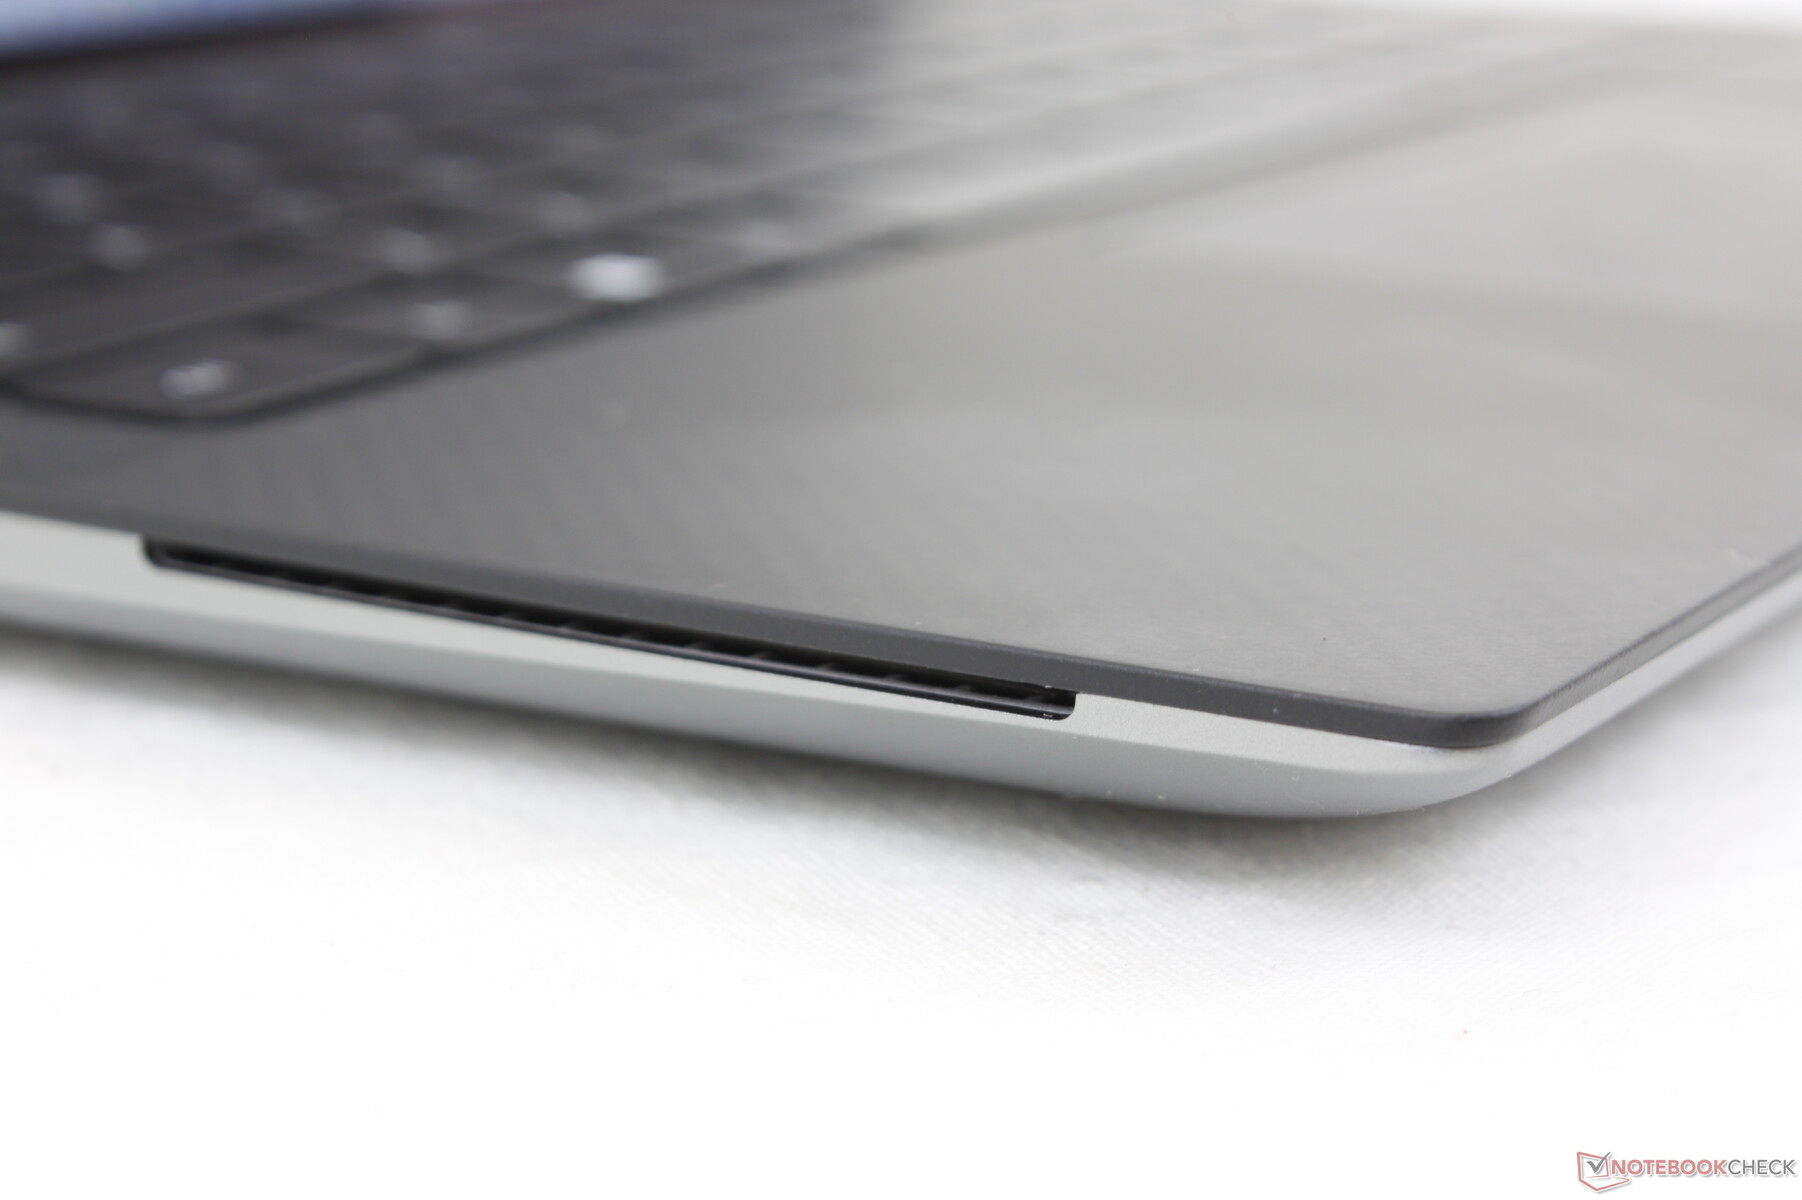
Lecteur de carte SD
Les taux de transfert du lecteur de cartes intégré sont très rapides, avec près de 230 Mo/s pour notre carte de test UHS-II. Cependant, en fonction de la taille des fichiers, les taux de transfert réels peuvent être inférieurs. Le transfert de 1 Go de photos (~4 Mo chacune) est plus lent et prend environ 13 secondes.
| SD Card Reader | |
| average JPG Copy Test (av. of 3 runs) | |
| Dell Precision 5000 5560 (AV Pro V60) | |
| Lenovo ThinkPad P15v G2 21A9000XGE | |
| Dell Precision 5000 5470 (AV Pro V60) | |
| Lenovo ThinkPad P14s G2 AMD (AV PRO V60) | |
| maximum AS SSD Seq Read Test (1GB) | |
| Lenovo ThinkPad P15v G2 21A9000XGE | |
| Dell Precision 5000 5470 (AV Pro V60) | |
| Dell Precision 5000 5560 (AV Pro V60) | |
| Lenovo ThinkPad P14s G2 AMD (AV PRO V60) | |
Communication
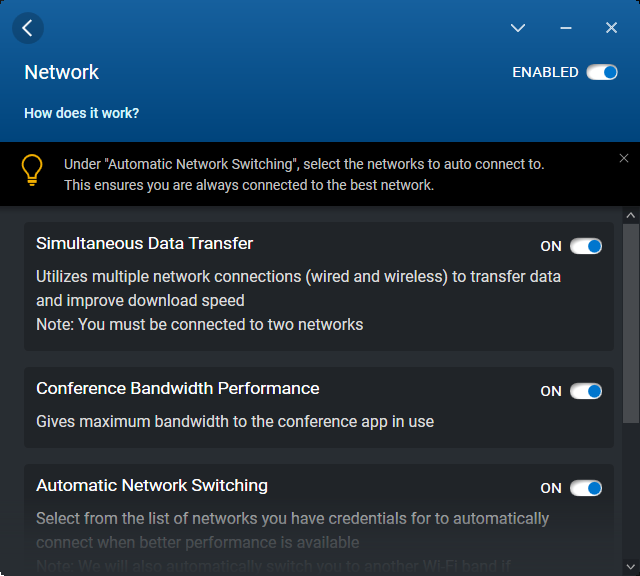
Un Intel AX211 est fourni en standard pour la connectivité Wi-Fi 6E et Bluetooth 5.2. Bien que nous n'ayons pas rencontré de problèmes notables, les taux de transmission sont plus lents et plus variables que prévu.
| Networking | |
| iperf3 transmit AX12 | |
| Lenovo ThinkPad P15v G2 21A9000XGE | |
| HP ZBook Firefly 14 G8 2C9Q2EA | |
| HP ZBook Firefly 14 G7 | |
| Dell Precision 5000 5560 | |
| Lenovo ThinkPad P14s G2 AMD | |
| iperf3 receive AX12 | |
| HP ZBook Firefly 14 G8 2C9Q2EA | |
| Lenovo ThinkPad P15v G2 21A9000XGE | |
| Dell Precision 5000 5560 | |
| HP ZBook Firefly 14 G7 | |
| Lenovo ThinkPad P14s G2 AMD | |
| iperf3 receive AXE11000 6GHz | |
| Dell Precision 5000 5470 | |
| iperf3 transmit AXE11000 6GHz | |
| Dell Precision 5000 5470 | |
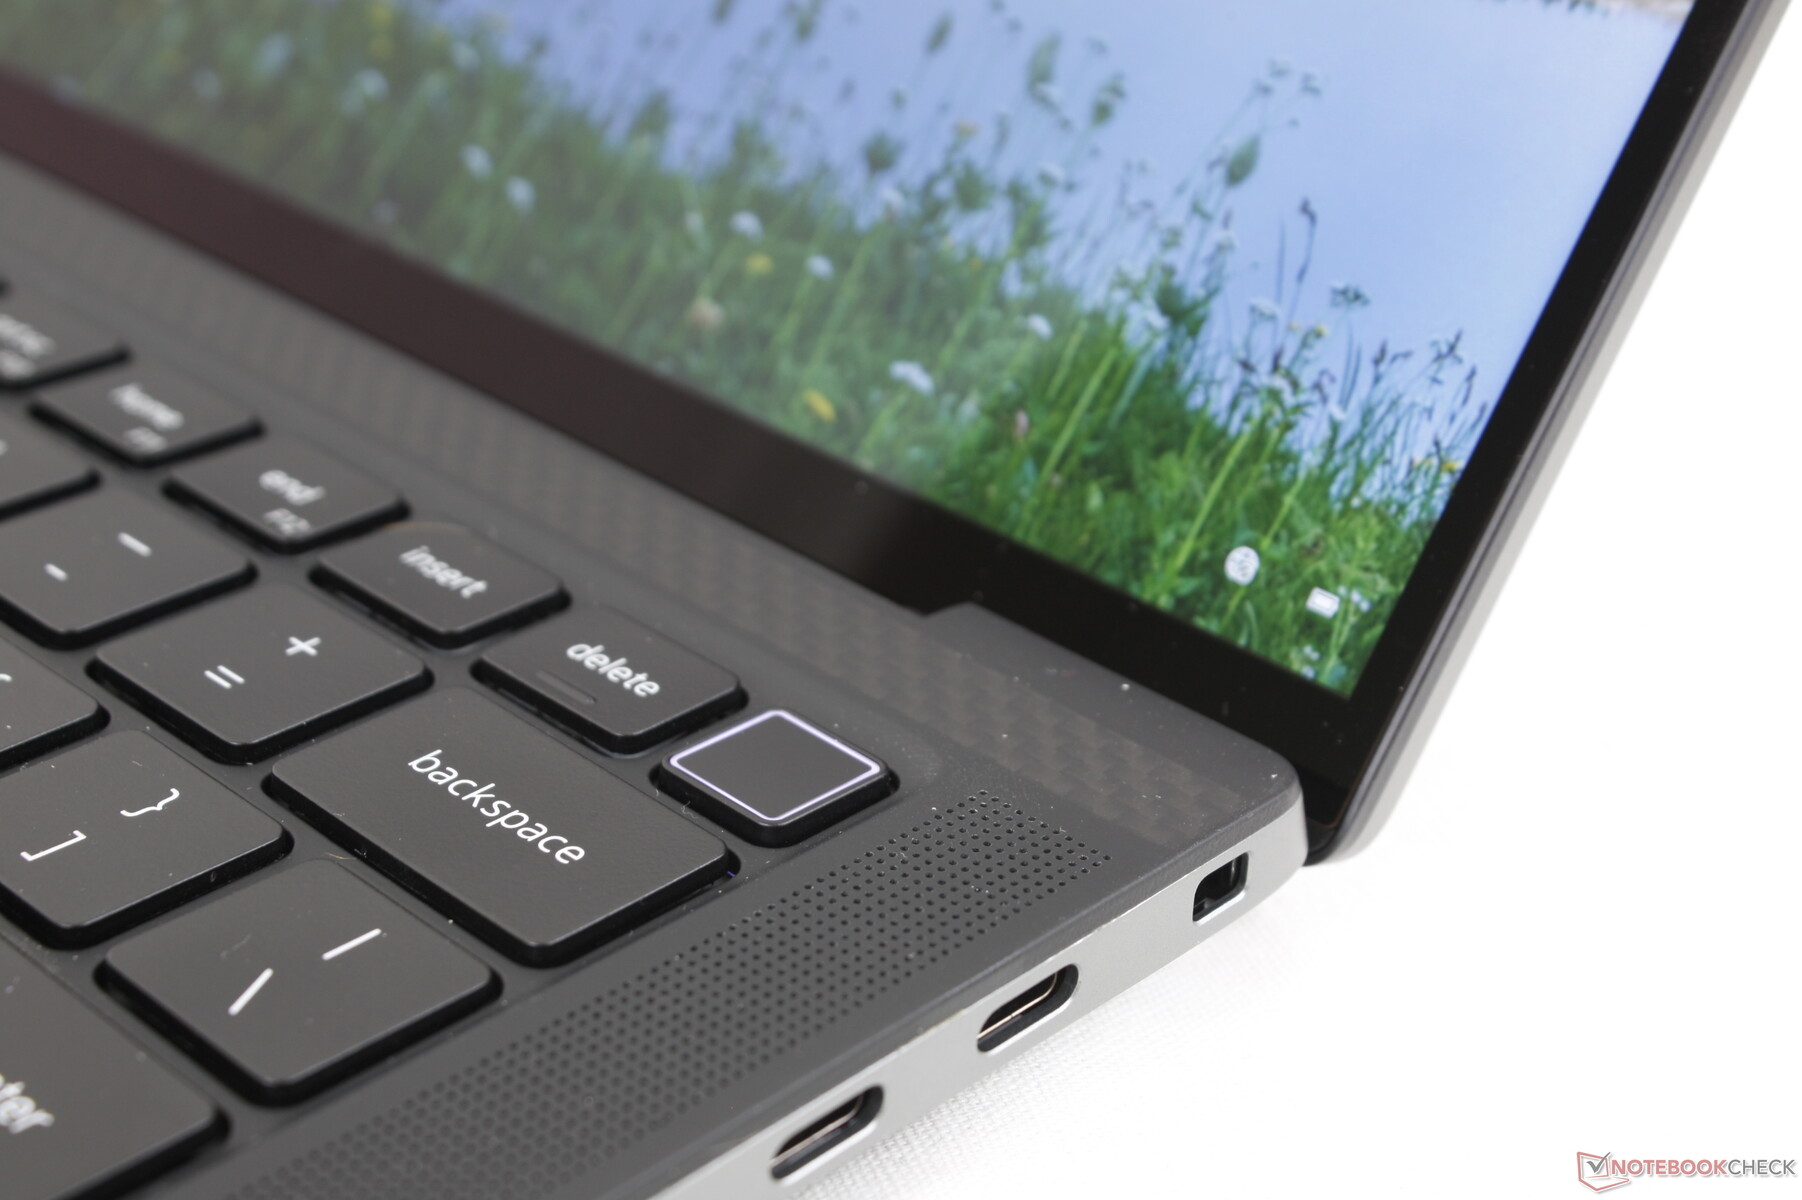
Webcam
La webcam est limitée à 1 MP ou 720p alors que la plupart des autres portables sont déjà passés à 2 MP ou même 5 MP comme c'est le cas de de nombreux ordinateurs portables HP haut de gamme. La qualité d'image est boueuse comme sur la webcam de la série XPS 13
L'infrarouge est présent pour le support du Bonjour, mais il n'y a pas d'obturateur de webcam pour la confidentialité.


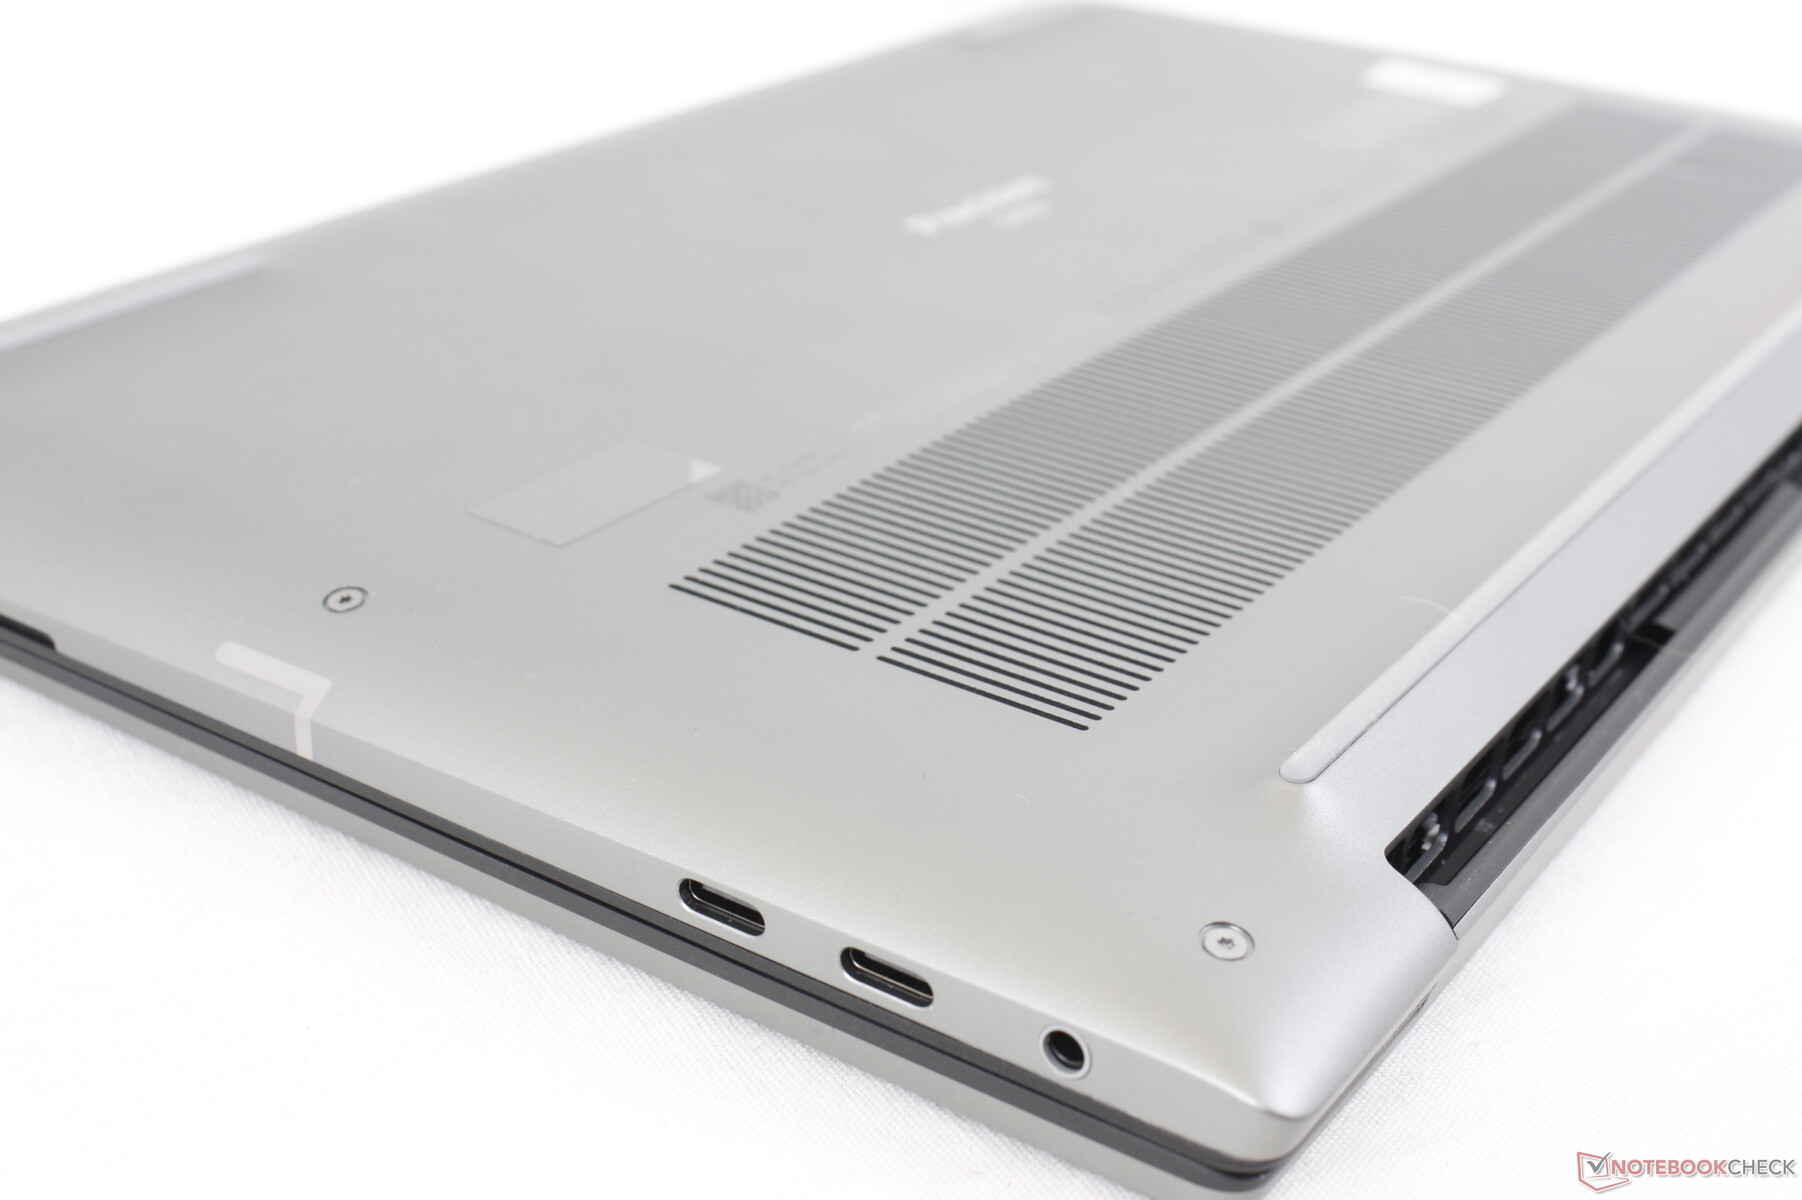
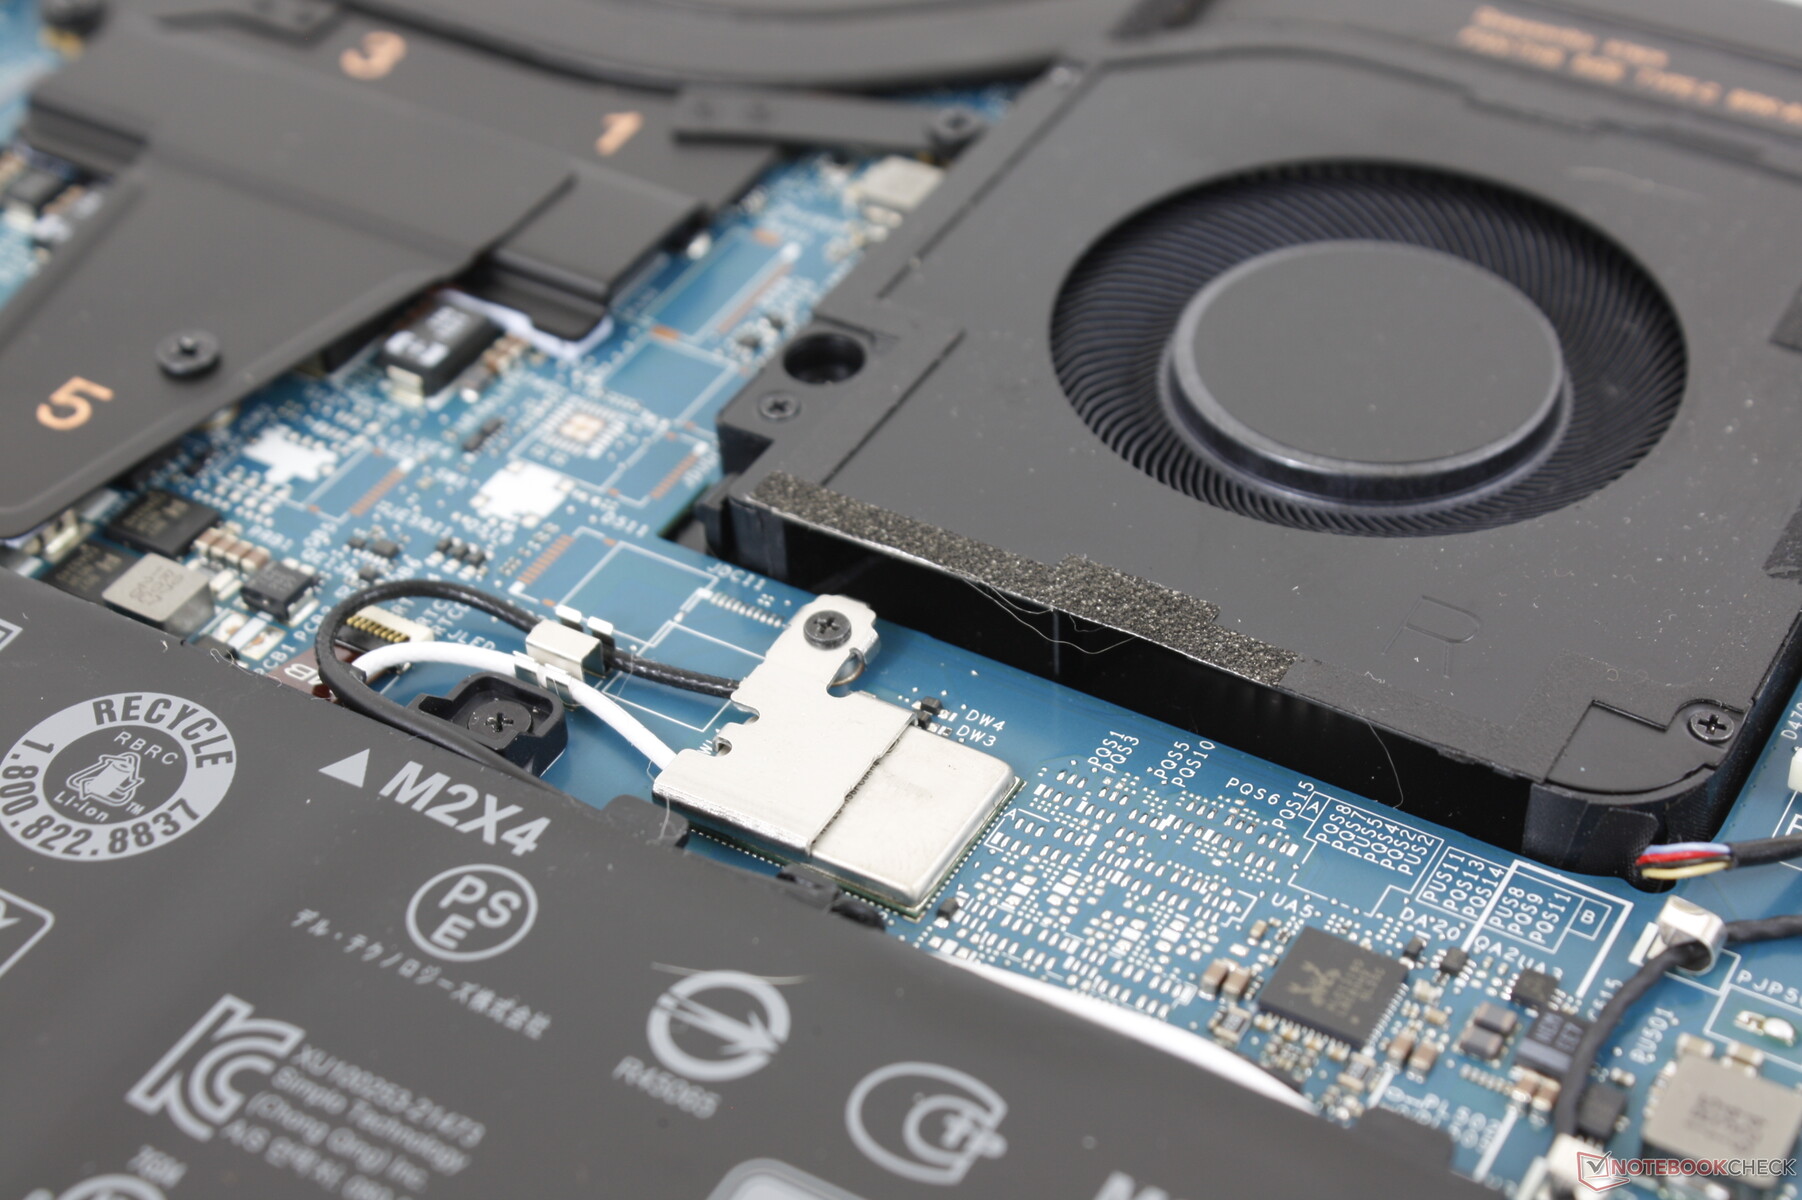
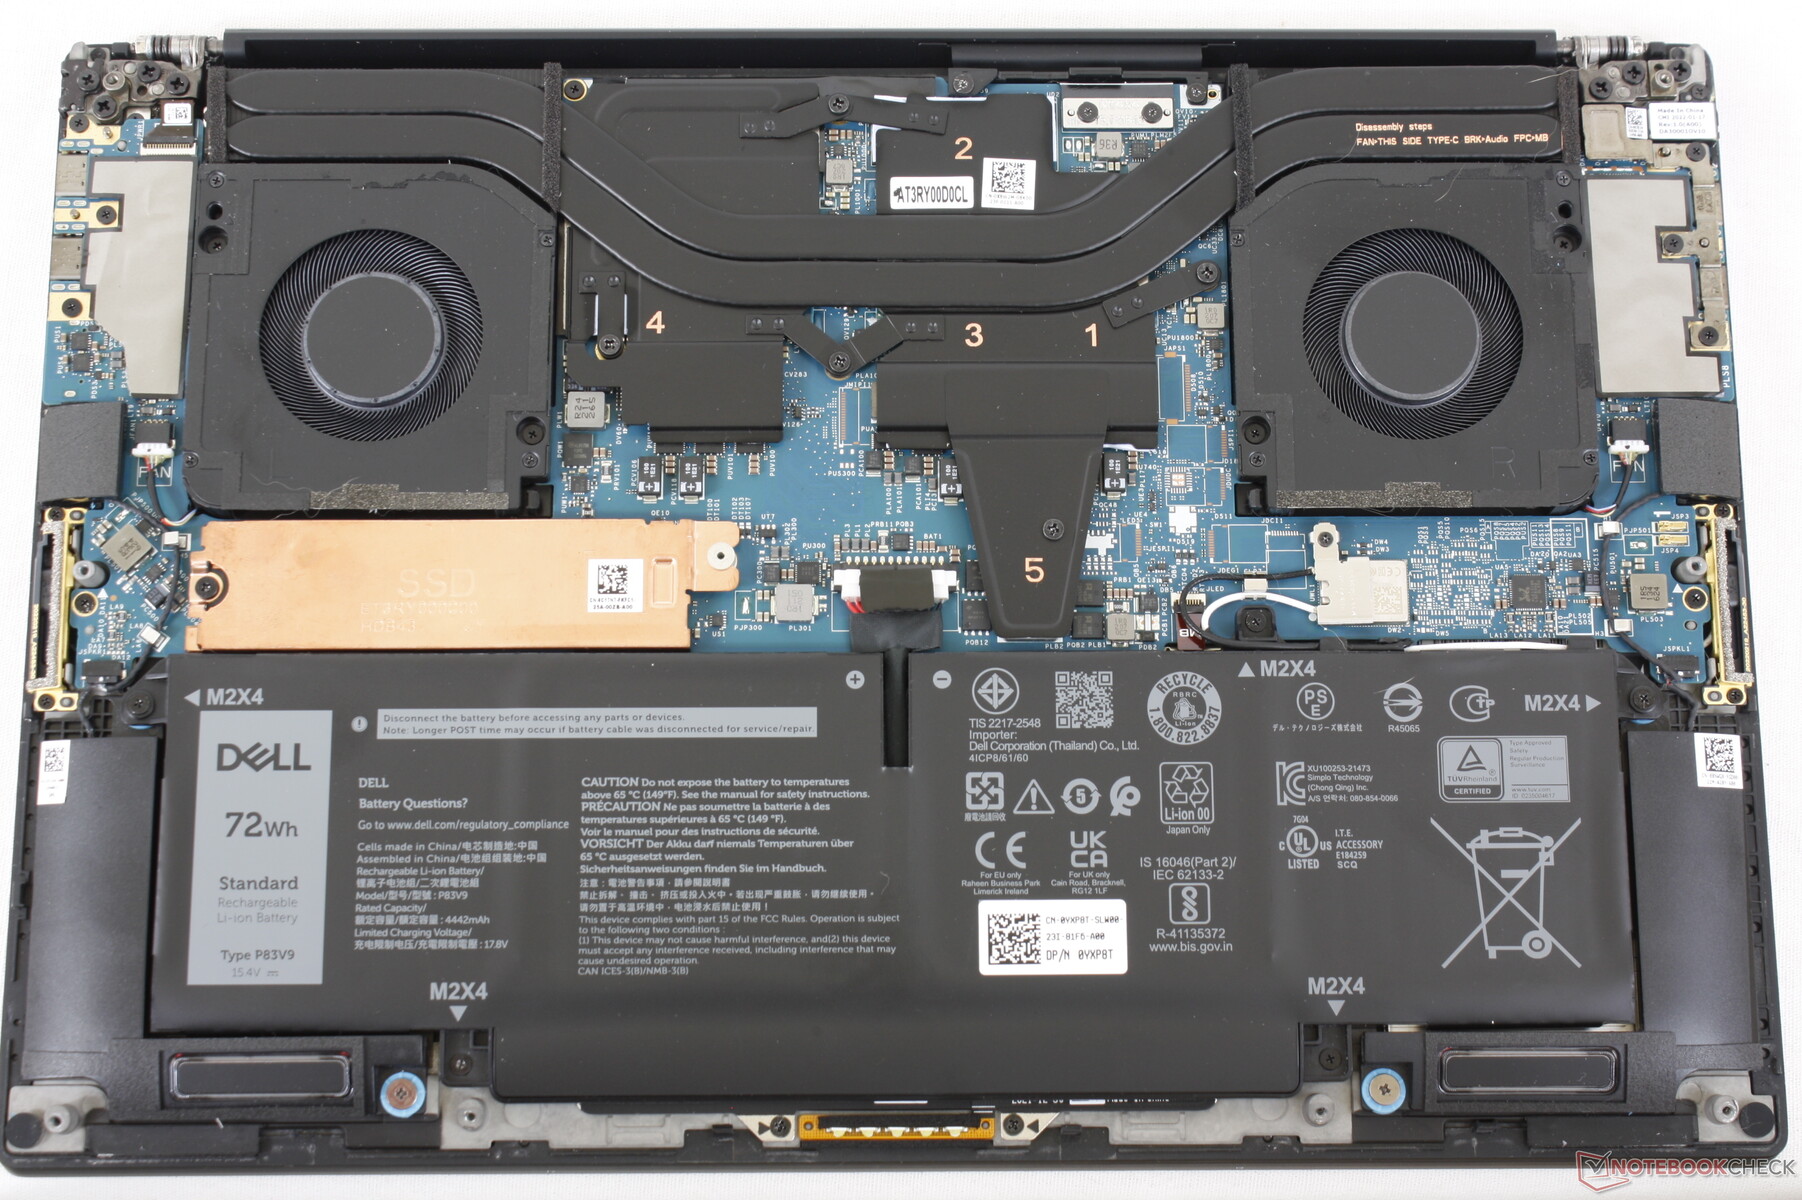
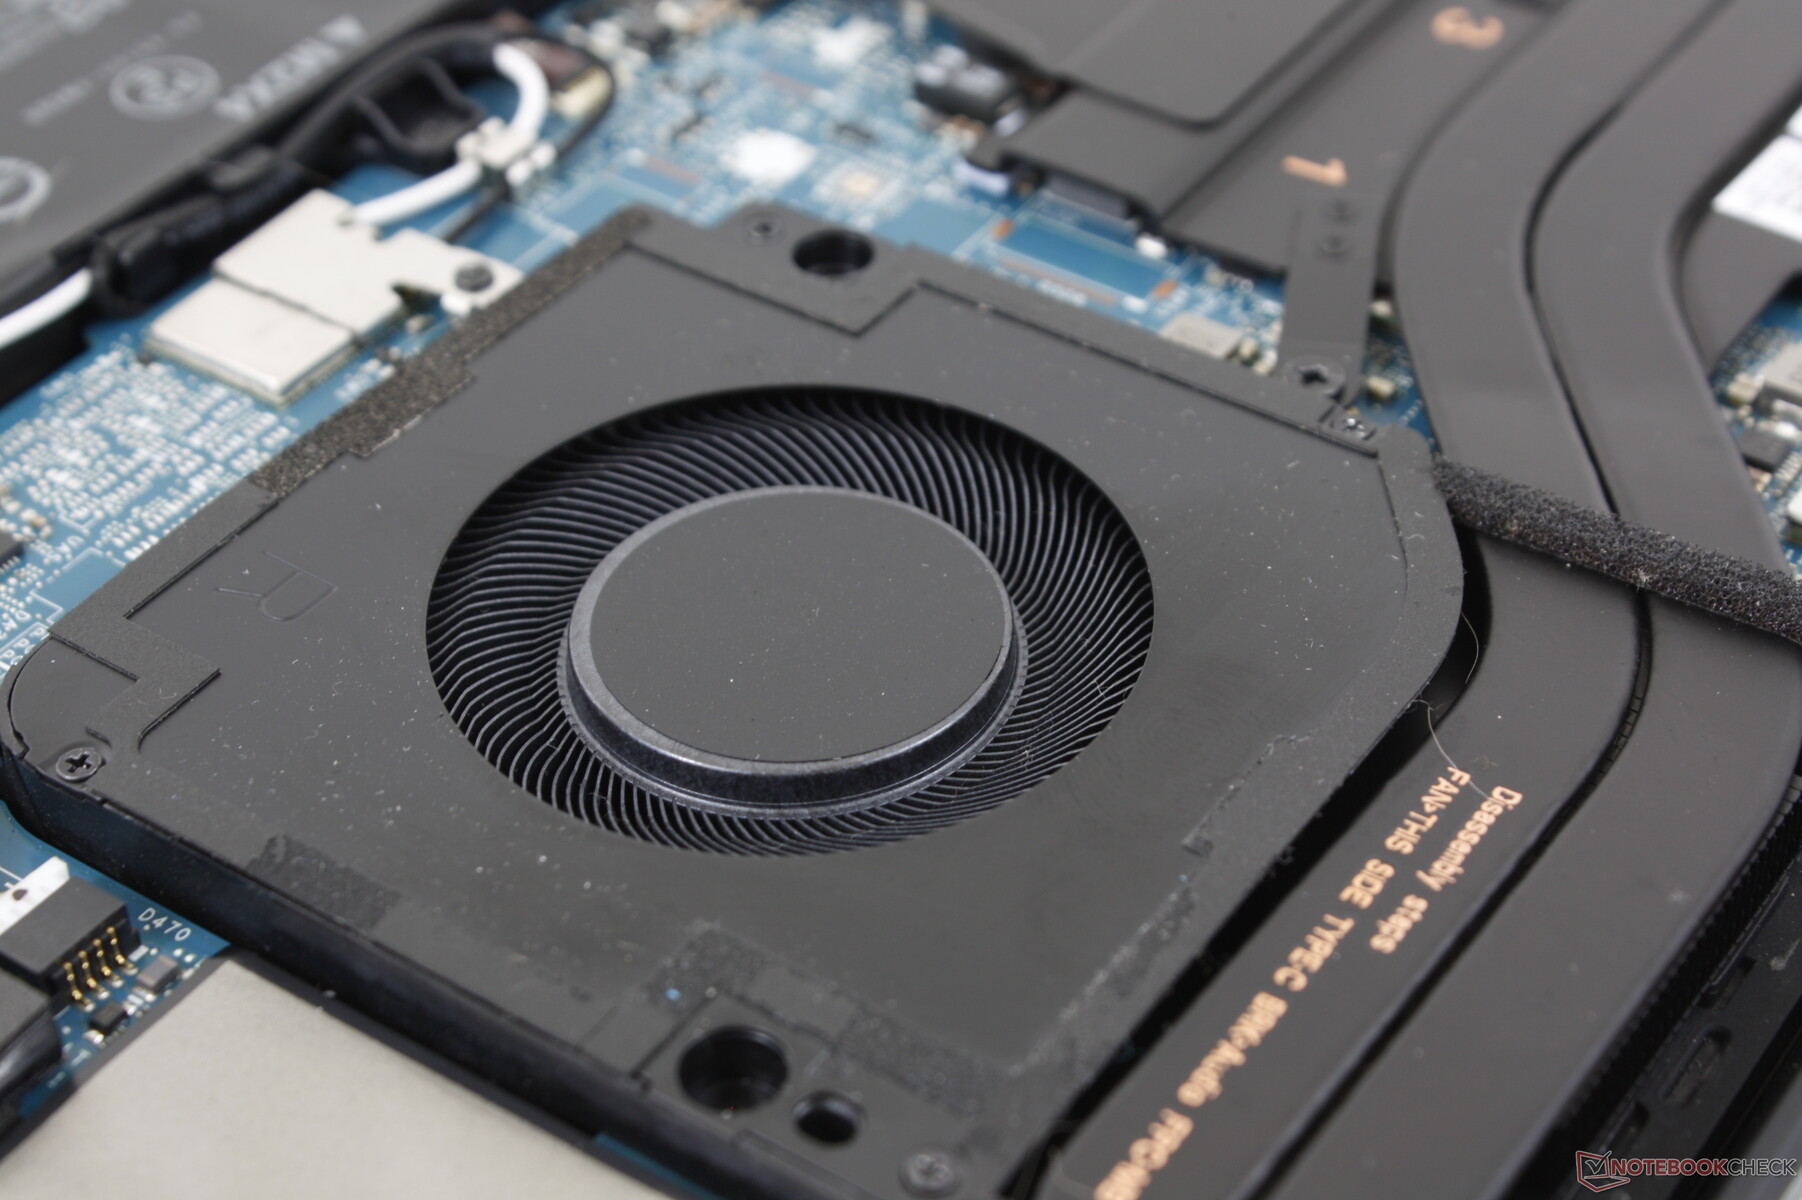
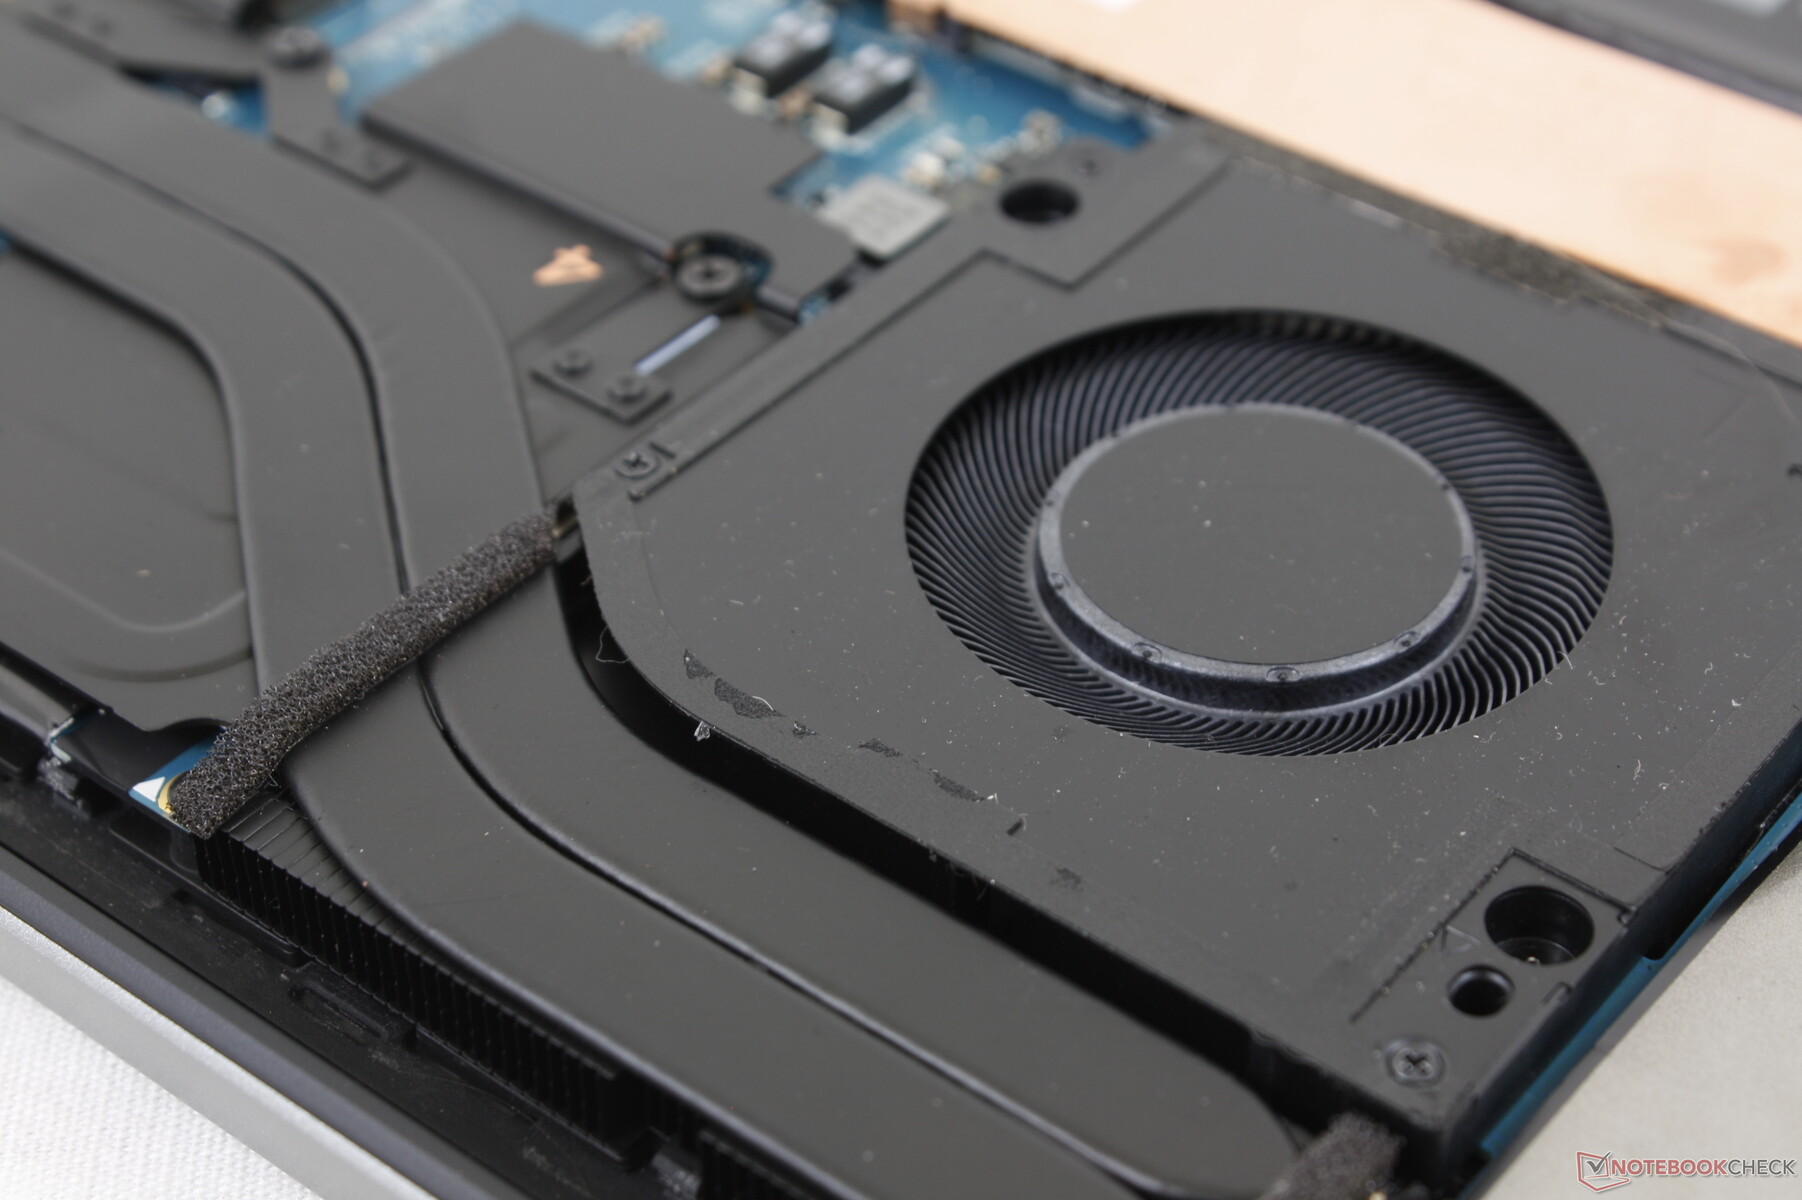
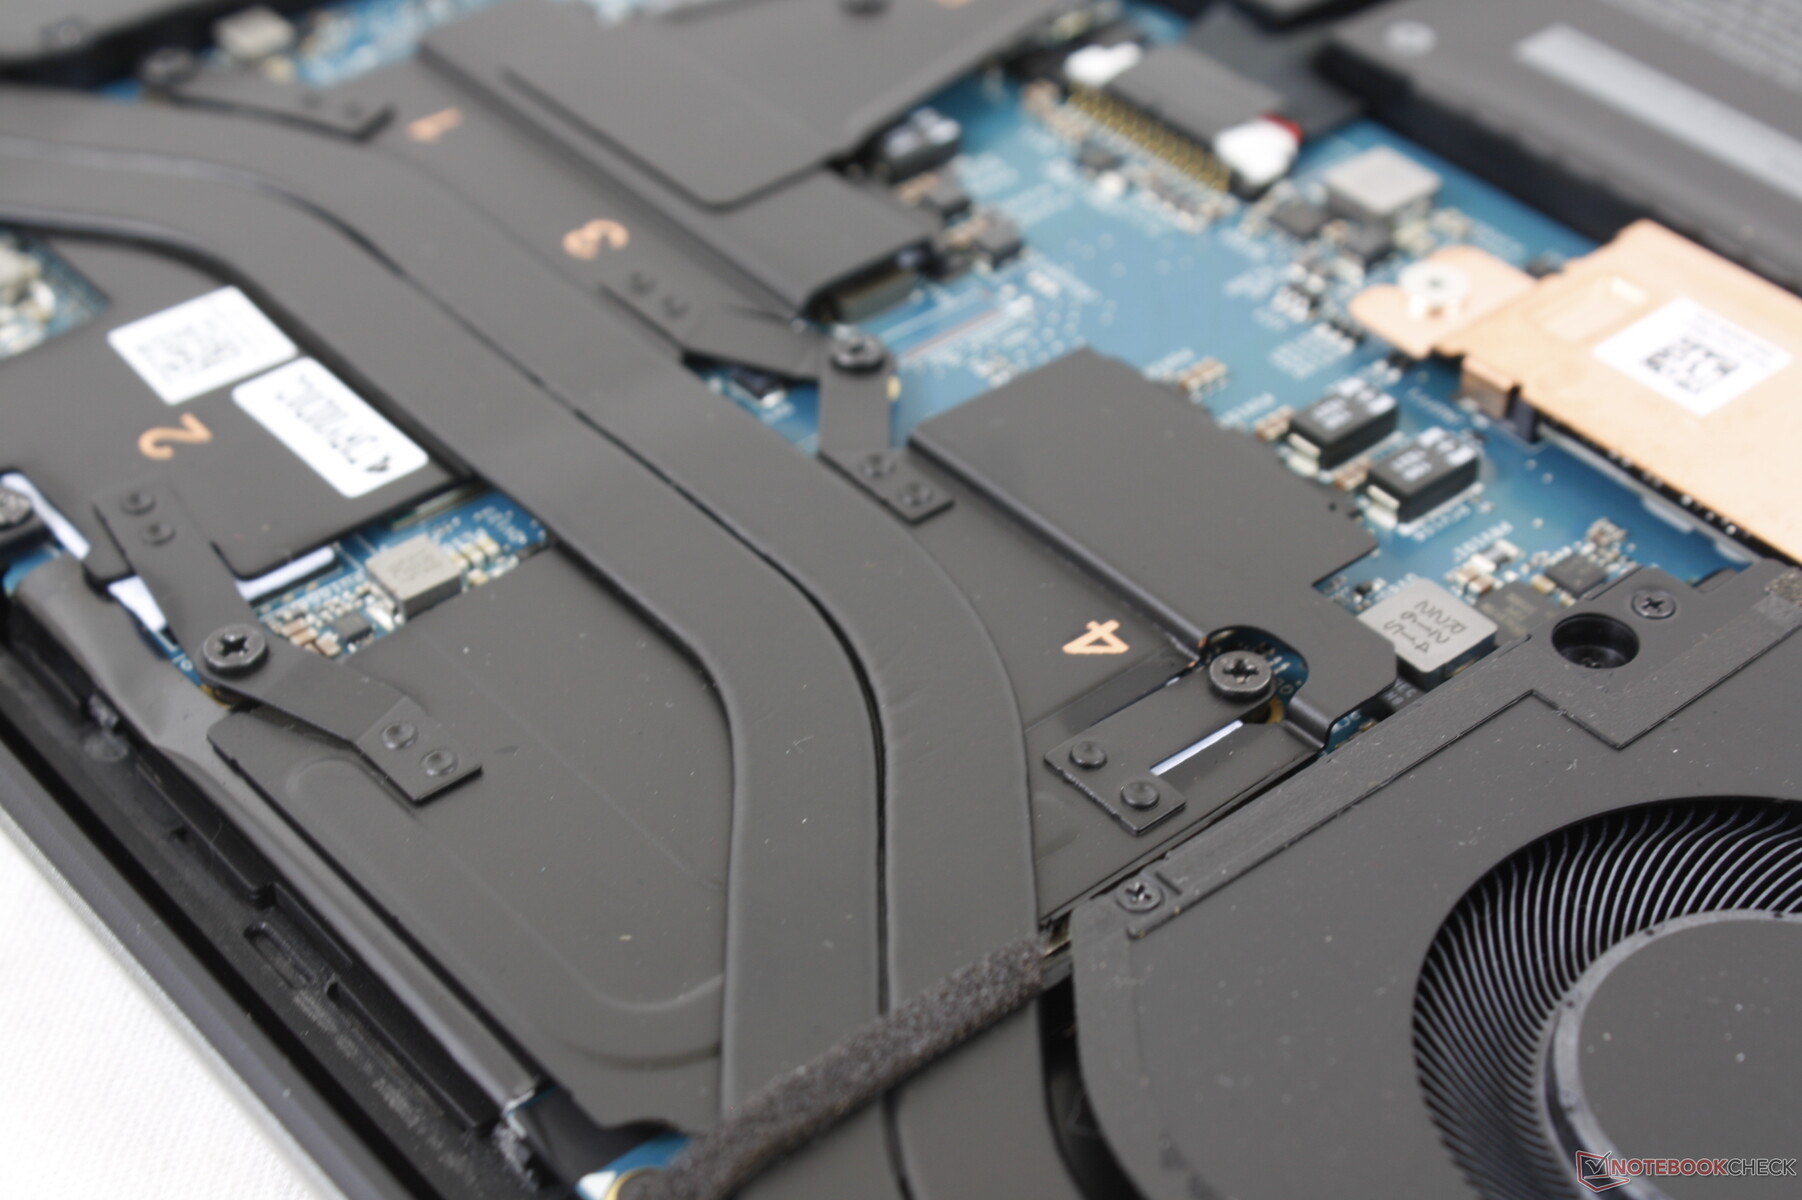
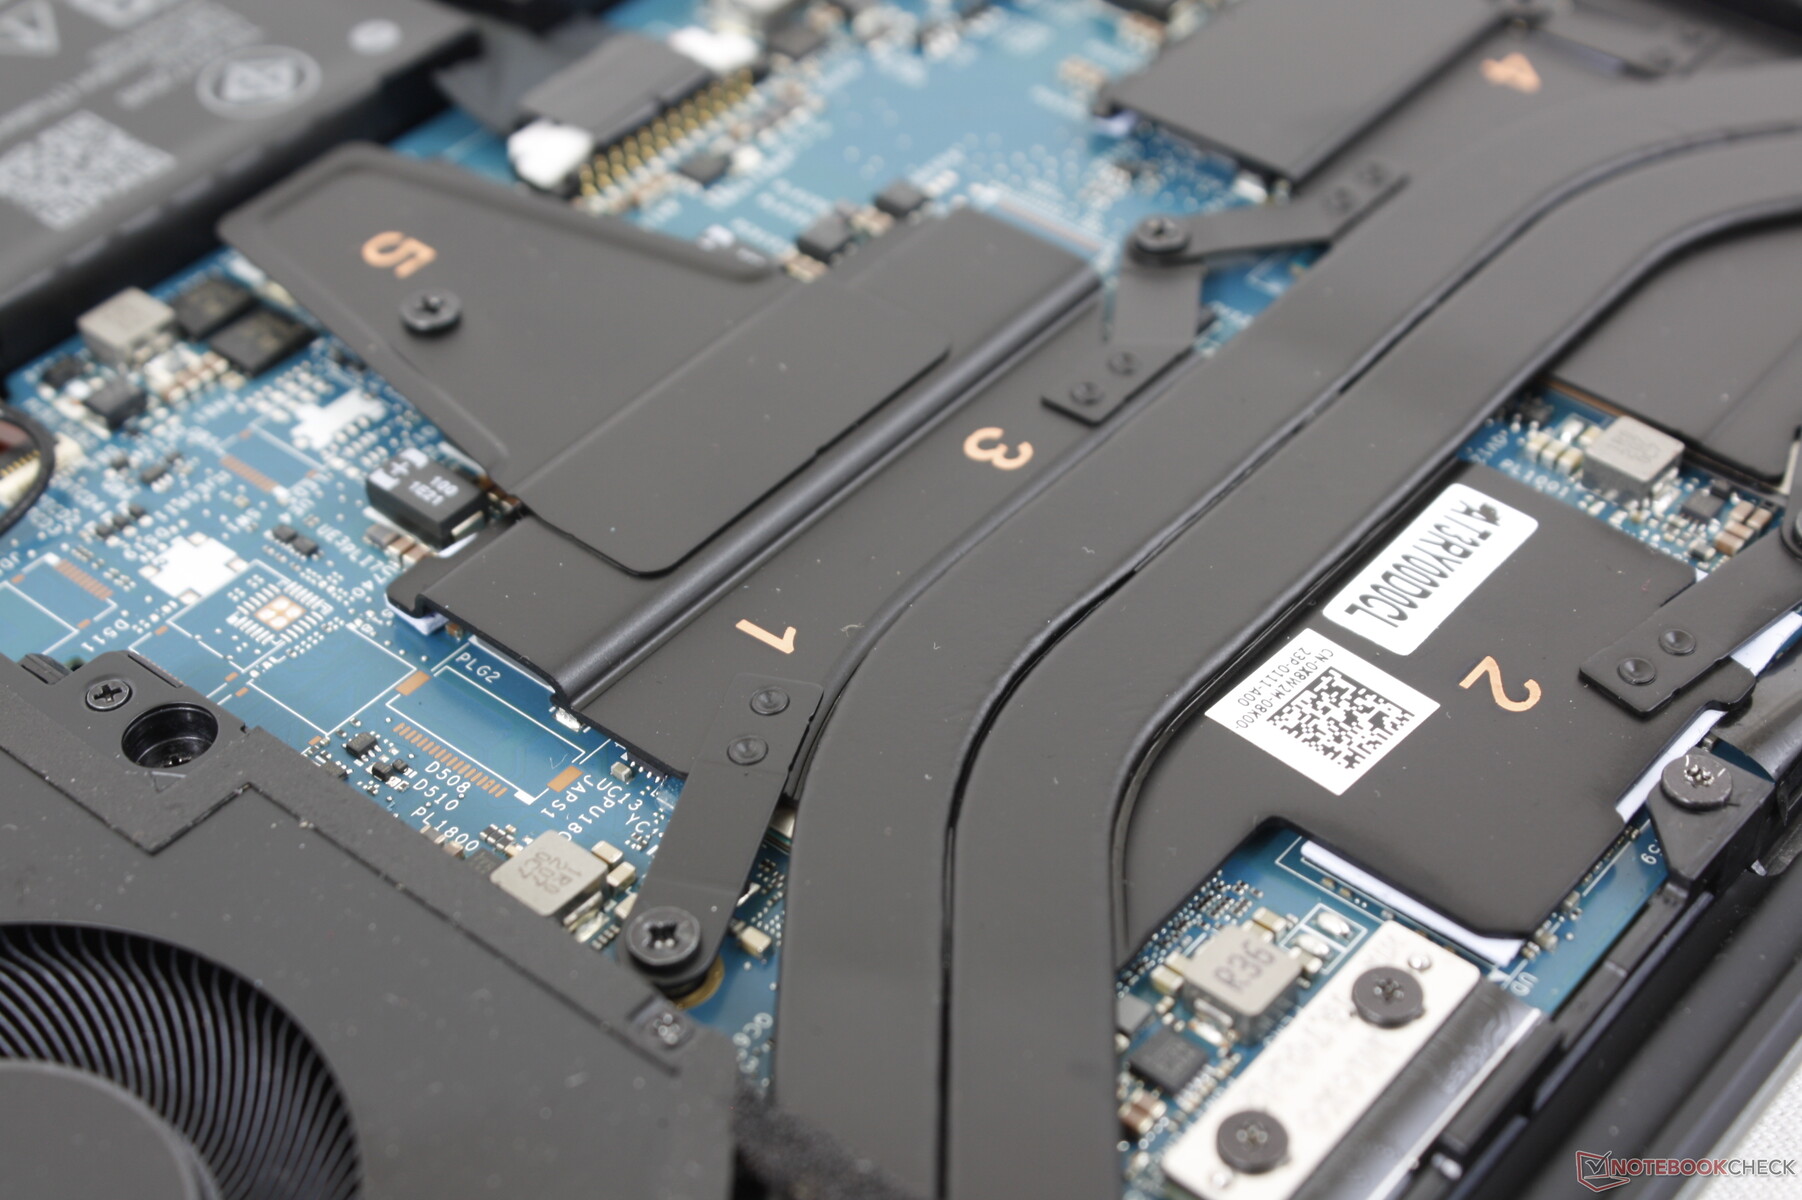
Maintenance
Le panneau inférieur est fixé par huit vis Torx T5 pour un retrait facile. Il n'y a pas grand-chose à mettre à niveau, cependant, car les modules RAM et WLAN sont soudés.
Garantie
La garantie de base n'est que de 12 mois aux États-Unis, au lieu de la période de 36 mois que nous sommes en droit d'attendre de la plupart des stations de travail mobiles et des ordinateurs portables professionnels haut de gamme.
Périphériques d'entrée
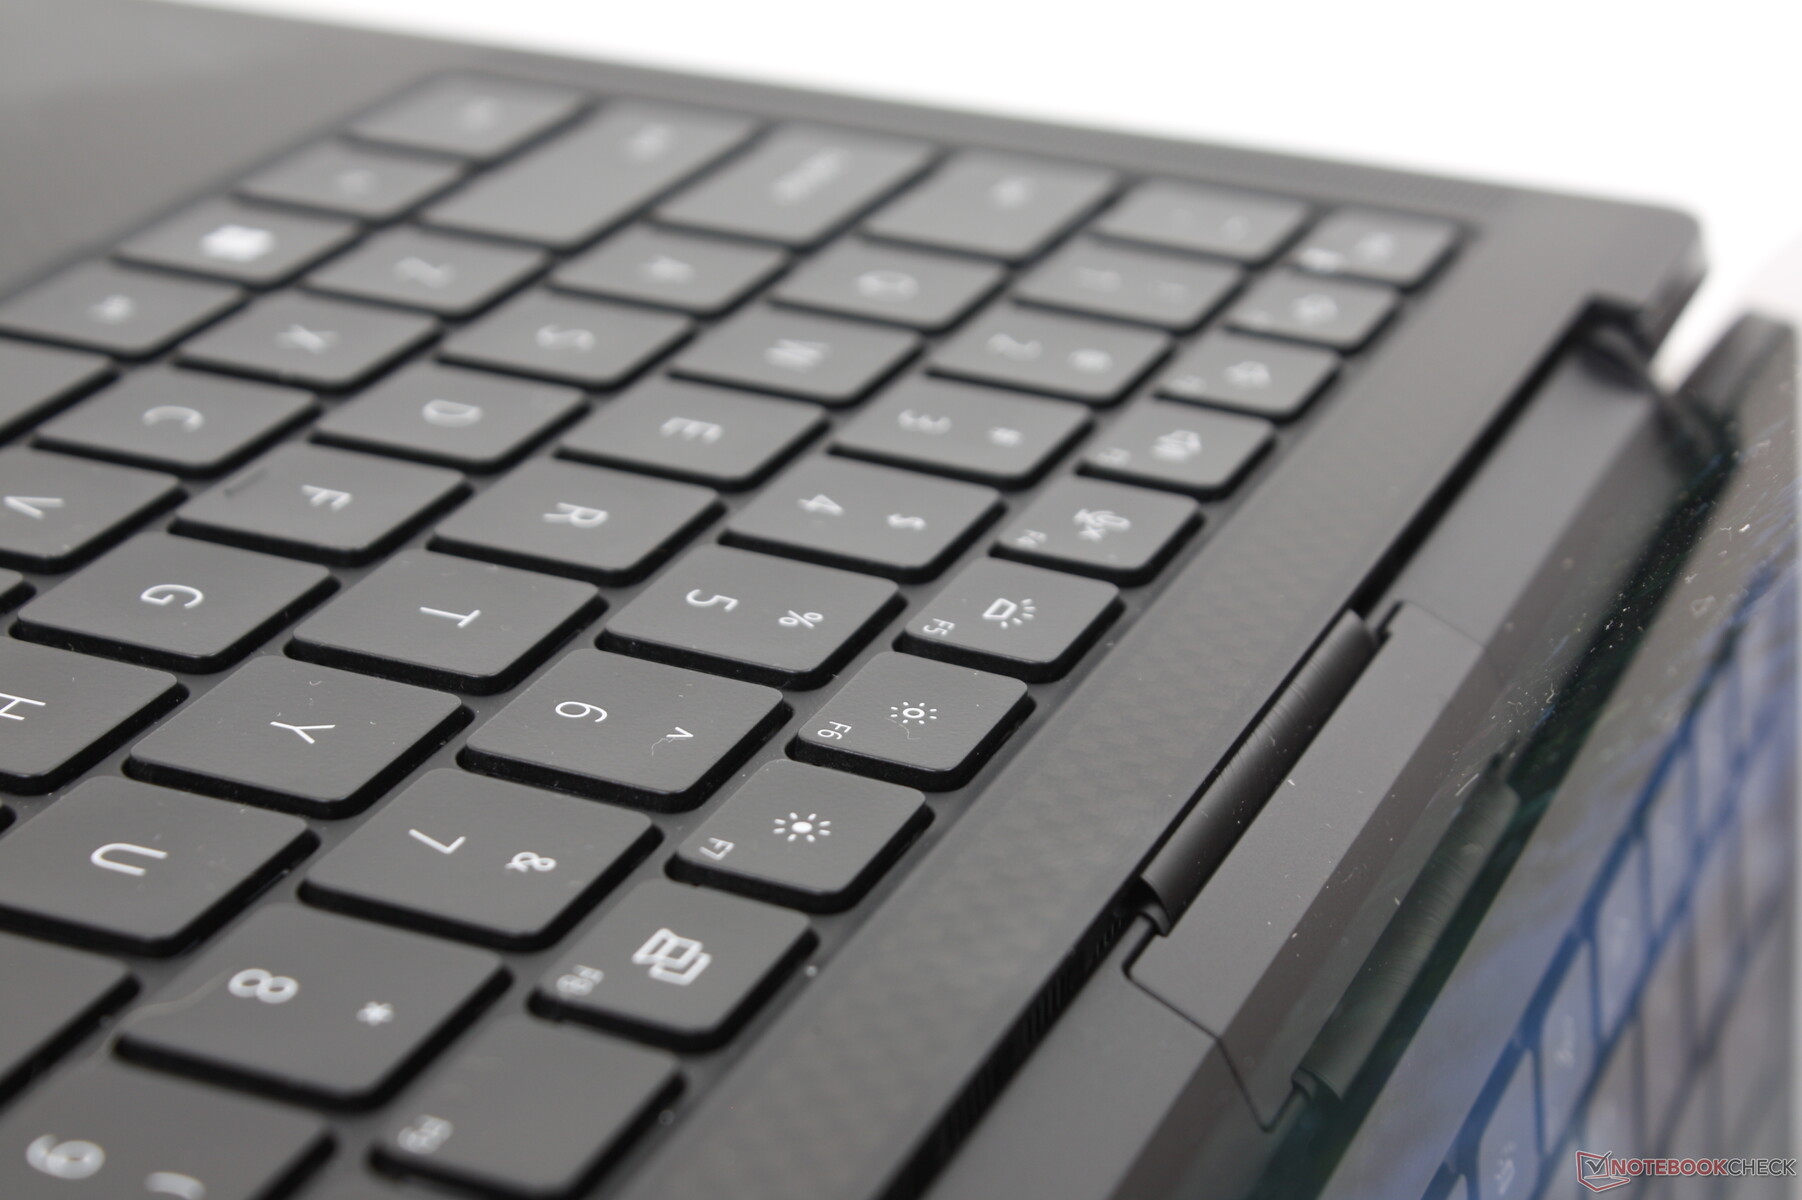
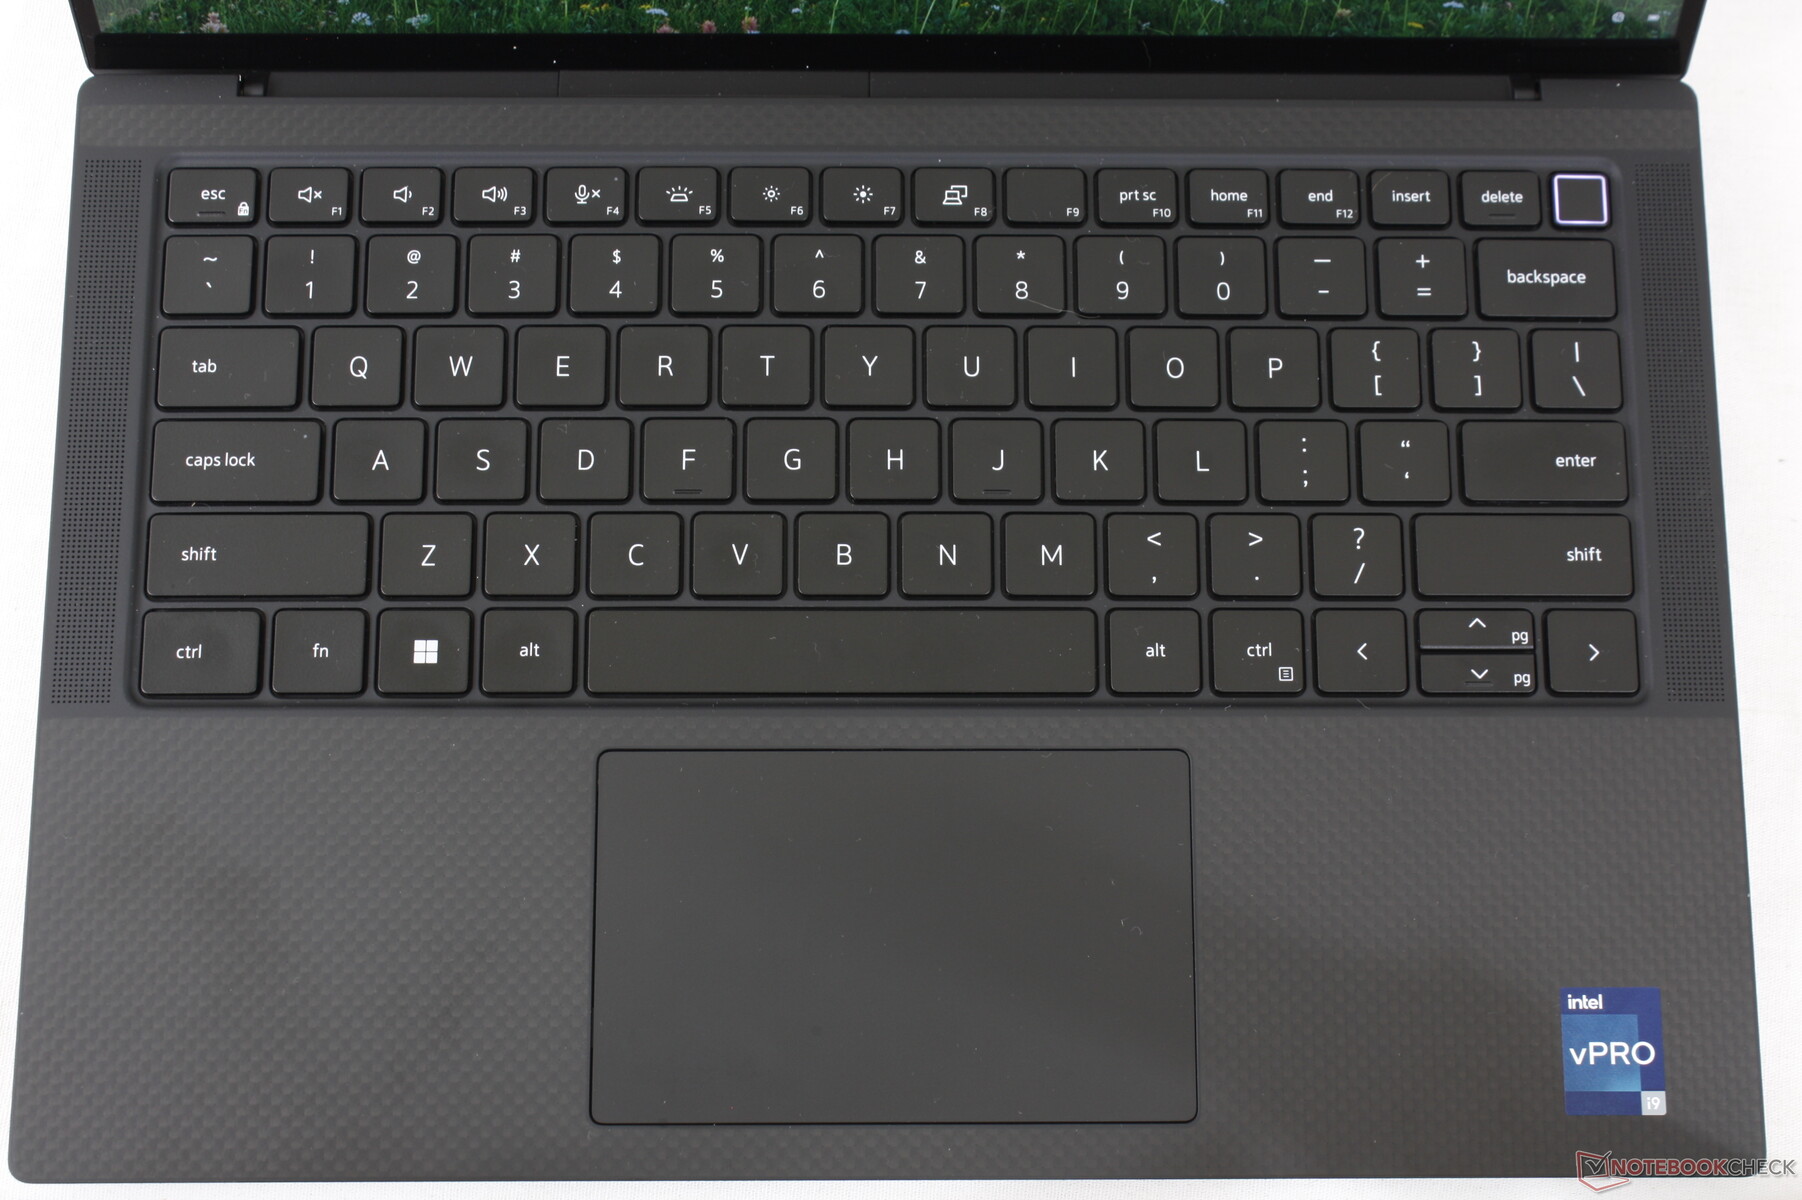
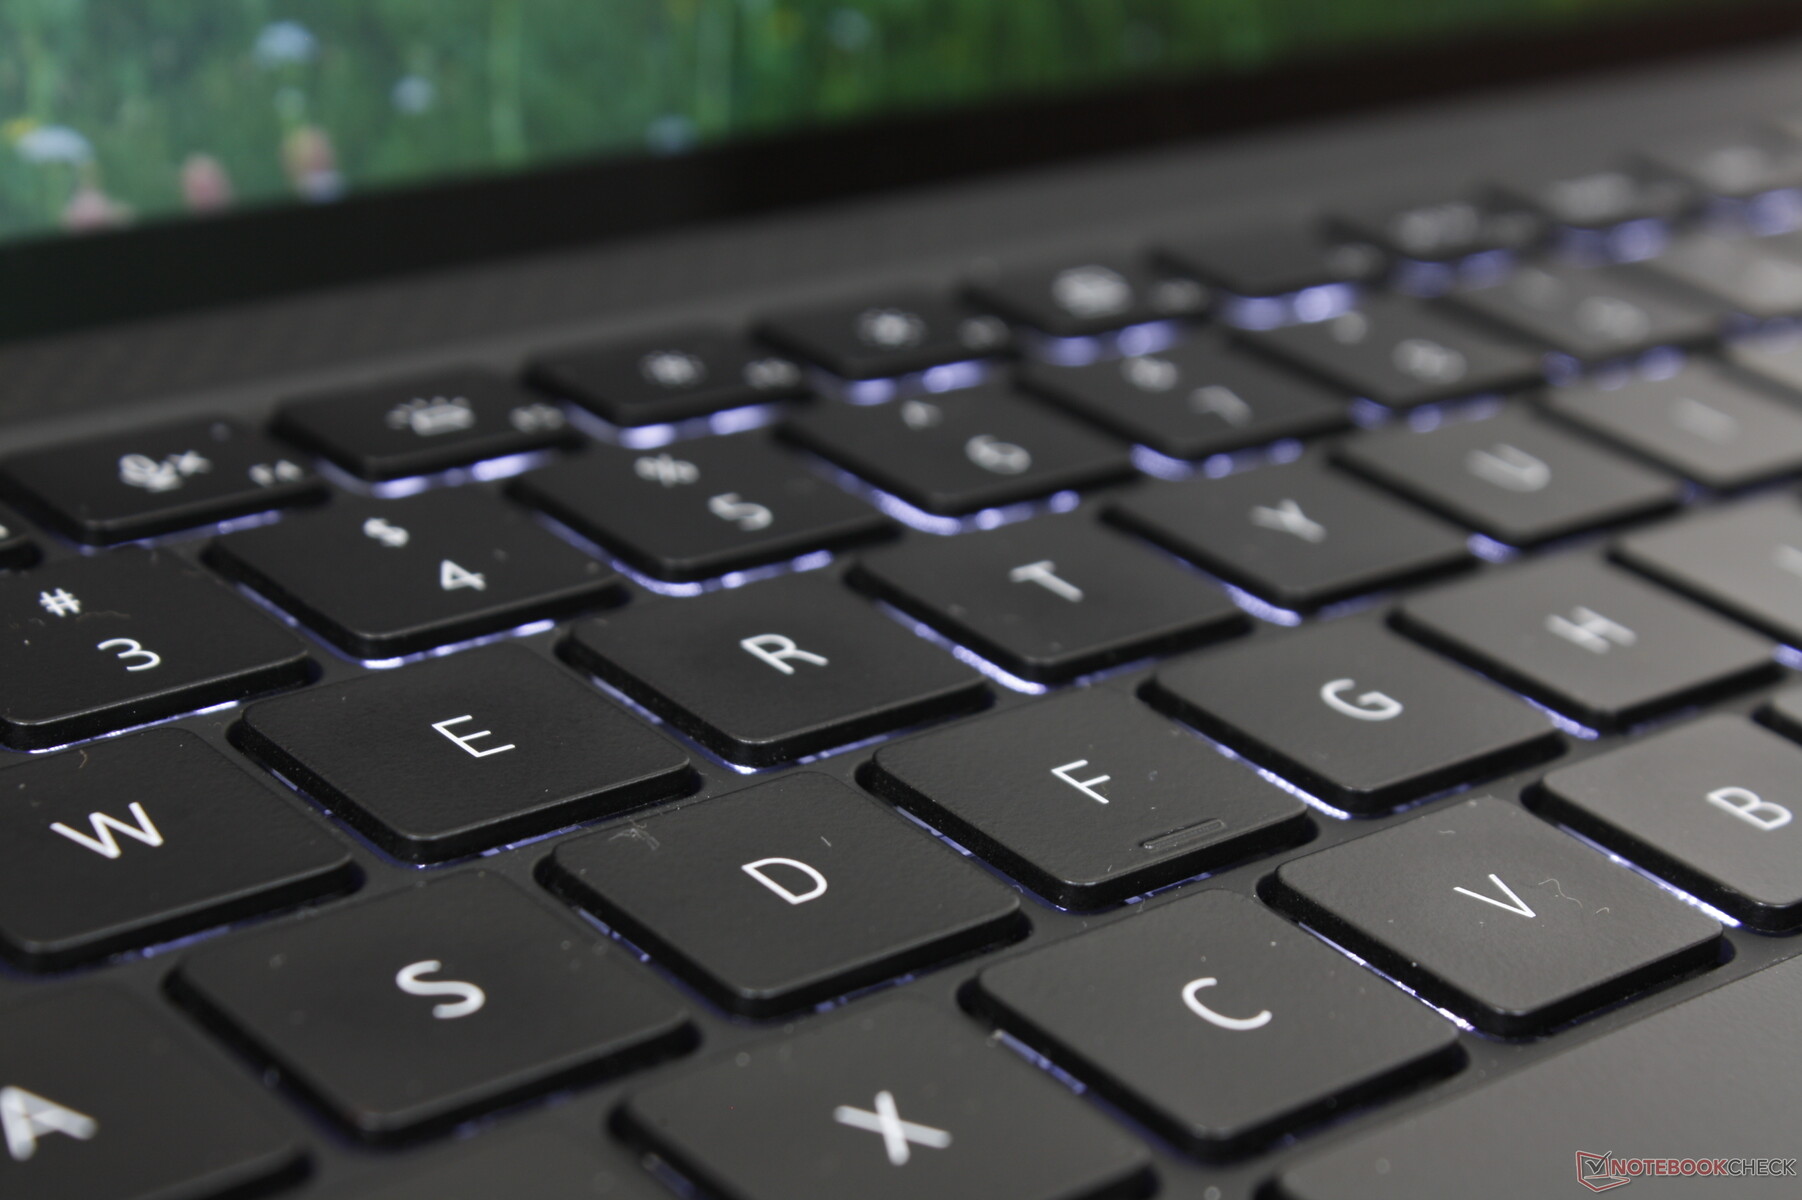
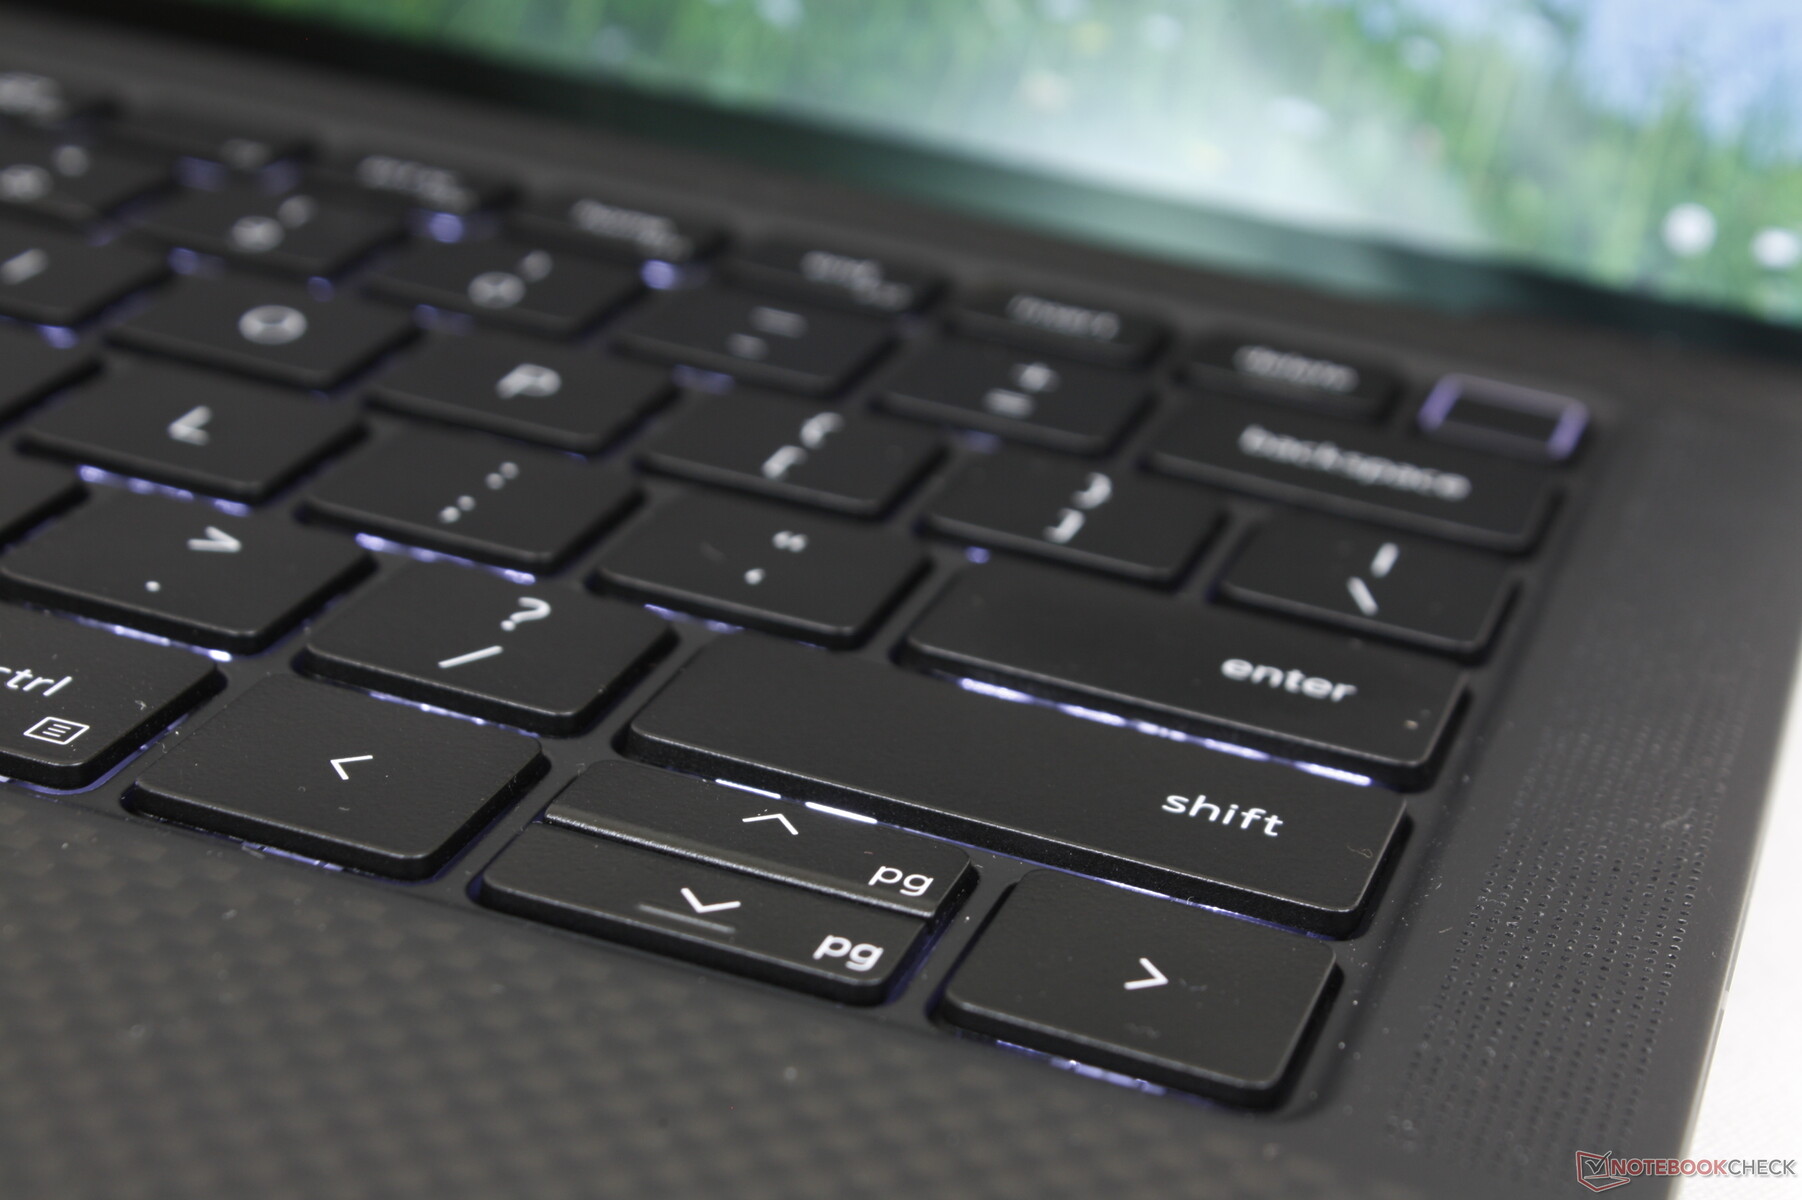
Clavier
Le modèle hérite du clavier que l'on trouve sur l'ancien XPS 13 9300 ou 9310. Si vous avez déjà tapé sur un XPS 13, vous saurez à quoi vous attendre sur le Precision 5470. Le retour des touches est uniforme avec une course modérée, mais les touches des séries HP EliteBook ou Firefly ont tendance à être plus nettes ou plus précises lorsqu'on les enfonce.
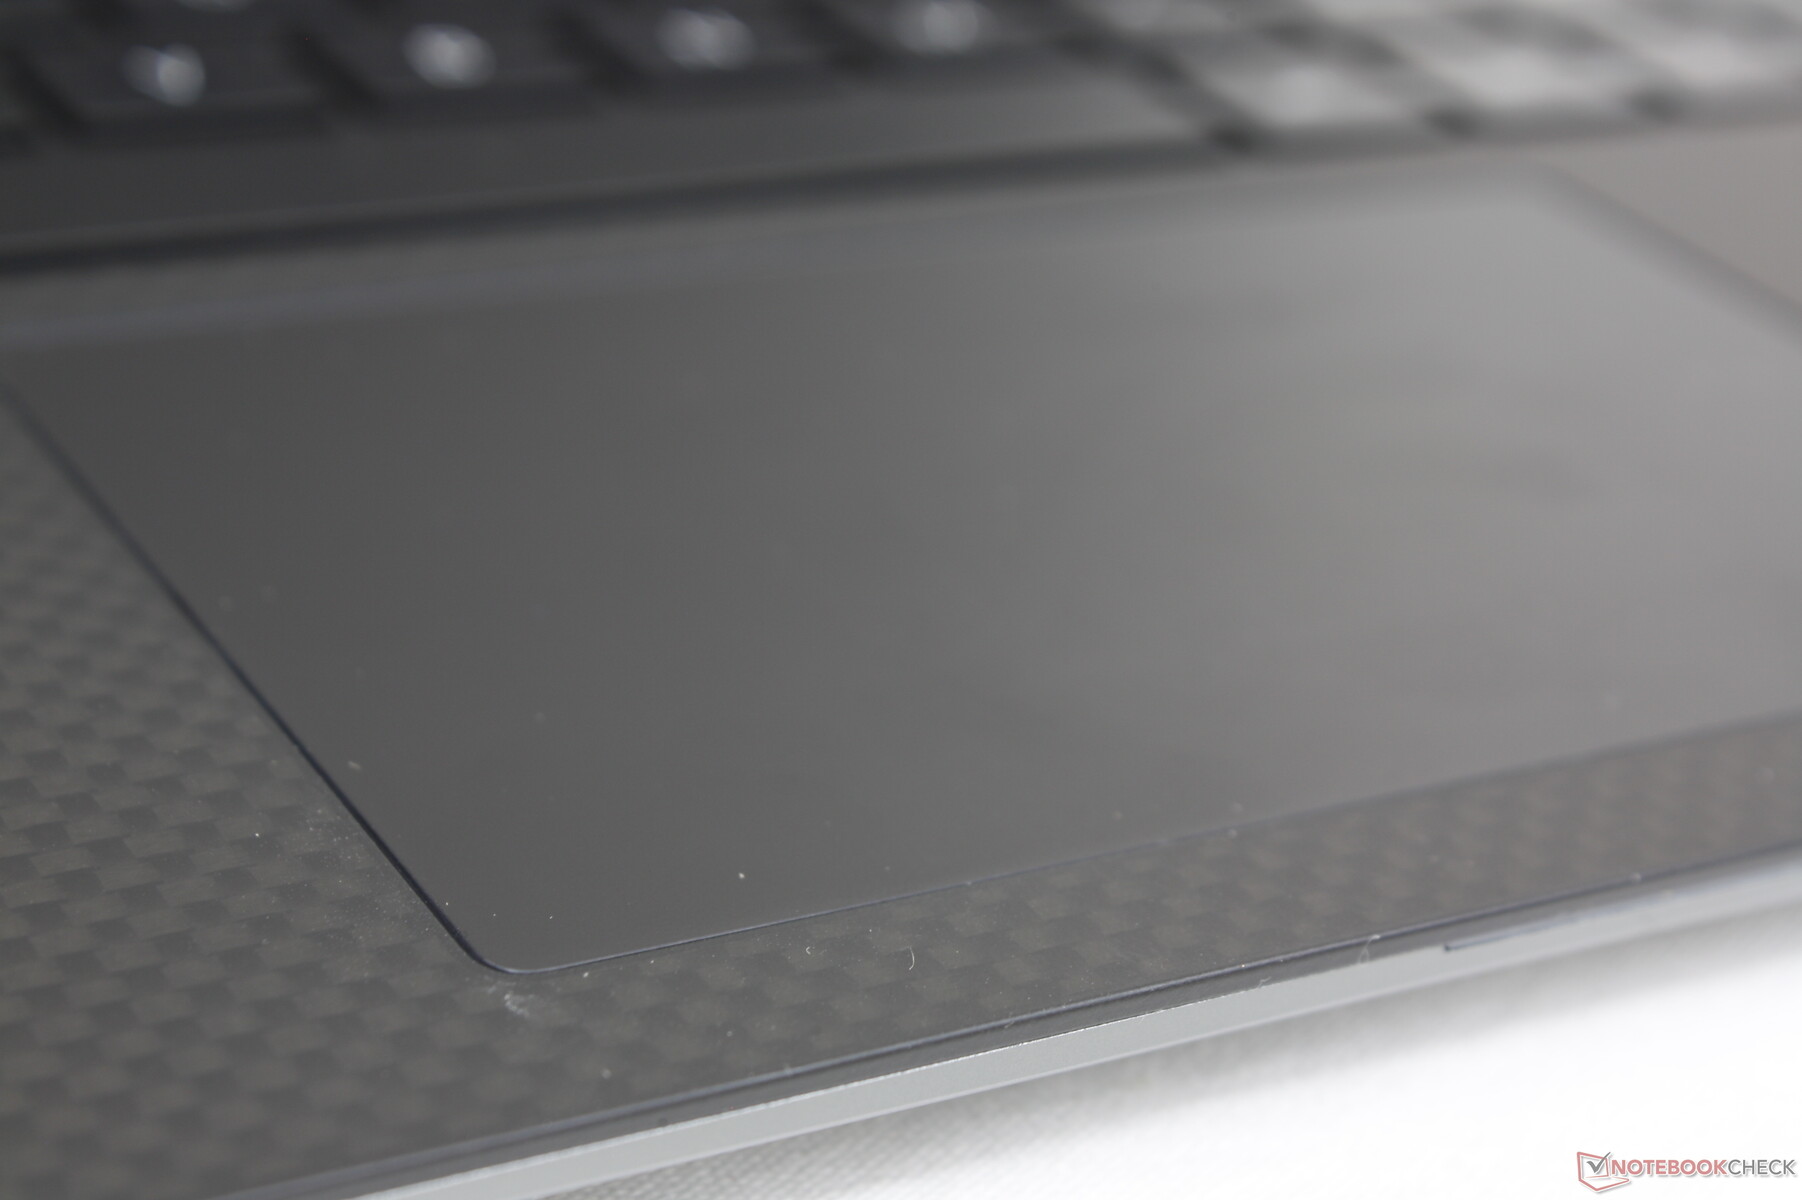
Pavé tactile
La surface du pavé numérique est à peu près de la même taille que celle du XPS 13 9300 (10,8 x 6,7 cm contre 11,2 x 6,5 cm). La traction est douce et seulement légèrement collante à des vitesses plus lentes pour une meilleure précision lorsque cela est nécessaire. Le retour d'information lorsque l'on clique sur le pavé tactile est relativement doux et peu profond, mais avec un claquement beaucoup plus silencieux que sur la plupart des autres ordinateurs portables.
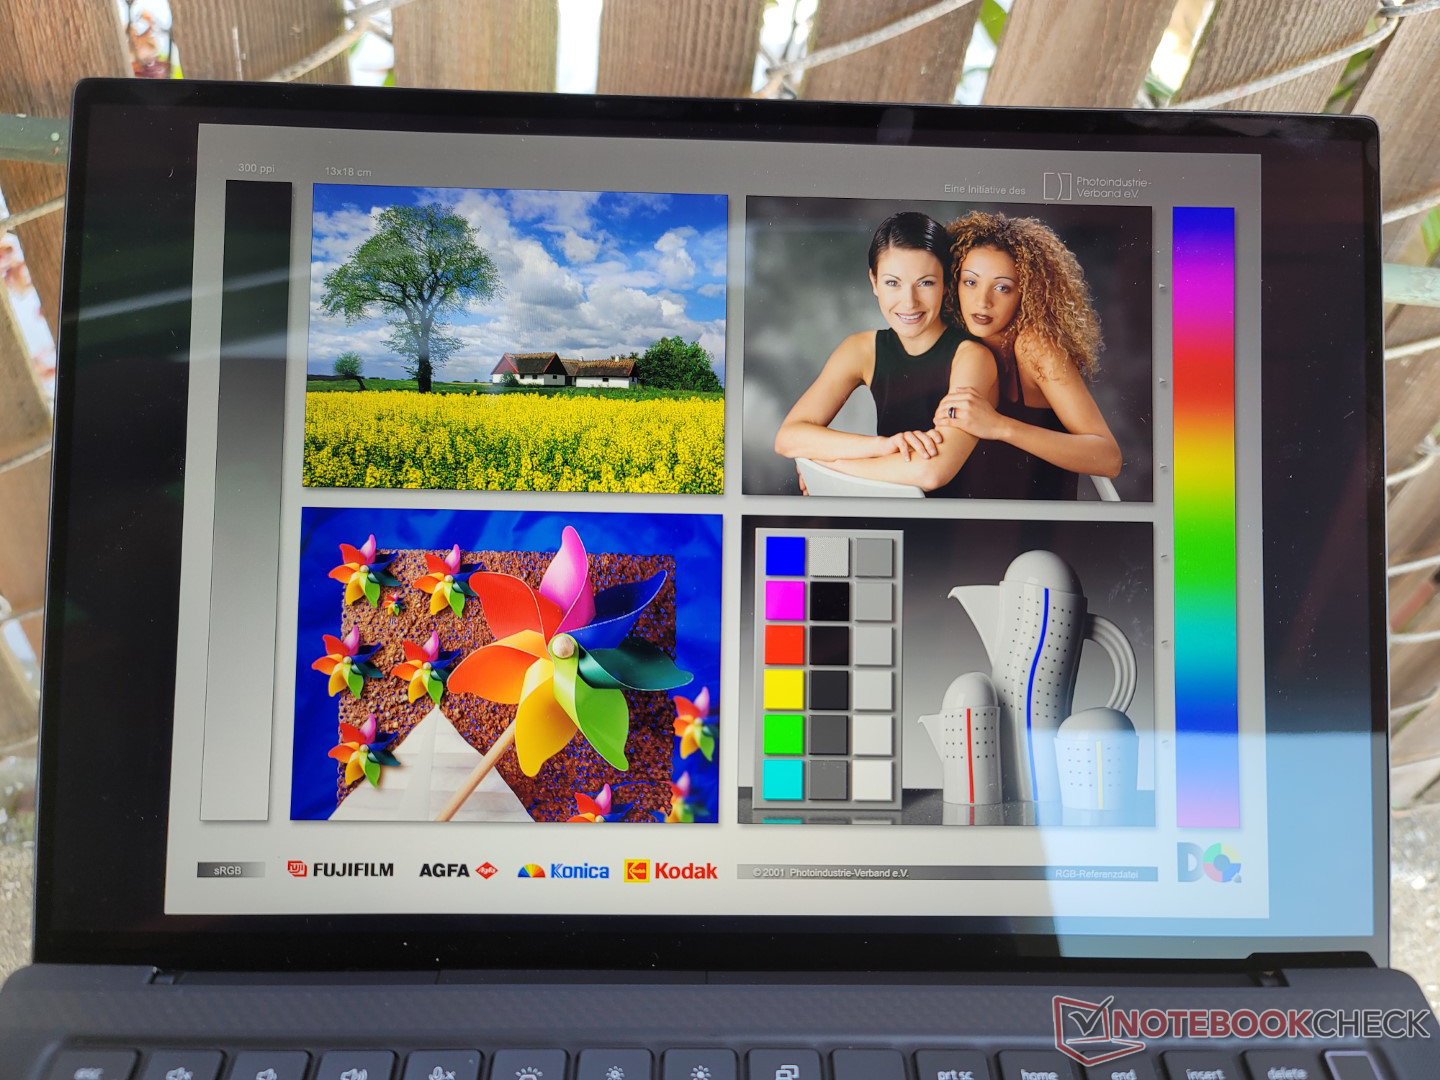
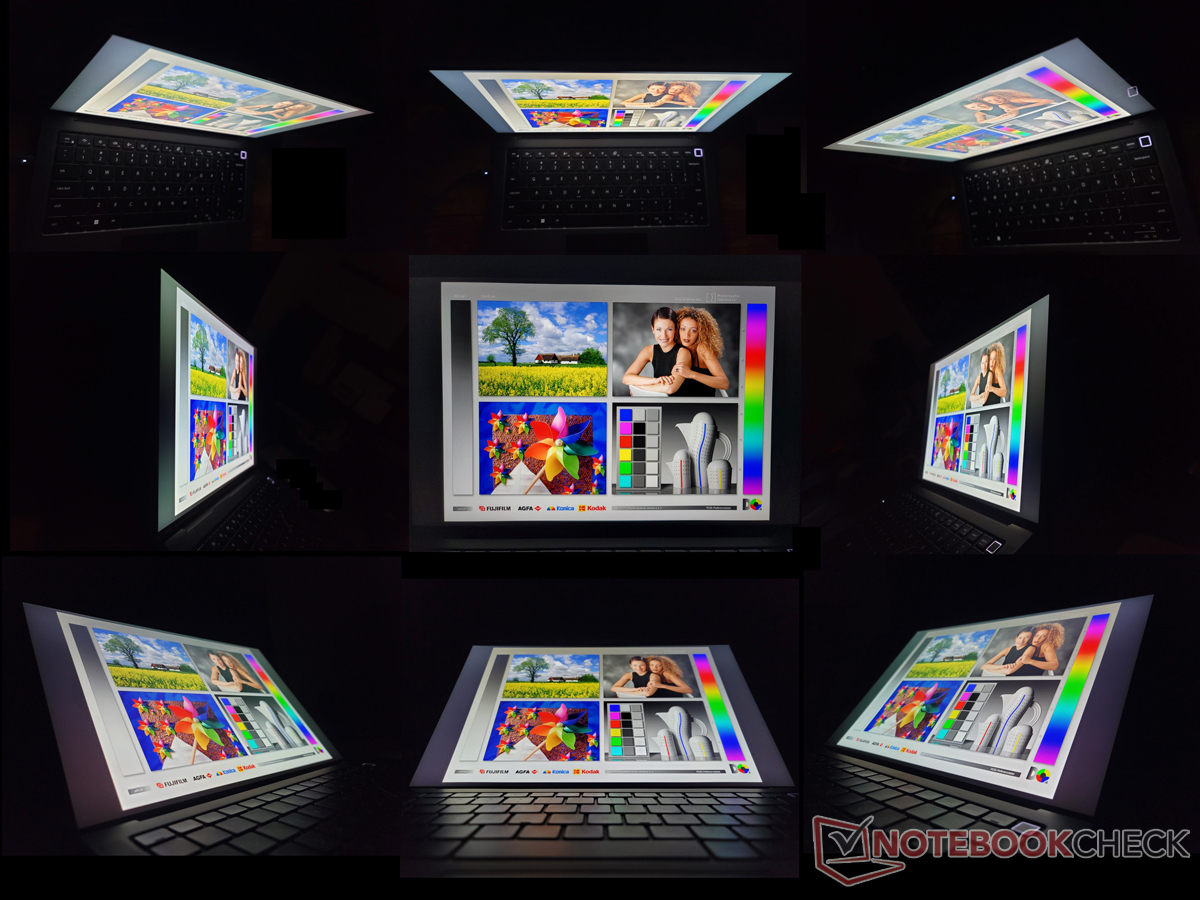
Écran - Identique à Latitude 9430 2-in-1
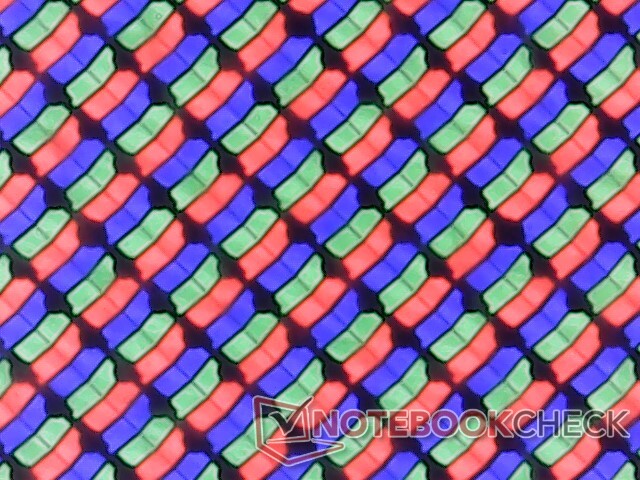
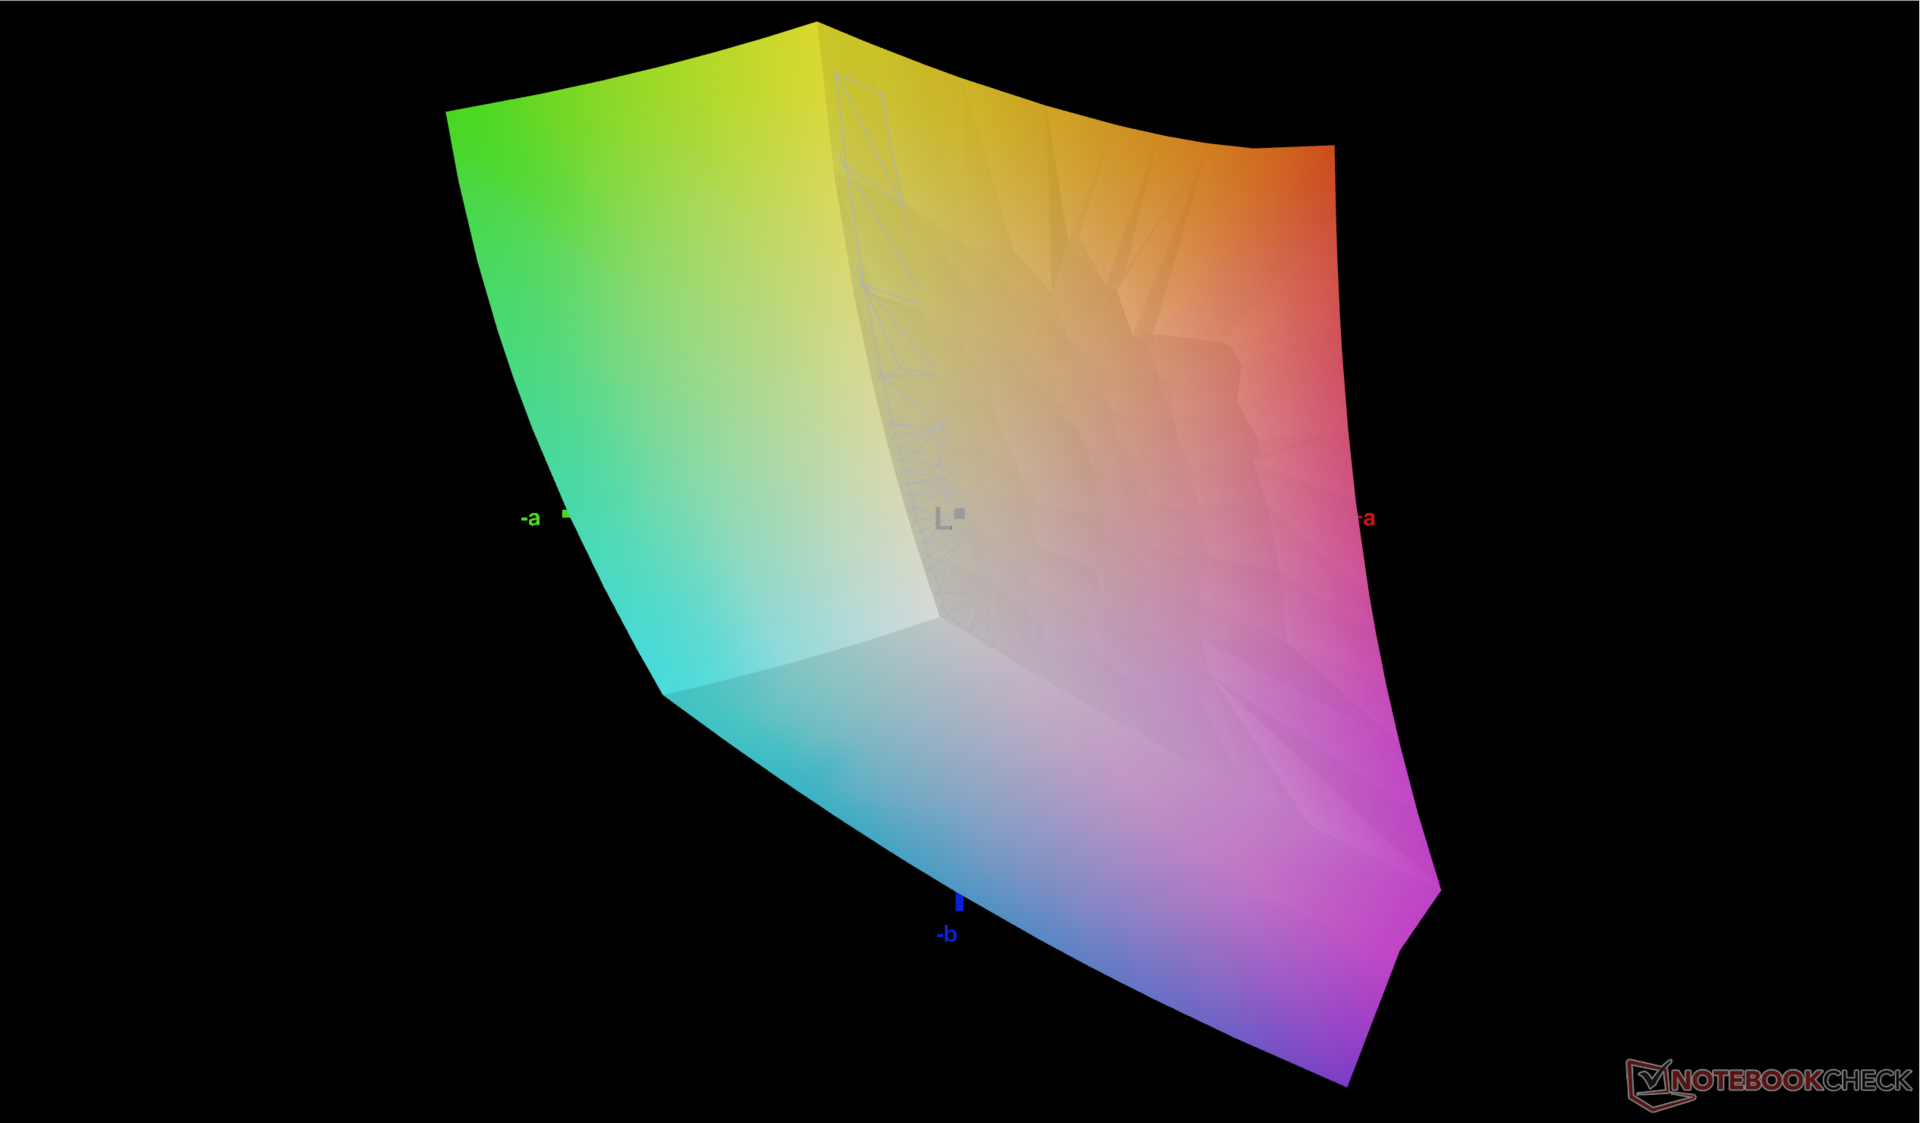
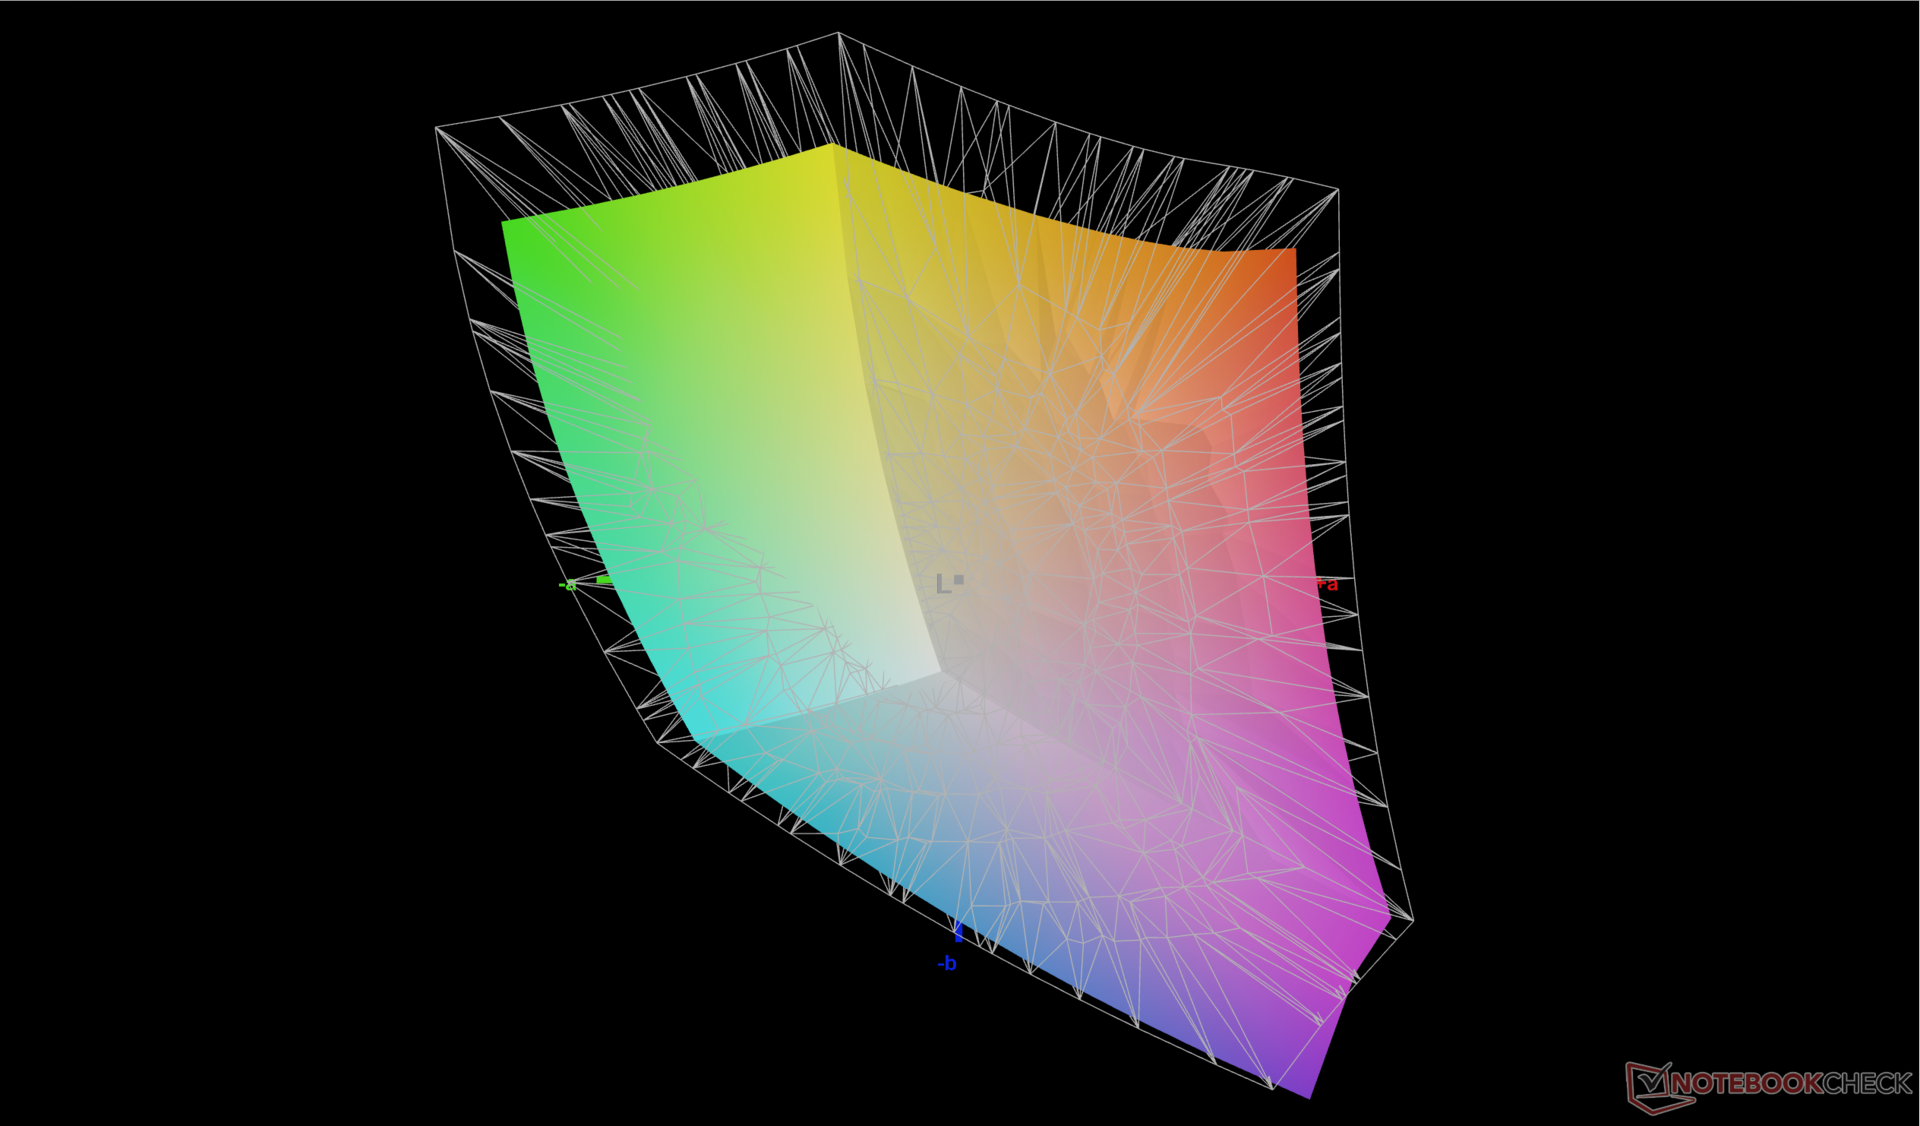
Le Precision 5470 partage le même écran tactile IPS AU Optronics B140QAN de haute qualité que celui du Latitude 9430 2-en-1. Ainsi, les deux modèles partagent des temps de réponse noir-blanc, un gamut, un taux de contraste et même une luminosité globale similaires. Cet écran est excellent pour les utilisateurs qui souhaitent une couverture sRGB complète et des niveaux de noir relativement profonds, mais il souffre malheureusement d'un effet fantôme notable qui peut être un problème si vous utilisez des applications impliquant des graphiques ou des vidéos rapides.
Il n'y a pas d'OLED, de couleurs AdobeRGB ou P3, ni d'options de taux de rafraîchissement plus élevé parmi lesquelles choisir, ce qui signifie que les utilisateurs sont limités à l'IPS et à 60 Hz sur toutes les configurations actuelles.
| |||||||||||||||||||||||||
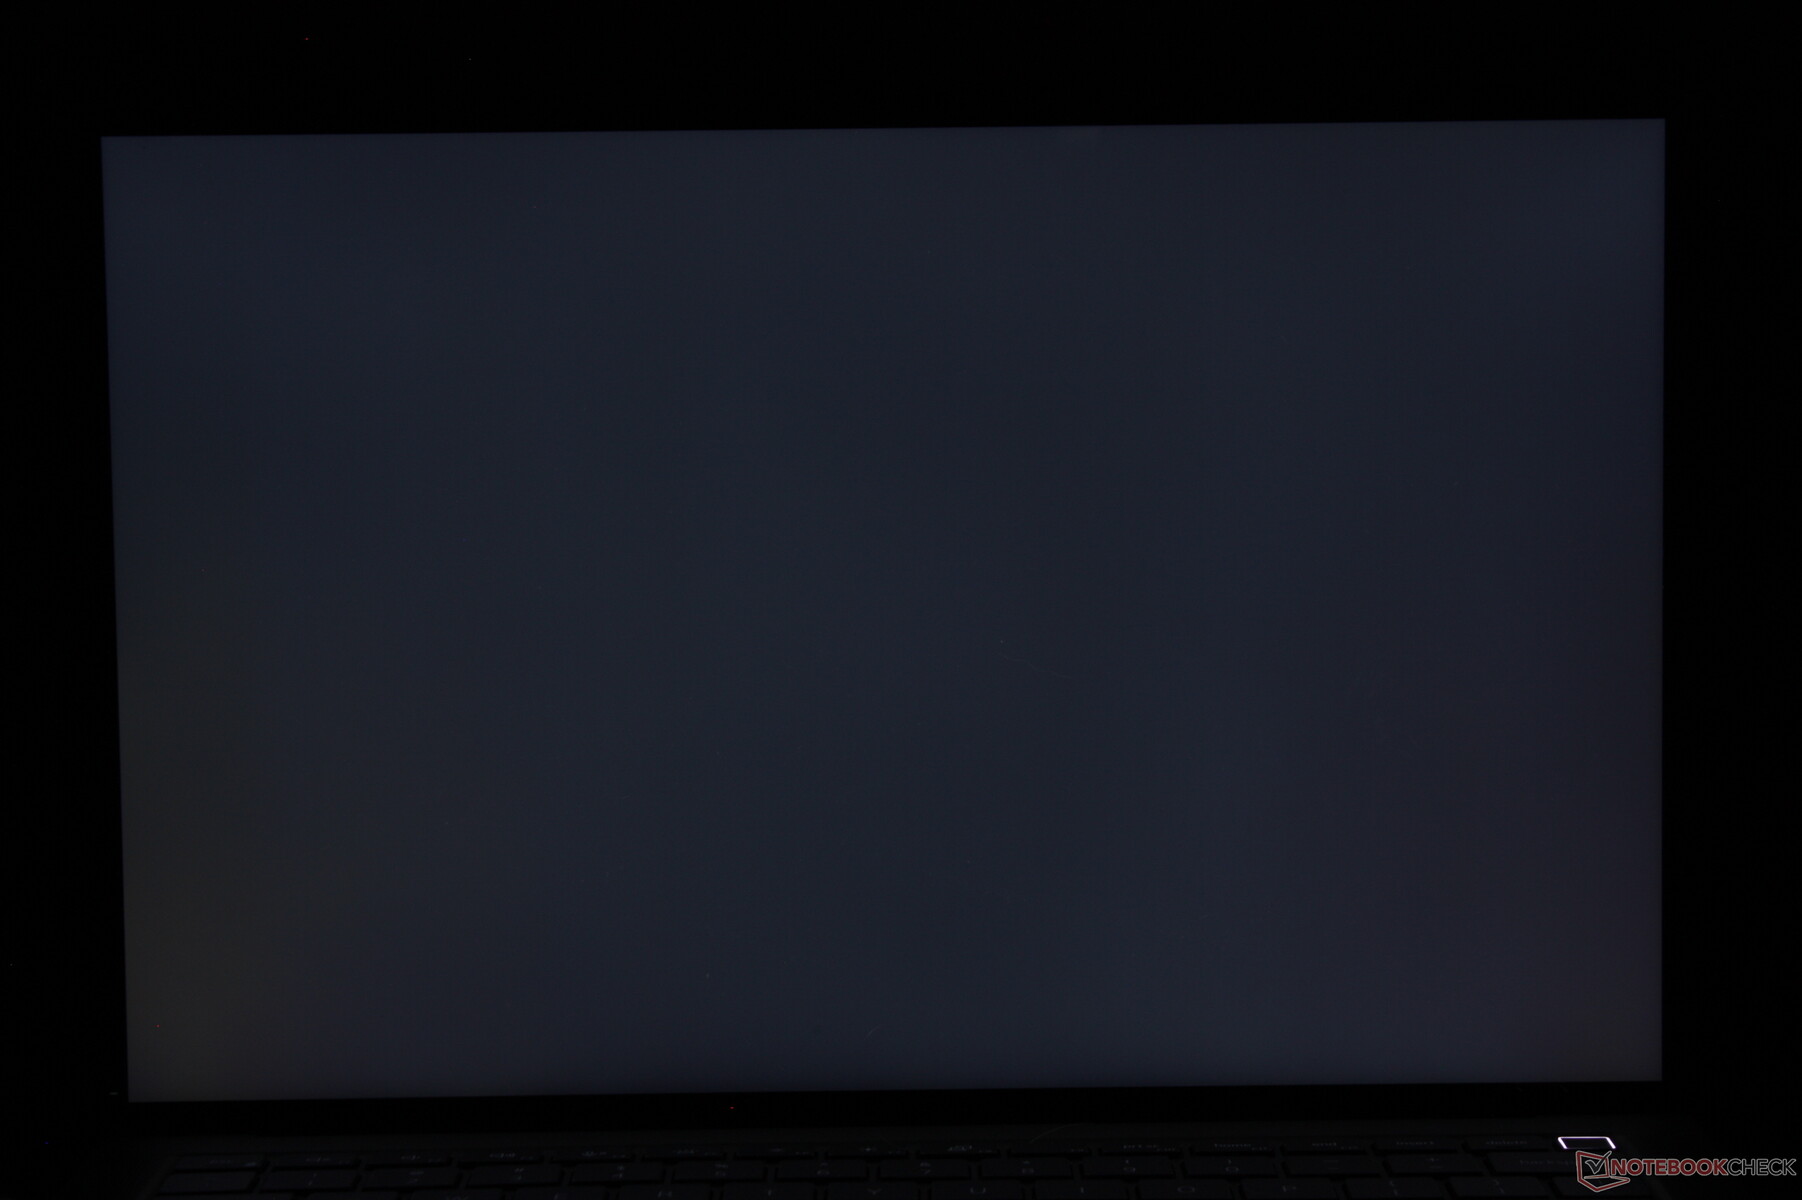
Homogénéité de la luminosité: 94 %
Valeur mesurée au centre, sur batterie: 537 cd/m²
Contraste: 1627:1 (Valeurs des noirs: 0.33 cd/m²)
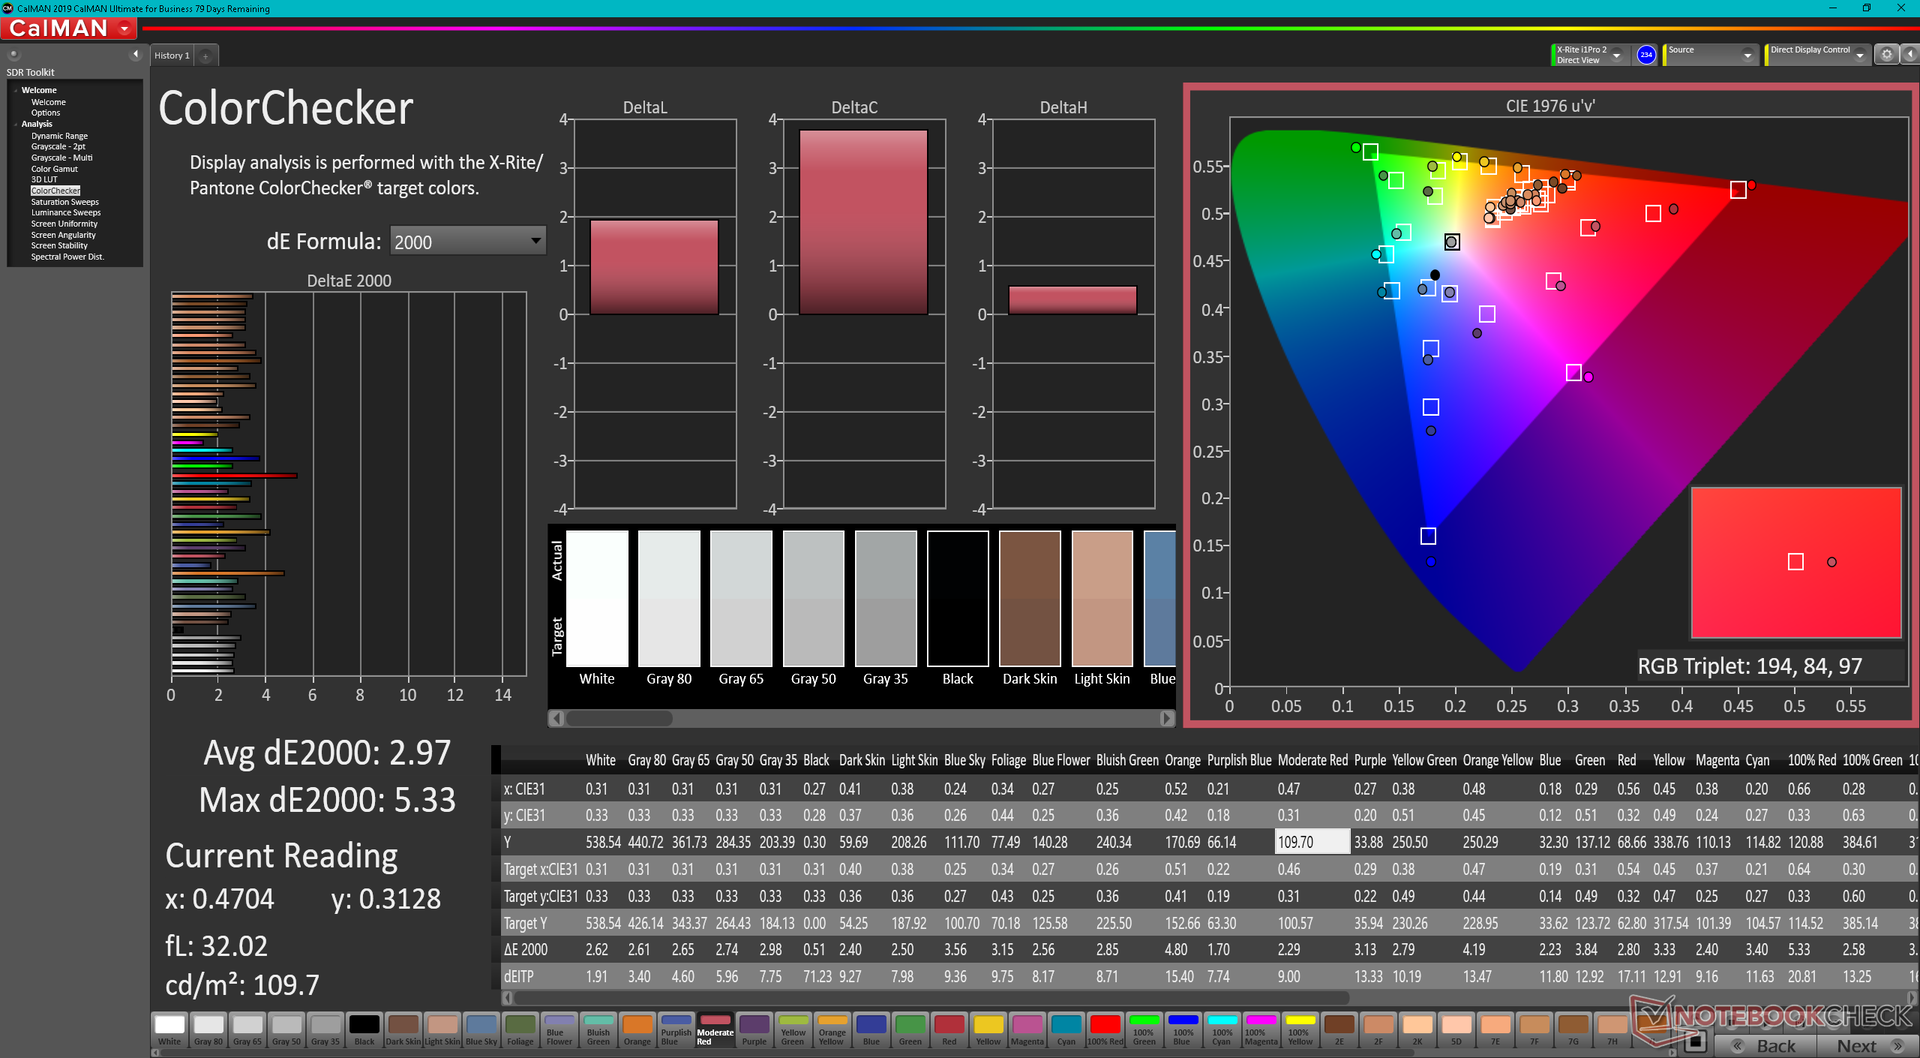
ΔE ColorChecker Calman: 2.97 | ∀{0.5-29.43 Ø4.71}
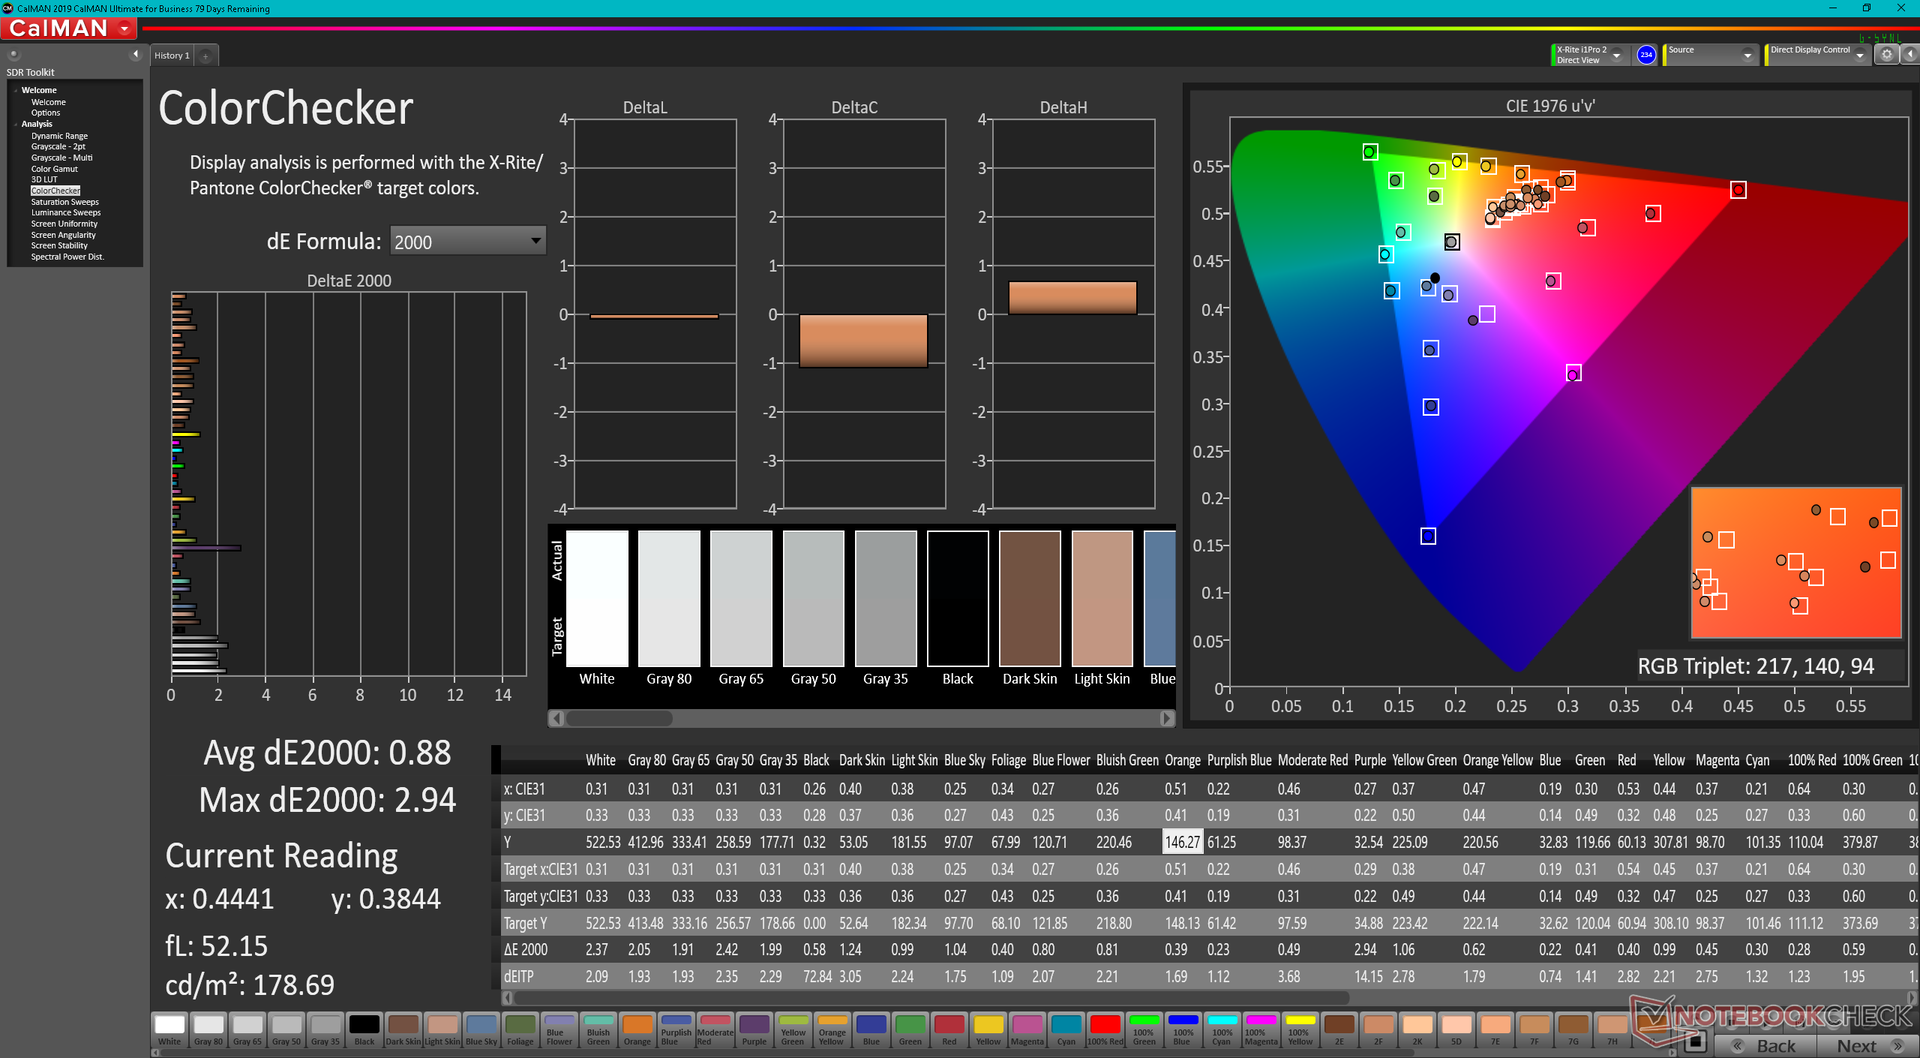
calibrated: 0.88
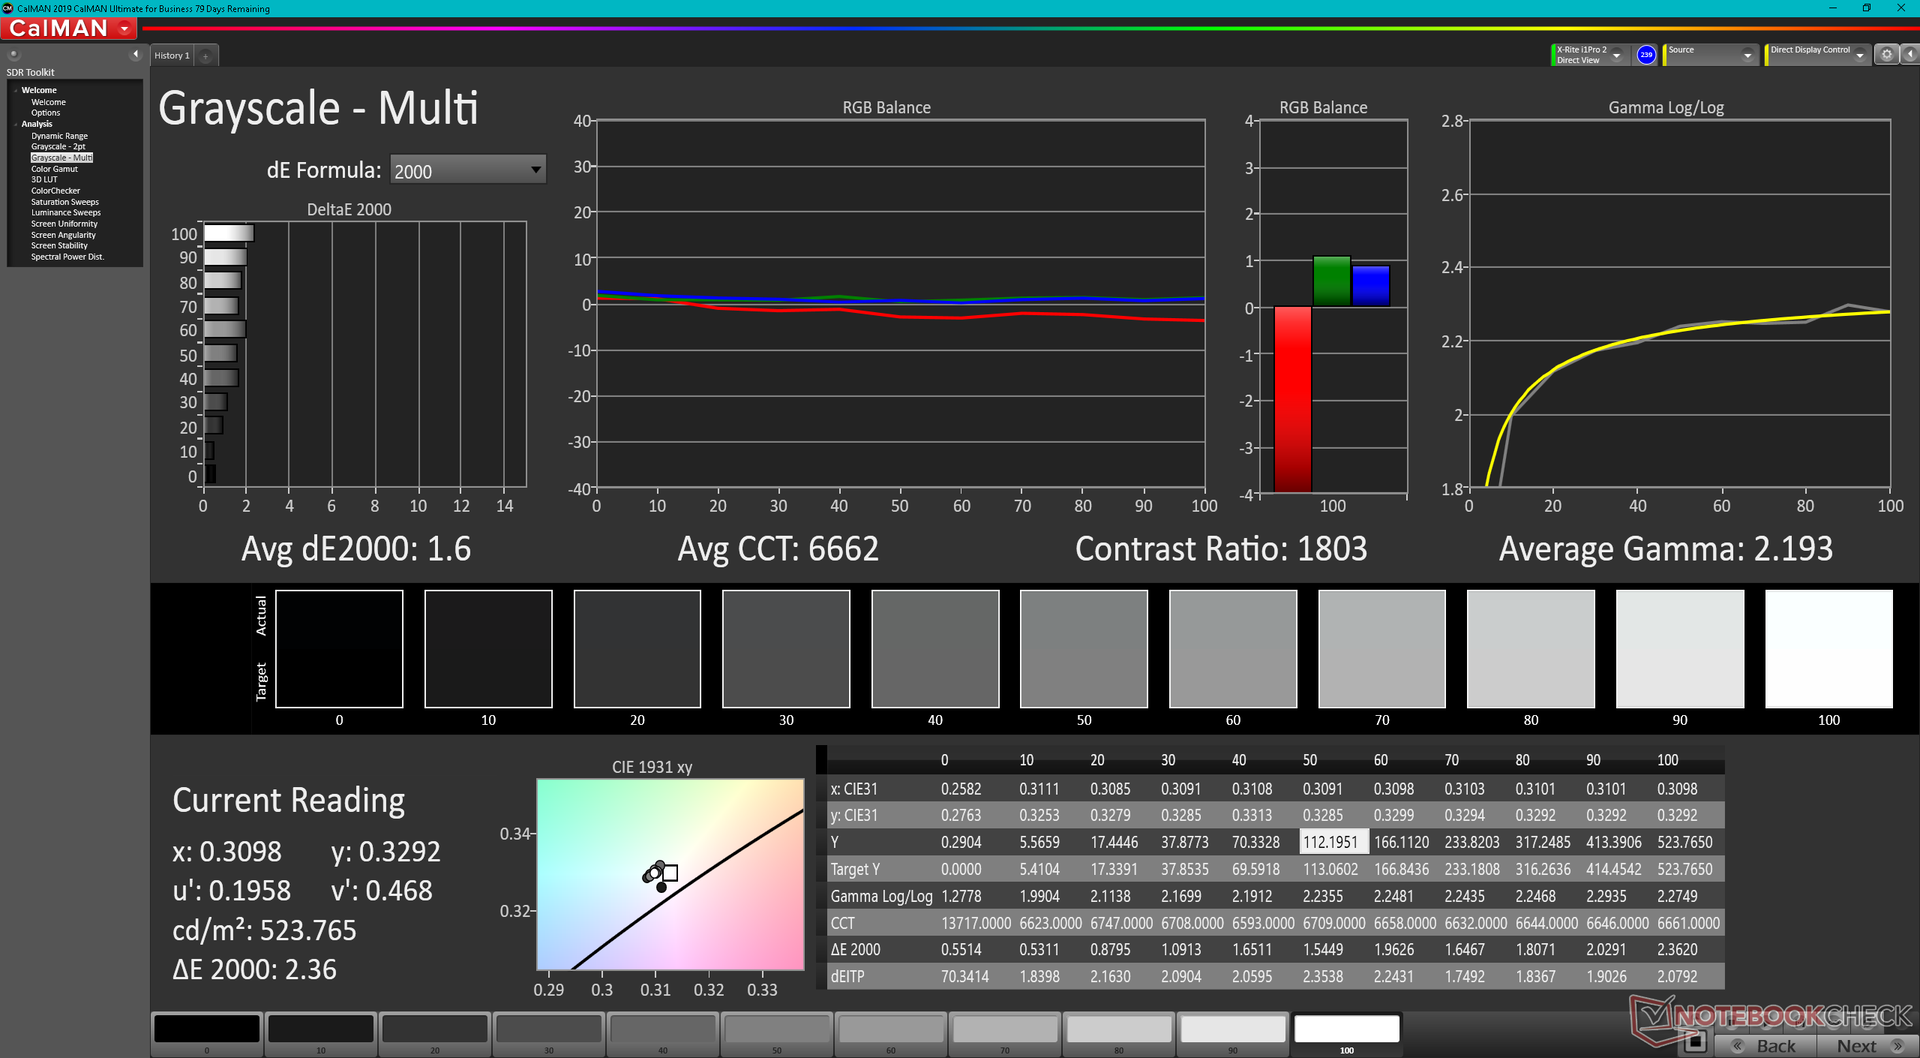
ΔE Greyscale Calman: 2.4 | ∀{0.09-98 Ø4.96}
78.7% AdobeRGB 1998 (Argyll 3D)
100% sRGB (Argyll 3D)
79.3% Display P3 (Argyll 3D)
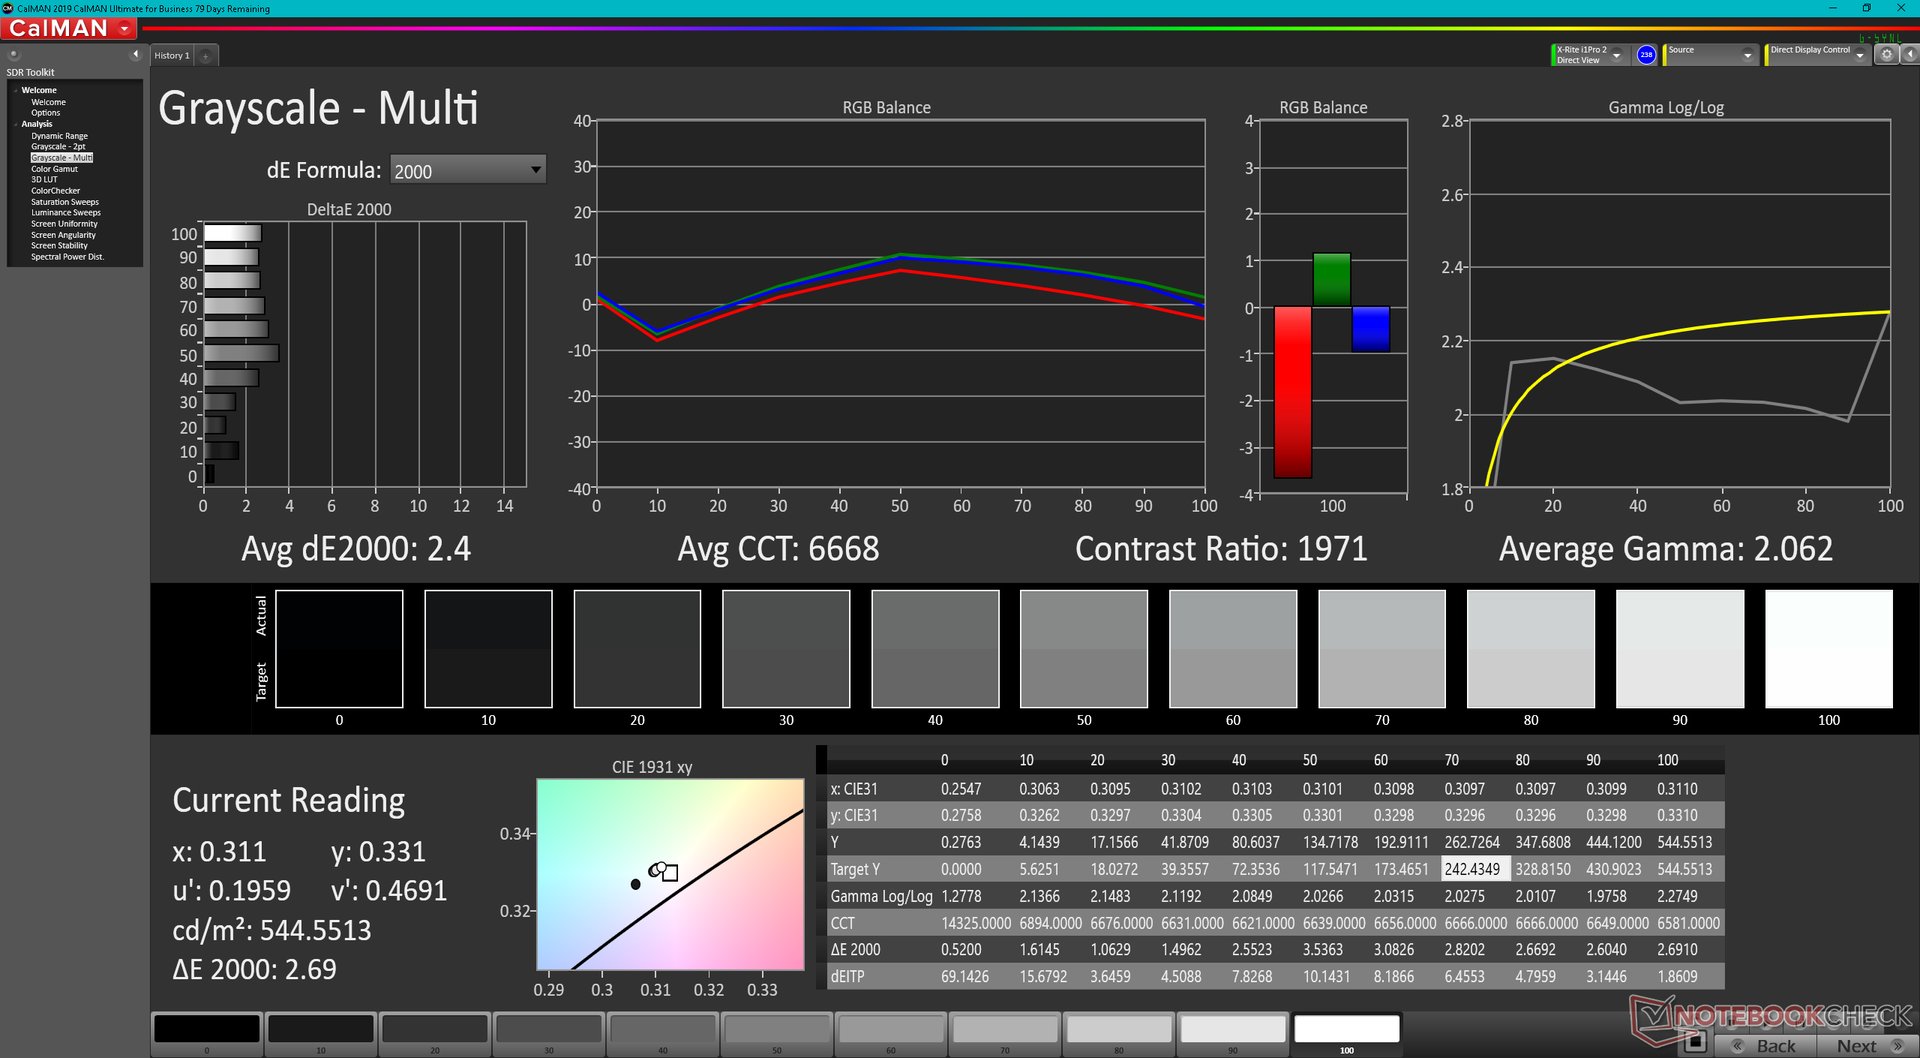
Gamma: 2.06
CCT: 6668 K
| Dell Precision 5000 5470 AU Optronics B140QAN, IPS, 2560x1600, 14" | Lenovo ThinkPad P15v G2 21A9000XGE N156HCA-EAC, IPS LED, 1920x1080, 15.6" | Dell Precision 5000 5560 Sharp LQ156R1, IPS, 3840x2400, 15.6" | Lenovo ThinkPad P14s G2 AMD MNE001EA1-5, IPS LED, 3840x2160, 14" | HP ZBook Firefly 14 G8 2C9Q2EA AU Optronics AUO068B, IPS, 1920x1080, 14" | HP ZBook Firefly 14 G7 InfoVision IVO8C78 (X140NVFC R0), IPS, 1920x1080, 14" | |
|---|---|---|---|---|---|---|
| Display | -41% | 16% | 10% | -7% | -4% | |
| Display P3 Coverage (%) | 79.3 | 43.7 -45% | 94.9 20% | 96.8 22% | 70 -12% | 73.8 -7% |
| sRGB Coverage (%) | 100 | 65.1 -35% | 100 0% | 99.9 0% | 99.5 0% | 99 -1% |
| AdobeRGB 1998 Coverage (%) | 78.7 | 45.3 -42% | 100 27% | 85.8 9% | 71.4 -9% | 75.5 -4% |
| Response Times | 11% | 8% | 8% | -7% | -19% | |
| Response Time Grey 50% / Grey 80% * (ms) | 52.4 ? | 48 ? 8% | 47.2 ? 10% | 52 ? 1% | 64.4 ? -23% | 54.8 ? -5% |
| Response Time Black / White * (ms) | 32.4 ? | 28 ? 14% | 30.4 ? 6% | 28 ? 14% | 29.2 ? 10% | 43.2 ? -33% |
| PWM Frequency (Hz) | 284.1 ? | |||||
| Screen | -116% | -24% | -19% | -10% | -27% | |
| Brightness middle (cd/m²) | 537 | 305 -43% | 501.5 -7% | 512 -5% | 461 -14% | 934 74% |
| Brightness (cd/m²) | 518 | 281 -46% | 467 -10% | 487 -6% | 439 -15% | 937 81% |
| Brightness Distribution (%) | 94 | 88 -6% | 83 -12% | 90 -4% | 89 -5% | 87 -7% |
| Black Level * (cd/m²) | 0.33 | 0.32 3% | 0.44 -33% | 0.35 -6% | 0.24 27% | 0.37 -12% |
| Contrast (:1) | 1627 | 953 -41% | 1140 -30% | 1463 -10% | 1921 18% | 2524 55% |
| Colorchecker dE 2000 * | 2.97 | 5.9 -99% | 4.73 -59% | 3.1 -4% | 2.6 12% | 4.7 -58% |
| Colorchecker dE 2000 max. * | 5.33 | 20.1 -277% | 8.45 -59% | 8.4 -58% | 5.8 -9% | 10.5 -97% |
| Colorchecker dE 2000 calibrated * | 0.88 | 4.5 -411% | 0.51 42% | 0.4 55% | 1.1 -25% | 1.6 -82% |
| Greyscale dE 2000 * | 2.4 | 5.3 -121% | 3.6 -50% | 5.5 -129% | 4.4 -83% | 7.1 -196% |
| Gamma | 2.06 107% | 2.1 105% | 2.08 106% | 2.22 99% | 2.29 96% | 2.31 95% |
| CCT | 6668 97% | 6307 103% | 6447 101% | 6373 102% | 6478 100% | 6348 102% |
| Color Space (Percent of AdobeRGB 1998) (%) | 65.2 | 68.5 | ||||
| Color Space (Percent of sRGB) (%) | 99.4 | 98.9 | ||||
| Moyenne finale (programmes/paramètres) | -49% /
-82% | 0% /
-11% | -0% /
-9% | -8% /
-9% | -17% /
-21% |
* ... Moindre est la valeur, meilleures sont les performances
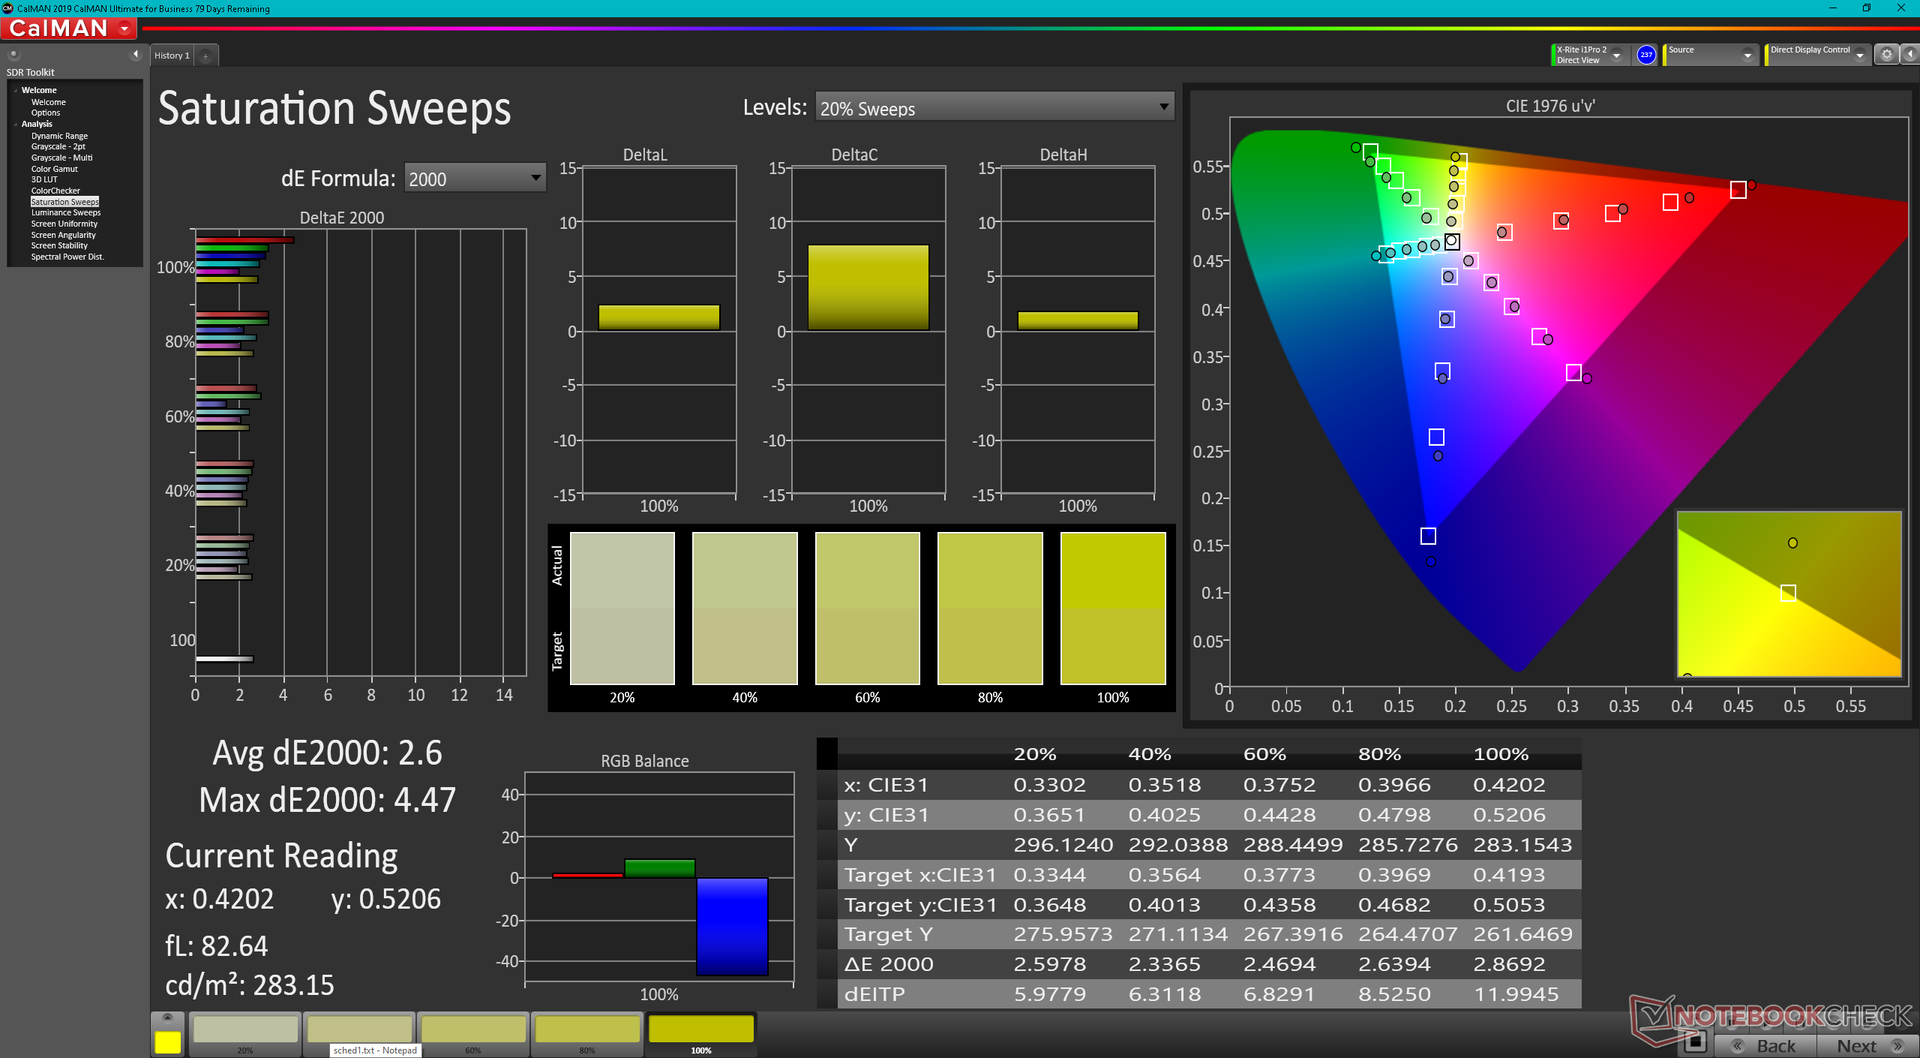
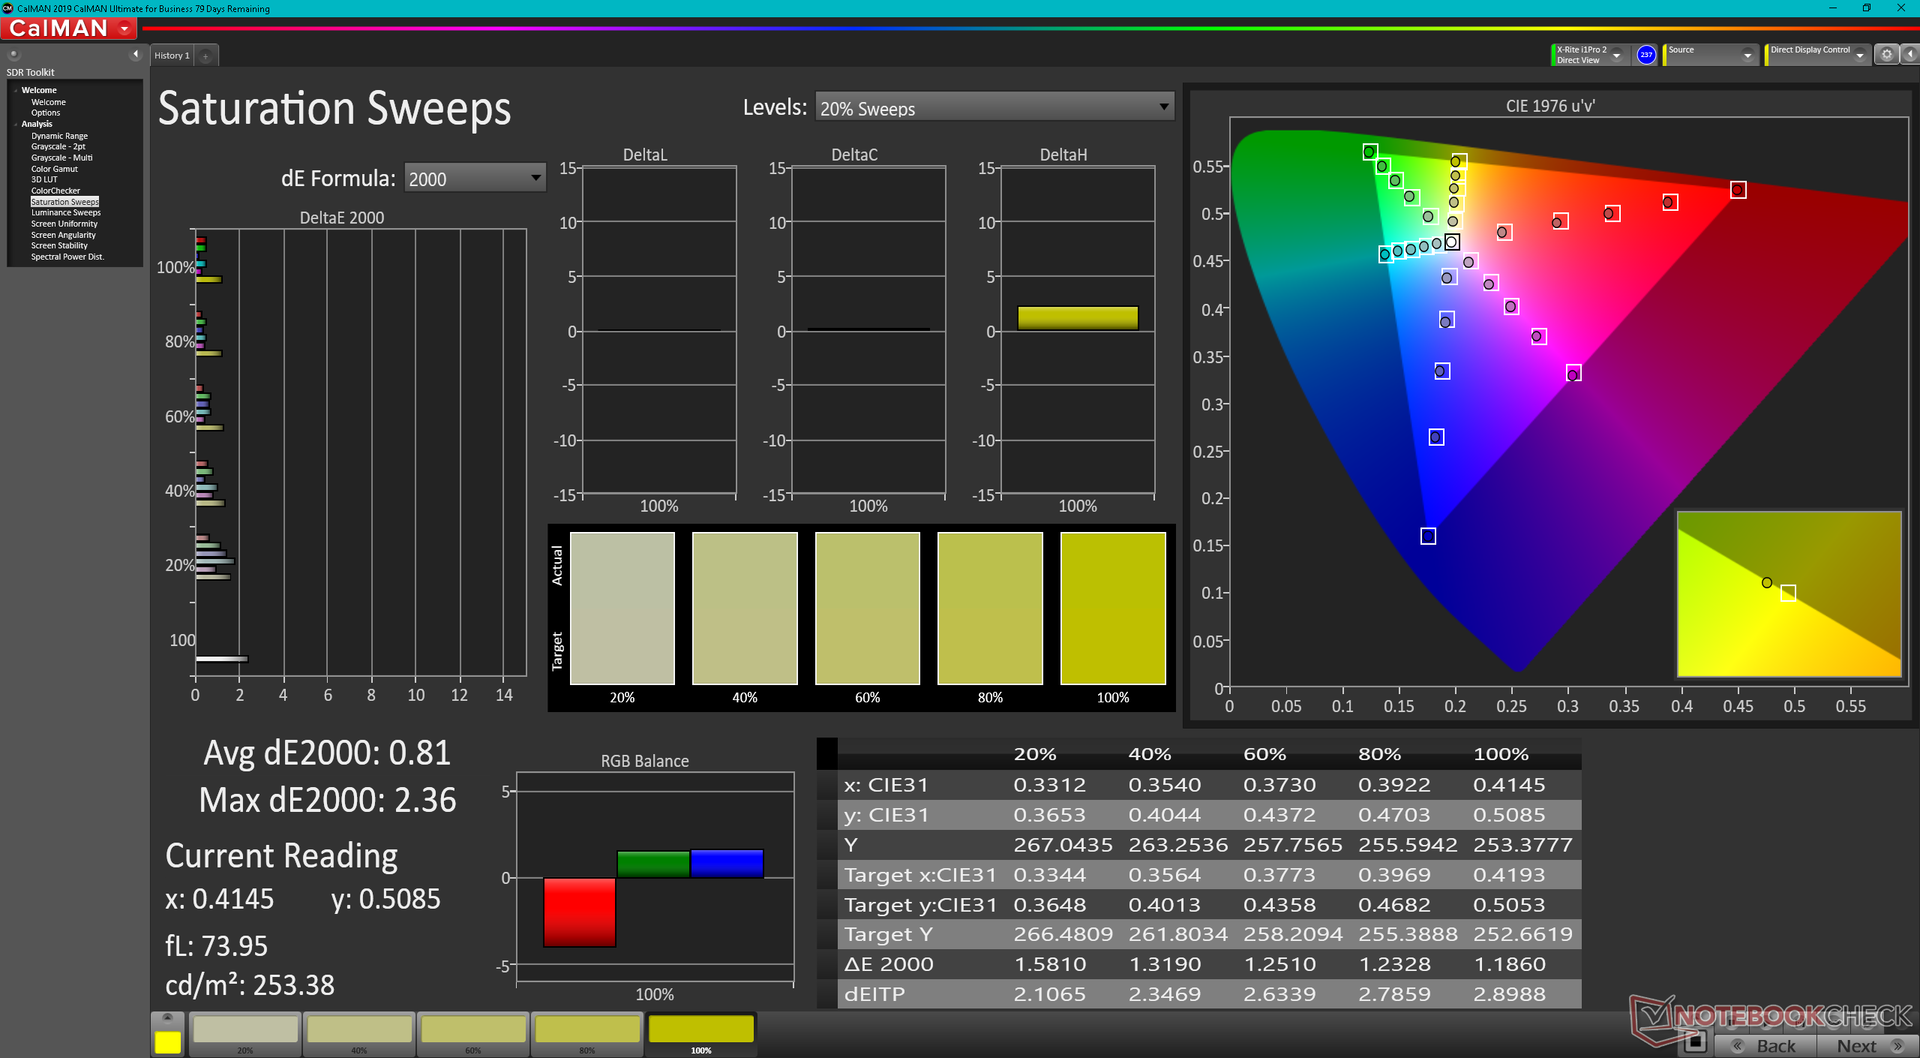
L'écran est bien calibré par rapport à la norme sRGB, avec des valeurs DeltaE moyennes pour les niveaux de gris et les couleurs de seulement 2,4 et 2,97, respectivement. Nous sommes en mesure d'améliorer ces valeurs encore plus avec notre colorimètre X-Rite à <2 chacun comme le montrent nos résultats CalMan ci-dessous.
Temps de réponse de l'écran
| ↔ Temps de réponse noir à blanc | ||
|---|---|---|
| 32.4 ms ... hausse ↗ et chute ↘ combinées | ↗ 15.6 ms hausse | 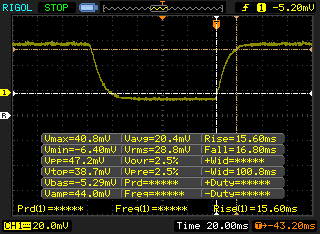 |
| ↘ 16.8 ms chute | ||
| L'écran souffre de latences très élevées, à éviter pour le jeu. En comparaison, tous les appareils testés affichent entre 0.1 (minimum) et 240 (maximum) ms. » 88 % des appareils testés affichent de meilleures performances. Cela signifie que les latences relevées sont moins bonnes que la moyenne (19.8 ms) de tous les appareils testés. | ||
| ↔ Temps de réponse gris 50% à gris 80% | ||
| 52.4 ms ... hausse ↗ et chute ↘ combinées | ↗ 24.4 ms hausse | 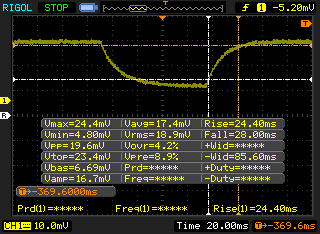 |
| ↘ 28 ms chute | ||
| L'écran souffre de latences très élevées, à éviter pour le jeu. En comparaison, tous les appareils testés affichent entre 0.165 (minimum) et 636 (maximum) ms. » 89 % des appareils testés affichent de meilleures performances. Cela signifie que les latences relevées sont moins bonnes que la moyenne (31 ms) de tous les appareils testés. | ||
Scintillement / MLI (Modulation de largeur d'impulsion)
| Scintillement / MLI (Modulation de largeur d'impulsion) non décelé | 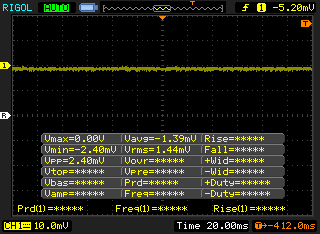 | ||
En comparaison, 52 % des appareils testés n'emploient pas MDI pour assombrir leur écran. Nous avons relevé une moyenne à 7757 (minimum : 5 - maximum : 343500) Hz dans le cas où une MDI était active. | |||
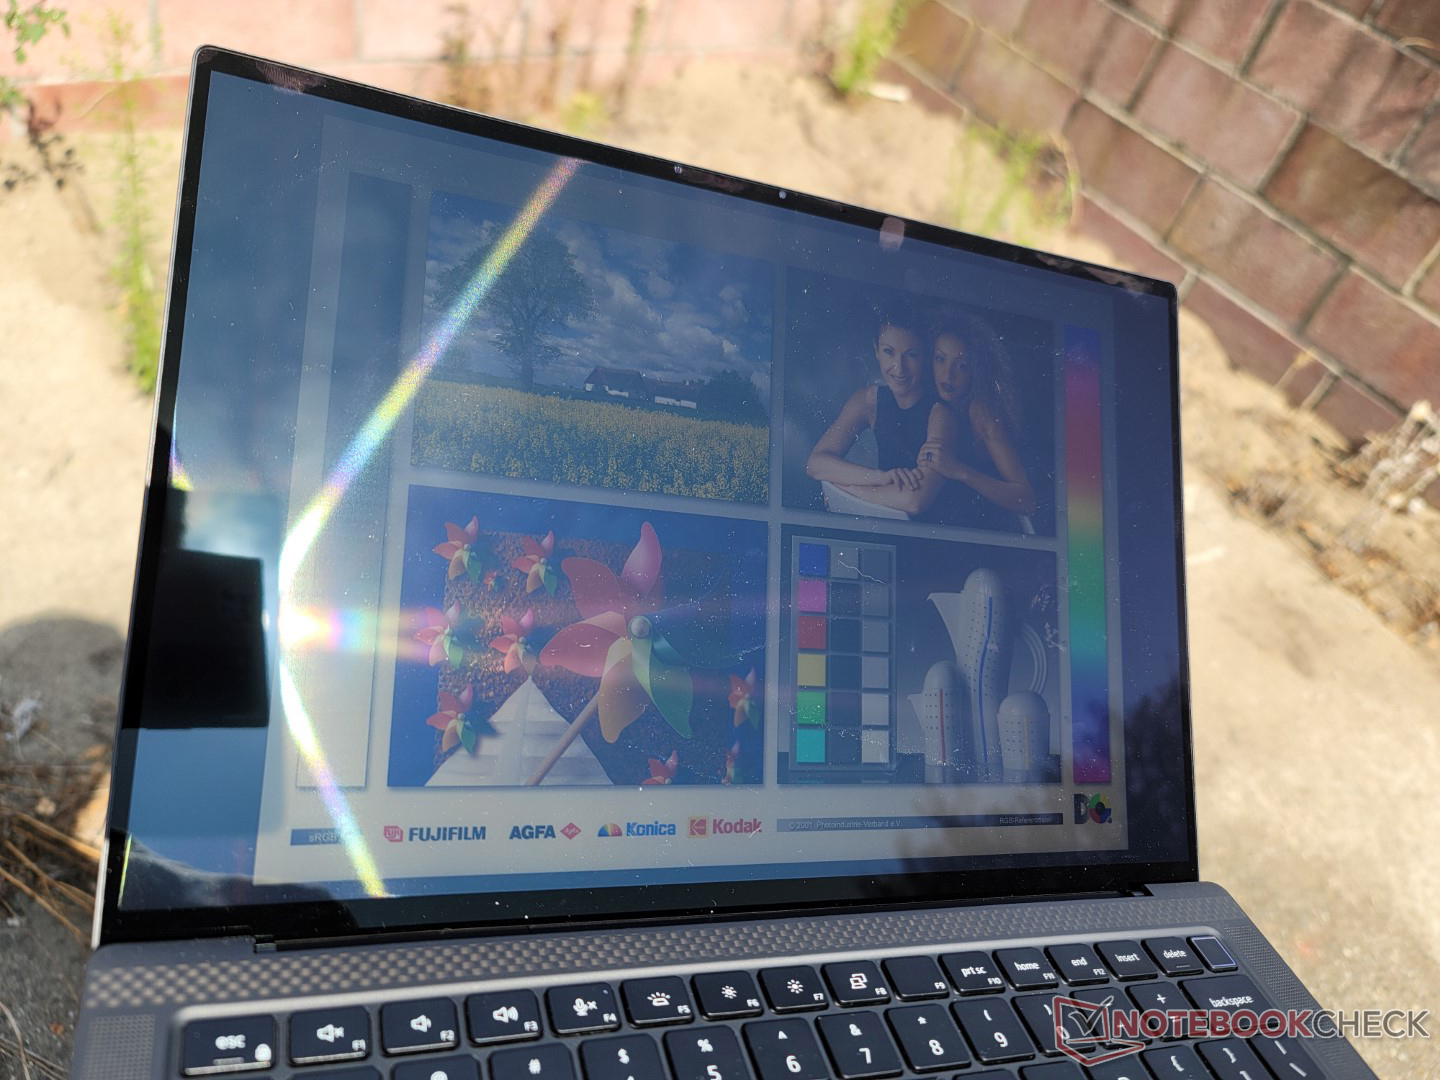
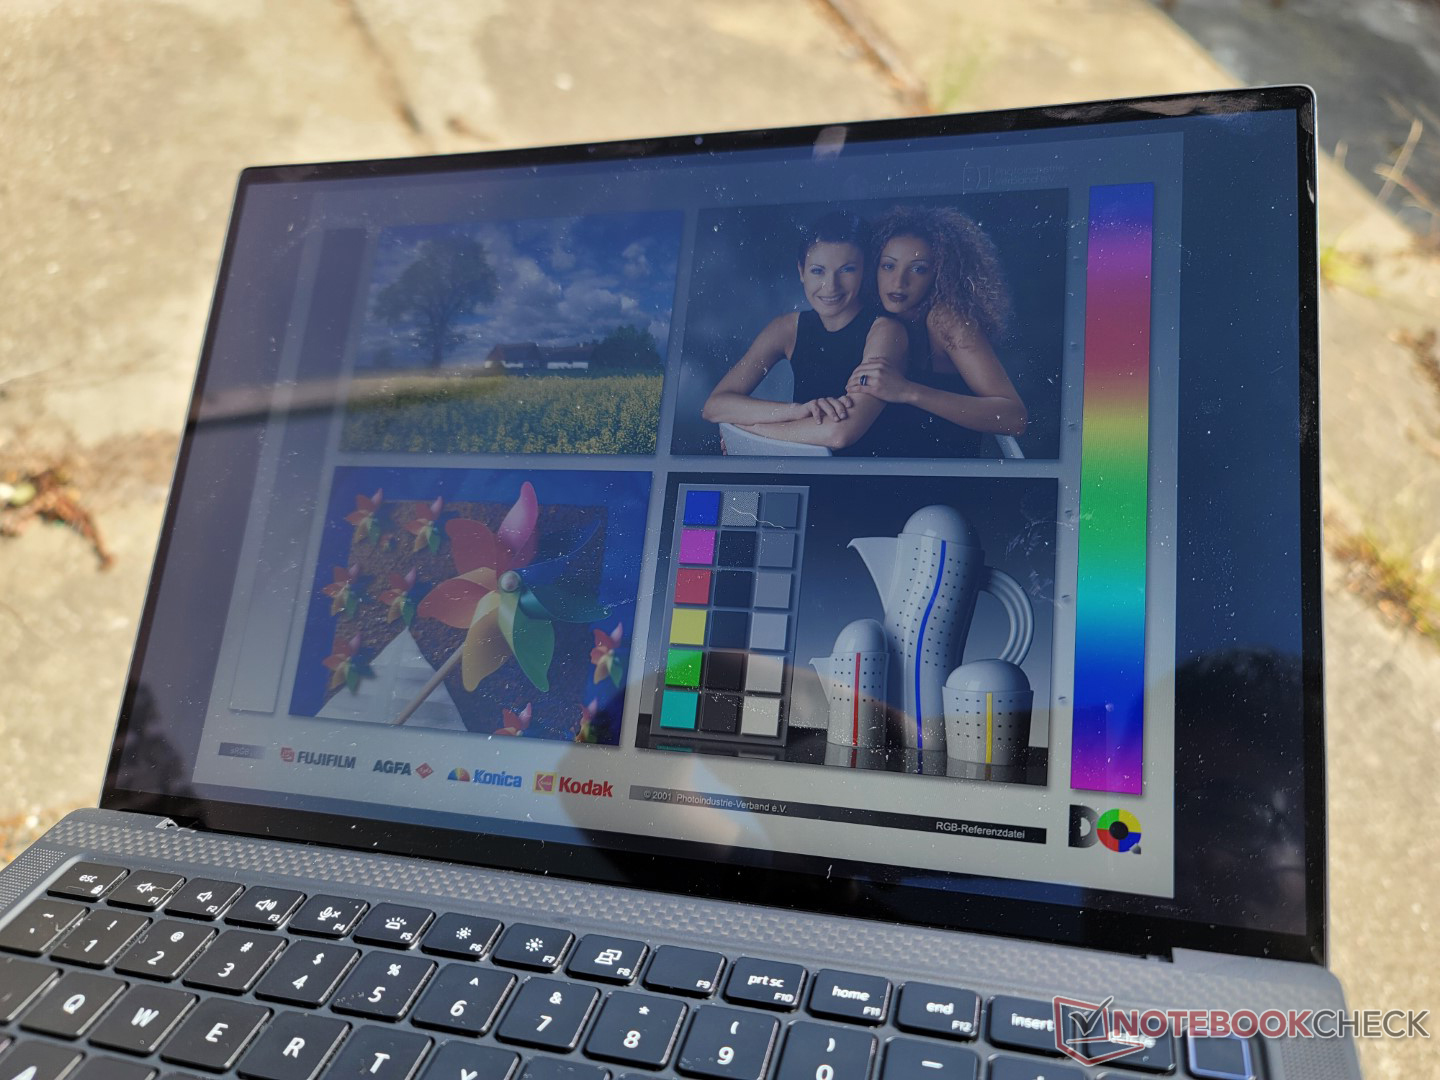
L'écran est plus lumineux que sur la plupart des Ultrabooks grand public pour une meilleure visibilité en extérieur. Néanmoins, de nombreux modèles HP EliteBook ou ZBook offrent des options d'écran de 1000 nits pour une visibilité nettement plus facile en extérieur. Dell n'a pas encore proposé d'options de luminosité similaires pour sa série Precision.
Performances - CPU Core i9 série H et GPU discret
Conditions d'essai
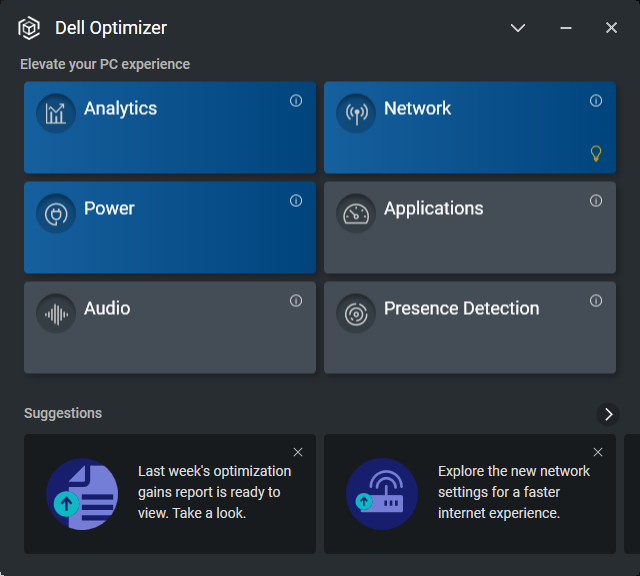
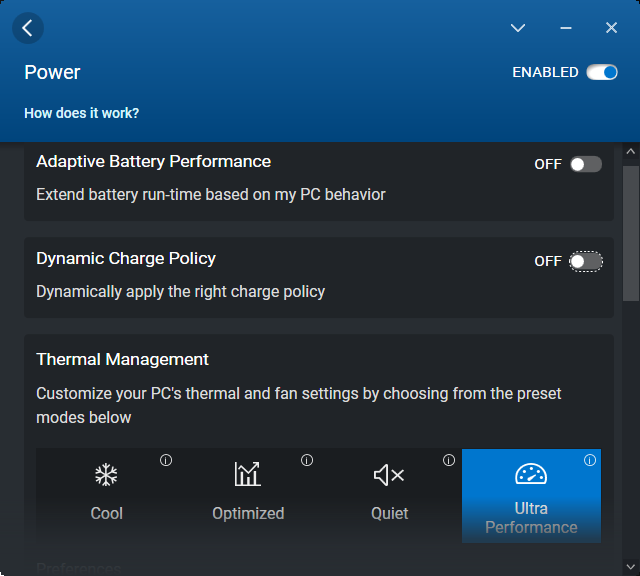
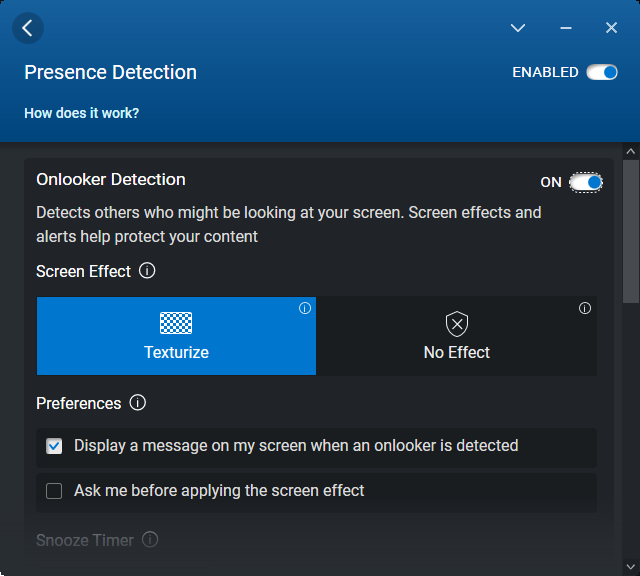
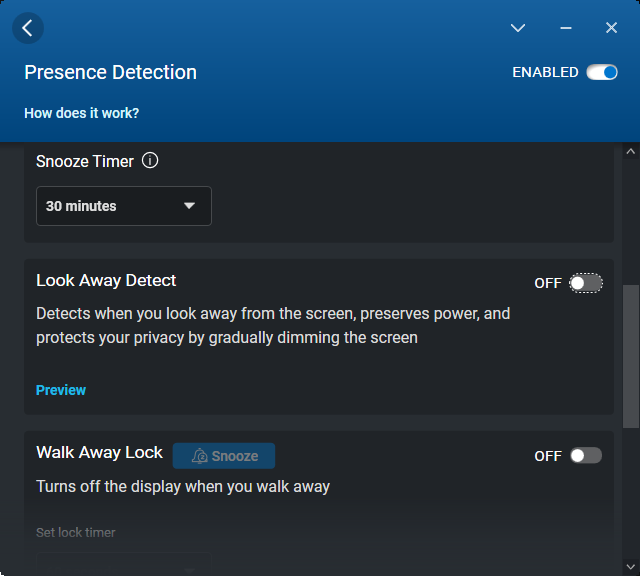
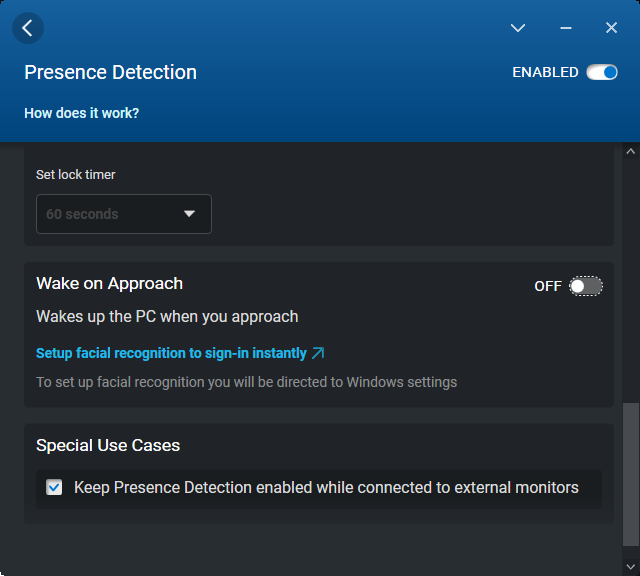
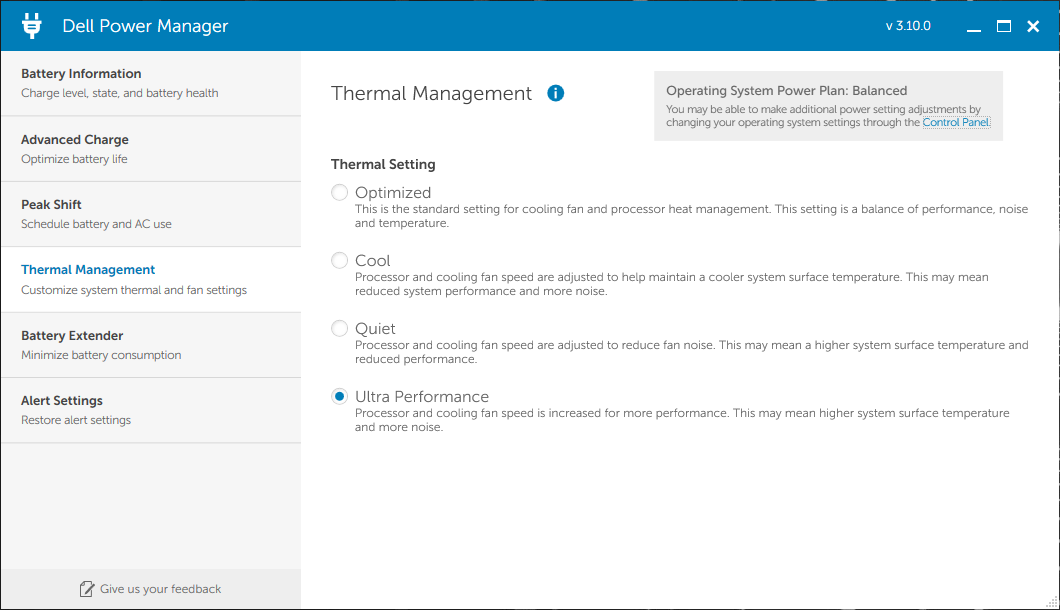
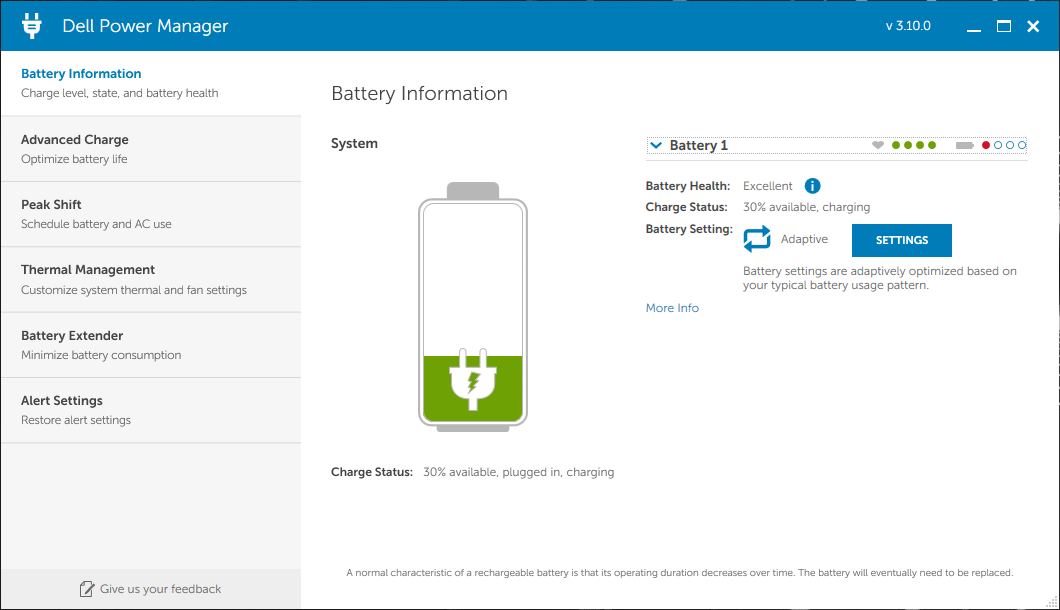
Nous avons réglé notre appareil en mode Ultra Performance via le logiciel Dell Optimizer avant d'exécuter les benchmarks ci-dessous. Nous avons également activé le GPU Nvidia discret via le panneau de configuration Nvidia. Notez que les mêmes paramètres d'alimentation peuvent être configurés via Dell Power Manager ou Dell Optimizer. Heureusement, si vous modifiez le profil d'alimentation dans un programme, les paramètres seront automatiquement modifiés dans l'autre.
Processeur
Les performances du CPU sont mitigées. Comparé à d'autres ordinateurs portables professionnels ou stations de travail de 14 pouces, le Precision 5470 offre des performances nettement plus rapides pour être à égalité avec des stations de travail encore plus grandes comme le MSI WE76 ou HP ZBook Fury 17 G8. Il s'agit essentiellement d'un processeur conçu pour les ordinateurs portables plus épais, compactés dans un format de 14 pouces. Lorsqu'on le compare à d'autres ordinateurs portables avec le même Core i9-12900H Cependant, le processeur de notre Precision est plus lent d'environ 15 à 20 % en moyenne.
Un autre inconvénient du processeur est sa fréquence d'horloge instable. Lors de l'exécution de CineBench R15 xT en boucle, par exemple, les scores fluctuent entre 1500 et 2100 points, comme le montre notre graphique ci-dessous, ce qui suggère une fluctuation de la fréquence d'horloge. En comparaison, aucune fluctuation de ce type ne se produit lors de l'exécution du même test sur le HP ZBook Fury 17 G8 ou le MSI Creator Z17, tous deux équipés de CPU de classe Core i9.
Cinebench R15 Multi Loop
Cinebench R23: Multi Core | Single Core
Cinebench R15: CPU Multi 64Bit | CPU Single 64Bit
Blender: v2.79 BMW27 CPU
7-Zip 18.03: 7z b 4 | 7z b 4 -mmt1
Geekbench 5.5: Multi-Core | Single-Core
HWBOT x265 Benchmark v2.2: 4k Preset
LibreOffice : 20 Documents To PDF
R Benchmark 2.5: Overall mean
Cinebench R23: Multi Core | Single Core
Cinebench R15: CPU Multi 64Bit | CPU Single 64Bit
Blender: v2.79 BMW27 CPU
7-Zip 18.03: 7z b 4 | 7z b 4 -mmt1
Geekbench 5.5: Multi-Core | Single-Core
HWBOT x265 Benchmark v2.2: 4k Preset
LibreOffice : 20 Documents To PDF
R Benchmark 2.5: Overall mean
* ... Moindre est la valeur, meilleures sont les performances
AIDA64: FP32 Ray-Trace | FPU Julia | CPU SHA3 | CPU Queen | FPU SinJulia | FPU Mandel | CPU AES | CPU ZLib | FP64 Ray-Trace | CPU PhotoWorxx
| Performance rating | |
| Moyenne Intel Core i9-12900H | |
| Dell Precision 5000 5470 | |
| Lenovo ThinkPad P14s G2 AMD | |
| Lenovo ThinkPad P15v G2 21A9000XGE | |
| HP ZBook Firefly 14 G8 2C9Q2EA | |
| HP ZBook Firefly 14 G7 | |
| AIDA64 / FP32 Ray-Trace | |
| Dell Precision 5000 5470 | |
| Lenovo ThinkPad P15v G2 21A9000XGE | |
| Moyenne Intel Core i9-12900H (4074 - 18289, n=29) | |
| Lenovo ThinkPad P14s G2 AMD | |
| HP ZBook Firefly 14 G8 2C9Q2EA | |
| HP ZBook Firefly 14 G7 | |
| AIDA64 / FPU Julia | |
| Lenovo ThinkPad P14s G2 AMD | |
| Dell Precision 5000 5470 | |
| Moyenne Intel Core i9-12900H (22307 - 93236, n=29) | |
| Lenovo ThinkPad P15v G2 21A9000XGE | |
| HP ZBook Firefly 14 G8 2C9Q2EA | |
| HP ZBook Firefly 14 G7 | |
| AIDA64 / CPU SHA3 | |
| Lenovo ThinkPad P15v G2 21A9000XGE | |
| Moyenne Intel Core i9-12900H (1378 - 4215, n=29) | |
| Dell Precision 5000 5470 | |
| Lenovo ThinkPad P14s G2 AMD | |
| HP ZBook Firefly 14 G8 2C9Q2EA | |
| HP ZBook Firefly 14 G7 | |
| AIDA64 / CPU Queen | |
| Dell Precision 5000 5470 | |
| Moyenne Intel Core i9-12900H (78172 - 111241, n=28) | |
| Lenovo ThinkPad P15v G2 21A9000XGE | |
| Lenovo ThinkPad P14s G2 AMD | |
| HP ZBook Firefly 14 G7 | |
| HP ZBook Firefly 14 G8 2C9Q2EA | |
| AIDA64 / FPU SinJulia | |
| Lenovo ThinkPad P14s G2 AMD | |
| Moyenne Intel Core i9-12900H (5709 - 10410, n=29) | |
| Lenovo ThinkPad P15v G2 21A9000XGE | |
| Dell Precision 5000 5470 | |
| HP ZBook Firefly 14 G8 2C9Q2EA | |
| HP ZBook Firefly 14 G7 | |
| AIDA64 / FPU Mandel | |
| Lenovo ThinkPad P14s G2 AMD | |
| Dell Precision 5000 5470 | |
| Lenovo ThinkPad P15v G2 21A9000XGE | |
| Moyenne Intel Core i9-12900H (11257 - 45581, n=29) | |
| HP ZBook Firefly 14 G8 2C9Q2EA | |
| HP ZBook Firefly 14 G7 | |
| AIDA64 / CPU AES | |
| Lenovo ThinkPad P14s G2 AMD | |
| Moyenne Intel Core i9-12900H (31935 - 151546, n=29) | |
| Lenovo ThinkPad P15v G2 21A9000XGE | |
| HP ZBook Firefly 14 G8 2C9Q2EA | |
| Dell Precision 5000 5470 | |
| HP ZBook Firefly 14 G7 | |
| AIDA64 / CPU ZLib | |
| Moyenne Intel Core i9-12900H (449 - 1193, n=29) | |
| Lenovo ThinkPad P15v G2 21A9000XGE | |
| Lenovo ThinkPad P14s G2 AMD | |
| Dell Precision 5000 5470 | |
| HP ZBook Firefly 14 G8 2C9Q2EA | |
| HP ZBook Firefly 14 G7 | |
| AIDA64 / FP64 Ray-Trace | |
| Dell Precision 5000 5470 | |
| Lenovo ThinkPad P15v G2 21A9000XGE | |
| Moyenne Intel Core i9-12900H (2235 - 10511, n=29) | |
| Lenovo ThinkPad P14s G2 AMD | |
| HP ZBook Firefly 14 G8 2C9Q2EA | |
| HP ZBook Firefly 14 G7 | |
| AIDA64 / CPU PhotoWorxx | |
| Dell Precision 5000 5470 | |
| Moyenne Intel Core i9-12900H (20960 - 48269, n=30) | |
| HP ZBook Firefly 14 G8 2C9Q2EA | |
| HP ZBook Firefly 14 G7 | |
| Lenovo ThinkPad P14s G2 AMD | |
| Lenovo ThinkPad P15v G2 21A9000XGE | |
Performance du système
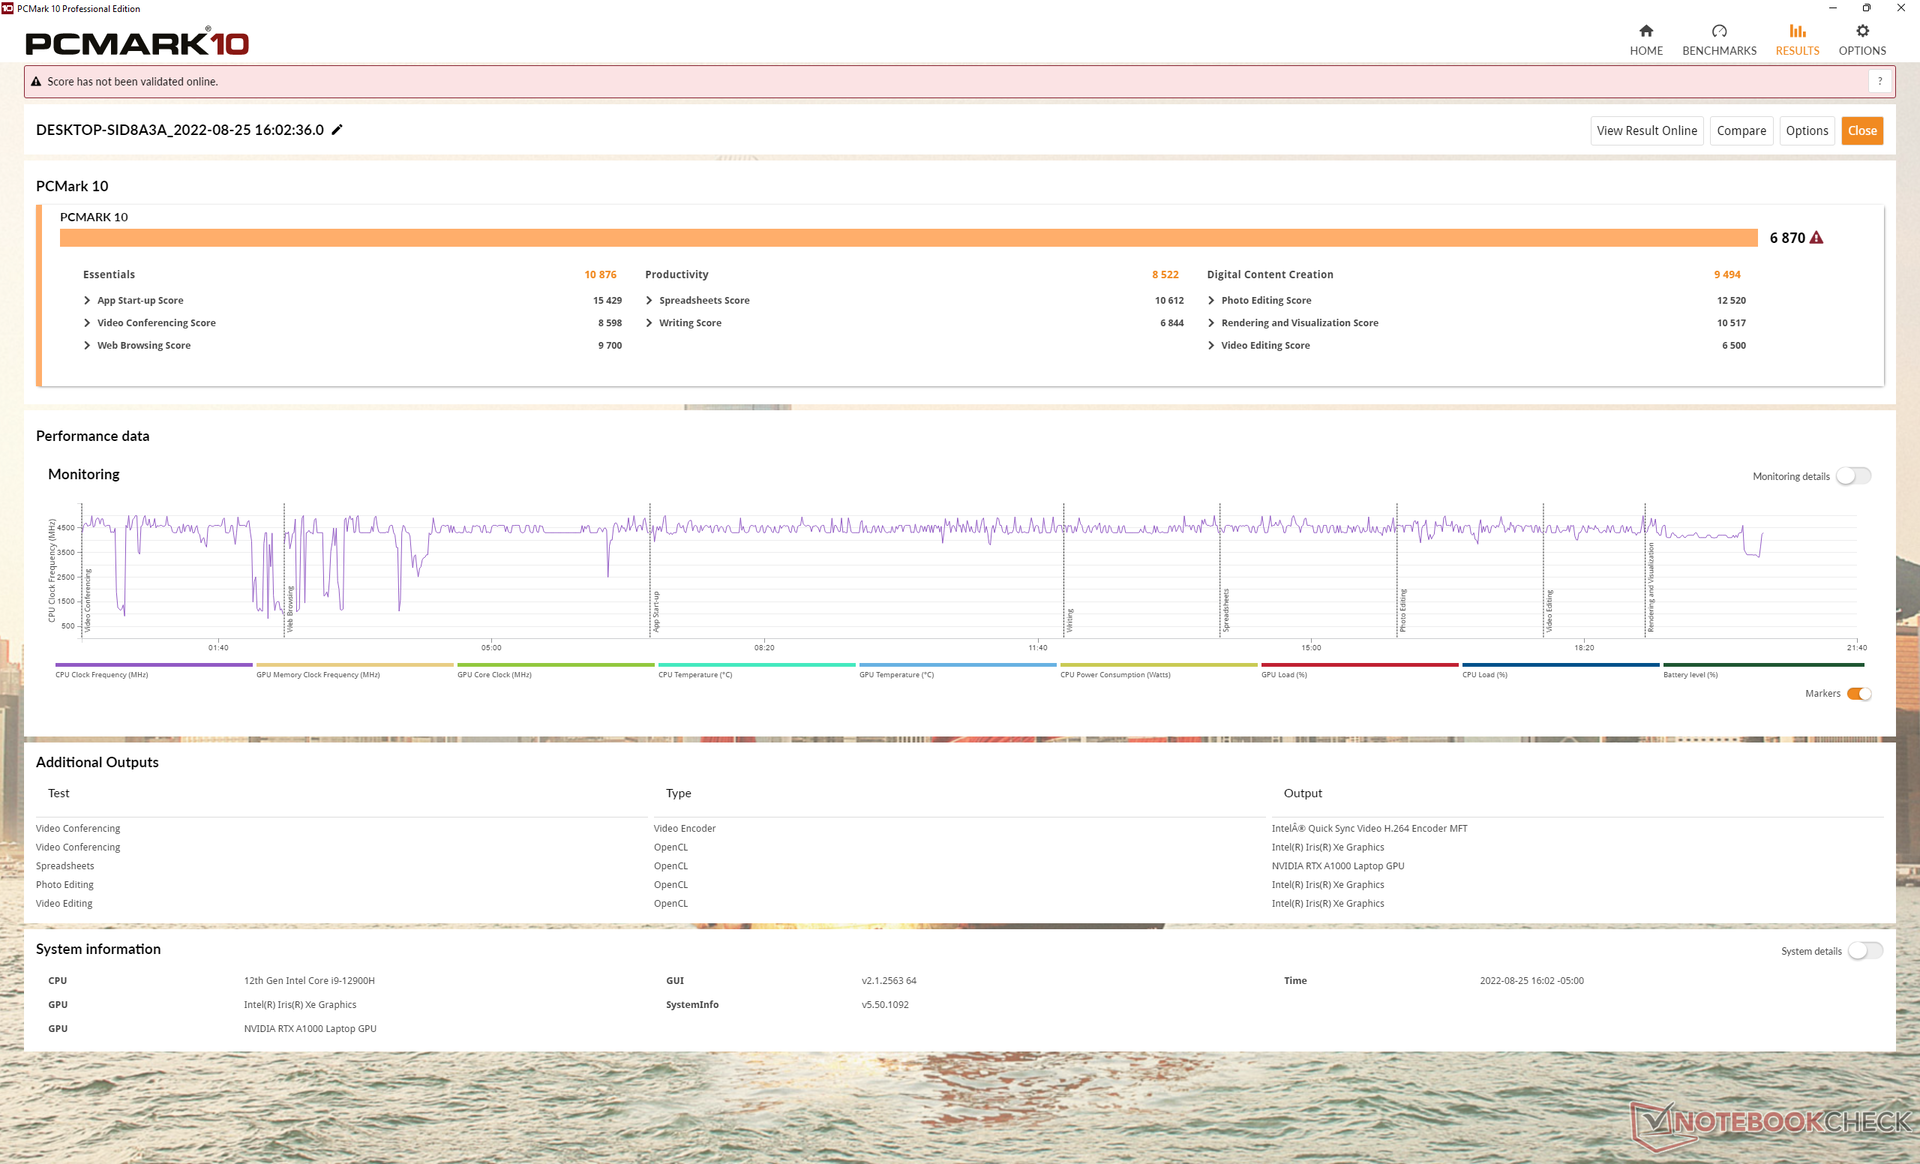
Les résultats de PCMark 10 sont plus élevés que prévu par rapport aux autres stations de travail mobiles. Nous attribuons cela au CPU Core i9 série H de 12e génération et au SSD PCIe4 x4, qui sont des options relativement peu courantes pour une station de travail de 14 pouces.
CrossMark: Overall | Productivity | Creativity | Responsiveness
| PCMark 10 / Score | |
| Dell Precision 5000 5470 | |
| Moyenne Intel Core i9-12900H, NVIDIA RTX A1000 Laptop GPU (n=1) | |
| Dell Precision 5000 5560 | |
| Lenovo ThinkPad P15v G2 21A9000XGE | |
| Lenovo ThinkPad P14s G2 AMD | |
| HP ZBook Firefly 14 G8 2C9Q2EA | |
| HP ZBook Firefly 14 G7 | |
| PCMark 10 / Essentials | |
| Dell Precision 5000 5470 | |
| Moyenne Intel Core i9-12900H, NVIDIA RTX A1000 Laptop GPU (n=1) | |
| Dell Precision 5000 5560 | |
| Lenovo ThinkPad P15v G2 21A9000XGE | |
| Lenovo ThinkPad P14s G2 AMD | |
| HP ZBook Firefly 14 G8 2C9Q2EA | |
| HP ZBook Firefly 14 G7 | |
| PCMark 10 / Productivity | |
| Dell Precision 5000 5560 | |
| Lenovo ThinkPad P14s G2 AMD | |
| Dell Precision 5000 5470 | |
| Moyenne Intel Core i9-12900H, NVIDIA RTX A1000 Laptop GPU (n=1) | |
| HP ZBook Firefly 14 G8 2C9Q2EA | |
| Lenovo ThinkPad P15v G2 21A9000XGE | |
| HP ZBook Firefly 14 G7 | |
| PCMark 10 / Digital Content Creation | |
| Dell Precision 5000 5470 | |
| Moyenne Intel Core i9-12900H, NVIDIA RTX A1000 Laptop GPU (n=1) | |
| Dell Precision 5000 5560 | |
| Lenovo ThinkPad P15v G2 21A9000XGE | |
| Lenovo ThinkPad P14s G2 AMD | |
| HP ZBook Firefly 14 G8 2C9Q2EA | |
| HP ZBook Firefly 14 G7 | |
| CrossMark / Overall | |
| Dell Precision 5000 5470 | |
| Moyenne Intel Core i9-12900H, NVIDIA RTX A1000 Laptop GPU (n=1) | |
| Lenovo ThinkPad P15v G2 21A9000XGE | |
| CrossMark / Productivity | |
| Dell Precision 5000 5470 | |
| Moyenne Intel Core i9-12900H, NVIDIA RTX A1000 Laptop GPU (n=1) | |
| Lenovo ThinkPad P15v G2 21A9000XGE | |
| CrossMark / Creativity | |
| Dell Precision 5000 5470 | |
| Moyenne Intel Core i9-12900H, NVIDIA RTX A1000 Laptop GPU (n=1) | |
| Lenovo ThinkPad P15v G2 21A9000XGE | |
| CrossMark / Responsiveness | |
| Dell Precision 5000 5470 | |
| Moyenne Intel Core i9-12900H, NVIDIA RTX A1000 Laptop GPU (n=1) | |
| Lenovo ThinkPad P15v G2 21A9000XGE | |
| PCMark 10 Score | 6870 points | |
Aide | ||
| AIDA64 / Memory Copy | |
| Dell Precision 5000 5470 | |
| Moyenne Intel Core i9-12900H (34438 - 74264, n=29) | |
| Lenovo ThinkPad P14s G2 AMD | |
| HP ZBook Firefly 14 G8 2C9Q2EA | |
| HP ZBook Firefly 14 G7 | |
| Lenovo ThinkPad P15v G2 21A9000XGE | |
| AIDA64 / Memory Read | |
| Dell Precision 5000 5470 | |
| Moyenne Intel Core i9-12900H (36365 - 74642, n=29) | |
| Lenovo ThinkPad P14s G2 AMD | |
| HP ZBook Firefly 14 G8 2C9Q2EA | |
| HP ZBook Firefly 14 G7 | |
| Lenovo ThinkPad P15v G2 21A9000XGE | |
| AIDA64 / Memory Write | |
| Dell Precision 5000 5470 | |
| Moyenne Intel Core i9-12900H (32276 - 67858, n=29) | |
| HP ZBook Firefly 14 G8 2C9Q2EA | |
| Lenovo ThinkPad P14s G2 AMD | |
| HP ZBook Firefly 14 G7 | |
| Lenovo ThinkPad P15v G2 21A9000XGE | |
| AIDA64 / Memory Latency | |
| Dell Precision 5000 5470 | |
| Lenovo ThinkPad P14s G2 AMD | |
| Lenovo ThinkPad P15v G2 21A9000XGE | |
| Moyenne Intel Core i9-12900H (74.7 - 118.1, n=28) | |
| HP ZBook Firefly 14 G7 | |
| HP ZBook Firefly 14 G8 2C9Q2EA | |
* ... Moindre est la valeur, meilleures sont les performances
Latence DPC
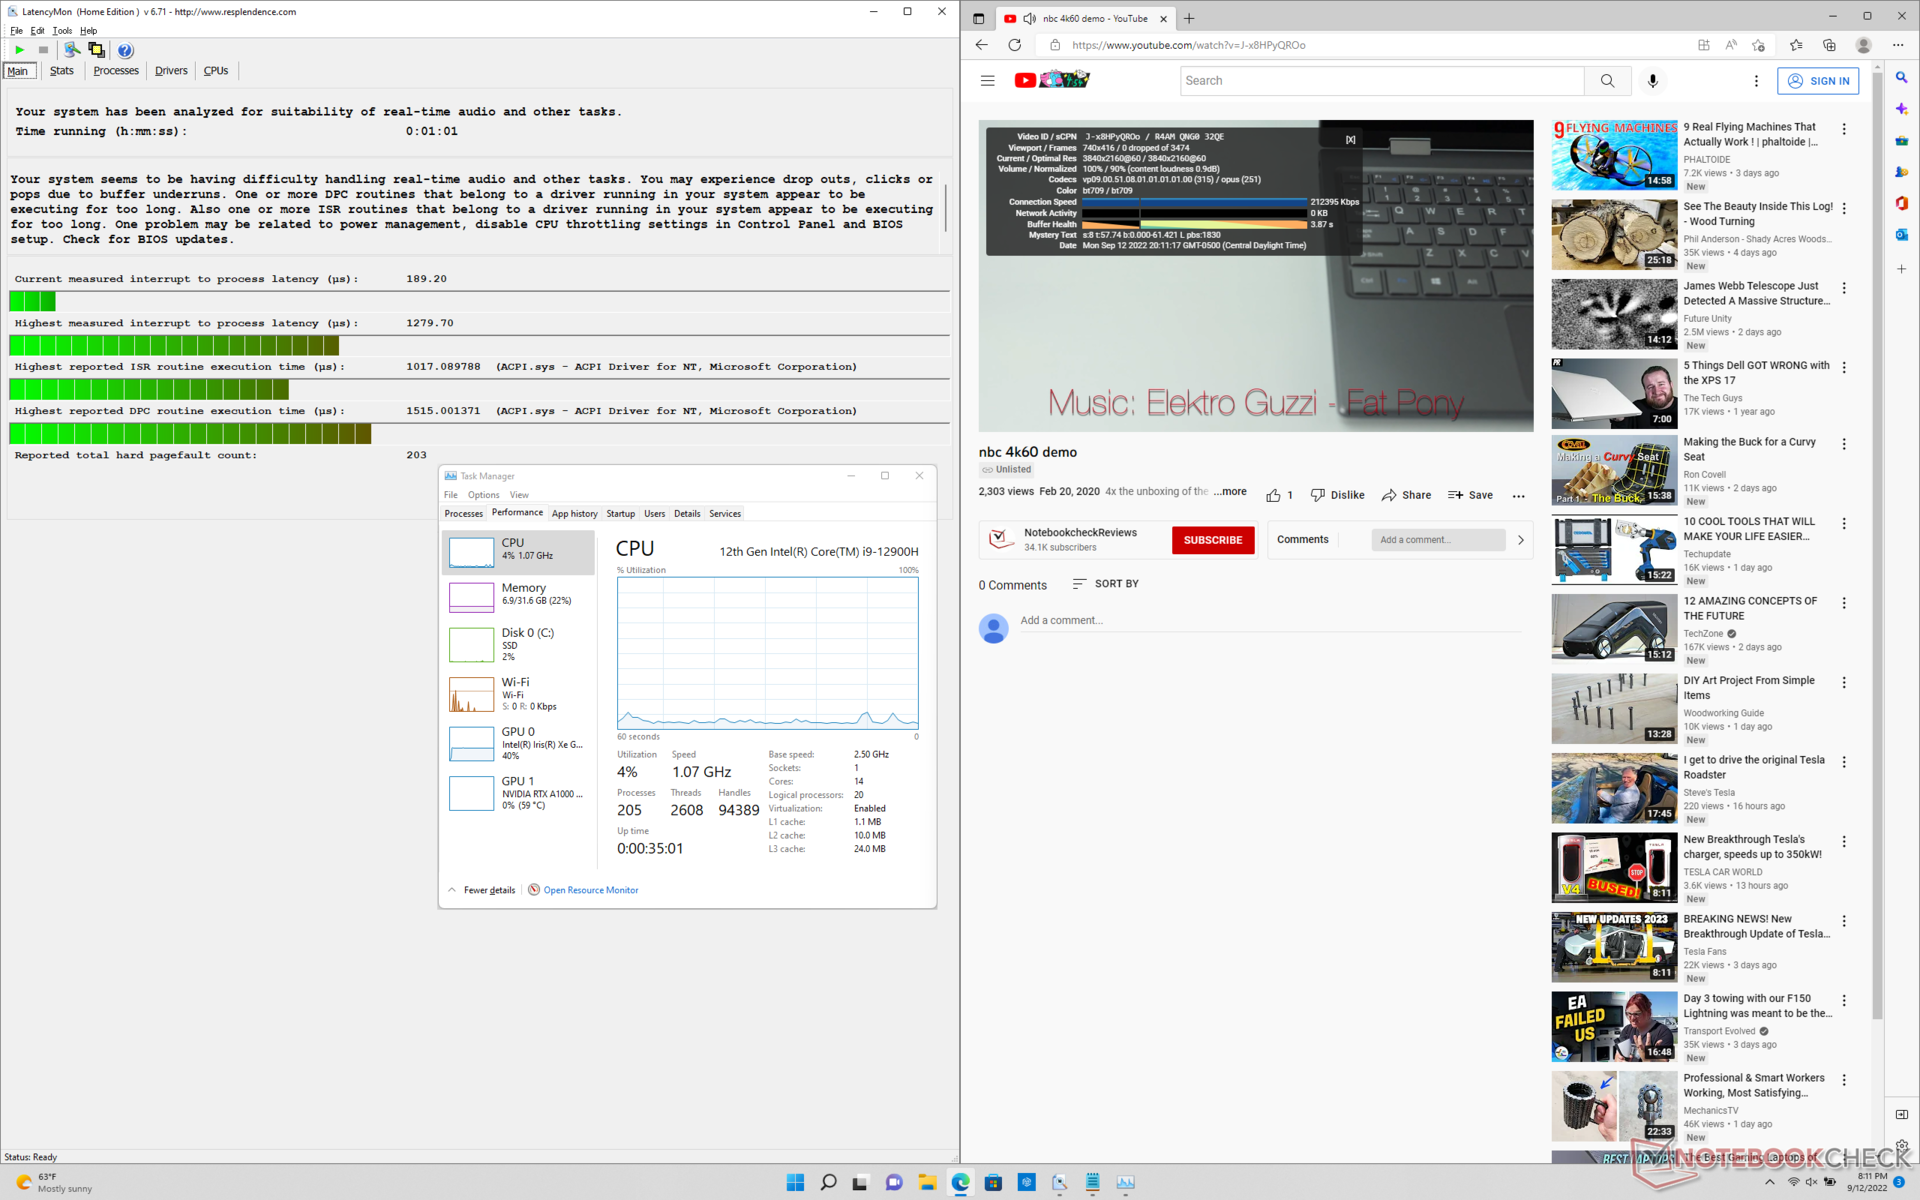
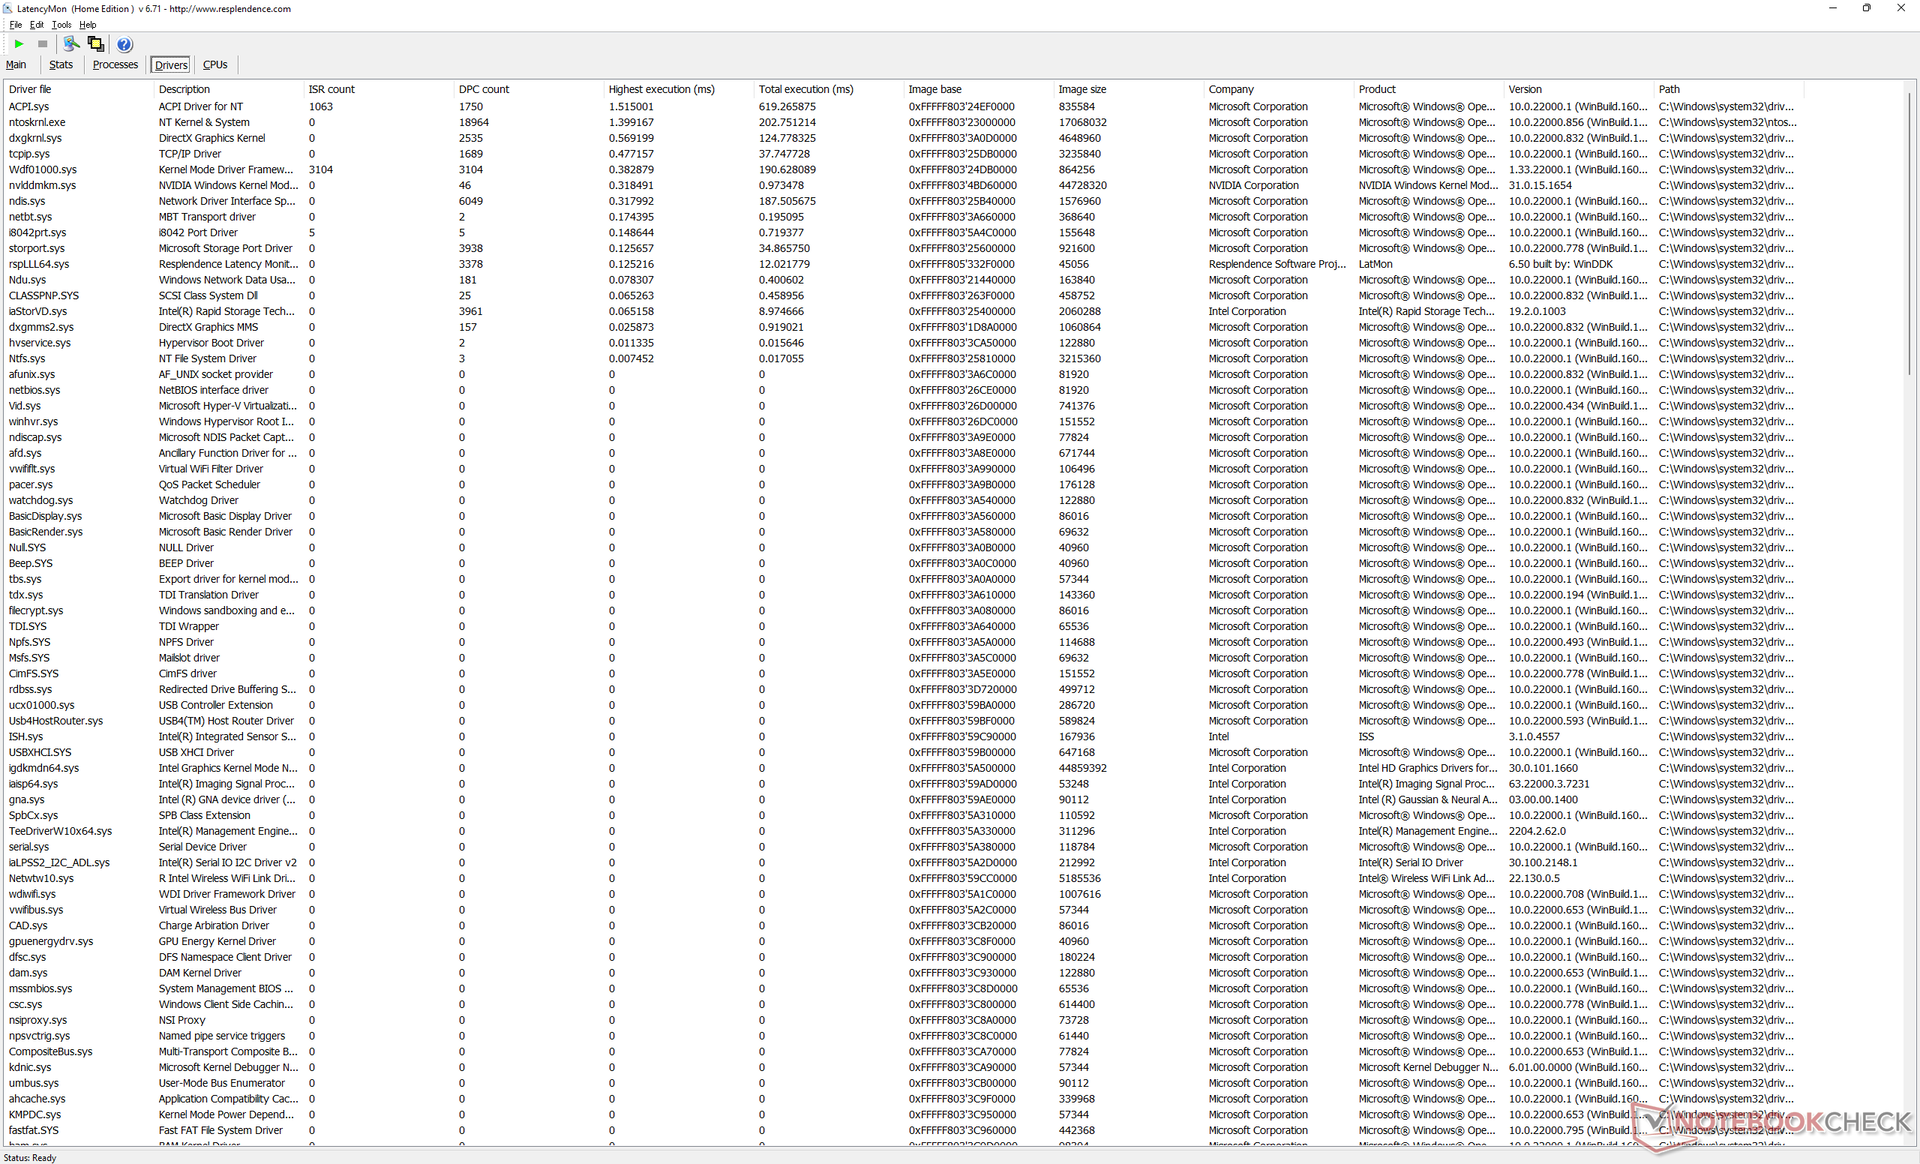
LatencyMon révèle de légers problèmes de DPC lors de l'ouverture de plusieurs onglets de navigateur sur notre page d'accueil, ce qui est un peu décevant à voir sur une station de travail. la lecture 4K à 60 FPS est sinon parfaite, sans aucune perte d'images pendant notre test vidéo d'une minute.
| DPC Latencies / LatencyMon - interrupt to process latency (max), Web, Youtube, Prime95 | |
| Lenovo ThinkPad P15v G2 21A9000XGE | |
| HP ZBook Firefly 14 G8 2C9Q2EA | |
| Lenovo ThinkPad P14s G2 AMD | |
| HP ZBook Firefly 14 G7 | |
| Dell Precision 5000 5470 | |
| Dell Precision 5000 5560 | |
* ... Moindre est la valeur, meilleures sont les performances
Périphériques de stockage
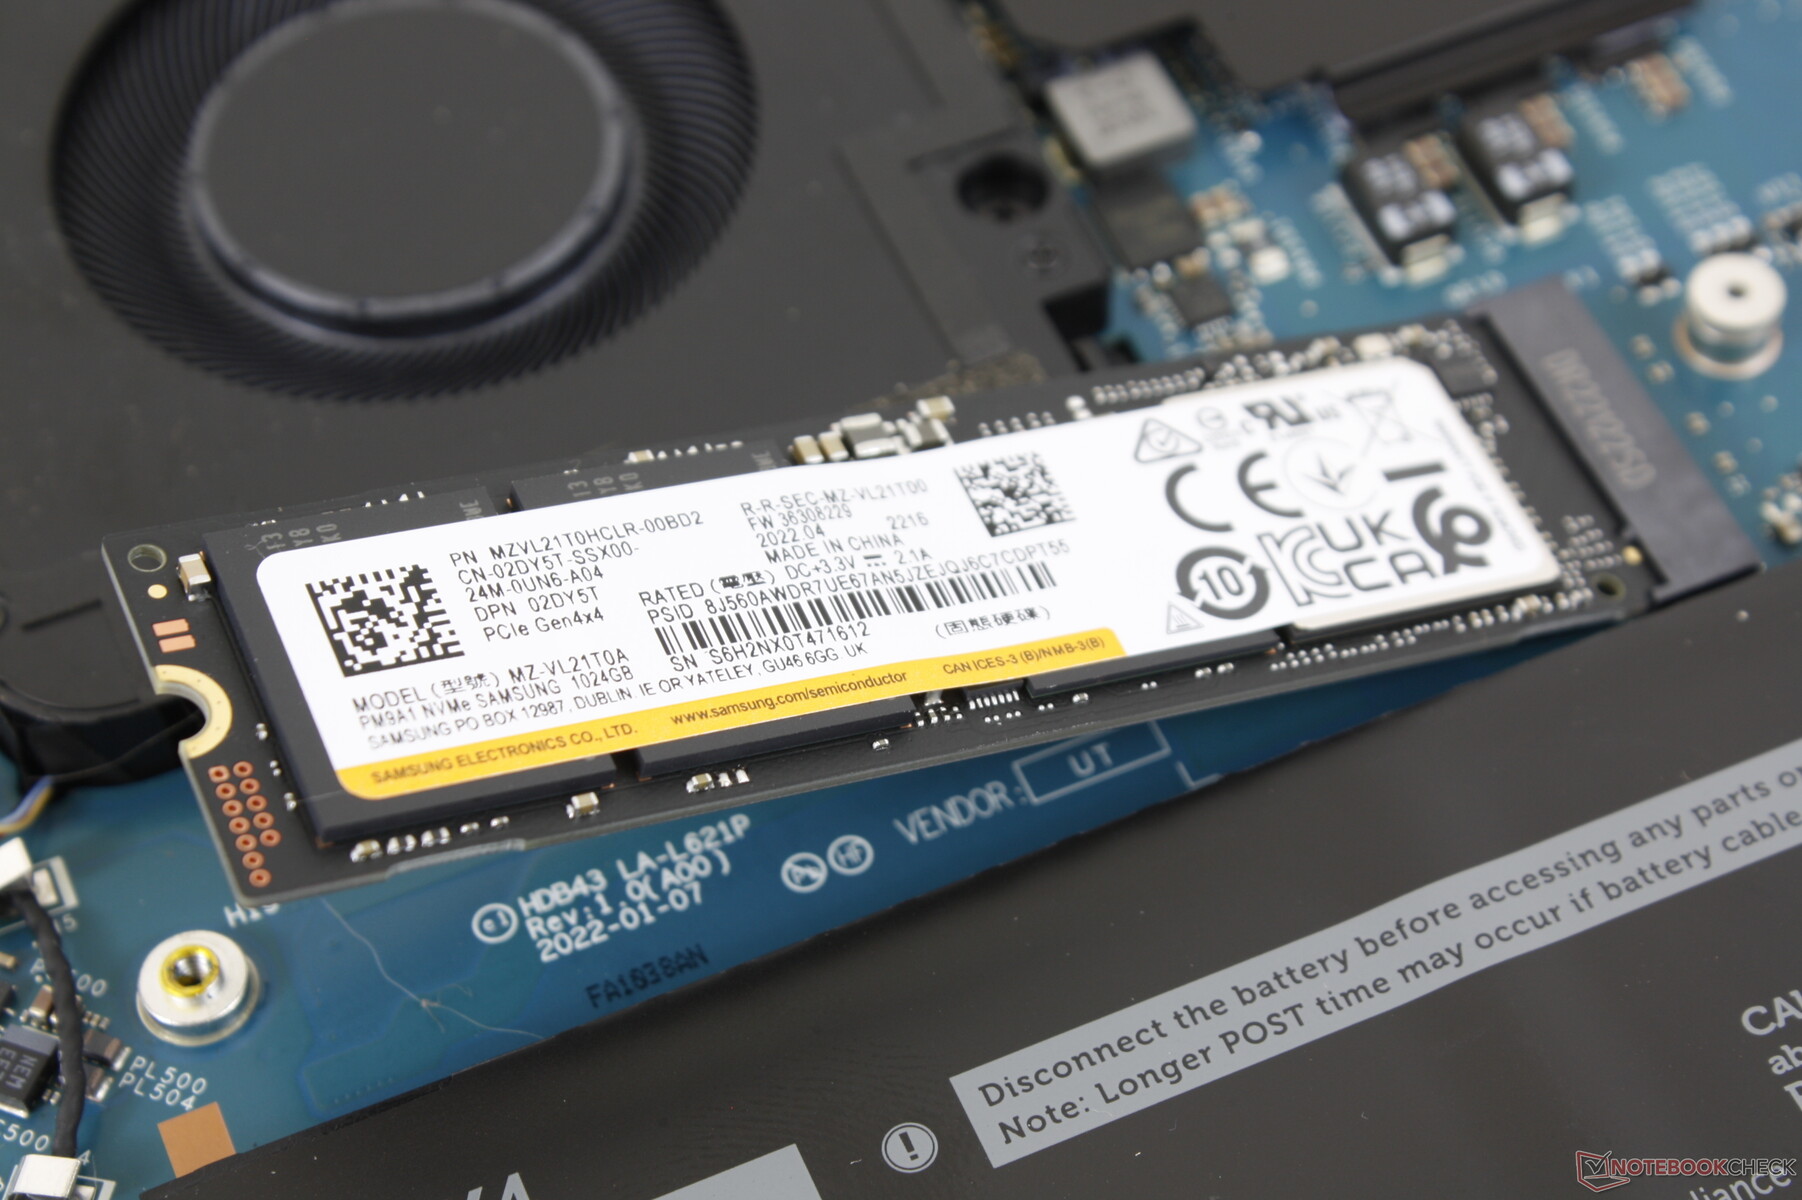
Dell propose des options de stockage PCIe3 ou PCIe4 de 256 Go à 4 To avec auto-cryptage en option. L'option PCIe4 Samsung PM9A1 de notre unité de test comprend son propre dissipateur thermique en cuivre pour de meilleures performances durables que sur les ordinateurs portables sans dissipateur thermique SSD, comme le modèle Latitude 7330.

| Drive Performance rating - Percent | |
| Dell Precision 5000 5560 | |
| Dell Precision 5000 5470 | |
| Lenovo ThinkPad P14s G2 AMD | |
| HP ZBook Firefly 14 G8 2C9Q2EA | |
| HP ZBook Firefly 14 G7 | |
| Lenovo ThinkPad P15v G2 21A9000XGE | |
* ... Moindre est la valeur, meilleures sont les performances
Disk Throttling: DiskSpd Read Loop, Queue Depth 8
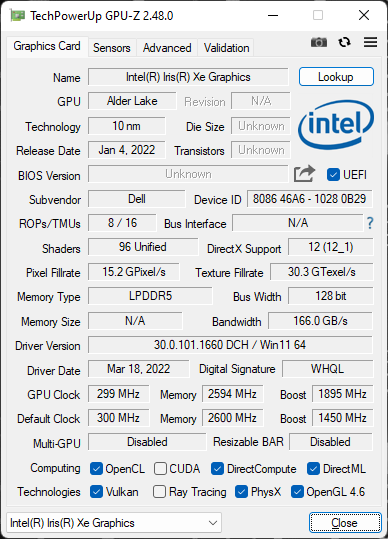
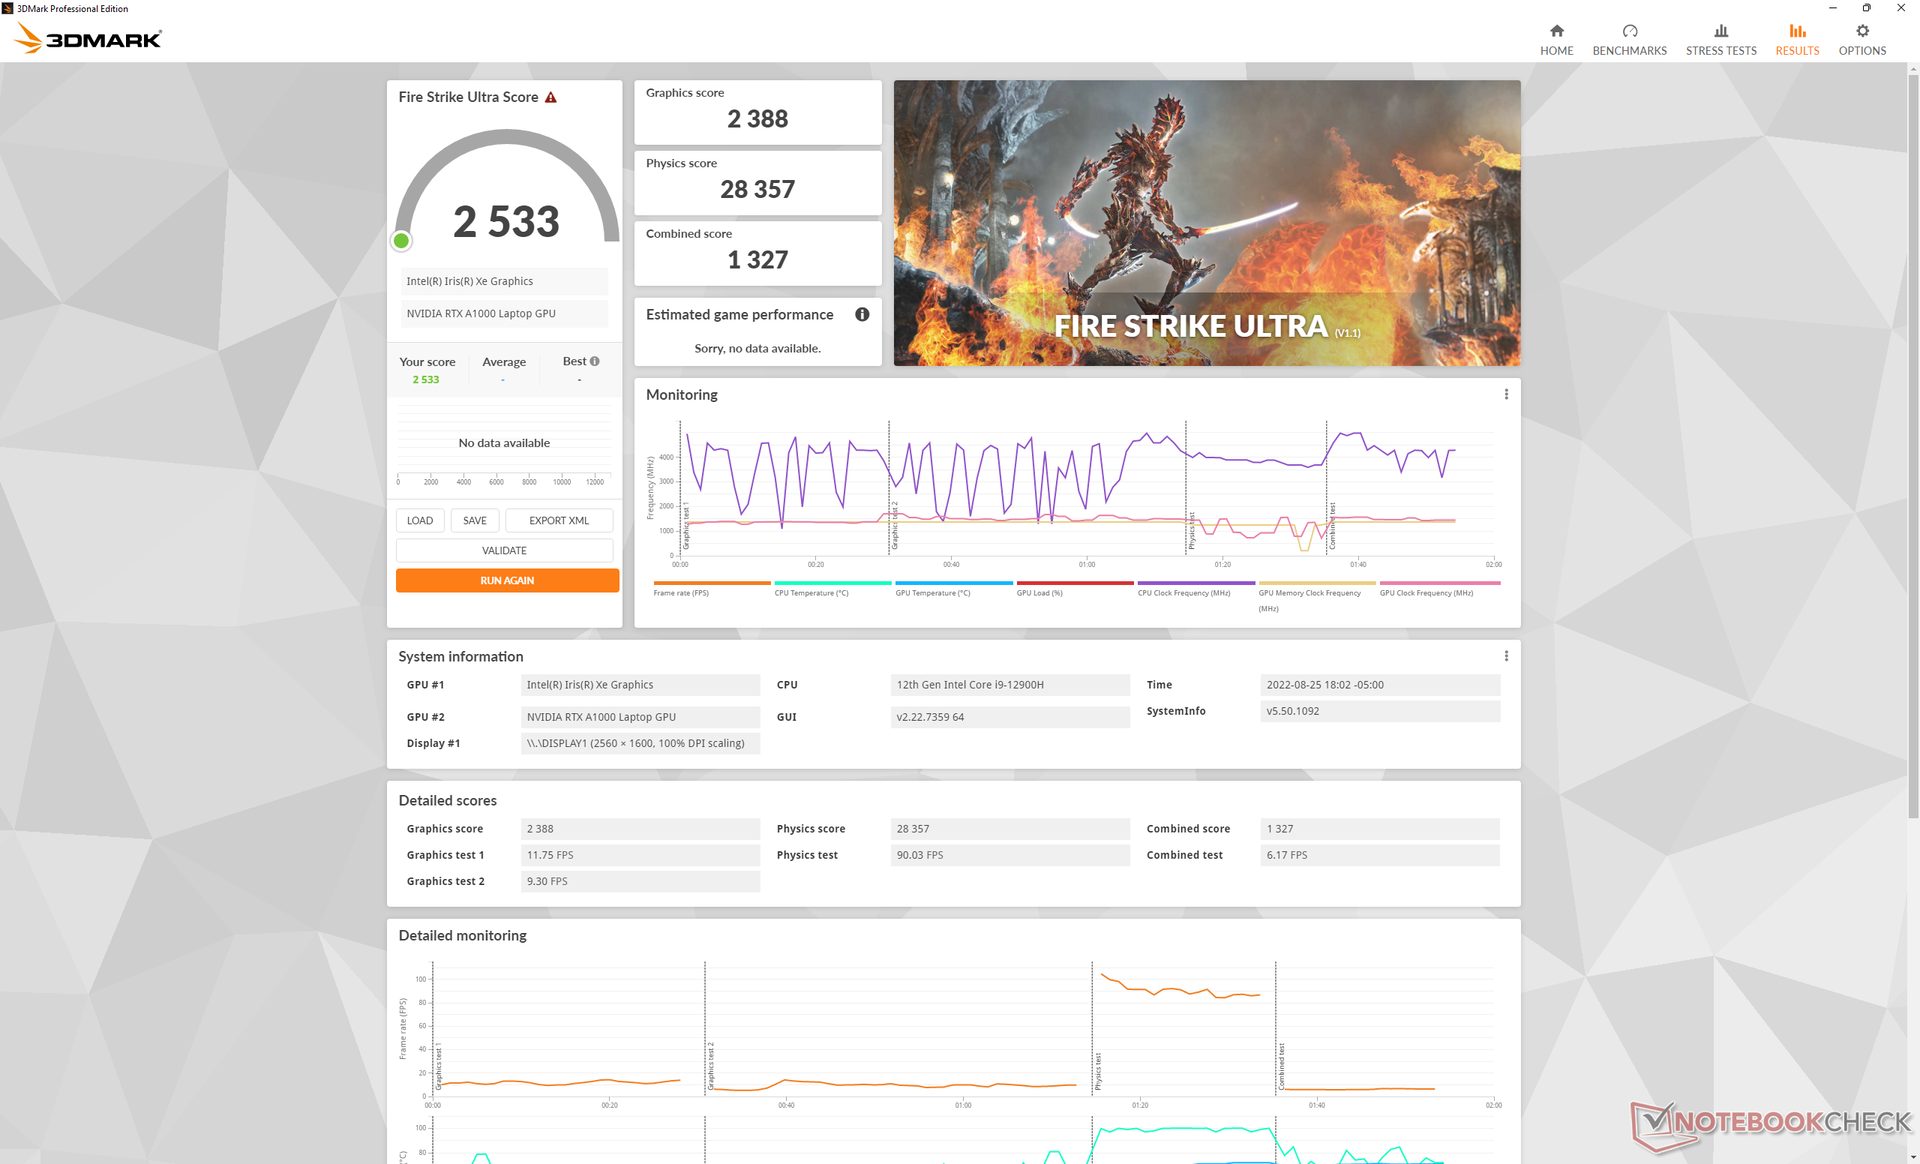
Performances du GPU - Graphique RTX A1000 40 W
Les performances graphiques globales sont environ 10 à 20 % plus rapides que celles de l'année dernière.NVIDIA T1200. Mais surtout, la RTX A1000 n'est qu'environ 10 à 15 % plus lente que la RTX A2000 sur le site Precision 5560, sauf lorsqu'il s'agit d'applications de ray tracing où la RTX A2000 peut être plus de deux fois plus rapide. Si vos charges de travail impliquent des effets de ray tracing, alors la RTX A1000 est celle à éviter.
L'utilisation du mode équilibré au lieu du mode Ultra Performance réduit les performances du CPU d'environ 33 %, tandis que les performances du GPU sont moins affectées.
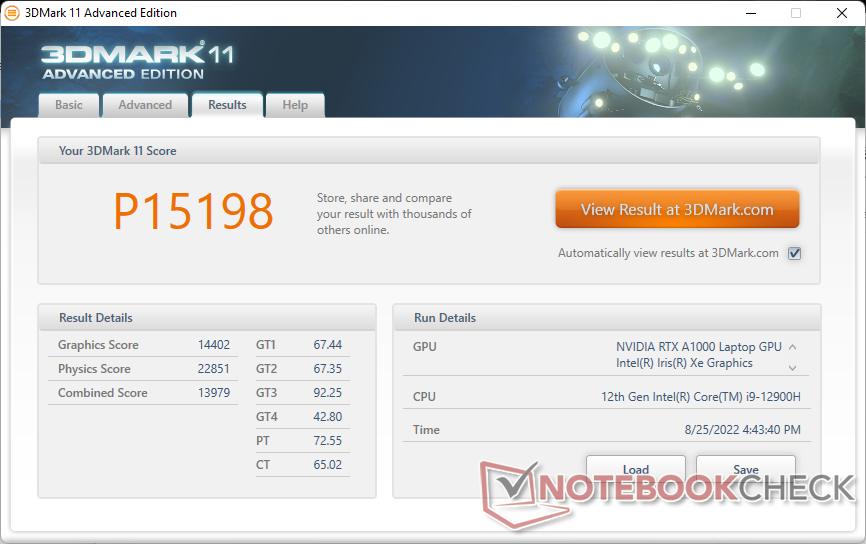
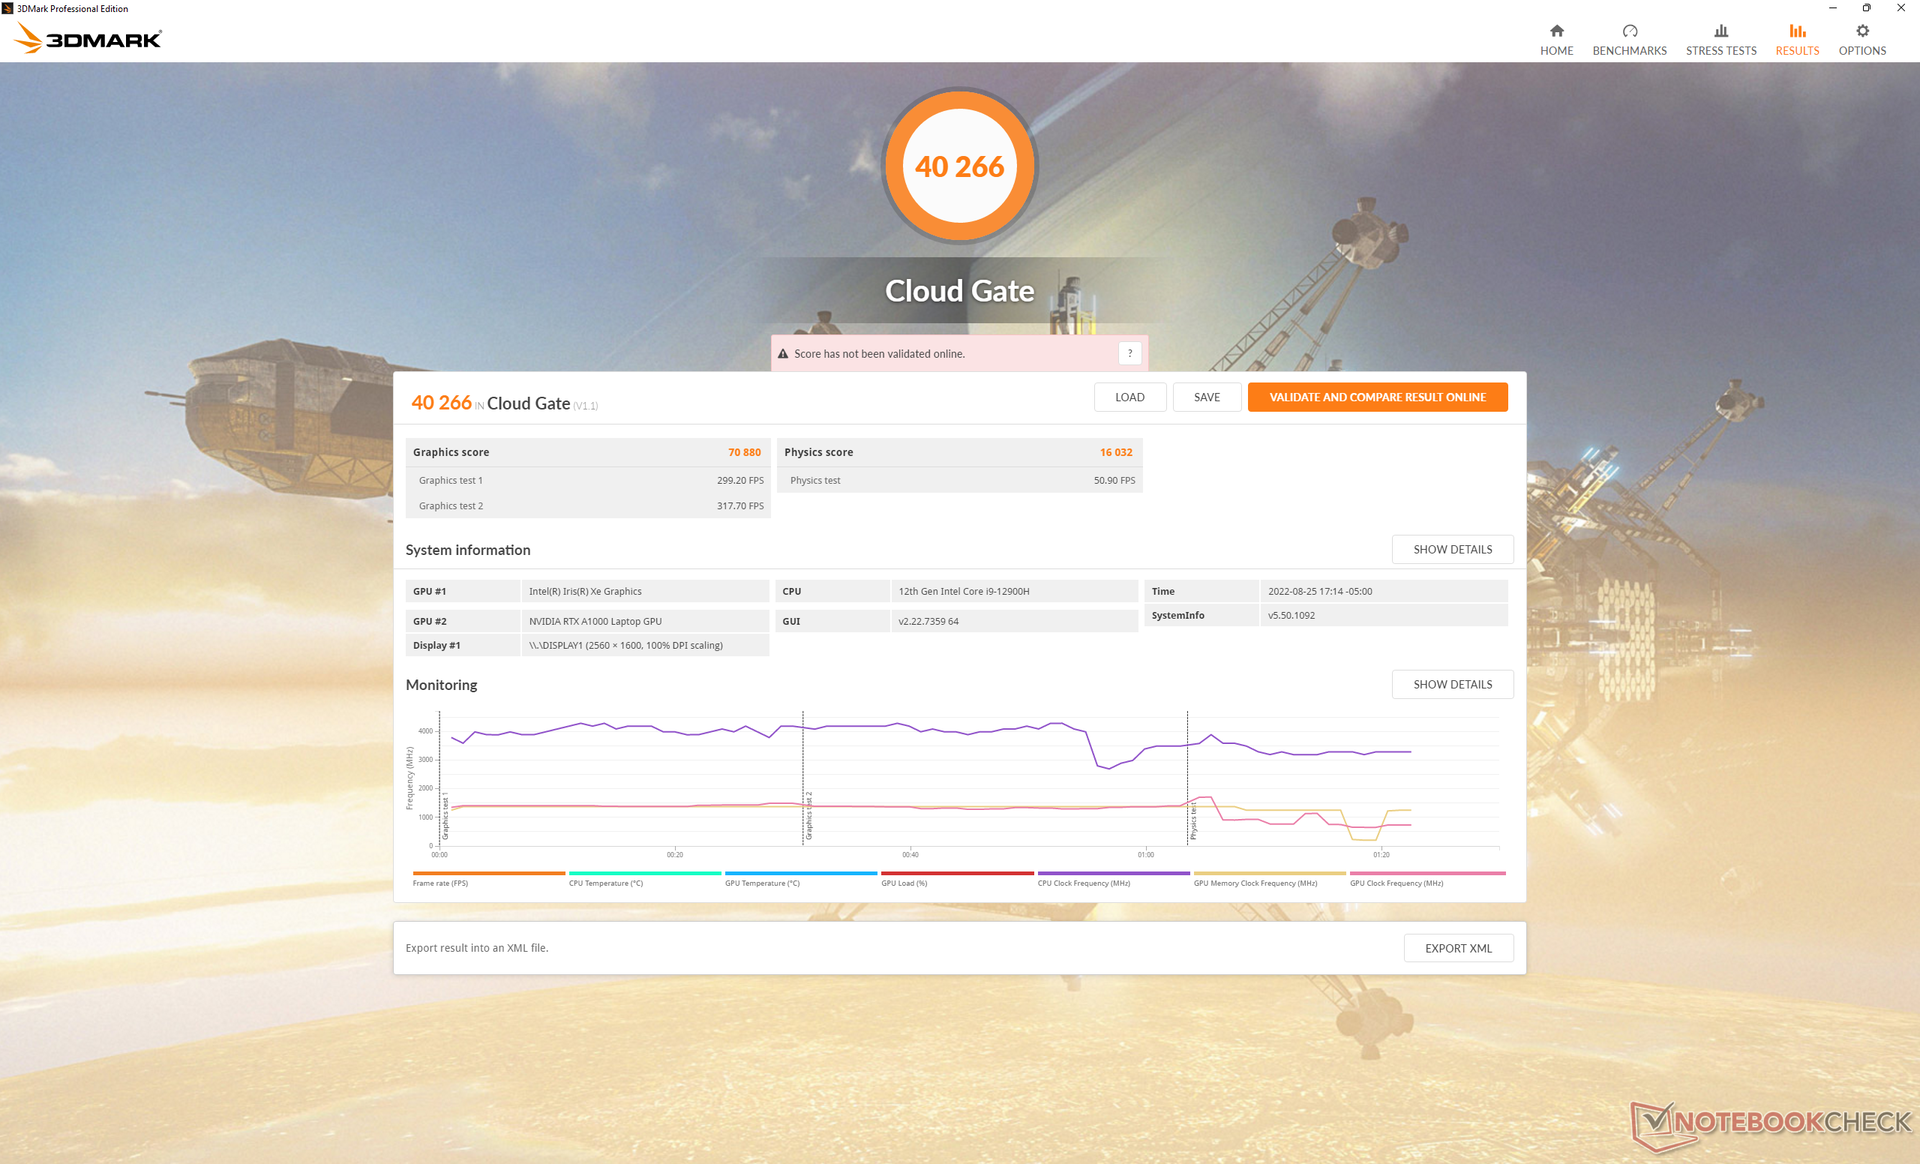
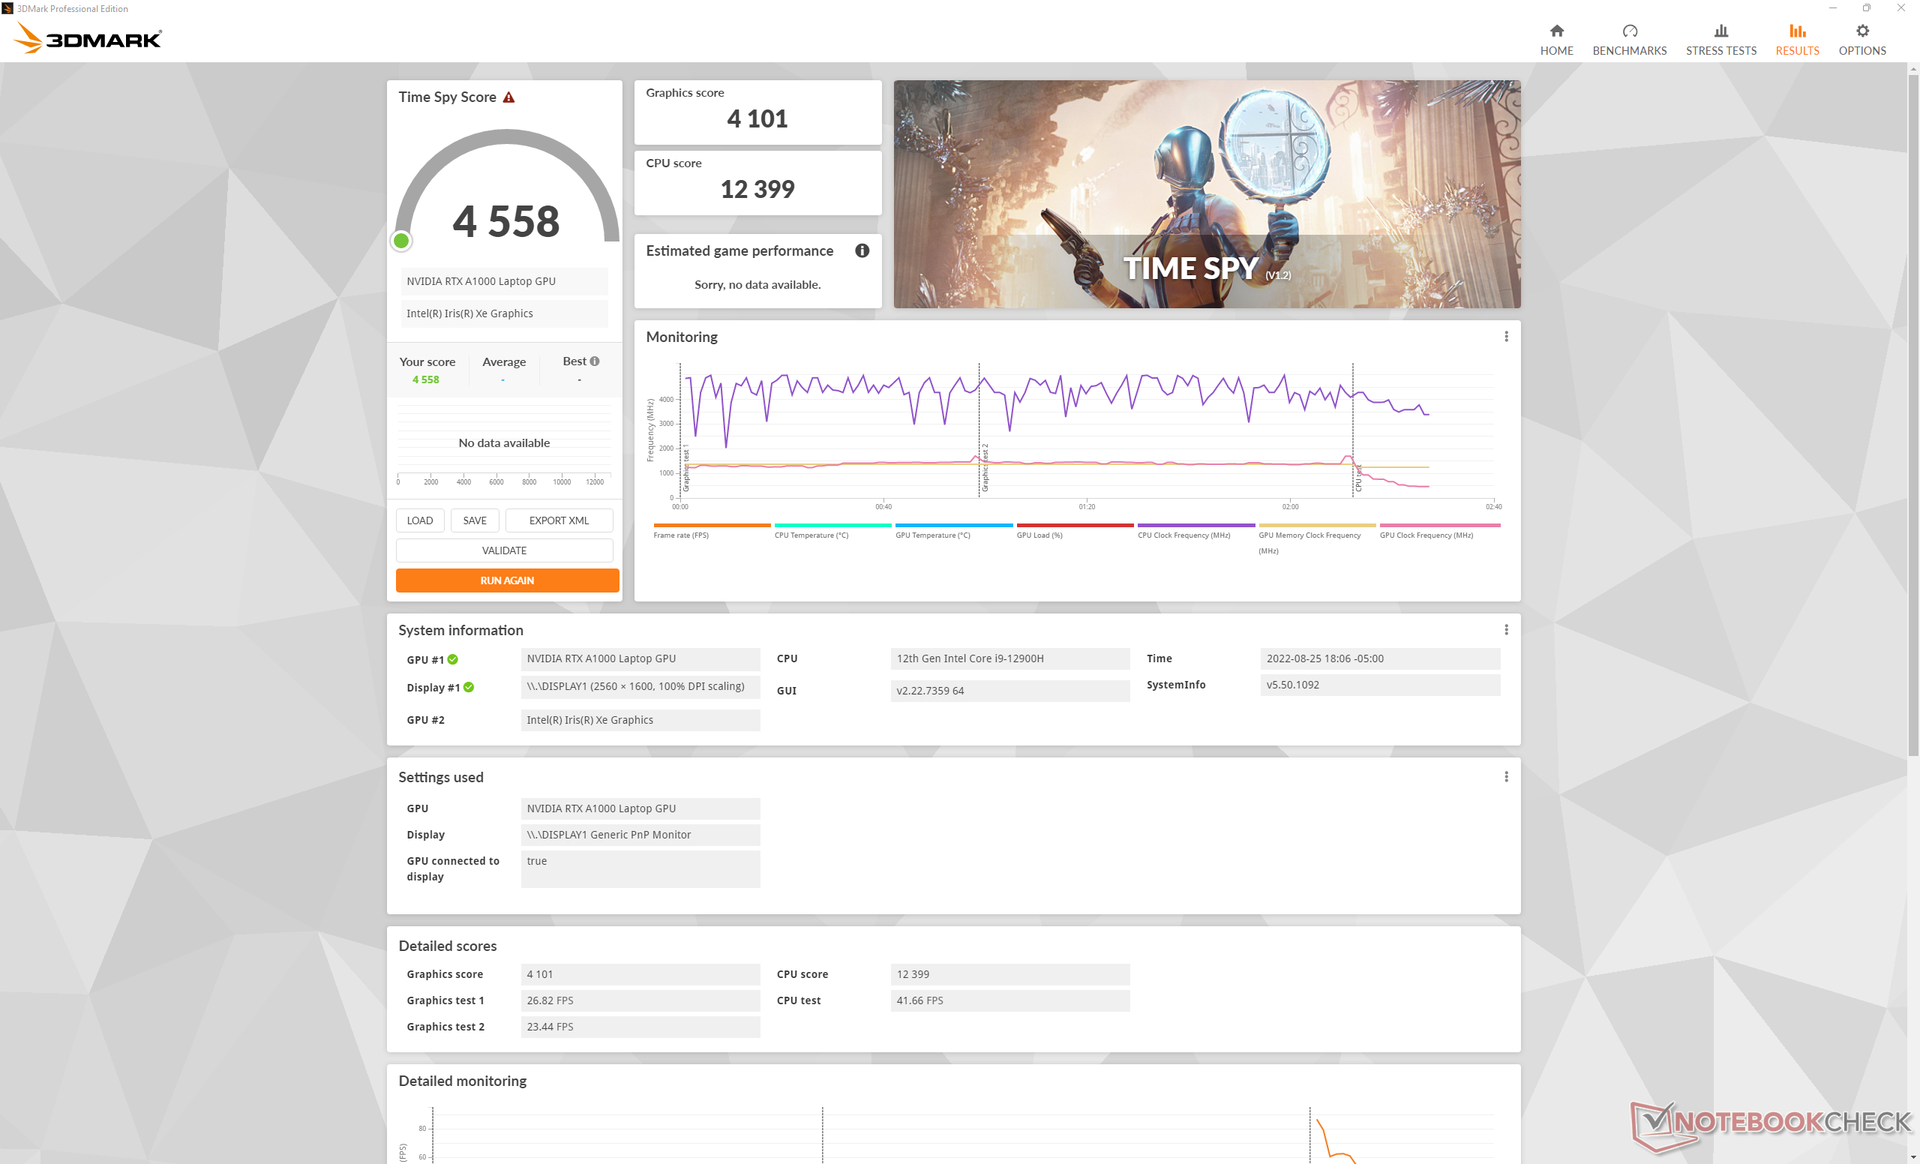

| 3DMark 11 Performance | 15198 points | |
| 3DMark Cloud Gate Standard Score | 40266 points | |
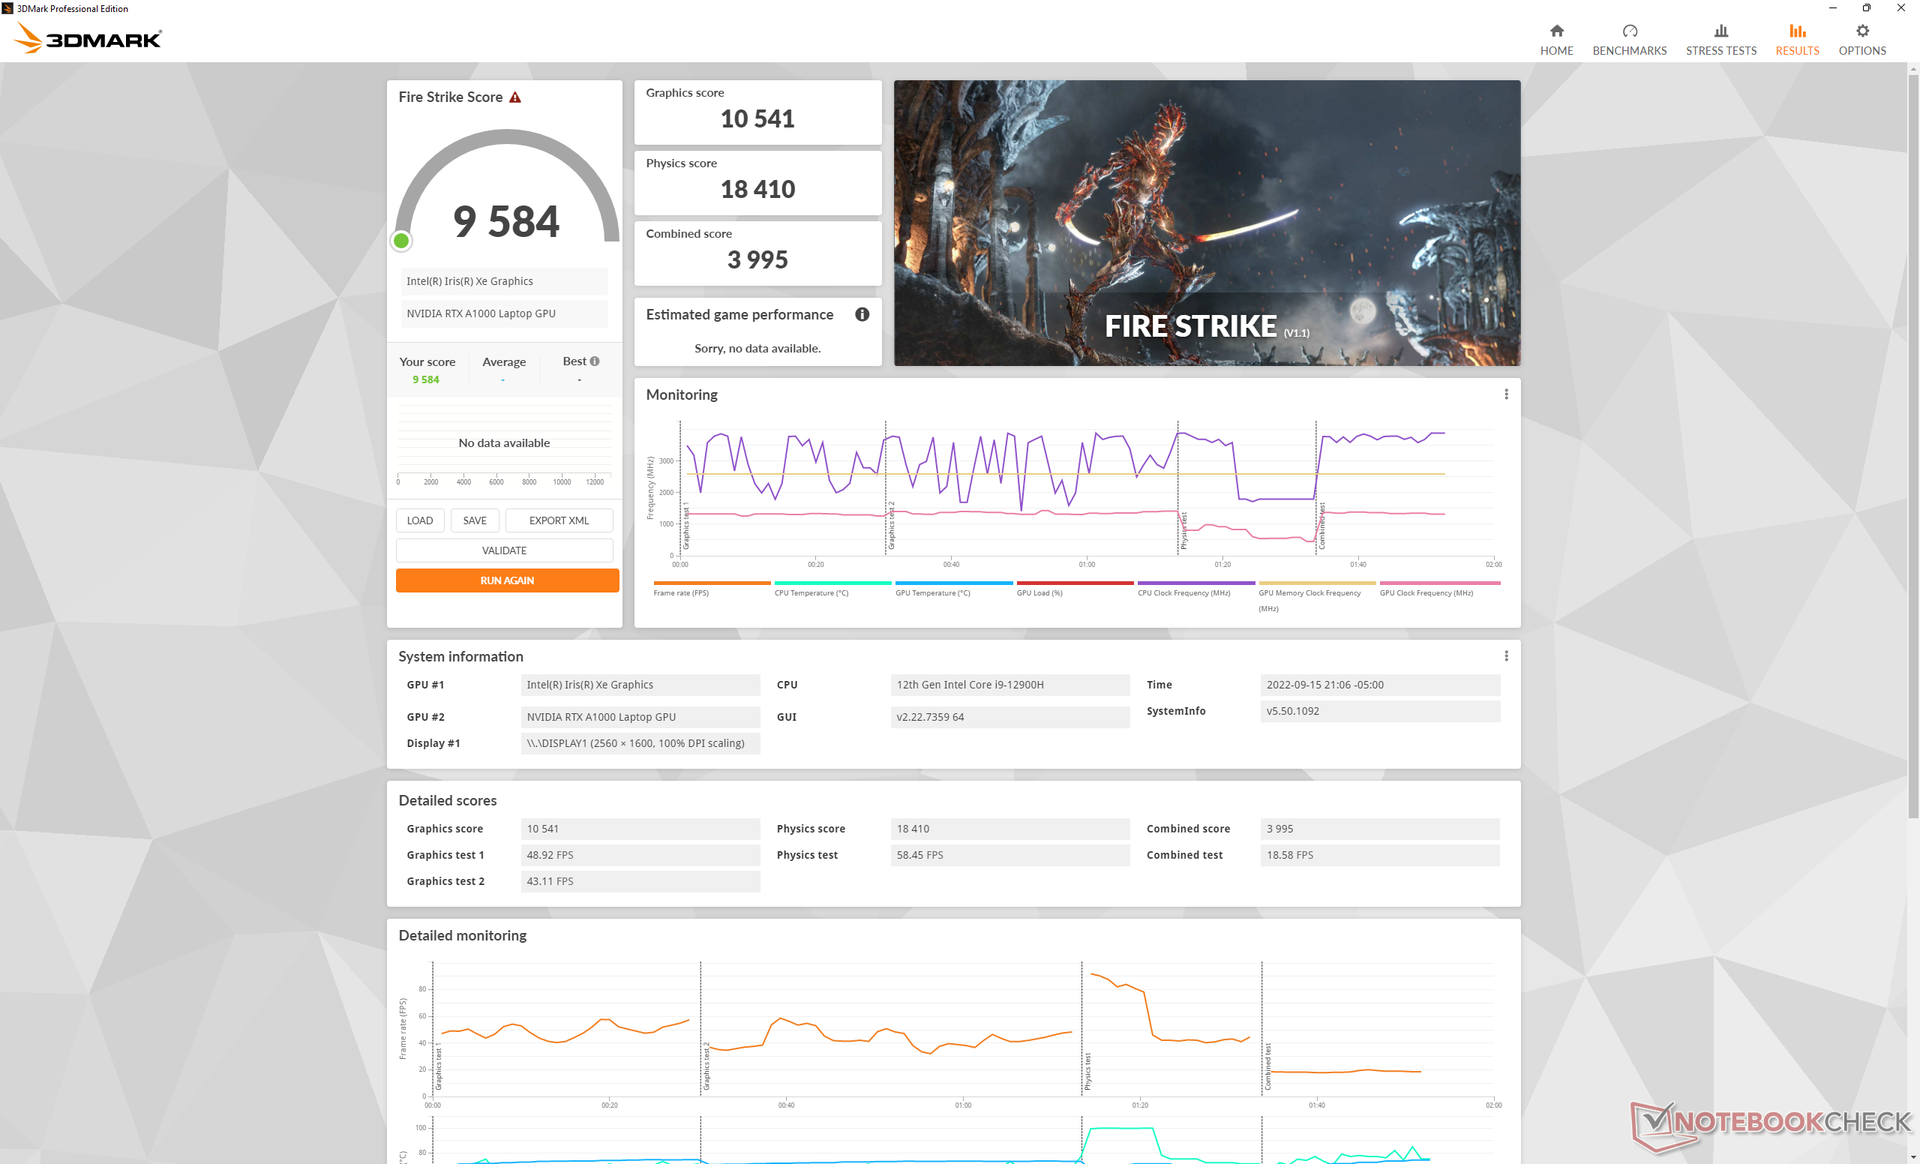
| 3DMark Fire Strike Score | 10123 points | |
| 3DMark Time Spy Score | 4558 points | |
Aide | ||
| Final Fantasy XV Benchmark | |
| 1280x720 Lite Quality | |
| HP ZBook Fury 17 G8-4A6A9EA | |
| HP ZBook Fury 17 G7 119W5EA | |
| Moyenne NVIDIA RTX A1000 Laptop GPU (105.3 - 129.2, n=2) | |
| Dell Precision 5000 5470 | |
| Lenovo ThinkPad P1 G4-20Y4Z9DVUS | |
| Lenovo ThinkPad P15v G2 21A9000XGE | |
| Dell Precision 5000 5560 | |
| HP ZBook Power 15 G8 313S5EA | |
| Dell Precision 3000 3551 | |
| 1920x1080 Standard Quality | |
| HP ZBook Fury 17 G8-4A6A9EA | |
| HP ZBook Fury 17 G7 119W5EA | |
| Moyenne NVIDIA RTX A1000 Laptop GPU (59.1 - 67.9, n=2) | |
| Dell Precision 5000 5560 | |
| Dell Precision 5000 5470 | |
| Lenovo ThinkPad P1 G4-20Y4Z9DVUS | |
| Lenovo ThinkPad P15v G2 21A9000XGE | |
| HP ZBook Power 15 G8 313S5EA | |
| Dell Precision 3000 3551 | |
| 1920x1080 High Quality | |
| HP ZBook Fury 17 G7 119W5EA | |
| HP ZBook Fury 17 G8-4A6A9EA | |
| Dell Precision 5000 5560 | |
| Moyenne NVIDIA RTX A1000 Laptop GPU (43 - 48.3, n=2) | |
| Dell Precision 5000 5470 | |
| Lenovo ThinkPad P1 G4-20Y4Z9DVUS | |
| Lenovo ThinkPad P15v G2 21A9000XGE | |
| HP ZBook Power 15 G8 313S5EA | |
| Dell Precision 3000 3551 | |
| Cyberpunk 2077 1.6 | |
| 1920x1080 Low Preset | |
| Dell Precision 5000 5470 | |
| Moyenne NVIDIA RTX A1000 Laptop GPU (n=1) | |
| 1920x1080 Medium Preset | |
| Dell Precision 5000 5470 | |
| Moyenne NVIDIA RTX A1000 Laptop GPU (n=1) | |
| 1920x1080 High Preset | |
| Dell Precision 5000 5470 | |
| Moyenne NVIDIA RTX A1000 Laptop GPU (n=1) | |
| 1920x1080 Ultra Preset | |
| Dell Precision 5000 5470 | |
| Moyenne NVIDIA RTX A1000 Laptop GPU (n=1) | |
Witcher 3 FPS Chart
| Bas | Moyen | Élevé | Ultra | QHD | |
|---|---|---|---|---|---|
| GTA V (2015) | 168 | 159.8 | 113.7 | 58.9 | |
| The Witcher 3 (2015) | 244.1 | 147.5 | 82.1 | 42.7 | |
| Dota 2 Reborn (2015) | 160.8 | 147.9 | 112.3 | 132.1 | |
| Final Fantasy XV Benchmark (2018) | 105.3 | 59.1 | 43 | ||
| X-Plane 11.11 (2018) | 118.7 | 94.8 | 76.3 | ||
| Strange Brigade (2018) | 242 | 106.2 | 84.7 | 72.8 | |
| Metro Exodus (2019) | 111 | 53.3 | 39.3 | 31.2 | 23.6 |
| Borderlands 3 (2019) | 110.4 | 68.4 | 42.6 | 31.3 | 18.8 |
| Gears Tactics (2020) | 161.5 | 106.5 | 63.9 | 46.8 | 31.1 |
| Horizon Zero Dawn (2020) | 82 | 68 | 58 | 48 | 38 |
| Watch Dogs Legion (2020) | 75 | 62 | 54 | 26 | 17 |
| Dirt 5 (2020) | 135 | 62.4 | 48.5 | 37.2 | 25.8 |
| Assassin´s Creed Valhalla (2020) | 103 | 50 | 33 | 25 | 22 |
| Hitman 3 (2021) | 171.9 | 83.7 | 71.3 | 66.1 | 41 |
| F1 2021 (2021) | 195 | 127 | 103 | 54 | 34 |
| Far Cry 6 (2021) | 103 | 64 | 54 | ||
| Guardians of the Galaxy (2021) | 92 | 64 | 64 | 61 | 37 |
| God of War (2022) | 60.2 | 49.1 | 40.9 | 25.8 | 20.5 |
| Cyberpunk 2077 1.6 (2022) | 61.3 | 50.4 | 36.7 | 29 | |
| F1 22 (2022) | 112 | 107 | 76 | 22 | 13 |
Émissions
Bruit du système - Bruyant sous charge
Le Precision 5470 fonctionne plus bruyamment que le plus grand Precision 5560 lorsqu'il est en charge. Le fonctionnement de Witcher 3 en mode Ultra Performance, par exemple, le ventilateur émet un bruit d'un peu moins de 49 dB(A), contre seulement 40 dB(A) pour le modèle de 15,6 pouces Precision. En fait, le Precision 5470 est facilement l'une des stations de travail les plus bruyantes de sa petite catégorie de 14 pouces.
Le système devient plus silencieux à 40,3 dB(A) lorsque vous exécutez des charges lourdes en mode Équilibré au lieu du mode Ultra Performance. Vous perdrez un peu de performance du CPU, comme indiqué ci-dessus, mais les ventilateurs plus silencieux peuvent valoir le coup en fonction de l'environnement.
Les ventilateurs internes émettront périodiquement des impulsions sans raison apparente s'ils sont réglés sur le mode Ultra Performance, même lorsque le bureau tourne au ralenti. Le mode équilibré ou le mode silencieux sont recommandés si vous utilisez des applications peu exigeantes.
Degré de la nuisance sonore
| Au repos |
| 23.3 / 23.3 / 23.3 dB(A) |
| Fortement sollicité |
| 48.5 / 50.4 dB(A) |
 | ||
30 dB silencieux 40 dB(A) audible 50 dB(A) bruyant |
||
min: | ||
| Dell Precision 5000 5470 RTX A1000 Laptop GPU, i9-12900H, Samsung PM9A1 MZVL21T0HCLR | Lenovo ThinkPad P15v G2 21A9000XGE T1200 Laptop GPU, i7-11800H, Toshiba XG6 KXG6AZNV512G | Dell Precision 5000 5560 RTX A2000 Laptop GPU, i7-11850H, Samsung PM9A1 MZVL22T0HBLB | Lenovo ThinkPad P14s G2 AMD Vega 8, R7 PRO 5850U, SK Hynix PC711 1TB HFS001TDE9X081N | HP ZBook Firefly 14 G8 2C9Q2EA T500 Laptop GPU, i7-1165G7, Toshiba XG6 KXG60ZNV1T02 | HP ZBook Firefly 14 G7 Quadro P520, i7-10610U, Toshiba XG6 KXG60ZNV512G | |
|---|---|---|---|---|---|---|
| Noise | 3% | 11% | 8% | -4% | -4% | |
| arrêt / environnement * (dB) | 23 | 25.21 -10% | 23.4 -2% | 24.04 -5% | 28.7 -25% | 29.7 -29% |
| Idle Minimum * (dB) | 23.3 | 25.21 -8% | 23.6 -1% | 24.04 -3% | 28.7 -23% | 29.7 -27% |
| Idle Average * (dB) | 23.3 | 25.21 -8% | 23.6 -1% | 24.04 -3% | 28.7 -23% | 29.7 -27% |
| Idle Maximum * (dB) | 23.3 | 25.21 -8% | 23.6 -1% | 24.04 -3% | 28.7 -23% | 30.4 -30% |
| Load Average * (dB) | 48.5 | 39.09 19% | 25.8 47% | 28.19 42% | 34 30% | 33.1 32% |
| Witcher 3 ultra * (dB) | 48.6 | 36.6 25% | 40.1 17% | 40.1 17% | 35.3 27% | |
| Load Maximum * (dB) | 50.4 | 43.53 14% | 41.4 18% | 40.77 19% | 40.1 20% | 37.9 25% |
* ... Moindre est la valeur, meilleures sont les performances
Température
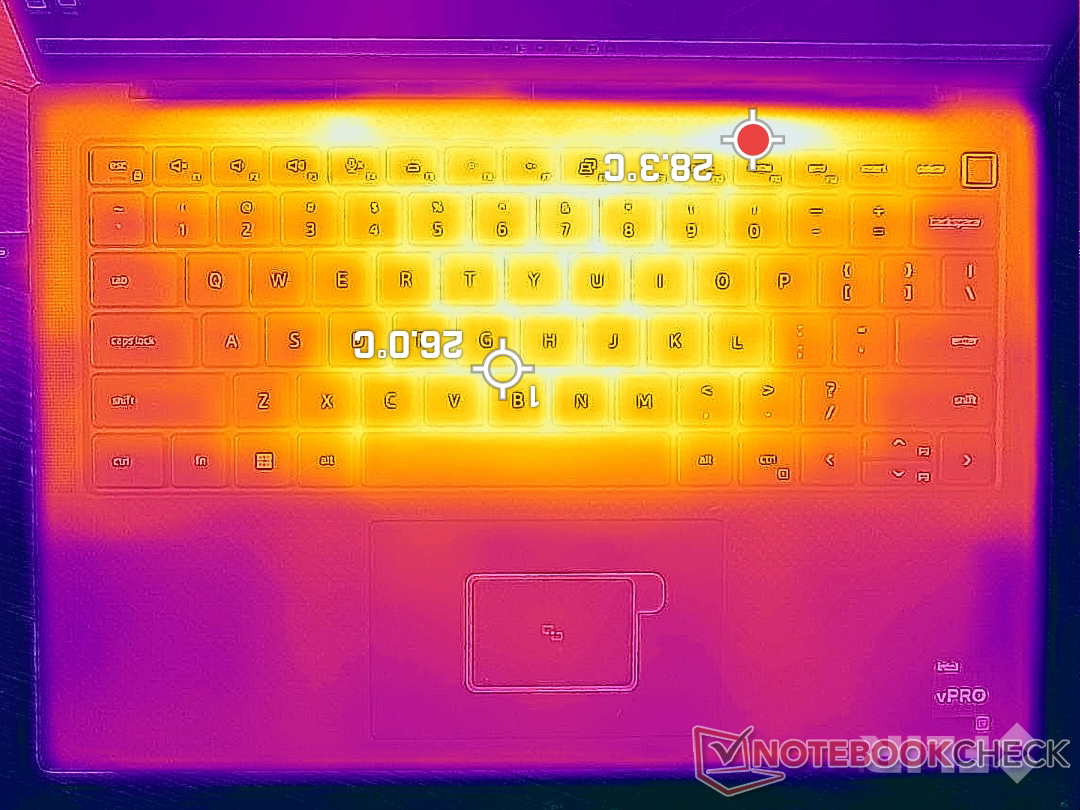
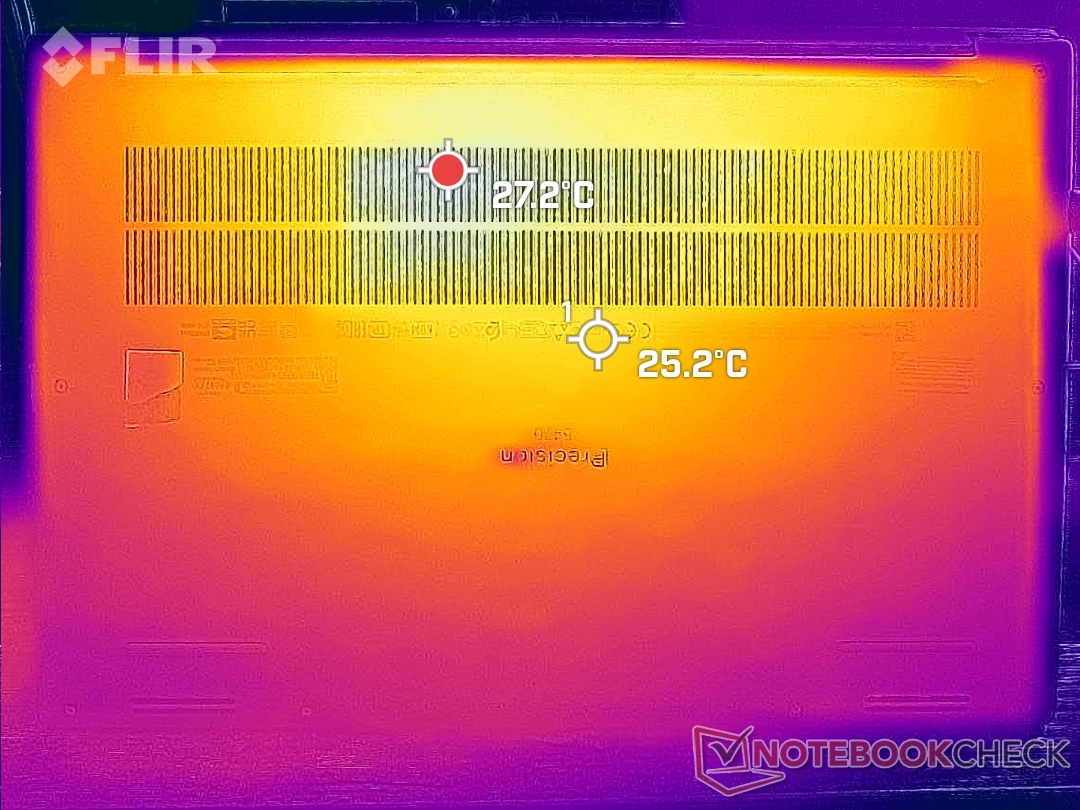
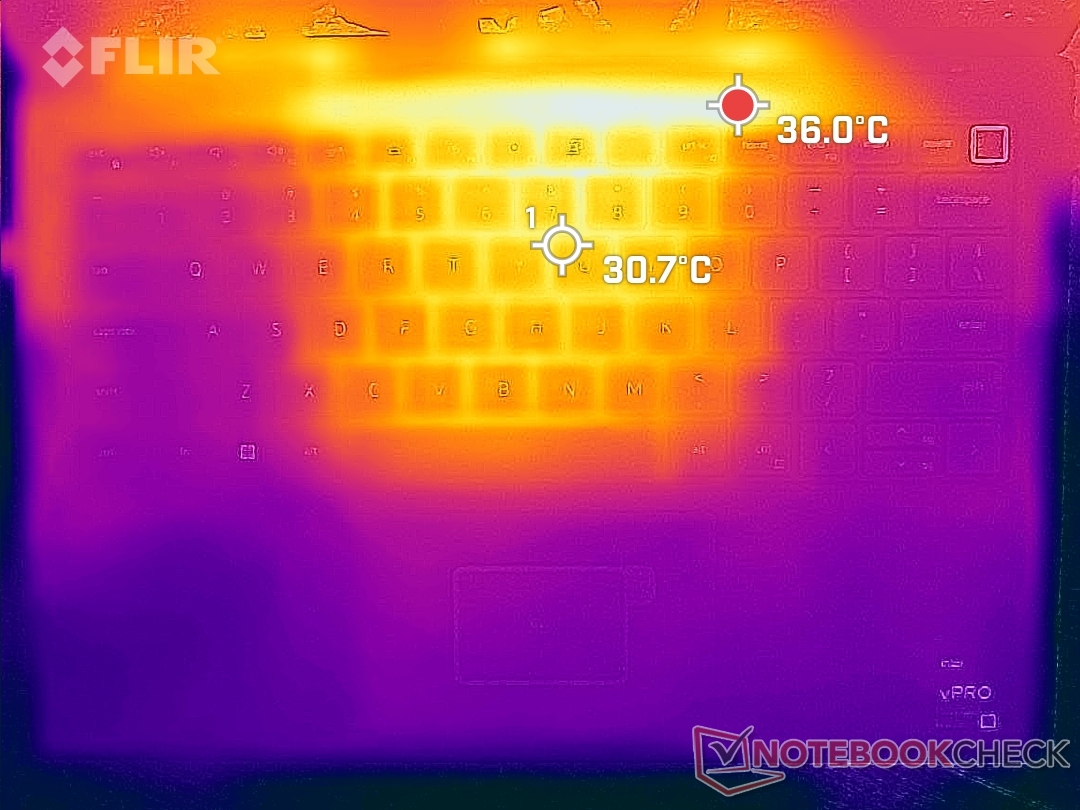
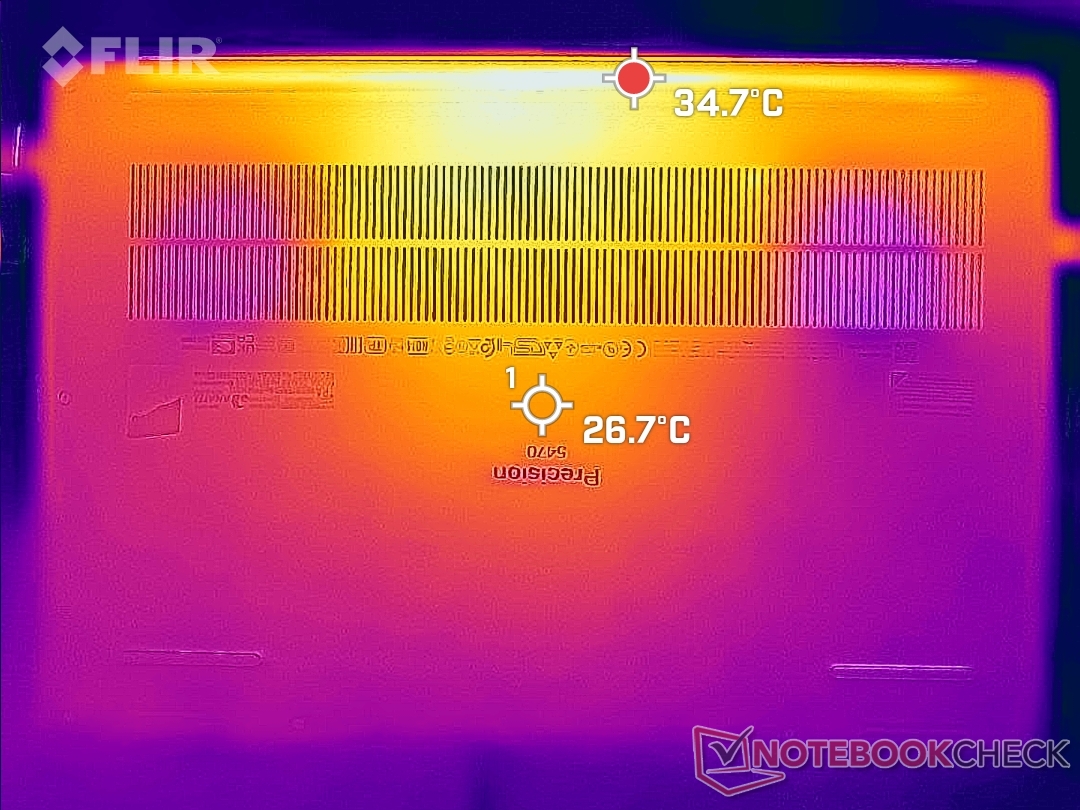
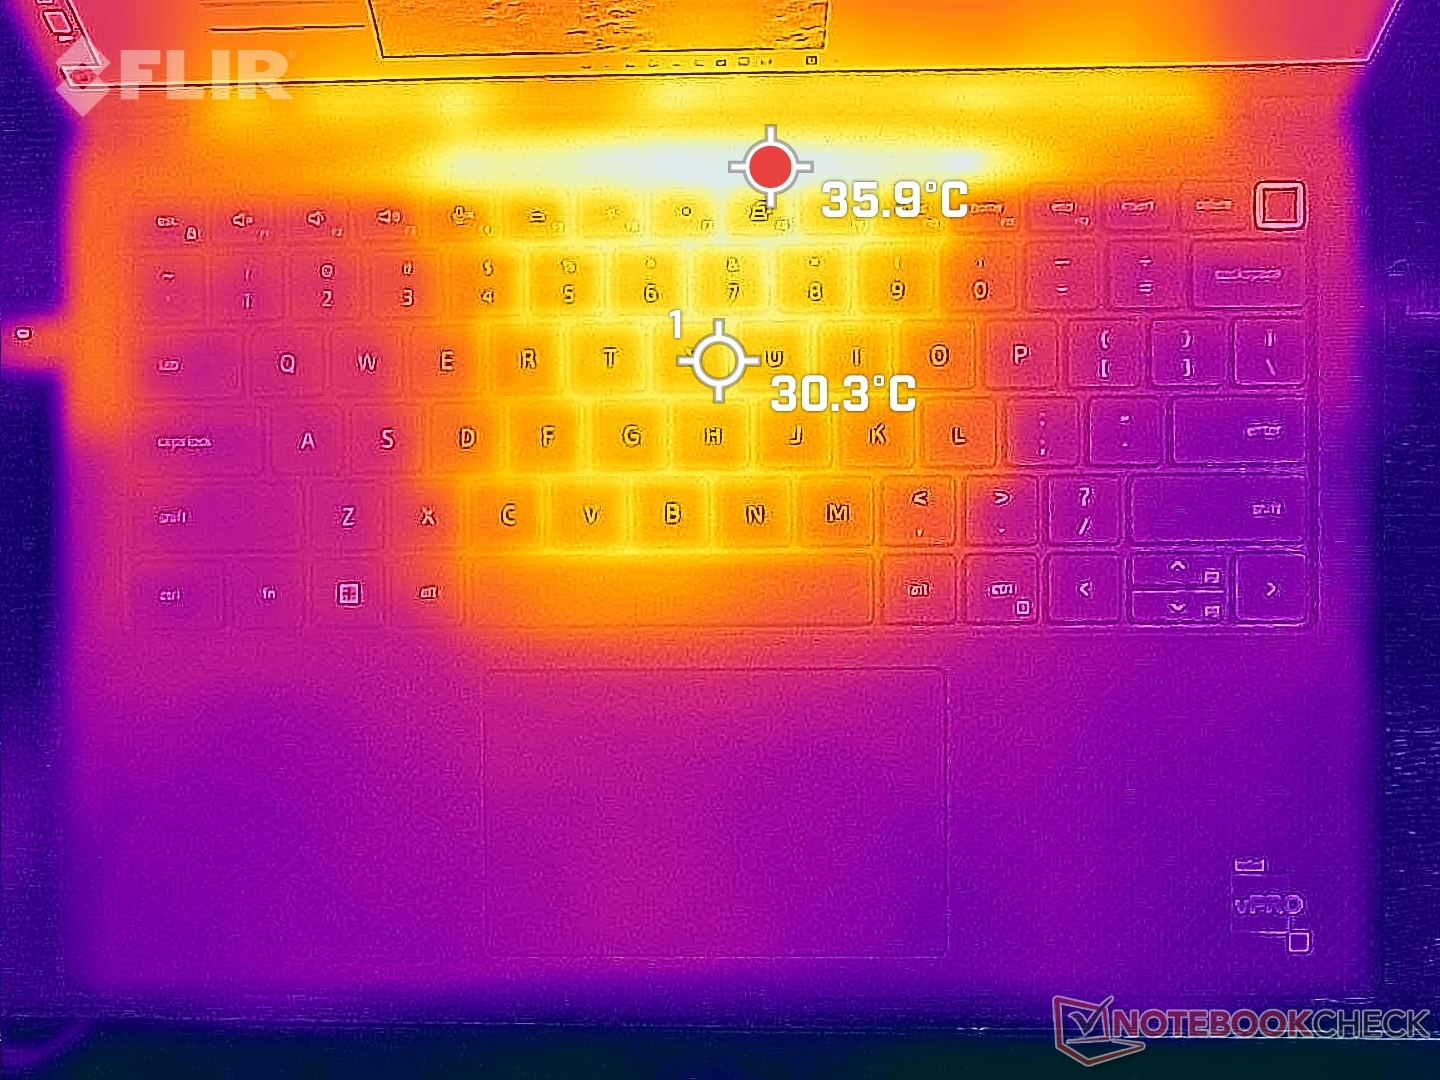
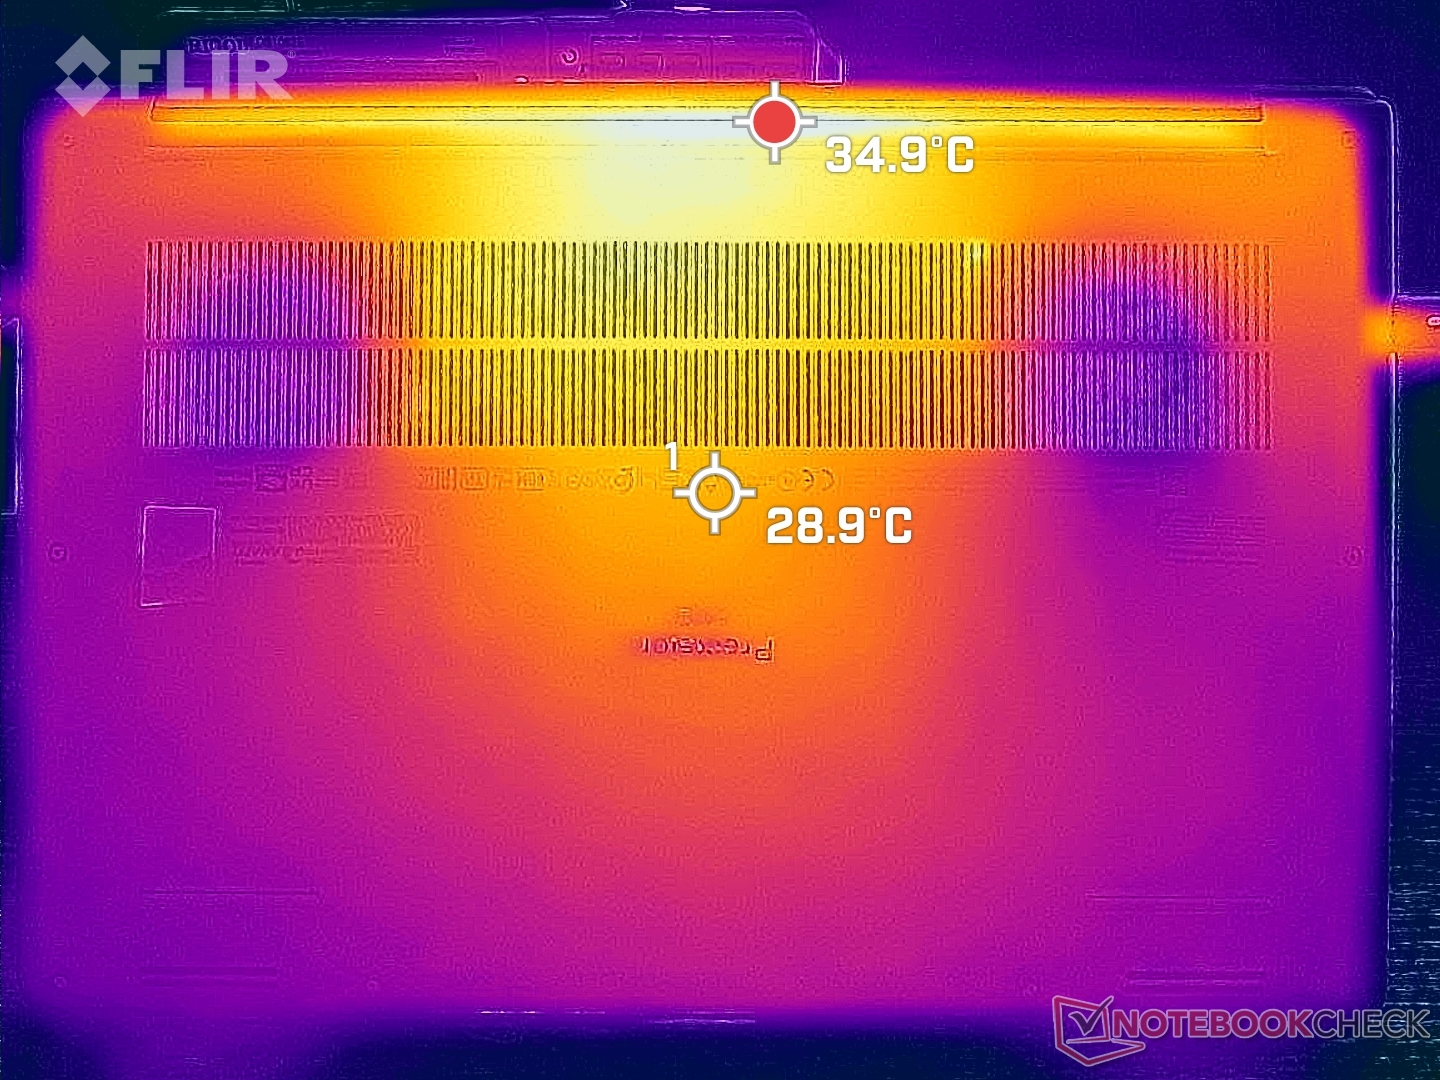
Les températures de surface sont plus fraîches que prévu compte tenu du CPU de classe Core H, du GPU Nvidia discret et de la petite taille du châssis. Les autres stations de travail de 14 pouces comme le ZBook Firefly 14 G8 ou le ThinkPad P14s G2 sont équipées de CPU plus lents et pourtant ils peuvent devenir beaucoup plus chauds avec des points chauds atteignant 49 C contre seulement 42 C sur notre Precision. Néanmoins, le centre du clavier peut encore devenir assez chaud à 42 C.
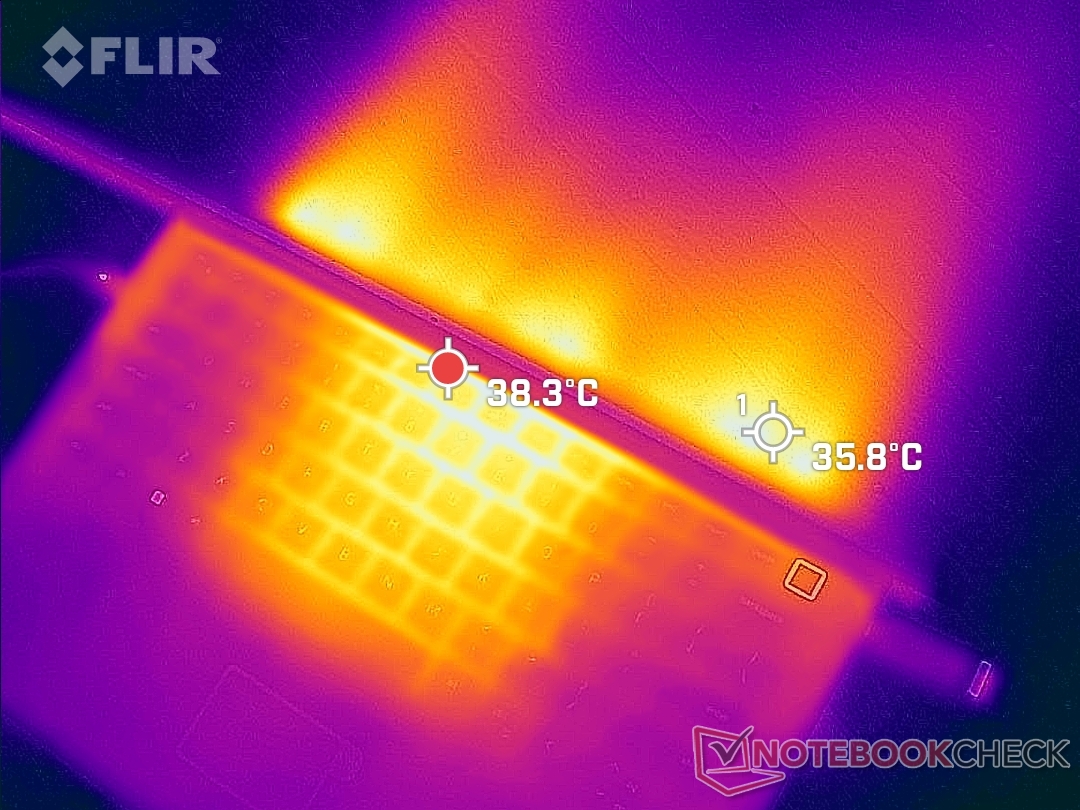
(±) La température maximale du côté supérieur est de 41.8 °C / 107 F, par rapport à la moyenne de 38.2 °C / 101 F, allant de 22.2 à 69.8 °C pour la classe Workstation.
(+) Le fond chauffe jusqu'à un maximum de 36 °C / 97 F, contre une moyenne de 41.1 °C / 106 F
(+) En utilisation inactive, la température moyenne du côté supérieur est de 31 °C / 88 F, par rapport à la moyenne du dispositif de 32 °C / 90 F.
(±) En jouant à The Witcher 3, la température moyenne du côté supérieur est de 32.2 °C / 90 F, alors que la moyenne de l'appareil est de 32 °C / 90 F.
(+) Les repose-poignets et le pavé tactile sont plus froids que la température de la peau avec un maximum de 27.6 °C / 81.7 F et sont donc froids au toucher.
(±) La température moyenne de la zone de l'appui-paume de dispositifs similaires était de 27.8 °C / 82 F (+0.2 °C / #0.3 F).
| Dell Precision 5000 5470 Intel Core i9-12900H, NVIDIA RTX A1000 Laptop GPU | Lenovo ThinkPad P15v G2 21A9000XGE Intel Core i7-11800H, NVIDIA T1200 Laptop GPU | Dell Precision 5000 5560 Intel Core i7-11850H, NVIDIA RTX A2000 Laptop GPU | Lenovo ThinkPad P14s G2 AMD AMD Ryzen 7 PRO 5850U, AMD Radeon RX Vega 8 (Ryzen 4000/5000) | HP ZBook Firefly 14 G8 2C9Q2EA Intel Core i7-1165G7, NVIDIA T500 Laptop GPU | HP ZBook Firefly 14 G7 Intel Core i7-10610U, NVIDIA Quadro P520 | |
|---|---|---|---|---|---|---|
| Heat | -9% | -10% | 1% | 5% | -7% | |
| Maximum Upper Side * (°C) | 41.8 | 53.8 -29% | 48.2 -15% | 42.8 -2% | 42.6 -2% | 52.3 -25% |
| Maximum Bottom * (°C) | 36 | 52.1 -45% | 42.6 -18% | 47.5 -32% | 49.4 -37% | 60.9 -69% |
| Idle Upper Side * (°C) | 34.6 | 27.6 20% | 34.8 -1% | 27 22% | 24.2 30% | 23.1 33% |
| Idle Bottom * (°C) | 33.6 | 27.7 18% | 35.2 -5% | 28.3 16% | 24.6 27% | 23 32% |
* ... Moindre est la valeur, meilleures sont les performances
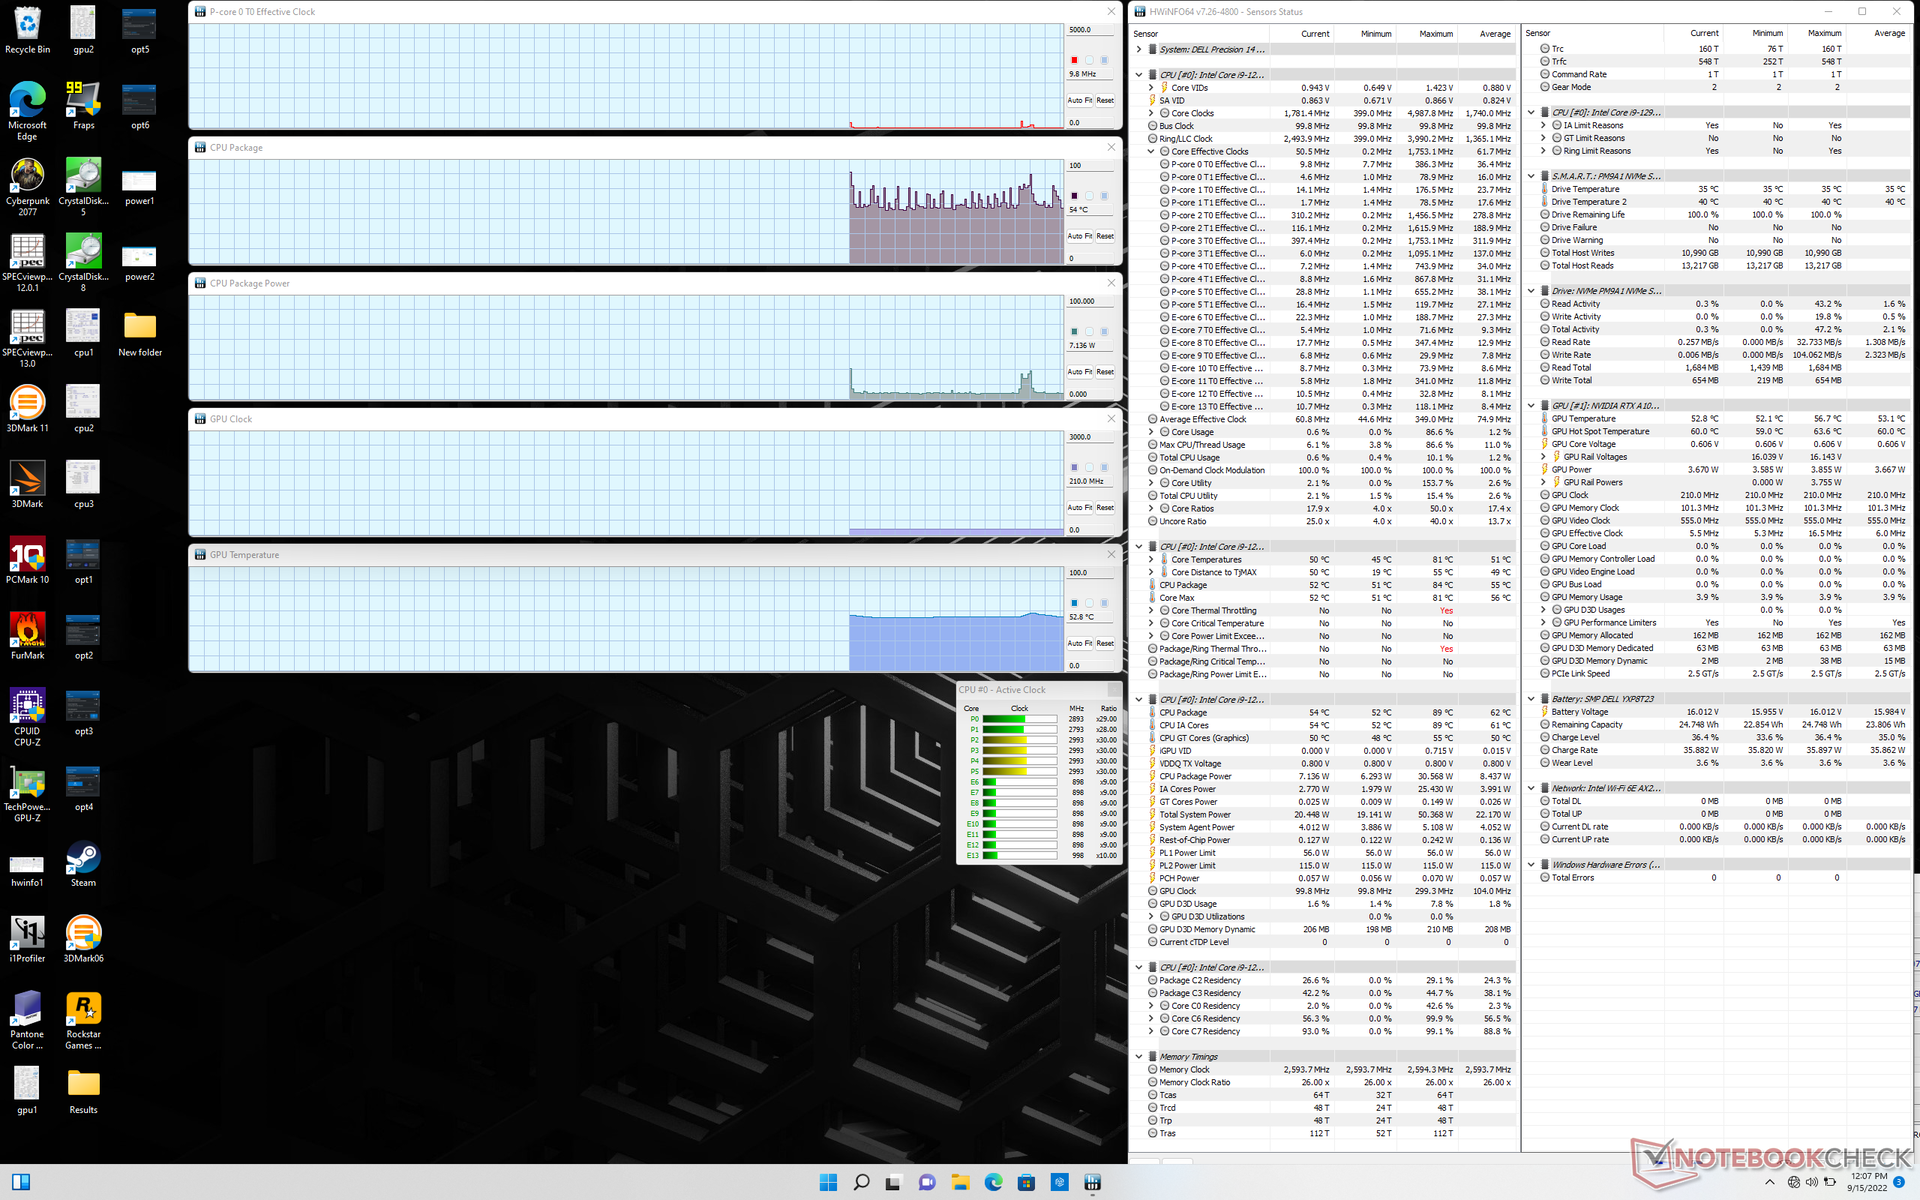
Test de stress - Cyclage des fréquences d'horloge du CPU
En lançant Prime95, les fréquences d'horloge du CPU, la consommation d'énergie de la carte et la température du cœur atteignent respectivement 3,6 GHz, 91 W et 101 °C. Après quelques secondes, cependant, les fréquences d'horloge, la consommation d'énergie et la température commencent à varier entre 1.0 et 2.4 GHz, 20 à 50 W, et 61 à 82 C, respectivement. Ce comportement cyclique correspond aux résultats de notre test en boucle CineBency R15 xT ci-dessus pour montrer que le Precision 5470 est incapable de maintenir des fréquences d'horloge Turbo Boost stables pendant de longues périodes. Faire tourner un processeur Core i9-12900H à son plein potentiel dans un châssis aussi petit reste une utopie.
Lors de l'exécution Witcher 3 pour représenter des charges de traitement élevées, le CPU et le GPU se stabiliseraient à 82 C et 71 C, respectivement, contre 69 C et 75 C sur le Precision 5560.
Le fonctionnement sur batterie limite les performances du CPU. Un test Fire Strike sur batterie donnerait des scores de physique et de graphisme de 21067 et 10542 points, respectivement, contre 27514 et 10914 points sur secteur.
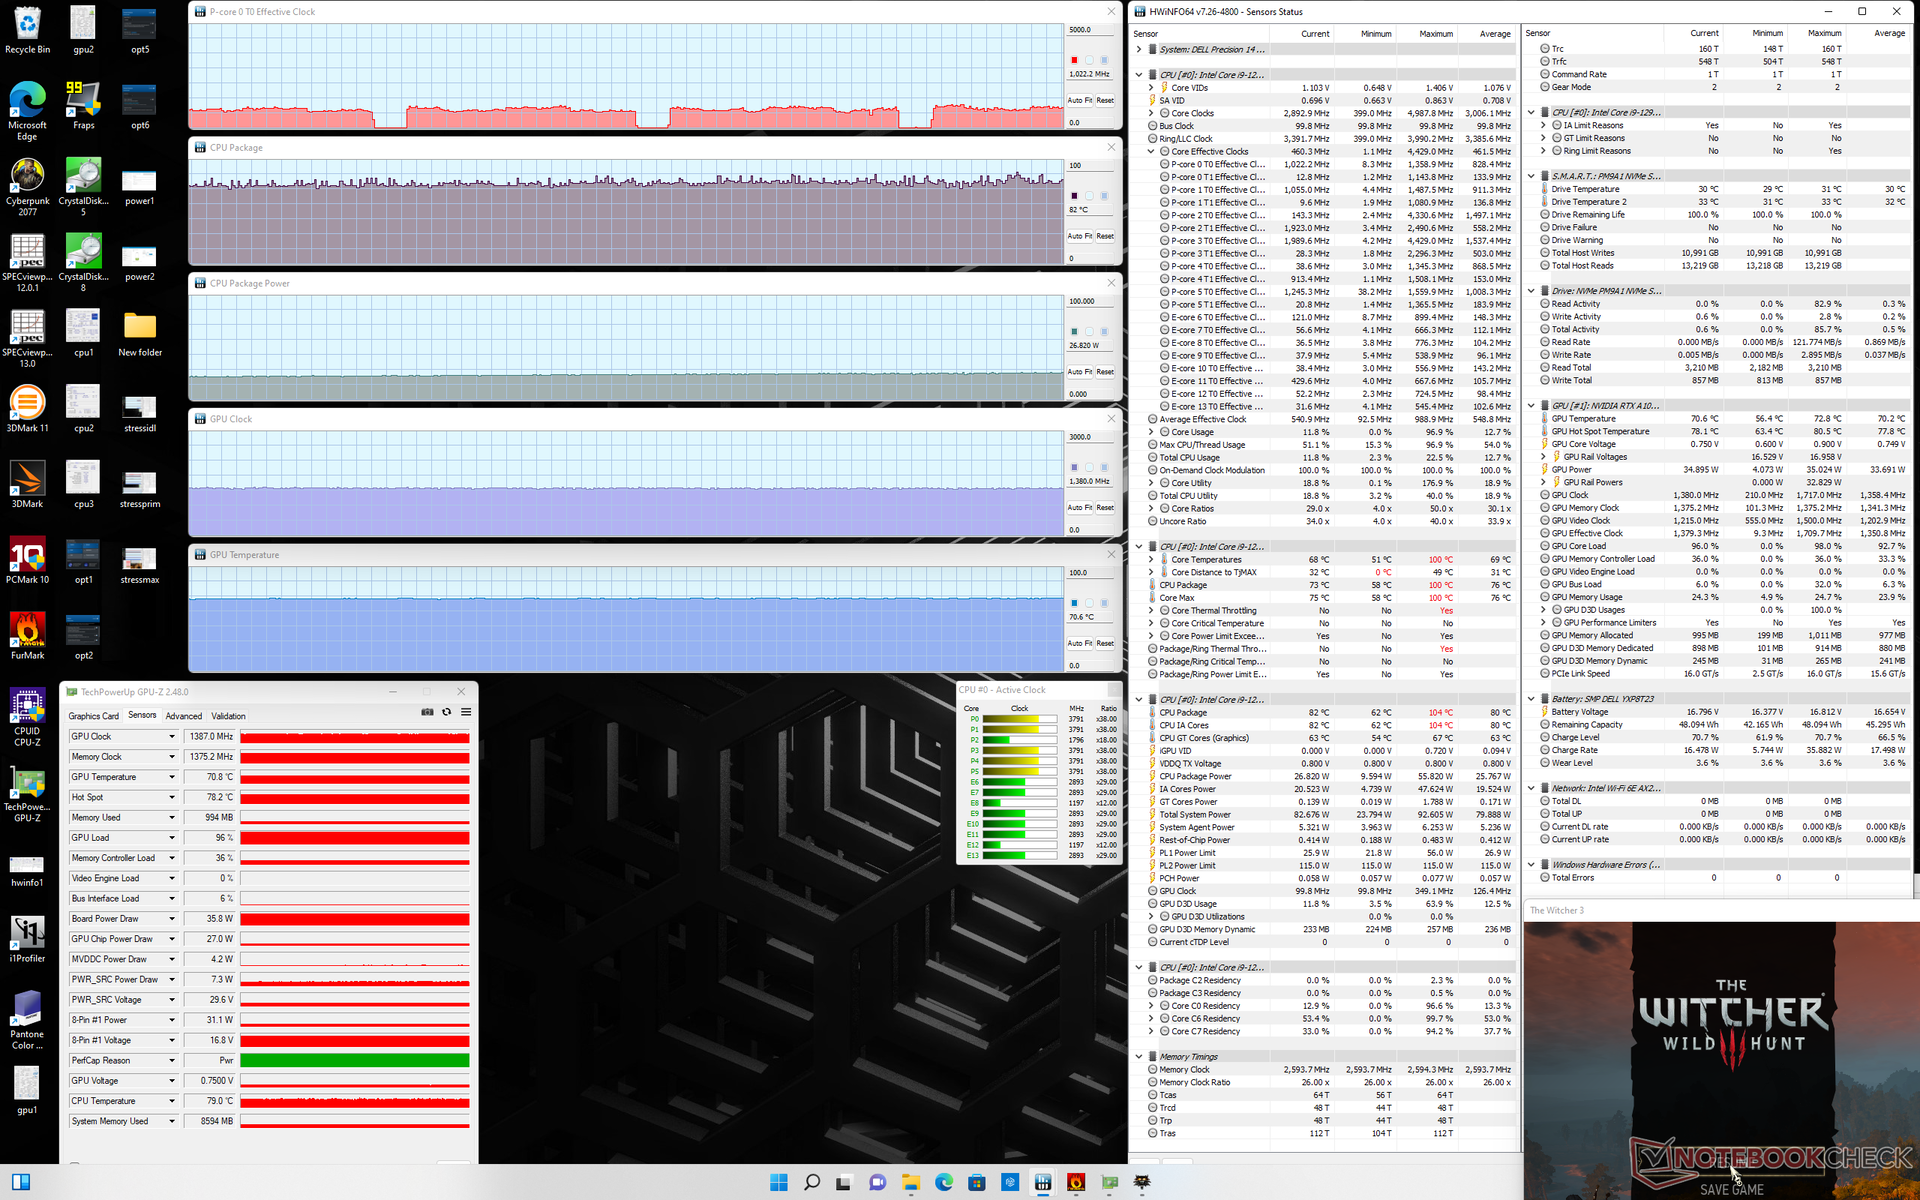
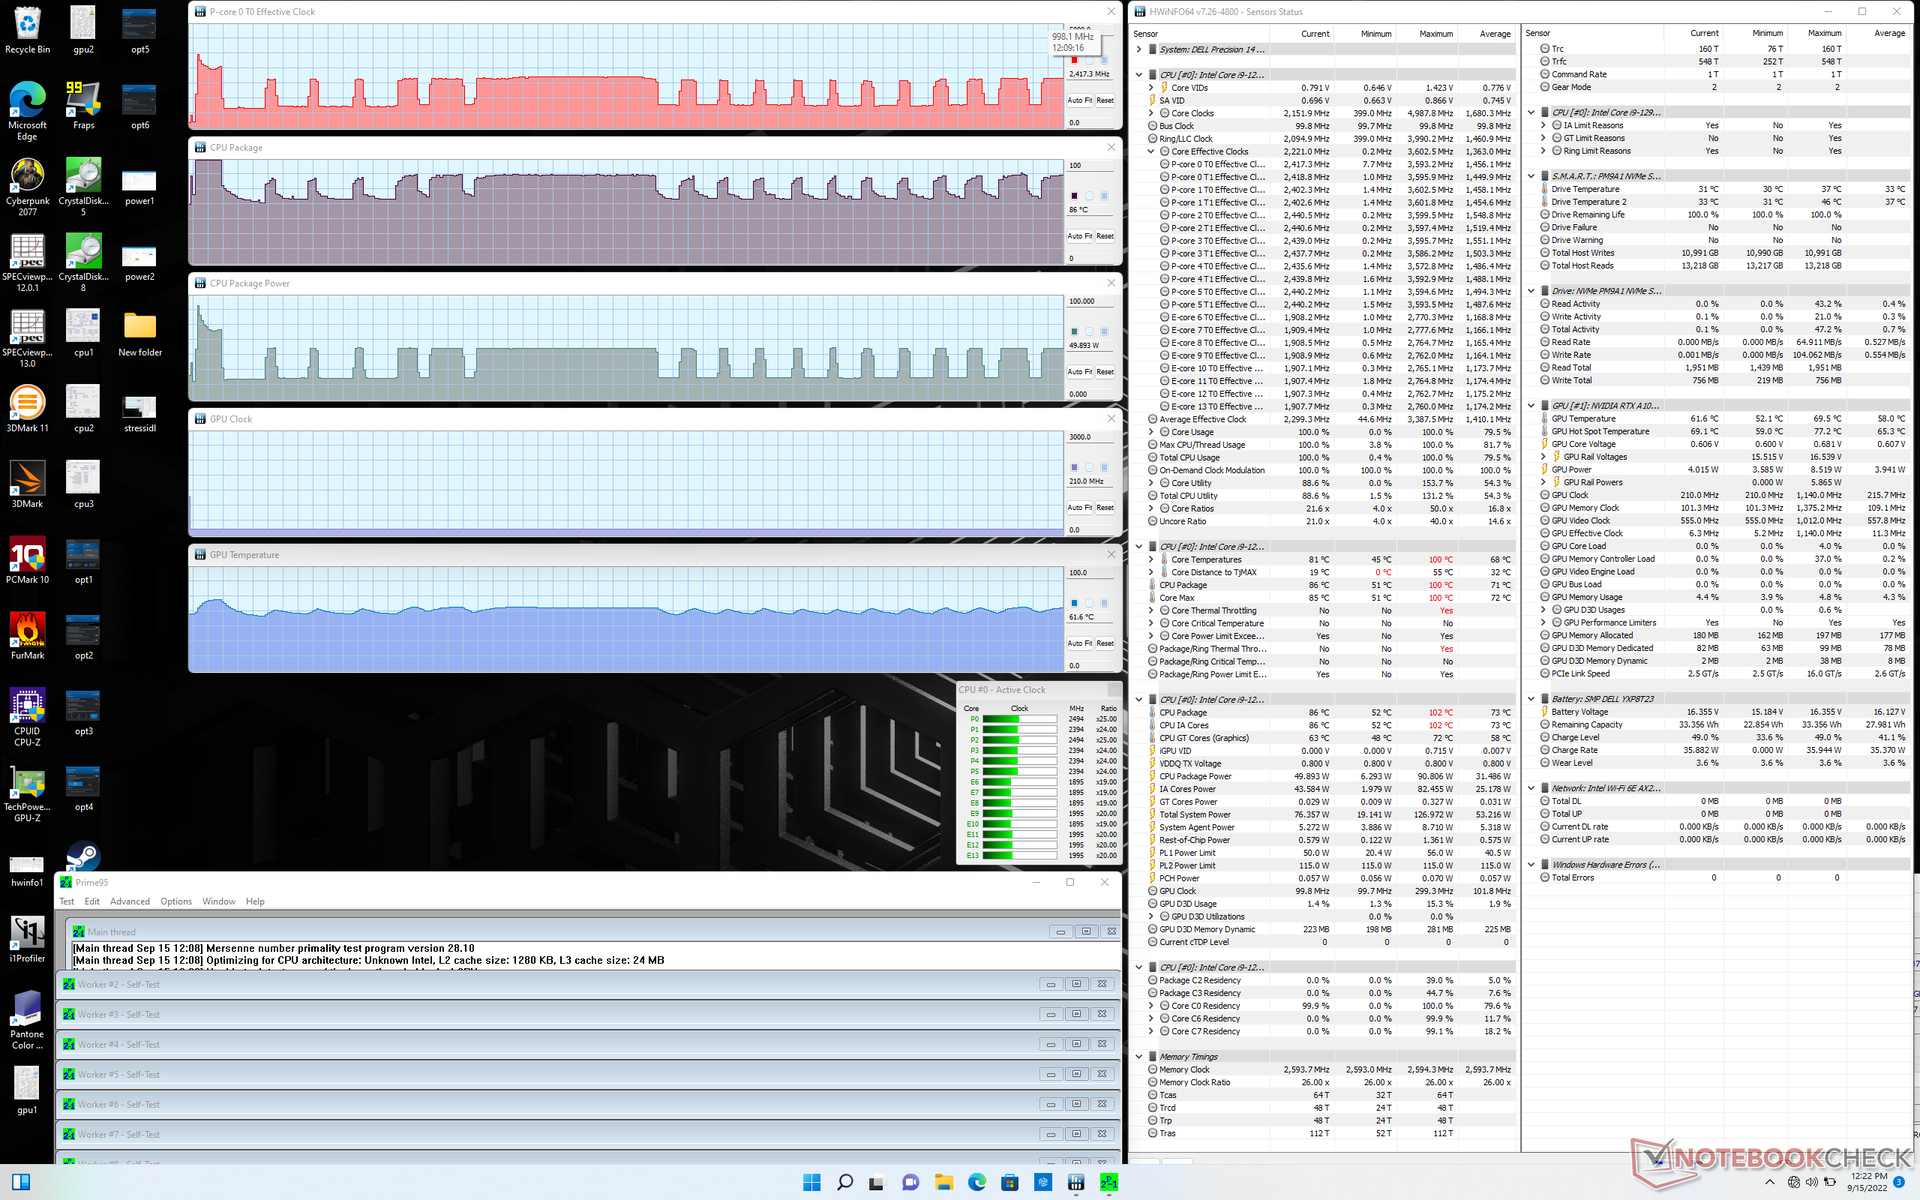
| Fréquence CPU (GHz) | Fréquence GPU (MHz) | Température CPU moyenne (°C) | Température GPU moyenne (°C) | |
| Système au repos | -- | -- | 54 | 53 |
| Prime95 Stress | 1.0 - 2.4 | -- | 61 - 80 | ~61 |
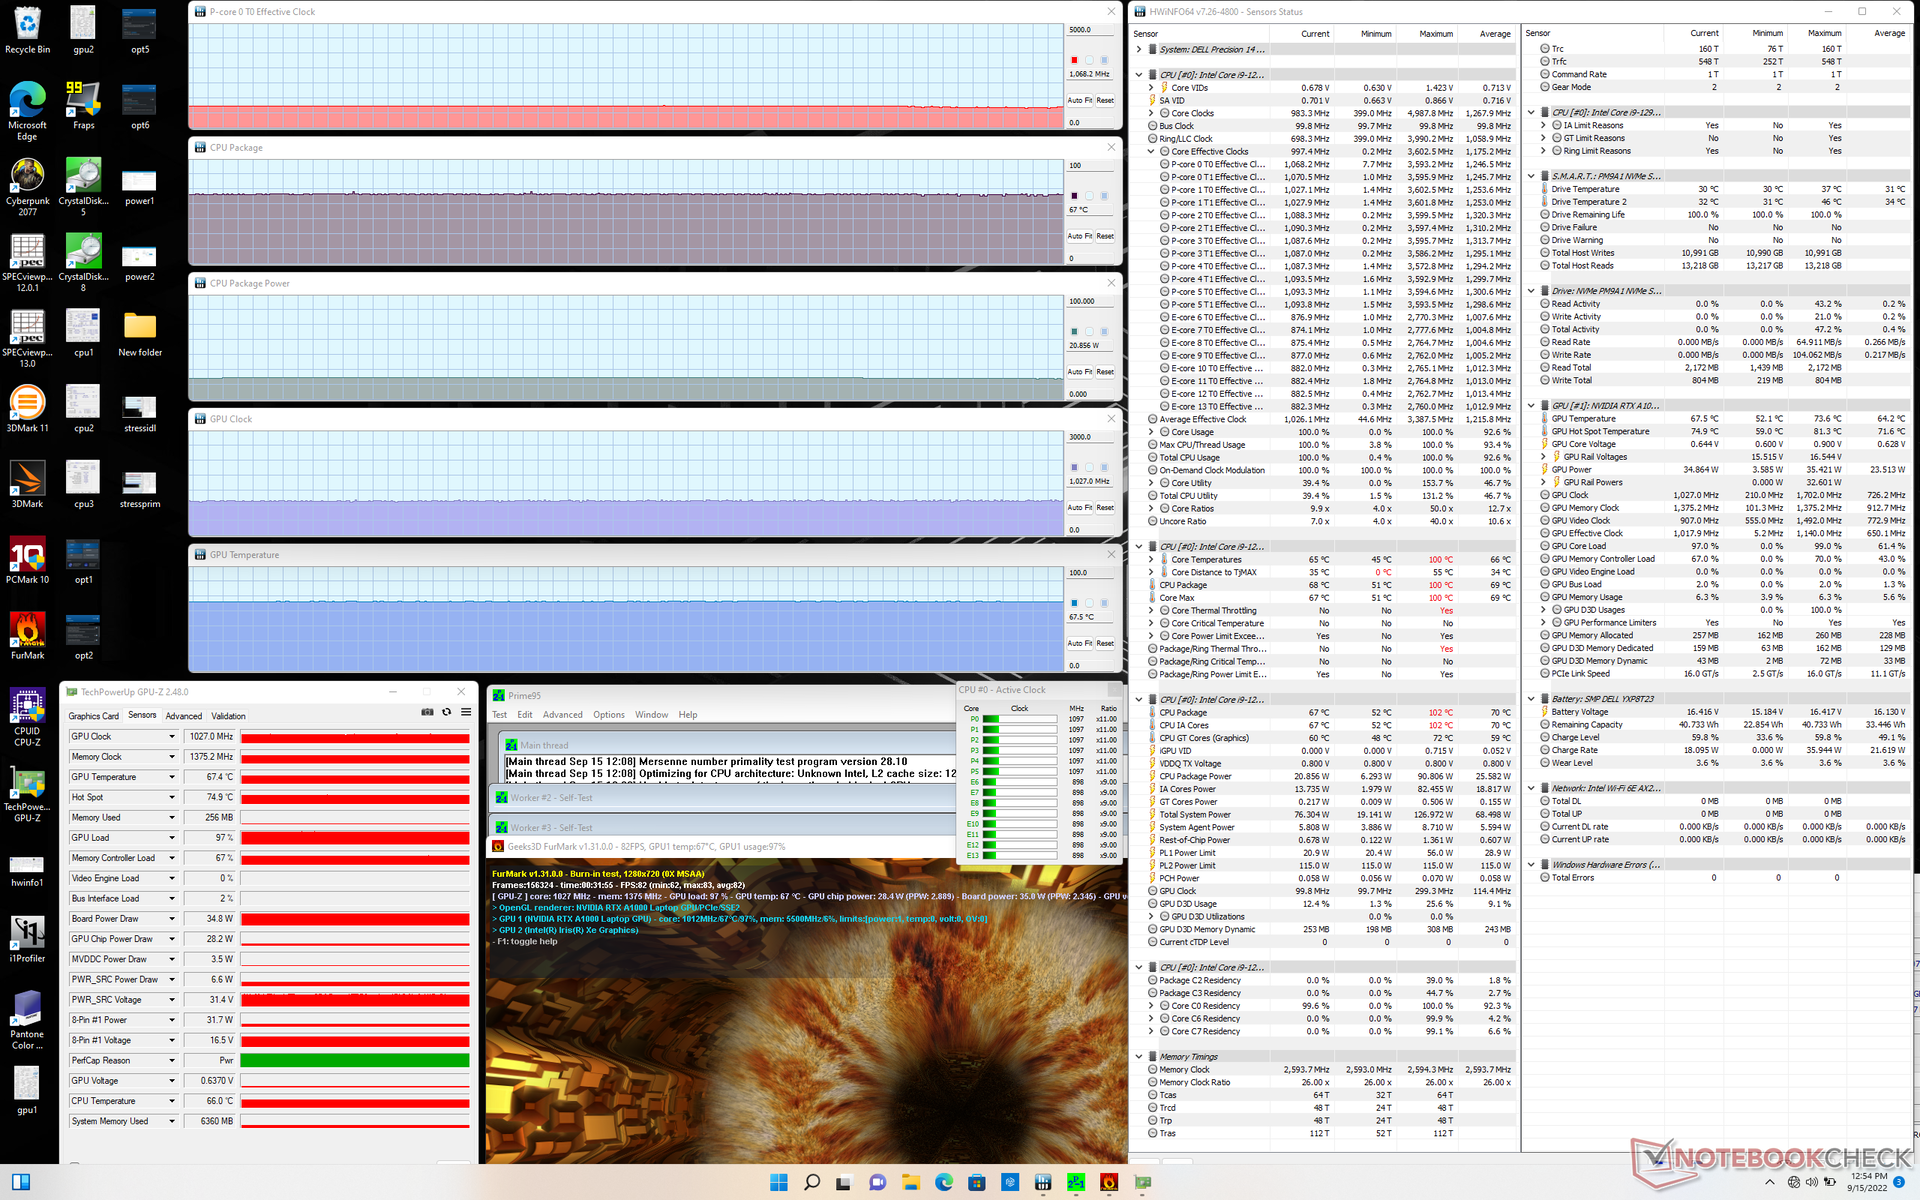
| Prime95+ FurMark Stress | 1.1 | 1027 | 67 | 68 |
| Witcher 3 Stress | 1.0 | 1387 | 82 | 71 |
Haut-parleurs
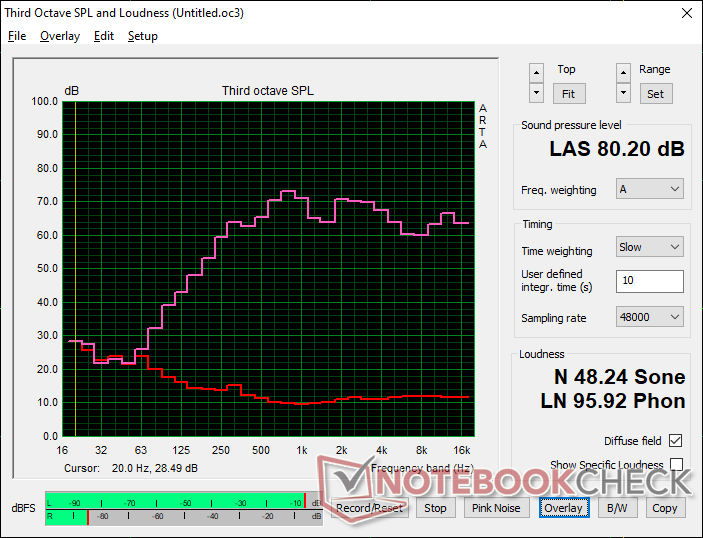
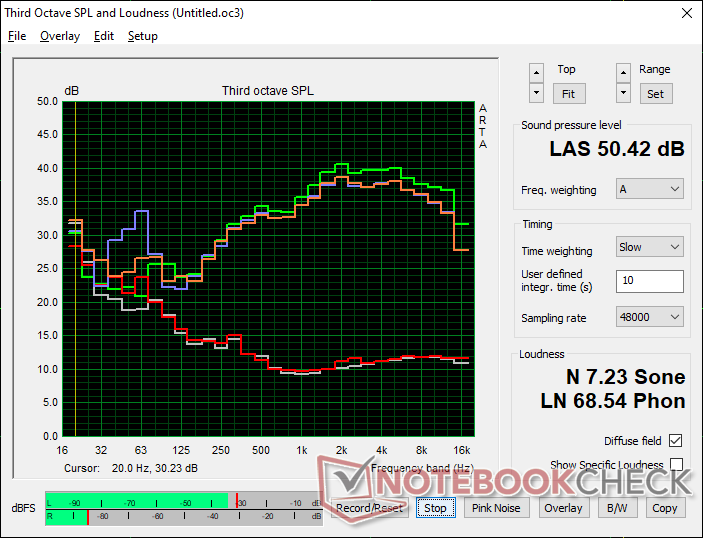
Dell Precision 5000 5470 analyse audio
(±) | le niveau sonore du haut-parleur est moyen mais bon (80.2# dB)
Basses 100 - 315 Hz
(±) | basse réduite - en moyenne 12.9% inférieure à la médiane
(±) | la linéarité des basses est moyenne (10.1% delta à la fréquence précédente)
Médiums 400 - 2000 Hz
(+) | médiane équilibrée - seulement 4.2% de la médiane
(+) | les médiums sont linéaires (6.5% delta à la fréquence précédente)
Aiguës 2 - 16 kHz
(+) | des sommets équilibrés - à seulement 3.4% de la médiane
(+) | les aigus sont linéaires (3.9% delta à la fréquence précédente)
Globalement 100 - 16 000 Hz
(+) | le son global est linéaire (12.9% différence à la médiane)
Par rapport à la même classe
» 21% de tous les appareils testés de cette catégorie étaient meilleurs, 6% similaires, 72% pires
» Le meilleur avait un delta de 7%, la moyenne était de 17%, le pire était de 35%.
Par rapport à tous les appareils testés
» 12% de tous les appareils testés étaient meilleurs, 3% similaires, 85% pires
» Le meilleur avait un delta de 4%, la moyenne était de 23%, le pire était de 134%.
Apple MacBook Pro 16 2021 M1 Pro analyse audio
(+) | les haut-parleurs peuvent jouer relativement fort (84.7# dB)
Basses 100 - 315 Hz
(+) | bonne basse - seulement 3.8% loin de la médiane
(+) | les basses sont linéaires (5.2% delta à la fréquence précédente)
Médiums 400 - 2000 Hz
(+) | médiane équilibrée - seulement 1.3% de la médiane
(+) | les médiums sont linéaires (2.1% delta à la fréquence précédente)
Aiguës 2 - 16 kHz
(+) | des sommets équilibrés - à seulement 1.9% de la médiane
(+) | les aigus sont linéaires (2.7% delta à la fréquence précédente)
Globalement 100 - 16 000 Hz
(+) | le son global est linéaire (4.6% différence à la médiane)
Par rapport à la même classe
» 0% de tous les appareils testés de cette catégorie étaient meilleurs, 0% similaires, 100% pires
» Le meilleur avait un delta de 5%, la moyenne était de 17%, le pire était de 45%.
Par rapport à tous les appareils testés
» 0% de tous les appareils testés étaient meilleurs, 0% similaires, 100% pires
» Le meilleur avait un delta de 4%, la moyenne était de 23%, le pire était de 134%.
Gestion de l'énergie
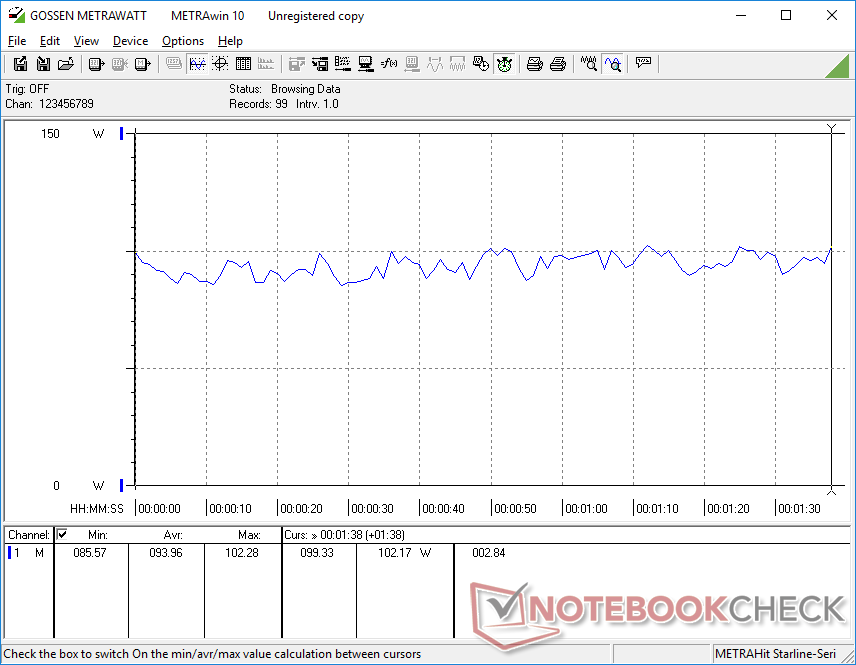
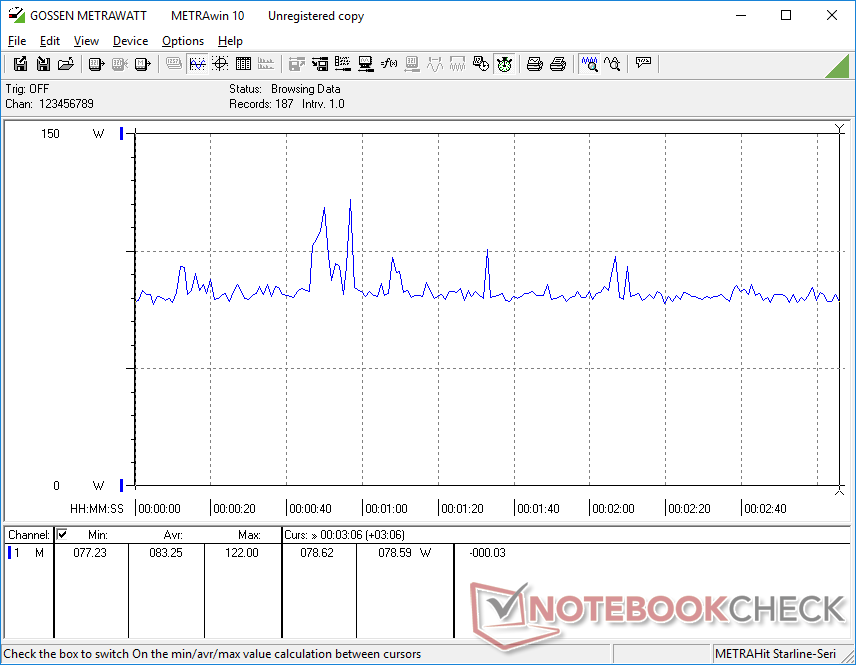
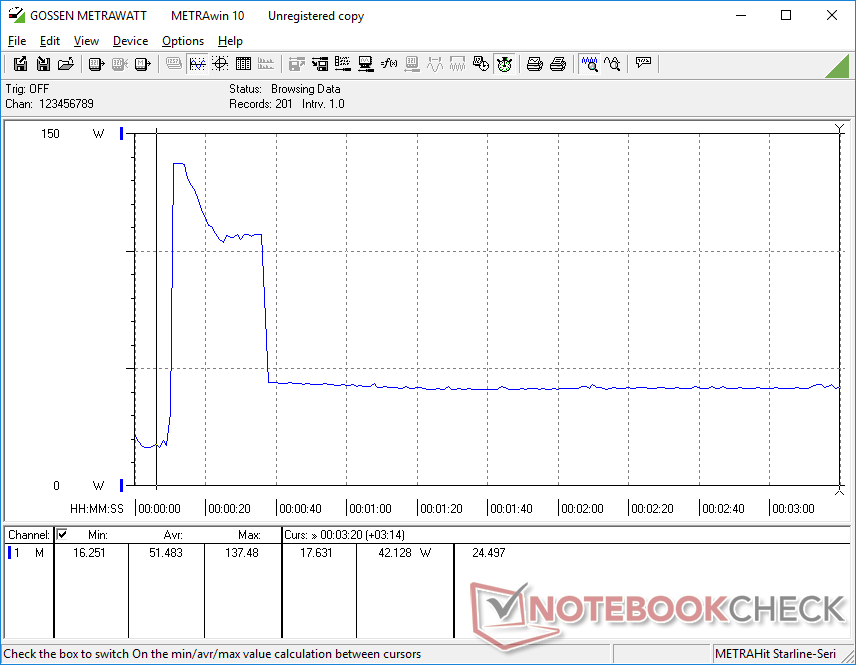
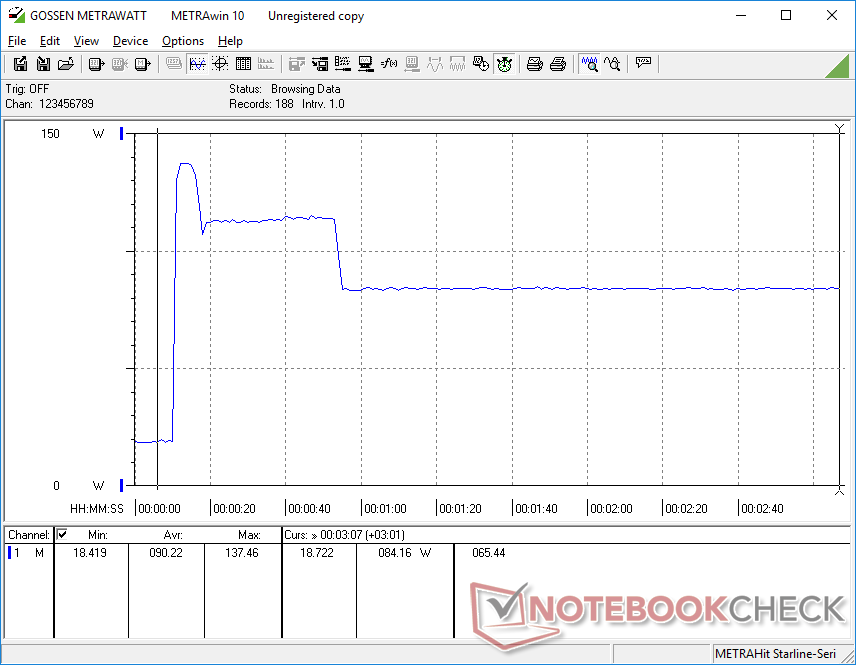
Consommation d'énergie - Une petite machine exigeante
Le fonctionnement au ralenti sur le bureau avec le réglage de la luminosité et le profil d'alimentation les plus bas ne consomme que 4,3 W, tandis que le réglage de la luminosité et le profil d'alimentation les plus élevés avec le dGPU actif consomment près de 19 W. Cependant, lorsque l'on exécute des charges plus exigeantes, comme des jeux, le système devient tout aussi exigeant que le plus grand Precision 5560 avec le GPU RTX A2000 plus rapide mais le CPU i7-11850H plus lent. Le système est généralement plus exigeant que les autres stations de travail de 14 pouces, comme on peut s'y attendre en raison de son matériel interne plus rapide
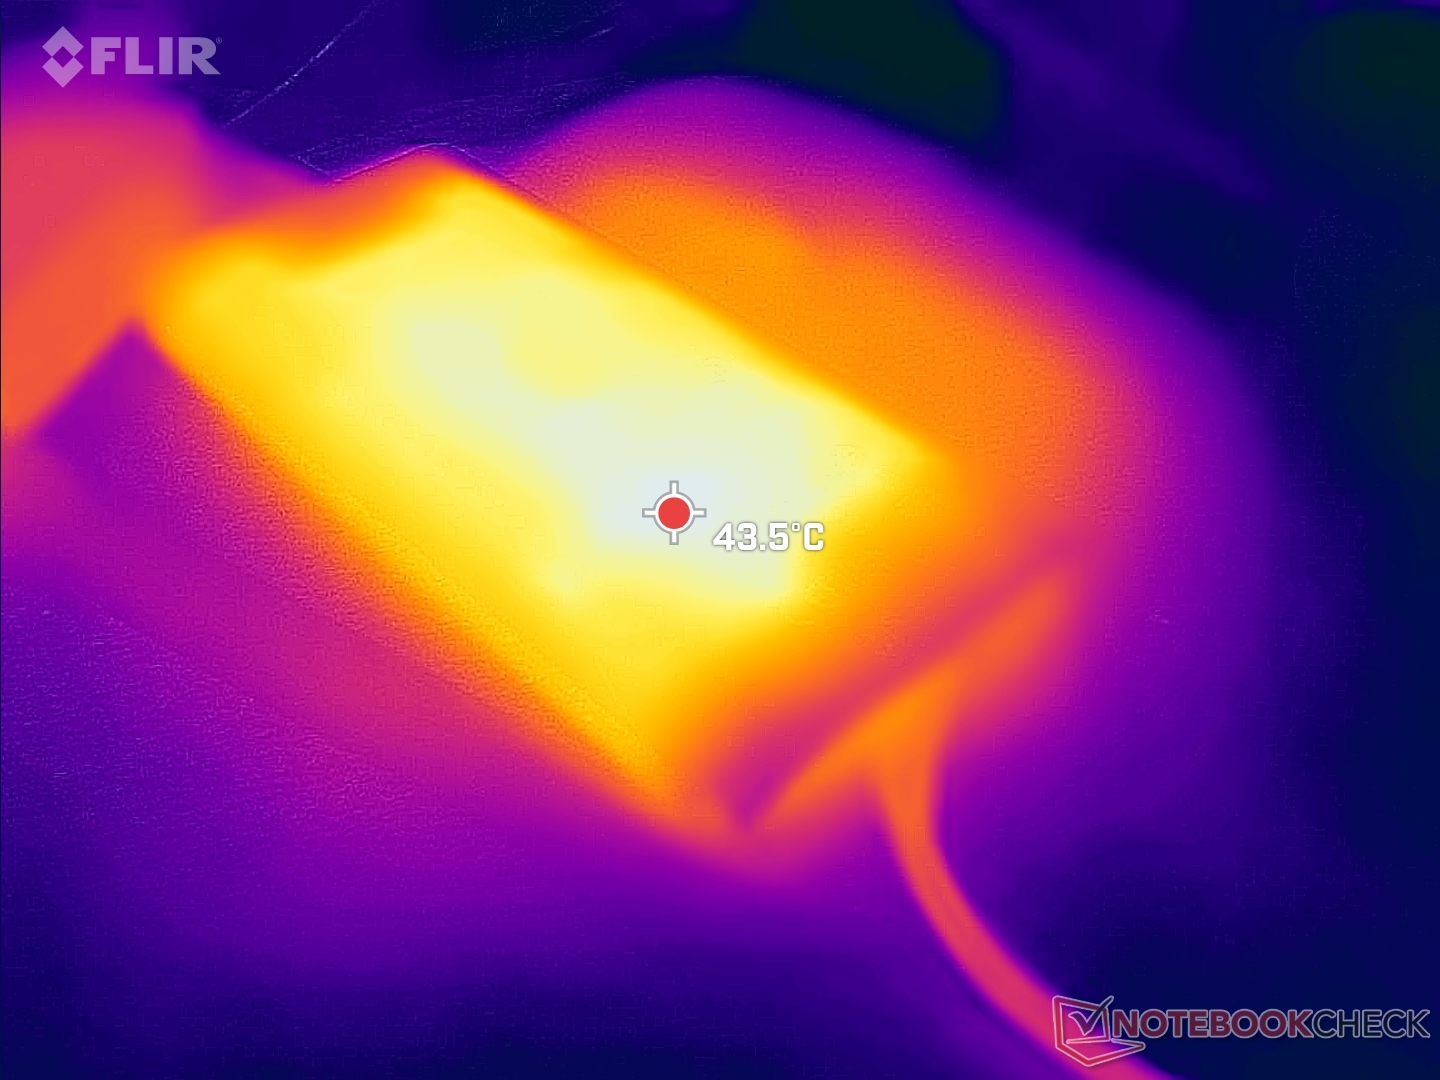
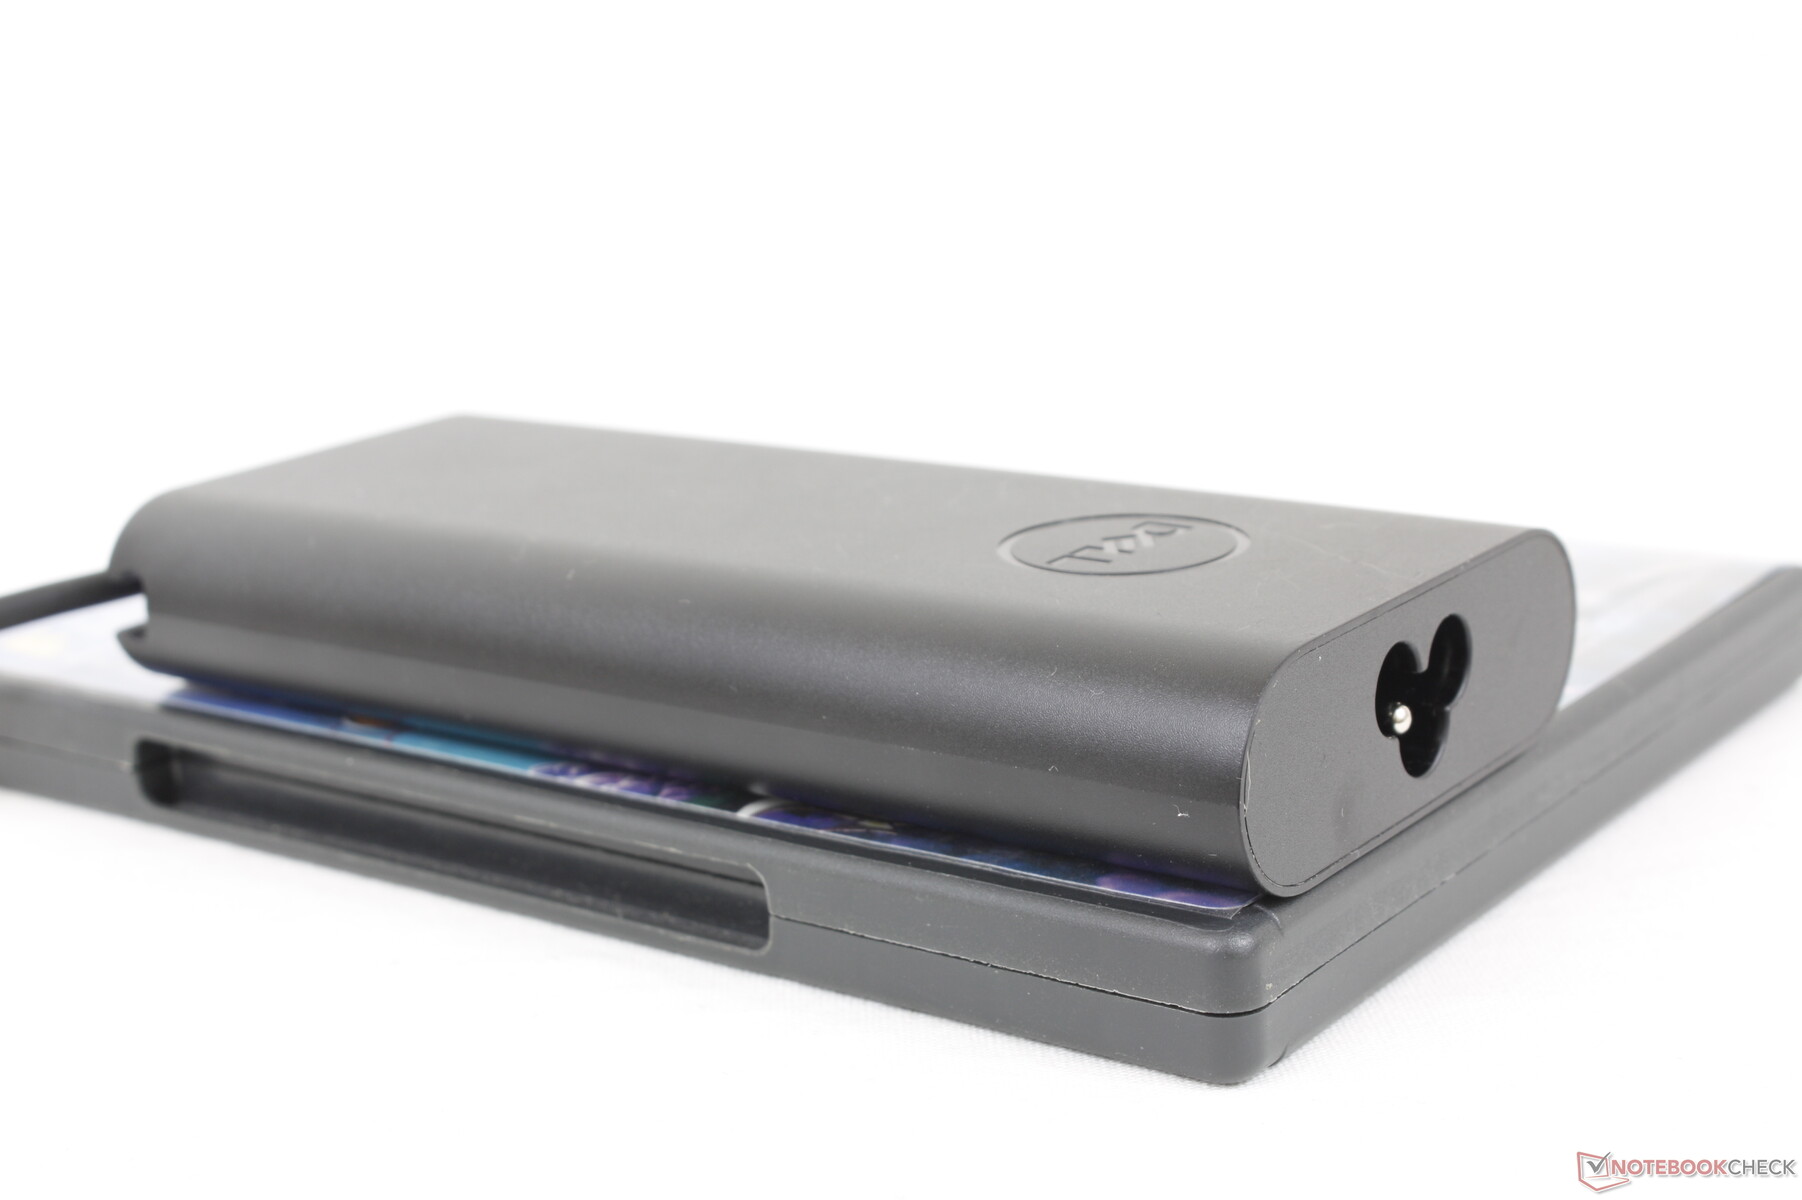
Nous sommes en mesure d'enregistrer un prélèvement maximal de près de 138 W sur l'adaptateur secteur USB-C 130 W de taille petite-moyenne (~14,3 x 6,5 x 2,2 cm) lorsque nous exécutons Prim95. Ce taux n'est que temporaire comme le montrent les captures d'écran ci-dessous en raison des limitations thermiques de la solution de refroidissement. La forme de la courbe de consommation d'énergie correspond étroitement à nos observations de fréquence d'horloge et de consommation d'énergie de la carte ci-dessus.
Notez que les SKUs sans le GPU RTX A1000 discret seront livrés avec un adaptateur USB-C AC plus petit de 90 W au lieu du plus grand de 130 W.
| Éteint/en veille | |
| Au repos | |
| Fortement sollicité |
|
Légende:
min: | |
| Dell Precision 5000 5470 i9-12900H, RTX A1000 Laptop GPU, Samsung PM9A1 MZVL21T0HCLR, IPS, 2560x1600, 14" | Lenovo ThinkPad P15v G2 21A9000XGE i7-11800H, T1200 Laptop GPU, Toshiba XG6 KXG6AZNV512G, IPS LED, 1920x1080, 15.6" | Dell Precision 5000 5560 i7-11850H, RTX A2000 Laptop GPU, Samsung PM9A1 MZVL22T0HBLB, IPS, 3840x2400, 15.6" | Lenovo ThinkPad P14s G2 AMD R7 PRO 5850U, Vega 8, SK Hynix PC711 1TB HFS001TDE9X081N, IPS LED, 3840x2160, 14" | HP ZBook Firefly 14 G8 2C9Q2EA i7-1165G7, T500 Laptop GPU, Toshiba XG6 KXG60ZNV1T02, IPS, 1920x1080, 14" | HP ZBook Firefly 14 G7 i7-10610U, Quadro P520, Toshiba XG6 KXG60ZNV512G, IPS, 1920x1080, 14" | |
|---|---|---|---|---|---|---|
| Power Consumption | 1% | -22% | 35% | 40% | 30% | |
| Idle Minimum * (Watt) | 4.3 | 5.96 -39% | 6.2 -44% | 4.49 -4% | 3.1 28% | 3.3 23% |
| Idle Average * (Watt) | 8.9 | 8.37 6% | 13.9 -56% | 9.62 -8% | 4.7 47% | 9.3 -4% |
| Idle Maximum * (Watt) | 18.9 | 9.05 52% | 23.8 -26% | 10.24 46% | 8.6 54% | 12.1 36% |
| Load Average * (Watt) | 94 | 91.82 2% | 95.7 -2% | 31.56 66% | 64.8 31% | 59.4 37% |
| Witcher 3 ultra * (Watt) | 83.2 | 102 -23% | 87 -5% | 43.7 47% | 59.6 28% | 52.7 37% |
| Load Maximum * (Watt) | 137.5 | 126.38 8% | 132.6 4% | 52.37 62% | 68.5 50% | 69.4 50% |
* ... Moindre est la valeur, meilleures sont les performances
Power Consumption Witcher 3 / Stresstest
Power Consumption external Monitor
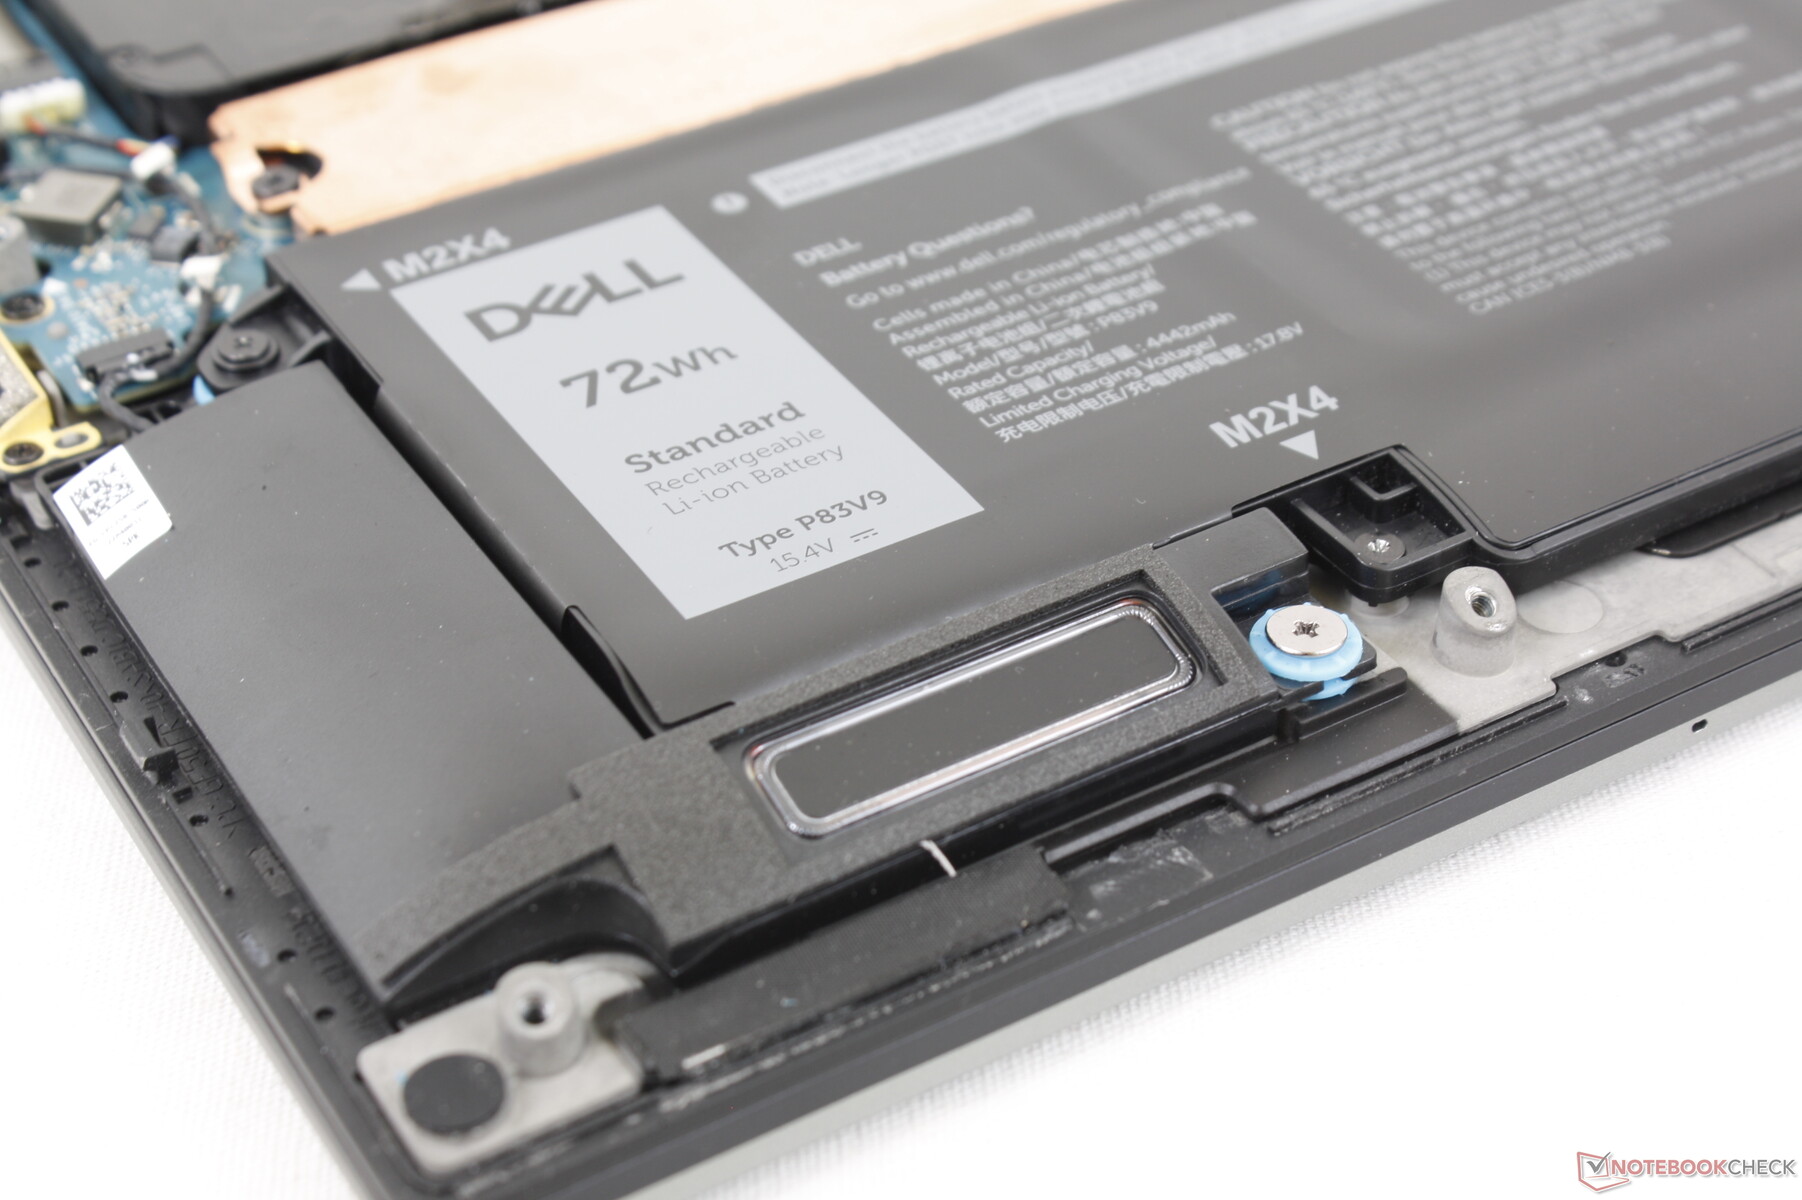
Autonomie de la batterie
La capacité de la batterie est relativement importante pour un ordinateur portable ultrafin de 14 pouces, avec 72 Wh. L'autonomie du WLAN est d'un peu plus de 9,5 heures avec une charge complète, soit quelques heures de moins que ce que nous avons enregistré sur le HP ZBook Firefly 14 G8 équipé de la série Core U, plus lent.
Le chargement de la batterie vide à la pleine capacité prend environ 2 heures.
| Dell Precision 5000 5470 i9-12900H, RTX A1000 Laptop GPU, 72 Wh | Lenovo ThinkPad P15v G2 21A9000XGE i7-11800H, T1200 Laptop GPU, 68 Wh | Dell Precision 5000 5560 i7-11850H, RTX A2000 Laptop GPU, 86 Wh | Lenovo ThinkPad P14s G2 AMD R7 PRO 5850U, Vega 8, 50 Wh | HP ZBook Firefly 14 G8 2C9Q2EA i7-1165G7, T500 Laptop GPU, 53 Wh | HP ZBook Firefly 14 G7 i7-10610U, Quadro P520, 53 Wh | |
|---|---|---|---|---|---|---|
| Autonomie de la batterie | -8% | 4% | 7% | 162% | 21% | |
| Reader / Idle (h) | 14.7 | 17.2 17% | 12 -18% | |||
| WiFi v1.3 (h) | 9.6 | 7.5 -22% | 6.3 -34% | 8.3 -14% | 12.8 33% | 10.1 5% |
| Load (h) | 1.1 | 0.9 -18% | 1.8 64% | 1.4 27% | 4.3 291% | 1.5 36% |
| H.264 (h) | 8 | 10.6 | 12.5 |
Points positifs
Points négatifs
Verdict - Uber Powerful sans la taille Uber
Le modèle Precision 5470 peut être décrit comme une station de travail fine et légère dotée du processeur d'un ordinateur portable de jeu épais et lourd. Vous ne trouverez pas d'autre station de travail de 14 pouces aussi compacte avec le même CPU Core i9-12900H et même GPU Nvidia RTX discret que ce Dell. Si vous cherchez à maximiser les performances tout en maintenant un poids et une taille aussi bas que possible, alors le Precision 5470 peut valoir la peine d'être considéré.
Le Precision 5470 est plus rapide et plus puissant que sa petite taille ne le laisse supposer. C'est le modèle de station de travail qu'il vous faut si vous voulez conserver des performances aussi élevées que possible dans un petit format de 14 pouces.
Malheureusement, le système est un peu trop ambitieux en matière de performances. Son Core i9-12900H est moins performant que celui d'autres ordinateurs portables équipés du même processeur. Il est tout de même rapide par rapport aux autres stations de travail de 14 poucesmais il aurait certainement pu être plus rapide. Nous avons des doutes quant à l'amélioration des performances du Core i9-12900HK par rapport à notre Core i9-12900H, étant donné les fluctuations indésirables de la fréquence d'horloge pendant notre examen. Pendant ce temps, la RTX A1000 montre un potentiel de ray tracing pauvre malgré le fait qu'elle porte le nom RTX, tout comme nos observations avec la GeForce RTX 3050 sur laquelle la A1000 est basée.
L'exigeant CPU de la 12e génération de la série H est directement responsable du bruit relativement fort du ventilateur et de la consommation d'énergie élevée de la Precision 5470. Il peut ressembler et se sentir comme un ordinateur portable de 14 pouces, mais il peut certainement sonner comme un ordinateur portable de jeu à certains moments. Cet inconvénient est courant sur les petits ordinateurs portables hautes performances.
Prix et disponibilité
Le modèle Precision 5470 est désormais largement disponible auprès de revendeurs en ligne tels que Newegg ou Amazon mais uniquement dans des configurations FHD limitées allant de 2 000 à 2 300 dollars américains. Les utilisateurs peuvent à la place acheter directement auprès de Dell qui proposera un plus grand nombre d'options configurables.
Dell Precision 5000 5470
- 09/16/2022 v7 (old)
Allen Ngo
Price comparison

