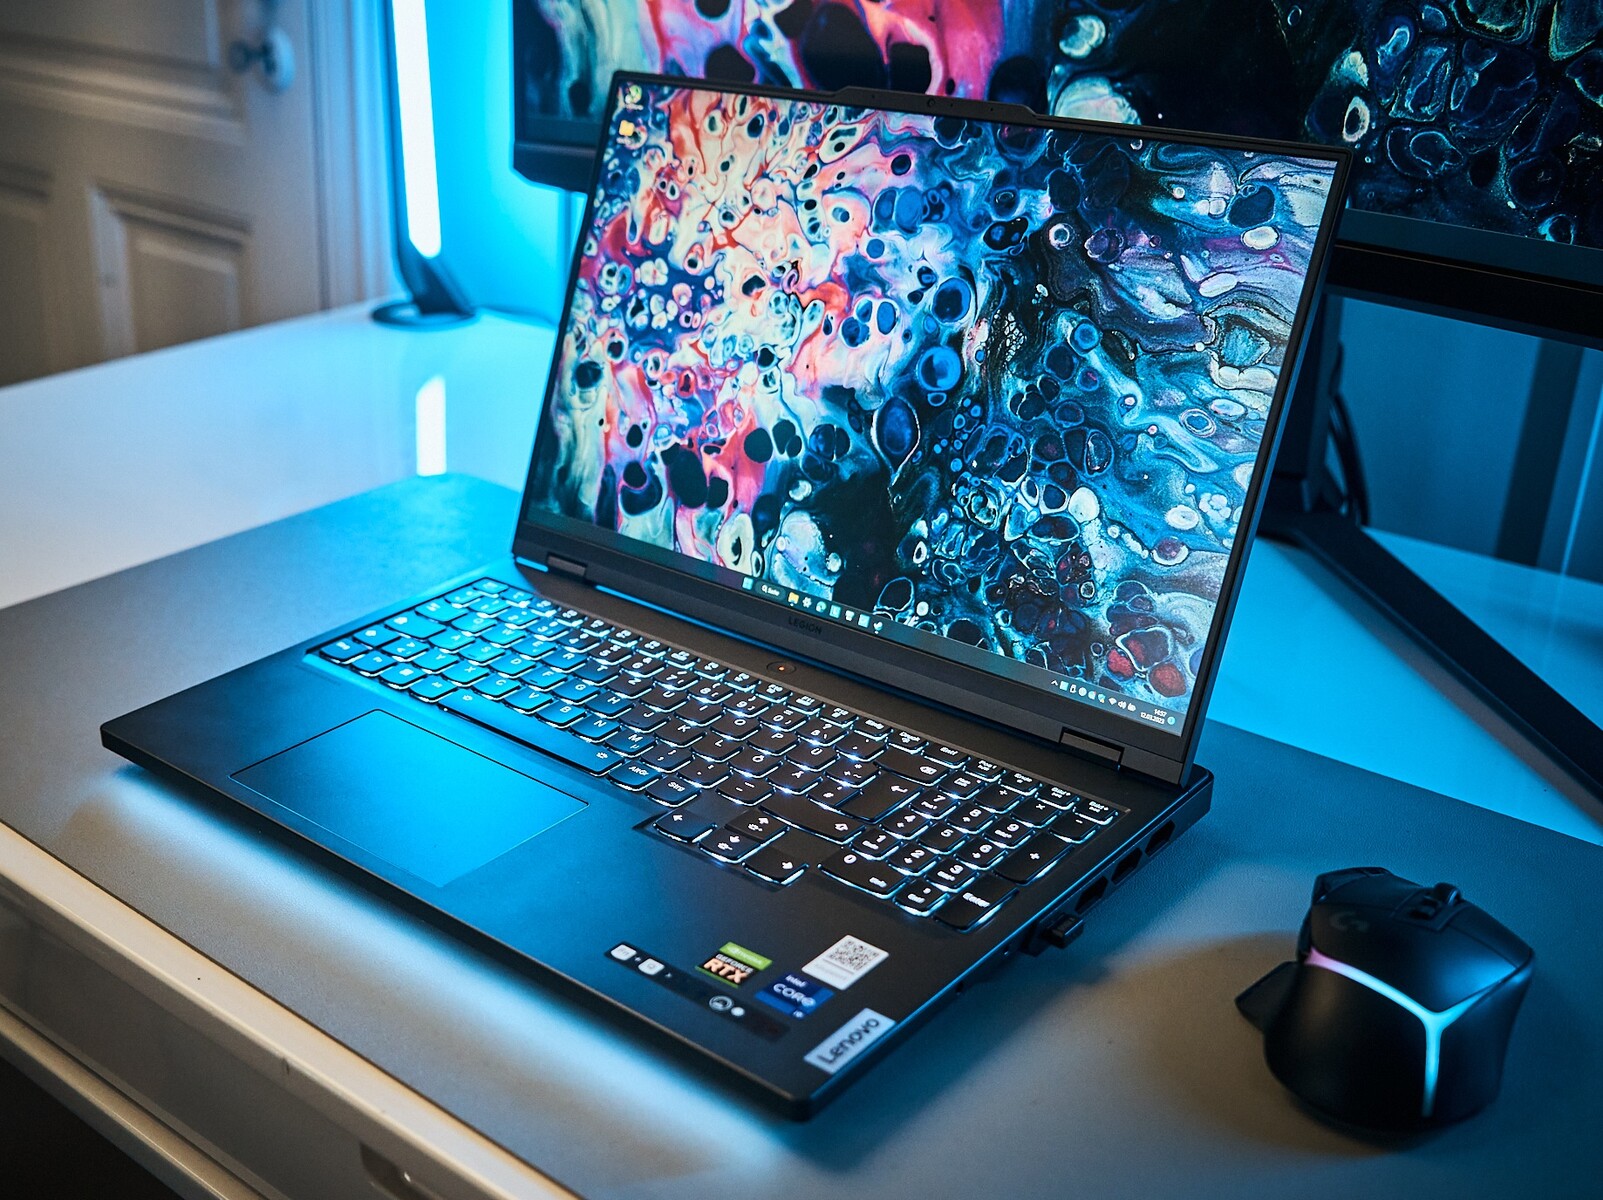
Test du Lenovo Legion Pro 7 16 : la puissance du jeu grâce à la RTX 4090

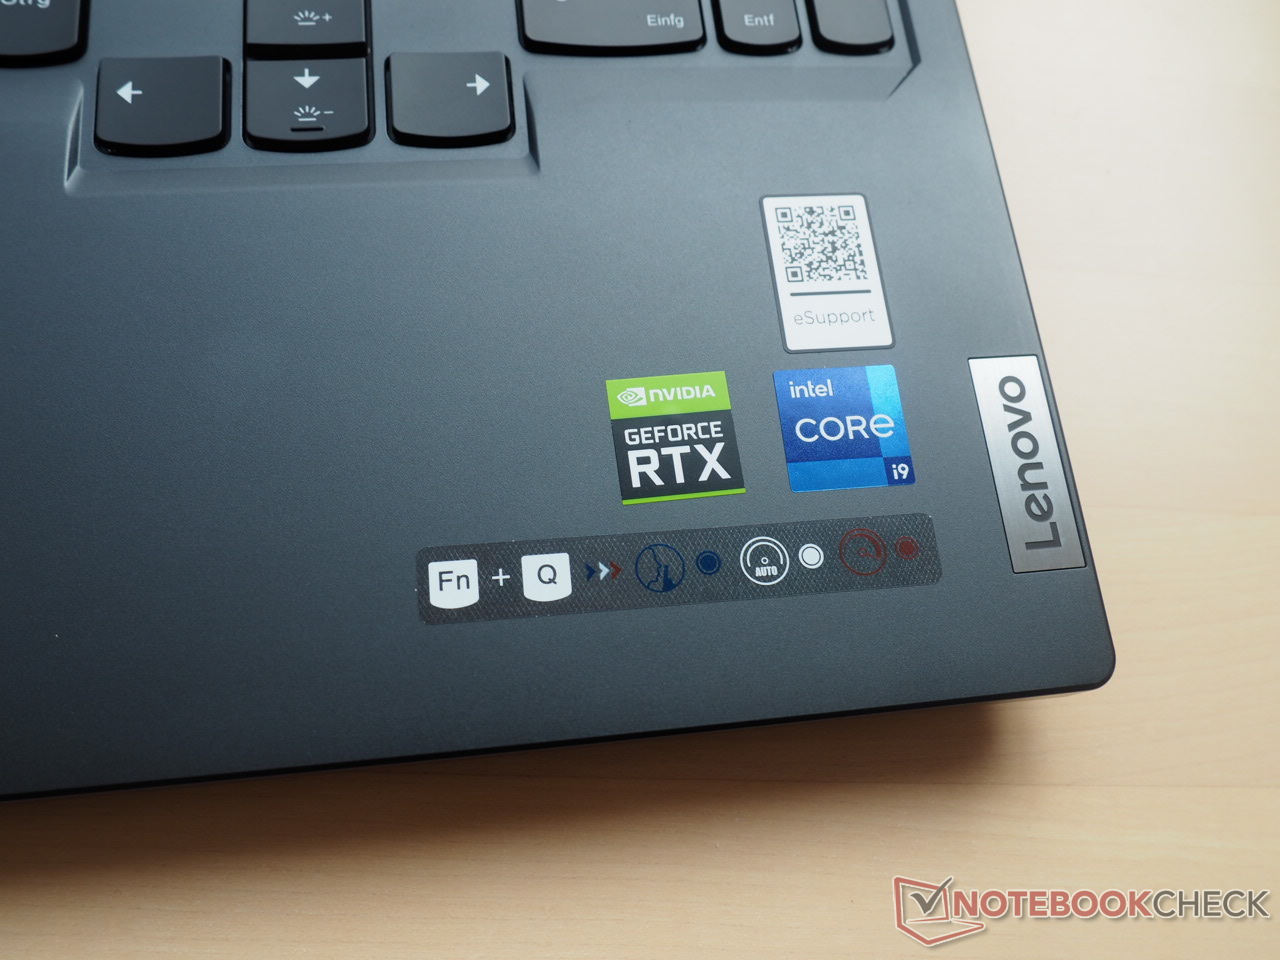
Ce Legion Pro 7 16IRX8H n'est pas seulement l'un des ordinateurs portables de jeu les plus puissants, mais aussi l'un des plus chers. Il faut actuellement débourser au moins 4 500 euros pour la combinaison du Core i9-13900HX, GeForce RTX 4090le prix est de 4 500 euros pour la combinaison du Core i9-13900HX, de la RTX 4090, de 32 Go de RAM (2x 16 Go DDR5-5600), de 2 To de mémoire de masse (2x 1 To NVMe SSD) et d'un écran de 240 Hz (2660 x 1600 pixels). Chaque joueur doit décider s'il veut ou non soutenir la politique tarifaire actuelle du fabricant, qui semble n'avoir aucun lien avec une quelconque inflation.
Les concurrents du Legion Pro 7 comprennent d'autres modèles haut de gamme avec RTX 4090 dans les gammes 16 et 17 pouces, comme le Razer Blade 16le XMG Neo 16xMG Neo 16 Asus Strix Scar 17 et le MSI Titan GT77. Le modèle frère moins cher avec la RTX 4080 figure également dans les tableaux à titre de comparaison.
Comparaison avec les concurrents potentiels
Note | Date | Modèle | Poids | Épaisseur | Taille | Résolution | Prix |
|---|---|---|---|---|---|---|---|
| 88.8 % v7 (old) | 06/23 | Lenovo Legion Pro 7 RTX4090 i9-13900HX, GeForce RTX 4090 Laptop GPU | 2.7 kg | 26 mm | 16.00" | 2560x1600 | |
| 89.8 % v7 (old) | 03/23 | Razer Blade 16 Early 2023 RTX 4090 i9-13950HX, GeForce RTX 4090 Laptop GPU | 2.5 kg | 21.99 mm | 16.00" | 3840x2400 | |
| 88.3 % v7 (old) | 04/23 | Asus ROG Strix Scar 17 G733PY-XS96 R9 7945HX, GeForce RTX 4090 Laptop GPU | 2.9 kg | 28.3 mm | 17.30" | 2560x1440 | |
| 87.7 % v7 (old) | 04/23 | Schenker XMG Neo 16 E23 i9-13900HX, GeForce RTX 4090 Laptop GPU | 2.5 kg | 29.9 mm | 16.00" | 2560x1600 | |
| 89 % v7 (old) | 02/23 | MSI Titan GT77 HX 13VI i9-13950HX, GeForce RTX 4090 Laptop GPU | 3.5 kg | 23 mm | 17.30" | 3840x2160 | |
| 89.4 % v7 (old) | 02/23 | Lenovo Legion Pro 7 16IRX8H i9-13900HX, GeForce RTX 4080 Laptop GPU | 2.7 kg | 26 mm | 16.00" | 2560x1600 |
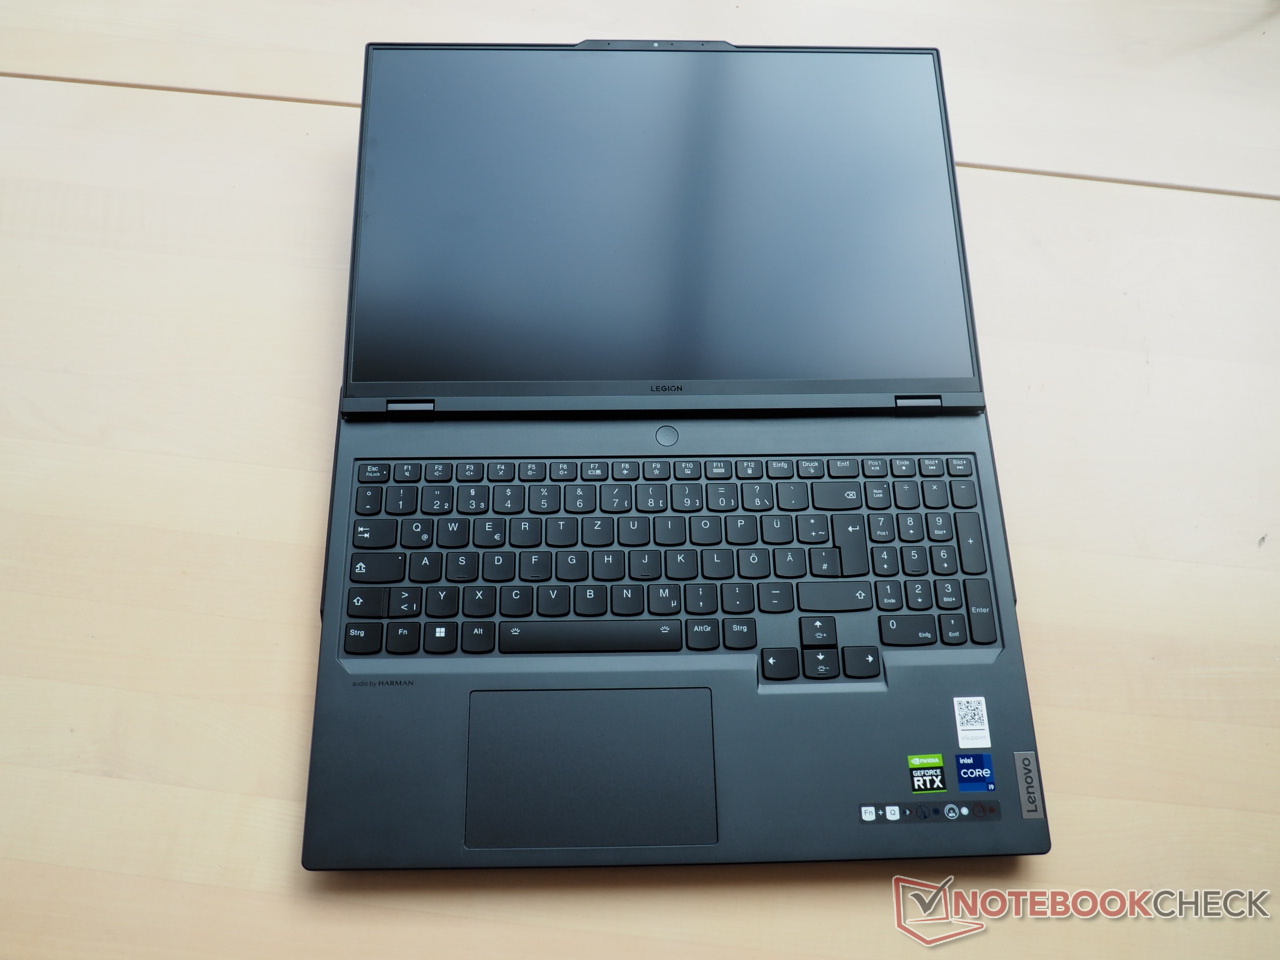
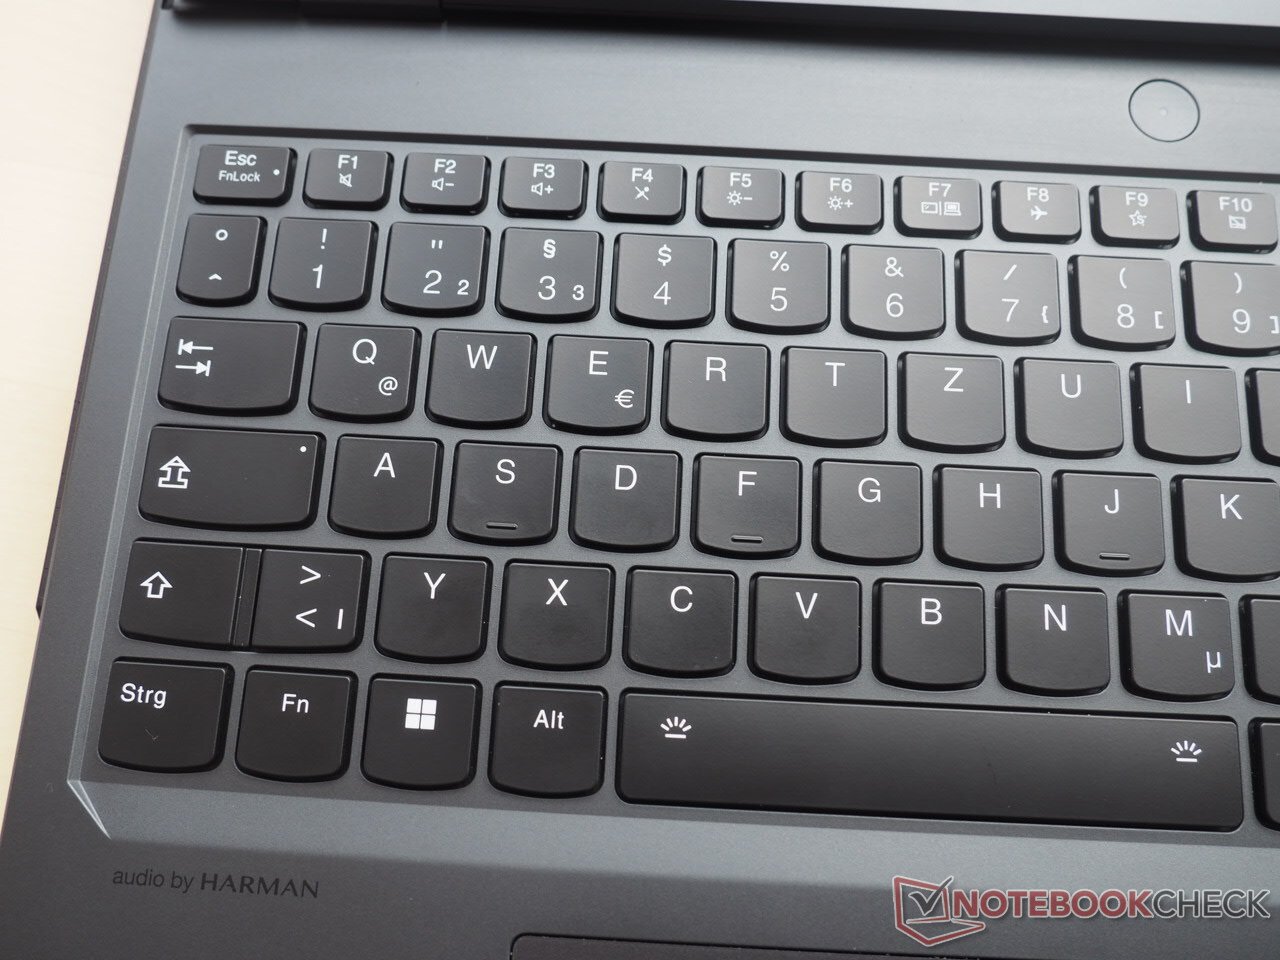
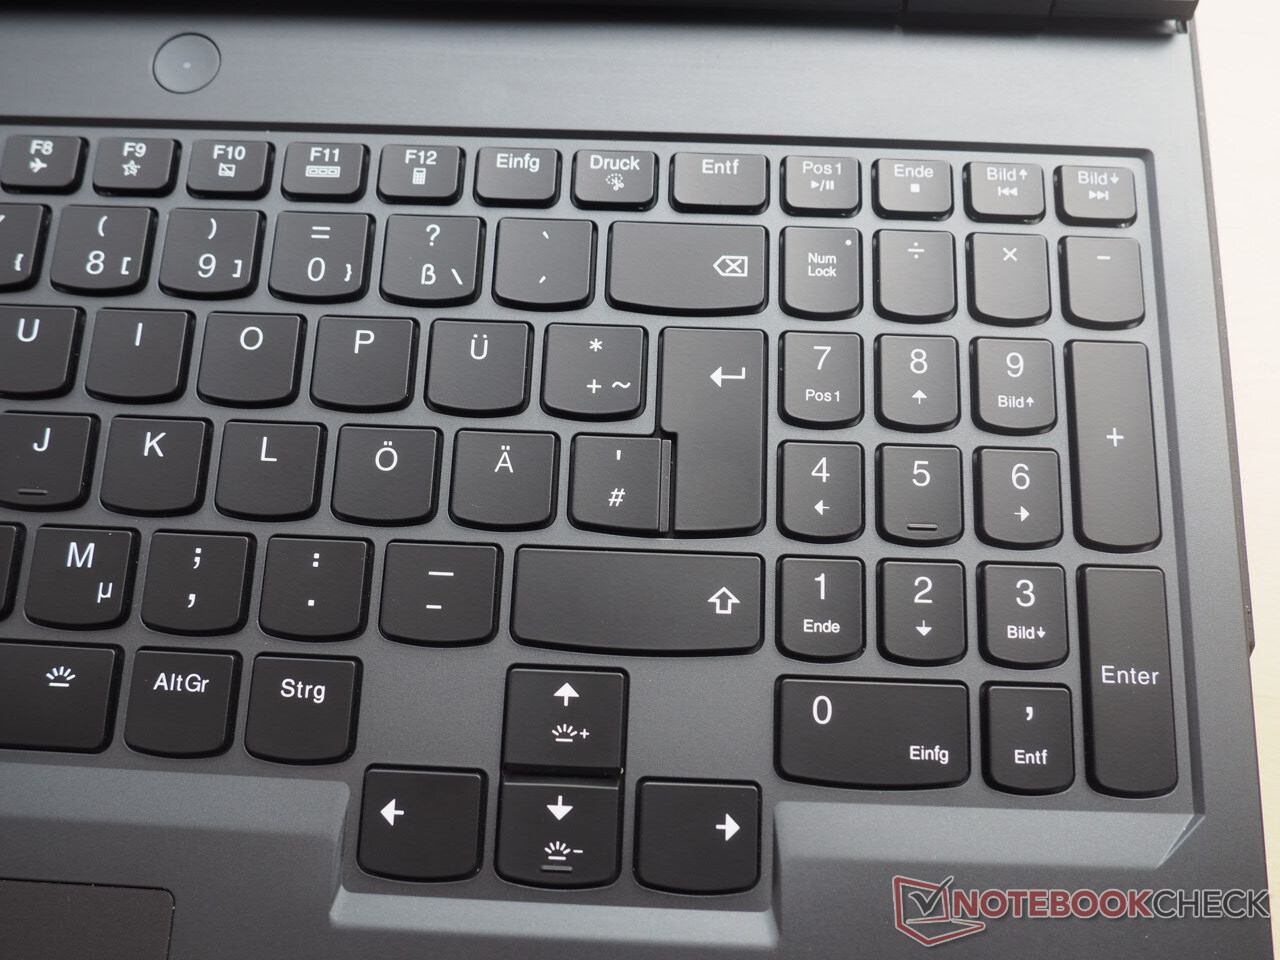
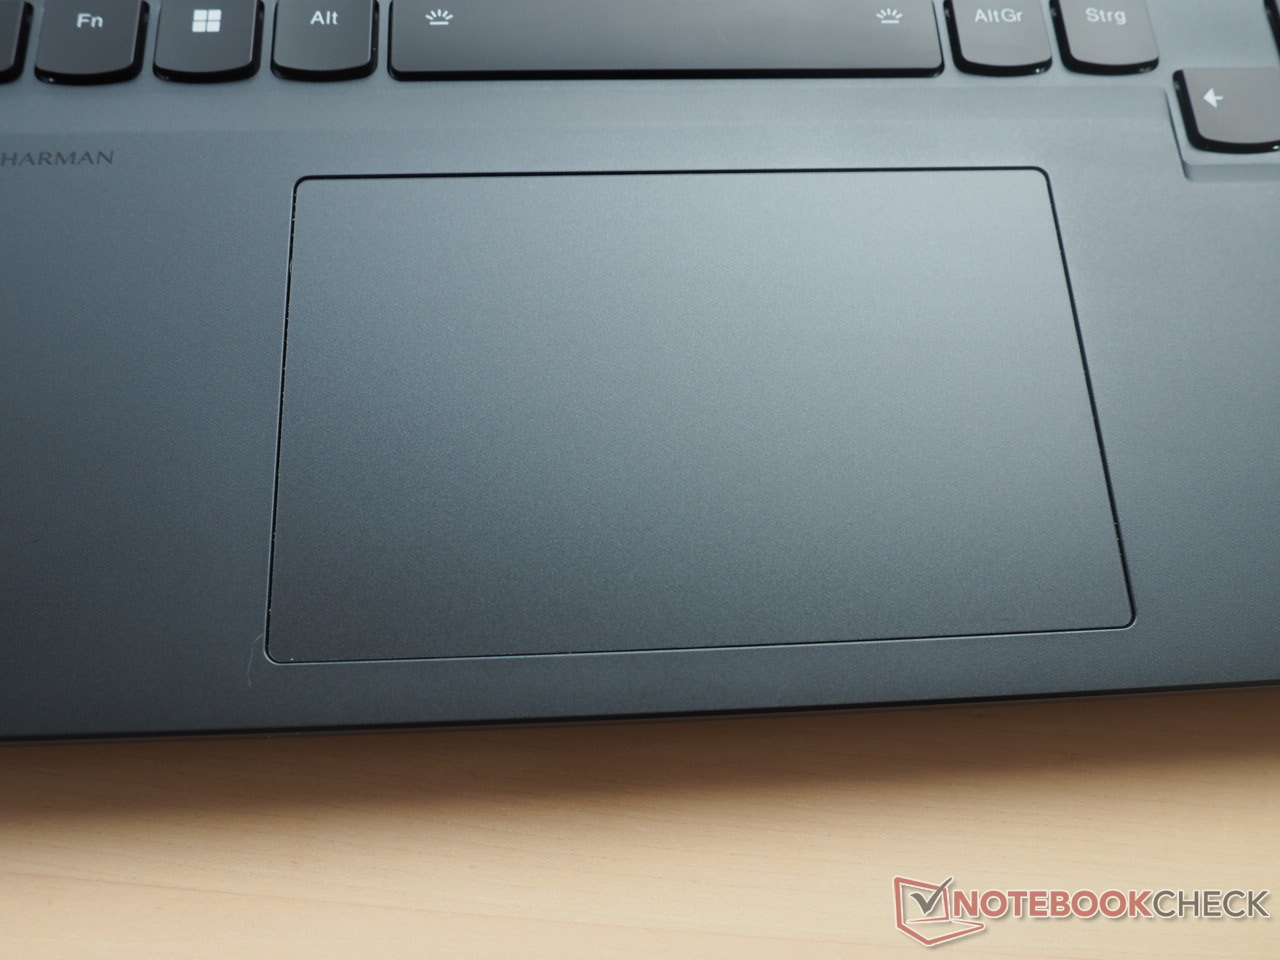
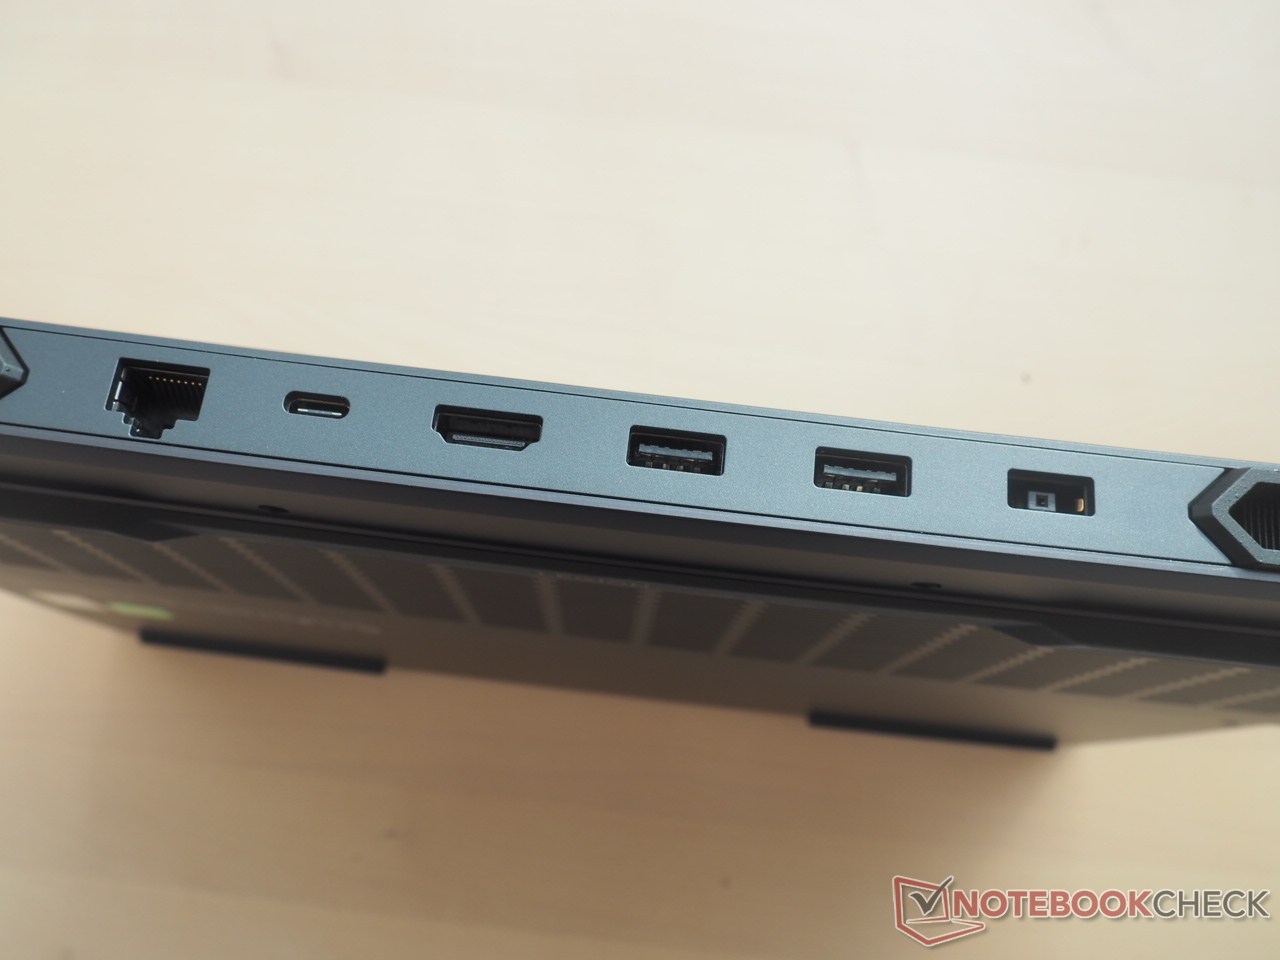
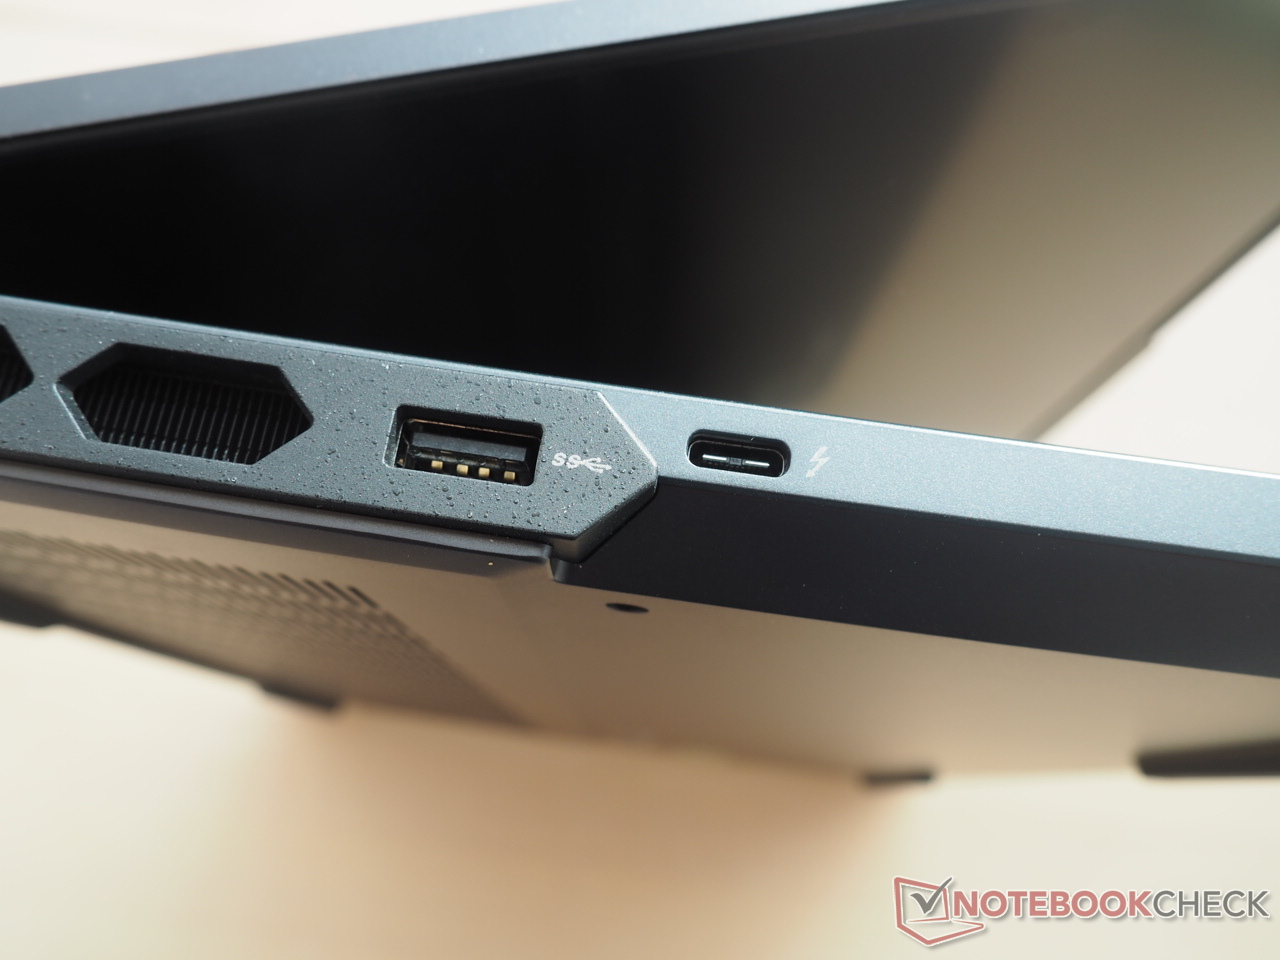
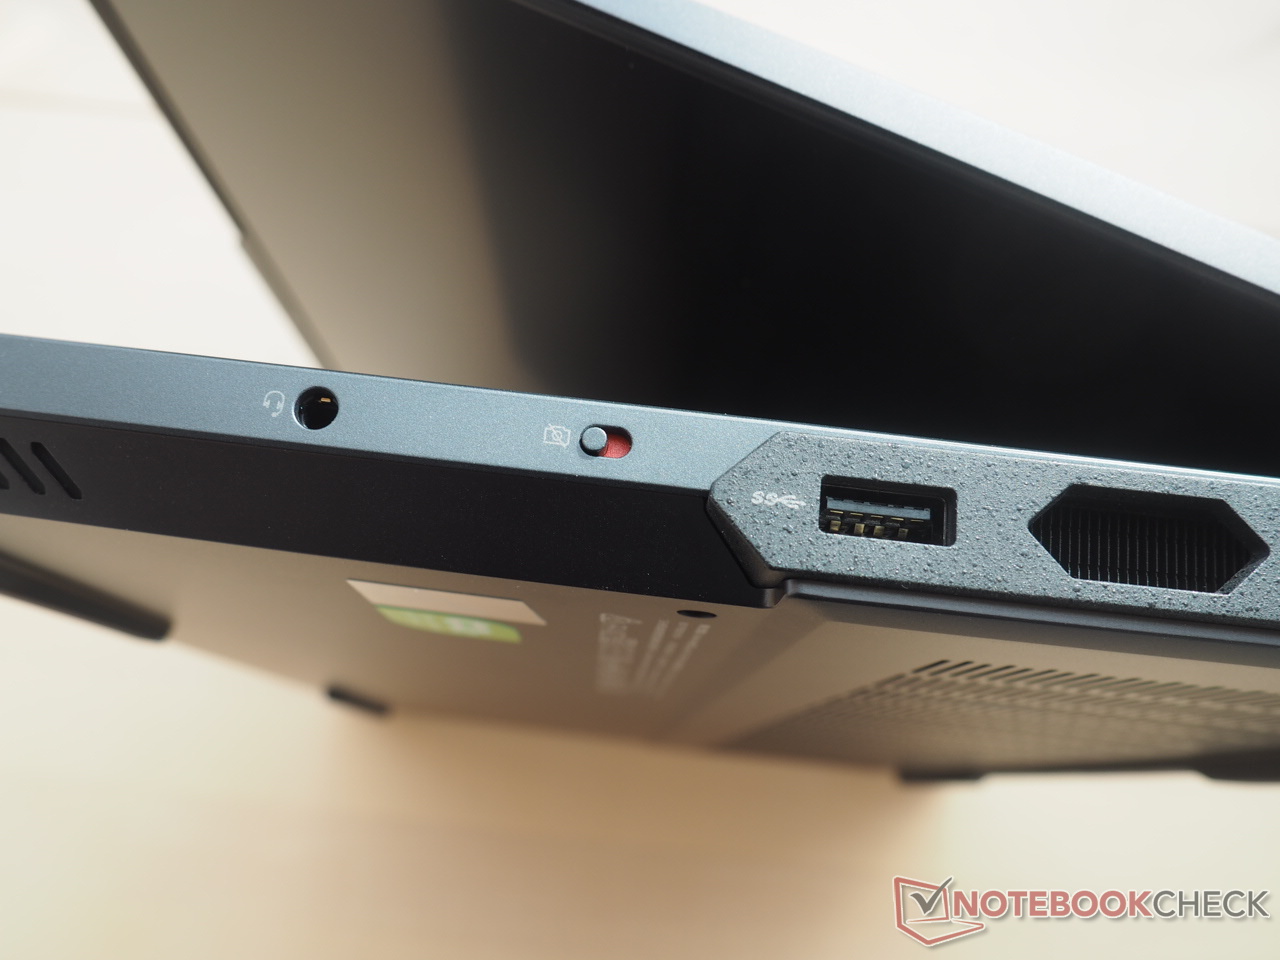
La construction du boîtier étant identique à celle de la variante déjà testée, nous n'entrerons pas dans les détails du châssis, des ports et des périphériques d'entrée dans cet article. Vous pouvez trouver les informations correspondantes dans la revue liée.
Communication
Webcam


Affichage
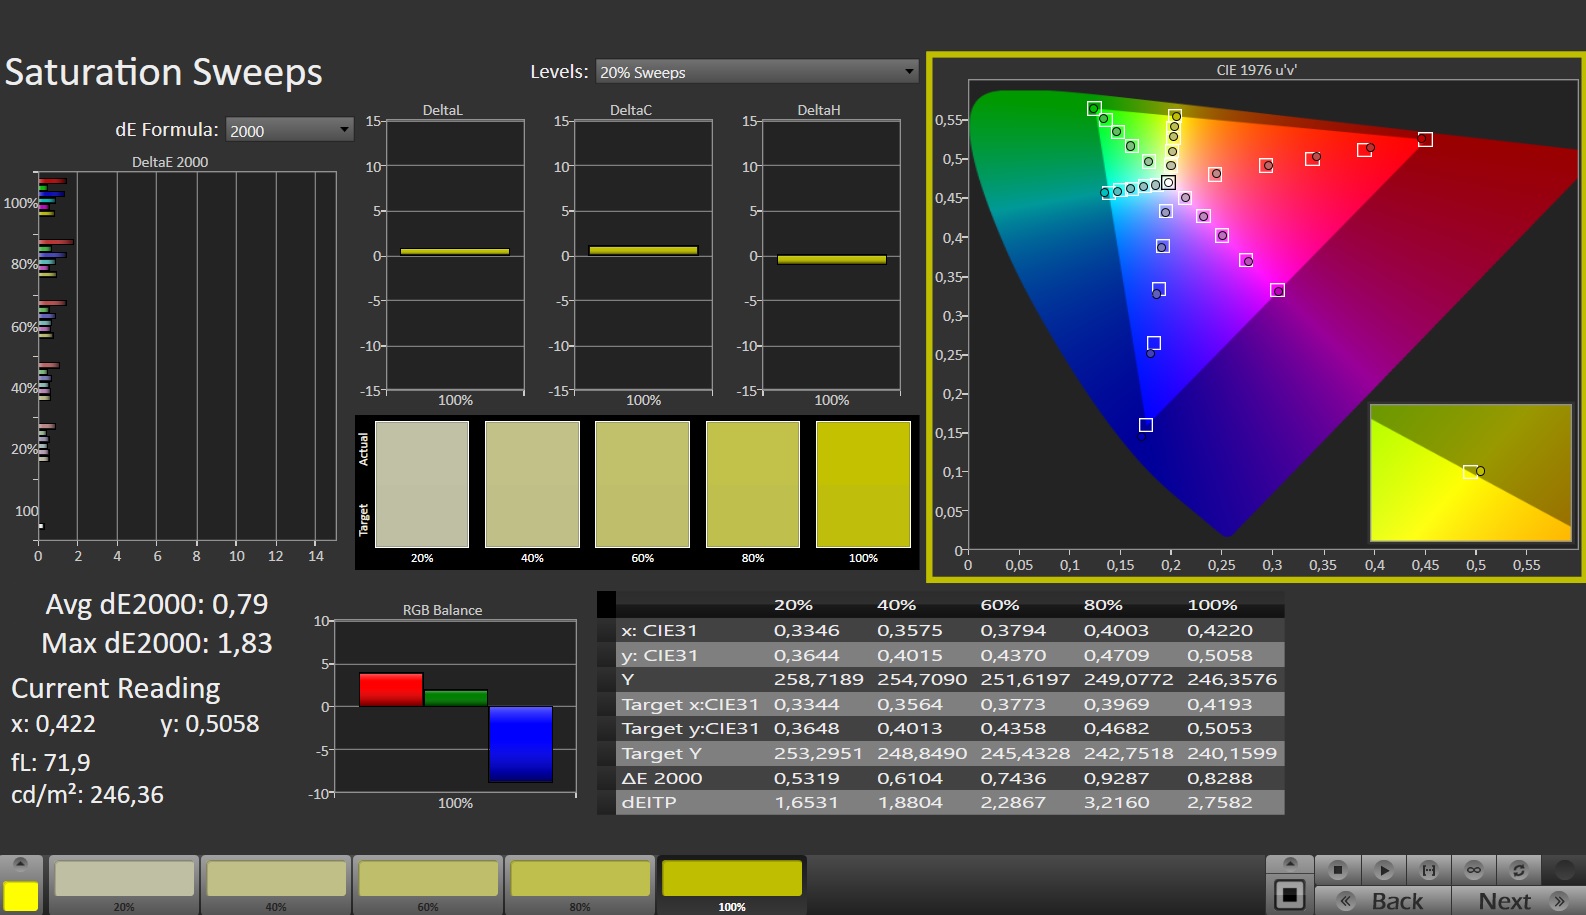
Outre le boîtier, l'écran est également identique à la version 4080, ce qui est une excellente nouvelle puisque notre dernier test a confirmé que l'écran WQXGA est impressionnant à presque tous les égards.
| |||||||||||||||||||||||||
Homogénéité de la luminosité: 91 %
Valeur mesurée au centre, sur batterie: 491 cd/m²
Contraste: 1228:1 (Valeurs des noirs: 0.4 cd/m²)
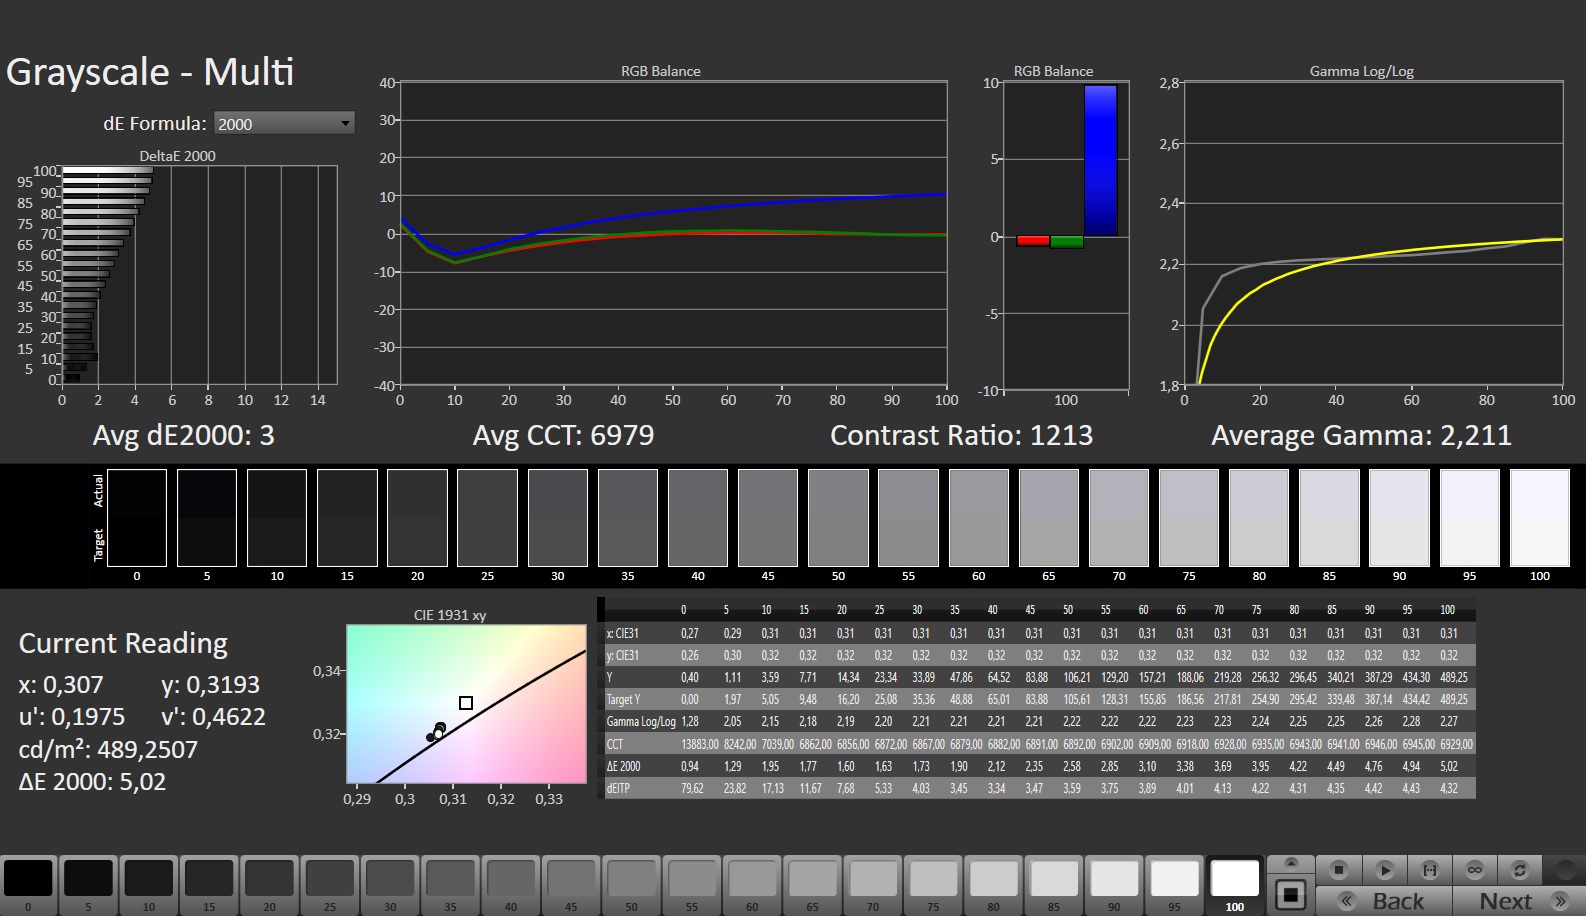
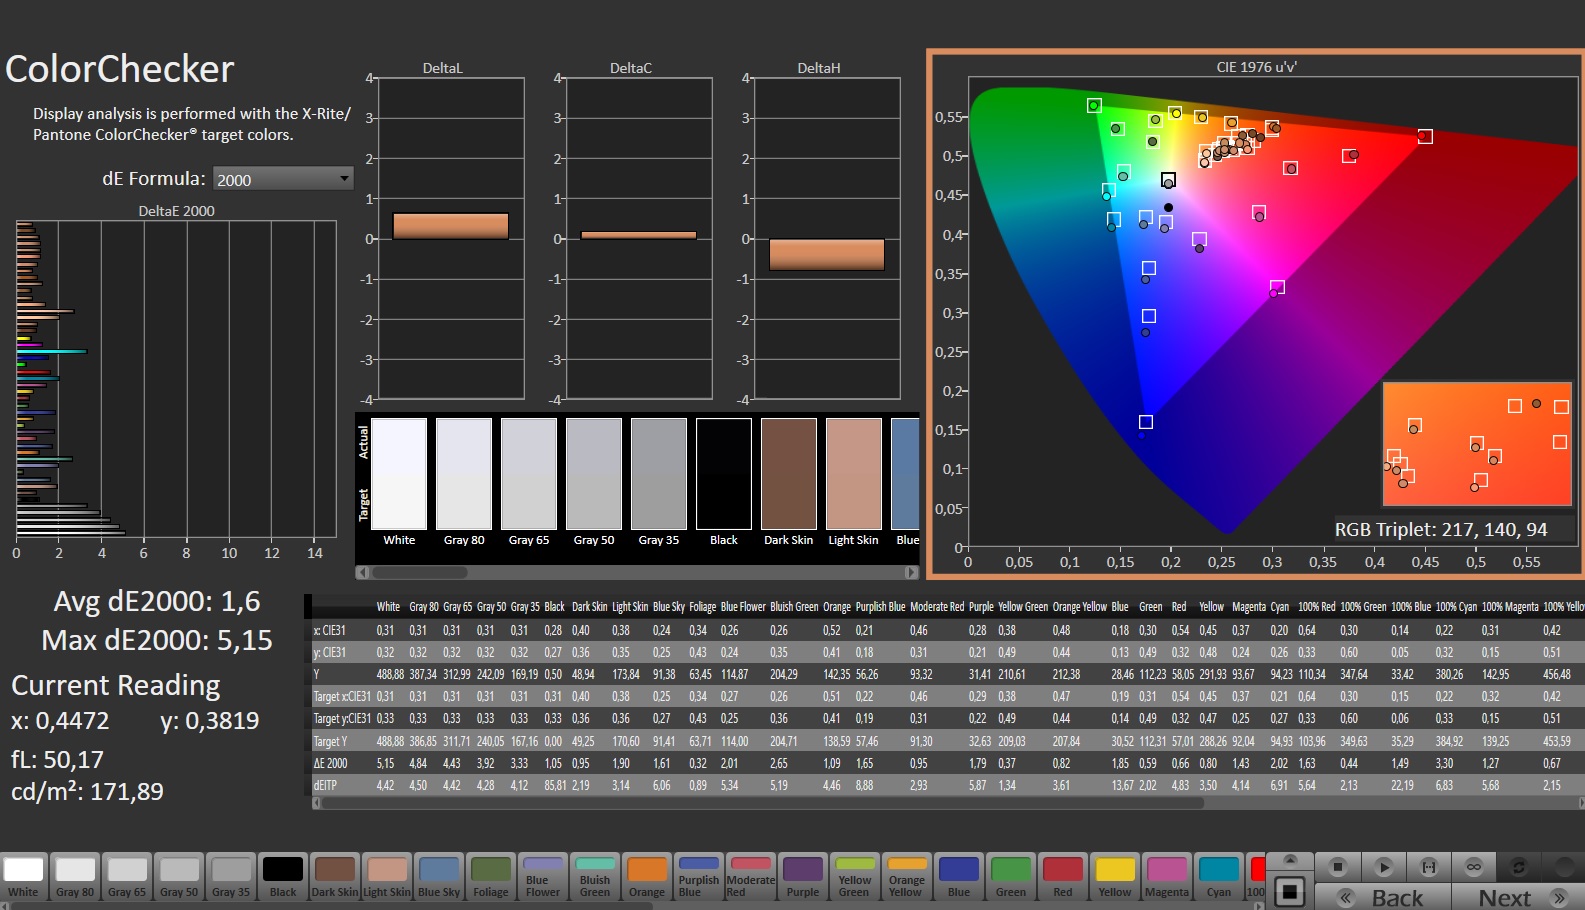
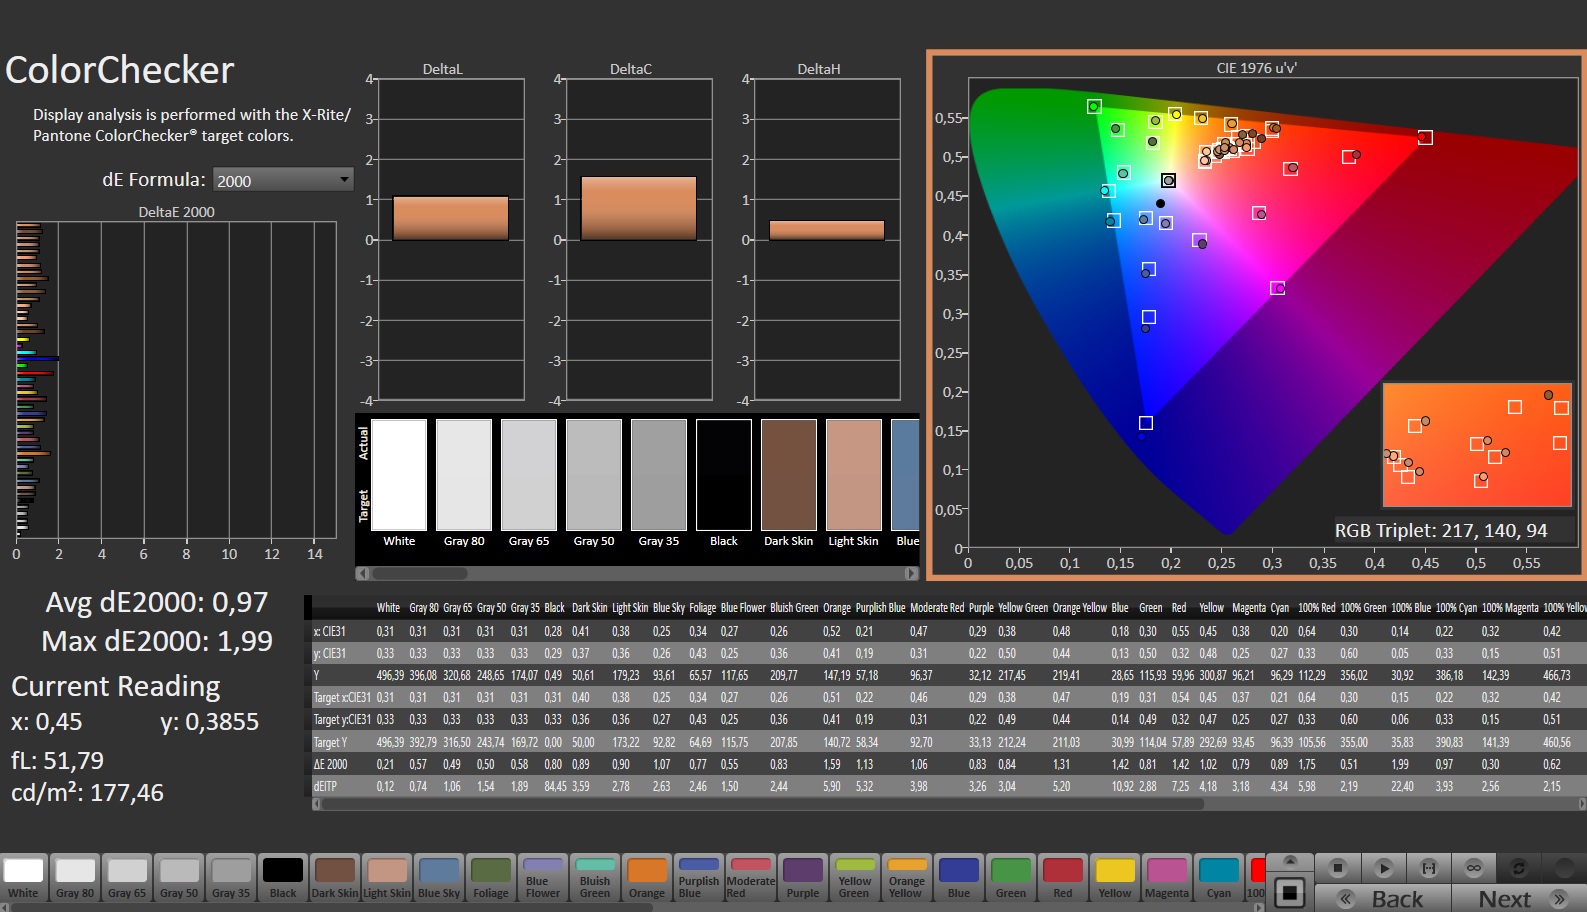
ΔE ColorChecker Calman: 1.6 | ∀{0.5-29.43 Ø4.71}
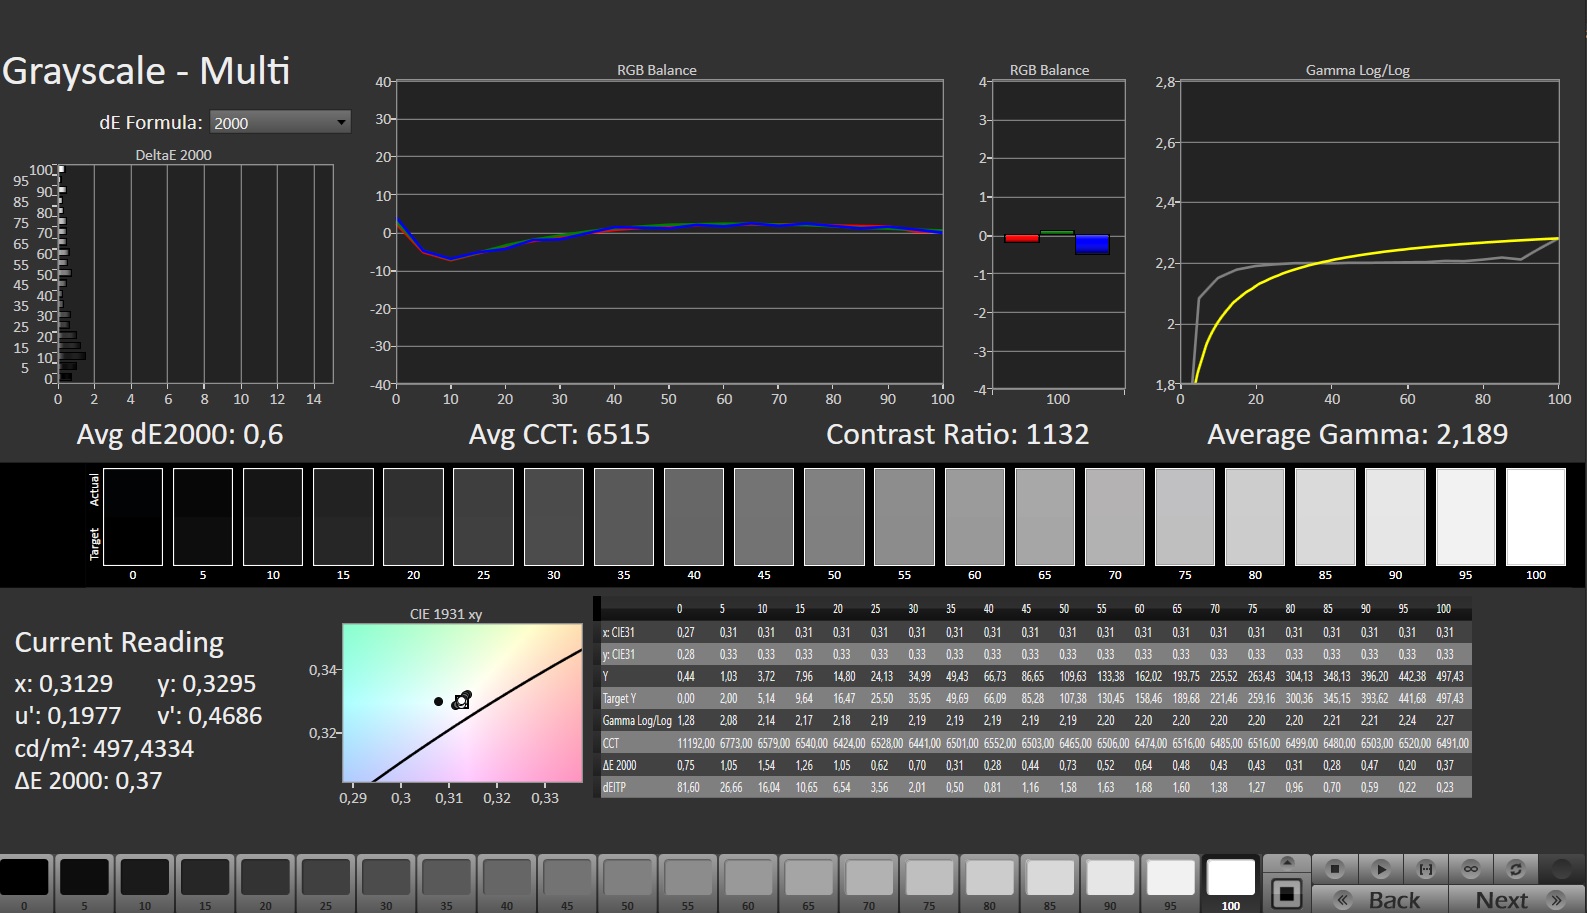
calibrated: 0.97
ΔE Greyscale Calman: 3 | ∀{0.09-98 Ø4.96}
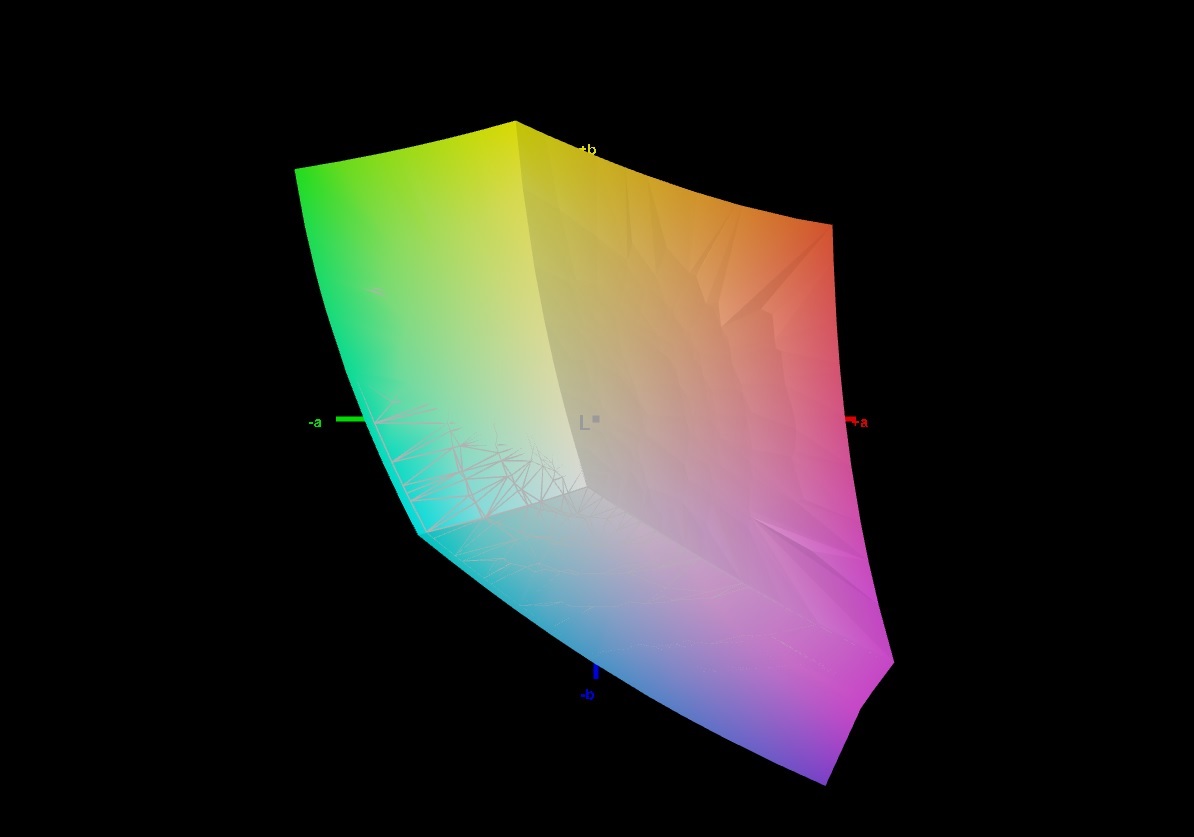
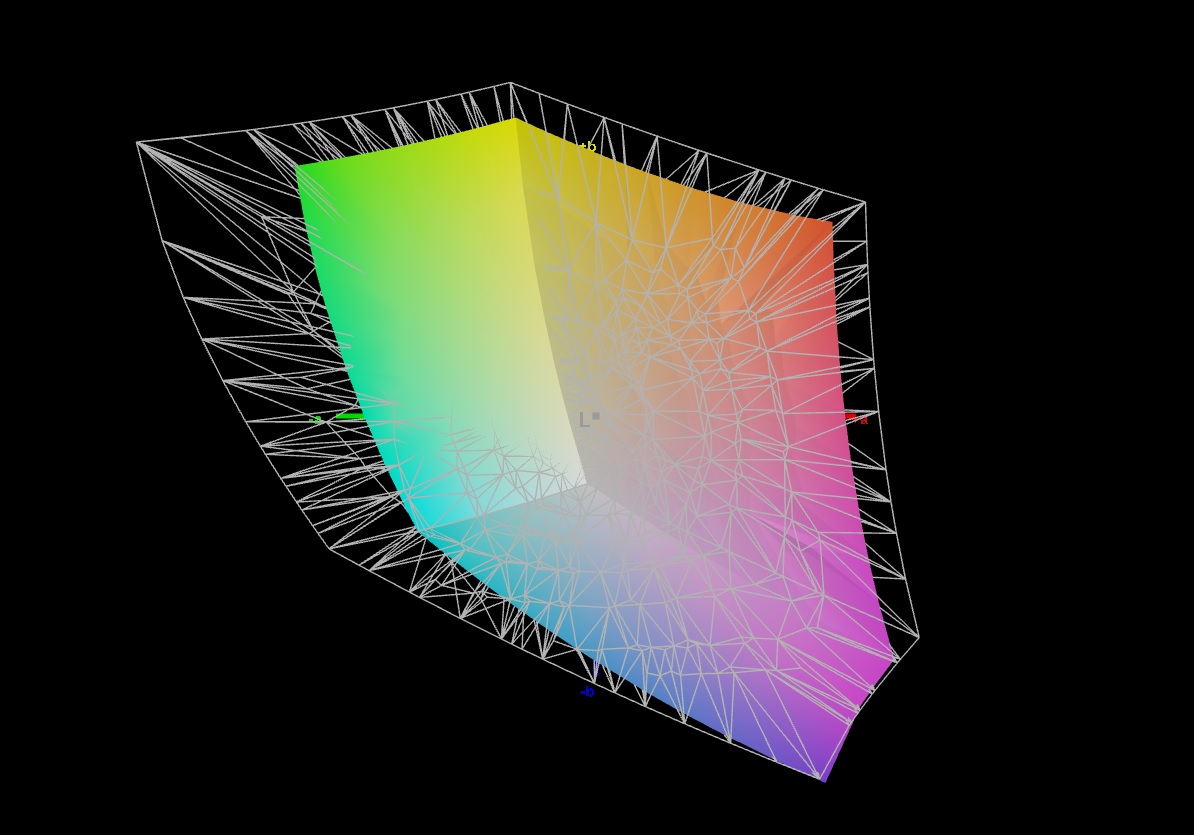
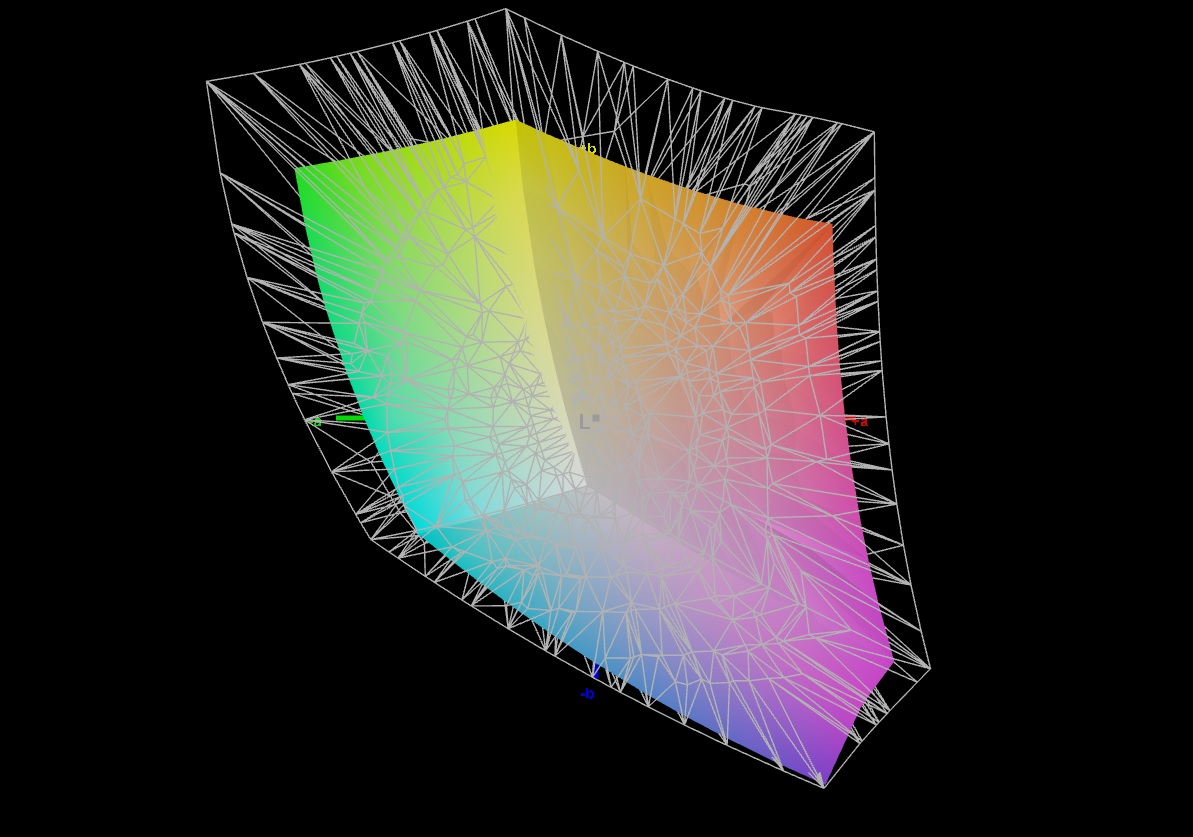
71.6% AdobeRGB 1998 (Argyll 3D)
99.8% sRGB (Argyll 3D)
69.5% Display P3 (Argyll 3D)
Gamma: 2.211
CCT: 6979 K
| Lenovo Legion Pro 7 RTX4090 MNG007DA2-3 (CSO1628), IPS, 2560x1600, 16" | Razer Blade 16 Early 2023 RTX 4090 AUO B160ZAN01.U, mini-LED, 3840x2400, 16" | Asus ROG Strix Scar 17 G733PY-XS96 NE173QHM-NZ2, IPS, 2560x1440, 17.3" | Schenker XMG Neo 16 E23 BOE0AF0 NE160QDM-NZ1, IPS, 2560x1600, 16" | MSI Titan GT77 HX 13VI B173ZAN06.C, Mini-LED, 3840x2160, 17.3" | Lenovo Legion Pro 7 16IRX8H MNG007DA2-3 (CSO1628), IPS, 2560x1600, 16" | |
|---|---|---|---|---|---|---|
| Display | 24% | 20% | -3% | 22% | -1% | |
| Display P3 Coverage (%) | 69.5 | 99.9 44% | 98 41% | 67.3 -3% | 94.9 37% | 69.1 -1% |
| sRGB Coverage (%) | 99.8 | 100 0% | 100 0% | 96.7 -3% | 99.9 0% | 99.7 0% |
| AdobeRGB 1998 Coverage (%) | 71.6 | 90.9 27% | 85.6 20% | 68.9 -4% | 92.4 29% | 71.2 -1% |
| Response Times | -622% | -53% | -60% | -365% | -21% | |
| Response Time Grey 50% / Grey 80% * (ms) | 10.9 ? | 10.2 ? 6% | 6.2 ? 43% | 14.5 ? -33% | 38.4 ? -252% | 12.3 ? -13% |
| Response Time Black / White * (ms) | 4.6 ? | 62.04 ? -1249% | 11.4 ? -148% | 8.6 ? -87% | 26.6 ? -478% | 5.9 ? -28% |
| PWM Frequency (Hz) | 2420 ? | 2380 ? | ||||
| Screen | 1412% | 11% | -5% | 54786% | 21% | |
| Brightness middle (cd/m²) | 491 | 730 49% | 322.5 -34% | 372 -24% | 606 23% | 511 4% |
| Brightness (cd/m²) | 472 | 729 54% | 317 -33% | 349 -26% | 602 28% | 469 -1% |
| Brightness Distribution (%) | 91 | 94 3% | 86 -5% | 88 -3% | 93 2% | 86 -5% |
| Black Level * (cd/m²) | 0.4 | 0.0045 99% | 0.29 28% | 0.32 20% | 0.0001 100% | 0.4 -0% |
| Contrast (:1) | 1228 | 162222 13110% | 1112 -9% | 1163 -5% | 6060000 493385% | 1278 4% |
| Colorchecker dE 2000 * | 1.6 | 5.65 -253% | 1.15 28% | 2.06 -29% | 4.8 -200% | 0.95 41% |
| Colorchecker dE 2000 max. * | 5.15 | 10.11 -96% | 3.03 41% | 3 42% | 8.2 -59% | 2.07 60% |
| Colorchecker dE 2000 calibrated * | 0.97 | 1.85 -91% | 0.56 42% | 1.5 -55% | 1.8 -86% | 0.91 6% |
| Greyscale dE 2000 * | 3 | 8.1 -170% | 1.7 43% | 1.9 37% | 6.5 -117% | 0.6 80% |
| Gamma | 2.211 100% | 1.98 111% | 2.27 97% | 2.312 95% | 2.63 84% | 2.176 101% |
| CCT | 6979 93% | 5874 111% | 6299 103% | 6747 96% | 6596 99% | 6545 99% |
| Moyenne finale (programmes/paramètres) | 271% /
824% | -7% /
4% | -23% /
-12% | 18148% /
35172% | -0% /
10% |
* ... Moindre est la valeur, meilleures sont les performances
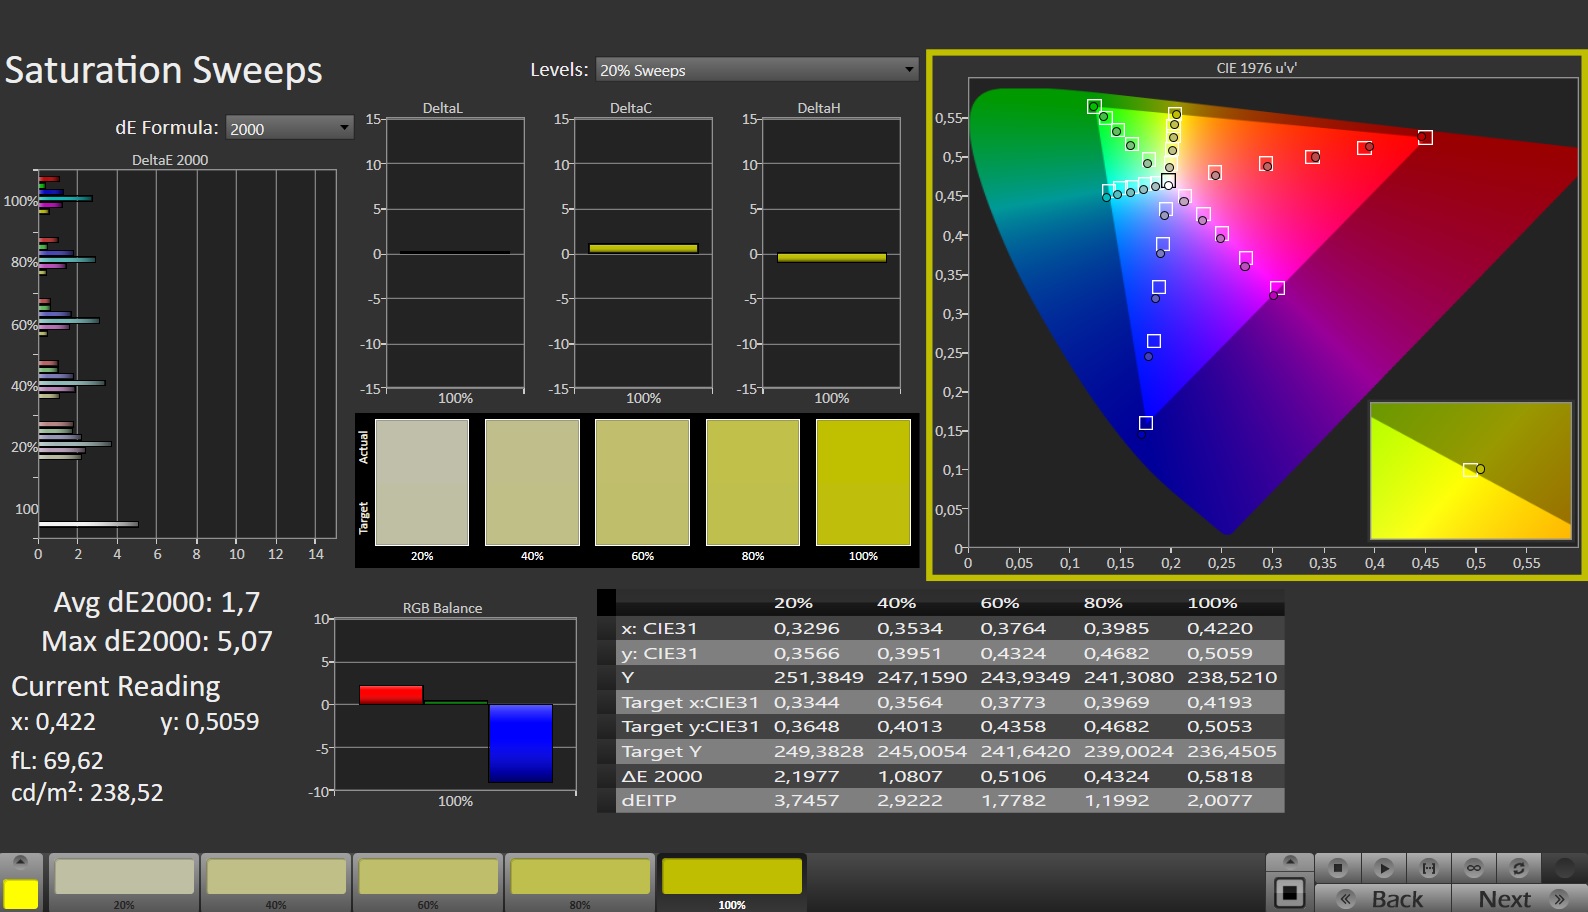
Qu'il s'agisse de la luminosité (~470 cd/m²), du contraste (~1 230:1) ou de la précision des couleurs (DeltaE 1,6 en moyenne) : Les valeurs mesurées font plus que justice à un écran IPS. Le temps de réponse est également satisfaisant, notamment grâce au taux de rafraîchissement de 240 Hz. L'espace colorimétrique peut être amélioré. Bien que 100% sRGB soit suffisant pour un ordinateur portable de jeu, environ 72% de couverture AdobeRGB et 70% DCI-P3 sont un peu pauvres pour les utilisateurs professionnels. D'autres concurrents sont plus performants dans ce domaine (voir tableau).
Dans l'ensemble, l'écran fait une bonne à très bonne impression, bien qu'il ne soit pas techniquement au niveau d'un panneau mini-LED comme celui du Razer Blade 16 et du MSI Titan GT 77.
Temps de réponse de l'écran
| ↔ Temps de réponse noir à blanc | ||
|---|---|---|
| 4.6 ms ... hausse ↗ et chute ↘ combinées | ↗ 1.6 ms hausse | 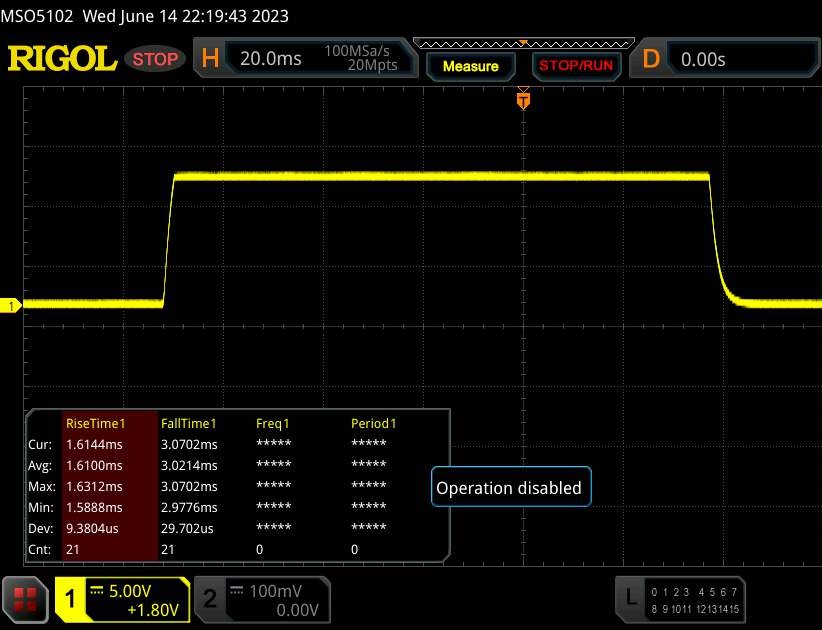 |
| ↘ 3 ms chute | ||
| L'écran montre de très faibles temps de réponse, parfait pour le jeu. En comparaison, tous les appareils testés affichent entre 0.1 (minimum) et 240 (maximum) ms. » 17 % des appareils testés affichent de meilleures performances. Cela signifie que les latences relevées sont meilleures que la moyenne (19.8 ms) de tous les appareils testés. | ||
| ↔ Temps de réponse gris 50% à gris 80% | ||
| 10.9 ms ... hausse ↗ et chute ↘ combinées | ↗ 5.1 ms hausse | 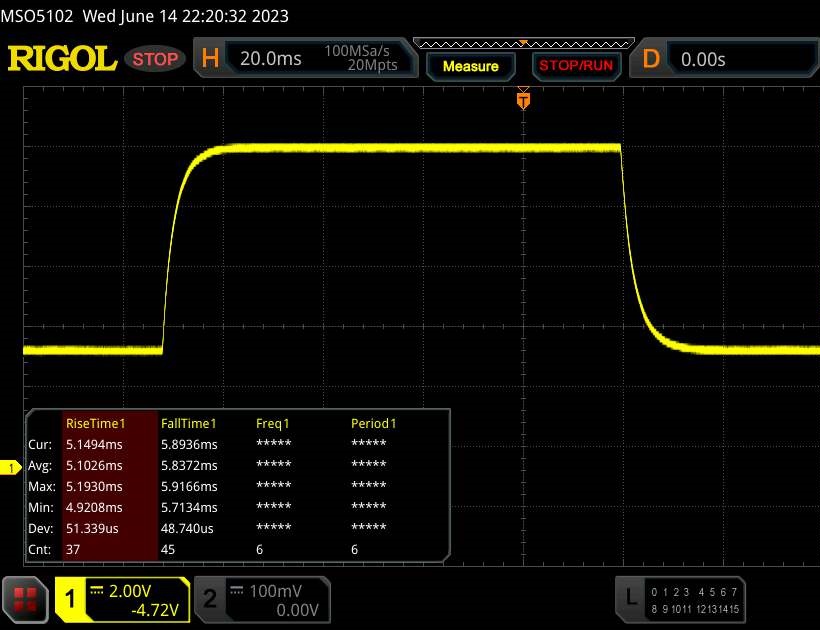 |
| ↘ 5.8 ms chute | ||
| L'écran montre de bons temps de réponse, mais insuffisant pour du jeu compétitif. En comparaison, tous les appareils testés affichent entre 0.165 (minimum) et 636 (maximum) ms. » 25 % des appareils testés affichent de meilleures performances. Cela signifie que les latences relevées sont meilleures que la moyenne (31 ms) de tous les appareils testés. | ||
Scintillement / MLI (Modulation de largeur d'impulsion)
| Scintillement / MLI (Modulation de largeur d'impulsion) non décelé | 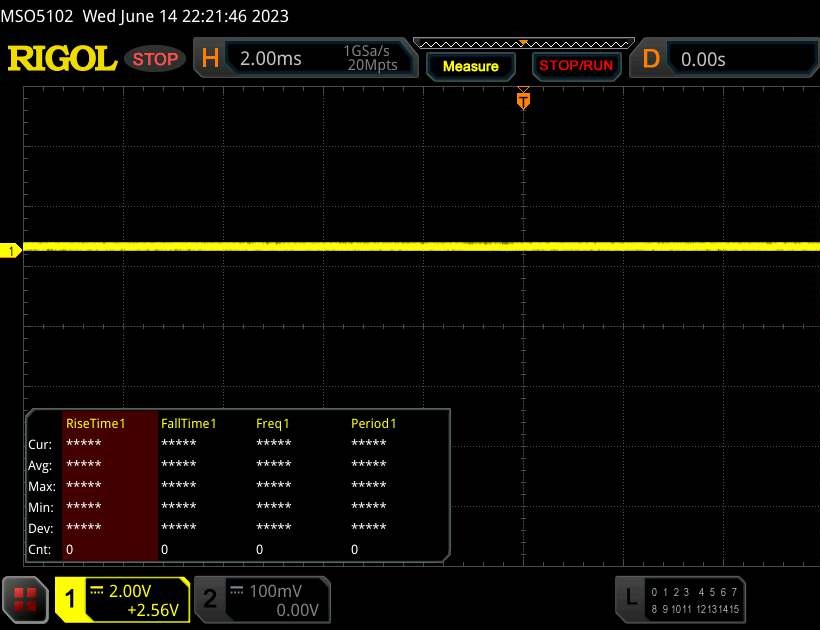 | ||
En comparaison, 52 % des appareils testés n'emploient pas MDI pour assombrir leur écran. Nous avons relevé une moyenne à 7757 (minimum : 5 - maximum : 343500) Hz dans le cas où une MDI était active. | |||
Performance
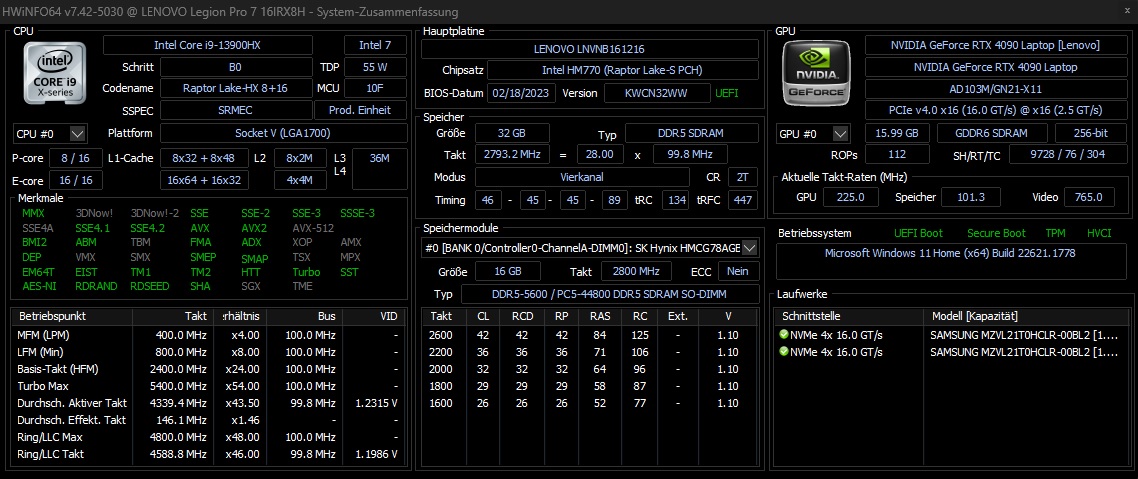
Le Legion Pro 7 16IRX8H se situe dans la catégorie supérieure absolue en termes de prix et de performances. Ce portable de 16 pouces offre suffisamment de réserves pour être bien préparé aux nouveaux jeux des années à venir. Alors que le CPU et le GPU sont soudés (ce qui est habituel dans les ordinateurs portables modernes), la mémoire de travail et la mémoire de masse peuvent être remplacées en cas de besoin.
Conditions d'essai
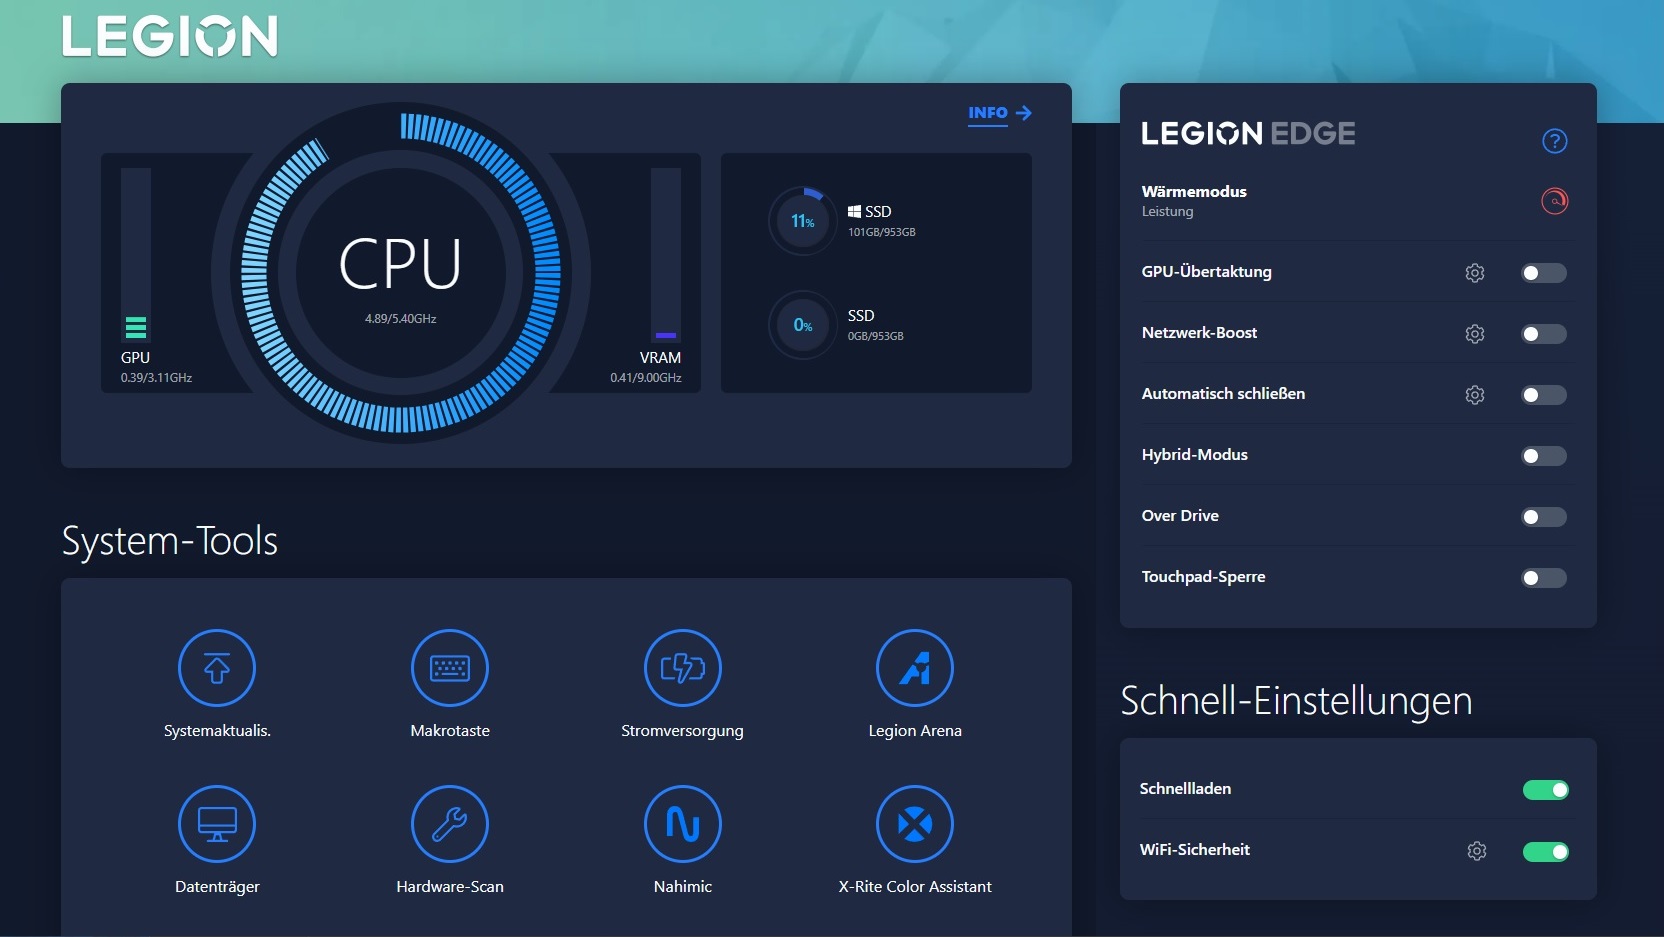
Le logiciel Lenovo Vantage préchargé contient de nombreuses options permettant de personnaliser le système. Le mode Heat et le mode Hybrid optionnel sont particulièrement pertinents. À l'exception des mesures de la batterie (Balanced avec commutation graphique), tous nos tests ont été effectués en mode Performance avec un dGPU actif en permanence.
| Mode silencieux | Mode équilibré | Mode performance | |
| CPU PL1 (HWiNFO) | 55 W | 80 W | 130 W |
| CPU PL2 (HWiNFO) | 65 W | 119 W | 185 W |
| Bruit (Witcher 3 @FHD/Ultra) | ~37 dB(A) | ~47 dB(A) | ~53 dB(A) |
| Performance (Witcher 3 @FHD/Ultra) | 40 FPS (verrouillé) | ~160 FPS | ~200 FPS |
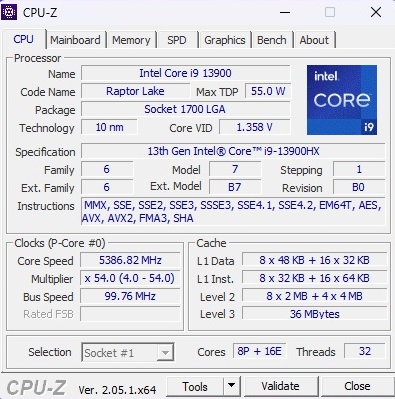
Processeur
Comme prévu, le Core i9-13900HX offre des performances très similaires à celles du modèle RTX 4080. Les performances de la puce Raptor Lake sont également assez constantes sur de longues périodes (voir la boucle Cinebench). En général, le CPU est légèrement plus performant que la moyenne du 13900HX déterminée jusqu'à présent. Intel combine 8 cœurs de performance avec Hyper-Threading et 16 cœurs d'efficacité sans HT, soit 32 threads parallèles au total.
Cinebench R15 Multi Loop
* ... Moindre est la valeur, meilleures sont les performances
AIDA64: FP32 Ray-Trace | FPU Julia | CPU SHA3 | CPU Queen | FPU SinJulia | FPU Mandel | CPU AES | CPU ZLib | FP64 Ray-Trace | CPU PhotoWorxx
| Performance rating | |
| Asus ROG Strix Scar 17 G733PY-XS96 | |
| MSI Titan GT77 HX 13VI | |
| Lenovo Legion Pro 7 RTX4090 | |
| Lenovo Legion Pro 7 16IRX8H | |
| Schenker XMG Neo 16 E23 | |
| Moyenne de la classe Gaming | |
| Moyenne Intel Core i9-13900HX | |
| Razer Blade 16 Early 2023 RTX 4090 | |
| AIDA64 / FP32 Ray-Trace | |
| Asus ROG Strix Scar 17 G733PY-XS96 | |
| Moyenne de la classe Gaming (10227 - 85542, n=105, 2 dernières années) | |
| MSI Titan GT77 HX 13VI | |
| Lenovo Legion Pro 7 RTX4090 | |
| Lenovo Legion Pro 7 16IRX8H | |
| Moyenne Intel Core i9-13900HX (17589 - 27615, n=22) | |
| Schenker XMG Neo 16 E23 | |
| Razer Blade 16 Early 2023 RTX 4090 | |
| AIDA64 / FPU Julia | |
| Asus ROG Strix Scar 17 G733PY-XS96 | |
| MSI Titan GT77 HX 13VI | |
| Moyenne de la classe Gaming (51376 - 238426, n=105, 2 dernières années) | |
| Lenovo Legion Pro 7 RTX4090 | |
| Lenovo Legion Pro 7 16IRX8H | |
| Moyenne Intel Core i9-13900HX (88686 - 137015, n=22) | |
| Schenker XMG Neo 16 E23 | |
| Razer Blade 16 Early 2023 RTX 4090 | |
| AIDA64 / CPU SHA3 | |
| Asus ROG Strix Scar 17 G733PY-XS96 | |
| MSI Titan GT77 HX 13VI | |
| Lenovo Legion Pro 7 16IRX8H | |
| Lenovo Legion Pro 7 RTX4090 | |
| Moyenne de la classe Gaming (2180 - 10115, n=105, 2 dernières années) | |
| Schenker XMG Neo 16 E23 | |
| Moyenne Intel Core i9-13900HX (4362 - 7029, n=22) | |
| Razer Blade 16 Early 2023 RTX 4090 | |
| AIDA64 / CPU Queen | |
| Asus ROG Strix Scar 17 G733PY-XS96 | |
| MSI Titan GT77 HX 13VI | |
| Razer Blade 16 Early 2023 RTX 4090 | |
| Schenker XMG Neo 16 E23 | |
| Lenovo Legion Pro 7 RTX4090 | |
| Lenovo Legion Pro 7 16IRX8H | |
| Moyenne Intel Core i9-13900HX (125644 - 141385, n=22) | |
| Moyenne de la classe Gaming (49785 - 173351, n=90, 2 dernières années) | |
| AIDA64 / FPU SinJulia | |
| Asus ROG Strix Scar 17 G733PY-XS96 | |
| MSI Titan GT77 HX 13VI | |
| Lenovo Legion Pro 7 16IRX8H | |
| Lenovo Legion Pro 7 RTX4090 | |
| Moyenne Intel Core i9-13900HX (12334 - 17179, n=22) | |
| Schenker XMG Neo 16 E23 | |
| Moyenne de la classe Gaming (4424 - 33636, n=105, 2 dernières années) | |
| Razer Blade 16 Early 2023 RTX 4090 | |
| AIDA64 / FPU Mandel | |
| Asus ROG Strix Scar 17 G733PY-XS96 | |
| Moyenne de la classe Gaming (25115 - 128721, n=105, 2 dernières années) | |
| MSI Titan GT77 HX 13VI | |
| Lenovo Legion Pro 7 RTX4090 | |
| Lenovo Legion Pro 7 16IRX8H | |
| Moyenne Intel Core i9-13900HX (43850 - 69202, n=22) | |
| Schenker XMG Neo 16 E23 | |
| Razer Blade 16 Early 2023 RTX 4090 | |
| AIDA64 / CPU AES | |
| Schenker XMG Neo 16 E23 | |
| Razer Blade 16 Early 2023 RTX 4090 | |
| Asus ROG Strix Scar 17 G733PY-XS96 | |
| Moyenne Intel Core i9-13900HX (89413 - 237881, n=22) | |
| MSI Titan GT77 HX 13VI | |
| Lenovo Legion Pro 7 RTX4090 | |
| Lenovo Legion Pro 7 16IRX8H | |
| Moyenne de la classe Gaming (39258 - 247074, n=105, 2 dernières années) | |
| AIDA64 / CPU ZLib | |
| Asus ROG Strix Scar 17 G733PY-XS96 | |
| MSI Titan GT77 HX 13VI | |
| Lenovo Legion Pro 7 16IRX8H | |
| Lenovo Legion Pro 7 RTX4090 | |
| Schenker XMG Neo 16 E23 | |
| Moyenne Intel Core i9-13900HX (1284 - 1958, n=22) | |
| Razer Blade 16 Early 2023 RTX 4090 | |
| Moyenne de la classe Gaming (574 - 2531, n=105, 2 dernières années) | |
| AIDA64 / FP64 Ray-Trace | |
| Asus ROG Strix Scar 17 G733PY-XS96 | |
| Moyenne de la classe Gaming (5509 - 45446, n=105, 2 dernières années) | |
| MSI Titan GT77 HX 13VI | |
| Lenovo Legion Pro 7 16IRX8H | |
| Lenovo Legion Pro 7 RTX4090 | |
| Moyenne Intel Core i9-13900HX (9481 - 15279, n=22) | |
| Schenker XMG Neo 16 E23 | |
| Razer Blade 16 Early 2023 RTX 4090 | |
| AIDA64 / CPU PhotoWorxx | |
| Razer Blade 16 Early 2023 RTX 4090 | |
| Lenovo Legion Pro 7 RTX4090 | |
| Schenker XMG Neo 16 E23 | |
| Lenovo Legion Pro 7 16IRX8H | |
| Moyenne Intel Core i9-13900HX (42994 - 51994, n=22) | |
| Moyenne de la classe Gaming (12271 - 89891, n=105, 2 dernières années) | |
| MSI Titan GT77 HX 13VI | |
| Asus ROG Strix Scar 17 G733PY-XS96 | |
Performance du système
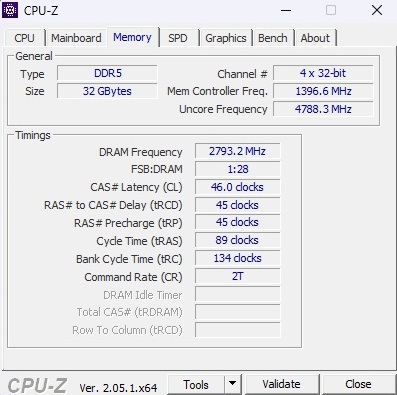
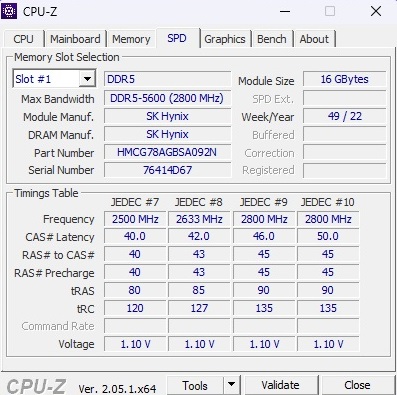
La puissance du système est également très élevée : 8 158 points dans PCMark 10, soit quelques pour cent de plus que le résultat du modèle RTX 4080. Les résultats du benchmark de la mémoire de travail DDR5 sont également impressionnants en comparaison.
CrossMark: Overall | Productivity | Creativity | Responsiveness
| PCMark 10 / Score | |
| MSI Titan GT77 HX 13VI | |
| Asus ROG Strix Scar 17 G733PY-XS96 | |
| Moyenne Intel Core i9-13900HX, NVIDIA GeForce RTX 4090 Laptop GPU (7690 - 9331, n=8) | |
| Moyenne de la classe Gaming (5828 - 12414, n=93, 2 dernières années) | |
| Schenker XMG Neo 16 E23 | |
| Lenovo Legion Pro 7 RTX4090 | |
| Lenovo Legion Pro 7 16IRX8H | |
| Razer Blade 16 Early 2023 RTX 4090 | |
| PCMark 10 / Essentials | |
| MSI Titan GT77 HX 13VI | |
| Lenovo Legion Pro 7 16IRX8H | |
| Moyenne Intel Core i9-13900HX, NVIDIA GeForce RTX 4090 Laptop GPU (10972 - 11983, n=8) | |
| Asus ROG Strix Scar 17 G733PY-XS96 | |
| Lenovo Legion Pro 7 RTX4090 | |
| Schenker XMG Neo 16 E23 | |
| Razer Blade 16 Early 2023 RTX 4090 | |
| Moyenne de la classe Gaming (8810 - 11935, n=97, 2 dernières années) | |
| PCMark 10 / Productivity | |
| Moyenne de la classe Gaming (6845 - 25323, n=95, 2 dernières années) | |
| Lenovo Legion Pro 7 16IRX8H | |
| Moyenne Intel Core i9-13900HX, NVIDIA GeForce RTX 4090 Laptop GPU (9038 - 11680, n=8) | |
| Asus ROG Strix Scar 17 G733PY-XS96 | |
| MSI Titan GT77 HX 13VI | |
| Schenker XMG Neo 16 E23 | |
| Lenovo Legion Pro 7 RTX4090 | |
| Razer Blade 16 Early 2023 RTX 4090 | |
| PCMark 10 / Digital Content Creation | |
| MSI Titan GT77 HX 13VI | |
| Asus ROG Strix Scar 17 G733PY-XS96 | |
| Schenker XMG Neo 16 E23 | |
| Lenovo Legion Pro 7 RTX4090 | |
| Moyenne de la classe Gaming (7602 - 19954, n=95, 2 dernières années) | |
| Moyenne Intel Core i9-13900HX, NVIDIA GeForce RTX 4090 Laptop GPU (10605 - 16395, n=8) | |
| Razer Blade 16 Early 2023 RTX 4090 | |
| Lenovo Legion Pro 7 16IRX8H | |
| CrossMark / Overall | |
| MSI Titan GT77 HX 13VI | |
| Schenker XMG Neo 16 E23 | |
| Moyenne Intel Core i9-13900HX, NVIDIA GeForce RTX 4090 Laptop GPU (1825 - 2295, n=8) | |
| Razer Blade 16 Early 2023 RTX 4090 | |
| Asus ROG Strix Scar 17 G733PY-XS96 | |
| Moyenne de la classe Gaming (1366 - 2409, n=94, 2 dernières années) | |
| CrossMark / Productivity | |
| MSI Titan GT77 HX 13VI | |
| Moyenne Intel Core i9-13900HX, NVIDIA GeForce RTX 4090 Laptop GPU (1666 - 2166, n=8) | |
| Schenker XMG Neo 16 E23 | |
| Razer Blade 16 Early 2023 RTX 4090 | |
| Moyenne de la classe Gaming (1386 - 2254, n=94, 2 dernières années) | |
| Asus ROG Strix Scar 17 G733PY-XS96 | |
| CrossMark / Creativity | |
| Schenker XMG Neo 16 E23 | |
| MSI Titan GT77 HX 13VI | |
| Moyenne Intel Core i9-13900HX, NVIDIA GeForce RTX 4090 Laptop GPU (2162 - 2514, n=8) | |
| Asus ROG Strix Scar 17 G733PY-XS96 | |
| Moyenne de la classe Gaming (1343 - 2786, n=94, 2 dernières années) | |
| Razer Blade 16 Early 2023 RTX 4090 | |
| CrossMark / Responsiveness | |
| MSI Titan GT77 HX 13VI | |
| Moyenne Intel Core i9-13900HX, NVIDIA GeForce RTX 4090 Laptop GPU (1441 - 2275, n=8) | |
| Razer Blade 16 Early 2023 RTX 4090 | |
| Schenker XMG Neo 16 E23 | |
| Moyenne de la classe Gaming (1226 - 2334, n=94, 2 dernières années) | |
| Asus ROG Strix Scar 17 G733PY-XS96 | |
| PCMark 10 Score | 8158 points | |
Aide | ||
| AIDA64 / Memory Copy | |
| Razer Blade 16 Early 2023 RTX 4090 | |
| Lenovo Legion Pro 7 RTX4090 | |
| Lenovo Legion Pro 7 16IRX8H | |
| Schenker XMG Neo 16 E23 | |
| Moyenne Intel Core i9-13900HX (67716 - 79193, n=22) | |
| Moyenne de la classe Gaming (21750 - 129946, n=105, 2 dernières années) | |
| MSI Titan GT77 HX 13VI | |
| Asus ROG Strix Scar 17 G733PY-XS96 | |
| AIDA64 / Memory Read | |
| Lenovo Legion Pro 7 RTX4090 | |
| Razer Blade 16 Early 2023 RTX 4090 | |
| Lenovo Legion Pro 7 16IRX8H | |
| Schenker XMG Neo 16 E23 | |
| Moyenne Intel Core i9-13900HX (73998 - 88462, n=22) | |
| Moyenne de la classe Gaming (22956 - 118858, n=105, 2 dernières années) | |
| MSI Titan GT77 HX 13VI | |
| Asus ROG Strix Scar 17 G733PY-XS96 | |
| AIDA64 / Memory Write | |
| Lenovo Legion Pro 7 RTX4090 | |
| Razer Blade 16 Early 2023 RTX 4090 | |
| Moyenne de la classe Gaming (22297 - 135096, n=105, 2 dernières années) | |
| Moyenne Intel Core i9-13900HX (65472 - 77045, n=22) | |
| Schenker XMG Neo 16 E23 | |
| Lenovo Legion Pro 7 16IRX8H | |
| MSI Titan GT77 HX 13VI | |
| Asus ROG Strix Scar 17 G733PY-XS96 | |
| AIDA64 / Memory Latency | |
| Moyenne de la classe Gaming (75.3 - 259, n=105, 2 dernières années) | |
| MSI Titan GT77 HX 13VI | |
| Razer Blade 16 Early 2023 RTX 4090 | |
| Schenker XMG Neo 16 E23 | |
| Moyenne Intel Core i9-13900HX (75.3 - 91.1, n=22) | |
| Lenovo Legion Pro 7 RTX4090 | |
| Lenovo Legion Pro 7 16IRX8H | |
| Asus ROG Strix Scar 17 G733PY-XS96 | |
* ... Moindre est la valeur, meilleures sont les performances
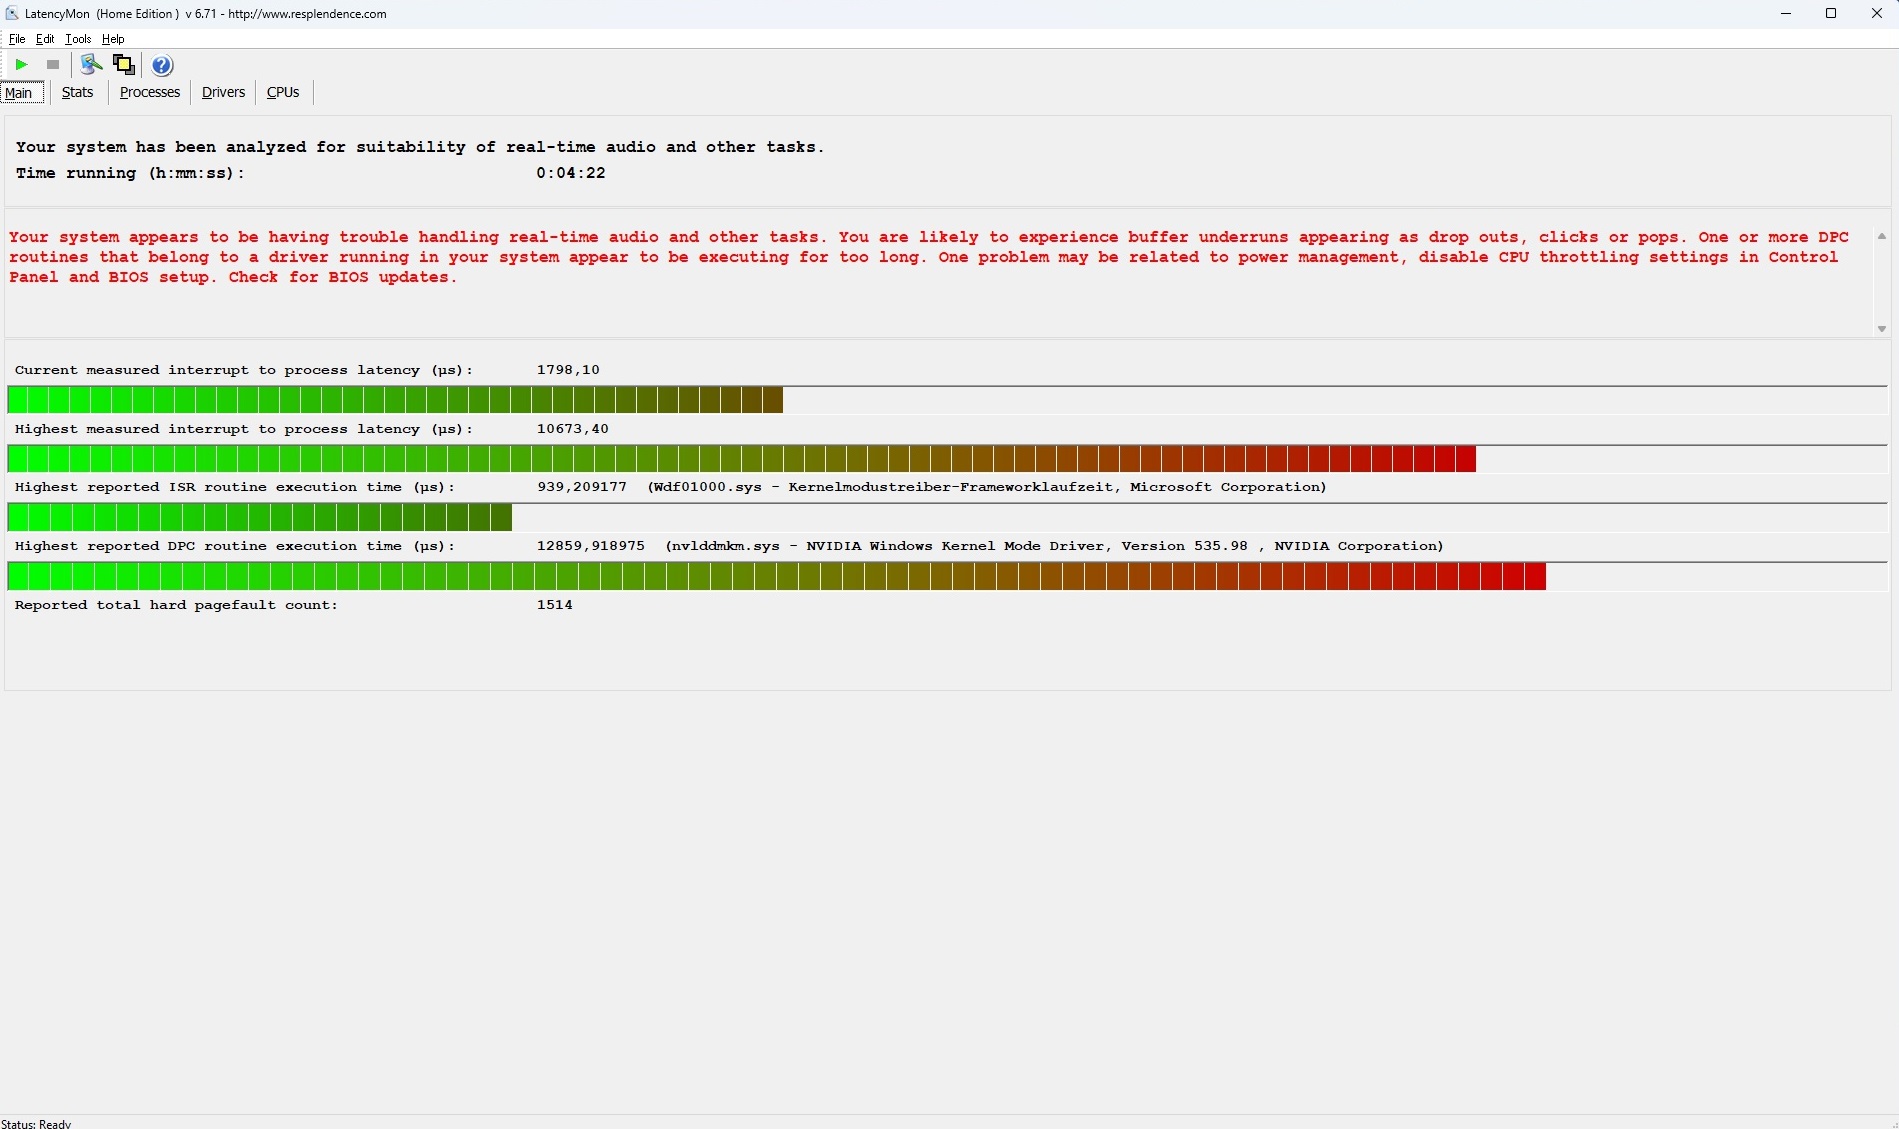
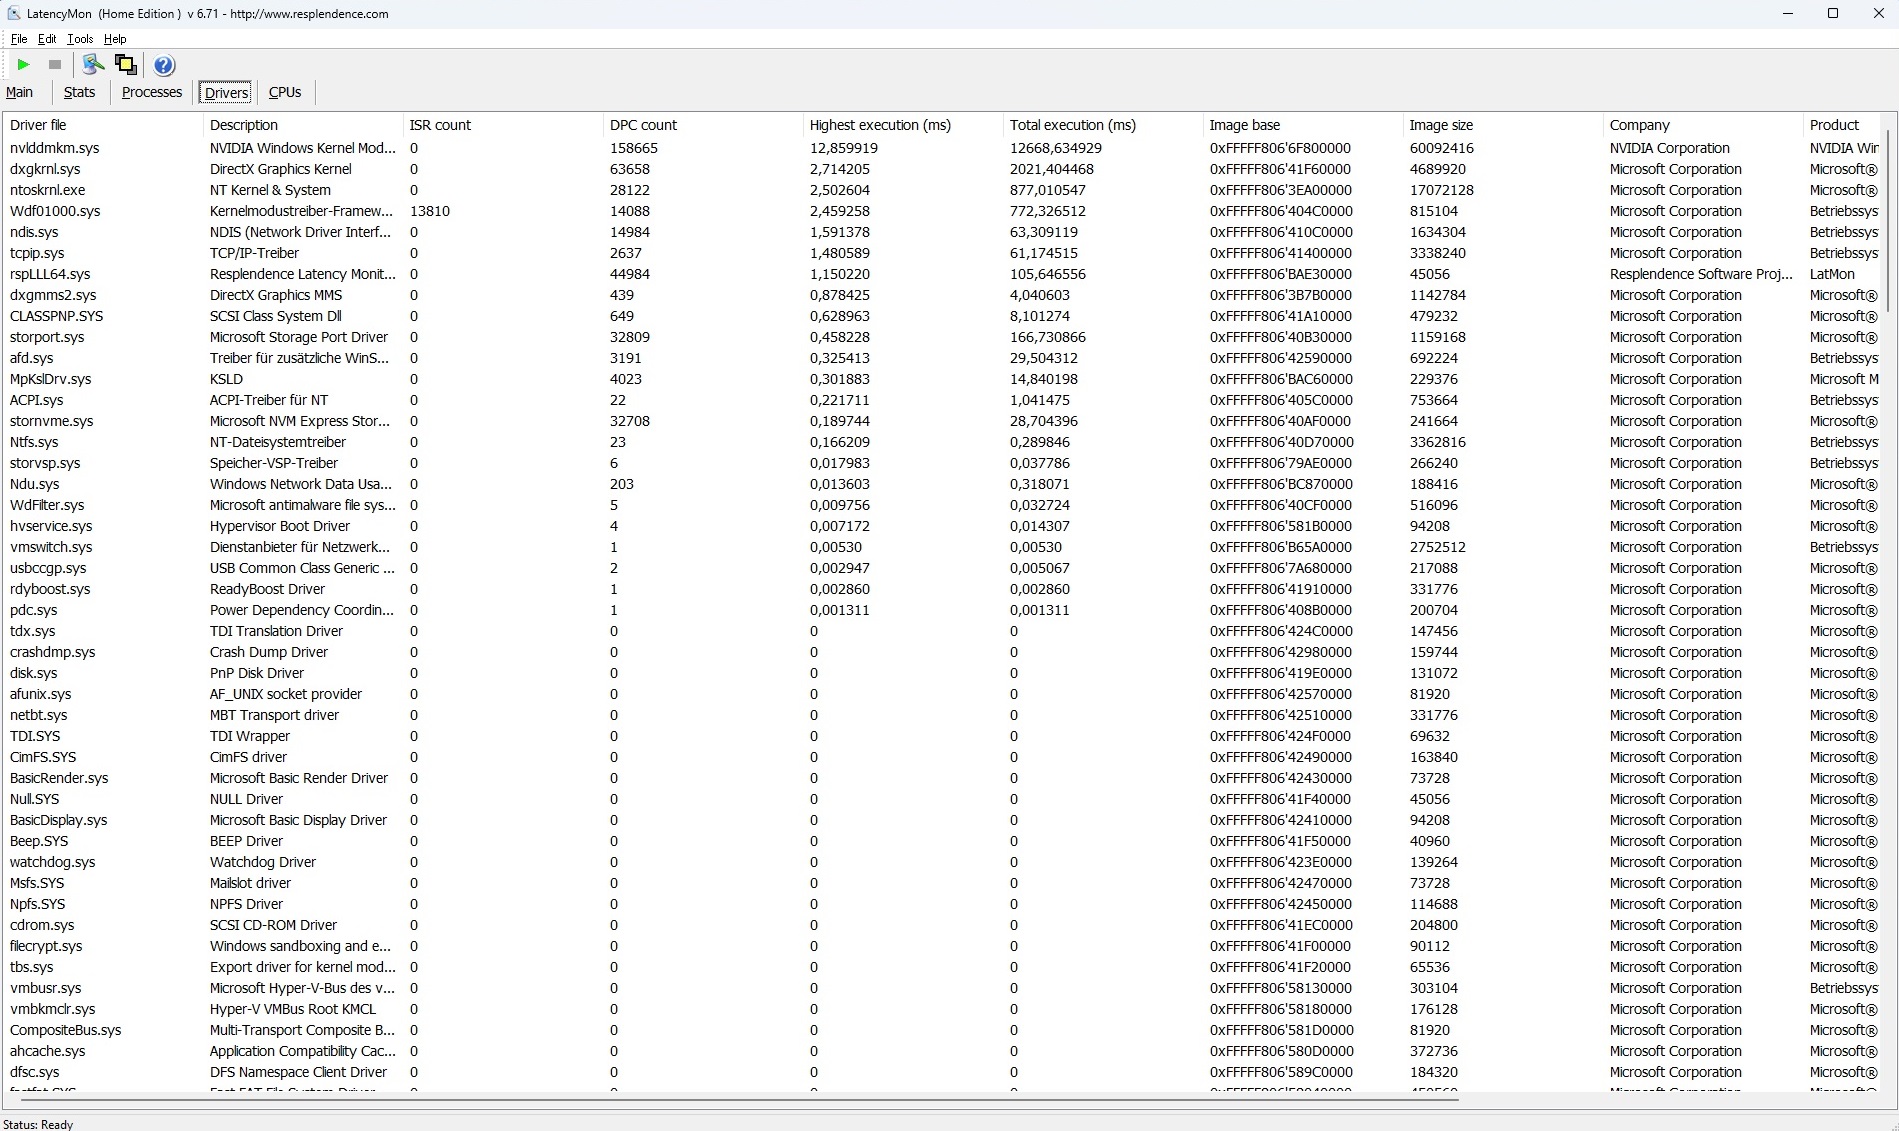
Latences DPC
La configuration de test n'est pas aussi performante en termes de latence. Selon l'outil LatencyMon, le 16 pouces n'est pas adapté à l'édition audio et vidéo en temps réel dans son état de livraison en raison de valeurs extrêmement élevées. Il est intéressant de noter que les latences sont nettement plus faibles avec la version RTX 4080.
| DPC Latencies / LatencyMon - interrupt to process latency (max), Web, Youtube, Prime95 | |
| Lenovo Legion Pro 7 RTX4090 | |
| Schenker XMG Neo 16 E23 | |
| MSI Titan GT77 HX 13VI | |
| Asus ROG Strix Scar 17 G733PY-XS96 | |
| Lenovo Legion Pro 7 16IRX8H | |
* ... Moindre est la valeur, meilleures sont les performances
Mémoire de masse
Au lieu d'installer un SSD plus grand, Lenovo utilise simplement deux SSD de 1 To du modèle moins cher Legion, qui occupe complètement les emplacements M.2. Le populaire Samsung PM9A1 obtient de très bons résultats, mais doit souvent faire face à des fluctuations plus fortes ou à des chutes pendant des périodes de charge plus longues - comme dans le cas du Pro 7. Cependant, ce phénomène affecte également les SSD NVMe d'autres fabricants (voir graphique).

* ... Moindre est la valeur, meilleures sont les performances
Continuous read: DiskSpd Read Loop, Queue Depth 8
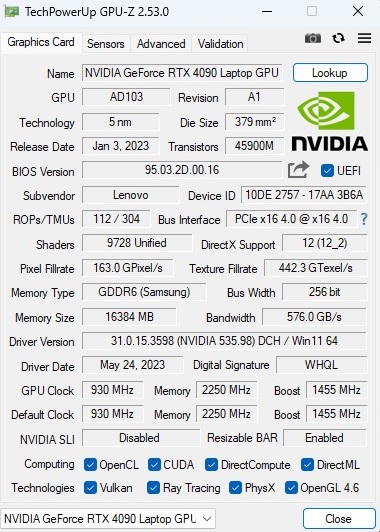
Carte graphique
La GeForce RTX 4090 est actuellement la carte graphique de jeu mobile la plus rapide. Le modèle haut de gamme de la génération Ada-Lovelace de Nvidia est doté de 9 728 shaders et de 16 Go de mémoire GDDR6. Dans les benchmarks synthétiques, la Legion Pro 7 se situe à mi-chemin de la concurrence de la RTX 4090, qui s'appuie également sur un TGP maximal de 175 watts (Dynamic Boost inclus).
| 3DMark 11 Performance | 44779 points | |
| 3DMark Fire Strike Score | 34742 points | |
| 3DMark Time Spy Score | 20039 points | |
Aide | ||
* ... Moindre est la valeur, meilleures sont les performances
Performances de jeu
L'écran 16 pouces se montre particulièrement efficace dans les tests de jeu. Les titres actuels tournent sans problème dans la résolution native (nos benchmarks QHD ont été créés avec 2 560 x 1 440 au lieu de 2 560 x 1 600 pixels), même avec le maximum de détails, et plus de 60 FPS sont presque toujours atteints. Même sur les écrans 4K, les réglages complets ne posent généralement pas de problème, même sans l'aide de DLSS ou de Frame Generation.
| Call of Duty Modern Warfare 2 2022 | |
| 3840x2160 Extreme Quality Preset AA:T2X Filmic SM | |
| MSI Titan GT77 HX 13VI | |
| Asus ROG Strix Scar 17 G733PY-XS96 | |
| Lenovo Legion Pro 7 RTX4090 | |
| Moyenne NVIDIA GeForce RTX 4090 Laptop GPU (63 - 86, n=12) | |
| Razer Blade 16 Early 2023 RTX 4090 | |
| Lenovo Legion Pro 7 16IRX8H | |
| 2560x1440 Extreme Quality Preset AA:T2X Filmic SM | |
| MSI Titan GT77 HX 13VI | |
| Asus ROG Strix Scar 17 G733PY-XS96 | |
| Lenovo Legion Pro 7 RTX4090 | |
| Moyenne NVIDIA GeForce RTX 4090 Laptop GPU (104 - 137, n=14) | |
| Razer Blade 16 Early 2023 RTX 4090 | |
| Lenovo Legion Pro 7 16IRX8H | |
| A Plague Tale Requiem | |
| 3840x2160 Ultra Preset | |
| Lenovo Legion Pro 7 RTX4090 | |
| Moyenne NVIDIA GeForce RTX 4090 Laptop GPU (33.1 - 43.8, n=3) | |
| Lenovo Legion Pro 7 16IRX8H | |
| 2560x1440 Ultra Preset | |
| Lenovo Legion Pro 7 RTX4090 | |
| Moyenne NVIDIA GeForce RTX 4090 Laptop GPU (58.9 - 77.2, n=3) | |
| Lenovo Legion Pro 7 16IRX8H | |
| Spider-Man Miles Morales | |
| 3840x2160 Very High Preset AA:T | |
| MSI Titan GT77 HX 13VI | |
| Lenovo Legion Pro 7 RTX4090 | |
| Moyenne NVIDIA GeForce RTX 4090 Laptop GPU (65.7 - 84.3, n=7) | |
| Lenovo Legion Pro 7 16IRX8H | |
| 2560x1440 Very High Preset AA:T | |
| MSI Titan GT77 HX 13VI | |
| Lenovo Legion Pro 7 RTX4090 | |
| Moyenne NVIDIA GeForce RTX 4090 Laptop GPU (93.3 - 119.8, n=7) | |
| Lenovo Legion Pro 7 16IRX8H | |
Comme d'habitude, nous avons testé si les performances du GPU restaient constantes sous une charge plus longue avec Le Witcher 3. A l'instar de la concurrence, nous n'avons pas constaté de baisse de performances ou autres, à l'exception de légères fluctuations.
Witcher 3 FPS-Diagramm
| Bas | Moyen | Élevé | Ultra | QHD | 4K | |
|---|---|---|---|---|---|---|
| GTA V (2015) | 186.3 | 186.9 | 184.9 | 143.6 | 137.7 | 173.6 |
| The Witcher 3 (2015) | 200 | |||||
| Dota 2 Reborn (2015) | 230 | 204 | 193.9 | 182.1 | 175.1 | |
| Final Fantasy XV Benchmark (2018) | 223 | 212 | 181.2 | 154 | 91.7 | |
| X-Plane 11.11 (2018) | 201 | 177.7 | 136.4 | 111.7 | ||
| Strange Brigade (2018) | 439 | 369 | 359 | 347 | 302 | 158.4 |
| Shadow of the Tomb Raider (2018) | 185 | 120 | ||||
| Cyberpunk 2077 1.6 (2022) | 100.93 | 50.05 | ||||
| F1 22 (2022) | 301 | 303 | 279 | 129.2 | 85.2 | 45.9 |
| A Plague Tale Requiem (2022) | 77.2 | 43.8 | ||||
| Call of Duty Modern Warfare 2 2022 (2022) | 132 | 82 | ||||
| Spider-Man Miles Morales (2022) | 108.1 | 80 | ||||
| The Witcher 3 v4 (2023) | 101.2 | 48.7 | ||||
| The Last of Us (2023) | 85.8 | 45.7 |
Émissions
Émissions sonores
Le gros inconvénient de composants haut de gamme aussi puissants est sans surprise le bruit. En mode Performance, le 16 pouces devient bruyant dans les applications 3D entre 48 dB(A) (moyenne 3DMark 06) et 55 dB(A) (test de stress maximum). Dans les jeux, il faut s'attendre à environ 53 dB(A), ce qui est également très désagréable sans casque. La situation est beaucoup plus détendue en mode ralenti. Bien que les ventilateurs soient parfois un peu bruyants (par exemple au démarrage), une moyenne de 28 à 30 dB(A) est acceptable, d'autant plus qu'il est possible d'utiliser le mode Silent ou Balanced si on le souhaite.
Degré de la nuisance sonore
| Au repos |
| 28 / 30 / 38 dB(A) |
| Fortement sollicité |
| 48 / 55 dB(A) |
 | ||
30 dB silencieux 40 dB(A) audible 50 dB(A) bruyant |
||
min: | ||
| Lenovo Legion Pro 7 RTX4090 i9-13900HX, GeForce RTX 4090 Laptop GPU | Razer Blade 16 Early 2023 RTX 4090 i9-13950HX, GeForce RTX 4090 Laptop GPU | Asus ROG Strix Scar 17 G733PY-XS96 R9 7945HX, GeForce RTX 4090 Laptop GPU | Schenker XMG Neo 16 E23 i9-13900HX, GeForce RTX 4090 Laptop GPU | MSI Titan GT77 HX 13VI i9-13950HX, GeForce RTX 4090 Laptop GPU | Lenovo Legion Pro 7 16IRX8H i9-13900HX, GeForce RTX 4080 Laptop GPU | |
|---|---|---|---|---|---|---|
| Noise | 18% | 14% | -10% | 1% | 4% | |
| arrêt / environnement * (dB) | 25 | 20.84 17% | 22.7 9% | 25 -0% | 24.6 2% | 24 4% |
| Idle Minimum * (dB) | 28 | 23.65 16% | 23.5 16% | 31 -11% | 29.2 -4% | 26 7% |
| Idle Average * (dB) | 30 | 23.65 21% | 27.7 8% | 33 -10% | 29.2 3% | 28 7% |
| Idle Maximum * (dB) | 38 | 23.65 38% | 27.7 27% | 42 -11% | 29.2 23% | 34 11% |
| Load Average * (dB) | 48 | 43.35 10% | 30.5 36% | 58 -21% | 50.7 -6% | 47 2% |
| Witcher 3 ultra * (dB) | 53 | 46.7 12% | 51.4 3% | 57 -8% | 53.3 -1% | 55 -4% |
| Load Maximum * (dB) | 55 | 46.72 15% | 54.1 2% | 59 -7% | 61 -11% | 56 -2% |
* ... Moindre est la valeur, meilleures sont les performances
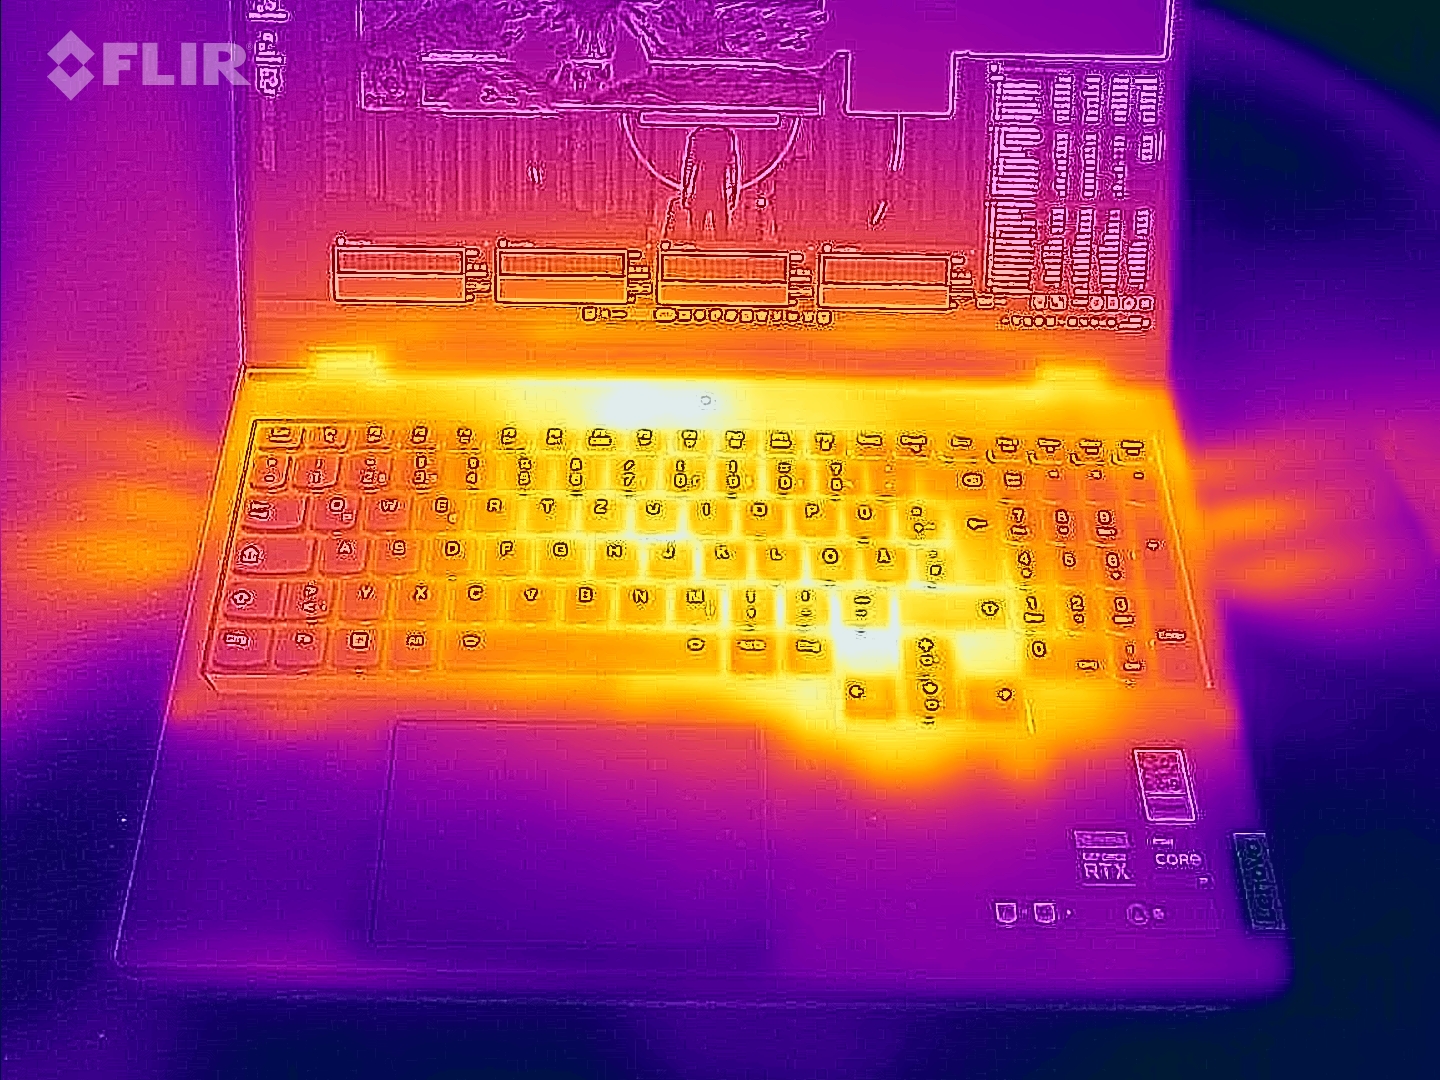
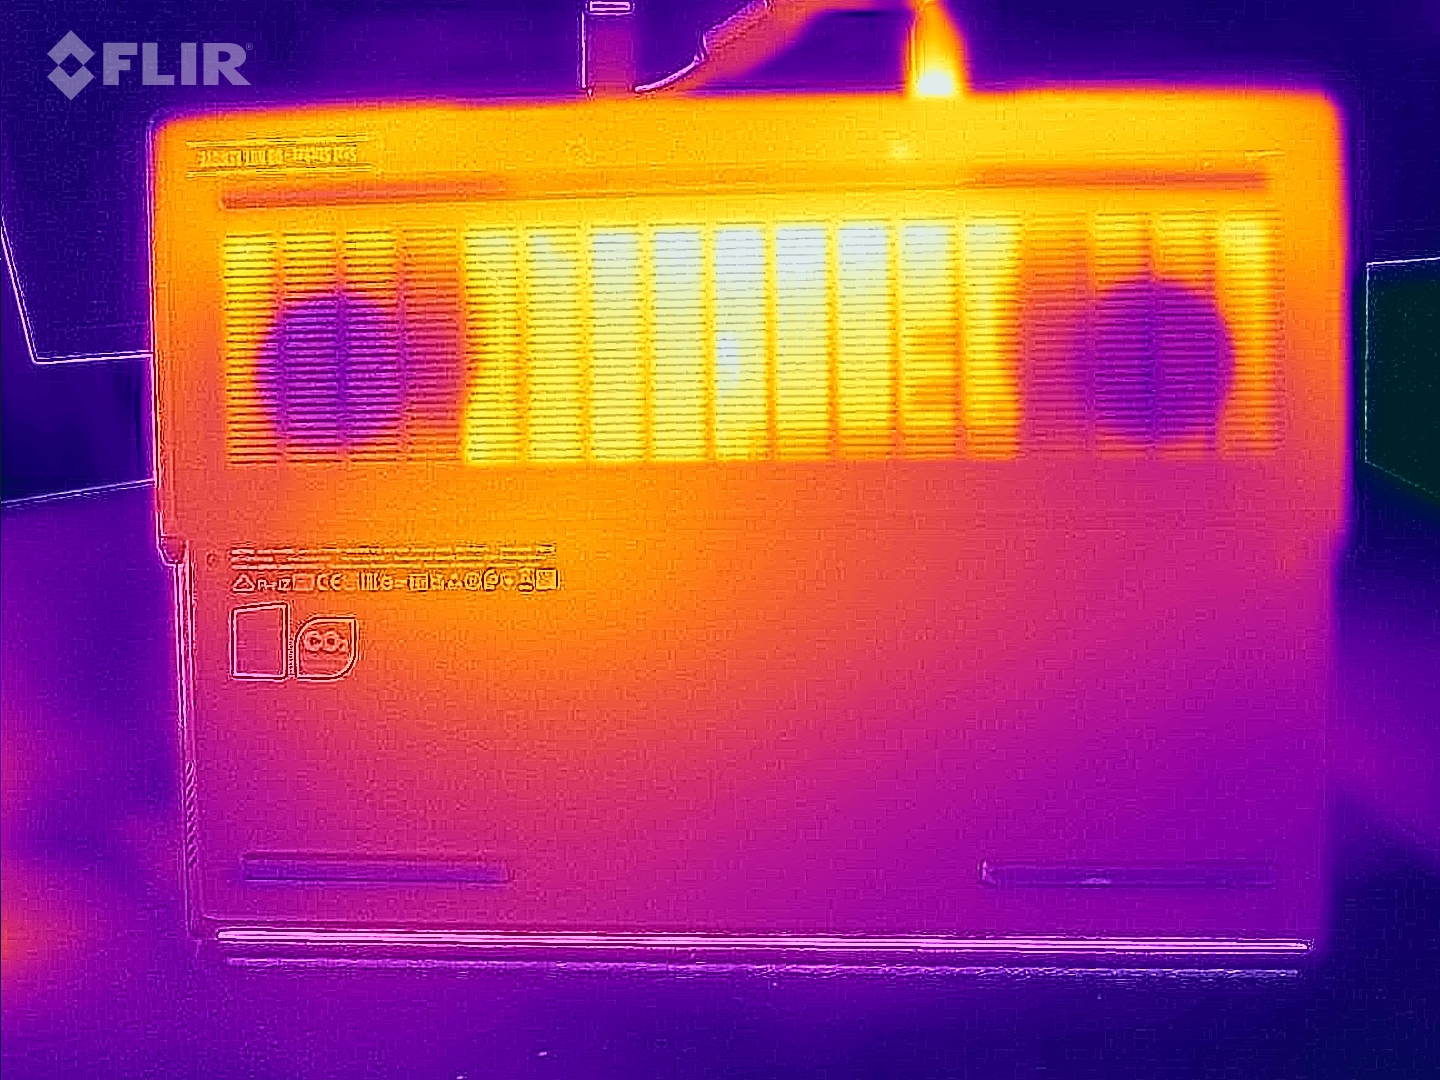
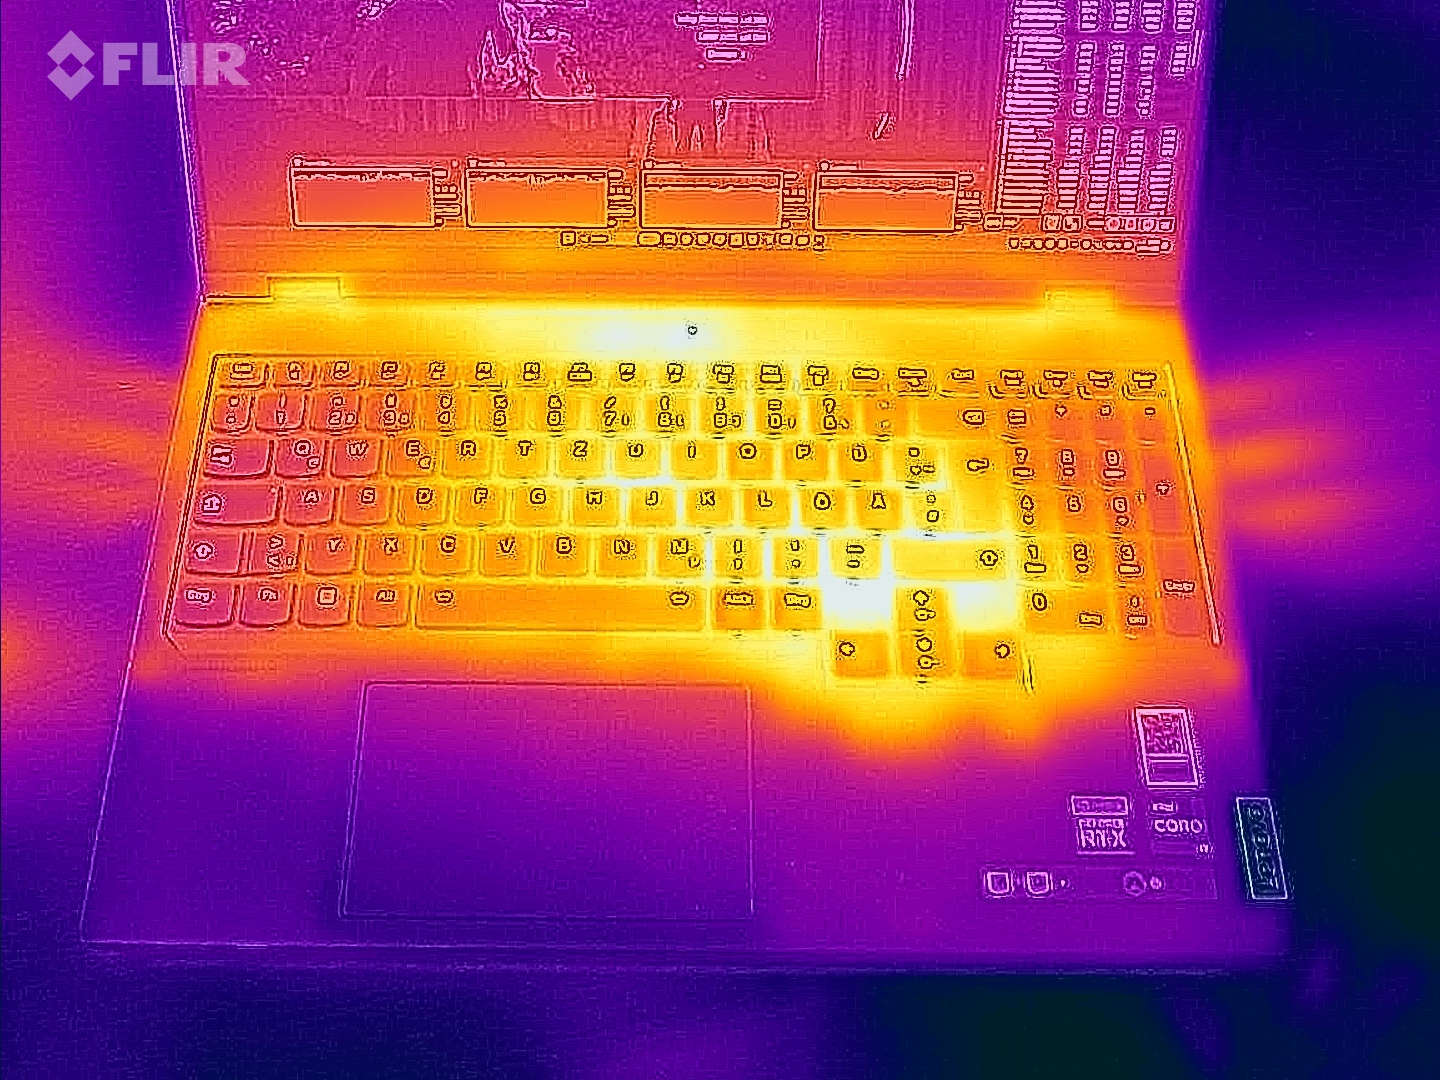
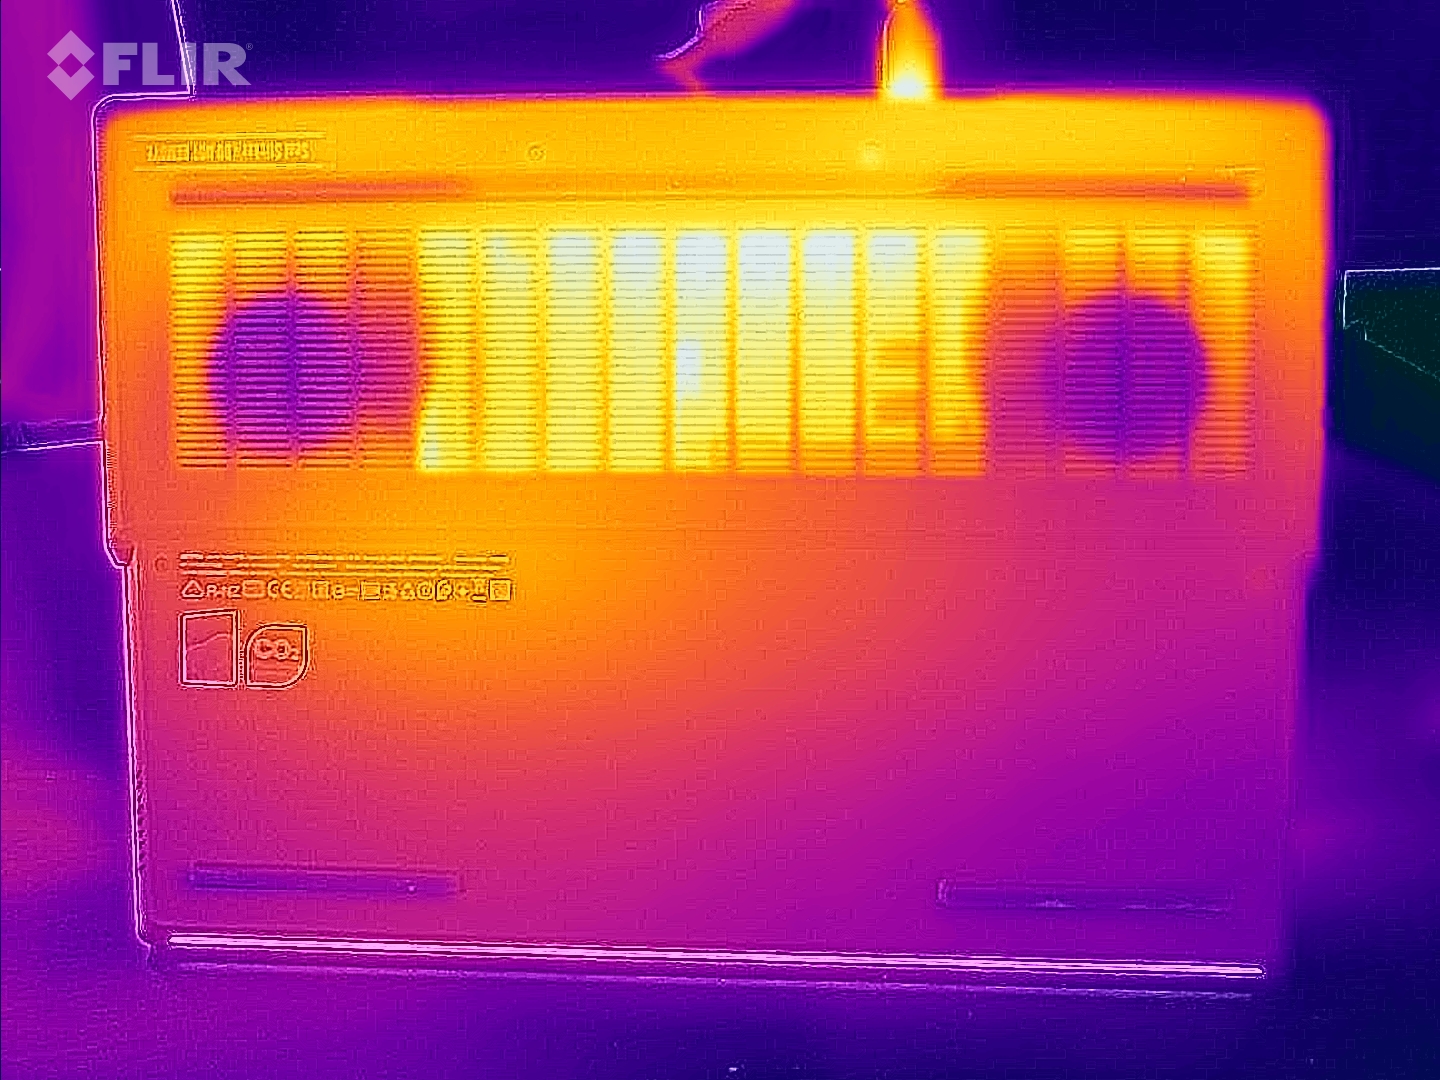
Température
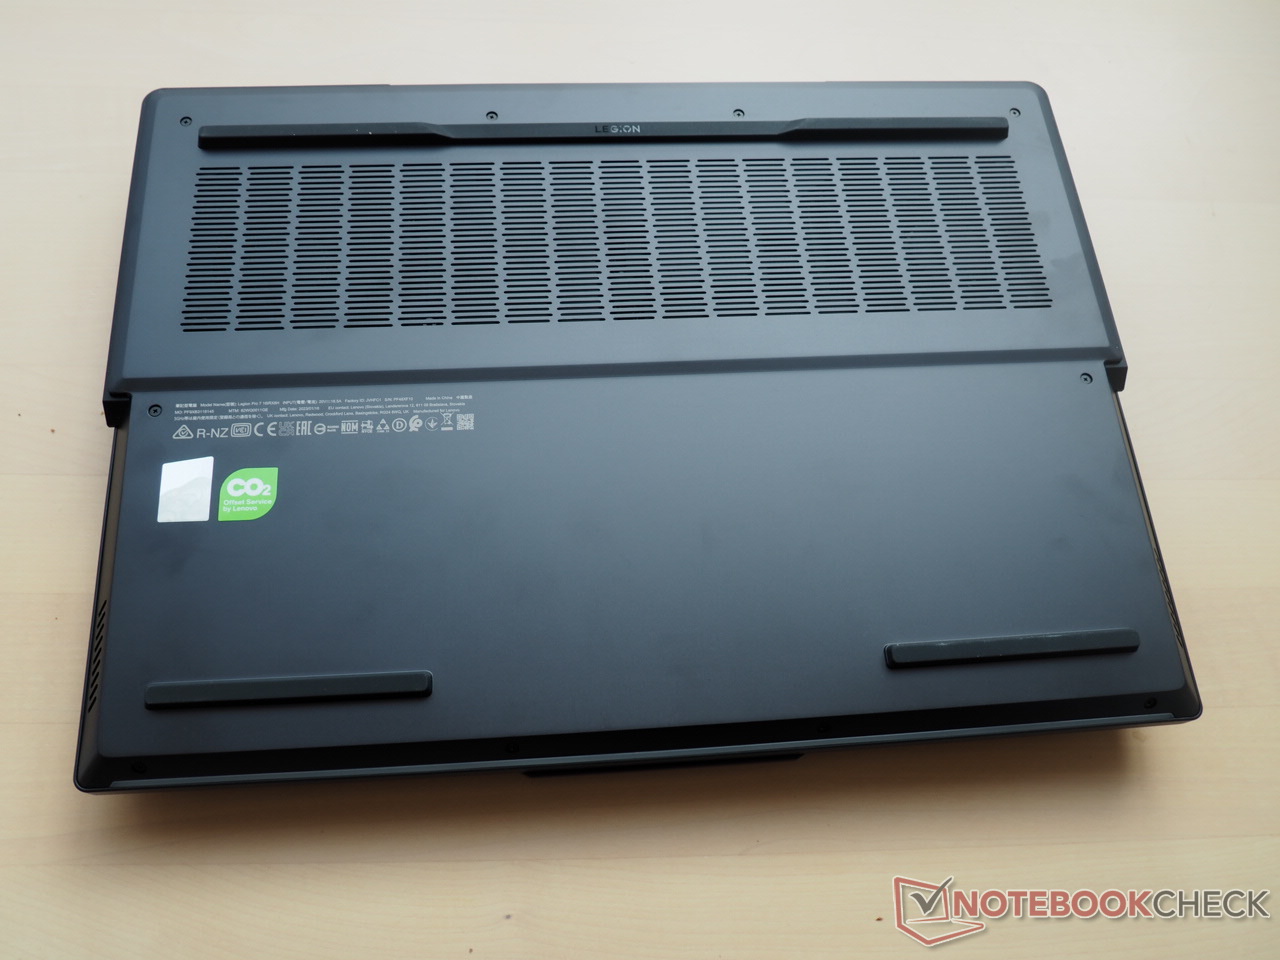
Le boîtier est plus chaud que la concurrence avec un maximum de 53 °C sur le dessus et jusqu'à 59 °C sur le dessous. L'évolution de la température reste dans les limites en mode veille. Le repose-paume, par exemple, atteint environ 29 °C, ce qui est modéré.
(-) La température maximale du côté supérieur est de 53 °C / 127 F, par rapport à la moyenne de 40.4 °C / 105 F, allant de 21.2 à 68.8 °C pour la classe Gaming.
(-) Le fond chauffe jusqu'à un maximum de 59 °C / 138 F, contre une moyenne de 43.2 °C / 110 F
(+) En utilisation inactive, la température moyenne du côté supérieur est de 31 °C / 88 F, par rapport à la moyenne du dispositif de 33.9 °C / 93 F.
(-) En jouant à The Witcher 3, la température moyenne du côté supérieur est de 45.4 °C / 114 F, alors que la moyenne de l'appareil est de 33.9 °C / 93 F.
(-) Les repose-poignets et le pavé tactile peuvent devenir très chauds au toucher, avec un maximum de 45 °C / 113# F.
(-) La température moyenne de la zone de l'appui-paume de dispositifs similaires était de 28.8 °C / 83.8 F (-16.2 °C / #-29.2 F).
| Lenovo Legion Pro 7 RTX4090 Intel Core i9-13900HX, NVIDIA GeForce RTX 4090 Laptop GPU | Razer Blade 16 Early 2023 RTX 4090 Intel Core i9-13950HX, NVIDIA GeForce RTX 4090 Laptop GPU | Asus ROG Strix Scar 17 G733PY-XS96 AMD Ryzen 9 7945HX, NVIDIA GeForce RTX 4090 Laptop GPU | Schenker XMG Neo 16 E23 Intel Core i9-13900HX, NVIDIA GeForce RTX 4090 Laptop GPU | MSI Titan GT77 HX 13VI Intel Core i9-13950HX, NVIDIA GeForce RTX 4090 Laptop GPU | Lenovo Legion Pro 7 16IRX8H Intel Core i9-13900HX, NVIDIA GeForce RTX 4080 Laptop GPU | |
|---|---|---|---|---|---|---|
| Heat | 7% | 25% | 14% | 20% | 1% | |
| Maximum Upper Side * (°C) | 53 | 52 2% | 34.6 35% | 50 6% | 40.6 23% | 48 9% |
| Maximum Bottom * (°C) | 59 | 47.6 19% | 35.6 40% | 51 14% | 41.1 30% | 49 17% |
| Idle Upper Side * (°C) | 34 | 33 3% | 27.2 20% | 28 18% | 26.2 23% | 40 -18% |
| Idle Bottom * (°C) | 32 | 30.6 4% | 30 6% | 26 19% | 30.3 5% | 33 -3% |
* ... Moindre est la valeur, meilleures sont les performances
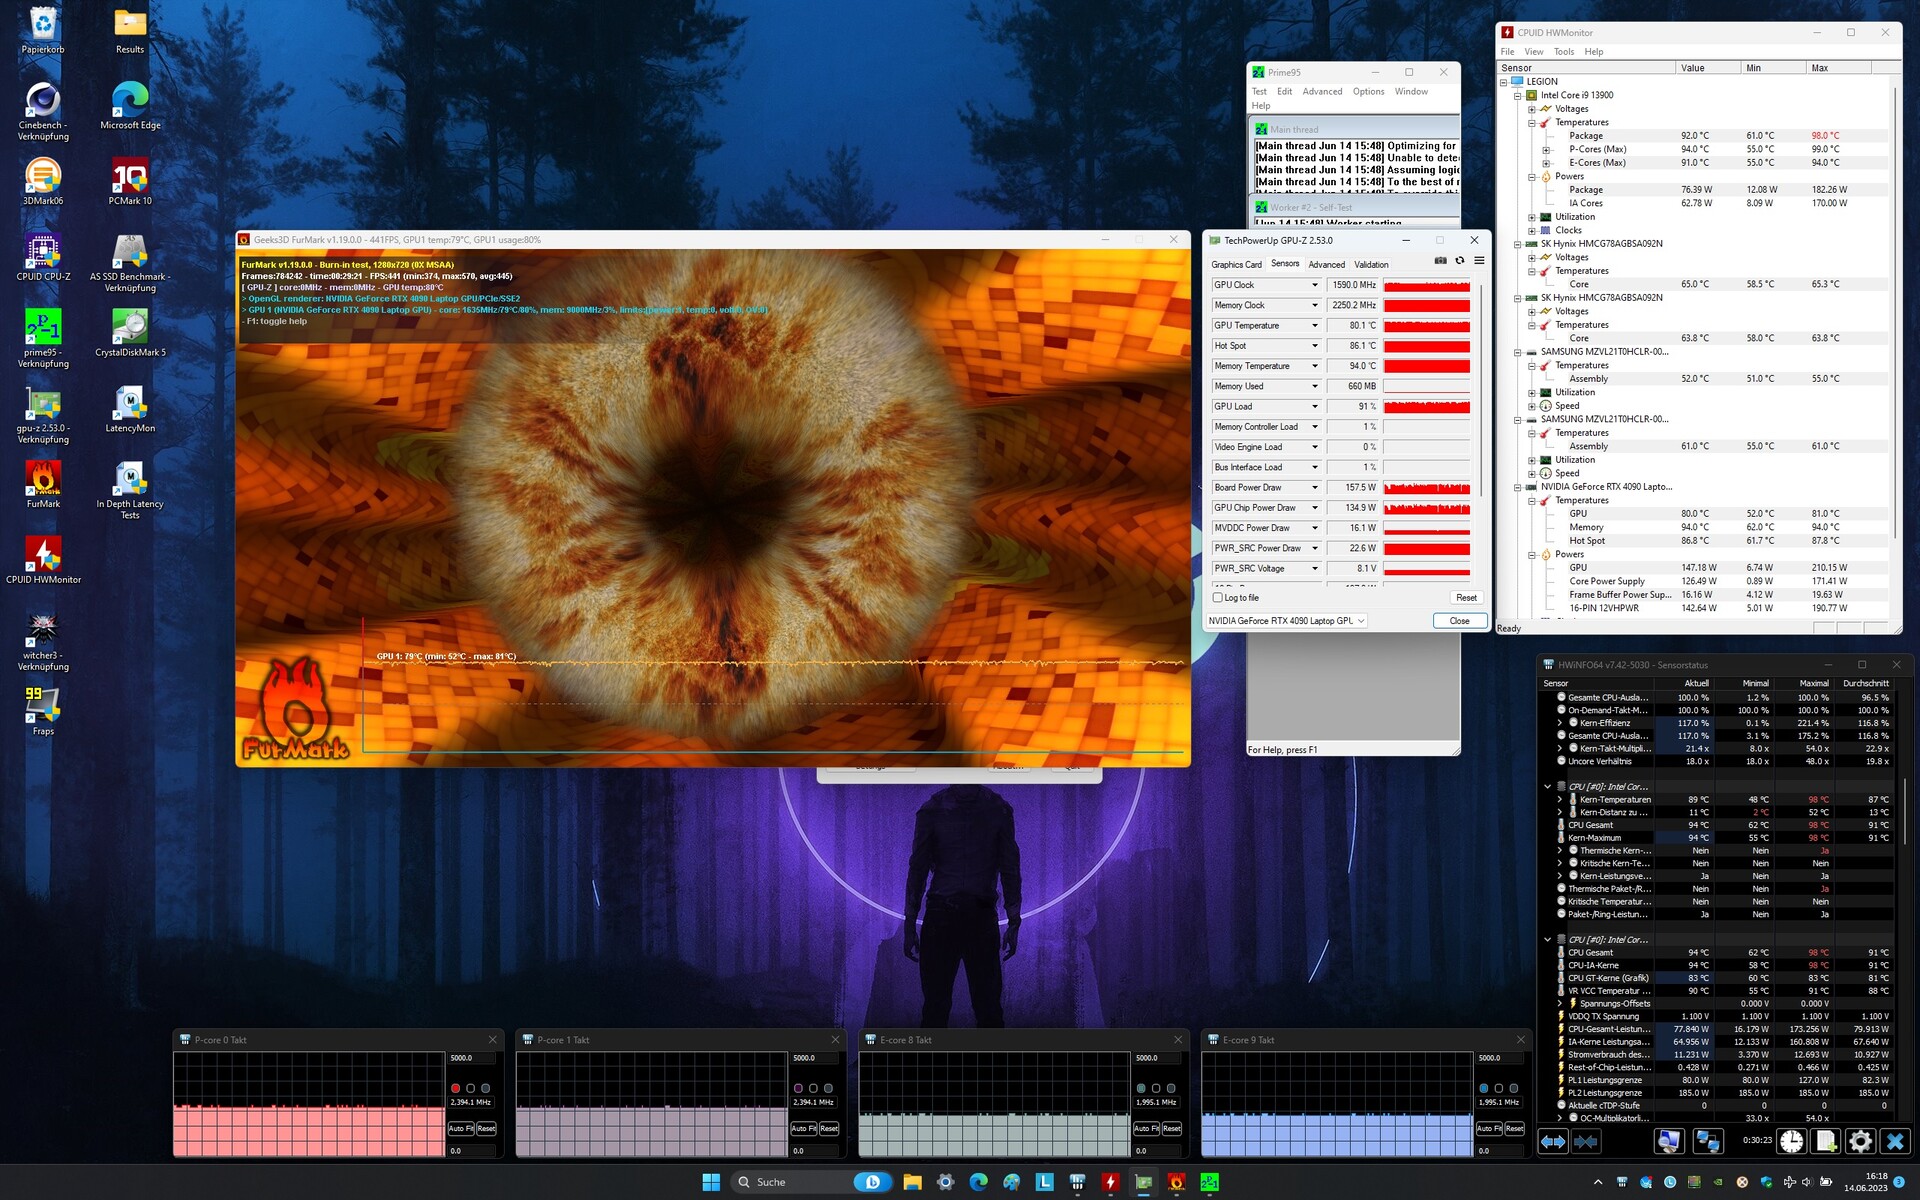
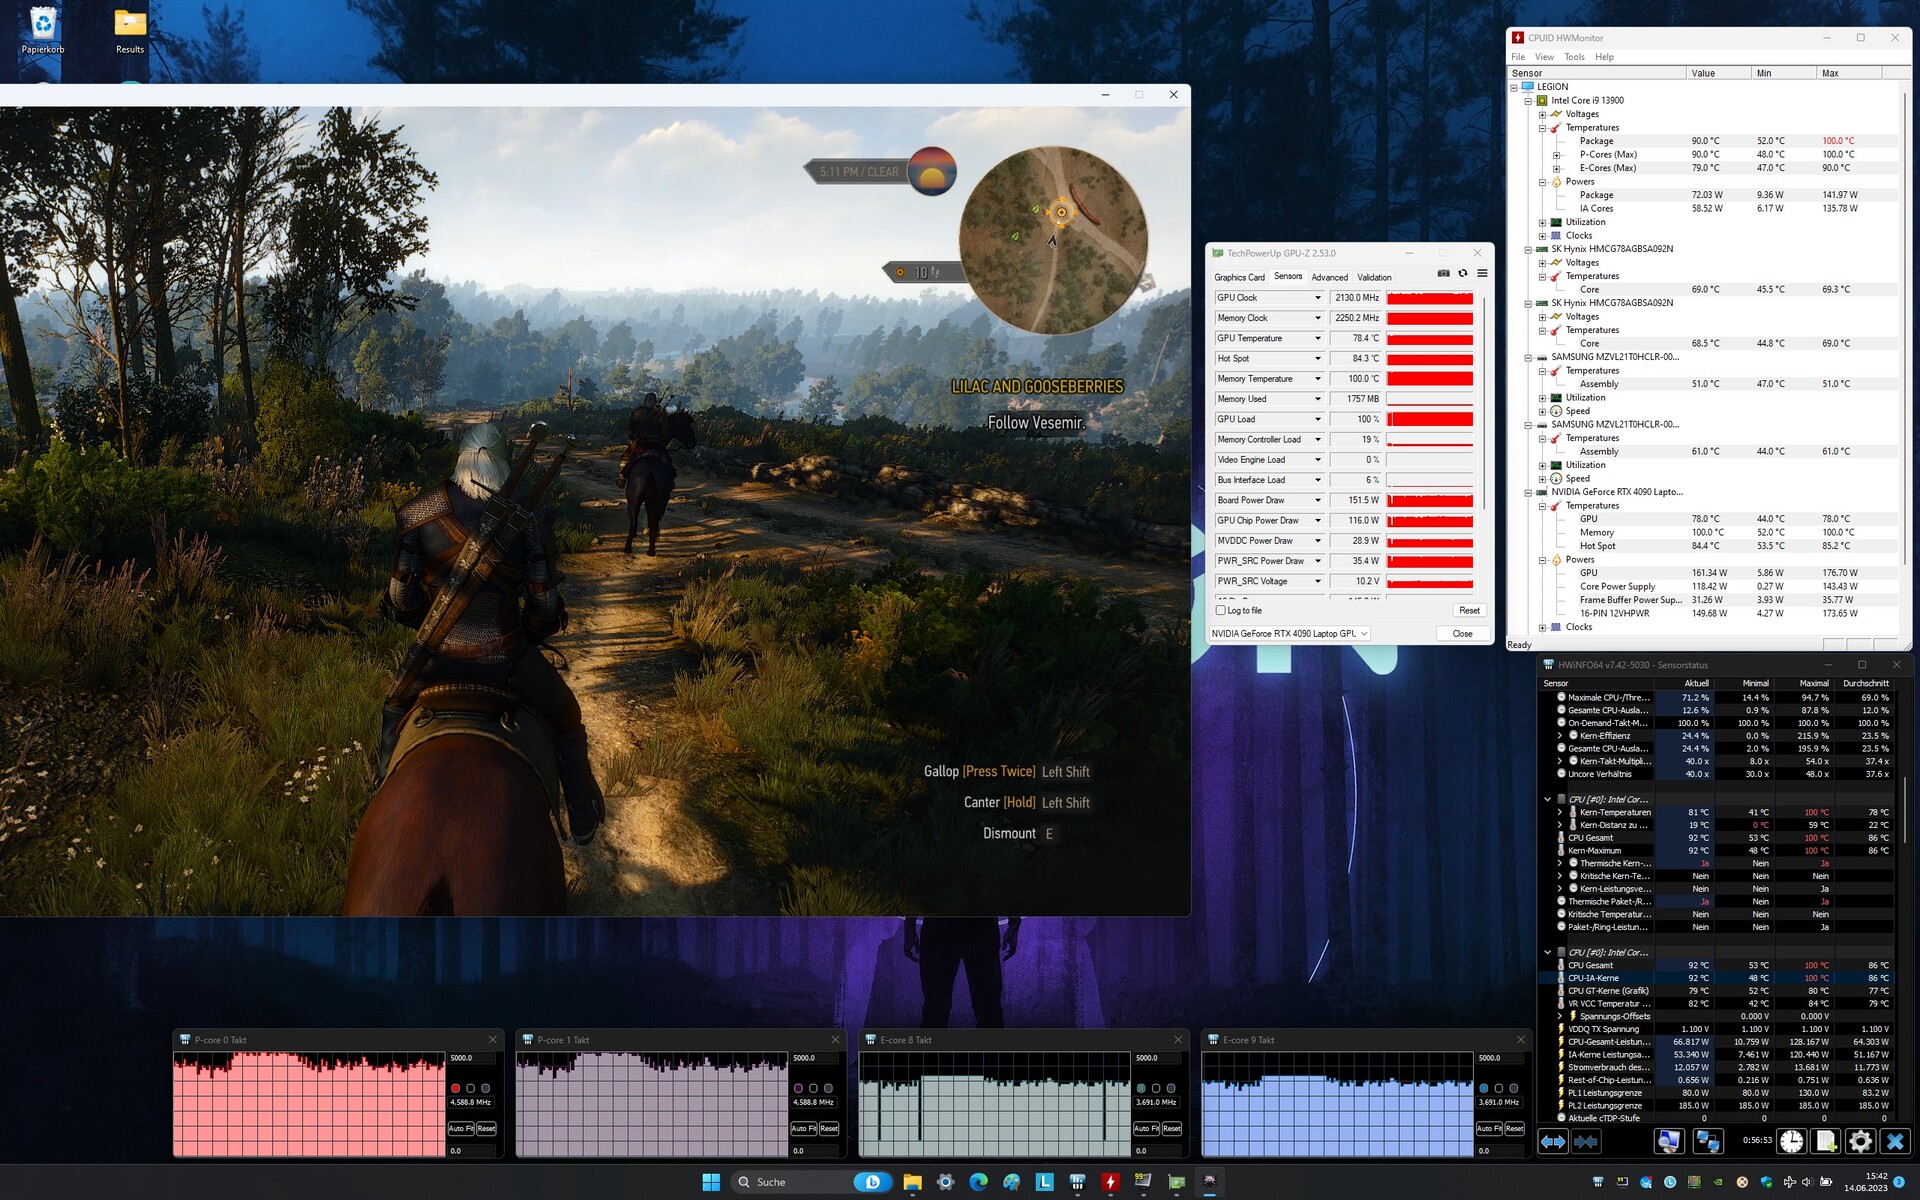
Épreuve d'effort
Le test de stress avec les outils FurMark et Prime95 n'a posé aucun problème. Bien que le processeur ait relativement chauffé (plus de 90 °C), il n'a pas ralenti en dessous de l'horloge de base. Le GPU (~80 °C) s'est comporté de la même manière.
Intervenants
Lenovo Legion Pro 7 RTX4090 analyse audio
(+) | les haut-parleurs peuvent jouer relativement fort (82# dB)
Basses 100 - 315 Hz
(±) | basse réduite - en moyenne 5.6% inférieure à la médiane
(+) | les basses sont linéaires (6.8% delta à la fréquence précédente)
Médiums 400 - 2000 Hz
(+) | médiane équilibrée - seulement 4.8% de la médiane
(+) | les médiums sont linéaires (5.1% delta à la fréquence précédente)
Aiguës 2 - 16 kHz
(+) | des sommets équilibrés - à seulement 1.7% de la médiane
(+) | les aigus sont linéaires (4% delta à la fréquence précédente)
Globalement 100 - 16 000 Hz
(+) | le son global est linéaire (8.7% différence à la médiane)
Par rapport à la même classe
» 3% de tous les appareils testés de cette catégorie étaient meilleurs, 1% similaires, 97% pires
» Le meilleur avait un delta de 6%, la moyenne était de 18%, le pire était de 132%.
Par rapport à tous les appareils testés
» 3% de tous les appareils testés étaient meilleurs, 1% similaires, 97% pires
» Le meilleur avait un delta de 4%, la moyenne était de 23%, le pire était de 134%.
Razer Blade 16 Early 2023 RTX 4090 analyse audio
(±) | le niveau sonore du haut-parleur est moyen mais bon (75# dB)
Basses 100 - 315 Hz
(±) | basse réduite - en moyenne 13.4% inférieure à la médiane
(±) | la linéarité des basses est moyenne (14.8% delta à la fréquence précédente)
Médiums 400 - 2000 Hz
(±) | médiane supérieure - en moyenne 5.3% supérieure à la médiane
(+) | les médiums sont linéaires (3.8% delta à la fréquence précédente)
Aiguës 2 - 16 kHz
(+) | des sommets équilibrés - à seulement 3.4% de la médiane
(+) | les aigus sont linéaires (4.2% delta à la fréquence précédente)
Globalement 100 - 16 000 Hz
(±) | la linéarité du son global est moyenne (15.6% de différence avec la médiane)
Par rapport à la même classe
» 36% de tous les appareils testés de cette catégorie étaient meilleurs, 6% similaires, 58% pires
» Le meilleur avait un delta de 6%, la moyenne était de 18%, le pire était de 132%.
Par rapport à tous les appareils testés
» 23% de tous les appareils testés étaient meilleurs, 5% similaires, 72% pires
» Le meilleur avait un delta de 4%, la moyenne était de 23%, le pire était de 134%.
Gestion de l'énergie
Consommation électrique
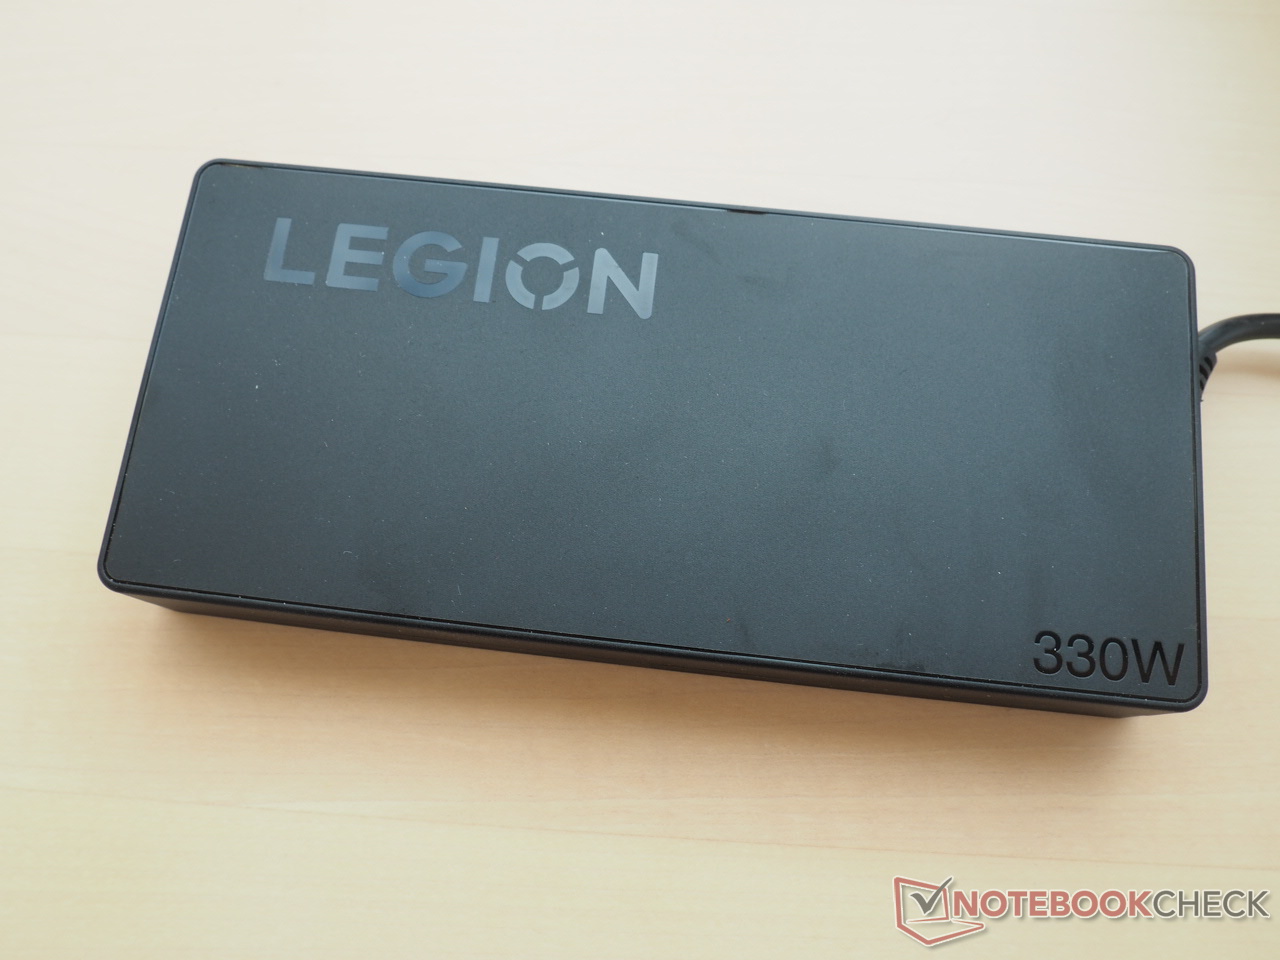
Même si certaines concurrentes consomment moins, la consommation d'énergie est typique pour une carte RTX 4090. Alors que nous avons mesuré entre 20 et 35 watts en mode veille, la consommation se situe entre 136 et 320 watts en charge. Le bloc d'alimentation de 330 watts fourni est donc suffisamment puissant.
| Éteint/en veille | |
| Au repos | |
| Fortement sollicité |
|
Légende:
min: | |
| Lenovo Legion Pro 7 RTX4090 i9-13900HX, GeForce RTX 4090 Laptop GPU | Razer Blade 16 Early 2023 RTX 4090 i9-13950HX, GeForce RTX 4090 Laptop GPU | Asus ROG Strix Scar 17 G733PY-XS96 R9 7945HX, GeForce RTX 4090 Laptop GPU | Schenker XMG Neo 16 E23 i9-13900HX, GeForce RTX 4090 Laptop GPU | MSI Titan GT77 HX 13VI i9-13950HX, GeForce RTX 4090 Laptop GPU | Lenovo Legion Pro 7 16IRX8H i9-13900HX, GeForce RTX 4080 Laptop GPU | Moyenne de la classe Gaming | |
|---|---|---|---|---|---|---|---|
| Power Consumption | -11% | 8% | 14% | 10% | 6% | 25% | |
| Idle Minimum * (Watt) | 20 | 27.5 -38% | 14.5 27% | 8 60% | 14 30% | 18 10% | 13 ? 35% |
| Idle Average * (Watt) | 25 | 34.4 -38% | 21.1 16% | 18 28% | 21.6 14% | 24 4% | 19 ? 24% |
| Idle Maximum * (Watt) | 35 | 35.4 -1% | 42.8 -22% | 28 20% | 24.8 29% | 32 9% | 24.6 ? 30% |
| Load Average * (Watt) | 136 | 147.8 -9% | 116.7 14% | 133 2% | 122.5 10% | 130 4% | 110.7 ? 19% |
| Witcher 3 ultra * (Watt) | 282 | 256 9% | 278 1% | 294 -4% | 265 6% | 260 8% | |
| Load Maximum * (Watt) | 320 | 286.7 10% | 279.6 13% | 399 -25% | 418 -31% | 320 -0% | 259 ? 19% |
* ... Moindre est la valeur, meilleures sont les performances
Power consumption Witcher 3 / Stresstest
Power consumption external monitor
Durée de vie de la batterie
L'autonomie de la batterie du Legion Pro 7 n'est ni mauvaise ni particulièrement bonne. Le 16 pouces a réussi notre test pratique WLAN avec une luminosité d'affichage réduite à 150 cd/m² pendant environ 5 heures.
| Lenovo Legion Pro 7 RTX4090 i9-13900HX, GeForce RTX 4090 Laptop GPU, 99.9 Wh | Razer Blade 16 Early 2023 RTX 4090 i9-13950HX, GeForce RTX 4090 Laptop GPU, 95.2 Wh | Asus ROG Strix Scar 17 G733PY-XS96 R9 7945HX, GeForce RTX 4090 Laptop GPU, 90 Wh | Schenker XMG Neo 16 E23 i9-13900HX, GeForce RTX 4090 Laptop GPU, 99 Wh | MSI Titan GT77 HX 13VI i9-13950HX, GeForce RTX 4090 Laptop GPU, 99.9 Wh | Lenovo Legion Pro 7 16IRX8H i9-13900HX, GeForce RTX 4080 Laptop GPU, 99.9 Wh | Moyenne de la classe Gaming | |
|---|---|---|---|---|---|---|---|
| Autonomie de la batterie | 14% | -20% | 31% | 4% | 0% | 39% | |
| WiFi v1.3 (h) | 5.1 | 5.8 14% | 4.1 -20% | 6.7 31% | 5.3 4% | 5.1 0% | 7.11 ? 39% |
| H.264 (h) | 8.4 | 5.8 | 6 | 8.32 ? | |||
| Witcher 3 ultra (h) | 1.6 | 1.4 | |||||
| Load (h) | 1.4 | 1.4 | 2.1 | 1.502 ? | |||
| Reader / Idle (h) | 6.4 | 8.27 ? |
Points positifs
Points négatifs
Verdict
Ceux qui peuvent accepter le prix exorbitant d'au moins 4.500 euros trouveront dans le Legion Pro 7 un gamer haut de gamme presque entièrement réussi au format 16 pouces.
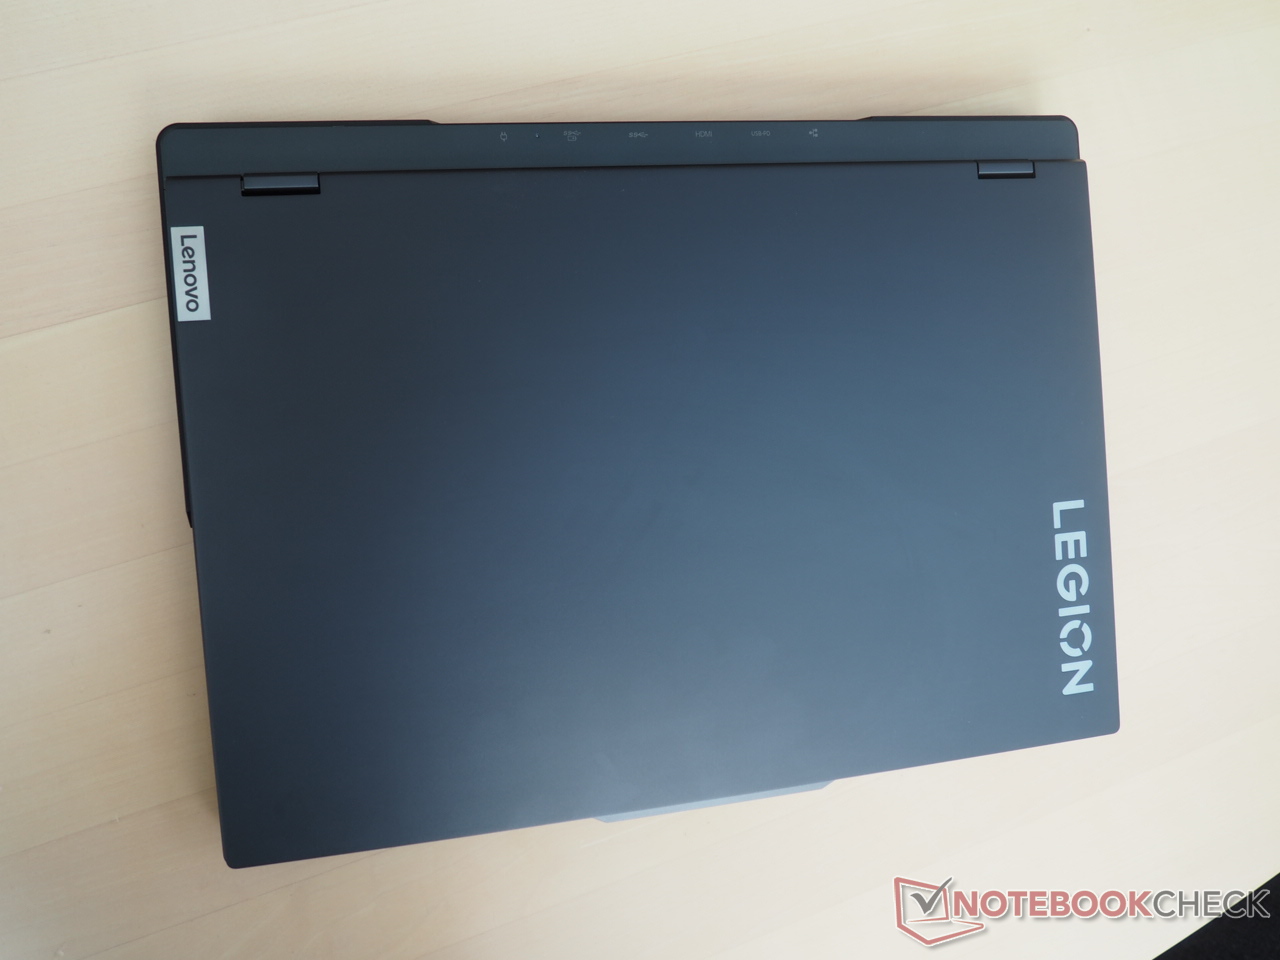
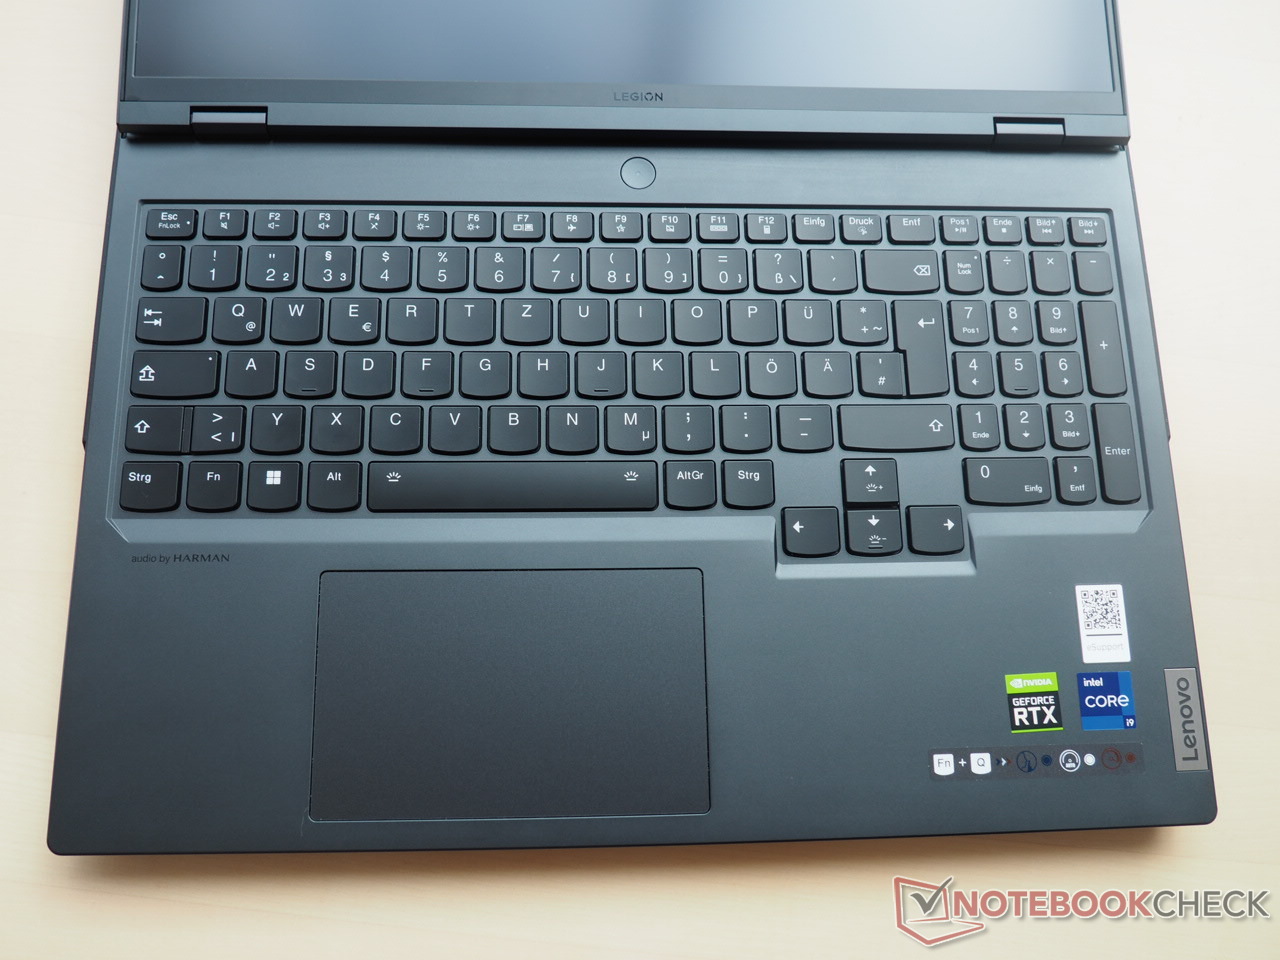
Lenovo mise non seulement sur un châssis stable et de grande qualité, mais aussi sur de bons périphériques d'entrée. La connectivité (y compris Thunderbolt 4) et l'écran WQXGA satisferont également la plupart des acheteurs. L'écran 16:10 (240 Hz) offre, entre autres, une bonne luminosité, une précision des couleurs convaincante et des temps de réponse courts pour les normes IPS.
Du côté négatif, nous avons - comme c'est malheureusement le cas pour les ordinateurs portables haut de gamme - une température très élevée et un développement du bruit sous charge. Sans casque, le mode performance n'est pas une partie de plaisir. Nous recommandons d'utiliser le mode silencieux ou équilibré.
Dans l'ensemble, le Legion Pro 7 avec RTX 4090 - comme le modèle RTX 4080 - obtient toujours une très bonne note et fait donc partie des meilleurs ordinateurs portables haut de gamme sur le marché
.
Si vous voulez un ordinateur plus silencieux et/ou plus léger, vous devriez jeter un coup d'œil au Blade 16. Le concurrent de Razer a même obtenu une note légèrement meilleure dans le test.
Prix et disponibilité
Lenovo Legion Pro 7 RTX4090
- 06/16/2023 v7 (old)
Florian Glaser
Transparency
La sélection des appareils à examiner est effectuée par notre équipe éditoriale. L'échantillon de test a été prêté à l'auteur par le fabricant ou le détaillant pour les besoins de cet examen. Le prêteur n'a pas eu d'influence sur cette évaluation et le fabricant n'a pas reçu de copie de cette évaluation avant sa publication. Il n'y avait aucune obligation de publier cet article. En tant que média indépendant, Notebookcheck n'est pas soumis à l'autorité des fabricants, des détaillants ou des éditeurs.
Voici comment Notebookcheck teste
Chaque année, Notebookcheck examine de manière indépendante des centaines d'ordinateurs portables et de smartphones en utilisant des procédures standardisées afin de garantir que tous les résultats sont comparables. Nous avons continuellement développé nos méthodes de test depuis environ 20 ans et avons établi des normes industrielles dans le processus. Dans nos laboratoires de test, des équipements de mesure de haute qualité sont utilisés par des techniciens et des rédacteurs expérimentés. Ces tests impliquent un processus de validation en plusieurs étapes. Notre système d'évaluation complexe repose sur des centaines de mesures et de points de référence bien fondés, ce qui garantit l'objectivité.Price comparison
