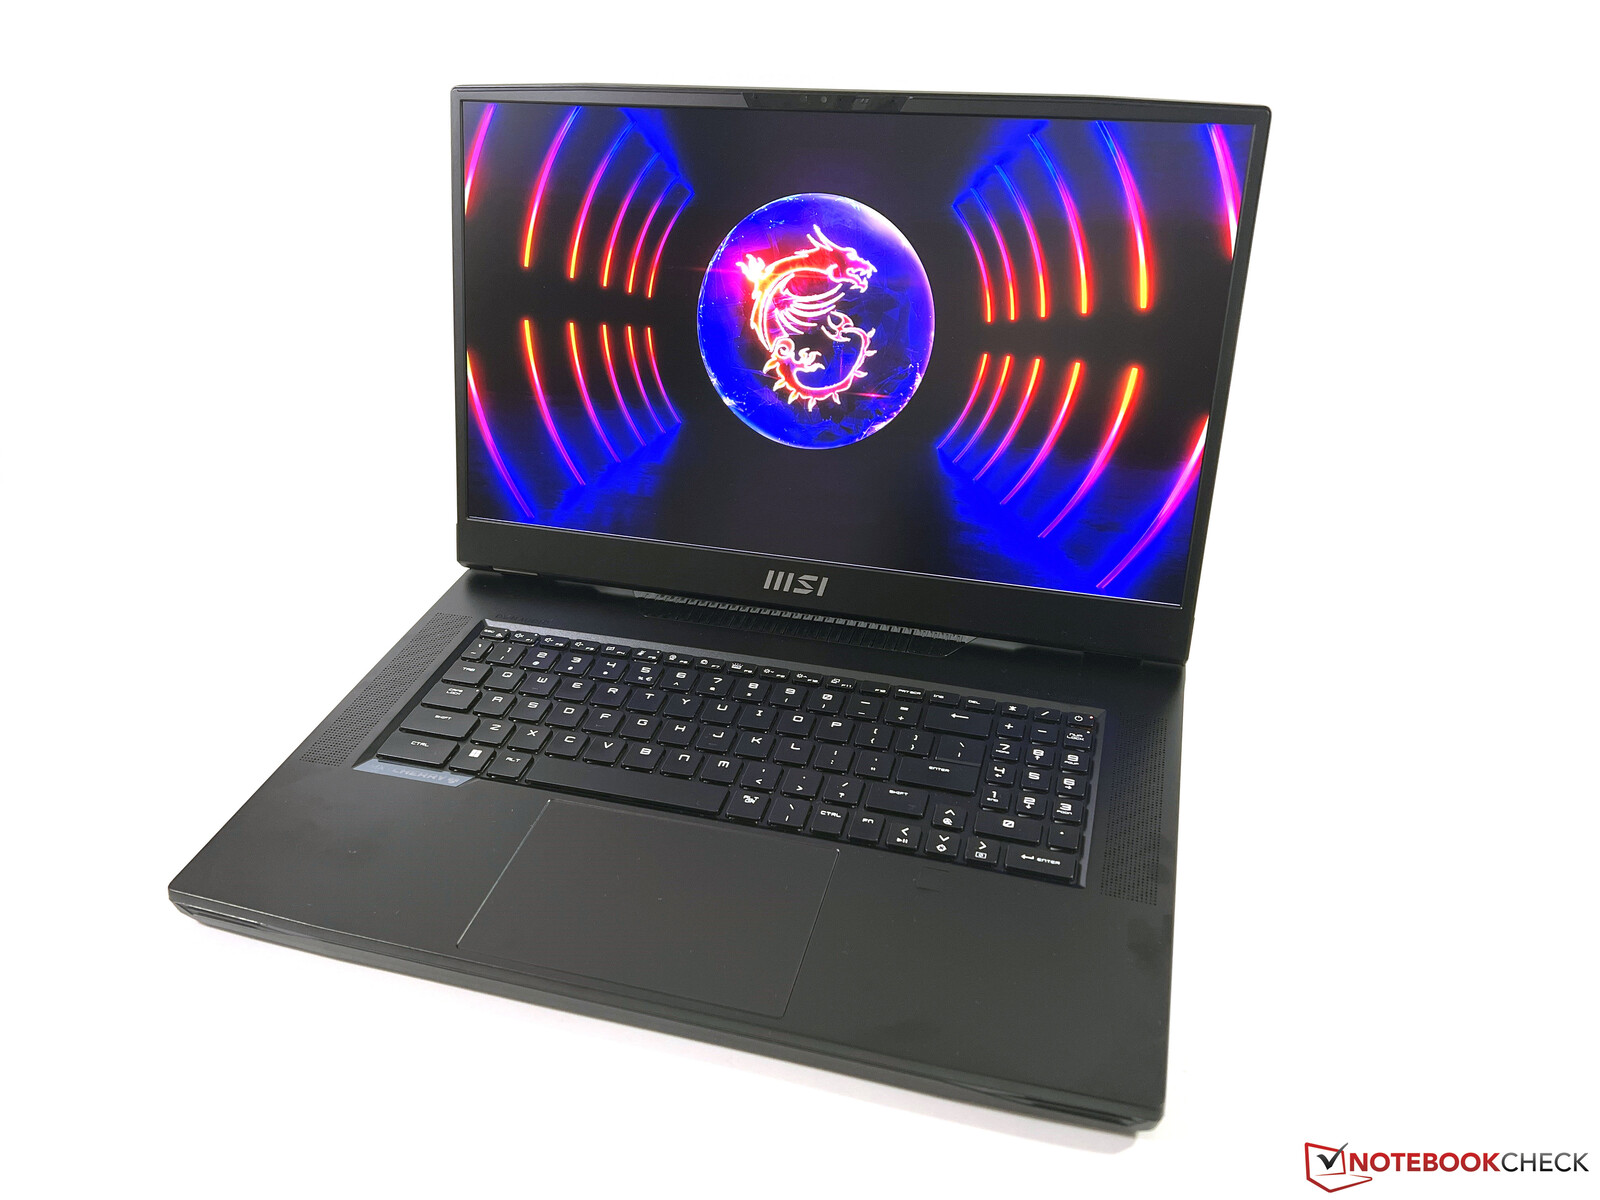
Test du MSI Titan GT77 HX 13V : le PC portable de jeu ultime avec RTX 4090 et Core i9-13950HX
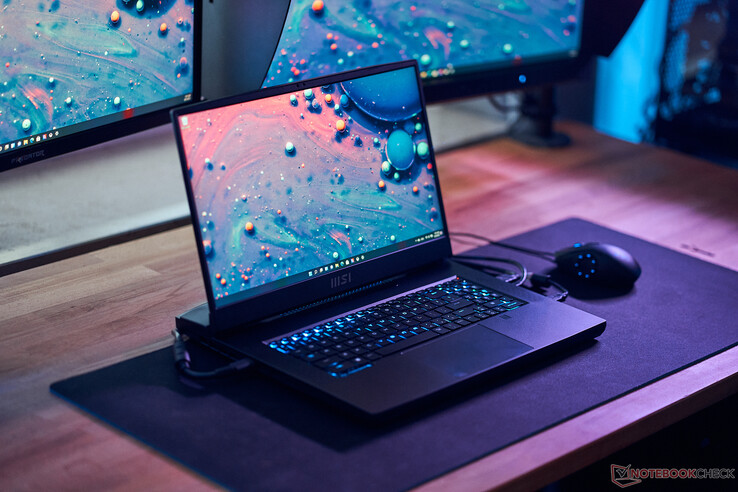
La série Titan GT77 de MSI propose des ordinateurs portables de jeu phares conçus pour des performances maximales. Le nouveau modèle 2023 GT77 HX 13VI poursuit ce concept et utilise certains des meilleurs composants mobiles disponibles. En plus des derniers processeurs Raptor Lake-HX d'Intel, vous pouvez également profiter des tout nouveaux GPU pour ordinateurs portables de Nvidia : GeForce.RTX 4080ou GeForce RTX 4090. MSI équipe également le nouveau GT77 d'un écran mini-LED 4K avec un taux de rafraîchissement de 144 Hz.
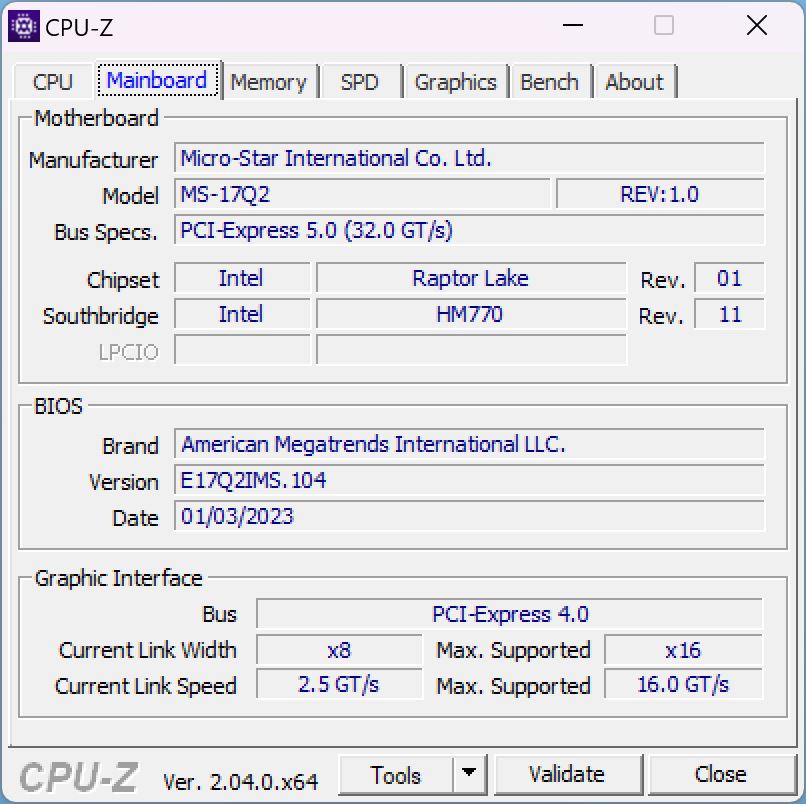
Notre unité de revue est une unité de pré-production avec leCore i9-13950HXGeForce RTX 4090, 64 Go de RAM, 4 To de stockage SSD et l'écran 4K Mini-LED. Les configurations de détail (GT77 HX 13VI) avec les mêmes spécifications seront livrées avec leCore i9-13980HX(fréquences légèrement plus élevées, mais pas de support vPro en contrepartie) pour un prix de vente conseillé de 6599 euros en Allemagne (5299 $) ; le SKU avec le RTX 4080 et un stockage SSD de 2 TB sera vendu 5499 euros (GT77 HX 13VH, 4299 $).
Comparaison avec les concurrents potentiels
Note | Date | Modèle | Poids | Épaisseur | Taille | Résolution | Prix |
|---|---|---|---|---|---|---|---|
| 89 % v7 (old) | 02/23 | MSI Titan GT77 HX 13VI i9-13950HX, GeForce RTX 4090 Laptop GPU | 3.5 kg | 23 mm | 17.30" | 3840x2160 | |
| 91.2 % v7 (old) | 02/23 | Razer Blade 16 Early 2023 i9-13950HX, GeForce RTX 4080 Laptop GPU | 2.4 kg | 21.99 mm | 16.00" | 2560x1600 | |
| 86.9 % v7 (old) | 11/22 | Asus ROG Strix Scar 17 SE G733CX-LL014W i9-12950HX, GeForce RTX 3080 Ti Laptop GPU | 2.9 kg | 28.3 mm | 17.30" | 2560x1440 | |
| 88.3 % v7 (old) | 08/22 | MSI Titan GT77 12UHS i9-12900HX, GeForce RTX 3080 Ti Laptop GPU | 3.3 kg | 23 mm | 17.30" | 1920x1080 | |
| 89.2 % v7 (old) | 05/22 | Alienware x17 R2 P48E i9-12900HK, GeForce RTX 3080 Ti Laptop GPU | 3.1 kg | 20.9 mm | 17.30" | 1920x1080 | |
| 87.6 % v7 (old) | 09/22 | Schenker XMG Neo 17 M22 R9 6900HX, GeForce RTX 3080 Ti Laptop GPU | 2.8 kg | 27 mm | 17.00" | 2560x1600 |
Cas - Titan avec éclairage limité
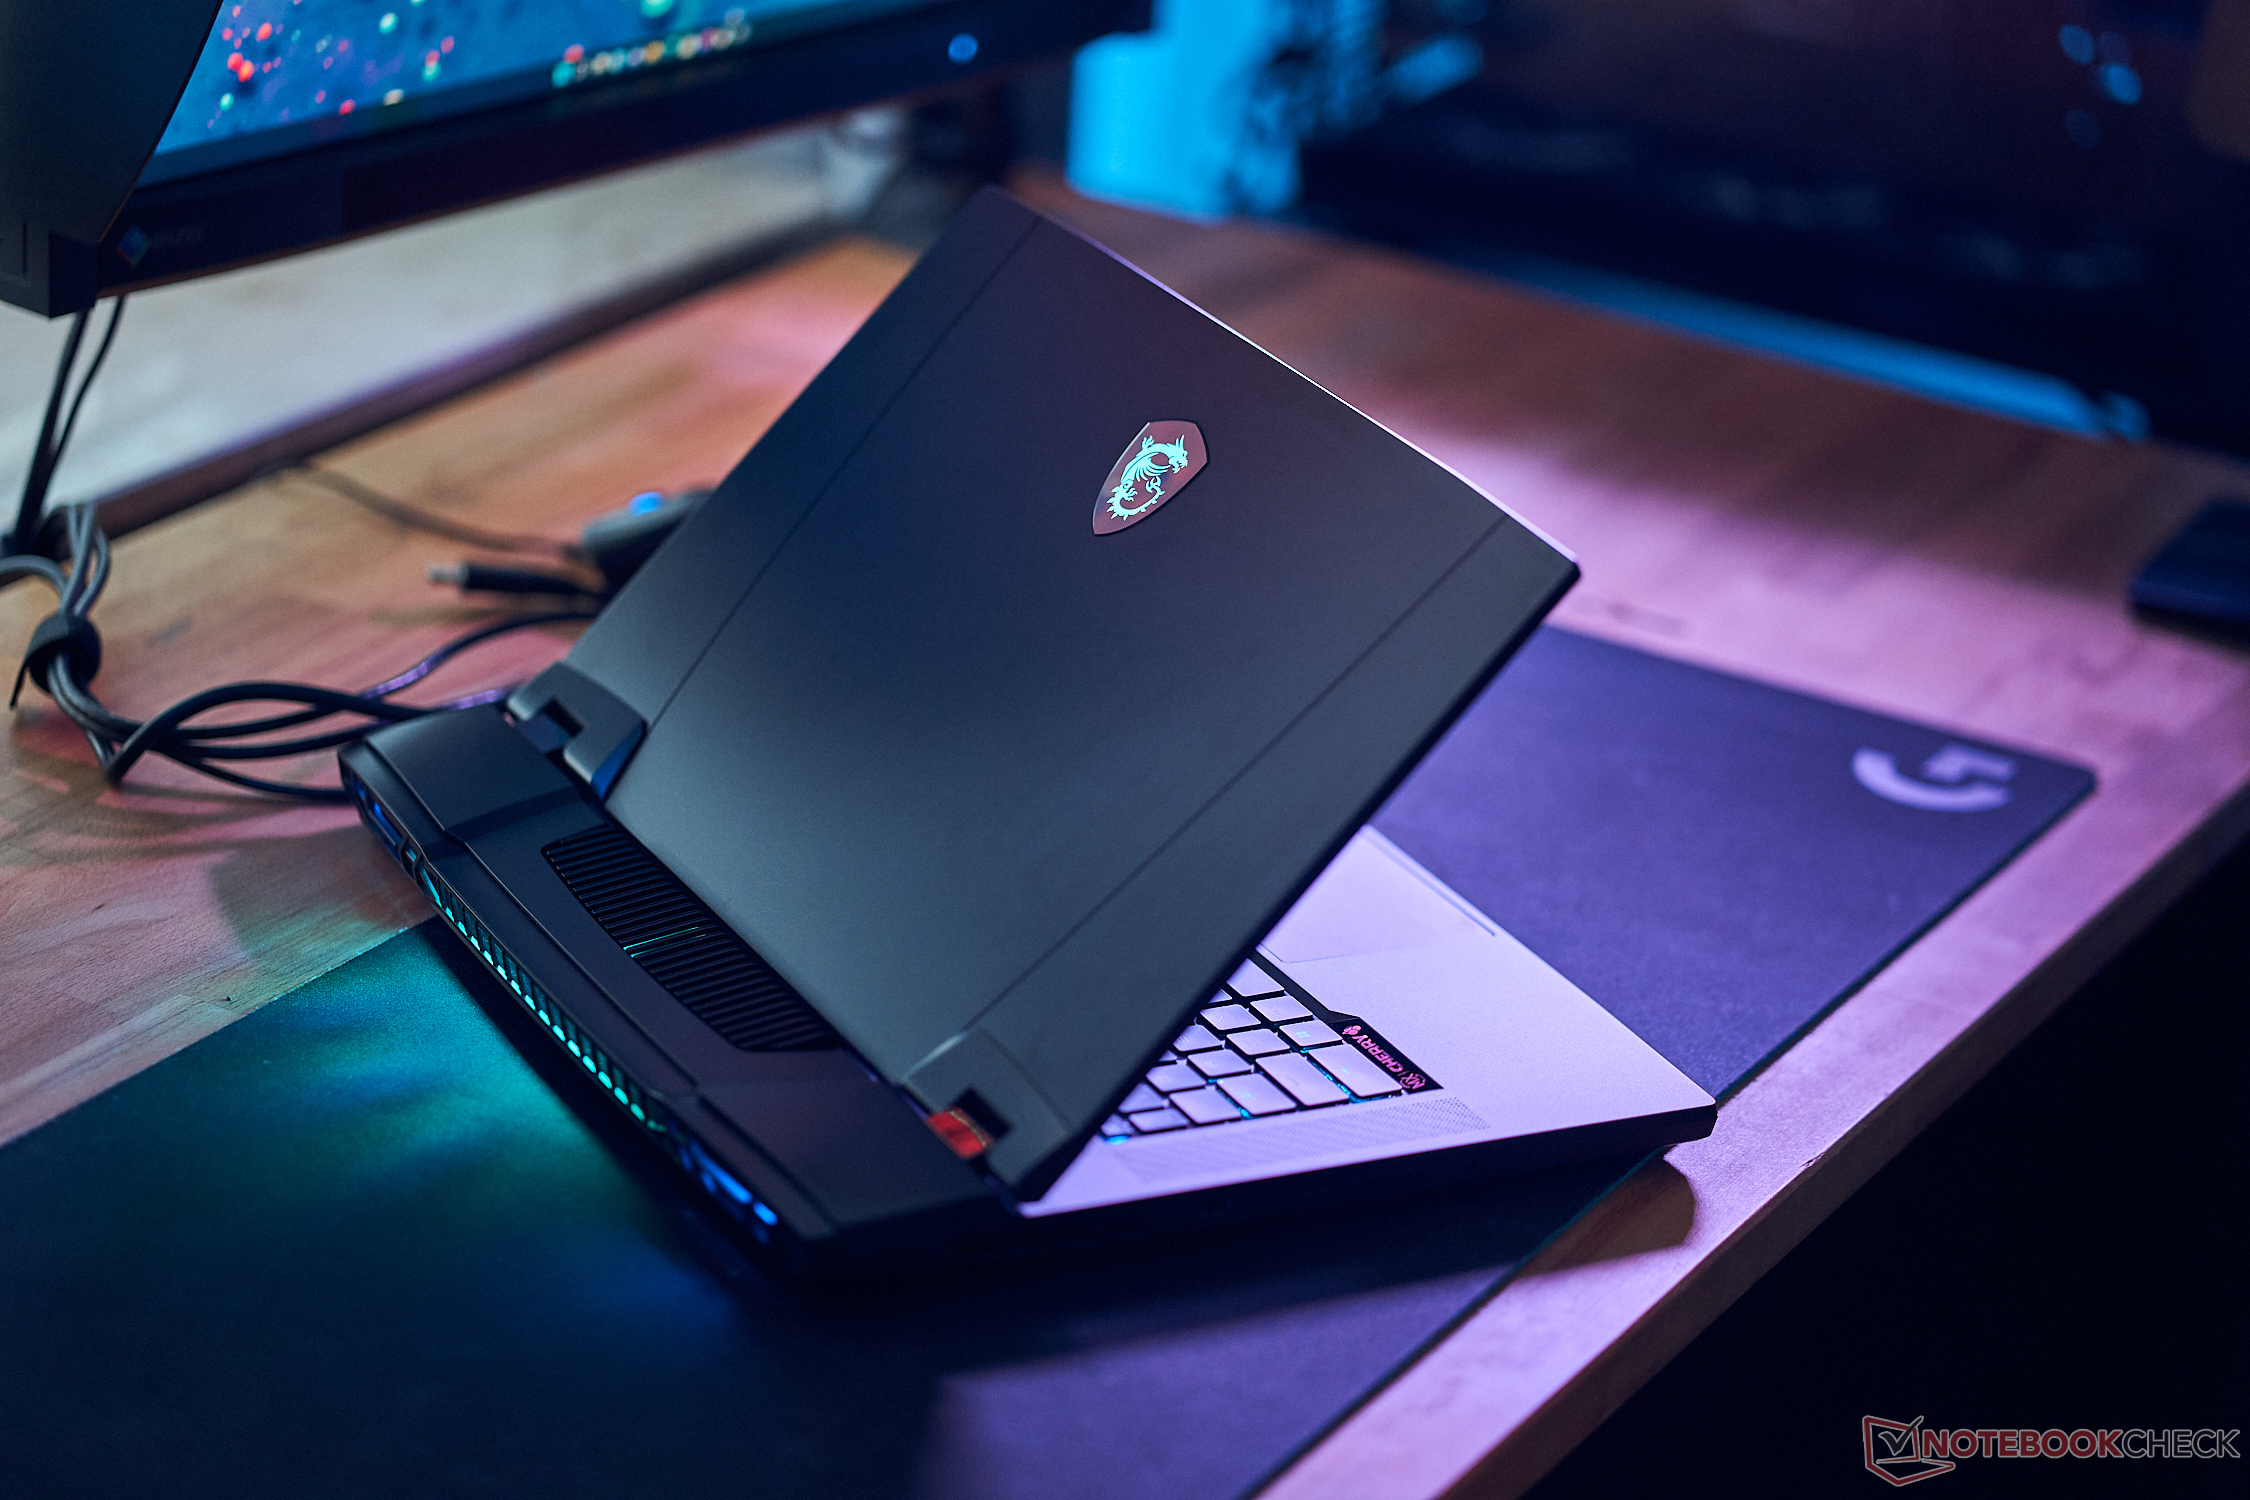
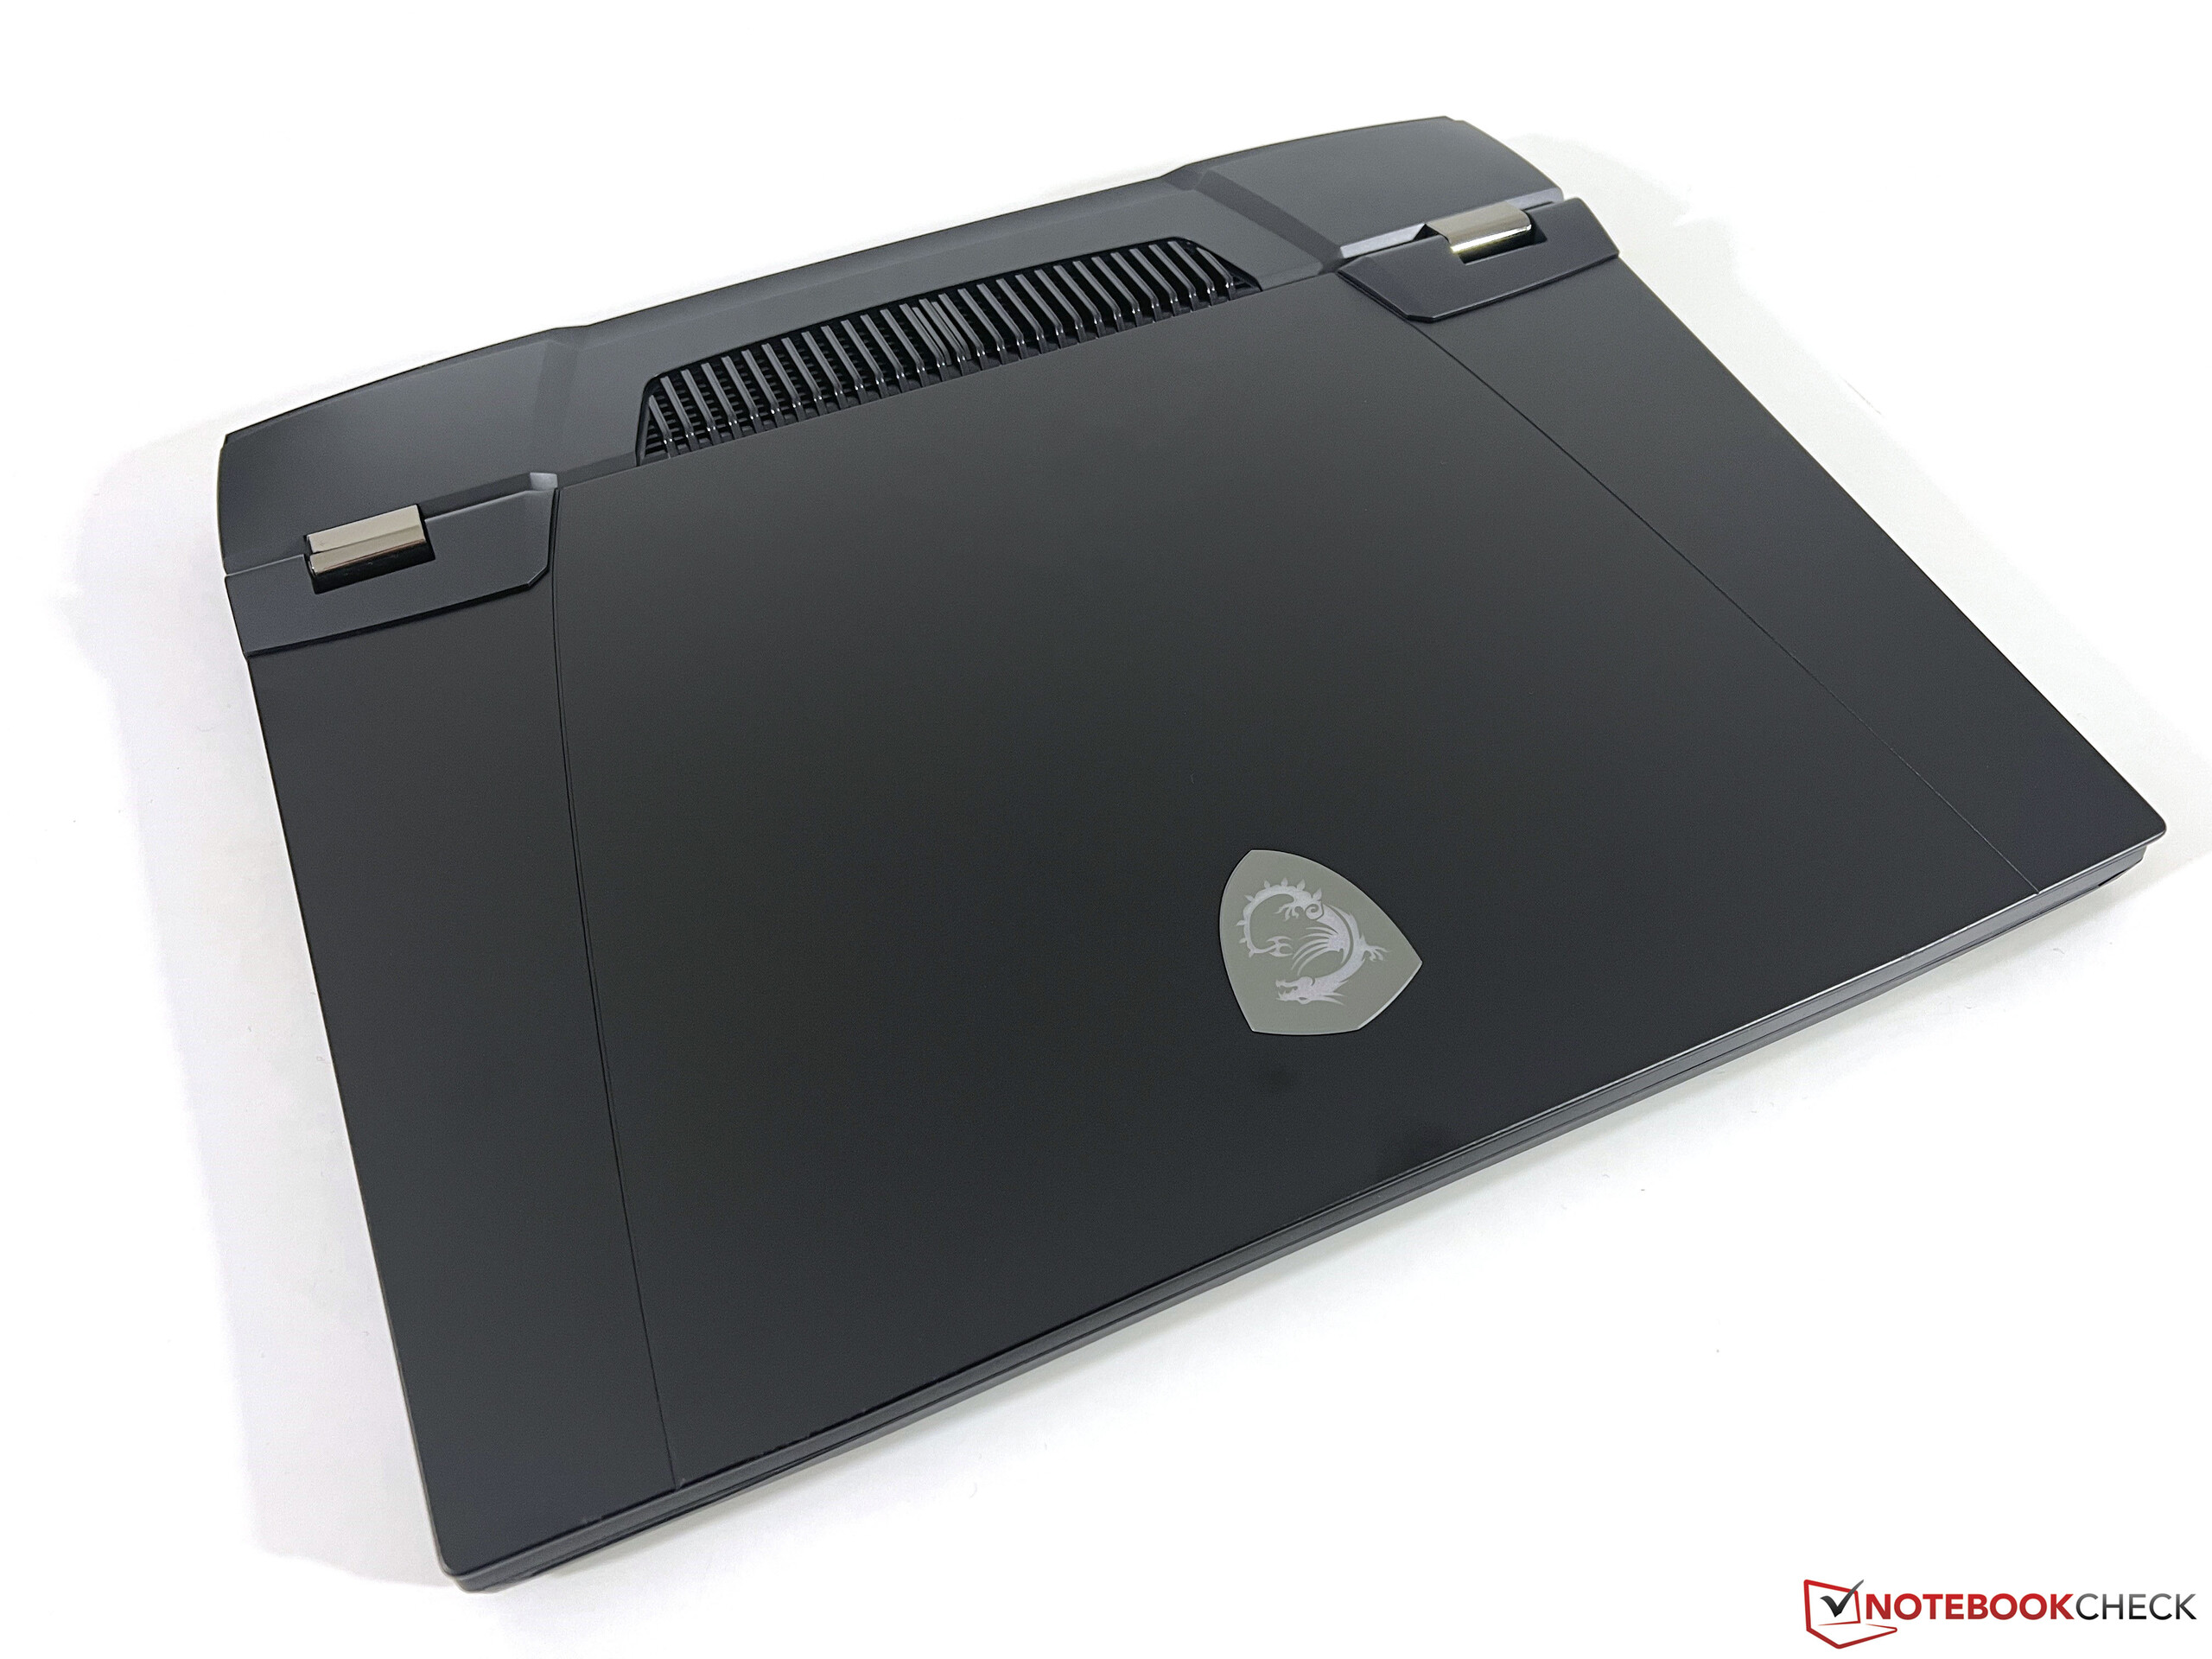
MSI a introduit un nouveau design de châssis pour le modèleTitan GT77il n'y a donc pas de changement visuel pour le nouveau modèle. Le châssis noir est très sobre pour un joueur haut de gamme et l'éclairage RVB est également limité au logo sur le couvercle ainsi qu'aux sorties de ventilateur à l'arrière. C'est une question de préférences personnelles, mais vous pouvez au moins utiliser l'ordinateur portable dans des environnements professionnels en désactivant l'éclairage. Vous verrez rapidement des traces de doigts sur les surfaces lisses, qui nécessitent un nettoyage régulier. MSI utilise toujours un écran au format 16:9 pour le modèle 2023.
La qualité du châssis est décente, même s'il est presque entièrement fait de plastique. En particulier, le matériau rugueux en bas ne répond pas vraiment aux attentes du prix élevé et pourrait également être utilisé sur un ordinateur portable de 500 euros. La qualité de construction globale est cependant décente ; l'unité de base est très solide et il n'y a que des craquements mineurs. Le couvercle, en revanche, est plus souple, mais nous n'avons pas pu provoquer de distorsions de l'image. Nous aurions préféré des charnières d'écran légèrement plus rigides et le couvercle oscille un peu lorsque vous réglez l'angle d'ouverture (jusqu'à ~135 degrés).
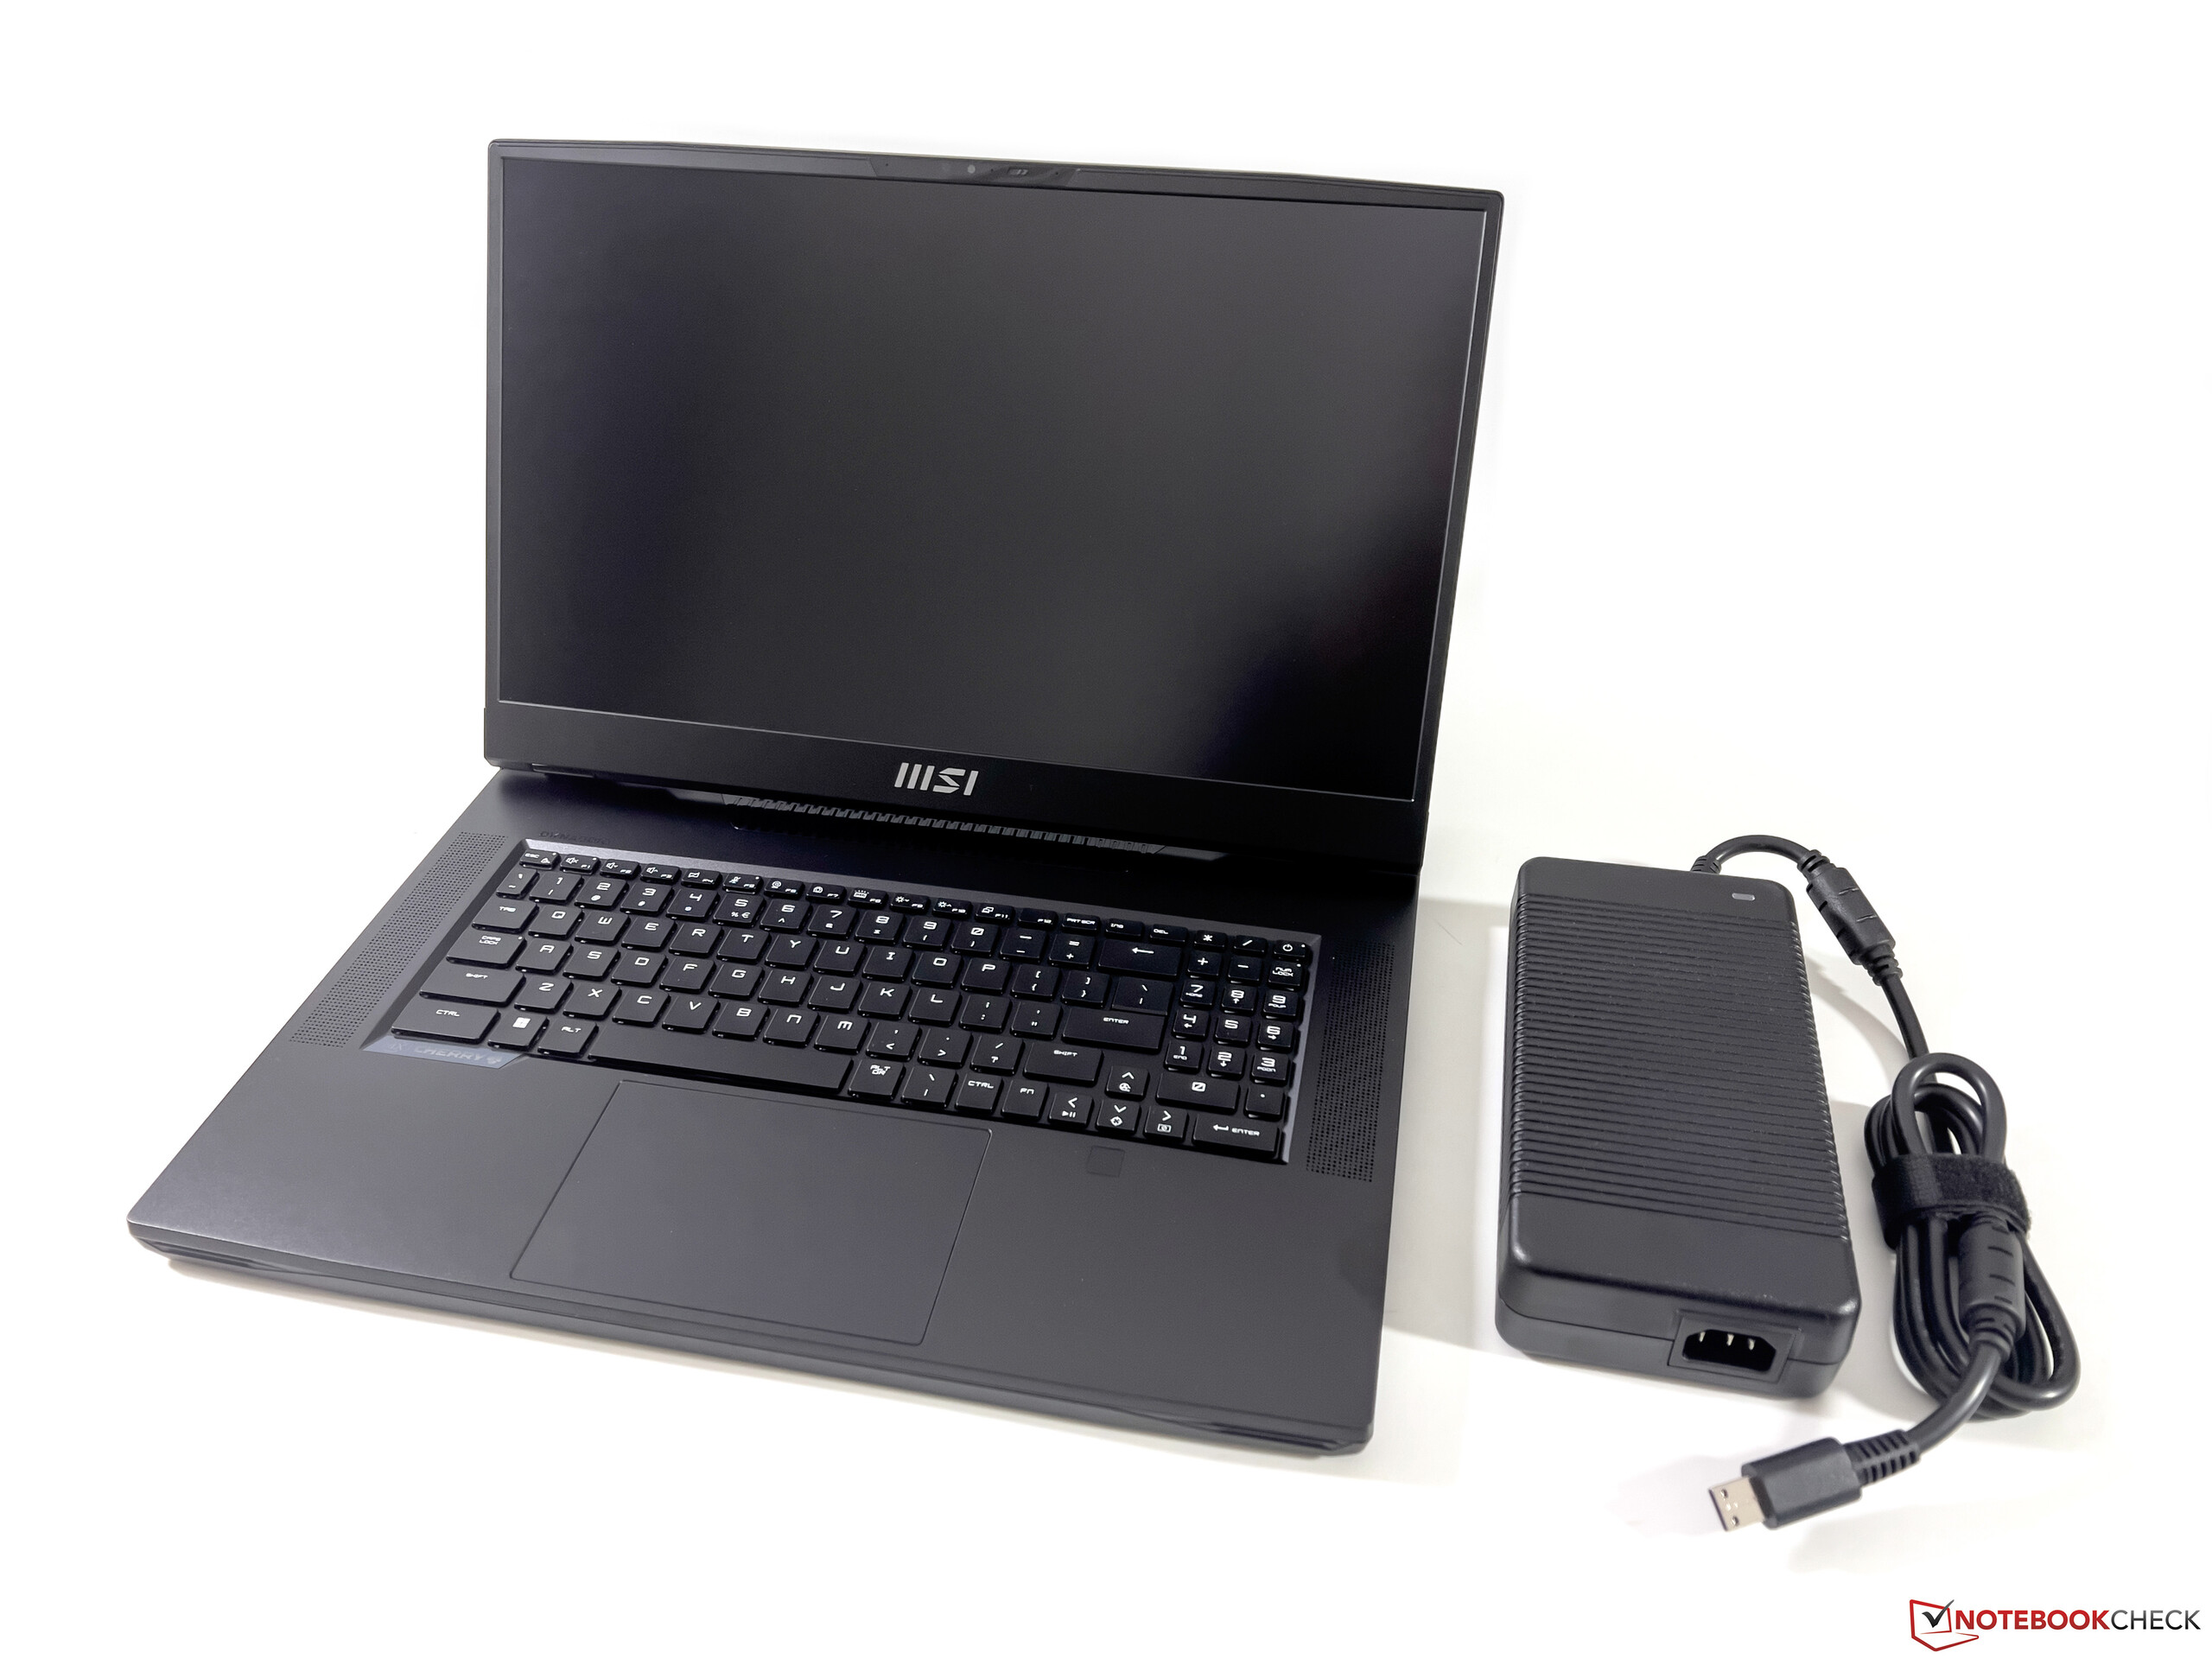
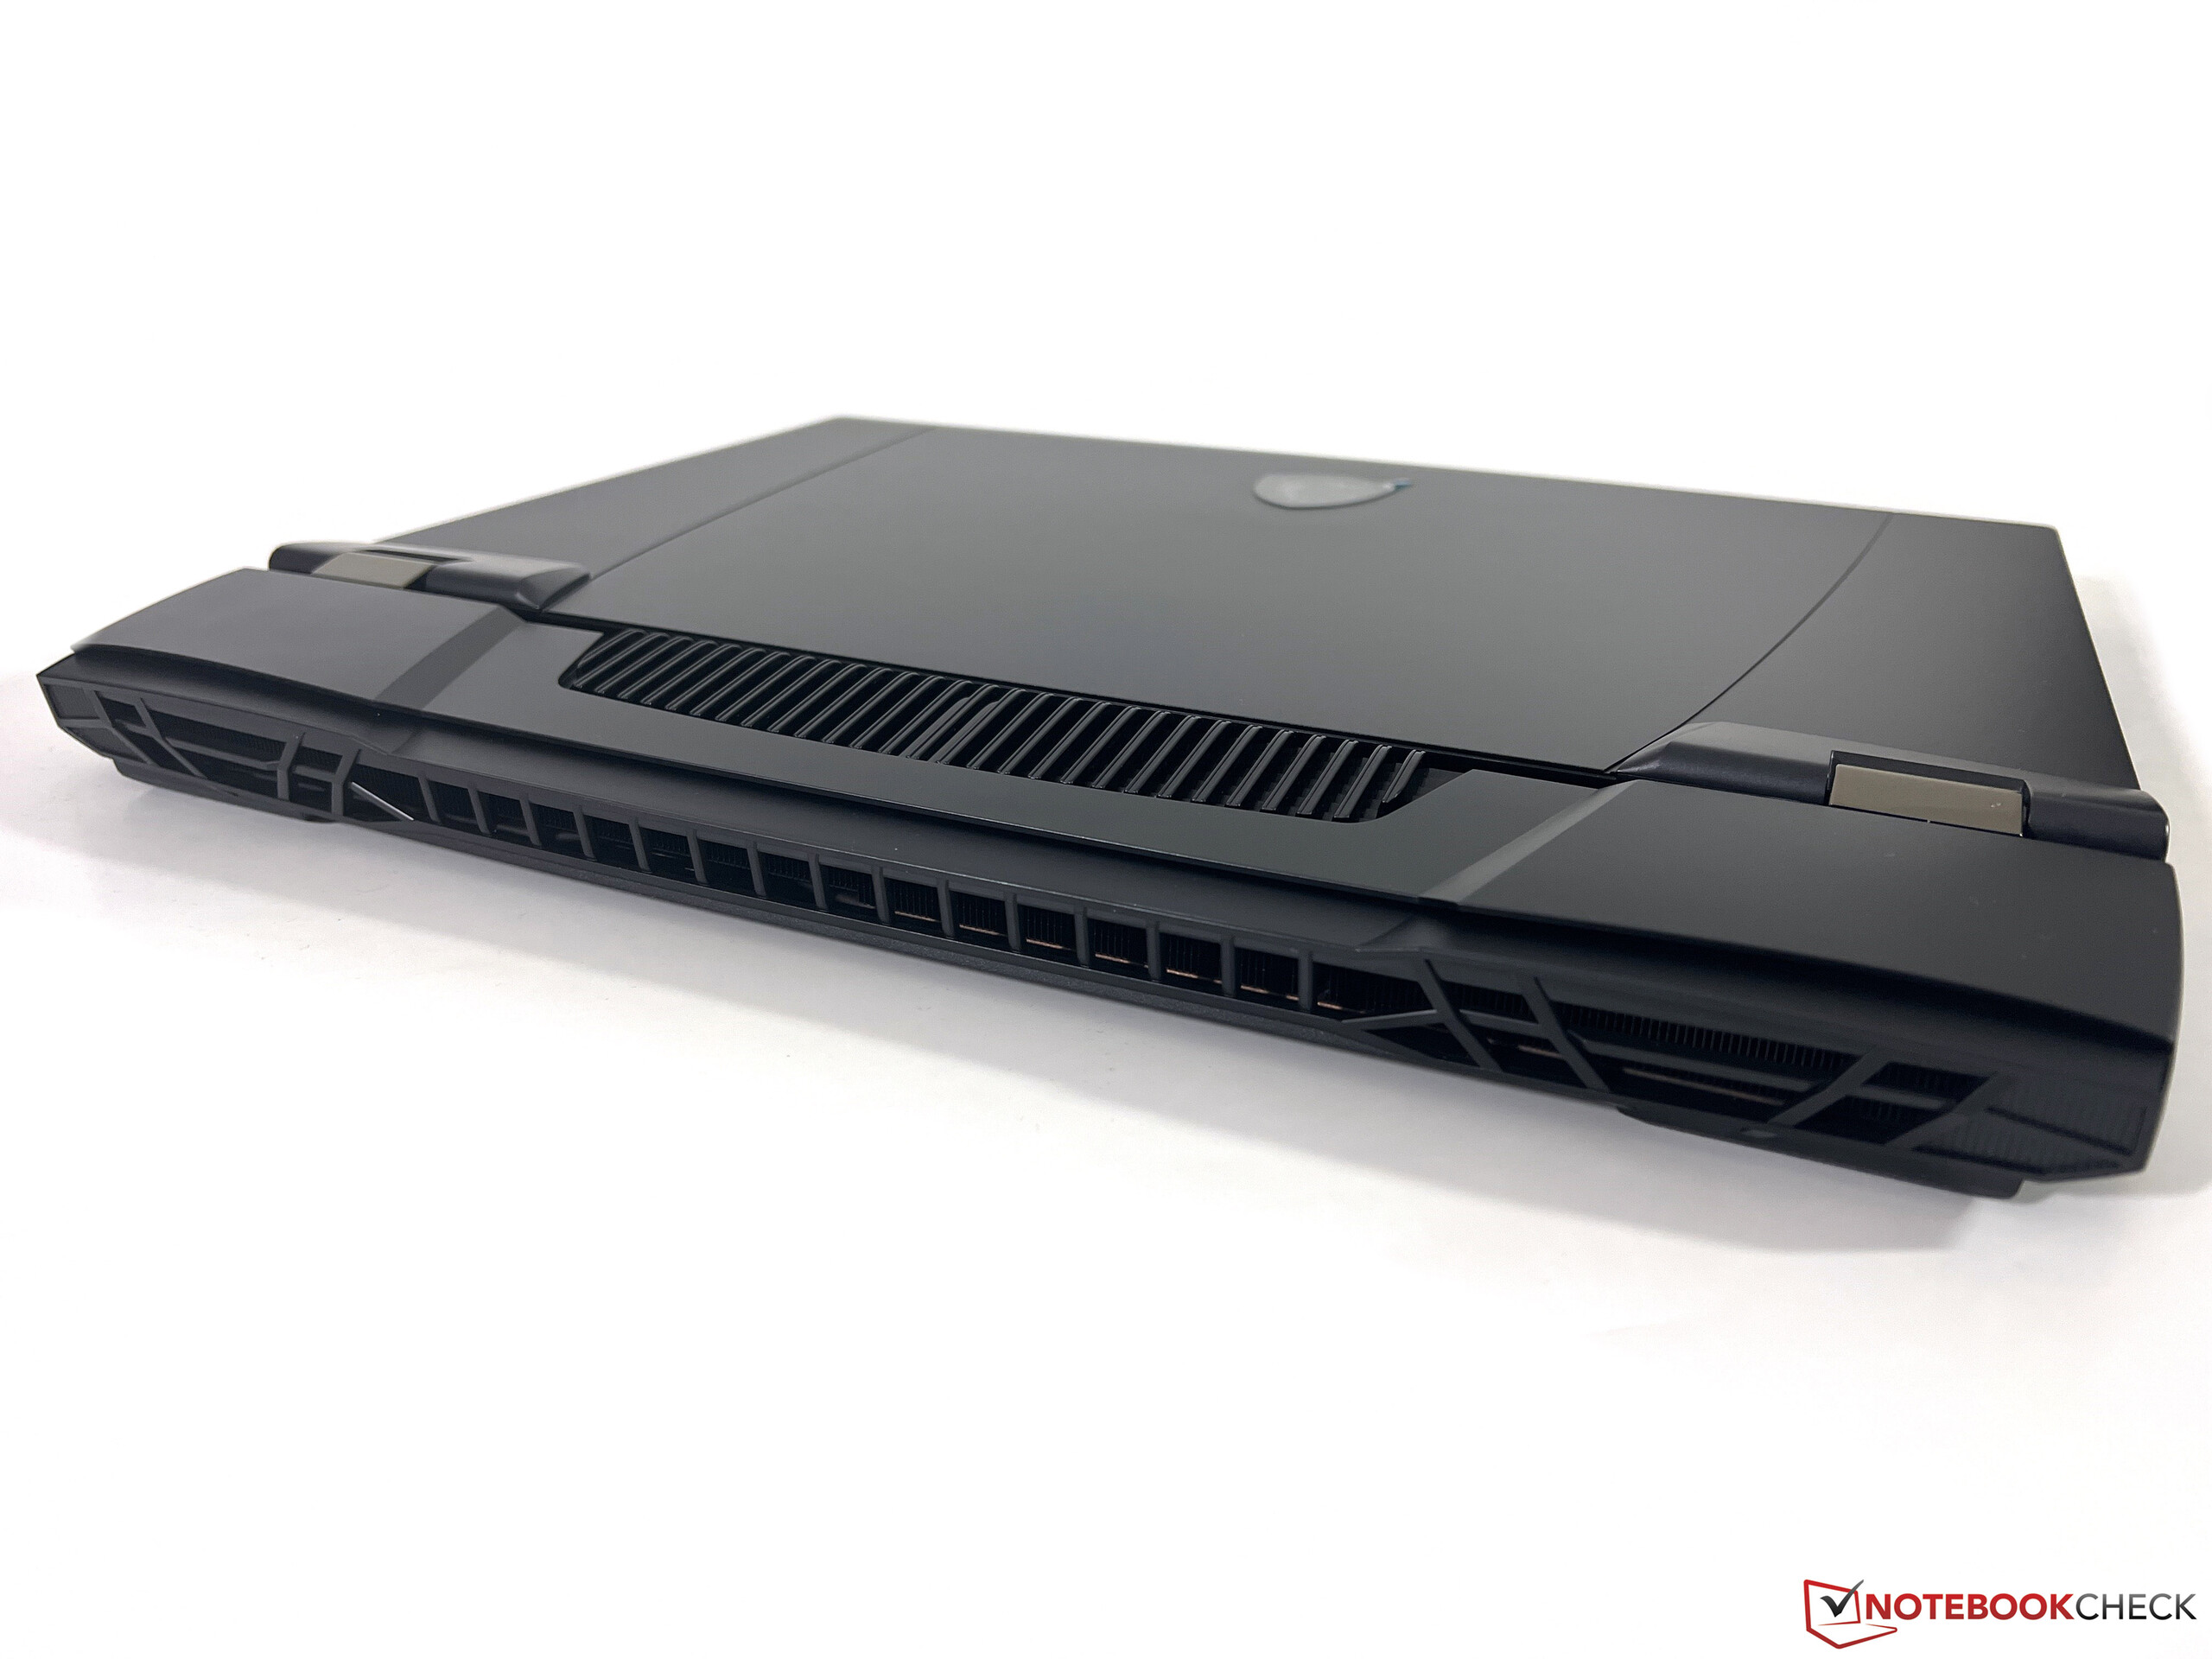
Le GT77 est toujours une machine relativement mince de 2,3 cm, surtout si l'on considère la puissance du matériel. Cependant, en raison de la grande unité de refroidissement à l'arrière, l'ordinateur portable est très profond et a un encombrement beaucoup plus important que ses rivaux. Il est également très lourd (près de 3,5 kg) et il faut ajouter 1,4 kg pour l'encombrant adaptateur d'alimentation de 330W.
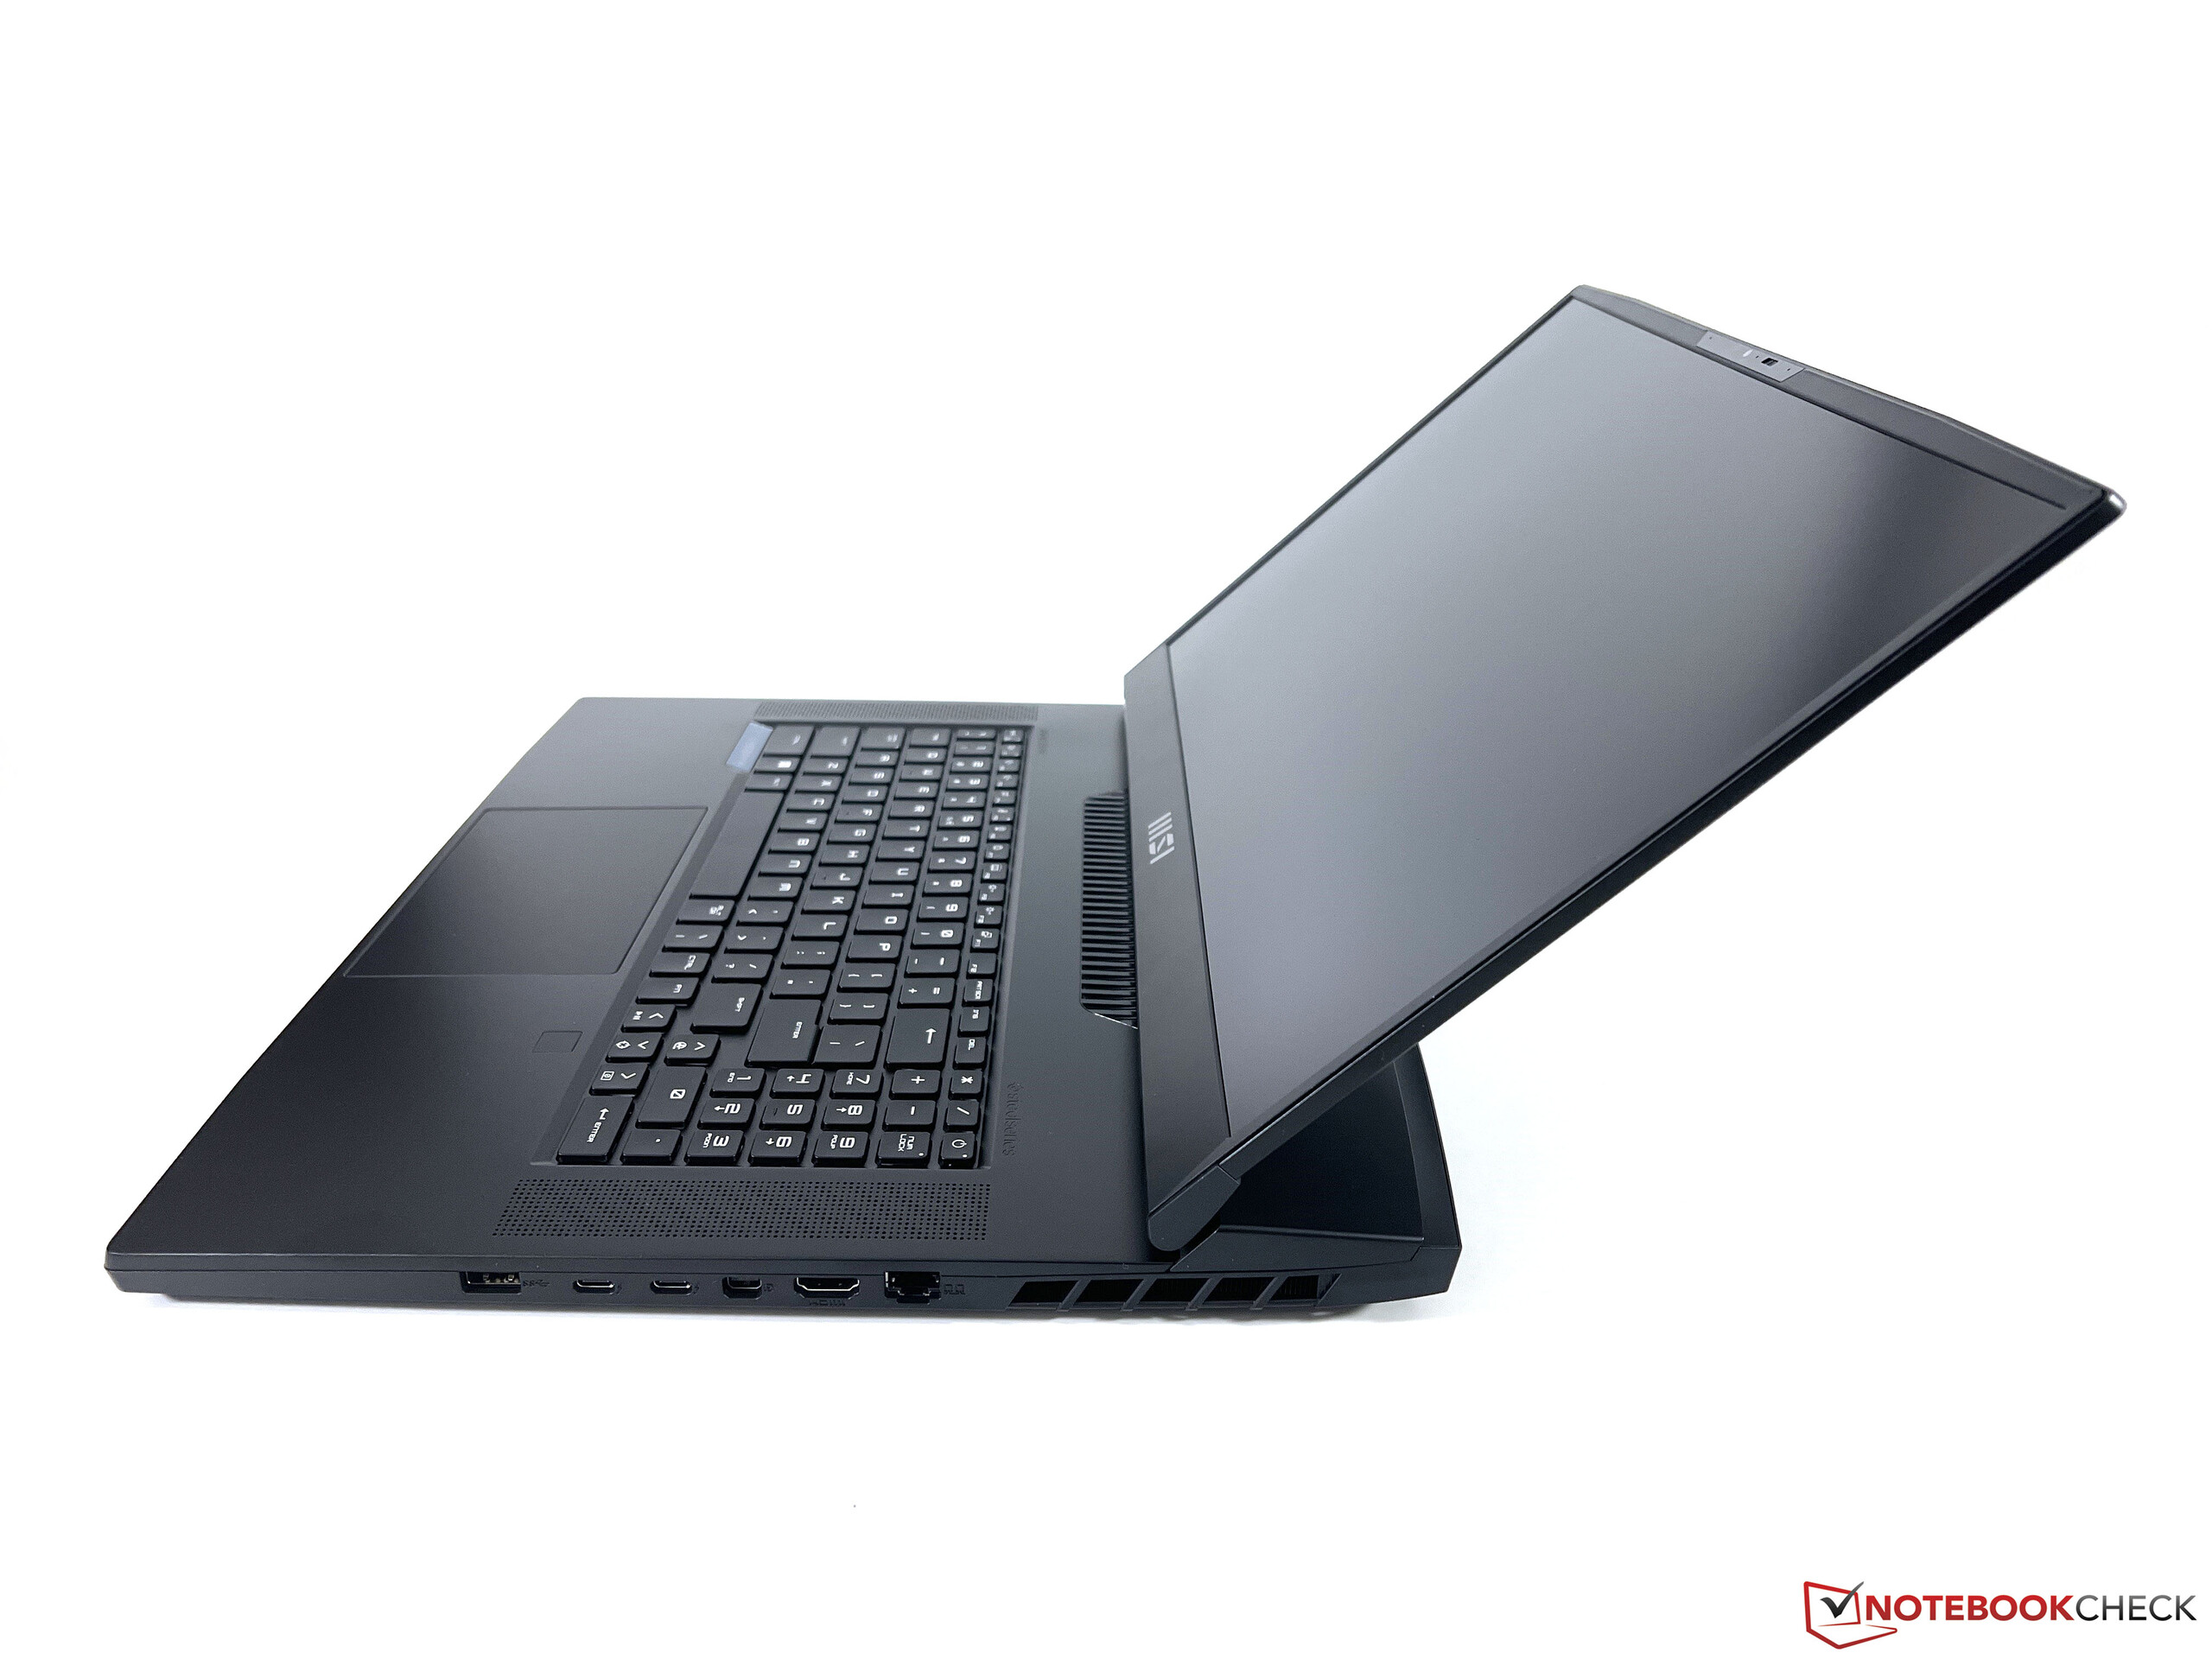
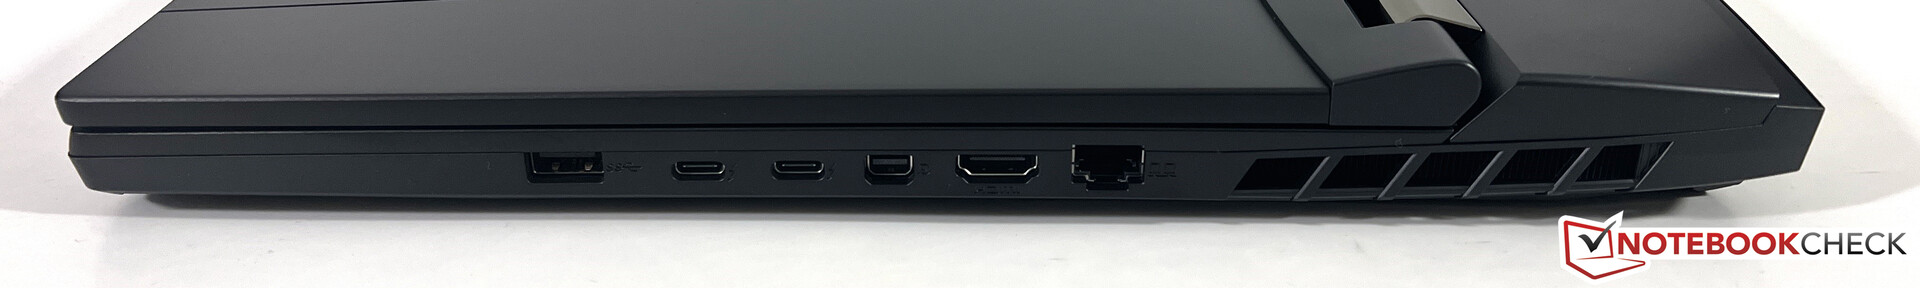
Connectivité - Thunderbolt et lecteur de cartes
Rien n'a changé en termes de ports et vous disposez toujours de tous les standards importants. Tous les ports sont situés sur les deux côtés puisque la zone arrière est exclusivement utilisée pour le refroidissement. Vous pouvez également charger la batterie sur le port USB-C arrière, mais cela nécessite un adaptateur secteur de 100 W (les modules de 65 W ne fonctionnaient pas).
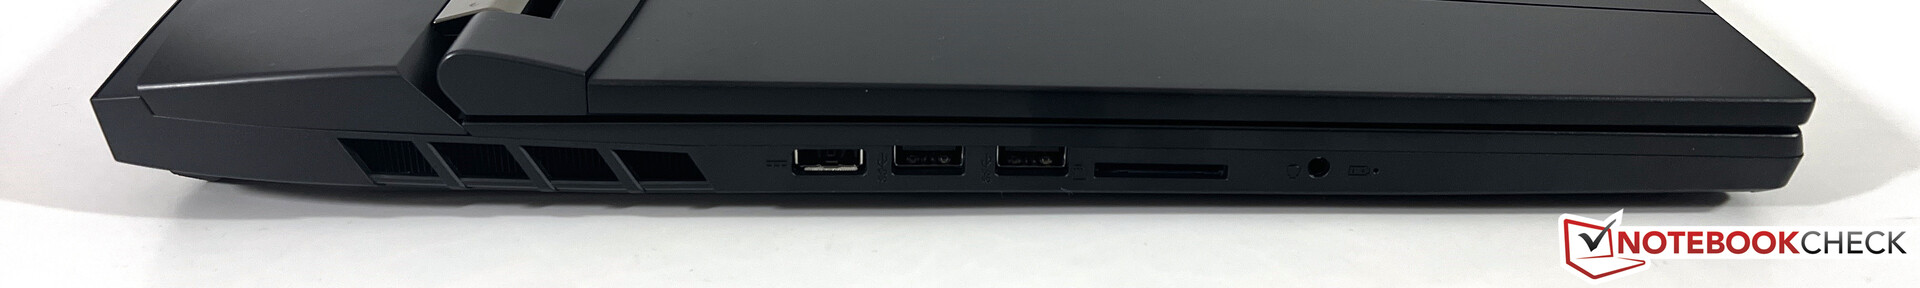
Lecteur de carte SD
Le lecteur de carte SD peut accueillir des cartes mémoire de taille normale et gère des taux de transfert moyens de plus de 80 Mo/s avec notre carte de référence (AV Pro V60).
| SD Card Reader | |
| average JPG Copy Test (av. of 3 runs) | |
| Alienware x17 R2 P48E (AV Pro V60) | |
| Moyenne de la classe Gaming (20.9 - 210, n=54, 2 dernières années) | |
| Razer Blade 16 Early 2023 (AV PRO microSD 128 GB V60) | |
| MSI Titan GT77 HX 13VI (Angelibird AV Pro V60) | |
| MSI Titan GT77 12UHS (AV PRO microSD 128 GB V60) | |
| Schenker XMG Neo 17 M22 (AV PRO microSD 128 GB V60) | |
| maximum AS SSD Seq Read Test (1GB) | |
| Alienware x17 R2 P48E (AV Pro V60) | |
| Razer Blade 16 Early 2023 (AV PRO microSD 128 GB V60) | |
| Moyenne de la classe Gaming (25.5 - 261, n=51, 2 dernières années) | |
| MSI Titan GT77 12UHS (AV PRO microSD 128 GB V60) | |
| MSI Titan GT77 HX 13VI (Angelibird AV Pro V60) | |
Communication
MSI équipe la nouvelle Titan GT77 du module Wi-Fi Killer AX1690i, qui prend en charge la norme Wi-Fi 6E actuelle ainsi que le Bluetooth 5.3. Notre échantillon américain ne s'est pas connecté aux 6 GHz de notre routeur de référence d'Asus, mais la qualité du signal était également très bonne lorsque nous utilisions le réseau 5 GHz (Wi-Fi 6). Vous pouvez également utiliser le port Ethernet à 2,5 Gbps.
Webcam
La webcam est équipée d'un obturateur mécanique, mais c'est à peu près tout ce qui est positif. MSI utilise toujours la mauvaise webcam 720p, qui ne prend pas de bonnes photos même dans de bonnes conditions d'éclairage. Vous pouvez vous attendre à plus en 2023, surtout si l'on considère le prix.


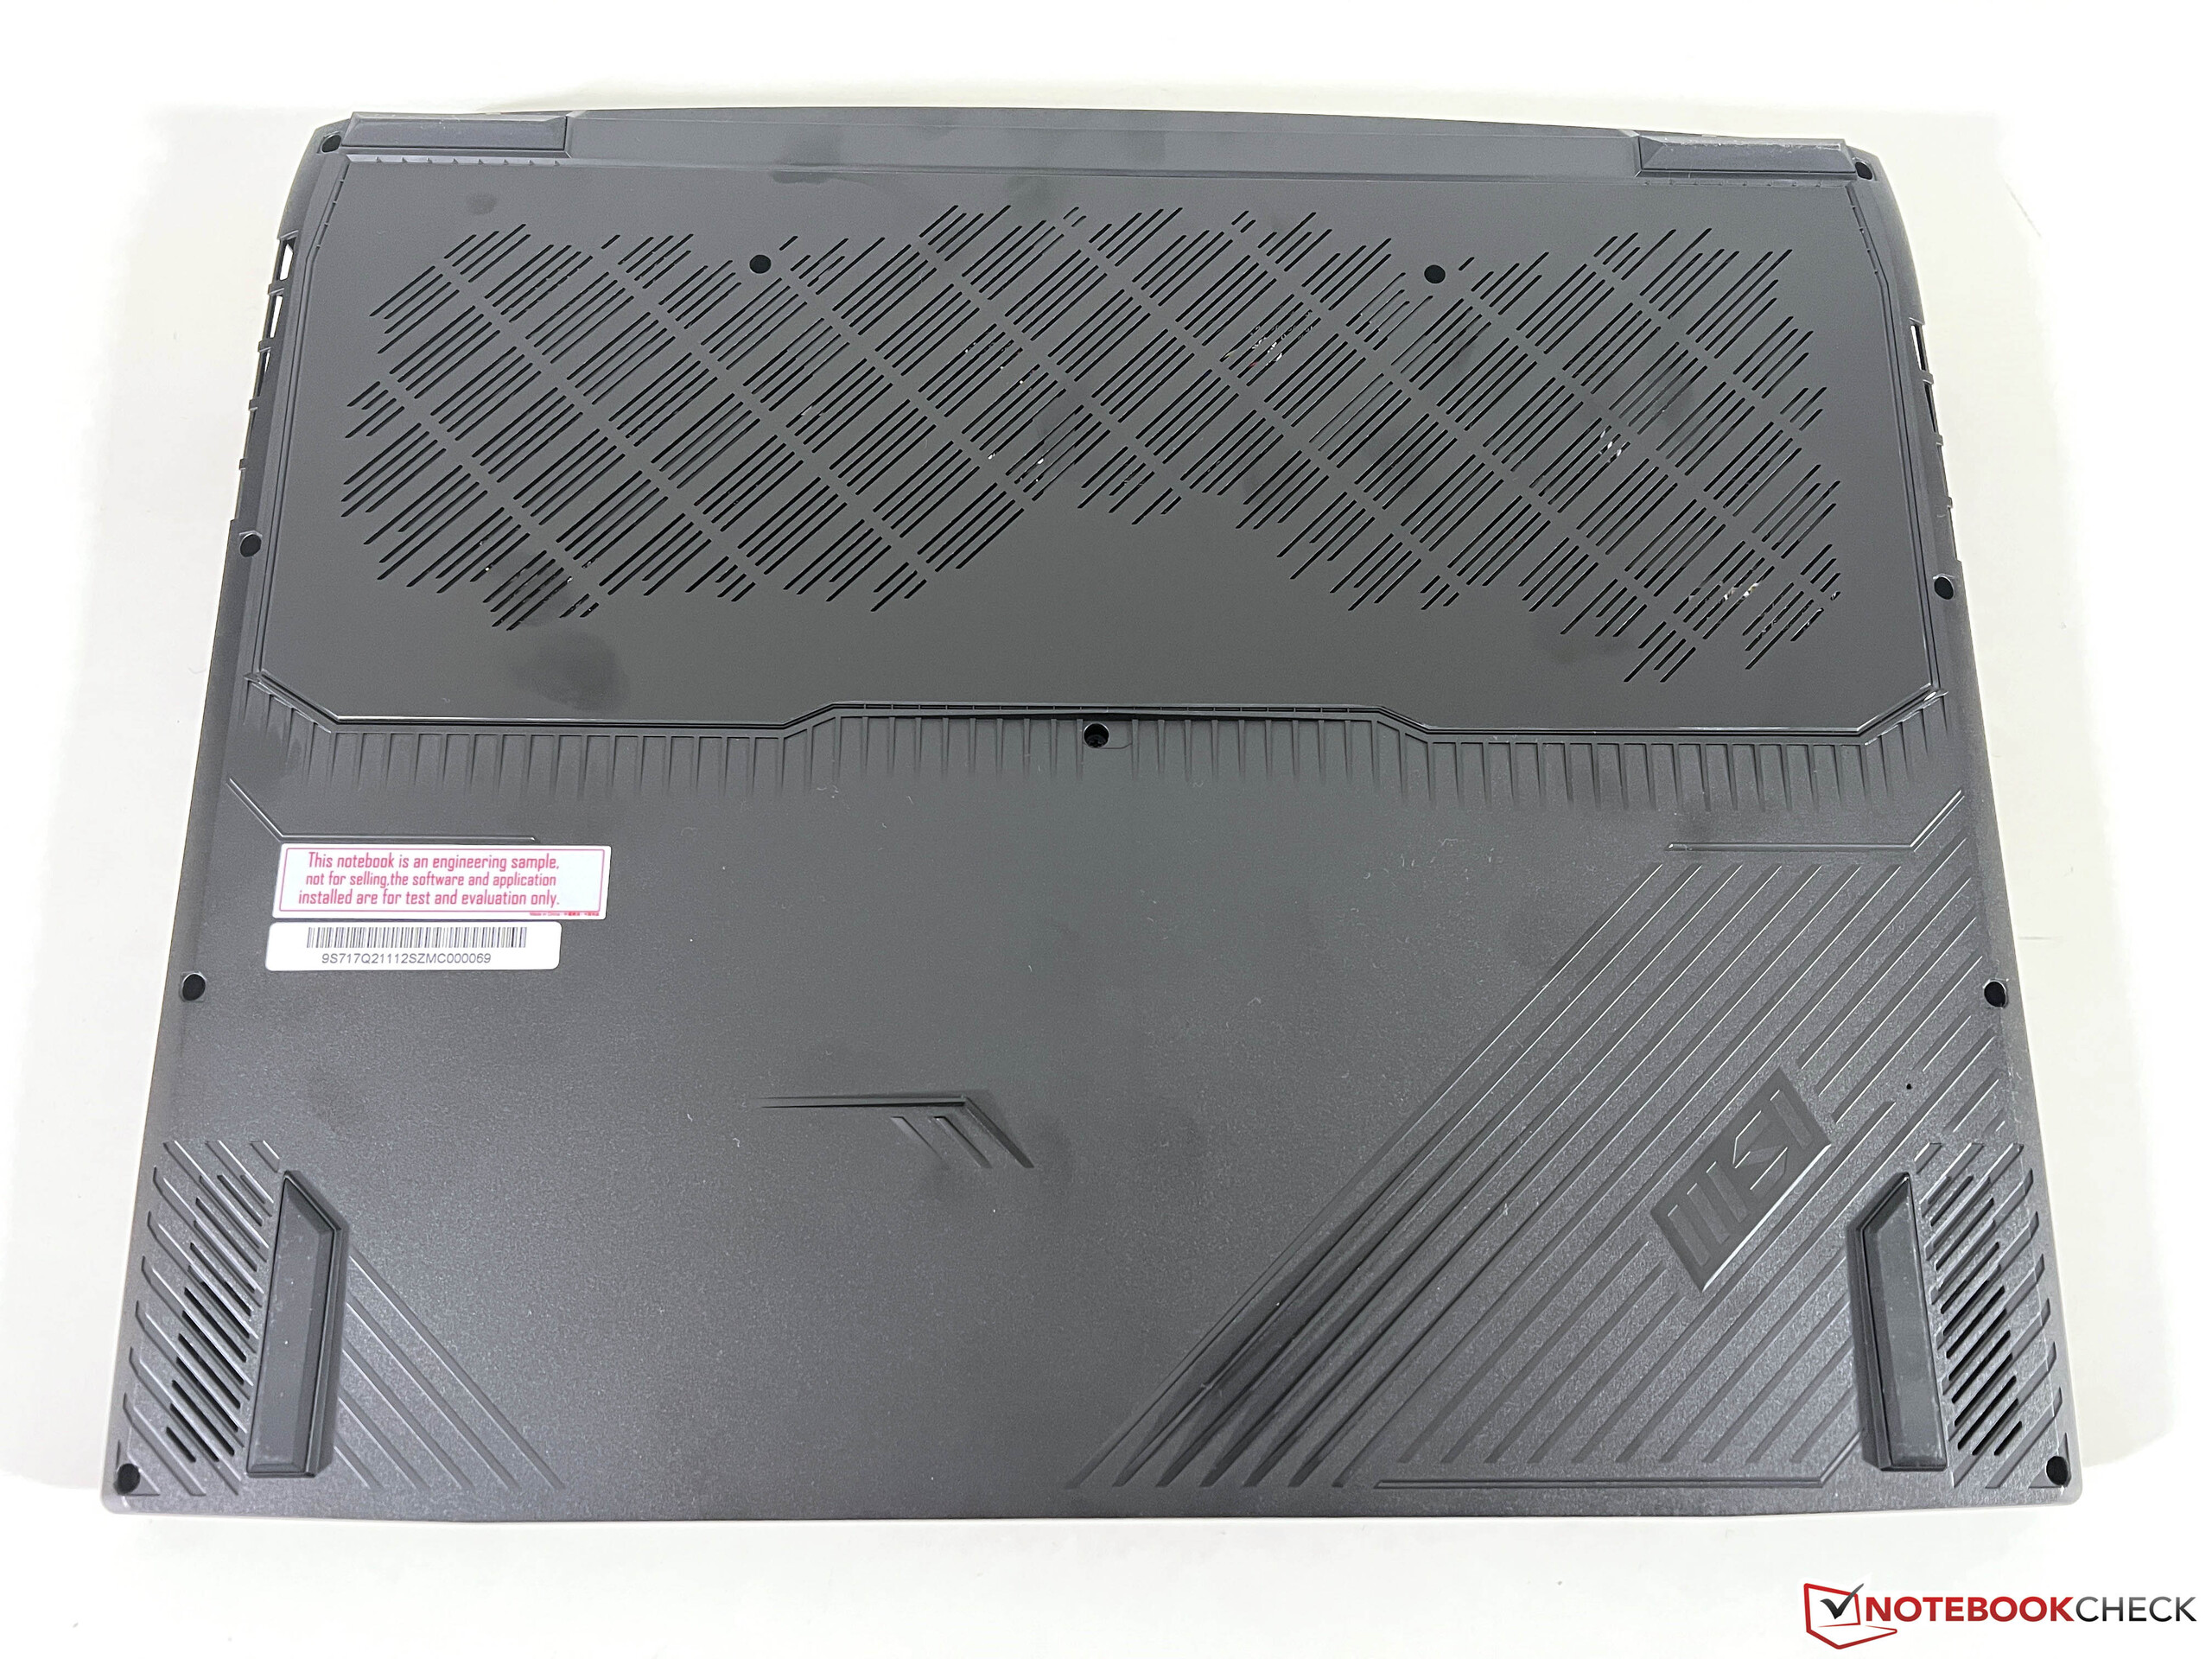
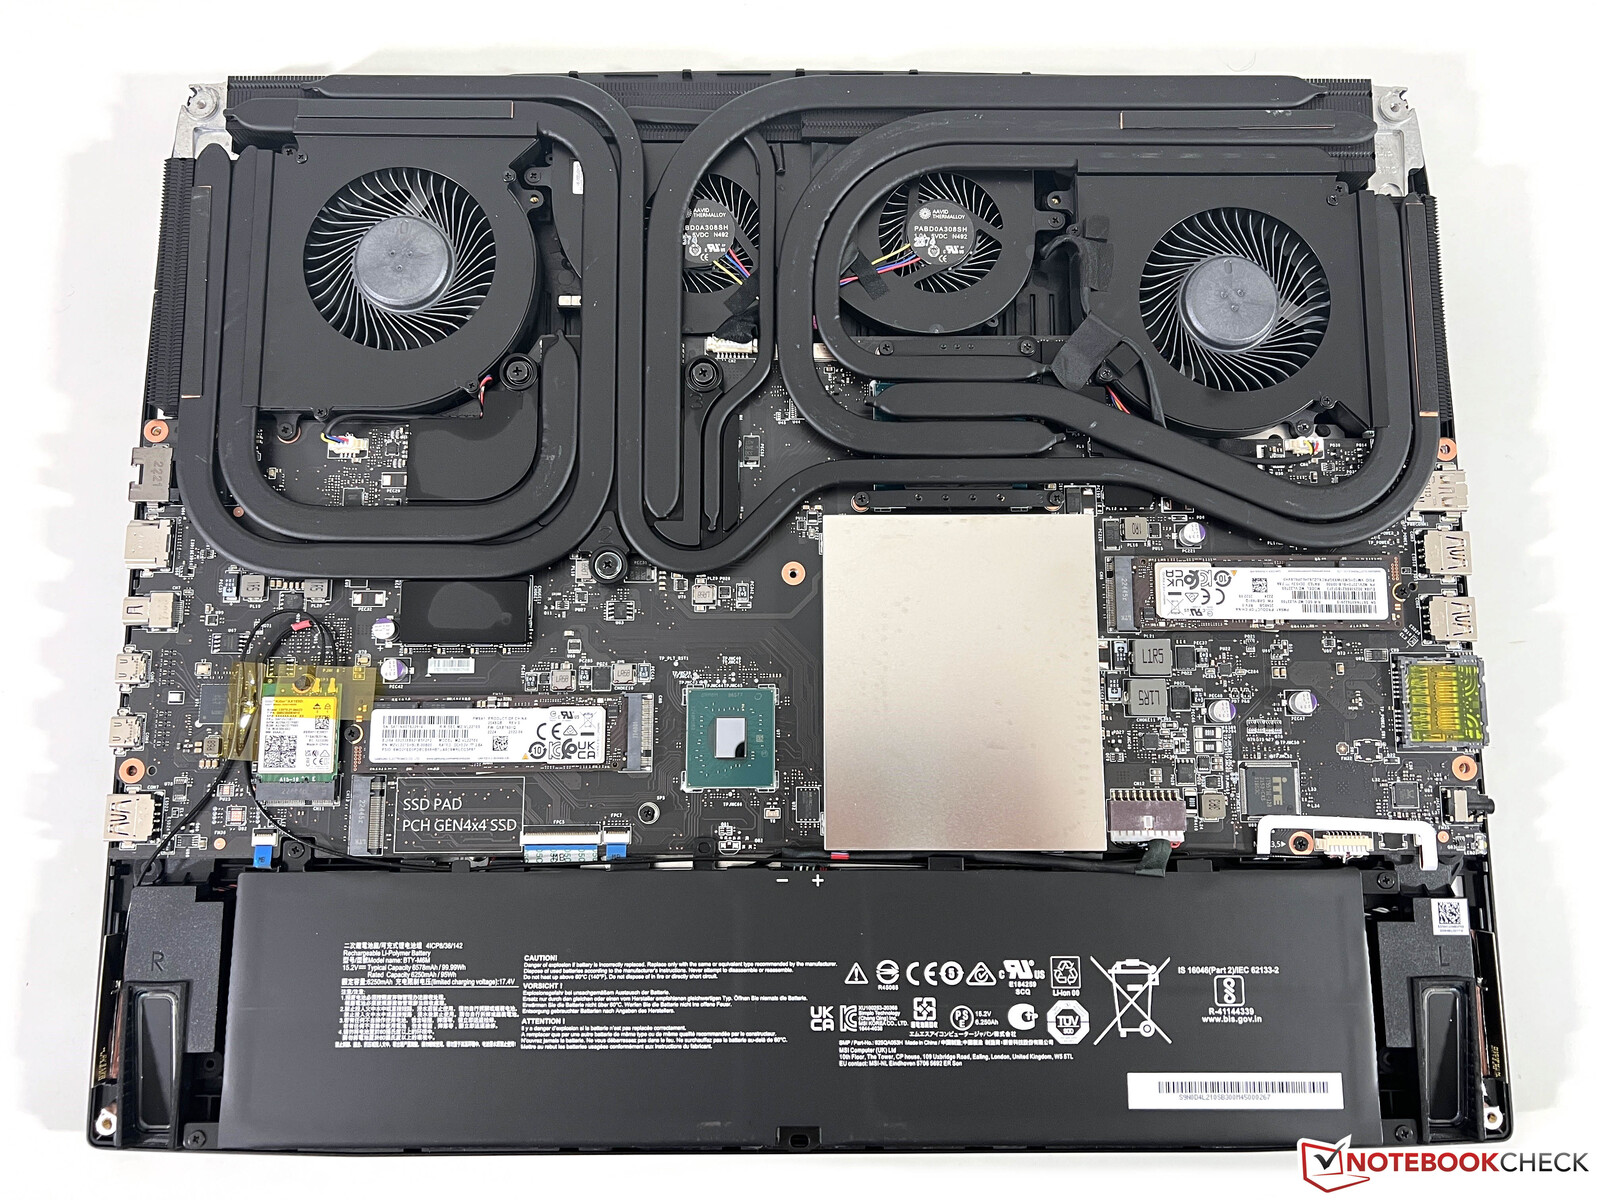
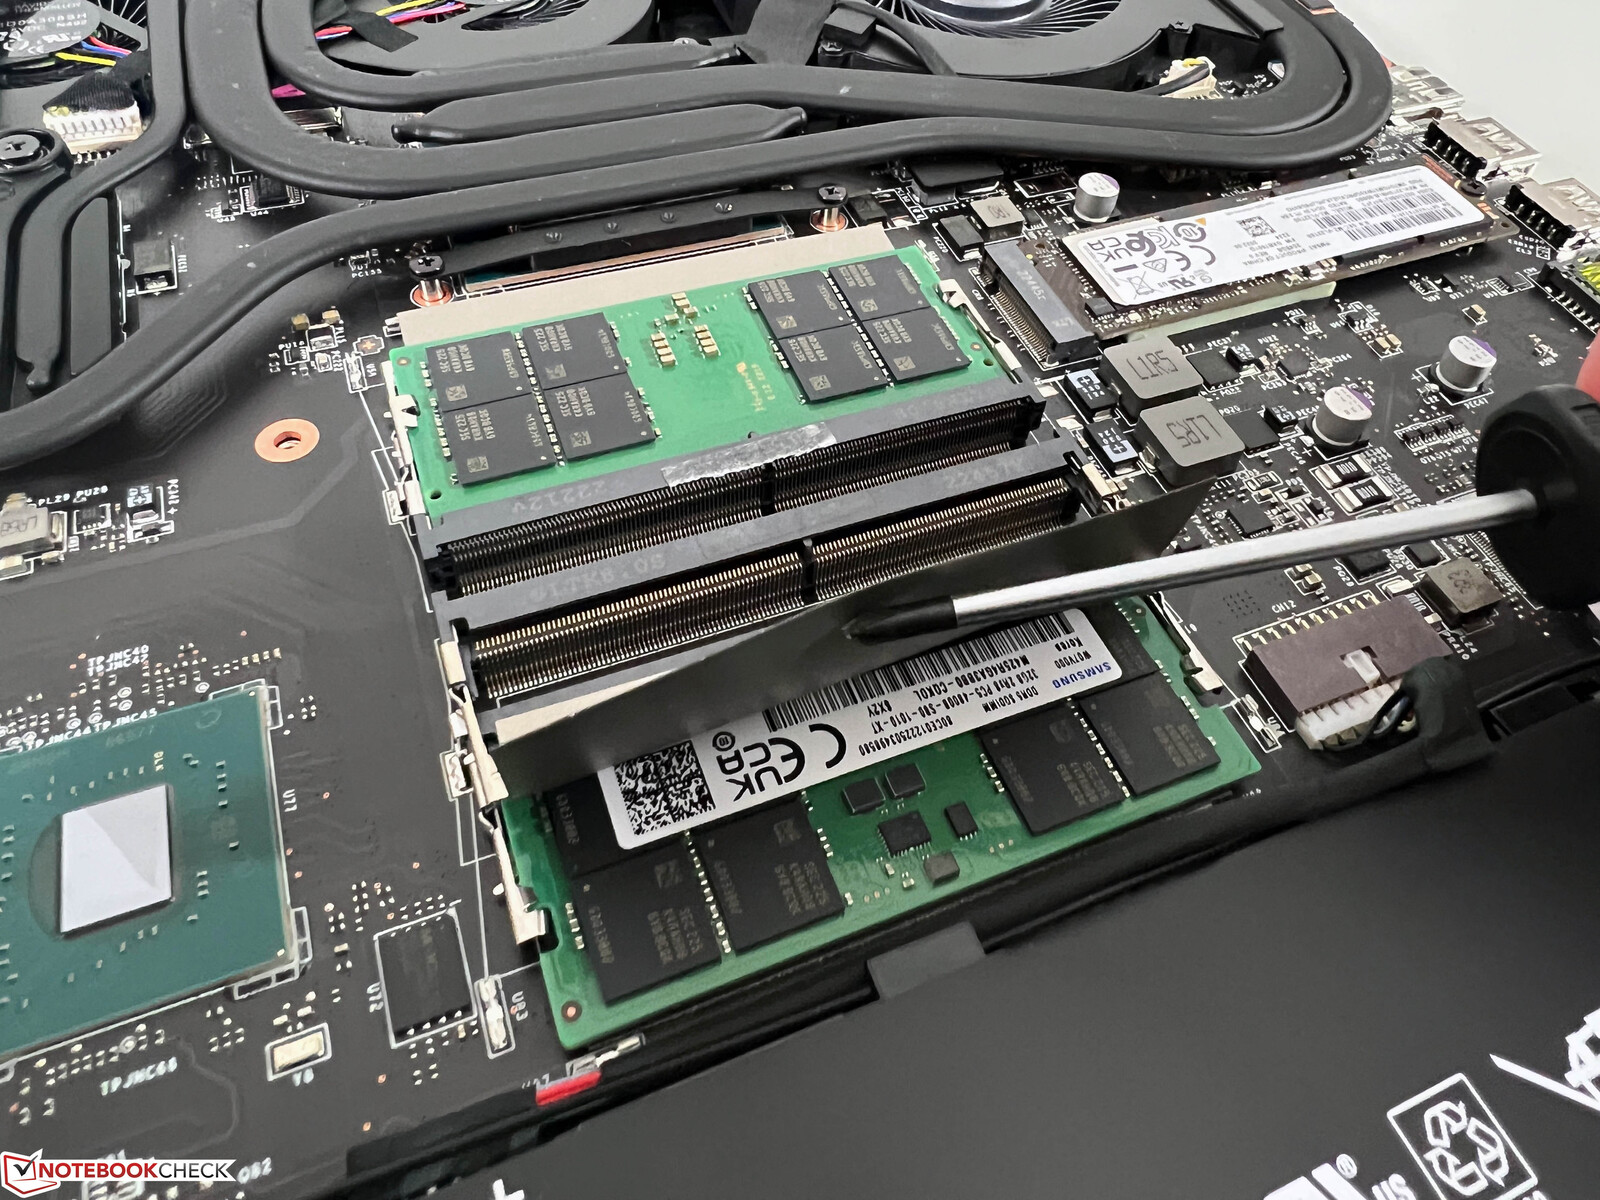
Maintenance
L'ensemble du couvercle inférieur est fixé par des vis Philips standard et peut être retiré, mais le couvercle est très bien fixé et le processus n'est pas facile. En plus des quatre emplacements SO-DIMM, vous pouvez également utiliser trois emplacements M.2 pour les mises à niveau. Il est également possible de remplacer le module Wi-Fi et de nettoyer les ventilateurs. MSI a changé la disposition du refroidissement et utilise plus de caloducs par rapport au modèle précédentce qui signifie que le quatrième emplacement M.2 a dû être retiré.
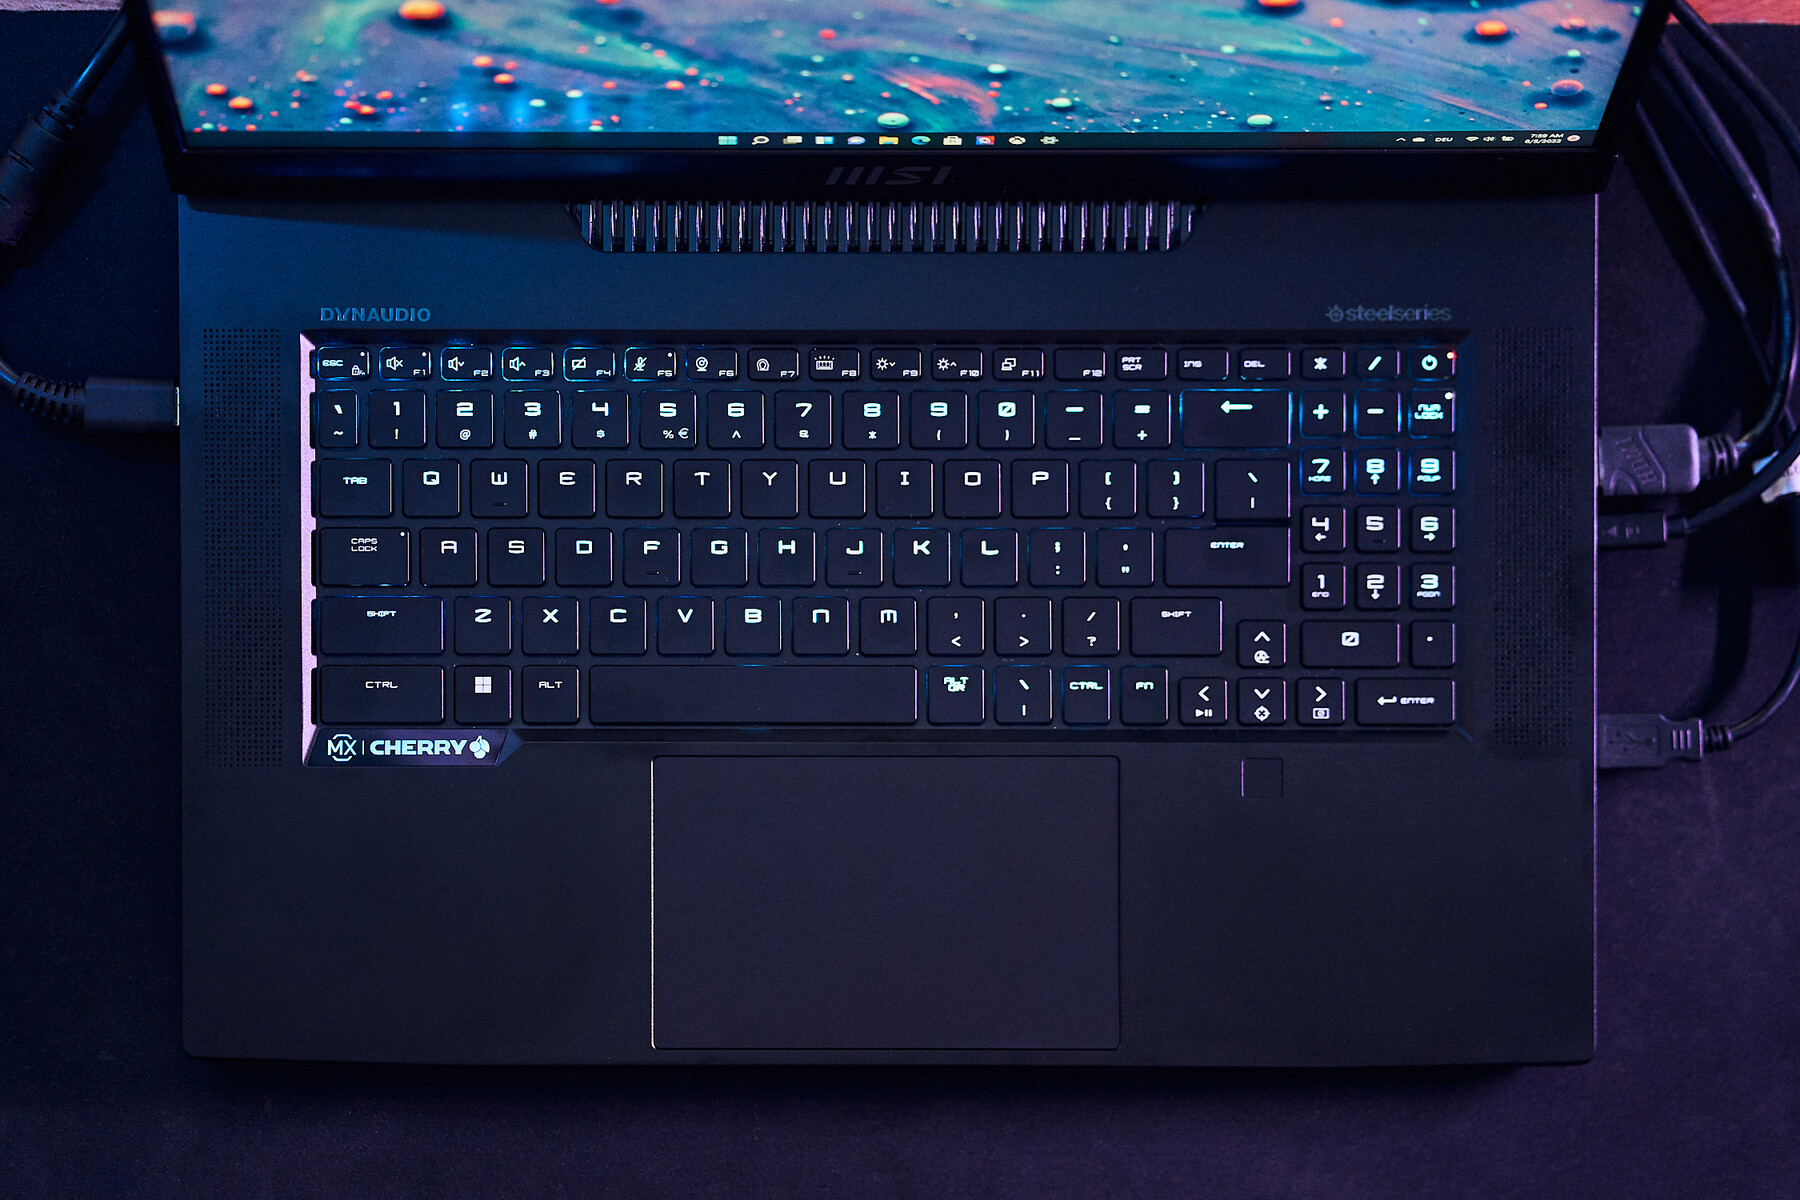
Périphériques d'entrée - MSI avec un excellent clavier mécanique
Nous avions déjà apprécié le clavier mécanique du modèle précédent et cela n'a pas changé. Le bruit de frappe est un peu plus élevé que celui des claviers conventionnels à dôme en caoutchouc, mais l'unité Cherry est nettement plus silencieuse que le clavier mécanique que vous pouvez obtenir pour leXMG Neo 17par exemple. Les touches fléchées et le pavé numérique dédié (qui est un peu plus étroit) utilisent des commutateurs classiques. Il est possible de régler l'éclairage de chaque touche individuellement, mais vous pouvez également choisir une couleur discrète pour toutes les touches. Le scanner d'empreintes digitales est intégré au repose-poignets, juste en dessous des touches fléchées.
Le grand pavé tactile a bien fonctionné pendant notre test et les opérations standard du curseur ne posent aucun problème, mais le bruit du clic est un peu fort. Cependant, la plupart des joueurs utiliseront de toute façon une souris ou un gamepad externe.
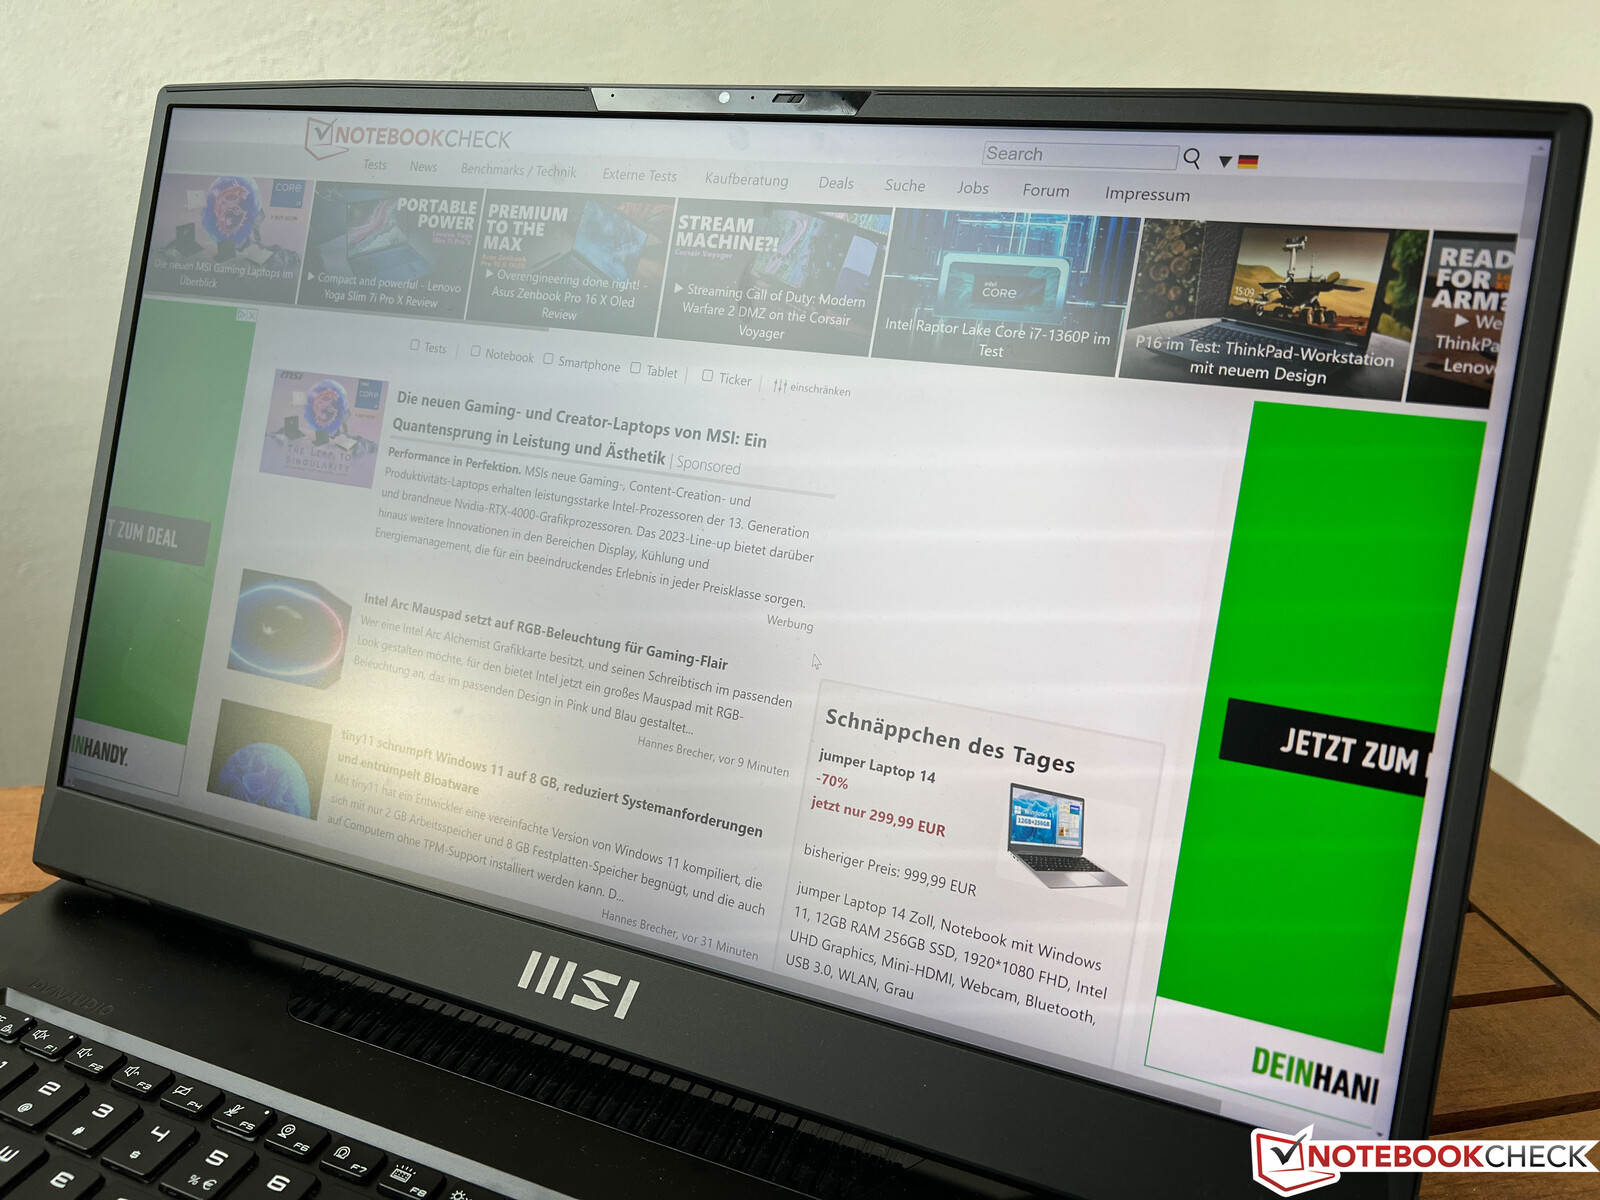
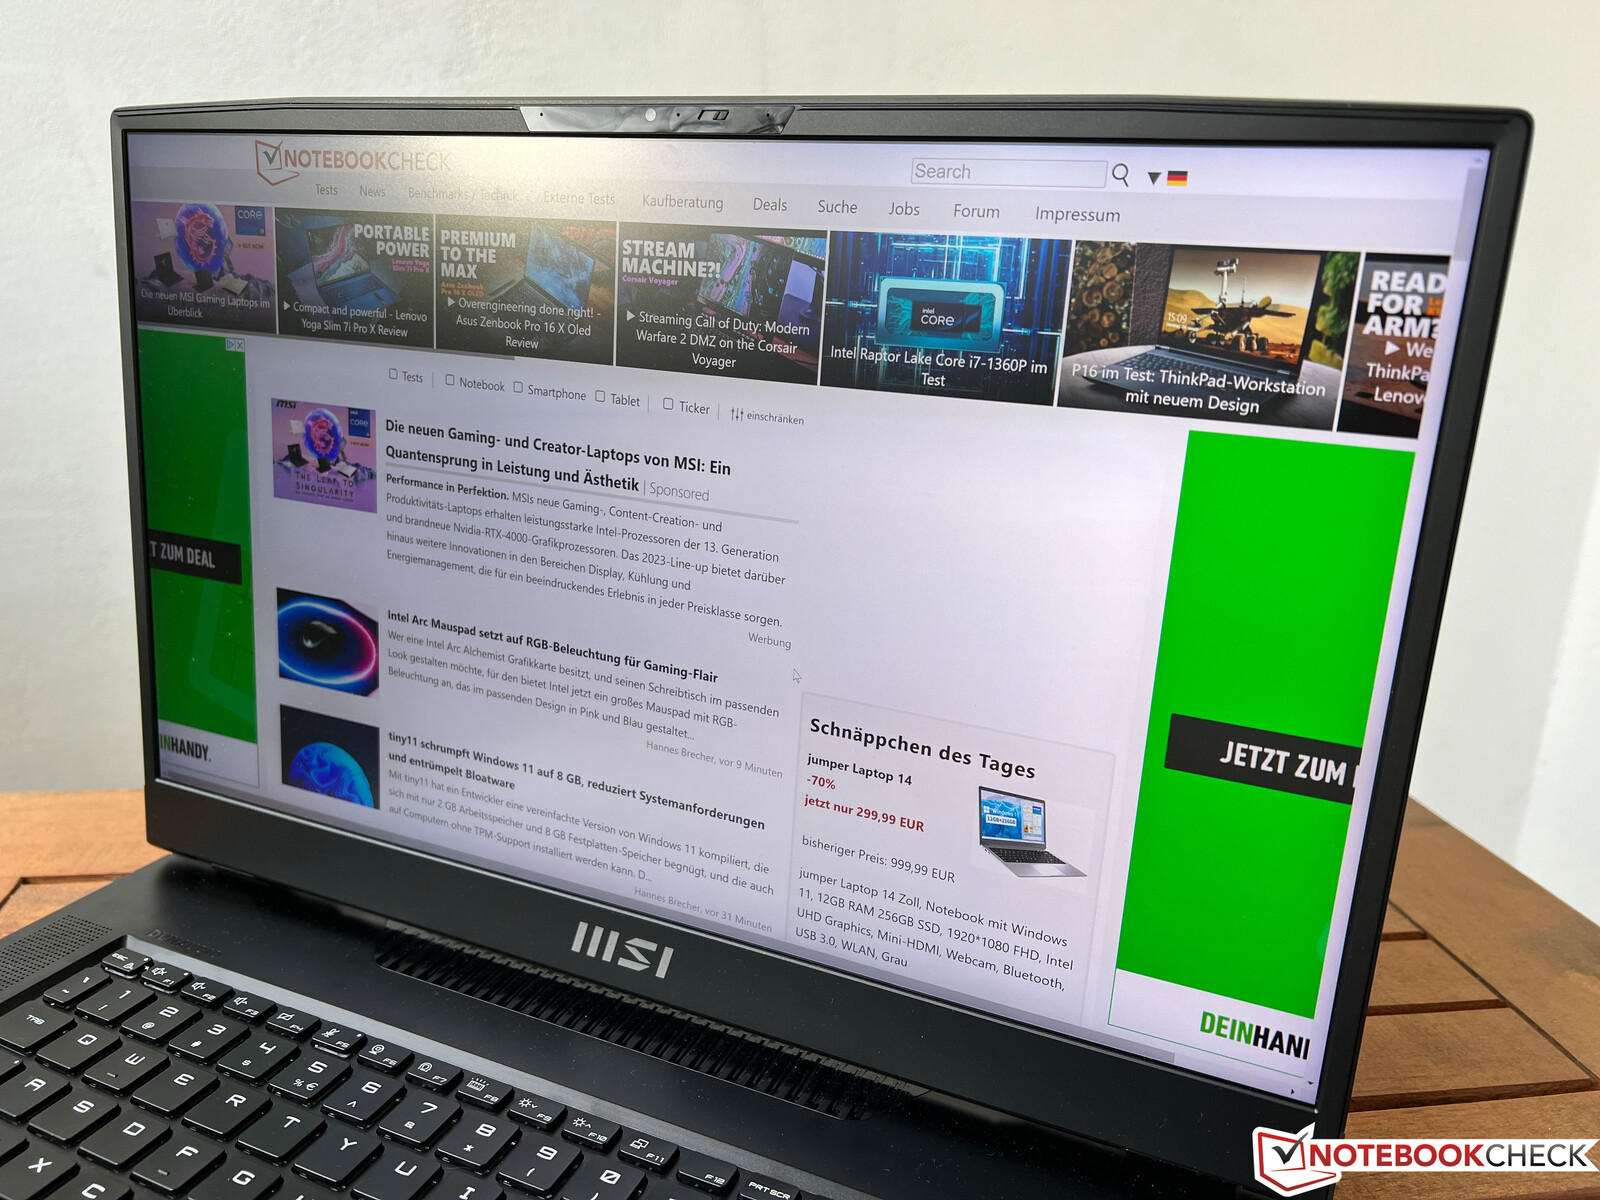
Écran - Mini-LED 4K avec 144 Hz

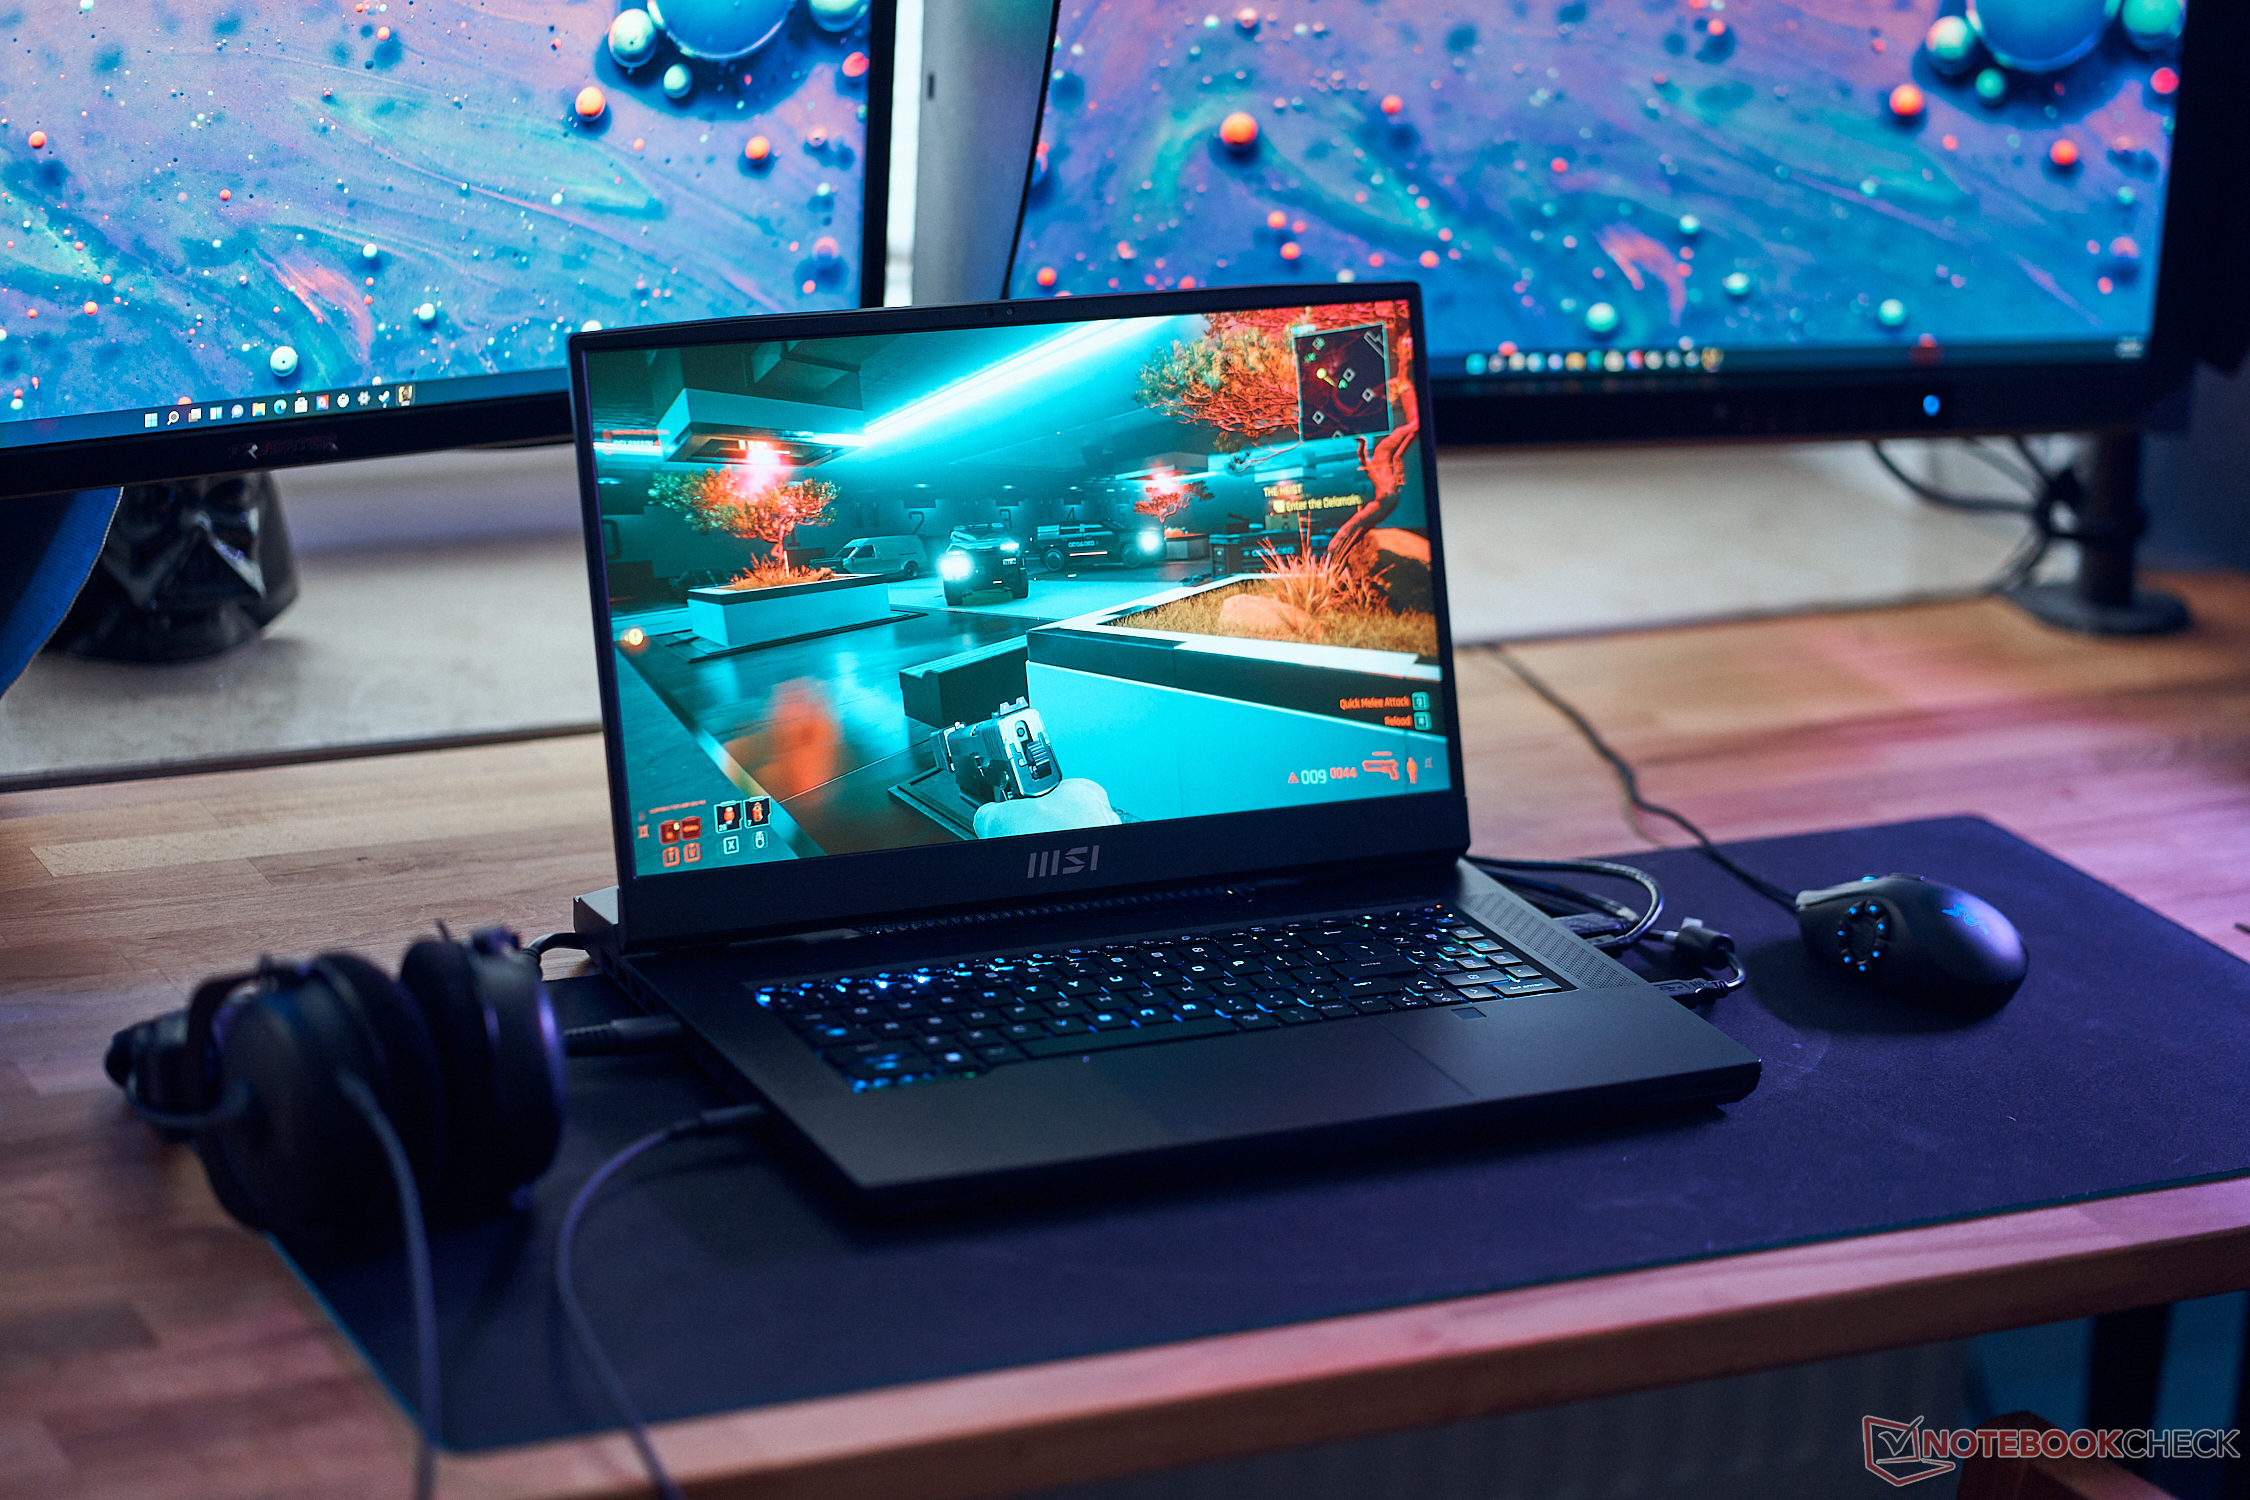
MSI n'utilise pas seulement les derniers modèles de CPU et de GPU, mais propose également une toute nouvelle dalle Mini-LED avec la résolution 4K (16:9, 3840 x 2160 pixels) et un taux de rafraîchissement de 144 Hz. Il est également possible d'obtenir un écran IPS QHD avec 240 Hz. La qualité d'image subjective de la dalle Mini-LED mate d'AU Optronics (B173ZAN06.C) est impressionnante avec des contenus très nets et des couleurs riches. Les images noires sont réellement noires et il n'y a pas de saignement du rétroéclairage sur les écrans Mini-LED. MSI annonce plus de 1000 zones de gradation, mais on peut quand même remarquer un effet de blooming. Des objets brillants sur des fonds sombres créent des nuages brillants puisque toute la zone de gradation est éclairée. Cependant, vous ne le remarquerez vraiment que lorsque des logos apparaissent, mais nous ne l'avons pas remarqué pendant les jeux ou les trucs quotidiens. Nous mesurons une luminosité moyenne de 600 nits et un rapport de contraste très élevé grâce à la faible valeur du noir.
La dalle prend en charge le HDR 1000 et nous pouvons confirmer une luminosité maximale de plus de 1000 nits sur une image complètement blanche, mais la dalle n'atteint pas des valeurs plus élevées alors que la dalle Mini-LED du...Apple MacBook Pro 16peut atteindre jusqu'à 1600 nits pour de petites parties de l'écran. L'implémentation du HDR dans Windows est encore une catastrophe par rapport à macOS. Le HDR doit être activé manuellement, vous ne pouvez plus utiliser de profils de couleurs et vous ne pouvez pas utiliser le HDR sur batterie. Nous ne serions pas surpris que de nombreux utilisateurs n'utilisent pas du tout le HDR compte tenu de ces problèmes, ce qui est dommage. La qualité des vidéos HDR est comparable à celle du MacBook Pro 16 malgré la surface mate, et nous l'avons testé côte à côte.
| |||||||||||||||||||||||||
Homogénéité de la luminosité: 93 %
Valeur mesurée au centre, sur batterie: 402 cd/m²
Contraste: 6060000:1 (Valeurs des noirs: 0.0001 cd/m²)
ΔE ColorChecker Calman: 4.8 | ∀{0.5-29.43 Ø4.73}
calibrated: 1.8
ΔE Greyscale Calman: 6.5 | ∀{0.09-98 Ø4.97}
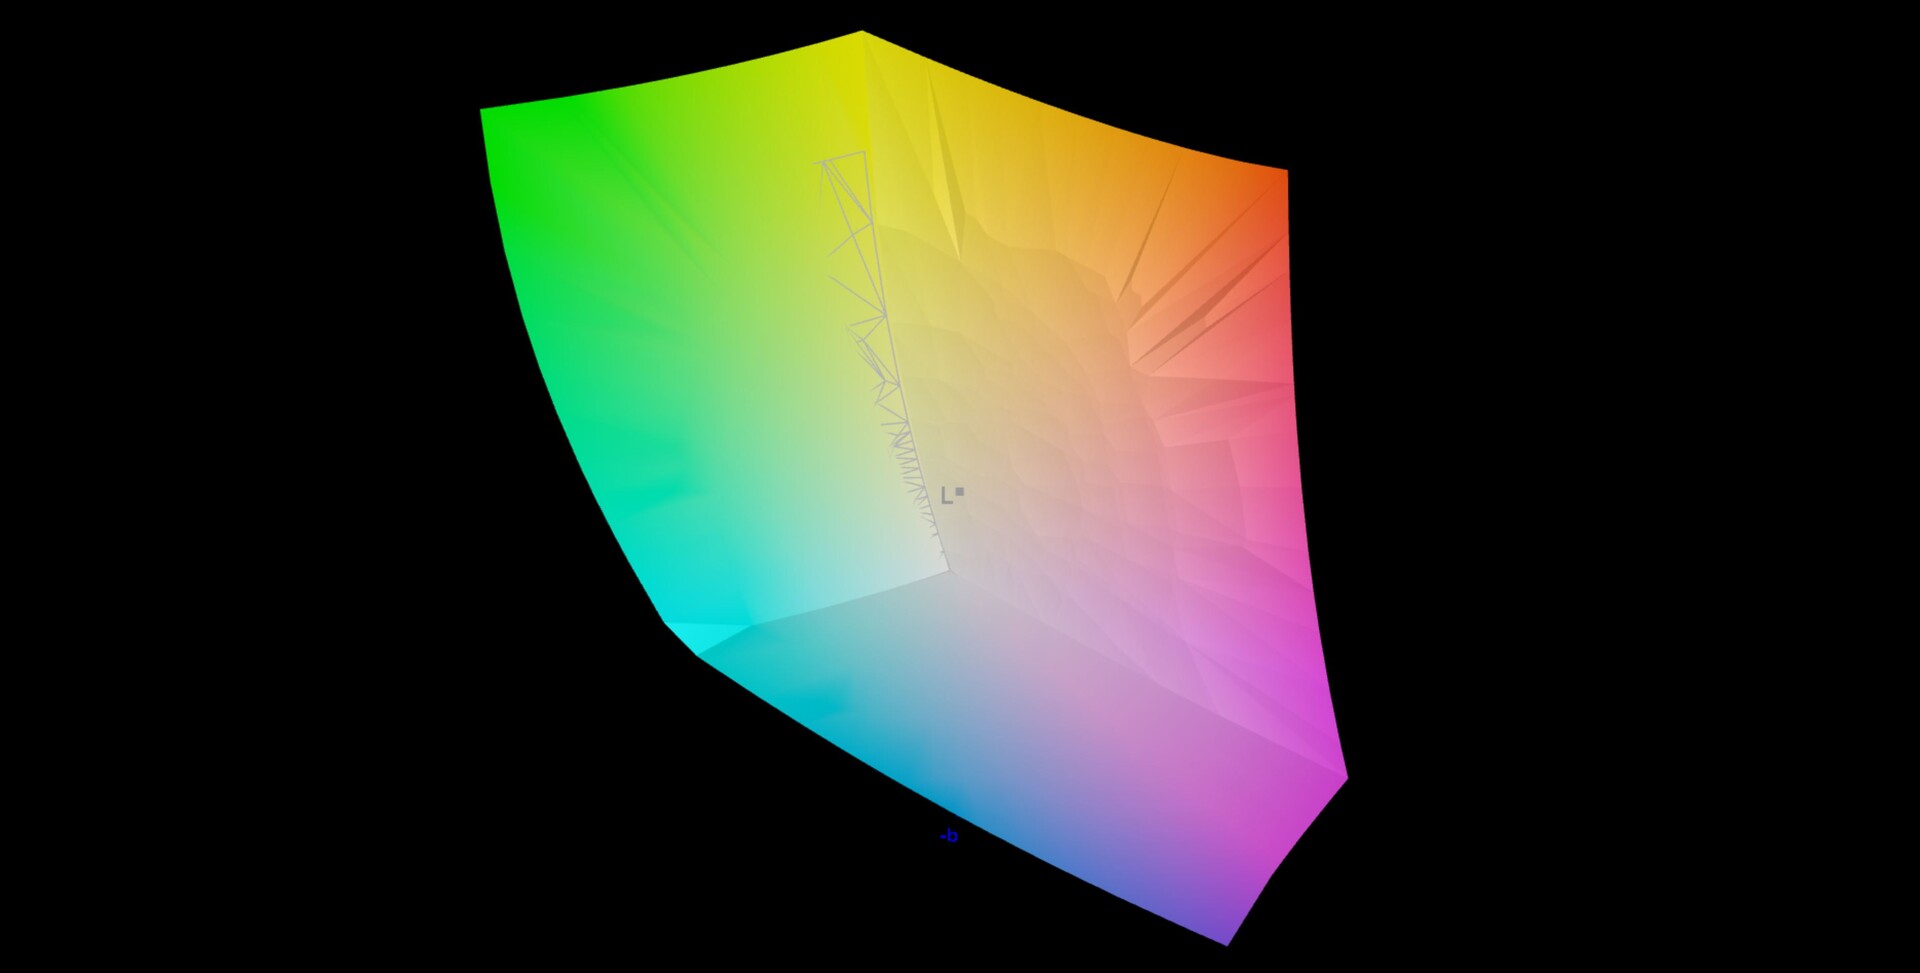
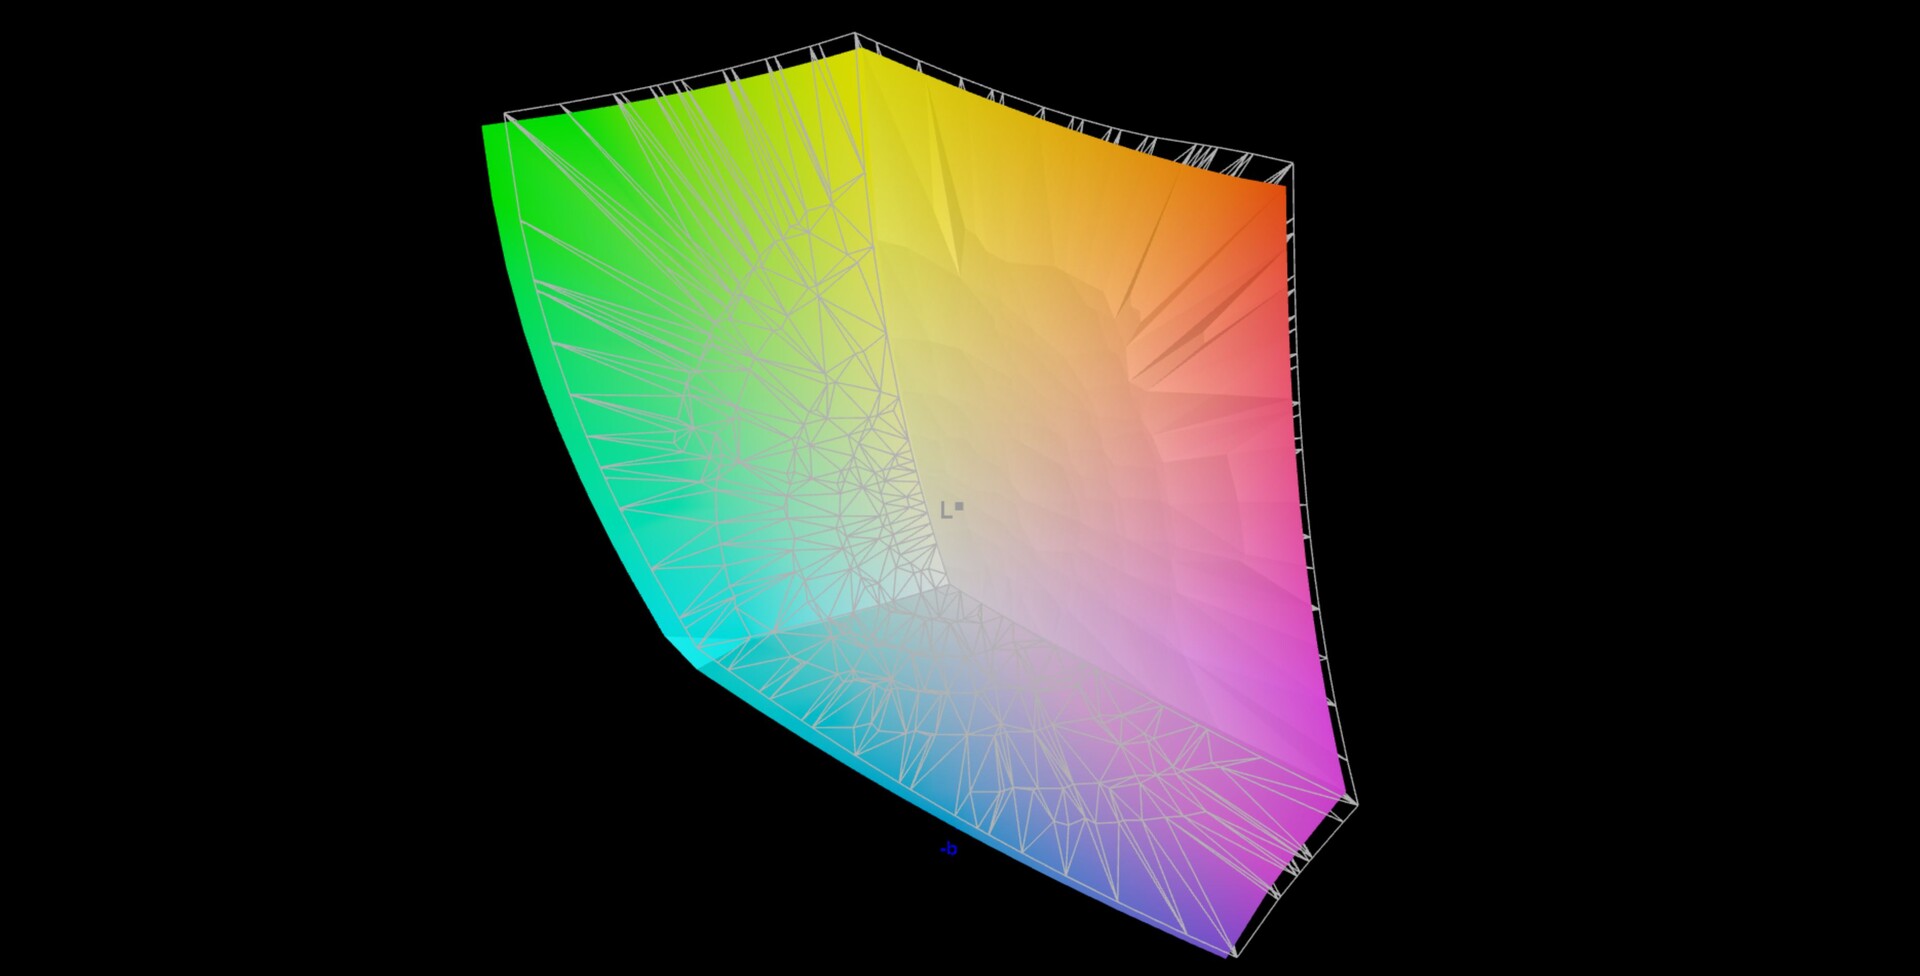
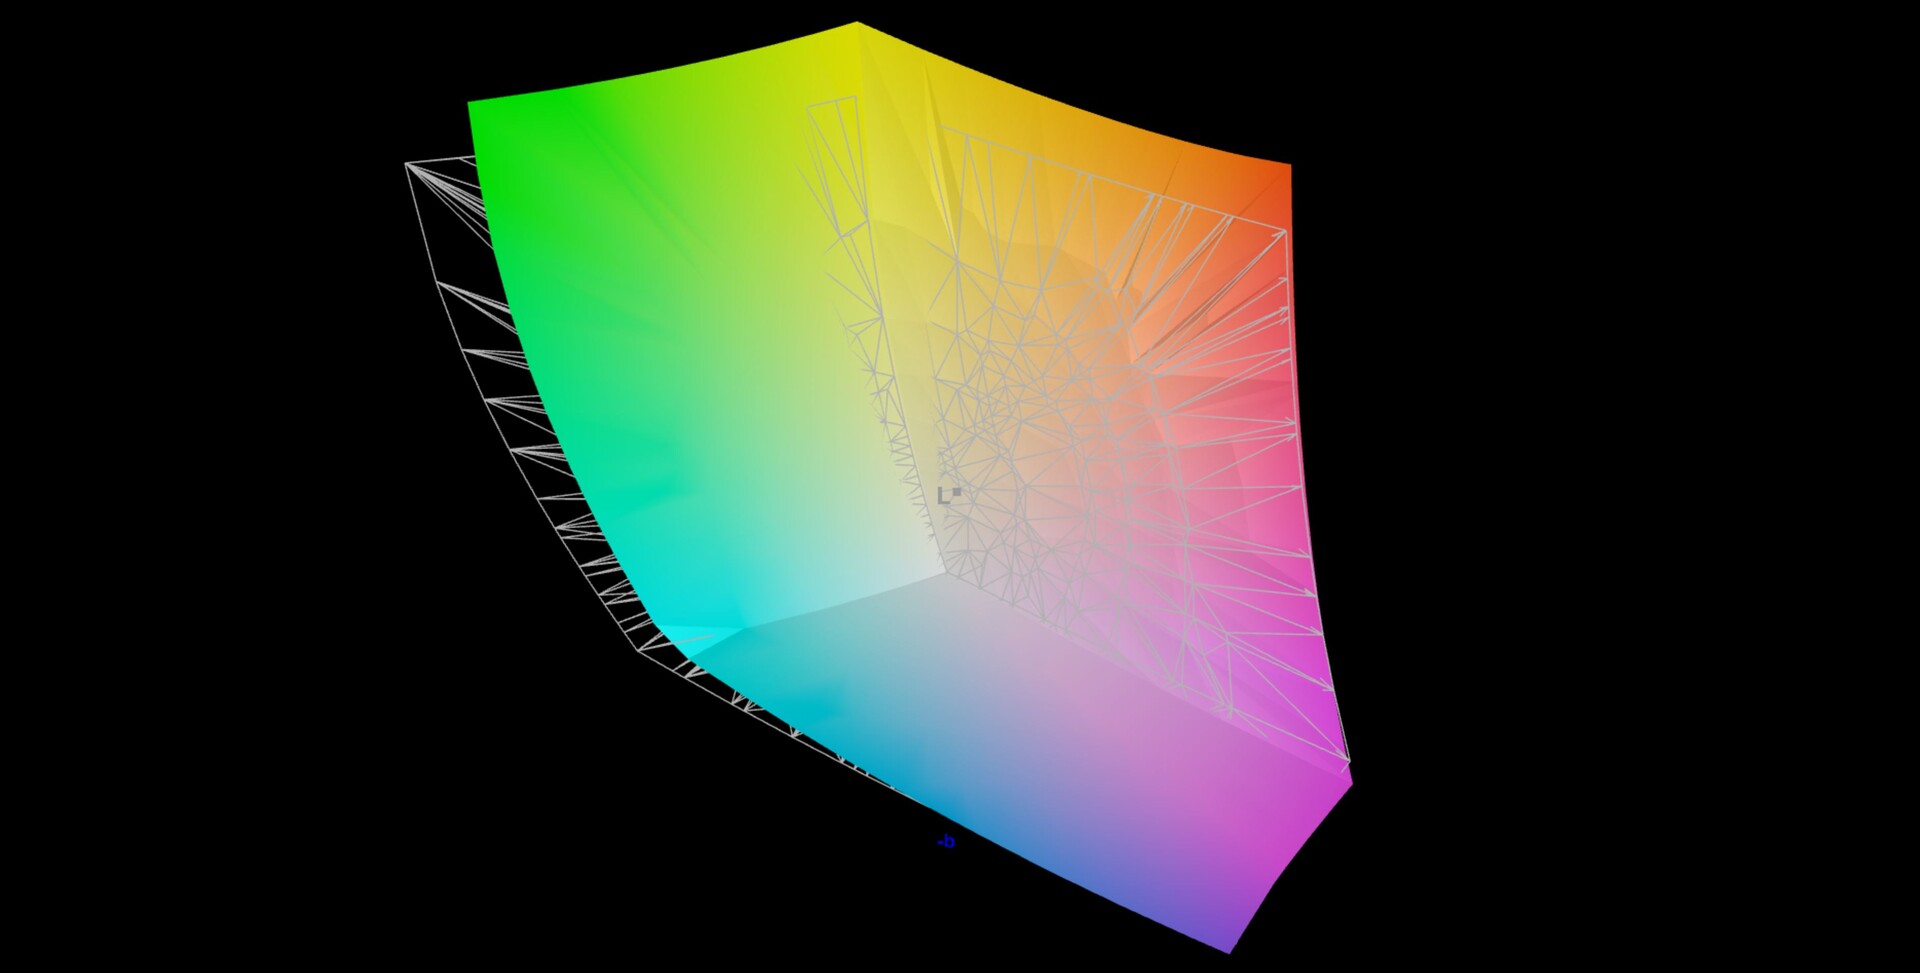
92.4% AdobeRGB 1998 (Argyll 3D)
99.9% sRGB (Argyll 3D)
94.9% Display P3 (Argyll 3D)
Gamma: 2.63
CCT: 6596 K
| MSI Titan GT77 HX 13VI B173ZAN06.C, Mini-LED, 3840x2160, 17.3" | Razer Blade 16 Early 2023 CSOT T3 MNG007DA4-1, IPS, 2560x1600, 16" | Asus ROG Strix Scar 17 SE G733CX-LL014W NE173QHM-NZ2, IPS, 2560x1440, 17.3" | MSI Titan GT77 12UHS Sharp SHP1544 LQ173M1JW08, IPS-Level, 1920x1080, 17.3" | Alienware x17 R2 P48E AU Optronics B173HAN, IPS, 1920x1080, 17.3" | Schenker XMG Neo 17 M22 BOE0A99, IPS, 2560x1600, 17" | |
|---|---|---|---|---|---|---|
| Display | 0% | -2% | -16% | -10% | -17% | |
| Display P3 Coverage (%) | 94.9 | 98.5 4% | 97.1 2% | 70.8 -25% | 79.2 -17% | 69 -27% |
| sRGB Coverage (%) | 99.9 | 100 0% | 99.9 0% | 98.9 -1% | 99.8 0% | 99.8 0% |
| AdobeRGB 1998 Coverage (%) | 92.4 | 89.7 -3% | 84.8 -8% | 73 -21% | 79.6 -14% | 69.6 -25% |
| Response Times | 69% | 74% | 86% | 67% | 75% | |
| Response Time Grey 50% / Grey 80% * (ms) | 38.4 ? | 6.6 ? 83% | 5.7 ? 85% | 3.03 ? 92% | 12.4 ? 68% | 10.8 ? 72% |
| Response Time Black / White * (ms) | 26.6 ? | 12 ? 55% | 10.1 ? 62% | 5.28 ? 80% | 9.2 ? 65% | 6.1 ? 77% |
| PWM Frequency (Hz) | 2380 ? | |||||
| Screen | -38877% | -37485% | -44442% | -32218% | -47756% | |
| Brightness middle (cd/m²) | 606 | 456.8 -25% | 320 -47% | 280 -54% | 365.4 -40% | 415 -32% |
| Brightness (cd/m²) | 602 | 437 -27% | 303 -50% | 275 -54% | 344 -43% | 399 -34% |
| Brightness Distribution (%) | 93 | 83 -11% | 87 -6% | 79 -15% | 85 -9% | 90 -3% |
| Black Level * (cd/m²) | 0.0001 | 0.35 -349900% | 0.3 -299900% | 0.4 -399900% | 0.29 -289900% | 0.43 -429900% |
| Contrast (:1) | 6060000 | 1305 -100% | 1067 -100% | 700 -100% | 1260 -100% | 965 -100% |
| Colorchecker dE 2000 * | 4.8 | 3.7 23% | 1.1 77% | 2.1 56% | 3.17 34% | 1.44 70% |
| Colorchecker dE 2000 max. * | 8.2 | 6.42 22% | 2.7 67% | 5.83 29% | 7.69 6% | 2.33 72% |
| Colorchecker dE 2000 calibrated * | 1.8 | 0.66 63% | 1.58 12% | 0.51 72% | 0.89 51% | |
| Greyscale dE 2000 * | 6.5 | 2.6 60% | 1.1 83% | 3.3 49% | 5.3 18% | 1.8 72% |
| Gamma | 2.63 84% | 2.3 96% | 2.13 103% | 2.13 103% | 2.18 101% | 2.132 103% |
| CCT | 6596 99% | 6108 106% | 6599 98% | 7060 92% | 5879 111% | 6327 103% |
| Moyenne finale (programmes/paramètres) | -12936% /
-24983% | -12471% /
-23057% | -14791% /
-28561% | -10720% /
-20704% | -15899% /
-30693% |
* ... Moindre est la valeur, meilleures sont les performances
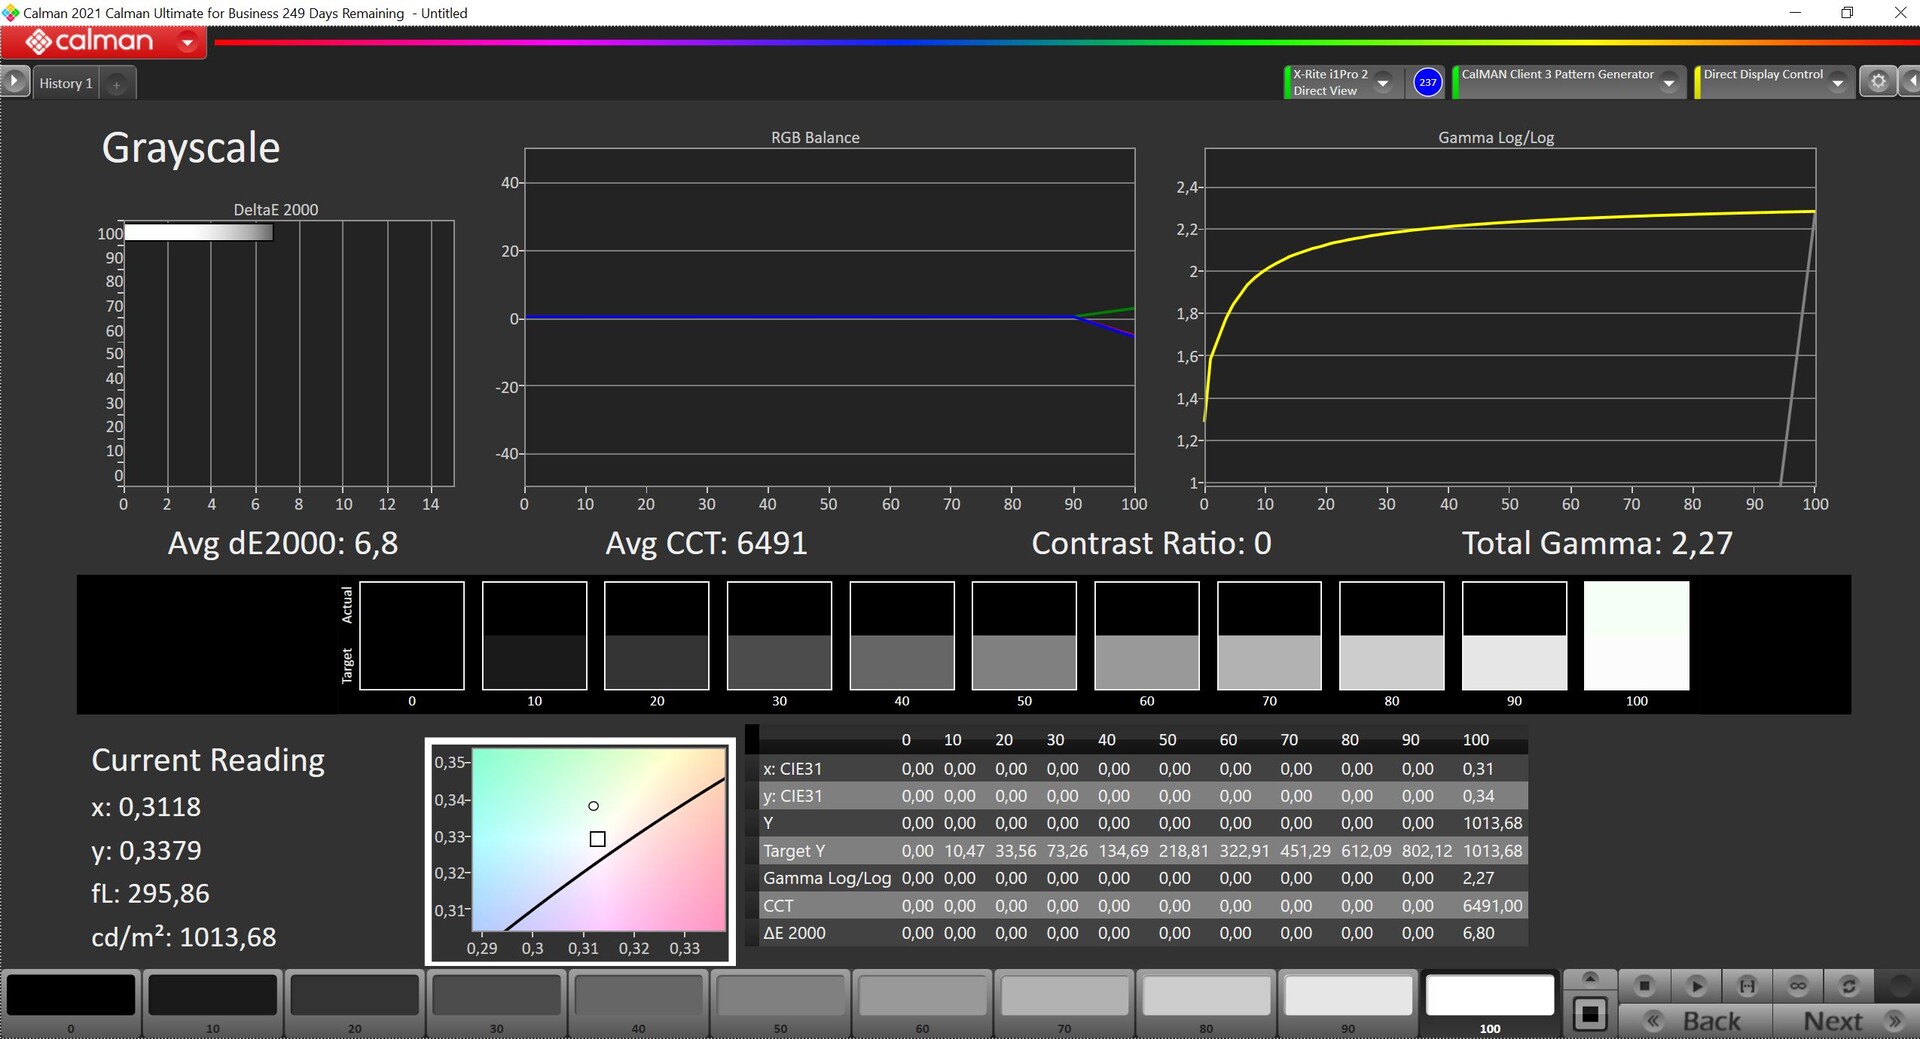
MSI livre le Titan GT77 avec le logiciel True Color, qui offre différents préréglages pour les espaces de couleurs et les scénarios (comme Gamer, Office, Movie) et vous pouvez même utiliser le logiciel pour calibrer l'écran. Nous avons utilisé le logiciel professionnel CalMAN en combinaison avec le spectrophotomètre X-Rite i1 Pro 2 et le profil Display P3 puisque le panneau est censé couvrir la totalité du gamut P3.
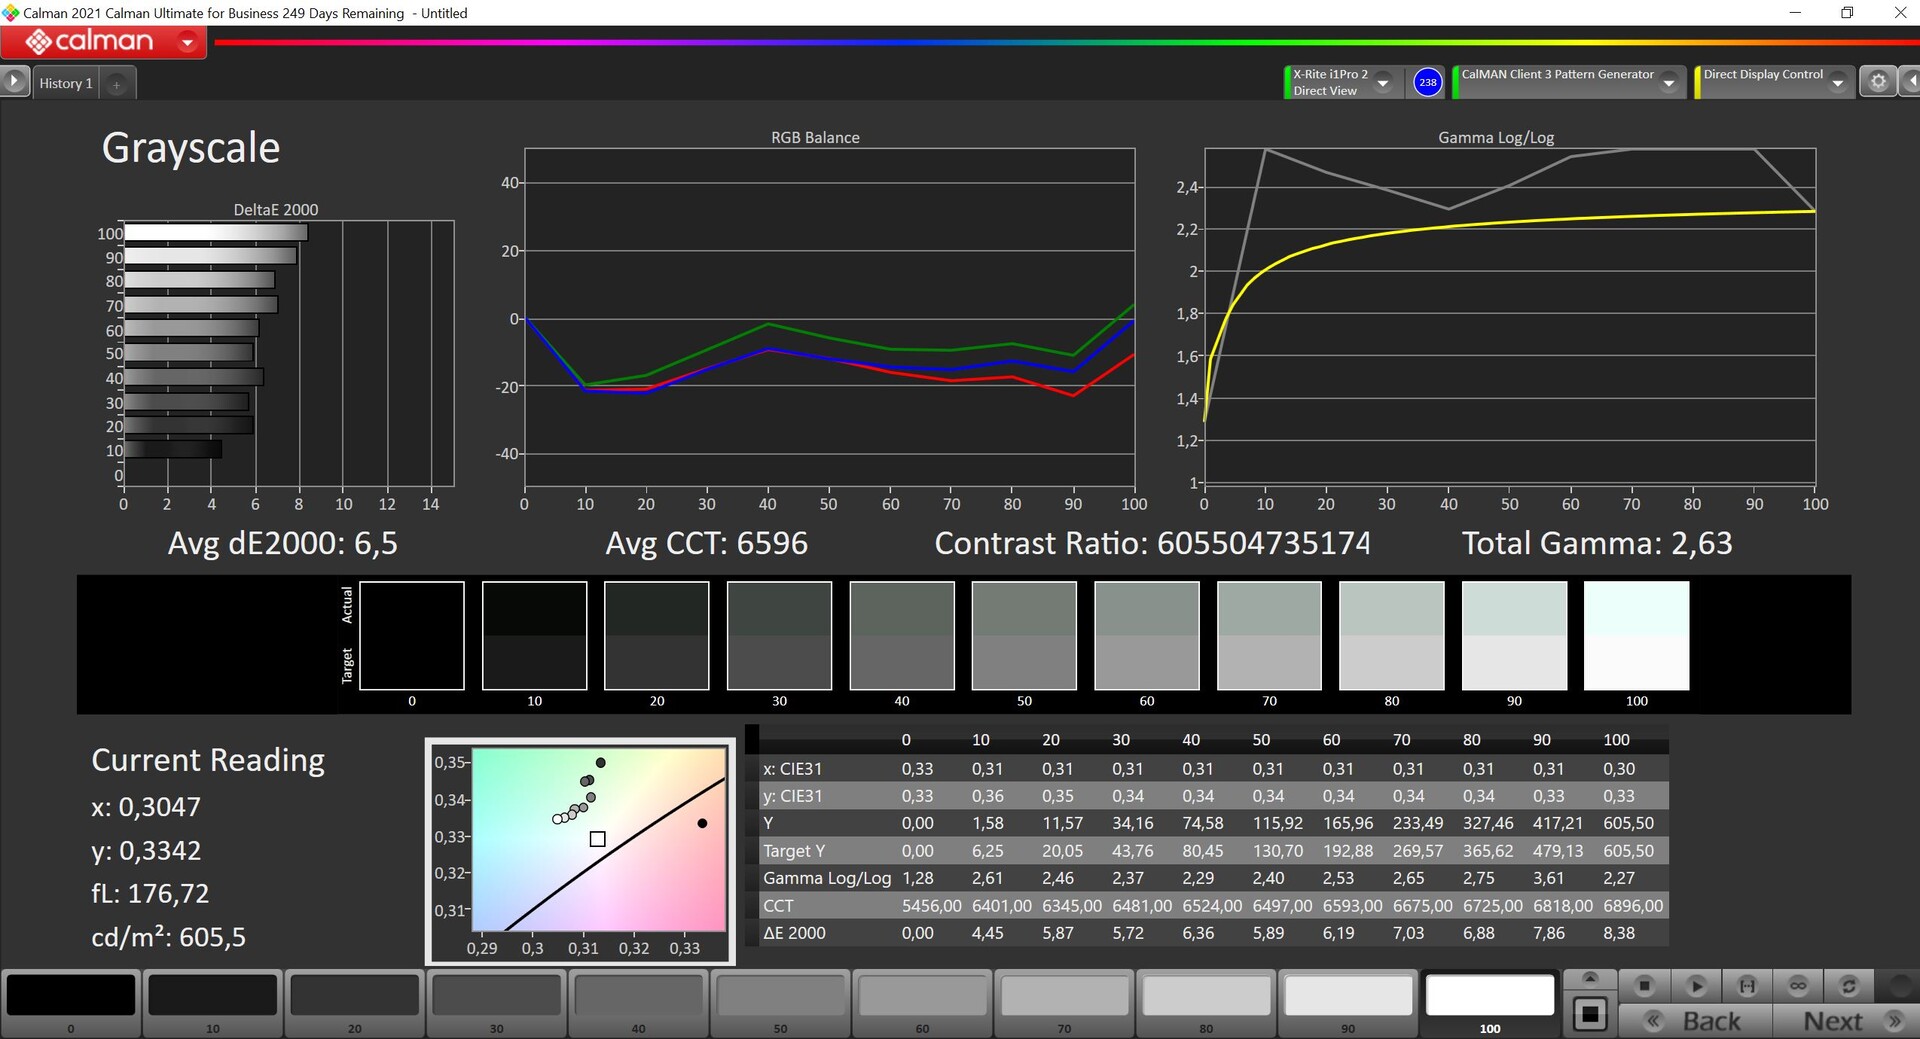
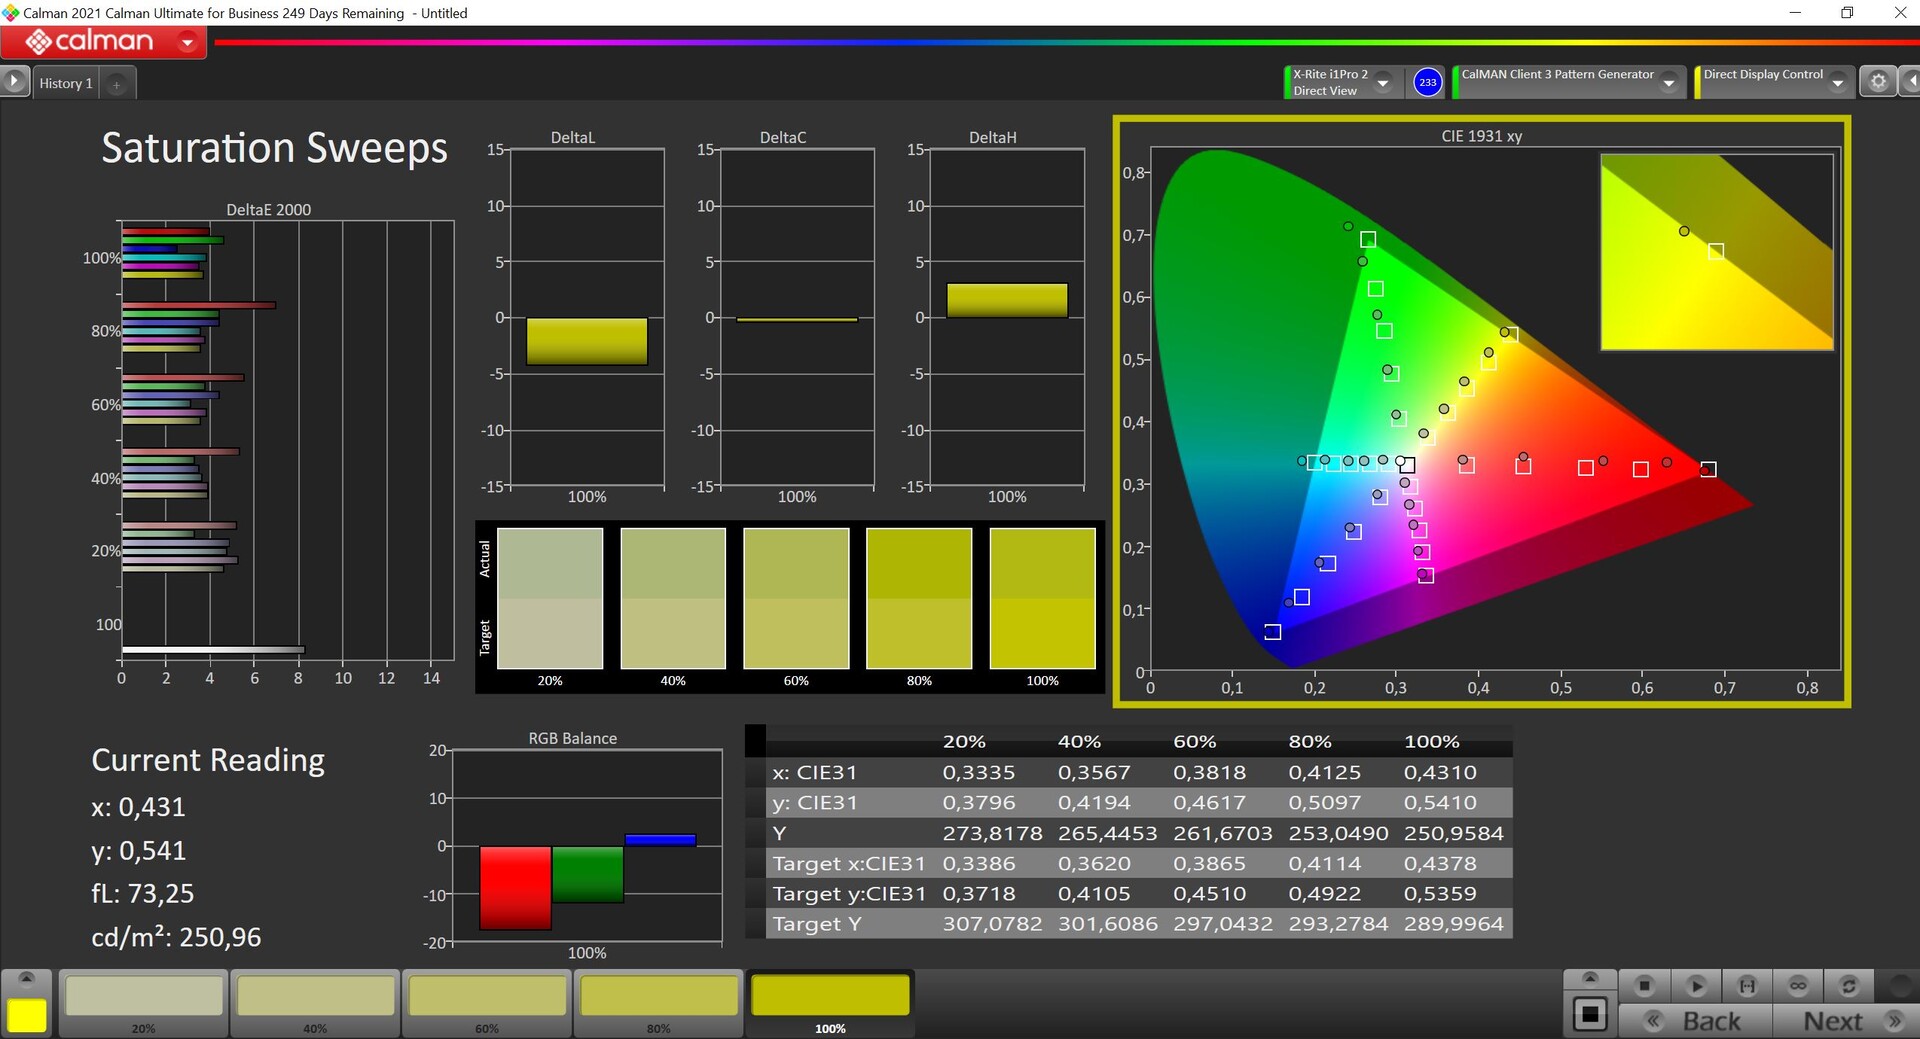
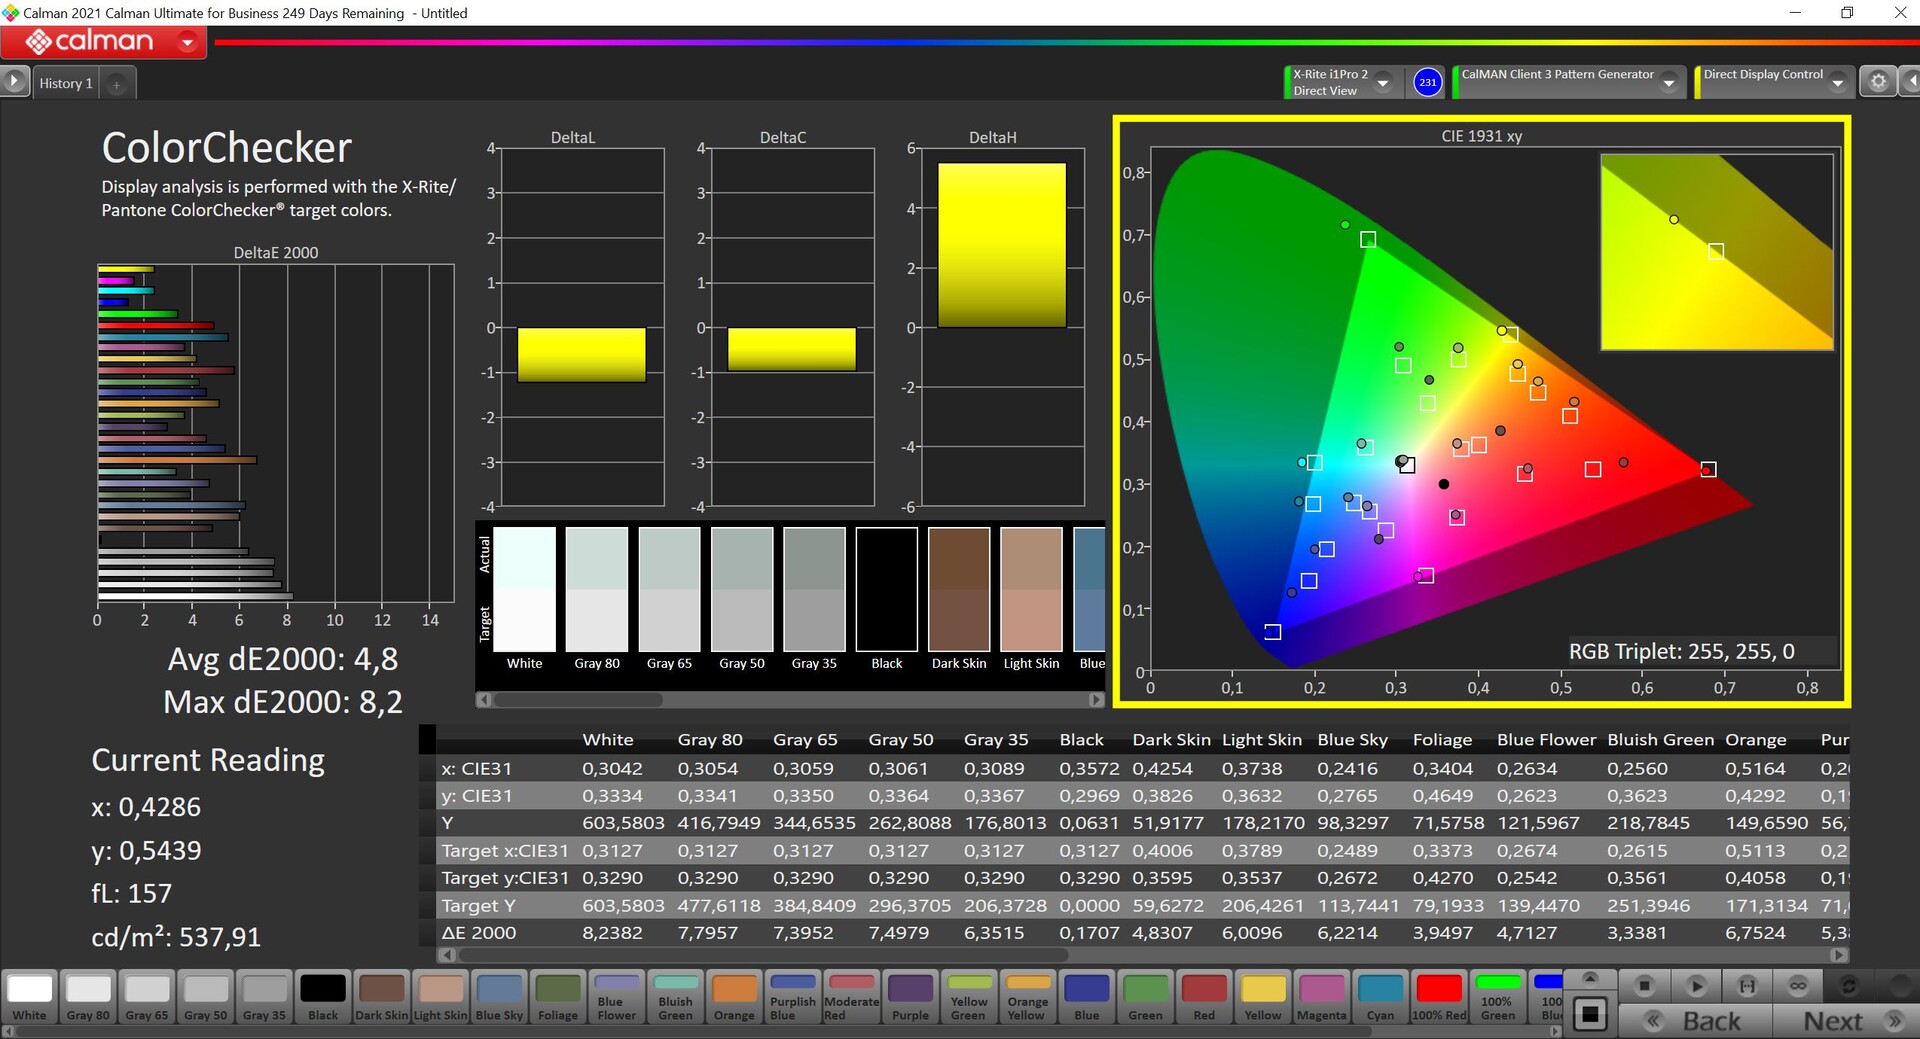
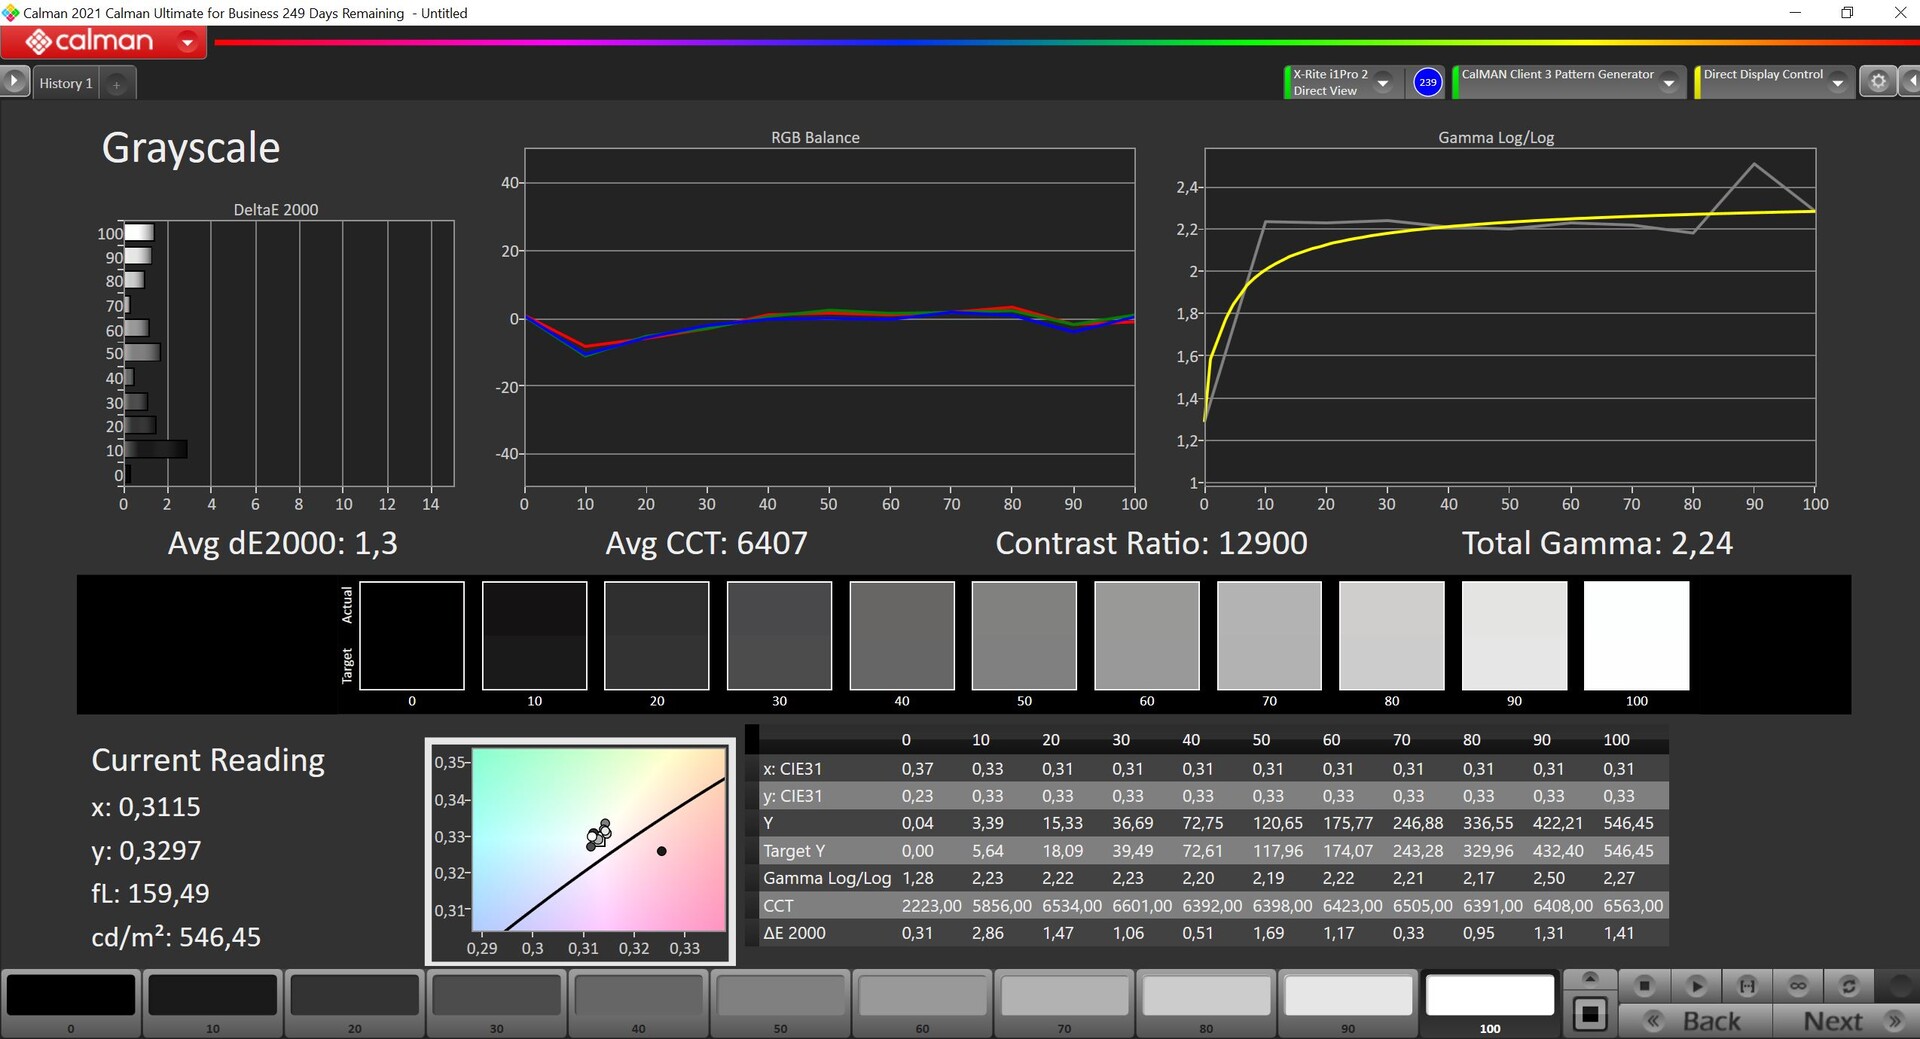
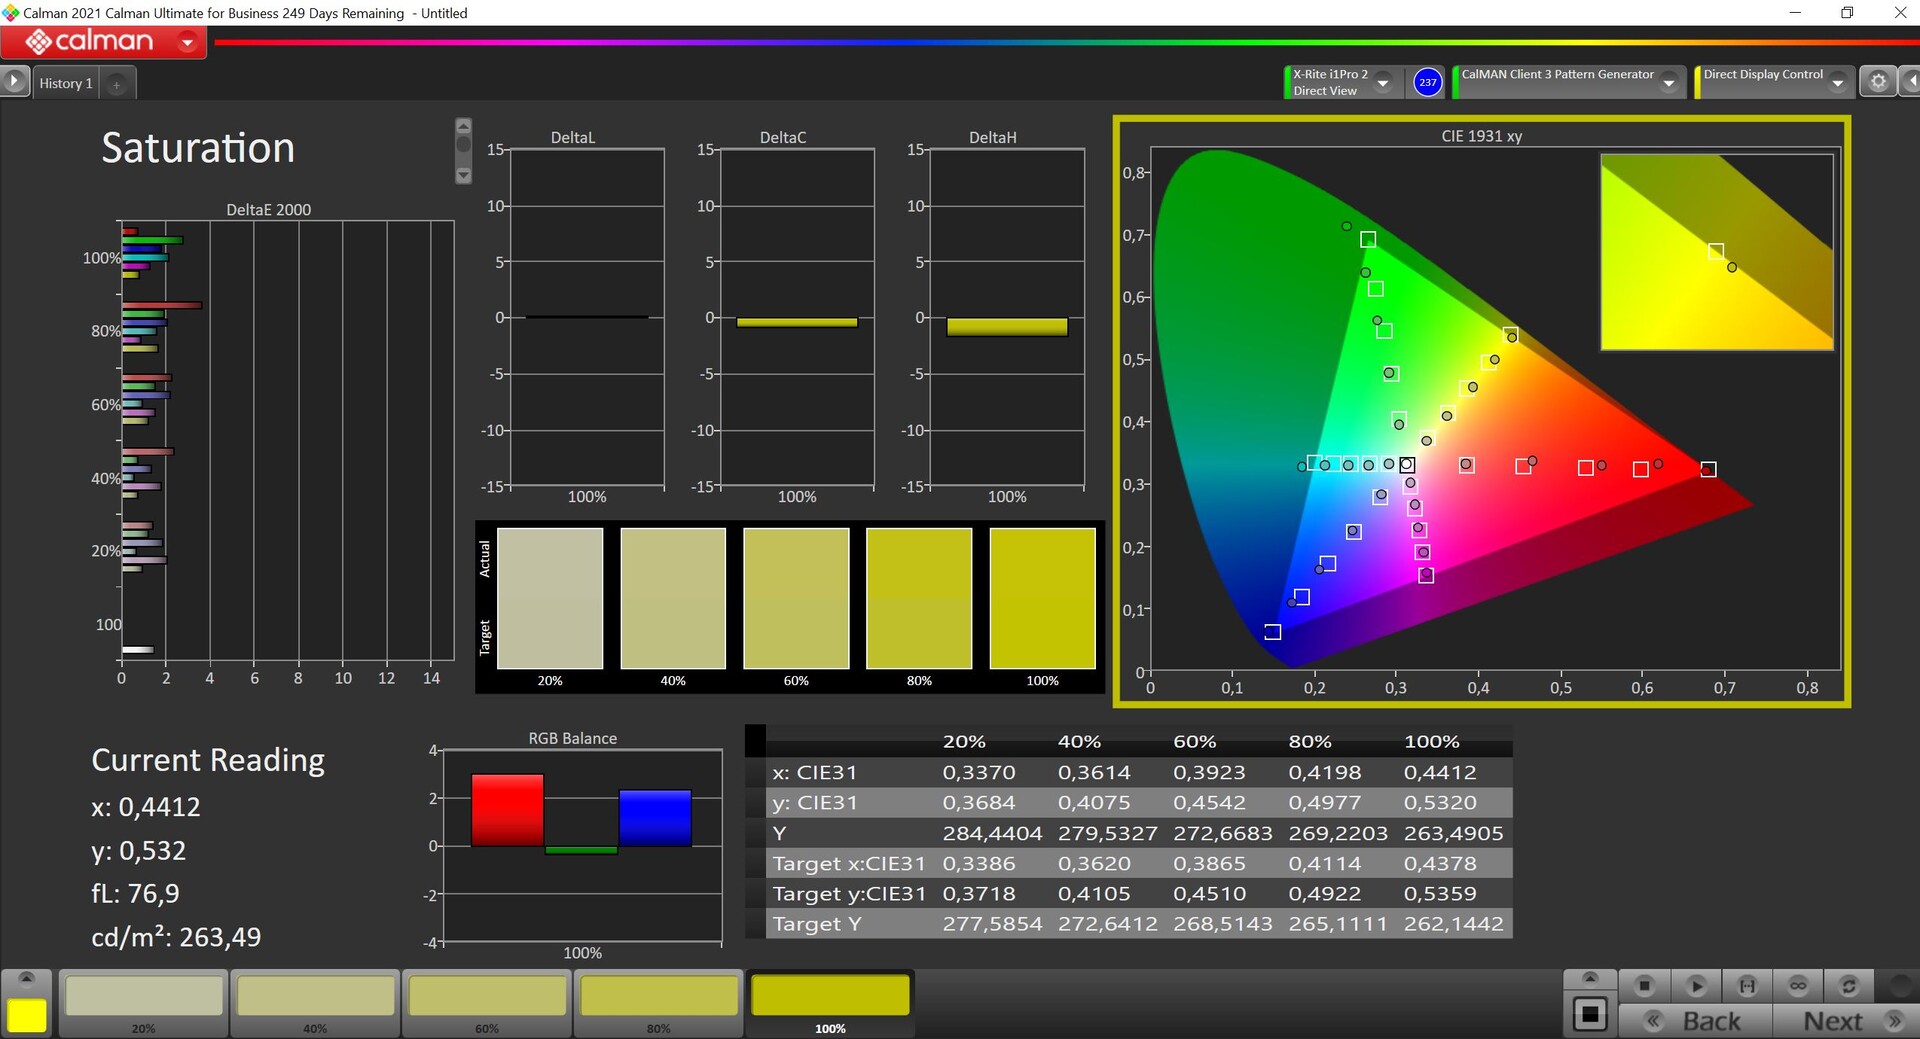
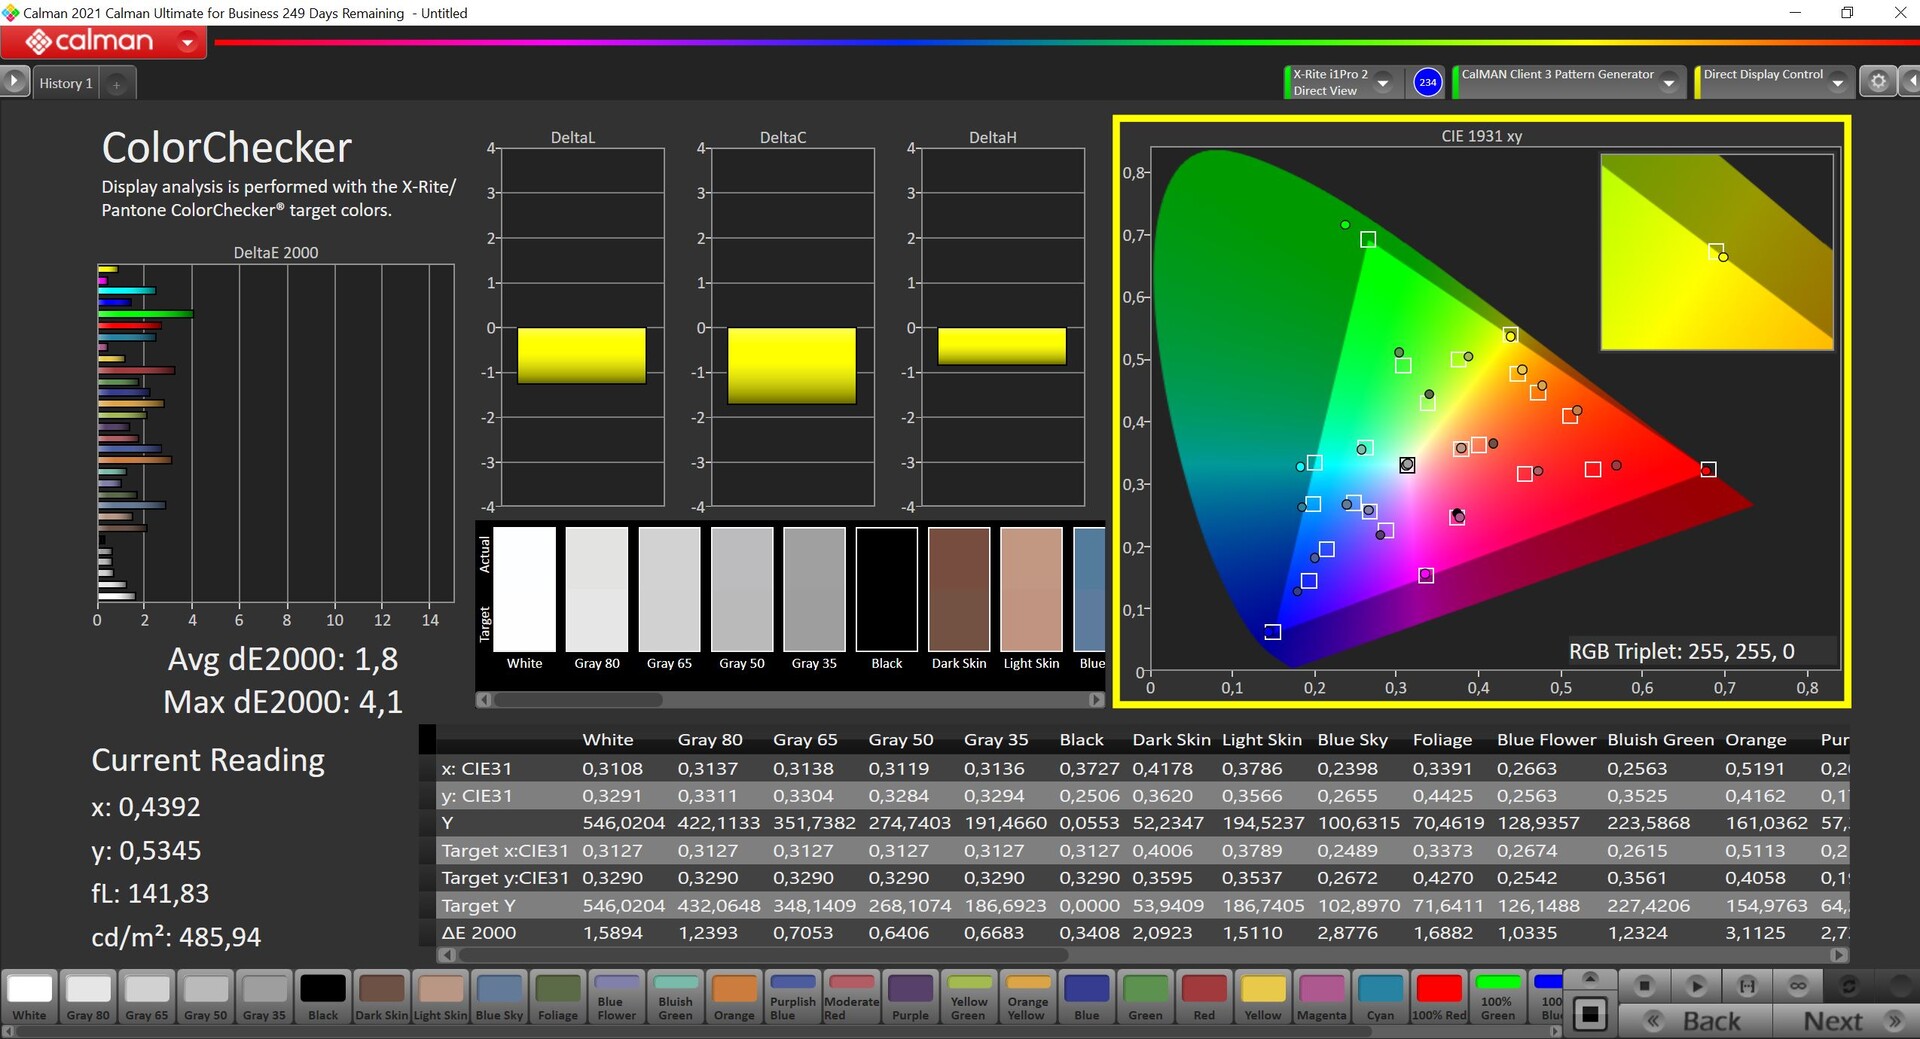
Les écarts par rapport au gamut de référence P3 sont très élevés dès le départ, tant pour les niveaux de gris que pour les couleurs. Notre propre calibration (le profil correspondant est disponible gratuitement dans la boîte d'affichage ci-dessus) améliore sensiblement la performance des couleurs, mais diminue également la luminosité maximale d'environ 50 nits. Nous recommandons tout de même le profil calibré et il est possible d'éditer des photos/vidéos, même si nos mesures montrent que l'espace couleur P3 n'est couvert qu'à 95 %.
Temps de réponse de l'écran
| ↔ Temps de réponse noir à blanc | ||
|---|---|---|
| 26.6 ms ... hausse ↗ et chute ↘ combinées | ↗ 9.2 ms hausse | 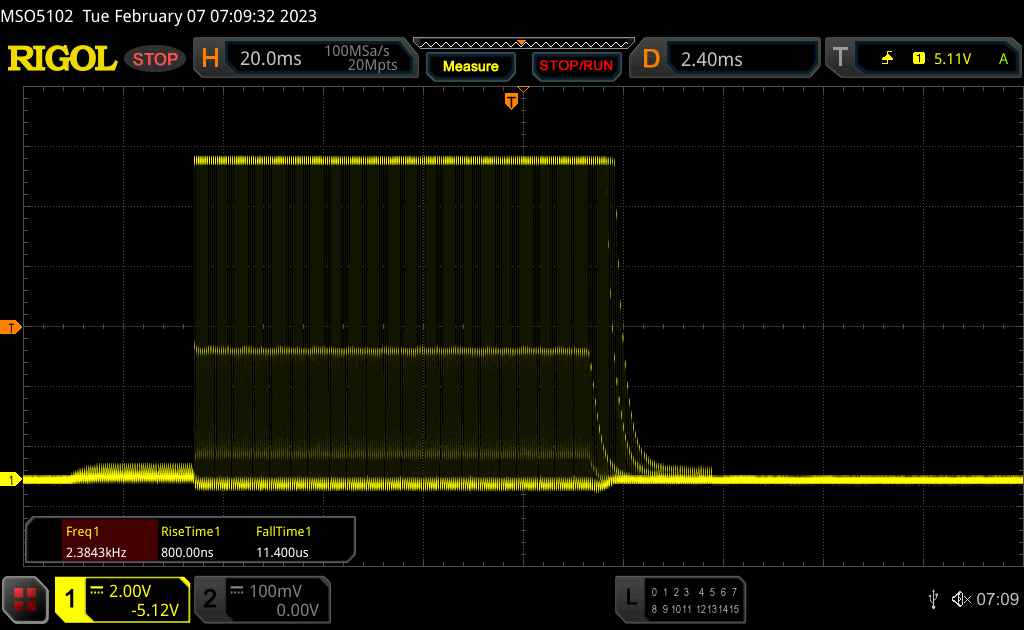 |
| ↘ 17.4 ms chute | ||
| L'écran souffre de latences relativement élevées, insuffisant pour le jeu. En comparaison, tous les appareils testés affichent entre 0.1 (minimum) et 240 (maximum) ms. » 66 % des appareils testés affichent de meilleures performances. Cela signifie que les latences relevées sont moins bonnes que la moyenne (19.9 ms) de tous les appareils testés. | ||
| ↔ Temps de réponse gris 50% à gris 80% | ||
| 38.4 ms ... hausse ↗ et chute ↘ combinées | ↗ 13.6 ms hausse | 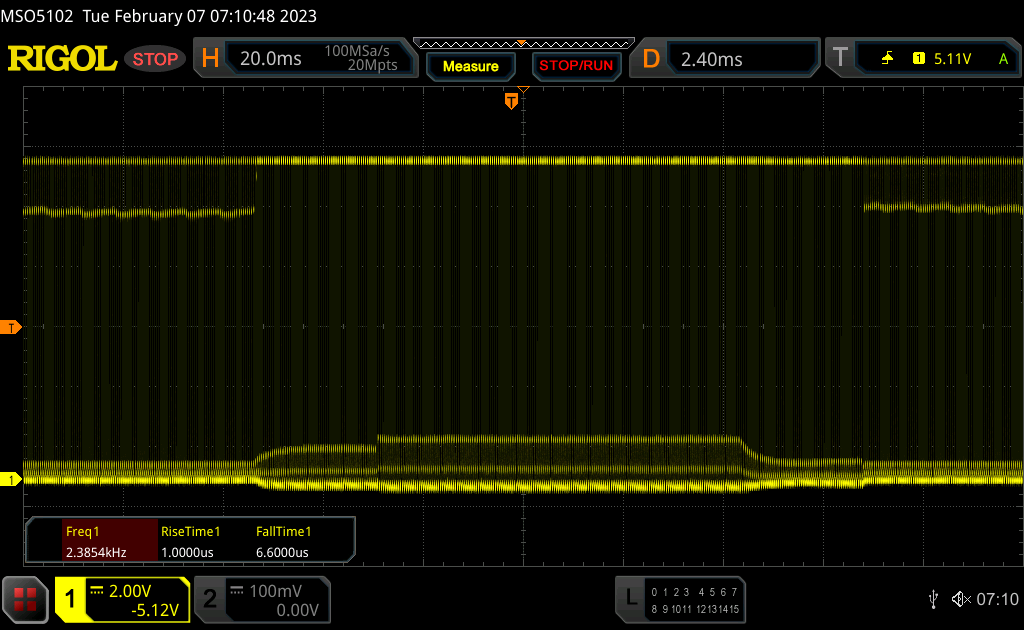 |
| ↘ 24.8 ms chute | ||
| L'écran souffre de latences très élevées, à éviter pour le jeu. En comparaison, tous les appareils testés affichent entre 0.165 (minimum) et 636 (maximum) ms. » 57 % des appareils testés affichent de meilleures performances. Cela signifie que les latences relevées sont moins bonnes que la moyenne (31.1 ms) de tous les appareils testés. | ||
Scintillement / MLI (Modulation de largeur d'impulsion)
| Scintillement / MLI (Modulation de largeur d'impulsion) décelé | 2380 Hz | ≤ 100 Niveau de luminosité | 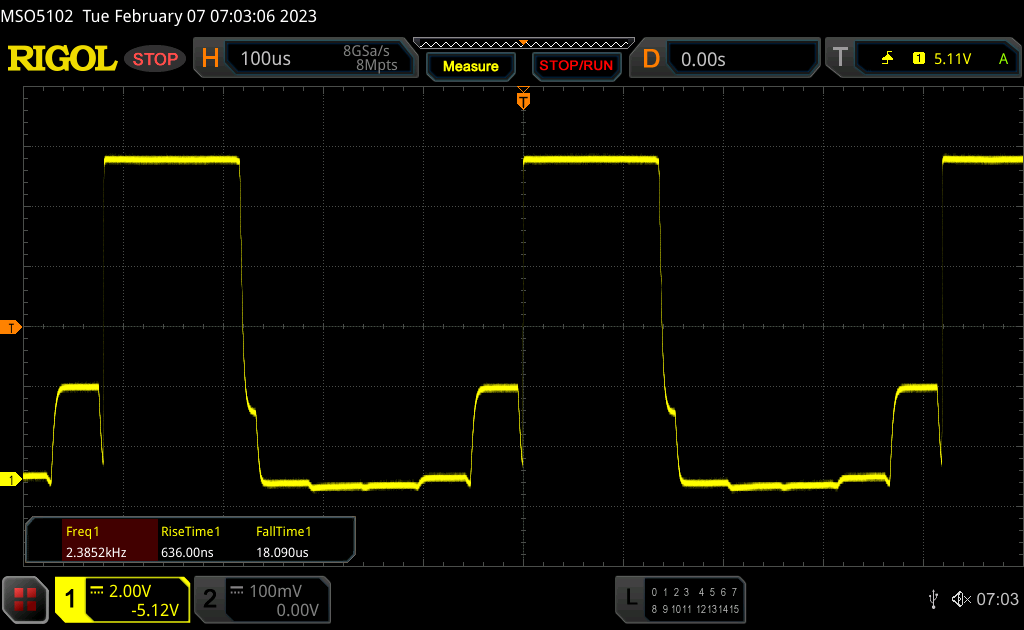 |
Le rétroéclairage de l'écran scintille à la fréquence de 2380 Hz (certainement du fait de l'utilisation d'une MDI - Modulation de largeur d'impulsion) à un niveau de luminosité inférieur ou égal à 100 % . Aucun scintillement ne devrait être perceptible au-dessus de cette valeur. La fréquence de rafraîchissement de 2380 Hz est élevée, la grande majorité des utilisateurs ne devrait pas percevoir de scintillements et être sujette à une fatigue oculaire accrue. En comparaison, 52 % des appareils testés n'emploient pas MDI pour assombrir leur écran. Nous avons relevé une moyenne à 7794 (minimum : 5 - maximum : 343500) Hz dans le cas où une MDI était active. | |||


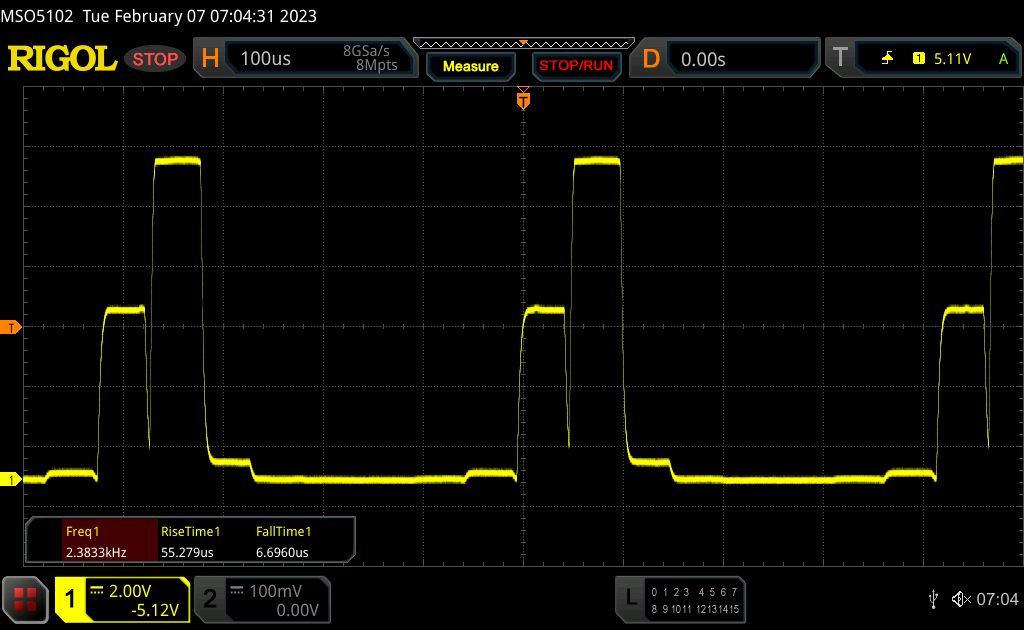
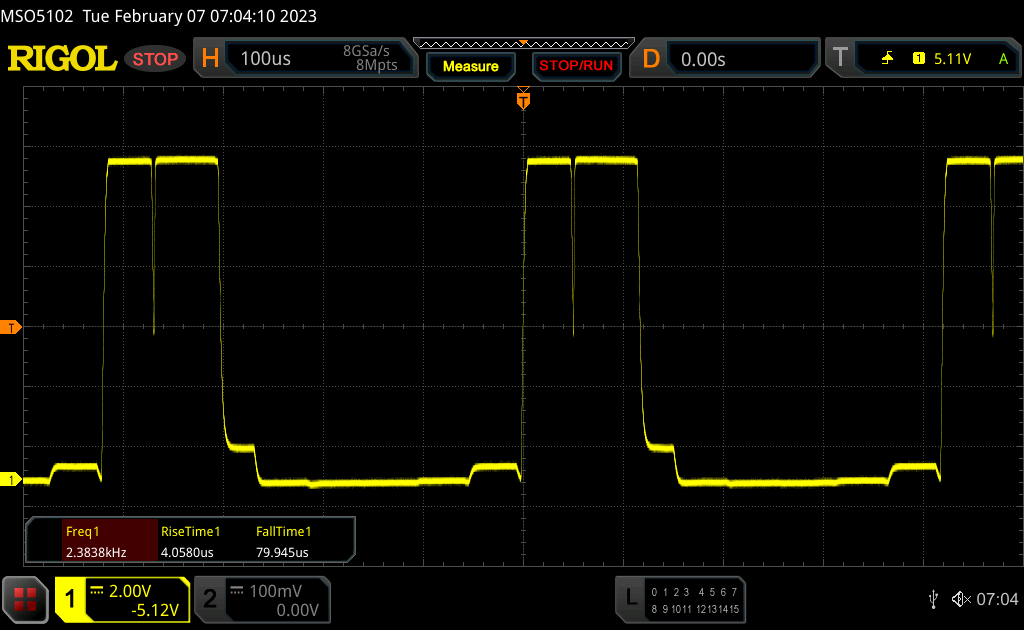
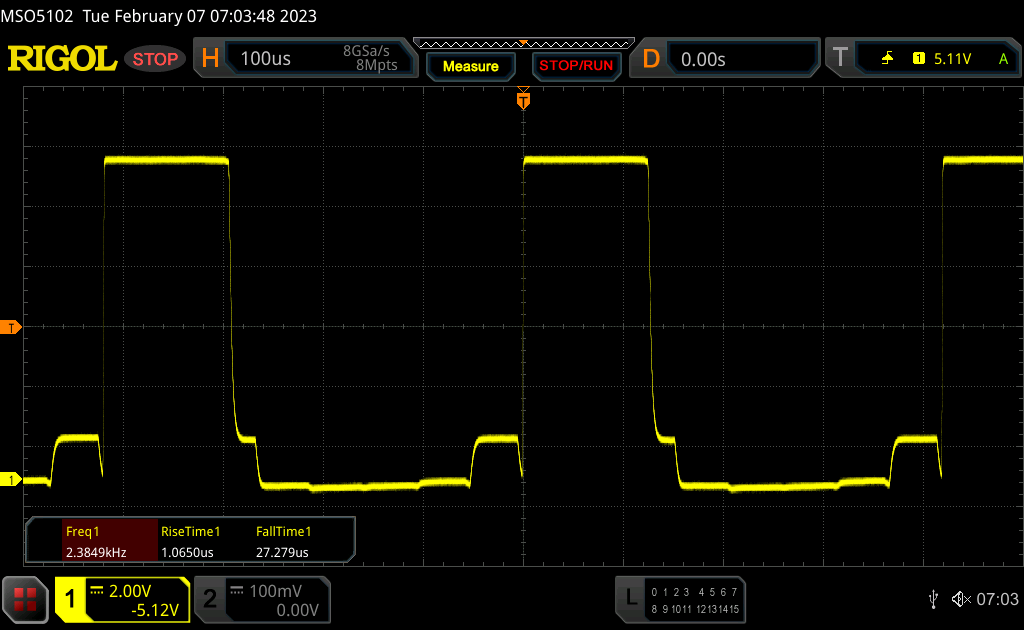
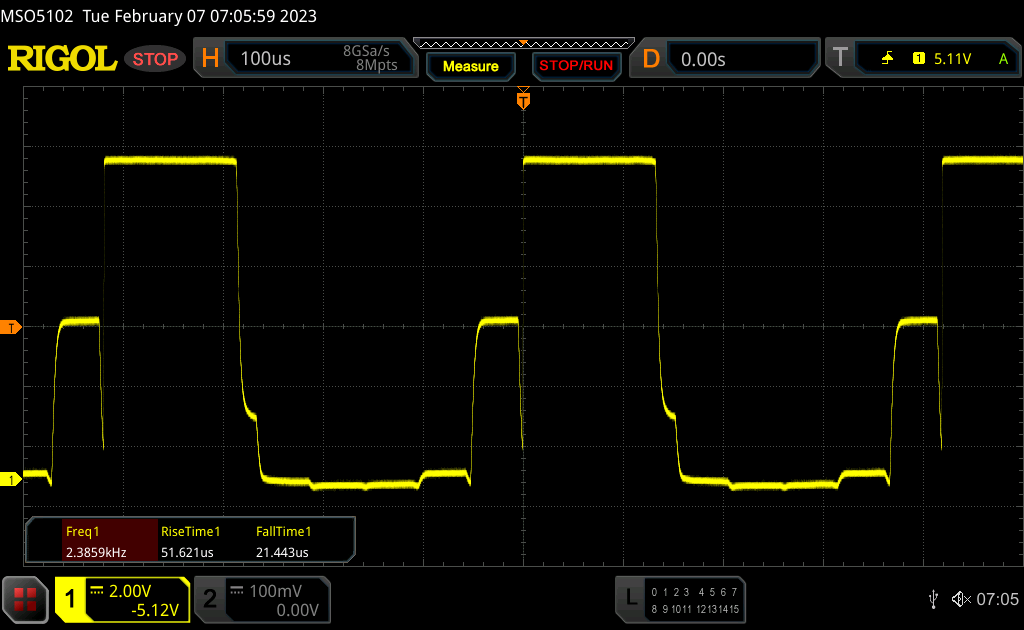
Nous détectons le PWM à tous les niveaux de luminosité (même la luminosité HDR maximale) avec une fréquence de 2,38 kHz, ce qui rend la détermination des temps de réponse vraiment délicate. Nous ajouterons les résultats correspondants plus tard.
La dalle mate et la haute luminosité devraient être excellentes en extérieur, mais MSI limite les capacités extérieures du GT77. Le HDR n'est pas possible sur batterie et la luminosité SDR maximale est également abaissée de ~600 à ~400 nits dès que vous détachez l'adaptateur secteur. Il n'y a aucune limitation en termes de stabilité de l'angle de vision.

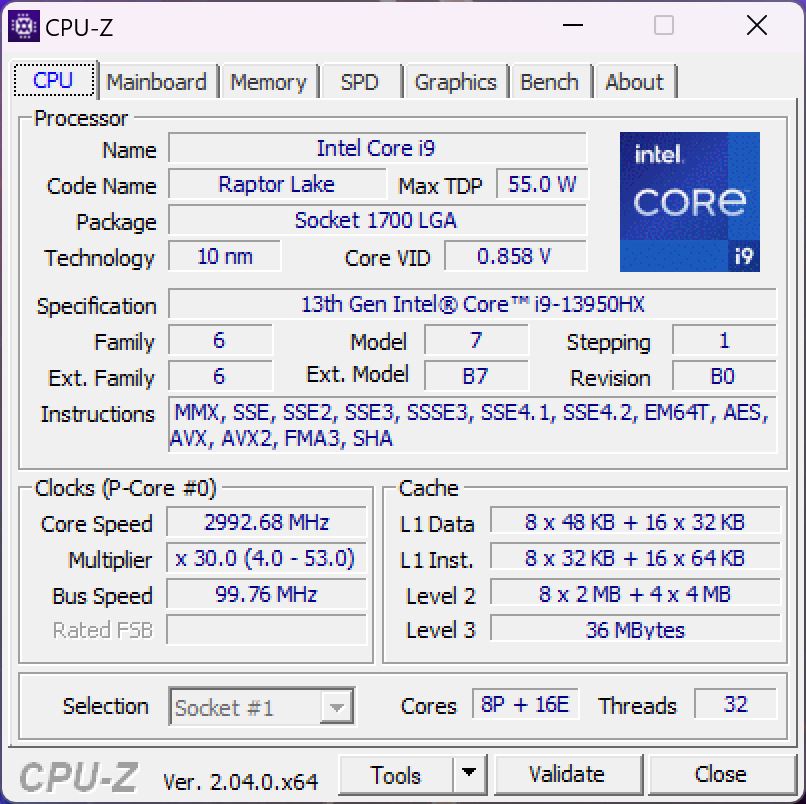
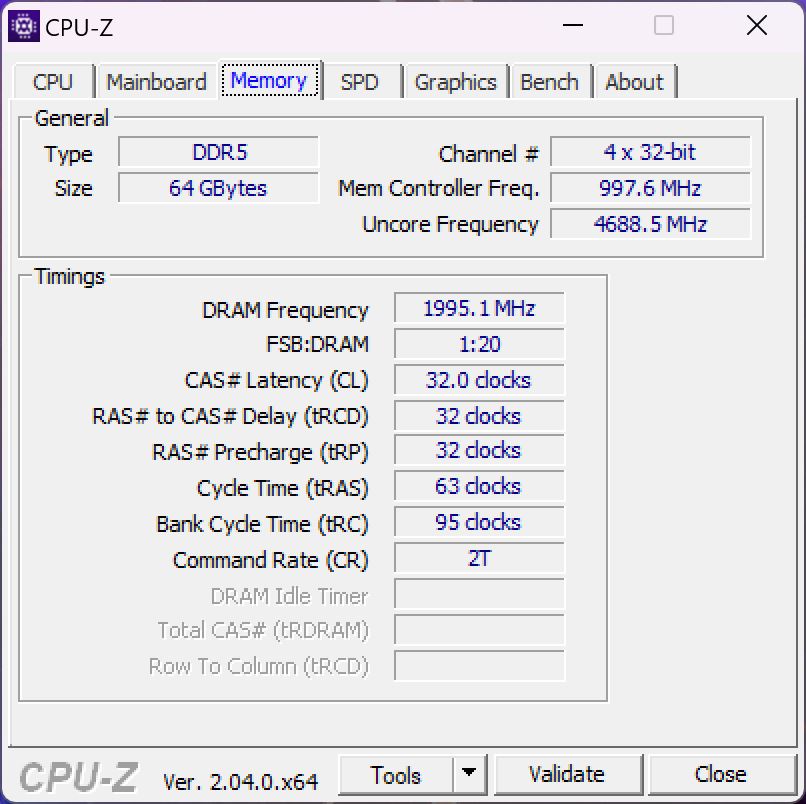
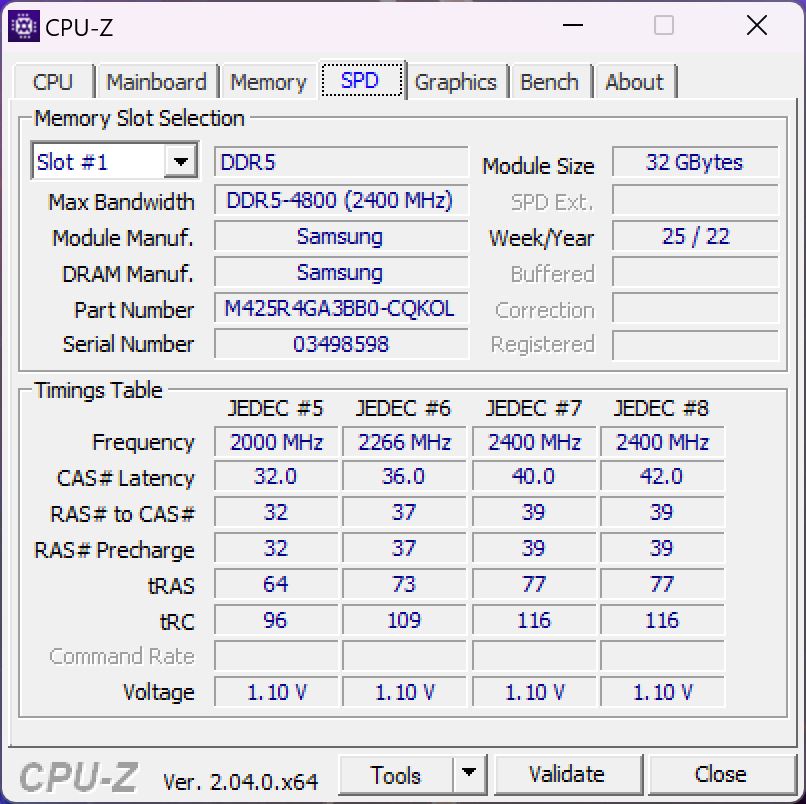
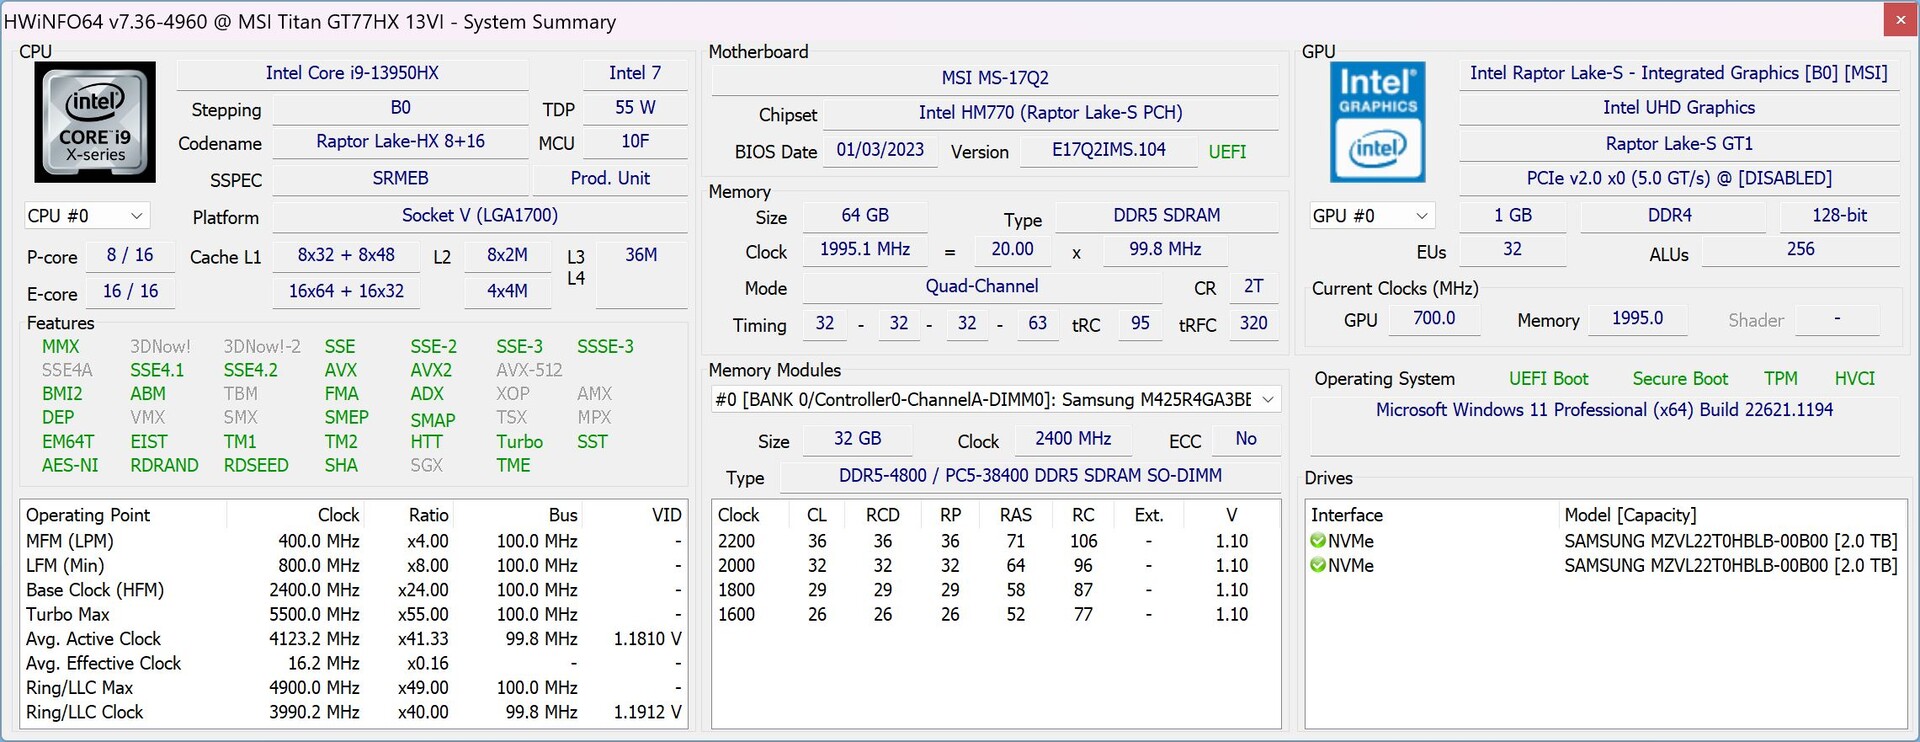
Performances - Core i9 HX & RTX 4090
Notre unité de test est équipée duCore i9-13950HXl'un des processeurs mobiles les plus rapides d'Intel. La version de détail sera équipée duCore i9-13980HXmais il n'offre qu'une horloge maximale supérieure de 100 MHz pour les P-cores en faveur du support vPro. Ce dernier point n'est pas important lorsque vous jouez à des jeux, mais pourrait être intéressant si vous prévoyez d'utiliser le Titan comme une station de travail mobile. MSI utilise toujours la DDR5-4800 au lieu de la plus rapide DDR5-5600 et vous pouvez choisir la nouvelle carteGeForce RTX 4080ou laRTX 4090pour les ordinateurs portables.
Paramètres de révision
Le logiciel MSI Center préchargé propose différents réglages de performances avec un mode AI et quatre préréglages supplémentaires (Extreme Performance, Balanced, Silent, Super Battery). Vous pouvez également sélectionner le mode graphique (hybride, uniquement dGPU, uniquement iGPU) grâce à un MUX, mais il n'y a pas de support pour Advanced Optimus, ce qui signifie que les changements nécessitent un redémarrage.
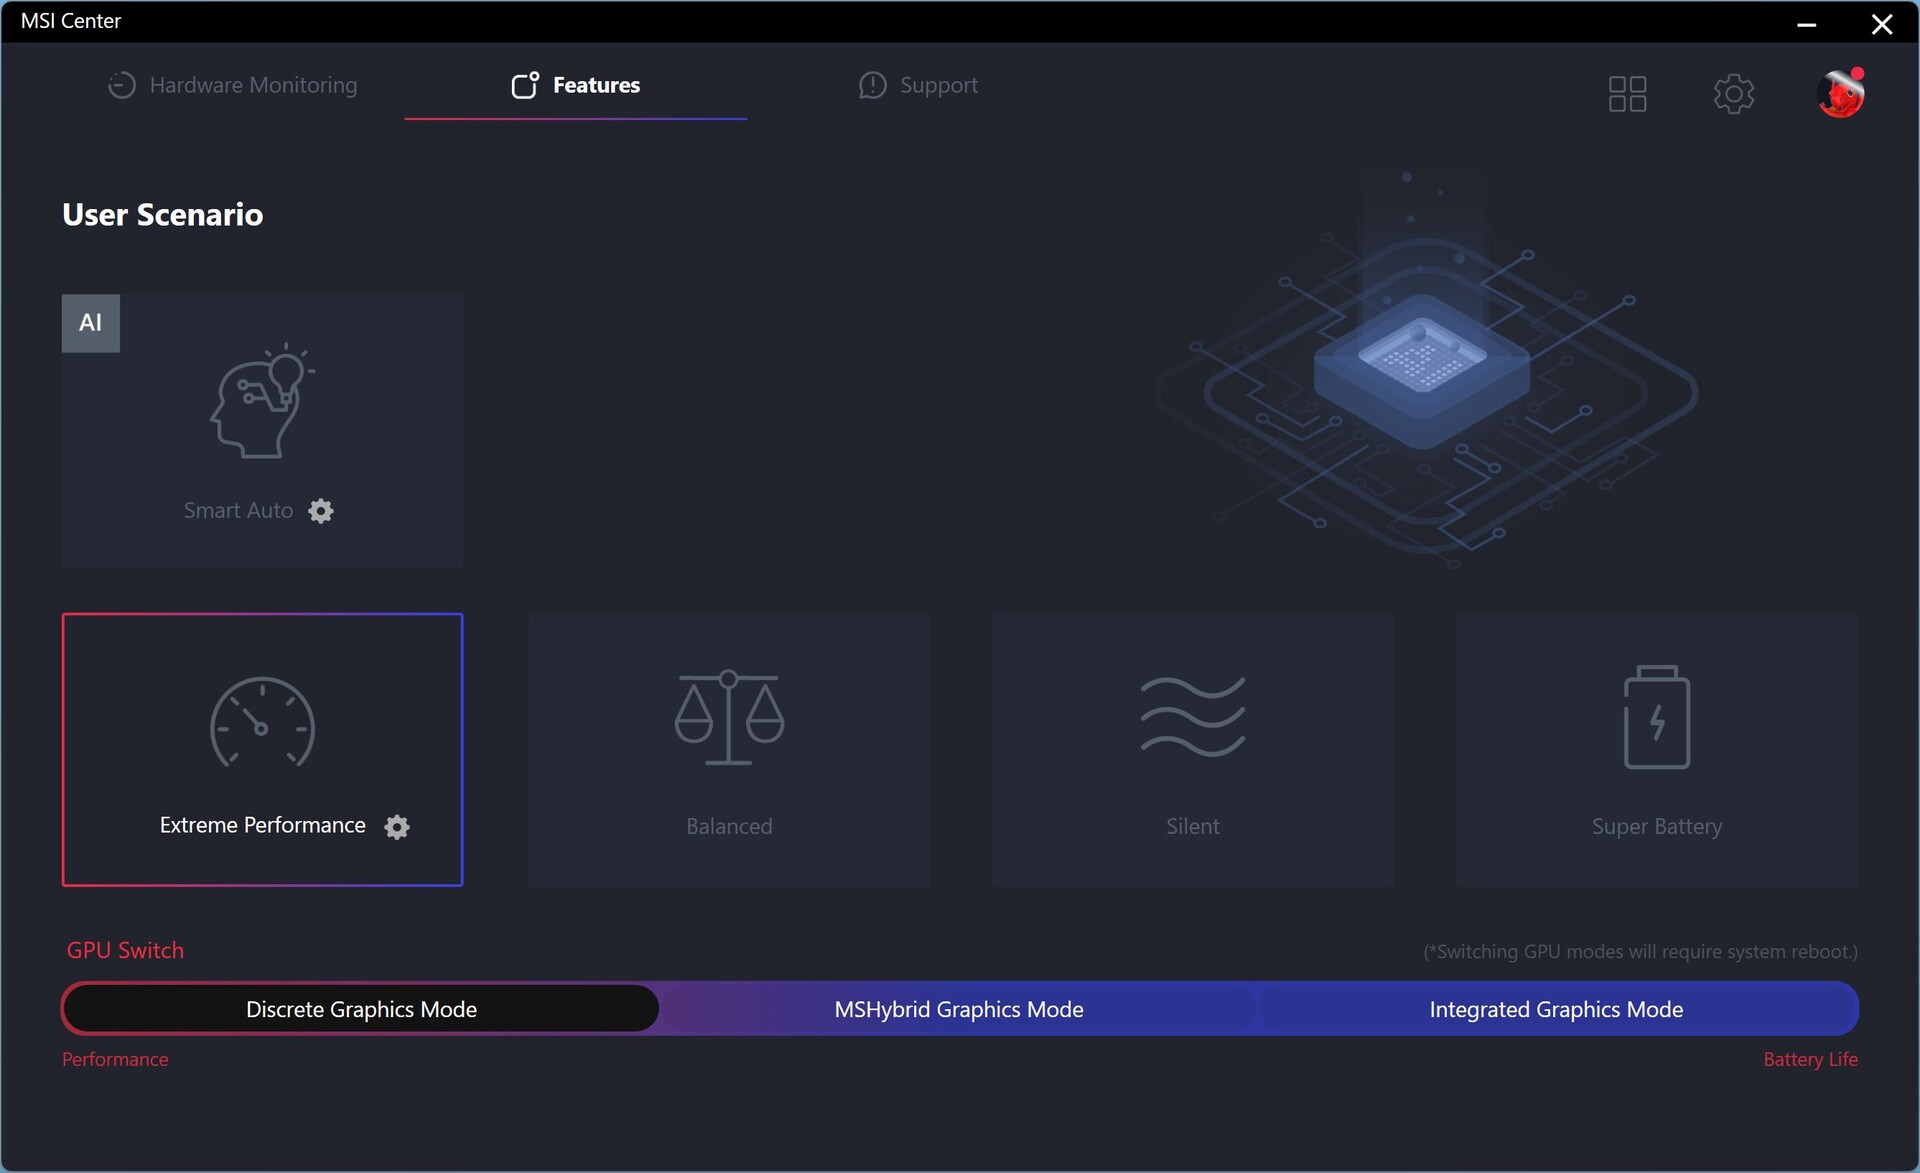
Nous avons utilisé le préréglage Extreme Performance avec le mode GPU discret (iGPU désactivé) pour nos benchmarks, mais nous avons utilisé l'iGPU pour les tests de batterie. Nous n'avons pas rencontré de problèmes sérieux avec le logiciel MSI, mais il y avait un bug avec le mode graphique discret où nous ne pouvions pas réduire la luminosité de l'écran. Nous espérons que ce problème sera corrigé sur les unités de détail.
Processeur - Core i9-13950HX
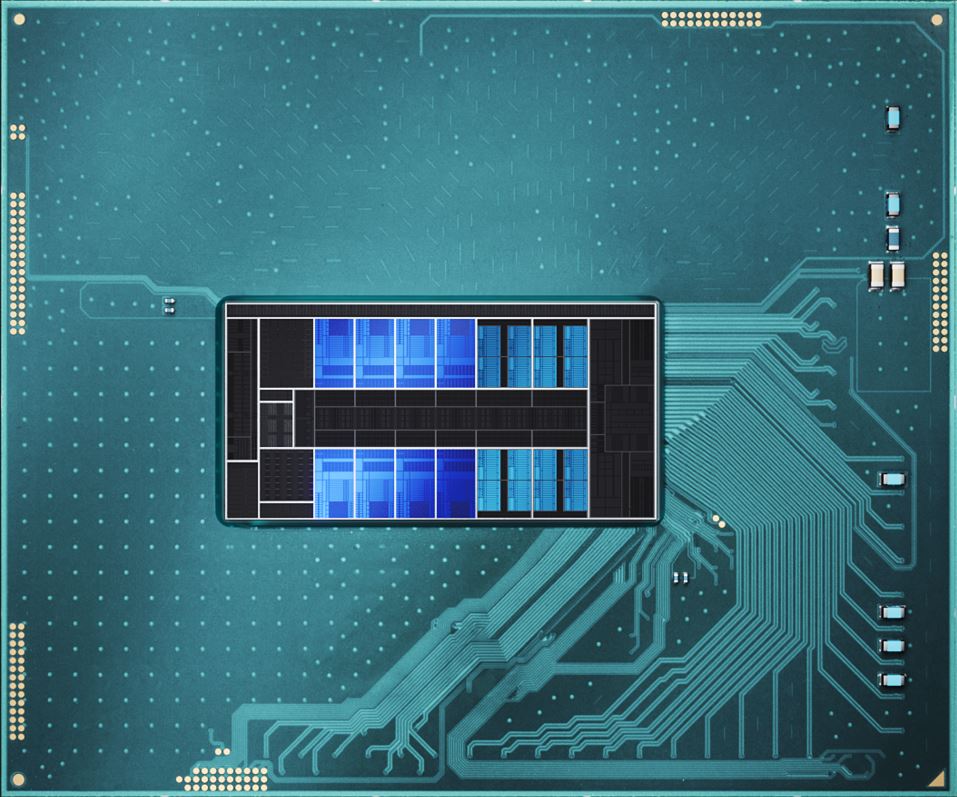
Contrairement aux processeurs mobiles Raptor Lake plus lentsintel a modifié la configuration des cœurs des puces haut de gamme de la série HX par rapport aux anciens processeurs Alder Lake. Les horloges sont plus élevées, mais il y a désormais aussi deux fois plus de cœurs d'efficacité (de 8 à 16), ce qui signifie que le processeur peut exécuter jusqu'à 32 threads simultanément (16 E-cores + 8 P-cores avec hyper threading).
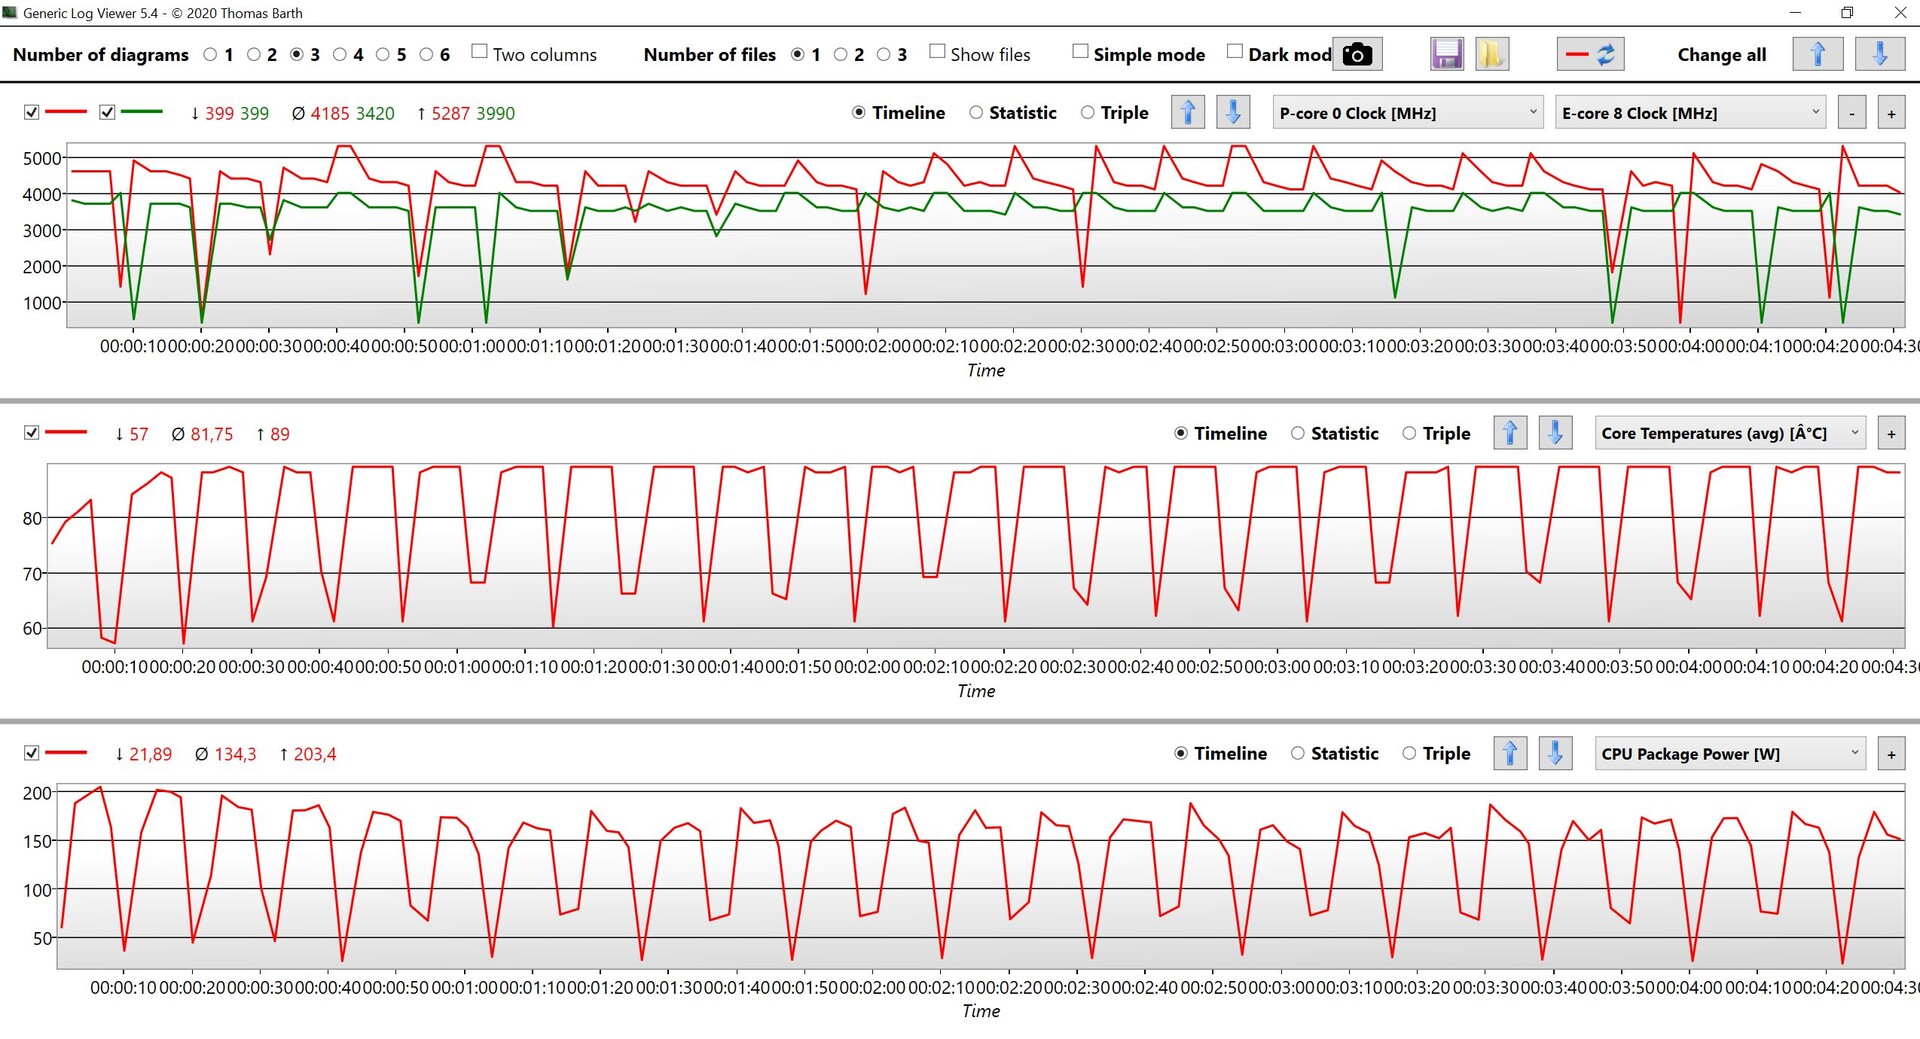
Les performances du nouveauCore i9-13950HXdans le MSI Titan GT77 sont excellentes grâce à des limites de puissance généreuses. Les performances fluctuent un peu, mais nous pouvons observer une consommation de plus de 200W au début des benchmarks avant que la puce ne se stabilise autour de 150W. Le saut de performance par rapport à l'ancienTitan GT77avec leCore i9-12900HXest de 22 % dans tous les benchmarks CPU et le Core i9-13950HX dans la nouvelleRazer Blade 16est également battu de 14 %.
Comme prévu, nous constatons les plus grandes améliorations dans les tests multicœurs, où l'on remarque simplement le nombre plus élevé de cœurs. Par exemple : La nouvelle GT77 est 45 % plus rapide que l'ancienne GT77 avec le Core i9-12900HX dans Cinebench R23 Multi. L'avantage par rapport aux autres processeurs Raptor Lake HX montre également qu'il s'agit d'une mise en œuvre très rapide. Le nouveau modèle est également plus rapide dans les tests à un seul cœur, mais l'avantage est beaucoup plus faible, à 6-10 %.
Les performances du CPU sont bloquées à 25W sur batterie, même dans le mode de performance le plus rapide, ce qui entraîne un déficit de performance de plus de 70 % dans les scénarios multicœurs. Des benchmarks supplémentaires sur le CPU sont listés dans notre section technique.
Cinebench R15 Multi Dauertest
Cinebench R23: Multi Core | Single Core
Cinebench R20: CPU (Multi Core) | CPU (Single Core)
Cinebench R15: CPU Multi 64Bit | CPU Single 64Bit
Blender: v2.79 BMW27 CPU
7-Zip 18.03: 7z b 4 | 7z b 4 -mmt1
Geekbench 5.5: Multi-Core | Single-Core
HWBOT x265 Benchmark v2.2: 4k Preset
LibreOffice : 20 Documents To PDF
R Benchmark 2.5: Overall mean
| CPU Performance rating | |
| MSI Titan GT77 HX 13VI | |
| Schenker XMG Neo 16 Raptor Lake | |
| Moyenne Intel Core i9-13950HX | |
| Razer Blade 16 Early 2023 | |
| Moyenne de la classe Gaming | |
| MSI Titan GT77 12UHS | |
| Asus ROG Strix Scar 17 SE G733CX-LL014W | |
| Alienware x17 R2 P48E | |
| Schenker XMG Neo 17 M22 | |
| Cinebench R23 / Multi Core | |
| MSI Titan GT77 HX 13VI | |
| Moyenne Intel Core i9-13950HX (24560 - 33277, n=7) | |
| Schenker XMG Neo 16 Raptor Lake | |
| Schenker XMG Neo 16 Raptor Lake | |
| Schenker XMG Neo 16 Raptor Lake | |
| Razer Blade 16 Early 2023 | |
| Moyenne de la classe Gaming (10488 - 40970, n=112, 2 dernières années) | |
| MSI Titan GT77 12UHS | |
| Asus ROG Strix Scar 17 SE G733CX-LL014W | |
| Alienware x17 R2 P48E | |
| Schenker XMG Neo 17 M22 | |
| Cinebench R23 / Single Core | |
| MSI Titan GT77 HX 13VI | |
| Moyenne Intel Core i9-13950HX (1952 - 2113, n=7) | |
| Schenker XMG Neo 16 Raptor Lake | |
| Razer Blade 16 Early 2023 | |
| Moyenne de la classe Gaming (1166 - 2356, n=112, 2 dernières années) | |
| MSI Titan GT77 12UHS | |
| Alienware x17 R2 P48E | |
| Asus ROG Strix Scar 17 SE G733CX-LL014W | |
| Schenker XMG Neo 17 M22 | |
| Cinebench R20 / CPU (Multi Core) | |
| MSI Titan GT77 HX 13VI | |
| Schenker XMG Neo 16 Raptor Lake | |
| Moyenne Intel Core i9-13950HX (8697 - 12648, n=7) | |
| Moyenne de la classe Gaming (4029 - 16108, n=111, 2 dernières années) | |
| Razer Blade 16 Early 2023 | |
| MSI Titan GT77 12UHS | |
| Asus ROG Strix Scar 17 SE G733CX-LL014W | |
| Alienware x17 R2 P48E | |
| Schenker XMG Neo 17 M22 | |
| Cinebench R20 / CPU (Single Core) | |
| MSI Titan GT77 HX 13VI | |
| Moyenne Intel Core i9-13950HX (742 - 816, n=7) | |
| Moyenne de la classe Gaming (442 - 895, n=111, 2 dernières années) | |
| Schenker XMG Neo 16 Raptor Lake | |
| Razer Blade 16 Early 2023 | |
| Asus ROG Strix Scar 17 SE G733CX-LL014W | |
| MSI Titan GT77 12UHS | |
| Alienware x17 R2 P48E | |
| Schenker XMG Neo 17 M22 | |
| Cinebench R15 / CPU Multi 64Bit | |
| MSI Titan GT77 HX 13VI | |
| Schenker XMG Neo 16 Raptor Lake | |
| Schenker XMG Neo 16 Raptor Lake | |
| Moyenne Intel Core i9-13950HX (3625 - 5227, n=7) | |
| Razer Blade 16 Early 2023 | |
| Moyenne de la classe Gaming (1578 - 6271, n=111, 2 dernières années) | |
| MSI Titan GT77 12UHS | |
| Asus ROG Strix Scar 17 SE G733CX-LL014W | |
| Alienware x17 R2 P48E | |
| Schenker XMG Neo 17 M22 | |
| Cinebench R15 / CPU Single 64Bit | |
| MSI Titan GT77 HX 13VI | |
| Schenker XMG Neo 16 Raptor Lake | |
| Schenker XMG Neo 16 Raptor Lake | |
| Moyenne de la classe Gaming (188.8 - 343, n=111, 2 dernières années) | |
| Moyenne Intel Core i9-13950HX (274 - 303, n=7) | |
| MSI Titan GT77 12UHS | |
| Asus ROG Strix Scar 17 SE G733CX-LL014W | |
| Razer Blade 16 Early 2023 | |
| Alienware x17 R2 P48E | |
| Schenker XMG Neo 17 M22 | |
| Blender / v2.79 BMW27 CPU | |
| Schenker XMG Neo 17 M22 | |
| Asus ROG Strix Scar 17 SE G733CX-LL014W | |
| Alienware x17 R2 P48E | |
| Moyenne de la classe Gaming (80 - 330, n=109, 2 dernières années) | |
| MSI Titan GT77 12UHS | |
| Razer Blade 16 Early 2023 | |
| Moyenne Intel Core i9-13950HX (100 - 137, n=7) | |
| Schenker XMG Neo 16 Raptor Lake | |
| MSI Titan GT77 HX 13VI | |
| 7-Zip 18.03 / 7z b 4 | |
| MSI Titan GT77 HX 13VI | |
| Schenker XMG Neo 16 Raptor Lake | |
| Moyenne Intel Core i9-13950HX (99351 - 127295, n=7) | |
| Razer Blade 16 Early 2023 | |
| Moyenne de la classe Gaming (33491 - 148086, n=110, 2 dernières années) | |
| MSI Titan GT77 12UHS | |
| Asus ROG Strix Scar 17 SE G733CX-LL014W | |
| Alienware x17 R2 P48E | |
| Schenker XMG Neo 17 M22 | |
| 7-Zip 18.03 / 7z b 4 -mmt1 | |
| MSI Titan GT77 HX 13VI | |
| Schenker XMG Neo 16 Raptor Lake | |
| Moyenne Intel Core i9-13950HX (6445 - 7064, n=7) | |
| Razer Blade 16 Early 2023 | |
| Moyenne de la classe Gaming (4199 - 7436, n=110, 2 dernières années) | |
| MSI Titan GT77 12UHS | |
| Asus ROG Strix Scar 17 SE G733CX-LL014W | |
| Schenker XMG Neo 17 M22 | |
| Alienware x17 R2 P48E | |
| Geekbench 5.5 / Multi-Core | |
| Schenker XMG Neo 16 Raptor Lake | |
| MSI Titan GT77 HX 13VI | |
| Moyenne Intel Core i9-13950HX (16776 - 21853, n=7) | |
| Razer Blade 16 Early 2023 | |
| Moyenne de la classe Gaming (6460 - 27010, n=110, 2 dernières années) | |
| MSI Titan GT77 12UHS | |
| Asus ROG Strix Scar 17 SE G733CX-LL014W | |
| Alienware x17 R2 P48E | |
| Schenker XMG Neo 17 M22 | |
| Geekbench 5.5 / Single-Core | |
| Moyenne de la classe Gaming (986 - 2474, n=110, 2 dernières années) | |
| MSI Titan GT77 HX 13VI | |
| Schenker XMG Neo 16 Raptor Lake | |
| Moyenne Intel Core i9-13950HX (1805 - 2097, n=7) | |
| MSI Titan GT77 12UHS | |
| Alienware x17 R2 P48E | |
| Asus ROG Strix Scar 17 SE G733CX-LL014W | |
| Razer Blade 16 Early 2023 | |
| Schenker XMG Neo 17 M22 | |
| HWBOT x265 Benchmark v2.2 / 4k Preset | |
| MSI Titan GT77 HX 13VI | |
| Schenker XMG Neo 16 Raptor Lake | |
| Moyenne Intel Core i9-13950HX (26 - 34.5, n=7) | |
| Razer Blade 16 Early 2023 | |
| Moyenne de la classe Gaming (11.5 - 44.3, n=110, 2 dernières années) | |
| MSI Titan GT77 12UHS | |
| Asus ROG Strix Scar 17 SE G733CX-LL014W | |
| Alienware x17 R2 P48E | |
| Schenker XMG Neo 17 M22 | |
| LibreOffice / 20 Documents To PDF | |
| Schenker XMG Neo 17 M22 | |
| Moyenne de la classe Gaming (19 - 88.8, n=110, 2 dernières années) | |
| Razer Blade 16 Early 2023 | |
| MSI Titan GT77 HX 13VI | |
| Schenker XMG Neo 16 Raptor Lake | |
| Moyenne Intel Core i9-13950HX (32.8 - 52.1, n=7) | |
| Alienware x17 R2 P48E | |
| MSI Titan GT77 12UHS | |
| Asus ROG Strix Scar 17 SE G733CX-LL014W | |
| R Benchmark 2.5 / Overall mean | |
| Schenker XMG Neo 17 M22 | |
| Alienware x17 R2 P48E | |
| Moyenne de la classe Gaming (0.3439 - 0.759, n=111, 2 dernières années) | |
| Asus ROG Strix Scar 17 SE G733CX-LL014W | |
| MSI Titan GT77 12UHS | |
| Razer Blade 16 Early 2023 | |
| MSI Titan GT77 HX 13VI | |
| Moyenne Intel Core i9-13950HX (0.3823 - 0.4121, n=7) | |
| Schenker XMG Neo 16 Raptor Lake | |
* ... Moindre est la valeur, meilleures sont les performances
AIDA64: FP32 Ray-Trace | FPU Julia | CPU SHA3 | CPU Queen | FPU SinJulia | FPU Mandel | CPU AES | CPU ZLib | FP64 Ray-Trace | CPU PhotoWorxx
| Performance rating | |
| MSI Titan GT77 HX 13VI | |
| Schenker XMG Neo 16 Raptor Lake | |
| Moyenne de la classe Gaming | |
| Moyenne Intel Core i9-13950HX | |
| Razer Blade 16 Early 2023 | |
| MSI Titan GT77 12UHS | |
| Asus ROG Strix Scar 17 SE G733CX-LL014W | |
| Schenker XMG Neo 17 M22 | |
| Alienware x17 R2 P48E | |
| AIDA64 / FP32 Ray-Trace | |
| Moyenne de la classe Gaming (10227 - 85542, n=109, 2 dernières années) | |
| MSI Titan GT77 HX 13VI | |
| Schenker XMG Neo 16 Raptor Lake | |
| Razer Blade 16 Early 2023 | |
| Razer Blade 16 Early 2023 | |
| Razer Blade 16 Early 2023 | |
| Moyenne Intel Core i9-13950HX (17993 - 28957, n=9) | |
| MSI Titan GT77 12UHS | |
| Asus ROG Strix Scar 17 SE G733CX-LL014W | |
| Schenker XMG Neo 17 M22 | |
| Alienware x17 R2 P48E | |
| AIDA64 / FPU Julia | |
| MSI Titan GT77 HX 13VI | |
| Moyenne de la classe Gaming (51376 - 238426, n=109, 2 dernières années) | |
| Schenker XMG Neo 16 Raptor Lake | |
| Razer Blade 16 Early 2023 | |
| Razer Blade 16 Early 2023 | |
| Razer Blade 16 Early 2023 | |
| Moyenne Intel Core i9-13950HX (89362 - 144303, n=9) | |
| MSI Titan GT77 12UHS | |
| Schenker XMG Neo 17 M22 | |
| Asus ROG Strix Scar 17 SE G733CX-LL014W | |
| Alienware x17 R2 P48E | |
| AIDA64 / CPU SHA3 | |
| MSI Titan GT77 HX 13VI | |
| Schenker XMG Neo 16 Raptor Lake | |
| Razer Blade 16 Early 2023 | |
| Razer Blade 16 Early 2023 | |
| Razer Blade 16 Early 2023 | |
| Moyenne de la classe Gaming (2180 - 9817, n=109, 2 dernières années) | |
| Moyenne Intel Core i9-13950HX (4518 - 7093, n=9) | |
| MSI Titan GT77 12UHS | |
| Asus ROG Strix Scar 17 SE G733CX-LL014W | |
| Alienware x17 R2 P48E | |
| Schenker XMG Neo 17 M22 | |
| AIDA64 / CPU Queen | |
| MSI Titan GT77 HX 13VI | |
| Schenker XMG Neo 16 Raptor Lake | |
| Moyenne Intel Core i9-13950HX (131931 - 140103, n=8) | |
| Razer Blade 16 Early 2023 | |
| Razer Blade 16 Early 2023 | |
| Moyenne de la classe Gaming (49785 - 173351, n=100, 2 dernières années) | |
| Alienware x17 R2 P48E | |
| Asus ROG Strix Scar 17 SE G733CX-LL014W | |
| MSI Titan GT77 12UHS | |
| Schenker XMG Neo 17 M22 | |
| AIDA64 / FPU SinJulia | |
| MSI Titan GT77 HX 13VI | |
| Schenker XMG Neo 16 Raptor Lake | |
| Razer Blade 16 Early 2023 | |
| Razer Blade 16 Early 2023 | |
| Razer Blade 16 Early 2023 | |
| Moyenne Intel Core i9-13950HX (12318 - 17057, n=9) | |
| Moyenne de la classe Gaming (4424 - 33636, n=109, 2 dernières années) | |
| MSI Titan GT77 12UHS | |
| Schenker XMG Neo 17 M22 | |
| Asus ROG Strix Scar 17 SE G733CX-LL014W | |
| Alienware x17 R2 P48E | |
| AIDA64 / FPU Mandel | |
| MSI Titan GT77 HX 13VI | |
| Moyenne de la classe Gaming (25115 - 128721, n=109, 2 dernières années) | |
| Schenker XMG Neo 16 Raptor Lake | |
| Razer Blade 16 Early 2023 | |
| Razer Blade 16 Early 2023 | |
| Razer Blade 16 Early 2023 | |
| Moyenne Intel Core i9-13950HX (44372 - 71038, n=9) | |
| Schenker XMG Neo 17 M22 | |
| MSI Titan GT77 12UHS | |
| Asus ROG Strix Scar 17 SE G733CX-LL014W | |
| Alienware x17 R2 P48E | |
| AIDA64 / CPU AES | |
| MSI Titan GT77 12UHS | |
| Asus ROG Strix Scar 17 SE G733CX-LL014W | |
| Razer Blade 16 Early 2023 | |
| Razer Blade 16 Early 2023 | |
| Razer Blade 16 Early 2023 | |
| Moyenne Intel Core i9-13950HX (99981 - 204491, n=9) | |
| MSI Titan GT77 HX 13VI | |
| Schenker XMG Neo 17 M22 | |
| Schenker XMG Neo 16 Raptor Lake | |
| Alienware x17 R2 P48E | |
| Moyenne de la classe Gaming (39258 - 247074, n=109, 2 dernières années) | |
| AIDA64 / CPU ZLib | |
| MSI Titan GT77 HX 13VI | |
| Schenker XMG Neo 16 Raptor Lake | |
| Razer Blade 16 Early 2023 | |
| Razer Blade 16 Early 2023 | |
| Razer Blade 16 Early 2023 | |
| Moyenne Intel Core i9-13950HX (1263 - 2069, n=9) | |
| Moyenne de la classe Gaming (574 - 2531, n=109, 2 dernières années) | |
| MSI Titan GT77 12UHS | |
| Asus ROG Strix Scar 17 SE G733CX-LL014W | |
| Alienware x17 R2 P48E | |
| Schenker XMG Neo 17 M22 | |
| AIDA64 / FP64 Ray-Trace | |
| Moyenne de la classe Gaming (5509 - 45446, n=109, 2 dernières années) | |
| MSI Titan GT77 HX 13VI | |
| Schenker XMG Neo 16 Raptor Lake | |
| Razer Blade 16 Early 2023 | |
| Razer Blade 16 Early 2023 | |
| Razer Blade 16 Early 2023 | |
| Moyenne Intel Core i9-13950HX (9649 - 15573, n=9) | |
| MSI Titan GT77 12UHS | |
| Asus ROG Strix Scar 17 SE G733CX-LL014W | |
| Schenker XMG Neo 17 M22 | |
| Alienware x17 R2 P48E | |
| AIDA64 / CPU PhotoWorxx | |
| Razer Blade 16 Early 2023 | |
| Razer Blade 16 Early 2023 | |
| Razer Blade 16 Early 2023 | |
| Moyenne Intel Core i9-13950HX (40233 - 50864, n=9) | |
| Schenker XMG Neo 16 Raptor Lake | |
| Moyenne de la classe Gaming (12271 - 89891, n=109, 2 dernières années) | |
| Asus ROG Strix Scar 17 SE G733CX-LL014W | |
| MSI Titan GT77 12UHS | |
| MSI Titan GT77 HX 13VI | |
| Alienware x17 R2 P48E | |
| Schenker XMG Neo 17 M22 | |
Performance du système
Les performances subjectives de la GT77 sont excellentes et les résultats des benchmarks synthétiques sont également très bons, mais ce n'est guère surprenant compte tenu de la puissance du matériel. Les rivaux sont également très rapides et vous remarquerez une grande différence entre les systèmes.
CrossMark: Overall | Productivity | Creativity | Responsiveness
| PCMark 10 / Score | |
| MSI Titan GT77 HX 13VI | |
| Moyenne de la classe Gaming (5828 - 11574, n=95, 2 dernières années) | |
| Moyenne Intel Core i9-13950HX, NVIDIA GeForce RTX 4090 Laptop GPU (7597 - 8884, n=2) | |
| MSI Titan GT77 12UHS | |
| Alienware x17 R2 P48E | |
| Razer Blade 16 Early 2023 | |
| Asus ROG Strix Scar 17 SE G733CX-LL014W | |
| Schenker XMG Neo 17 M22 | |
| PCMark 10 / Essentials | |
| MSI Titan GT77 HX 13VI | |
| Moyenne Intel Core i9-13950HX, NVIDIA GeForce RTX 4090 Laptop GPU (10903 - 11761, n=2) | |
| Alienware x17 R2 P48E | |
| MSI Titan GT77 12UHS | |
| Razer Blade 16 Early 2023 | |
| Moyenne de la classe Gaming (8810 - 12600, n=99, 2 dernières années) | |
| Asus ROG Strix Scar 17 SE G733CX-LL014W | |
| Schenker XMG Neo 17 M22 | |
| PCMark 10 / Productivity | |
| Moyenne de la classe Gaming (6845 - 18766, n=97, 2 dernières années) | |
| MSI Titan GT77 12UHS | |
| Alienware x17 R2 P48E | |
| Asus ROG Strix Scar 17 SE G733CX-LL014W | |
| MSI Titan GT77 HX 13VI | |
| Schenker XMG Neo 17 M22 | |
| Moyenne Intel Core i9-13950HX, NVIDIA GeForce RTX 4090 Laptop GPU (8330 - 9851, n=2) | |
| Razer Blade 16 Early 2023 | |
| PCMark 10 / Digital Content Creation | |
| MSI Titan GT77 HX 13VI | |
| Moyenne Intel Core i9-13950HX, NVIDIA GeForce RTX 4090 Laptop GPU (13099 - 16424, n=2) | |
| Razer Blade 16 Early 2023 | |
| Moyenne de la classe Gaming (7602 - 19657, n=97, 2 dernières années) | |
| MSI Titan GT77 12UHS | |
| Alienware x17 R2 P48E | |
| Asus ROG Strix Scar 17 SE G733CX-LL014W | |
| Schenker XMG Neo 17 M22 | |
| CrossMark / Overall | |
| MSI Titan GT77 HX 13VI | |
| Asus ROG Strix Scar 17 SE G733CX-LL014W | |
| MSI Titan GT77 12UHS | |
| Moyenne Intel Core i9-13950HX, NVIDIA GeForce RTX 4090 Laptop GPU (2019 - 2139, n=2) | |
| Schenker XMG Neo 16 Raptor Lake | |
| Moyenne de la classe Gaming (1366 - 2409, n=97, 2 dernières années) | |
| Alienware x17 R2 P48E | |
| Schenker XMG Neo 17 M22 | |
| Razer Blade 16 Early 2023 | |
| CrossMark / Productivity | |
| MSI Titan GT77 12UHS | |
| MSI Titan GT77 HX 13VI | |
| Asus ROG Strix Scar 17 SE G733CX-LL014W | |
| Moyenne Intel Core i9-13950HX, NVIDIA GeForce RTX 4090 Laptop GPU (1909 - 1977, n=2) | |
| Moyenne de la classe Gaming (1386 - 2254, n=97, 2 dernières années) | |
| Schenker XMG Neo 16 Raptor Lake | |
| Alienware x17 R2 P48E | |
| Schenker XMG Neo 17 M22 | |
| Razer Blade 16 Early 2023 | |
| CrossMark / Creativity | |
| MSI Titan GT77 HX 13VI | |
| Schenker XMG Neo 16 Raptor Lake | |
| Asus ROG Strix Scar 17 SE G733CX-LL014W | |
| Moyenne Intel Core i9-13950HX, NVIDIA GeForce RTX 4090 Laptop GPU (2222 - 2423, n=2) | |
| MSI Titan GT77 12UHS | |
| Moyenne de la classe Gaming (1343 - 2729, n=97, 2 dernières années) | |
| Alienware x17 R2 P48E | |
| Schenker XMG Neo 17 M22 | |
| Razer Blade 16 Early 2023 | |
| CrossMark / Responsiveness | |
| MSI Titan GT77 12UHS | |
| Asus ROG Strix Scar 17 SE G733CX-LL014W | |
| MSI Titan GT77 HX 13VI | |
| Moyenne Intel Core i9-13950HX, NVIDIA GeForce RTX 4090 Laptop GPU (1792 - 1861, n=2) | |
| Moyenne de la classe Gaming (1226 - 2334, n=97, 2 dernières années) | |
| Alienware x17 R2 P48E | |
| Schenker XMG Neo 16 Raptor Lake | |
| Schenker XMG Neo 17 M22 | |
| Razer Blade 16 Early 2023 | |
| PCMark 10 Score | 8884 points | |
Aide | ||
| AIDA64 / Memory Copy | |
| Razer Blade 16 Early 2023 | |
| Razer Blade 16 Early 2023 | |
| Razer Blade 16 Early 2023 | |
| Moyenne Intel Core i9-13950HX (61938 - 78813, n=9) | |
| Moyenne de la classe Gaming (21750 - 129946, n=109, 2 dernières années) | |
| Schenker XMG Neo 16 Raptor Lake | |
| MSI Titan GT77 12UHS | |
| MSI Titan GT77 HX 13VI | |
| Asus ROG Strix Scar 17 SE G733CX-LL014W | |
| Alienware x17 R2 P48E | |
| Schenker XMG Neo 17 M22 | |
| AIDA64 / Memory Read | |
| Razer Blade 16 Early 2023 | |
| Razer Blade 16 Early 2023 | |
| Razer Blade 16 Early 2023 | |
| Moyenne Intel Core i9-13950HX (62368 - 86831, n=9) | |
| Schenker XMG Neo 16 Raptor Lake | |
| Moyenne de la classe Gaming (22956 - 118858, n=109, 2 dernières années) | |
| Asus ROG Strix Scar 17 SE G733CX-LL014W | |
| MSI Titan GT77 HX 13VI | |
| MSI Titan GT77 12UHS | |
| Alienware x17 R2 P48E | |
| Schenker XMG Neo 17 M22 | |
| AIDA64 / Memory Write | |
| Razer Blade 16 Early 2023 | |
| Razer Blade 16 Early 2023 | |
| Razer Blade 16 Early 2023 | |
| Moyenne de la classe Gaming (22297 - 135096, n=109, 2 dernières années) | |
| Moyenne Intel Core i9-13950HX (59501 - 80441, n=9) | |
| Schenker XMG Neo 16 Raptor Lake | |
| Asus ROG Strix Scar 17 SE G733CX-LL014W | |
| MSI Titan GT77 HX 13VI | |
| MSI Titan GT77 12UHS | |
| Schenker XMG Neo 17 M22 | |
| Alienware x17 R2 P48E | |
| AIDA64 / Memory Latency | |
| Moyenne de la classe Gaming (75.3 - 259, n=109, 2 dernières années) | |
| Razer Blade 16 Early 2023 | |
| Razer Blade 16 Early 2023 | |
| Razer Blade 16 Early 2023 | |
| Alienware x17 R2 P48E | |
| MSI Titan GT77 HX 13VI | |
| Schenker XMG Neo 17 M22 | |
| Schenker XMG Neo 16 Raptor Lake | |
| Moyenne Intel Core i9-13950HX (84.4 - 99.5, n=9) | |
| MSI Titan GT77 12UHS | |
| Asus ROG Strix Scar 17 SE G733CX-LL014W | |
* ... Moindre est la valeur, meilleures sont les performances
Latence DPC
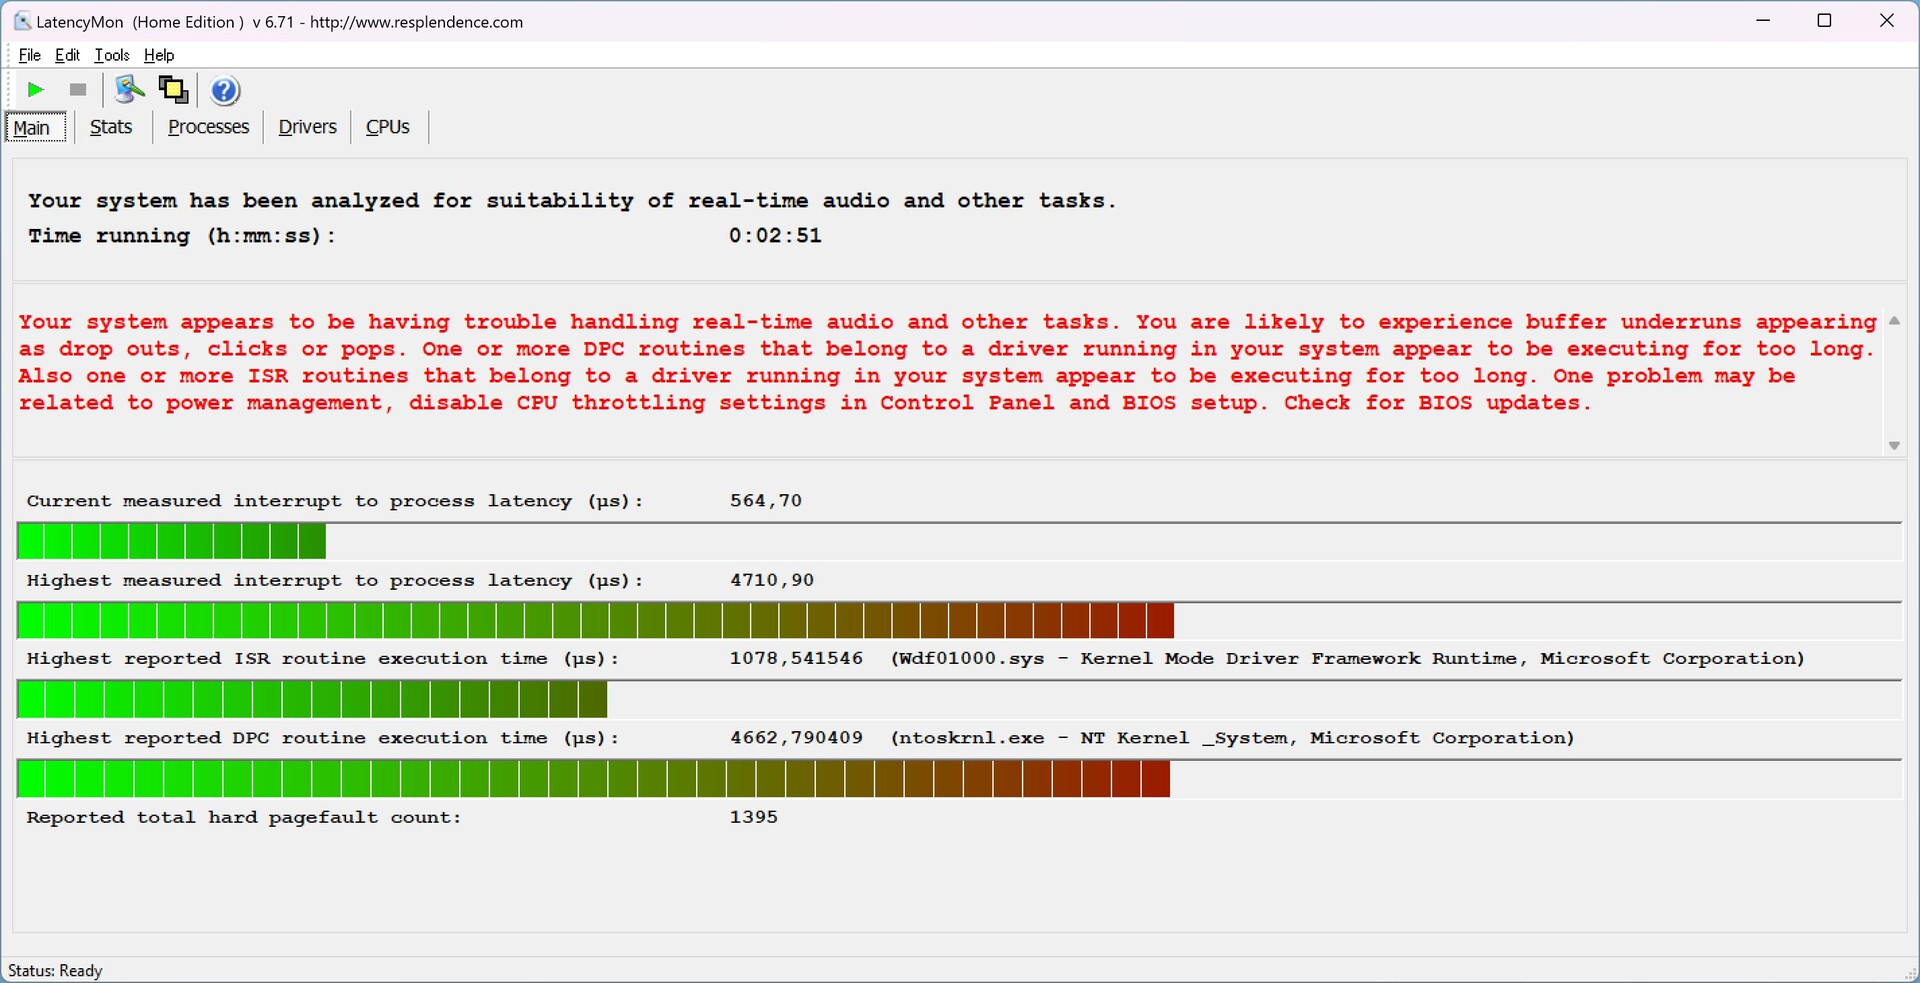
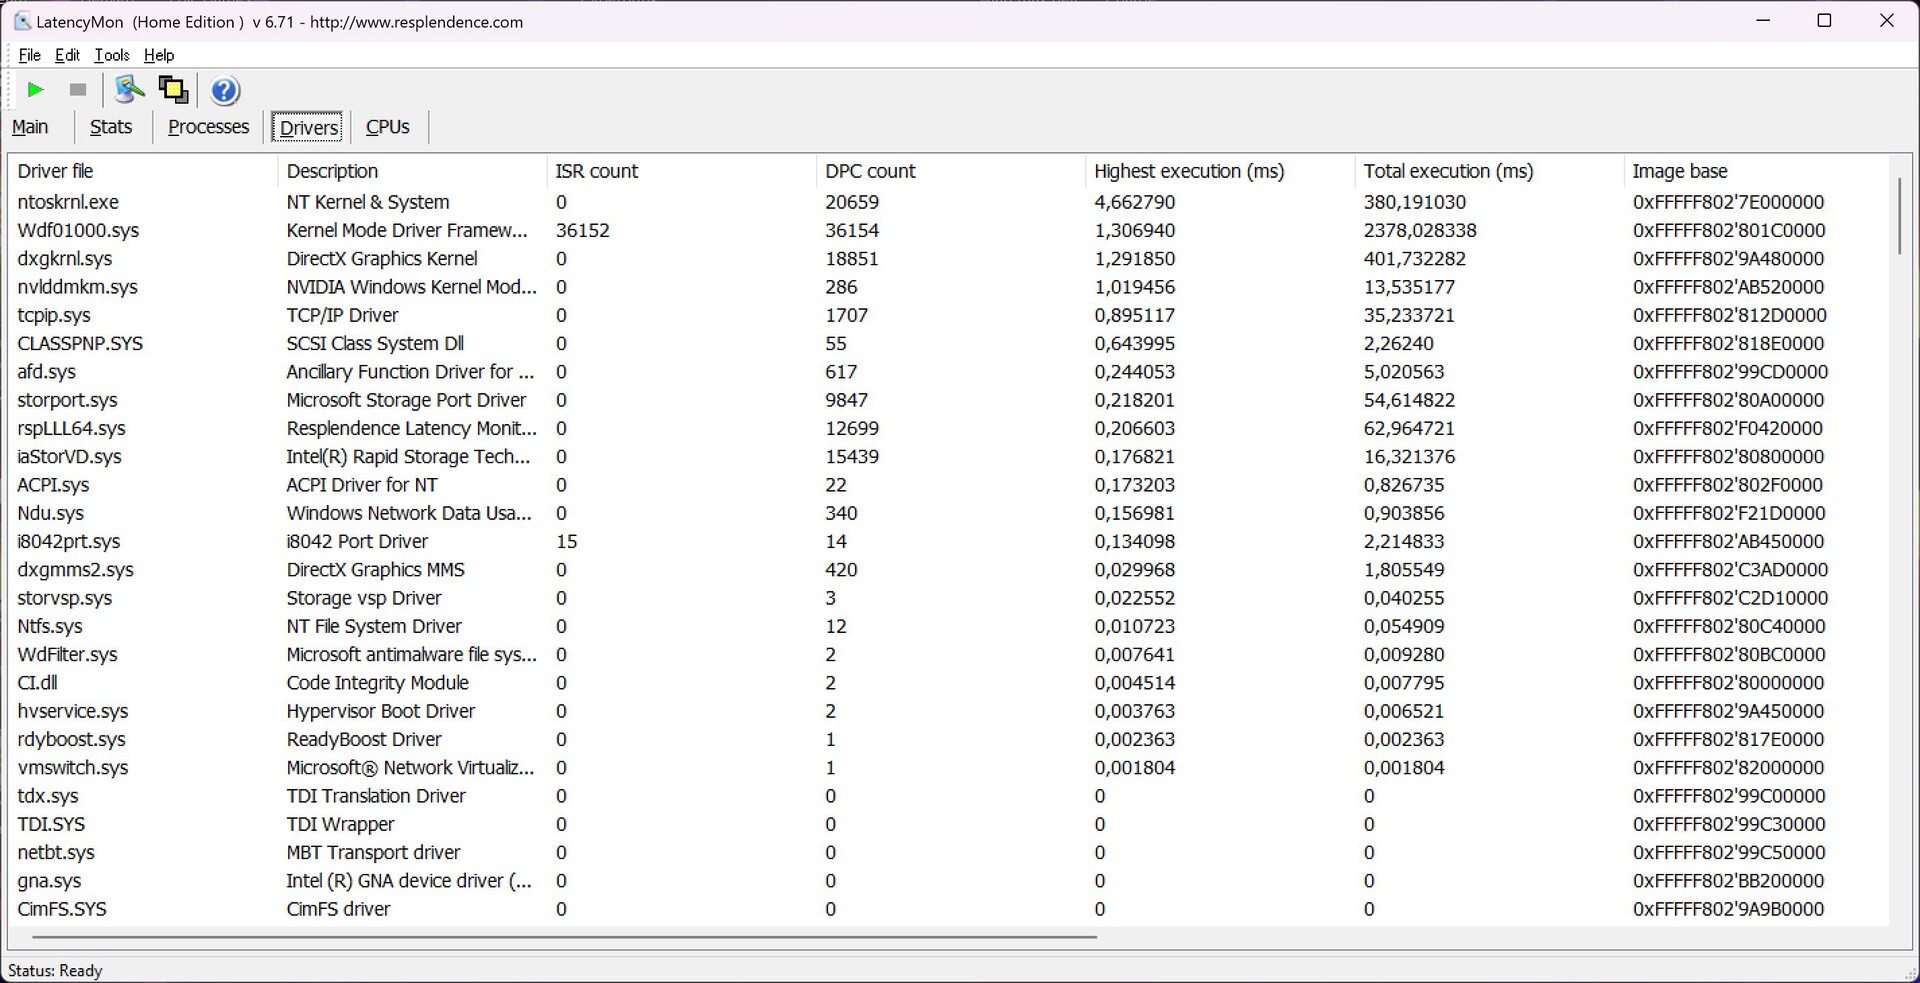
Notre test de latence standardisé (navigation web, lecture YouTube 4K, charge CPU) montre des limitations majeures pour les applications audio en temps réel avec la version actuelle du BIOS (1.04).
| DPC Latencies / LatencyMon - interrupt to process latency (max), Web, Youtube, Prime95 | |
| MSI Titan GT77 HX 13VI | |
| Schenker XMG Neo 17 M22 | |
| Asus ROG Strix Scar 17 SE G733CX-LL014W | |
| Razer Blade 16 Early 2023 | |
| MSI Titan GT77 12UHS | |
| MSI Titan GT77 12UHS | |
| Alienware x17 R2 P48E | |
* ... Moindre est la valeur, meilleures sont les performances
Périphériques de stockage
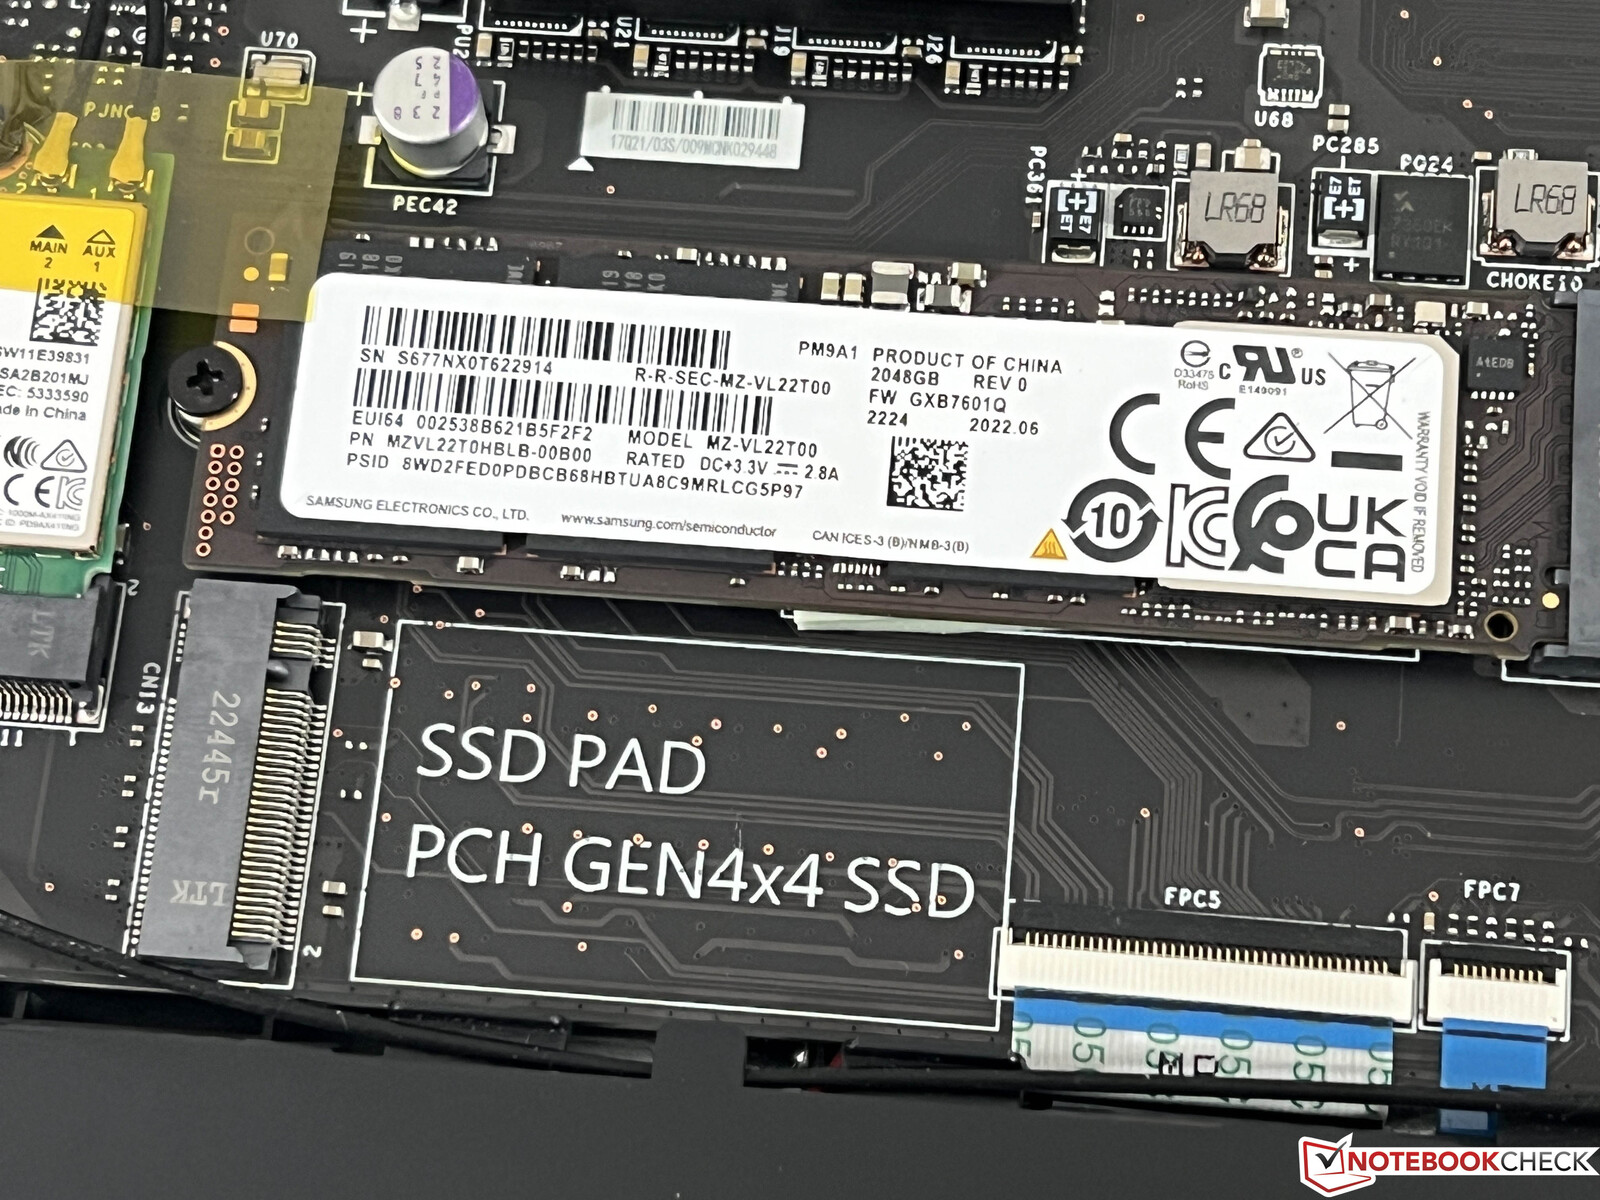
Le Titan 2023 est l'un des premiers ordinateurs portables dotés d'une interface PCIe 5.0 rapide, mais il n'existe pas encore de SSD adaptés sur le marché. Les deux autres emplacements supportent PCIe 4.0 et notre unité de test est équipée de deux SSD de 2 To de Samsung (PM9A1, version OEM du 980 Pro) dans une configuration RAID 0. Outre la capacité de 4 To (dont 3,97 sont libres pour l'utilisateur), nous pouvons également enregistrer des taux de transfert supérieurs à 11 Go/s. Cependant, ces performances ne peuvent être maintenues très longtemps et chutent considérablement après quelques minutes, de sorte qu'un refroidisseur SSD aurait pu être une bonne idée. D'autres benchmarks SSD sont disponibles ici.

* ... Moindre est la valeur, meilleures sont les performances
Disk Throttling: DiskSpd Read Loop, Queue Depth 8
Performances du GPU - Ordinateur portable RTX 4090
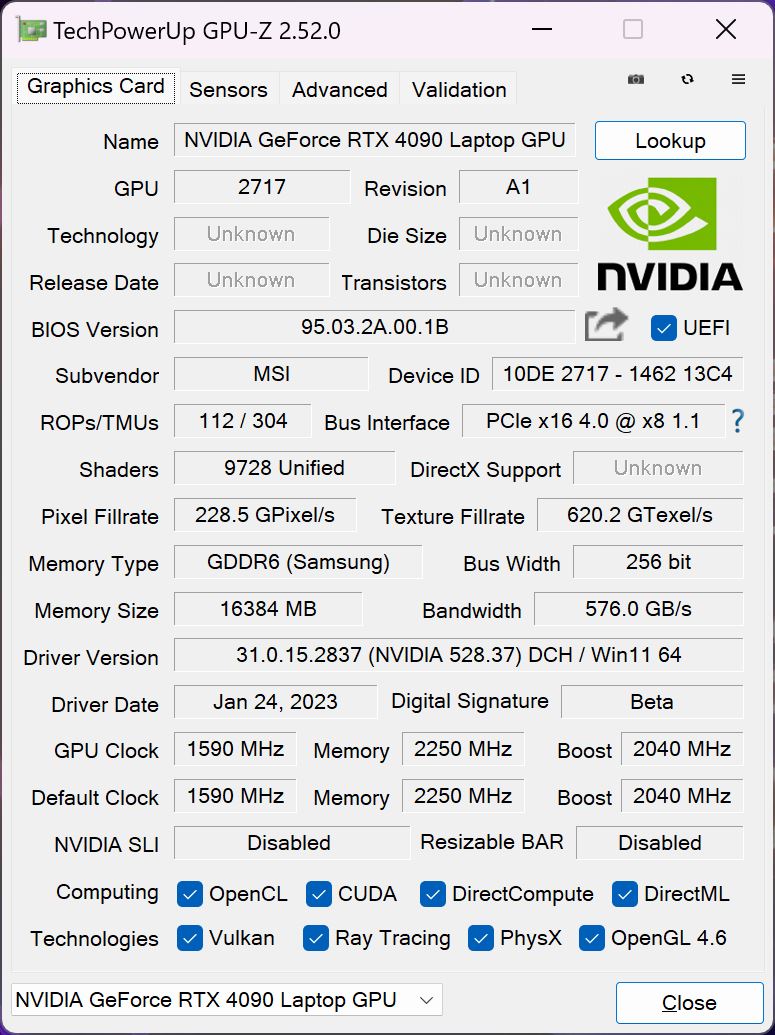
Le siteGeForce RTX 4090est le nouveau GPU mobile haut de gamme de Nvidia et la GT77 utilise la version la plus rapide avec une consommation maximale de 175W (150W TGP + 25W Dynamic Boost du CPU), 16 GB VRAM et une horloge centrale maximale de 2340 MHz.
Les performances graphiques sont excellentes et la nouvelle RTX 4090 se situe entre les modèles de bureau.RTX 3090/RTX 3090 Tiet les modèles de bureauRTX 4070 TietRTX 4080dans les benchmarks synthétiques. L'avantage sur l'ancien modèle mobileRTX 3080 Tidans la précédenteGT77est de 40-60 % (selon le benchmark) malgré le même TGP. Le siterTX 4080 mobiledans laRazer Blade 16est environ 17-19 % plus lente selon le benchmark.
La nouvelle Titan peut maintenir ses performances graphiques et le test de stress 3dMark Time Spy est facilement réussi à 99 %. La consommation d'énergie est toutefois limitée à 27 W sur batterie, ce qui entraîne un déficit de performances de près de 80 %.
Geekbench 5.5: OpenCL Score
GFXBench: 3840x2160 4K Aztec Ruins High Tier Offscreen | 2560x1440 Aztec Ruins High Tier Offscreen
| 3DMark / Wild Life Extreme Unlimited | |
| NVIDIA GeForce RTX 3090 Ti | |
| NVIDIA GeForce RTX 4090 Laptop GPU | |
| Moyenne NVIDIA GeForce RTX 4090 Laptop GPU (34246 - 44948, n=7) | |
| Moyenne de la classe Gaming (22281 - 47946, n=17, 2 dernières années) | |
| NVIDIA GeForce RTX 3080 Ti Laptop GPU | |
| NVIDIA GeForce RTX 3080 Ti Laptop GPU | |
| NVIDIA GeForce RTX 3080 Ti Laptop GPU | |
| Apple M2 Max 38-Core GPU | |
| NVIDIA GeForce RTX 3080 Ti Laptop GPU | |
| 3DMark / Speed Way Score | |
| NVIDIA GeForce RTX 4080 | |
| NVIDIA GeForce RTX 4090 Laptop GPU | |
| NVIDIA GeForce RTX 4090 Laptop GPU | |
| Moyenne NVIDIA GeForce RTX 4090 Laptop GPU (4401 - 5940, n=27) | |
| NVIDIA GeForce RTX 4070 Ti | |
| NVIDIA GeForce RTX 3080 Ti | |
| NVIDIA GeForce RTX 3090 | |
| Moyenne de la classe Gaming (1577 - 6643, n=44, 2 dernières années) | |
| NVIDIA GeForce RTX 4080 Laptop GPU | |
| NVIDIA GeForce RTX 3080 Ti Laptop GPU | |
| GFXBench / 4K Aztec Ruins High Tier Offscreen | |
| Moyenne NVIDIA GeForce RTX 4090 Laptop GPU (239 - 246, n=3) | |
| NVIDIA GeForce RTX 4090 Laptop GPU | |
| NVIDIA GeForce RTX 4080 Laptop GPU | |
| Apple M2 Max 38-Core GPU | |
| Moyenne de la classe Gaming (100.4 - 243, n=6, 2 dernières années) | |
| GFXBench / Aztec Ruins High Tier Offscreen | |
| Moyenne NVIDIA GeForce RTX 4090 Laptop GPU (518 - 550, n=3) | |
| NVIDIA GeForce RTX 4090 Laptop GPU | |
| NVIDIA GeForce RTX 4080 Laptop GPU | |
| Apple M2 Max 38-Core GPU | |
| Moyenne de la classe Gaming (232 - 507, n=6, 2 dernières années) | |
| 3DMark 06 Standard Score | 67927 points | |
| 3DMark Vantage P Result | 113387 points | |
| 3DMark 11 Performance | 49253 points | |
| 3DMark Fire Strike Score | 37594 points | |
| 3DMark Fire Strike Extreme Score | 25475 points | |
| 3DMark Time Spy Score | 20862 points | |
Aide | ||
Photoshop PugetBench: Filter Score | General Score | GPU Score | Overall Score
Premiere Pro PugetBench: GPU 0.9 | Live Playback 0.9 | Export 0.9 | Overall Score 0.9
| Blender / v3.3 Classroom OPTIX/RTX | |
| Alienware x15 R2 P111F | |
| Asus ROG Strix Scar 17 SE G733CX-LL014W | |
| MSI Titan GT77 12UHS | |
| Moyenne de la classe Gaming (9 - 32, n=111, 2 dernières années) | |
| Razer Blade 16 Early 2023 | |
| ASUS TUF Gaming GeForce RTX 3080 Ti OC | |
| Intel Core i5-13400F | |
| Moyenne NVIDIA GeForce RTX 4090 Laptop GPU (9 - 19, n=39) | |
| KFA2 GeForce RTX 4070 Ti SG | |
| MSI Titan GT77 HX 13VI | |
| Schenker XMG Neo 16 Raptor Lake | |
| KFA2 GeForce RTX 4080 SG | |
| Blender / v3.3 Classroom CUDA | |
| Alienware x15 R2 P111F | |
| Asus ROG Strix Scar 17 SE G733CX-LL014W | |
| Moyenne de la classe Gaming (15 - 228, n=111, 2 dernières années) | |
| MSI Titan GT77 12UHS | |
| Razer Blade 16 Early 2023 | |
| ASUS TUF Gaming GeForce RTX 3080 Ti OC | |
| Intel Core i5-13400F | |
| Moyenne NVIDIA GeForce RTX 4090 Laptop GPU (16 - 24, n=39) | |
| Schenker XMG Neo 16 Raptor Lake | |
| MSI Titan GT77 HX 13VI | |
| Blender / v3.3 Classroom CPU | |
| Alienware x15 R2 P111F | |
| Intel Core i5-13400F | |
| Apple MacBook Pro 16 2023 M2 Max | |
| Asus ROG Strix Scar 17 SE G733CX-LL014W | |
| MSI Titan GT77 12UHS | |
| Moyenne de la classe Gaming (122 - 565, n=107, 2 dernières années) | |
| Razer Blade 16 Early 2023 | |
| Schenker XMG Neo 16 Raptor Lake | |
| Moyenne NVIDIA GeForce RTX 4090 Laptop GPU (144 - 305, n=39) | |
| MSI Titan GT77 HX 13VI | |
| ASUS TUF Gaming GeForce RTX 3080 Ti OC | |
| Blender / v3.3 Classroom METAL | |
| Apple MacBook Pro 16 2023 M2 Max | |
| Photoshop PugetBench / Filter Score | |
| KFA2 GeForce RTX 4080 SG | |
| ASUS TUF Gaming GeForce RTX 3080 Ti OC | |
| KFA2 GeForce RTX 4070 Ti SG | |
| Intel Core i5-13400F | |
| Apple MacBook Pro 16 2023 M2 Max | |
| MSI Titan GT77 HX 13VI | |
| Moyenne NVIDIA GeForce RTX 4090 Laptop GPU (91.9 - 104.6, n=5) | |
| Photoshop PugetBench / General Score | |
| MSI Titan GT77 HX 13VI | |
| Moyenne NVIDIA GeForce RTX 4090 Laptop GPU (151.8 - 168.2, n=5) | |
| Apple MacBook Pro 16 2023 M2 Max | |
| KFA2 GeForce RTX 4080 SG | |
| ASUS TUF Gaming GeForce RTX 3080 Ti OC | |
| KFA2 GeForce RTX 4070 Ti SG | |
| Intel Core i5-13400F | |
| Photoshop PugetBench / GPU Score | |
| KFA2 GeForce RTX 4080 SG | |
| ASUS TUF Gaming GeForce RTX 3080 Ti OC | |
| KFA2 GeForce RTX 4070 Ti SG | |
| Apple MacBook Pro 16 2023 M2 Max | |
| Moyenne NVIDIA GeForce RTX 4090 Laptop GPU (109.1 - 119.4, n=5) | |
| MSI Titan GT77 HX 13VI | |
| Intel Core i5-13400F | |
| Photoshop PugetBench / Overall Score | |
| KFA2 GeForce RTX 4080 SG | |
| ASUS TUF Gaming GeForce RTX 3080 Ti OC | |
| KFA2 GeForce RTX 4070 Ti SG | |
| MSI Titan GT77 HX 13VI | |
| Moyenne NVIDIA GeForce RTX 4090 Laptop GPU (1225 - 1356, n=5) | |
| Apple MacBook Pro 16 2023 M2 Max | |
| Intel Core i5-13400F | |
| Premiere Pro PugetBench / GPU 0.9 | |
| MSI Titan GT77 HX 13VI | |
| Moyenne NVIDIA GeForce RTX 4090 Laptop GPU (75.8 - 109.2, n=3) | |
| KFA2 GeForce RTX 4080 SG | |
| Intel Core i5-13400F | |
| ASUS TUF Gaming GeForce RTX 3080 Ti OC | |
| KFA2 GeForce RTX 4070 Ti SG | |
| Apple MacBook Pro 16 2023 M2 Max | |
| Premiere Pro PugetBench / Live Playback 0.9 | |
| MSI Titan GT77 HX 13VI | |
| Moyenne NVIDIA GeForce RTX 4090 Laptop GPU (91.7 - 118, n=3) | |
| KFA2 GeForce RTX 4080 SG | |
| KFA2 GeForce RTX 4070 Ti SG | |
| ASUS TUF Gaming GeForce RTX 3080 Ti OC | |
| Intel Core i5-13400F | |
| Apple MacBook Pro 16 2023 M2 Max | |
| Premiere Pro PugetBench / Export 0.9 | |
| MSI Titan GT77 HX 13VI | |
| KFA2 GeForce RTX 4070 Ti SG | |
| KFA2 GeForce RTX 4080 SG | |
| ASUS TUF Gaming GeForce RTX 3080 Ti OC | |
| Moyenne NVIDIA GeForce RTX 4090 Laptop GPU (78.4 - 113.4, n=3) | |
| Apple MacBook Pro 16 2023 M2 Max | |
| Intel Core i5-13400F | |
| Premiere Pro PugetBench / Overall Score 0.9 | |
| Apple MacBook Pro 16 2023 M2 Max | |
| MSI Titan GT77 HX 13VI | |
| Moyenne NVIDIA GeForce RTX 4090 Laptop GPU (821 - 1105, n=3) | |
| KFA2 GeForce RTX 4070 Ti SG | |
| KFA2 GeForce RTX 4080 SG | |
| ASUS TUF Gaming GeForce RTX 3080 Ti OC | |
| Intel Core i5-13400F | |
Photoshop PugetBench: Filter Score | General Score | GPU Score | Overall Score
Premiere Pro PugetBench: GPU 0.9 | Live Playback 0.9 | Export 0.9 | Overall Score 0.9
* ... Moindre est la valeur, meilleures sont les performances
Le RTX 4090 n'a pas de pilotes spéciaux comme les GPU de station de travail, mais les performances sont tout de même impressionnantes et le nouveau GPU GeForce peut même battre le professionnelRTX A5500dans certains des tests SPECviewperf (comme Maya, SiemensNX). Cependant, le GPU grand public est parfois aussi au plus bas, donc cela dépend de votre charge de travail, mais les GPU professionnels ne sont pas toujours nécessaires.
Performances en matière de jeux
Les performances de jeu sont tout simplement étonnantes et la combinaison du Core i9-13950HX et de la RTX 4090 gère tous les jeux testés de manière fluide, même en 4K avec les paramètres maximum. Les seules exceptions sont les cas extrêmes comme Cyberpunk 2077 avec le préréglage RT Ultra en 4K, où vous pouvez aider avec l'upscaling (plus sur ce point plus tard). Les jeux par défaut que nous testons avec chaque ordinateur portable montrent un avantage moyen de 26 % par rapport à l'ancienneRTX 3080 Timais l'avantage est plus important dans les titres plus récents et les résolutions plus élevées.
| The Witcher 3 - 1920x1080 Ultra Graphics & Postprocessing (HBAO+) | |
| Schenker XMG Neo 16 Raptor Lake | |
| MSI Titan GT77 HX 13VI | |
| Razer Blade 16 Early 2023 | |
| Moyenne de la classe Gaming (95 - 240, n=8, 2 dernières années) | |
| MSI Titan GT77 12UHS | |
| Alienware x17 R2 P48E | |
| Schenker XMG Neo 17 M22 | |
| Asus ROG Strix Scar 17 SE G733CX-LL014W | |
Les performances de Raytracing sont également très bonnes et la nouvelle RTX 4090 est à peu près au même niveau que larTX 4070 Ti de bureau.
| The Witcher 3 v4 - 1920x1080 RT Ultra Preset / On AA:FX | |
| KFA2 GeForce RTX 4070 Ti SG | |
| MSI Titan GT77 HX 13VI | |
| Schenker XMG Neo 16 Raptor Lake | |
| Moyenne NVIDIA GeForce RTX 4090 Laptop GPU (53.1 - 68, n=5) | |
| The Callisto Protocol - 1920x1080 Ultra Preset (without FSR Upscaling) + Full Ray-Tracing | |
| KFA2 GeForce RTX 4080 SG | |
| KFA2 GeForce RTX 4070 Ti SG | |
| ASUS TUF Gaming GeForce RTX 3080 Ti OC | |
| MSI Titan GT77 HX 13VI | |
| Moyenne NVIDIA GeForce RTX 4090 Laptop GPU (32 - 79.6, n=5) | |
| Schenker XMG Neo 16 Raptor Lake | |
| Spider-Man Miles Morales - 1920x0180 Very High Preset + Ray-Tracing AA:T | |
| KFA2 GeForce RTX 4080 SG | |
| KFA2 GeForce RTX 4070 Ti SG | |
| Schenker XMG Neo 16 Raptor Lake | |
| ASUS TUF Gaming GeForce RTX 3080 Ti OC | |
| MSI Titan GT77 HX 13VI | |
| Moyenne NVIDIA GeForce RTX 4090 Laptop GPU (79.6 - 96.2, n=4) | |
| Watch Dogs Legion - 1920x1080 Ultra Preset + Ultra Ray Tracing (DX12) | |
| Schenker XMG Neo 16 Raptor Lake | |
| Zotac Gaming GeForce RTX 3090 Ti AMP Extreme Holo | |
| Moyenne NVIDIA GeForce RTX 4090 Laptop GPU (84 - 90, n=2) | |
| MSI Titan GT77 HX 13VI | |
| Razer Blade 16 Early 2023 | |
| MSI Titan GT77 12UHS | |
| Alienware x15 R2 P111F | |
| Jeu | Réglage | DLSS désactivé | DLSS activé (équilibré) | Différence |
|---|---|---|---|---|
| Spider-Man Miles Morales | 4K Ultra | 83 FPS | 132 FPS | +59 % |
| Witcher 3 4.00 | 4K RT Ultra | 27 FPS | 50 FPS | +85% |
| Cyberpunk 2077 1.5 | RT 4K | 22 FPS | 95 FPS | +331 % |
| God of War | 4K Ultra | 80 FPS | 111 FPS | +38 % |
Nous effectuons généralement nos benchmarks de jeux sans technologies d'upscaling comme Nvidia DLSS ou AMD FSR. Cependant, les performances peuvent bénéficier d'un avantage considérable lorsque le titre le supporte et nous avons remarqué quelques améliorations majeures avec DLSS 3.0 activé sans aucun déficit visuel. Compte tenu de ces résultats, les prochaines petites variantesRTX 4060etRTX 4070devraient être capables de gérer le jeu en 4K lorsque le DLSS est actif.
Les performances de jeu sont parfaitement stables, comme le montre également notre boucle Witcher 3. Cependant, les performances sont une fois de plus massivement réduites sur batterie.
Witcher 3 FPS-Diagramm
Nous avons également vérifié l'efficacité du nouveau GPU avec notre test Witcher 3. L'influence du CPU n'est pas très grande et nous utilisons les valeurs connectées à un écran externe, ce qui nous permet d'éliminer les différents types d'écrans et aussi de comparer les résultats avec les GPU de bureau. Le résultat de la nouvelle RTX 4090 est impressionnant, car le GPU est environ 40 % plus efficace que la RTX 3080 Ti Mobile (140W) dans lAlienware x15et que lerTX 4080 de bureau. La nouvelle GT77 est également 53 % plus efficace que le modèle précédent avec laRTX 3080 Tià la même TGP.
| Bas | Moyen | Élevé | Ultra | QHD | 4K DLSS | 4K | |
|---|---|---|---|---|---|---|---|
| GTA V (2015) | 184.1 | 182.6 | 140.9 | 138.5 | 175.7 | ||
| The Witcher 3 (2015) | 619 | 546 | 422 | 198.9 | 160 | ||
| Dota 2 Reborn (2015) | 225 | 206 | 194.1 | 185.9 | 178.9 | ||
| Final Fantasy XV Benchmark (2018) | 230 | 221 | 187.4 | 162.9 | 94.7 | ||
| X-Plane 11.11 (2018) | 203 | 177.5 | 134.1 | 114.3 | |||
| Far Cry 5 (2018) | 186 | 173 | 160 | 159 | 113 | ||
| Strange Brigade (2018) | 490 | 396 | 391 | 373 | 309 | 159.3 | |
| Shadow of the Tomb Raider (2018) | 245 | 227 | 219 | 214 | 187 | 103 | |
| Metro Exodus (2019) | 204 | 183 | 153 | 132 | 116 | 81 | |
| Control (2019) | 240 | 232 | 187 | 122 | 63 | ||
| Borderlands 3 (2019) | 201 | 176 | 162 | 151 | 130 | 76 | |
| Horizon Zero Dawn (2020) | 209 | 189 | 174 | 163 | 154 | 131 | 95 |
| Mafia Definitive Edition (2020) | 219 | 189 | 179 | 161 | 93 | ||
| Watch Dogs Legion (2020) | 152 | 144 | 131 | 120 | 109 | 69 | |
| F1 2021 (2021) | 501 | 449 | 417 | 209 | 192.4 | 114.4 | |
| Far Cry 6 (2021) | 167 | 147 | 144 | 135 | 89 | ||
| Forza Horizon 5 (2021) | 220 | 181 | 174 | 124 | 113 | 95 | |
| God of War (2022) | 201 | 200 | 180 | 133 | 115 | 80 | |
| Rainbow Six Extraction (2022) | 378 | 347 | 346 | 314 | 219 | 112 | |
| Dying Light 2 (2022) | 240 | 206 | 174 | 121 | 62 | ||
| GRID Legends (2022) | 254 | 230 | 210 | 199 | 190 | 132 | |
| Cyberpunk 2077 1.6 (2022) | 156 | 144 | 138 | 135 | 98 | 56 | |
| Ghostwire Tokyo (2022) | 237 | 236 | 234 | 231 | 206 | 100 | |
| Tiny Tina's Wonderlands (2022) | 339 | 289 | 224 | 182 | 131 | 70 | |
| F1 22 (2022) | 316 | 294 | 283 | 138.2 | 90.1 | 44.9 | |
| Call of Duty Modern Warfare 2 2022 (2022) | 230 | 215 | 183 | 176 | 135 | 126 | 85 |
| Spider-Man Miles Morales (2022) | 134 | 131 | 118 | 116 | 113 | 83 | |
| The Callisto Protocol (2022) | 195 | 181 | 145 | 144 | 114 | 68 | |
| The Witcher 3 v4 (2023) | 240 | 189 | 173 | 150 | 104 | 50 | |
| Dead Space Remake (2023) | 147 | 141 | 130 | 129 | 100 | 53 |
Émissions - GT77 avec plus de caloducs
Bruit du système
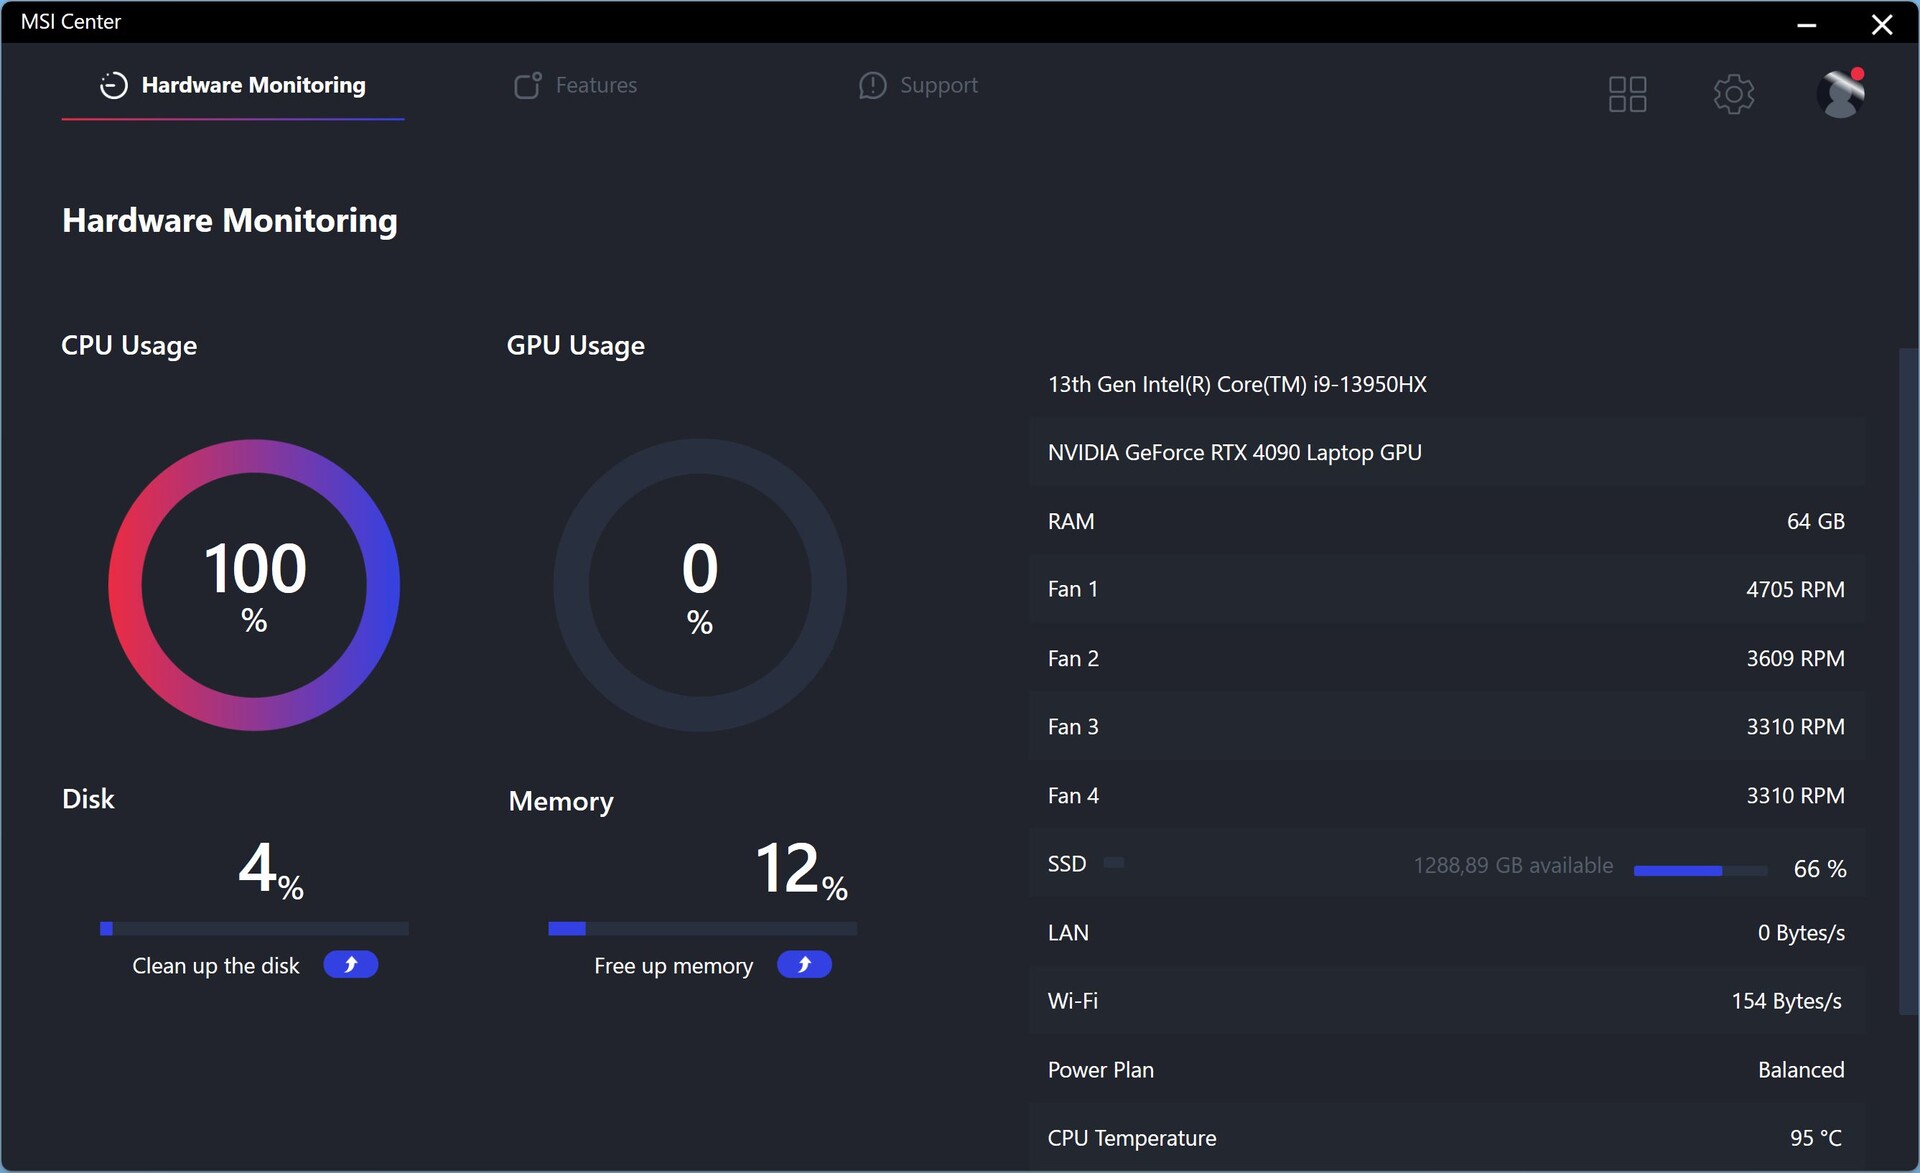
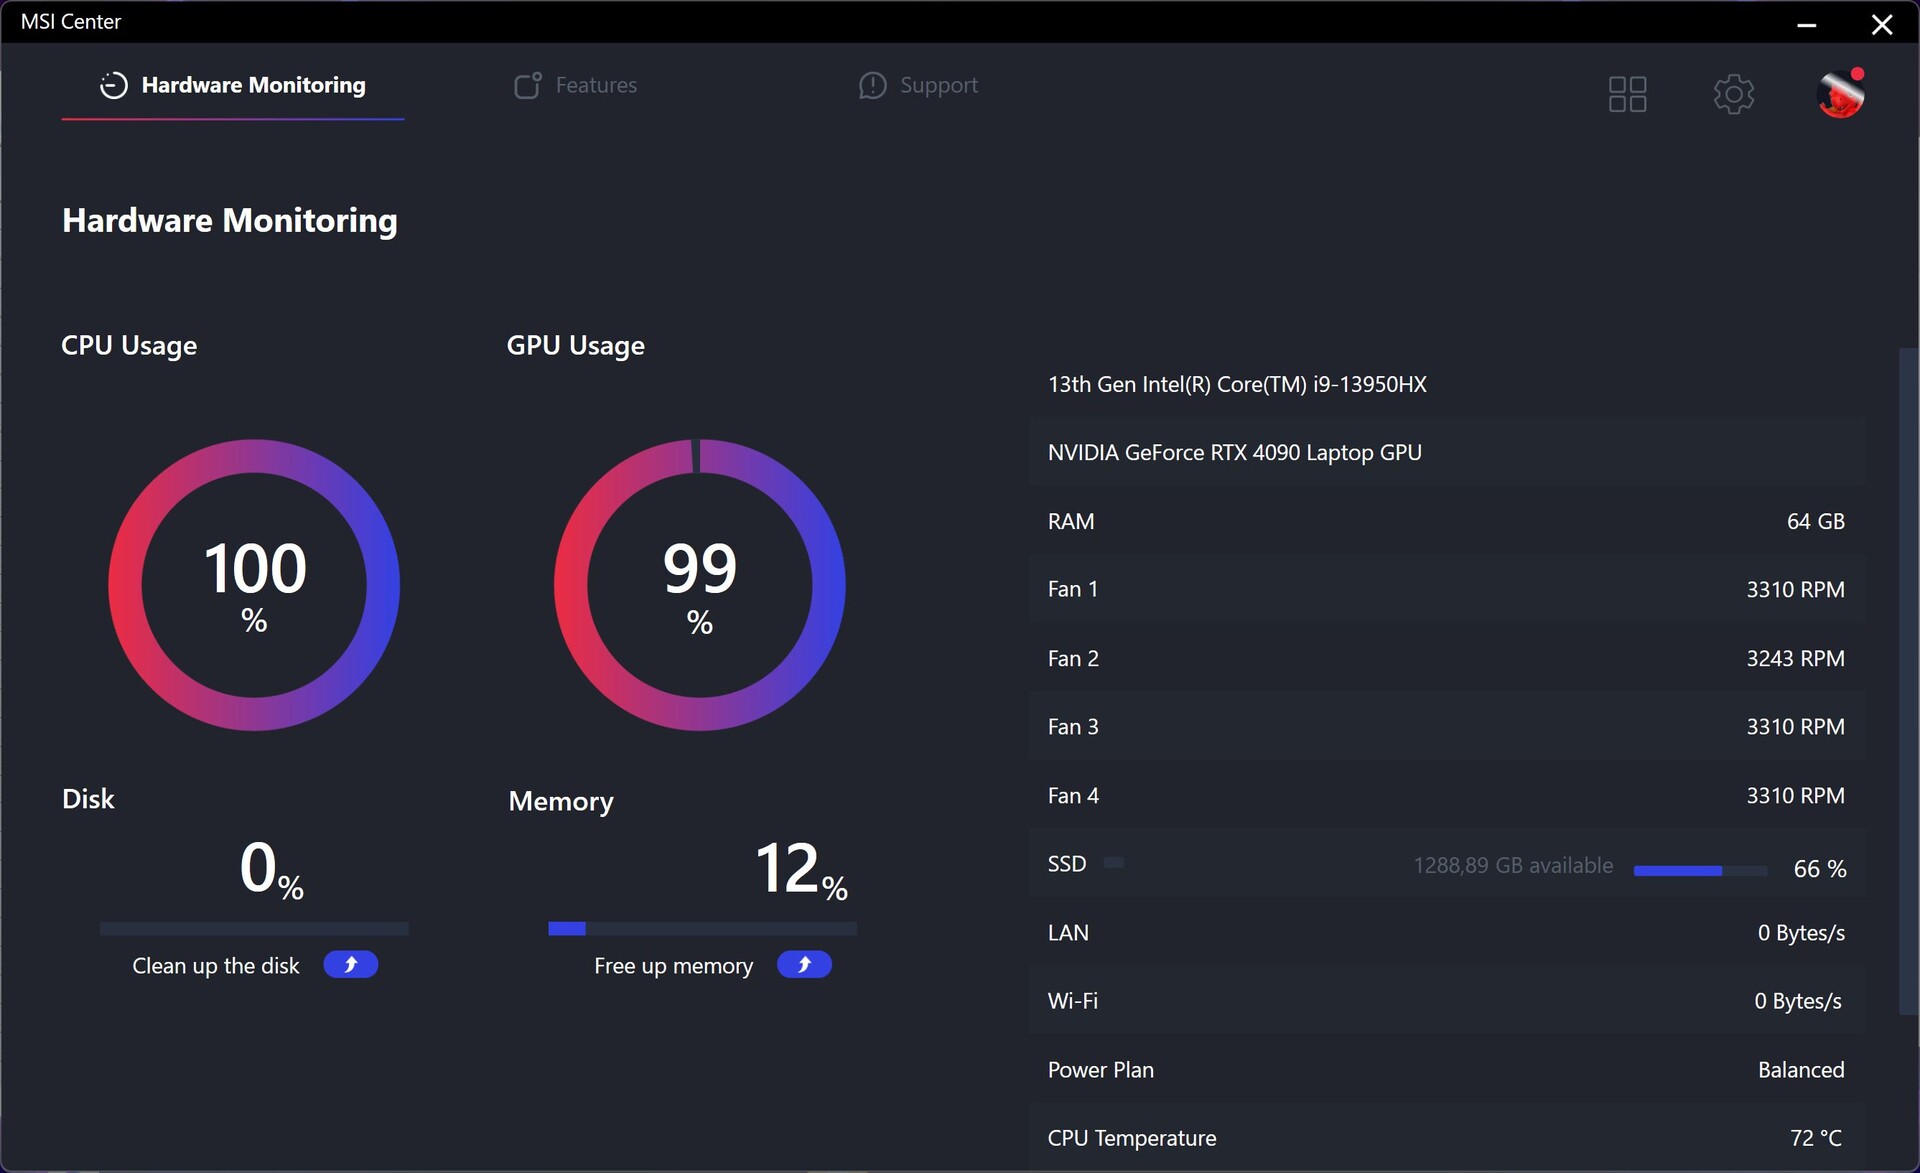
Le Titan GT77 utilise quatre ventilateurs et de nombreux caloducs pour dissiper toute la chaleur. L'un des ventilateurs (Fan 1 selon MSI Control) tourne toujours à ~1500 rpm indépendamment des réglages de puissance, ce qui se traduit par un murmure de 29,2 dB(A). Ce n'est donc jamais un système silencieux et vous pouvez parfois entendre des bruits électroniques à 29 dB(A) également. L'activité constante des ventilateurs signifie qu'ils ne tourneront pas pendant les charges de travail légères comme la navigation sur Internet. En revanche, si vous commencez à solliciter le processeur ou le GPU, il deviendra très vite très bruyant. Il est assez intéressant de constater que nous avons obtenu les ventilateurs les plus bruyants pendant la charge du CPU à 61 dB(A), alors que le test de stress n'a donné "que" 53,3 dB(A). La raison est le comportement du ventilateur, qui peut également être vu dans les images ci-dessous.
Nous avons mesuré entre 53 et 56 dB(A) selon le titre, ce qui est évidemment très fort. Il y a deux approches différentes ici, vous pouvez soit utiliser un casque (avantageusement avec un système de réduction du bruit) ou utiliser le mode silencieux, qui limitera le bruit du ventilateur à 39,6 dB(A). Les performances en prendront également un coup, mais la plupart des jeux fonctionneront toujours sans problème grâce aux énormes réserves de performances. Vous pouvez activer manuellement la fonction Cooler Boost, qui se traduira par 62,8 dB(A), mais nous n'avons jamais atteint ce niveau pendant les tests.
| Performances extrêmes | Équilibré | Silencieux | |
|---|---|---|---|
| Witcher 3 4.00 Ultra 4K | 55,7 dB(A) | 55,7 dB(A) | 39,6 dB(A) |
| Witcher 3 Ultra | 53,3 dB(A) | 53,3 dB(A) | 39,6 dB(A) |
| Dead Space Remake Ultra 4K | 55.7 dB(A) | 53.3 dB(A) | 39.6 dB(A) |
| CB R23 Multi | 61 dB(A) | 55,7 dB(A) | 36,8 dB(A) |
| Furmark | 56,1 dB(A) | 53,3 dB(A) | 39,6 dB(A) |
Degré de la nuisance sonore
| Au repos |
| 29.2 / 29.2 / 29.2 dB(A) |
| Fortement sollicité |
| 50.7 / 61 dB(A) |
 | ||
30 dB silencieux 40 dB(A) audible 50 dB(A) bruyant |
||
min: | ||
| MSI Titan GT77 HX 13VI GeForce RTX 4090 Laptop GPU, i9-13950HX, Samsung PM9A1 MZVL22T0HBLB | Razer Blade 16 Early 2023 GeForce RTX 4080 Laptop GPU, i9-13950HX, SSSTC CA6-8D1024 | Asus ROG Strix Scar 17 SE G733CX-LL014W GeForce RTX 3080 Ti Laptop GPU, i9-12950HX, Samsung PM9A1 MZVL22T0HBLB | MSI Titan GT77 12UHS GeForce RTX 3080 Ti Laptop GPU, i9-12900HX, Samsung PM9A1 MZVL21T0HCLR | Alienware x17 R2 P48E GeForce RTX 3080 Ti Laptop GPU, i9-12900HK, 2x Samsung PM9A1 1TB (RAID 0) | Schenker XMG Neo 17 M22 GeForce RTX 3080 Ti Laptop GPU, R9 6900HX, Samsung SSD 980 Pro 1TB MZ-V8P1T0BW | |
|---|---|---|---|---|---|---|
| Noise | 16% | 19% | 10% | 18% | -2% | |
| arrêt / environnement * (dB) | 24.6 | 23 7% | 23.9 3% | 21.9 11% | 22.7 8% | 26 -6% |
| Idle Minimum * (dB) | 29.2 | 23 21% | 23.9 18% | 24.53 16% | 23.1 21% | 26 11% |
| Idle Average * (dB) | 29.2 | 23 21% | 23.9 18% | 24.53 16% | 23.1 21% | 29 1% |
| Idle Maximum * (dB) | 29.2 | 23.6 19% | 23.9 18% | 24.53 16% | 23.1 21% | 40 -37% |
| Load Average * (dB) | 50.7 | 39 23% | 34.3 32% | 46.25 9% | 31.9 37% | 47 7% |
| Witcher 3 ultra * (dB) | 53.3 | 51.6 3% | 56.86 -7% | 52.5 2% | 52 2% | |
| Load Maximum * (dB) | 61 | 51.3 16% | 45.9 25% | 54.25 11% | 52.5 14% | 54 11% |
* ... Moindre est la valeur, meilleures sont les performances
Température
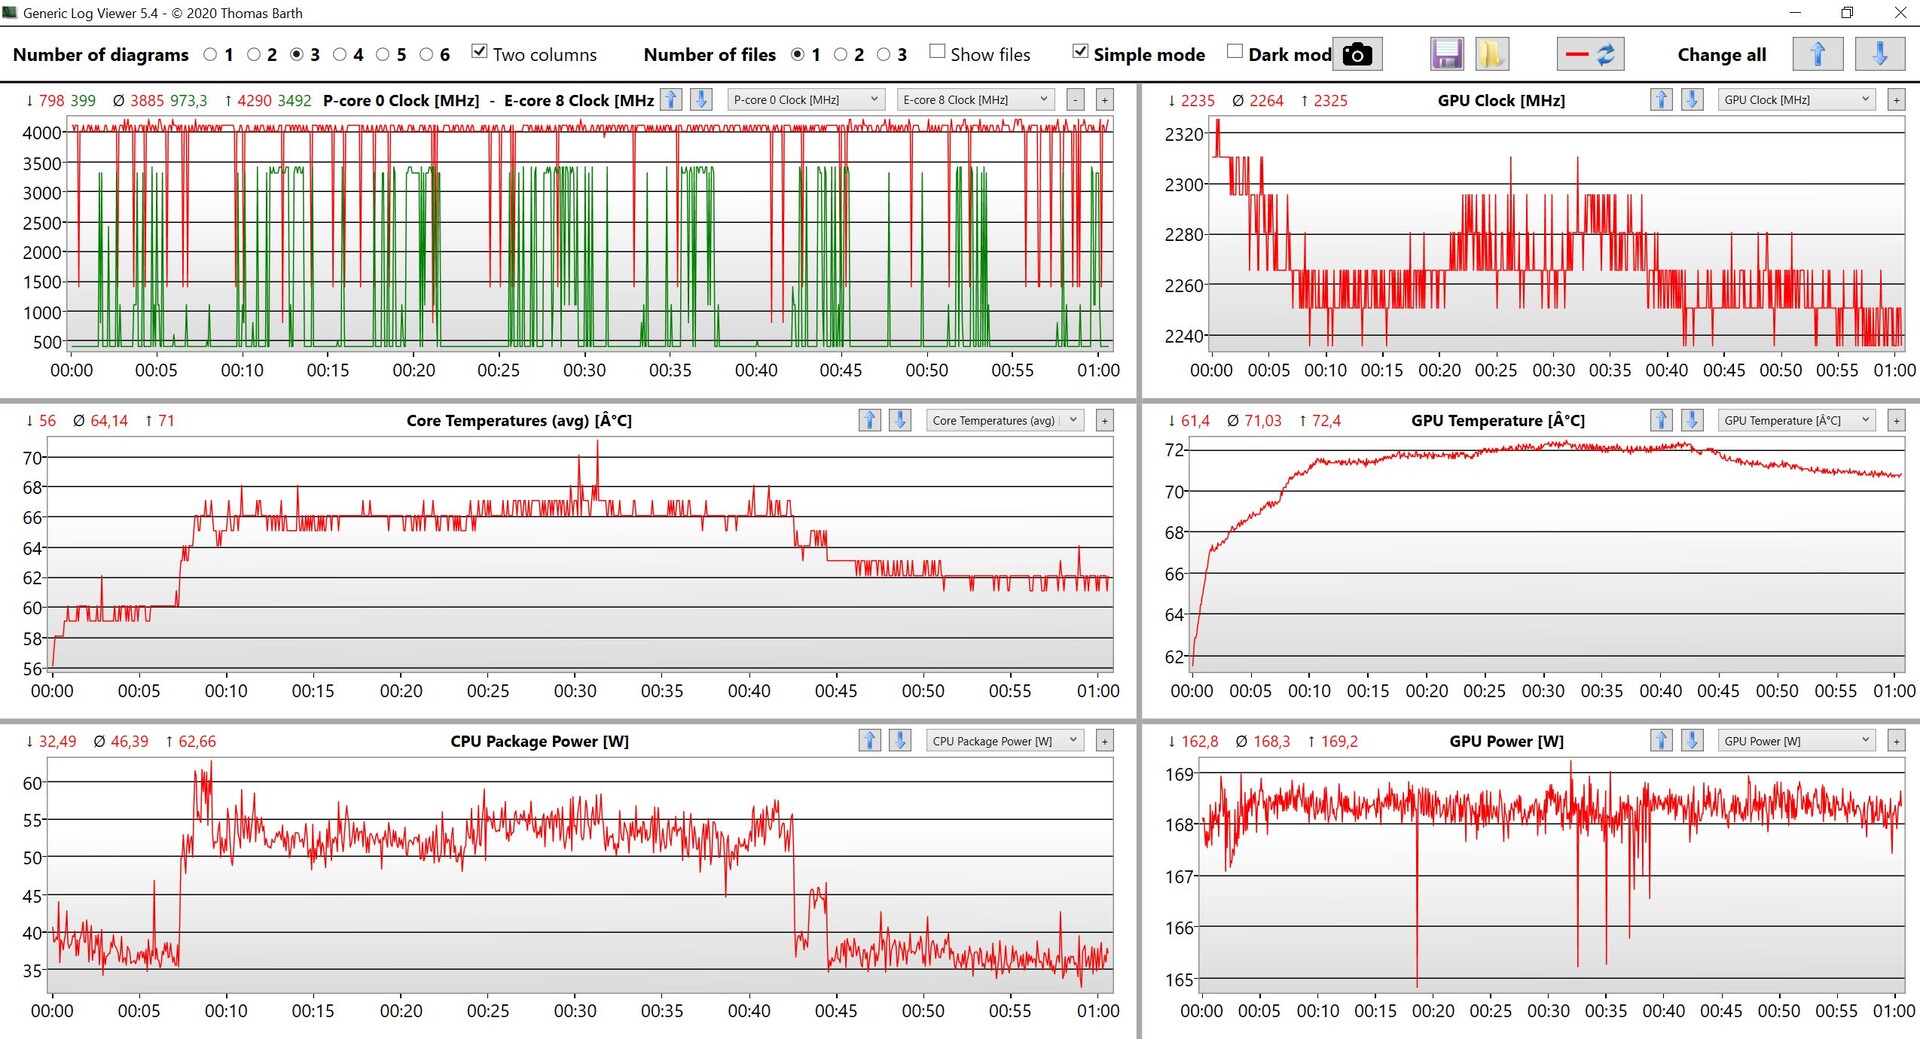
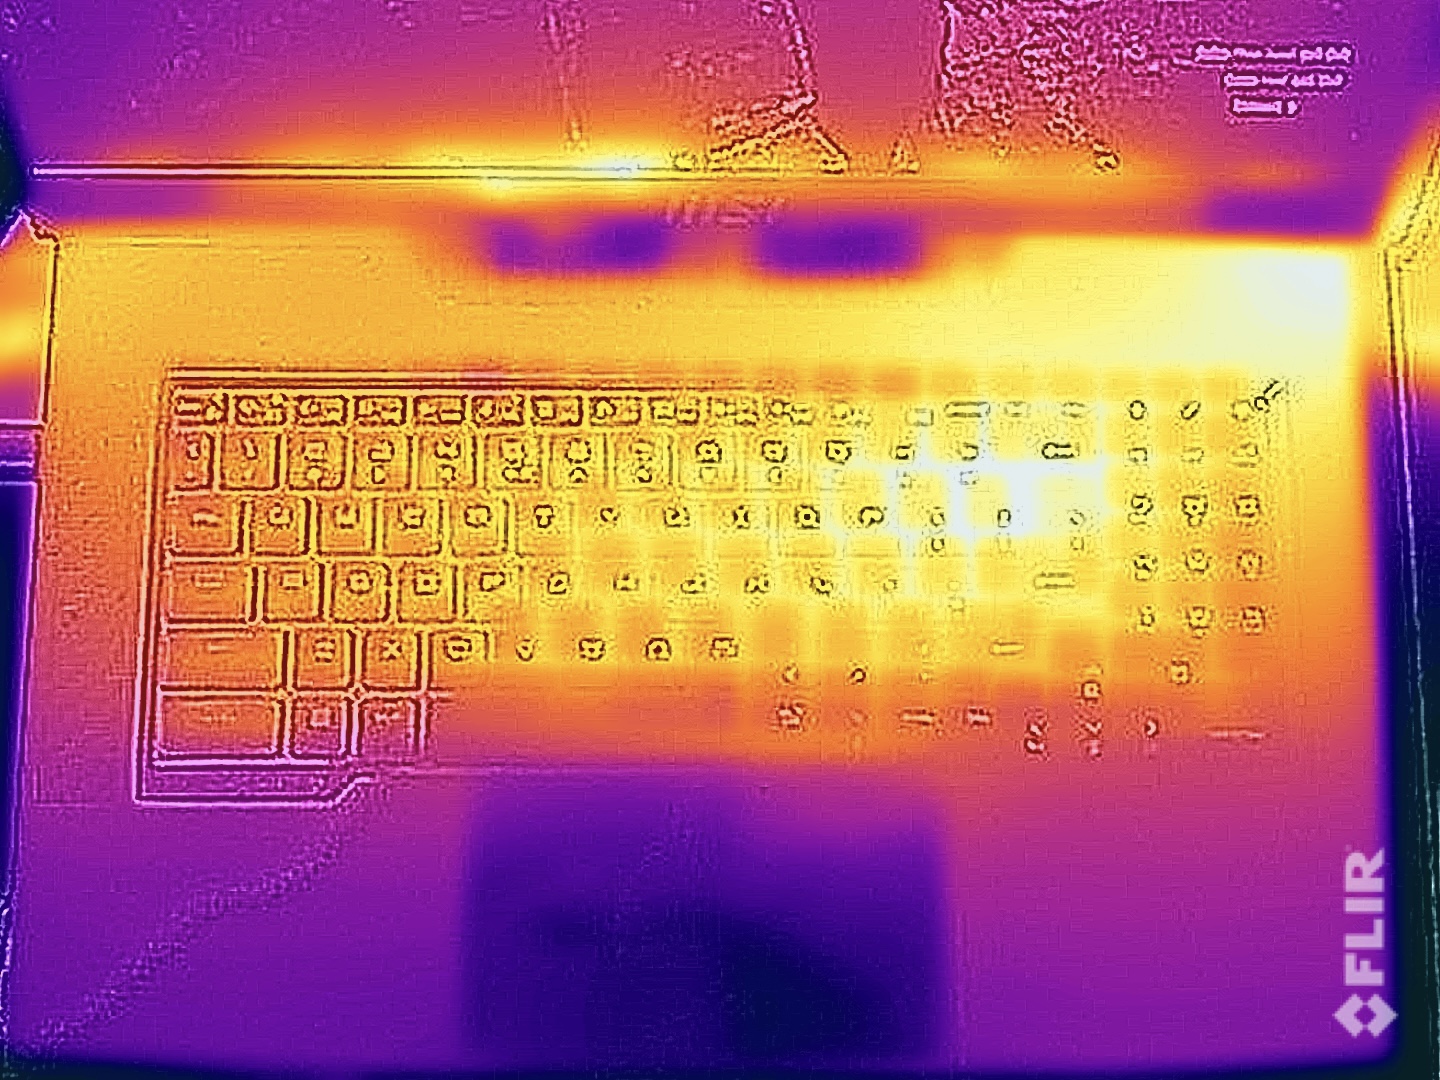
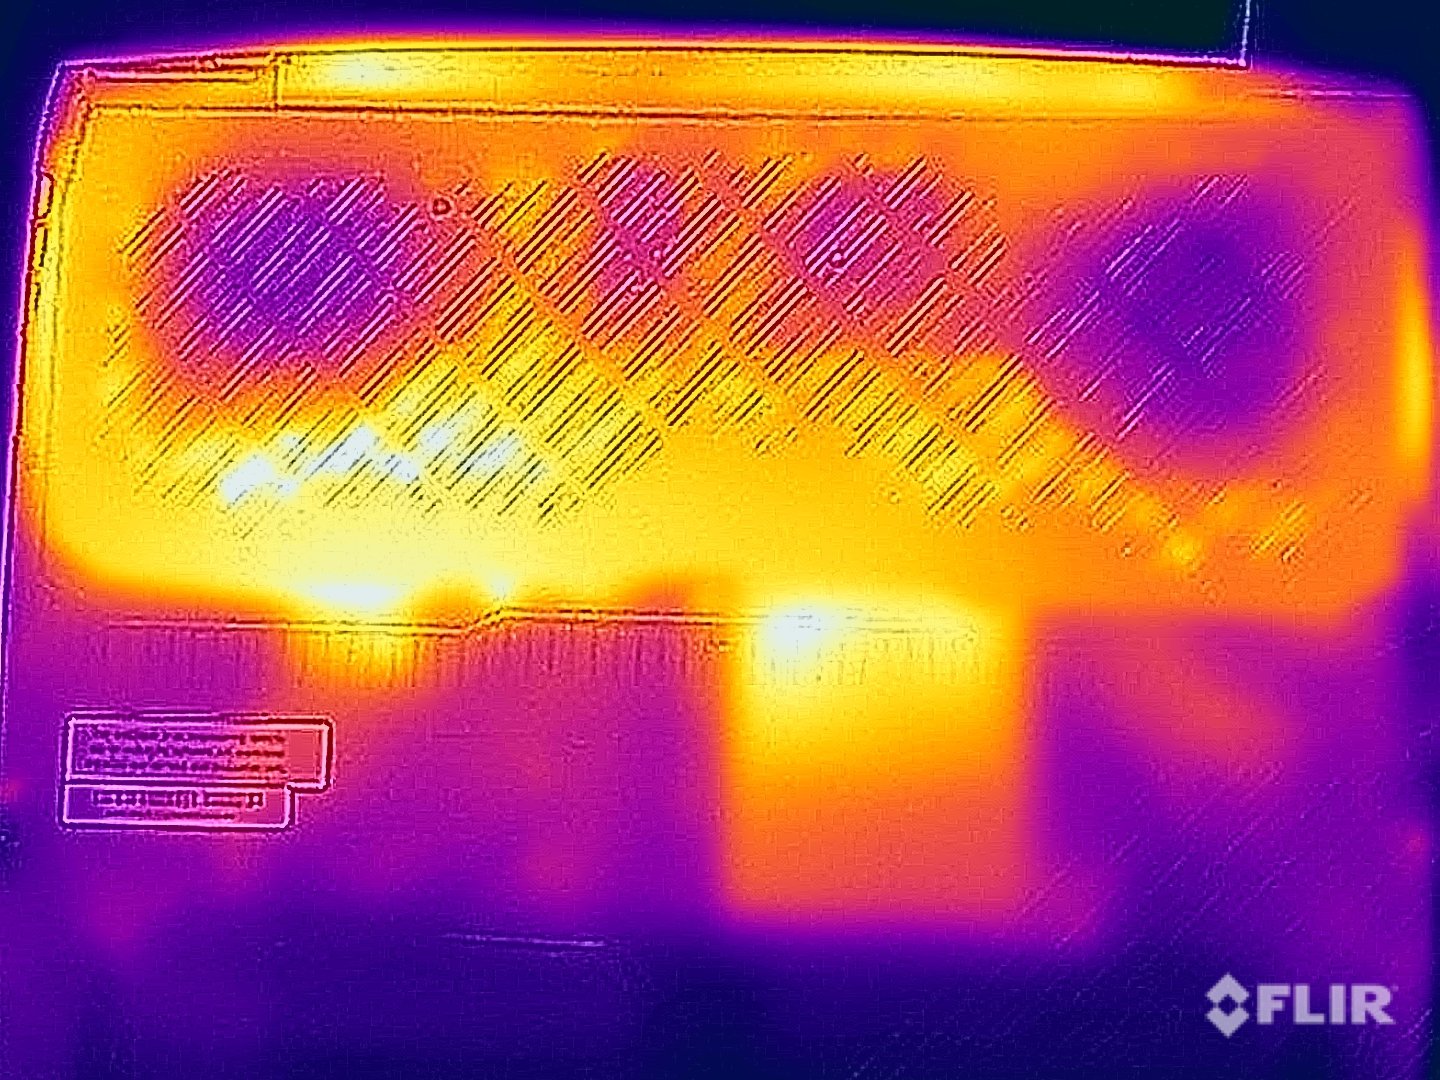
Les ventilateurs bruyants ont un gros avantage, car les températures de surface sont étonnamment basses et vous pouvez toujours utiliser le clavier sans aucune limitation pendant les longues sessions de jeu. Nous avons vérifié les résultats plusieurs fois, mais les chiffres étaient les mêmes. Nous ne pouvons guère mesurer plus de 40 °C sous charge, ce qui est un excellent résultat compte tenu des performances.
Le CPU et le GPU se stabilisent rapidement à 75W et 150W, respectivement, pendant le test de stress et les performances sont stables. Le système refroidit un total de 225W, mais MSI annonce même jusqu'à 250W pour les systèmes avec leCore i9-13980HXles températures pourraient donc être un peu plus élevées (nous ne nous attendons pas vraiment à des ventilateurs encore plus bruyants).
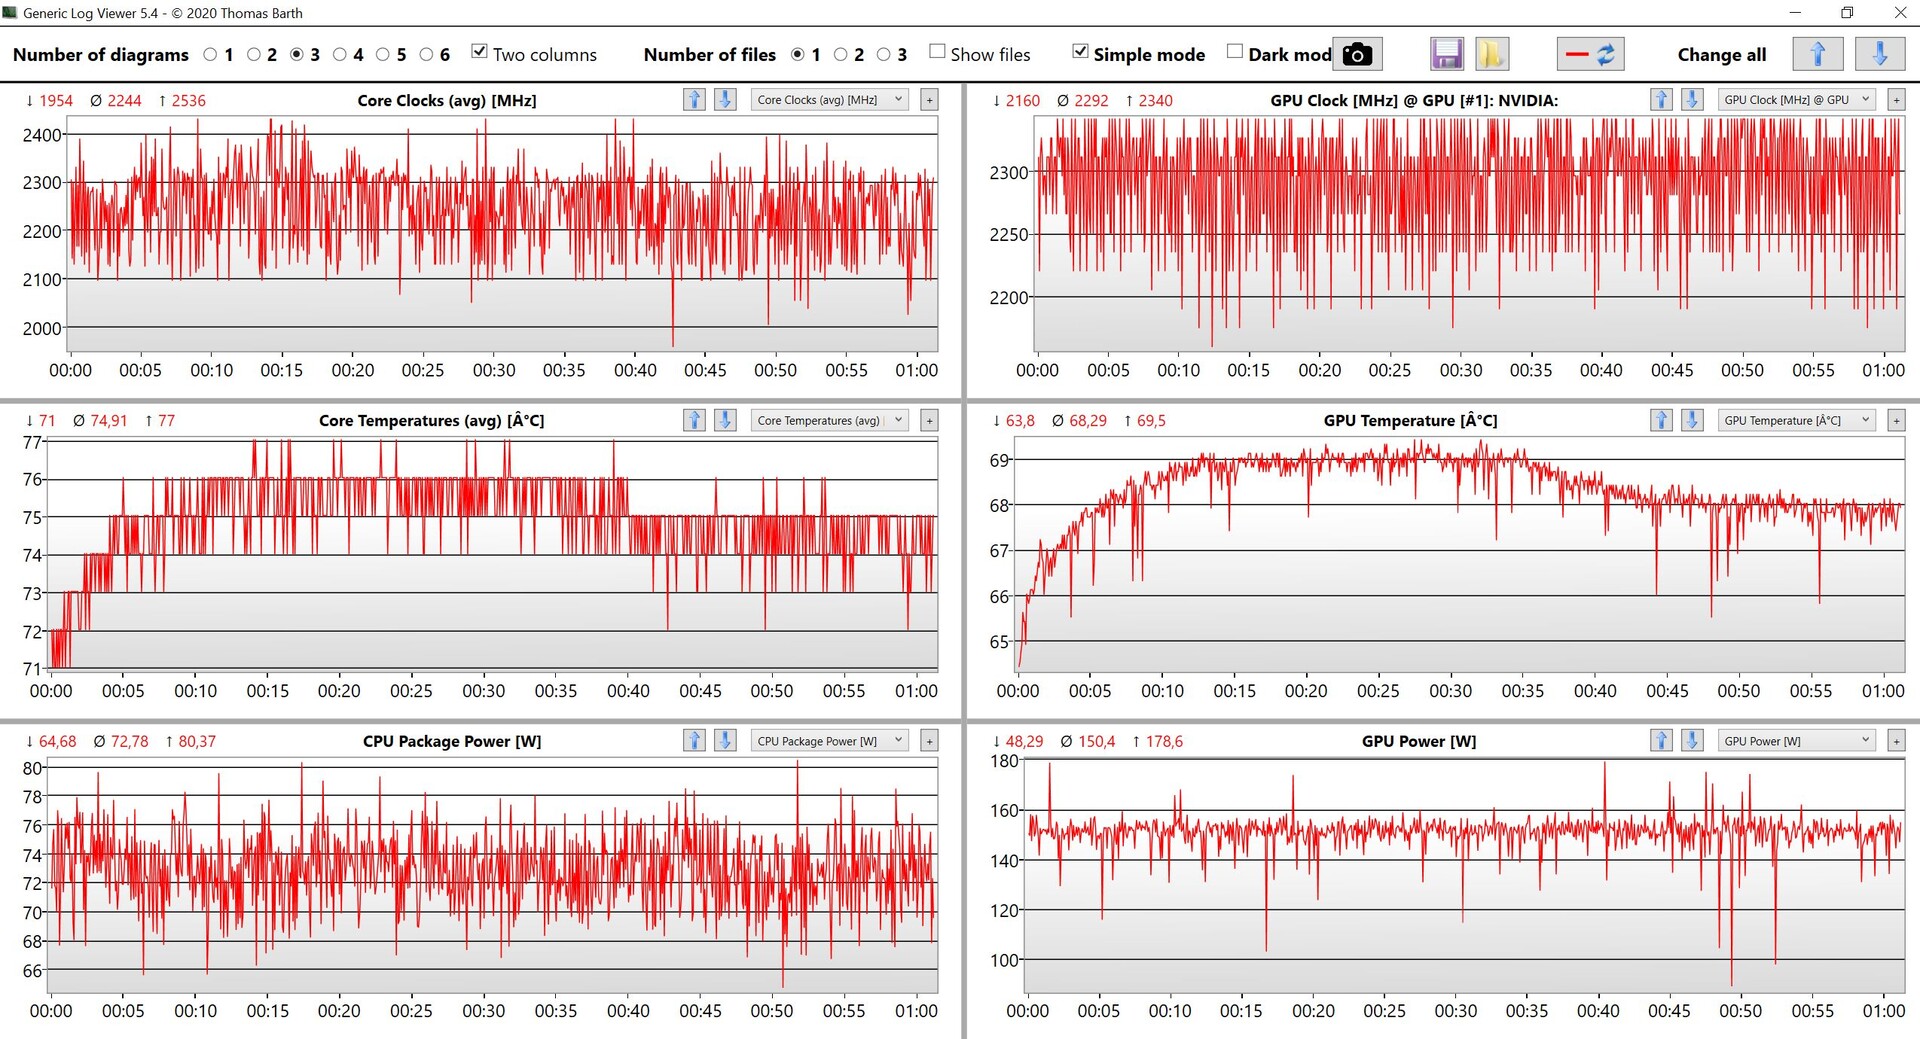
(±) La température maximale du côté supérieur est de 40.6 °C / 105 F, par rapport à la moyenne de 40.4 °C / 105 F, allant de 21.2 à 68.8 °C pour la classe Gaming.
(±) Le fond chauffe jusqu'à un maximum de 41.1 °C / 106 F, contre une moyenne de 43.2 °C / 110 F
(+) En utilisation inactive, la température moyenne du côté supérieur est de 25.2 °C / 77 F, par rapport à la moyenne du dispositif de 33.9 °C / 93 F.
(±) En jouant à The Witcher 3, la température moyenne du côté supérieur est de 36.2 °C / 97 F, alors que la moyenne de l'appareil est de 33.9 °C / 93 F.
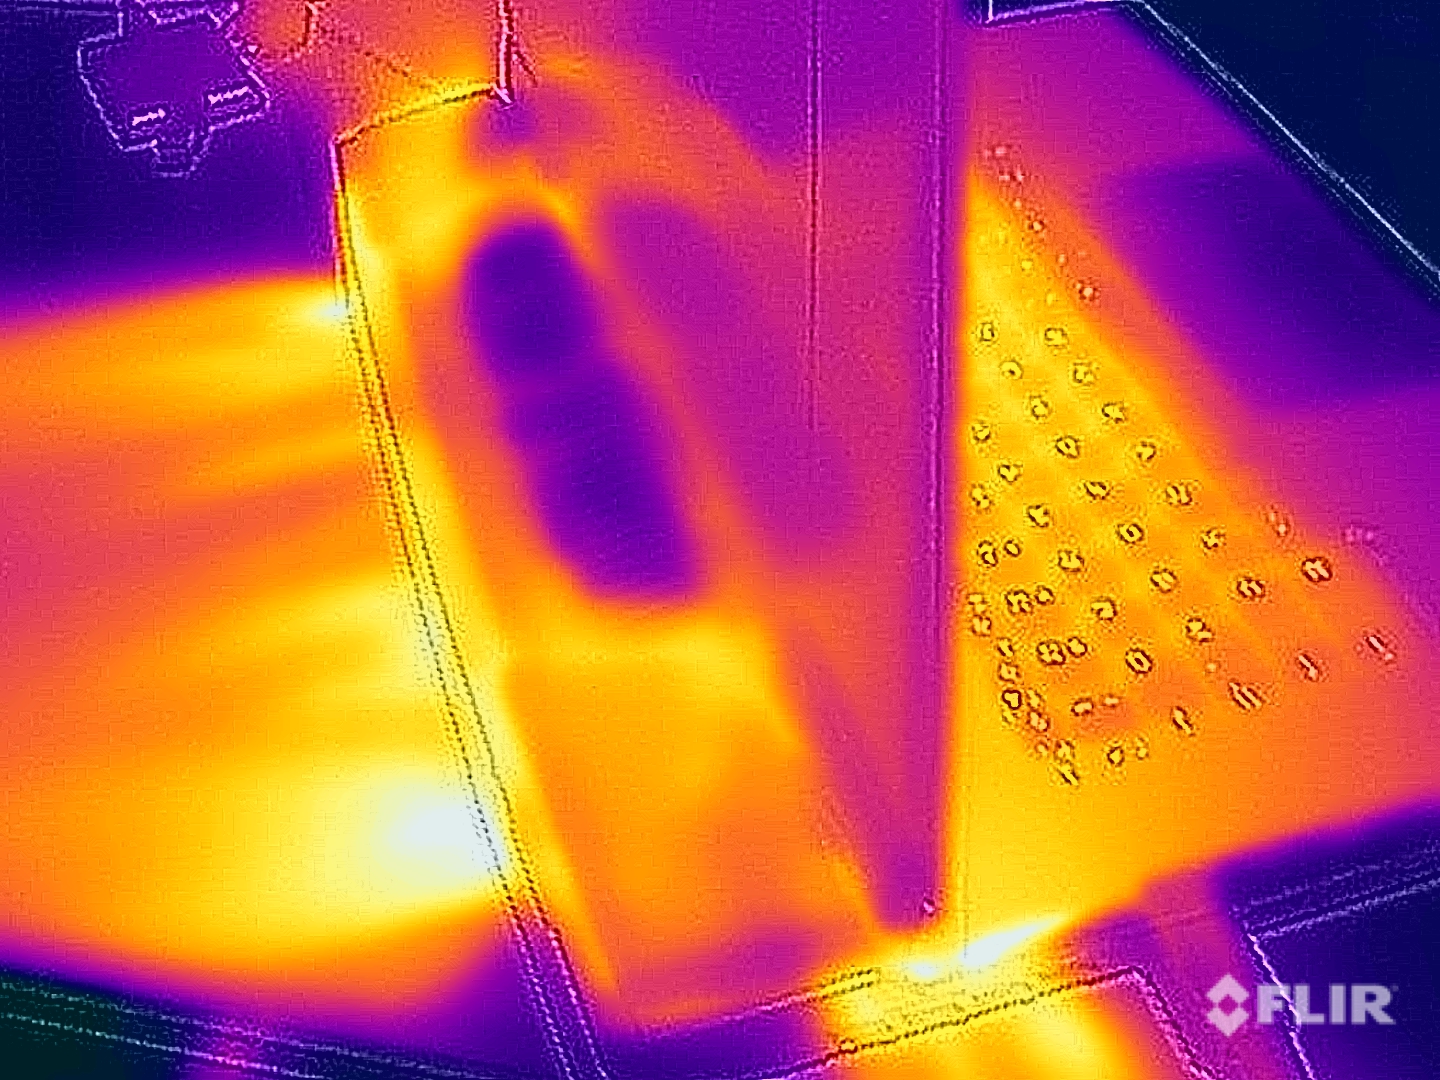
(+) Les repose-poignets et le pavé tactile sont plus froids que la température de la peau avec un maximum de 29.6 °C / 85.3 F et sont donc froids au toucher.
(±) La température moyenne de la zone de l'appui-paume de dispositifs similaires était de 28.8 °C / 83.8 F (-0.8 °C / #-1.5 F).
| MSI Titan GT77 HX 13VI Intel Core i9-13950HX, NVIDIA GeForce RTX 4090 Laptop GPU | Razer Blade 16 Early 2023 Intel Core i9-13950HX, NVIDIA GeForce RTX 4080 Laptop GPU | Asus ROG Strix Scar 17 SE G733CX-LL014W Intel Core i9-12950HX, NVIDIA GeForce RTX 3080 Ti Laptop GPU | MSI Titan GT77 12UHS Intel Core i9-12900HX, NVIDIA GeForce RTX 3080 Ti Laptop GPU | Alienware x17 R2 P48E Intel Core i9-12900HK, NVIDIA GeForce RTX 3080 Ti Laptop GPU | Schenker XMG Neo 17 M22 AMD Ryzen 9 6900HX, NVIDIA GeForce RTX 3080 Ti Laptop GPU | |
|---|---|---|---|---|---|---|
| Heat | -5% | -19% | -22% | -11% | -18% | |
| Maximum Upper Side * (°C) | 40.6 | 40 1% | 48.8 -20% | 40.8 -0% | 49.6 -22% | 49 -21% |
| Maximum Bottom * (°C) | 41.1 | 37.6 9% | 52.4 -27% | 52.4 -27% | 42.4 -3% | 52 -27% |
| Idle Upper Side * (°C) | 26.2 | 32.4 -24% | 30.4 -16% | 34.6 -32% | 29.2 -11% | 30 -15% |
| Idle Bottom * (°C) | 30.3 | 31.4 -4% | 34.1 -13% | 38.4 -27% | 32 -6% | 33 -9% |
* ... Moindre est la valeur, meilleures sont les performances
Haut-parleurs
Le GT77 offre toujours deux bons haut-parleurs stéréo combinés à deux woofers, qui produisent un son décent. Cependant, vous ne pouvez pas vraiment en profiter pendant les jeux car les ventilateurs sont trop bruyants, mais le système sonore est certainement suffisant pour la lecture occasionnelle de musique et de vidéos.
MSI Titan GT77 HX 13VI analyse audio
(+) | les haut-parleurs peuvent jouer relativement fort (90.1# dB)
Basses 100 - 315 Hz
(±) | basse réduite - en moyenne 14.3% inférieure à la médiane
(±) | la linéarité des basses est moyenne (7.5% delta à la fréquence précédente)
Médiums 400 - 2000 Hz
(+) | médiane équilibrée - seulement 3.5% de la médiane
(+) | les médiums sont linéaires (3.2% delta à la fréquence précédente)
Aiguës 2 - 16 kHz
(+) | des sommets équilibrés - à seulement 1.9% de la médiane
(+) | les aigus sont linéaires (3.8% delta à la fréquence précédente)
Globalement 100 - 16 000 Hz
(+) | le son global est linéaire (11.1% différence à la médiane)
Par rapport à la même classe
» 8% de tous les appareils testés de cette catégorie étaient meilleurs, 3% similaires, 89% pires
» Le meilleur avait un delta de 6%, la moyenne était de 18%, le pire était de 132%.
Par rapport à tous les appareils testés
» 7% de tous les appareils testés étaient meilleurs, 2% similaires, 92% pires
» Le meilleur avait un delta de 4%, la moyenne était de 24%, le pire était de 134%.
Alienware x17 R2 P48E analyse audio
(+) | les haut-parleurs peuvent jouer relativement fort (84.3# dB)
Basses 100 - 315 Hz
(±) | basse réduite - en moyenne 9.7% inférieure à la médiane
(+) | les basses sont linéaires (5.5% delta à la fréquence précédente)
Médiums 400 - 2000 Hz
(+) | médiane équilibrée - seulement 1.6% de la médiane
(+) | les médiums sont linéaires (3% delta à la fréquence précédente)
Aiguës 2 - 16 kHz
(±) | sommets plus élevés - en moyenne 5% plus élevés que la médiane
(±) | la linéarité des aigus est moyenne (7.6% delta à la fréquence précédente)
Globalement 100 - 16 000 Hz
(+) | le son global est linéaire (9.3% différence à la médiane)
Par rapport à la même classe
» 3% de tous les appareils testés de cette catégorie étaient meilleurs, 2% similaires, 95% pires
» Le meilleur avait un delta de 6%, la moyenne était de 18%, le pire était de 132%.
Par rapport à tous les appareils testés
» 3% de tous les appareils testés étaient meilleurs, 1% similaires, 96% pires
» Le meilleur avait un delta de 4%, la moyenne était de 24%, le pire était de 134%.
Gestion de l'énergie - Titan avec batterie de 99,9 Wh
Consommation d'énergie
La consommation d'énergie de la nouvelle GT77 au ralenti avec l'iGPU n'est pas trop mauvaise et il n'y a pas de différences majeures avec les modèles précédents en charge, ce qui est impressionnant compte tenu de l'augmentation des performances. Nous pouvons observer une consommation maximale de 420W lorsque nous commençons le test de stress, mais elle va rapidement baisser à ~290W une fois que les composants se sont installés. Cela signifie que l'adaptateur d'alimentation de 330W est suffisant.
| Éteint/en veille | |
| Au repos | |
| Fortement sollicité |
|
Légende:
min: | |
| MSI Titan GT77 HX 13VI i9-13950HX, GeForce RTX 4090 Laptop GPU, Samsung PM9A1 MZVL22T0HBLB, Mini-LED, 3840x2160, 17.3" | Razer Blade 16 Early 2023 i9-13950HX, GeForce RTX 4080 Laptop GPU, SSSTC CA6-8D1024, IPS, 2560x1600, 16" | Asus ROG Strix Scar 17 SE G733CX-LL014W i9-12950HX, GeForce RTX 3080 Ti Laptop GPU, Samsung PM9A1 MZVL22T0HBLB, IPS, 2560x1440, 17.3" | MSI Titan GT77 12UHS i9-12900HX, GeForce RTX 3080 Ti Laptop GPU, Samsung PM9A1 MZVL21T0HCLR, IPS-Level, 1920x1080, 17.3" | Alienware x17 R2 P48E i9-12900HK, GeForce RTX 3080 Ti Laptop GPU, 2x Samsung PM9A1 1TB (RAID 0), IPS, 1920x1080, 17.3" | Schenker XMG Neo 17 M22 R9 6900HX, GeForce RTX 3080 Ti Laptop GPU, Samsung SSD 980 Pro 1TB MZ-V8P1T0BW, IPS, 2560x1600, 17" | Moyenne NVIDIA GeForce RTX 4090 Laptop GPU | Moyenne de la classe Gaming | |
|---|---|---|---|---|---|---|---|---|
| Power Consumption | -12% | -7% | -30% | -37% | 33% | -9% | 14% | |
| Idle Minimum * (Watt) | 14 | 15.2 -9% | 19.3 -38% | 30.21 -116% | 24.1 -72% | 7 50% | 16.2 ? -16% | 13.2 ? 6% |
| Idle Average * (Watt) | 21.6 | 22.8 -6% | 26.5 -23% | 32.42 -50% | 28.5 -32% | 11 49% | 23.1 ? -7% | 18.9 ? 13% |
| Idle Maximum * (Watt) | 24.8 | 49.8 -101% | 27.1 -9% | 33.7 -36% | 60 -142% | 17 31% | 34.2 ? -38% | 24.3 ? 2% |
| Load Average * (Watt) | 122.5 | 121.2 1% | 141 -15% | 125.09 -2% | 128.7 -5% | 92 25% | 130.5 ? -7% | 108 ? 12% |
| Witcher 3 ultra * (Watt) | 265 | 242 9% | 225 15% | 256 3% | 254 4% | 221 17% | ||
| Load Maximum * (Watt) | 418 | 273.7 35% | 307.9 26% | 321.88 23% | 323 23% | 306 27% | 324 ? 22% | 254 ? 39% |
* ... Moindre est la valeur, meilleures sont les performances
Power consumption Witcher 3 / Stress test
Power consumption external screen
Durée de vie de la batterie
MSI implémente déjà la plus grosse batterie possible avec 99,9 Wh, mais l'autonomie reste limitée en raison des chiffres de consommation élevés. Nous avons déjà mentionné que la luminosité de l'écran est réduite sur la batterie et que vous ne pouvez pas non plus utiliser le HDR, mais vous pouvez toujours espérer environ 5-6 heures à une luminosité de 150 nits (69 % de la luminosité maximale sur notre unité d'examen) dans des scénarios pratiques. L'autonomie minimale est de 1,5 heure, mais nous avons déjà mentionné que les performances sont massivement réduites. Une charge complète prend 158 minutes lorsque l'appareil est allumé ; 80 % de la capacité est disponible après un peu plus d'une heure et demie.
| MSI Titan GT77 HX 13VI i9-13950HX, GeForce RTX 4090 Laptop GPU, 99.9 Wh | Razer Blade 16 Early 2023 i9-13950HX, GeForce RTX 4080 Laptop GPU, 95.2 Wh | Asus ROG Strix Scar 17 SE G733CX-LL014W i9-12950HX, GeForce RTX 3080 Ti Laptop GPU, 90 Wh | MSI Titan GT77 12UHS i9-12900HX, GeForce RTX 3080 Ti Laptop GPU, 99.9 Wh | Alienware x17 R2 P48E i9-12900HK, GeForce RTX 3080 Ti Laptop GPU, 87 Wh | Schenker XMG Neo 17 M22 R9 6900HX, GeForce RTX 3080 Ti Laptop GPU, 99 Wh | Moyenne de la classe Gaming | |
|---|---|---|---|---|---|---|---|
| Autonomie de la batterie | 8% | -21% | 17% | -53% | 36% | 25% | |
| H.264 (h) | 6 | 7.2 20% | 6.6 10% | 8.26 ? 38% | |||
| WiFi v1.3 (h) | 5.3 | 6.1 15% | 4.2 -21% | 6.9 30% | 2 -62% | 9 70% | 7.02 ? 32% |
| Load (h) | 1.4 | 1.4 0% | 1.4 0% | 0.8 -43% | 1.8 29% | 1.47 ? 5% | |
| Witcher 3 ultra (h) | 1.5 |
Points positifs
Points négatifs
Verdict : la GT77 offre des performances de jeu extrêmes et un écran exceptionnel
Le nouveau MSI Titan GT77 ne touchera très probablement qu'un très petit groupe d'utilisateurs en raison de son prix élevé, mais il n'en reste pas moins une impressionnante vitrine de ce qui est possible. Le joueur haut de gamme combine les meilleurs composants que vous pouvez actuellement obtenir à presque tous les égards et c'est un très bon ensemble global, qui n'a pas à se cacher derrière les systèmes de bureau à part entière.
Nous connaissons déjà le châssis de son prédécesseur et il laisse une impression décente, mais les options d'éclairage sont assez limitées (ce qui peut être bon ou mauvais selon vos préférences) et les surfaces lisses sont très sujettes aux empreintes digitales. Le clavier mécanique est toujours excellent et il y a suffisamment de ports. Le nouveau Processeur HX de la génération actuelle Raptor Lake d'Intel d'Intel est en moyenne 22 % plus rapide que son prédécesseur, mais le nouveau processeurGeForce RTX 4090est encore plus impressionnante. Malgré un TGP similaire de 175W, elle est environ 40-60 % plus rapide que l'ancienneRTX 3080 Tiet peut rivaliser avec les versions de bureau des RTX 3090/RTX 3090 Ti. Par rapport aux GPU de bureau RTX-40xx actuels, le nouveau portable RTX 4090 se situe juste entre le RTX 4070 Ti et le RTX 4080.
Aucun ordinateur portable de jeu n'offre plus de performances à l'heure actuelle : Le MSI GT77 avec le Core i9-13950HX et le GeForce RTX 4090 utilise le matériel le plus rapide que vous pouvez obtenir pour un ordinateur portable. Les jeux sont également incroyables sur le nouveau panneau 4K Mini-LED.
La combinaison matérielle n'a aucun problème avec la résolution 4K native du nouvel écran Mini-LED (144 Hz). La qualité d'image subjective est excellente et les jeux sont tout simplement superbes. Vous pouvez également utiliser le panneau pour l'édition d'images après un étalonnage, ce qui est possible avec le logiciel True Color préchargé. L'écran prend également en charge le HDR avec une luminosité de plus de 1000 nits, mais la mise en œuvre du HDR dans Windows est encore terrible par rapport à macOS, où il fonctionne tout simplement de manière transparente.
Compte tenu de la puissance du matériel, de la conception discrète du châssis, du bon écran et de l'excellent clavier, la Titan GT77 fonctionne aussi très bien comme station de travail mobile et même la RTX A5500 se laisse distancer dans certaines applications professionnelles.
Le refroidissement fonctionne très bien avec quatre ventilateurs et de nombreux caloducs, et nous pouvons difficilement mesurer des températures de surface de plus de 40 °C même en charge, mais les ventilateurs sont extrêmement bruyants en contrepartie. Il faut s'attendre à 54-57 dB(A) pendant les jeux et même plus de 60 dB(A) lorsque vous ne sollicitez que le CPU. Le bruit des ventilateurs est très régulier, mais nous vous recommandons tout de même un casque (de préférence avec annulation active du bruit). Il est également possible d'utiliser le mode silencieux et de réduire le bruit du ventilateur à 40 dB(A). Les performances en prendront un coup, mais elles seront tout de même plus que suffisantes dans la plupart des titres.
Le MSI Titan GT77 présente également quelques inconvénients, surtout si l'on considère son prix élevé. Il s'agit notamment de l'utilisation de plastique bon marché (en particulier le couvercle inférieur), de la lenteur de la RAM DDR5-4800 et de la mauvaise webcam 720p. Les performances des deux SSD de 2 To dans une configuration RAID 0 sont très élevées, mais pas stables. Le GT77 est le premier ordinateur portable de jeu de 17 pouces avec le nouveau matériel dans notre revue et nous sommes déjà impatients de tester la concurrence au cours des deux prochaines semaines.
Prix et disponibilité
La nouvelle MSI Titan GT77 HX 13 VI est disponible dans la boutique MSI au prix de 5299 $.
MSI Titan GT77 HX 13VI
- 02/07/2023 v7 (old)
Andreas Osthoff
Transparency
La sélection des appareils à examiner est effectuée par notre équipe éditoriale. L'échantillon de test a été prêté à l'auteur par le fabricant ou le détaillant pour les besoins de cet examen. Le prêteur n'a pas eu d'influence sur cette évaluation et le fabricant n'a pas reçu de copie de cette évaluation avant sa publication. Il n'y avait aucune obligation de publier cet article. En tant que média indépendant, Notebookcheck n'est pas soumis à l'autorité des fabricants, des détaillants ou des éditeurs.
Voici comment Notebookcheck teste
Chaque année, Notebookcheck examine de manière indépendante des centaines d'ordinateurs portables et de smartphones en utilisant des procédures standardisées afin de garantir que tous les résultats sont comparables. Nous avons continuellement développé nos méthodes de test depuis environ 20 ans et avons établi des normes industrielles dans le processus. Dans nos laboratoires de test, des équipements de mesure de haute qualité sont utilisés par des techniciens et des rédacteurs expérimentés. Ces tests impliquent un processus de validation en plusieurs étapes. Notre système d'évaluation complexe repose sur des centaines de mesures et de points de référence bien fondés, ce qui garantit l'objectivité.Price comparison

