Critiques du Intel Core i9-13900HX processeur
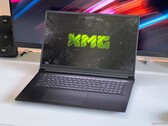
Test du XMG Focus 17 M25 : le GPU pour PC portable Nvidia RTX 5070 Ti le moins cher
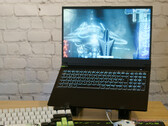
Le nouveau XMG Focus 17 M25 est le moyen le plus abordable d'obtenir le nouveau GPU pour ordinateur portable Nvidia GeForce RTX 5070 Ti. L'ordinateur portable de jeu de 17 pouces est disponible à partir de 1 849 € (taux de change actuel d'environ 2 100 $), mais quels sont les compromis que vous devrez accepter pour ce prix ?
Intel Core i9-13900HX, NVIDIA GeForce RTX 5070 Ti Laptop, 17.3", 2.8 kgTest de l'Acer Predator Helios 18 : gamer RTX 4080 avec écran MiniLED à plus de 1000 cd/m²
Le Predator Helios 18 pouces est un véritable substitut d'ordinateur de bureau, en particulier pour les joueurs et les créatifs. L'écran MiniLED très lumineux, la RTX 4080 et le puissant i9-13900HX en sont les garants. Lisez la suite pour savoir si l'ordinateur portable est également adapté aux joueurs et aux créatifs en ce qui concerne ses autres caractéristiques.
Intel Core i9-13900HX, NVIDIA GeForce RTX 4080 Laptop GPU, 18", 3.2 kgTest du HP Omen Transcend 16 : plus qu'une simple différence de nom
A ne pas confondre avec l'Omen 16 classique, l'Omen Transcend 16 est l'étape suivante de la série avec de nouvelles fonctionnalités et options dont les futurs modèles Omen s'inspireront probablement. Prenez connaissance de toutes les différences et de tous les changements avant d'appuyer sur la gâchette.
Intel Core i9-13900HX, NVIDIA GeForce RTX 4070 Laptop GPU, 16", 2.3 kgTest du Schenker XMG Focus 15 (E23) : PC portable de jeu à petit prix performant
Si vous pouvez vous passer d'un boîtier métallique et d'un clavier RGB complet, vous ne devez pas nécessairement opter pour le coûteux XMG Pro 15. Dans notre test, le XMG Focus 15 est tout aussi performant et ne se laisse distancer que sur quelques points. En contrepartie, le prix de base du Focus 15 est inférieur d'environ 400 € à celui du Pro 15 pour des performances pratiquement similaires.
Intel Core i9-13900HX, NVIDIA GeForce RTX 4050 Laptop GPU, 15.6", 2.4 kgTest du Schenker XMG Pro 15 E23 (PD50SND-G) : l'équilibre entre travail et jeu, c'est possible !
Un design solide et discret associé à une puissance de calcul. C'est ce que le XMG Pro 15 E23 a réussi à faire dans notre étude. Qu'il s'agisse d'un ordinateur portable destiné aux créateurs de contenu ou aux joueurs, le XMG Pro 15 impressionne par sa puissance graphique Nvidia et son superbe écran QHD qui couvre l'espace colorimétrique P3.
Intel Core i9-13900HX, NVIDIA GeForce RTX 4060 Laptop GPU, 15.6", 2.4 kgLenovo Legion Pro 7 RTX4090: NVIDIA GeForce RTX 4090 Laptop GPU, 16.00", 2.7 kg
Critique » Test du Lenovo Legion Pro 7 16 : la puissance du jeu grâce à la RTX 4090
Schenker XMG Focus 17 (E23): NVIDIA GeForce RTX 4070 Laptop GPU, 17.30", 2.9 kg
Critique » Test du Schenker XMG Focus 17 (E23) : PC portable de jeu avec RTX 4070 très puissant
Schenker Key 17 Pro (Early 23): NVIDIA GeForce RTX 4090 Laptop GPU, 17.30", 3.4 kg
Critique » Test du Schenker Key 17 Pro (début 2023) : PC portable de jeu 4k avec Core i9 et RTX 4090
Eurocom Raptor X17: NVIDIA GeForce RTX 4090 Laptop GPU, 17.30", 3.5 kg
Critique » Test de l'Eurocom Raptor X17 : l'alternative aux MSI et autres Asus ROG
Medion Erazer Major X20: NVIDIA GeForce RTX 4070 Laptop GPU, 16.00", 2.4 kg
Critique » Test du Medion Erazer Major X20 : PC portable de jeu avec RTX 4070 et bien équipé
Aorus 17X AZF: NVIDIA GeForce RTX 4090 Laptop GPU, 17.30", 2.9 kg
Critique » Test de l'Aorus 17X AZF : PC portable gaming haut de gamme et fin avec i9-13900HX et RTX 4090
Eluktronics Mech-17 GP2 Liquid Propulsion Package G2: NVIDIA GeForce RTX 4090 Laptop GPU
Critique » Test du Liquid Propulsion Package G2 d'Eluktronics : refroidissement à eau pour PC portable RTX 4090
HP Omen 17-ck2097ng: NVIDIA GeForce RTX 4080 Laptop GPU, 17.30", 2.8 kg
Critique » Test du HP Omen 17 (2023) : ordinateur portable de jeu avec RTX 4080
Medion Erazer Beast X40: NVIDIA GeForce RTX 4090 Laptop GPU, 17.00", 2.9 kg
Critique » Test du Medion Erazer Beast X40 : ordinateur portable de jeu avec RTX 4090
Eluktronics Mech-17 GP2: NVIDIA GeForce RTX 4090 Laptop GPU, 17.00", 2.9 kg
Critique » Test de l'Eluktronics Mech-17 GP2 : un MSI GT77 Titan avec les performances sans la taille
Lenovo Legion Pro 7 16IRX8H: NVIDIA GeForce RTX 4080 Laptop GPU, 16.00", 2.7 kg
Critique » Test du Lenovo Legion Pro 7 16IRX8H : un concentré de performances RTX 4080 haut de gamme
Schenker XMG Neo 17 2023 Engineering Sample: NVIDIA GeForce RTX 4070 Laptop GPU
Critique » Test des GeForce RTX 4070, 4060, 4050 : les nouveaux GPU pour PC portables de Nvidia
Schenker XMG Neo 16 Raptor Lake: NVIDIA GeForce RTX 4090 Laptop GPU, 16.00"
Critique » Test de la Nvidia Ada RTX 40 : la RTX 4090 de 175 W surpasse la RTX 3090 de 350 W pour les performances comme pour l'efficacité énergétique
Acer Predator Helios 18 PH18-71: NVIDIA GeForce RTX 4060 Laptop GPU, 18.00", 3.3 kg
Autres tests » Acer Predator Helios 18 PH18-71
Dell G16 7630, i9-13900HX RTX 4070: NVIDIA GeForce RTX 4070 Laptop GPU, 16.00", 2.9 kg
Autres tests » Dell G16 7630, i9-13900HX RTX 4070
Acer Predator Helios 3D 15 SpatialLabs Edition: NVIDIA GeForce RTX 4080 Laptop GPU, 15.60", 3 kg
Autres tests » Acer Predator Helios 3D 15 SpatialLabs Edition
Alienware m18 R1, RTX 4090: NVIDIA GeForce RTX 4090 Laptop GPU, 18.00", 4.2 kg
Autres tests » Alienware m18 R1, RTX 4090
Acer Predator Helios 16 PH16-71-97H2: NVIDIA GeForce RTX 4070 Laptop GPU, 16.00", 2.7 kg
Autres tests » Acer Predator Helios 16 PH16-71-97H2
Schenker XMG Neo 17 E23: NVIDIA GeForce RTX 4090 Laptop GPU, 17.30", 2.8 kg
Autres tests » SCHENKER XMG Neo 17 E23
HP Omen Transcend 16-u0000: NVIDIA GeForce RTX 4070 Laptop GPU, 16.00", 2.2 kg
Autres tests » HP Omen Transcend 16-u0000
Origin PC EON17-X 2023: NVIDIA GeForce RTX 4090 Laptop GPU, 17.30", 3.3 kg
Autres tests » Origin PC EON17-X 2023
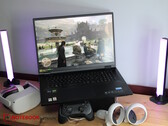
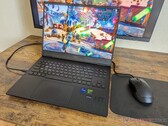
HP Omen Transcend 16: NVIDIA GeForce RTX 4070 Laptop GPU, 16.00", 2.3 kg
Autres tests » HP Omen Transcend 16
HP Omen Transcend 16-u0095ng: NVIDIA GeForce RTX 4070 Laptop GPU, 16.00", 2.2 kg
Autres tests » HP Omen Transcend 16-u0095ng
HP Omen 17-ck2940nz: NVIDIA GeForce RTX 4080 Laptop GPU, 17.30", 2.8 kg
Autres tests » HP Omen 17-ck2940nz
Lenovo Legion Pro 7 16IRX8H, i9-13900HX RTX 4090: NVIDIA GeForce RTX 4090 Laptop GPU, 16.00", 2.8 kg
Autres tests » Lenovo Legion Pro 7 16IRX8H, i9-13900HX RTX 4090
HP Omen 17-ck2004TX: NVIDIA GeForce RTX 4080 Laptop GPU, 17.30", 2.8 kg
Autres tests » HP Omen 17-ck2004TX
Lenovo Legion Pro 5 16IRX8, i9-13900HX RTX 4070: NVIDIA GeForce RTX 4070 Laptop GPU, 16.00", 2.6 kg
Autres tests » Lenovo Legion Pro 5 16IRX8, i9-13900HX RTX 4070
Acer Predator Triton 17X PTX17-71-99W5: NVIDIA GeForce RTX 4090 Laptop GPU, 17.00", 3 kg
Autres tests » Acer Predator Triton 17X PTX17-71-99W5
Lenovo Legion Pro 7 16IRX8H, i9-13900HX RTX 4070: NVIDIA GeForce RTX 4070 Laptop GPU, 16.00", 2.5 kg
Autres tests » Lenovo Legion Pro 7 16IRX8H, i9-13900HX RTX 4070
Acer Predator Helios 16 PH16-71: NVIDIA GeForce RTX 4070 Laptop GPU, 16.00", 2.7 kg
Autres tests » Acer Predator Helios 16 PH16-71
Schenker XMG Focus 15 (E23): NVIDIA GeForce RTX 4050 Laptop GPU, 15.60", 2.4 kg
Autres tests » Schenker XMG Focus 15 (E23)
HP Omen 17-ck2097ng: NVIDIA GeForce RTX 4080 Laptop GPU, 17.30", 2.8 kg
Autres tests » HP Omen 17-ck2097ng
Medion Erazer Major X20: NVIDIA GeForce RTX 4070 Laptop GPU, 16.00", 2.4 kg
Autres tests » Medion Erazer Major X20
Alienware m16 R1: NVIDIA GeForce RTX 4080 Laptop GPU, 16.00", 3.3 kg
Autres tests » Alienware m16 R1
Aorus 17X AZF: NVIDIA GeForce RTX 4090 Laptop GPU, 17.30", 2.9 kg
Autres tests » Aorus 17X AZF
Lenovo Legion Pro 7 16IRX8H: NVIDIA GeForce RTX 4080 Laptop GPU, 16.00", 2.7 kg
Autres tests » Lenovo Legion Pro 7 16IRX8H
Acer Predator Helios 16 2023 PH16-71-9705: NVIDIA GeForce RTX 4080 Laptop GPU, 16.00", 2.7 kg
Autres tests » Acer Predator Helios 16 2023 PH16-71-9705
Acer Predator Helios 18 2023 PH18-71-91U5: NVIDIA GeForce RTX 4080 Laptop GPU, 18.00", 3.3 kg
Autres tests » Acer Predator Helios 18 2023 PH18-71-91U5
Schenker XMG Neo 16 E23: NVIDIA GeForce RTX 4090 Laptop GPU, 16.00", 2.5 kg
Autres tests » Schenker XMG Neo 16 E23
Medion Erazer Beast X40: NVIDIA GeForce RTX 4090 Laptop GPU, 17.00", 2.9 kg
Autres tests » Medion Erazer Beast X40
Schenker XMG Focus 17 M25: NVIDIA GeForce RTX 5070 Ti Laptop, 17.30", 2.8 kg
» Le Focus 17 M25 de XMG avec la RTX 5070 Ti est actuellement l'ordinateur portable de jeu au meilleur rapport qualité-prix
HP Omen Transcend 16: NVIDIA GeForce RTX 4070 Laptop GPU, 16.00", 2.3 kg
» HP Omen Transcend 16 : trois pas en avant et un pas en arrière pour la série