Test du Lenovo Legion Pro 7 16IRX8H : un concentré de performances RTX 4080 haut de gamme

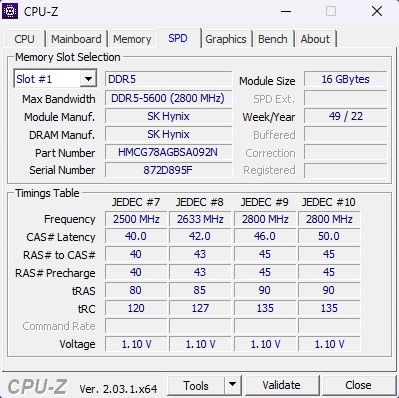
Avec un prix de détail proche de 4 000 €, le Lenovo Legion Pro 7 16IRX8H, que nous avons eu l'occasion de tester, ne peut pas vraiment être considéré comme une bonne affaire. Cependant, ce prix vous offre un Core i9-13900HX32 Go de DDR5-5600-RAM (2x 16 Go), et un SSD PCIe Gen 4x4 NVMe M.2 2280 de 1 To.
Le site GPU Nvidia GeForce RTX 4080 pour ordinateur portableavec 12 Go de GDDR6 VRAM prend en charge les tâches graphiques exigeantes. L'écran IPS mat au format 16:10 avec une résolution de 2560 x 1600 pixels est évalué pour atteindre 100% sRGB et 500 nits de luminosité maximale. Lenovo a équipé la dalle 240 Hz de la prise en charge de Nvidia G-Sync en plus d'AMD FreeSync, ce qui est une bonne chose.
Windows 11 Home est installé comme système d'exploitation de choix.
La principale concurrence du Lenovo Legion 7 Pro est jusqu'à présent leRazer Blade 16 Early 2023mais il est également intéressant de voir comment l'ordinateur portable se comporte par rapport à la génération précédente. Par conséquent, nous incluons également Legion 7 SKUs présentant les combinaisons suivantes :Core i9-12900HXetRTX 3080 Ti, Ryzen 9 5900HXetRTX 3080et les Ryzen 9 6900HXet RX 6850M XT.
Comparaison avec les concurrents potentiels
Note | Date | Modèle | Poids | Épaisseur | Taille | Résolution | Prix |
|---|---|---|---|---|---|---|---|
| 89.4 % v7 (old) | 02/23 | Lenovo Legion Pro 7 16IRX8H i9-13900HX, GeForce RTX 4080 Laptop GPU | 2.7 kg | 26 mm | 16.00" | 2560x1600 | |
| 91.2 % v7 (old) | 02/23 | Razer Blade 16 Early 2023 i9-13950HX, GeForce RTX 4080 Laptop GPU | 2.4 kg | 21.99 mm | 16.00" | 2560x1600 | |
| 88.9 % v7 (old) | 09/22 | Lenovo Legion 7 16IAX7-82TD004SGE i9-12900HX, GeForce RTX 3080 Ti Laptop GPU | 2.6 kg | 20 mm | 16.00" | 2560x1600 | |
| 88.1 % v7 (old) | 06/21 | Lenovo Legion 7 16ACHg6 R9 5900HX, GeForce RTX 3080 Laptop GPU | 2.5 kg | 23.5 mm | 16.00" | 2560x1600 | |
| 90.8 % v7 (old) | 09/22 | Lenovo Legion 7 16ARHA7 R9 6900HX, Radeon RX 6850M XT | 2.6 kg | 19.4 mm | 16.00" | 2560x1600 |
Cas : Pas très différent de son prédécesseur
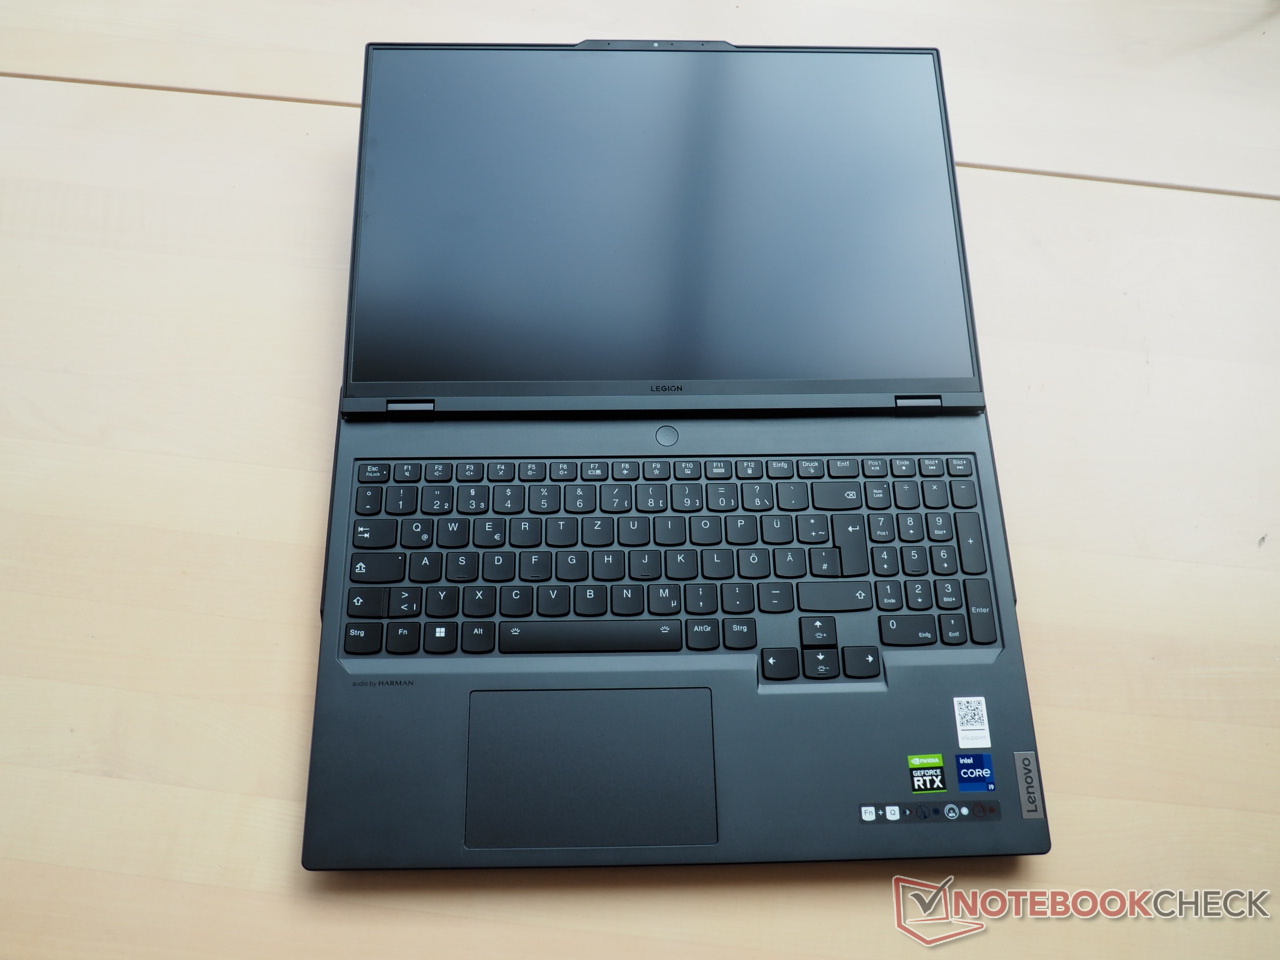
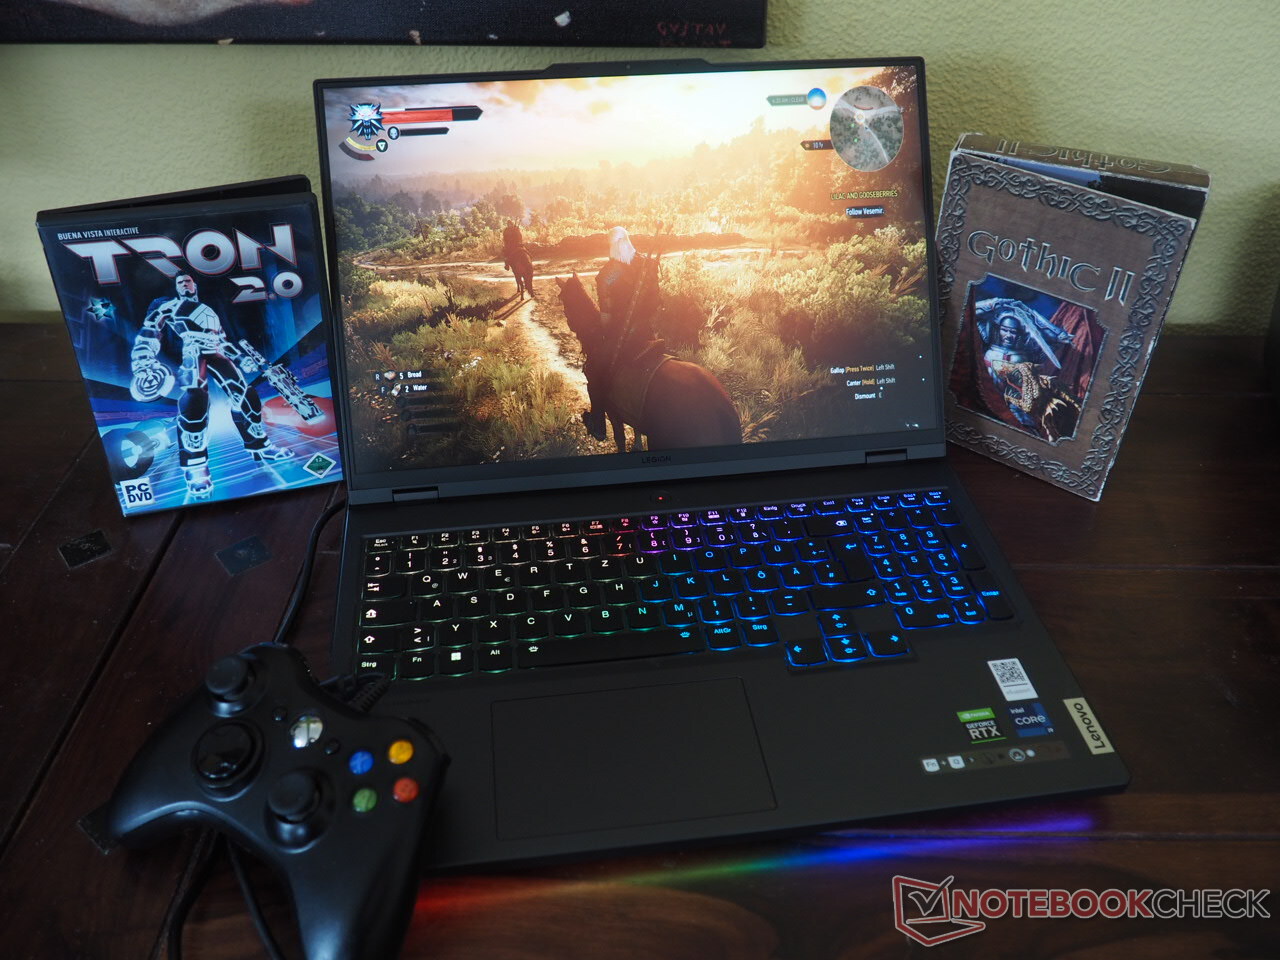
La conception du châssis est assez similaire à celle de son prédécesseur, le Legion 7 16ARHA7avec quelques légères modifications telles que les aérations latérales et arrière redessinées. Même avec ces changements, la conception du châssis reste bonne. La stabilité et la résistance des charnières, qui peuvent s'ouvrir à 180°, sont également supérieures à la moyenne de la catégorie.
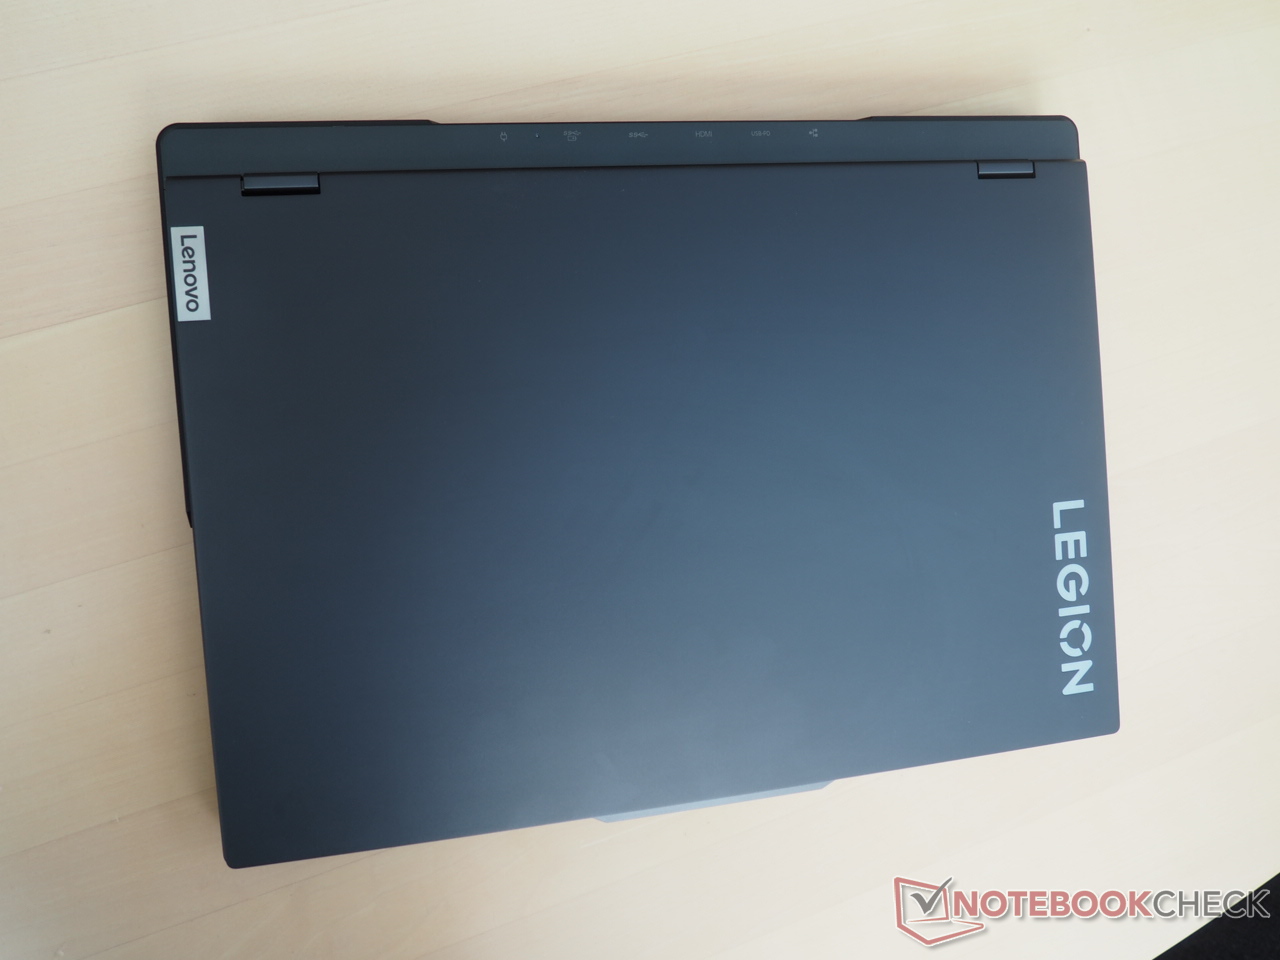
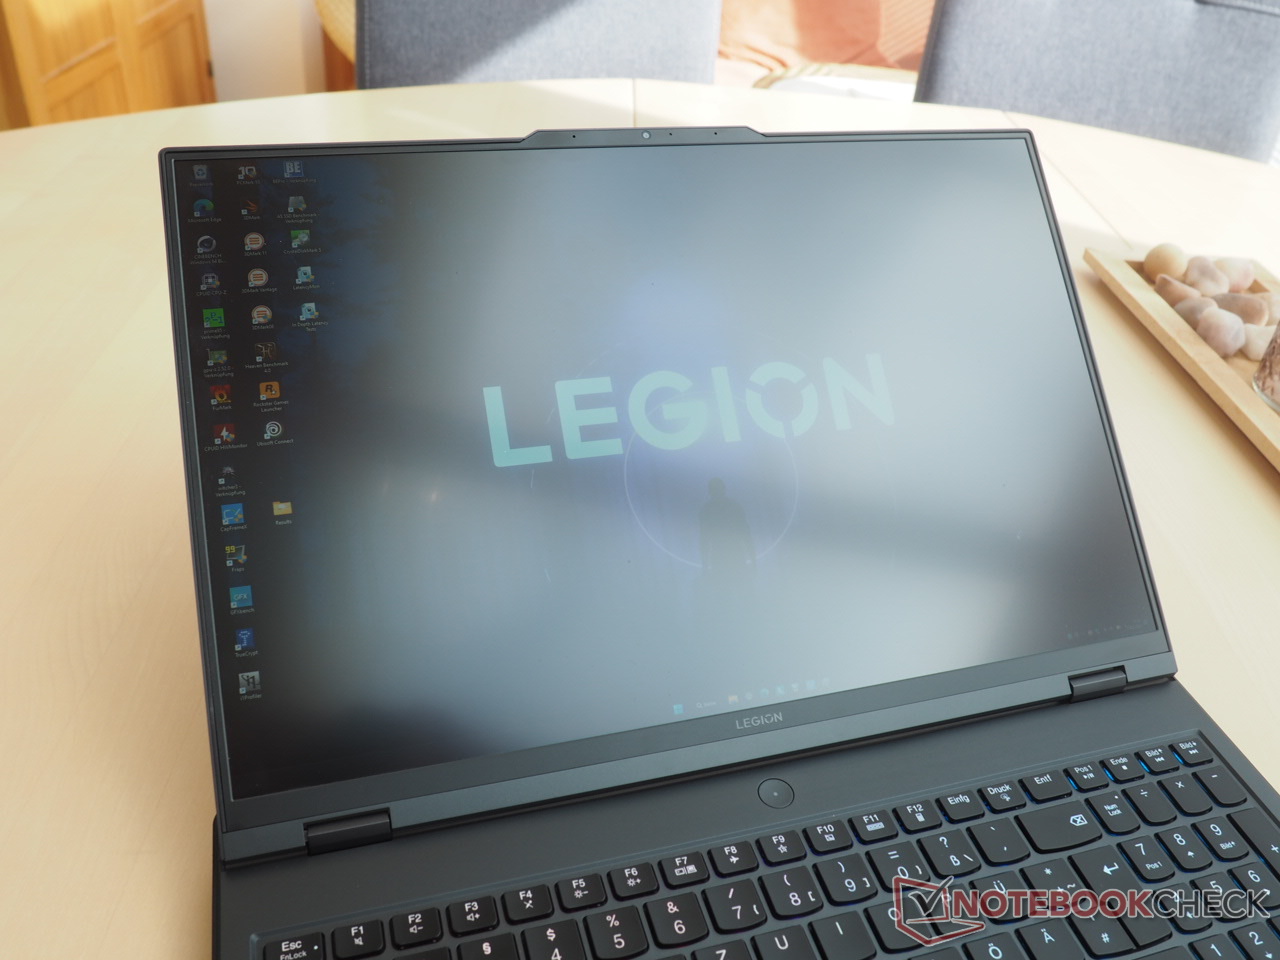
La qualité générale est excellente. Le couvercle métallique, en particulier, est élégant, mais il peut rapidement devenir un aimant à empreintes digitales. Lorsqu'il est éteint, le look est plutôt discret, à l'exception du marquage Legion sur le couvercle.
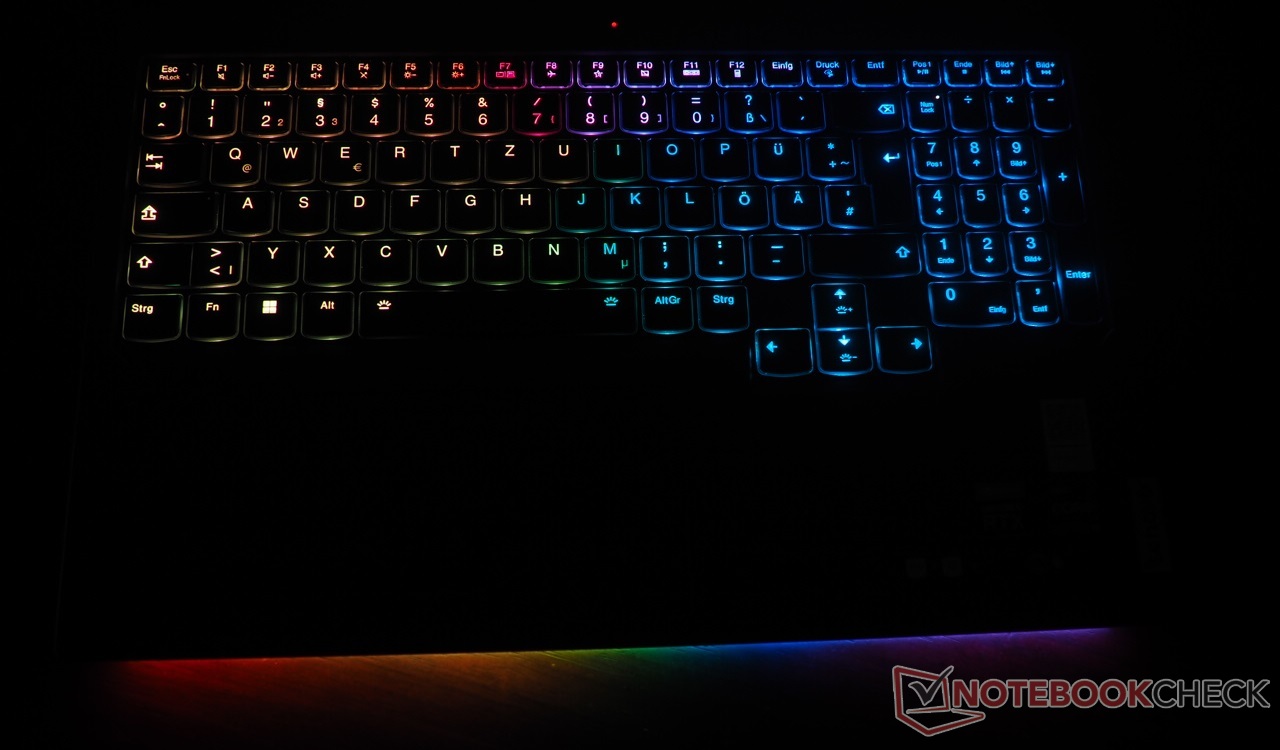
En cours d'utilisation, cependant, le Legion 7 Pro peut être immédiatement reconnu comme un ordinateur portable de jeu grâce au clavier éclairé RGB et à la bande de LED à l'avant.
À environ 2,7 kg, le Legion 7 Pro de 16 pouces a tendance à être l'un des ordinateurs portables les plus lourds de sa catégorie (le Razer Blade 16 pèse 300 g de moins). De même, la hauteur de 2,6 cm est supérieure d'environ 4 mm à celle du Blade 16, ce qui devrait théoriquement contribuer à un meilleur refroidissement.
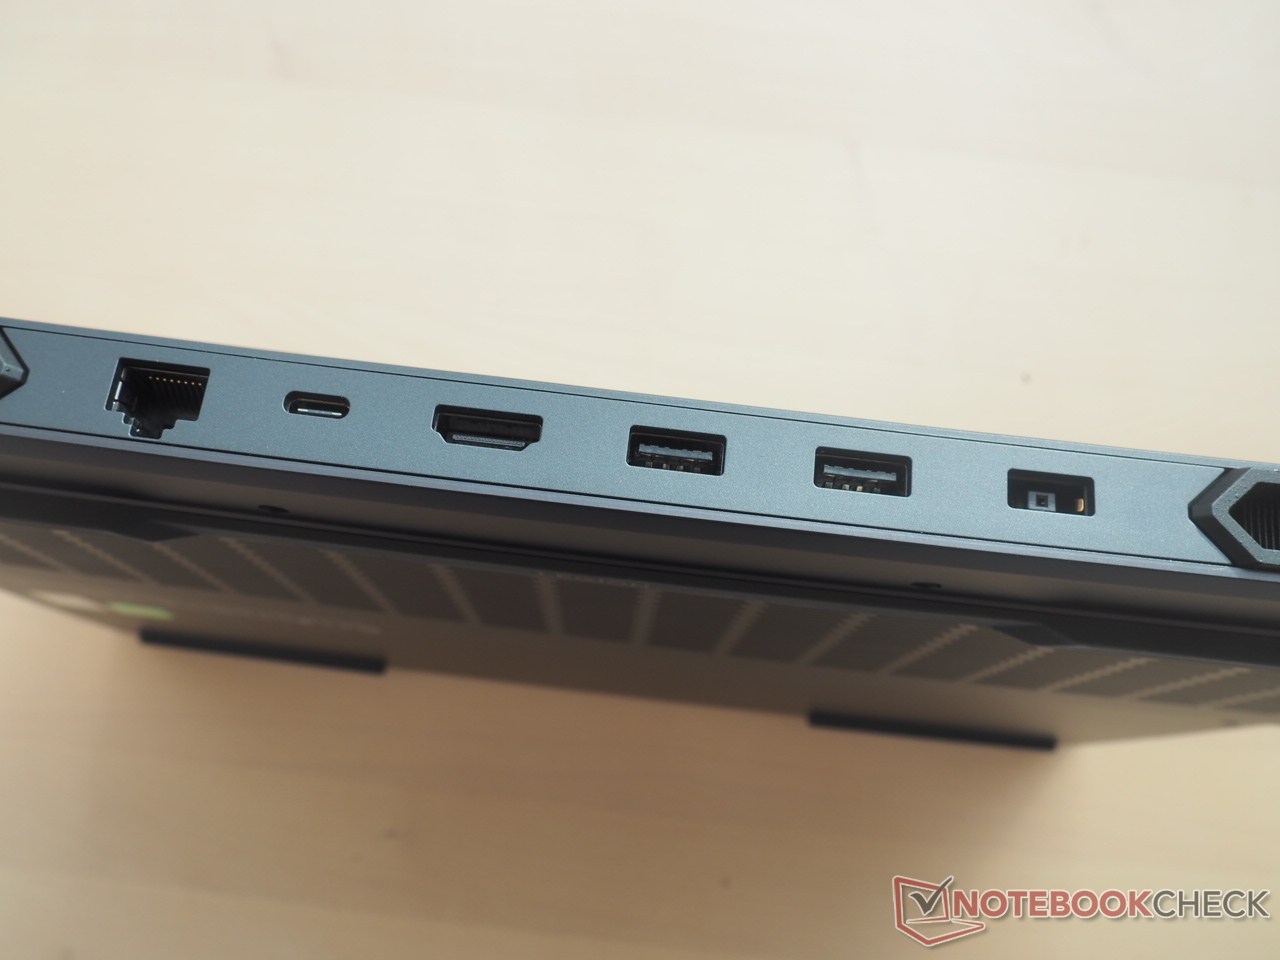
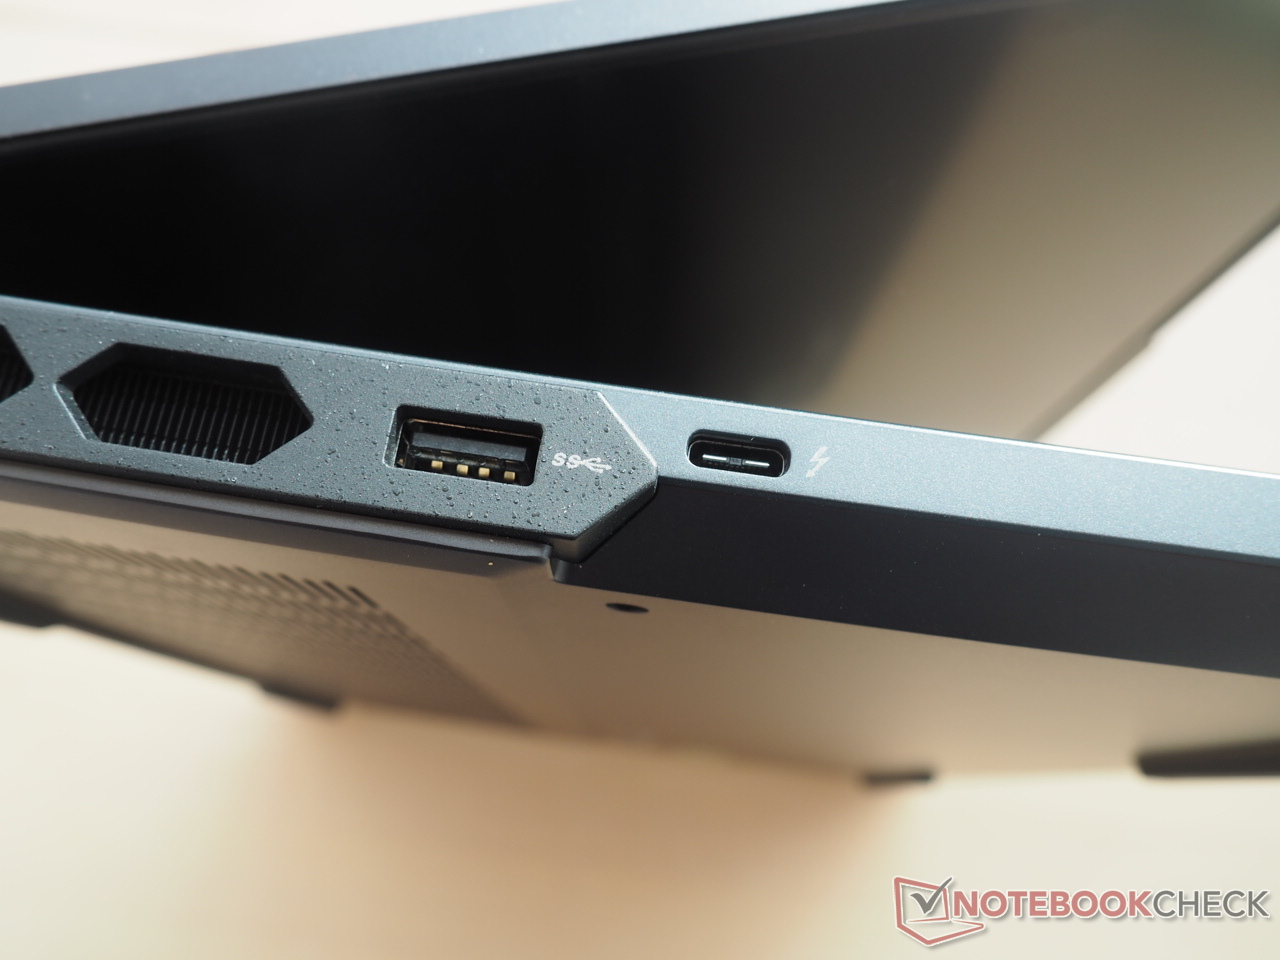
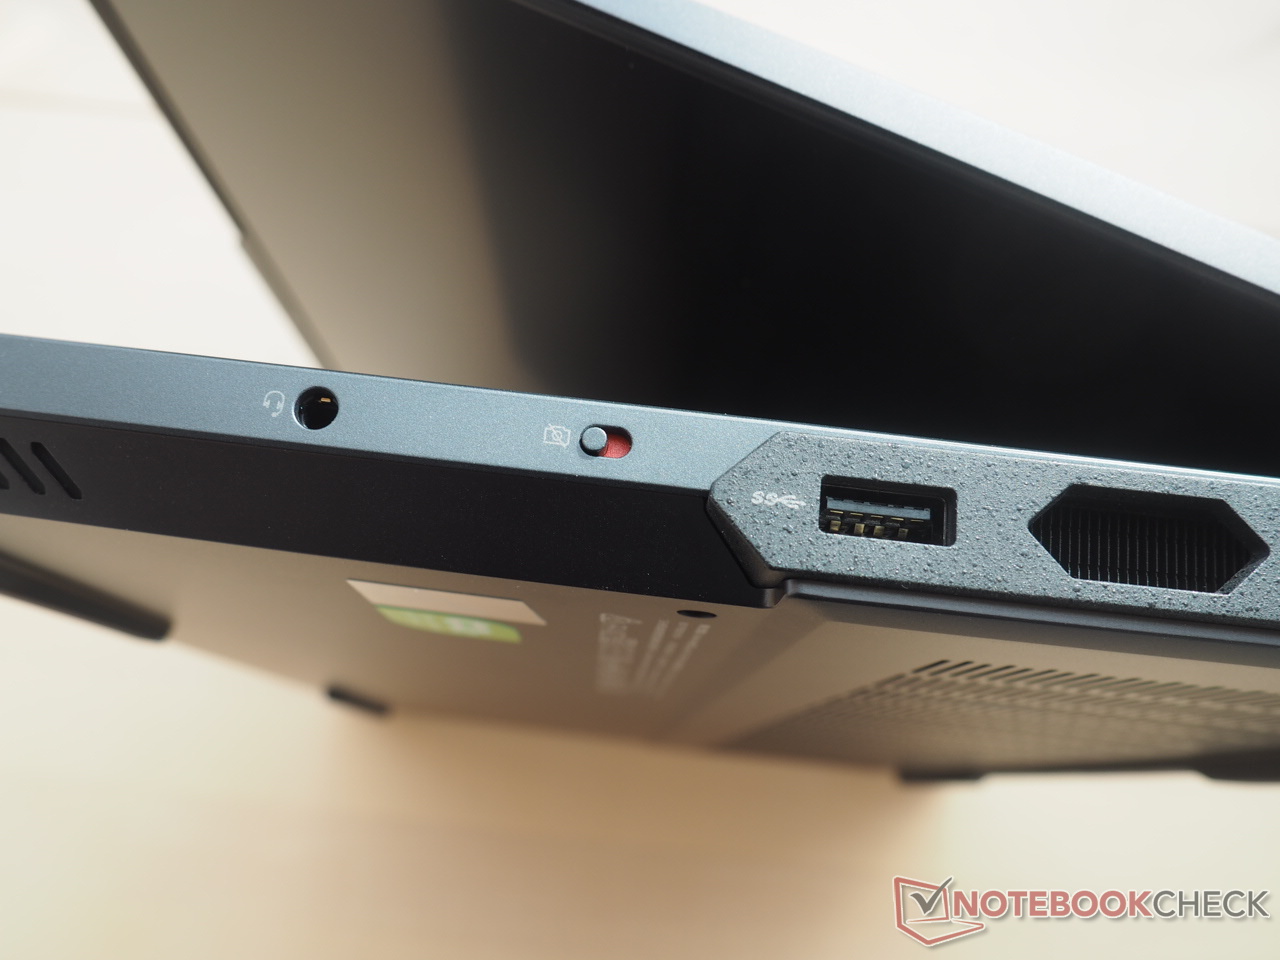
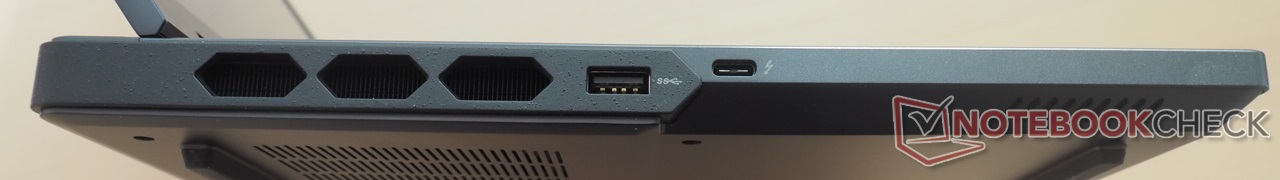
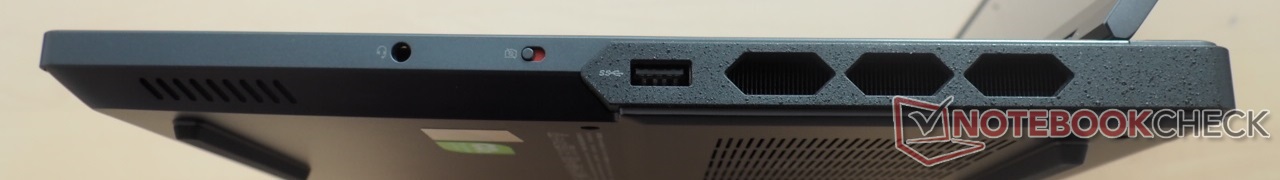
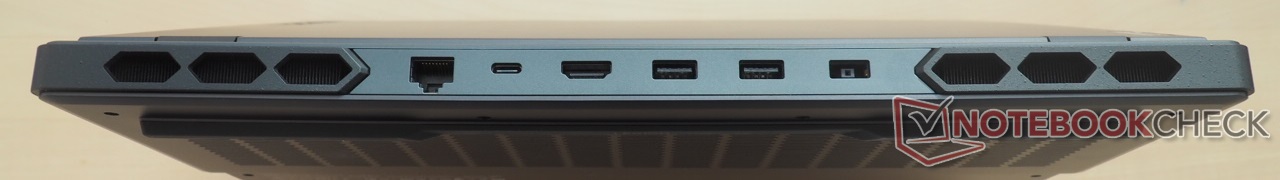
Connectivité : Un grand nombre de ports USB
Ports
Le Legion 7 Pro impressionne par l'abondance de ses ports. Au total, six ports USB sont disponibles (2x Type-C, 4x Type-A), ce qui n'est pas souvent le cas, même sur les ordinateurs portables de jeu haut de gamme. Trois écrans externes peuvent être connectés grâce à la prise en charge de la sortie HDMI 2.1 et de la sortie DisplayPort sur les deux ports USB Type-C. La puissance de 140 W délivrée via l'USB Type-C est également impressionnante.
Un port RJ-45, et une prise audio complètent la sélection de ports. La présence d'un interrupteur d'obturateur de webcam physique sur le côté droit est un plus. Le seul bémol du Legion 7 Pro est l'absence d'un lecteur de cartes.
La majorité des ports étant situés à l'arrière de l'appareil, les gauchers comme les droitiers en auront pour leur argent lorsqu'ils utiliseront une souris de jeu filaire.
Communication
Nous n'avons pas constaté de divergences au niveau des performances Wi-Fi. Le Legion Pro 7 a atteint un débit de 1 600 Mb/s à une distance de 1 m de notre routeur de référence Asus ROG Rapture GT-AXE11000, ce qui correspond à une très bonne transmission et réception. Le Razer Blade 16 se contente de quelques 100 Mb/s de débit en moins.
Webcam
La qualité de la webcam est légèrement supérieure à la moyenne. L'appareil photo de 2 mégapixels offre une netteté d'image décente et une précision des couleurs passable, ce qui est acceptable pour un ordinateur portable (les normes ici sont très pauvres, malheureusement).


Accessoires
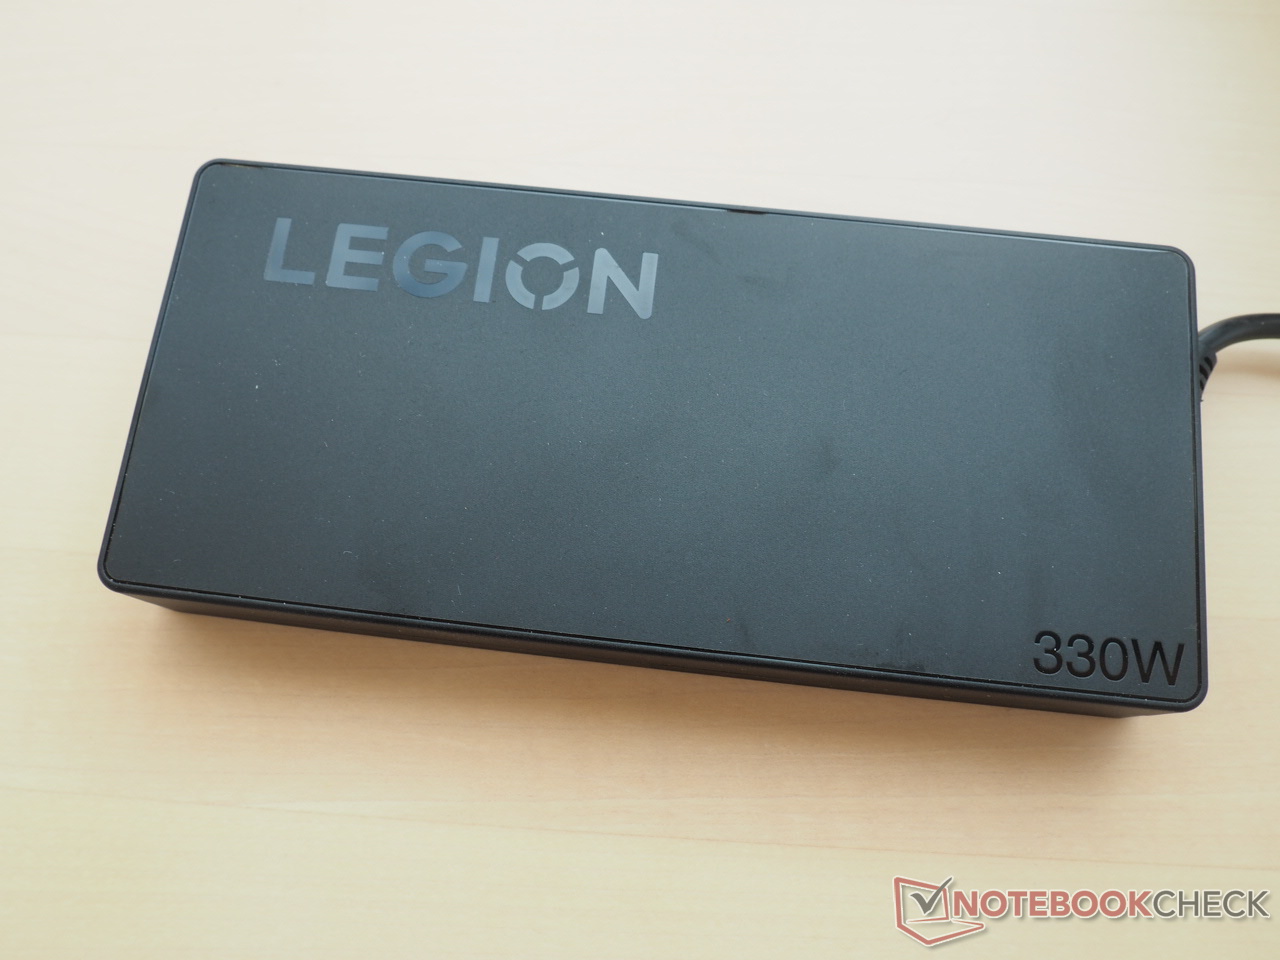
La livraison comprend un bloc d'alimentation massif de 800 g qui mesure 18,5 x 8 x 2,5 cm, ce qui est conforme à ce que l'on attend d'un modèle de 330 W. Quelques brochures d'information sont fournies en standard.
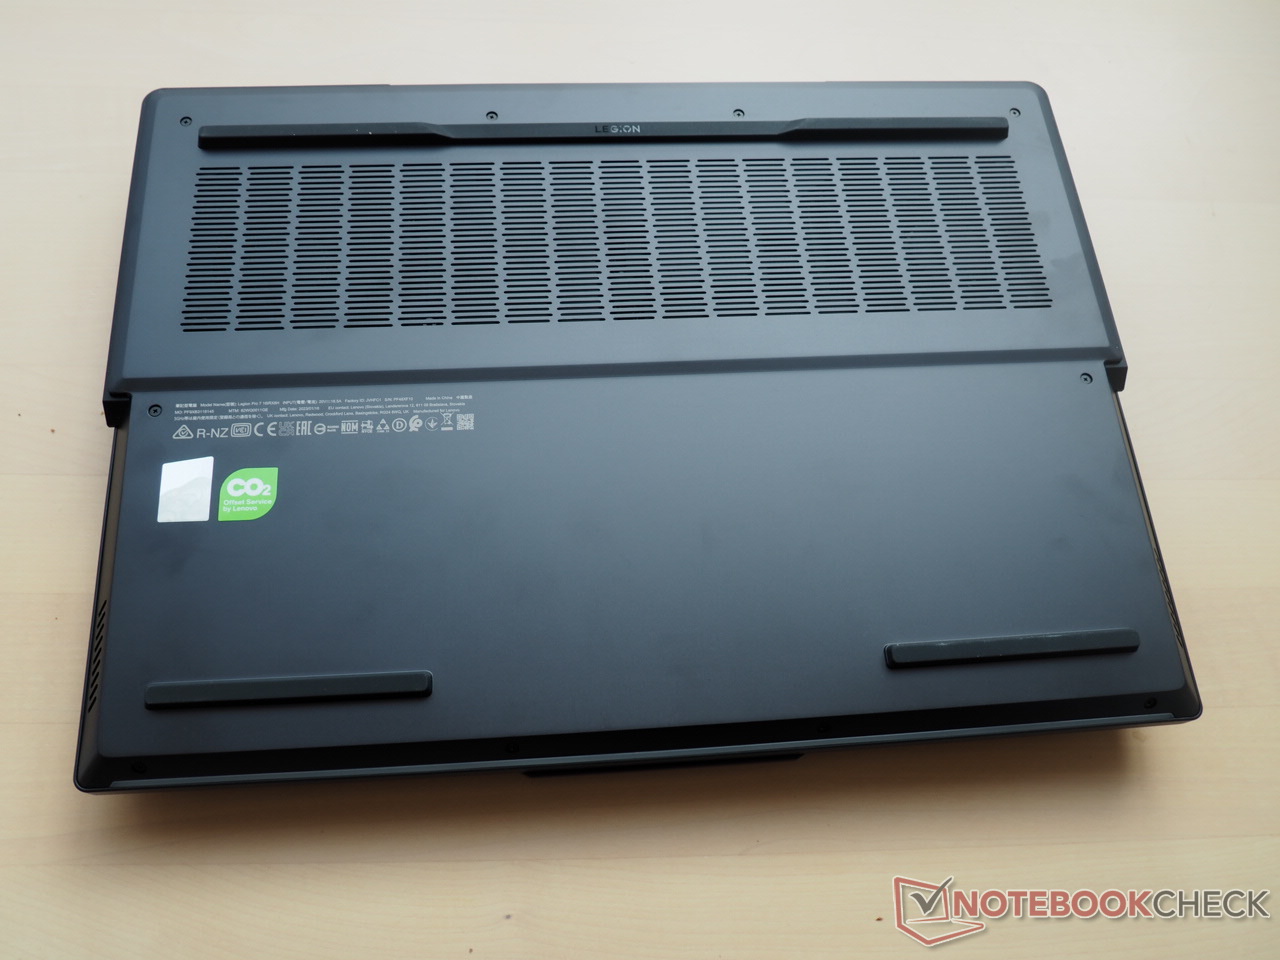
Maintenance
Lenovo aurait pu rendre le démontage du Legion 7 Pro plus convivial. Même après avoir retiré toutes les vis du boîtier, la plaque de base est si serrée (surtout à l'arrière) que l'on peut craindre d'endommager le châssis si l'on applique trop de force.
Pour cette raison, et parce qu'il s'agit d'un échantillon vendu au détail dans le magasin, nous n'avons pas essayé d'ouvrir l'ordinateur portable par sécurité.
Garantie
Selon les informations fournies par le fabricant en Allemagne, la garantie du Legion 7 Pro peut être étendue à plus de trois ans avec Premium Care.
Périphériques d'entrée : Pas vraiment de quoi se plaindre
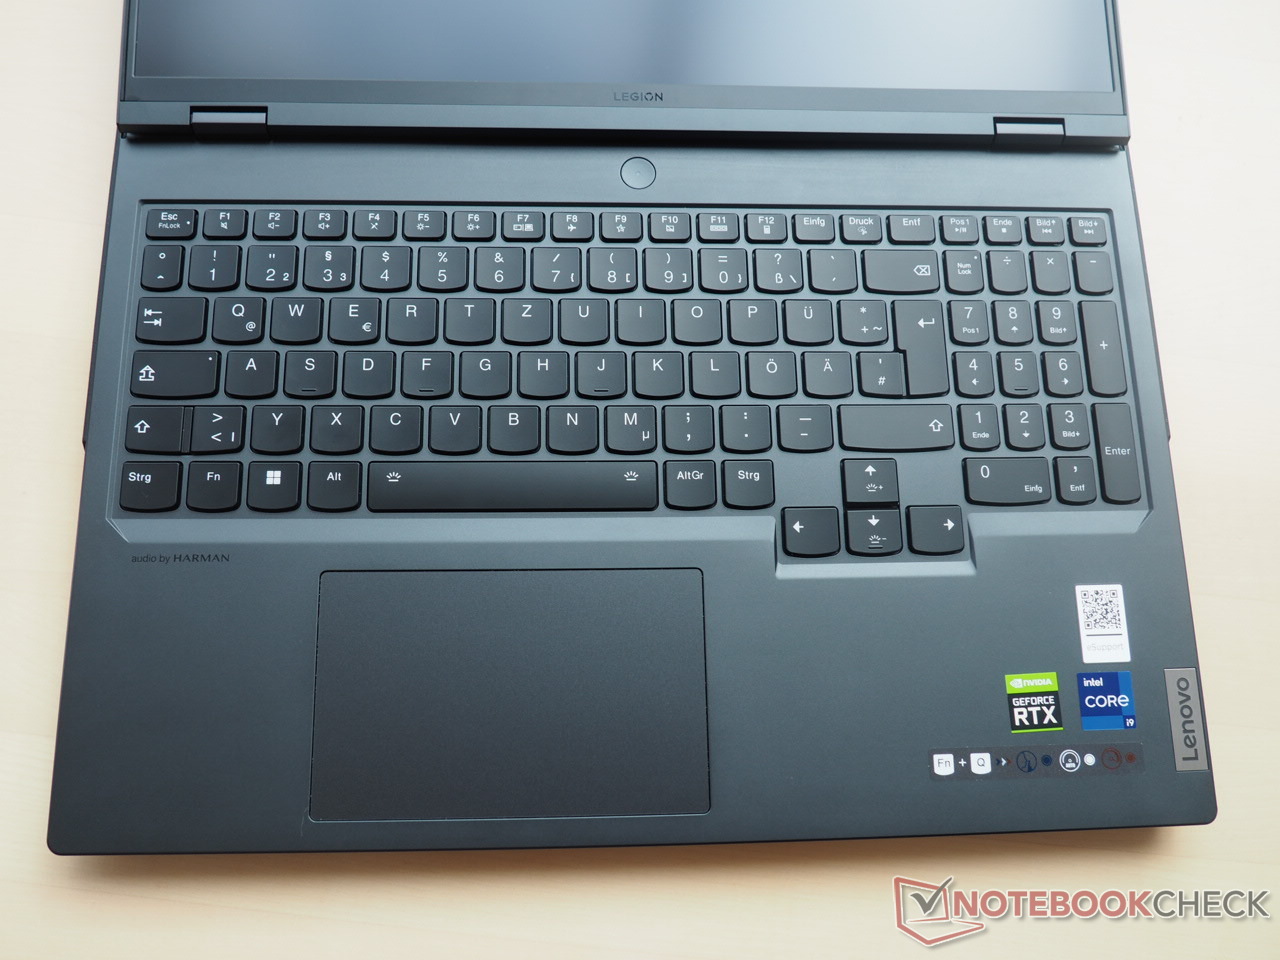
Clavier
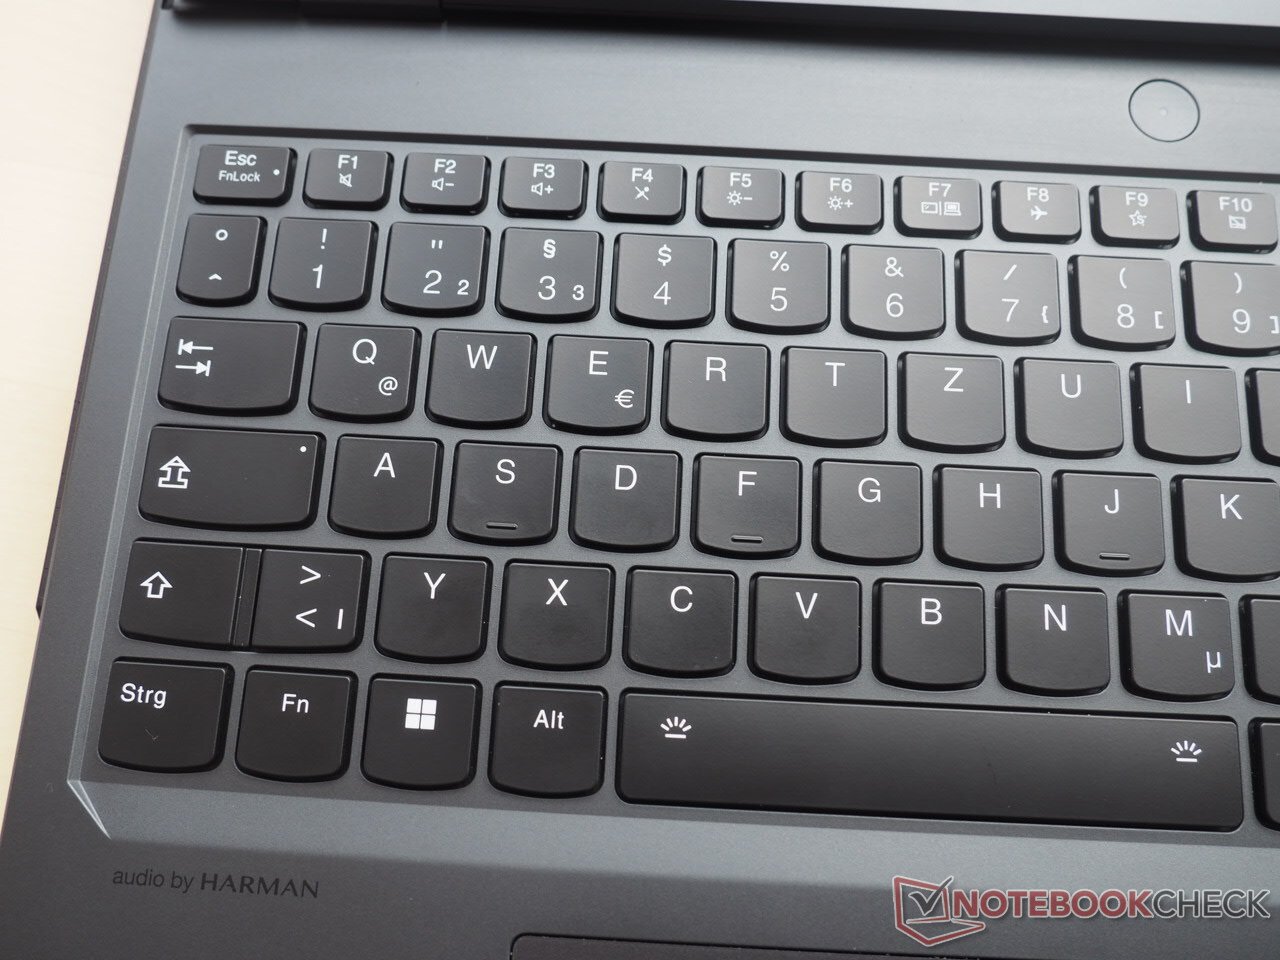
Le clavier n'offre que peu de possibilités de réclamation. Les touches typiques du style Lenovo avec des bords inférieurs incurvés assurent une expérience de frappe agréable après une certaine familiarisation. L'actionnement et le point de pression sont assez bons, bien qu'ils ne soient pas vraiment proches du niveau d'un clavier mécanique.
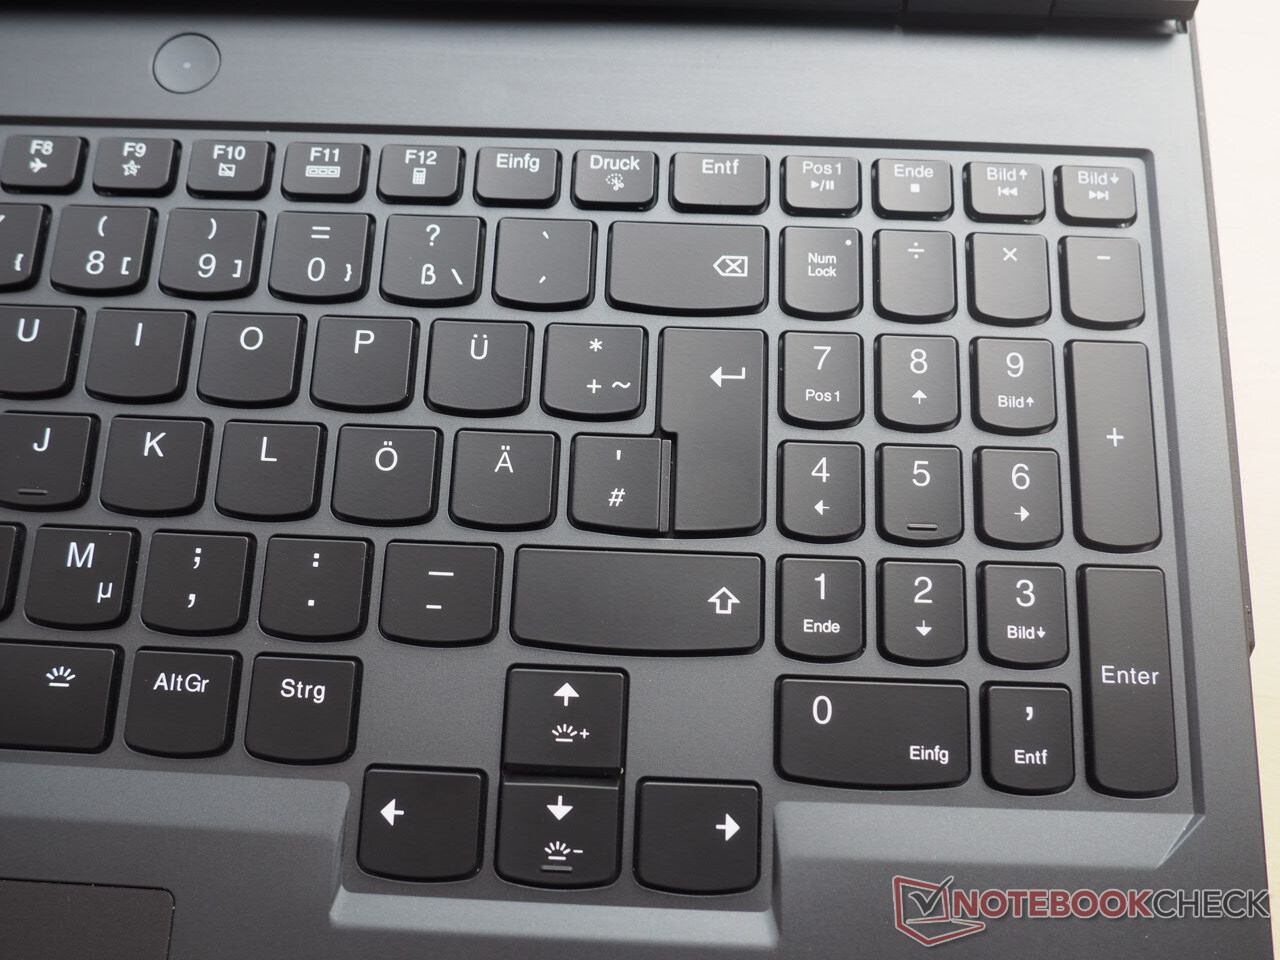
La disposition du clavier est, à notre avis, convaincante. Ceux qui comptent beaucoup sur les touches fléchées peuvent s'attendre à un dimensionnement décent. Un pavé numérique à part entière est également disponible. L'étiquetage clair des touches signifie que vous pouvez éteindre le rétroéclairage pendant la journée. Sinon, le rétroéclairage offre une intensité utile et plusieurs modes de réglage.
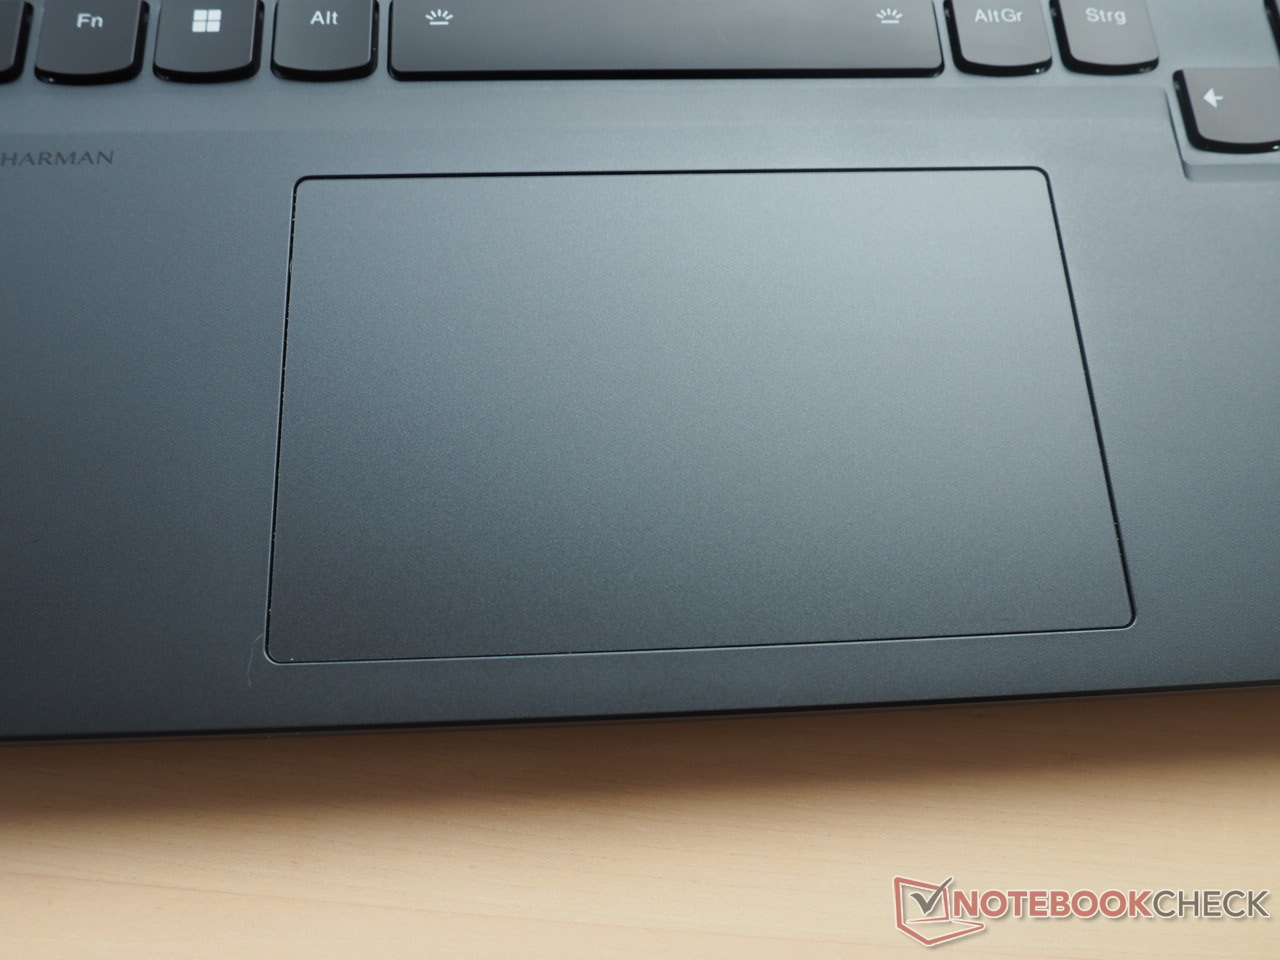
Pavé tactile
Le pavé tactile lisse de 12 x 7,5 cm semble suffisant pour un appareil de 16 pouces et est placé relativement loin sur la gauche. Nous n'avons constaté aucun problème de précision et de glissement, ce qui permet un fonctionnement fluide.
Les zones de clic situées près du bas sont très stables et peuvent être facilement déclenchées, mais le son est assez fort et irrégulier.
Affichage : panneau de 240 Hz avec des niveaux de luminosité élevés et sans PWM
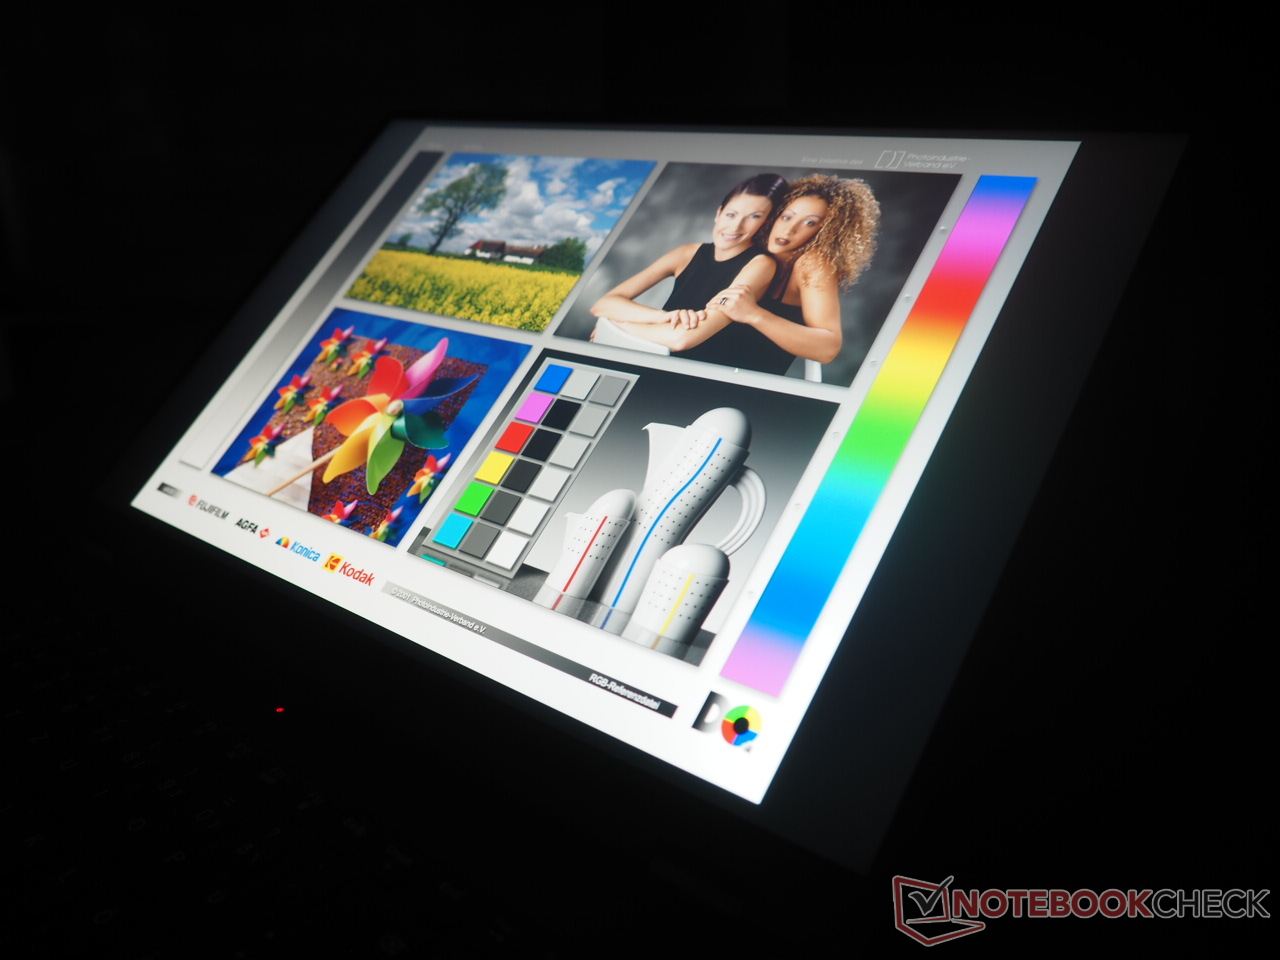
La dalle WQXGA 240 Hz du Legion 7 Pro offre une luminosité moyenne élevée de 469 cd/m2, ce qui devrait être de bon augure pour un affichage en extérieur. Cependant, la concurrence offre également des niveaux de luminosité similaires.
| |||||||||||||||||||||||||
Homogénéité de la luminosité: 86 %
Valeur mesurée au centre, sur batterie: 511 cd/m²
Contraste: 1278:1 (Valeurs des noirs: 0.4 cd/m²)
ΔE ColorChecker Calman: 0.95 | ∀{0.5-29.43 Ø4.73}
calibrated: 0.91
ΔE Greyscale Calman: 0.6 | ∀{0.09-98 Ø4.97}
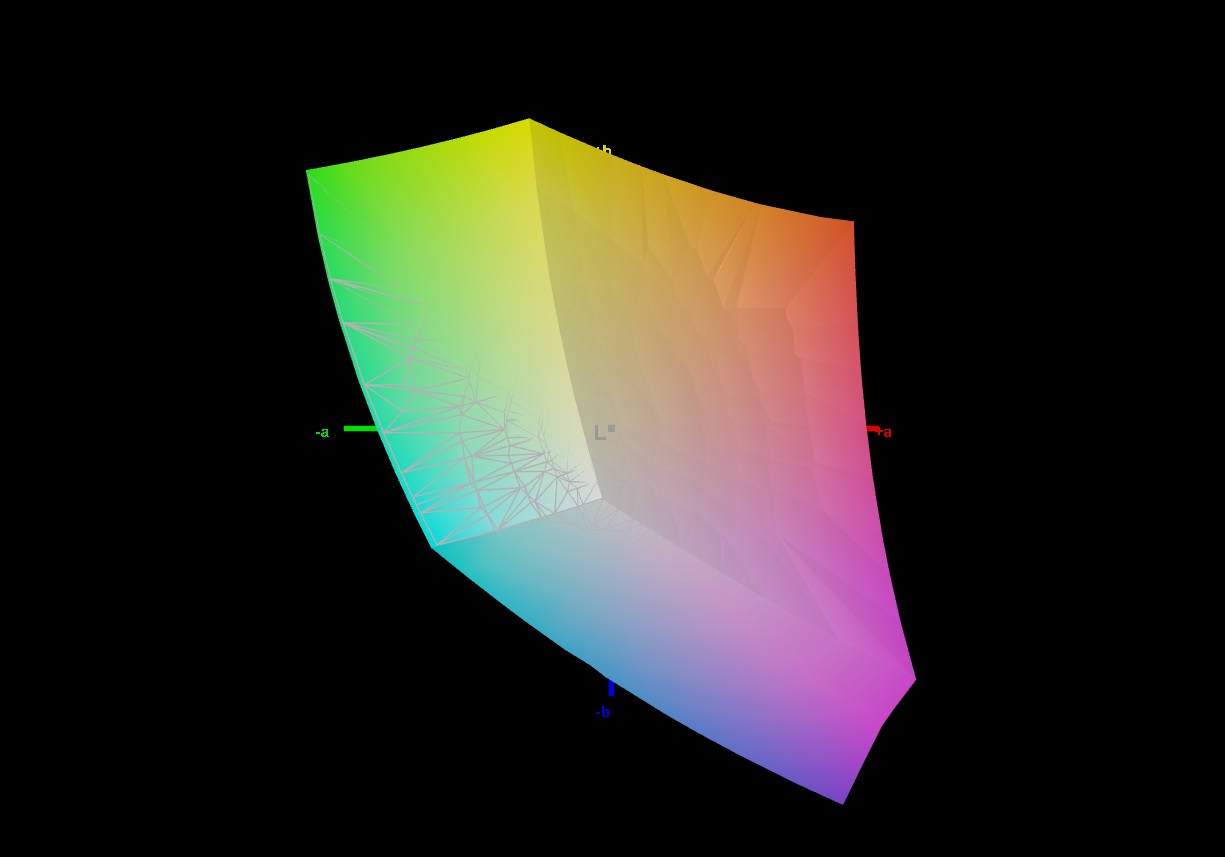
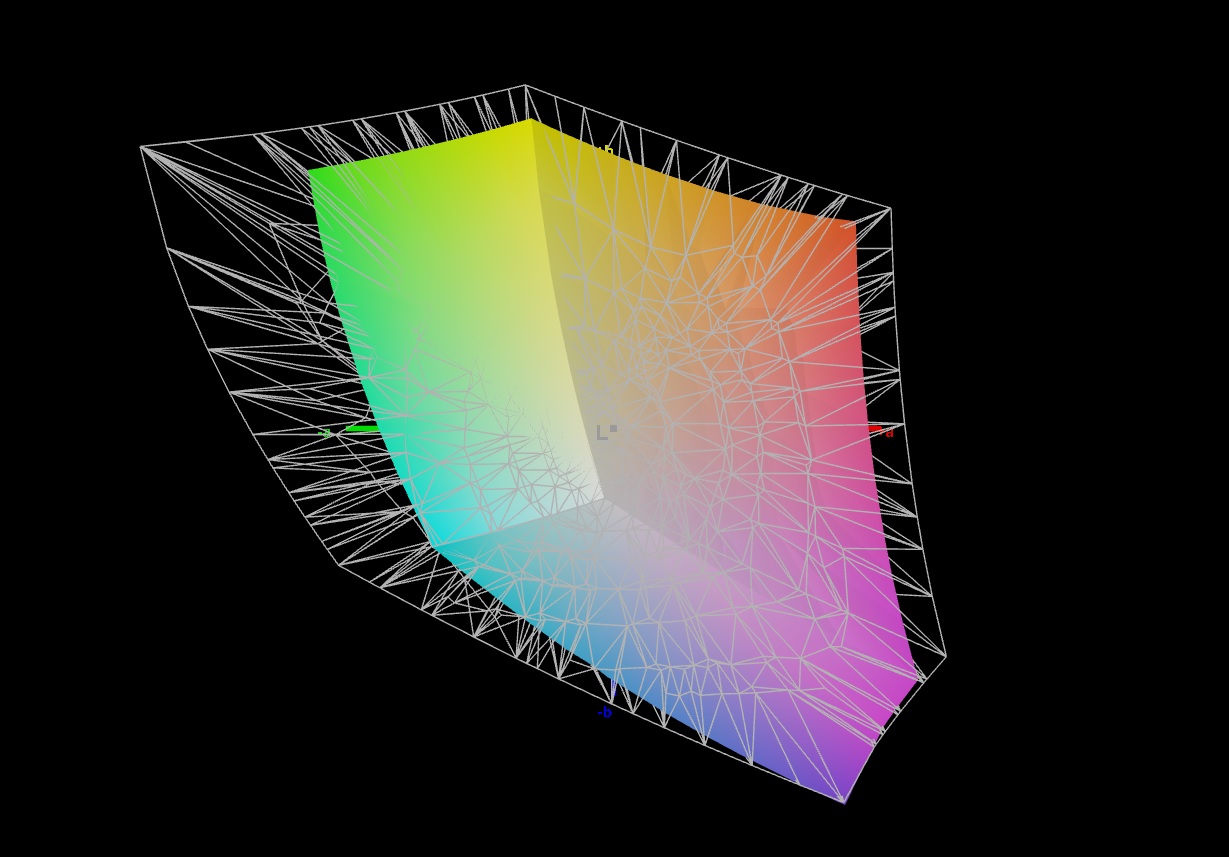
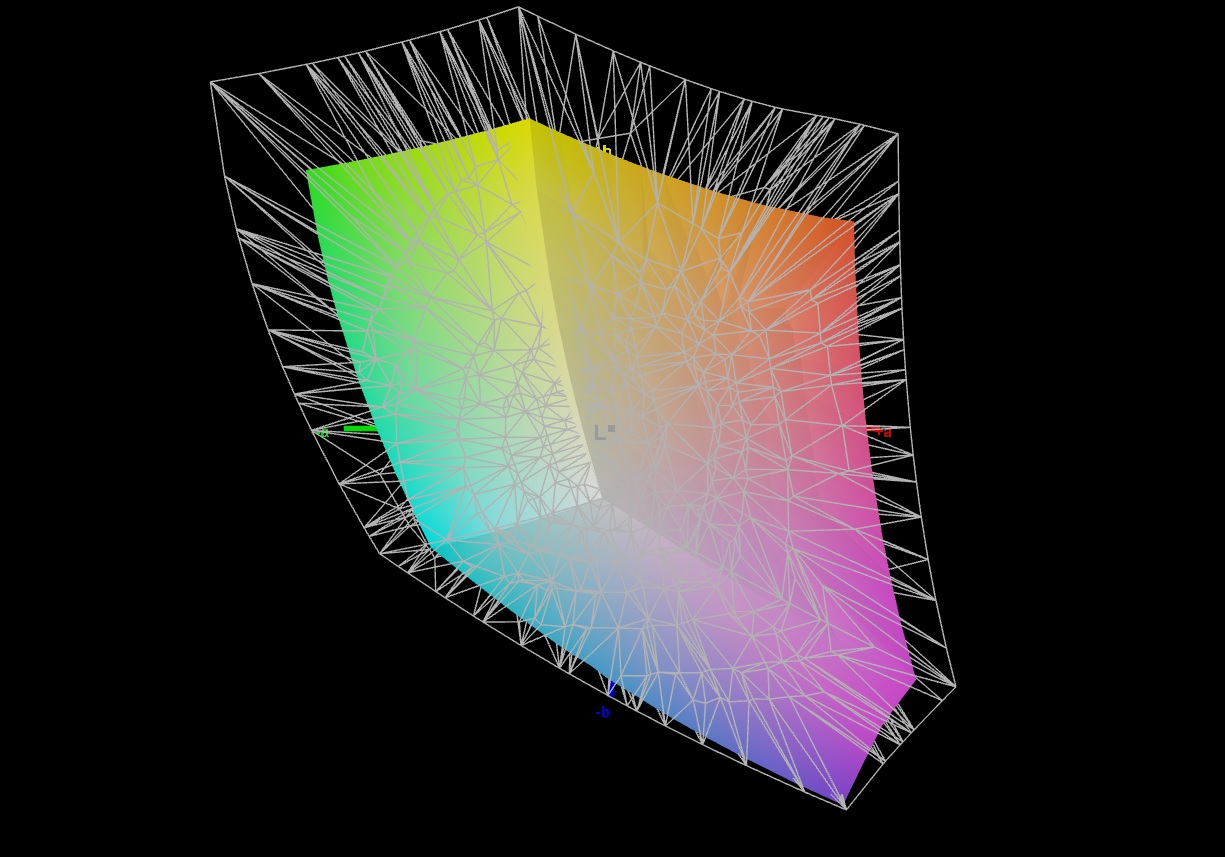
71.2% AdobeRGB 1998 (Argyll 3D)
99.7% sRGB (Argyll 3D)
69.1% Display P3 (Argyll 3D)
Gamma: 2.176
CCT: 6545 K
| Lenovo Legion Pro 7 16IRX8H MNG007DA2-3 (CSO1628), IPS, 2560x1600, 16" | Razer Blade 16 Early 2023 CSOT T3 MNG007DA4-1, IPS, 2560x1600, 16" | Lenovo Legion 7 16IAX7-82TD004SGE NE160QDM-NY1, IPS, 2560x1600, 16" | Lenovo Legion 7 16ACHg6 CSOT T3 MNG007DA1-1, IPS, 2560x1600, 16" | Lenovo Legion 7 16ARHA7 BOE CQ NE160QDM-NY1, IPS, 2560x1600, 16" | |
|---|---|---|---|---|---|
| Display | 23% | -1% | 1% | -7% | |
| Display P3 Coverage (%) | 69.1 | 98.5 43% | 69.3 0% | 70.3 2% | 63.7 -8% |
| sRGB Coverage (%) | 99.7 | 100 0% | 98.2 -2% | 99.4 0% | 95.3 -4% |
| AdobeRGB 1998 Coverage (%) | 71.2 | 89.7 26% | 70.8 -1% | 72.7 2% | 65.7 -8% |
| Response Times | -29% | 2% | -11% | -19% | |
| Response Time Grey 50% / Grey 80% * (ms) | 12.3 ? | 6.6 ? 46% | 12.6 ? -2% | 14 ? -14% | 9.2 ? 25% |
| Response Time Black / White * (ms) | 5.9 ? | 12 ? -103% | 5.6 ? 5% | 6.4 ? -8% | 9.6 ? -63% |
| PWM Frequency (Hz) | |||||
| Screen | -90% | -87% | -27% | -74% | |
| Brightness middle (cd/m²) | 511 | 456.8 -11% | 547 7% | 489 -4% | 478.8 -6% |
| Brightness (cd/m²) | 469 | 437 -7% | 523 12% | 469 0% | 477 2% |
| Brightness Distribution (%) | 86 | 83 -3% | 88 2% | 92 7% | 90 5% |
| Black Level * (cd/m²) | 0.4 | 0.35 13% | 0.44 -10% | 0.38 5% | 0.43 -8% |
| Contrast (:1) | 1278 | 1305 2% | 1243 -3% | 1287 1% | 1113 -13% |
| Colorchecker dE 2000 * | 0.95 | 3.7 -289% | 2.1 -121% | 1.45 -53% | 2.24 -136% |
| Colorchecker dE 2000 max. * | 2.07 | 6.42 -210% | 7 -238% | 2.16 -4% | 4.49 -117% |
| Colorchecker dE 2000 calibrated * | 0.91 | 0.66 27% | 0.9 1% | 1.16 -27% | 1.89 -108% |
| Greyscale dE 2000 * | 0.6 | 2.6 -333% | 3.2 -433% | 1.6 -167% | 2.3 -283% |
| Gamma | 2.176 101% | 2.3 96% | 2.23 99% | 2.197 100% | 2.25 98% |
| CCT | 6545 99% | 6108 106% | 6979 93% | 6377 102% | 6955 93% |
| Color Space (Percent of AdobeRGB 1998) (%) | 73 | ||||
| Color Space (Percent of sRGB) (%) | 94 | ||||
| Moyenne finale (programmes/paramètres) | -32% /
-57% | -29% /
-56% | -12% /
-19% | -33% /
-52% |
* ... Moindre est la valeur, meilleures sont les performances
Le taux de contraste de 1 278:1 est similaire à celui du Blade 16. Cependant, le produit phare de Razer offre une meilleure couverture de la gamme de couleurs. Le Legion Pro 7 peut gérer 100 % de sRGB mais n'est pas à la hauteur lorsqu'il s'agit de la couverture Adobe RGB et Display P3.
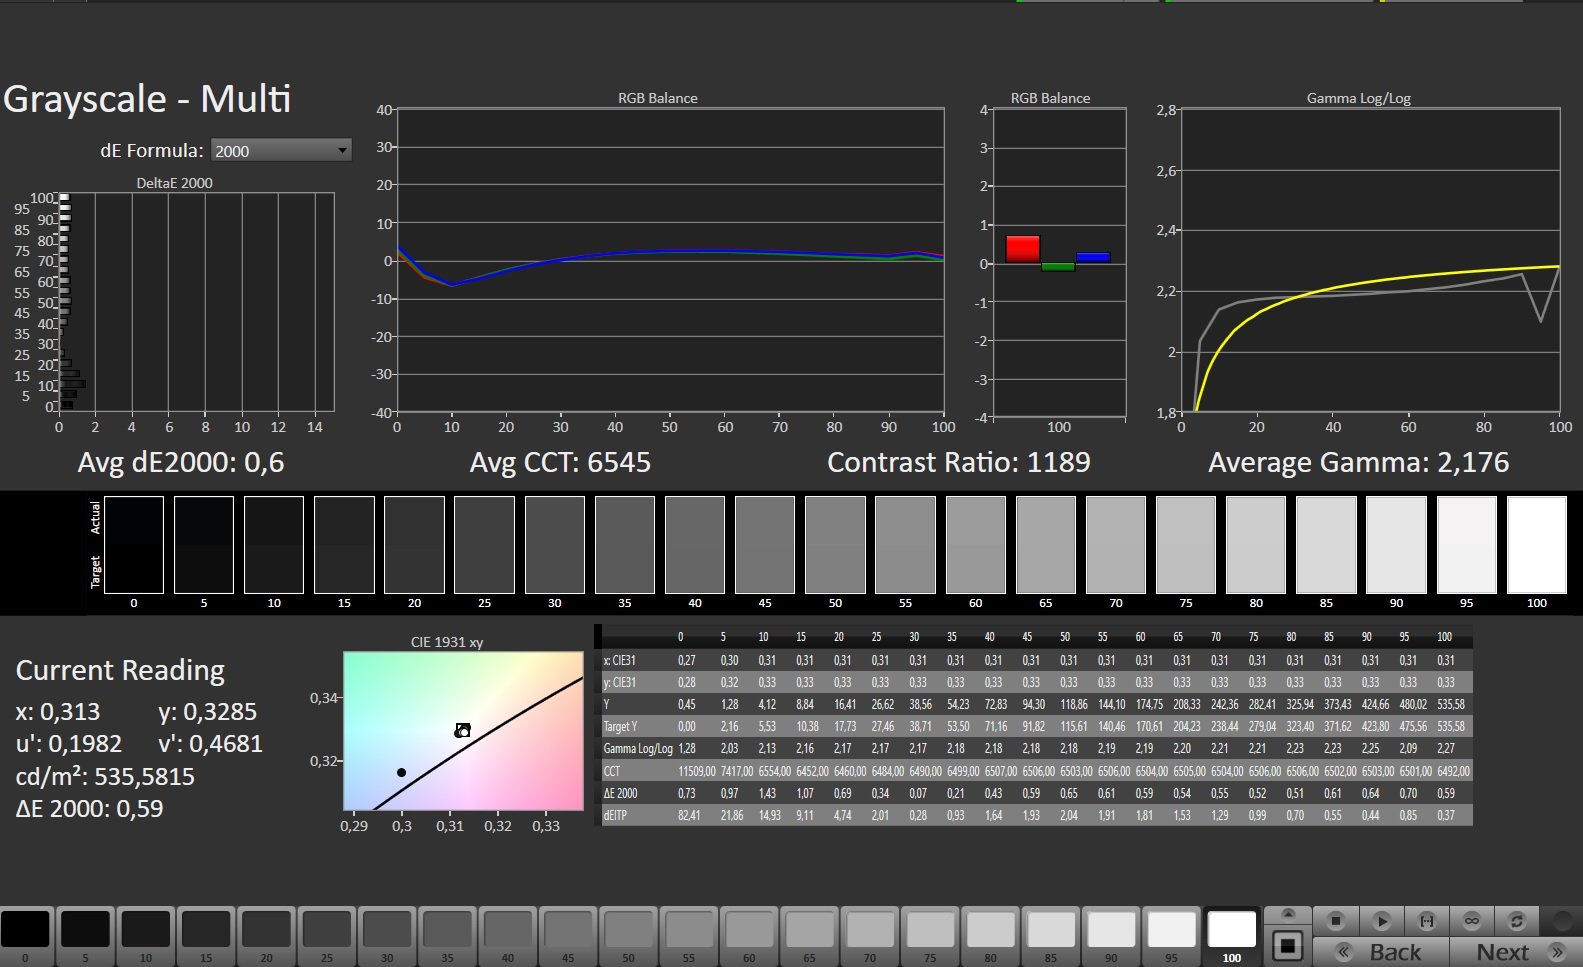
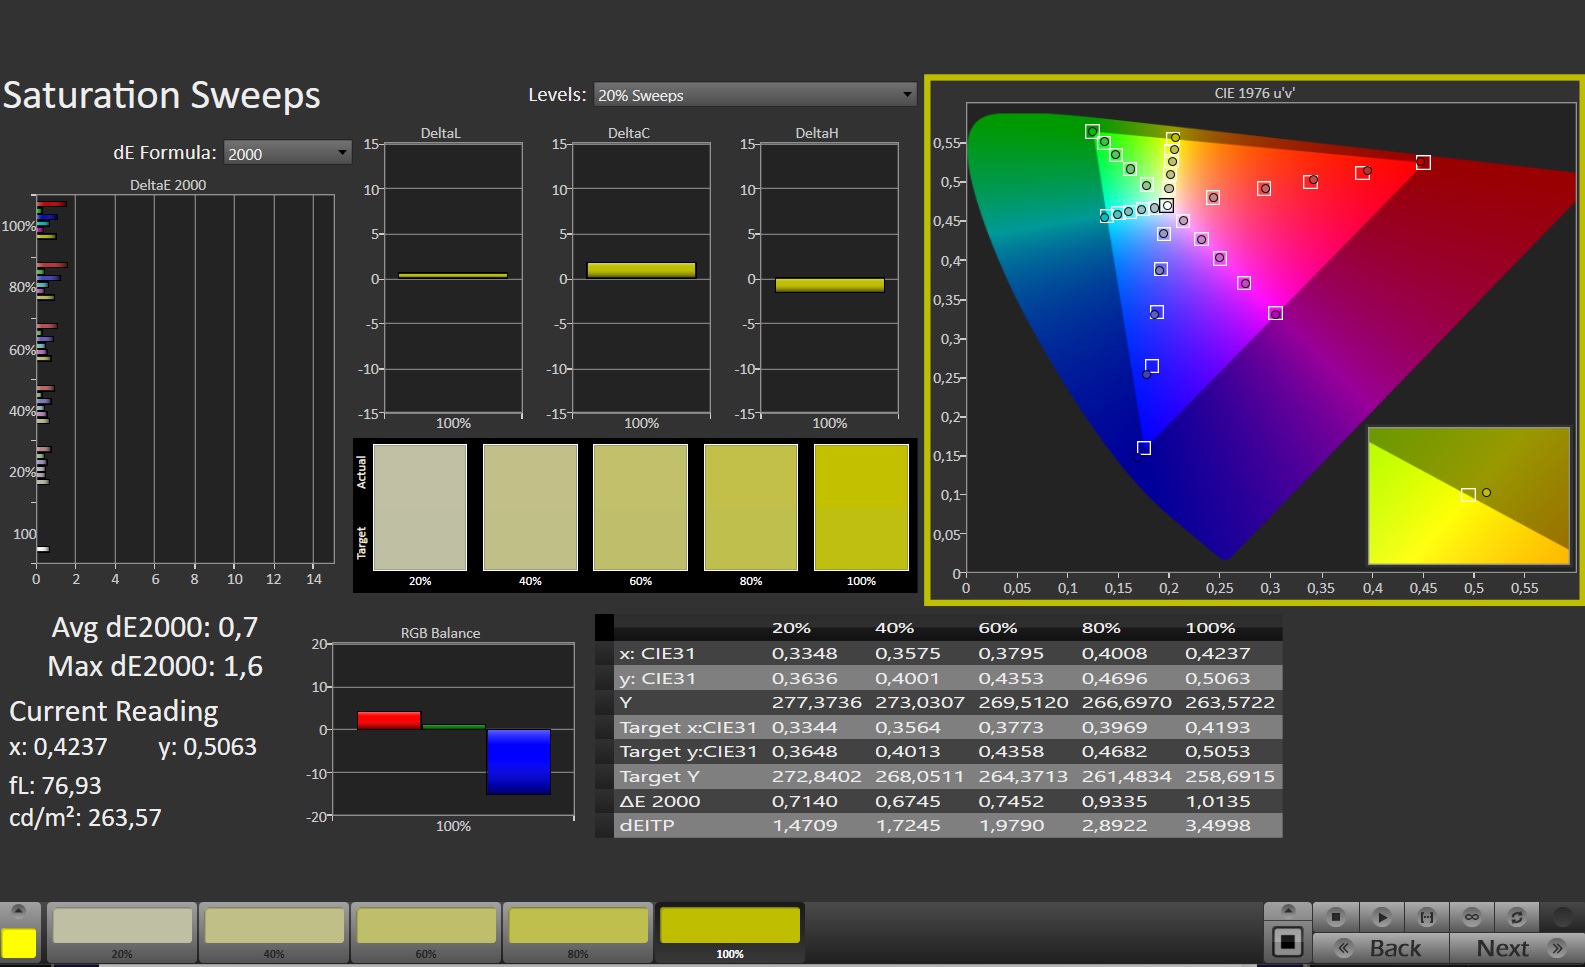

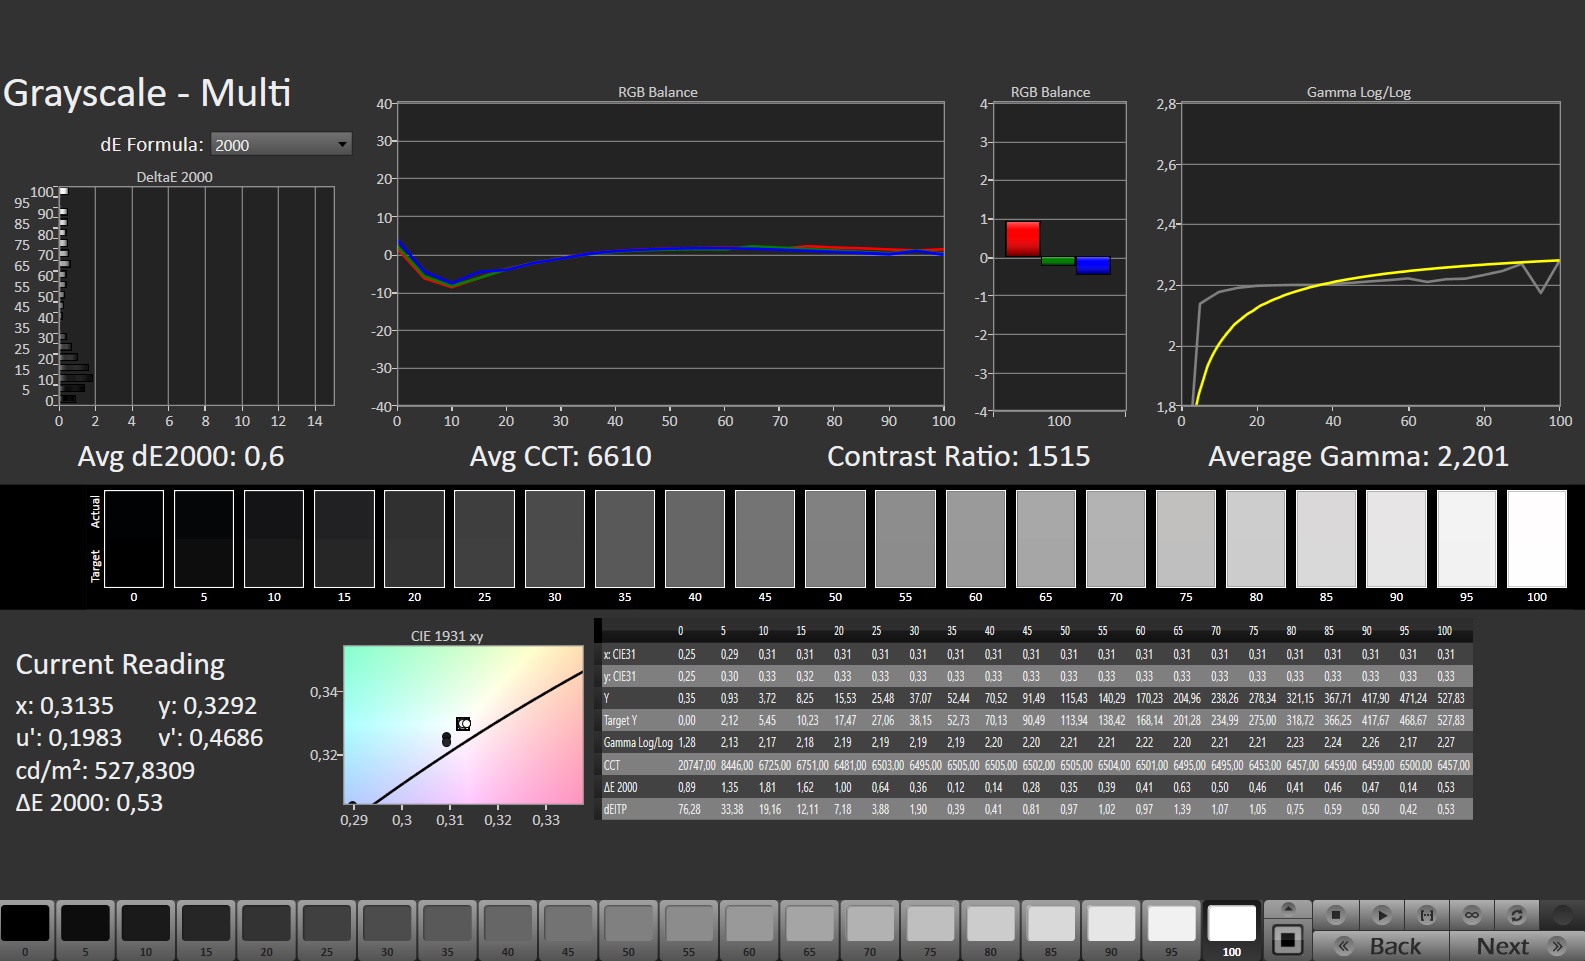
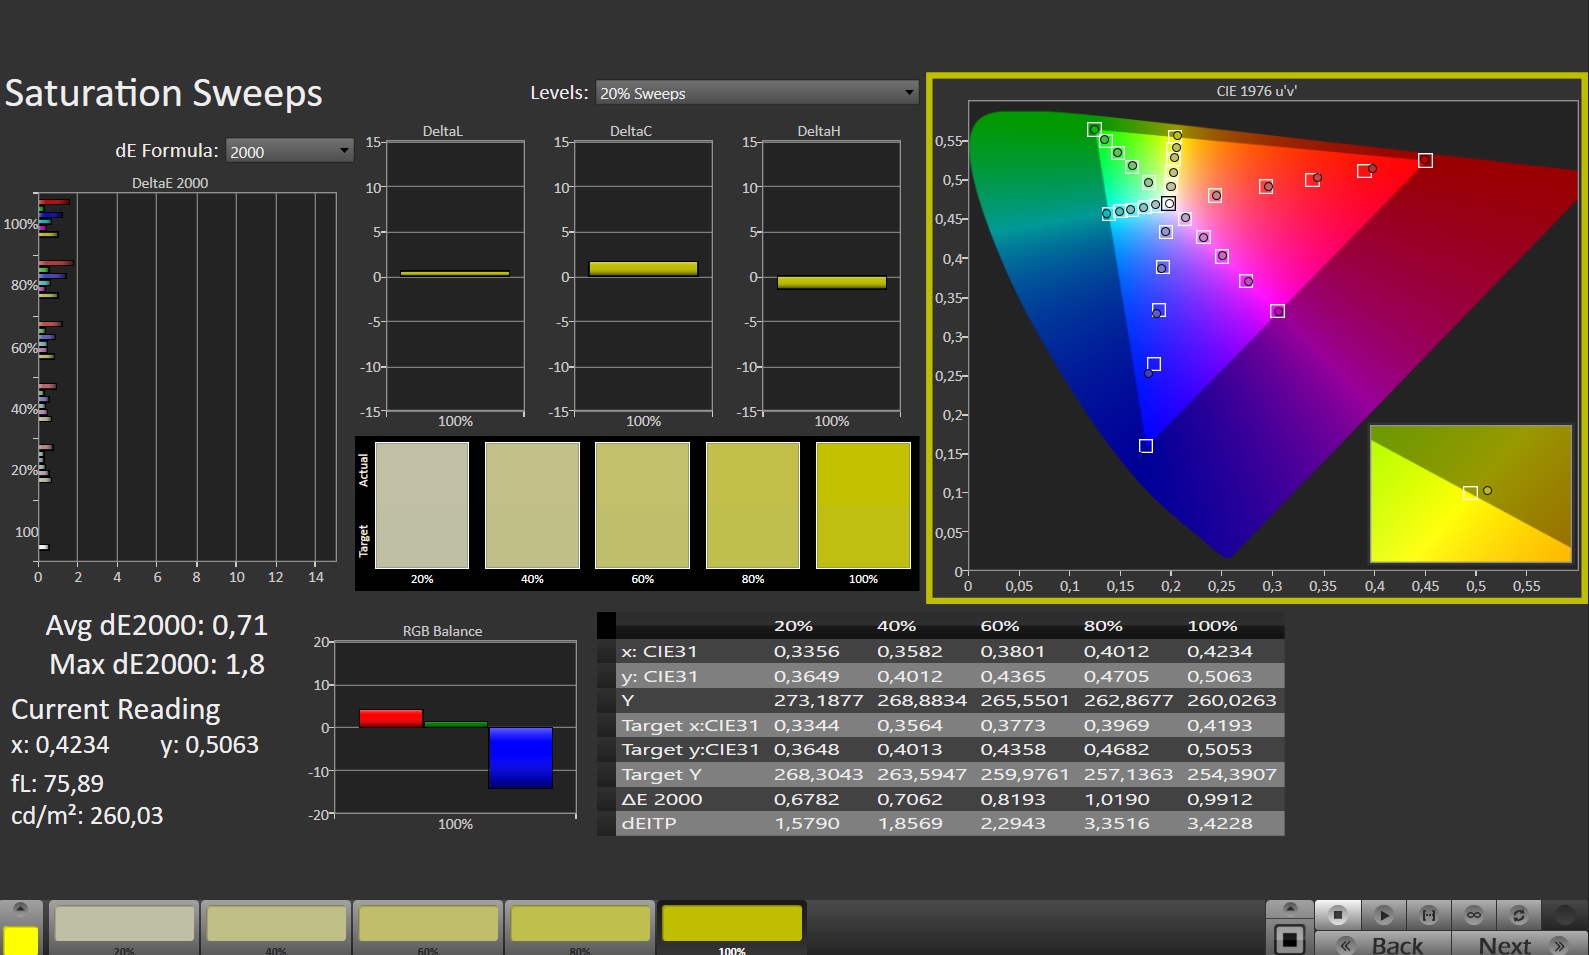
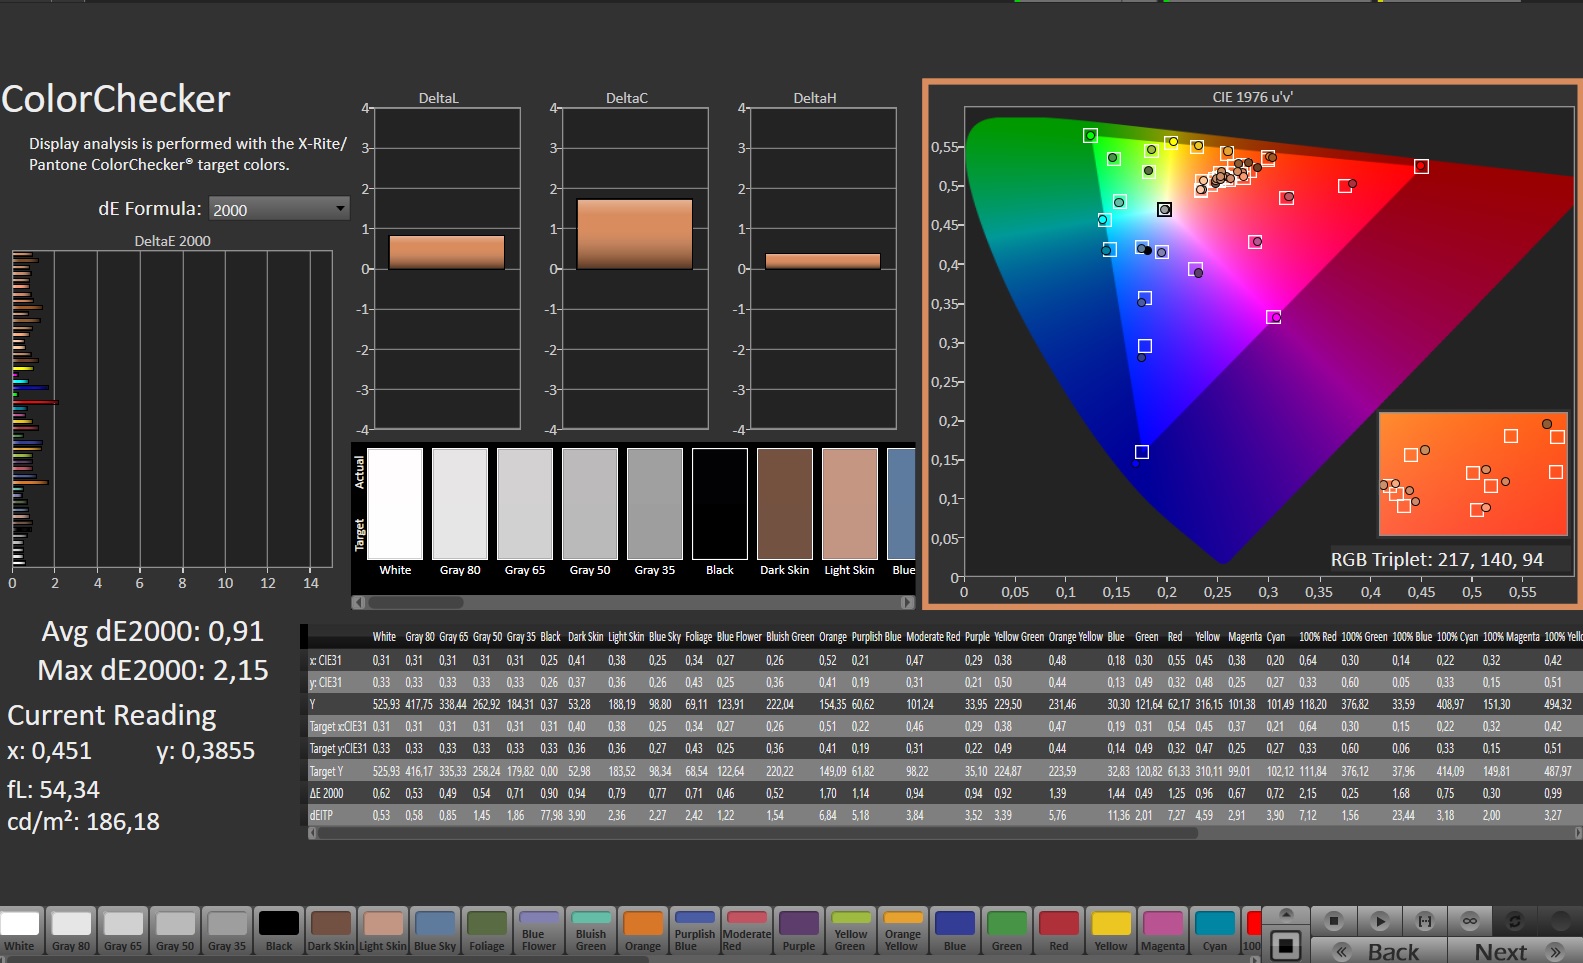
Cela dit, le Legion Pro 7 offre une excellente précision des couleurs dès sa sortie de l'emballage grâce à l'étalonnage X-Rite Pantone.
Les temps de réponse (~6 ms du noir au blanc) sont conformes aux attentes. La stabilité de l'angle de vue dépend généralement du niveau de l'IPS, elle semble être relativement bonne à partir de positions obliques.
Temps de réponse de l'écran
| ↔ Temps de réponse noir à blanc | ||
|---|---|---|
| 5.9 ms ... hausse ↗ et chute ↘ combinées | ↗ 2.2 ms hausse | 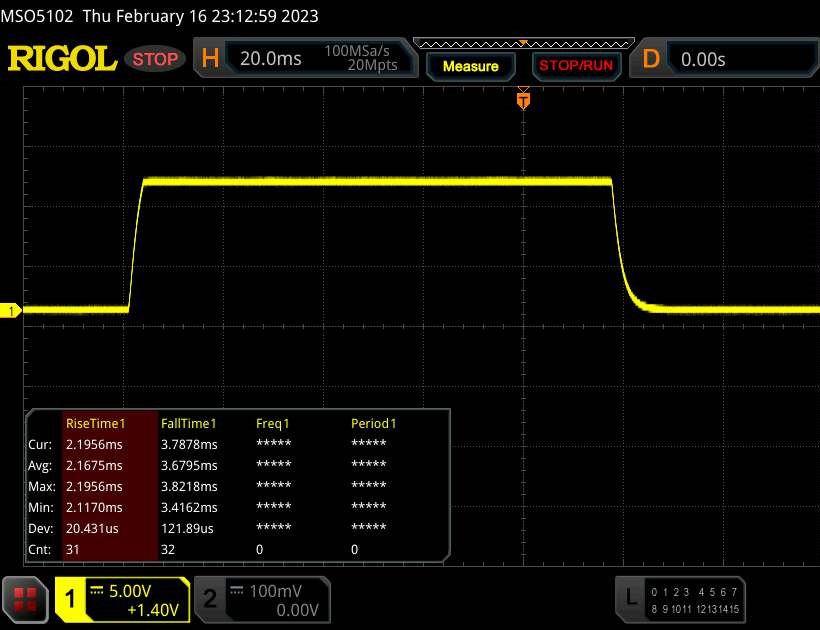 |
| ↘ 3.7 ms chute | ||
| L'écran montre de très faibles temps de réponse, parfait pour le jeu. En comparaison, tous les appareils testés affichent entre 0.1 (minimum) et 240 (maximum) ms. » 18 % des appareils testés affichent de meilleures performances. Cela signifie que les latences relevées sont meilleures que la moyenne (19.9 ms) de tous les appareils testés. | ||
| ↔ Temps de réponse gris 50% à gris 80% | ||
| 12.3 ms ... hausse ↗ et chute ↘ combinées | ↗ 5.7 ms hausse | 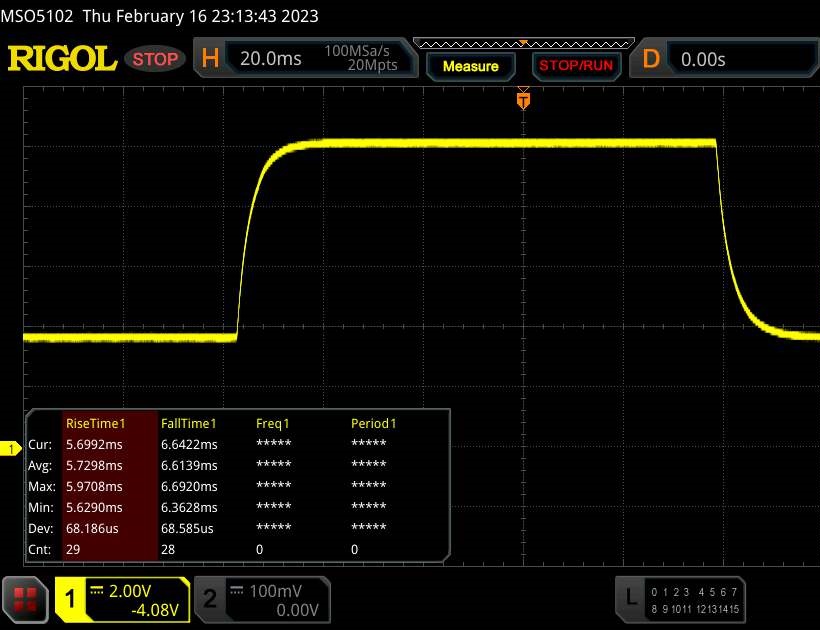 |
| ↘ 6.6 ms chute | ||
| L'écran montre de bons temps de réponse, mais insuffisant pour du jeu compétitif. En comparaison, tous les appareils testés affichent entre 0.165 (minimum) et 636 (maximum) ms. » 26 % des appareils testés affichent de meilleures performances. Cela signifie que les latences relevées sont meilleures que la moyenne (31.1 ms) de tous les appareils testés. | ||
Scintillement / MLI (Modulation de largeur d'impulsion)
| Scintillement / MLI (Modulation de largeur d'impulsion) non décelé |  | ||
En comparaison, 52 % des appareils testés n'emploient pas MDI pour assombrir leur écran. Nous avons relevé une moyenne à 7798 (minimum : 5 - maximum : 343500) Hz dans le cas où une MDI était active. | |||
Performances : Core i9-13900HX et RTX 4080 en tête des classements
La configuration actuelle place le Lenovo Legion Pro 7 dans la catégorie haut de gamme absolue, ce qui signifie que vous devrez cracher vos sous en conséquence (nous considérons néanmoins que le niveau de prix actuel est excessif).
Quoi qu'il en soit, cette configuration offre suffisamment de puissance pour supporter toutes sortes de charges de travail pendant des années.
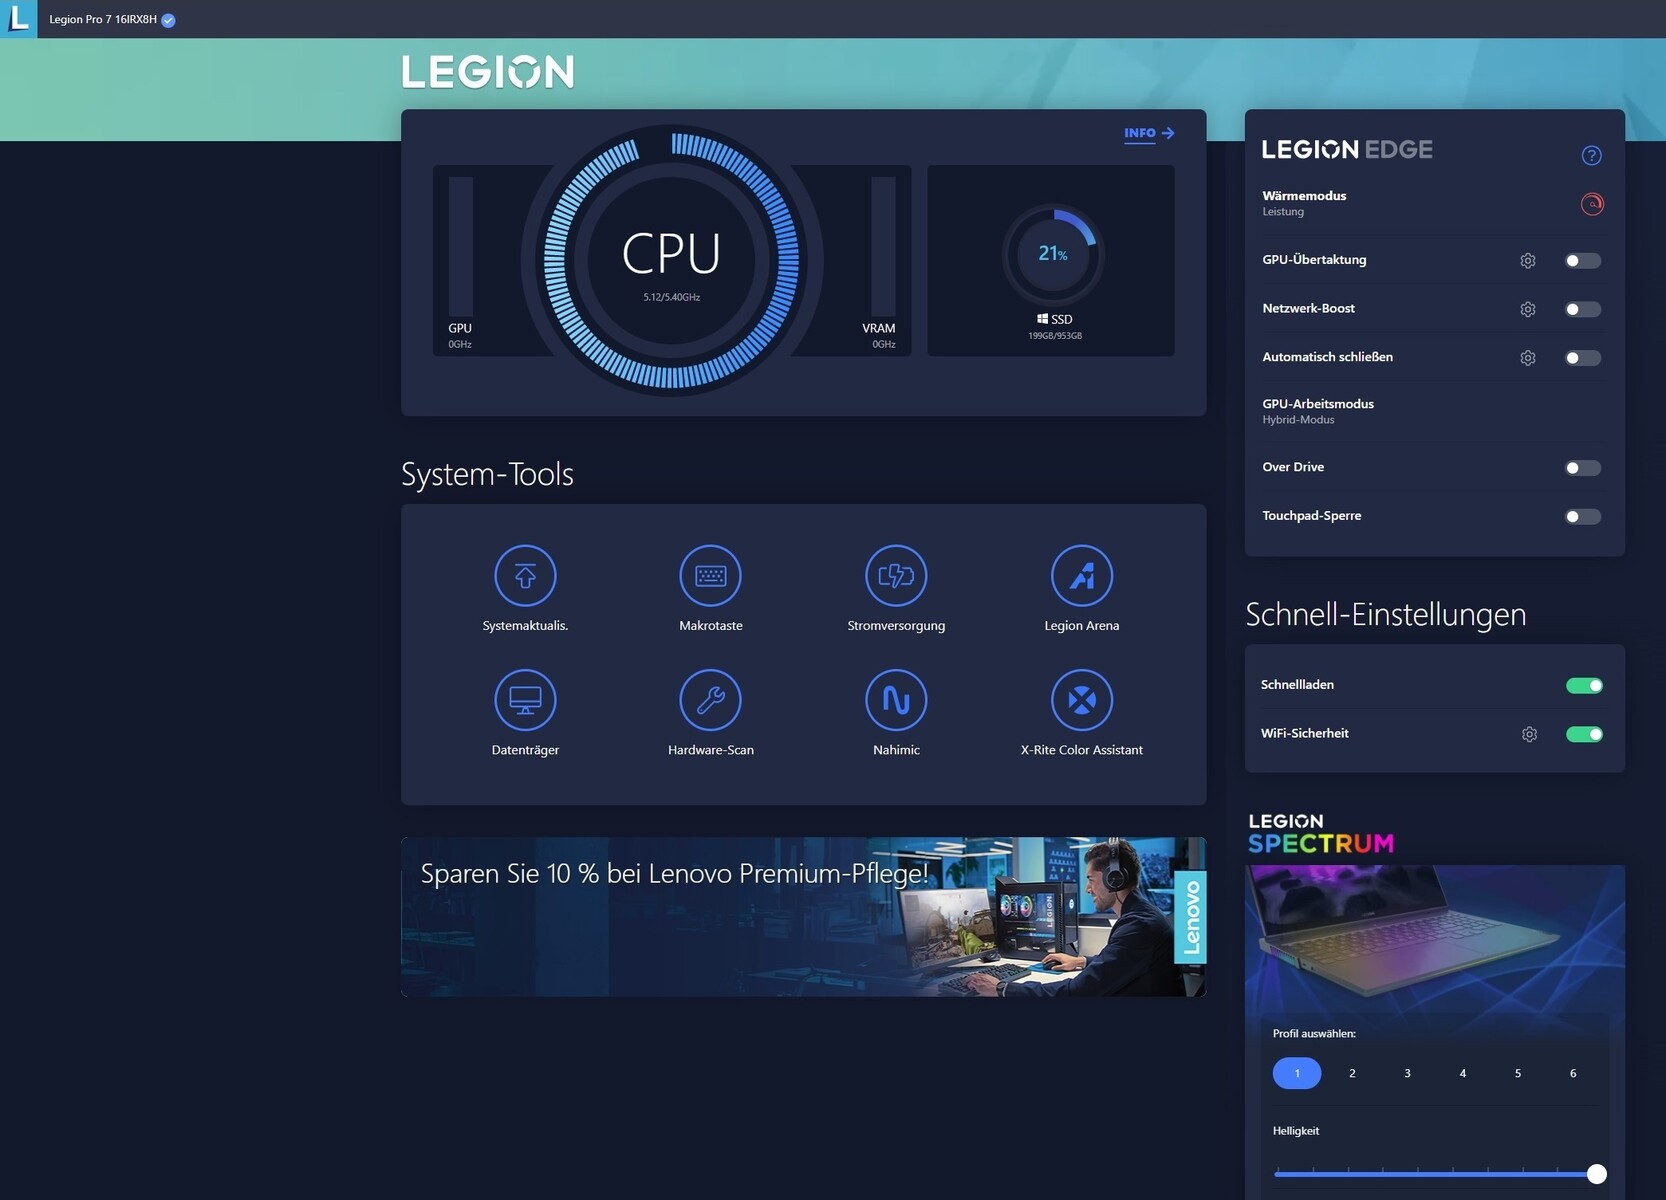
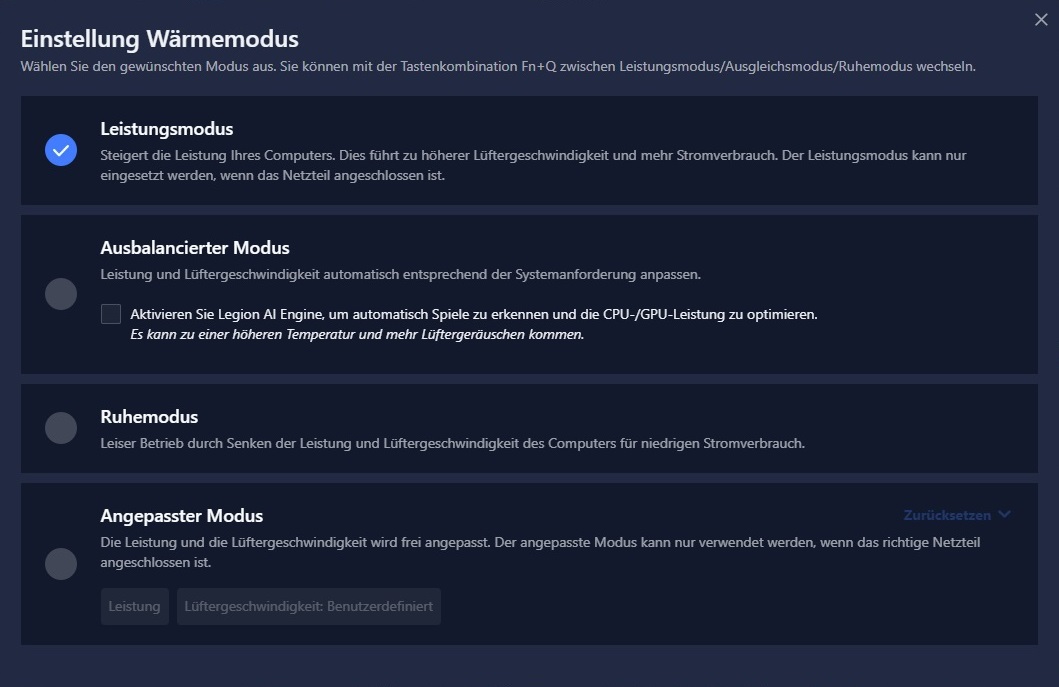
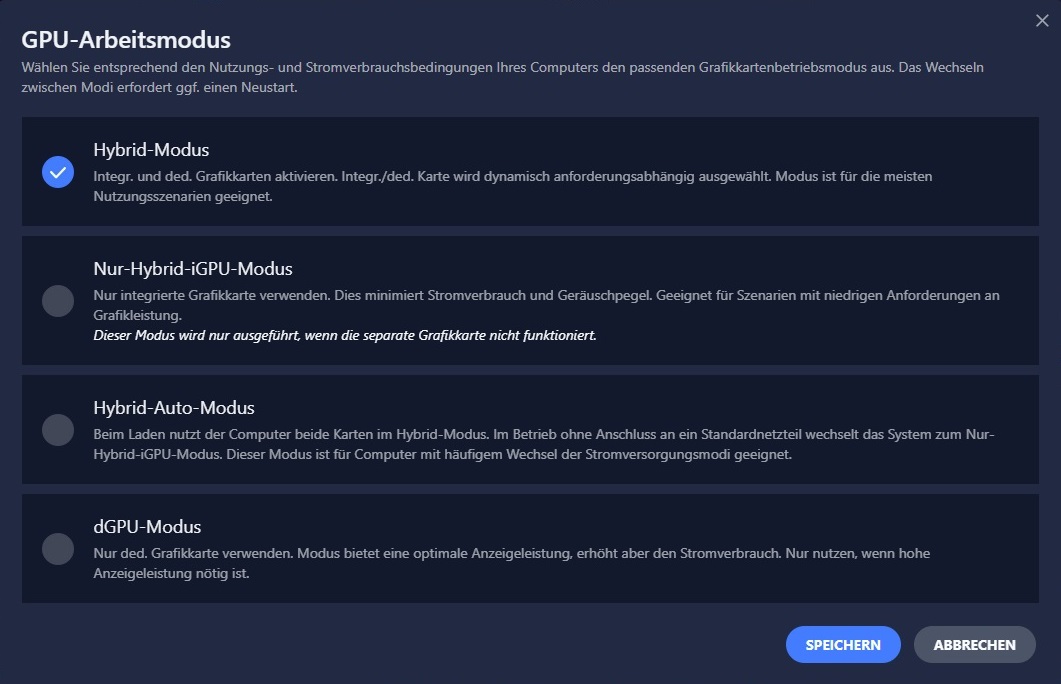
Conditions d'essai
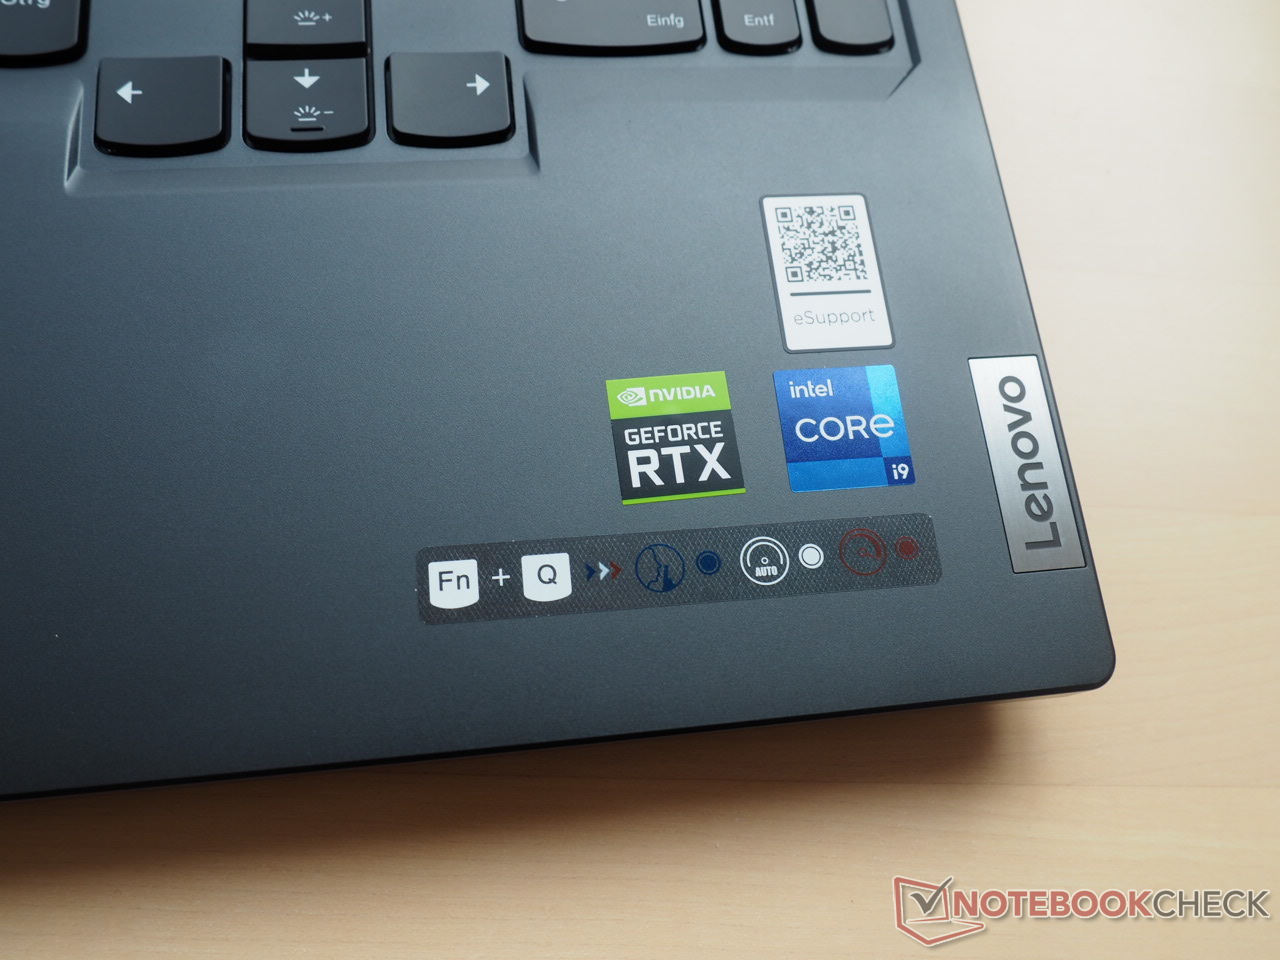
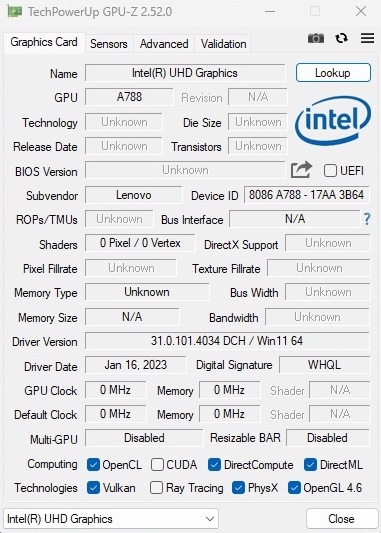
L'application Lenovo Vantage est préinstallée et vous permet de choisir parmi plusieurs modes de fonctionnement des performances et du GPU. Vous pouvez également changer de mode de performance via le raccourci Fn + Q.
Nous avons utilisé le mode Performance pour toutes nos mesures, ainsi que la commutation graphique active qui permet de basculer dynamiquement entre l'iGPU et le dGPU. Un mode dGPU pur est également disponible (voir les captures d'écran ci-dessous).
Le tableau ci-dessous illustre l'effet des différents modes de performance sur les valeurs PL1/PL2 et le bruit du ventilateur.
| Silencieux | Équilibré | Performance | |
| CPU PL1 (HWiNFO) | 55 W | 75 W | 130 W |
| CPU PL2 (HWiNFO) | 65 W | 119 W | 185 W |
| Bruit (The Witcher 3 ) | 39 dB(A) | 43 - 46 dB(A) | 49 - 55 dB(A) |
| Performances (The Witcher 3 ) | 40 fps (verrouillé) | 150 fps | 180 fps |
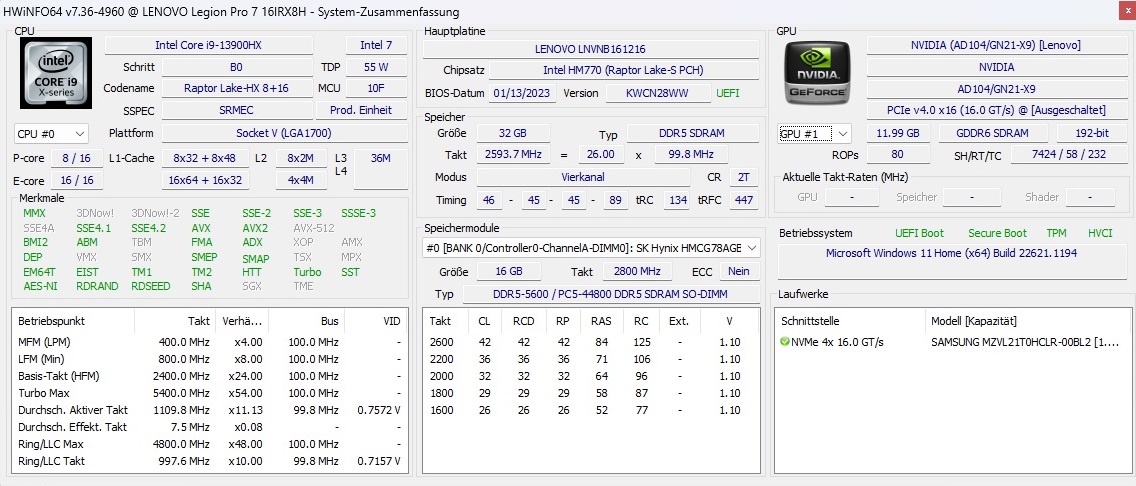
Prozessor
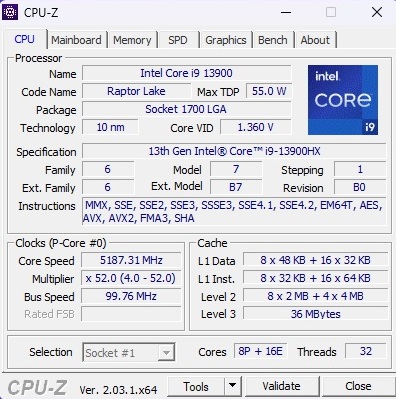
Le site Intel Core i9-13900HX est un monstre de performances. Cette puce de 10 nm offre huit cœurs de performance cadencés à 2,2 GHz à 5,4 GHz et prenant en charge l'hyperthreading, ainsi que 16 cœurs d'efficacité cadencés à 1,6 GHz à 3,9 GHz sans hyperthreading, soit un total de 32 threads en parallèle.
Le cache L3 de 36 Mo et le TDP de 55 W confirment que le Core i9-13900HX est une puce puissante.
Cinebench R15 Multi Dauertest
* ... Moindre est la valeur, meilleures sont les performances
AIDA64: FP32 Ray-Trace | FPU Julia | CPU SHA3 | CPU Queen | FPU SinJulia | FPU Mandel | CPU AES | CPU ZLib | FP64 Ray-Trace | CPU PhotoWorxx
| Performance rating | |
| Lenovo Legion Pro 7 16IRX8H | |
| Moyenne de la classe Gaming | |
| Moyenne Intel Core i9-13900HX | |
| Razer Blade 16 Early 2023 | |
| Lenovo Legion 7 16ARHA7 | |
| Lenovo Legion 7 16IAX7-82TD004SGE | |
| Lenovo Legion 7 16ACHg6 | |
| AIDA64 / FP32 Ray-Trace | |
| Moyenne de la classe Gaming (10227 - 85542, n=110, 2 dernières années) | |
| Lenovo Legion Pro 7 16IRX8H | |
| Razer Blade 16 Early 2023 | |
| Razer Blade 16 Early 2023 | |
| Razer Blade 16 Early 2023 | |
| Moyenne Intel Core i9-13900HX (17589 - 27615, n=22) | |
| Lenovo Legion 7 16ARHA7 | |
| Lenovo Legion 7 16ACHg6 | |
| Lenovo Legion 7 16IAX7-82TD004SGE | |
| AIDA64 / FPU Julia | |
| Moyenne de la classe Gaming (51376 - 238426, n=110, 2 dernières années) | |
| Lenovo Legion Pro 7 16IRX8H | |
| Razer Blade 16 Early 2023 | |
| Razer Blade 16 Early 2023 | |
| Razer Blade 16 Early 2023 | |
| Moyenne Intel Core i9-13900HX (88686 - 137015, n=22) | |
| Lenovo Legion 7 16ARHA7 | |
| Lenovo Legion 7 16ACHg6 | |
| Lenovo Legion 7 16IAX7-82TD004SGE | |
| AIDA64 / CPU SHA3 | |
| Lenovo Legion Pro 7 16IRX8H | |
| Razer Blade 16 Early 2023 | |
| Razer Blade 16 Early 2023 | |
| Razer Blade 16 Early 2023 | |
| Moyenne de la classe Gaming (2180 - 9817, n=110, 2 dernières années) | |
| Moyenne Intel Core i9-13900HX (4362 - 7029, n=22) | |
| Lenovo Legion 7 16IAX7-82TD004SGE | |
| Lenovo Legion 7 16ARHA7 | |
| Lenovo Legion 7 16ACHg6 | |
| AIDA64 / CPU Queen | |
| Razer Blade 16 Early 2023 | |
| Razer Blade 16 Early 2023 | |
| Lenovo Legion Pro 7 16IRX8H | |
| Moyenne Intel Core i9-13900HX (125644 - 141385, n=22) | |
| Moyenne de la classe Gaming (49785 - 173351, n=101, 2 dernières années) | |
| Lenovo Legion 7 16ARHA7 | |
| Lenovo Legion 7 16ACHg6 | |
| Lenovo Legion 7 16IAX7-82TD004SGE | |
| AIDA64 / FPU SinJulia | |
| Razer Blade 16 Early 2023 | |
| Razer Blade 16 Early 2023 | |
| Razer Blade 16 Early 2023 | |
| Lenovo Legion Pro 7 16IRX8H | |
| Moyenne Intel Core i9-13900HX (12334 - 17179, n=22) | |
| Moyenne de la classe Gaming (4424 - 33636, n=110, 2 dernières années) | |
| Lenovo Legion 7 16IAX7-82TD004SGE | |
| Lenovo Legion 7 16ARHA7 | |
| Lenovo Legion 7 16ACHg6 | |
| AIDA64 / FPU Mandel | |
| Moyenne de la classe Gaming (25115 - 128721, n=110, 2 dernières années) | |
| Lenovo Legion Pro 7 16IRX8H | |
| Razer Blade 16 Early 2023 | |
| Razer Blade 16 Early 2023 | |
| Razer Blade 16 Early 2023 | |
| Moyenne Intel Core i9-13900HX (43850 - 69202, n=22) | |
| Lenovo Legion 7 16ARHA7 | |
| Lenovo Legion 7 16ACHg6 | |
| Lenovo Legion 7 16IAX7-82TD004SGE | |
| AIDA64 / CPU AES | |
| Razer Blade 16 Early 2023 | |
| Razer Blade 16 Early 2023 | |
| Razer Blade 16 Early 2023 | |
| Lenovo Legion 7 16ARHA7 | |
| Moyenne Intel Core i9-13900HX (89413 - 237881, n=22) | |
| Lenovo Legion 7 16ACHg6 | |
| Lenovo Legion Pro 7 16IRX8H | |
| Lenovo Legion 7 16IAX7-82TD004SGE | |
| Moyenne de la classe Gaming (39258 - 247074, n=110, 2 dernières années) | |
| AIDA64 / CPU ZLib | |
| Lenovo Legion Pro 7 16IRX8H | |
| Razer Blade 16 Early 2023 | |
| Razer Blade 16 Early 2023 | |
| Razer Blade 16 Early 2023 | |
| Moyenne Intel Core i9-13900HX (1284 - 1958, n=22) | |
| Moyenne de la classe Gaming (574 - 2531, n=110, 2 dernières années) | |
| Lenovo Legion 7 16IAX7-82TD004SGE | |
| Lenovo Legion 7 16ARHA7 | |
| Lenovo Legion 7 16ACHg6 | |
| AIDA64 / FP64 Ray-Trace | |
| Moyenne de la classe Gaming (5509 - 45446, n=110, 2 dernières années) | |
| Lenovo Legion Pro 7 16IRX8H | |
| Razer Blade 16 Early 2023 | |
| Razer Blade 16 Early 2023 | |
| Razer Blade 16 Early 2023 | |
| Moyenne Intel Core i9-13900HX (9481 - 15279, n=22) | |
| Lenovo Legion 7 16ARHA7 | |
| Lenovo Legion 7 16ACHg6 | |
| Lenovo Legion 7 16IAX7-82TD004SGE | |
| AIDA64 / CPU PhotoWorxx | |
| Razer Blade 16 Early 2023 | |
| Razer Blade 16 Early 2023 | |
| Razer Blade 16 Early 2023 | |
| Lenovo Legion Pro 7 16IRX8H | |
| Moyenne Intel Core i9-13900HX (42994 - 51994, n=22) | |
| Moyenne de la classe Gaming (12271 - 89891, n=110, 2 dernières années) | |
| Lenovo Legion 7 16IAX7-82TD004SGE | |
| Lenovo Legion 7 16ARHA7 | |
| Lenovo Legion 7 16ACHg6 | |
Performance du système
Les performances globales du système sont au coude à coude avec celles de la Blade 16. Le Legion Pro 7 obtient 7 830 points dans PCMark 10, ce qui est un excellent résultat, supérieur de 11 % à la moyenne de la catégorie.
CrossMark: Overall | Productivity | Creativity | Responsiveness
| PCMark 10 / Score | |
| Lenovo Legion 7 16IAX7-82TD004SGE | |
| Moyenne de la classe Gaming (5828 - 11574, n=96, 2 dernières années) | |
| Moyenne Intel Core i9-13900HX, NVIDIA GeForce RTX 4080 Laptop GPU (7609 - 8549, n=3) | |
| Razer Blade 16 Early 2023 | |
| Lenovo Legion Pro 7 16IRX8H | |
| Lenovo Legion 7 16ARHA7 | |
| Lenovo Legion 7 16ACHg6 | |
| PCMark 10 / Essentials | |
| Lenovo Legion Pro 7 16IRX8H | |
| Moyenne Intel Core i9-13900HX, NVIDIA GeForce RTX 4080 Laptop GPU (10982 - 11824, n=3) | |
| Lenovo Legion 7 16IAX7-82TD004SGE | |
| Razer Blade 16 Early 2023 | |
| Moyenne de la classe Gaming (8810 - 12600, n=100, 2 dernières années) | |
| Lenovo Legion 7 16ARHA7 | |
| Lenovo Legion 7 16ACHg6 | |
| PCMark 10 / Productivity | |
| Lenovo Legion 7 16IAX7-82TD004SGE | |
| Lenovo Legion Pro 7 16IRX8H | |
| Moyenne de la classe Gaming (6845 - 18766, n=98, 2 dernières années) | |
| Moyenne Intel Core i9-13900HX, NVIDIA GeForce RTX 4080 Laptop GPU (9976 - 10788, n=3) | |
| Lenovo Legion 7 16ACHg6 | |
| Lenovo Legion 7 16ARHA7 | |
| Razer Blade 16 Early 2023 | |
| PCMark 10 / Digital Content Creation | |
| Razer Blade 16 Early 2023 | |
| Lenovo Legion 7 16IAX7-82TD004SGE | |
| Moyenne de la classe Gaming (7602 - 19657, n=98, 2 dernières années) | |
| Moyenne Intel Core i9-13900HX, NVIDIA GeForce RTX 4080 Laptop GPU (10135 - 14720, n=3) | |
| Lenovo Legion 7 16ARHA7 | |
| Lenovo Legion 7 16ACHg6 | |
| Lenovo Legion Pro 7 16IRX8H | |
| CrossMark / Overall | |
| Lenovo Legion 7 16IAX7-82TD004SGE | |
| Moyenne Intel Core i9-13900HX, NVIDIA GeForce RTX 4080 Laptop GPU (1991 - 2194, n=2) | |
| Moyenne de la classe Gaming (1366 - 2409, n=98, 2 dernières années) | |
| Lenovo Legion 7 16ARHA7 | |
| Razer Blade 16 Early 2023 | |
| CrossMark / Productivity | |
| Lenovo Legion 7 16IAX7-82TD004SGE | |
| Moyenne Intel Core i9-13900HX, NVIDIA GeForce RTX 4080 Laptop GPU (1828 - 2059, n=2) | |
| Moyenne de la classe Gaming (1386 - 2254, n=98, 2 dernières années) | |
| Lenovo Legion 7 16ARHA7 | |
| Razer Blade 16 Early 2023 | |
| CrossMark / Creativity | |
| Moyenne Intel Core i9-13900HX, NVIDIA GeForce RTX 4080 Laptop GPU (2239 - 2411, n=2) | |
| Lenovo Legion 7 16IAX7-82TD004SGE | |
| Moyenne de la classe Gaming (1343 - 2729, n=98, 2 dernières années) | |
| Razer Blade 16 Early 2023 | |
| Lenovo Legion 7 16ARHA7 | |
| CrossMark / Responsiveness | |
| Lenovo Legion 7 16IAX7-82TD004SGE | |
| Moyenne Intel Core i9-13900HX, NVIDIA GeForce RTX 4080 Laptop GPU (1808 - 1998, n=2) | |
| Moyenne de la classe Gaming (1226 - 2334, n=98, 2 dernières années) | |
| Razer Blade 16 Early 2023 | |
| Lenovo Legion 7 16ARHA7 | |
| PCMark 10 Score | 7830 points | |
Aide | ||
| AIDA64 / Memory Copy | |
| Razer Blade 16 Early 2023 | |
| Razer Blade 16 Early 2023 | |
| Razer Blade 16 Early 2023 | |
| Lenovo Legion Pro 7 16IRX8H | |
| Moyenne Intel Core i9-13900HX (67716 - 79193, n=22) | |
| Moyenne de la classe Gaming (21750 - 129946, n=110, 2 dernières années) | |
| Lenovo Legion 7 16IAX7-82TD004SGE | |
| Lenovo Legion 7 16ARHA7 | |
| Lenovo Legion 7 16ACHg6 | |
| AIDA64 / Memory Read | |
| Razer Blade 16 Early 2023 | |
| Razer Blade 16 Early 2023 | |
| Razer Blade 16 Early 2023 | |
| Lenovo Legion Pro 7 16IRX8H | |
| Moyenne Intel Core i9-13900HX (73998 - 88462, n=22) | |
| Moyenne de la classe Gaming (22956 - 118858, n=110, 2 dernières années) | |
| Lenovo Legion 7 16IAX7-82TD004SGE | |
| Lenovo Legion 7 16ARHA7 | |
| Lenovo Legion 7 16ACHg6 | |
| AIDA64 / Memory Write | |
| Razer Blade 16 Early 2023 | |
| Razer Blade 16 Early 2023 | |
| Razer Blade 16 Early 2023 | |
| Moyenne de la classe Gaming (22297 - 135096, n=110, 2 dernières années) | |
| Moyenne Intel Core i9-13900HX (65472 - 77045, n=22) | |
| Lenovo Legion Pro 7 16IRX8H | |
| Lenovo Legion 7 16IAX7-82TD004SGE | |
| Lenovo Legion 7 16ARHA7 | |
| Lenovo Legion 7 16ACHg6 | |
| AIDA64 / Memory Latency | |
| Moyenne de la classe Gaming (75.3 - 259, n=110, 2 dernières années) | |
| Razer Blade 16 Early 2023 | |
| Razer Blade 16 Early 2023 | |
| Razer Blade 16 Early 2023 | |
| Lenovo Legion 7 16IAX7-82TD004SGE | |
| Moyenne Intel Core i9-13900HX (75.3 - 91.1, n=22) | |
| Lenovo Legion 7 16ARHA7 | |
| Lenovo Legion Pro 7 16IRX8H | |
| Lenovo Legion 7 16ACHg6 | |
* ... Moindre est la valeur, meilleures sont les performances
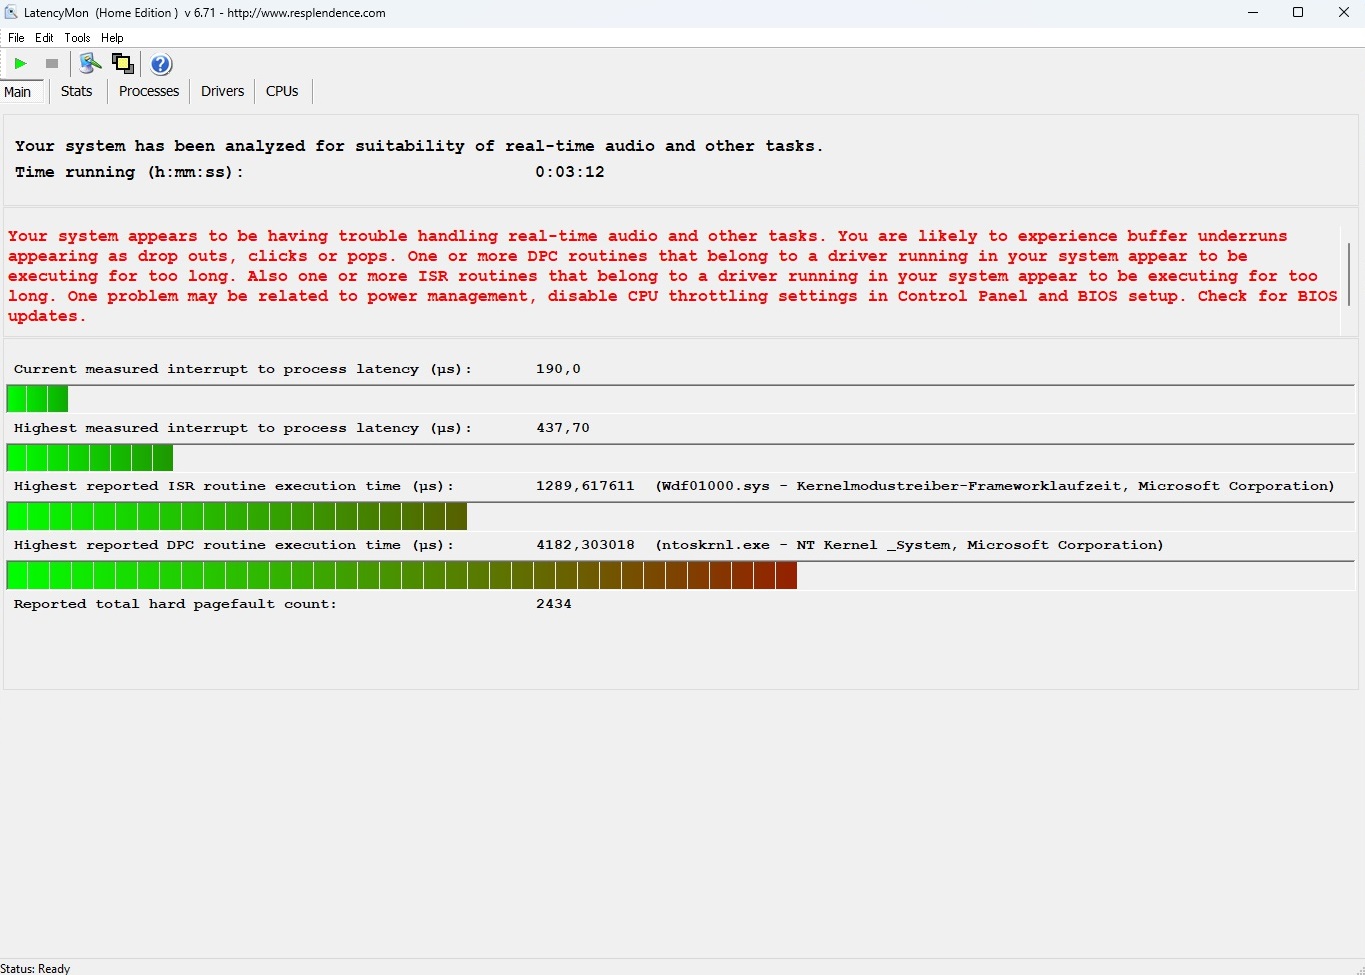
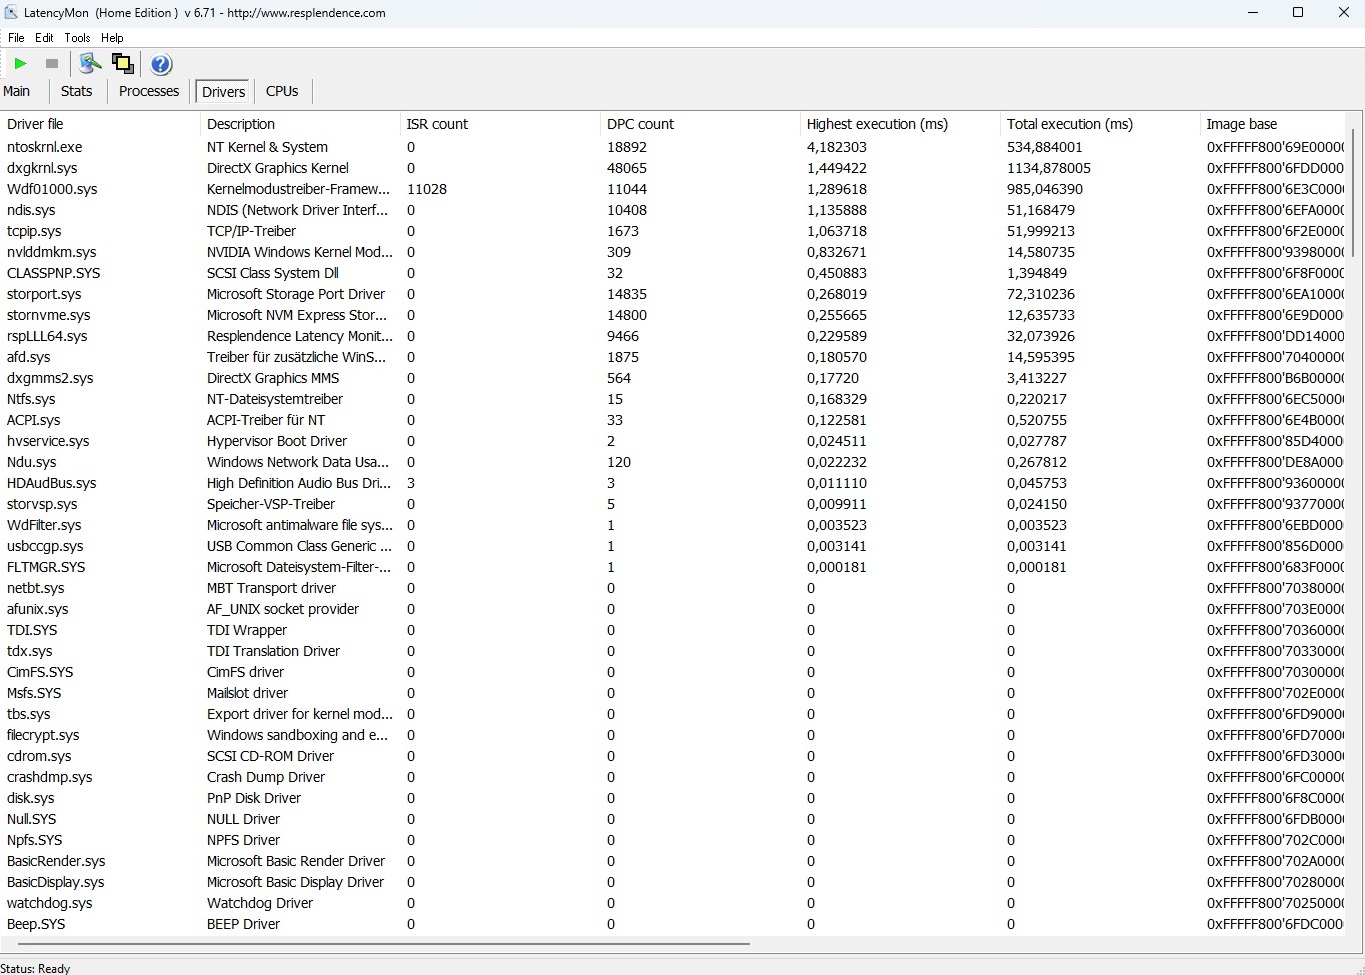
Latence DPC
La latence du DPC s'avère une fois de plus problématique, bien que cela ne puisse concerner qu'un petit sous-ensemble d'utilisateurs. Selon LatencyMon, le Legion Pro 7 n'est pas idéal pour l'édition audio en temps réel sans un réglage plus fin.
| DPC Latencies / LatencyMon - interrupt to process latency (max), Web, Youtube, Prime95 | |
| Razer Blade 16 Early 2023 | |
| Lenovo Legion 7 16ARHA7 | |
| Lenovo Legion 7 16IAX7-82TD004SGE | |
| Lenovo Legion 7 16ACHg6 | |
| Lenovo Legion Pro 7 16IRX8H | |
* ... Moindre est la valeur, meilleures sont les performances
Périphériques de stockage
Le Legion Pro 7 obtient de bons résultats dans le domaine du stockage. Notre modèle de test utilise un rapide SSD NVMe Samsung PM9A1 de 1 To, qui fait bonne figure dans nos benchmarks. Le disque atteint une vitesse de lecture séquentielle d'environ 5 400 Mo/s et des écritures séquentielles supérieures à 4 000 Mo/s.
Cependant, notre test en boucle DiskSpd prouve de fortes fluctuations de performance sous une charge continue. La concurrence ne semble pas être affectée par un étranglement aussi important.

* ... Moindre est la valeur, meilleures sont les performances
Disk Throttling: DiskSpd Read Loop, Queue Depth 8
Performances du GPU
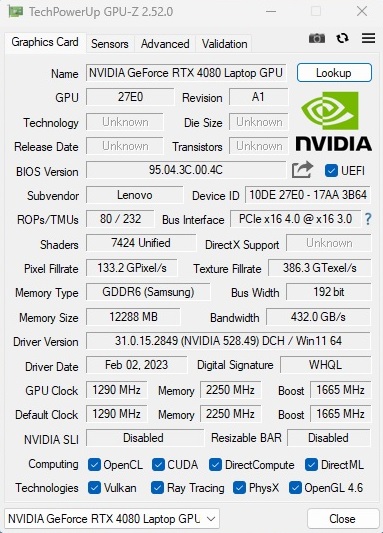
Avec un TGP maximum de 175 W incluant Dynamic Boost, le GPU RTX 4080 pour ordinateur portable est probablement le composant le plus intéressant du Legion Pro 7 du point de vue des joueurs. Les spécifications de ce composant 4 nm de la génération Ada de Nvidia sont impressionnantes sur le papier.
Un total de 7 424 cœurs CUDA promet d'excellentes performances. Cependant, 12 Go de VRAM GDDR6 sur une interface mémoire de 192 bits ne sont pas très inspirants en 2023 - 16 Go de VRAM auraient été plus appropriés compte tenu des exigences des jeux actuels et du prix élevé demandé. Vous trouverez de plus amples informations et une analyse des performances dans notre article consacré à la RTX Analyse de la revue du GPU Nvidia Ada RTX 40.
Bien qu'il ne dispose pas d'une VRAM particulièrement abondante, le GPU RTX 4080 Laptop fait mordre la poussière à la concurrence AMD et à ses prédécesseurs. En prenant tous les scores 3DMark ensemble, le GPU RTX 4080 Laptop est plus de 30% plus rapide que le GPU RTX 3080 Ti pour ordinateur portable et le RX 6850M XT de la génération précédente de Legions, qui fonctionnaient également à un TGP élevé.
| 3DMark 06 Standard Score | 59578 points | |
| 3DMark Vantage P Result | 111294 points | |
| 3DMark 11 Performance | 44468 points | |
| 3DMark Ice Storm Standard Score | 208555 points | |
| 3DMark Cloud Gate Standard Score | 66531 points | |
| 3DMark Fire Strike Score | 34434 points | |
| 3DMark Time Spy Score | 17928 points | |
Aide | ||
* ... Moindre est la valeur, meilleures sont les performances
Performances en matière de jeux
Dans les jeux, le GPU RTX 4080 pour ordinateur portable a un avantage encore plus grand, comme on peut le voir dans le classement des performances cumulées, notamment par rapport au RTX 3080 Laptop GPU et la RX 6850M XT. Le CPU a cependant une influence sur les taux de rafraîchissement aux résolutions 1080p.
La comparaison est plus significative lorsque le raytracing est activé et aux résolutions QHD et 4K. Nous avons choisi des titres modernes tels que Spider-Man Miles Morales, Resident Evil Villageet Les gardiens de la Galaxy pour illustrer les prouesses du GPU RTX 4080 pour ordinateur portable à des résolutions et des paramètres plus élevés.
En moyenne, le GPU RTX 4080 pour ordinateur portable est environ un tiers plus rapide qu'un GPU RTX 3080 Ti pour ordinateur portable de 175 W et environ 60% plus rapide qu'un GPU RTX 3080 pour ordinateur portable de 165 W dans ces tests.
Des comparaisons détaillées des performances sont disponibles dans notre liste exhaustive de benchmarks de jeux
.<br>| Performance rating - Percent | |
| Razer Blade 16 Early 2023 | |
| Lenovo Legion Pro 7 16IRX8H | |
| Moyenne de la classe Gaming | |
| Lenovo Legion 7 16IAX7-82TD004SGE | |
| Lenovo Legion 7 16ACHg6 | |
| Lenovo Legion 7 16ARHA7 | |
| The Witcher 3 - 1920x1080 Ultra Graphics & Postprocessing (HBAO+) | |
| Lenovo Legion Pro 7 16IRX8H | |
| Razer Blade 16 Early 2023 | |
| Moyenne de la classe Gaming (95 - 240, n=8, 2 dernières années) | |
| Lenovo Legion 7 16ARHA7 | |
| Lenovo Legion 7 16IAX7-82TD004SGE | |
| Lenovo Legion 7 16ACHg6 | |
| GTA V - 1920x1080 Highest AA:4xMSAA + FX AF:16x | |
| Lenovo Legion Pro 7 16IRX8H | |
| Razer Blade 16 Early 2023 | |
| Moyenne de la classe Gaming (48.3 - 186.9, n=103, 2 dernières années) | |
| Lenovo Legion 7 16IAX7-82TD004SGE | |
| Lenovo Legion 7 16ACHg6 | |
| Lenovo Legion 7 16ARHA7 | |
| Final Fantasy XV Benchmark - 1920x1080 High Quality | |
| Lenovo Legion Pro 7 16IRX8H | |
| Razer Blade 16 Early 2023 | |
| Moyenne de la classe Gaming (41 - 215, n=104, 2 dernières années) | |
| Lenovo Legion 7 16IAX7-82TD004SGE | |
| Lenovo Legion 7 16ARHA7 | |
| Lenovo Legion 7 16ACHg6 | |
| Strange Brigade - 1920x1080 ultra AA:ultra AF:16 | |
| Razer Blade 16 Early 2023 | |
| Lenovo Legion Pro 7 16IRX8H | |
| Moyenne de la classe Gaming (76.3 - 456, n=94, 2 dernières années) | |
| Lenovo Legion 7 16ARHA7 | |
| Lenovo Legion 7 16ACHg6 | |
| Lenovo Legion 7 16IAX7-82TD004SGE | |
| Dota 2 Reborn - 1920x1080 ultra (3/3) best looking | |
| Razer Blade 16 Early 2023 | |
| Lenovo Legion Pro 7 16IRX8H | |
| Lenovo Legion 7 16IAX7-82TD004SGE | |
| Moyenne de la classe Gaming (84.8 - 248, n=113, 2 dernières années) | |
| Lenovo Legion 7 16ACHg6 | |
| Lenovo Legion 7 16ARHA7 | |
| Spider-Man Miles Morales | |
| 1920x0180 Very High Preset + Ray-Tracing AA:T | |
| Lenovo Legion Pro 7 16IRX8H | |
| Moyenne NVIDIA GeForce RTX 4080 Laptop GPU (n=1) | |
| MSI Raider GE76 12UHS @175 W TGP | |
| XMG Neo 15 @165 W TGP | |
| 2560x1440 Very High Preset AA:T | |
| Lenovo Legion Pro 7 16IRX8H | |
| Moyenne NVIDIA GeForce RTX 4080 Laptop GPU (n=1) | |
| MSI Raider GE76 12UHS @175 W TGP | |
| XMG Neo 15 @165 W TGP | |
| 3840x2160 Very High Preset AA:T | |
| Lenovo Legion Pro 7 16IRX8H | |
| Moyenne NVIDIA GeForce RTX 4080 Laptop GPU (n=1) | |
| MSI Raider GE76 12UHS @175 W TGP | |
| XMG Neo 15 @165 W TGP | |
| Resident Evil Village | |
| 1920x1080 Ray Tracing Preset | |
| Lenovo Legion Pro 7 16IRX8H | |
| Moyenne NVIDIA GeForce RTX 4080 Laptop GPU (n=1) | |
| MSI GE76 Raider | |
| Lenovo Legion 7 16ACHg6 | |
| 2560x1440 Max Preset | |
| Lenovo Legion Pro 7 16IRX8H | |
| Moyenne NVIDIA GeForce RTX 4080 Laptop GPU (n=1) | |
| MSI GE76 Raider | |
| Lenovo Legion 7 16ACHg6 | |
| 3840x2160 Max Preset | |
| Lenovo Legion Pro 7 16IRX8H | |
| Moyenne NVIDIA GeForce RTX 4080 Laptop GPU (n=1) | |
| MSI GE76 Raider | |
| Guardians of the Galaxy | |
| 1920x1080 Ultra Preset + Ultra Ray-Tracing | |
| Lenovo Legion Pro 7 16IRX8H | |
| Moyenne NVIDIA GeForce RTX 4080 Laptop GPU (n=1) | |
| MSI GE76 Raider | |
| XMG Neo 15 @165 W TGP | |
| 2560x1440 Ultra Preset | |
| Lenovo Legion Pro 7 16IRX8H | |
| Moyenne NVIDIA GeForce RTX 4080 Laptop GPU (n=1) | |
| MSI GE76 Raider | |
| XMG Neo 15 @165 W TGP | |
| Lenovo Legion 7 16ARHA7 | |
| 3840x2160 Ultra Preset | |
| Lenovo Legion Pro 7 16IRX8H | |
| Moyenne NVIDIA GeForce RTX 4080 Laptop GPU (n=1) | |
| MSI GE76 Raider | |
| XMG Neo 15 @165 W TGP | |
Contrairement au SSD et, dans une moindre mesure, au CPU, le GPU reste relativement stable sur une longue période de temps. Nous ne constatons pas de baisse drastique du taux de trame ou d'incohérence dans le stress de 60 minutes avec le GPU.Le site Witcher 3à 1080p Ultra.
The Witcher 3 FPS Chart
| Bas | Moyen | Élevé | Ultra | QHD | 4K | |
|---|---|---|---|---|---|---|
| GTA V (2015) | 187.6 | 185.1 | 145.5 | |||
| The Witcher 3 (2015) | 509 | 325 | 178 | |||
| Dota 2 Reborn (2015) | 206 | 194.4 | 179 | |||
| Final Fantasy XV Benchmark (2018) | 192.1 | 162.4 | ||||
| X-Plane 11.11 (2018) | 167.9 | 131.8 | ||||
| Far Cry 5 (2018) | 179 | 158 | 156 | |||
| Strange Brigade (2018) | 392 | 351 | 318 | |||
| Outriders (2021) | 157.7 | 151.1 | 149.9 | 130.5 | 72.3 | |
| Resident Evil Village (2021) | 239 | 239 | 239 | 193.7 | 100.5 | |
| Days Gone (2021) | 243 | 215 | 171.3 | 125.1 | 70.9 | |
| Deathloop (2021) | 130.5 | 129.4 | 123.5 | 112.8 | 60.7 | |
| Back 4 Blood (2021) | 345 | 295 | 276 | 188.4 | 112 | |
| Guardians of the Galaxy (2021) | 165 | 165 | 163 | 146 | 96 | |
| Riders Republic (2021) | 172 | 169 | 168 | 133 | 76 | |
| Farming Simulator 22 (2021) | 263 | 217 | 194.4 | 191.6 | 145.2 | |
| Halo Infinite (2021) | 239 | 209 | 197.5 | 150.7 | 88.6 | |
| God of War (2022) | 160.6 | 137.7 | 101.4 | 86.7 | 60 | |
| Rainbow Six Extraction (2022) | 278 | 272 | 221 | 172 | 88 | |
| Elden Ring (2022) | 59.9 | 59.8 | 59.8 | 59.6 | 59.3 | |
| Elex 2 (2022) | 118.7 | 118.7 | 118.5 | 114.5 | 63 | |
| Vampire Bloodhunt (2022) | 266 | 239 | 221 | 195.5 | 124.6 | |
| F1 22 (2022) | 247 | 222 | 101 | 72 | 38 | |
| The Quarry (2022) | 206 | 174.1 | 142 | 102.5 | 48.7 | |
| A Plague Tale Requiem (2022) | 110.9 | 97.7 | 86 | 63.4 | 36.1 | |
| Uncharted Legacy of Thieves Collection (2022) | 102.3 | 100.3 | 99.5 | 86.5 | 54.1 | |
| Call of Duty Modern Warfare 2 2022 (2022) | 182 | 149 | 140 | 104 | 67 | |
| Spider-Man Miles Morales (2022) | 115.2 | 103.3 | 101.3 | 94.8 | 68.5 | |
| Need for Speed Unbound (2022) | 101.2 | 94.7 | 83 | 79.7 | 63.6 | |
| High On Life (2023) | 214 | 162.8 | 148.4 | 100.6 | 42.6 | |
| The Witcher 3 v4 (2023) | 161.4 | 144 | 125.3 | 81.1 | 42.8 | |
| Dead Space Remake (2023) | 121.5 | 113.3 | 109.3 | 81.8 | 41.3 |
Émissions : Émissions de température et de bruit plus élevées que celles de la Blade 16
Bruit du système
Comme on pouvait s'y attendre, les composants haut de gamme proposés dégagent beaucoup de chaleur et sont donc très bruyants. Si le Legion Pro 7 est encore raisonnablement silencieux en mode veille avec un niveau de pression acoustique (SPL) moyen de 28 dB(A), le bruit devient inquiétant sans casque lorsque l'on joue en mode Performance avec un SPL compris entre 49 et 55 dB(A).
Le mode équilibré, qui n'entraîne pas un déficit de performance, donne un niveau de pression acoustique plus supportable de 43 à 46 dB(A). Le Razer Blade 16 reste comparativement plus silencieux dans toutes les conditions de test, malgré sa taille et son poids inférieurs.
Degré de la nuisance sonore
| Au repos |
| 26 / 28 / 34 dB(A) |
| Fortement sollicité |
| 47 / 56 dB(A) |
 | ||
30 dB silencieux 40 dB(A) audible 50 dB(A) bruyant |
||
min: | ||
| Lenovo Legion Pro 7 16IRX8H i9-13900HX, GeForce RTX 4080 Laptop GPU | Razer Blade 16 Early 2023 i9-13950HX, GeForce RTX 4080 Laptop GPU | Lenovo Legion 7 16IAX7-82TD004SGE i9-12900HX, GeForce RTX 3080 Ti Laptop GPU | Lenovo Legion 7 16ACHg6 R9 5900HX, GeForce RTX 3080 Laptop GPU | Lenovo Legion 7 16ARHA7 R9 6900HX, Radeon RX 6850M XT | |
|---|---|---|---|---|---|
| Noise | 14% | 3% | 3% | 16% | |
| arrêt / environnement * (dB) | 24 | 23 4% | 24.5 -2% | 26 -8% | 22.8 5% |
| Idle Minimum * (dB) | 26 | 23 12% | 24.5 6% | 26 -0% | 23 12% |
| Idle Average * (dB) | 28 | 23 18% | 30 -7% | 30 -7% | 23 18% |
| Idle Maximum * (dB) | 34 | 23.6 31% | 32.5 4% | 35 -3% | 23 32% |
| Load Average * (dB) | 47 | 39 17% | 43.9 7% | 40 15% | 26.8 43% |
| Witcher 3 ultra * (dB) | 55 | 51.6 6% | 48.8 11% | 46 16% | 54.3 1% |
| Load Maximum * (dB) | 56 | 51.3 8% | 54.2 3% | 50 11% | 54.2 3% |
* ... Moindre est la valeur, meilleures sont les performances
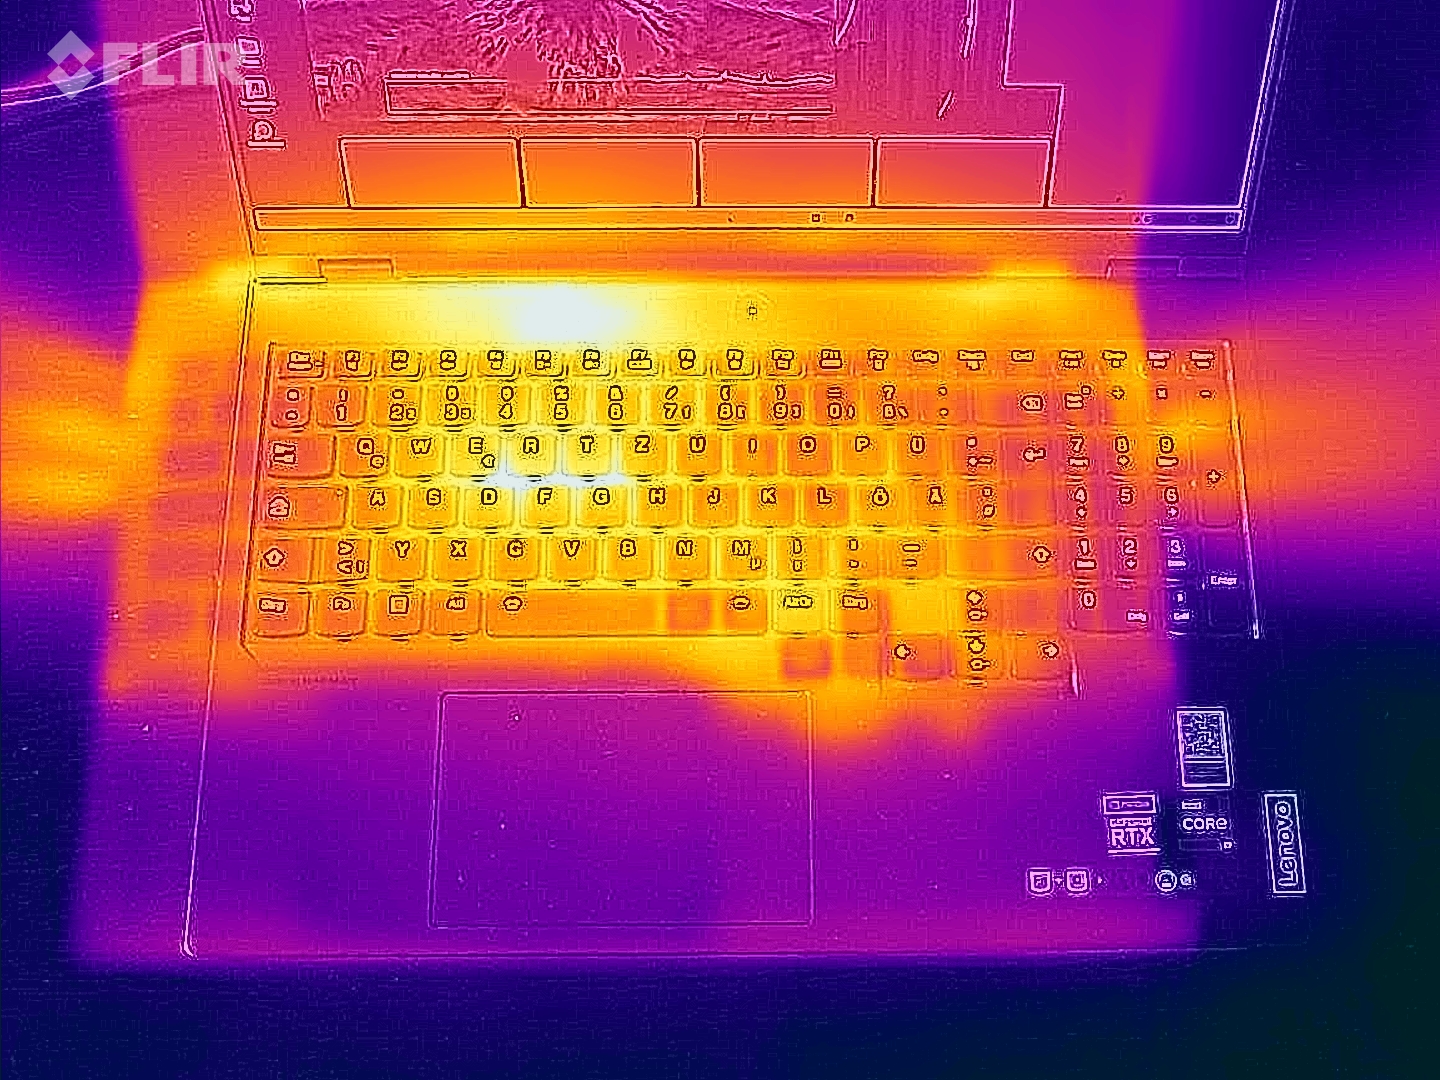
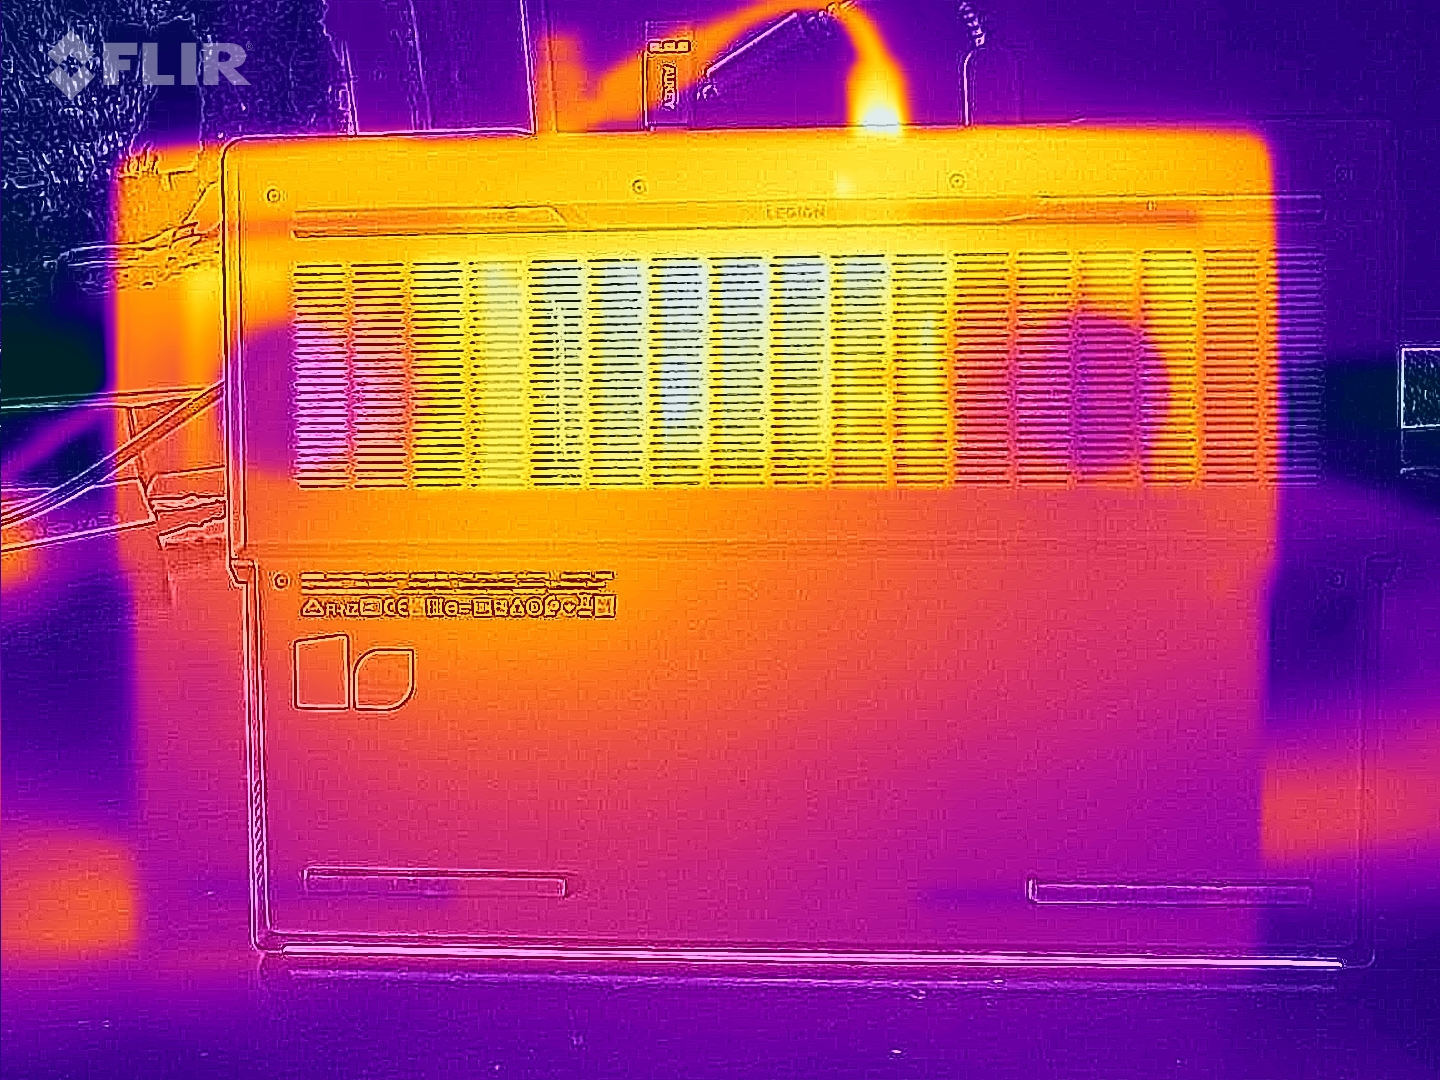
Temparature
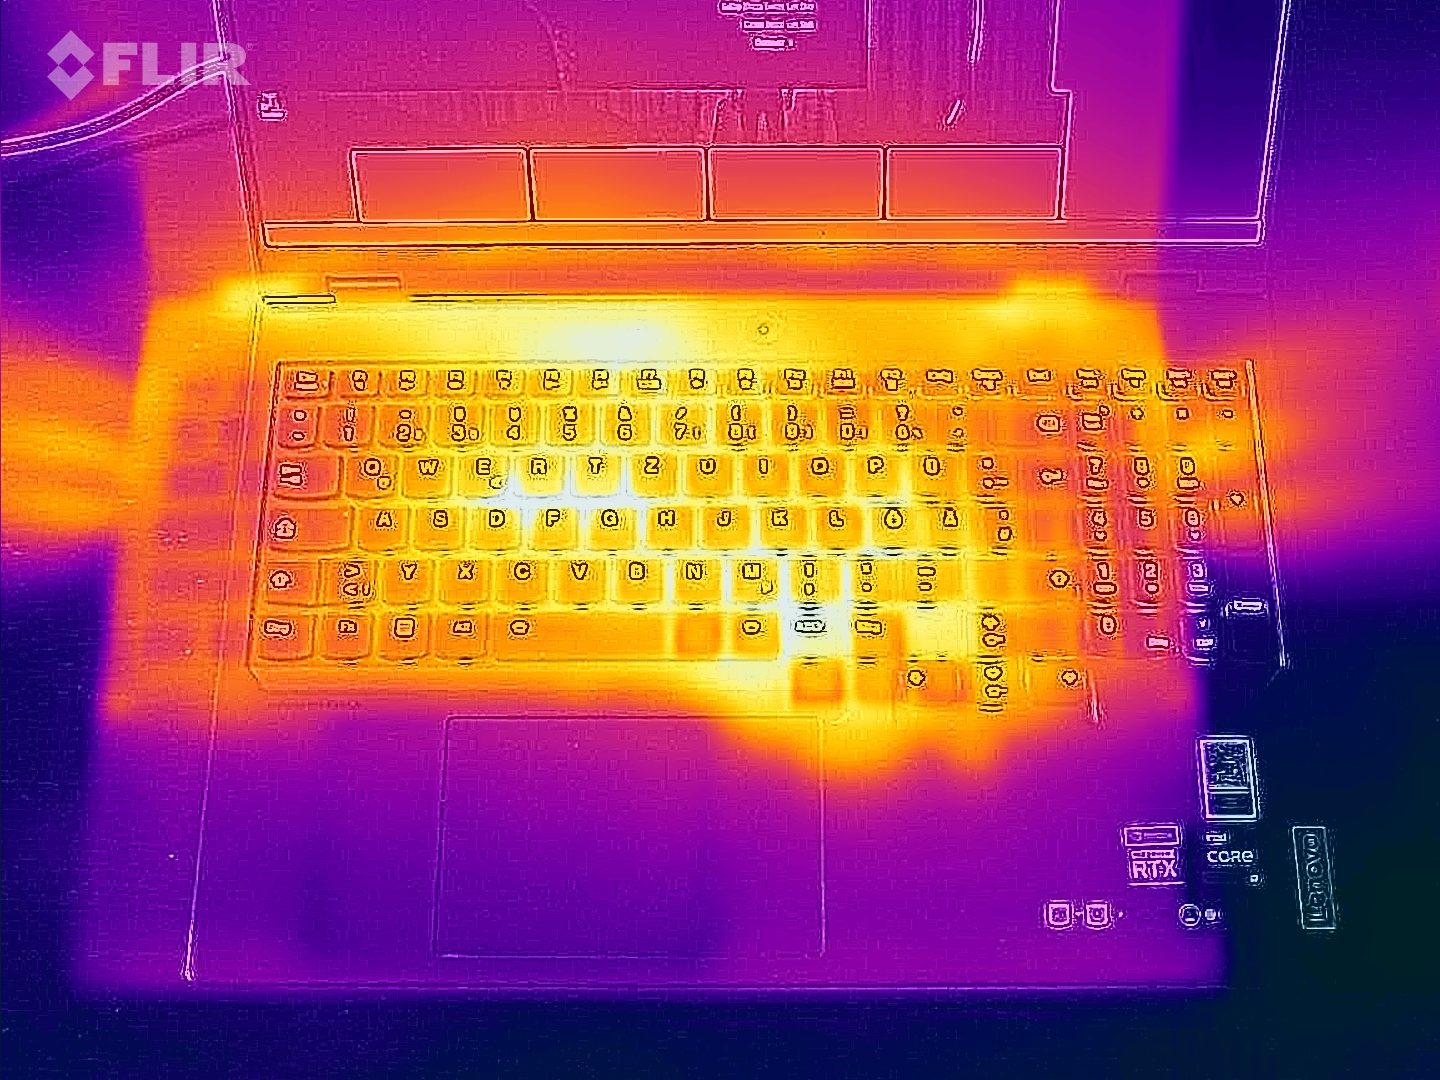
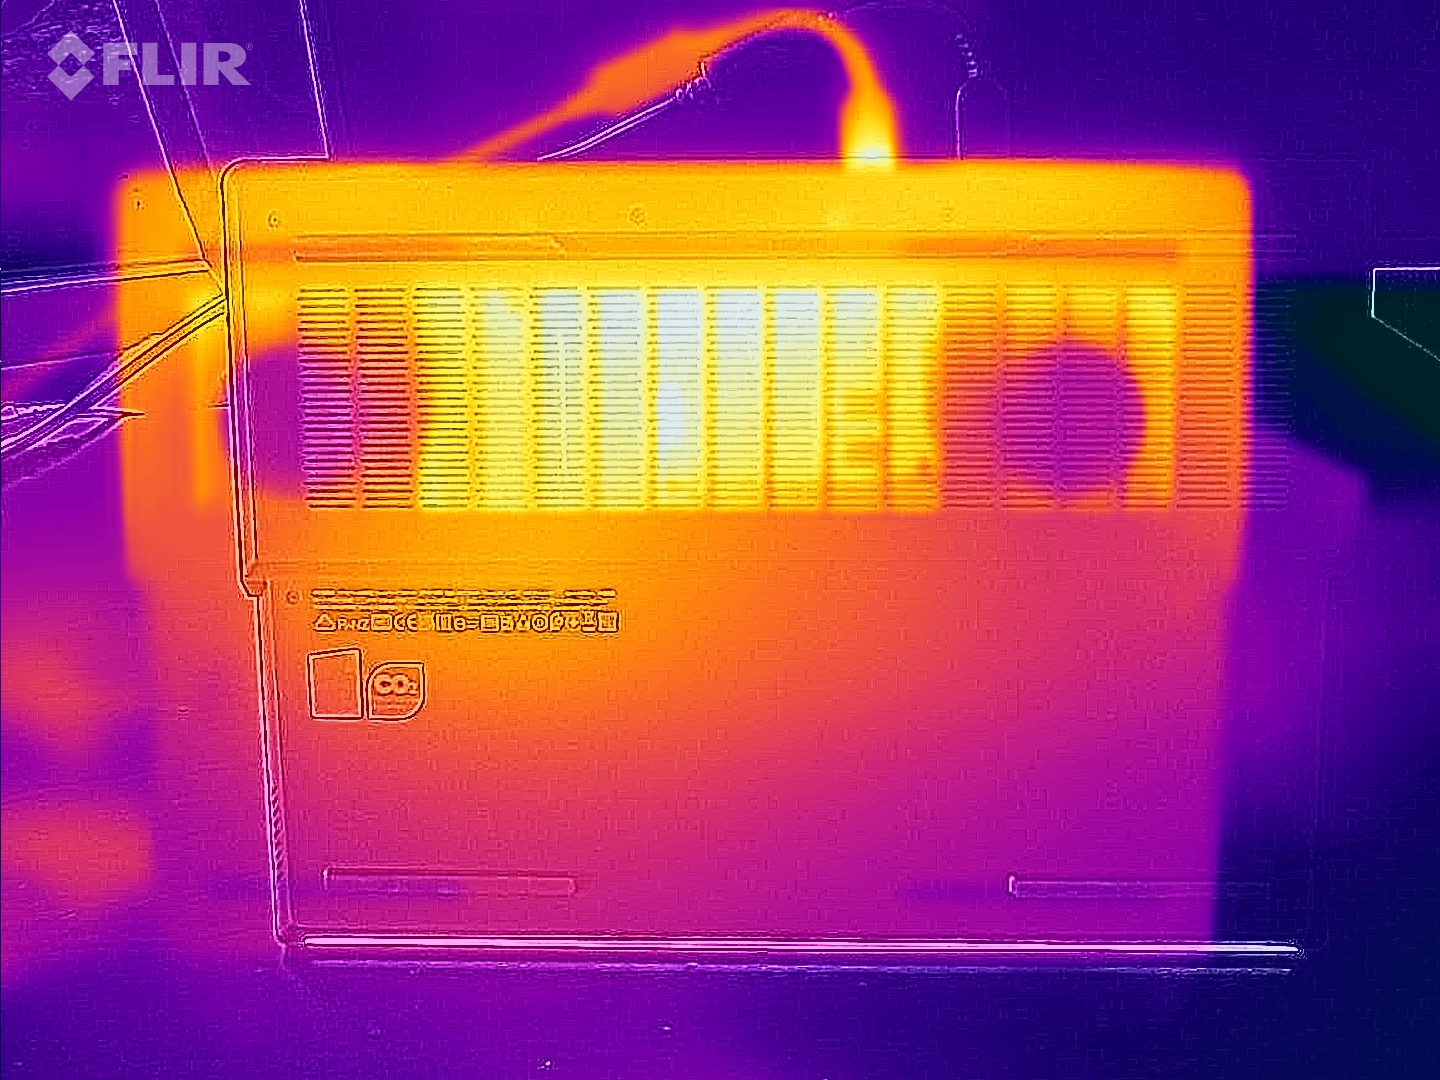
En stressant avec The Witcher 3 à 1080p Ultra, le dessous du Legion Pro 7 franchit les 50 °C à certains endroits, ce qui signifie que ce n'est pas adapté pour jouer sur les genoux. Au ralenti, le dessus se réchauffe jusqu'à 40 °C, ce qui est relativement élevé.
Même en ce qui concerne les émissions de chaleur, le Razer Blade 16 semble avoir de meilleures performances que le Legion Pro 7.
(-) La température maximale du côté supérieur est de 48 °C / 118 F, par rapport à la moyenne de 40.4 °C / 105 F, allant de 21.2 à 68.8 °C pour la classe Gaming.
(-) Le fond chauffe jusqu'à un maximum de 49 °C / 120 F, contre une moyenne de 43.2 °C / 110 F
(±) En utilisation inactive, la température moyenne du côté supérieur est de 32.7 °C / 91 F, par rapport à la moyenne du dispositif de 33.9 °C / 93 F.
(-) En jouant à The Witcher 3, la température moyenne du côté supérieur est de 43.3 °C / 110 F, alors que la moyenne de l'appareil est de 33.9 °C / 93 F.
(-) Les repose-poignets et le pavé tactile peuvent devenir très chauds au toucher, avec un maximum de 42 °C / 107.6# F.
(-) La température moyenne de la zone de l'appui-paume de dispositifs similaires était de 28.8 °C / 83.8 F (-13.2 °C / #-23.8 F).
| Lenovo Legion Pro 7 16IRX8H i9-13900HX, GeForce RTX 4080 Laptop GPU | Razer Blade 16 Early 2023 i9-13950HX, GeForce RTX 4080 Laptop GPU | Lenovo Legion 7 16IAX7-82TD004SGE i9-12900HX, GeForce RTX 3080 Ti Laptop GPU | Lenovo Legion 7 16ACHg6 R9 5900HX, GeForce RTX 3080 Laptop GPU | Lenovo Legion 7 16ARHA7 R9 6900HX, Radeon RX 6850M XT | |
|---|---|---|---|---|---|
| Heat | 16% | -5% | -5% | 13% | |
| Maximum Upper Side * (°C) | 48 | 40 17% | 44.4 7% | 51 -6% | 37.2 22% |
| Maximum Bottom * (°C) | 49 | 37.6 23% | 60.8 -24% | 52 -6% | 43 12% |
| Idle Upper Side * (°C) | 40 | 32.4 19% | 33.8 15% | 37 7% | 34 15% |
| Idle Bottom * (°C) | 33 | 31.4 5% | 38.8 -18% | 38 -15% | 32.8 1% |
* ... Moindre est la valeur, meilleures sont les performances
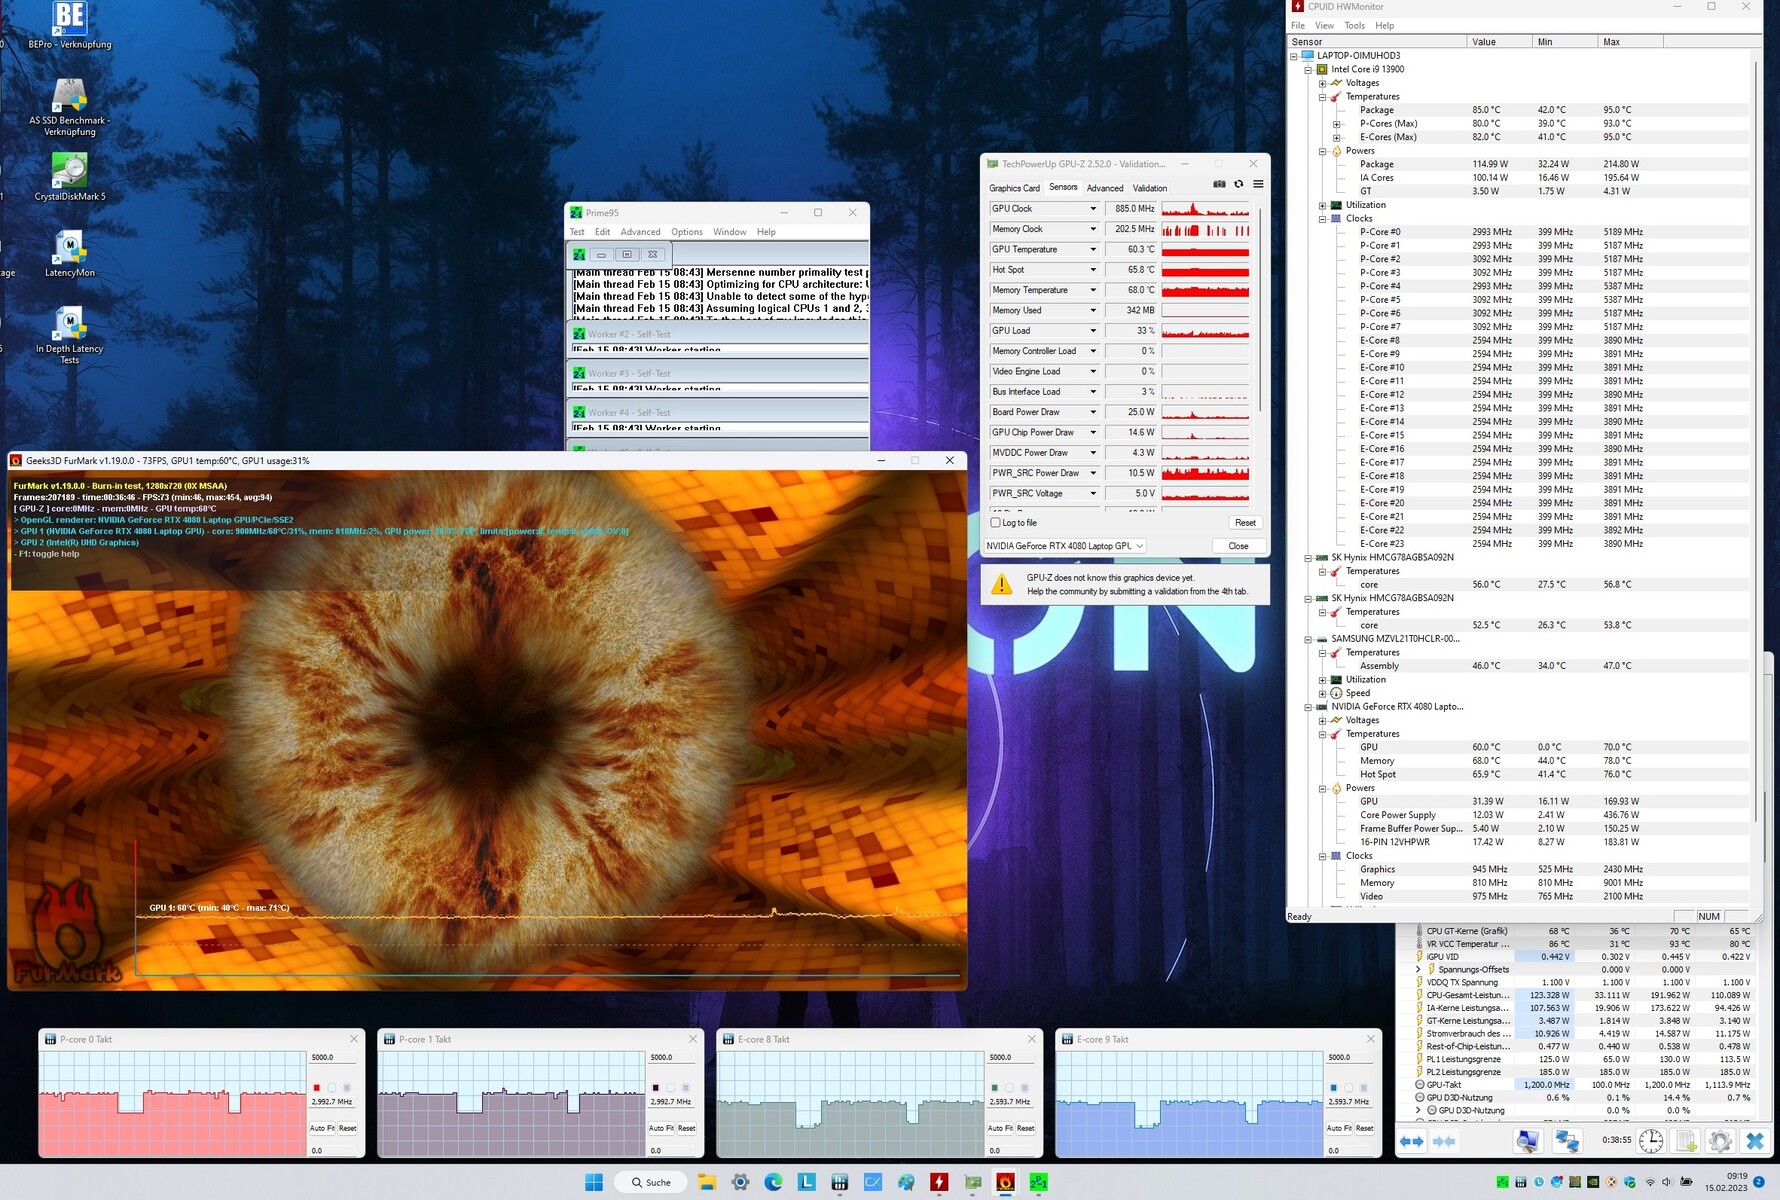
Test de stress
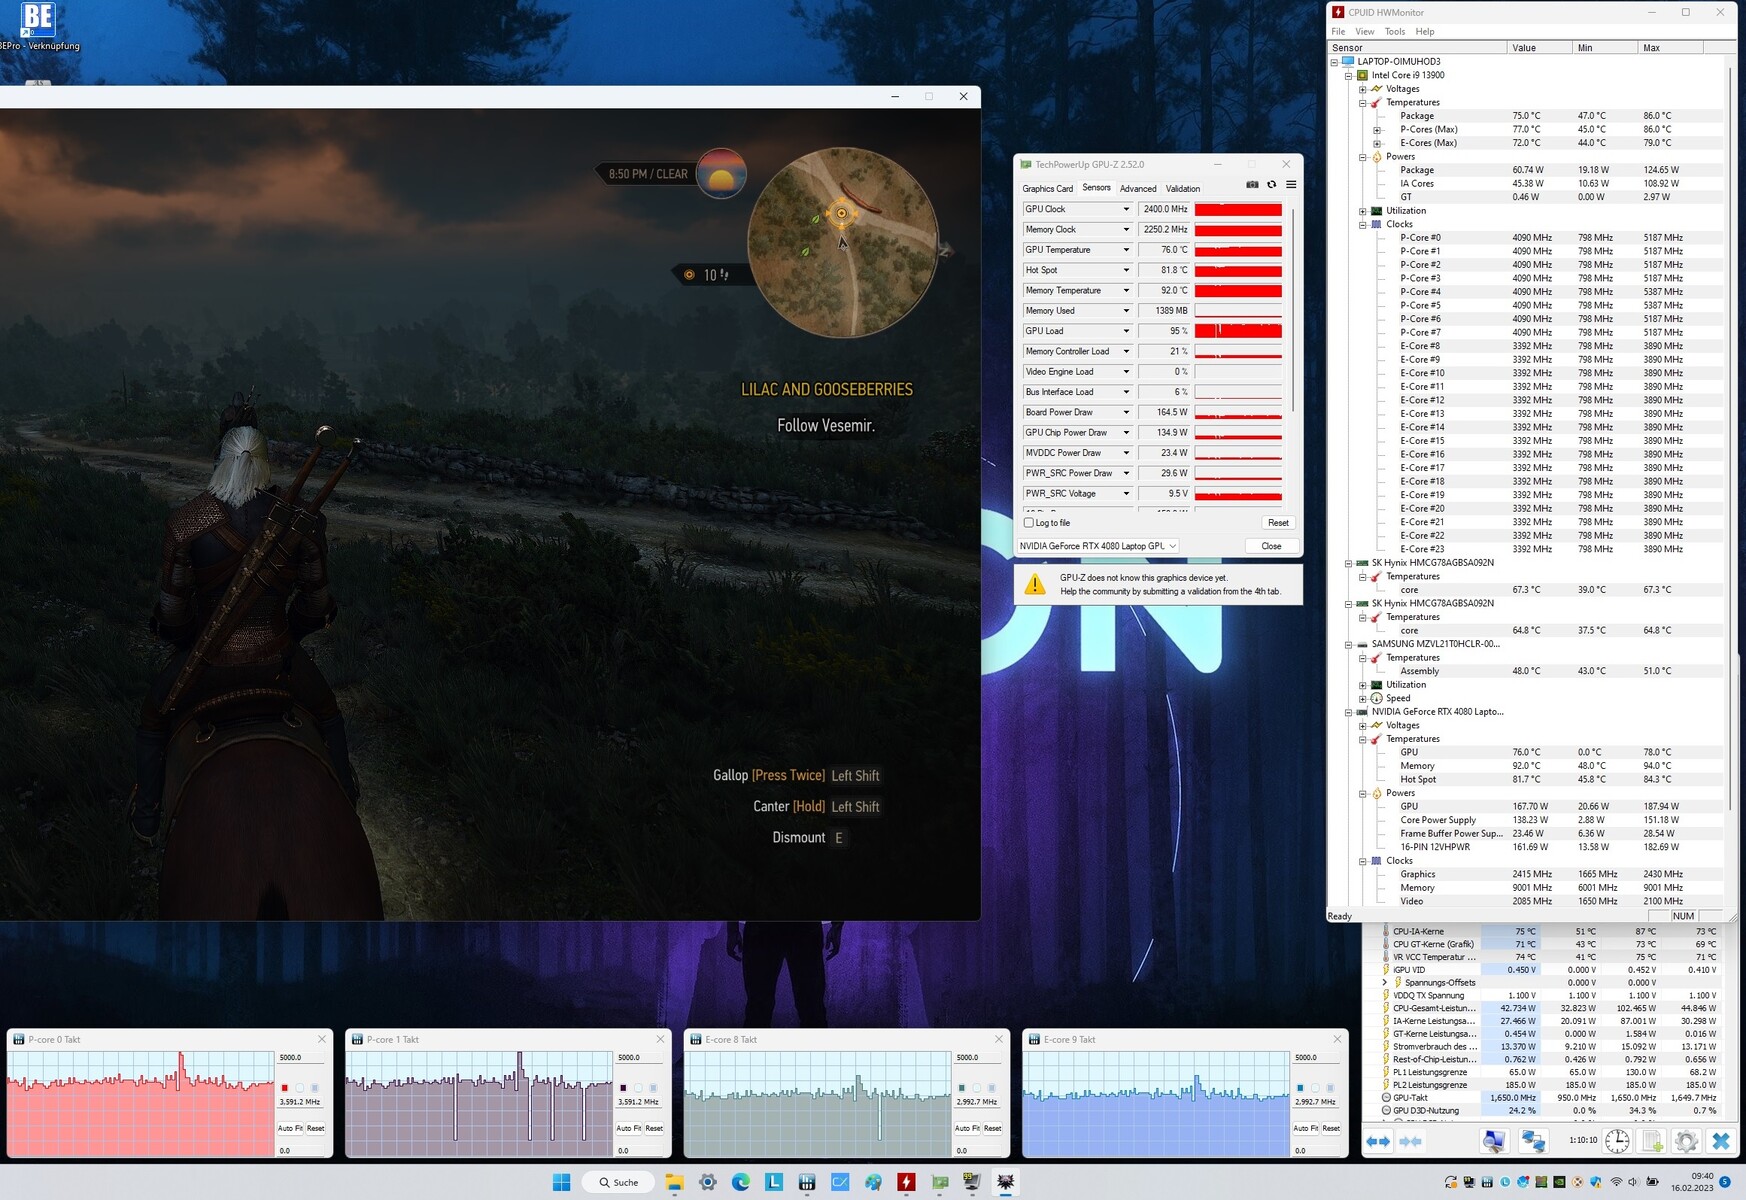
Un test de stress combiné avec FurMark et Prime95 n'est pas très utile car le GPU montre un étranglement. Pendant le stress de The Witcher 3, le CPU et le GPU chauffent en moyenne à 75 °C, ce qui n'est pas problématique.
Haut-parleurs
L'un des points forts du Legion Pro 7 est la collaboration de Lenovo avec Harman, qui permet d'obtenir des haut-parleurs de bonne qualité. Notre analyse audio ne montre aucune faiblesse flagrante dans aucune gamme de fréquences, ce qui est rare dans les ordinateurs portables - le Blade 16 doit se contenter de basses plus faibles, par exemple.
Des haut-parleurs externes ou un casque ne sont pas absolument nécessaires étant donné le niveau de volume maximal élevé de 82 dB(A).
Lenovo Legion Pro 7 16IRX8H analyse audio
(+) | les haut-parleurs peuvent jouer relativement fort (82# dB)
Basses 100 - 315 Hz
(±) | basse réduite - en moyenne 8.9% inférieure à la médiane
(+) | les basses sont linéaires (6.4% delta à la fréquence précédente)
Médiums 400 - 2000 Hz
(+) | médiane équilibrée - seulement 2.8% de la médiane
(+) | les médiums sont linéaires (4.2% delta à la fréquence précédente)
Aiguës 2 - 16 kHz
(+) | des sommets équilibrés - à seulement 2.5% de la médiane
(+) | les aigus sont linéaires (6% delta à la fréquence précédente)
Globalement 100 - 16 000 Hz
(+) | le son global est linéaire (9.4% différence à la médiane)
Par rapport à la même classe
» 3% de tous les appareils testés de cette catégorie étaient meilleurs, 2% similaires, 95% pires
» Le meilleur avait un delta de 6%, la moyenne était de 18%, le pire était de 132%.
Par rapport à tous les appareils testés
» 3% de tous les appareils testés étaient meilleurs, 1% similaires, 96% pires
» Le meilleur avait un delta de 4%, la moyenne était de 24%, le pire était de 134%.
Razer Blade 16 Early 2023 analyse audio
(+) | les haut-parleurs peuvent jouer relativement fort (88.2# dB)
Basses 100 - 315 Hz
(-) | presque aucune basse - en moyenne 16.4% plus bas que la médiane
(±) | la linéarité des basses est moyenne (10.8% delta à la fréquence précédente)
Médiums 400 - 2000 Hz
(+) | médiane équilibrée - seulement 2.5% de la médiane
(+) | les médiums sont linéaires (2.4% delta à la fréquence précédente)
Aiguës 2 - 16 kHz
(+) | des sommets équilibrés - à seulement 4.9% de la médiane
(±) | la linéarité des aigus est moyenne (7.9% delta à la fréquence précédente)
Globalement 100 - 16 000 Hz
(+) | le son global est linéaire (12.6% différence à la médiane)
Par rapport à la même classe
» 16% de tous les appareils testés de cette catégorie étaient meilleurs, 3% similaires, 81% pires
» Le meilleur avait un delta de 6%, la moyenne était de 18%, le pire était de 132%.
Par rapport à tous les appareils testés
» 11% de tous les appareils testés étaient meilleurs, 2% similaires, 86% pires
» Le meilleur avait un delta de 4%, la moyenne était de 24%, le pire était de 134%.
Gestion de l'énergie : Consommation élevée même au repos
Consommation électrique
Comme c'est le cas pour les ordinateurs portables de jeu haut de gamme, le Legion Pro 7 a des besoins énergétiques élevés malgré la commutation graphique, même en mode inactif. Avec une consommation de 18 à 32 W (y compris de courts pics de charge) en mode inactif, le Legion Pro 7 se situe près de 20 % au-dessus de la moyenne de la catégorie.
Nous enregistrons une consommation de 130 W au mur en charge moyenne (3DMark06) et de 320 W en stress maximal. Pendant les jeux, on peut s'attendre à ce que la consommation atteigne environ 260 W, ce qui est légèrement supérieur à celle de la Blade 16 (242 W).
| Éteint/en veille | |
| Au repos | |
| Fortement sollicité |
|
Légende:
min: | |
| Lenovo Legion Pro 7 16IRX8H i9-13900HX, GeForce RTX 4080 Laptop GPU | Razer Blade 16 Early 2023 i9-13950HX, GeForce RTX 4080 Laptop GPU | Lenovo Legion 7 16IAX7-82TD004SGE i9-12900HX, GeForce RTX 3080 Ti Laptop GPU | Lenovo Legion 7 16ACHg6 R9 5900HX, GeForce RTX 3080 Laptop GPU | Lenovo Legion 7 16ARHA7 R9 6900HX, Radeon RX 6850M XT | Moyenne de la classe Gaming | |
|---|---|---|---|---|---|---|
| Power Consumption | -1% | 1% | -14% | 21% | 22% | |
| Idle Minimum * (Watt) | 18 | 15.2 16% | 19.2 -7% | 31 -72% | 9.9 45% | 13.3 ? 26% |
| Idle Average * (Watt) | 24 | 22.8 5% | 25.1 -5% | 33 -38% | 22 8% | 19 ? 21% |
| Idle Maximum * (Watt) | 32 | 49.8 -56% | 27.1 15% | 46 -44% | 23.1 28% | 24.5 ? 23% |
| Load Average * (Watt) | 130 | 121.2 7% | 132 -2% | 110 15% | 94.4 27% | 108.1 ? 17% |
| Witcher 3 ultra * (Watt) | 260 | 242 7% | 253 3% | 180 31% | 249 4% | |
| Load Maximum * (Watt) | 320 | 273.7 14% | 308.9 3% | 235 27% | 276 14% | 254 ? 21% |
* ... Moindre est la valeur, meilleures sont les performances
Power consumption: The Witcher 3 / Stress test
Power consumption: External Monitor
Durée de vie de la batterie
Lenovo équipe le Legion Pro 7 d'une puissante batterie de 99 WHr, qui ne peut être que quelque peu utile en raison de la gestion sous-optimale de l'énergie. Jusqu'à 6,5 heures d'autonomie sont possibles en veille, sans autre tâche en cours et avec une luminosité minimale. C'est un résultat modeste comparé aux 9,5 heures du Blade 16.
En utilisation quotidienne, comme la navigation sur Internet en Wi-Fi à une luminosité réduite de 150 nits, nous avons pu parvenir à obtenir 5 heures d'autonomie.
| Lenovo Legion Pro 7 16IRX8H i9-13900HX, GeForce RTX 4080 Laptop GPU, 99.9 Wh | Razer Blade 16 Early 2023 i9-13950HX, GeForce RTX 4080 Laptop GPU, 95.2 Wh | Lenovo Legion 7 16IAX7-82TD004SGE i9-12900HX, GeForce RTX 3080 Ti Laptop GPU, 99 Wh | Lenovo Legion 7 16ACHg6 R9 5900HX, GeForce RTX 3080 Laptop GPU, 80 Wh | Lenovo Legion 7 16ARHA7 R9 6900HX, Radeon RX 6850M XT, 99 Wh | Moyenne de la classe Gaming | |
|---|---|---|---|---|---|---|
| Autonomie de la batterie | 9% | -40% | 12% | 2% | 14% | |
| Reader / Idle (h) | 6.4 | 8.9 39% | 8.2 28% | 4.9 -23% | 8.71 ? 36% | |
| WiFi v1.3 (h) | 5.1 | 6.1 20% | 4.5 -12% | 6.8 33% | 7.3 43% | 7.01 ? 37% |
| Load (h) | 2.1 | 1.4 -33% | 0.7 -67% | 1.6 -24% | 1.8 -14% | 1.47 ? -30% |
| H.264 (h) | 5.1 | 6.8 | 8.26 ? | |||
| Witcher 3 ultra (h) | 0.9 |
Points positifs
Points négatifs
Verdict : Une puissance de jeu impressionnante
Les joueurs passionnés qui veulent jouer à des titres modernes exigeants avec un maximum de détails et qui n'hésitent pas à dépenser leur argent trouveront dans le Lenovo Legion 7 Pro 16IRX8H le bon choix.
La combinaison d'un Core i9-13900HX et d'une RTX 4080 GeForce offre un niveau de performance impressionnant qui peut facilement donner 40 voire 60 fps dans la plupart des jeux modernes en 4K Ultra
L'écran 16:10 QHD 240 Hz, lumineux, net et aux couleurs précises, offre une expérience visuelle immersive. Le matériel est logé dans un châssis élégant qui donne une impression de qualité supérieure et obtient de bons résultats en termes de fabrication et de stabilité. D'autres aspects tels que la qualité du son, les périphériques d'entrée et la connectivité semblent également être presque parfaits.
Cependant, les acheteurs potentiels du Lenovo Legion 7 Pro 16IRX8H devront garder à l'esprit les émissions élevées. L'ordinateur portable de 16 pouces devient assez chaud sous charge, sauf si le profil Silencieux est sélectionné - nous trouvons que le profil Équilibré est le meilleur compromis entre les performances et les émissions pour une utilisation quotidienne. Nous aurions également aimé voir une plus grande autonomie de la batterie de 99 WHr.
L'un des principaux concurrents du nouveau Lenovo Legion 7 Pro est leRazer Blade 16qui est en fait plus silencieux et plus froid tout en offrant des niveaux de performance similaires. De plus, le Blade 16 est un peu plus léger et plus fin en comparaison.
Cela étant dit, le Lenovo Legion 7 Pro 16IRX8H impressionne dans l'ensemble et mérite à juste titre notre note "Très bien".
Prix et disponibilité
Le Lenovo Legion Pro 7 16IRX8H testé est disponible sur campuspoint.depour 3 599 €. (RRP : €3,999).
Lenovo Legion Pro 7 16IRX8H
- 02/21/2023 v7 (old)
Florian Glaser
Transparency
La sélection des appareils à examiner est effectuée par notre équipe éditoriale. L'échantillon de test a été prêté à l'auteur par le fabricant ou le détaillant pour les besoins de cet examen. Le prêteur n'a pas eu d'influence sur cette évaluation et le fabricant n'a pas reçu de copie de cette évaluation avant sa publication. Il n'y avait aucune obligation de publier cet article. En tant que média indépendant, Notebookcheck n'est pas soumis à l'autorité des fabricants, des détaillants ou des éditeurs.
Voici comment Notebookcheck teste
Chaque année, Notebookcheck examine de manière indépendante des centaines d'ordinateurs portables et de smartphones en utilisant des procédures standardisées afin de garantir que tous les résultats sont comparables. Nous avons continuellement développé nos méthodes de test depuis environ 20 ans et avons établi des normes industrielles dans le processus. Dans nos laboratoires de test, des équipements de mesure de haute qualité sont utilisés par des techniciens et des rédacteurs expérimentés. Ces tests impliquent un processus de validation en plusieurs étapes. Notre système d'évaluation complexe repose sur des centaines de mesures et de points de référence bien fondés, ce qui garantit l'objectivité.Price comparison

