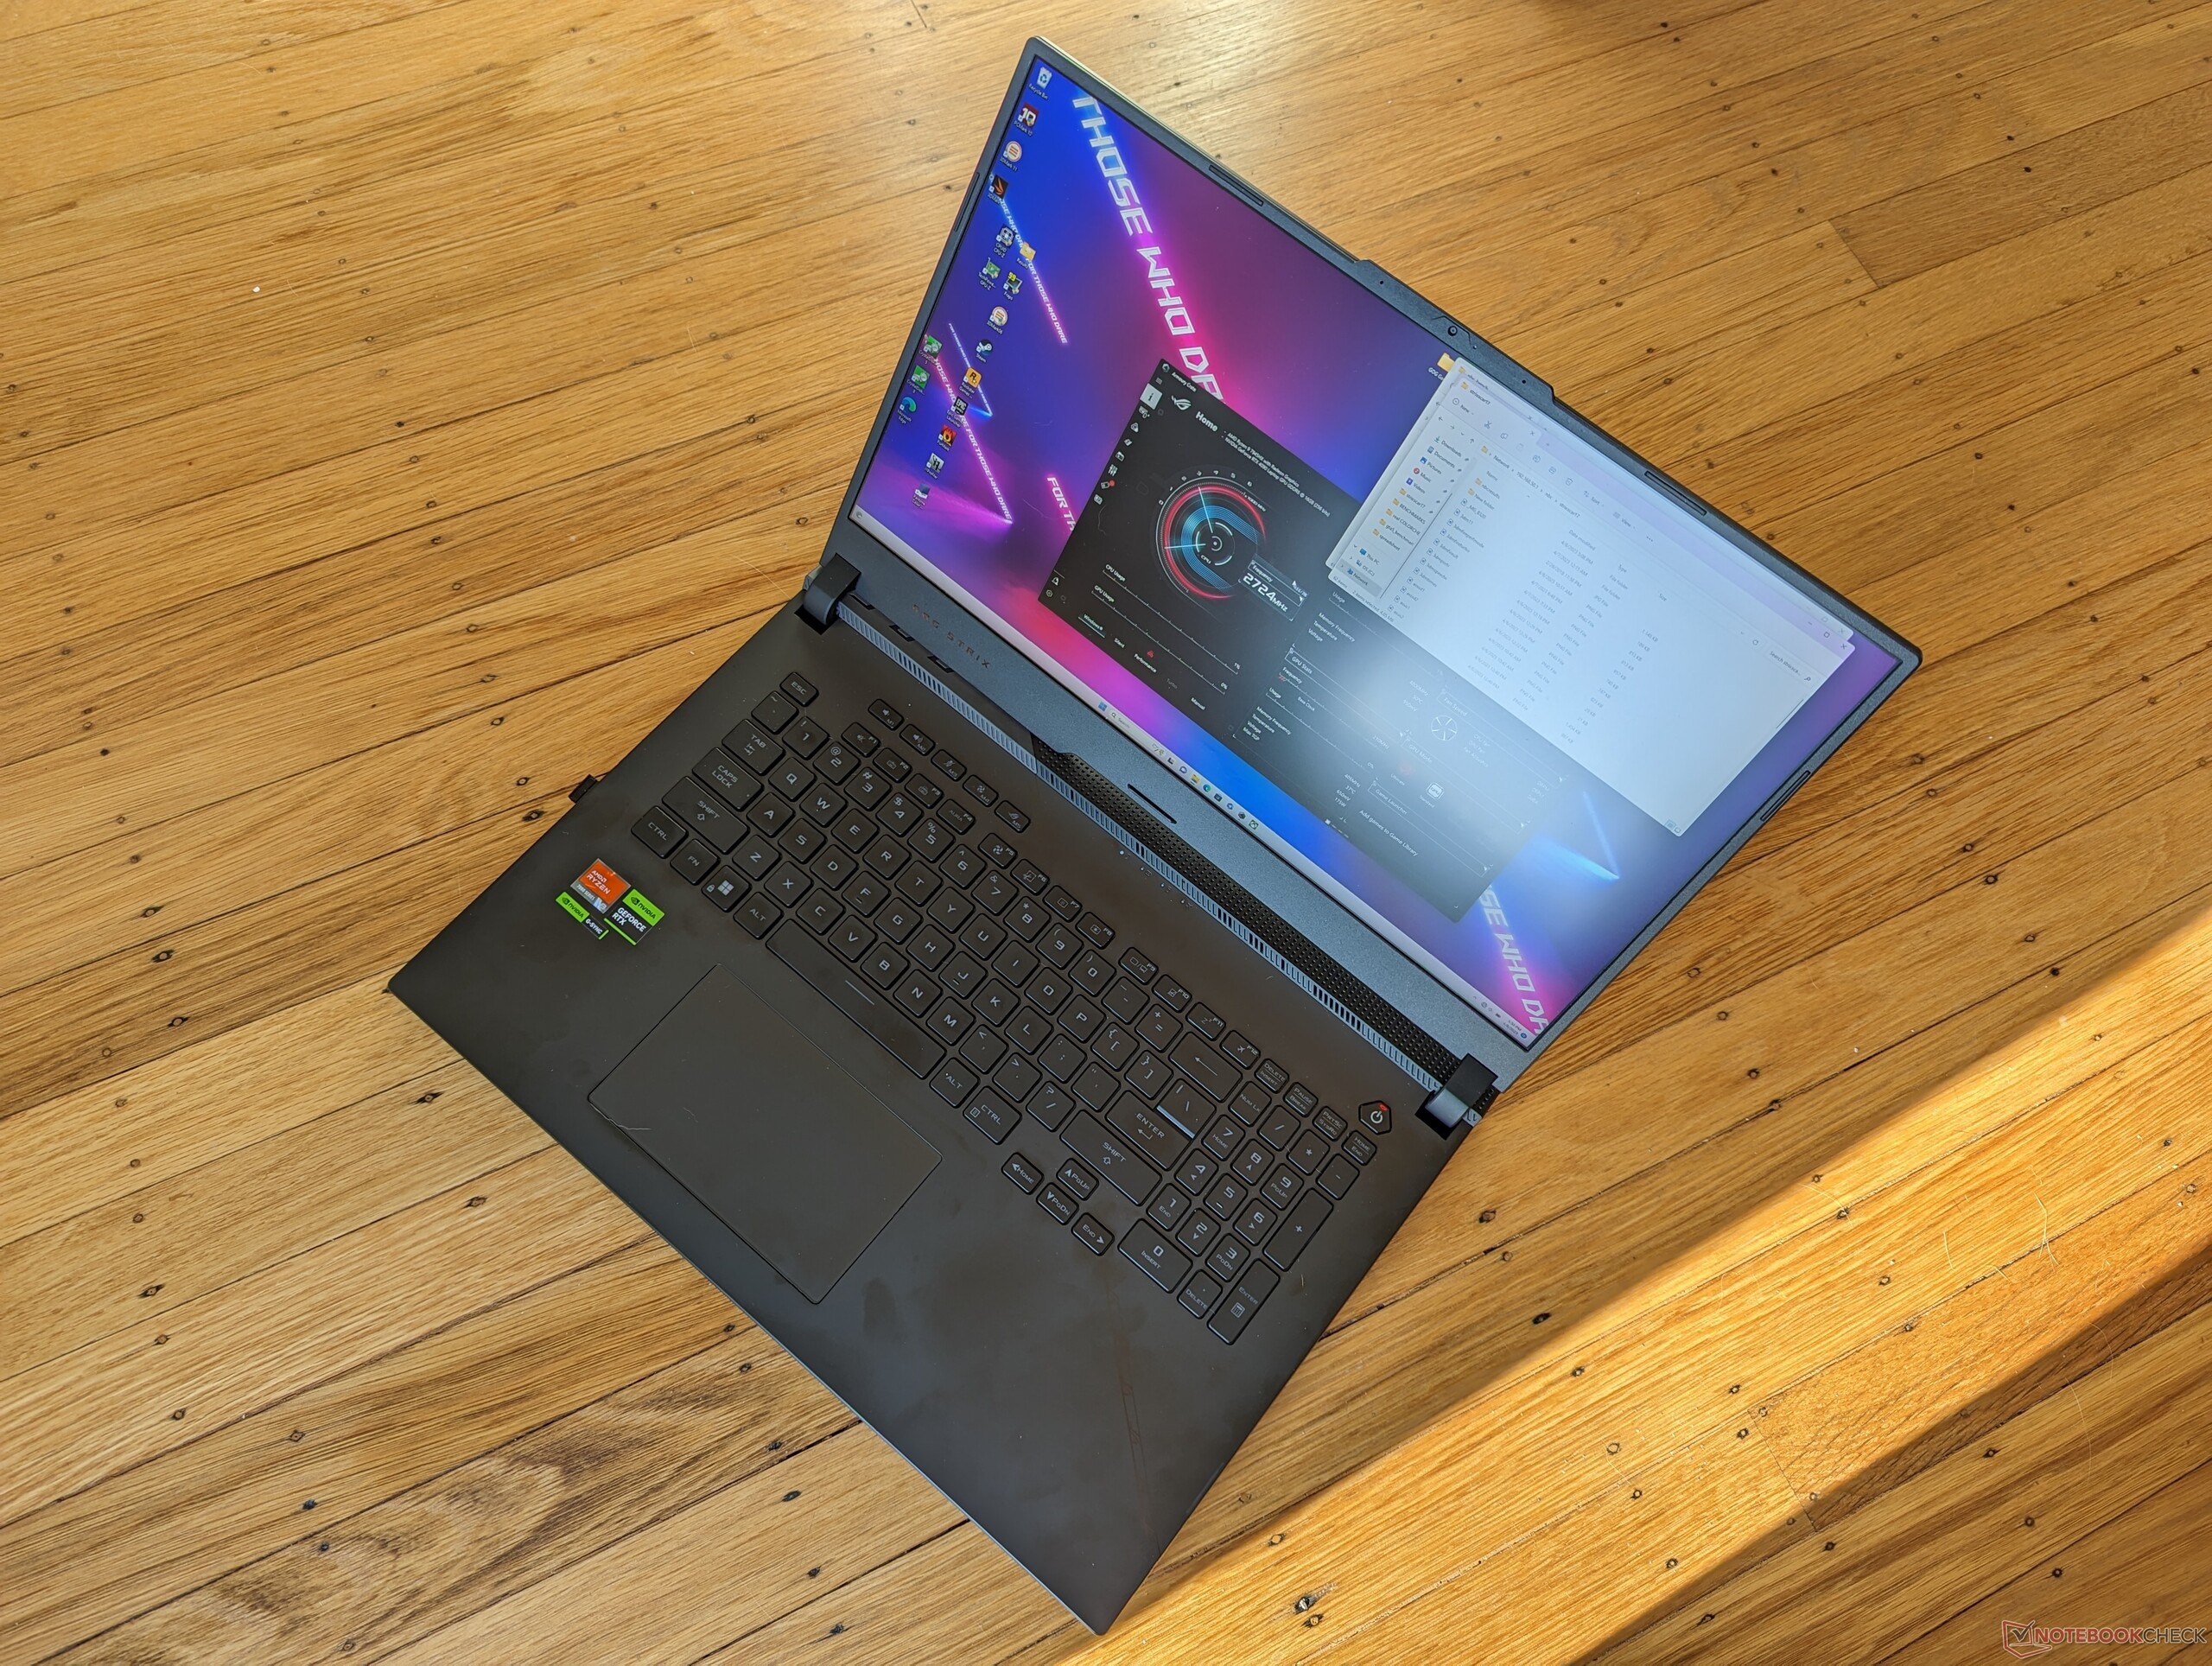
Test de l'Asus ROG Strix Scar 17 G733PY : Intel n'est plus roi

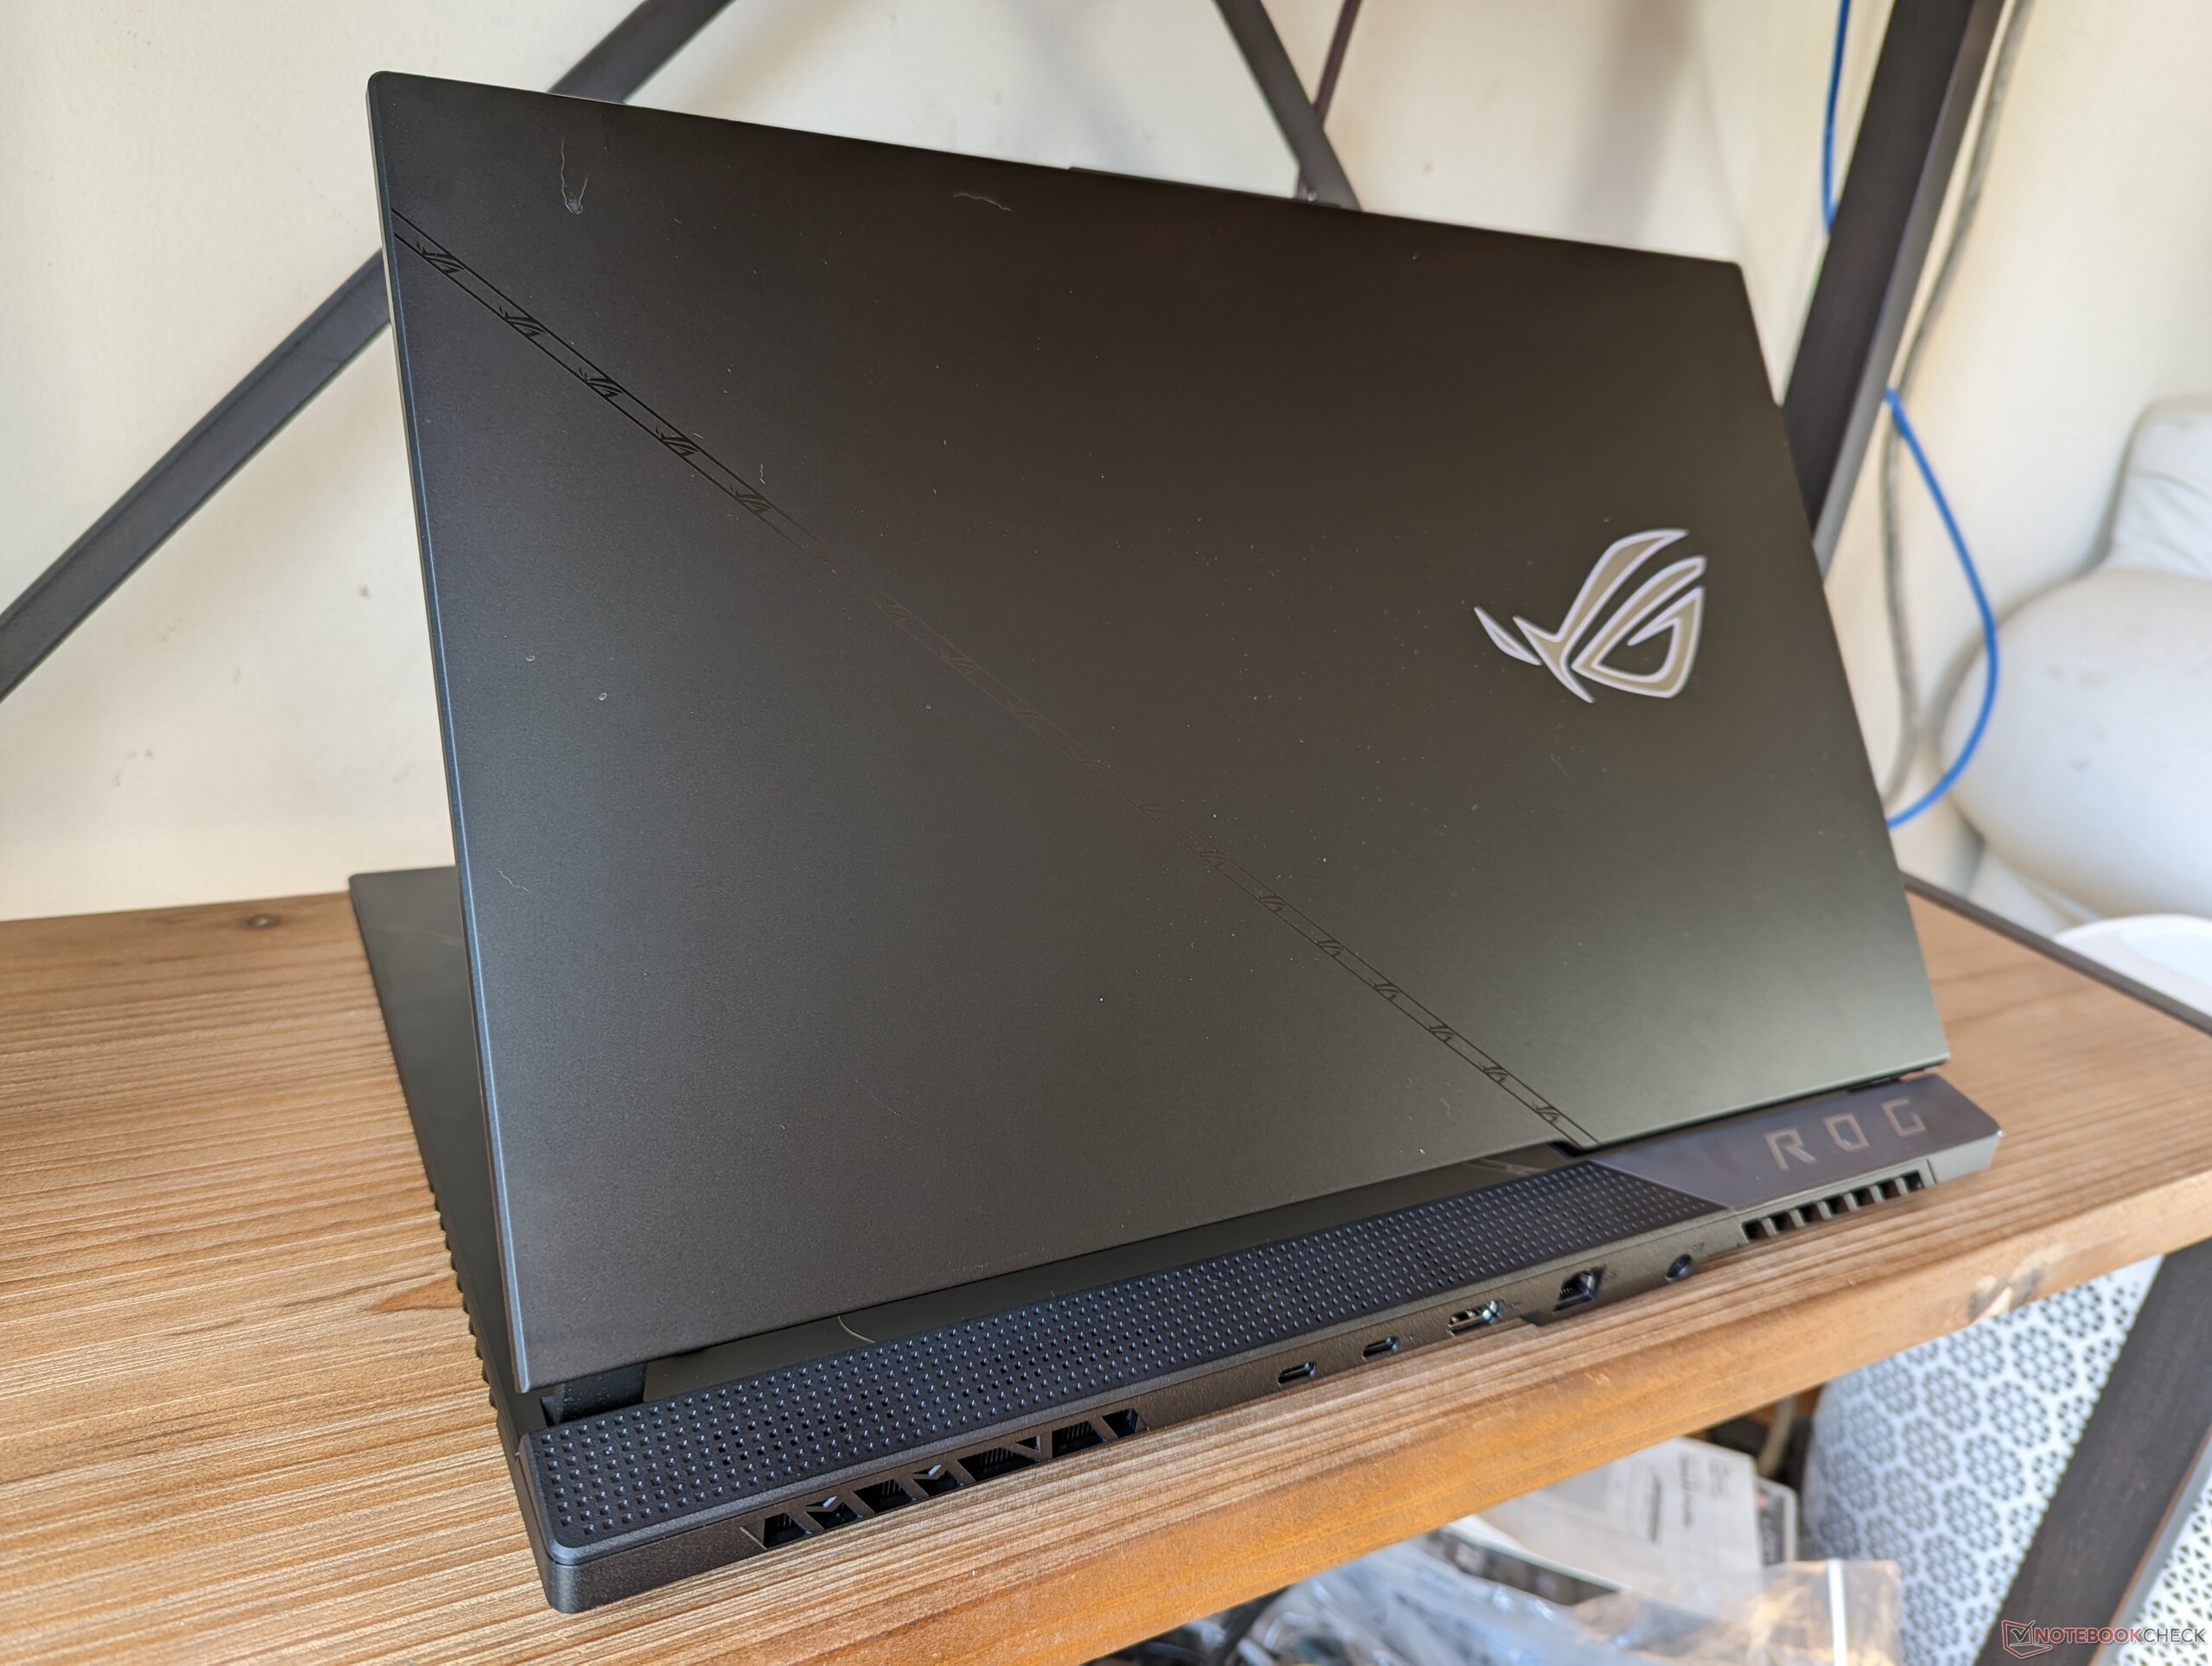
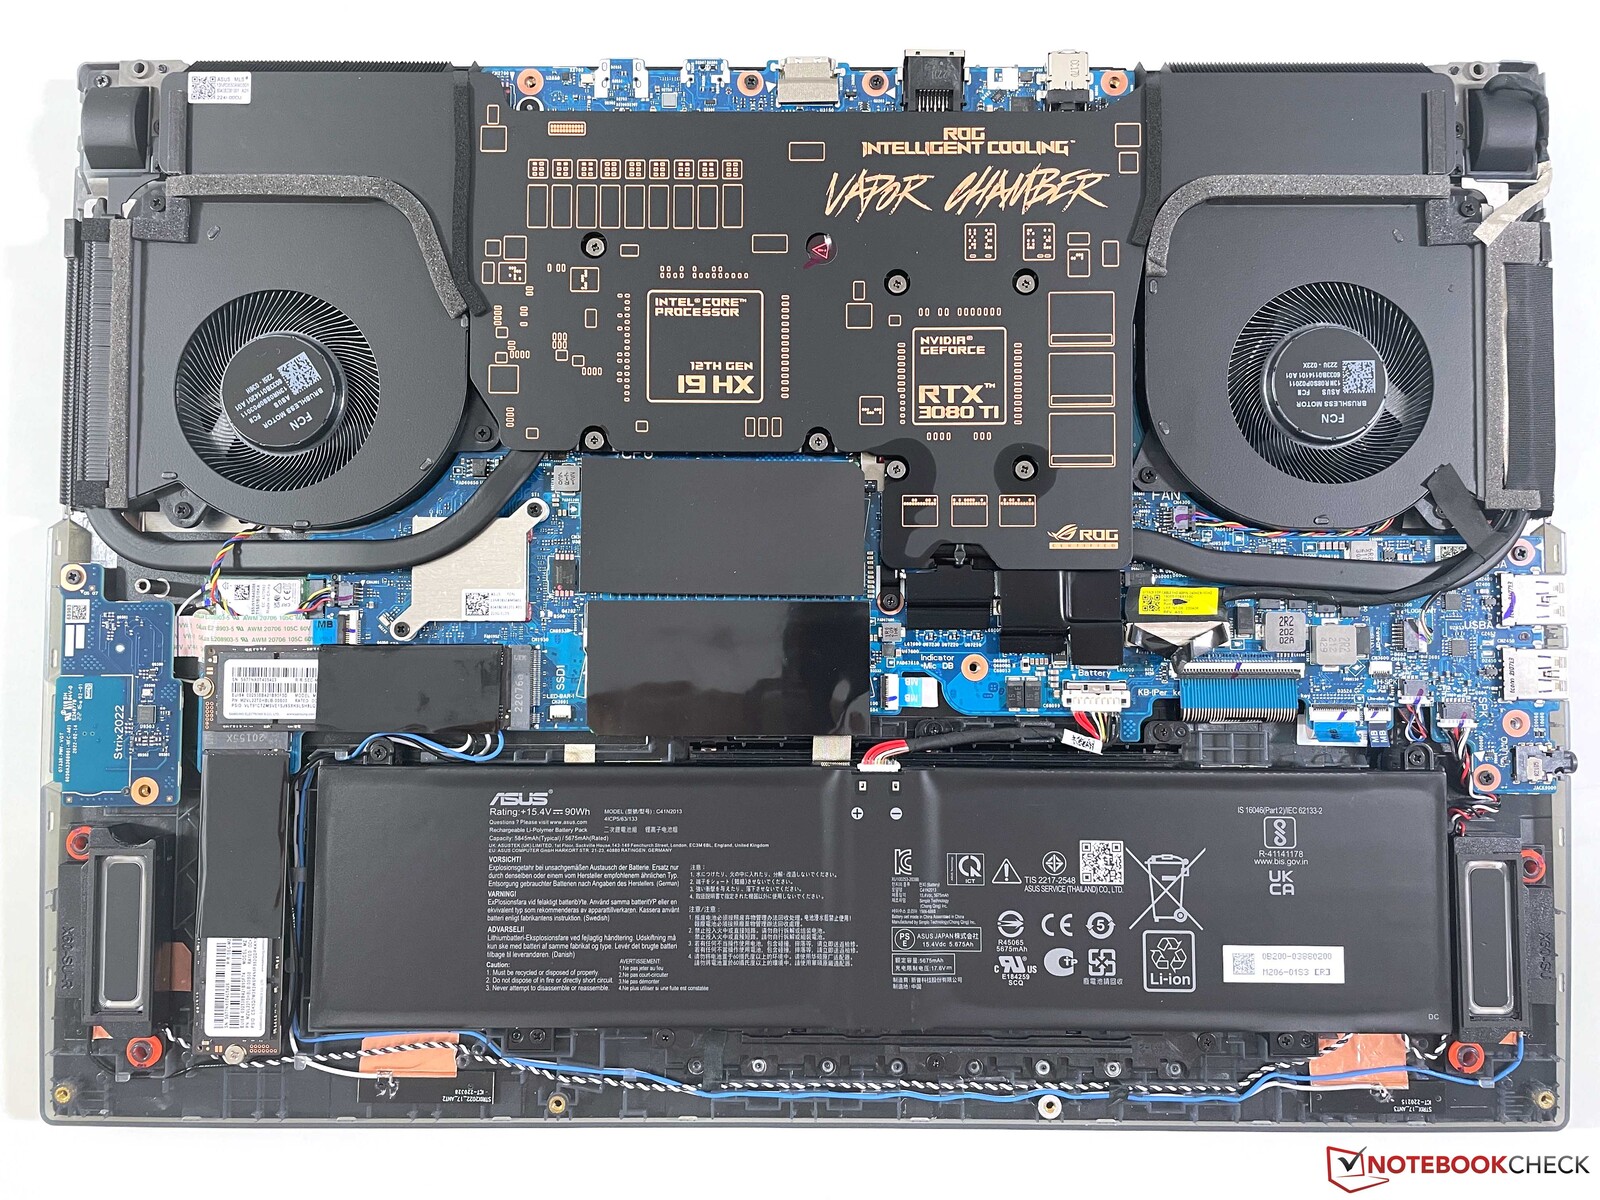
Dévoilé au CES 2023, Asus a rafraîchi sa série haut de gamme ROG Strix Scar 17 de 17,3 pouces avec les derniers CPU Intel 13ème génération, CPU AMD Zen 4 et GPU Nvidia Ada Lovelace pour remplacer la gamme de l'année dernière. En dehors de ces mises à jour internes, le design extérieur du châssis reste pratiquement identique d'une année sur l'autre. Nous vous recommandons de consulter nos avis sur le ROG Strix Scar 17 2022 pour en savoir plus sur les caractéristiques physiques du modèle 2023. Les différences entre les deux modèles sont indiquées ci-dessous.
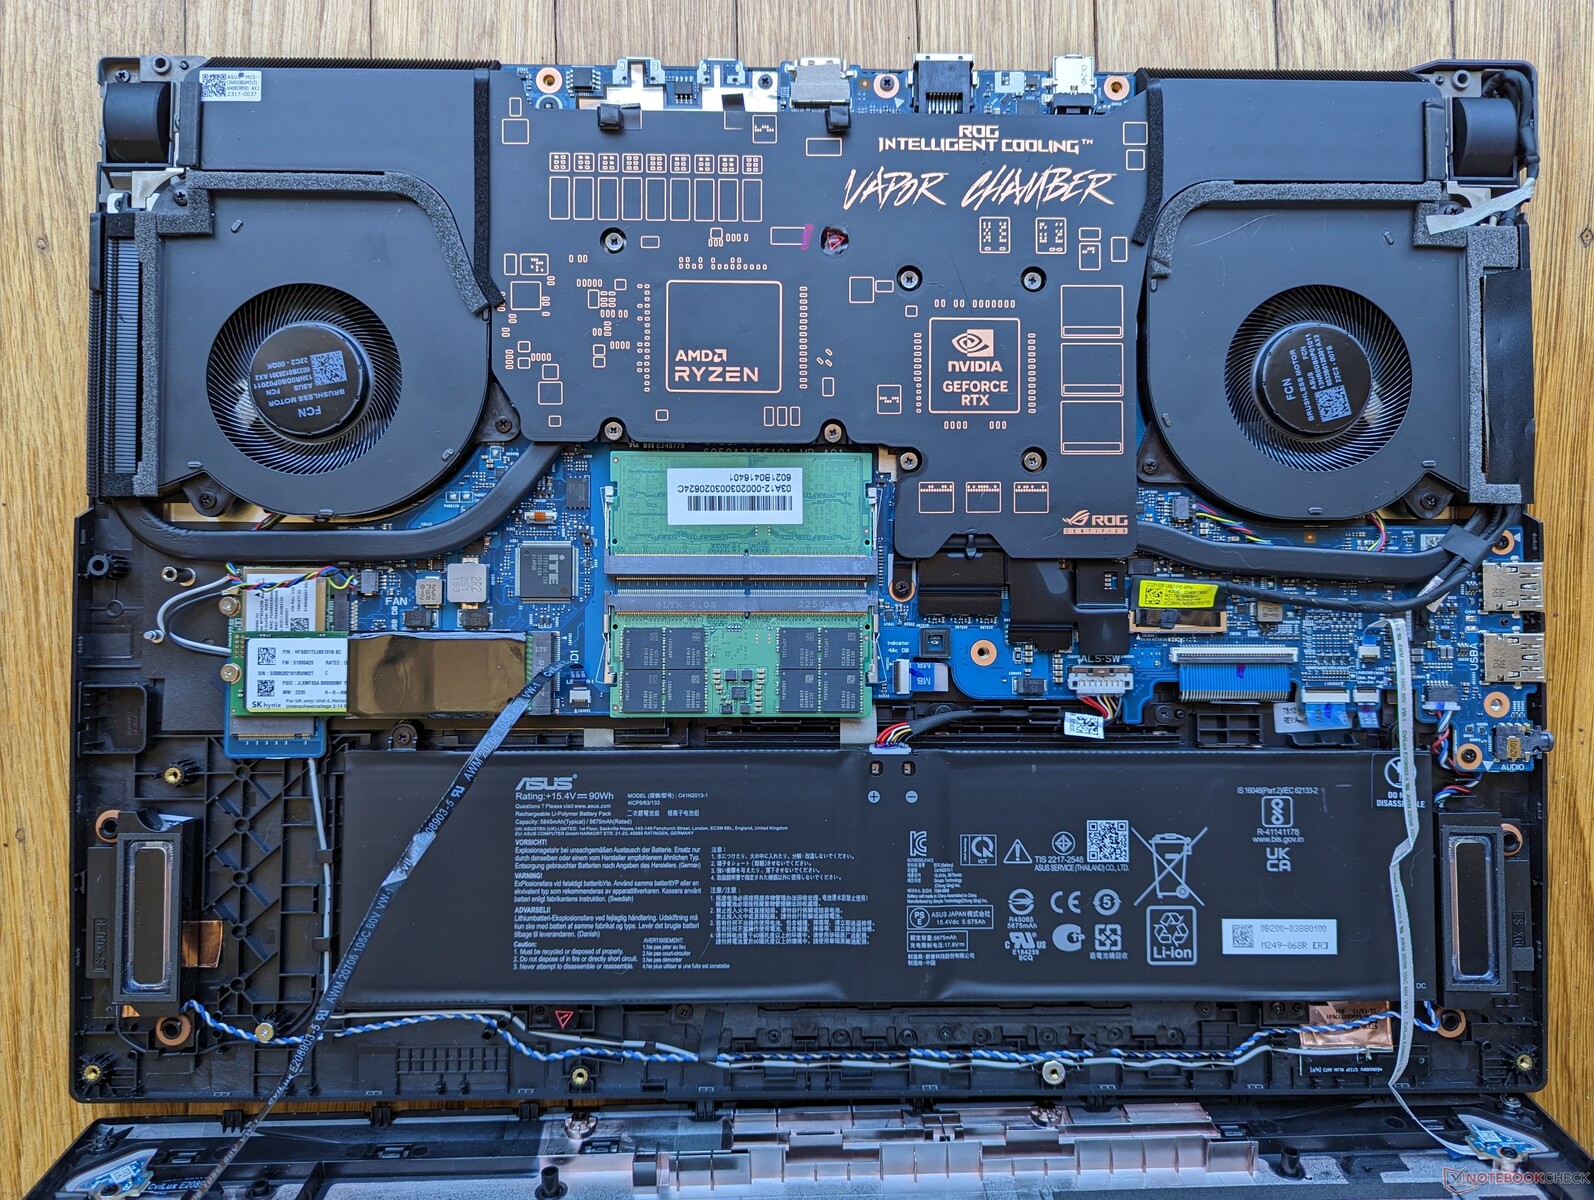
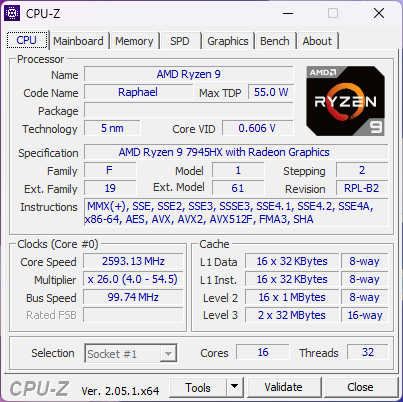
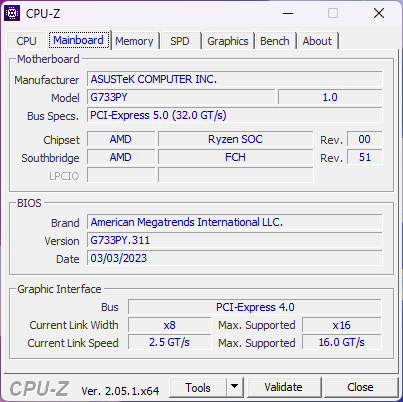
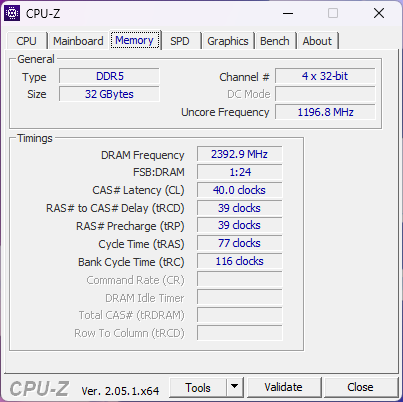
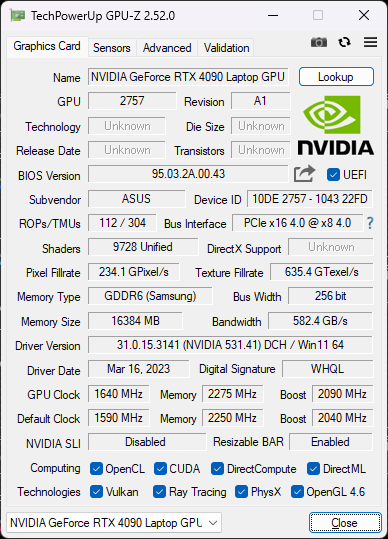
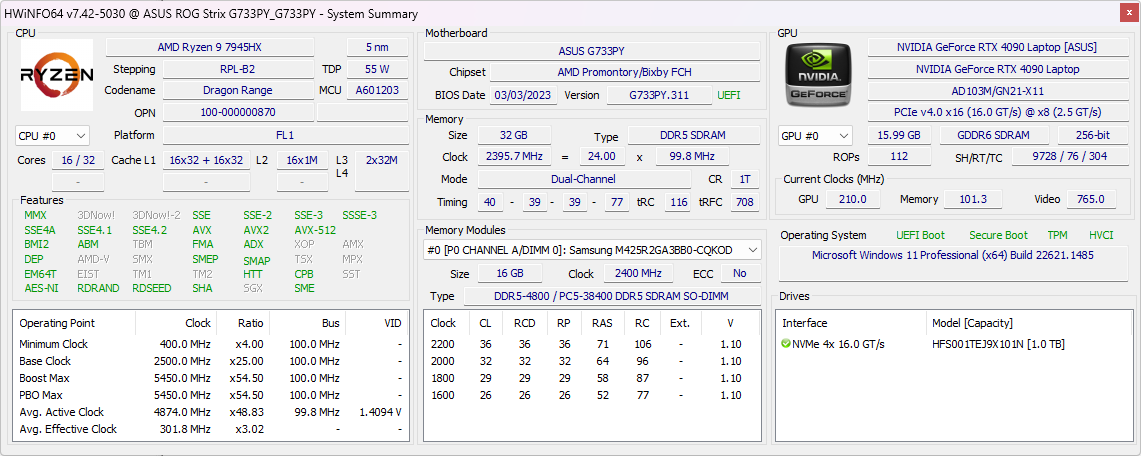
Notre configuration est le modèle le plus haut de gamme équipé du processeur Ryzen 9 7945HX et du GPU RTX 4090 de 175 W GeForce. D'autres modèles sont disponibles jusqu'à la RTX 4060, mais ils sont tous équipés de la même dalle IPS 1440p 240 Hz.
Les concurrents du Strix Scar 17 comprennent d'autres ordinateurs portables de jeu haut de gamme de 17 pouces tels que le Razer Blade 17, Alienware m17, MSI GE77ou Aorus 17.
Plus d'avis Asus :
Comparaison avec les concurrents potentiels
Note | Date | Modèle | Poids | Épaisseur | Taille | Résolution | Prix |
|---|---|---|---|---|---|---|---|
| 88.3 % v7 (old) | 04/23 | Asus ROG Strix Scar 17 G733PY-XS96 R9 7945HX, GeForce RTX 4090 Laptop GPU | 2.9 kg | 28.3 mm | 17.30" | 2560x1440 | |
| 88.3 % v7 (old) | 03/23 | MSI GE78HX 13VH-070US i9-13950HX, GeForce RTX 4080 Laptop GPU | 3 kg | 23 mm | 17.00" | 2560x1600 | |
| 89.9 % v7 (old) | 03/23 | Eluktronics Mech-17 GP2 i9-13900HX, GeForce RTX 4090 Laptop GPU | 2.9 kg | 27 mm | 17.00" | 2560x1600 | |
| 88.4 % v7 (old) | 04/23 | Asus ROG Strix G17 G713PI R9 7945HX, GeForce RTX 4070 Laptop GPU | 2.8 kg | 30.7 mm | 17.30" | 2560x1440 | |
| 83.7 % v7 (old) | 08/22 | Aorus 17X XES i9-12900HX, GeForce RTX 3070 Ti Laptop GPU | 2.7 kg | 30 mm | 17.30" | 1920x1080 | |
| 86.1 % v7 (old) | 01/23 | Alienware m17 R5 (R9 6900HX, RX 6850M XT) R9 6900HX, Radeon RX 6850M XT | 3.4 kg | 26.7 mm | 17.00" | 3840x2160 |
Cas - Pas de changement... Presque
Il existe trois différences importantes entre les modèles 2023 et 2022 :
- Asus Keystone n'est plus pris en charge. Le fabricant a probablement reconnu que très peu de propriétaires utilisaient cette fonction en premier lieu.
- Nouvelle webcam. Il y a maintenant une webcam intégrée alors que le modèle de l'année dernière en était complètement dépourvu.
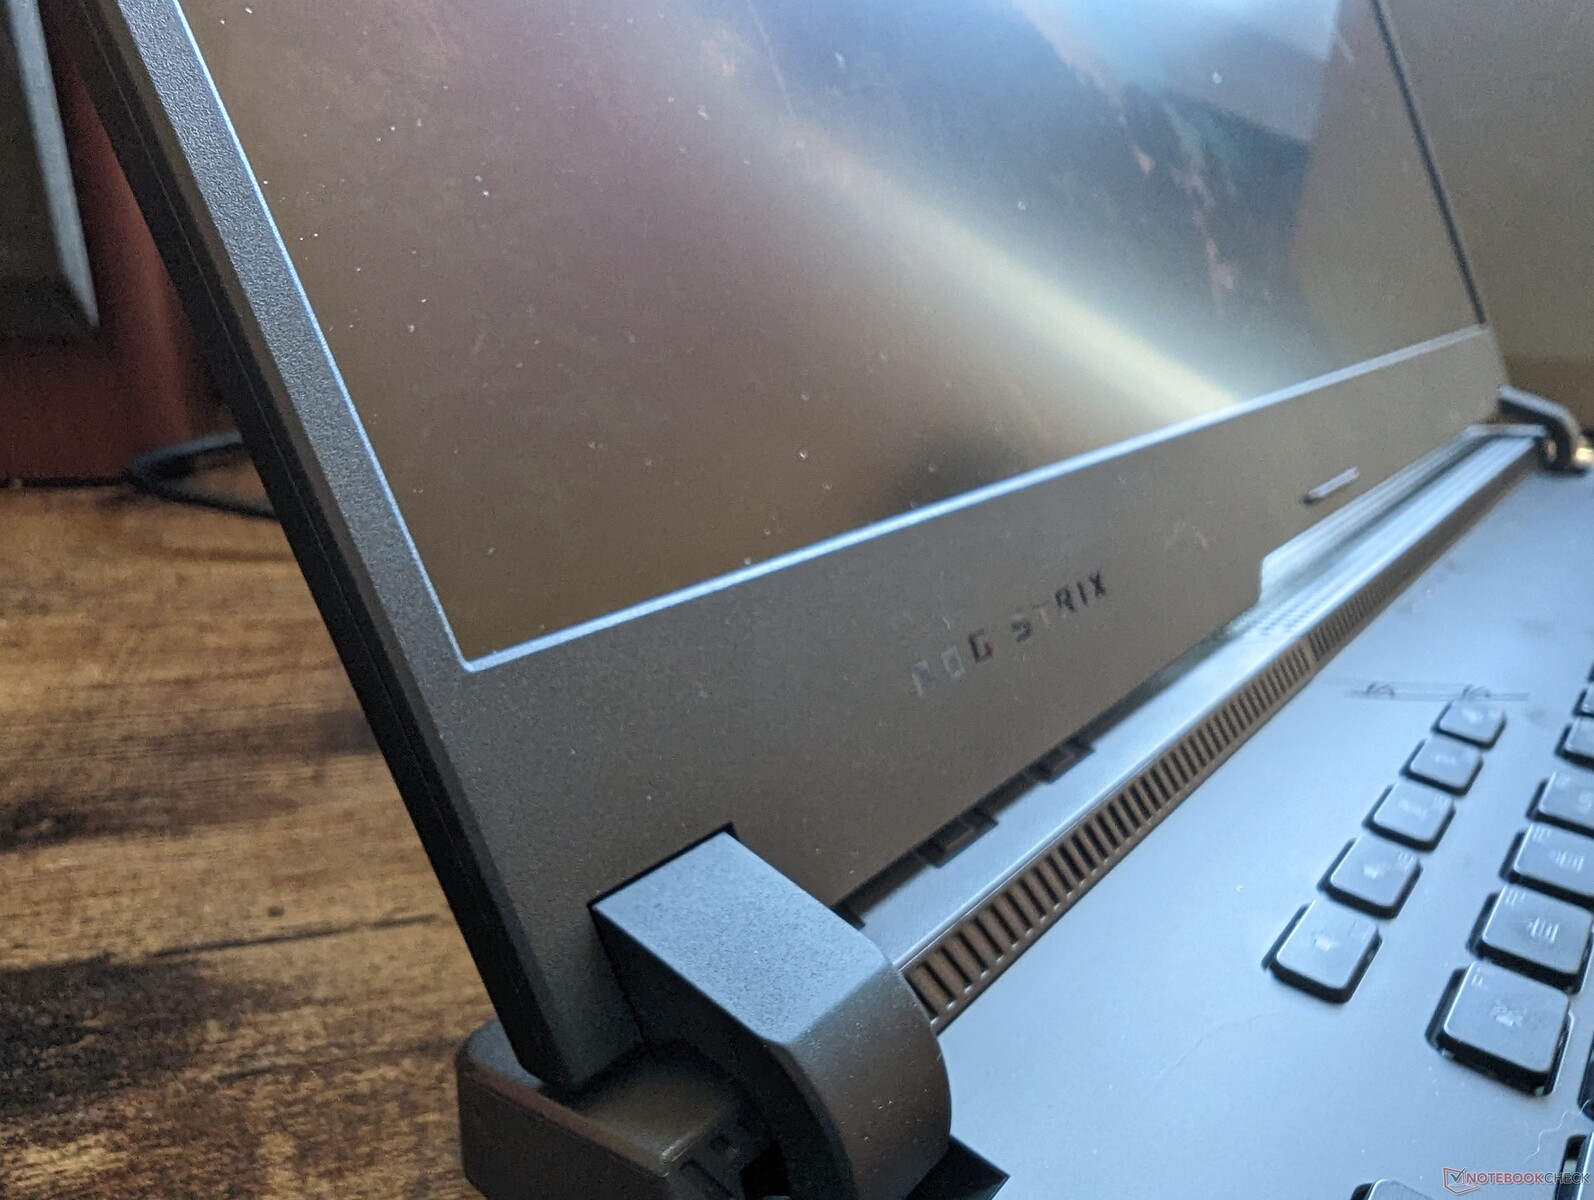
- Nouveaux marquages superficiels sur les repose-poignets et le couvercle extérieur.
Le châssis est par ailleurs identique à celui de l'année précédente.
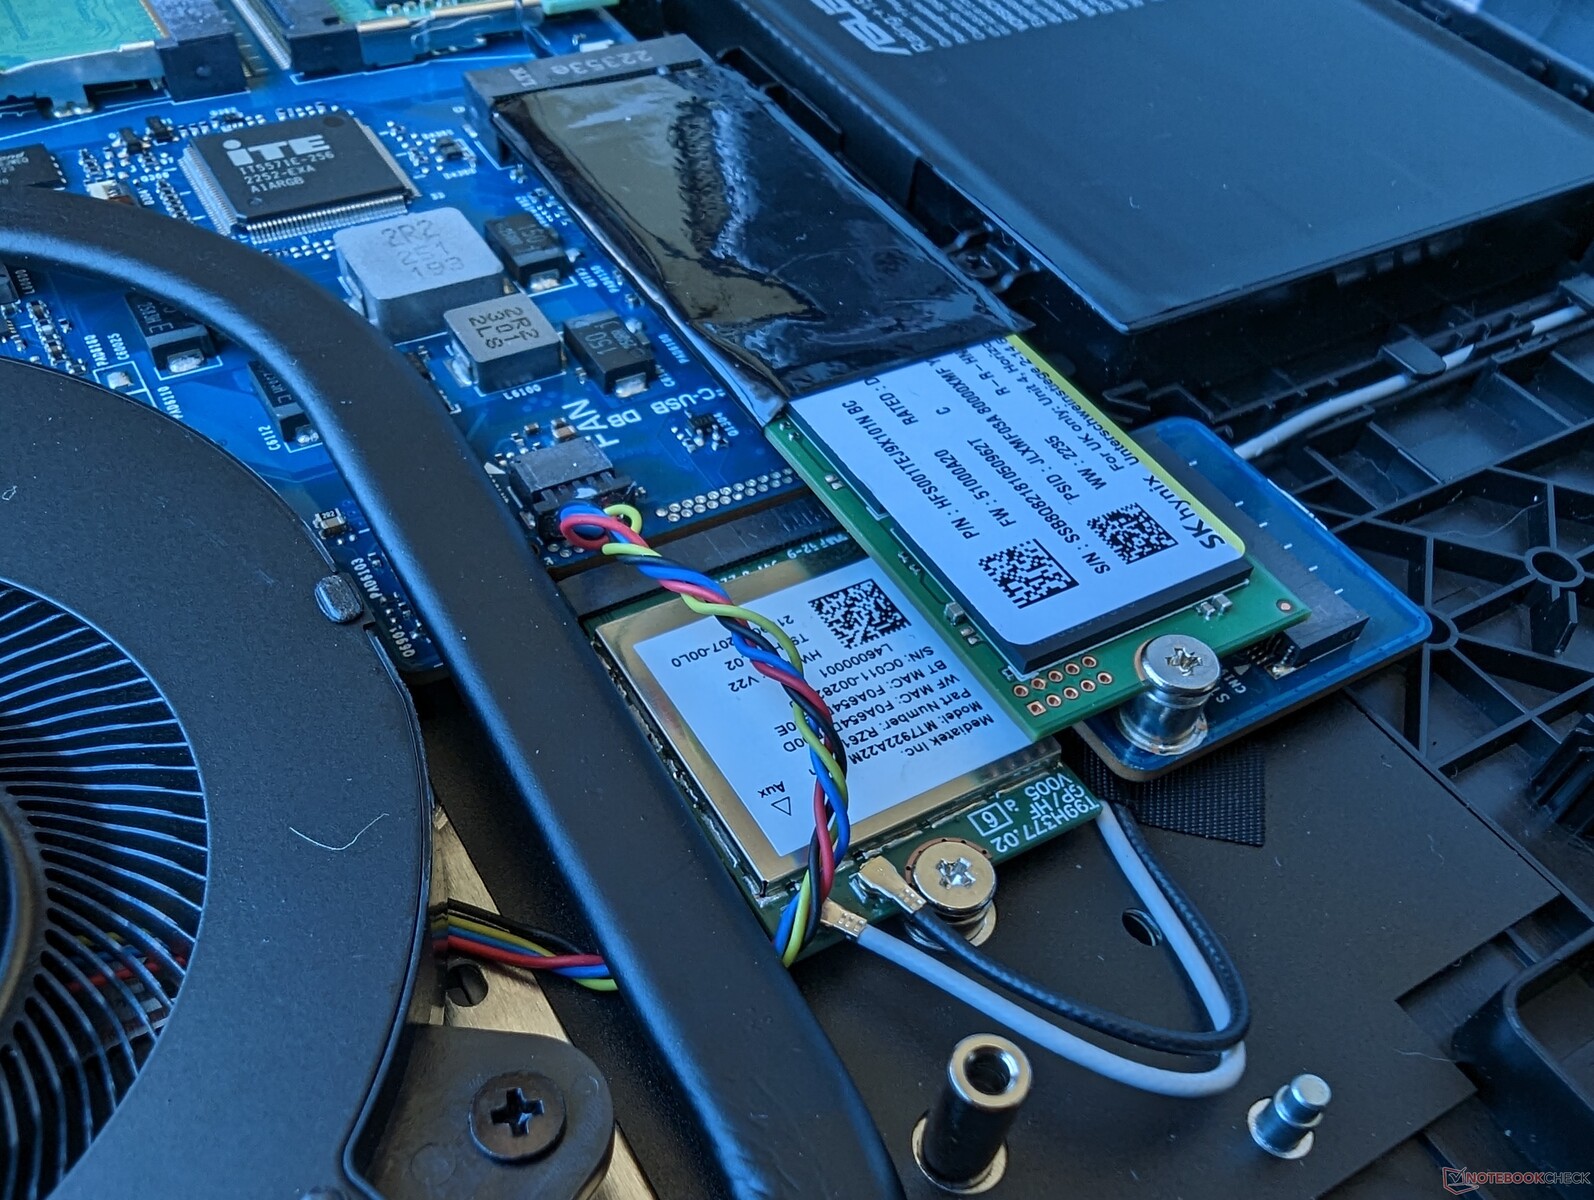
Communication
Le Wi-Fi 6E est assuré par un MediaTek MT7922 au lieu du plus courant Intel AX211, probablement parce qu'il s'agit d'une conception centrée sur AMD-Nvidia. Les taux de transfert et les performances sont néanmoins stables et fiables lorsqu'ils sont associés à notre routeur de test Asus AXE11000.
| Networking | |
| iperf3 transmit AXE11000 | |
| Asus ROG Strix G17 G713PI | |
| Eluktronics Mech-17 GP2 | |
| MSI GE78HX 13VH-070US | |
| Alienware m17 R5 (R9 6900HX, RX 6850M XT) | |
| Asus ROG Strix Scar 17 G733PY-XS96 | |
| iperf3 receive AXE11000 | |
| Asus ROG Strix G17 G713PI | |
| Eluktronics Mech-17 GP2 | |
| Asus ROG Strix Scar 17 G733PY-XS96 | |
| MSI GE78HX 13VH-070US | |
| Alienware m17 R5 (R9 6900HX, RX 6850M XT) | |
| iperf3 transmit AXE11000 6GHz | |
| Aorus 17X XES | |
| Asus ROG Strix Scar 17 G733PY-XS96 | |
| MSI GE78HX 13VH-070US | |
| iperf3 receive AXE11000 6GHz | |
| Aorus 17X XES | |
| MSI GE78HX 13VH-070US | |
| Asus ROG Strix Scar 17 G733PY-XS96 | |
Webcam
Bien qu'une webcam soit préférable à l'absence de webcam, Asus a choisi le plus petit dénominateur commun en installant un capteur de 1 MP au lieu d'un capteur de 2 MP ou de 5 MP. D'autres ordinateurs portables de jeu comme le Alienware m17 R1 ou le Razer Blade ont des webcams de plus haute résolution. L'infrarouge n'est pas pris en charge par l'Asus.


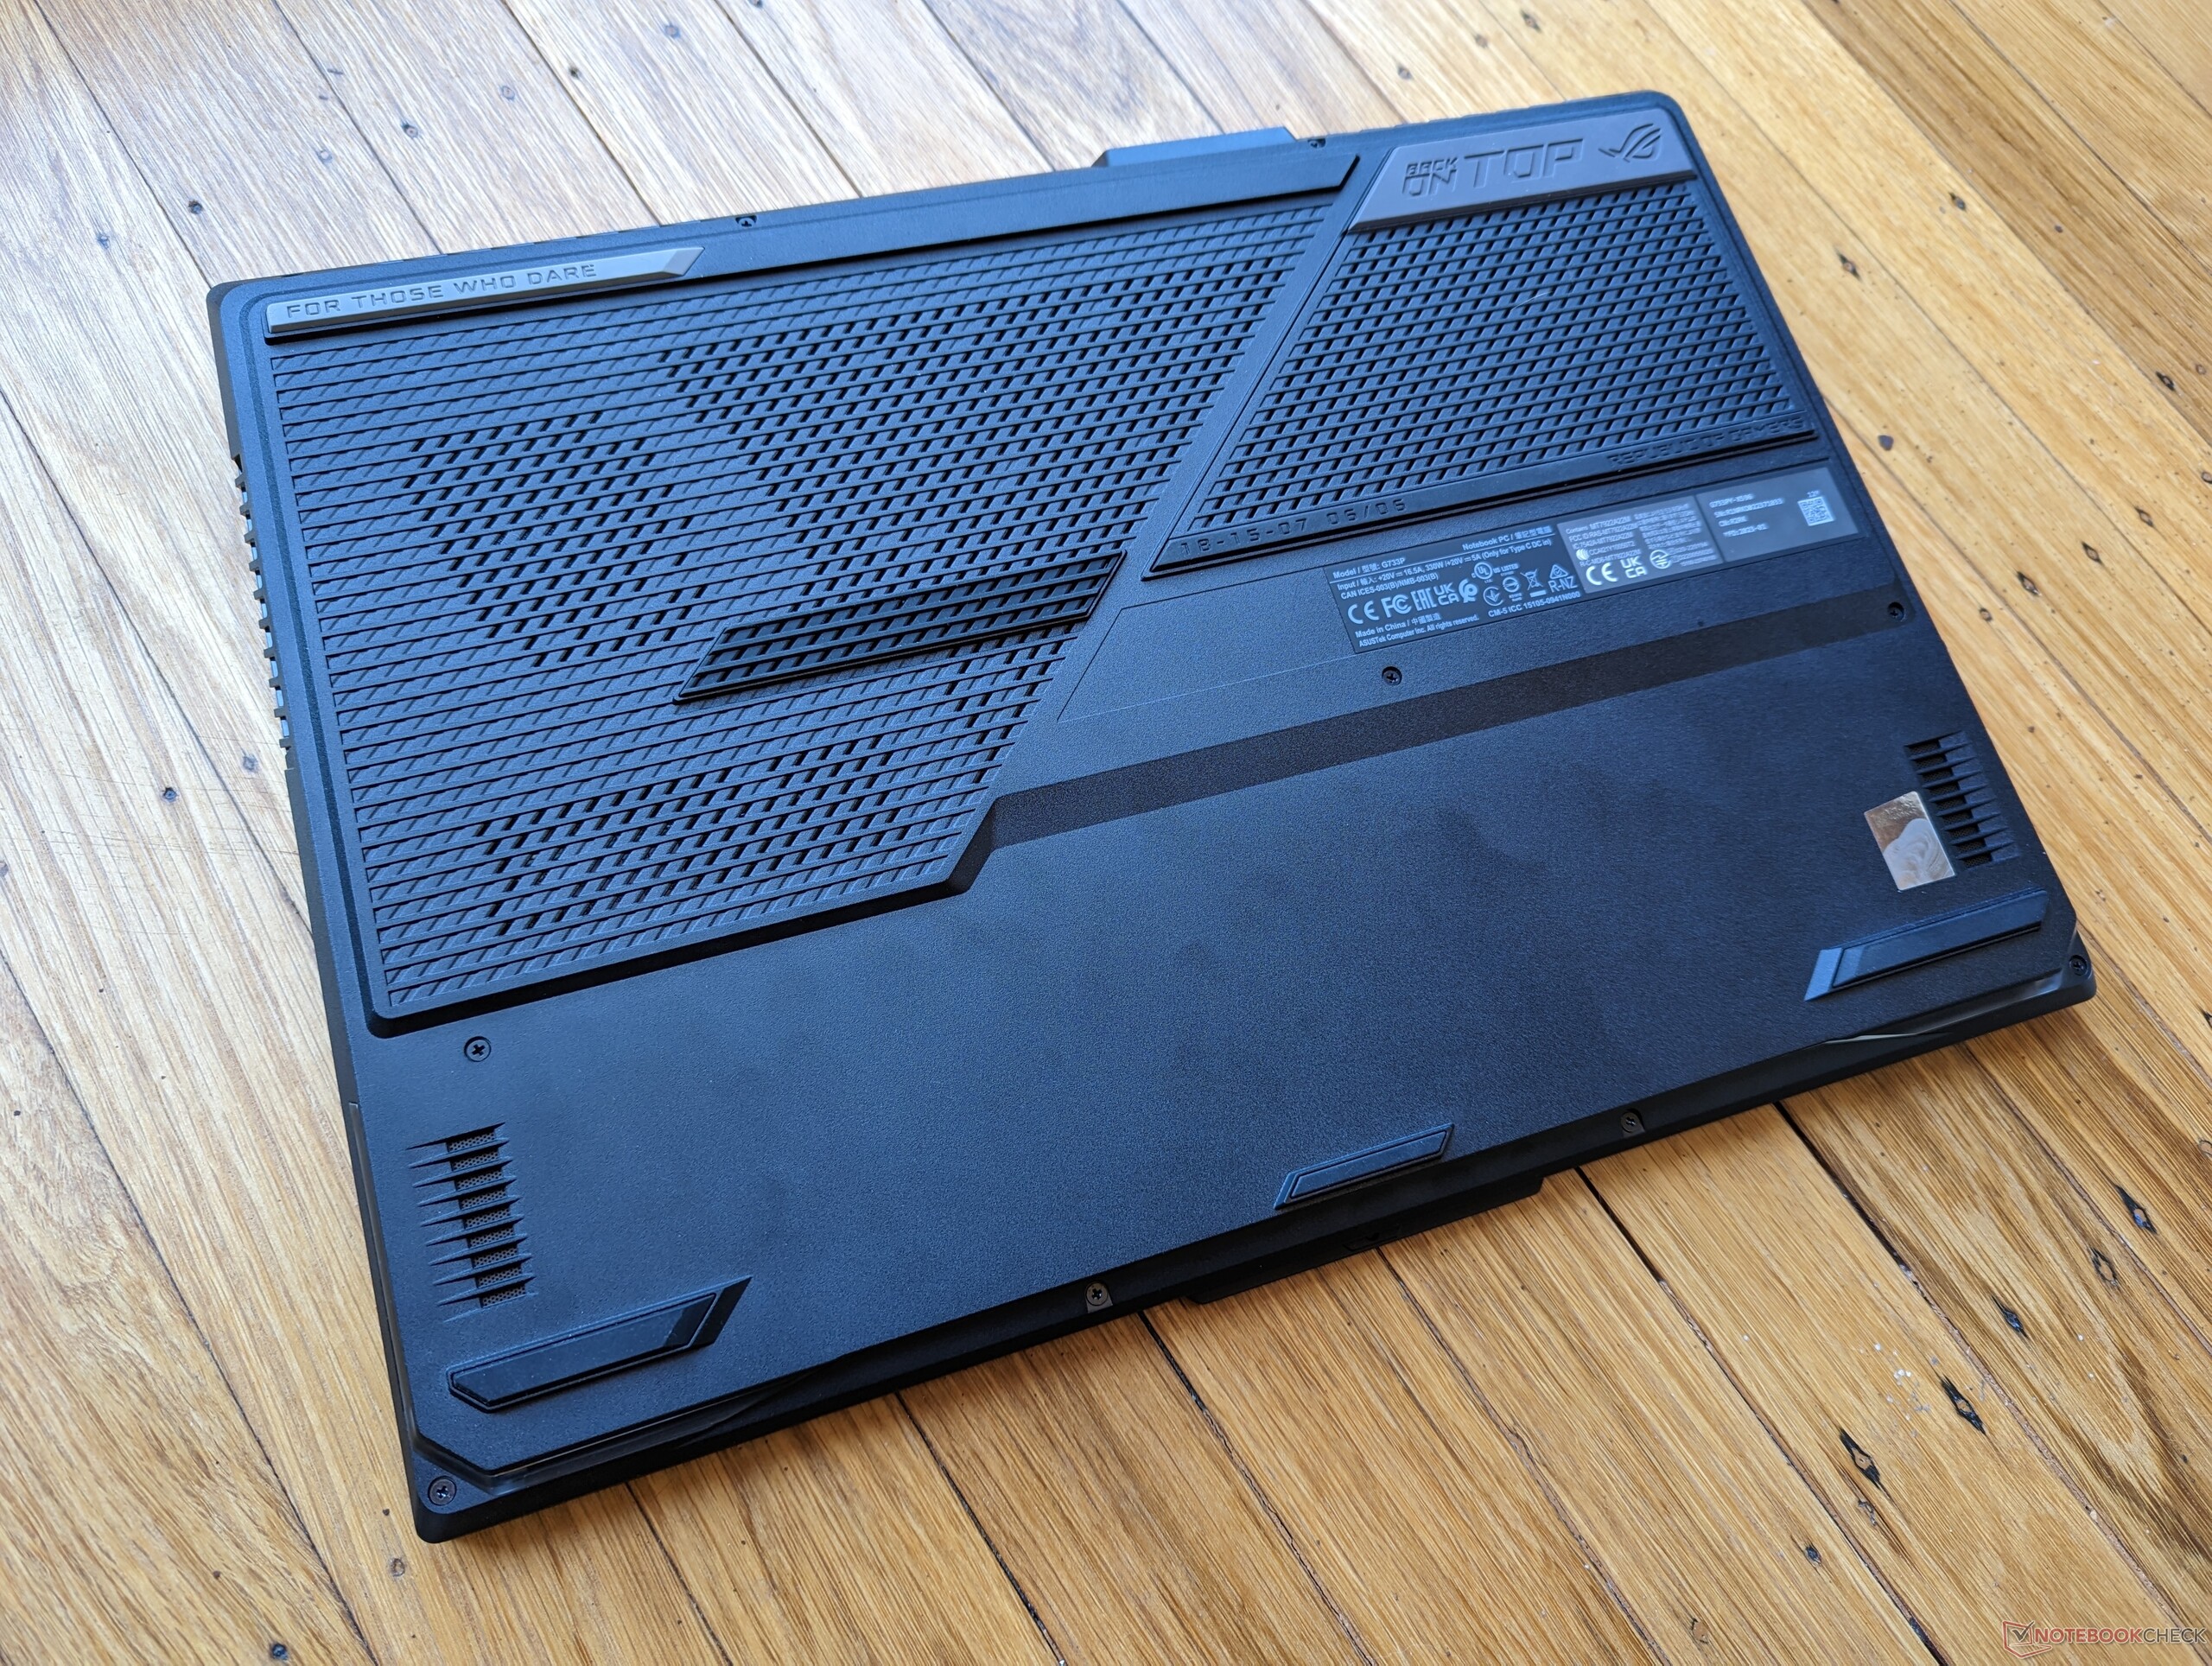
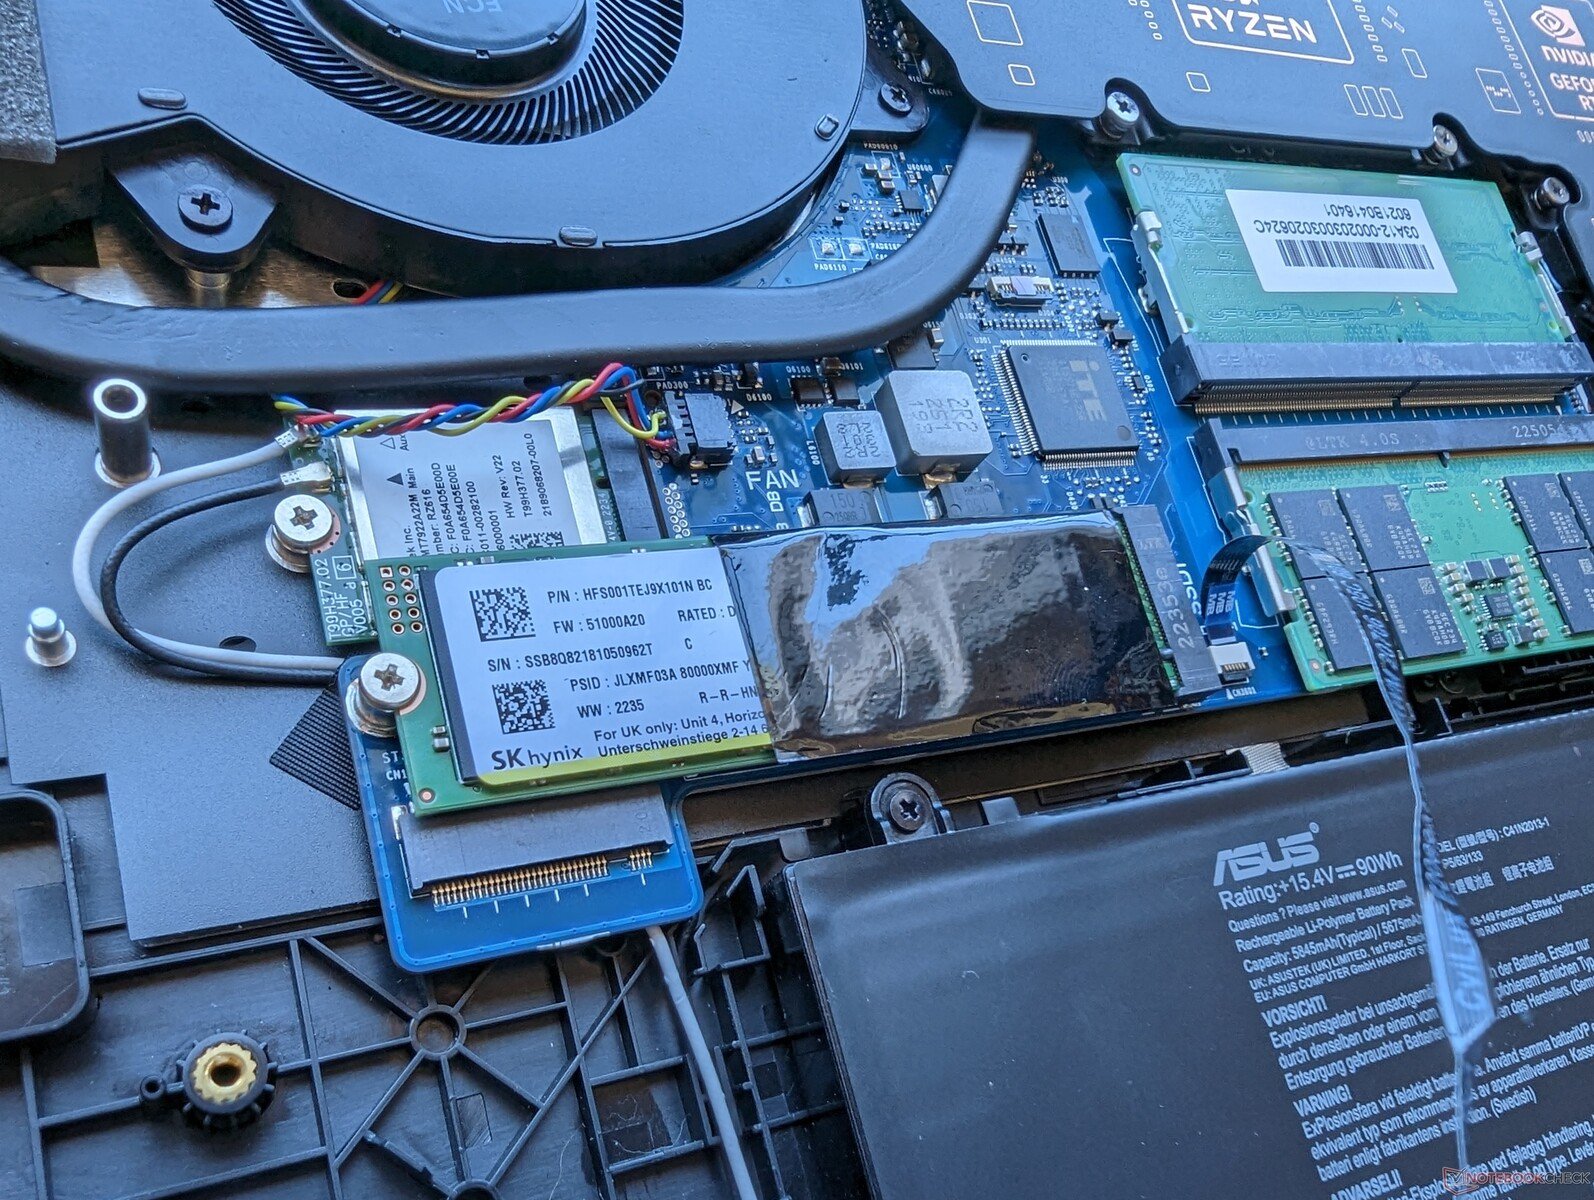
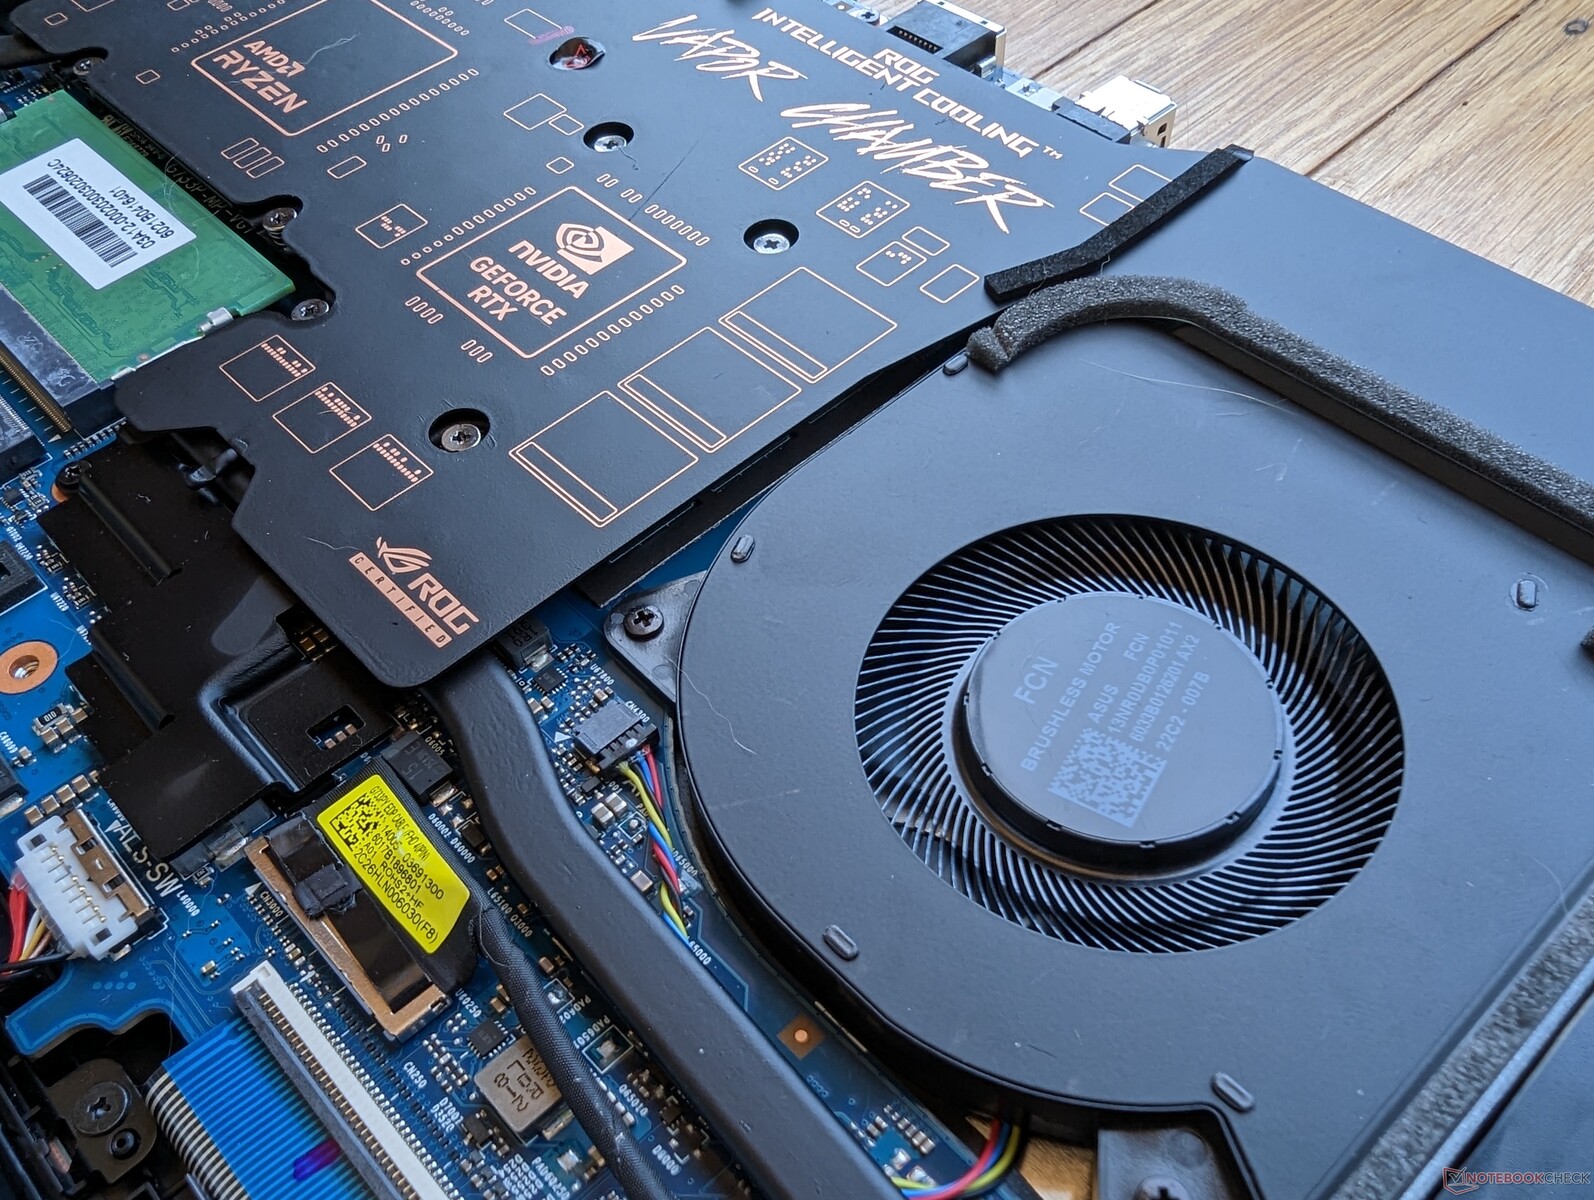
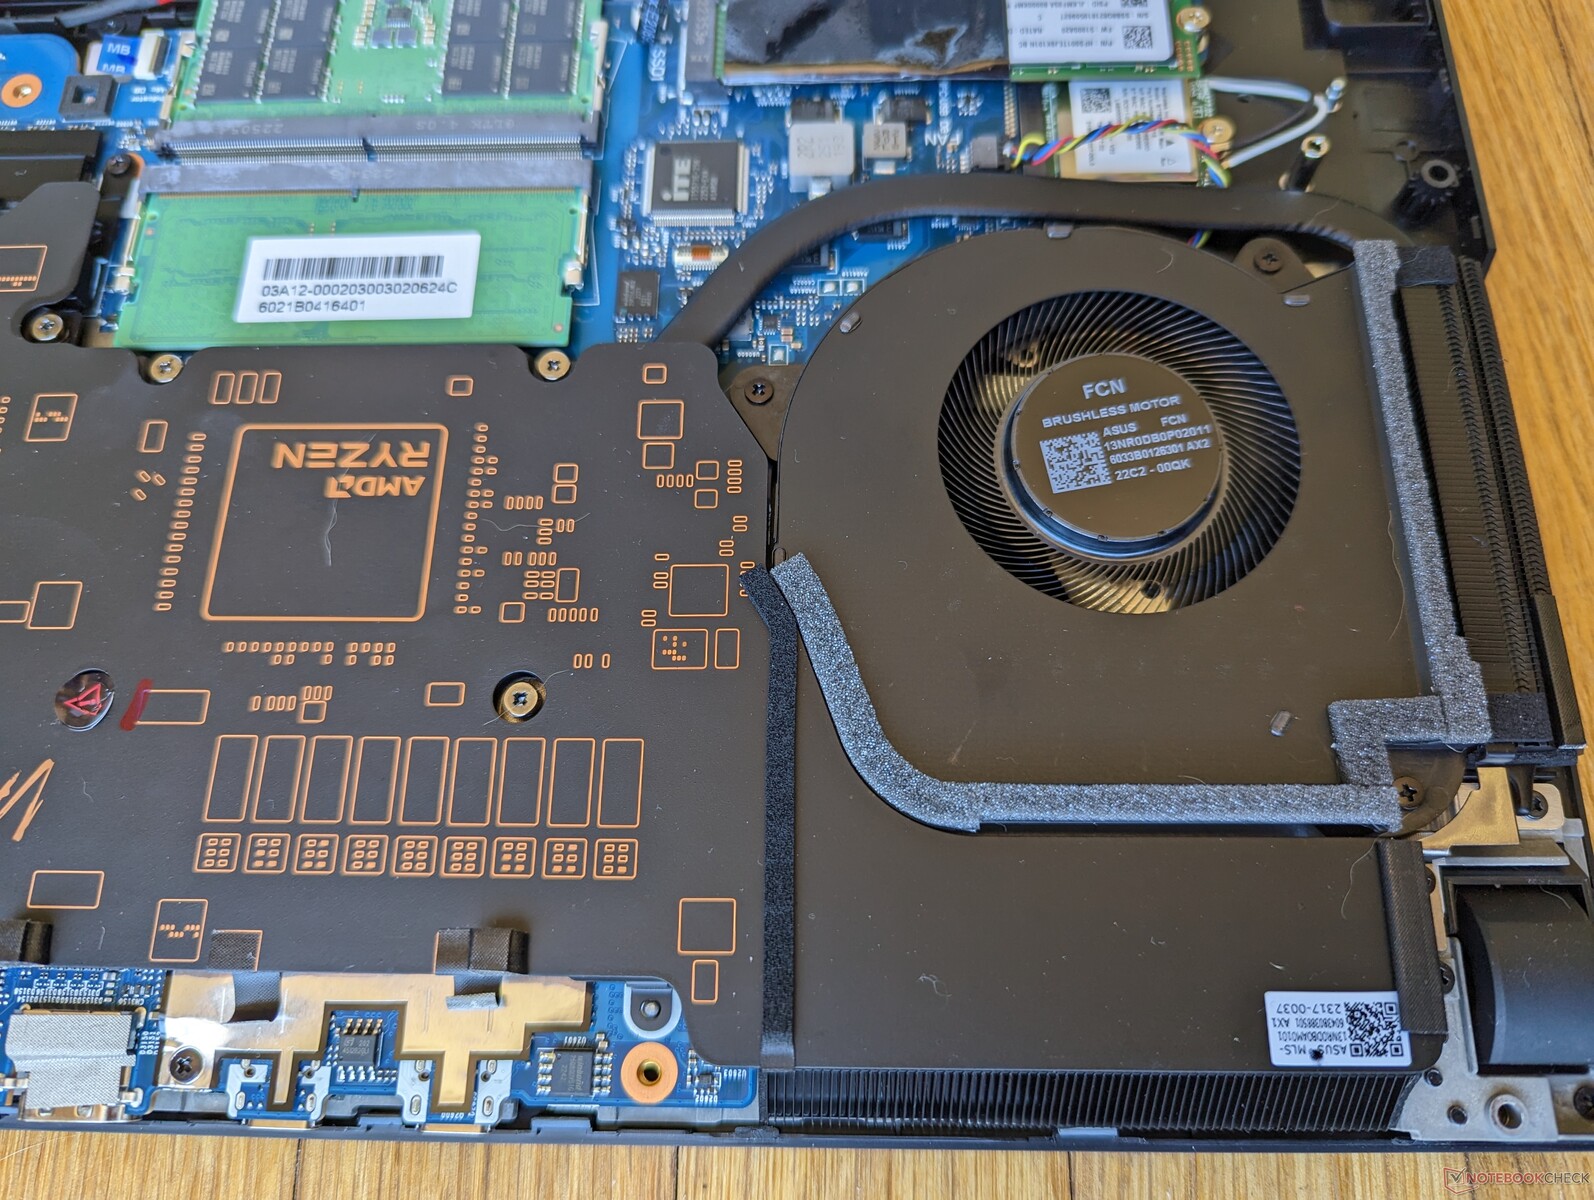
Maintenance
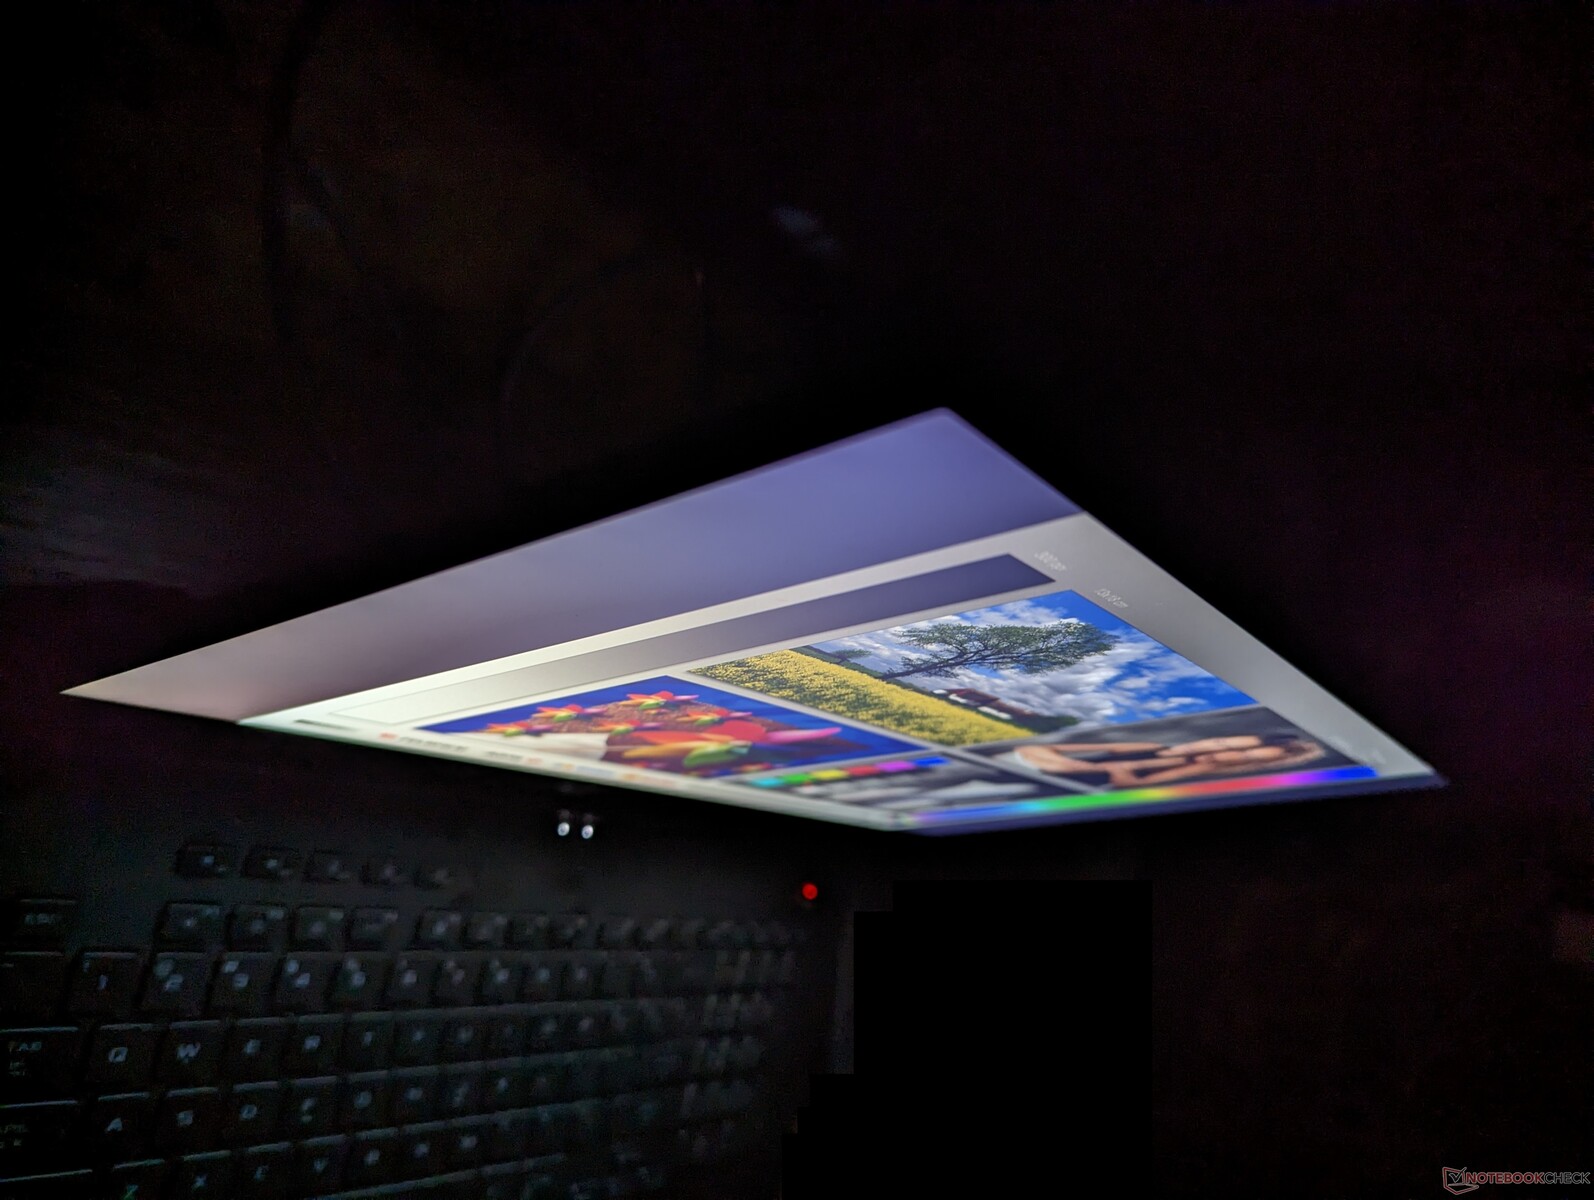
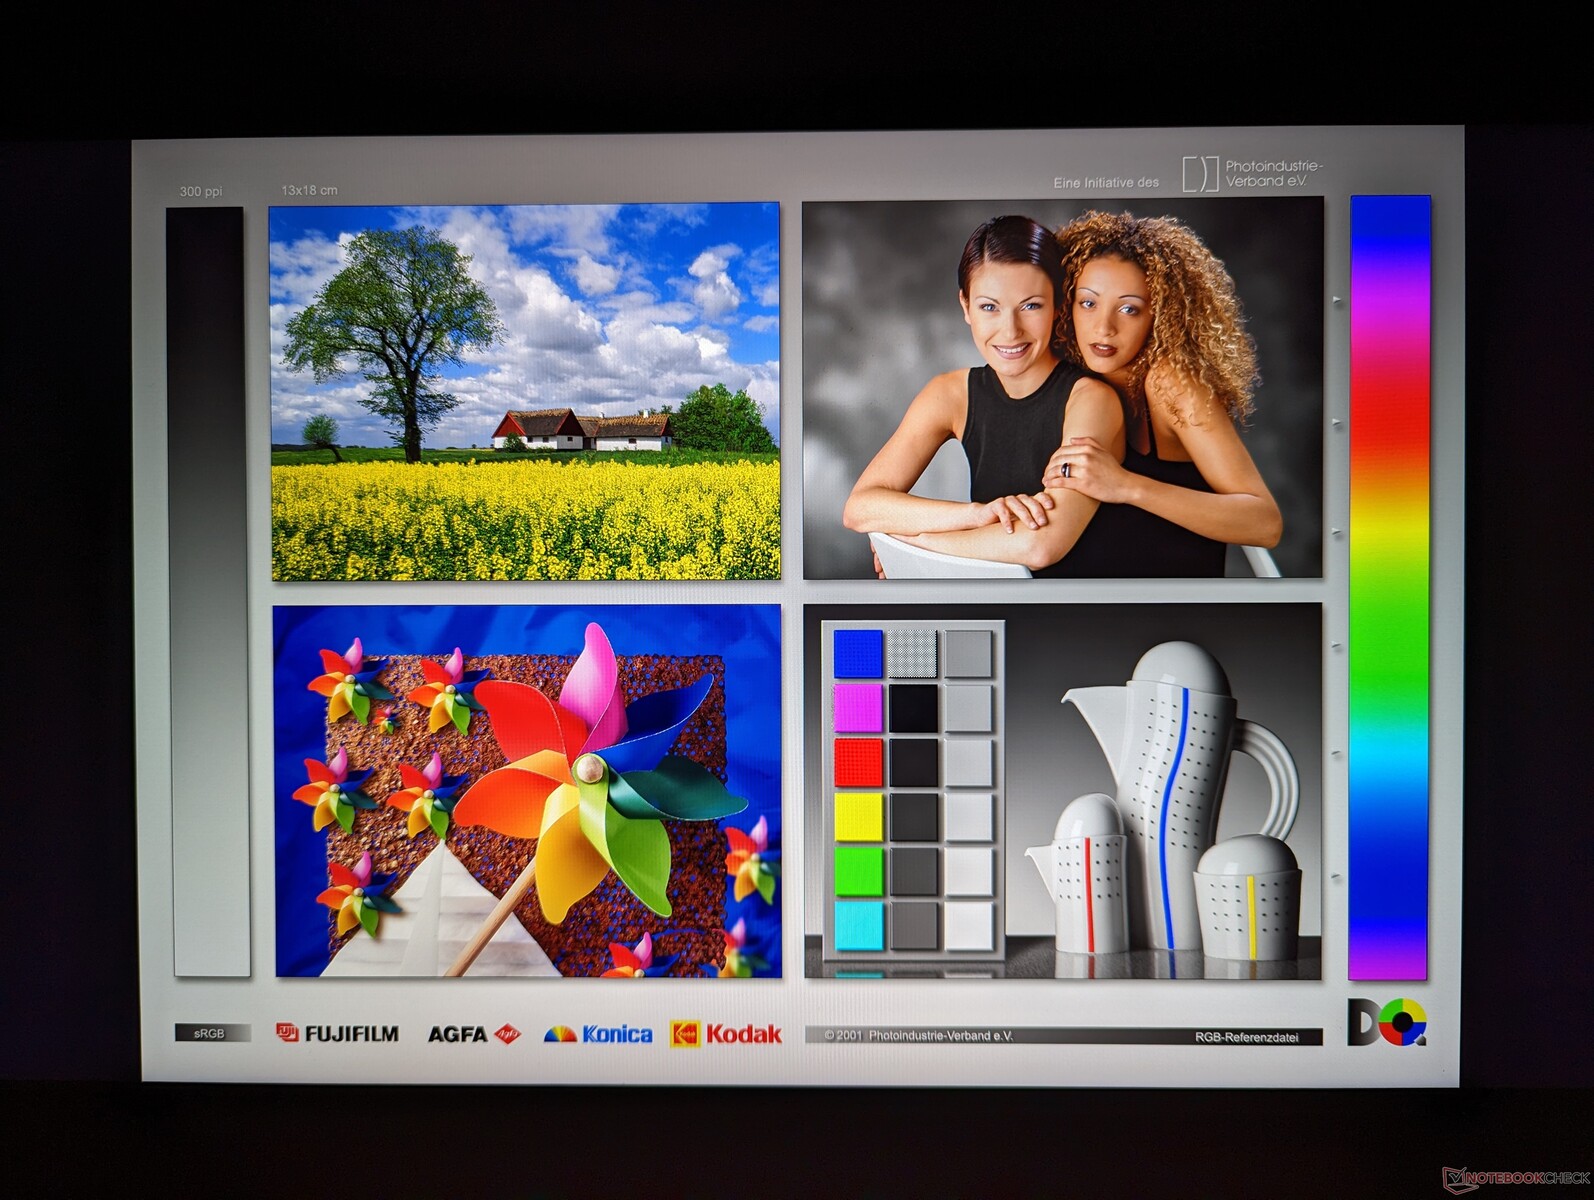
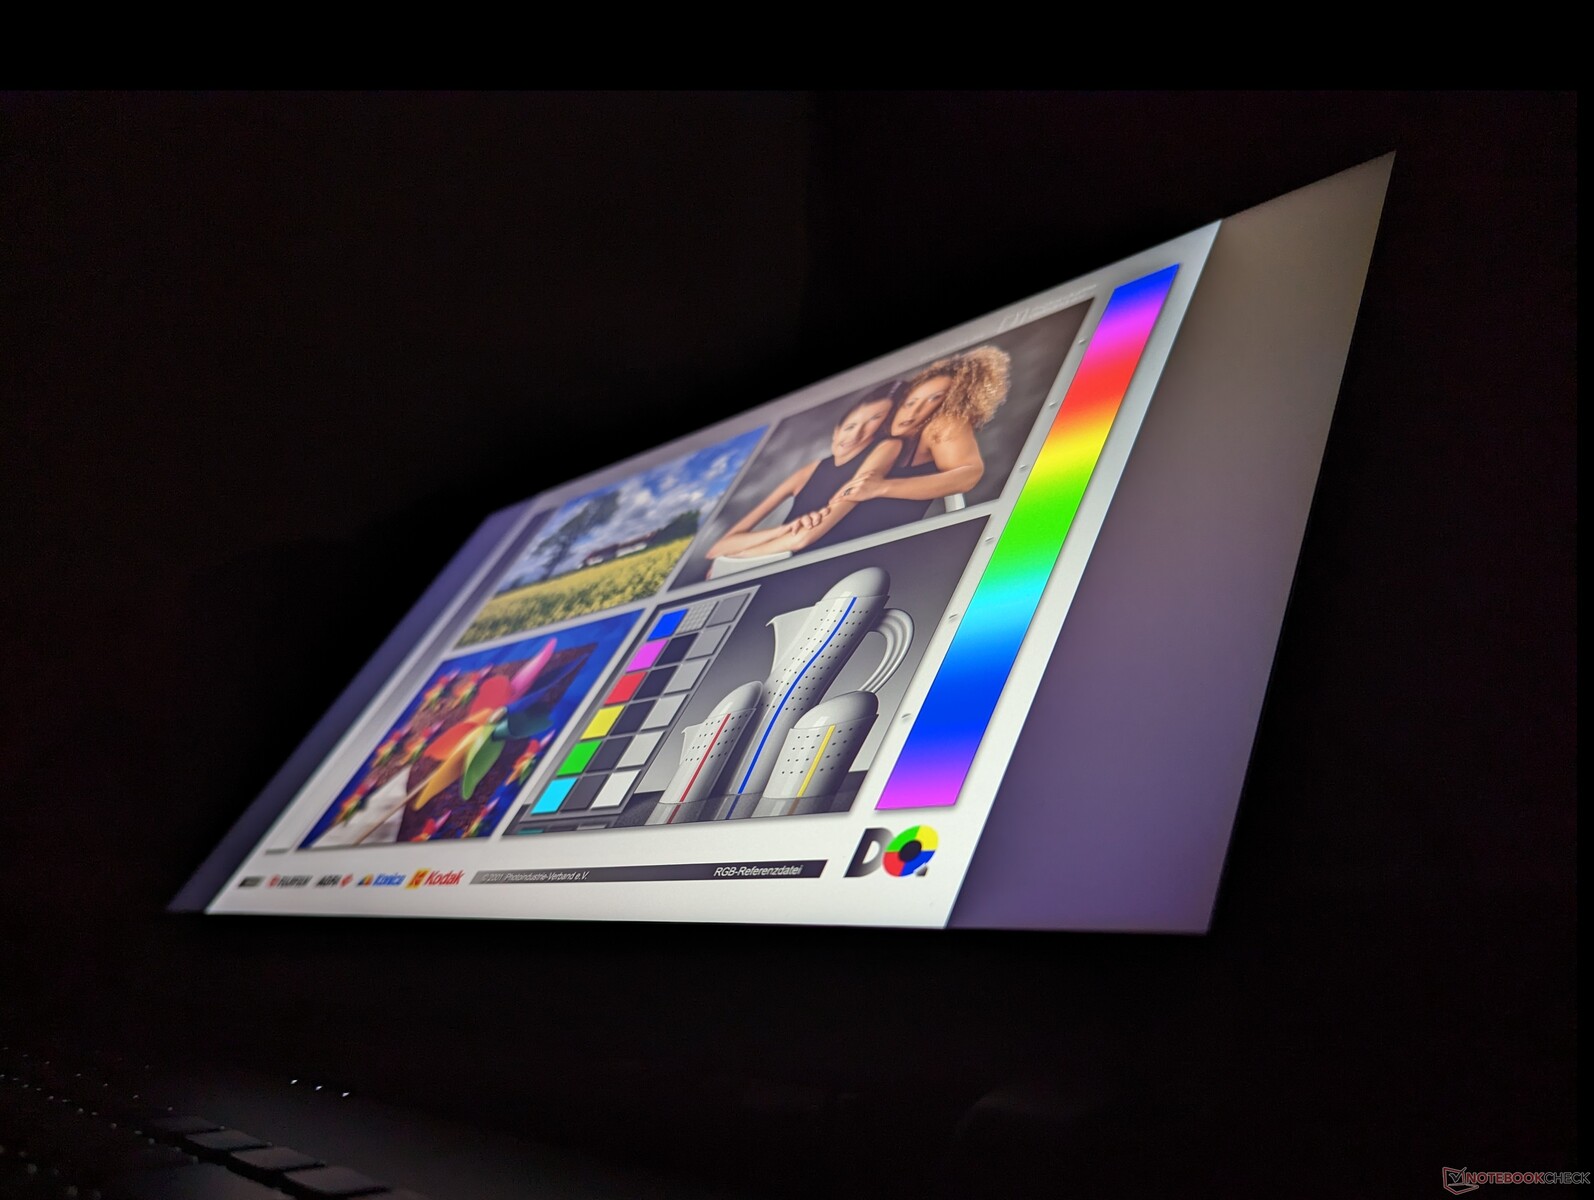
Affichage - 1440p Sweet Spot
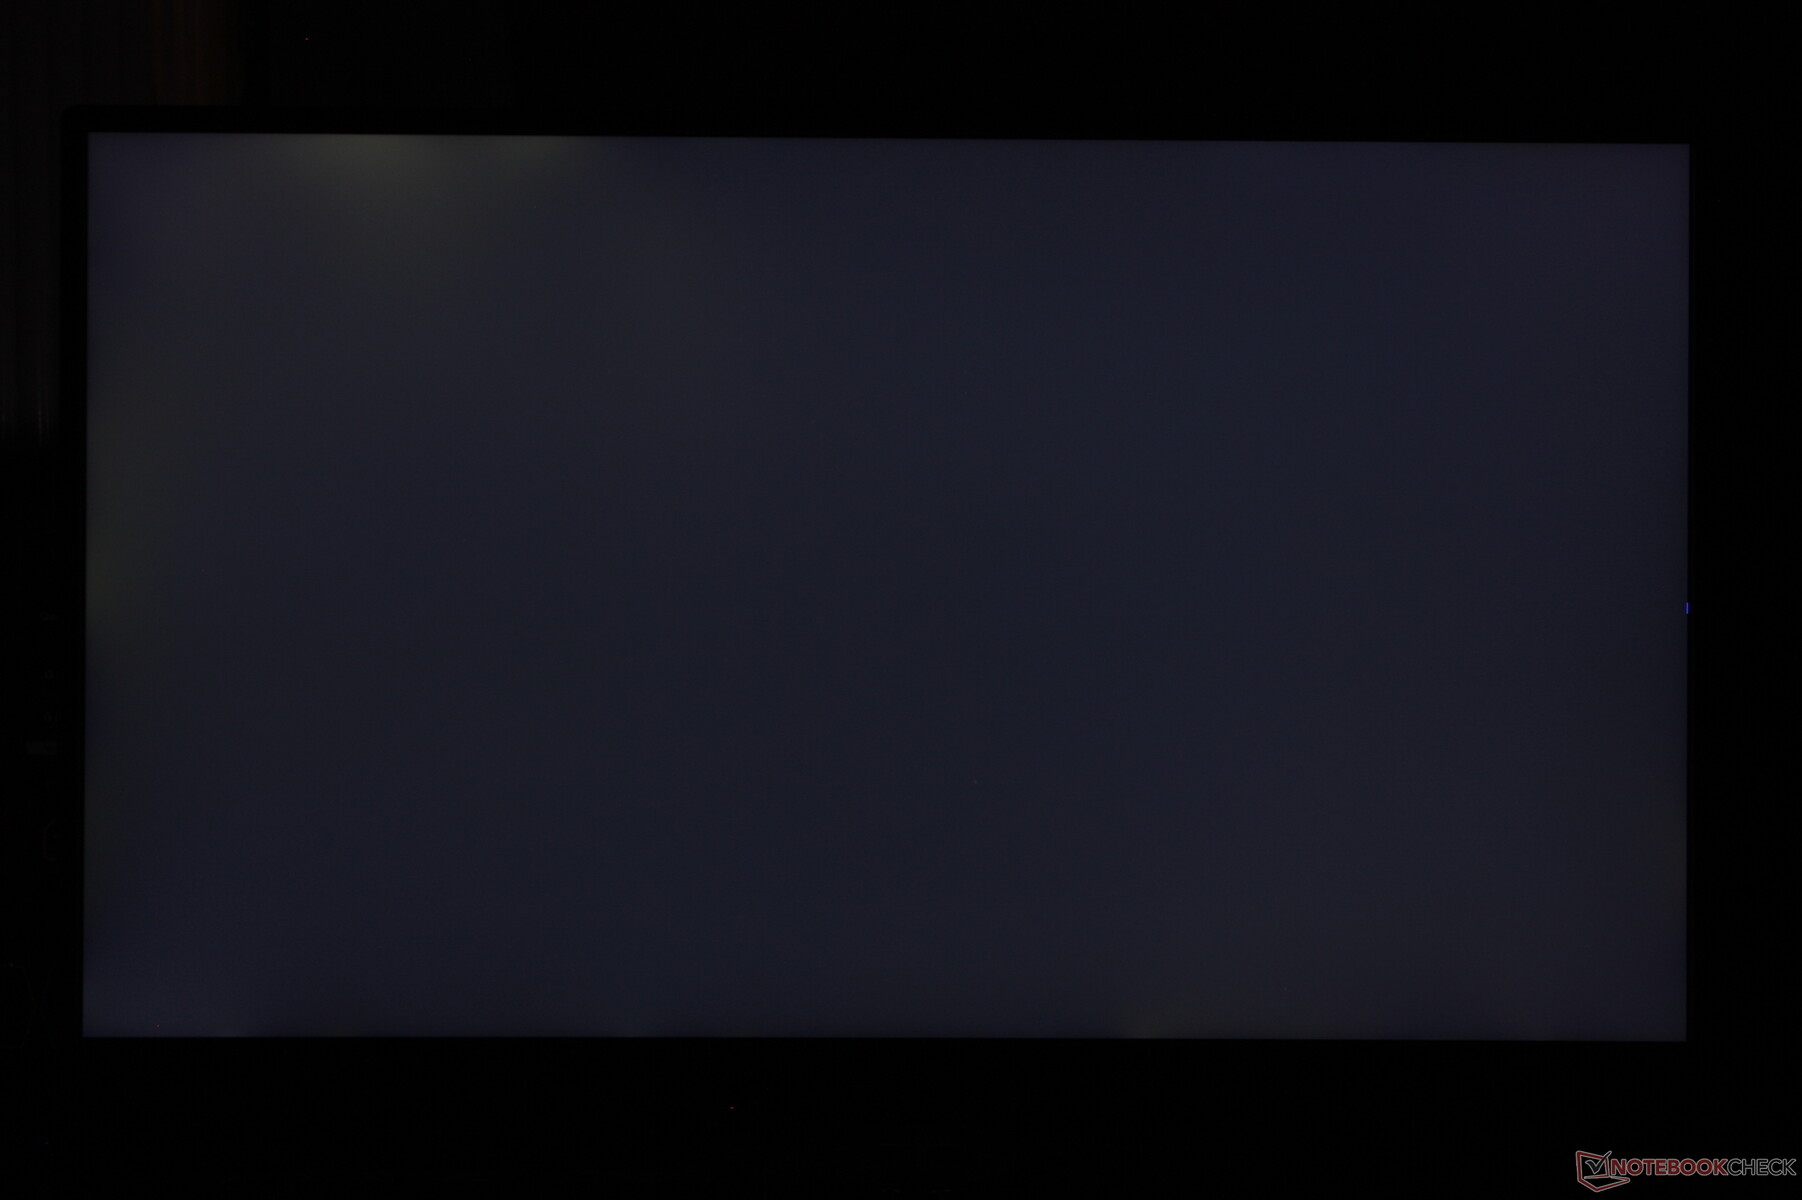
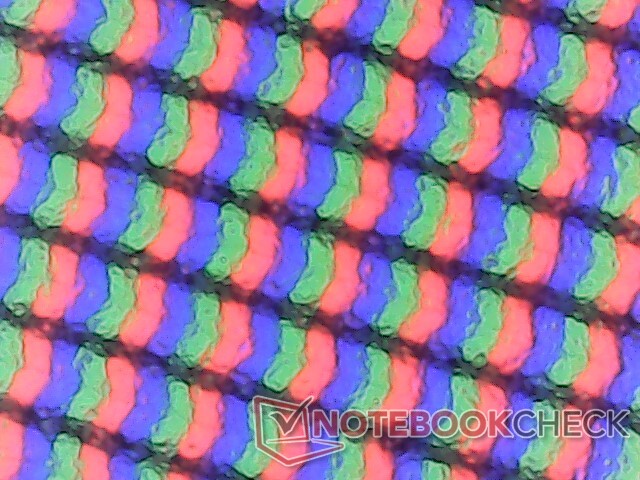
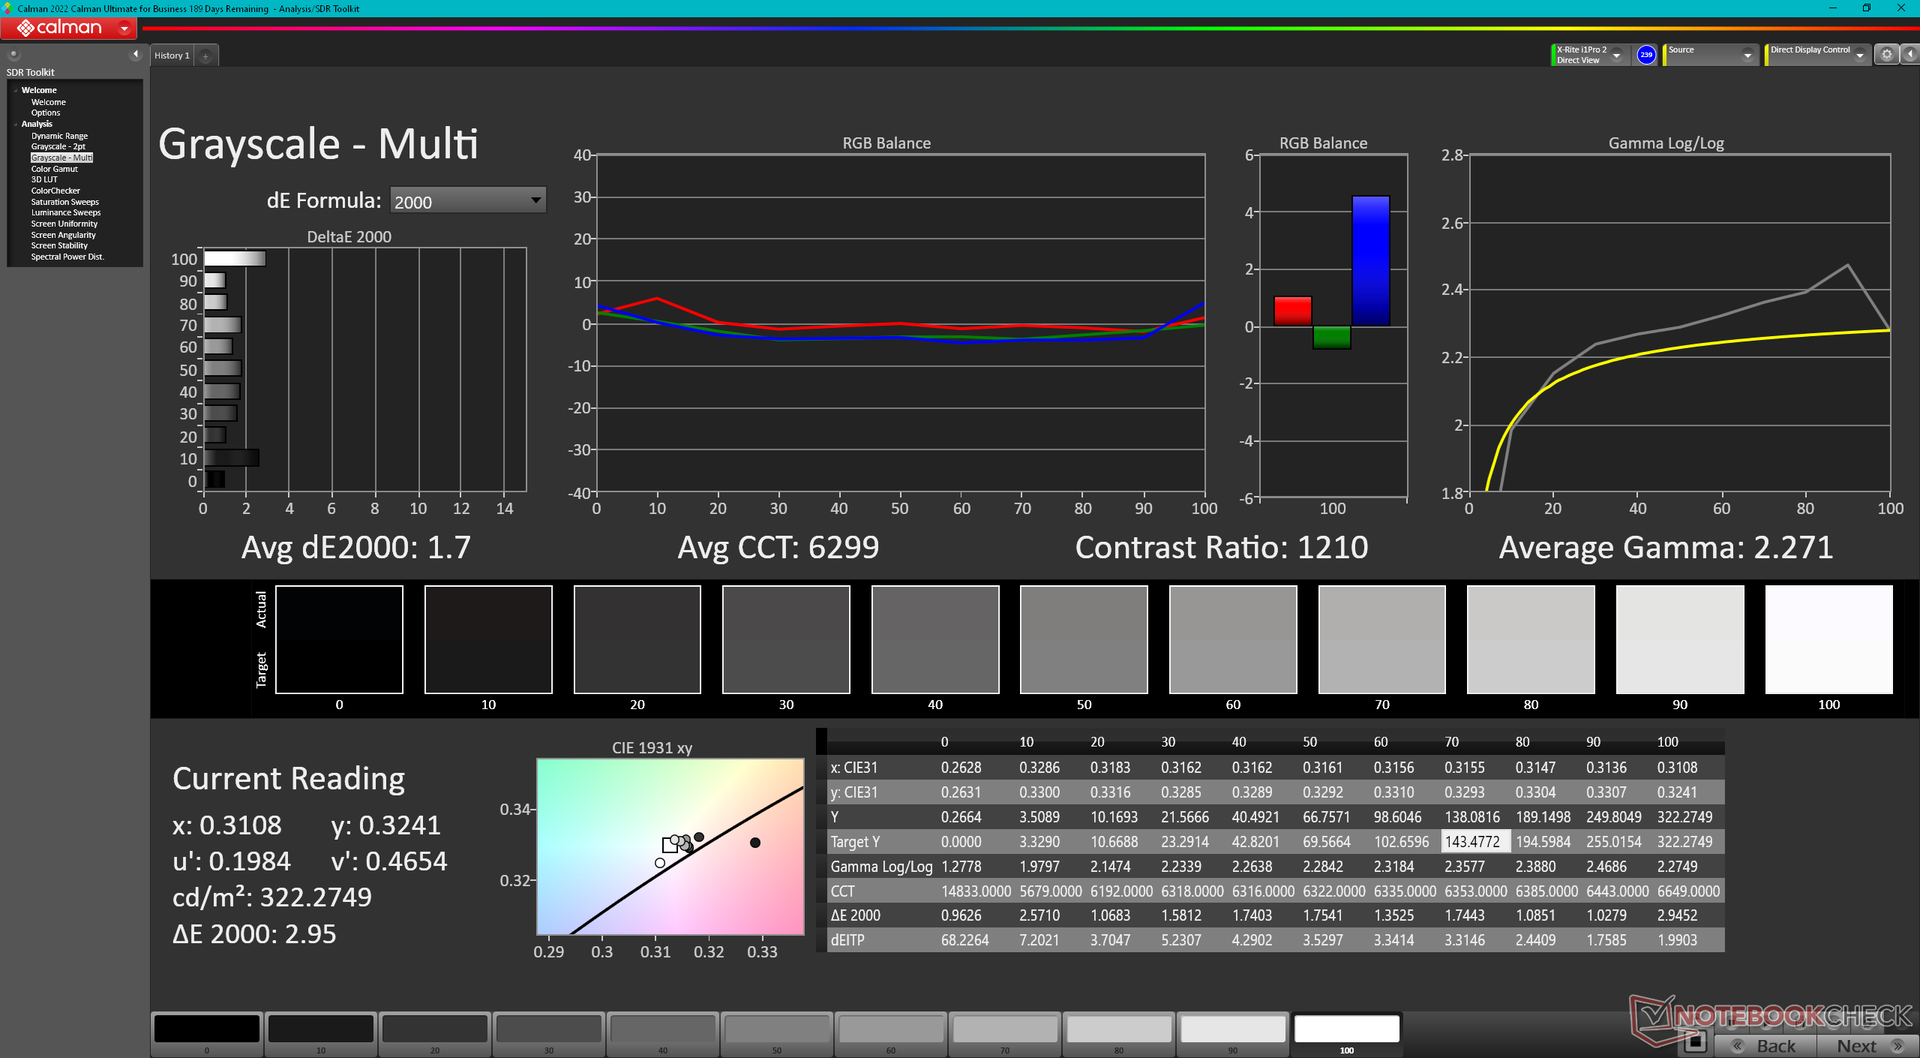
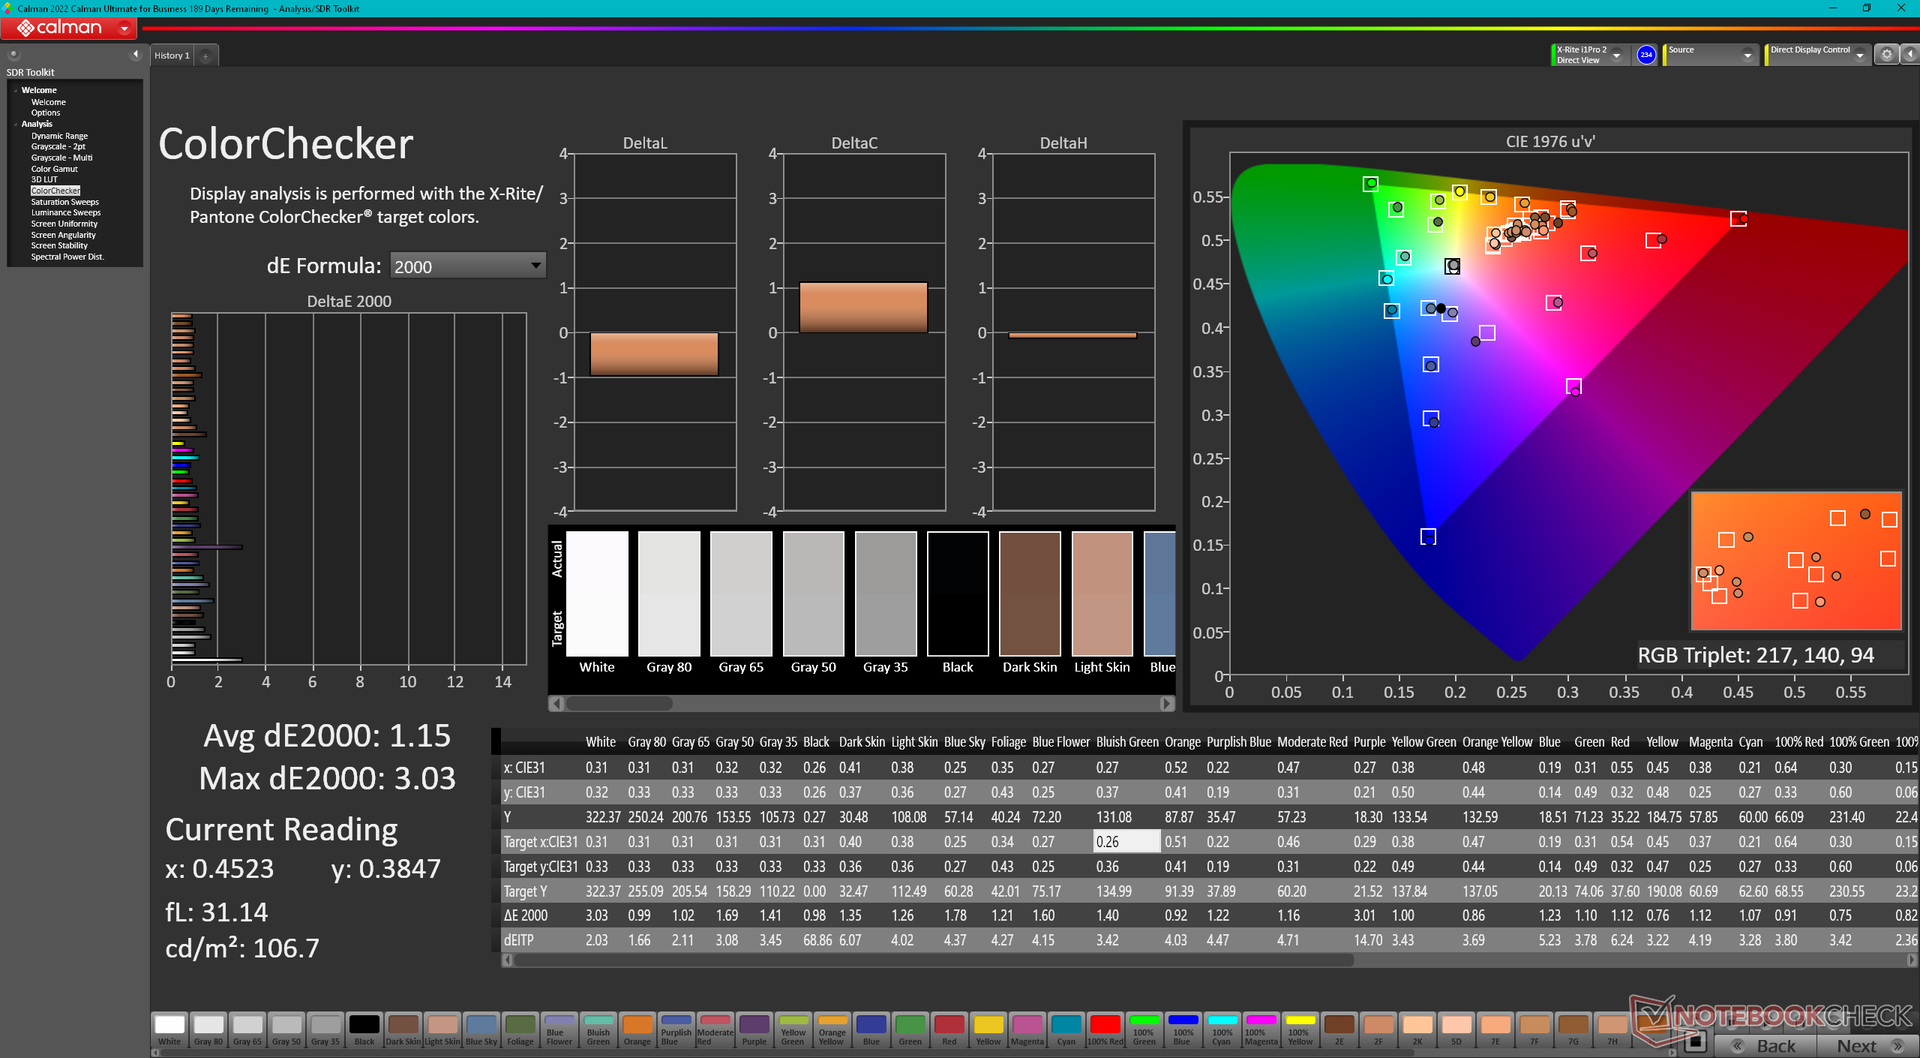
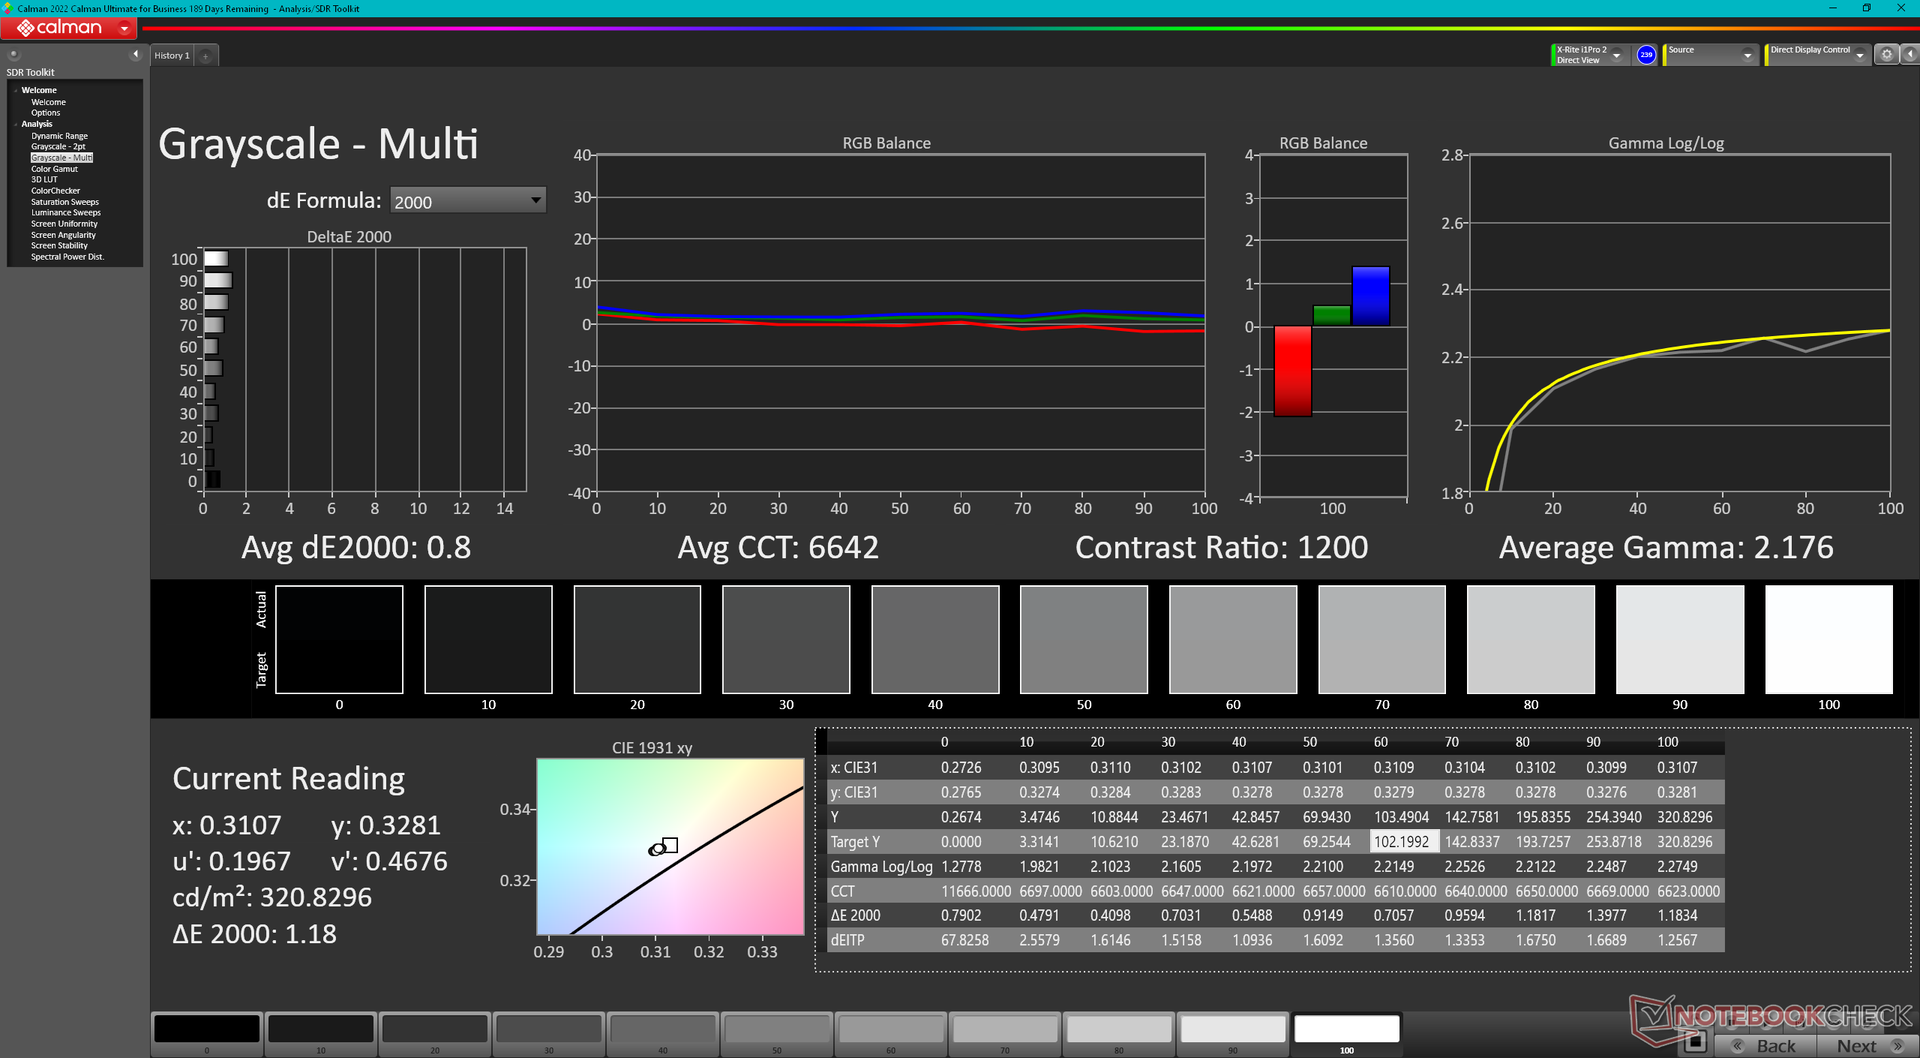
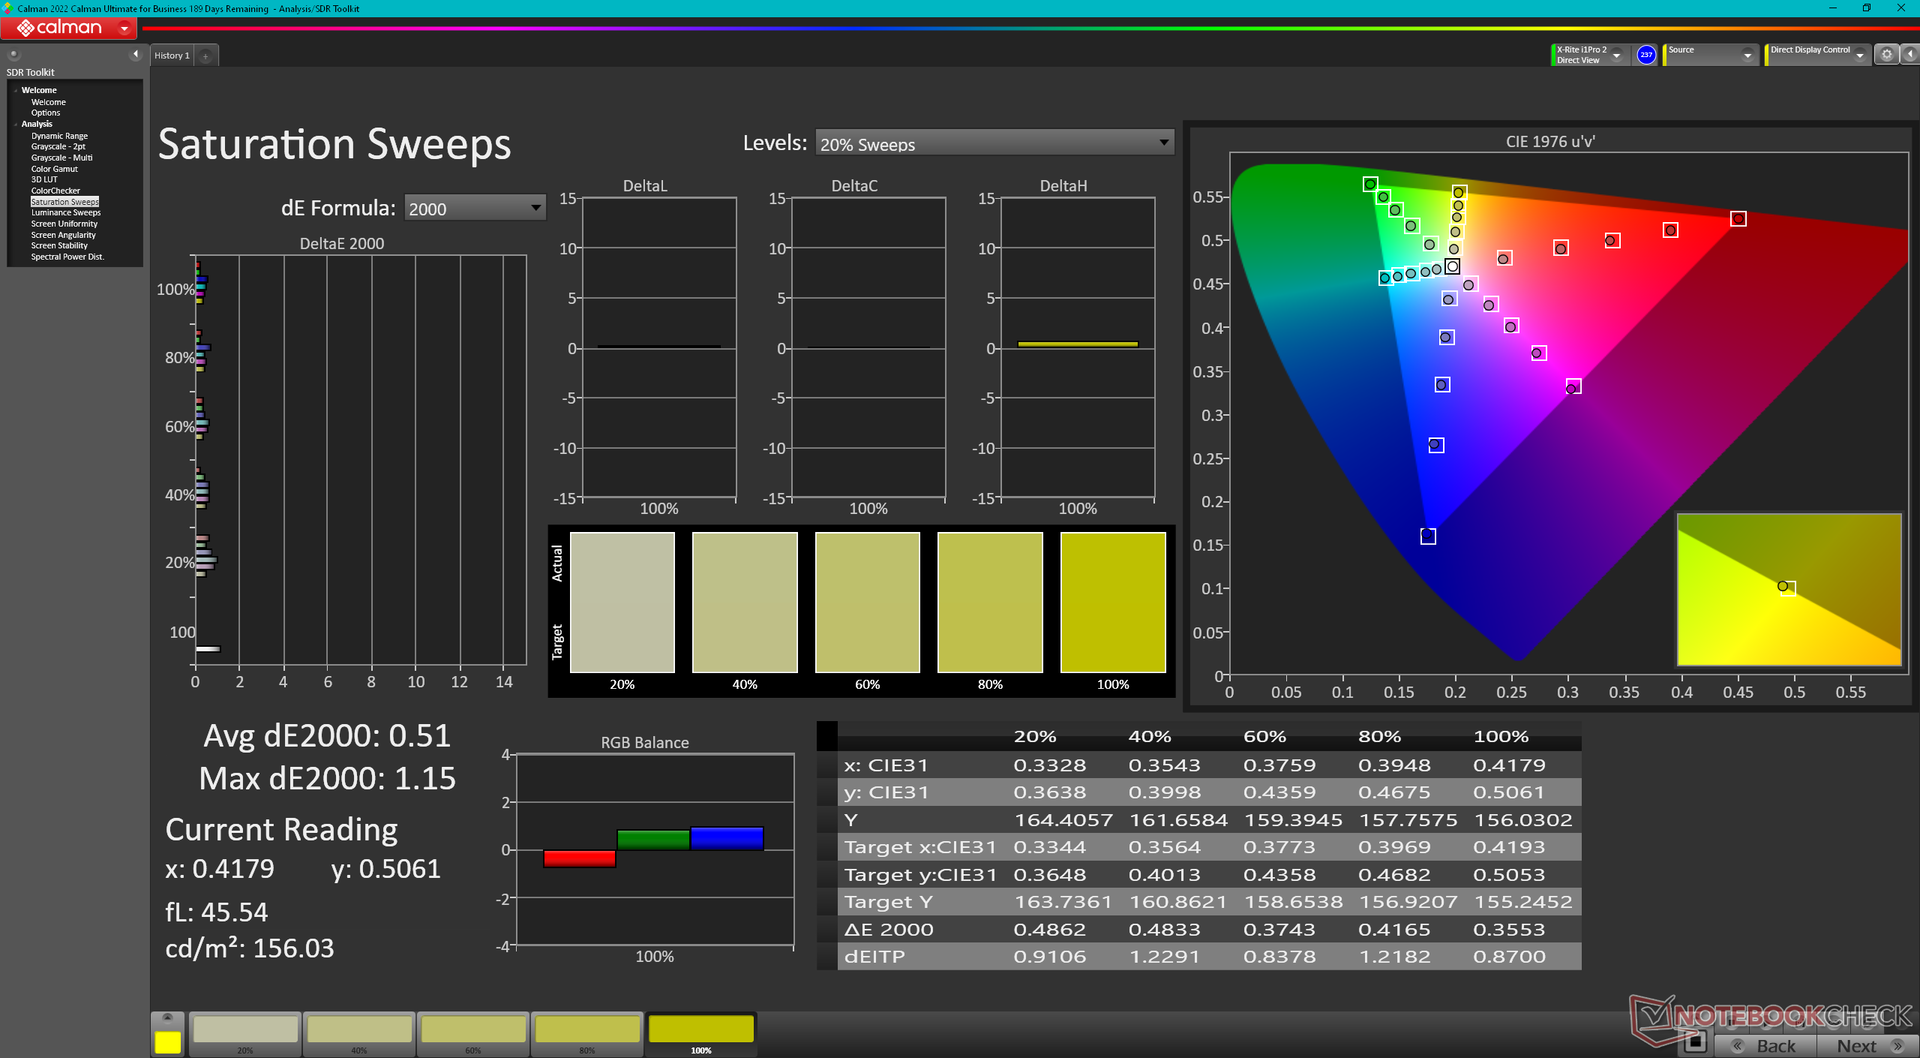
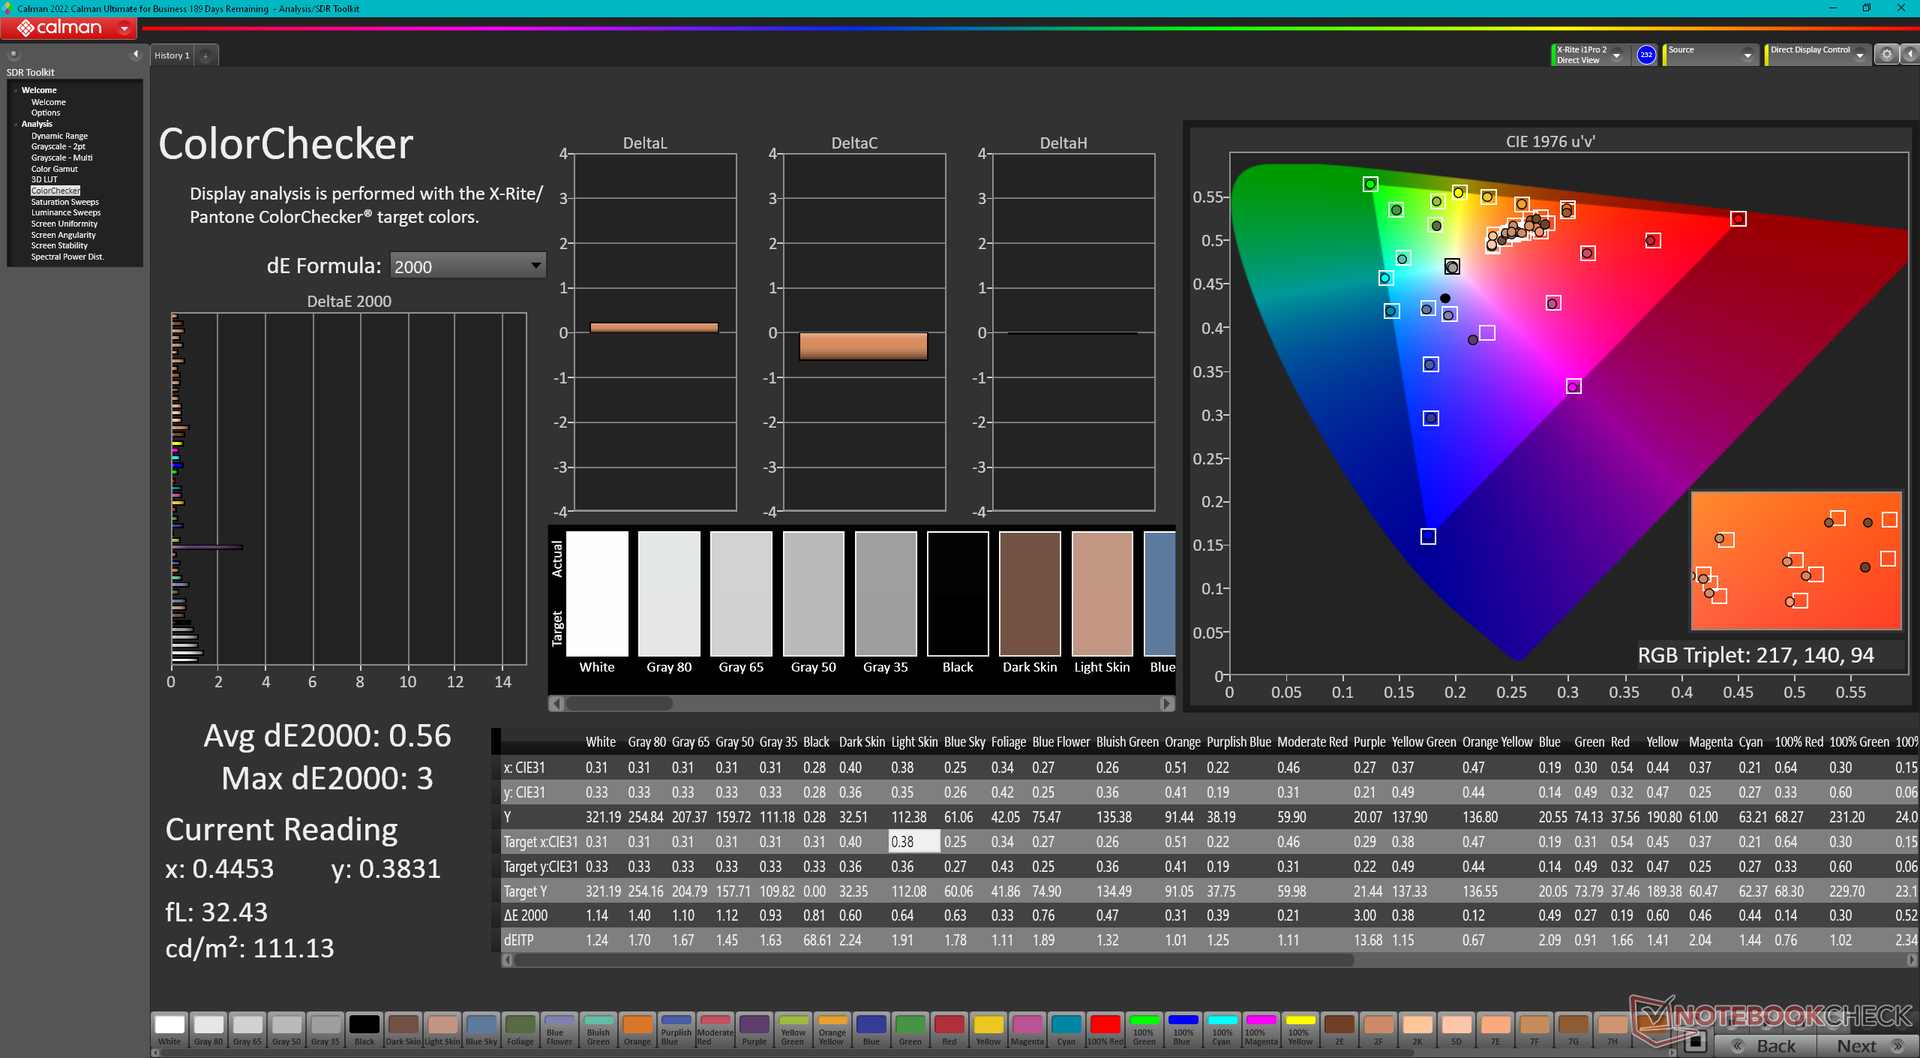
Le modèle 2023 utilise la même dalle BOE NE173QHM-NZ2 IPS 240 Hz que le modèle 2022. Nos mesures ci-dessous sont donc presque identiques d'une année sur l'autre. Ce n'est pas nécessairement une mauvaise chose puisque le panneau offre des temps de réponse très rapides, des couleurs DCI-P3 complètes et un rapport de contraste décent pour convenir à la fois à l'édition graphique et aux jeux. Les utilisateurs à la recherche d'options 4K ou OLED n'ont cependant pas de chance pour le moment.
| |||||||||||||||||||||||||
Homogénéité de la luminosité: 86 %
Valeur mesurée au centre, sur batterie: 322.5 cd/m²
Contraste: 1112:1 (Valeurs des noirs: 0.29 cd/m²)
ΔE ColorChecker Calman: 1.15 | ∀{0.5-29.43 Ø4.71}
calibrated: 0.56
ΔE Greyscale Calman: 1.7 | ∀{0.09-98 Ø4.96}
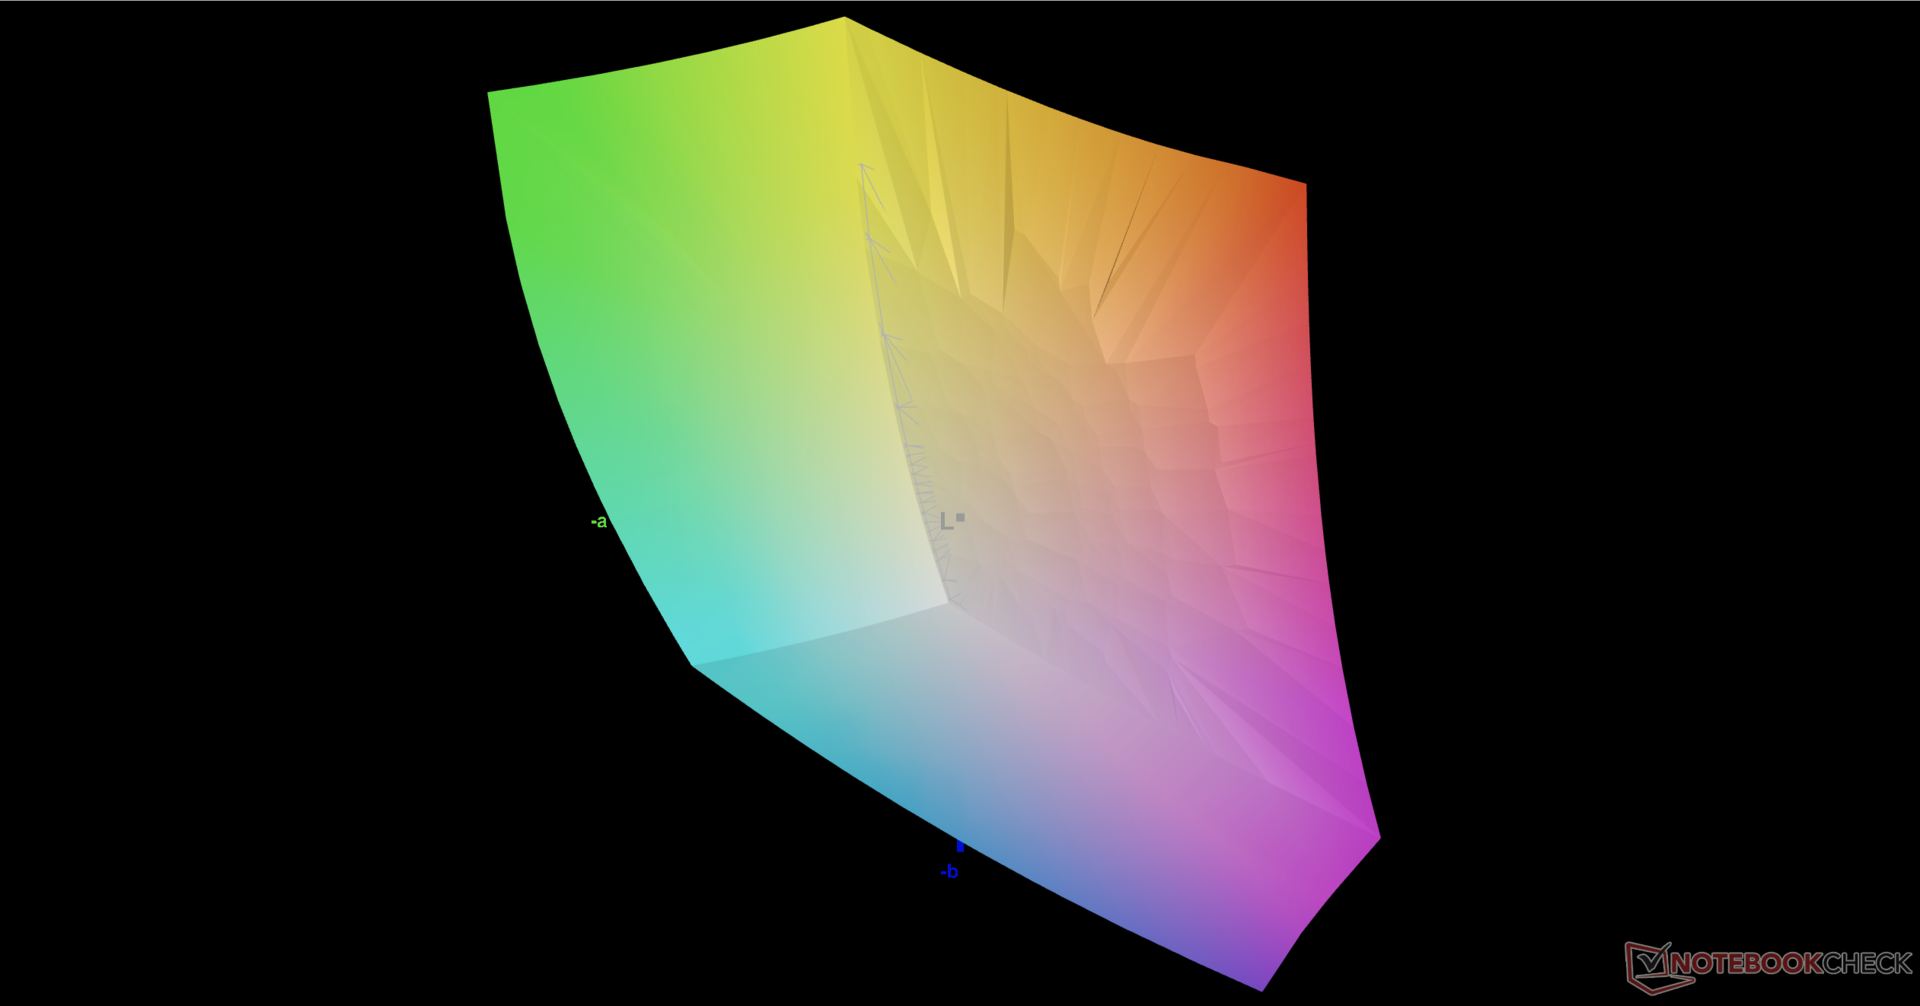
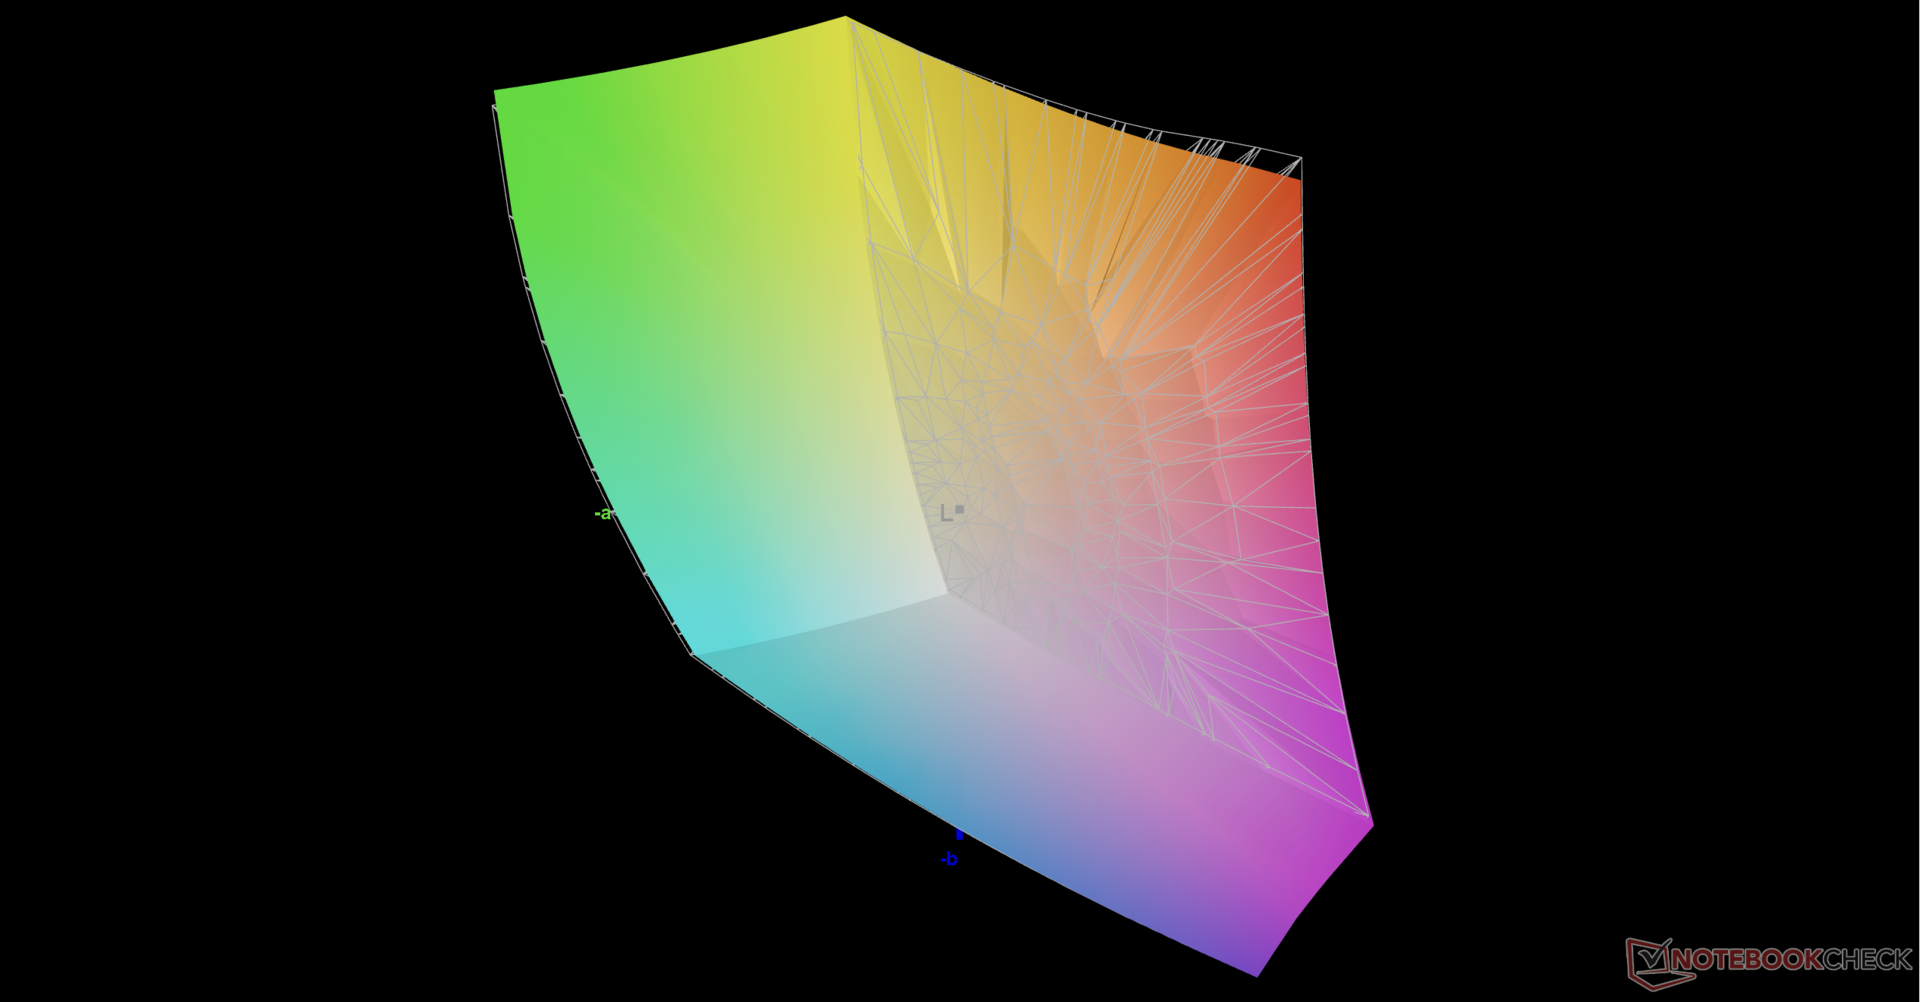
85.6% AdobeRGB 1998 (Argyll 3D)
100% sRGB (Argyll 3D)
98% Display P3 (Argyll 3D)
Gamma: 2.27
CCT: 6299 K
| Asus ROG Strix Scar 17 G733PY-XS96 NE173QHM-NZ2, IPS, 2560x1440, 17.3" | Asus ROG Strix Scar 17 SE G733CX-LL014W NE173QHM-NZ2, IPS, 2560x1440, 17.3" | MSI GE78HX 13VH-070US AU Optronics B170QAN01.2, IPS, 2560x1600, 17" | Eluktronics Mech-17 GP2 BOE NE170QDM-NZ1, IPS, 2560x1600, 17" | Aorus 17X XES Sharp SHP1563, IPS, 1920x1080, 17.3" | Alienware m17 R5 (R9 6900HX, RX 6850M XT) AU Optronics AUODBA3, IPS, 3840x2160, 17" | |
|---|---|---|---|---|---|---|
| Display | -1% | 0% | -16% | -15% | 1% | |
| Display P3 Coverage (%) | 98 | 97.1 -1% | 97.6 0% | 69.1 -29% | 70.1 -28% | 97.2 -1% |
| sRGB Coverage (%) | 100 | 99.9 0% | 99.9 0% | 99.7 0% | 99.9 0% | 99.6 0% |
| AdobeRGB 1998 Coverage (%) | 85.6 | 84.8 -1% | 86.5 1% | 69.8 -18% | 71.9 -16% | 88.4 3% |
| Response Times | 10% | 38% | -38% | 47% | -84% | |
| Response Time Grey 50% / Grey 80% * (ms) | 6.2 ? | 5.7 ? 8% | 4.2 ? 32% | 12 ? -94% | 3.4 ? 45% | 16.4 ? -165% |
| Response Time Black / White * (ms) | 11.4 ? | 10.1 ? 11% | 6.4 ? 44% | 9.4 ? 18% | 5.8 ? 49% | 11.6 ? -2% |
| PWM Frequency (Hz) | ||||||
| Screen | 5% | -93% | -20% | -102% | -161% | |
| Brightness middle (cd/m²) | 322.5 | 320 -1% | 398.6 24% | 417.3 29% | 278 -14% | 484 50% |
| Brightness (cd/m²) | 317 | 303 -4% | 384 21% | 387 22% | 273 -14% | 449 42% |
| Brightness Distribution (%) | 86 | 87 1% | 89 3% | 87 1% | 79 -8% | 87 1% |
| Black Level * (cd/m²) | 0.29 | 0.3 -3% | 0.46 -59% | 0.42 -45% | 0.26 10% | 0.55 -90% |
| Contrast (:1) | 1112 | 1067 -4% | 867 -22% | 994 -11% | 1069 -4% | 880 -21% |
| Colorchecker dE 2000 * | 1.15 | 1.1 4% | 4.05 -252% | 2.14 -86% | 3.96 -244% | 4.8 -317% |
| Colorchecker dE 2000 max. * | 3.03 | 2.7 11% | 8.68 -186% | 4.09 -35% | 10.78 -256% | 7.48 -147% |
| Colorchecker dE 2000 calibrated * | 0.56 | 1.02 -82% | 0.42 25% | 1.07 -91% | 4.74 -746% | |
| Greyscale dE 2000 * | 1.7 | 1.1 35% | 6.5 -282% | 3.1 -82% | 6.8 -300% | 5.5 -224% |
| Gamma | 2.27 97% | 2.13 103% | 2.11 104% | 2.19 100% | 2.224 99% | 2.42 91% |
| CCT | 6299 103% | 6599 98% | 7518 86% | 6040 108% | 7651 85% | 6148 106% |
| Moyenne finale (programmes/paramètres) | 5% /
4% | -18% /
-54% | -25% /
-22% | -23% /
-62% | -81% /
-116% |
* ... Moindre est la valeur, meilleures sont les performances
L'écran est précalibré dès sa sortie de l'emballage avec des valeurs moyennes de deltaE en niveaux de gris et en couleurs très faibles, de seulement 1,7 et 1,15, respectivement. Un étalonnage par l'utilisateur final n'est donc pas nécessaire.

Temps de réponse de l'écran
| ↔ Temps de réponse noir à blanc | ||
|---|---|---|
| 11.4 ms ... hausse ↗ et chute ↘ combinées | ↗ 5.9 ms hausse | 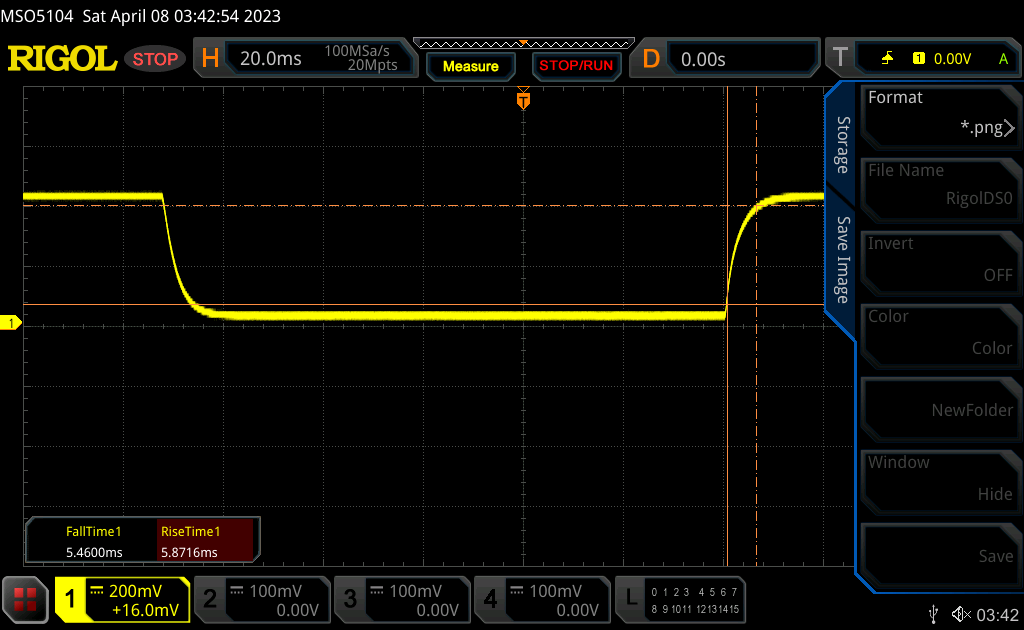 |
| ↘ 5.5 ms chute | ||
| L'écran montre de bons temps de réponse, mais insuffisant pour du jeu compétitif. En comparaison, tous les appareils testés affichent entre 0.1 (minimum) et 240 (maximum) ms. » 31 % des appareils testés affichent de meilleures performances. Cela signifie que les latences relevées sont meilleures que la moyenne (19.8 ms) de tous les appareils testés. | ||
| ↔ Temps de réponse gris 50% à gris 80% | ||
| 6.2 ms ... hausse ↗ et chute ↘ combinées | ↗ 2.8 ms hausse | 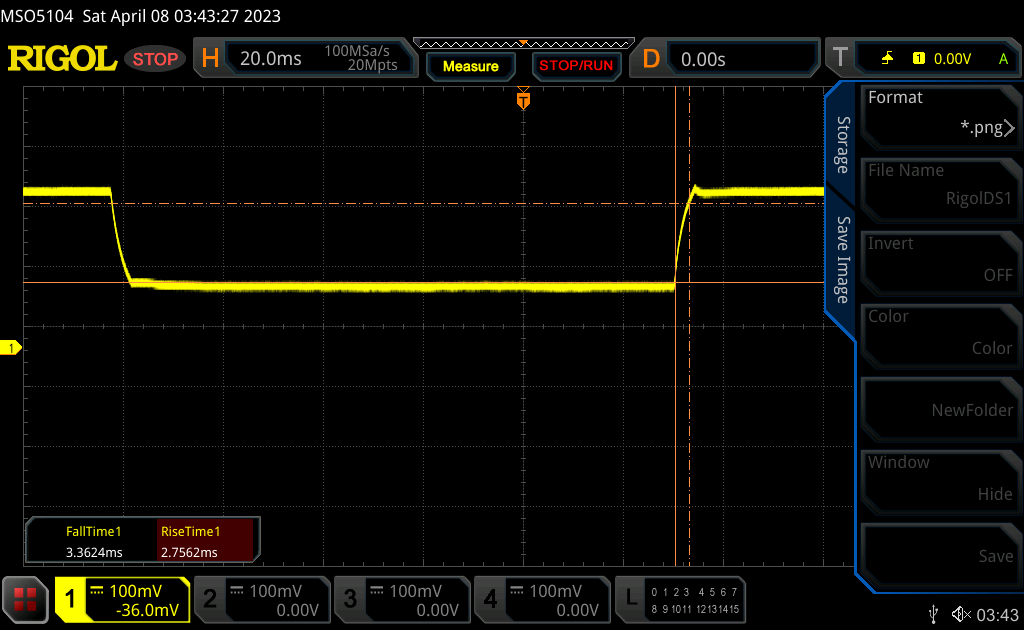 |
| ↘ 3.4 ms chute | ||
| L'écran montre de très faibles temps de réponse, parfait pour le jeu. En comparaison, tous les appareils testés affichent entre 0.165 (minimum) et 636 (maximum) ms. » 19 % des appareils testés affichent de meilleures performances. Cela signifie que les latences relevées sont meilleures que la moyenne (31 ms) de tous les appareils testés. | ||
Scintillement / MLI (Modulation de largeur d'impulsion)
| Scintillement / MLI (Modulation de largeur d'impulsion) non décelé | 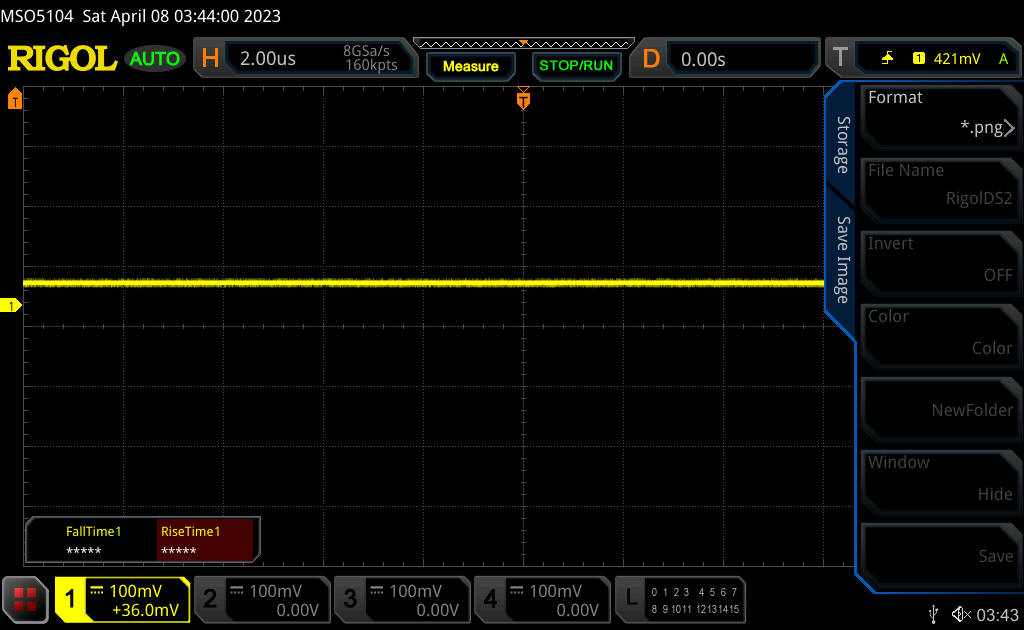 | ||
En comparaison, 52 % des appareils testés n'emploient pas MDI pour assombrir leur écran. Nous avons relevé une moyenne à 7754 (minimum : 5 - maximum : 343500) Hz dans le cas où une MDI était active. | |||
Performances - Rising Ryzen
Conditions d'essai
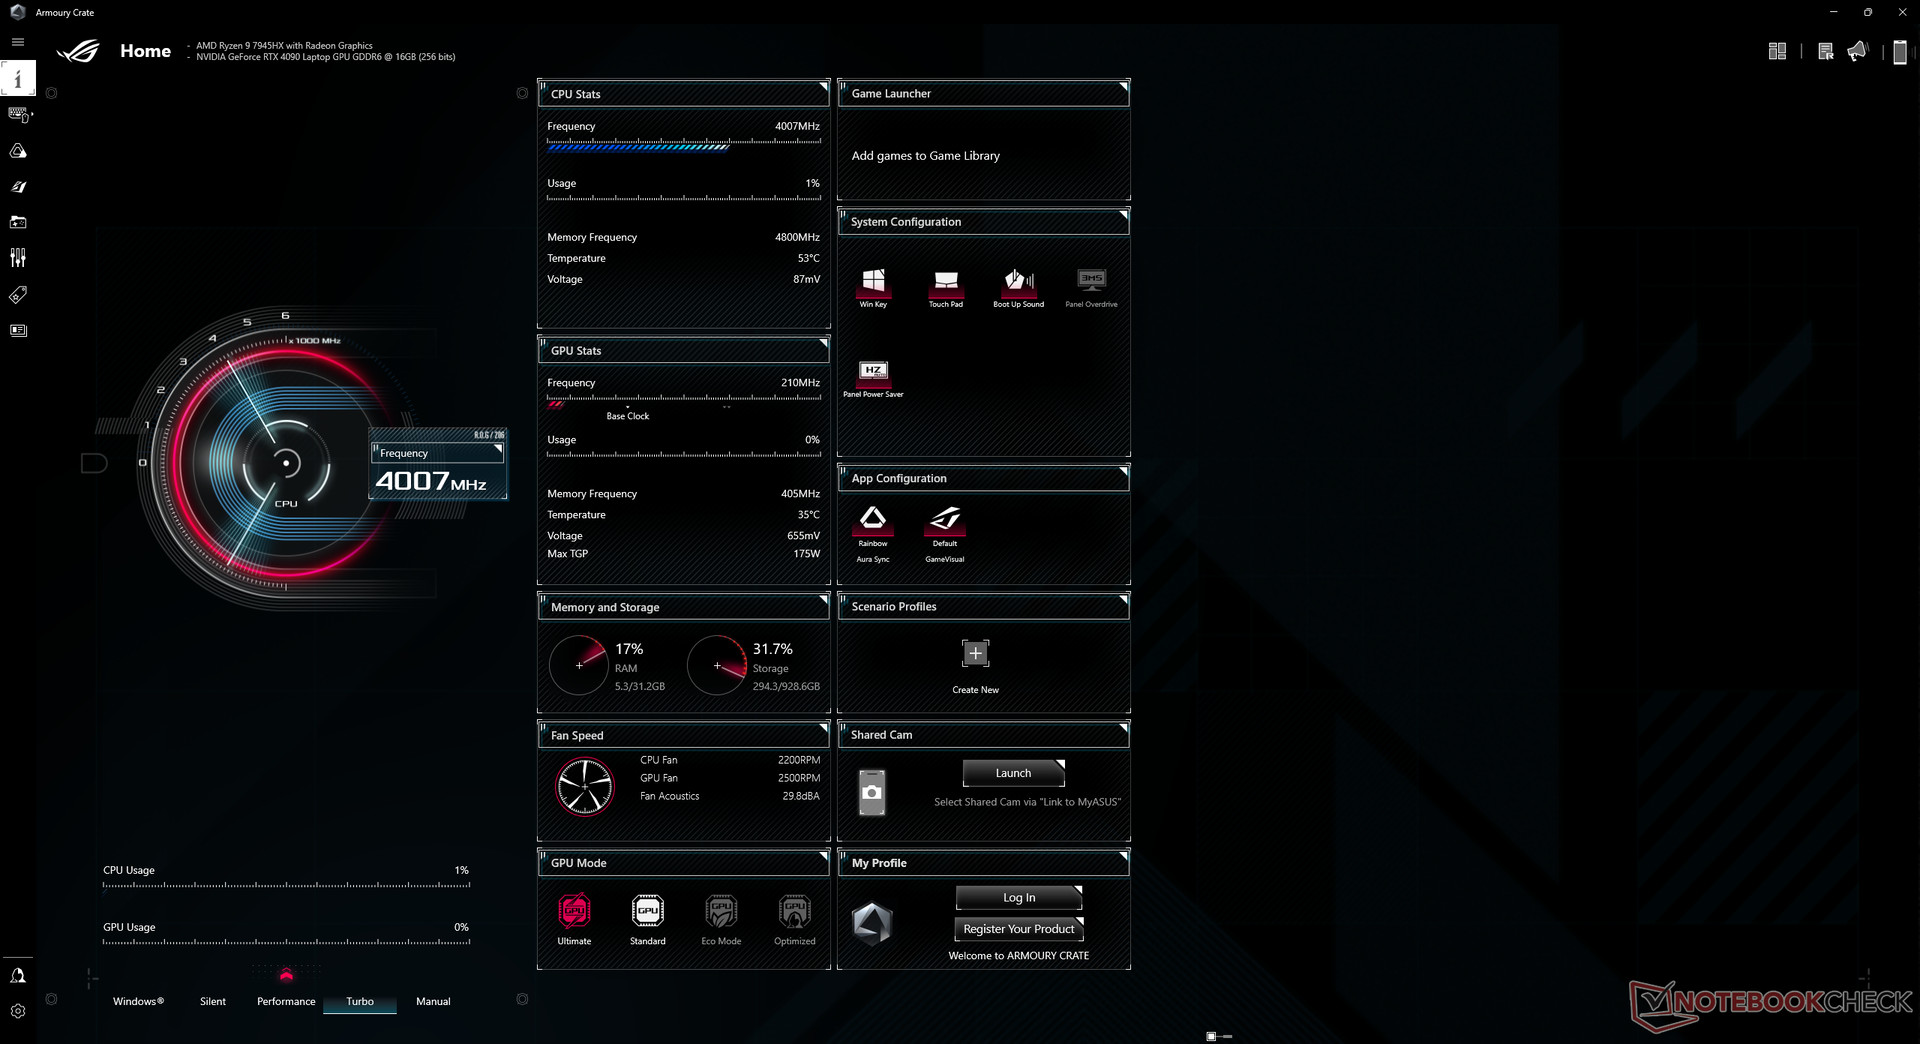
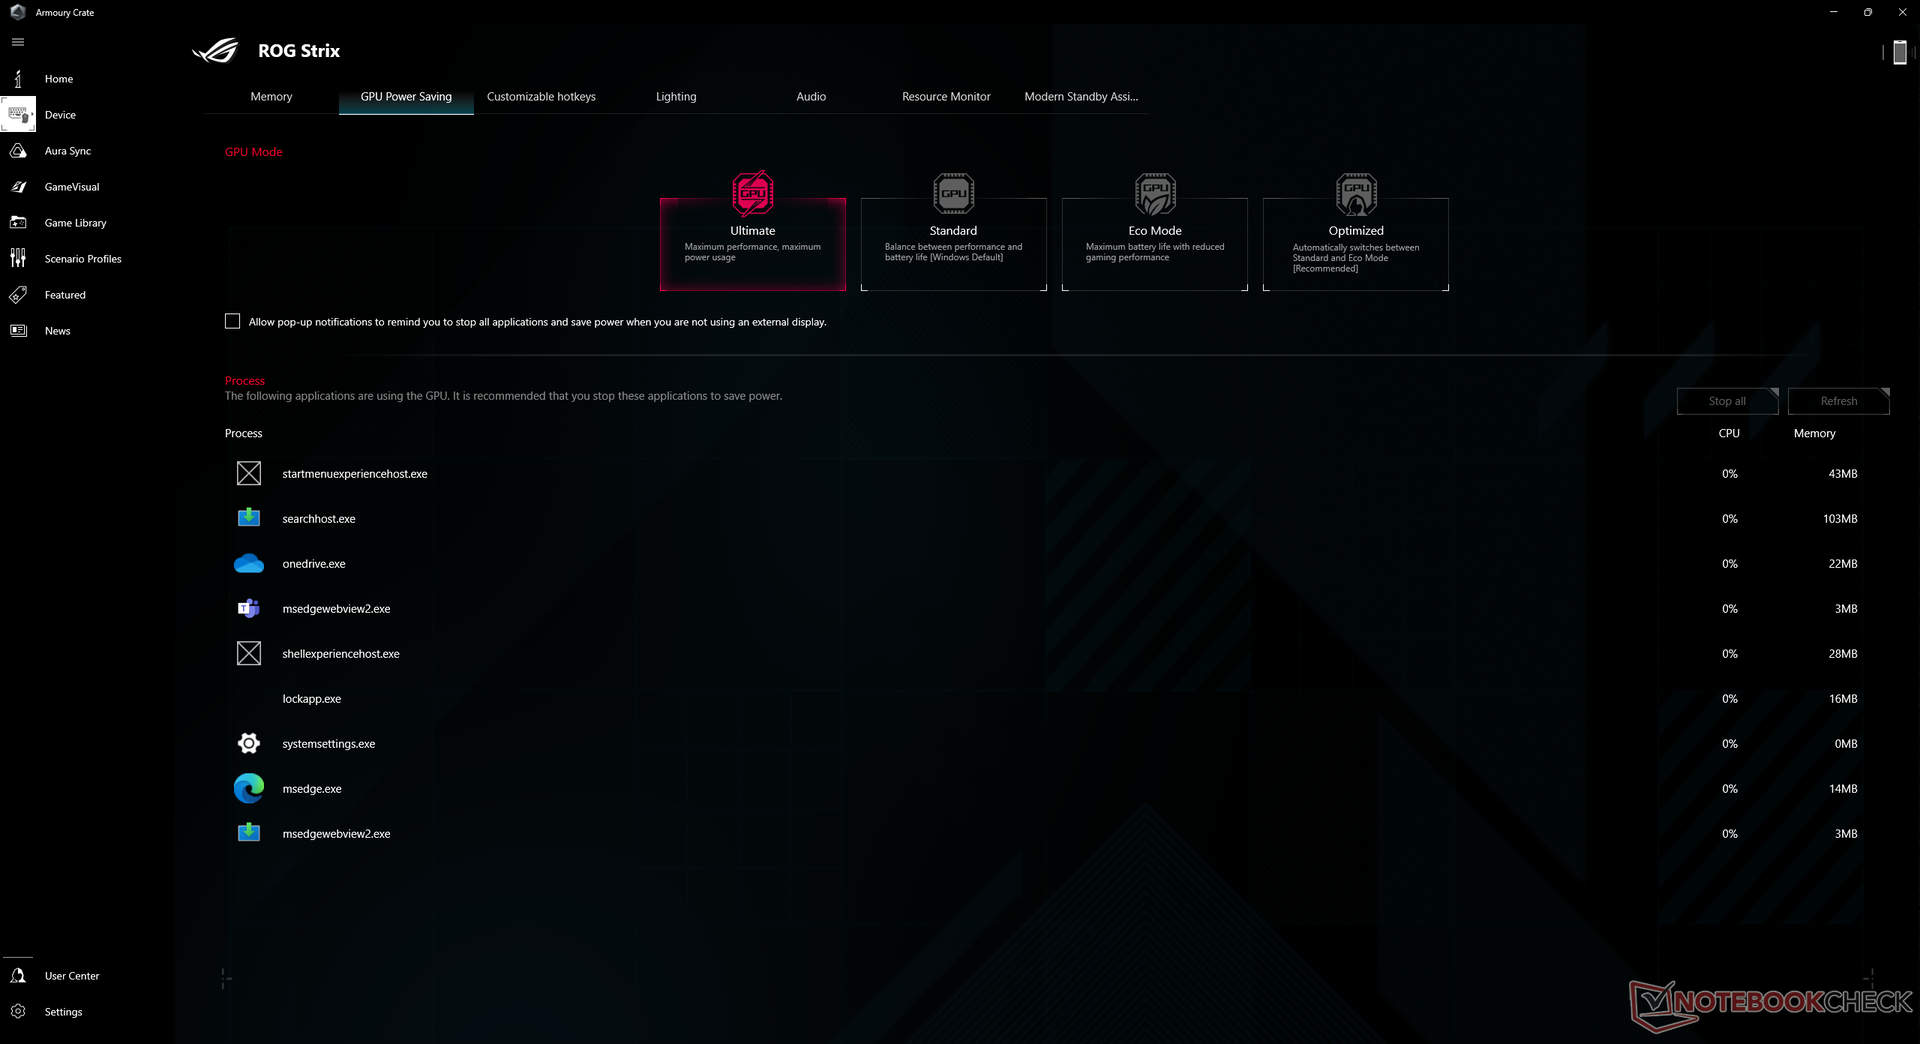
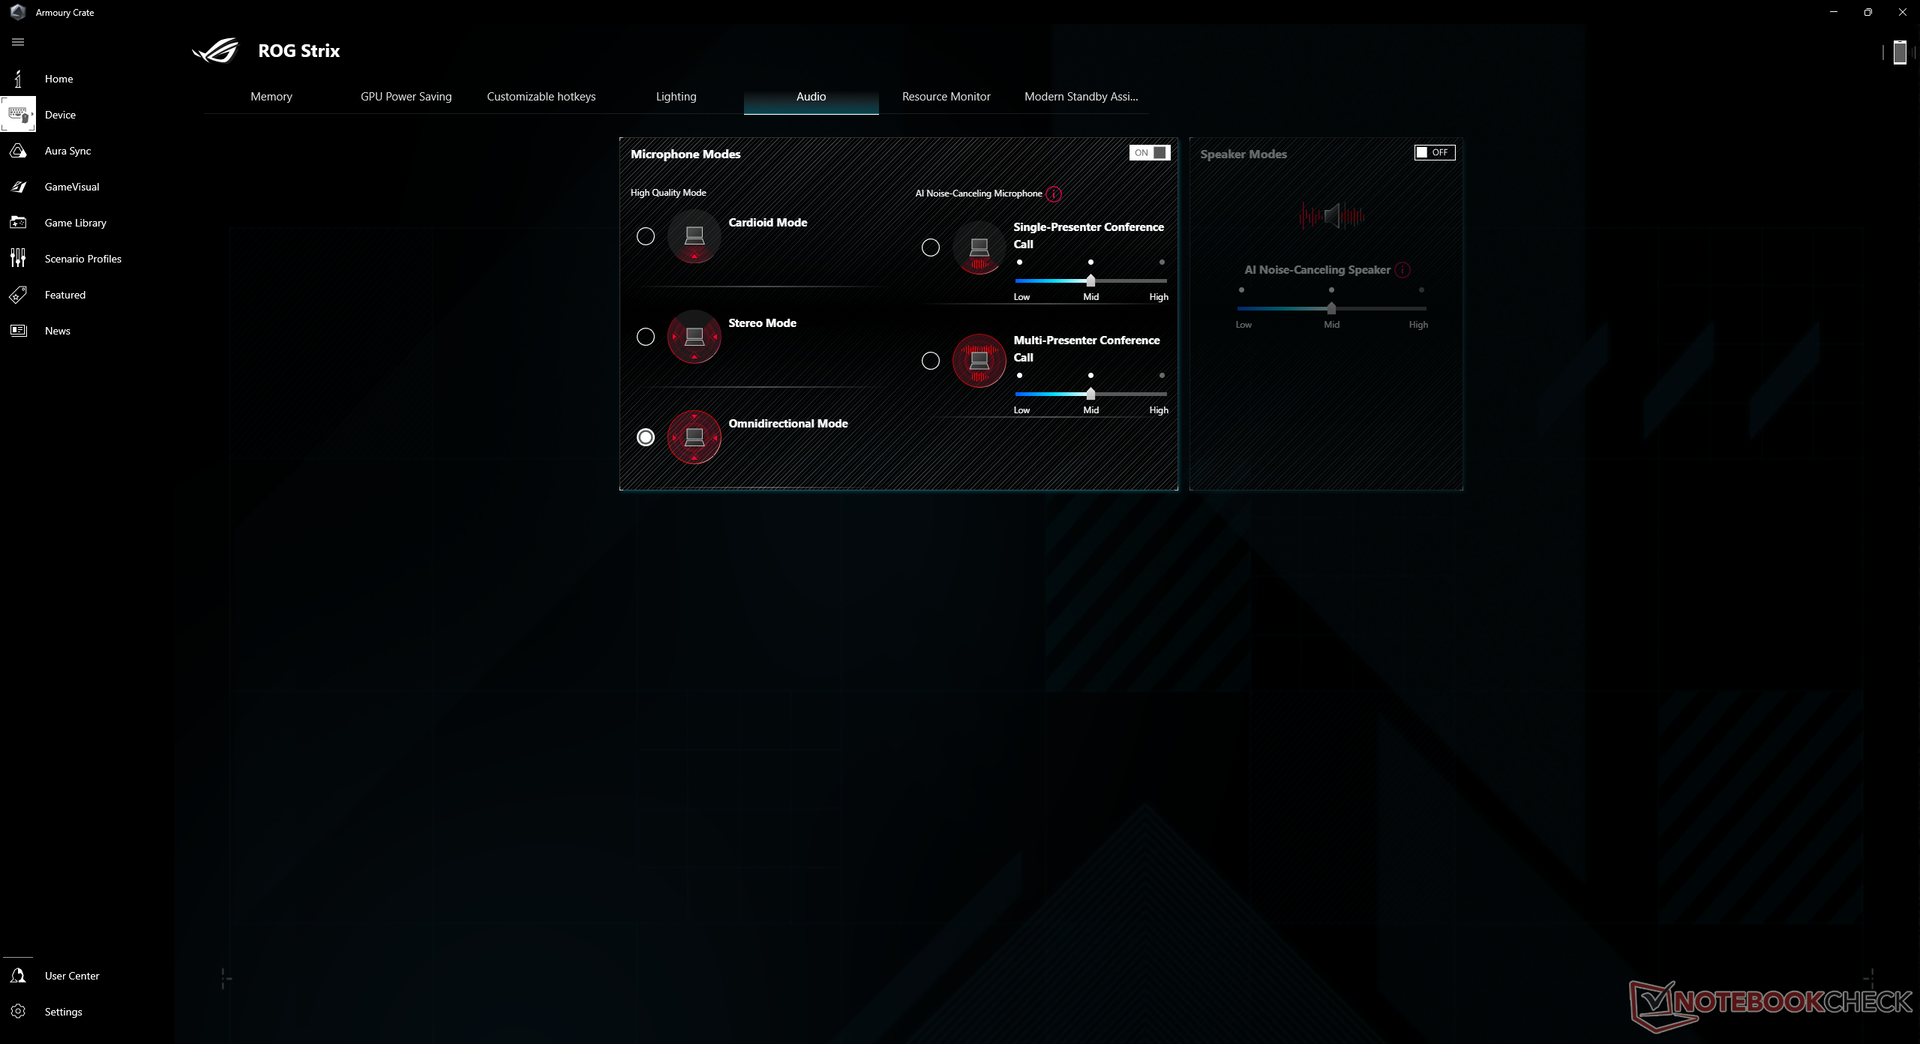
Nous avons réglé notre appareil en mode Turbo et en mode GPU discret via Asus Armoury Crate avant d'effectuer les tests ci-dessous. Les propriétaires sont encouragés à se familiariser avec Armoury Crate car c'est le centre de contrôle pour les modes d'alimentation, MUX, Asus Aura, et d'autres fonctionnalités et mises à jour spécifiques au modèle.
Il convient de noter que nous avons rencontré quelques problèmes sur notre unité de test. Lors de la commutation entre les modes Optimus et dGPU, le système ne parvenait parfois pas à se charger lors du redémarrage. Un redémarrage brutal était alors nécessaire.
Processeur
Les performances du processeur sont parmi les plus rapides que l'on puisse trouver sur un ordinateur portable, comme nous l'avons expliqué dans notre test du Ryzen 9 7945HX notre test du Ryzen 9 7945HX. Néanmoins, il reste en retrait par rapport au processeur concurrentCore i9-13950HX ou i9-13900HX de la concurrence, juste un peu plus lorsqu'il s'agit d'opérations à un seul fil.
Cinebench R15 Multi Loop
Cinebench R23: Multi Core | Single Core
Cinebench R20: CPU (Multi Core) | CPU (Single Core)
Cinebench R15: CPU Multi 64Bit | CPU Single 64Bit
Blender: v2.79 BMW27 CPU
7-Zip 18.03: 7z b 4 | 7z b 4 -mmt1
Geekbench 5.5: Multi-Core | Single-Core
HWBOT x265 Benchmark v2.2: 4k Preset
LibreOffice : 20 Documents To PDF
R Benchmark 2.5: Overall mean
* ... Moindre est la valeur, meilleures sont les performances
AIDA64: FP32 Ray-Trace | FPU Julia | CPU SHA3 | CPU Queen | FPU SinJulia | FPU Mandel | CPU AES | CPU ZLib | FP64 Ray-Trace | CPU PhotoWorxx
| Performance rating | |
| Asus ROG Strix Scar 17 G733PY-XS96 | |
| Moyenne AMD Ryzen 9 7945HX | |
| Asus ROG Strix G17 G713PI | |
| Eluktronics Mech-17 GP2 | |
| MSI GE78HX 13VH-070US | |
| Aorus 17X XES | |
| Alienware m17 R5 (R9 6900HX, RX 6850M XT) | |
| AIDA64 / FP32 Ray-Trace | |
| Asus ROG Strix Scar 17 G733PY-XS96 | |
| Moyenne AMD Ryzen 9 7945HX (50388 - 60169, n=7) | |
| Asus ROG Strix G17 G713PI | |
| MSI GE78HX 13VH-070US | |
| Eluktronics Mech-17 GP2 | |
| Alienware m17 R5 (R9 6900HX, RX 6850M XT) | |
| Aorus 17X XES | |
| AIDA64 / FPU Julia | |
| Asus ROG Strix Scar 17 G733PY-XS96 | |
| Asus ROG Strix G17 G713PI | |
| Moyenne AMD Ryzen 9 7945HX (201874 - 252486, n=7) | |
| MSI GE78HX 13VH-070US | |
| Eluktronics Mech-17 GP2 | |
| Alienware m17 R5 (R9 6900HX, RX 6850M XT) | |
| Aorus 17X XES | |
| AIDA64 / CPU SHA3 | |
| Asus ROG Strix Scar 17 G733PY-XS96 | |
| Moyenne AMD Ryzen 9 7945HX (8525 - 10389, n=7) | |
| Asus ROG Strix G17 G713PI | |
| Eluktronics Mech-17 GP2 | |
| MSI GE78HX 13VH-070US | |
| Aorus 17X XES | |
| Alienware m17 R5 (R9 6900HX, RX 6850M XT) | |
| AIDA64 / CPU Queen | |
| Asus ROG Strix Scar 17 G733PY-XS96 | |
| Moyenne AMD Ryzen 9 7945HX (175041 - 200651, n=7) | |
| Asus ROG Strix G17 G713PI | |
| Eluktronics Mech-17 GP2 | |
| MSI GE78HX 13VH-070US | |
| Alienware m17 R5 (R9 6900HX, RX 6850M XT) | |
| Aorus 17X XES | |
| AIDA64 / FPU SinJulia | |
| Asus ROG Strix Scar 17 G733PY-XS96 | |
| Moyenne AMD Ryzen 9 7945HX (28794 - 32988, n=7) | |
| Asus ROG Strix G17 G713PI | |
| Eluktronics Mech-17 GP2 | |
| MSI GE78HX 13VH-070US | |
| Alienware m17 R5 (R9 6900HX, RX 6850M XT) | |
| Aorus 17X XES | |
| AIDA64 / FPU Mandel | |
| Asus ROG Strix Scar 17 G733PY-XS96 | |
| Moyenne AMD Ryzen 9 7945HX (105740 - 134044, n=7) | |
| Asus ROG Strix G17 G713PI | |
| MSI GE78HX 13VH-070US | |
| Eluktronics Mech-17 GP2 | |
| Alienware m17 R5 (R9 6900HX, RX 6850M XT) | |
| Aorus 17X XES | |
| AIDA64 / CPU AES | |
| Eluktronics Mech-17 GP2 | |
| Moyenne AMD Ryzen 9 7945HX (126790 - 325960, n=7) | |
| Asus ROG Strix Scar 17 G733PY-XS96 | |
| Asus ROG Strix G17 G713PI | |
| MSI GE78HX 13VH-070US | |
| Aorus 17X XES | |
| Alienware m17 R5 (R9 6900HX, RX 6850M XT) | |
| AIDA64 / CPU ZLib | |
| Asus ROG Strix Scar 17 G733PY-XS96 | |
| Moyenne AMD Ryzen 9 7945HX (2022 - 2409, n=7) | |
| Asus ROG Strix G17 G713PI | |
| MSI GE78HX 13VH-070US | |
| Eluktronics Mech-17 GP2 | |
| Aorus 17X XES | |
| Alienware m17 R5 (R9 6900HX, RX 6850M XT) | |
| AIDA64 / FP64 Ray-Trace | |
| Asus ROG Strix Scar 17 G733PY-XS96 | |
| Moyenne AMD Ryzen 9 7945HX (26875 - 31796, n=7) | |
| Asus ROG Strix G17 G713PI | |
| MSI GE78HX 13VH-070US | |
| Eluktronics Mech-17 GP2 | |
| Alienware m17 R5 (R9 6900HX, RX 6850M XT) | |
| Aorus 17X XES | |
| AIDA64 / CPU PhotoWorxx | |
| MSI GE78HX 13VH-070US | |
| Eluktronics Mech-17 GP2 | |
| Aorus 17X XES | |
| Moyenne AMD Ryzen 9 7945HX (31421 - 40095, n=7) | |
| Asus ROG Strix Scar 17 G733PY-XS96 | |
| Asus ROG Strix G17 G713PI | |
| Alienware m17 R5 (R9 6900HX, RX 6850M XT) | |
Performance du système
CrossMark: Overall | Productivity | Creativity | Responsiveness
| PCMark 10 / Score | |
| Eluktronics Mech-17 GP2 | |
| Moyenne AMD Ryzen 9 7945HX, NVIDIA GeForce RTX 4090 Laptop GPU (8733 - 9151, n=2) | |
| MSI GE78HX 13VH-070US | |
| Asus ROG Strix Scar 17 G733PY-XS96 | |
| Aorus 17X XES | |
| Asus ROG Strix G17 G713PI | |
| Alienware m17 R5 (R9 6900HX, RX 6850M XT) | |
| Asus ROG Strix Scar 17 SE G733CX-LL014W | |
| PCMark 10 / Essentials | |
| Eluktronics Mech-17 GP2 | |
| Moyenne AMD Ryzen 9 7945HX, NVIDIA GeForce RTX 4090 Laptop GPU (11165 - 12176, n=2) | |
| MSI GE78HX 13VH-070US | |
| Asus ROG Strix G17 G713PI | |
| Asus ROG Strix Scar 17 G733PY-XS96 | |
| Aorus 17X XES | |
| Asus ROG Strix Scar 17 SE G733CX-LL014W | |
| Alienware m17 R5 (R9 6900HX, RX 6850M XT) | |
| PCMark 10 / Productivity | |
| Asus ROG Strix G17 G713PI | |
| Moyenne AMD Ryzen 9 7945HX, NVIDIA GeForce RTX 4090 Laptop GPU (10266 - 11833, n=2) | |
| Eluktronics Mech-17 GP2 | |
| MSI GE78HX 13VH-070US | |
| Asus ROG Strix Scar 17 G733PY-XS96 | |
| Aorus 17X XES | |
| Asus ROG Strix Scar 17 SE G733CX-LL014W | |
| Alienware m17 R5 (R9 6900HX, RX 6850M XT) | |
| PCMark 10 / Digital Content Creation | |
| Asus ROG Strix Scar 17 G733PY-XS96 | |
| Eluktronics Mech-17 GP2 | |
| MSI GE78HX 13VH-070US | |
| Moyenne AMD Ryzen 9 7945HX, NVIDIA GeForce RTX 4090 Laptop GPU (14432 - 15768, n=2) | |
| Aorus 17X XES | |
| Alienware m17 R5 (R9 6900HX, RX 6850M XT) | |
| Asus ROG Strix Scar 17 SE G733CX-LL014W | |
| Asus ROG Strix G17 G713PI | |
| CrossMark / Overall | |
| Eluktronics Mech-17 GP2 | |
| Aorus 17X XES | |
| Asus ROG Strix Scar 17 SE G733CX-LL014W | |
| Asus ROG Strix G17 G713PI | |
| Moyenne AMD Ryzen 9 7945HX, NVIDIA GeForce RTX 4090 Laptop GPU (1993 - 2078, n=2) | |
| Asus ROG Strix Scar 17 G733PY-XS96 | |
| MSI GE78HX 13VH-070US | |
| Alienware m17 R5 (R9 6900HX, RX 6850M XT) | |
| CrossMark / Productivity | |
| Eluktronics Mech-17 GP2 | |
| Aorus 17X XES | |
| Asus ROG Strix Scar 17 SE G733CX-LL014W | |
| Asus ROG Strix G17 G713PI | |
| Moyenne AMD Ryzen 9 7945HX, NVIDIA GeForce RTX 4090 Laptop GPU (1838 - 1946, n=2) | |
| MSI GE78HX 13VH-070US | |
| Asus ROG Strix Scar 17 G733PY-XS96 | |
| Alienware m17 R5 (R9 6900HX, RX 6850M XT) | |
| CrossMark / Creativity | |
| Eluktronics Mech-17 GP2 | |
| Moyenne AMD Ryzen 9 7945HX, NVIDIA GeForce RTX 4090 Laptop GPU (2334 - 2377, n=2) | |
| Asus ROG Strix Scar 17 SE G733CX-LL014W | |
| Asus ROG Strix Scar 17 G733PY-XS96 | |
| Asus ROG Strix G17 G713PI | |
| Aorus 17X XES | |
| MSI GE78HX 13VH-070US | |
| Alienware m17 R5 (R9 6900HX, RX 6850M XT) | |
| CrossMark / Responsiveness | |
| Aorus 17X XES | |
| Asus ROG Strix Scar 17 SE G733CX-LL014W | |
| Eluktronics Mech-17 GP2 | |
| MSI GE78HX 13VH-070US | |
| Asus ROG Strix G17 G713PI | |
| Moyenne AMD Ryzen 9 7945HX, NVIDIA GeForce RTX 4090 Laptop GPU (1584 - 1689, n=2) | |
| Asus ROG Strix Scar 17 G733PY-XS96 | |
| Alienware m17 R5 (R9 6900HX, RX 6850M XT) | |
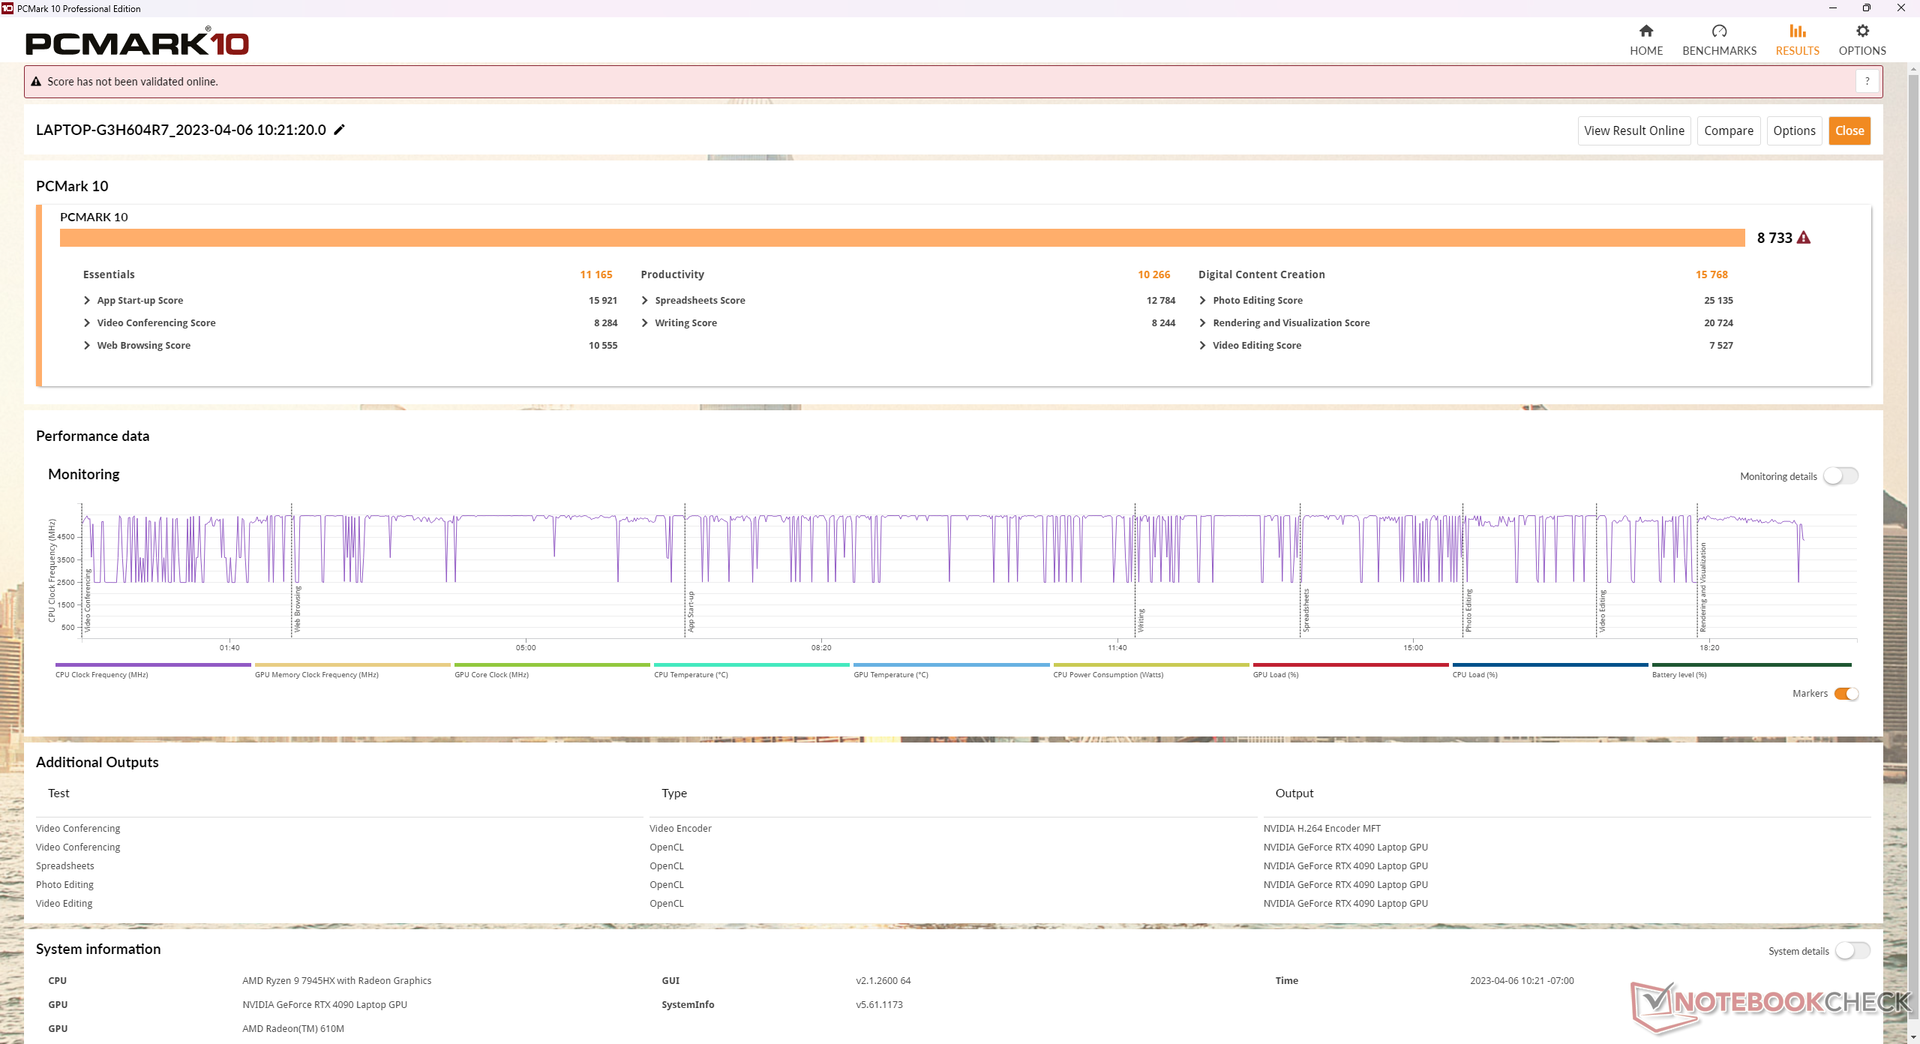
| PCMark 10 Score | 8733 points | |
Aide | ||
| AIDA64 / Memory Copy | |
| MSI GE78HX 13VH-070US | |
| Eluktronics Mech-17 GP2 | |
| Aorus 17X XES | |
| Moyenne AMD Ryzen 9 7945HX (48948 - 57953, n=7) | |
| Alienware m17 R5 (R9 6900HX, RX 6850M XT) | |
| Asus ROG Strix Scar 17 G733PY-XS96 | |
| Asus ROG Strix G17 G713PI | |
| AIDA64 / Memory Read | |
| MSI GE78HX 13VH-070US | |
| Eluktronics Mech-17 GP2 | |
| Aorus 17X XES | |
| Moyenne AMD Ryzen 9 7945HX (56910 - 67753, n=7) | |
| Asus ROG Strix G17 G713PI | |
| Asus ROG Strix Scar 17 G733PY-XS96 | |
| Alienware m17 R5 (R9 6900HX, RX 6850M XT) | |
| AIDA64 / Memory Write | |
| MSI GE78HX 13VH-070US | |
| Eluktronics Mech-17 GP2 | |
| Moyenne AMD Ryzen 9 7945HX (58602 - 70063, n=7) | |
| Aorus 17X XES | |
| Asus ROG Strix Scar 17 G733PY-XS96 | |
| Asus ROG Strix G17 G713PI | |
| Alienware m17 R5 (R9 6900HX, RX 6850M XT) | |
| AIDA64 / Memory Latency | |
| Alienware m17 R5 (R9 6900HX, RX 6850M XT) | |
| Eluktronics Mech-17 GP2 | |
| Aorus 17X XES | |
| Asus ROG Strix G17 G713PI | |
| MSI GE78HX 13VH-070US | |
| Moyenne AMD Ryzen 9 7945HX (77.1 - 91.3, n=7) | |
| Asus ROG Strix Scar 17 G733PY-XS96 | |
* ... Moindre est la valeur, meilleures sont les performances
Latence DPC
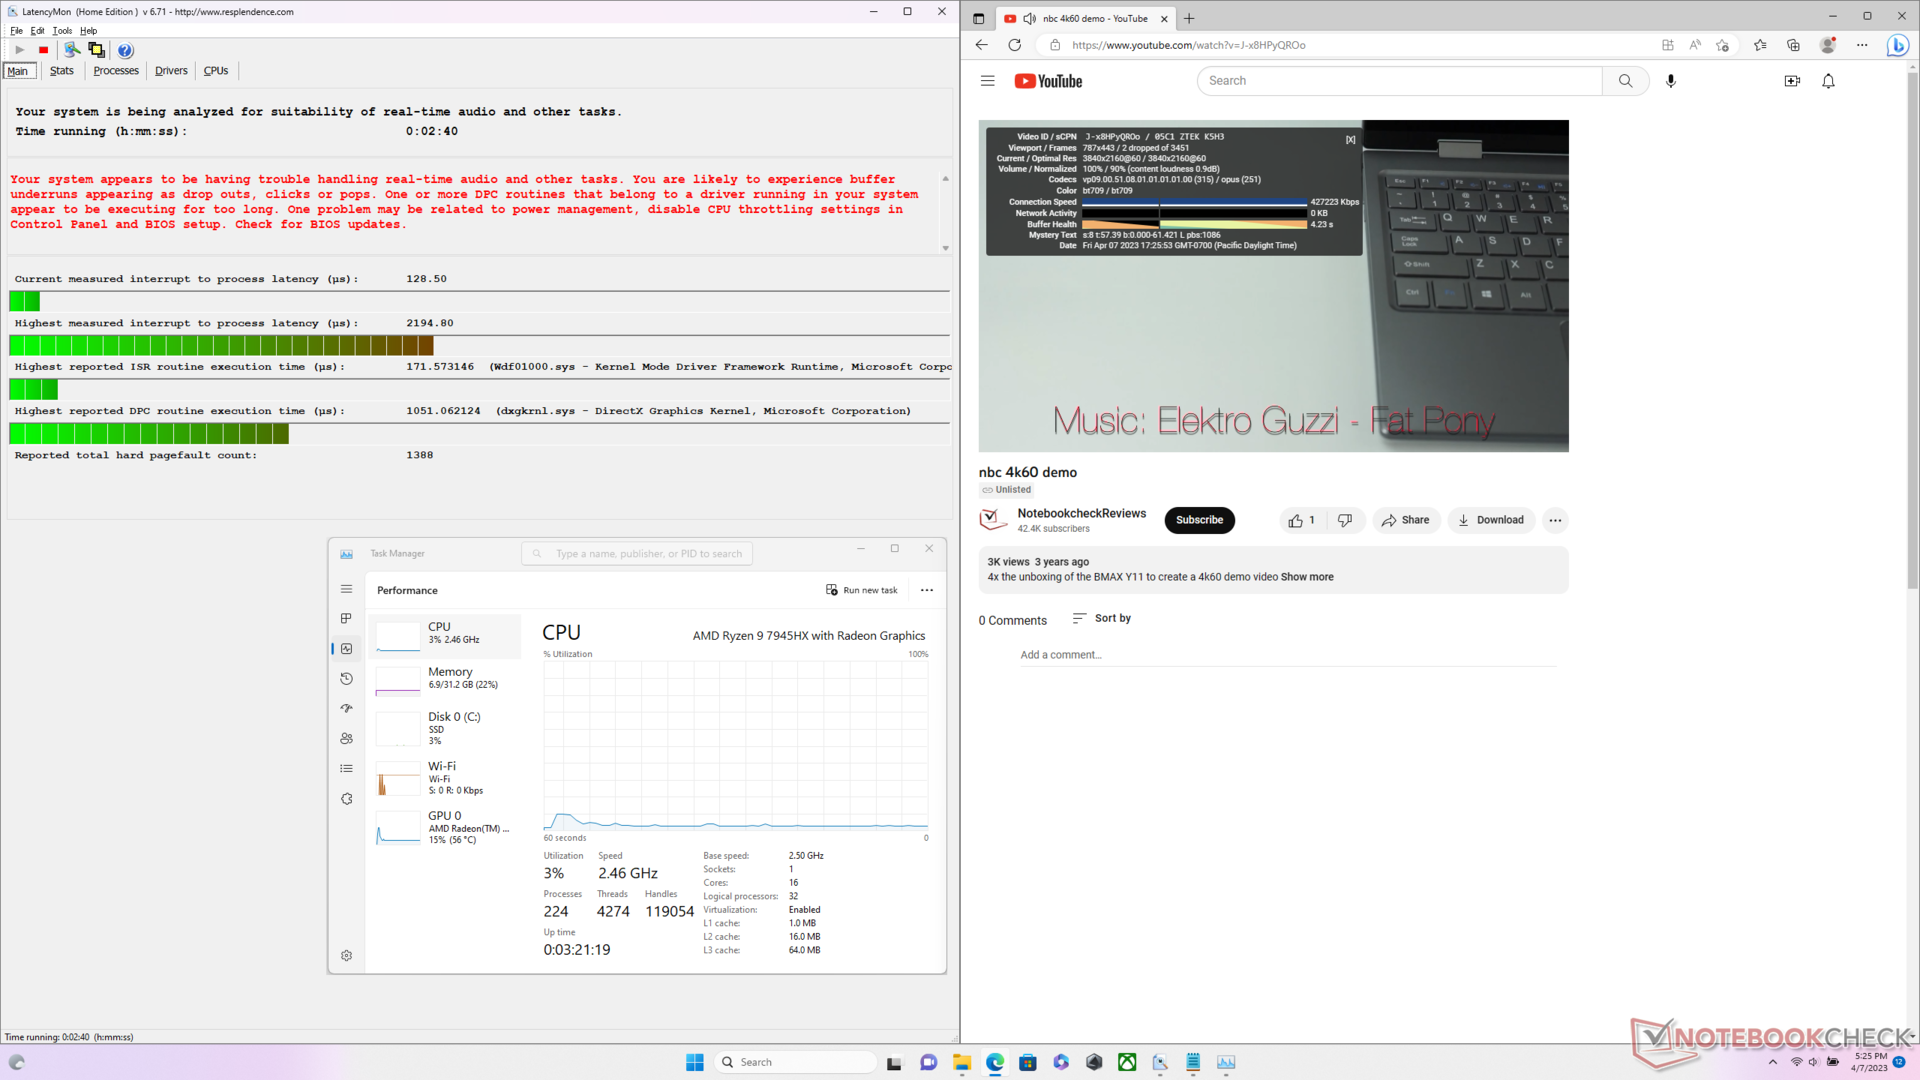
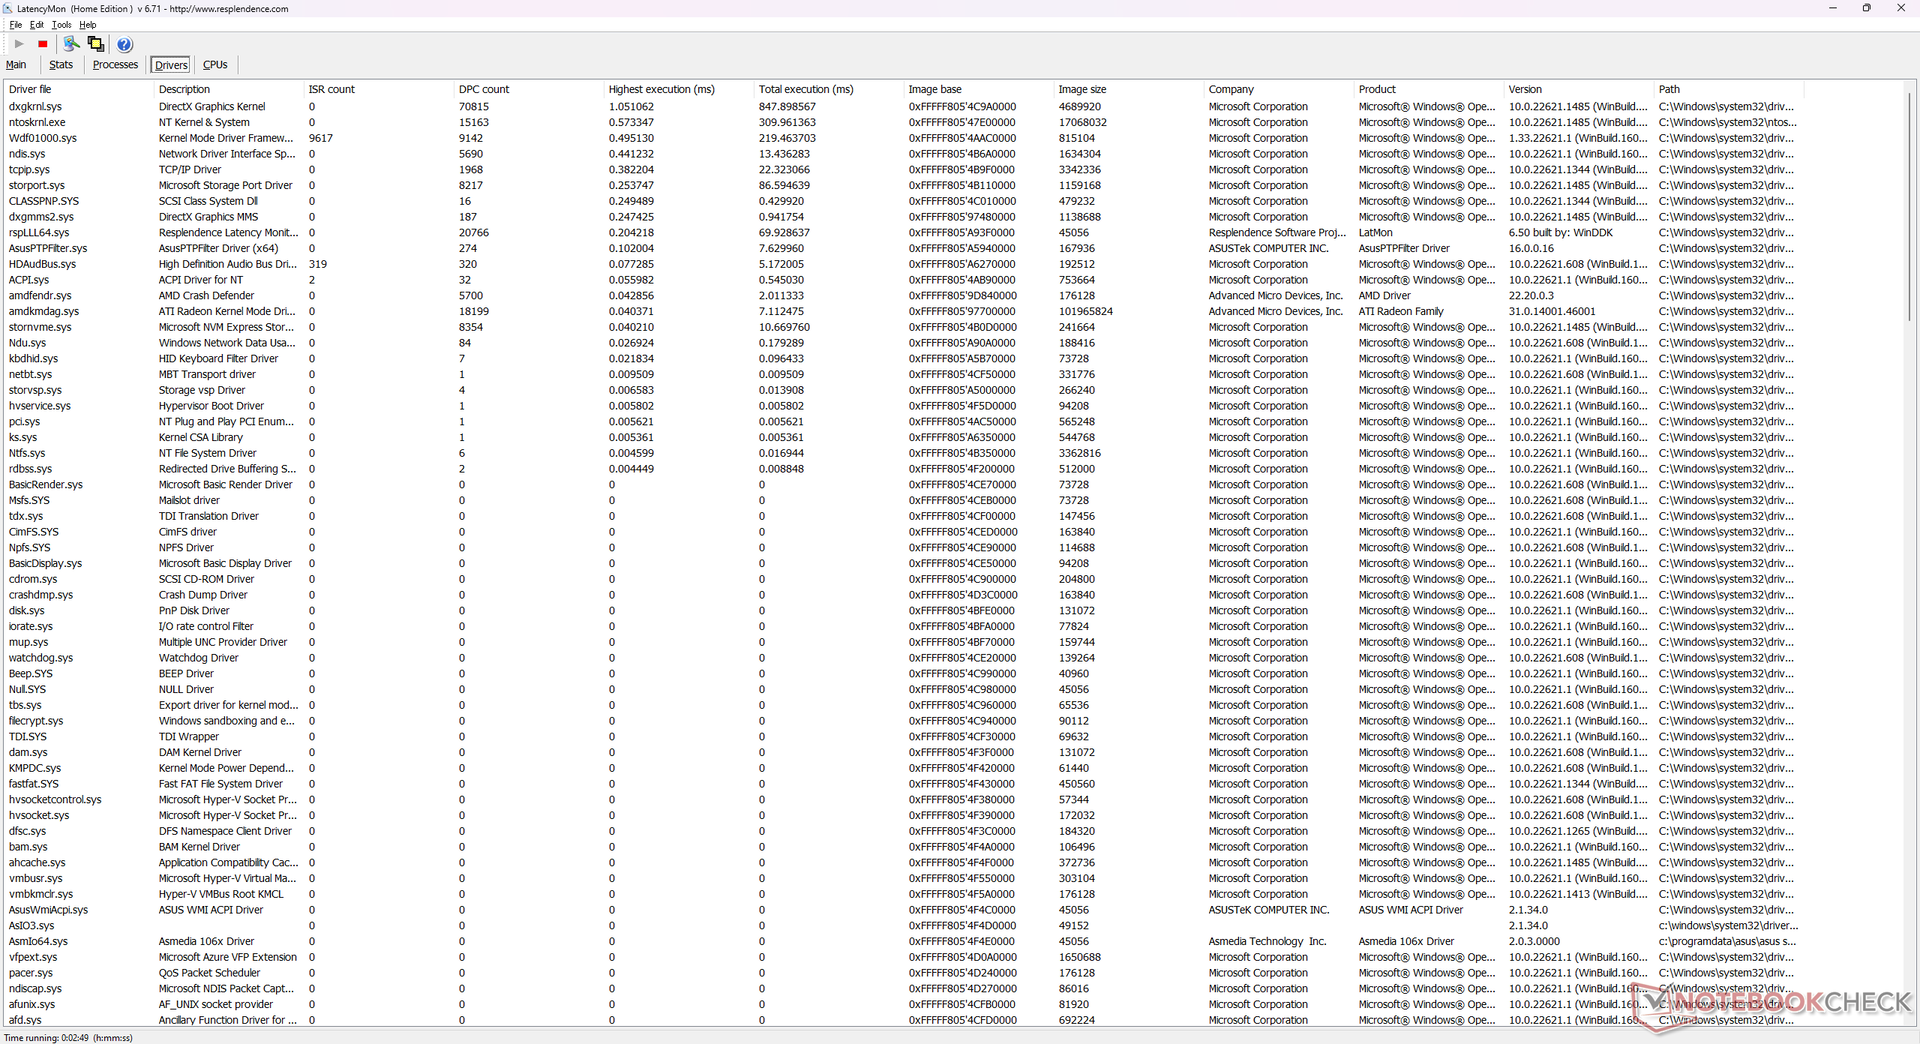
LatencyMon n'a révélé aucun problème de DPC lors de l'ouverture de plusieurs onglets de notre page d'accueil. L'exécution de Prime95, cependant, induit une latence d'interruption élevée. Nous avons pu enregistrer 2 images perdues lors de la lecture de notre vidéo de test 4K60 d'une minute.
| DPC Latencies / LatencyMon - interrupt to process latency (max), Web, Youtube, Prime95 | |
| MSI GE78HX 13VH-070US | |
| Asus ROG Strix Scar 17 SE G733CX-LL014W | |
| Asus ROG Strix Scar 17 G733PY-XS96 | |
| Asus ROG Strix G17 G713PI | |
| Alienware m17 R5 (R9 6900HX, RX 6850M XT) | |
| Eluktronics Mech-17 GP2 | |
* ... Moindre est la valeur, meilleures sont les performances
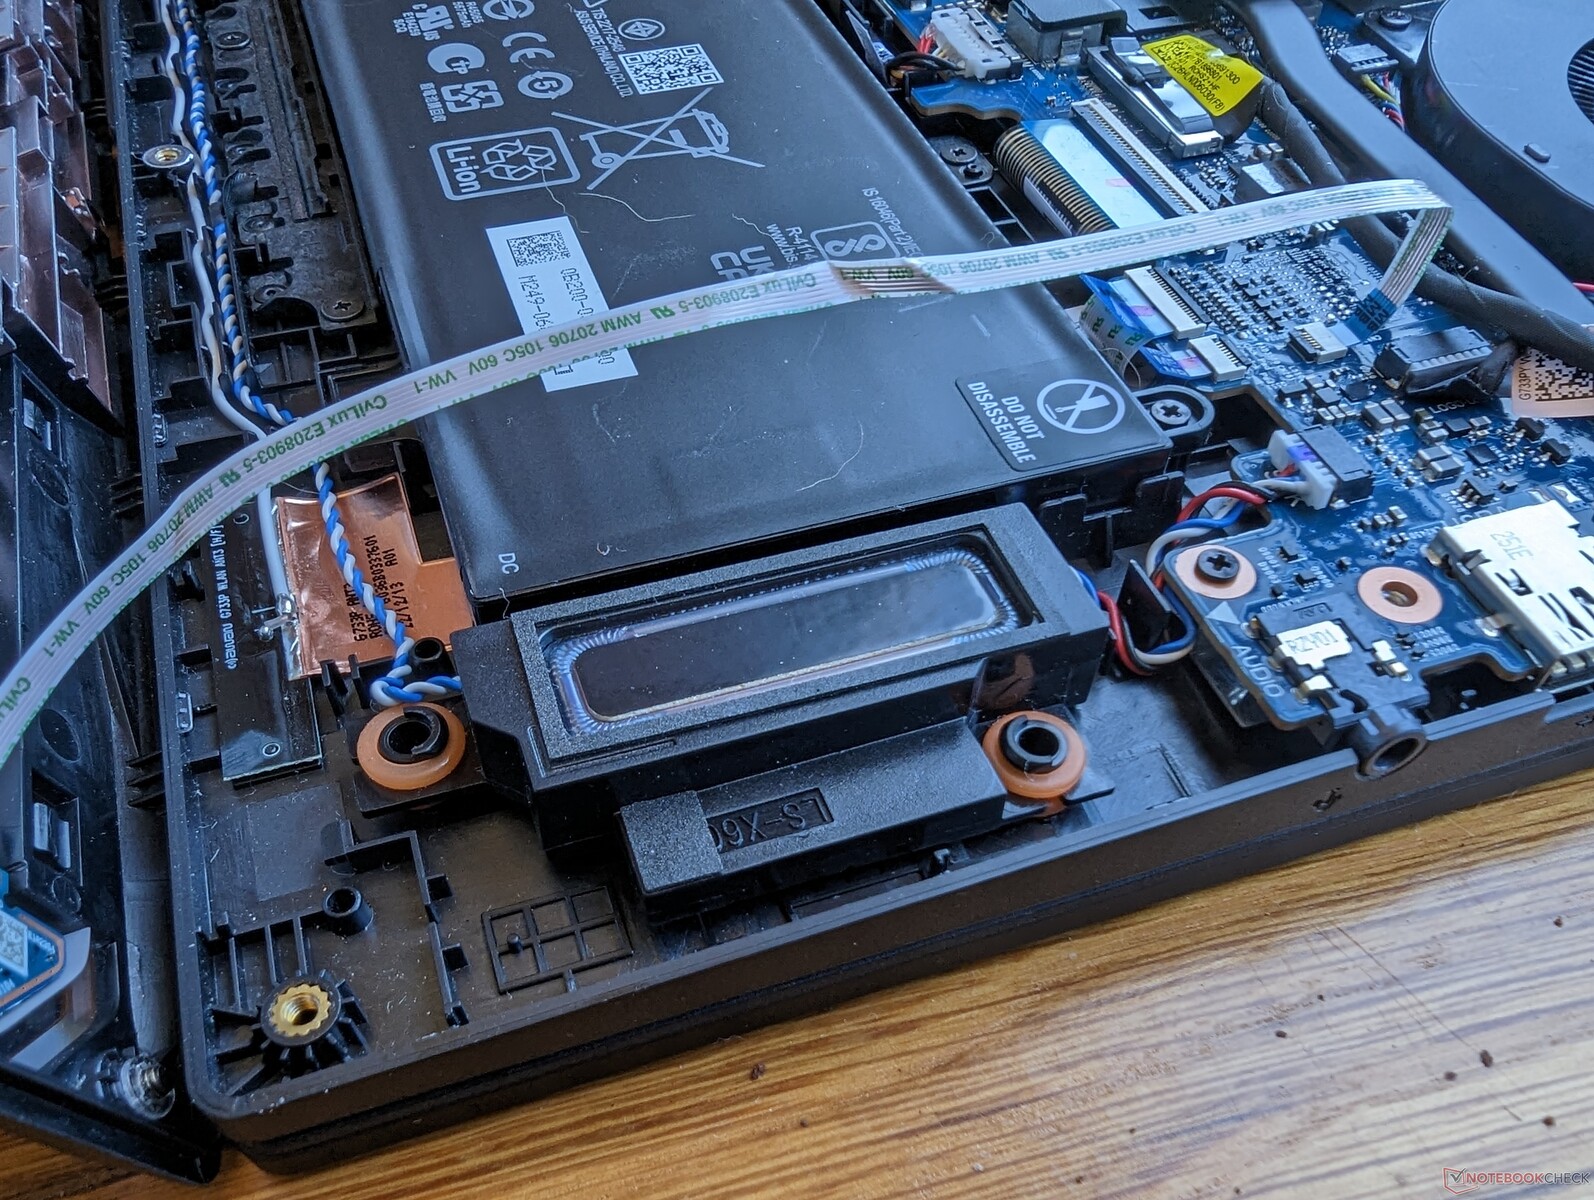
Périphériques de stockage - Throttling de performance détecté
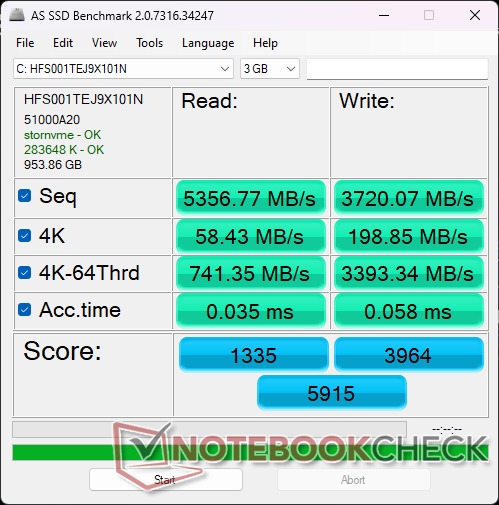
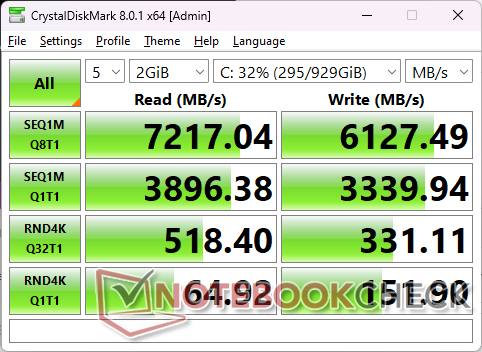
Notre unité est livrée avec un 1 TB SK hynix PC801 pour des vitesses de lecture et d'écriture séquentielles d'environ 7200 Mo/s et 6200 Mo/s, respectivement. Cependant, le disque de notre unité présentait des problèmes d'étranglement des performances après environ 4 minutes de stress, comme le montre le graphique ci-dessous. Les disques durs SSD ne sont pas équipés d'un répartiteur de chaleur ou d'un coussin thermique pour faciliter la dissipation de la chaleur.

| Drive Performance rating - Percent | |
| Aorus 17X XES | |
| MSI GE78HX 13VH-070US | |
| Asus ROG Strix Scar 17 G733PY-XS96 | |
| Eluktronics Mech-17 GP2 | |
| Alienware m17 R5 (R9 6900HX, RX 6850M XT) | |
| Asus ROG Strix G17 G713PI | |
* ... Moindre est la valeur, meilleures sont les performances
Disk Throttling: DiskSpd Read Loop, Queue Depth 8
Performance du GPU - 175 W GeForce RTX 4090
Le GeForce RTX 4090 mobile mobile offre des performances de 60 à 80 % supérieures à celles de la RTX 3080 Ti mobile de l'année dernière ROG Strix Scar 17 G733. L'écart de performance d'une année sur l'autre est donc considérable. La rétrogradation vers la RTX 4080 ou 4070 Devrait avoir un impact sur les performances du GPU de 15 à 20 % et de 40 à 50 %, respectivement. Les passionnés devraient donc éviter la RTX 4070 mobile car la baisse de performance de la RTX 4080 mobile à la RTX 4070 mobile est beaucoup plus importante que celle de la RTX 4090 mobile à la RTX 4080 mobile.
L'exécution en mode Performance au lieu du mode Turbo a un léger impact sur les performances. Un test sur Fire Strike en mode Performance entraînerait une baisse de 4 à 5 % du score graphique. Notre section Test de stress ci-dessous explore plus en détail ces deux modes.
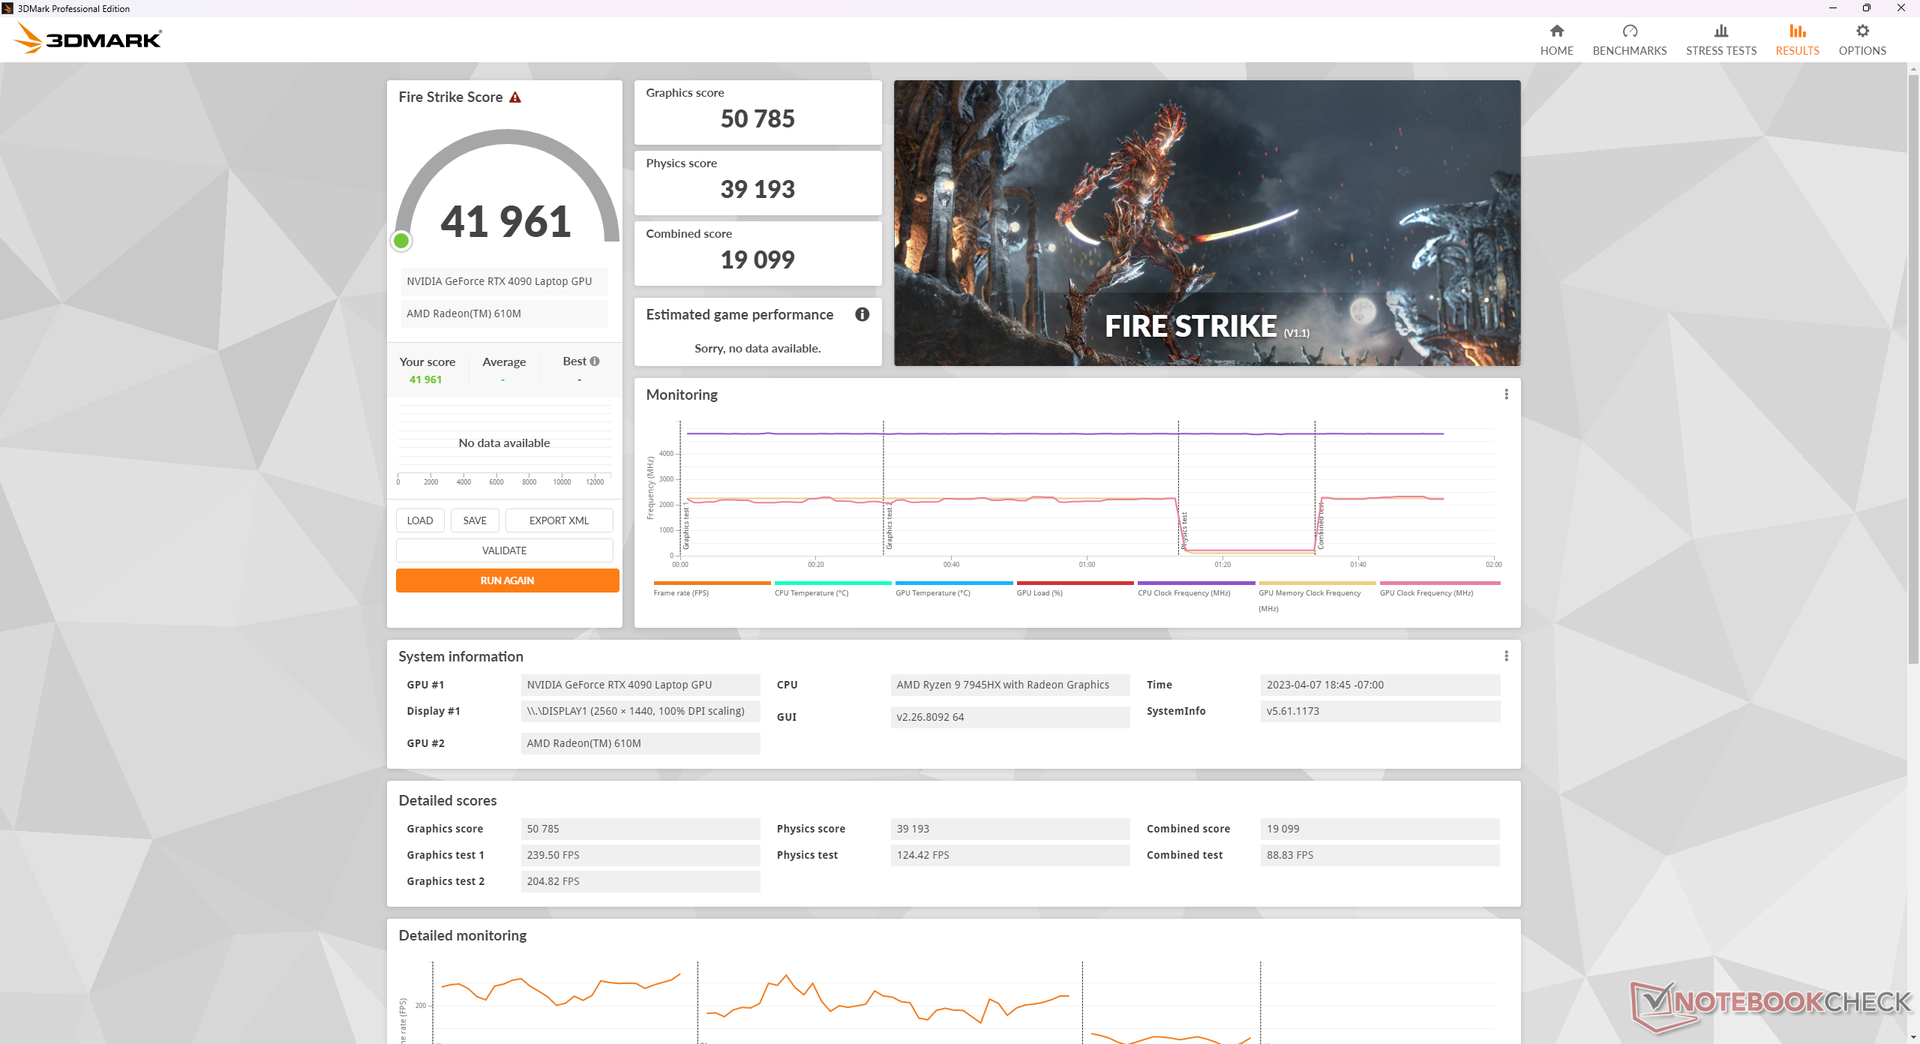

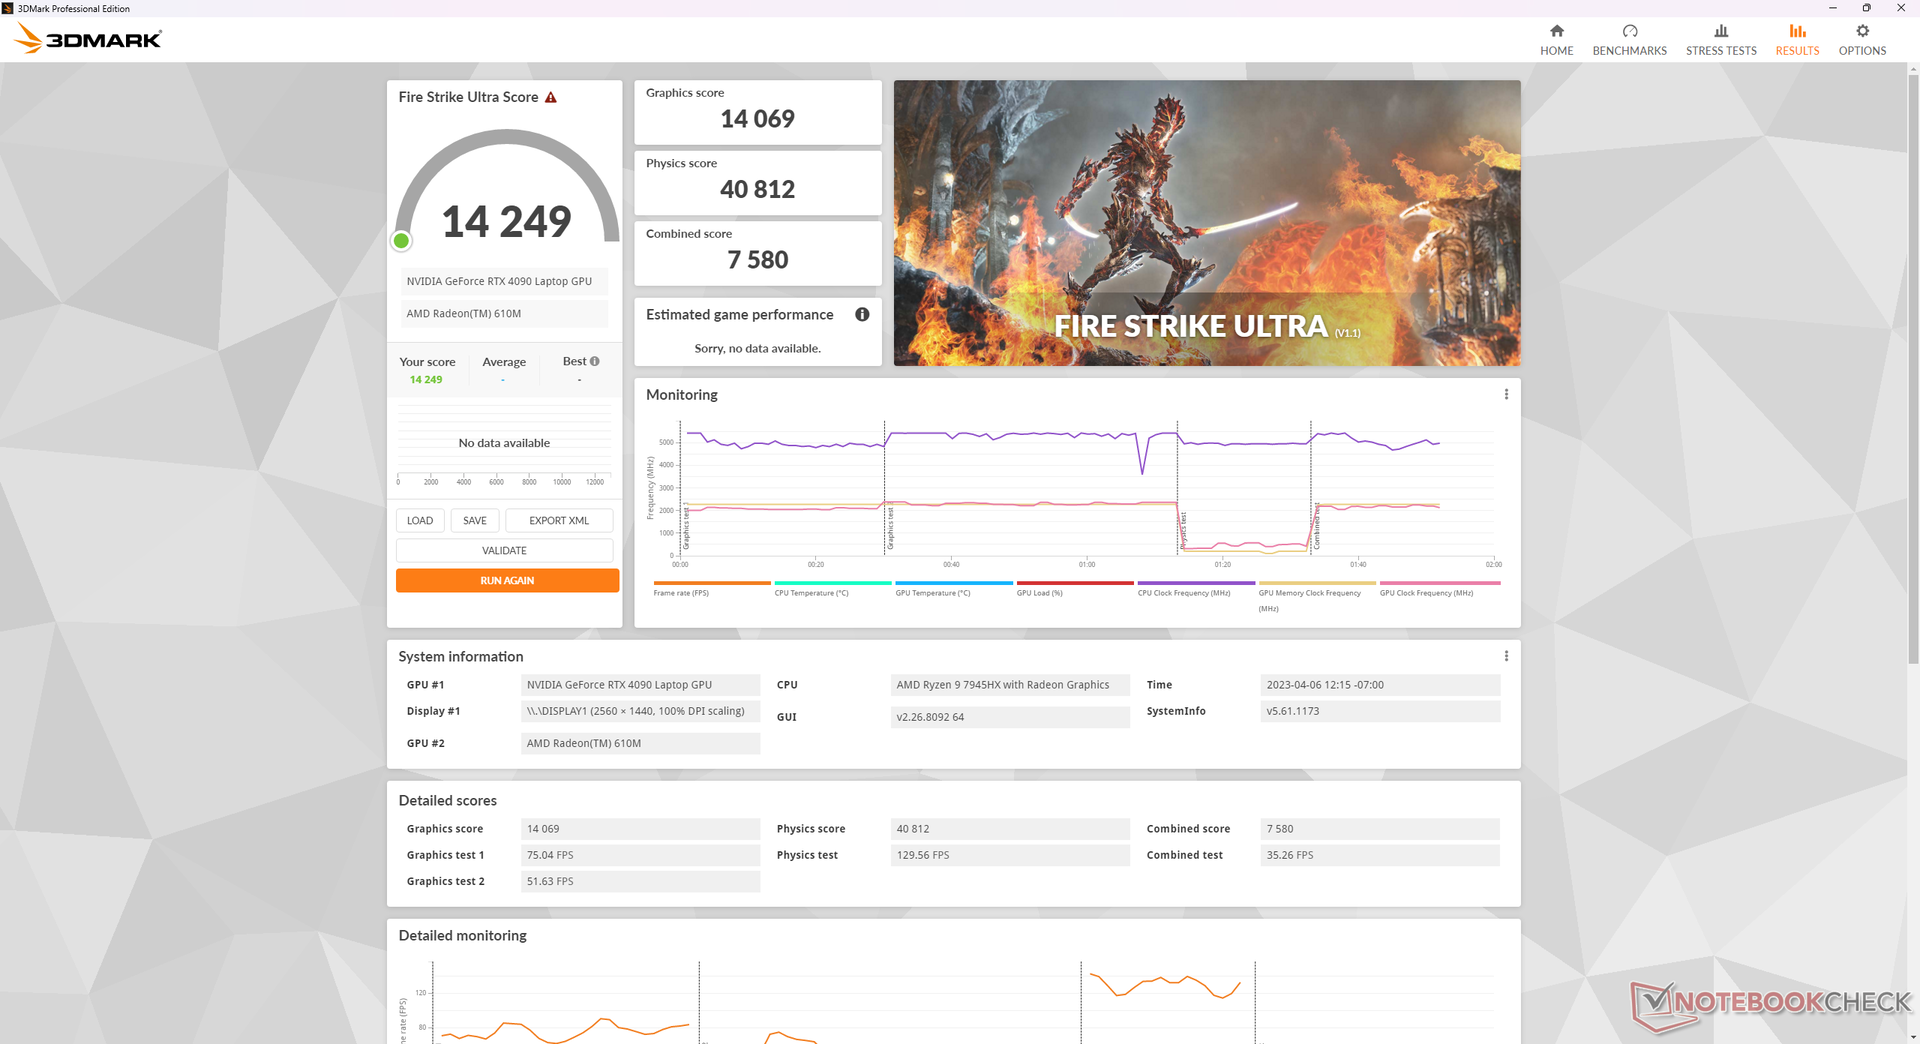
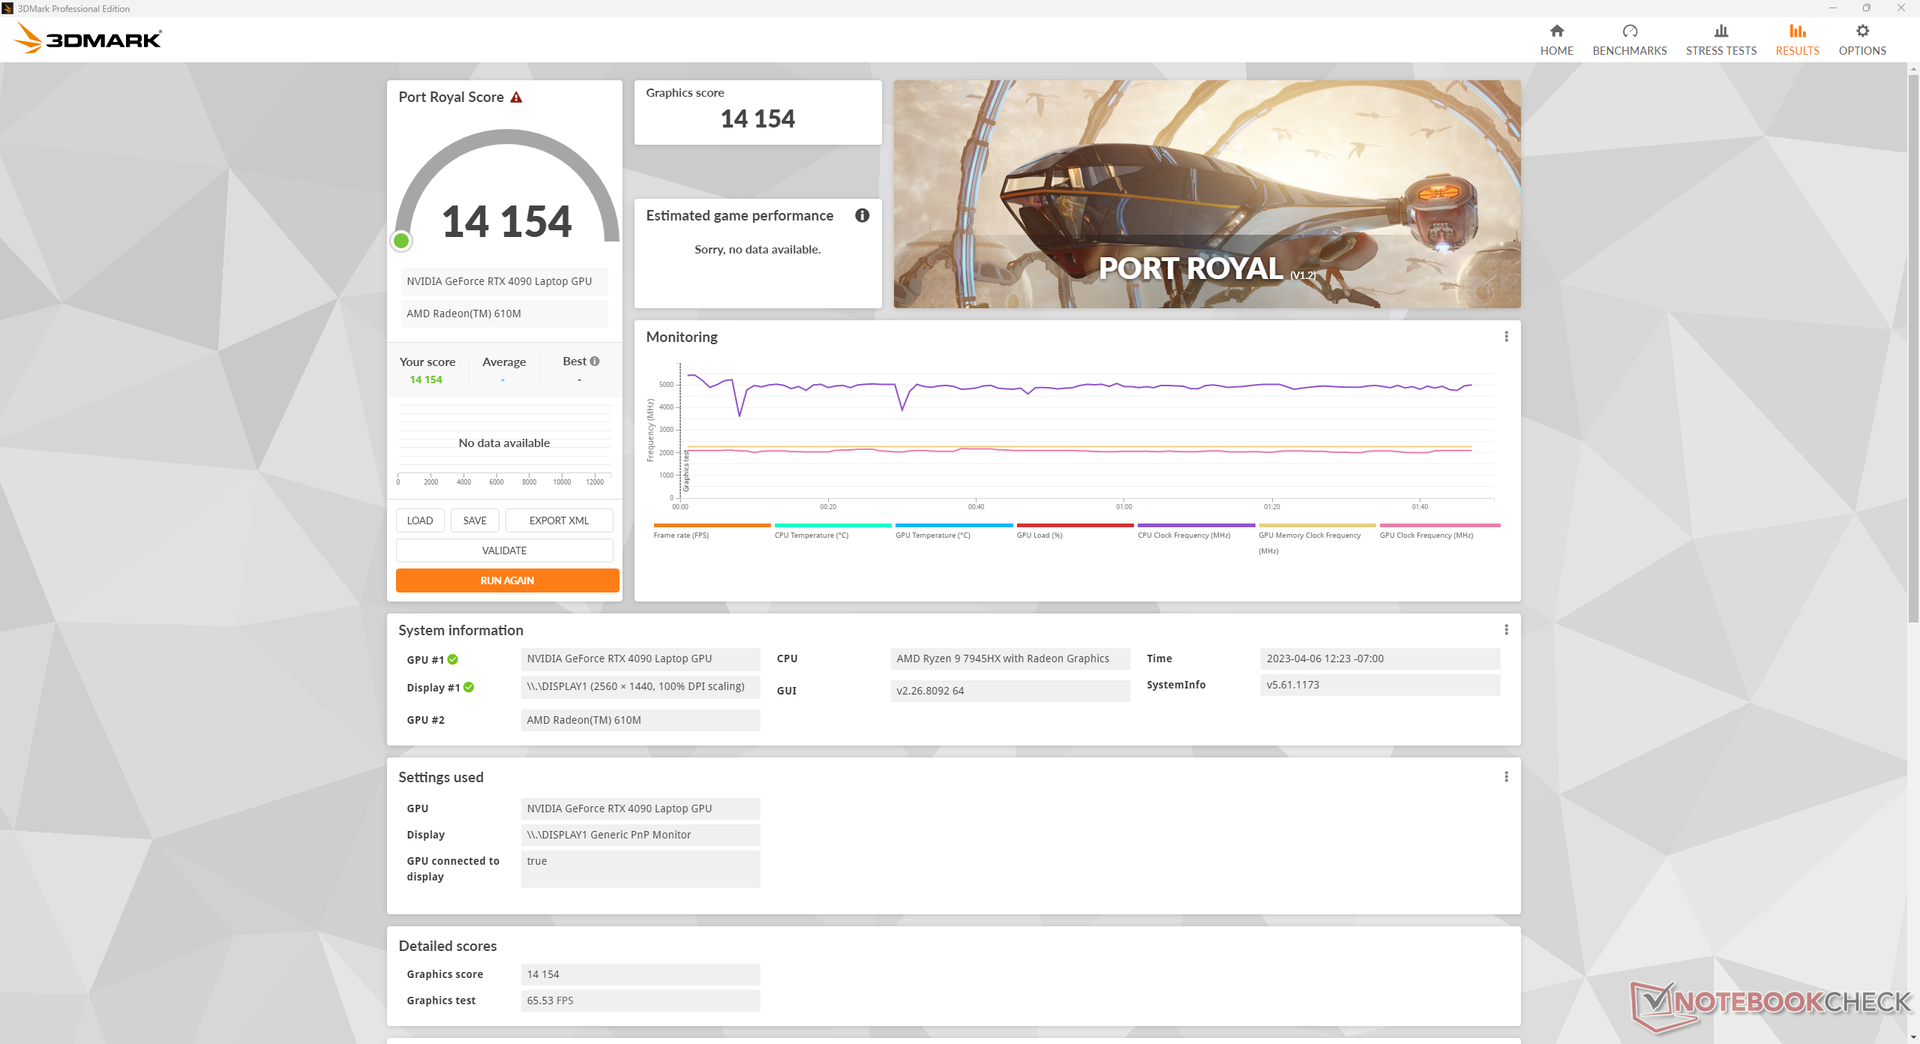
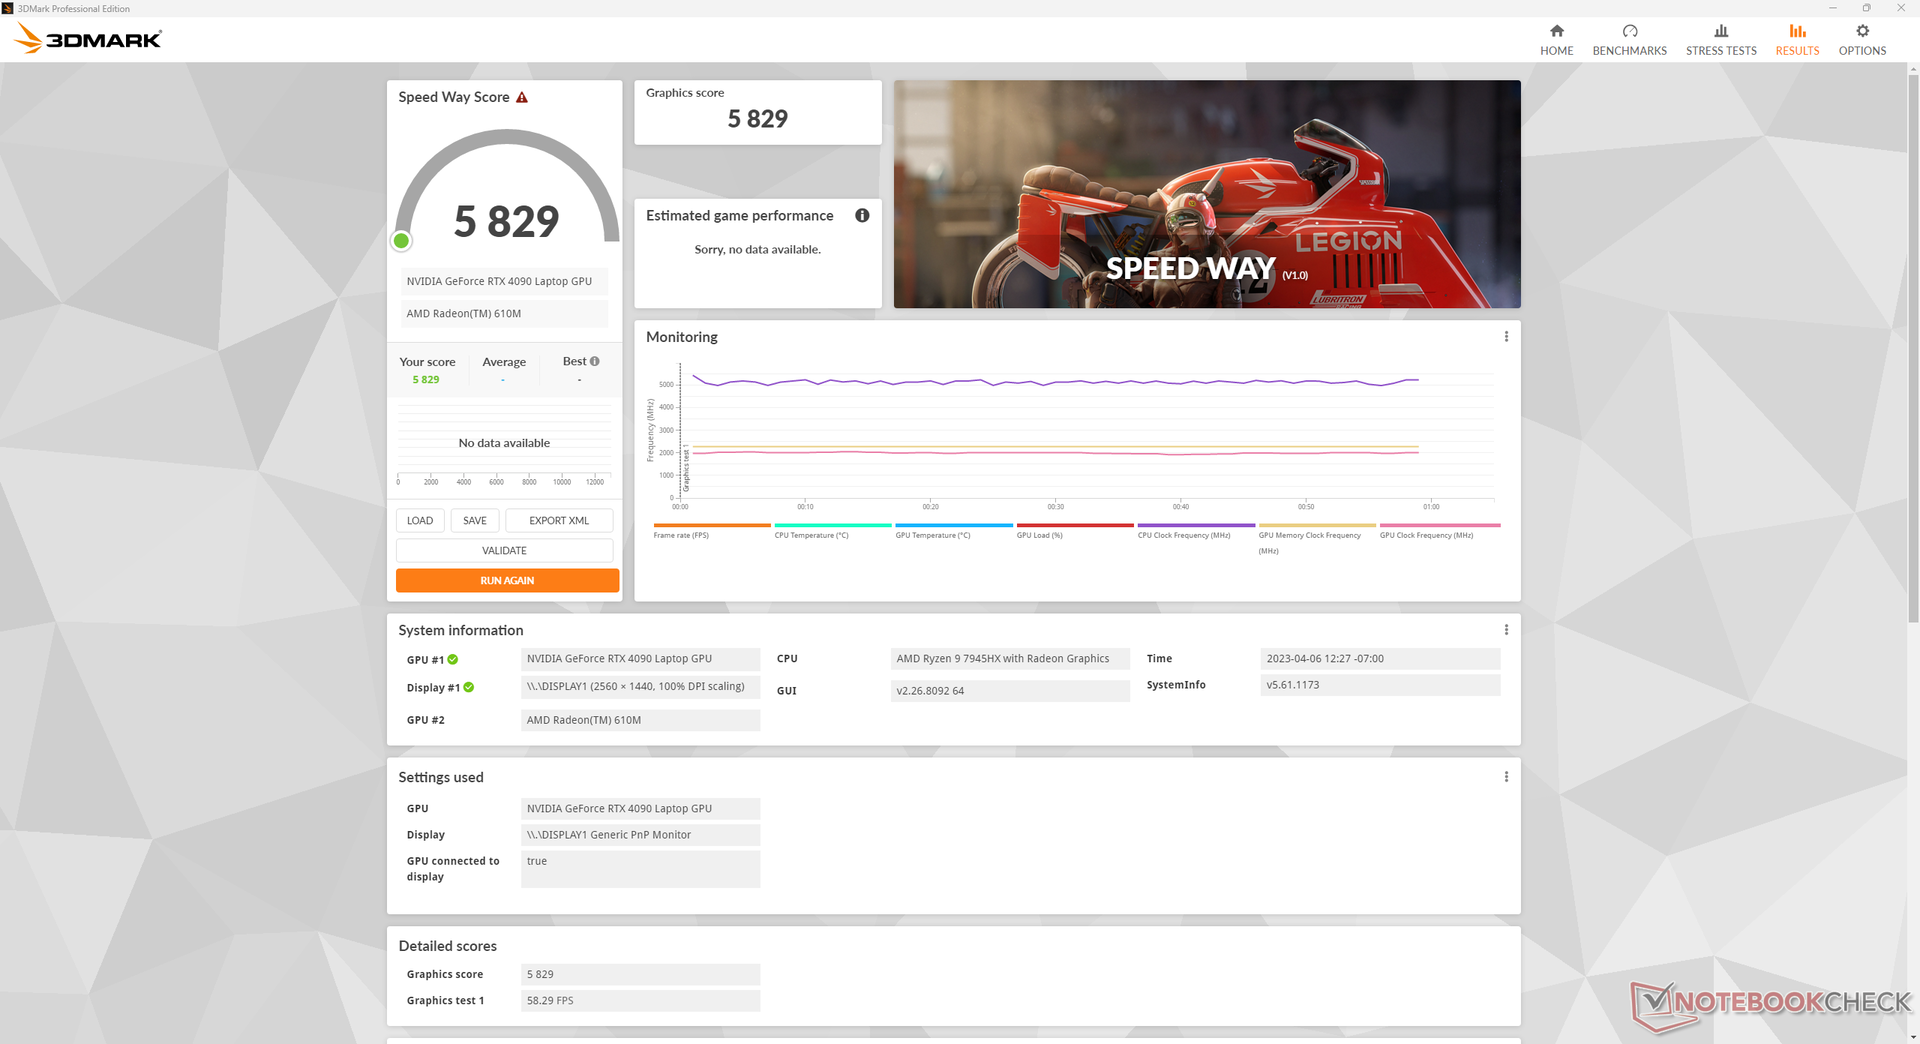
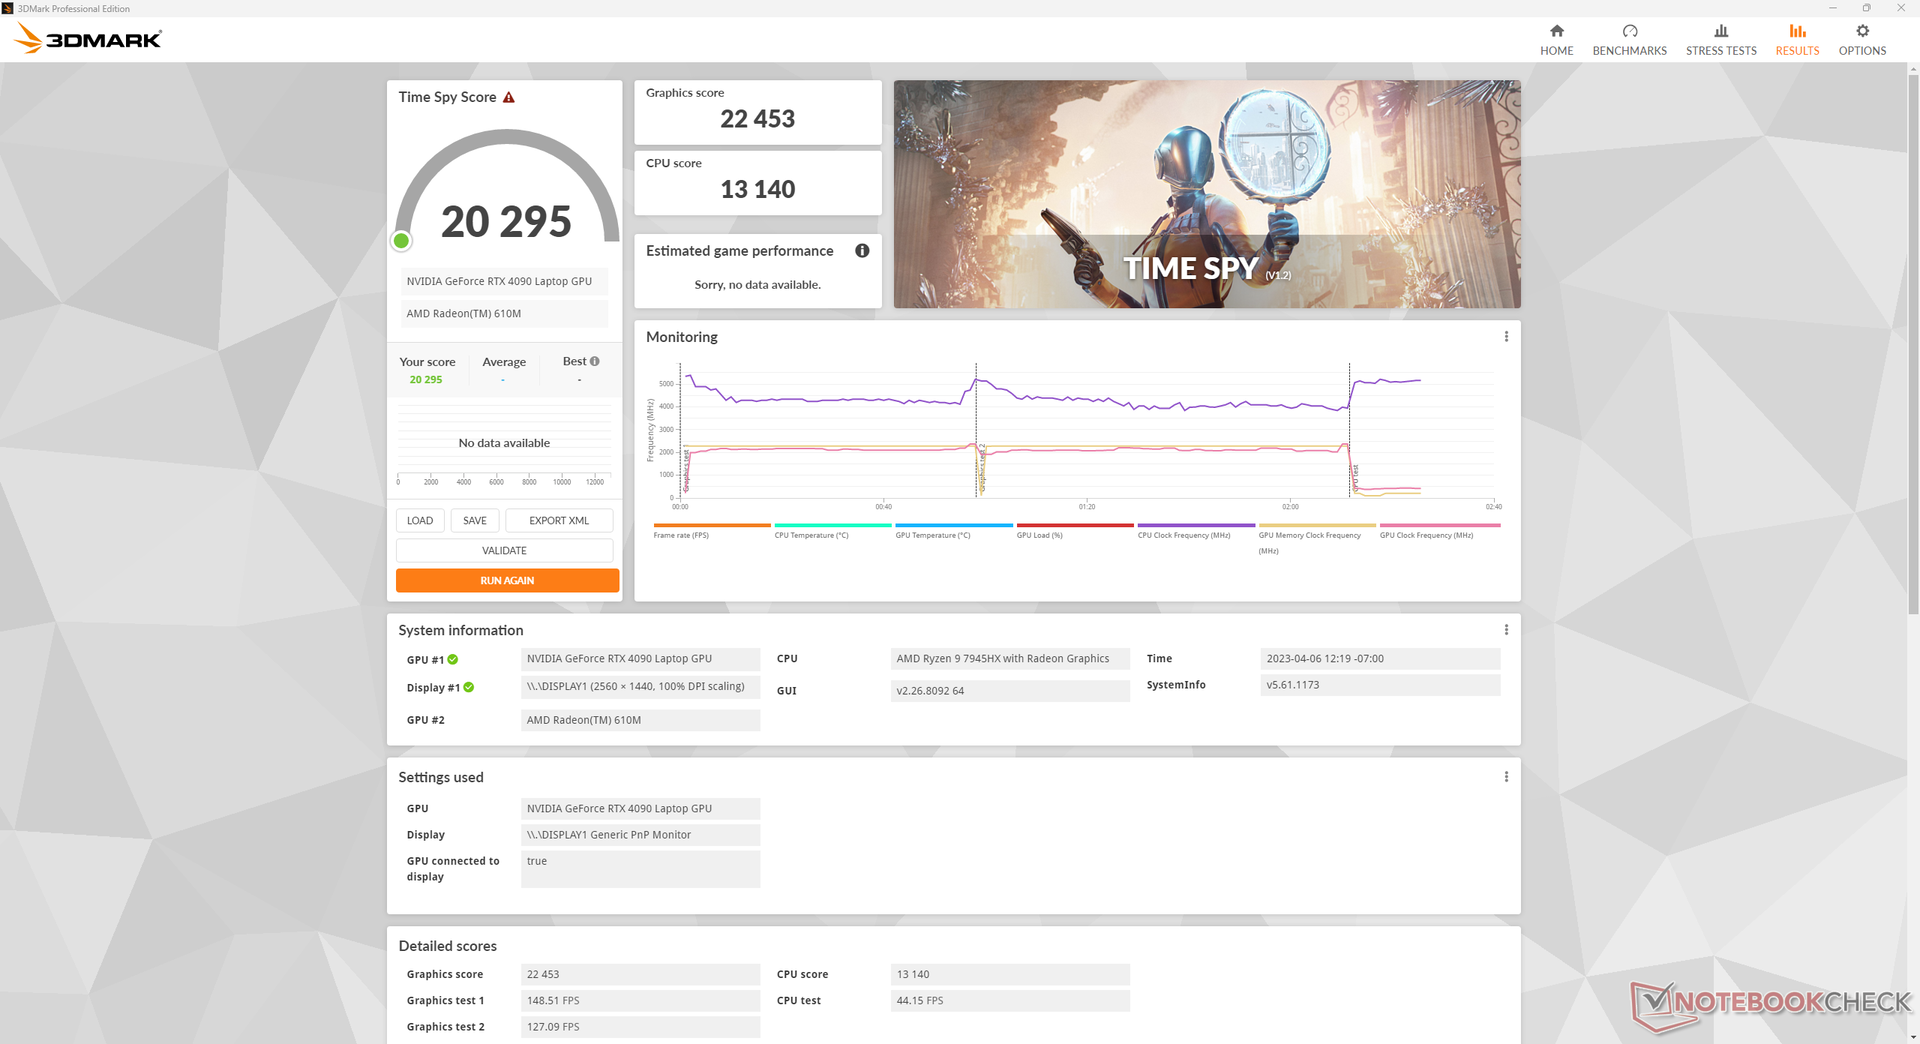
| 3DMark 11 Performance | 46484 points | |
| 3DMark Fire Strike Score | 43163 points | |
| 3DMark Time Spy Score | 20295 points | |
Aide | ||
* ... Moindre est la valeur, meilleures sont les performances
| Tiny Tina's Wonderlands | |
| 1920x1080 Low Preset (DX12) | |
| KFA2 GeForce RTX 4090 SG | |
| Moyenne NVIDIA GeForce RTX 4090 Laptop GPU (268 - 378, n=8) | |
| Asus ROG Strix Scar 17 G733PY-XS96 | |
| 1920x1080 Medium Preset (DX12) | |
| KFA2 GeForce RTX 4090 SG | |
| Moyenne NVIDIA GeForce RTX 4090 Laptop GPU (230 - 302, n=8) | |
| Asus ROG Strix Scar 17 G733PY-XS96 | |
| 1920x1080 High Preset (DX12) | |
| KFA2 GeForce RTX 4090 SG | |
| Moyenne NVIDIA GeForce RTX 4090 Laptop GPU (168 - 233, n=9) | |
| Asus ROG Strix Scar 17 G733PY-XS96 | |
| 1920x1080 Badass Preset (DX12) | |
| KFA2 GeForce RTX 4090 SG | |
| Asus ROG Strix Scar 17 G733PY-XS96 | |
| Moyenne NVIDIA GeForce RTX 4090 Laptop GPU (141.1 - 189.4, n=14) | |
| 2560x1440 Badass Preset (DX12) | |
| KFA2 GeForce RTX 4090 SG | |
| Asus ROG Strix Scar 17 G733PY-XS96 | |
| Moyenne NVIDIA GeForce RTX 4090 Laptop GPU (103.4 - 137.8, n=14) | |
| 3840x2160 Badass Preset (DX12) | |
| KFA2 GeForce RTX 4090 SG | |
| Asus ROG Strix Scar 17 G733PY-XS96 | |
| Moyenne NVIDIA GeForce RTX 4090 Laptop GPU (53.3 - 73.7, n=12) | |
Witcher 3 FPS Chart
| Bas | Moyen | Élevé | Ultra | QHD DLSS | QHD FSR | QHD | 4K DLSS | 4K FSR | 4K | |
|---|---|---|---|---|---|---|---|---|---|---|
| GTA V (2015) | 185 | 180.4 | 175.2 | 112.6 | 114.8 | 170.5 | ||||
| The Witcher 3 (2015) | 490.1 | 405.6 | 370.3 | 203.8 | 154.8 | |||||
| Dota 2 Reborn (2015) | 165.6 | 150.5 | 154.2 | 139 | 135.4 | |||||
| Final Fantasy XV Benchmark (2018) | 214 | 205 | 163.9 | 151 | 93.3 | |||||
| X-Plane 11.11 (2018) | 132.2 | 118 | 94.3 | 78.5 | ||||||
| Far Cry 5 (2018) | 157 | 145 | 142 | 108 | ||||||
| Shadow of the Tomb Raider (2018) | 238 | 228 | 190 | 104 | ||||||
| Borderlands 3 (2019) | 121.4 | |||||||||
| Doom Eternal (2020) | 441 | 362 | 200 | |||||||
| Valorant (2020) | 485 | |||||||||
| Assassin´s Creed Valhalla (2020) | 187 | 169 | 135 | 79 | ||||||
| Far Cry 6 (2021) | 117 | 112 | 109 | 82 | ||||||
| Cyberpunk 2077 1.6 (2022) | 146.4 | 140.5 | 132.6 | 133.8 | 104.3 | 48.6 | ||||
| Tiny Tina's Wonderlands (2022) | 267.7 | 230 | 194.6 | 176.2 | 134.2 | 71.9 | ||||
| F1 22 (2022) | 266 | 243 | 221 | 116.3 | 92.1 | 45.8 | ||||
| Call of Duty Modern Warfare 2 2022 (2022) | 188 | 180 | 135 | 82 | ||||||
| Star Wars Jedi Survivor (2023) | 105.6 | 103.1 | 88.4 | 43 | ||||||
| Black Myth: Wukong (2024) | 153 | 117 | 93 | 41 | 43 | 24 | ||||
| Final Fantasy XVI (2024) | 91.6 | 71.2 | 77.5 | |||||||
| God of War Ragnarök (2024) | 138 | 127.1 | 113.9 | 82.8 | ||||||
| Call of Duty Black Ops 6 (2024) | 130 | 126 | 92 | 76 | 72 | 76 | ||||
| Stalker 2 (2024) | 64.2 | 113.2 | 58.6 | 78.2 | 38.9 | |||||
| Marvel Rivals (2024) | 146 | 122 | 101 | 90 | 71 | |||||
| Kingdom Come Deliverance 2 (2025) | 112.5 | 110.4 | 86.7 | 70.8 | 48.4 | |||||
| Monster Hunter Wilds (2025) | 89.2 | 84.7 | 78.1 | 74.7 | 66.6 | 58 | 42.8 | |||
| Civilization 7 (2025) | 161.3 | 155.4 | 154.9 | |||||||
| The Elder Scrolls IV Oblivion Remastered (2025) | 56.8 | 53.7 | 43.1 | 26.4 | ||||||
| Doom: The Dark Ages (2025) | 123.4 | 115 | 105.5 | 95.2 | 95.3 | 73.1 | 57.1 | 39.7 | ||
| F1 25 (2025) | 227 | 216 | 203 | 53.8 | 57.8 | 32.4 | 28.8 | 15 | ||
| Borderlands 4 (2025) | 83.2 | 70 | 54.8 | 37.9 | ||||||
| Battlefield 6 (2025) | 126.8 | 113.7 | 89.9 | 50.9 | ||||||
| The Outer Worlds 2 (2025) | 77.2 | 41.8 | 51.5 | 27.2 | ||||||
| ARC Raiders (2025) | 226 | 205 | 196.7 | 116.5 | 87.7 | 50 | ||||
| Anno 117: Pax Romana (2025) | 96.4 | 59.9 | 59 | 44.4 | 25.9 | |||||
| Call of Duty Black Ops 7 (2025) | 76 | 52 | 27 | |||||||
| Resident Evil Requiem (2026) | 72.4 | 55.6 | 28.3 | |||||||
| Death Stranding 2 (2026) | 88.5 | 82.6 | 68.1 | 63.4 | 42.4 | |||||
| Crimson Desert (2026) | 73.3 | 68.1 | 57.3 | 51.1 | 43.1 | |||||
| Pragmata (2026) | 110.7 | 104.6 | 85.5 | 82.6 | 58.6 | |||||
| War Thunder (2026) | 123 | 85 | 50 | |||||||
| Forza Horizon 6 (2026) | 94 | 61 | 50 | 31 | ||||||
| 007 First Light (2026) | 75.8 | 79.4 | 67.3 | 63.4 | 35.7 |
Émissions - Performance plus silencieuse que le turbo
Bruit du système
Le bruit des ventilateurs est toujours présent, entre 23 et 27 dB(A) sur un fond silencieux de 22,7 dB(A), quel que soit le réglage des performances. Heureusement, cette plage est suffisamment silencieuse pour passer inaperçue et les ventilateurs font un bon travail en restant en dessous de 30 dB(A) lors de l'exécution de charges légèrement plus élevées comme la navigation Web ou le streaming.
Les jeux en mode Performance sont plus silencieux qu'en mode Turbo. Le bruit du ventilateur en mode Witcher 3 le bruit du ventilateur en mode Performance est d'environ 46,4 dB(A) contre 51,4 à 54 dB(A) en mode Turbo. Par conséquent, les utilisateurs peuvent vouloir compenser le déficit de 5 % des performances graphiques par les niveaux de bruit plus faibles du mode Performance.
Degré de la nuisance sonore
| Au repos |
| 23.5 / 27.7 / 27.7 dB(A) |
| Fortement sollicité |
| 30.5 / 54.1 dB(A) |
 | ||
30 dB silencieux 40 dB(A) audible 50 dB(A) bruyant |
||
min: | ||
| Asus ROG Strix Scar 17 G733PY-XS96 GeForce RTX 4090 Laptop GPU, R9 7945HX, SK hynix PC801 HFS001TEJ9X101N | MSI GE78HX 13VH-070US GeForce RTX 4080 Laptop GPU, i9-13950HX, Samsung PM9A1 MZVL22T0HBLB | Eluktronics Mech-17 GP2 GeForce RTX 4090 Laptop GPU, i9-13900HX, Samsung PM9A1 MZVL21T0HCLR | Asus ROG Strix G17 G713PI GeForce RTX 4070 Laptop GPU, R9 7945HX, WD PC SN560 SDDPNQE-1T00 | Aorus 17X XES GeForce RTX 3070 Ti Laptop GPU, i9-12900HX, Gigabyte AG470S1TB-SI B10 | Alienware m17 R5 (R9 6900HX, RX 6850M XT) Radeon RX 6850M XT, R9 6900HX, SSSTC CA6-8D1024 | |
|---|---|---|---|---|---|---|
| Noise | -10% | -10% | -9% | -24% | 1% | |
| arrêt / environnement * (dB) | 22.7 | 23.4 -3% | 25.2 -11% | 25 -10% | 26 -15% | 23 -1% |
| Idle Minimum * (dB) | 23.5 | 24.2 -3% | 28 -19% | 26 -11% | 28 -19% | 23 2% |
| Idle Average * (dB) | 27.7 | 25.6 8% | 28 -1% | 29 -5% | 32 -16% | 28.11 -1% |
| Idle Maximum * (dB) | 27.7 | 31 -12% | 30.4 -10% | 30 -8% | 38 -37% | 28.11 -1% |
| Load Average * (dB) | 30.5 | 43.3 -42% | 41 -34% | 46 -51% | 53 -74% | 30.62 -0% |
| Witcher 3 ultra * (dB) | 51.4 | 56.3 -10% | 50.7 1% | 46 11% | 54 -5% | 49.75 3% |
| Load Maximum * (dB) | 54.1 | 59.1 -9% | 52.6 3% | 47 13% | 55 -2% | 50.17 7% |
* ... Moindre est la valeur, meilleures sont les performances
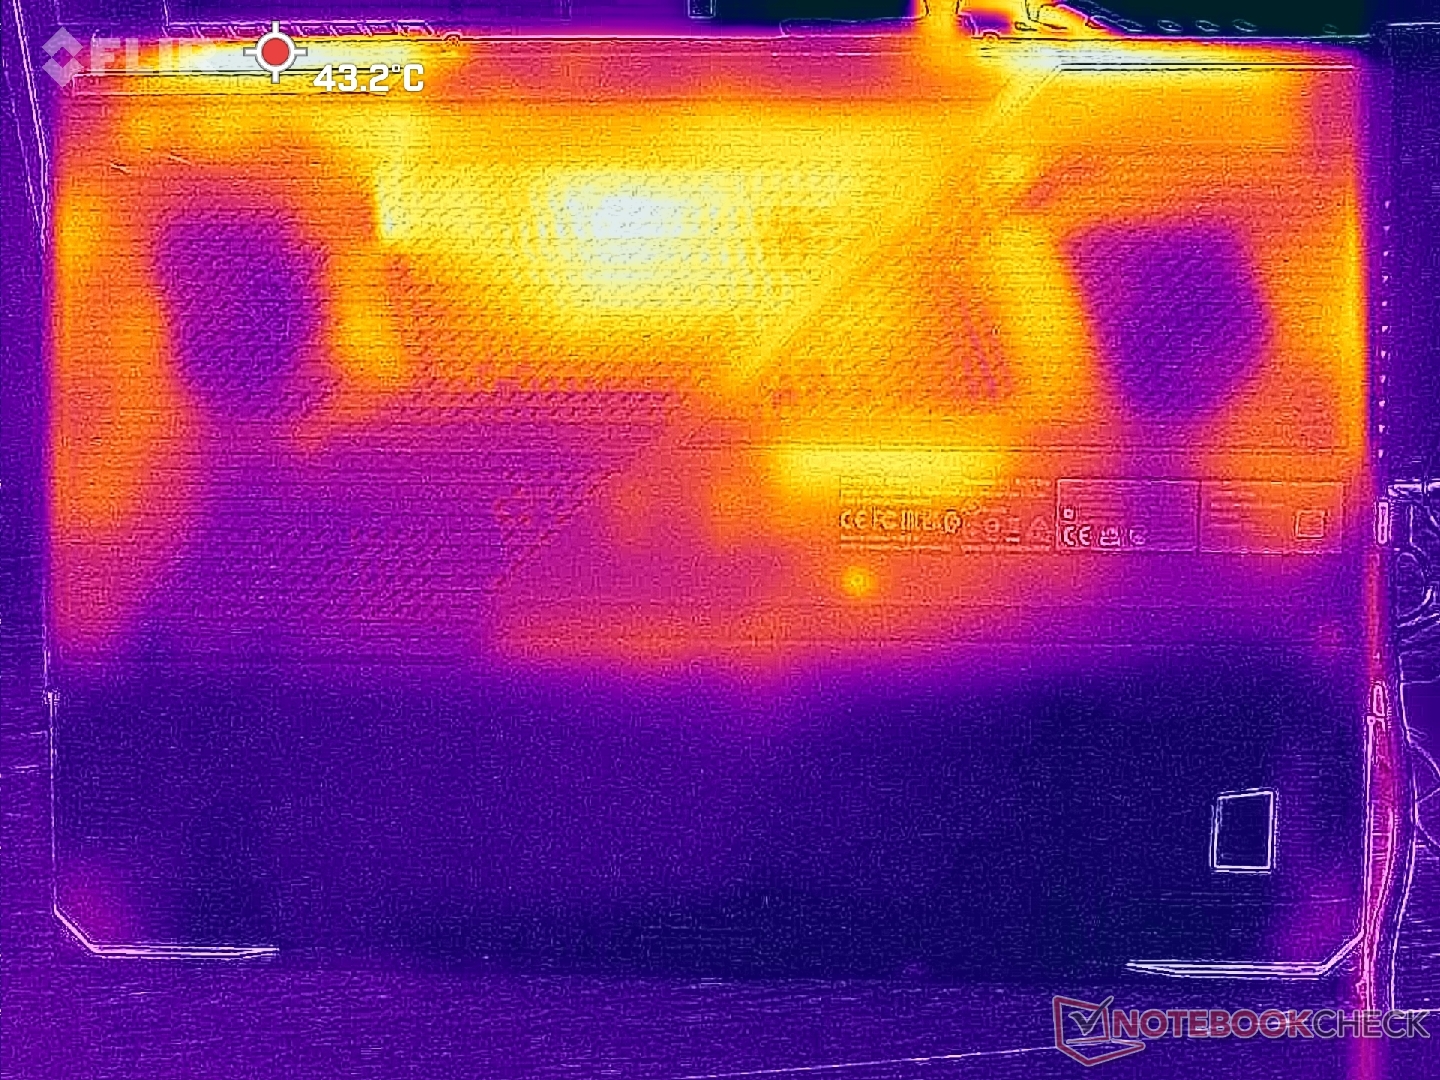
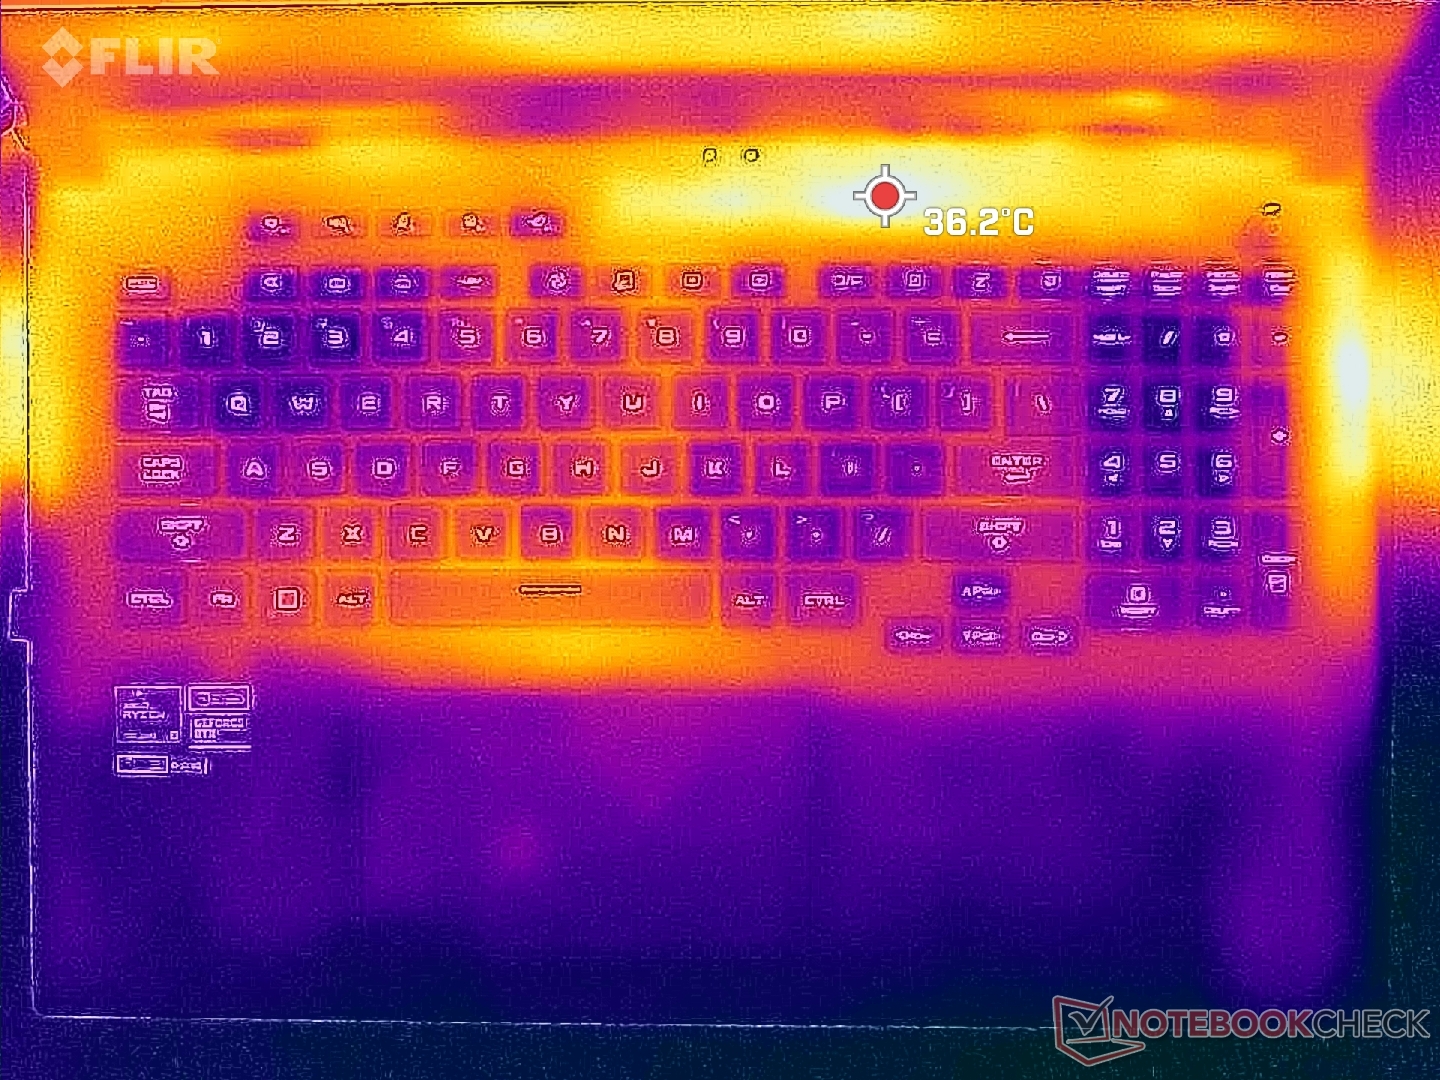
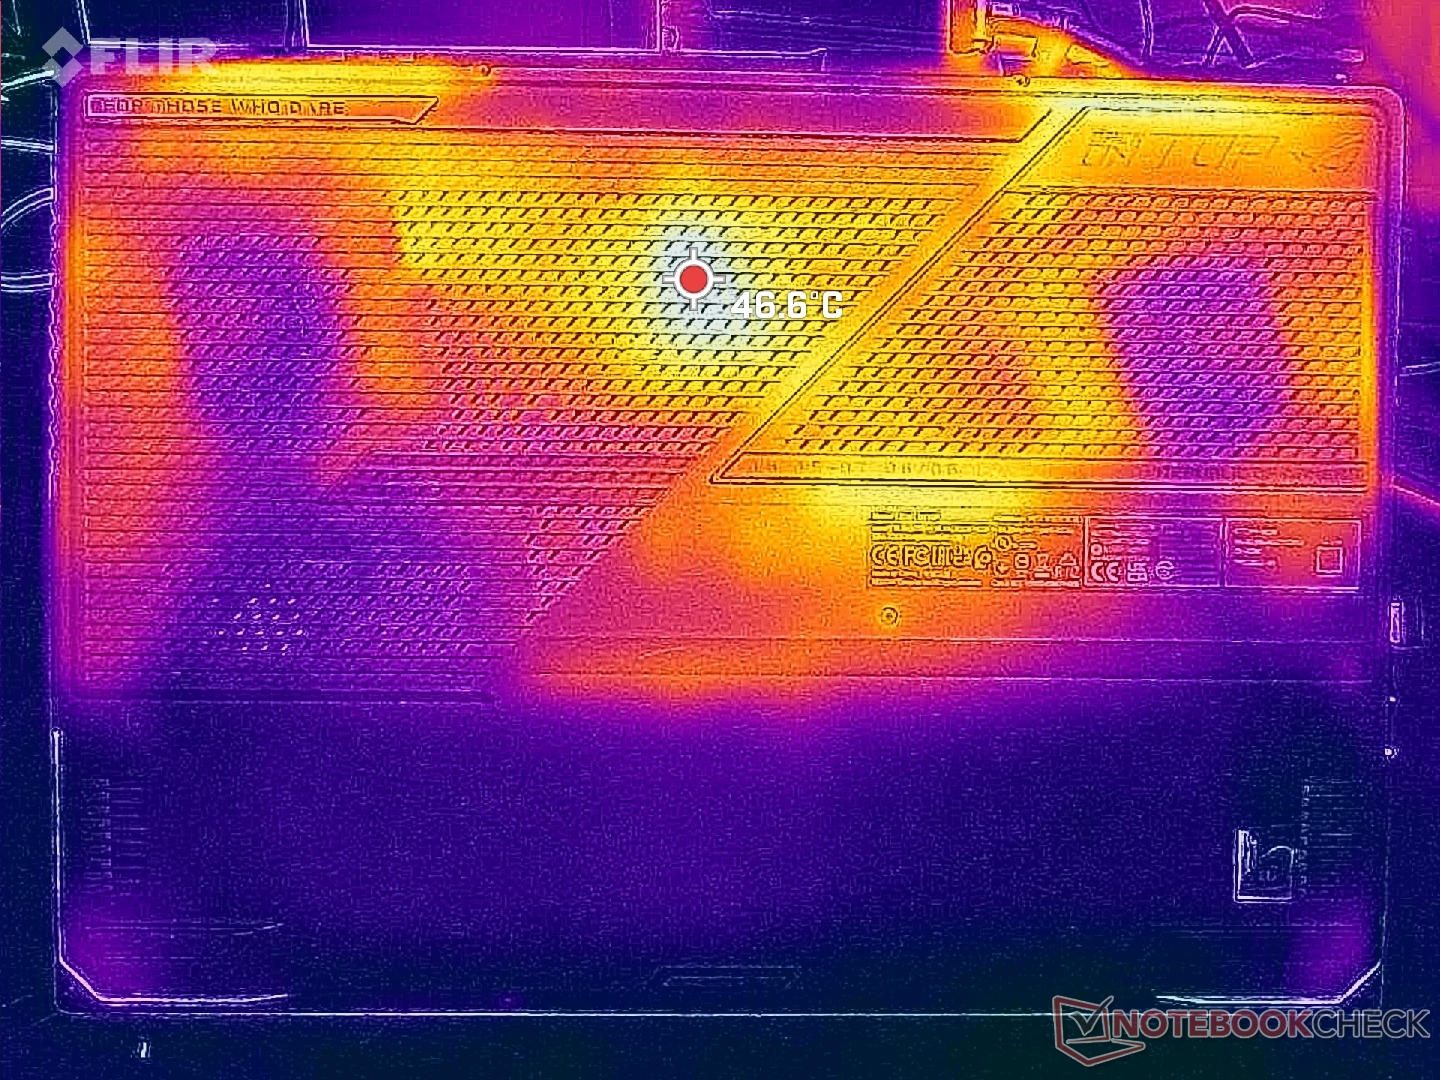
Température
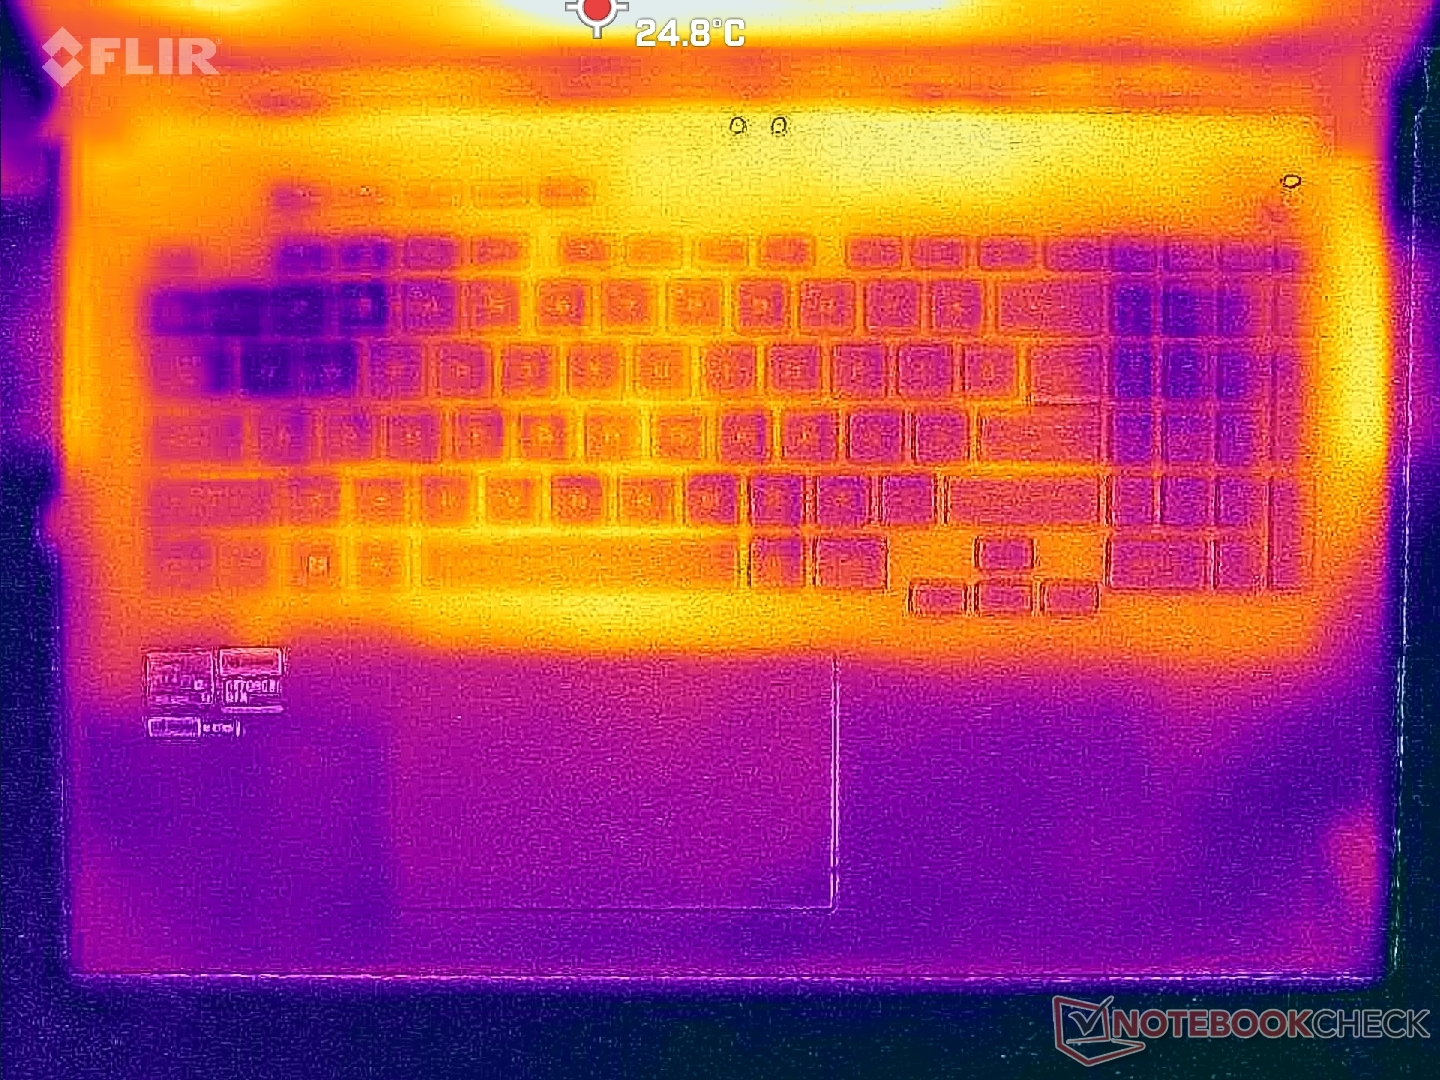
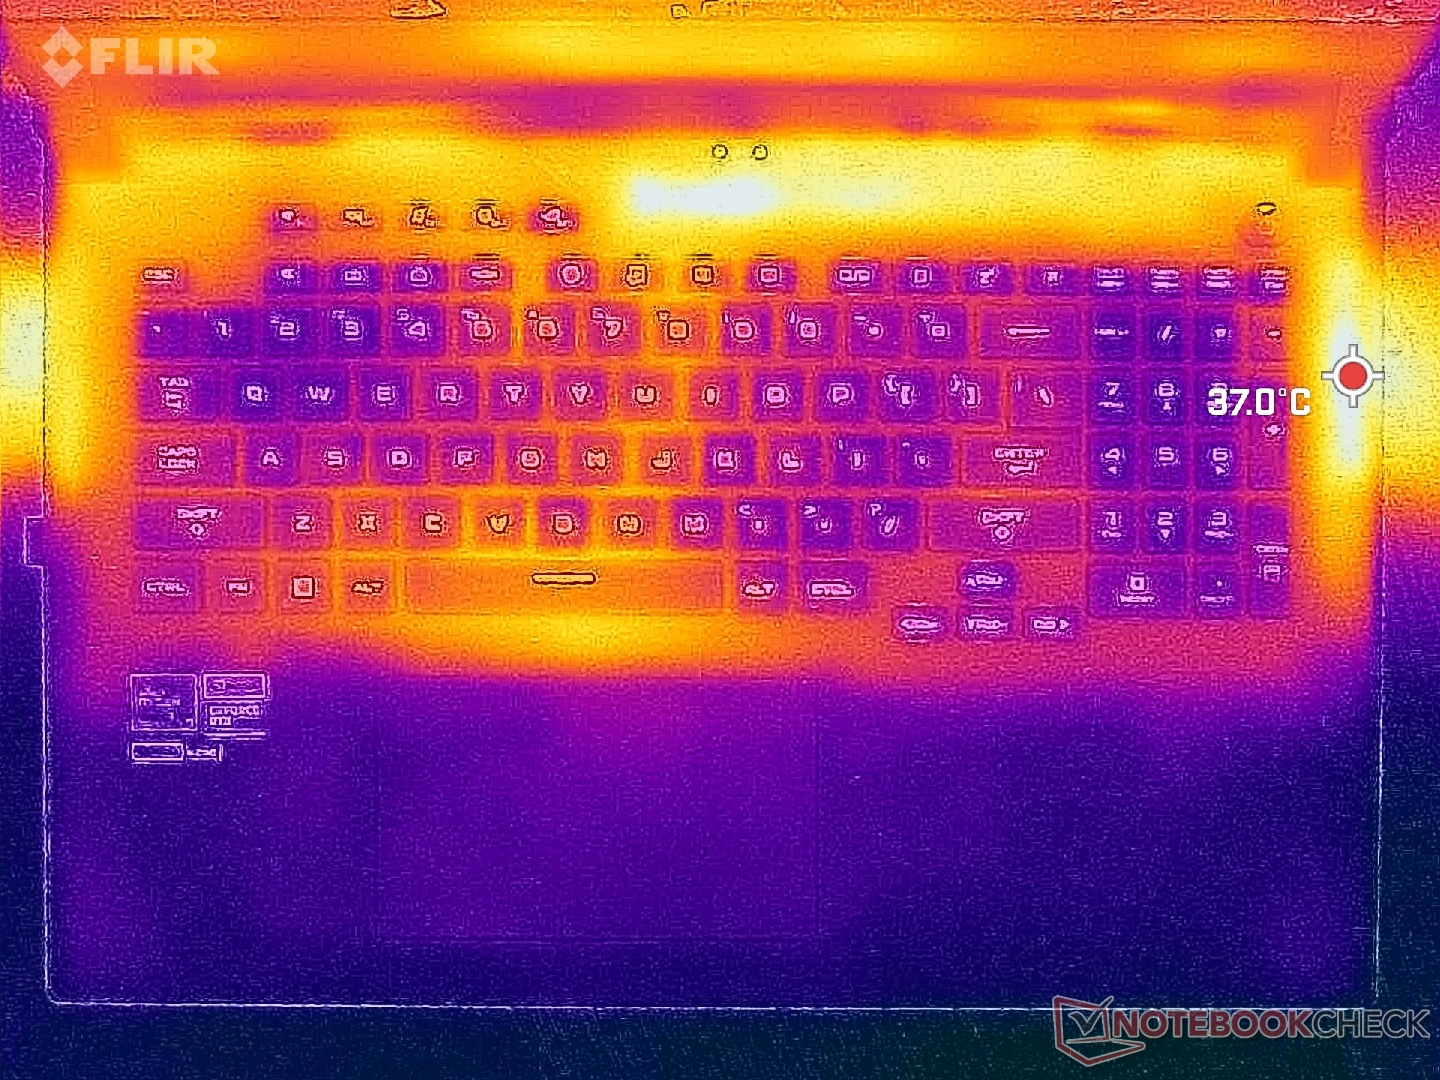
La majeure partie du clavier et des repose-paumes reste froide pendant le jeu. Les points chauds se situent plutôt sur les bords de la plate-forme, là où les doigts ont le moins de chance de se toucher.
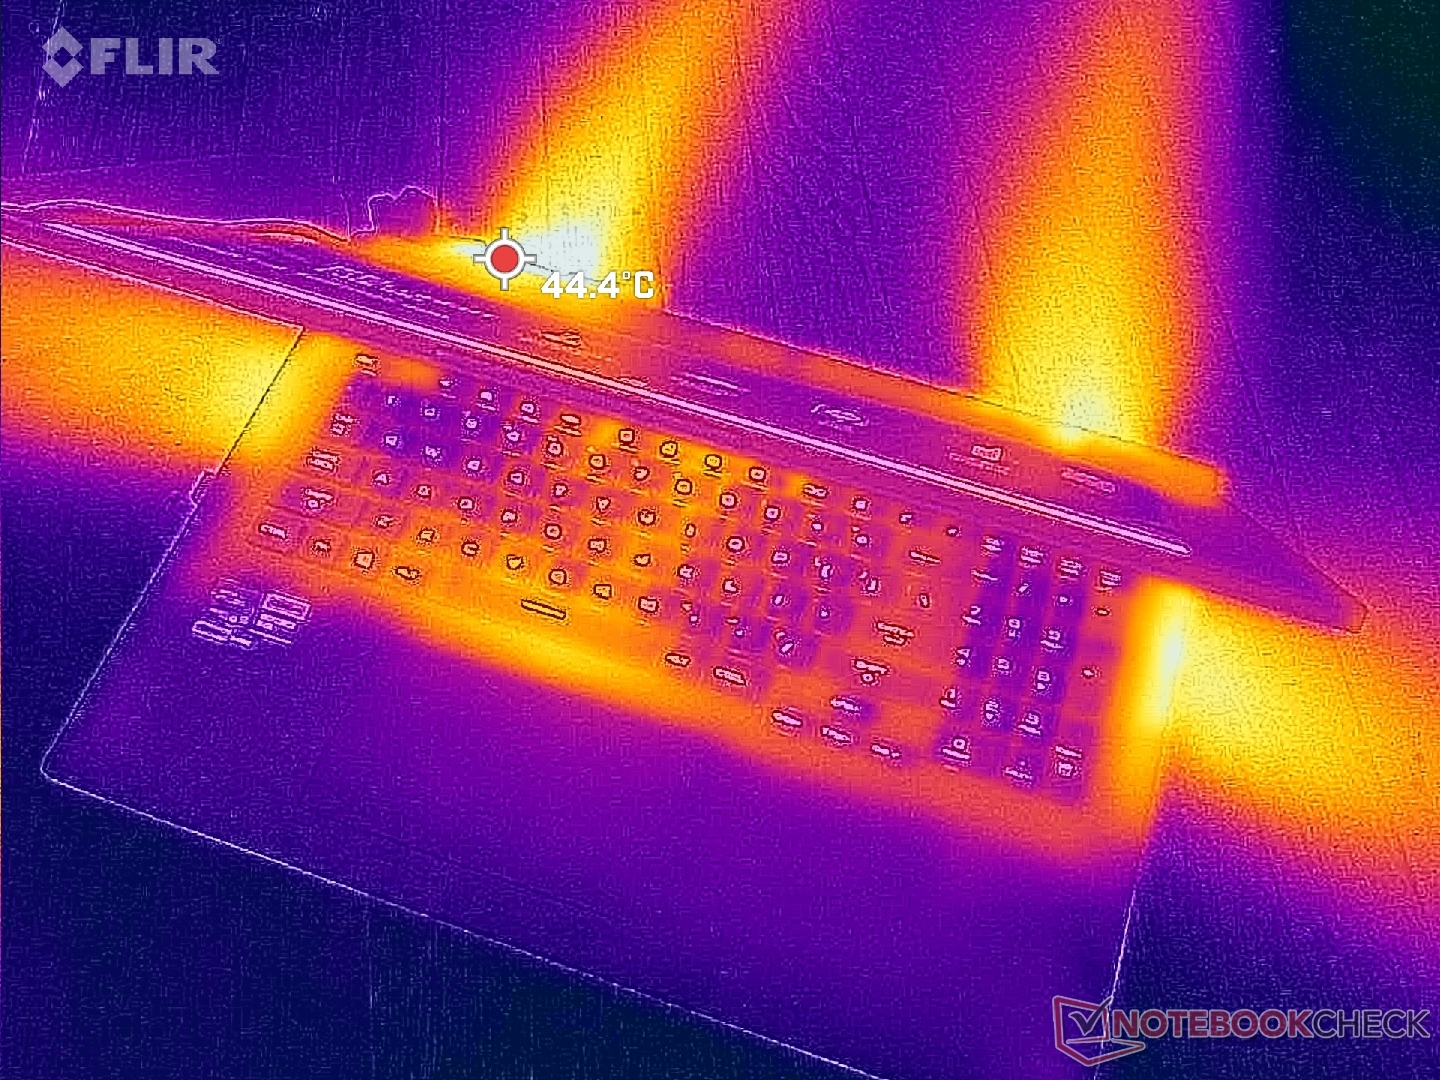
(+) La température maximale du côté supérieur est de 34.6 °C / 94 F, par rapport à la moyenne de 40.4 °C / 105 F, allant de 21.2 à 68.8 °C pour la classe Gaming.
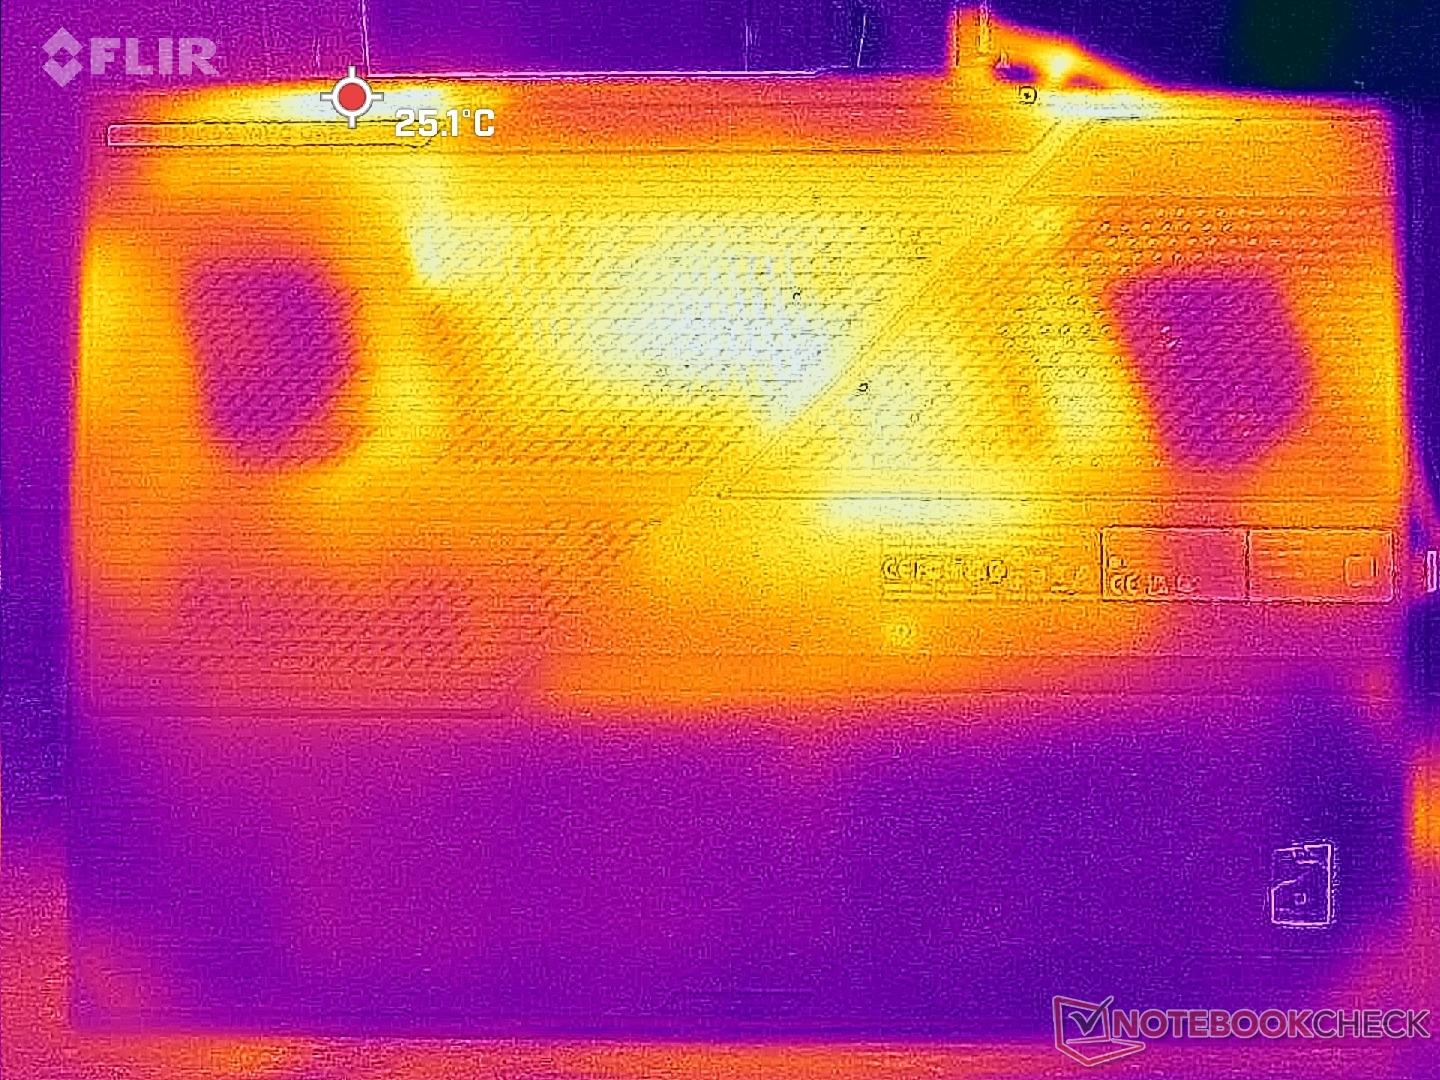
(+) Le fond chauffe jusqu'à un maximum de 35.6 °C / 96 F, contre une moyenne de 43.2 °C / 110 F
(+) En utilisation inactive, la température moyenne du côté supérieur est de 23.2 °C / 74 F, par rapport à la moyenne du dispositif de 33.9 °C / 93 F.
(+) En jouant à The Witcher 3, la température moyenne du côté supérieur est de 27.3 °C / 81 F, alors que la moyenne de l'appareil est de 33.9 °C / 93 F.
(+) Les repose-poignets et le pavé tactile sont plus froids que la température de la peau avec un maximum de 20.8 °C / 69.4 F et sont donc froids au toucher.
(+) La température moyenne de la zone de l'appui-paume de dispositifs similaires était de 28.8 °C / 83.8 F (+8 °C / #14.4 F).
| Asus ROG Strix Scar 17 G733PY-XS96 AMD Ryzen 9 7945HX, NVIDIA GeForce RTX 4090 Laptop GPU | MSI GE78HX 13VH-070US Intel Core i9-13950HX, NVIDIA GeForce RTX 4080 Laptop GPU | Eluktronics Mech-17 GP2 Intel Core i9-13900HX, NVIDIA GeForce RTX 4090 Laptop GPU | Asus ROG Strix G17 G713PI AMD Ryzen 9 7945HX, NVIDIA GeForce RTX 4070 Laptop GPU | Aorus 17X XES Intel Core i9-12900HX, NVIDIA GeForce RTX 3070 Ti Laptop GPU | Alienware m17 R5 (R9 6900HX, RX 6850M XT) AMD Ryzen 9 6900HX, AMD Radeon RX 6850M XT | |
|---|---|---|---|---|---|---|
| Heat | -13% | -13% | -18% | -46% | -29% | |
| Maximum Upper Side * (°C) | 34.6 | 37.4 -8% | 39 -13% | 42 -21% | 54 -56% | 53 -53% |
| Maximum Bottom * (°C) | 35.6 | 45 -26% | 44 -24% | 41 -15% | 58 -63% | 56 -57% |
| Idle Upper Side * (°C) | 27.2 | 29.8 -10% | 31 -14% | 33 -21% | 37 -36% | 30 -10% |
| Idle Bottom * (°C) | 30 | 32.4 -8% | 29.8 1% | 34 -13% | 39 -30% | 29 3% |
* ... Moindre est la valeur, meilleures sont les performances
Stress Test - Réchauffement de la température centrale
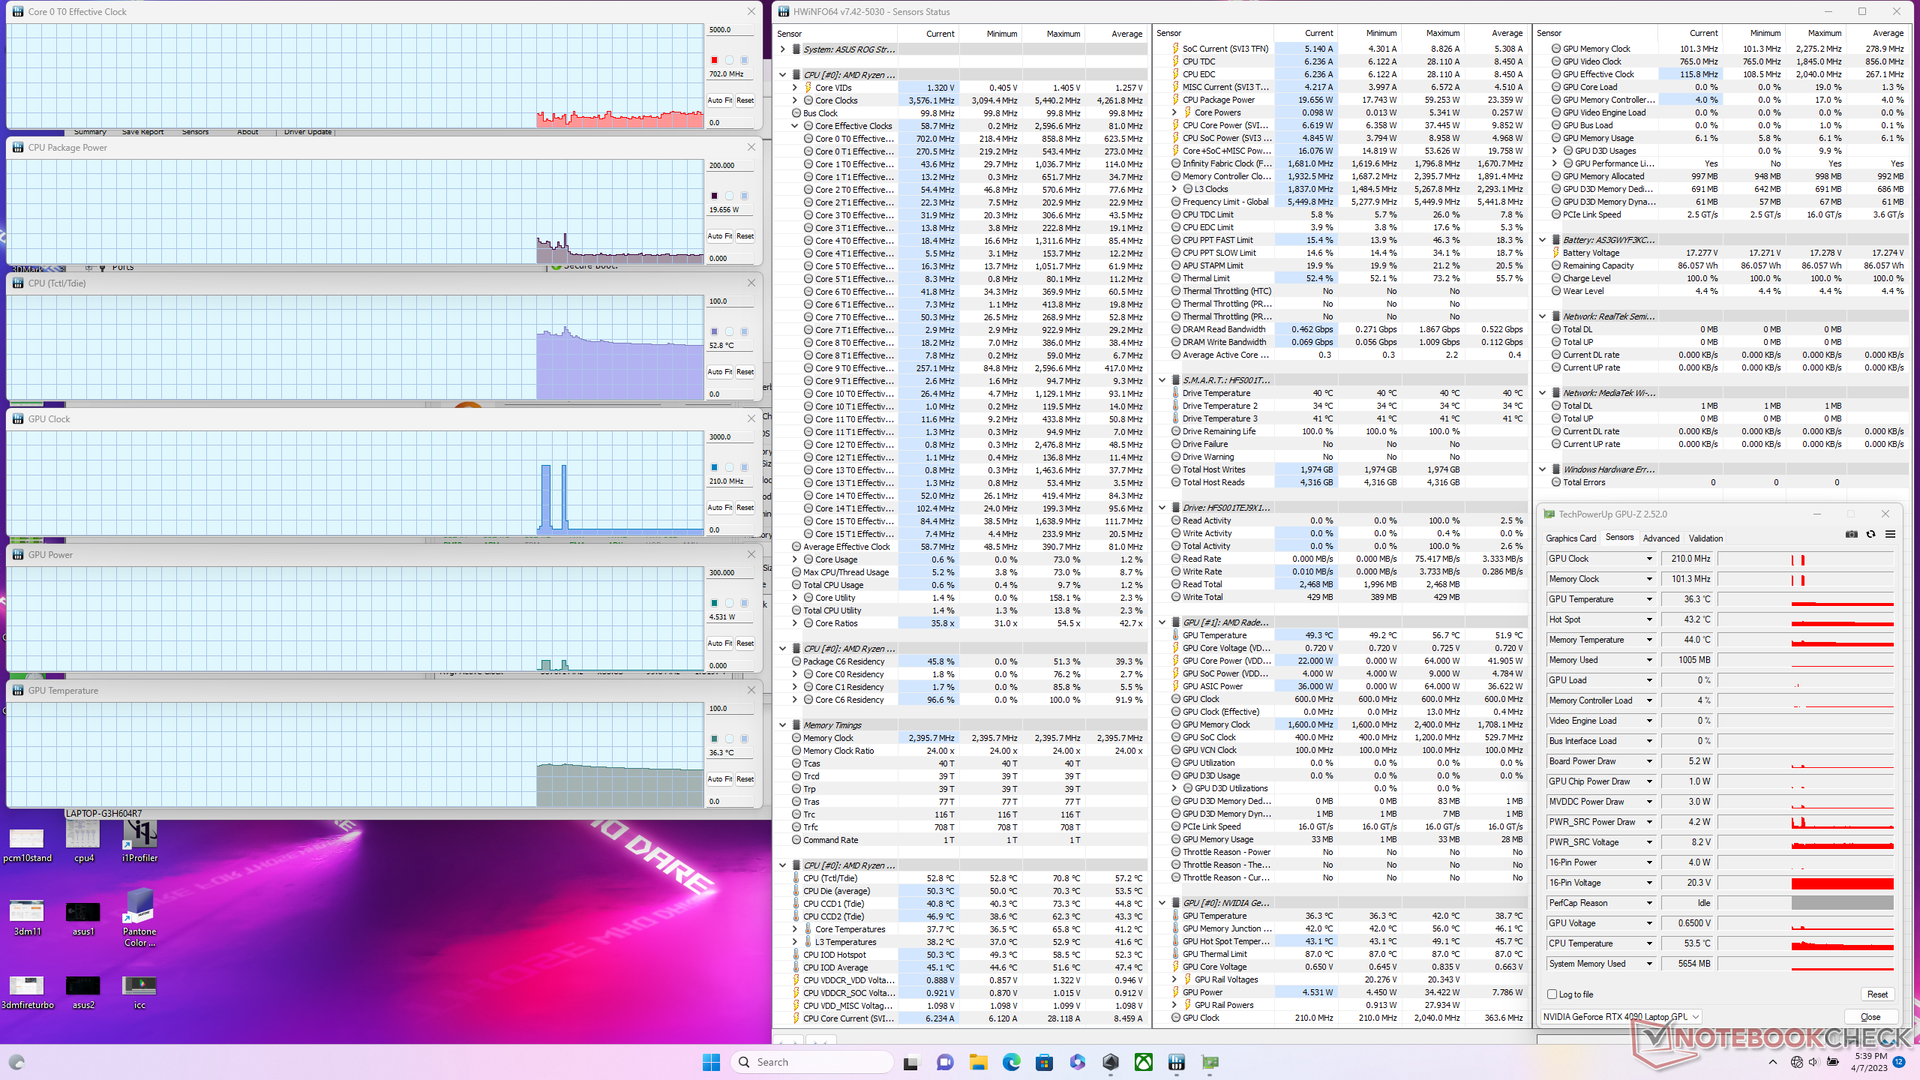
Lorsqu'il est sollicité sous Prime95, le CPU oscille entre 4,2 et 4,9 GHz tout en conservant une puissance de 114 W à 128 W. La température du cœur est toutefois très élevée, à plus de 90 C.
La fréquence d'horloge du GPU, l'horloge de la mémoire, la température et la consommation d'énergie de la carte se stabilisent respectivement à 2055 MHz, 2250 MHz, 79 C et 149 W en mode Performance Witcher 3 en mode Performance. Ces valeurs passent à 2280 MHz, 2275 MHz, 74 C et 170 W en mode Turbo. Le mode Turbo est donc nécessaire si vous souhaitez vous rapprocher des 175 W TGP annoncés pour la RTX 4090 mobile.
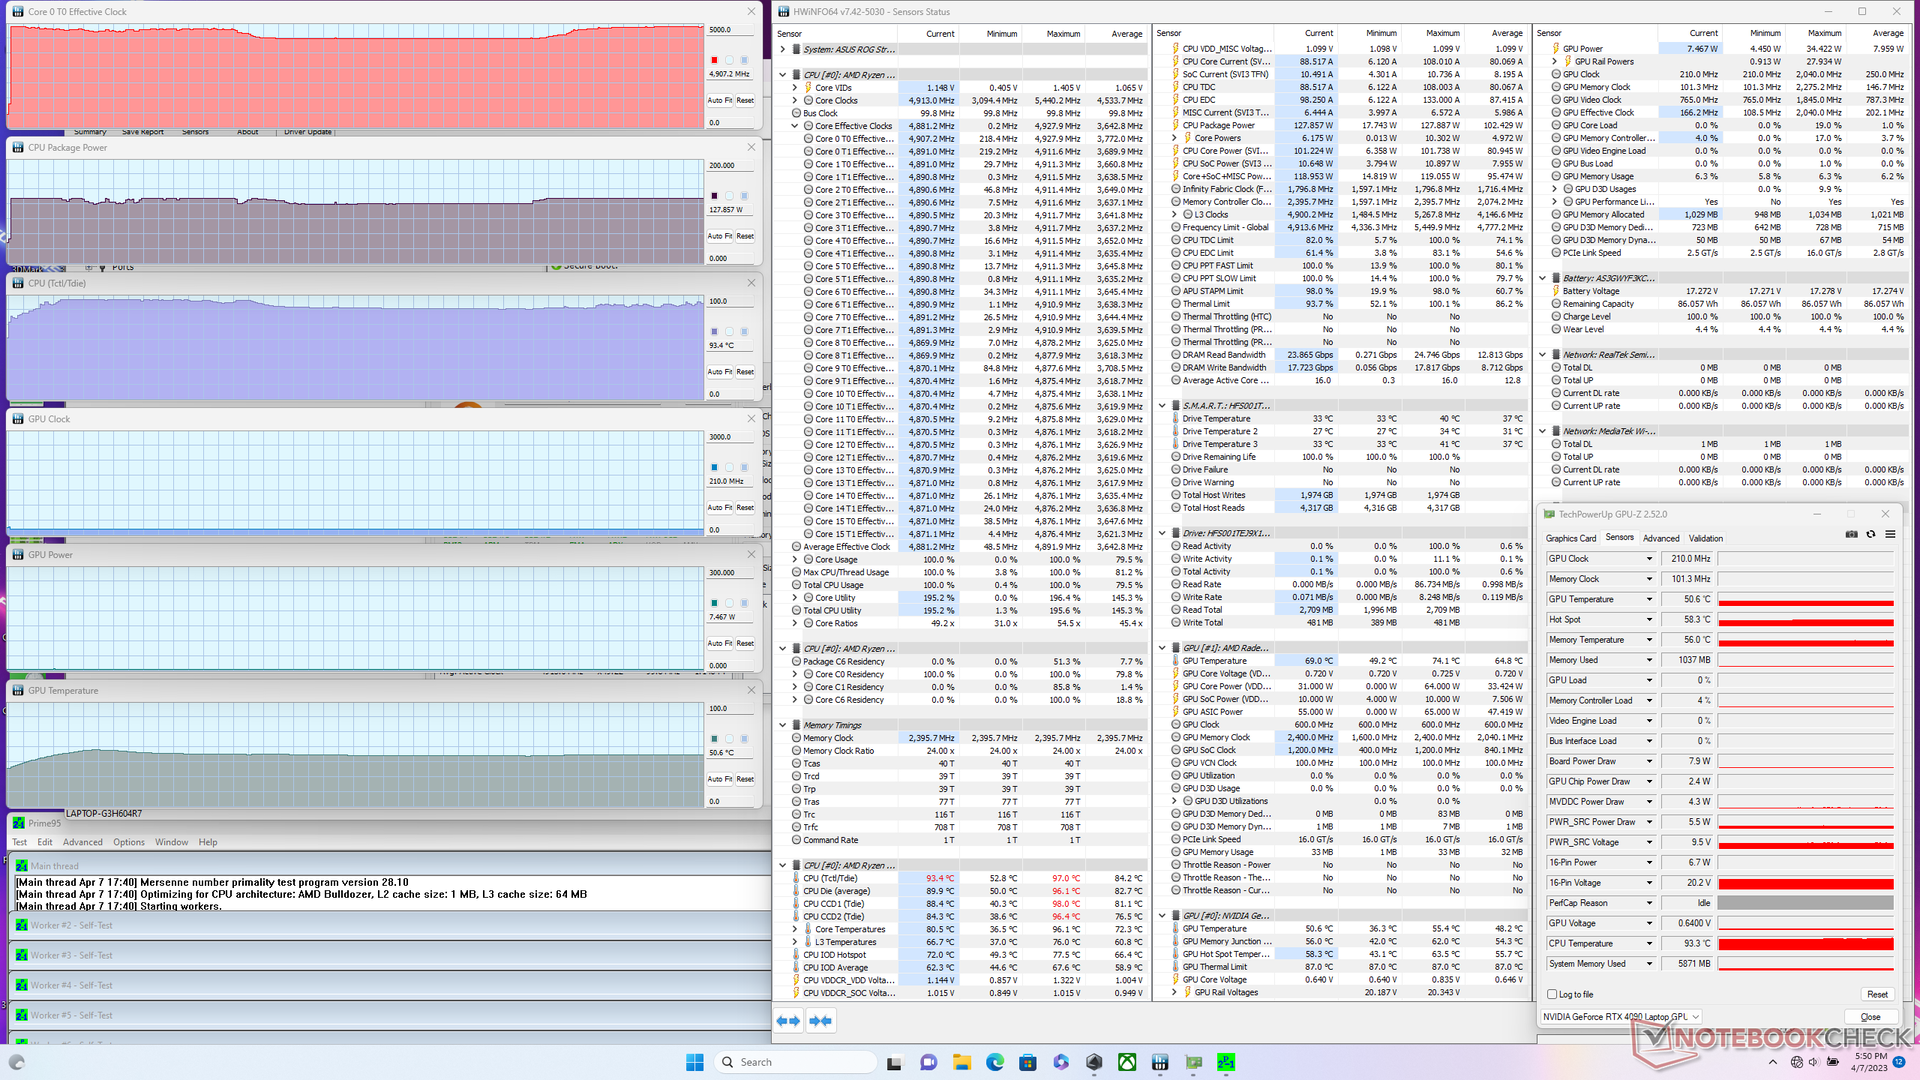
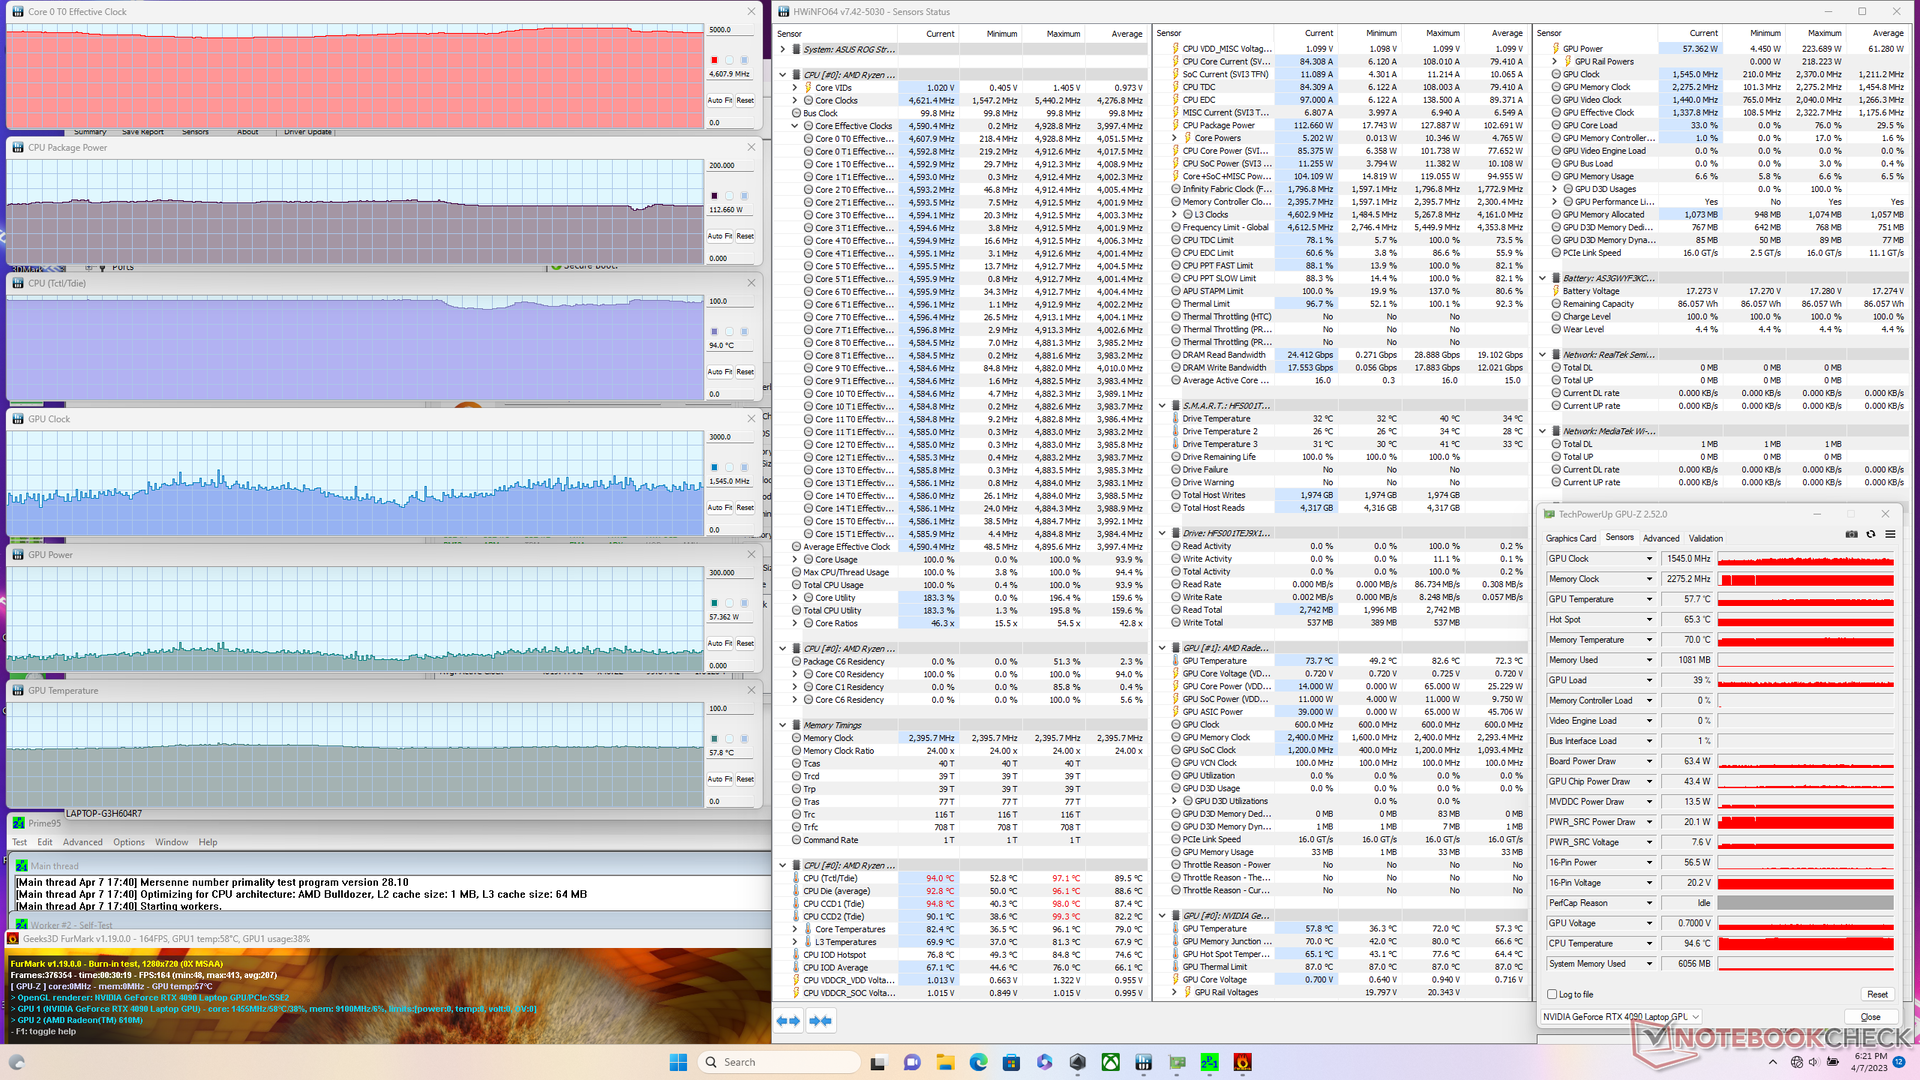
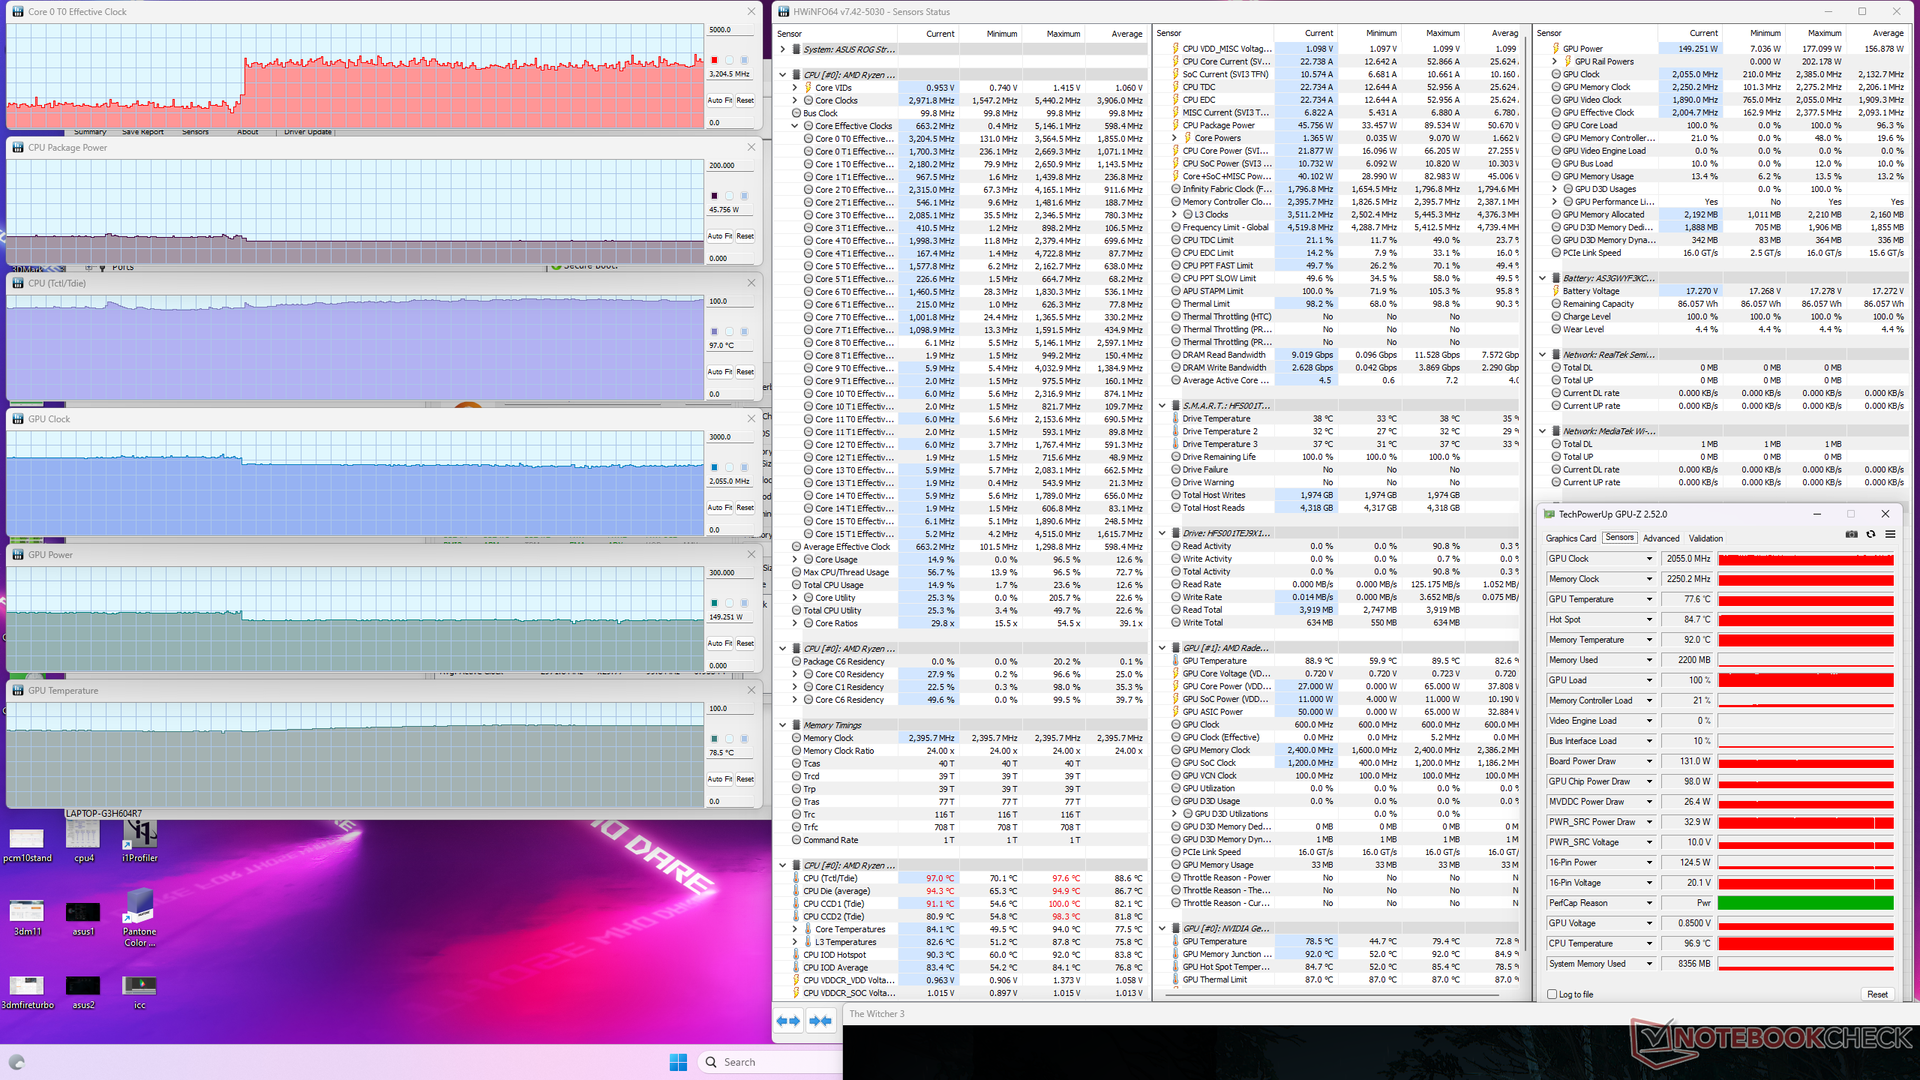
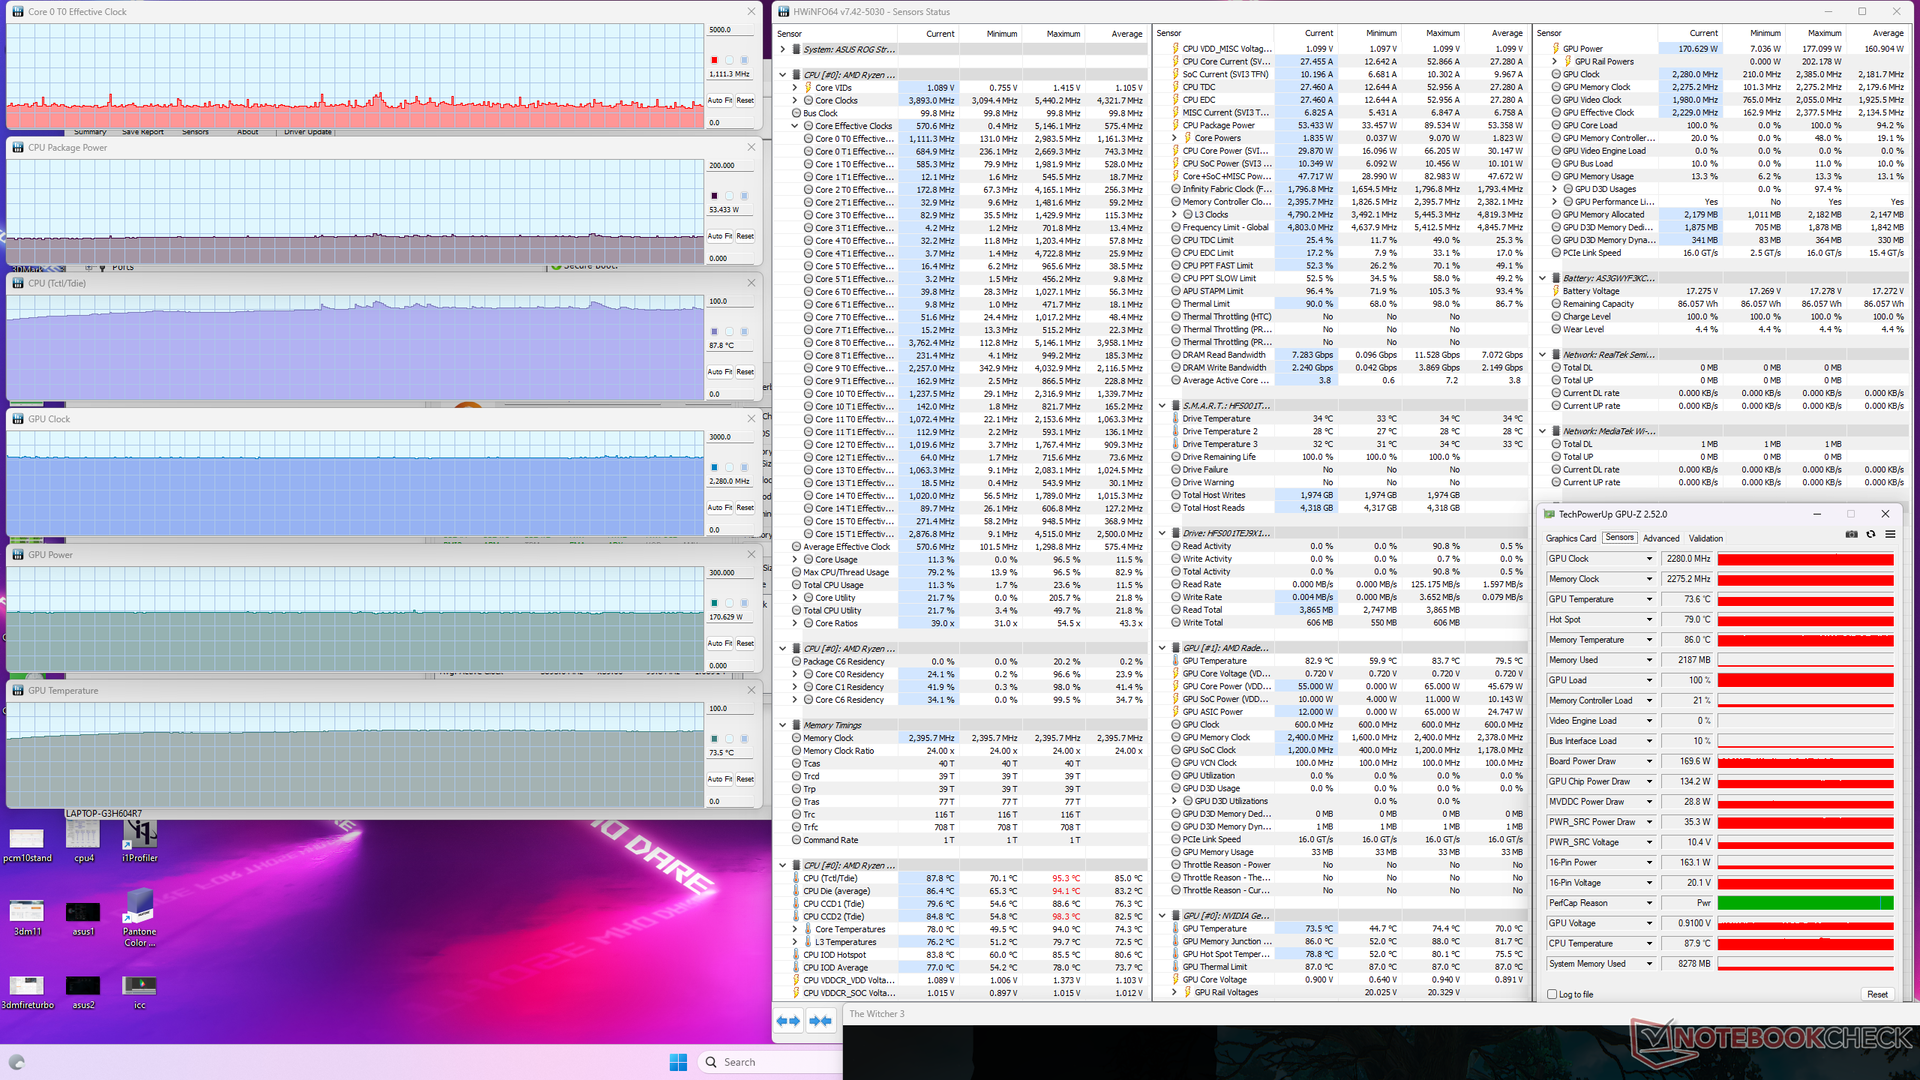
| Horloge du CPU (GHz) | Horloge du GPU (MHz) | Température moyenne du CPU (°C) | Température moyenne du GPU (°C) | |
| Système en veille | -- | -- | 53 | 36 |
| Prime95 Stress | 4.2 - 4.9 | -- | 90 - 94 | 51 |
| Prime95 + FurMark Stress | 4.2 - 4.8 | ~850 - 1545 | 94 | 58 |
| Witcher 3 Stress (mode Performance) | ~3.2 | 2055 | 97 | 79 |
| Witcher 3 Stress (mode Turbo) | ~1.1 | 2280 | 88 | 74 |
Intervenants
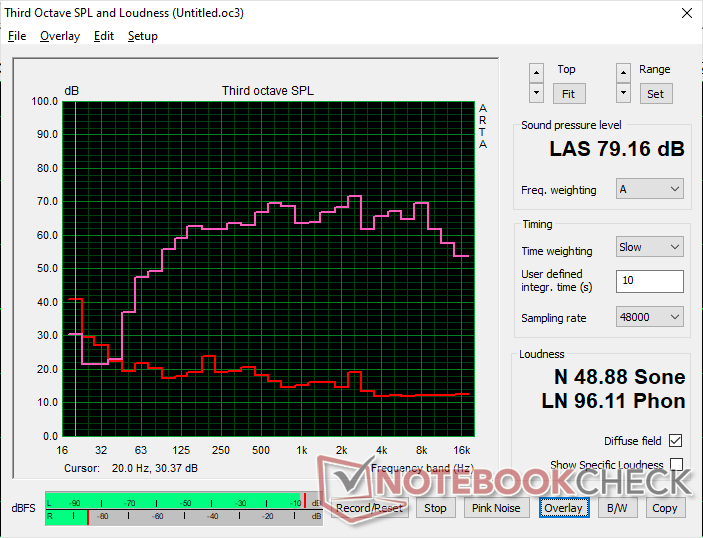
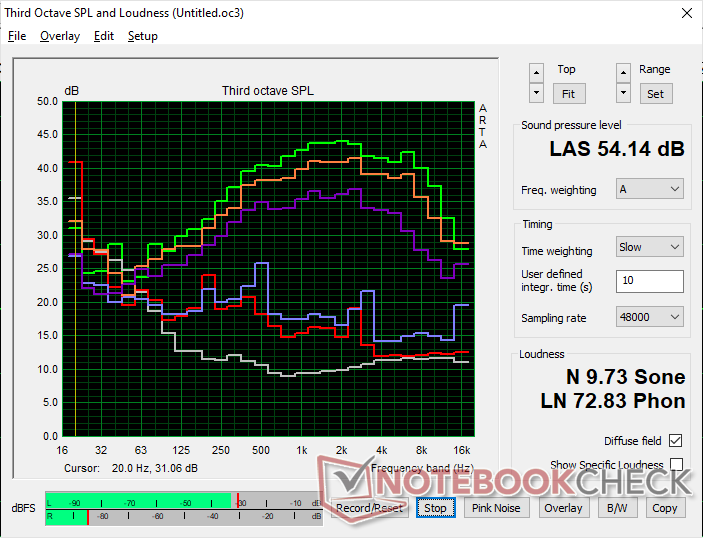
Asus ROG Strix Scar 17 G733PY-XS96 analyse audio
(±) | le niveau sonore du haut-parleur est moyen mais bon (79.2# dB)
Basses 100 - 315 Hz
(+) | bonne basse - seulement 2.8% loin de la médiane
(+) | les basses sont linéaires (5.6% delta à la fréquence précédente)
Médiums 400 - 2000 Hz
(+) | médiane équilibrée - seulement 2.9% de la médiane
(+) | les médiums sont linéaires (4.7% delta à la fréquence précédente)
Aiguës 2 - 16 kHz
(+) | des sommets équilibrés - à seulement 3.5% de la médiane
(±) | la linéarité des aigus est moyenne (10% delta à la fréquence précédente)
Globalement 100 - 16 000 Hz
(+) | le son global est linéaire (9.3% différence à la médiane)
Par rapport à la même classe
» 3% de tous les appareils testés de cette catégorie étaient meilleurs, 2% similaires, 95% pires
» Le meilleur avait un delta de 6%, la moyenne était de 18%, le pire était de 132%.
Par rapport à tous les appareils testés
» 3% de tous les appareils testés étaient meilleurs, 1% similaires, 96% pires
» Le meilleur avait un delta de 4%, la moyenne était de 23%, le pire était de 134%.
Apple MacBook Pro 16 2021 M1 Pro analyse audio
(+) | les haut-parleurs peuvent jouer relativement fort (84.7# dB)
Basses 100 - 315 Hz
(+) | bonne basse - seulement 3.8% loin de la médiane
(+) | les basses sont linéaires (5.2% delta à la fréquence précédente)
Médiums 400 - 2000 Hz
(+) | médiane équilibrée - seulement 1.3% de la médiane
(+) | les médiums sont linéaires (2.1% delta à la fréquence précédente)
Aiguës 2 - 16 kHz
(+) | des sommets équilibrés - à seulement 1.9% de la médiane
(+) | les aigus sont linéaires (2.7% delta à la fréquence précédente)
Globalement 100 - 16 000 Hz
(+) | le son global est linéaire (4.6% différence à la médiane)
Par rapport à la même classe
» 0% de tous les appareils testés de cette catégorie étaient meilleurs, 0% similaires, 100% pires
» Le meilleur avait un delta de 5%, la moyenne était de 17%, le pire était de 45%.
Par rapport à tous les appareils testés
» 0% de tous les appareils testés étaient meilleurs, 0% similaires, 100% pires
» Le meilleur avait un delta de 4%, la moyenne était de 23%, le pire était de 134%.
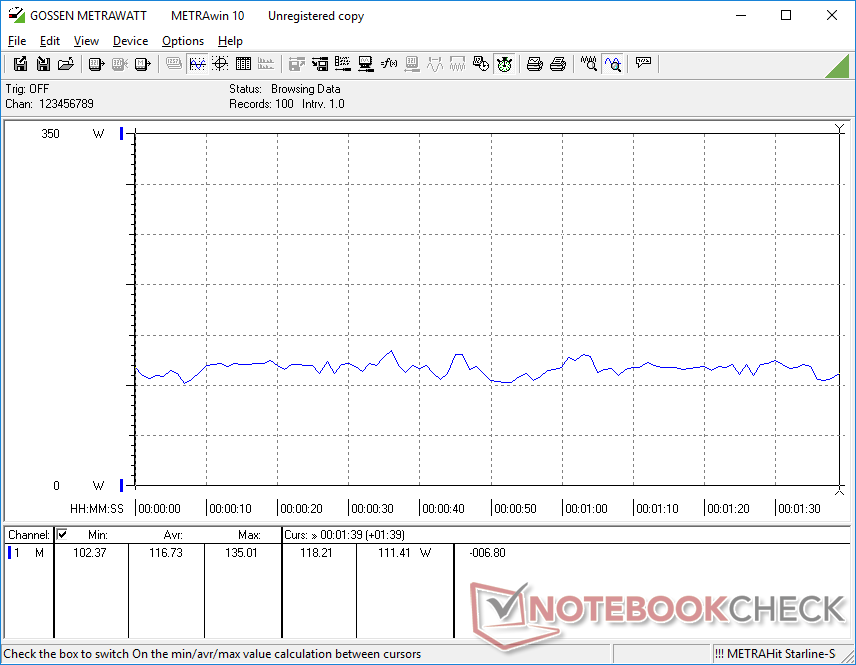
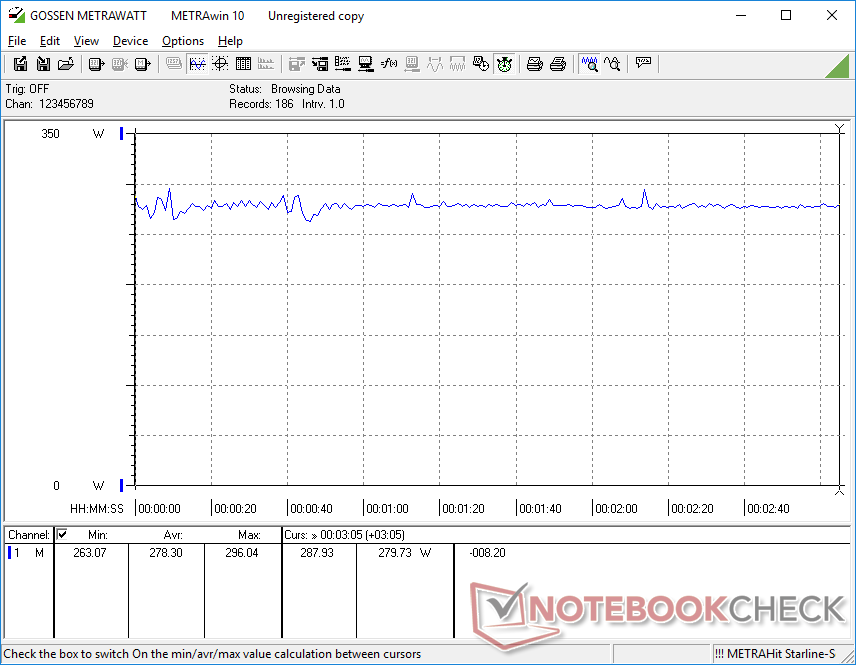
Gestion de l'énergie - Machine exigeante
Consommation électrique
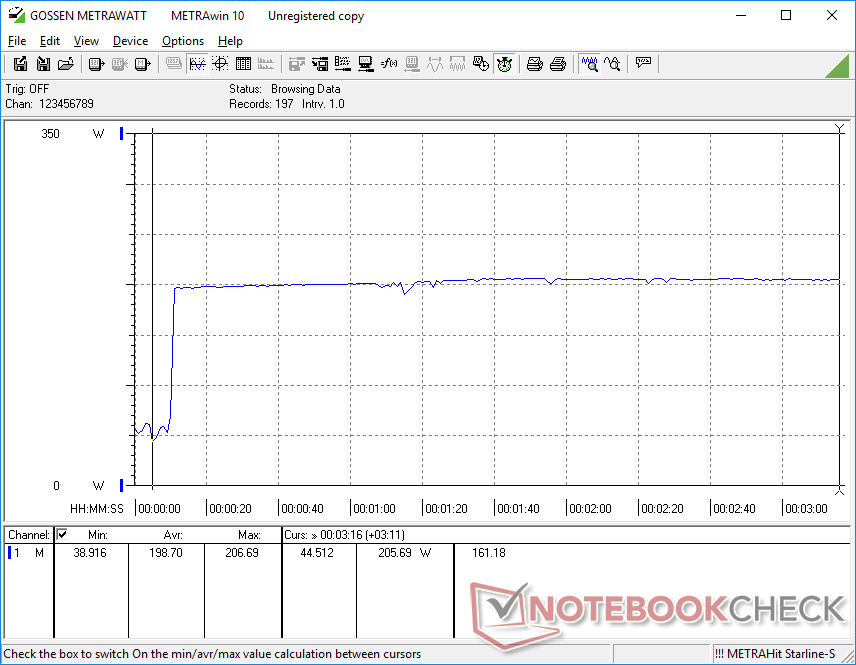
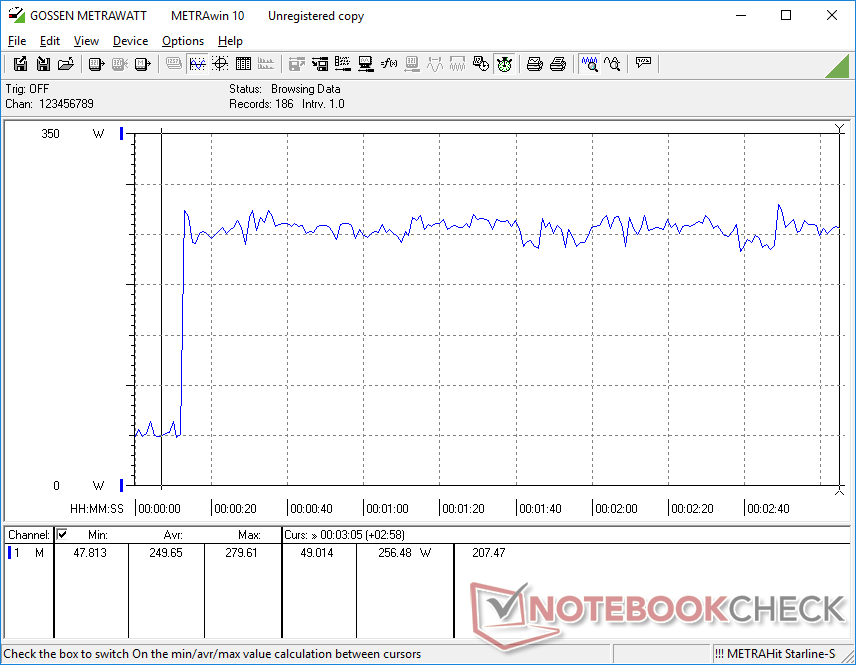
Notre modèle 2023 est généralement plus gourmand en énergie que le modèle 2022 alimenté par Intel. Lors de l'exécution de Prime95, par exemple, la consommation d'énergie se stabilise à 205 W contre seulement 117 W pour la configuration i9-12950HX de l'année dernière. De même, l'exécution de Witcher 3 consommerait environ 24 % d'énergie en plus par rapport à l'ancienne configuration RTX 3080 Ti. Les performances sont peut-être plus élevées d'une génération à l'autre, mais la consommation a également augmenté.
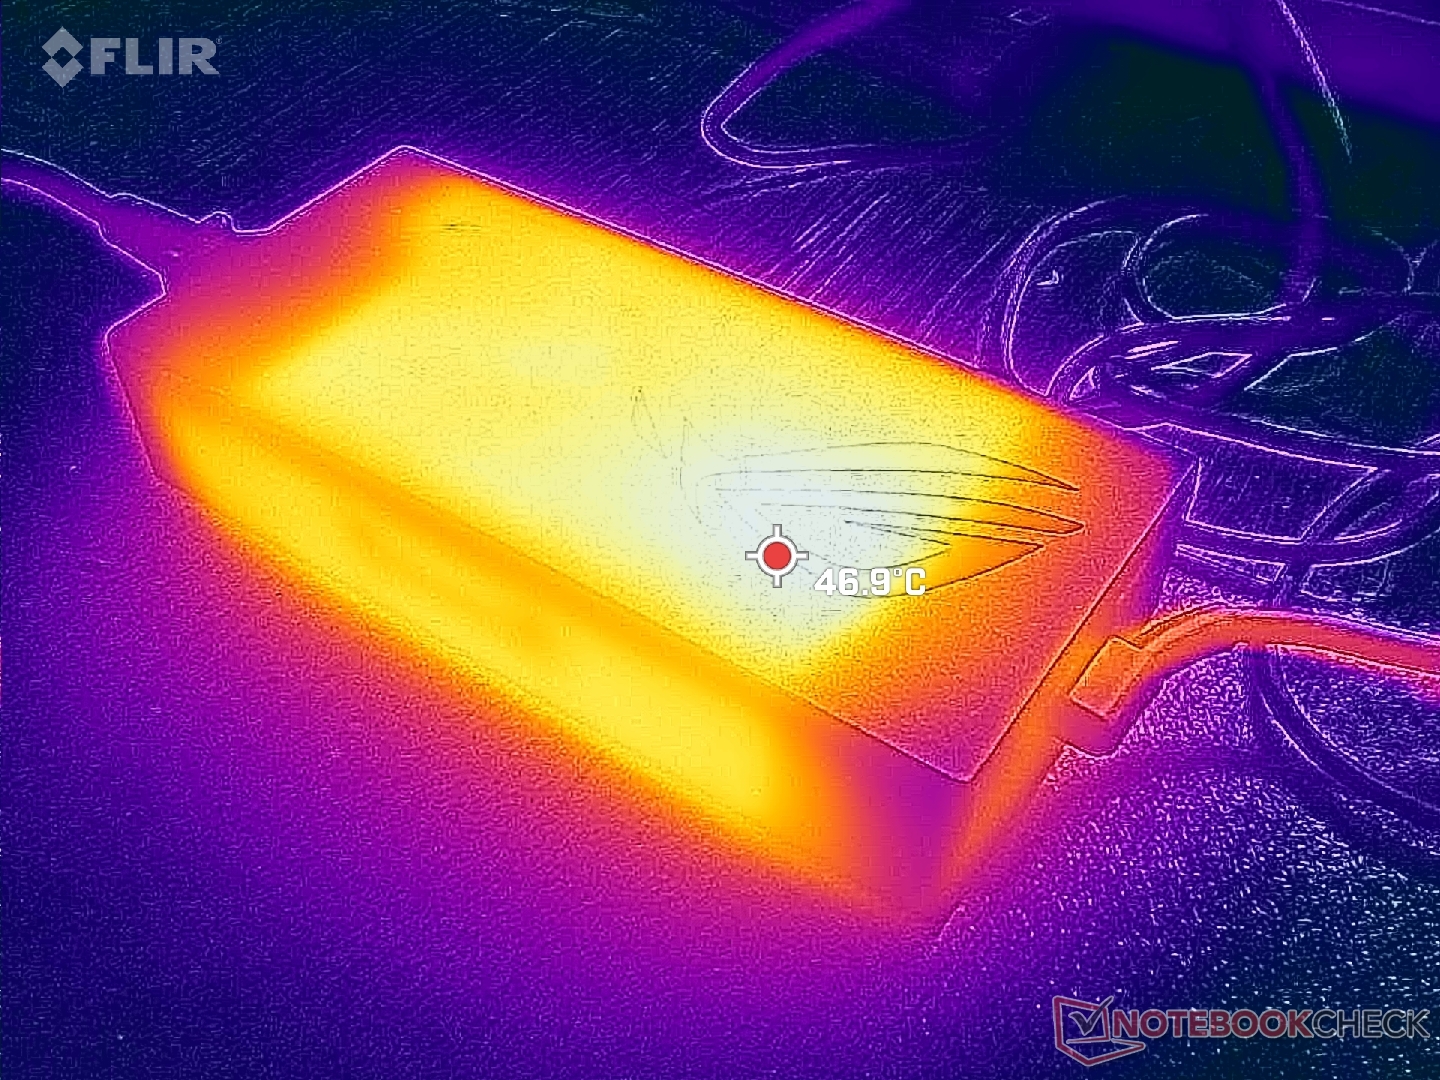
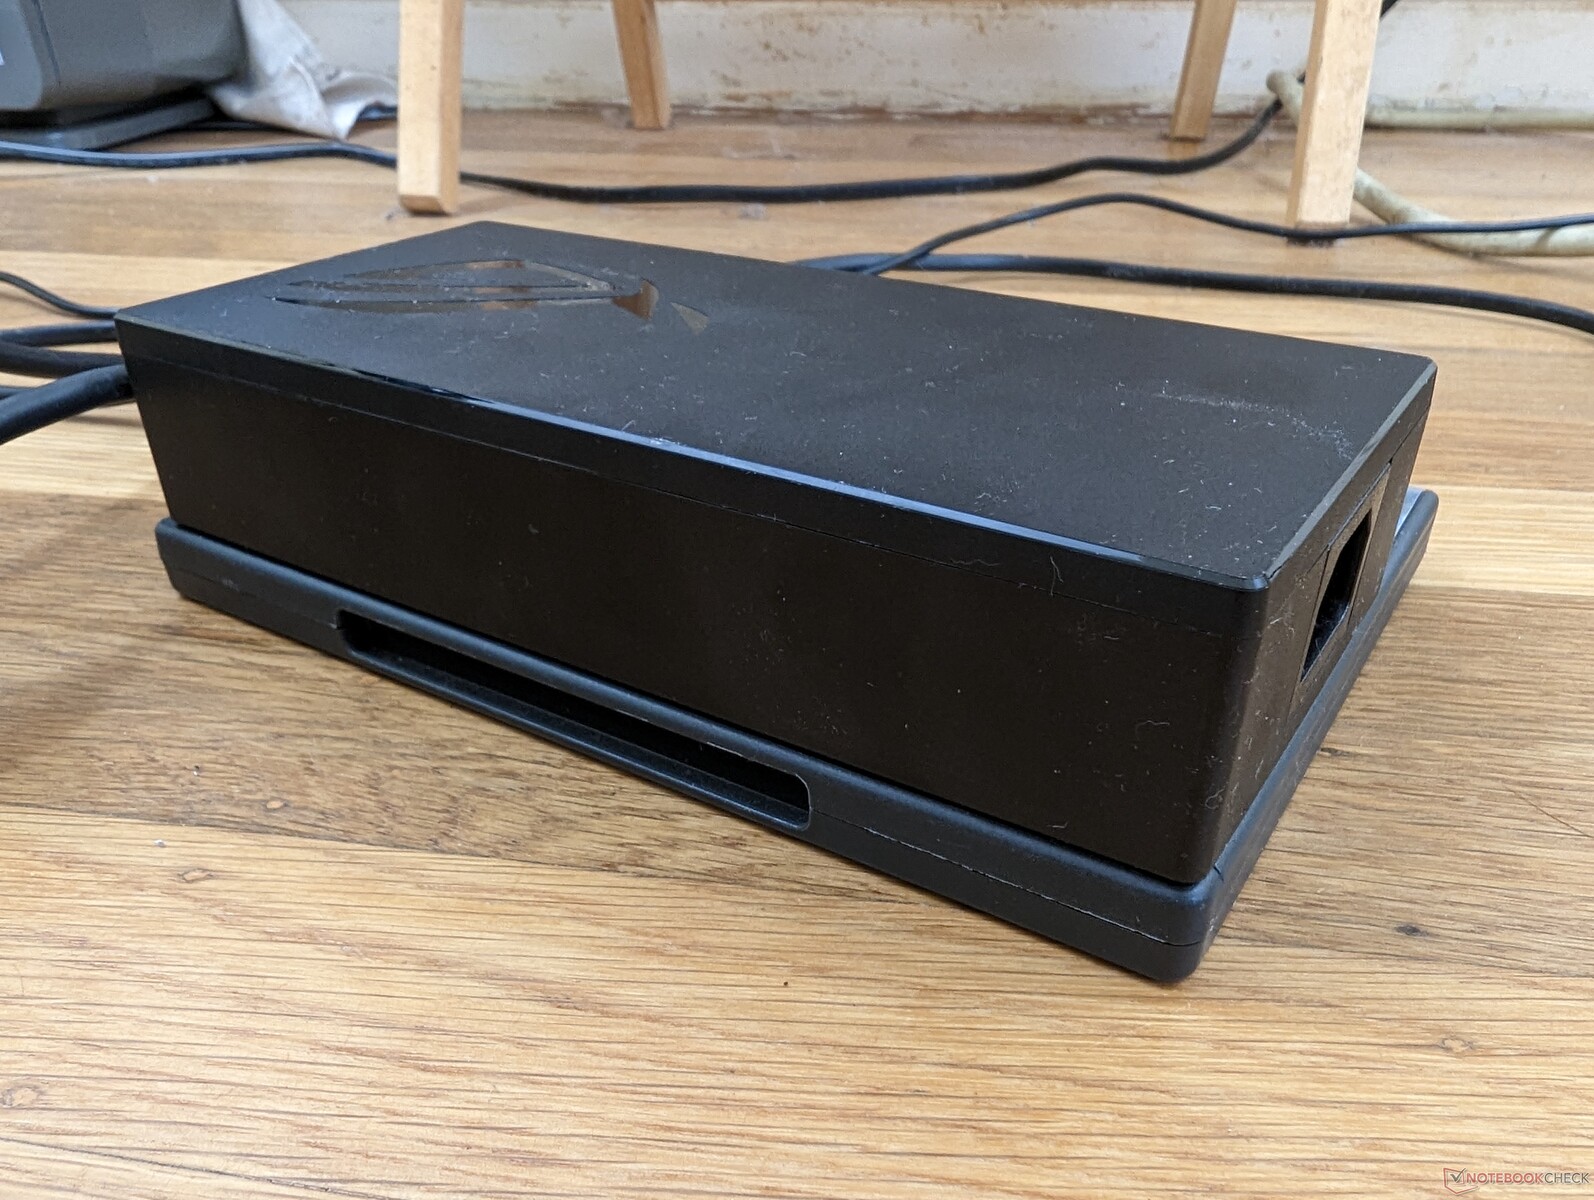
Nous avons pu enregistrer une consommation maximale de 280 W avec le grand adaptateur secteur de 330 W (~18,4 x 8,4 x 3,6 cm).
| Éteint/en veille | |
| Au repos | |
| Fortement sollicité |
|
Légende:
min: | |
| Asus ROG Strix Scar 17 G733PY-XS96 R9 7945HX, GeForce RTX 4090 Laptop GPU, SK hynix PC801 HFS001TEJ9X101N, IPS, 2560x1440, 17.3" | MSI GE78HX 13VH-070US i9-13950HX, GeForce RTX 4080 Laptop GPU, Samsung PM9A1 MZVL22T0HBLB, IPS, 2560x1600, 17" | Eluktronics Mech-17 GP2 i9-13900HX, GeForce RTX 4090 Laptop GPU, Samsung PM9A1 MZVL21T0HCLR, IPS, 2560x1600, 17" | Asus ROG Strix G17 G713PI R9 7945HX, GeForce RTX 4070 Laptop GPU, WD PC SN560 SDDPNQE-1T00, IPS, 2560x1440, 17.3" | Aorus 17X XES i9-12900HX, GeForce RTX 3070 Ti Laptop GPU, Gigabyte AG470S1TB-SI B10, IPS, 1920x1080, 17.3" | Alienware m17 R5 (R9 6900HX, RX 6850M XT) R9 6900HX, Radeon RX 6850M XT, SSSTC CA6-8D1024, IPS, 3840x2160, 17" | |
|---|---|---|---|---|---|---|
| Power Consumption | -3% | -1% | 13% | -9% | 23% | |
| Idle Minimum * (Watt) | 14.5 | 16.1 -11% | 14 3% | 15 -3% | 18 -24% | 13 10% |
| Idle Average * (Watt) | 21.1 | 24 -14% | 19.3 9% | 20 5% | 28 -33% | 16.5 22% |
| Idle Maximum * (Watt) | 42.8 | 34 21% | 36.8 14% | 29 32% | 36 16% | 17 60% |
| Load Average * (Watt) | 116.7 | 123.6 -6% | 117.2 -0% | 121 -4% | 153 -31% | 93 20% |
| Witcher 3 ultra * (Watt) | 278 | 286 -3% | 304 -9% | 179.8 35% | 221 21% | 239 14% |
| Load Maximum * (Watt) | 279.6 | 285.7 -2% | 342.5 -22% | 246 12% | 290 -4% | 251 10% |
* ... Moindre est la valeur, meilleures sont les performances
Power Consumption Witcher 3 / Stresstest
Power Consumption external Monitor
Autonomie de la batterie
L'autonomie du WLAN est dans la moyenne avec 4 heures en profil équilibré avec Optimus et iGPU actifs. D'autres ordinateurs portables de jeu de 17 pouces comme le ROG Strix G17 G713PI ou l'Aorus 17X XESAorus 17X XES obtiendraient des résultats similaires.
Le système peut être rechargé via des adaptateurs USB-C tiers. Certains adaptateurs peuvent toutefois ne pas fonctionner ; notre chargeur USB-C Lenovo de 135 W fonctionnerait sans problème, tandis que notre chargeur USB-C Dell XPS de 130 W ne se rechargerait pas du tout.
| Asus ROG Strix Scar 17 G733PY-XS96 R9 7945HX, GeForce RTX 4090 Laptop GPU, 90 Wh | MSI GE78HX 13VH-070US i9-13950HX, GeForce RTX 4080 Laptop GPU, 99 Wh | Eluktronics Mech-17 GP2 i9-13900HX, GeForce RTX 4090 Laptop GPU, 99 Wh | Asus ROG Strix G17 G713PI R9 7945HX, GeForce RTX 4070 Laptop GPU, 90 Wh | Aorus 17X XES i9-12900HX, GeForce RTX 3070 Ti Laptop GPU, 99 Wh | Alienware m17 R5 (R9 6900HX, RX 6850M XT) R9 6900HX, Radeon RX 6850M XT, 97 Wh | |
|---|---|---|---|---|---|---|
| Autonomie de la batterie | 49% | 24% | 5% | 7% | 17% | |
| WiFi v1.3 (h) | 4.1 | 6.1 49% | 5.1 24% | 4.3 5% | 4.4 7% | 4.8 17% |
| Reader / Idle (h) | 7.3 | |||||
| Load (h) | 1.5 | 1 | 1.4 | 1.8 | ||
| H.264 (h) | 2.8 | 3.8 | 4.9 | |||
| Witcher 3 ultra (h) | 1.1 |
Points positifs
Points négatifs
Verdict - Excellente performance avec un look vieillissant
Pour 2022, AMD et Nvidia ont introduit les séries Zen 3+ et mobile GeForce 30 Ti pour remplacer les options Zen 3 et non Ti de 2021, respectivement. Les mises à jour se sont toutefois avérées relativement mineures, les nouvelles options n'apportant rien de nouveau au niveau de l'architecture. En 2023, les séries Zen 4 et mobile GeForce RTX 40 ont enfin apporté les améliorations significatives en termes de performances que les joueurs sur ordinateur portable attendaient. La consommation d'énergie est peut-être plus élevée, mais l'augmentation de la puissance compense, d'autant plus que le Ryzen 9 7945HX est à la fois légèrement plus rapide et plus économe en énergie que le Core i9-13950HX de 13e génération concurrent.
Le ROG Strix Scar 17 2023 montre la Ryzen 9 7945HX et la GeForce RTX 4090 sous leur meilleur jour. Cependant, certains éléments de design extérieur mériteraient d'être mis à jour.
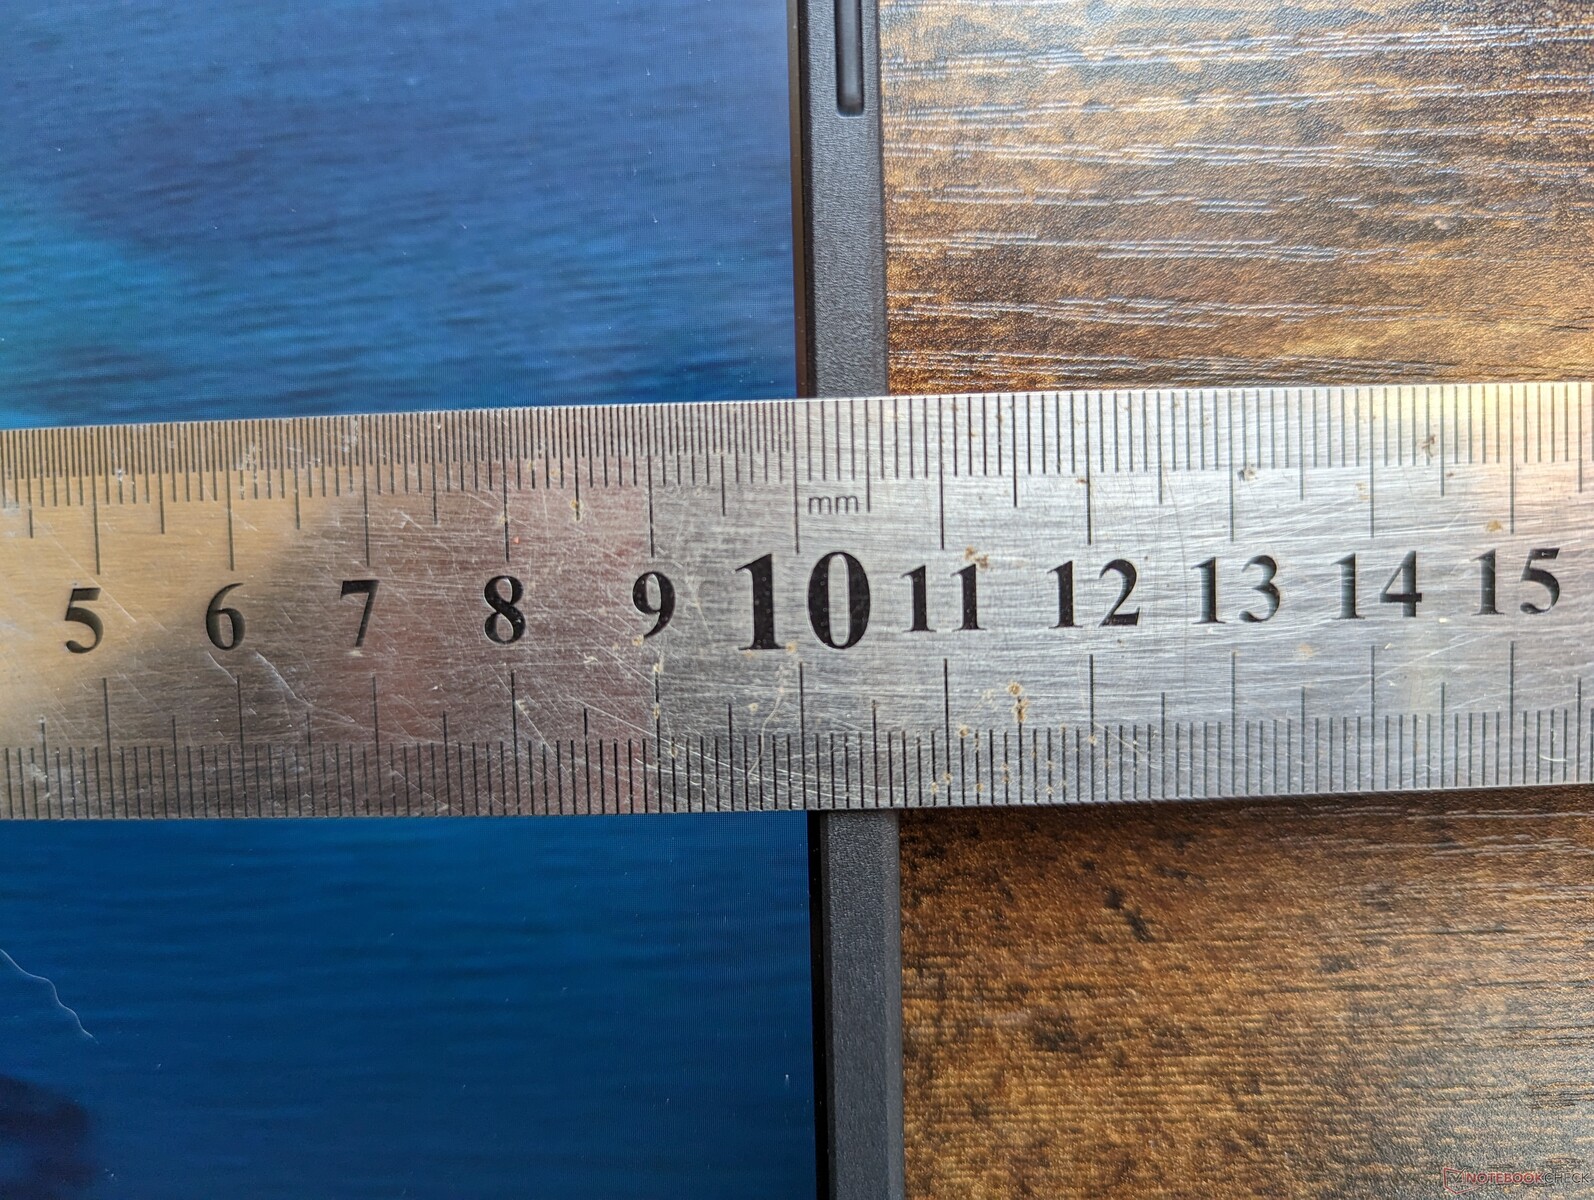
Si les processeurs sont impressionnants cette année, le design extérieur du ROG Strix Scar 17 mériterait d'être rafraîchi. La température du processeur lors des jeux est plus élevée que prévu, par exemple, tandis que le SSD PCIe4 x4 s'essouffle après quelques minutes d'utilisation intensive. Le pavé numérique et les touches fléchées sont toujours aussi étroits et certaines étiquettes secondaires sur les touches du clavier ne s'allument toujours pas lorsque le rétroéclairage est actif. Certains modèles concurrents, comme le MSI GE78 sont passés au 16:10 alors que la série Strix Scar 17 reste en 16:9. Le modèle risque donc d'avoir l'air plus vite défraîchi, même si ses performances sont tout sauf lentes.
Prix et disponibilité
Nom, prix et disponibilité du modèle testé, si nécessaire avec les variantes d'équipement correspondantes. Lien affil vers un magasin à partir de la liste dans la fenêtre de lien.
Asus ROG Strix Scar 17 G733PY-XS96
- 04/10/2023 v7 (old)
Allen Ngo
Transparency
La sélection des appareils à examiner est effectuée par notre équipe éditoriale. L'échantillon de test a été prêté à l'auteur par le fabricant ou le détaillant pour les besoins de cet examen. Le prêteur n'a pas eu d'influence sur cette évaluation et le fabricant n'a pas reçu de copie de cette évaluation avant sa publication. Il n'y avait aucune obligation de publier cet article. En tant que média indépendant, Notebookcheck n'est pas soumis à l'autorité des fabricants, des détaillants ou des éditeurs.
Voici comment Notebookcheck teste
Chaque année, Notebookcheck examine de manière indépendante des centaines d'ordinateurs portables et de smartphones en utilisant des procédures standardisées afin de garantir que tous les résultats sont comparables. Nous avons continuellement développé nos méthodes de test depuis environ 20 ans et avons établi des normes industrielles dans le processus. Dans nos laboratoires de test, des équipements de mesure de haute qualité sont utilisés par des techniciens et des rédacteurs expérimentés. Ces tests impliquent un processus de validation en plusieurs étapes. Notre système d'évaluation complexe repose sur des centaines de mesures et de points de référence bien fondés, ce qui garantit l'objectivité.Price comparison

