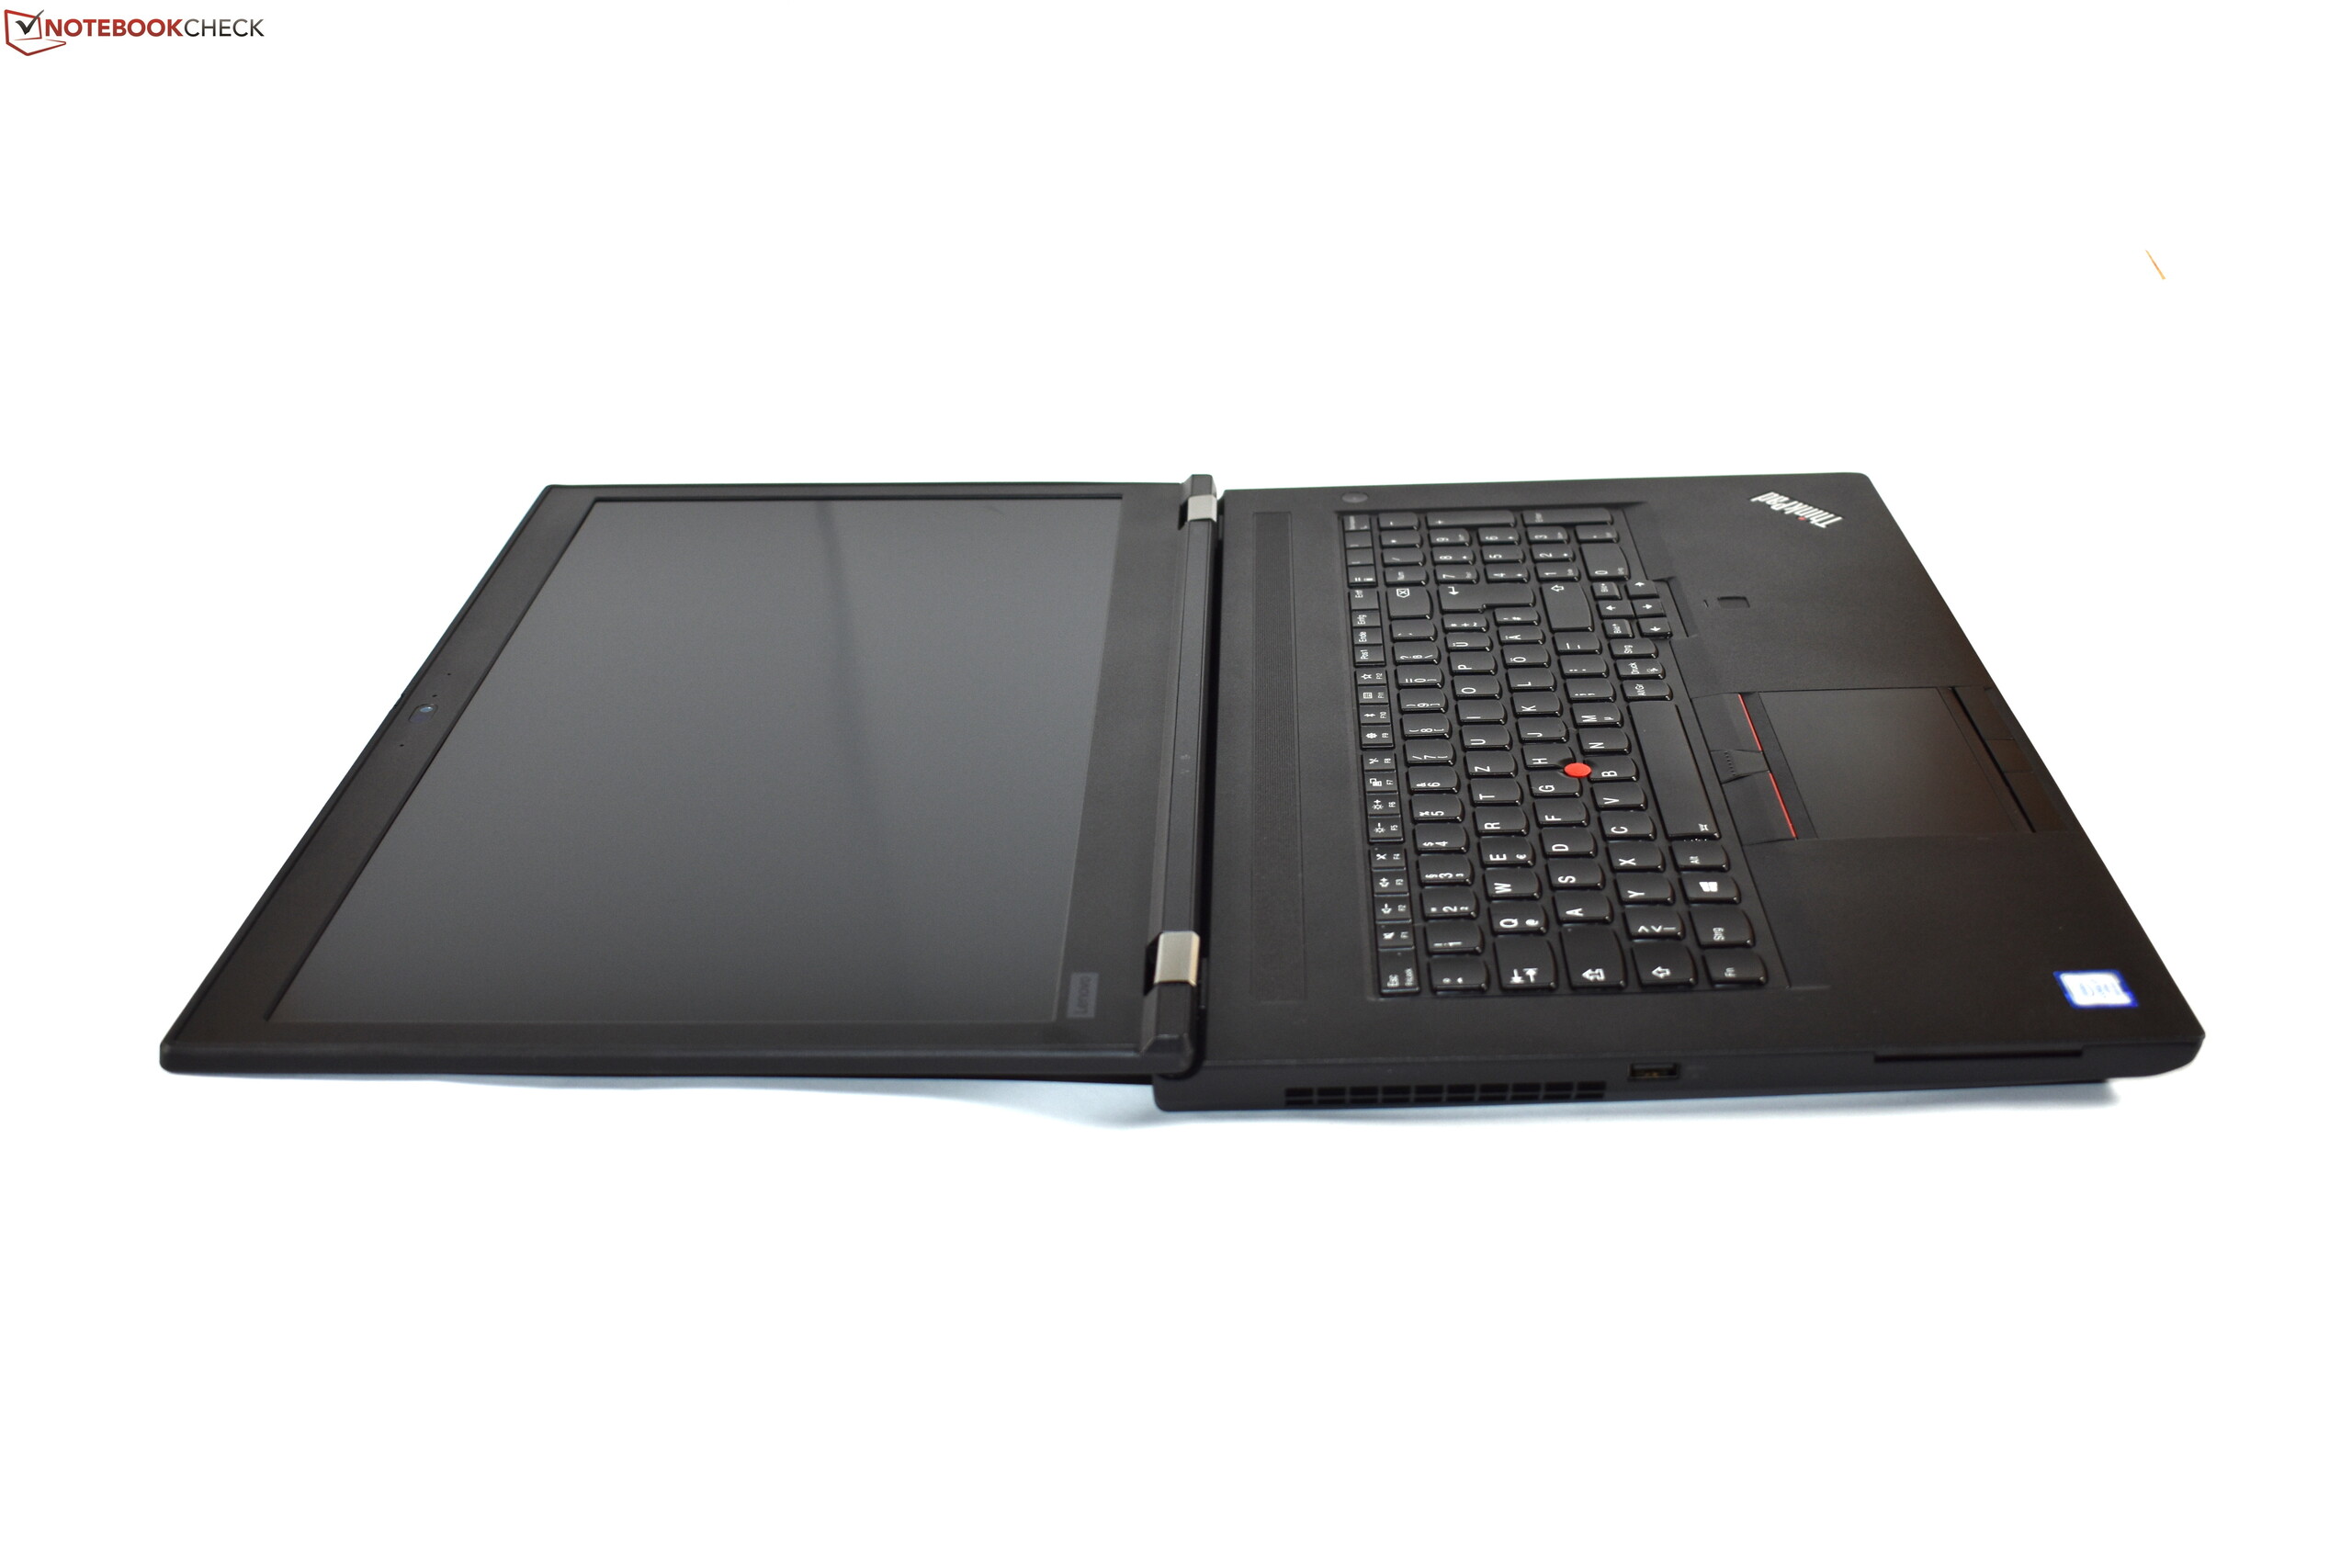
Test du Lenovo ThinkPad P73 (i7-9850H, Quadro RTX 3000, FHD) : grosse station de travail, mais chauffe exagérée
Note | Date | Modèle | Poids | Épaisseur | Taille | Résolution | Prix |
|---|---|---|---|---|---|---|---|
| 86.6 % v7 (old) | 12/19 | Lenovo ThinkPad P73-20QR002DGE i7-9850H, Quadro RTX 3000 (Laptop) | 3.5 kg | 31 mm | 17.30" | 1920x1080 | |
| 85.7 % v7 (old) | 05/19 | Dell Precision 7730 i7-8850H, Quadro P3200 | 3.3 kg | 30 mm | 17.30" | 1920x1080 | |
| 84.6 % v7 (old) | 02/19 | Fujitsu Celsius H980 i7-8750H, Quadro P3200 | 3.5 kg | 30 mm | 17.30" | 1920x1080 | |
| 85.2 % v7 (old) | 04/19 | MSI WT75 8SM E-2176G, Quadro P5200 | 4.1 kg | 51 mm | 17.30" | 3840x2160 | |
v (old) | Lenovo ThinkPad P72-20MB000EGE i7-8850H, Quadro P3200 | 3.4 kg | 29.4 mm | 17.30" | 1920x1080 |

| SD Card Reader | |
| average JPG Copy Test (av. of 3 runs) | |
| Dell Precision 7730 (Toshiba Exceria Pro SDXC 64 GB UHS-II) | |
| Lenovo ThinkPad P73-20QR002DGE (Toshiba Exceria Pro SDXC 64 GB UHS-II) | |
| MSI WT75 8SM (Toshiba Exceria Pro SDXC 64 GB UHS-II) | |
| Lenovo ThinkPad P72-20MB000EGE (Toshiba Exceria Pro SDXC 64 GB UHS-II) | |
| Fujitsu Celsius H980 (Toshiba Exceria Pro SDXC 64 GB UHS-II) | |
| Moyenne de la classe Workstation (49.6 - 681, n=14, 2 dernières années) | |
| maximum AS SSD Seq Read Test (1GB) | |
| Moyenne de la classe Workstation (87.6 - 1455, n=14, 2 dernières années) | |
| Dell Precision 7730 (Toshiba Exceria Pro SDXC 64 GB UHS-II) | |
| Lenovo ThinkPad P73-20QR002DGE (Toshiba Exceria Pro SDXC 64 GB UHS-II) | |
| Lenovo ThinkPad P72-20MB000EGE (Toshiba Exceria Pro SDXC 64 GB UHS-II) | |
| MSI WT75 8SM (Toshiba Exceria Pro SDXC 64 GB UHS-II) | |
| Fujitsu Celsius H980 (Toshiba Exceria Pro SDXC 64 GB UHS-II) | |
| Networking | |
| iperf3 transmit AX12 | |
| Dell Precision 7730 | |
| Lenovo ThinkPad P73-20QR002DGE | |
| Fujitsu Celsius H980 | |
| Lenovo ThinkPad P72-20MB000EGE | |
| MSI WT75 8SM | |
| iperf3 receive AX12 | |
| Fujitsu Celsius H980 | |
| Lenovo ThinkPad P72-20MB000EGE | |
| MSI WT75 8SM | |
| Dell Precision 7730 | |
| Lenovo ThinkPad P73-20QR002DGE | |
| |||||||||||||||||||||||||
Homogénéité de la luminosité: 83 %
Valeur mesurée au centre, sur batterie: 332 cd/m²
Contraste: 854:1 (Valeurs des noirs: 0.39 cd/m²)
ΔE ColorChecker Calman: 4.4 | ∀{0.5-29.43 Ø4.72}
calibrated: 2
ΔE Greyscale Calman: 5.1 | ∀{0.09-98 Ø4.97}
94% sRGB (Argyll 1.6.3 3D)
61.1% AdobeRGB 1998 (Argyll 1.6.3 3D)
67.8% AdobeRGB 1998 (Argyll 3D)
94.2% sRGB (Argyll 3D)
67.5% Display P3 (Argyll 3D)
Gamma: 2.39
CCT: 7061 K
| Lenovo ThinkPad P73-20QR002DGE N173HCE-E31, IPS LED, 1920x1080, 17.3" | Dell Precision 7730 B173HAN01.3, IPS LED, 1920x1080, 17.3" | Fujitsu Celsius H980 LG Philips, LP173WF4-SPF5, IPS, 1920x1080, 17.3" | MSI WT75 8SM AU Optronics B173ZAN01.0, IPS, 3840x2160, 17.3" | Lenovo ThinkPad P72-20MB000EGE LP173WF4_SPF7, IPS, 1920x1080, 17.3" | |
|---|---|---|---|---|---|
| Display | -2% | -6% | 22% | -6% | |
| Display P3 Coverage (%) | 67.5 | 65 -4% | 67.3 0% | 80.8 20% | 67.4 0% |
| sRGB Coverage (%) | 94.2 | 93.4 -1% | 85 -10% | 98.3 4% | 85 -10% |
| AdobeRGB 1998 Coverage (%) | 67.8 | 66.3 -2% | 62.2 -8% | 95.3 41% | 62.2 -8% |
| Response Times | -20% | 11% | 11% | -3% | |
| Response Time Grey 50% / Grey 80% * (ms) | 40 ? | 48.8 ? -22% | 38 ? 5% | 36 ? 10% | 40.8 ? -2% |
| Response Time Black / White * (ms) | 28 ? | 32.8 ? -17% | 23.2 ? 17% | 24.8 ? 11% | 28.8 ? -3% |
| PWM Frequency (Hz) | 25000 ? | 120500 ? | |||
| Screen | 23% | -13% | 6% | -0% | |
| Brightness middle (cd/m²) | 333 | 322 -3% | 400 20% | 327.9 -2% | 338 2% |
| Brightness (cd/m²) | 310 | 316 2% | 394 27% | 311 0% | 317 2% |
| Brightness Distribution (%) | 83 | 84 1% | 92 11% | 88 6% | 86 4% |
| Black Level * (cd/m²) | 0.39 | 0.24 38% | 0.51 -31% | 0.43 -10% | 0.28 28% |
| Contrast (:1) | 854 | 1342 57% | 784 -8% | 763 -11% | 1207 41% |
| Colorchecker dE 2000 * | 4.4 | 2.2 50% | 5.3 -20% | 4.41 -0% | 4.3 2% |
| Colorchecker dE 2000 max. * | 7.5 | 4.6 39% | 9.3 -24% | 10.07 -34% | 10.2 -36% |
| Colorchecker dE 2000 calibrated * | 2 | 1.9 5% | 3.8 -90% | 1.43 28% | 3.7 -85% |
| Greyscale dE 2000 * | 5.1 | 1.6 69% | 5.5 -8% | 2.9 43% | 2.2 57% |
| Gamma | 2.39 92% | 2.19 100% | 2.17 101% | 2.17 101% | 2.17 101% |
| CCT | 7061 92% | 6621 98% | 6686 97% | 6916 94% | 6621 98% |
| Color Space (Percent of AdobeRGB 1998) (%) | 61.1 | 60.4 -1% | 55.8 -9% | 84.2 38% | 55.8 -9% |
| Color Space (Percent of sRGB) (%) | 94 | 93.3 -1% | 84.9 -10% | 99 5% | 84.7 -10% |
| Moyenne finale (programmes/paramètres) | 0% /
13% | -3% /
-9% | 13% /
9% | -3% /
-2% |
* ... Moindre est la valeur, meilleures sont les performances
Temps de réponse de l'écran
| ↔ Temps de réponse noir à blanc | ||
|---|---|---|
| 28 ms ... hausse ↗ et chute ↘ combinées | ↗ 17.2 ms hausse | 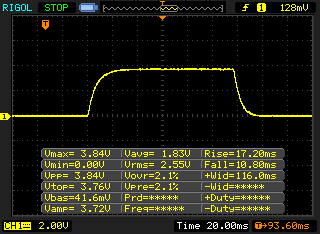 |
| ↘ 10.8 ms chute | ||
| L'écran souffre de latences relativement élevées, insuffisant pour le jeu. En comparaison, tous les appareils testés affichent entre 0.1 (minimum) et 240 (maximum) ms. » 71 % des appareils testés affichent de meilleures performances. Cela signifie que les latences relevées sont moins bonnes que la moyenne (19.8 ms) de tous les appareils testés. | ||
| ↔ Temps de réponse gris 50% à gris 80% | ||
| 40 ms ... hausse ↗ et chute ↘ combinées | ↗ 20.4 ms hausse | 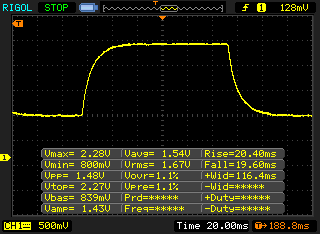 |
| ↘ 19.6 ms chute | ||
| L'écran souffre de latences très élevées, à éviter pour le jeu. En comparaison, tous les appareils testés affichent entre 0.165 (minimum) et 636 (maximum) ms. » 61 % des appareils testés affichent de meilleures performances. Cela signifie que les latences relevées sont moins bonnes que la moyenne (31 ms) de tous les appareils testés. | ||
Scintillement / MLI (Modulation de largeur d'impulsion)
| Scintillement / MLI (Modulation de largeur d'impulsion) décelé | 25000 Hz | ≤ 50 Niveau de luminosité | 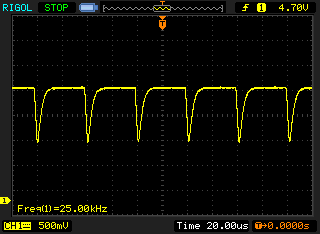 |
Le rétroéclairage de l'écran scintille à la fréquence de 25000 Hz (certainement du fait de l'utilisation d'une MDI - Modulation de largeur d'impulsion) à un niveau de luminosité inférieur ou égal à 50 % . Aucun scintillement ne devrait être perceptible au-dessus de cette valeur. La fréquence de rafraîchissement de 25000 Hz est élevée, la grande majorité des utilisateurs ne devrait pas percevoir de scintillements et être sujette à une fatigue oculaire accrue. En comparaison, 52 % des appareils testés n'emploient pas MDI pour assombrir leur écran. Nous avons relevé une moyenne à 7765 (minimum : 5 - maximum : 343500) Hz dans le cas où une MDI était active. | |||
| Cinebench R15 | |
| CPU Single 64Bit | |
| Moyenne de la classe Workstation (191.4 - 328, n=24, 2 dernières années) | |
| MSI WT75 8SM | |
| Moyenne Intel Core i7-9850H (192 - 196.5, n=3) | |
| Lenovo ThinkPad P73-20QR002DGE | |
| Lenovo ThinkPad P72-20MB000EGE | |
| Dell Precision 7730 | |
| Fujitsu Celsius H980 | |
| CPU Multi 64Bit | |
| Moyenne de la classe Workstation (2489 - 5810, n=24, 2 dernières années) | |
| MSI WT75 8SM | |
| Dell Precision 7730 | |
| Lenovo ThinkPad P73-20QR002DGE | |
| Lenovo ThinkPad P72-20MB000EGE | |
| Lenovo ThinkPad P72-20MB000EGE | |
| Moyenne Intel Core i7-9850H (1114 - 1272, n=3) | |
| Fujitsu Celsius H980 | |
| PCMark 8 | |
| Home Score Accelerated v2 | |
| MSI WT75 8SM | |
| Dell Precision 7730 | |
| Lenovo ThinkPad P72-20MB000EGE | |
| Fujitsu Celsius H980 | |
| Lenovo ThinkPad P73-20QR002DGE | |
| Moyenne Intel Core i7-9850H, NVIDIA Quadro RTX 3000 (Laptop) (n=1) | |
| Work Score Accelerated v2 | |
| Lenovo ThinkPad P72-20MB000EGE | |
| Dell Precision 7730 | |
| Lenovo ThinkPad P73-20QR002DGE | |
| Moyenne Intel Core i7-9850H, NVIDIA Quadro RTX 3000 (Laptop) (n=1) | |
| Fujitsu Celsius H980 | |
| MSI WT75 8SM | |
| PCMark 8 Home Score Accelerated v2 | 4271 points | |
| PCMark 8 Creative Score Accelerated v2 | 4087 points | |
| PCMark 8 Work Score Accelerated v2 | 5432 points | |
| PCMark 10 Score | 5768 points | |
Aide | ||
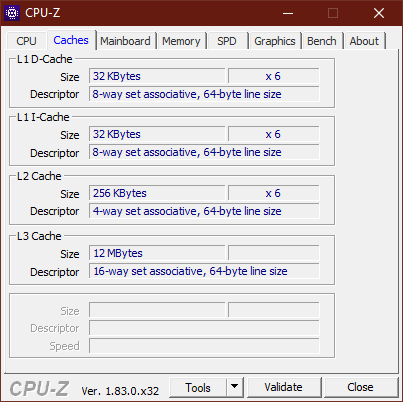
| Lenovo ThinkPad P73-20QR002DGE Intel SSD Pro 7600p SSDPEKKF512G8L | Dell Precision 7730 Samsung SSD PM981 MZVLB512HAJQ | Fujitsu Celsius H980 Samsung SSD PM981 MZVLB512HAJQ | MSI WT75 8SM Samsung SSD PM981 MZVLB512HAJQ | Lenovo ThinkPad P72-20MB000EGE Lenovo LENSE20256GMSP34MEAT2TA | Moyenne Intel SSD Pro 7600p SSDPEKKF512G8L | |
|---|---|---|---|---|---|---|
| CrystalDiskMark 5.2 / 6 | -12% | -20% | -8% | -19% | -11% | |
| Write 4K (MB/s) | 154.3 | 103.2 -33% | 111.8 -28% | 131.4 -15% | 101 -35% | 133.9 ? -13% |
| Read 4K (MB/s) | 66.4 | 41.39 -38% | 32.02 -52% | 46.15 -30% | 45.37 -32% | 59.1 ? -11% |
| Write Seq (MB/s) | 1561 | 1880 20% | 1539 -1% | 1584 1% | 1409 -10% | 1378 ? -12% |
| Read Seq (MB/s) | 2460 | 2350 -4% | 1252 -49% | 1787 -27% | 2129 -13% | 2341 ? -5% |
| Write 4K Q32T1 (MB/s) | 438 | 282.3 -36% | 355.4 -19% | 361.2 -18% | 320.3 -27% | 355 ? -19% |
| Read 4K Q32T1 (MB/s) | 568 | 314.3 -45% | 408.7 -28% | 426.1 -25% | 348.3 -39% | 429 ? -24% |
| Write Seq Q32T1 (MB/s) | 1581 | 1881 19% | 1913 21% | 1984 25% | 1529 -3% | 1514 ? -4% |
| Read Seq Q32T1 (MB/s) | 2724 | 3216 18% | 2530 -7% | 3374 24% | 2957 9% | 2677 ? -2% |

| 3DMark 11 - 1280x720 Performance GPU | |
| Moyenne de la classe Workstation (12535 - 69594, n=24, 2 dernières années) | |
| MSI WT75 8SM | |
| Lenovo ThinkPad P53-20QN000YGE | |
| Razer Blade Pro 17 RTX 2060 | |
| Moyenne NVIDIA Quadro RTX 3000 (Laptop) (17569 - 20542, n=4) | |
| Lenovo ThinkPad P73-20QR002DGE | |
| Lenovo ThinkPad P72-20MB000EGE | |
| Fujitsu Celsius H980 | |
| Dell Precision 7730 | |
| 3DMark | |
| 1280x720 Cloud Gate Standard Graphics | |
| Lenovo ThinkPad P53-20QN000YGE | |
| Moyenne de la classe Workstation (58392 - 152418, n=14, 2 dernières années) | |
| Razer Blade Pro 17 RTX 2060 | |
| MSI WT75 8SM | |
| Lenovo ThinkPad P73-20QR002DGE | |
| Moyenne NVIDIA Quadro RTX 3000 (Laptop) (62730 - 106470, n=3) | |
| Lenovo ThinkPad P72-20MB000EGE | |
| Dell Precision 7730 | |
| Fujitsu Celsius H980 | |
| 1920x1080 Fire Strike Graphics | |
| Moyenne de la classe Workstation (8293 - 52560, n=24, 2 dernières années) | |
| MSI WT75 8SM | |
| Lenovo ThinkPad P53-20QN000YGE | |
| Razer Blade Pro 17 RTX 2060 | |
| Moyenne NVIDIA Quadro RTX 3000 (Laptop) (13802 - 15881, n=2) | |
| Lenovo ThinkPad P73-20QR002DGE | |
| Dell Precision 7730 | |
| Lenovo ThinkPad P72-20MB000EGE | |
| Fujitsu Celsius H980 | |
| 2560x1440 Time Spy Graphics | |
| Moyenne de la classe Workstation (2725 - 24806, n=24, 2 dernières années) | |
| Lenovo ThinkPad P53-20QN000YGE | |
| Razer Blade Pro 17 RTX 2060 | |
| MSI WT75 8SM | |
| Moyenne NVIDIA Quadro RTX 3000 (Laptop) (5503 - 6014, n=3) | |
| Lenovo ThinkPad P73-20QR002DGE | |
| Lenovo ThinkPad P72-20MB000EGE | |
| Fujitsu Celsius H980 | |
| LuxMark v2.0 64Bit | |
| Room GPUs-only | |
| Moyenne de la classe Workstation (1760 - 6990, n=4, 2 dernières années) | |
| Lenovo ThinkPad P73-20QR002DGE | |
| Moyenne NVIDIA Quadro RTX 3000 (Laptop) (n=1) | |
| Dell Precision 7730 | |
| Fujitsu Celsius H980 | |
| Lenovo ThinkPad P53-20QN000YGE | |
| Lenovo ThinkPad P72-20MB000EGE | |
| Sala GPUs-only | |
| Moyenne de la classe Workstation (5177 - 13967, n=4, 2 dernières années) | |
| Lenovo ThinkPad P73-20QR002DGE | |
| Moyenne NVIDIA Quadro RTX 3000 (Laptop) (n=1) | |
| Lenovo ThinkPad P53-20QN000YGE | |
| Fujitsu Celsius H980 | |
| Dell Precision 7730 | |
| Lenovo ThinkPad P72-20MB000EGE | |
| 3DMark 06 Standard Score | 37304 points | |
| 3DMark Vantage P Result | 50309 points | |
| 3DMark 11 Performance | 15944 points | |
| 3DMark Ice Storm Standard Score | 98035 points | |
| 3DMark Cloud Gate Standard Score | 32163 points | |
| 3DMark Fire Strike Score | 12693 points | |
| 3DMark Time Spy Score | 5566 points | |
Aide | ||
| The Witcher 3 - 1920x1080 Ultra Graphics & Postprocessing (HBAO+) | |
| Moyenne de la classe Workstation (51 - 91.7, n=2, 2 dernières années) | |
| Lenovo ThinkPad P53-20QN000YGE | |
| MSI WT75 8SM | |
| Razer Blade Pro 17 RTX 2060 | |
| Moyenne NVIDIA Quadro RTX 3000 (Laptop) (53.9 - 59, n=2) | |
| Lenovo ThinkPad P73-20QR002DGE | |
| Dell Precision 7730 | |
| Lenovo ThinkPad P72-20MB000EGE | |
| Bas | Moyen | Élevé | Ultra | 4K | |
|---|---|---|---|---|---|
| BioShock Infinite (2013) | 349.5 | 294.1 | 275.2 | 140.3 | |
| The Witcher 3 (2015) | 274.9 | 182.7 | 101.3 | 53.9 | |
| Dota 2 Reborn (2015) | 142 | 130 | 132 | 121 | 88 |
| Rise of the Tomb Raider (2016) | 213.9 | 174.6 | 99.4 | 83 | |
| Rocket League (2017) | 219.1 | ||||
| X-Plane 11.11 (2018) | 114 | 102 | 86 | ||
| Assassin´s Creed Odyssey (2018) | 96 | 77 | 62 | 39 | |
| Far Cry New Dawn (2019) | 114 | 91 | 86 | 77 | |
| Total War: Three Kingdoms (2019) | 226.5 | 107.7 | 69.2 | 46 | |
| F1 2019 (2019) | 102 | 92 | 84 | 73 |
Degré de la nuisance sonore
| Au repos |
| 29.3 / 29.3 / 29.3 dB(A) |
| Fortement sollicité |
| 30.2 / 33.1 dB(A) |
 | ||
30 dB silencieux 40 dB(A) audible 50 dB(A) bruyant |
||
min: | ||
(-) La température maximale du côté supérieur est de 52.2 °C / 126 F, par rapport à la moyenne de 38.2 °C / 101 F, allant de 22.2 à 69.8 °C pour la classe Workstation.
(-) Le fond chauffe jusqu'à un maximum de 47.8 °C / 118 F, contre une moyenne de 41.1 °C / 106 F
(+) En utilisation inactive, la température moyenne du côté supérieur est de 26.3 °C / 79 F, par rapport à la moyenne du dispositif de 32 °C / 90 F.
(-) En jouant à The Witcher 3, la température moyenne du côté supérieur est de 43.1 °C / 110 F, alors que la moyenne de l'appareil est de 32 °C / 90 F.
(±) Les repose-poignets et le pavé tactile peuvent devenir très chauds au toucher, avec un maximum de 37.6 °C / 99.7# F.
(-) La température moyenne de la zone de l'appui-paume de dispositifs similaires était de 27.8 °C / 82 F (-9.8 °C / #-17.7 F).
Lenovo ThinkPad P73-20QR002DGE analyse audio
(-) | haut-parleurs pas très forts (70.2 dB)
Basses 100 - 315 Hz
(±) | basse réduite - en moyenne 14.5% inférieure à la médiane
(±) | la linéarité des basses est moyenne (14% delta à la fréquence précédente)
Médiums 400 - 2000 Hz
(±) | médiane supérieure - en moyenne 7.3% supérieure à la médiane
(+) | les médiums sont linéaires (5.1% delta à la fréquence précédente)
Aiguës 2 - 16 kHz
(±) | sommets réduits - en moyenne 5.1% plus bas que la médiane
(±) | la linéarité des aigus est moyenne (8% delta à la fréquence précédente)
Globalement 100 - 16 000 Hz
(±) | la linéarité du son global est moyenne (29.3% de différence avec la médiane)
Par rapport à la même classe
» 96% de tous les appareils testés de cette catégorie étaient meilleurs, 1% similaires, 3% pires
» Le meilleur avait un delta de 7%, la moyenne était de 17%, le pire était de 35%.
Par rapport à tous les appareils testés
» 87% de tous les appareils testés étaient meilleurs, 3% similaires, 10% pires
» Le meilleur avait un delta de 4%, la moyenne était de 24%, le pire était de 134%.
Dell Precision 7730 analyse audio
(±) | le niveau sonore du haut-parleur est moyen mais bon (81.1# dB)
Basses 100 - 315 Hz
(-) | presque aucune basse - en moyenne 16.7% plus bas que la médiane
(±) | la linéarité des basses est moyenne (11.6% delta à la fréquence précédente)
Médiums 400 - 2000 Hz
(±) | médiane réduite - en moyenne 5.4% inférieure à la médiane
(+) | les médiums sont linéaires (5.4% delta à la fréquence précédente)
Aiguës 2 - 16 kHz
(+) | des sommets équilibrés - à seulement 4% de la médiane
(+) | les aigus sont linéaires (5.8% delta à la fréquence précédente)
Globalement 100 - 16 000 Hz
(±) | la linéarité du son global est moyenne (17% de différence avec la médiane)
Par rapport à la même classe
» 49% de tous les appareils testés de cette catégorie étaient meilleurs, 10% similaires, 41% pires
» Le meilleur avait un delta de 7%, la moyenne était de 17%, le pire était de 35%.
Par rapport à tous les appareils testés
» 30% de tous les appareils testés étaient meilleurs, 8% similaires, 62% pires
» Le meilleur avait un delta de 4%, la moyenne était de 24%, le pire était de 134%.
| Éteint/en veille | |
| Au repos | |
| Fortement sollicité |
|
Légende:
min: | |
| Lenovo ThinkPad P73-20QR002DGE i7-9850H, Quadro RTX 3000 (Laptop), Intel SSD Pro 7600p SSDPEKKF512G8L, IPS LED, 1920x1080, 17.3" | Dell Precision 7730 i7-8850H, Quadro P3200, Samsung SSD PM981 MZVLB512HAJQ, IPS LED, 1920x1080, 17.3" | Fujitsu Celsius H980 i7-8750H, Quadro P3200, Samsung SSD PM981 MZVLB512HAJQ, IPS, 1920x1080, 17.3" | MSI WT75 8SM E-2176G, Quadro P5200, Samsung SSD PM981 MZVLB512HAJQ, IPS, 3840x2160, 17.3" | Lenovo ThinkPad P72-20MB000EGE i7-8850H, Quadro P3200, Lenovo LENSE20256GMSP34MEAT2TA, IPS, 1920x1080, 17.3" | Moyenne NVIDIA Quadro RTX 3000 (Laptop) | Moyenne de la classe Workstation | |
|---|---|---|---|---|---|---|---|
| Power Consumption | -11% | -35% | -120% | 21% | -9% | -3% | |
| Idle Minimum * (Watt) | 8.9 | 10.1 -13% | 14.8 -66% | 29 -226% | 4.6 48% | 9.8 ? -10% | 9.04 ? -2% |
| Idle Average * (Watt) | 12.8 | 18 -41% | 20.4 -59% | 37.1 -190% | 12.2 5% | 15.5 ? -21% | 13.8 ? -8% |
| Idle Maximum * (Watt) | 16.4 | 19.7 -20% | 21.5 -31% | 39.5 -141% | 15.4 6% | 17.5 ? -7% | 17.7 ? -8% |
| Load Average * (Watt) | 108.4 | 89.6 17% | 98.4 9% | 133.6 -23% | 79.6 27% | 109.8 ? -1% | 96.2 ? 11% |
| Witcher 3 ultra * (Watt) | 153 | 134 12% | 236.3 -54% | 86 44% | |||
| Load Maximum * (Watt) | 166 | 204 -23% | 213.5 -29% | 310 -87% | 176 -6% | 179.9 ? -8% | 178.5 ? -8% |
* ... Moindre est la valeur, meilleures sont les performances
| Lenovo ThinkPad P73-20QR002DGE i7-9850H, Quadro RTX 3000 (Laptop), 99 Wh | Dell Precision 7730 i7-8850H, Quadro P3200, 92 Wh | Fujitsu Celsius H980 i7-8750H, Quadro P3200, 96 Wh | MSI WT75 8SM E-2176G, Quadro P5200, 90 Wh | Lenovo ThinkPad P72-20MB000EGE i7-8850H, Quadro P3200, 99 Wh | Moyenne de la classe Workstation | |
|---|---|---|---|---|---|---|
| Autonomie de la batterie | -28% | -22% | -41% | 7% | -8% | |
| H.264 (h) | 9.8 | 5.8 -41% | 5.9 -40% | 12.3 26% | 9.51 ? -3% | |
| WiFi v1.3 (h) | 11.1 | 5.6 -50% | 8.3 -25% | 3.7 -67% | 11.2 1% | 8.52 ? -23% |
| Load (h) | 1.4 | 1.5 7% | 1.4 0% | 1.2 -14% | 1.3 -7% | 1.429 ? 2% |
| Reader / Idle (h) | 13.5 | 4 | 28.3 | 26.1 ? |
Points positifs
Points négatifs
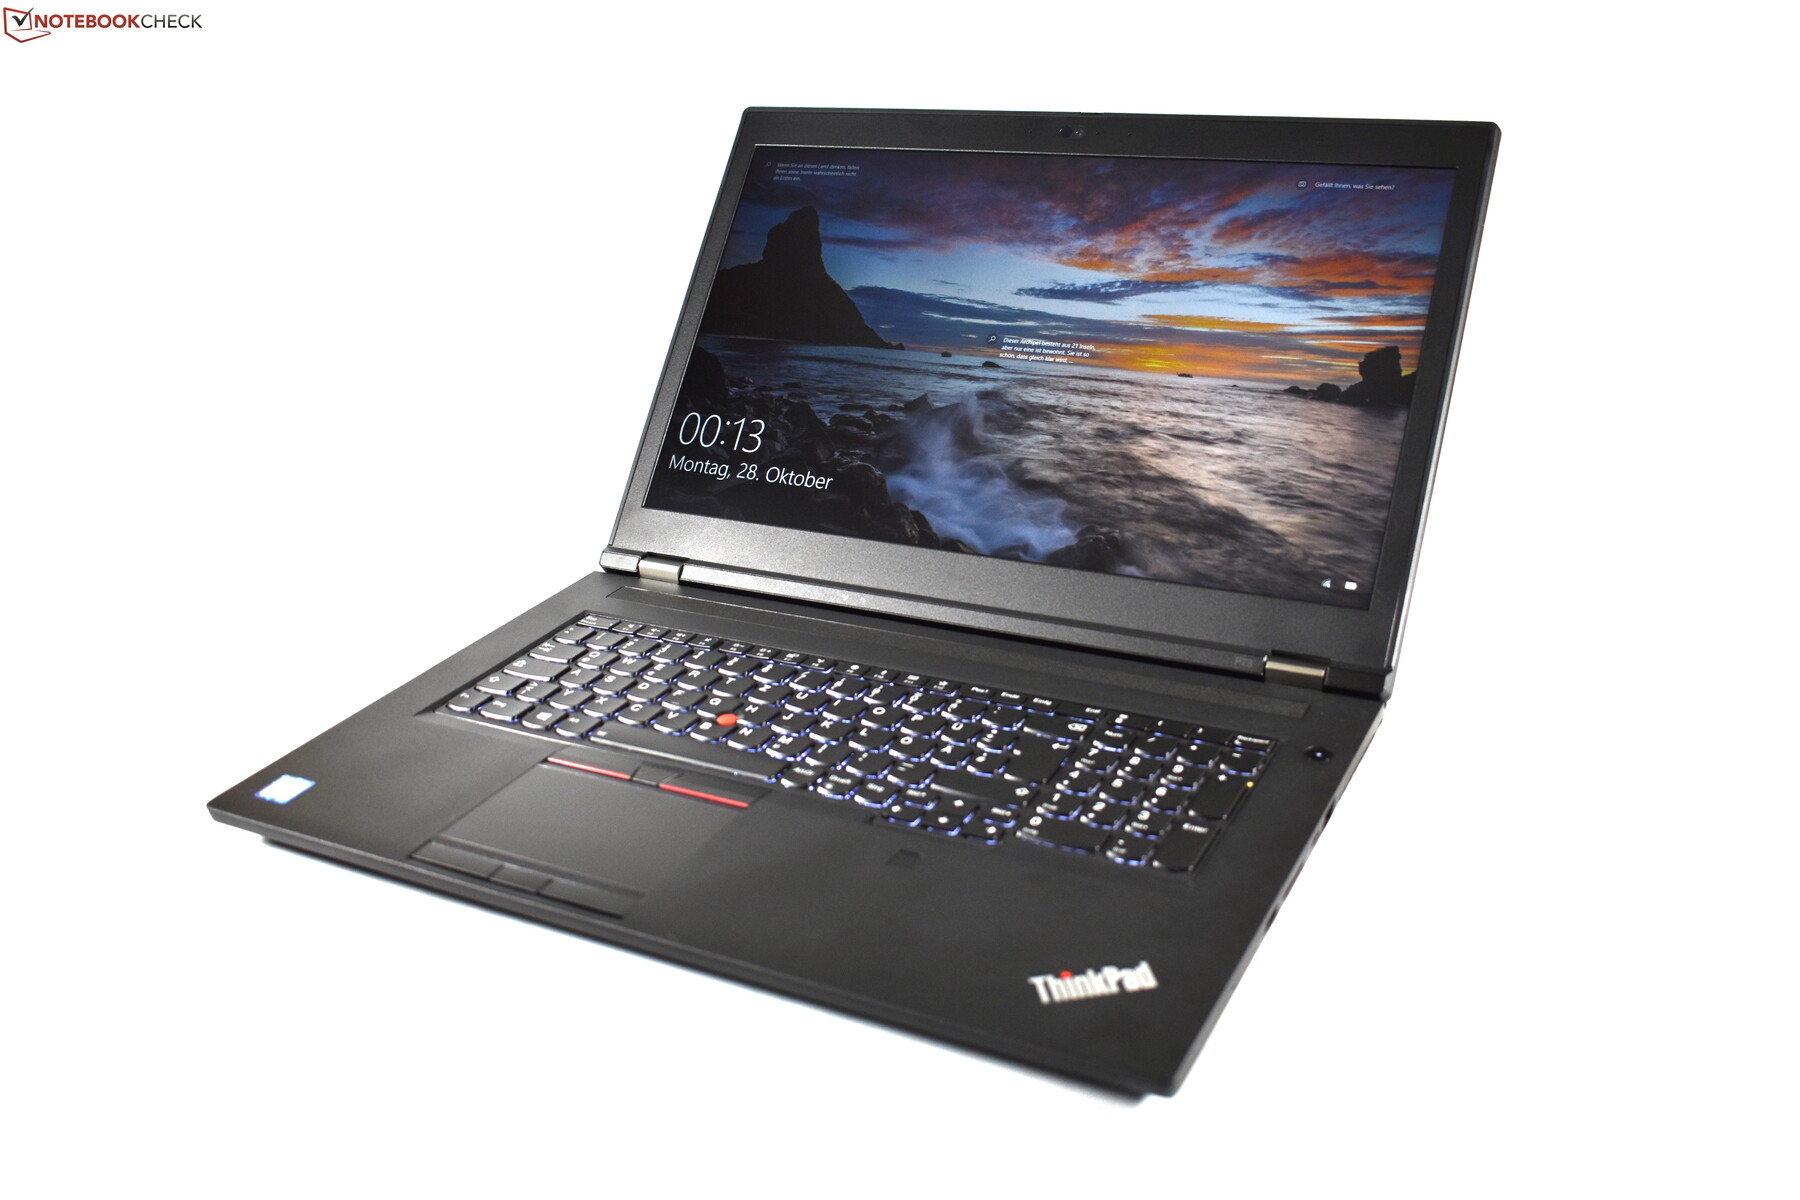

Notre configuration du Lenovo ThinkPad P73 coûte plus de 3 000 €. Malgré son prix, cette station de travail n’est pas parfaite.
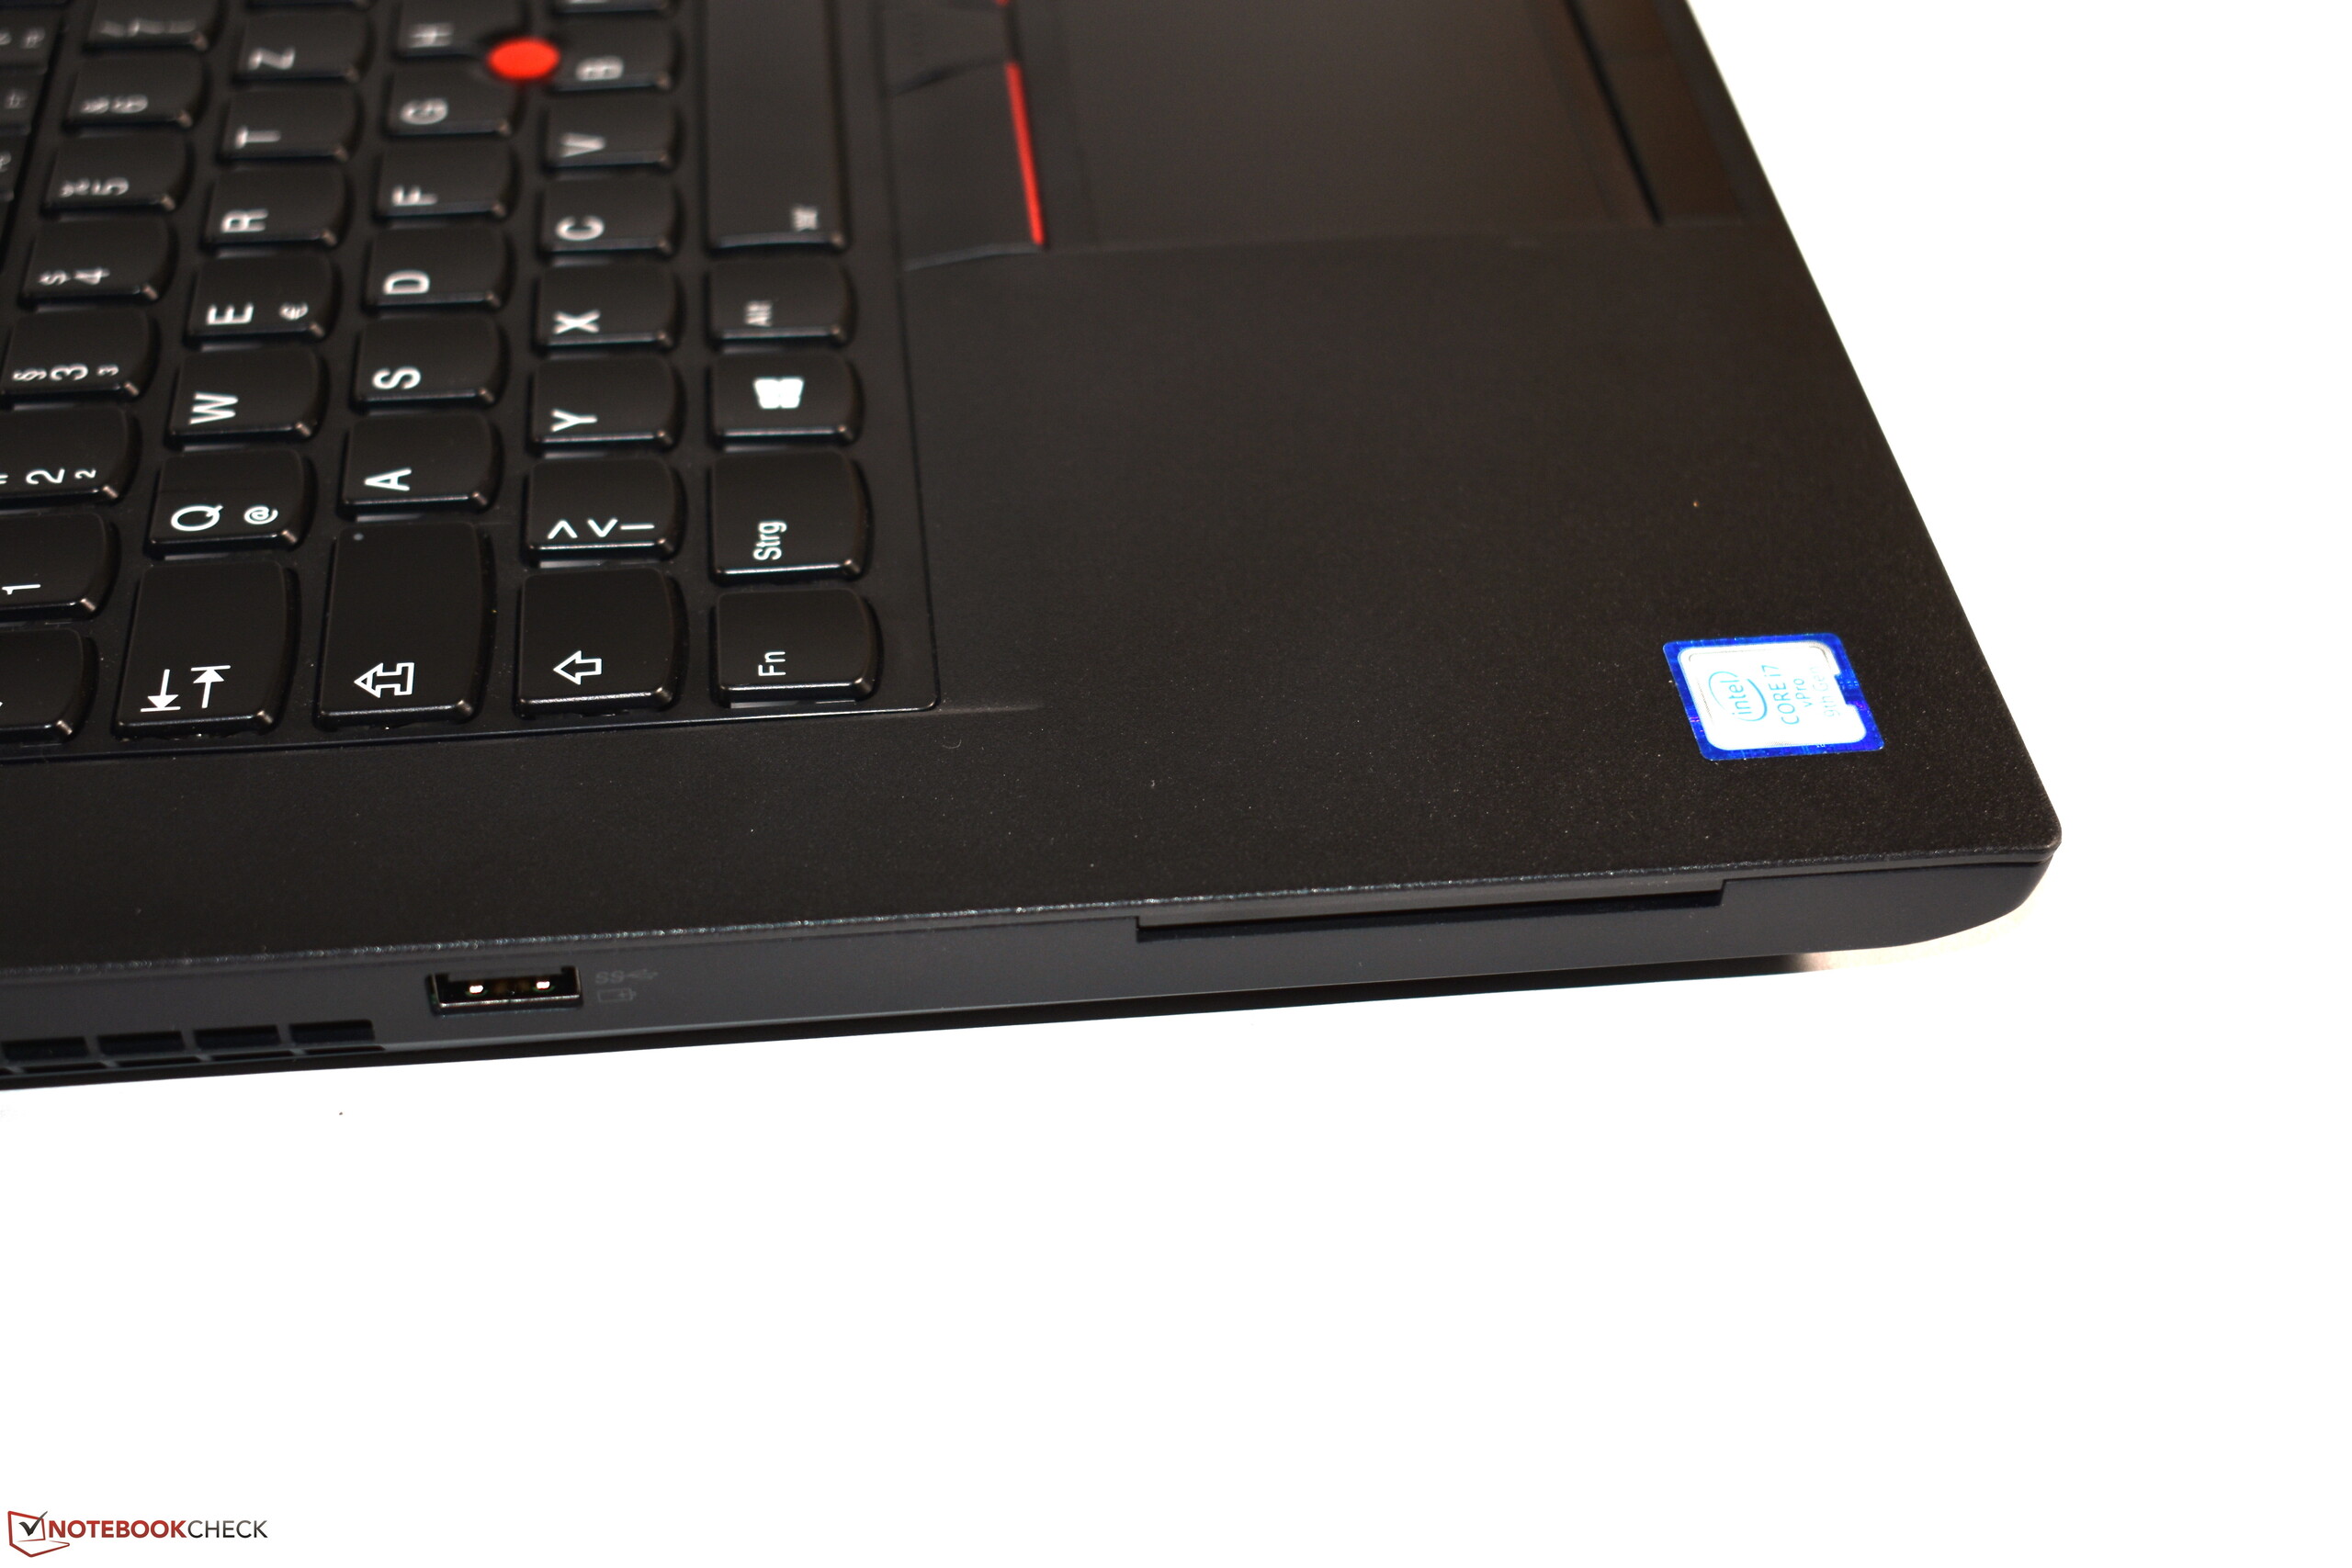
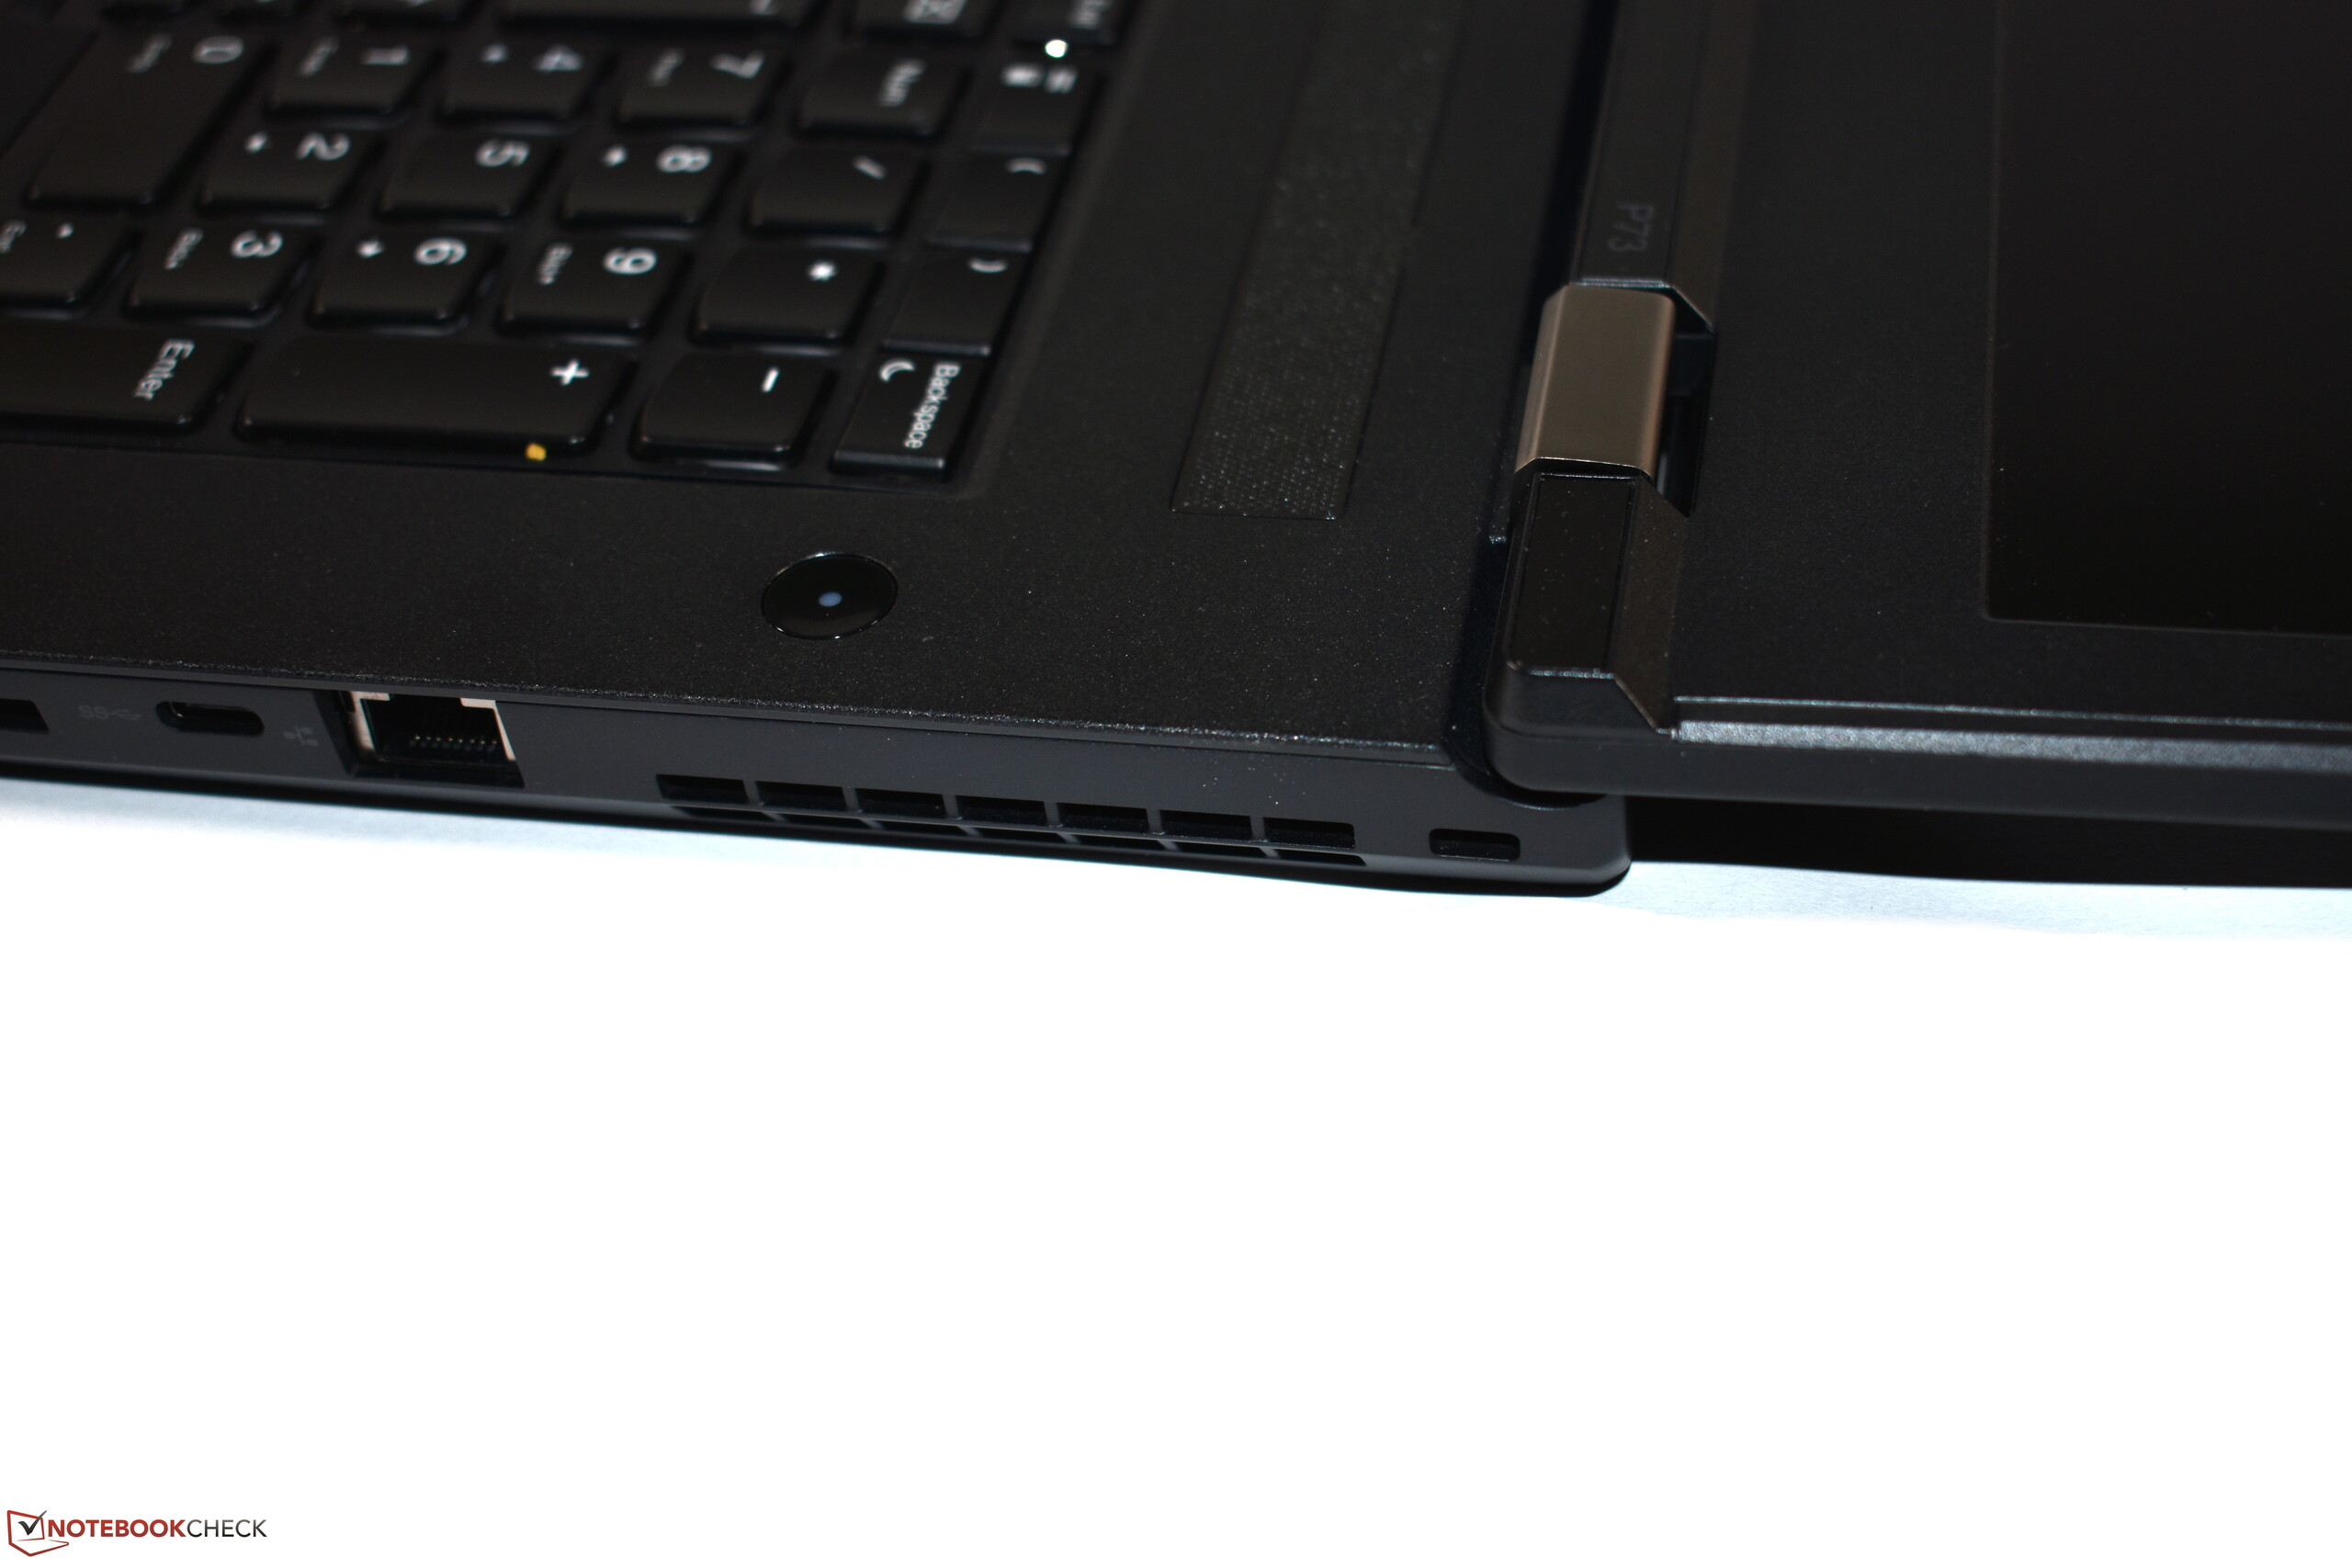
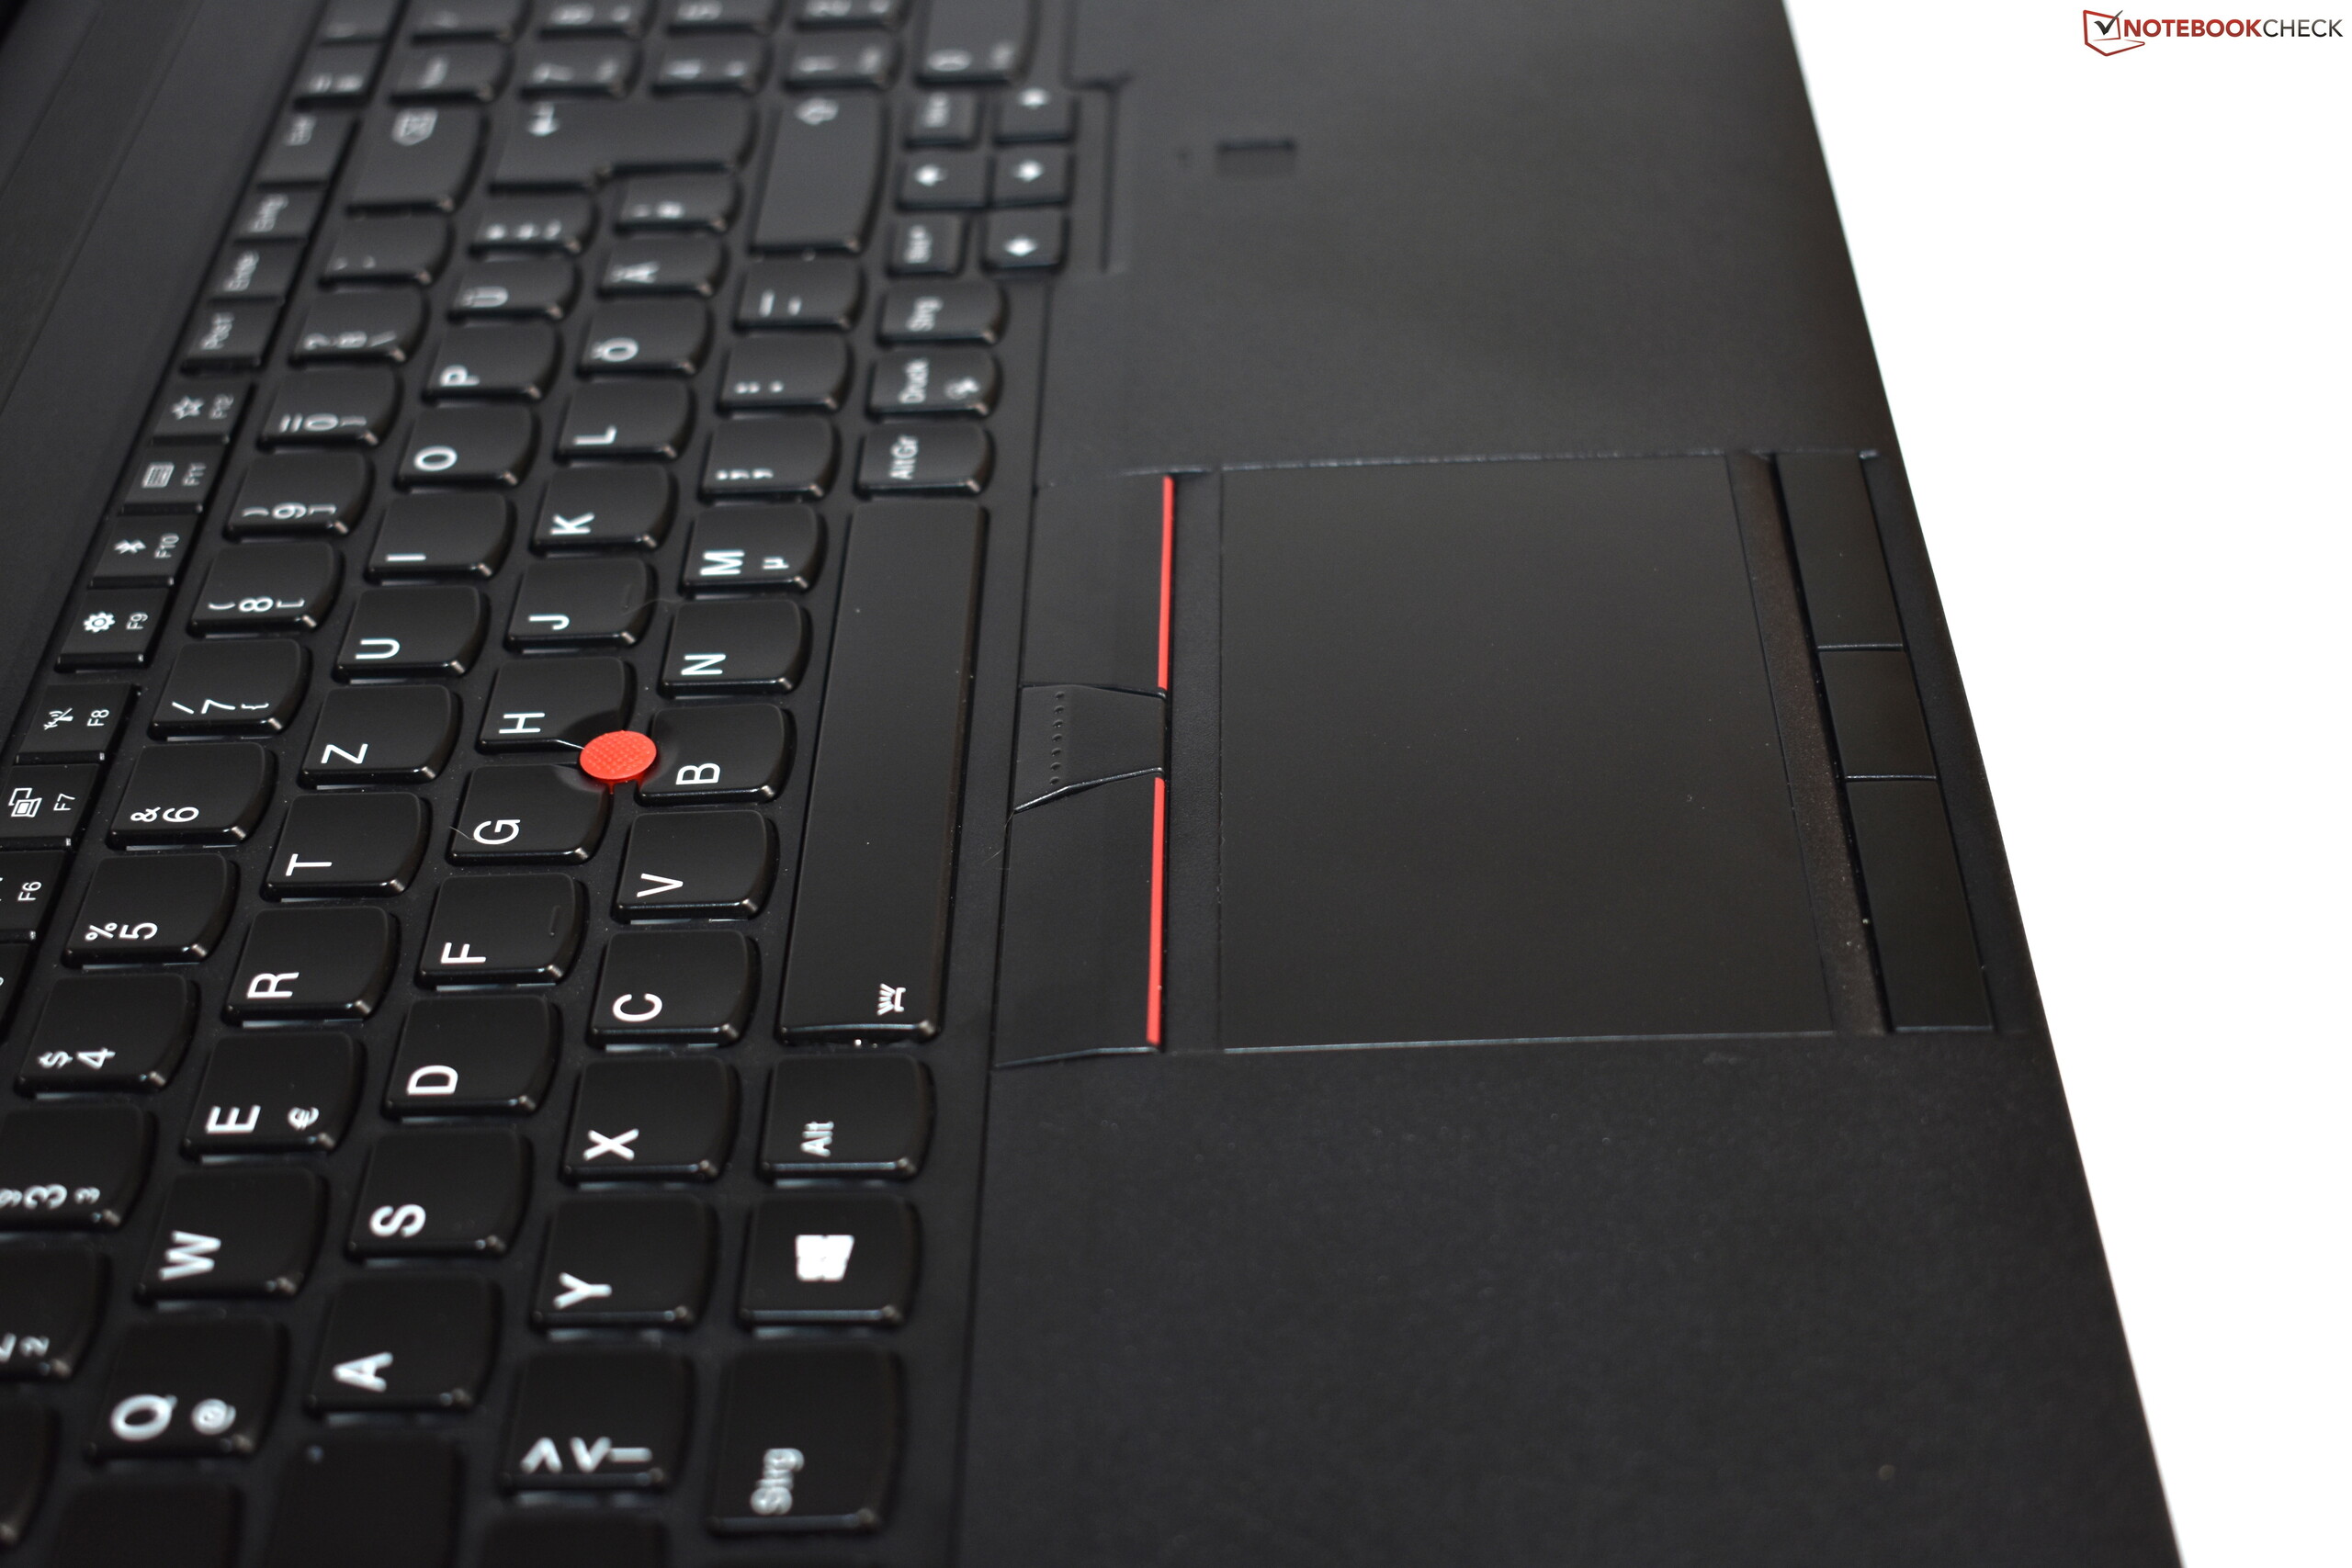
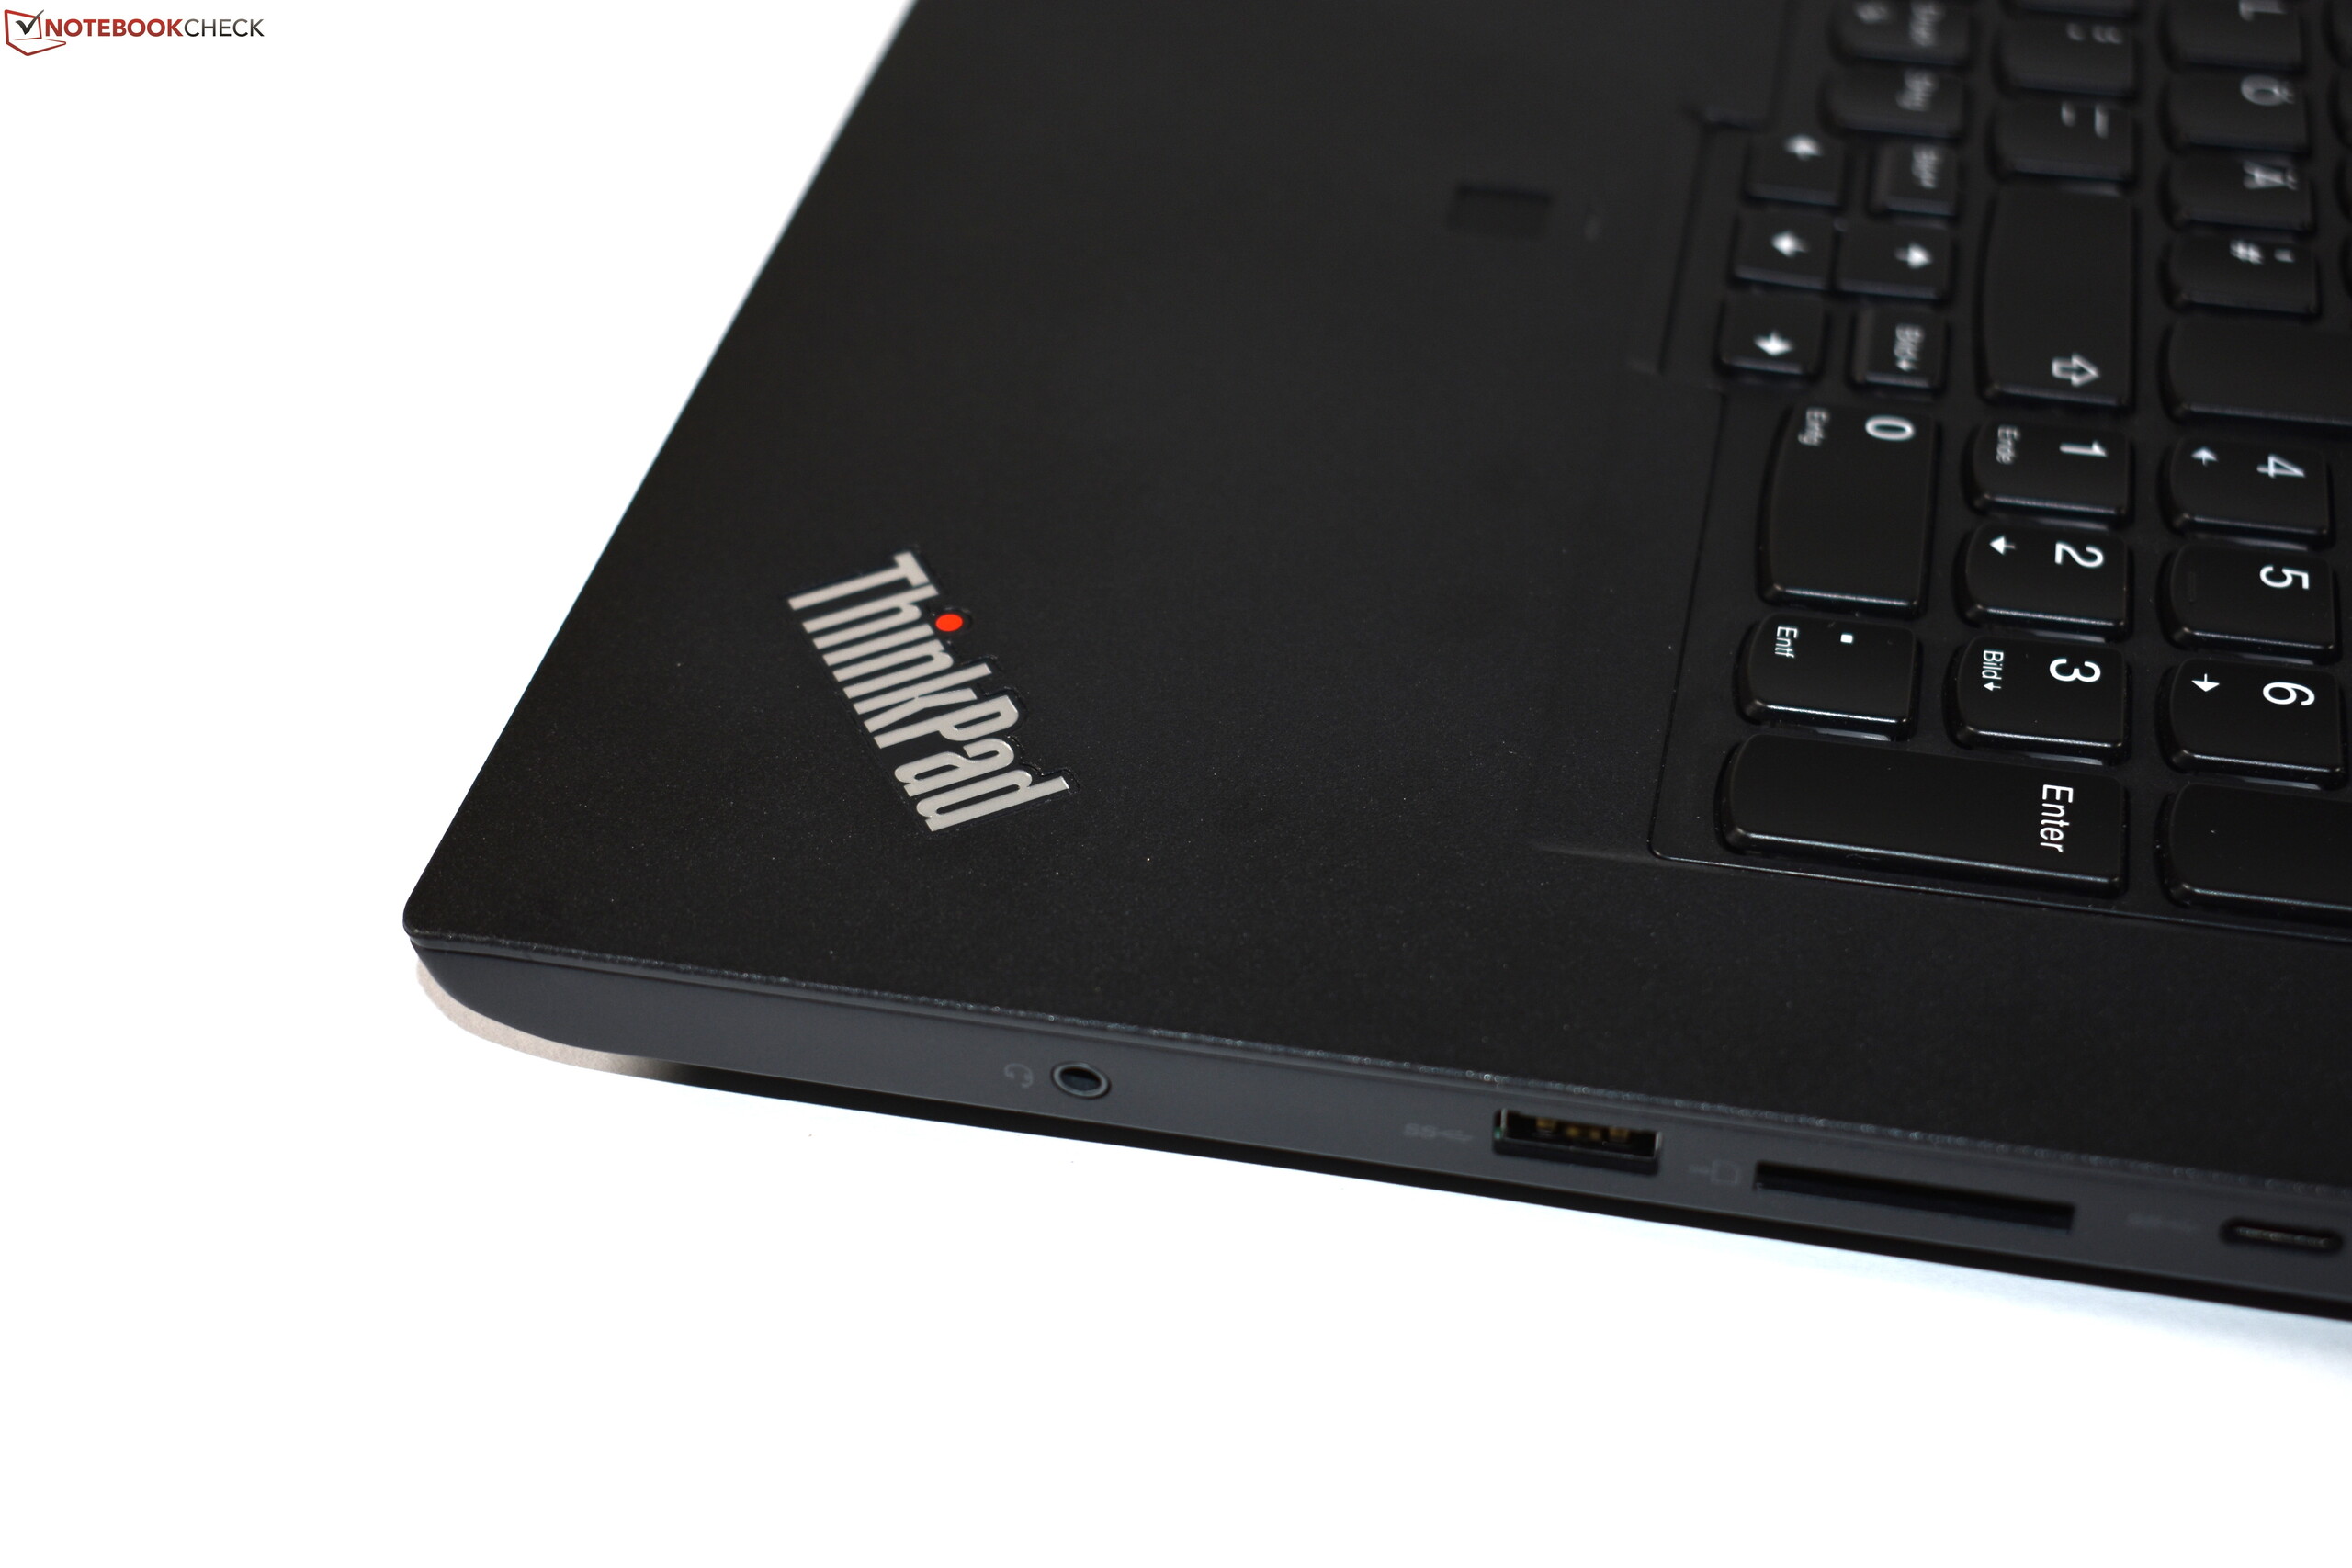
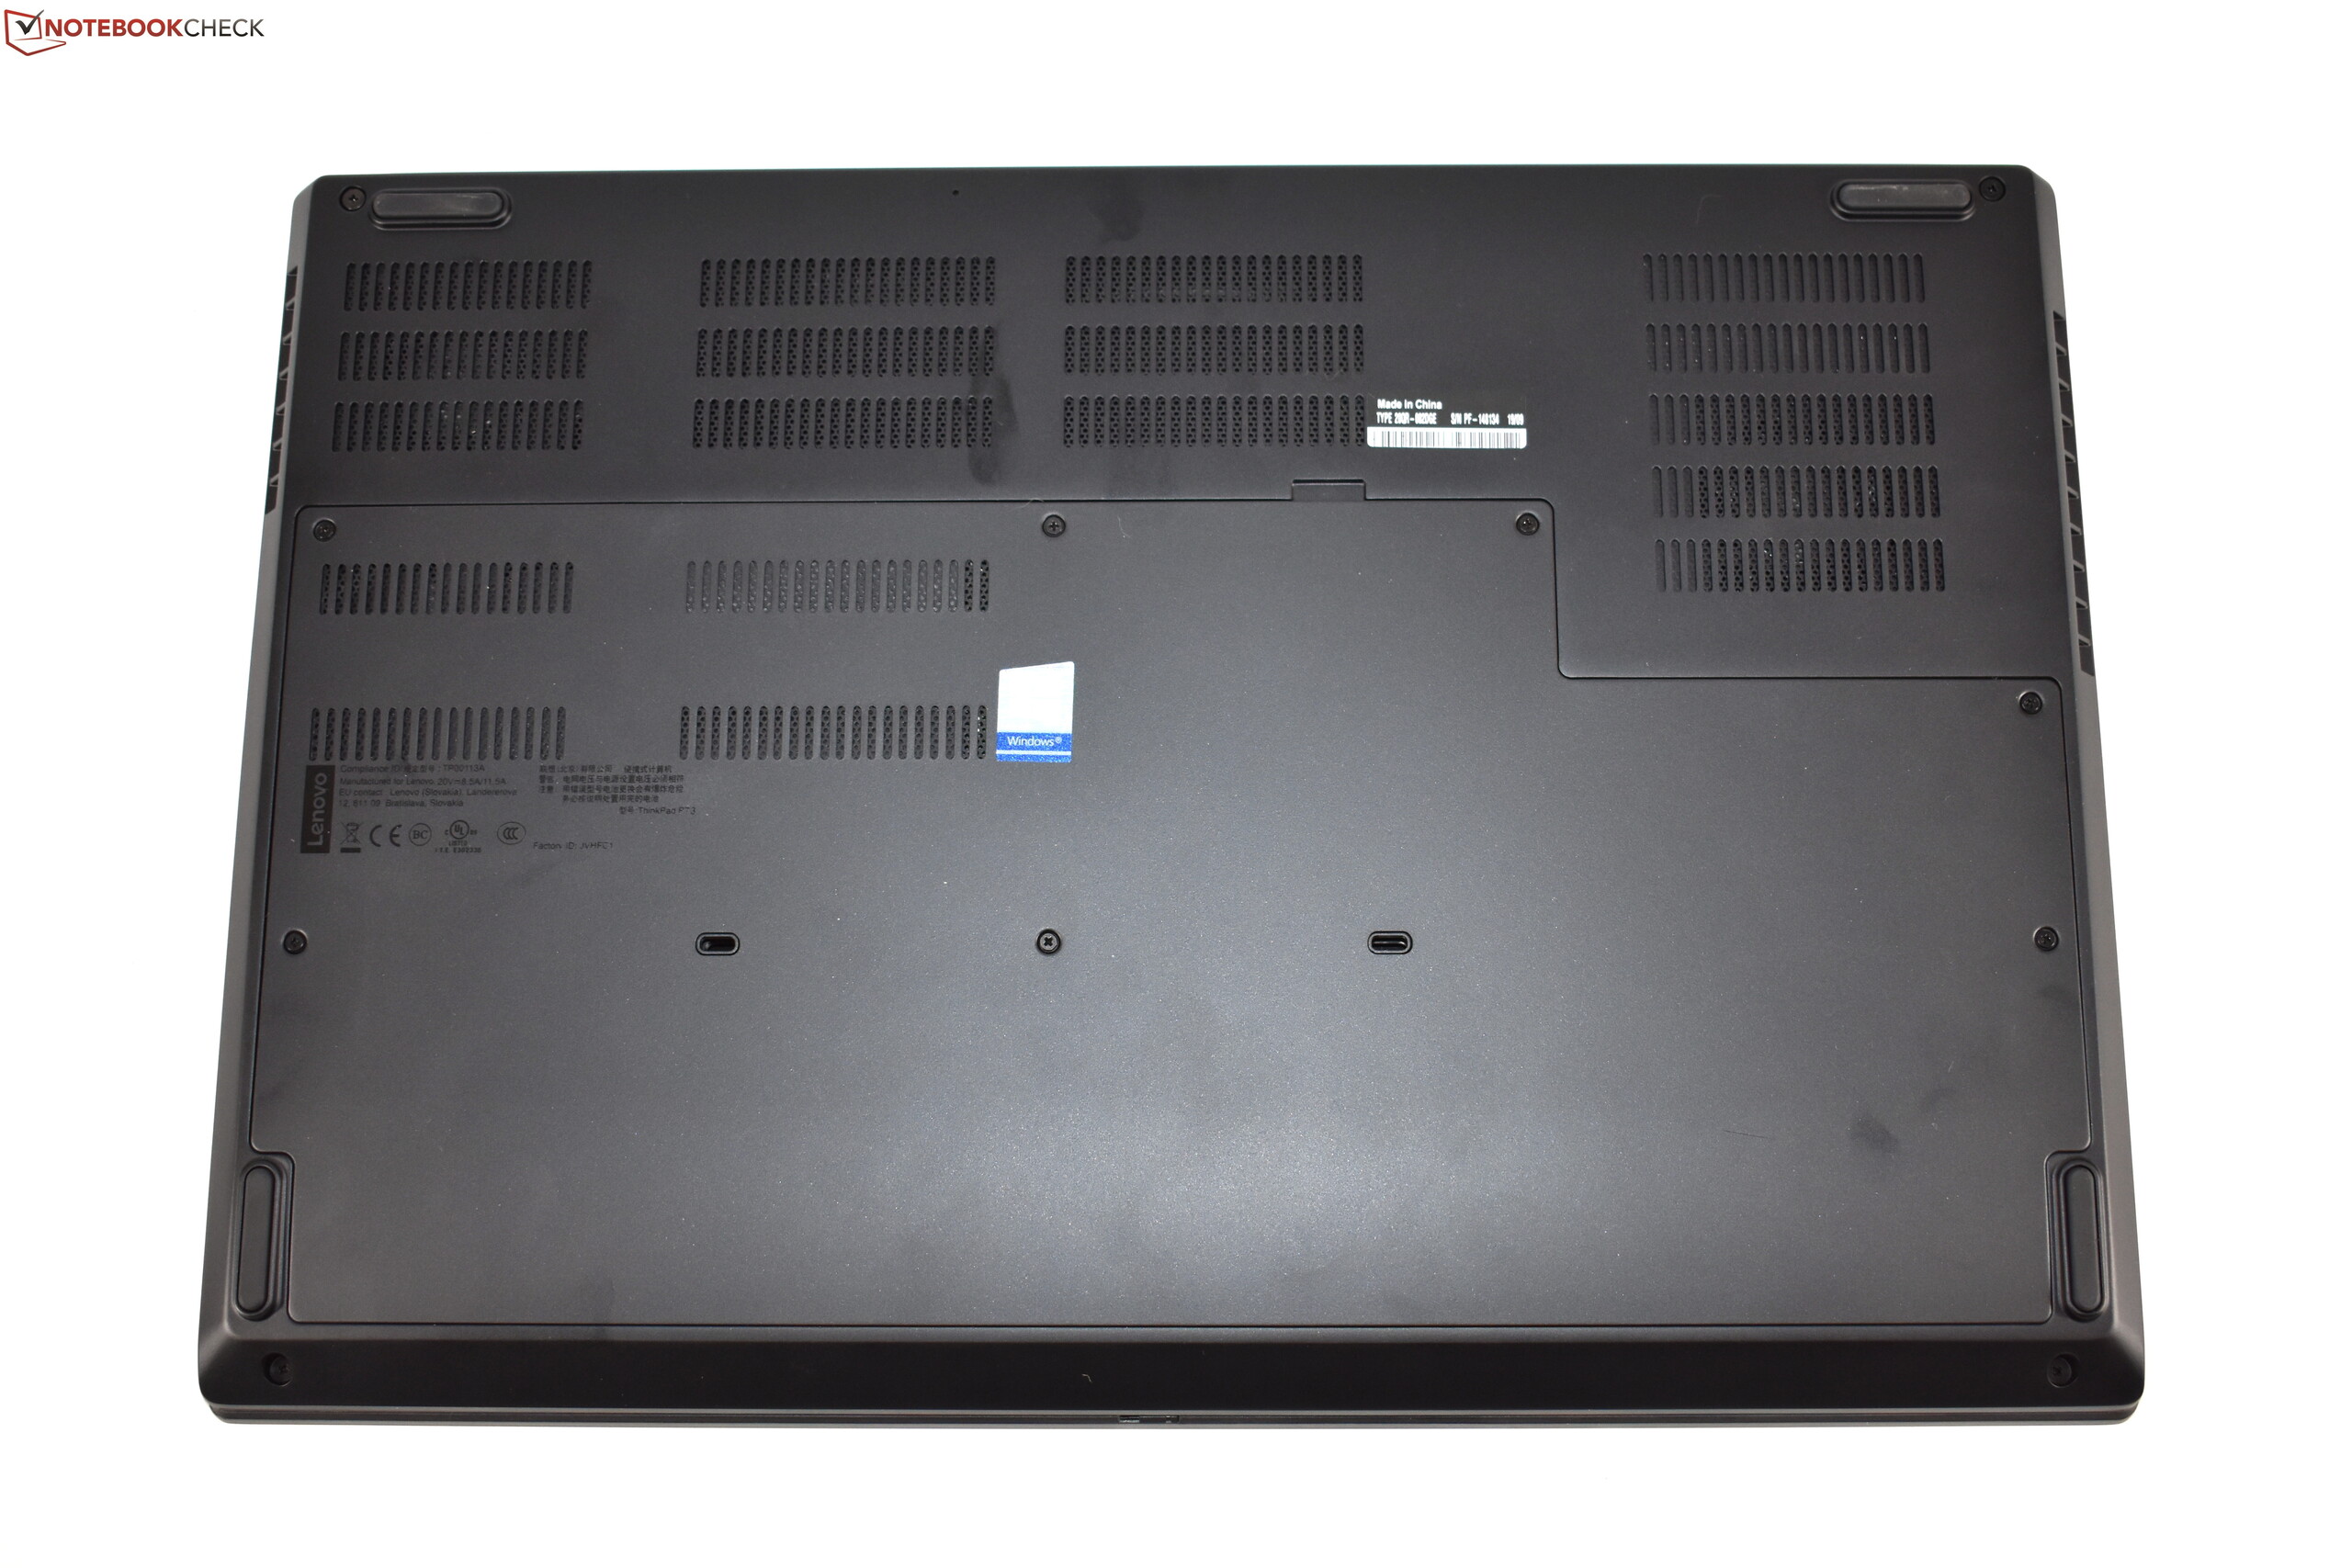
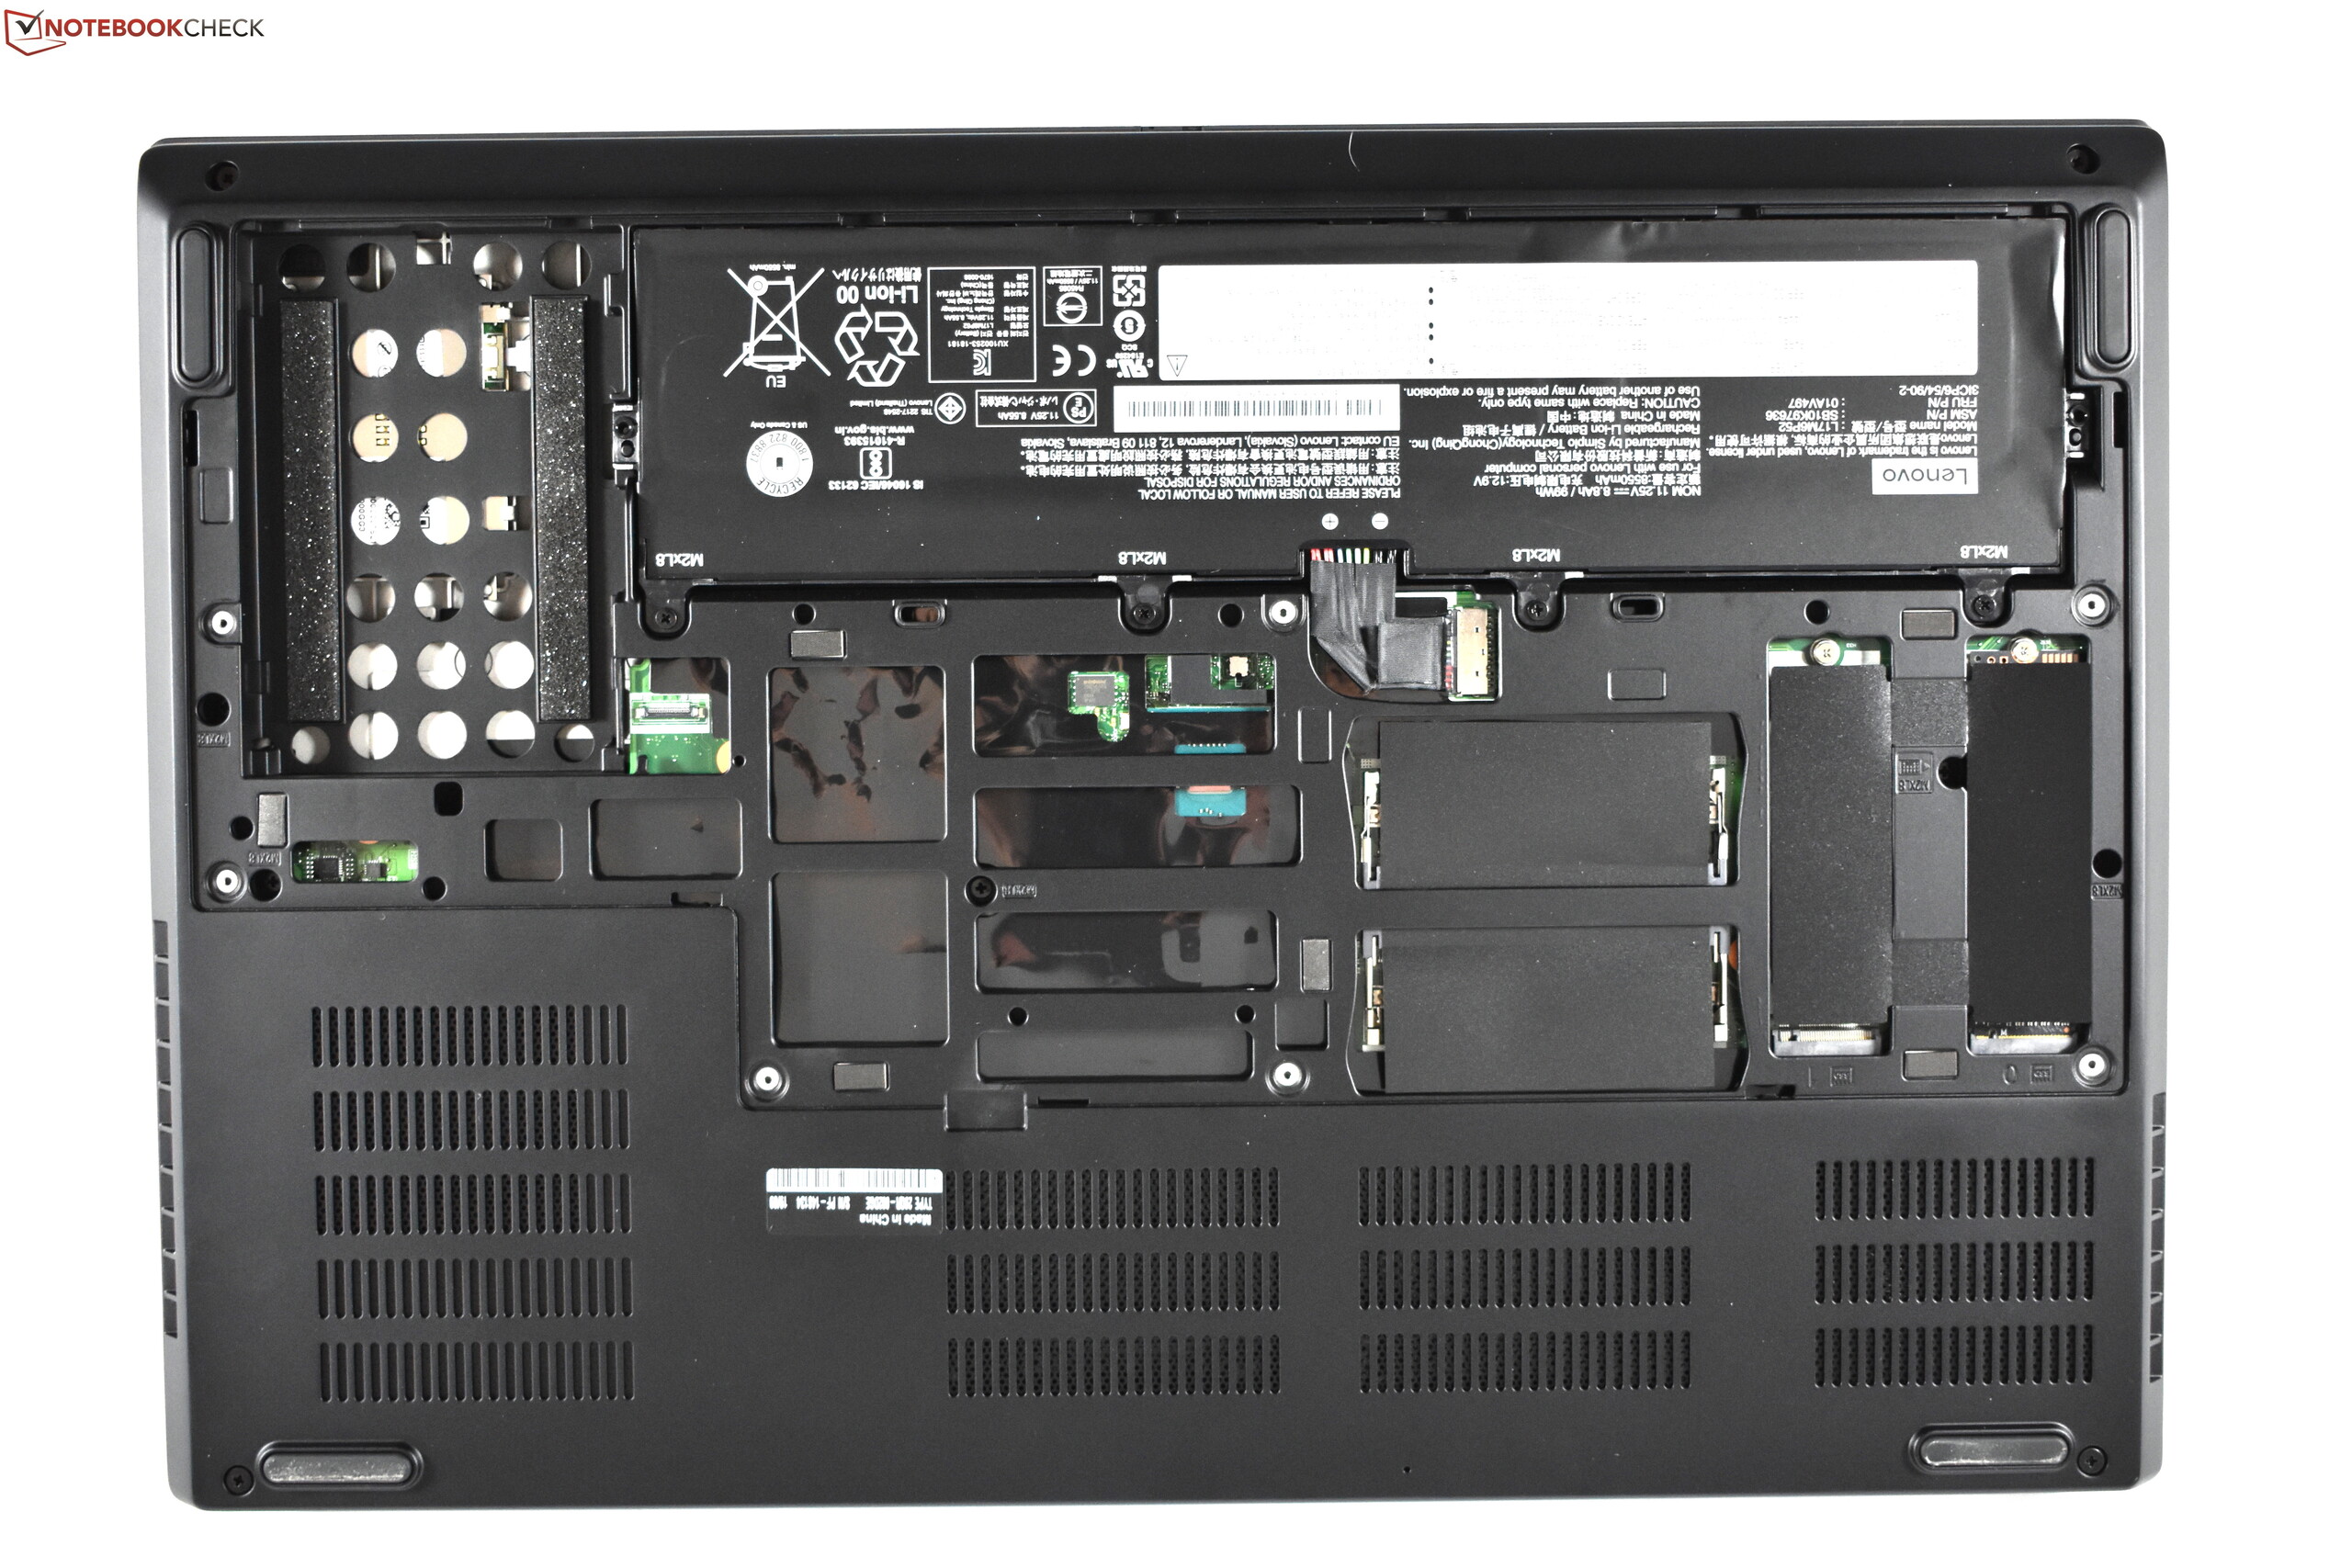
La liste des qualités de l’appareil inclut le châssis ThinkPad robuste, les excellents périphériques d’entrée, et l’autonomie étonnamment bonne. Et le système de refroidissement reste plutôt silencieux, même en cas de sollicitations, où il reste peu audible. L’évolutivité, avec trois emplacements de stockage et quatre de RAM est toujours exemplaire, tout comme la sélection des ports.
Le niveau de performances reste primordial pour une station de travail. Et on peut dire que le processeur du P73 est très rapide. Malheureusement, le GPU nous déçoit, les performances de la Nvidia Quadro RTX 3000 baissant en cas de sollicitations soutenues. Le ThinkPad chauffe beaucoup en cas de sollicitations. Les températures du châssis supérieures à 50 °C font trop. Ici, des ventilateurs plus actifs auraient été une bonne chose. Autre problème, les performances sont limitées quand l’appareil est sur batterie.
Un Lenovo ThinkPad P73 plutôt puissant, gêné par des températures élevées et des performances graphiques de ce fait instables.
Nous pouvons néanmoins recommander le Lenovo ThinkPad P73. Mais tel qu’il est ici, il n’offre pas de réel avantage sur l’ancien ThinkPad P72. Peut-être que Lenovo devrait retravailler la gestion des ventilateurs, pour les laisser tourner plus vite quand la machine est sollicitée.
L’intégralité de cette critique est disponible en anglais en suivant ce lien.
Lenovo ThinkPad P73-20QR002DGE
- 11/21/2019 v7 (old)
Benjamin Herzig
Price comparison
