
Notebookcheck Logo

Intel Core i7-9850H

Intel i7-9850H

L'Intel Core i7-9850H est un processeur haut de gamme six cœurs pour les portables, basé sur l'architecture Coffee Lake (2019 Refresh, CFL-HR). Il est cadencé entre 2,6 et 4,6 GHz (4 GHz avec 6 cœurs), et peut exécuter jusqu'à 12 threads simultanément grâce à l'Hyperthreading. D'après Intel, le processeur est gravé en 14 nm amélioré (14 nm++). Par rapport à son prédécesseur, le Core i7-8850H, le 9850H ne propose qu'une fréquence améliorée.

L'architecture Coffee Lake est similaire à Kaby Lake, et ne diffère que du nombre de cœurs (six cœurs pour les versions haut de gammes) et du procédé de gravure amélioré (14 nm++ d'après Intel).

Performances

Grâce aux deux cœurs supplémentaires, les performances ont augmenté de presque 50 % Par rapport à un processeur Kaby Lake du même type comme le Core i7-7920HQ (3,1 - 4,1 GHz). Les performances monocœur n'ont pas progressé depuis le prédécesseur Kaby Lake. Par rapport au i7-8850H, les performances n'ont que légèrement progressé.

Graphismes

L'iGPU intégré Intel UHD Graphics 630 est censé proposer des performances légèrements supérieures que précédemment, sa fréquence ayant progressé de 50 MHz (rumeur). L'architecture est identique à celle de l'Intel HD Graphics 630. Nous nous attendons à des gains de performances, mais s'agissant d'une solution bas de gamme, il ne pourra faire tourner les jeux récents fluidement qu'à un niveau de détails réduits - s'il les fait effectivement marcher.

Consommation

Intel indique une enveloppe thermique de 45 W, qui fait que cet i7 n'est adapté qu'aux gros portables avec une bonne solution de refroidissement. Grâce au cTDP-down, le CPU peut également être configuré avec une enveloppe thermique (TDP) de 35 W, avec des performances inférieures.

GammeIntel Coffee Lake
Nom de codeCoffee Lake-H

Gamme: Coffee Lake Coffee Lake-H

Intel Core i9-9980HK2.4 - 5 GHz8 / 16 cores16 MB L3
Intel Core i9-9880H2.3 - 4.8 GHz8 / 16 cores16 MB L3
Intel Core i9-8950HK2.9 - 4.8 GHz6 / 12 cores12 MB L3
Intel Xeon E-2186M2.9 - 4.8 GHz6 / 12 cores12 MB L3
Intel Xeon E-2276M2.8 - 4.7 GHz6 / 12 cores12 MB L3
Intel Core i7-9850H « 2.6 - 4.6 GHz6 / 12 cores12 MB L3
Intel Core i7-9750H2.6 - 4.5 GHz6 / 12 cores12 MB L3
Intel Xeon E-2176M2.7 - 4.4 GHz6 / 12 cores12 MB L3
Intel Core i7-8850H2.6 - 4.3 GHz6 / 12 cores9 MB L3
Intel Core i7-8750H2.2 - 4.1 GHz6 / 12 cores9 MB L3
Intel Core i5-9400H2.5 - 4.3 GHz4 / 8 cores8 MB L3
Intel Core i5-9300HF2.4 - 4.1 GHz4 / 8 cores8 MB L3
Intel Core i5-9300H2.4 - 4.1 GHz4 / 8 cores8 MB L3
Intel Core i5-8400H2.5 - 4.2 GHz4 / 8 cores8 MB L3
Intel Core i5-8300H2.3 - 4 GHz4 / 8 cores8 MB L3
Intel Core i3-8100H3 GHz4 / 4 cores8 MB L3
Fréquence2600 - 4600 MHz
Cache de Niveau 1 (L1)384 KB
Cache de Niveau 2 (L2)1.5 MB
Cache de Niveau 3 (L3)12 MB
Nombres de cœurs/threads simultanés supportés6 / 12
Consommation énergétique maximale (TDP)45 Watt(s)
Lithographie (procédé de fabrication)14 nm
SocketFCBGA1440
FonctionnalitésDual-Channel DDR4 Memory Controller, HyperThreading, AVX, AVX2, Quick Sync, Virtualization, AES-NI
Carte graphiqueIntel UHD Graphics 630 (350 - 1150 MHz)
64 BitPrend en charge les instructions 64 Bit
Architecturex86
Date de présentation04/30/2019

Benchmarks

Performance Rating - CB R15 + R20 + 7-Zip + X265 + Blender + 3DM11 CPU
32.9 pt (46%)
Cinebench R20 - Cinebench R20 CPU (Single Core)
min: 425     moyenne: 439.5     médian: 439.5 (49%)     maximum: 454 Points
Cinebench R20 - Cinebench R20 CPU (Multi Core)
min: 1800     moyenne: 2114     médian: 2114 (5%)     maximum: 2428 Points
Cinebench R15 - Cinebench R15 CPU Multi 64 Bit
min: 1114     moyenne: 1205     médian: 1230 (8%)     maximum: 1272 Points
31 -97%
...
1098 -9%
1113 -8%
1117 -7%
1122 -7%
1129 -6%
1153 -4%
1182 -2%
Intel Core i7-9750H
1182 -2%
1196 -1%
Intel Core i7-9850H
1205
1220 1%
1220 1%
Apple M2
1222 1%
1232 2%
Intel Core i5-1240U
1242 3%
1243 3%
Intel Core i7-1265U
1244 3%
1249 4%
1263 5%
...
5600 365%
max:
15842 1215%
0%
100%
065130195260325390455520585650715780845910975104011051170Tooltip
Cinebench R15 - Cinebench R15 CPU Single 64 Bit
min: 192     moyenne: 193.8     médian: 193 (58%)     maximum: 196.5 Points
Cinebench R11.5 - Cinebench R11.5 CPU Multi 64 Bit
12.5 Points (16%)
Cinebench R11.5 - Cinebench R11.5 CPU Single 64 Bit
2.1 Points (53%)
Cinebench R10 - Cinebench R10 Rend. Single (32bit)
7169 points (43%)
Cinebench R10 - Cinebench R10 Rend. Multi (64bit)
42090 Points (29%)
Cinebench R10 - Cinebench R10 Rend. Single (64bit)
9224 Points (11%)
wPrime 2.10 - wPrime 2.0 1024m *
278 s (3%)
7-Zip 18.03 - 7-Zip 18.03 Multli Thread 4 runs
min: 25786     moyenne: 29714     médian: 31087 (18%)     maximum: 32268 MIPS
7-Zip 18.03 - 7-Zip 18.03 Single Thread 4 runs
min: 5020     moyenne: 5066     médian: 5086 (61%)     maximum: 5092 MIPS
X264 HD Benchmark 4.0 - x264 Pass 2
68.3 fps (24%)
X264 HD Benchmark 4.0 - x264 Pass 1
201.3 fps (46%)
HWBOT x265 Benchmark v2.2 - HWBOT x265 4k Preset
min: 7     moyenne: 8.4     médian: 9 (16%)     maximum: 9.1 fps
01234567891011121314151617Tooltip
TrueCrypt - TrueCrypt Serpent
0.8 GB/s (23%)
Blender - Blender 2.79 BMW27 CPU *
min: 411     moyenne: 459.3     médian: 415 (3%)     maximum: 552 Seconds
3DMark 06 - CPU - 3DMark 06 - CPU
min: 9137     moyenne: 10056     médian: 10056 (21%)     maximum: 10975 Points
Super Pi Mod 1.5 XS 32M - Super Pi mod 1.5 XS 32M *
467.6 s (2%)
3DMark Vantage - 3DM Vant. Perf. CPU no Physx
min: 26292     moyenne: 34763     médian: 37665 (33%)     maximum: 40333 Points
3DMark 11 - 3DM11 Performance Physics
min: 9987     moyenne: 11361     médian: 11512 (31%)     maximum: 12585 Points
3DMark - 3DMark Ice Storm Physics
min: 54664     moyenne: 57802     médian: 56870 (46%)     maximum: 61872 Points
3DMark - 3DMark Cloud Gate Physics
min: 8390     moyenne: 9853     médian: 9841 (25%)     maximum: 11328 Points
3DMark - 3DMark Fire Strike Standard Physics
min: 14059     moyenne: 15802     médian: 15330 (27%)     maximum: 18016 Points
3DMark - 3DMark Time Spy CPU
min: 4588     moyenne: 5605     médian: 5953 (25%)     maximum: 6275 Points
Geekbench 5.5 - Geekbench 5.1 - 5.4 64 Bit Single-Core
1150 points (49%)
125 -89%
...
1109 -4%
1115 -3%
1121 -3%
1127 -2%
1133 -1%
1134 -1%
1136 -1%
1140 -1%
1143 -1%
Intel Core i7-9850H
1150
1153 0%
1156 1%
Intel Core i5-1035G7
1163 1%
1164 1%
1166 1%
1167 1%
1170 2%
Intel Core i7-1068G7
1173 2%
1176 2%
...
2331 103%
0%
100%
Geekbench 5.0 - Geekbench 5.0 64 Bit Single-Core
min: 1135     moyenne: 1169     médian: 1169 (5%)     maximum: 1203 points
Geekbench 5.0 - Geekbench 5.0 64 Bit Multi-Core
min: 5353     moyenne: 5620     médian: 5619.5 (18%)     maximum: 5886 points
Geekbench 4.4 - Geekbench 4.1 - 4.4 64 Bit Single-Core
min: 5320     moyenne: 5509     médian: 5594 (56%)     maximum: 5614 points
Geekbench 4.4 - Geekbench 4.1 - 4.4 64 Bit Multi-Core
min: 18098     moyenne: 22010     médian: 23715 (26%)     maximum: 24218 points
Geekbench 4.0 - Geekbench 4.0 64 Bit Single-Core
5376 points (73%)
Geekbench 4.0 - Geekbench 4.0 64 Bit Multi-Core
20077 points (49%)
Mozilla Kraken 1.1 - Kraken 1.1 Total Score *
min: 1010     moyenne: 1018     médian: 1015 (1%)     maximum: 1028 ms
Octane V2 - Octane V2 Total Score
min: 38630     moyenne: 39090     médian: 39091 (35%)     maximum: 39548 Points
- Amplitude des valeurs obtenues dans le benchmark avec cette carte graphique
- Valeur moyenne obtenue dans le benchmark avec cette carte graphique
* Plus les chiffres sont petits, plus les performances sont élevées

v1.26
log 17. 02:55:47

#0 no ids found in url (should be separated by "_") +0s ... 0s

#1 not redirecting to Ajax server +0s ... 0s

#2 did not recreate cache, as it is less than 5 days old! Created at Sat, 16 Mar 2024 05:37:00 +0100 +0.001s ... 0.001s

#3 no comparison url found in template nbc.compare_page_2 needed +0.007s ... 0.008s

#4 no comparison url found in template nbc.compare_page_2 needed +0s ... 0.009s

#5 no comparison url found in template nbc.compare_page_2 needed +0s ... 0.009s

#6 no comparison url found in template nbc.compare_page_2 needed +0s ... 0.009s

#7 no comparison url found in template nbc.compare_page_2 needed +0s ... 0.01s

#8 no comparison url found in template nbc.compare_page_2 needed +0s ... 0.01s

#9 no comparison url found in template nbc.compare_page_2 needed +0s ... 0.01s

#10 no comparison url found in template nbc.compare_page_2 needed +0s ... 0.01s

#11 no comparison url found in template nbc.compare_page_2 needed +0s ... 0.011s

#12 no comparison url found in template nbc.compare_page_2 needed +0s ... 0.011s

#13 no comparison url found in template nbc.compare_page_2 needed +0s ... 0.011s

#14 no comparison url found in template nbc.compare_page_2 needed +0s ... 0.011s

#15 no comparison url found in template nbc.compare_page_2 needed +0s ... 0.011s

#16 no comparison url found in template nbc.compare_page_2 needed +0s ... 0.012s

#17 no comparison url found in template nbc.compare_page_2 needed +0s ... 0.012s

#18 composed specs +0s ... 0.012s

#19 did output specs +0s ... 0.012s

#20 getting avg benchmarks for device 11350 +0.016s ... 0.028s

#21 got single benchmarks 11350 +0.019s ... 0.047s

#22 got avg benchmarks for devices +0s ... 0.047s

#23 min, max, avg, median took s +0.8s ... 0.847s

#24 no comparison url found in template nbc.compare_page_2 needed +0s ... 0.847s

#25 return log +0s ... 0.847s

Critiques du Intel Core i7-9850H processeur

Test du Lenovo ThinkPad P73 (i7-9850H, Quadro RTX 3000, FHD) : grosse station de travail, mais chauffe exagérée

Test du Lenovo ThinkPad P73 (i7-9850H, Quadro RTX 3000, FHD) : grosse station de travail, mais chauffe exagérée

Avoir les performances les plus élevées possibles - voilà le but du Lenovo ThinkPad P73. Le Lenovo ThinkPad P73 récent intègre des processeurs Coffee Lake Refre...
Intel Core i7-9850H | NVIDIA Quadro RTX 3000 (Laptop) | 17.30" | 3.5 kg
Test du Lenovo ThinkPad P53 (i7-9850H, Quadro RTX 5000, FHD) : station de travail classique et puissance graphique
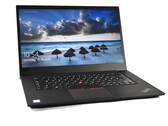
Test du Lenovo ThinkPad P53 (i7-9850H, Quadro RTX 5000, FHD) : station de travail classique et puissance graphique

Lenovo propose maintenant le nouveau ThinkPad P53 équipé de la Nvidia Quadro RTX 5000 haut de gamme, d’habitude réservée à des appareils plus gros. Le système d...
Intel Core i7-9850H | NVIDIA Quadro RTX 5000 Max-Q | 15.60" | 2.7 kg
Courte critique du Lenovo ThinkPad P1 2019 (i7-9850H, Quadro T1000, FHD) : station de travail toute en finesse

Courte critique du Lenovo ThinkPad P1 2019 (i7-9850H, Quadro T1000, FHD) : station de travail toute en finesse

Lenovo a introduit la deuxième génération de sa station d’accueil haut de gamme fine ThinkPad P1. On retrouve à bord les dernières cartes graphiques Nvidia Quad...
Intel Core i7-9850H | NVIDIA Quadro T1000 (Laptop) | 15.60" | 1.7 kg

HP ZBook 15 G6 6TU88EA: NVIDIA Quadro P2000, 15.60", 2.6 kg
  Autres tests » HP ZBook 15 G6 6TU88EA

Lenovo ThinkPad X1 Extreme G2-20QV000KUS: NVIDIA GeForce GTX 1650 Max-Q, 15.60", 1.8 kg
  Autres tests » Lenovo ThinkPad X1 Extreme G2-20QV000KUS

Dell Latitude 14 5401-P8TG4: Intel UHD Graphics 630, 14.00", 1.5 kg
  Autres tests » Dell Latitude 5401-P8TG4

Lenovo ThinkPad P53-20QN000YGE: NVIDIA Quadro RTX 5000 Max-Q, 15.60", 2.7 kg
  Autres tests » Lenovo ThinkPad P53-20QN000YGE

Lenovo ThinkPad P1 2019-20QT001LUS: NVIDIA Quadro T2000 (Laptop), 15.60", 1.7 kg
  Autres tests » Lenovo ThinkPad P1 2019-20QT001LUS

Please share our article, every link counts!

» Comparaison des processeurs pour ordinateur portable
Comparaison de tout les processeurs mobiles


» Processeurs mobiles - liste des benchmarks
Liste des benchmarks de l'intégralité des processeurs pour portables


Les autres processeurs de la gamme Coffee Lake

» Intel Core i9-9900KS
   8x 4 GHz - 5 GHz
» Intel Core i9-9900K
   8x 3.6 GHz - 5 GHz
» Intel Core i9-9980HK
   8x 2.4 GHz - 5 GHz
» Intel Core i7-9700K
   8x 3.6 GHz - 4.9 GHz
» Intel Core i9-9880H
   8x 2.3 GHz - 4.8 GHz
» Intel Core i7-8086K
   6x 3.7 GHz - 5 GHz
» Intel Core i7-8700K
   6x 3.7 GHz - 4.7 GHz
» Intel Xeon E-2176G
   6x 3.7 GHz - 4.7 GHz
» Intel Core i7-9700
   8x 3 GHz - 4.7 GHz
» Intel Core i9-8950HK
   6x 2.9 GHz - 4.8 GHz
» Intel Xeon E-2186M
   6x 2.9 GHz - 4.8 GHz
» Intel Xeon E-2276M
   6x 2.8 GHz - 4.7 GHz
» Intel Core i7-8700
   6x 3.2 GHz - 4.6 GHz
» Intel Core i5-9600K
   6x 3.7 GHz - 4.6 GHz
» Intel Core i7-9850H
   6x 2.6 GHz - 4.6 GHz
» Intel Core i7-9750H
   6x 2.6 GHz - 4.5 GHz
» Intel Core i9-9900T
   8x 2.1 GHz - 4.4 GHz
» Intel Xeon E-2176M
   6x 2.7 GHz - 4.4 GHz
» Intel Core i7-8850H
   6x 2.6 GHz - 4.3 GHz
» Intel Core i5-8600K
   6x 3.6 GHz - 4.3 GHz
» Intel Core i5-8500
   6x 3 GHz - 4.1 GHz
» Intel Core i7-8750H
   6x 2.2 GHz - 4.1 GHz
» Intel Core i5-8400
   6x 2.8 GHz - 4 GHz
» Intel Core i5-8500T
   6x 2.1 GHz - 3.5 GHz
» Intel Core i5-9400H
   4x 2.5 GHz - 4.3 GHz
» Intel Core i5-9300HF
   4x 2.4 GHz - 4.1 GHz
» Intel Core i5-9300H
   4x 2.4 GHz - 4.1 GHz
» Intel Core i5-8400H
   4x 2.5 GHz - 4.2 GHz
» Intel Core i7-8559U
   4x 2.7 GHz - 4.5 GHz
» Intel Core i5-8300H
   4x 2.3 GHz - 4 GHz
» Intel Core i5-9400F
   6x 2.9 GHz - 4.1 GHz
» Intel Core i3-9100F
   4x 3.6 GHz - 4.2 GHz
» Intel Core i7-8557U
   4x 1.7 GHz - 4.5 GHz
» Intel Core i5-8269U
   4x 2.6 GHz - 4.2 GHz
» Intel Core i5-8279U
   4x 2.4 GHz - 4.1 GHz
» Intel Core i5-8259U
   4x 2.3 GHz - 3.8 GHz
» Intel Core i5-8257U
   4x 1.4 GHz - 3.9 GHz
» Intel Core i5-8260U
   4x 1.6 GHz - 3.9 GHz
» Intel Core i3-8109U
   2x 3 GHz - 3.6 GHz
» Intel Core i3-8100H
   4x 3 GHz

Processeurs similaires

+ Intel Core i5-1340P
   12x 1.4 GHz - 4.6 GHz
+ AMD Ryzen 7 4800U
   8x 1.8 GHz - 4.2 GHz
+ Intel Core i5-10500H
   6x 2.5 GHz - 4.5 GHz
+ AMD Ryzen 5 5600HS
   6x 3 GHz - 4.2 GHz
+ AMD Ryzen 5 4600H
   6x 3 GHz - 4 GHz
» Intel Core i7-9850H
   6x 2.6 GHz - 4.6 GHz
- Intel Core i7-9750H
   6x 2.6 GHz - 4.5 GHz
- Intel Core i5-11260H
   6x 2.6 GHz - 4.4 GHz
- Apple M2
   8x 2.42 GHz - 3.48 GHz
- AMD Ryzen 5 4600HS
   6x 3 GHz - 4 GHz
- Intel Xeon E-2176M
   6x 2.7 GHz - 4.4 GHz
> Revues et rapports de ordinateurs portatifs et smartphones, ordiphones > FAQ > Processeurs mobiles - indice de référence > Intel Core i7 i7-9850H Notebook Processor
Klaus Hinum (Update: 2020-04-10)