Test du Medion Erazer Scout E20 : PC portable de jeu FHD abordable avec RTX 4050
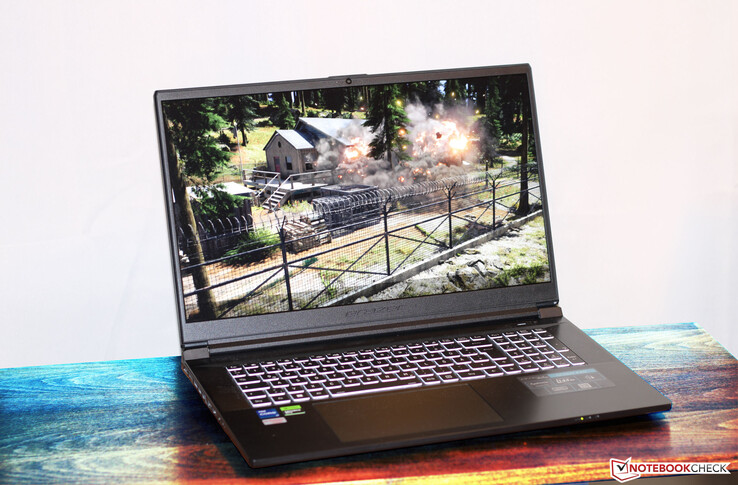
Bien que l'Erazer Scout E20 soit avant tout considéré comme un ordinateur portable de jeu d'entrée de gamme, il pourrait également être utilisé dans d'autres domaines exigeant des performances élevées, tels que le rendu ou le traitement vidéo. Medion associe un processeur Raptor Lake à une carte graphique GeForce RTX 4050laptop, demandant environ 1 500 euros (~1 658 $) pour l'ensemble. L'ordinateur est basé sur un barebone de Clevo (V170RNCQ). Parmi ses concurrents, on trouve des appareils tels que le Gigabyte G7 KEde Gigabyte, leMSI Katana 17 B13VFKmSI Katana 17 B13VFKAsus TUF Gaming A16 FA617, l'Asus TUF Gaming A16 FA617Lenovo Legion 5 15IAH7H 82RBet leAcer Nitro 5 AN515-46-R1A1.
Comparaison avec les concurrents potentiels
Note | Date | Modèle | Poids | Épaisseur | Taille | Résolution | Prix |
|---|---|---|---|---|---|---|---|
| 83 % v7 (old) | 05/23 | Medion Erazer Scout E20 i7-13700H, GeForce RTX 4050 Laptop GPU | 2.8 kg | 29 mm | 17.30" | 1920x1080 | |
| 83.3 % v7 (old) | 01/23 | Gigabyte G7 KE i5-12500H, GeForce RTX 3060 Laptop GPU | 2.6 kg | 25 mm | 17.30" | 1920x1080 | |
| 82.1 % v7 (old) | 02/23 | MSI Katana 17 B13VFK i7-13620H, GeForce RTX 4060 Laptop GPU | 2.8 kg | 25.2 mm | 17.30" | 1920x1080 | |
| 86.2 % v7 (old) | 02/23 | Asus TUF Gaming A16 FA617 R7 7735HS, Radeon RX 7600S | 2.2 kg | 27 mm | 16.00" | 1920x1200 | |
| 87.5 % v7 (old) | 11/22 | Lenovo Legion 5 15IAH7H 82RB i7-12700H, GeForce RTX 3060 Laptop GPU | 2.4 kg | 19.99 mm | 15.60" | 1920x1080 | |
| 83.9 % v7 (old) | 11/22 | Acer Nitro 5 AN515-46-R1A1 R7 6800H, GeForce RTX 3070 Ti Laptop GPU | 2.5 kg | 26.8 mm | 15.60" | 1920x1080 |
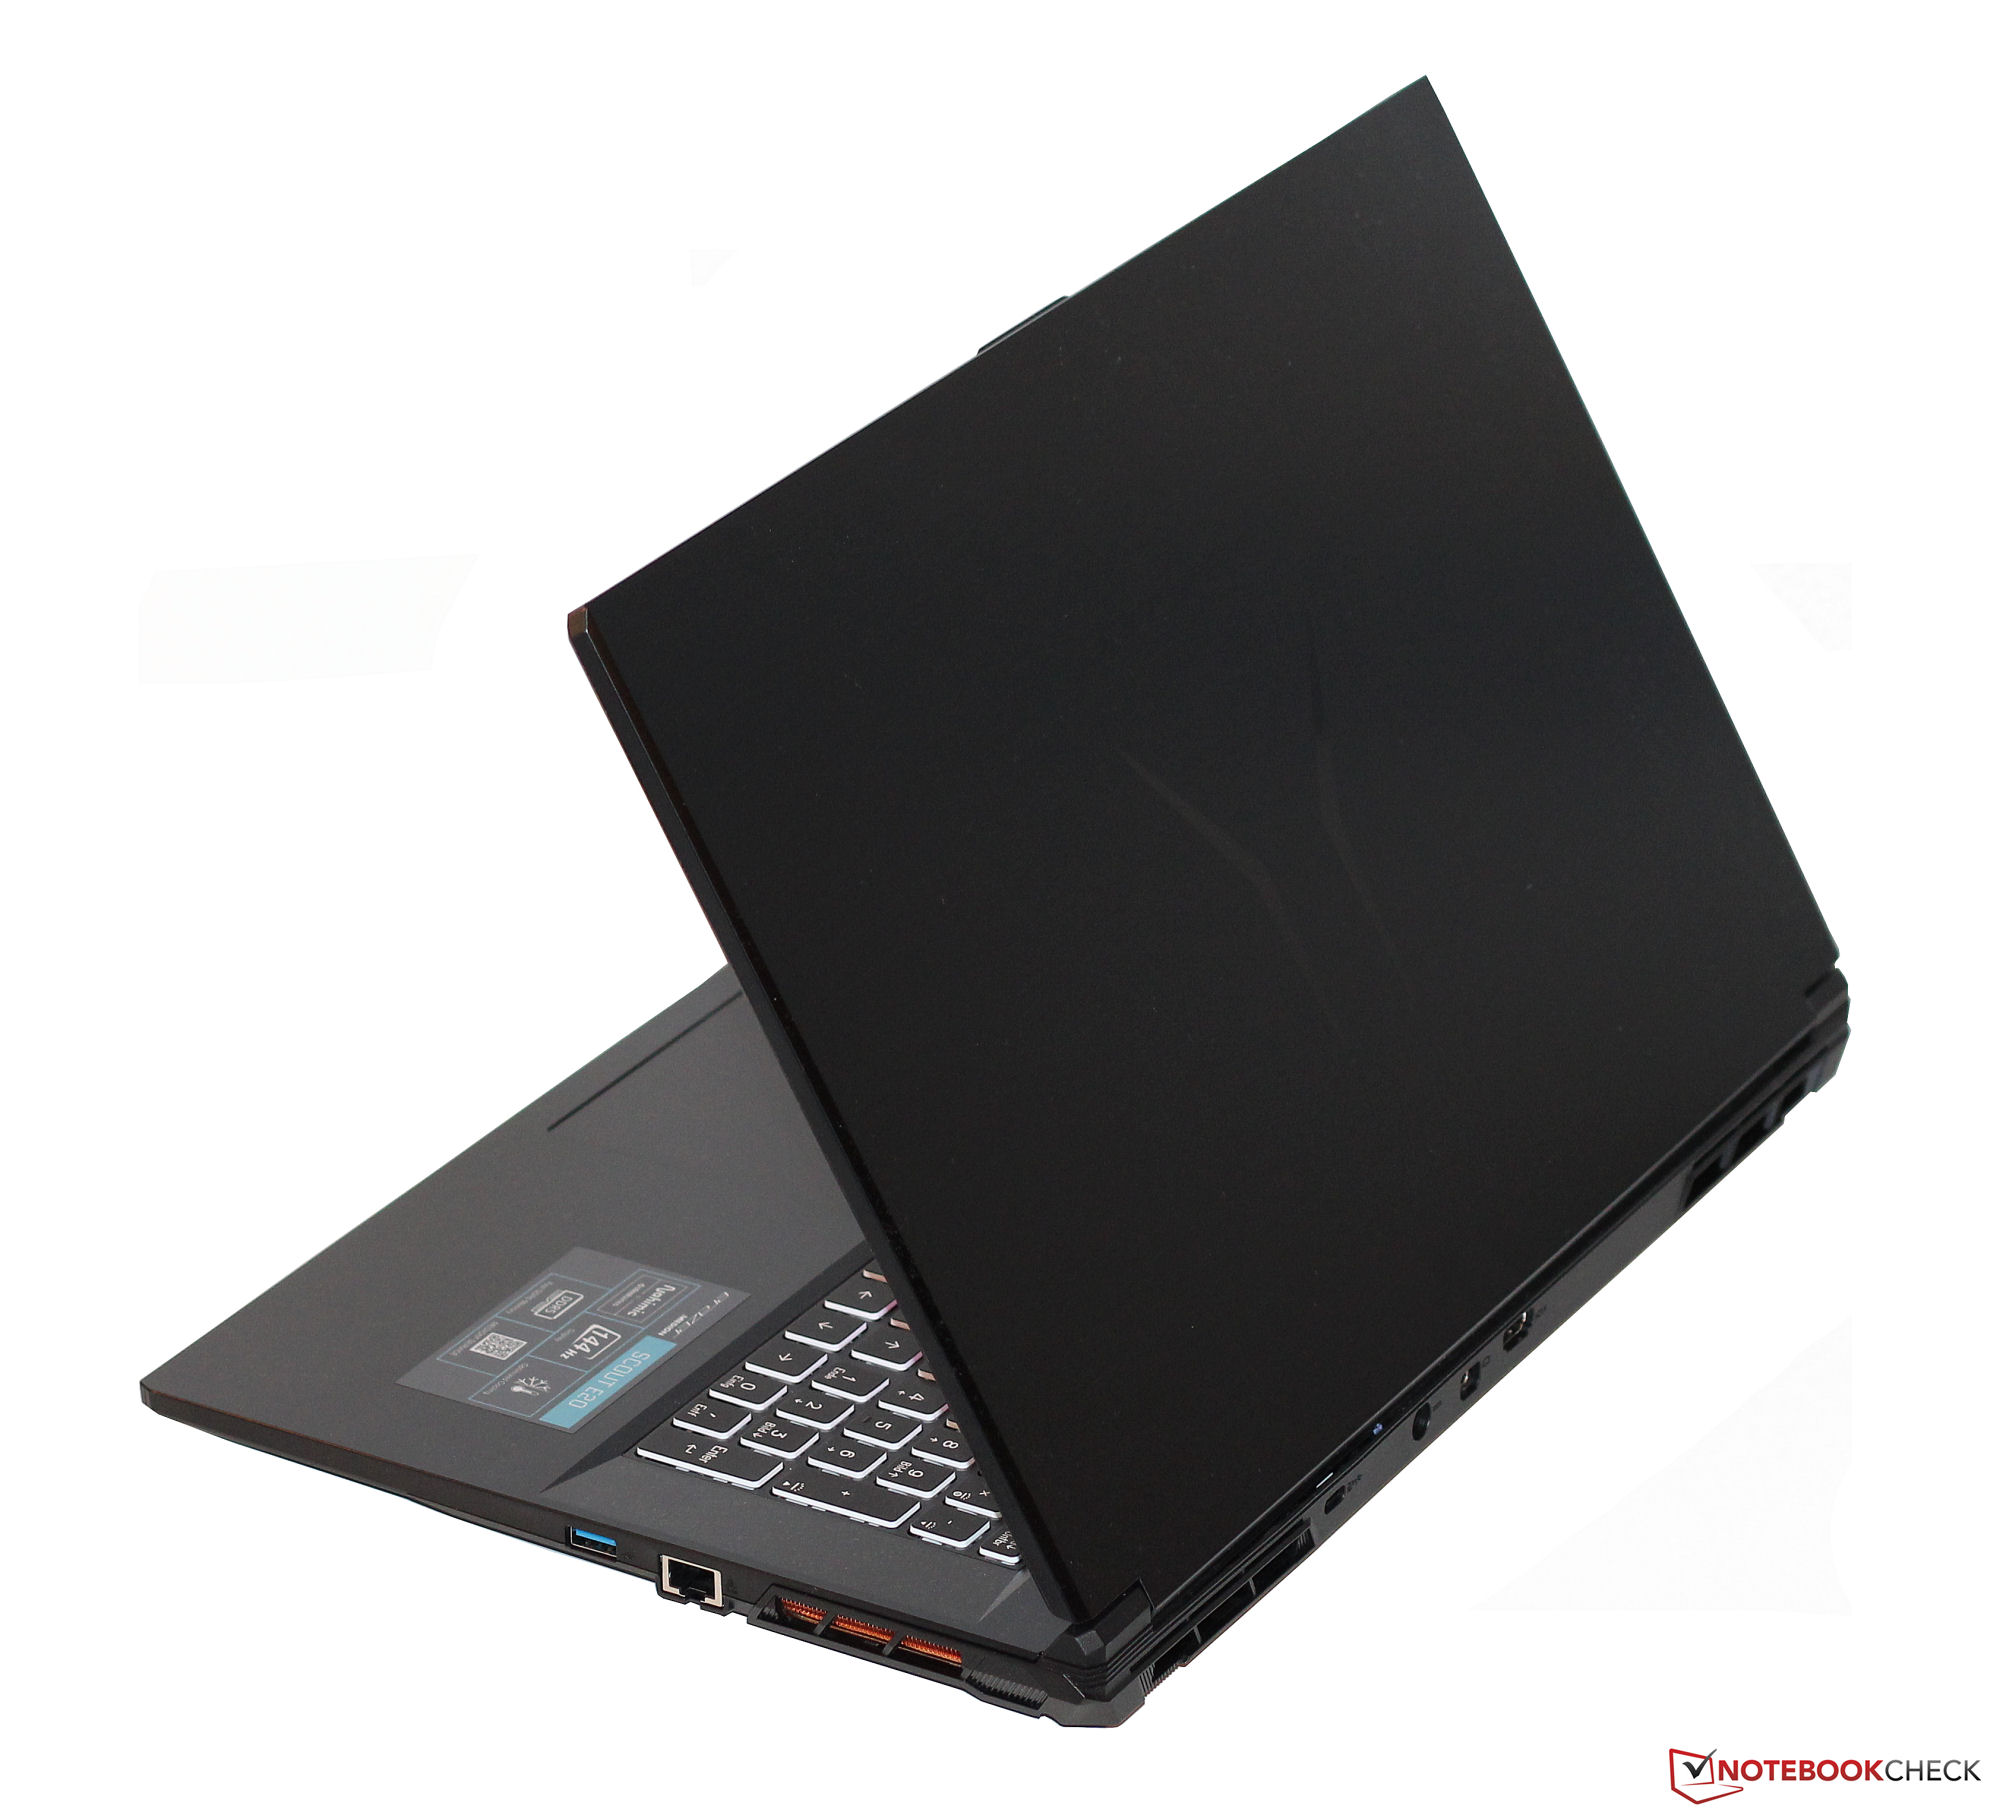
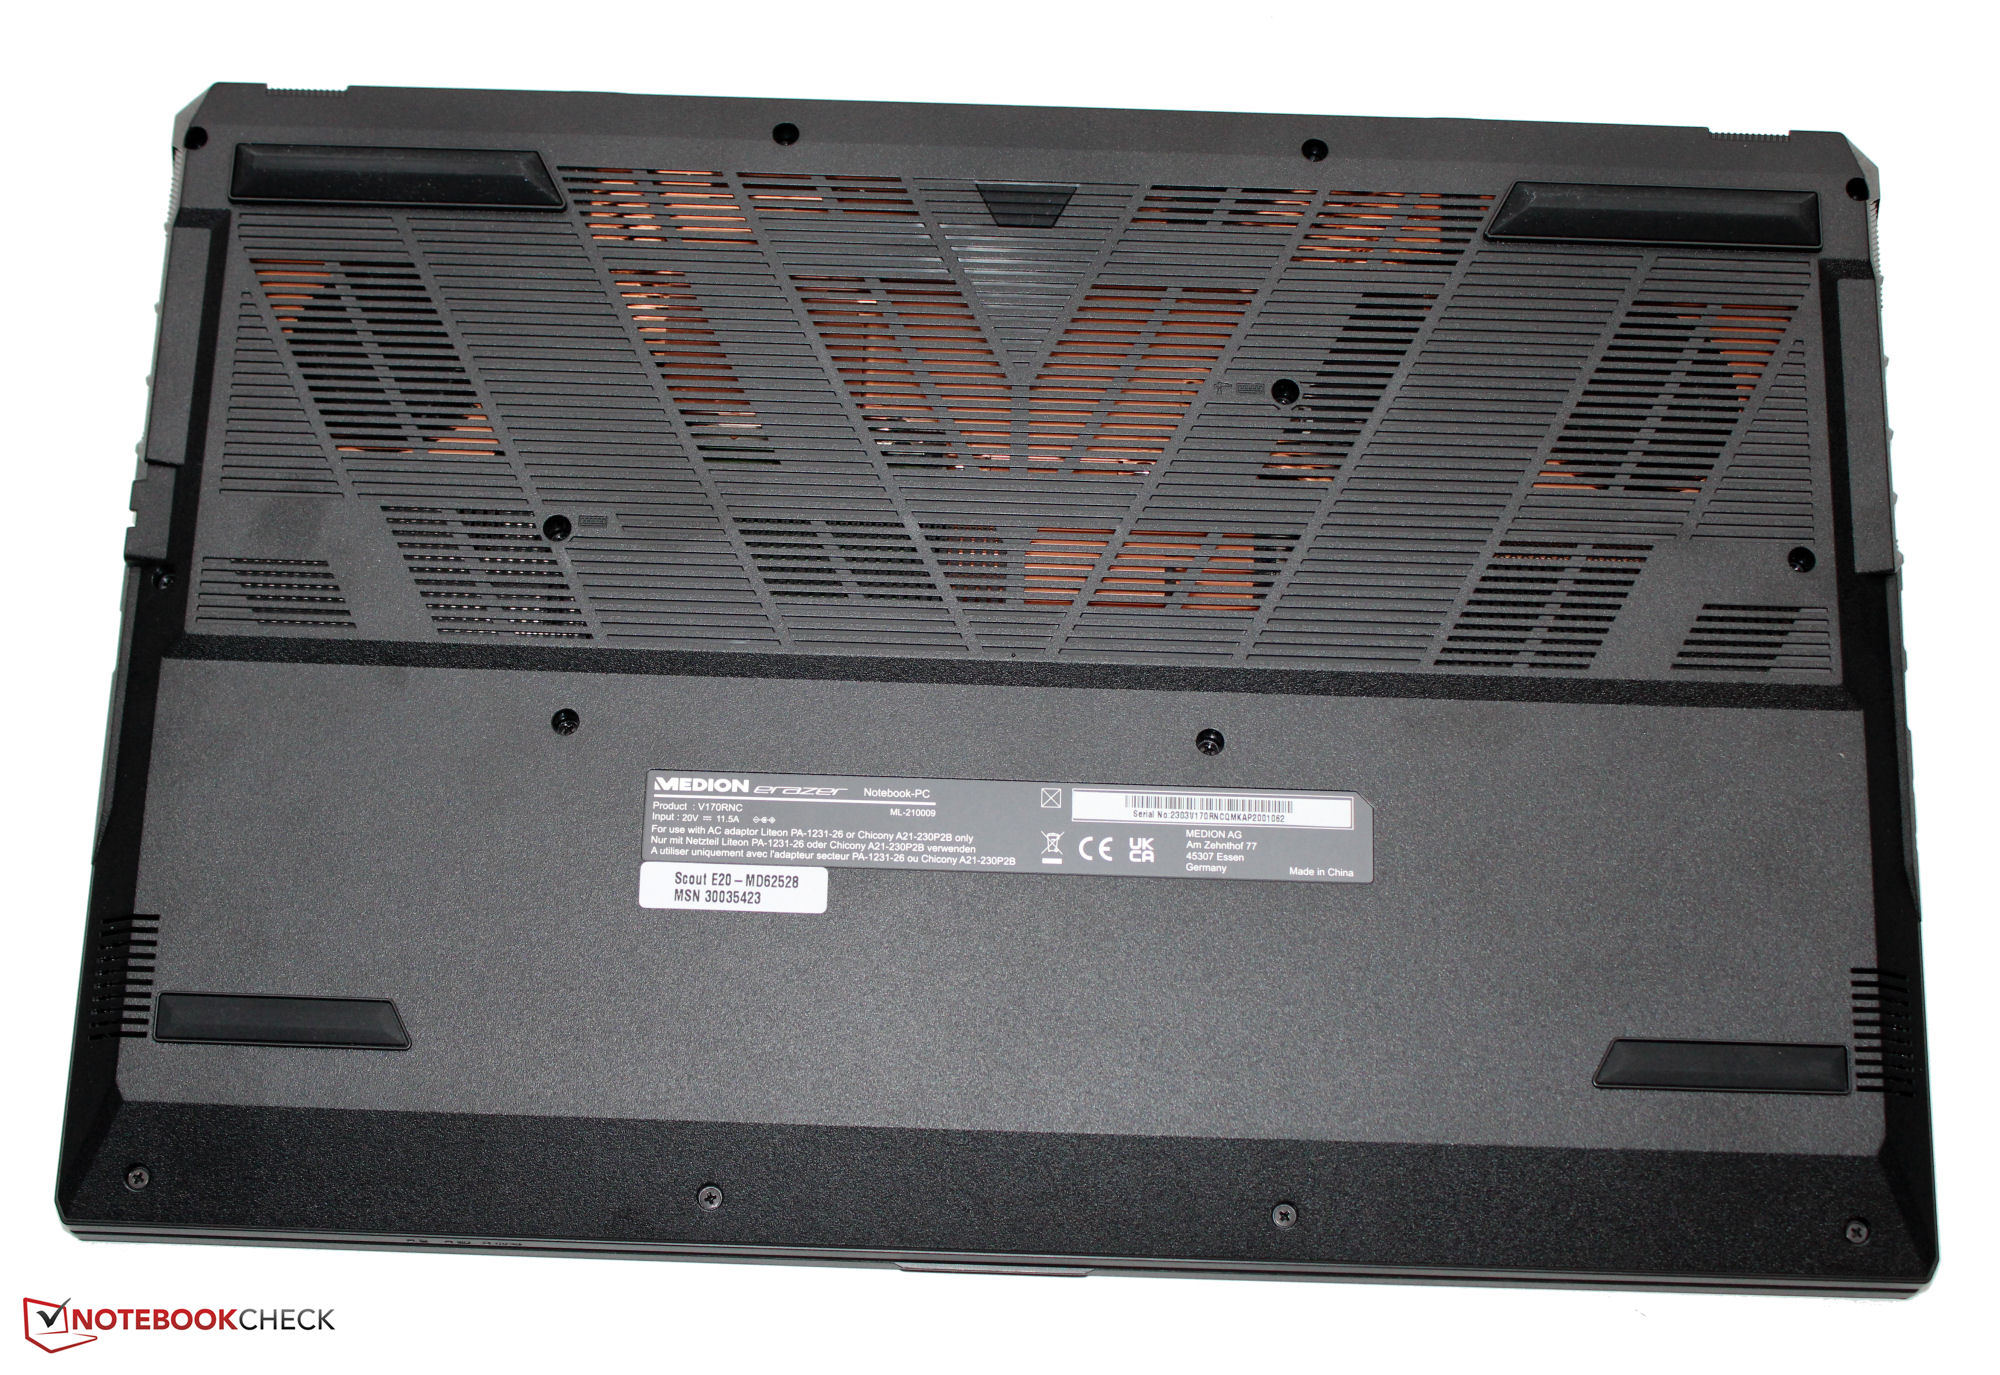
Boîtier - L'ordinateur portable Medion est doté d'un boîtier en plastique
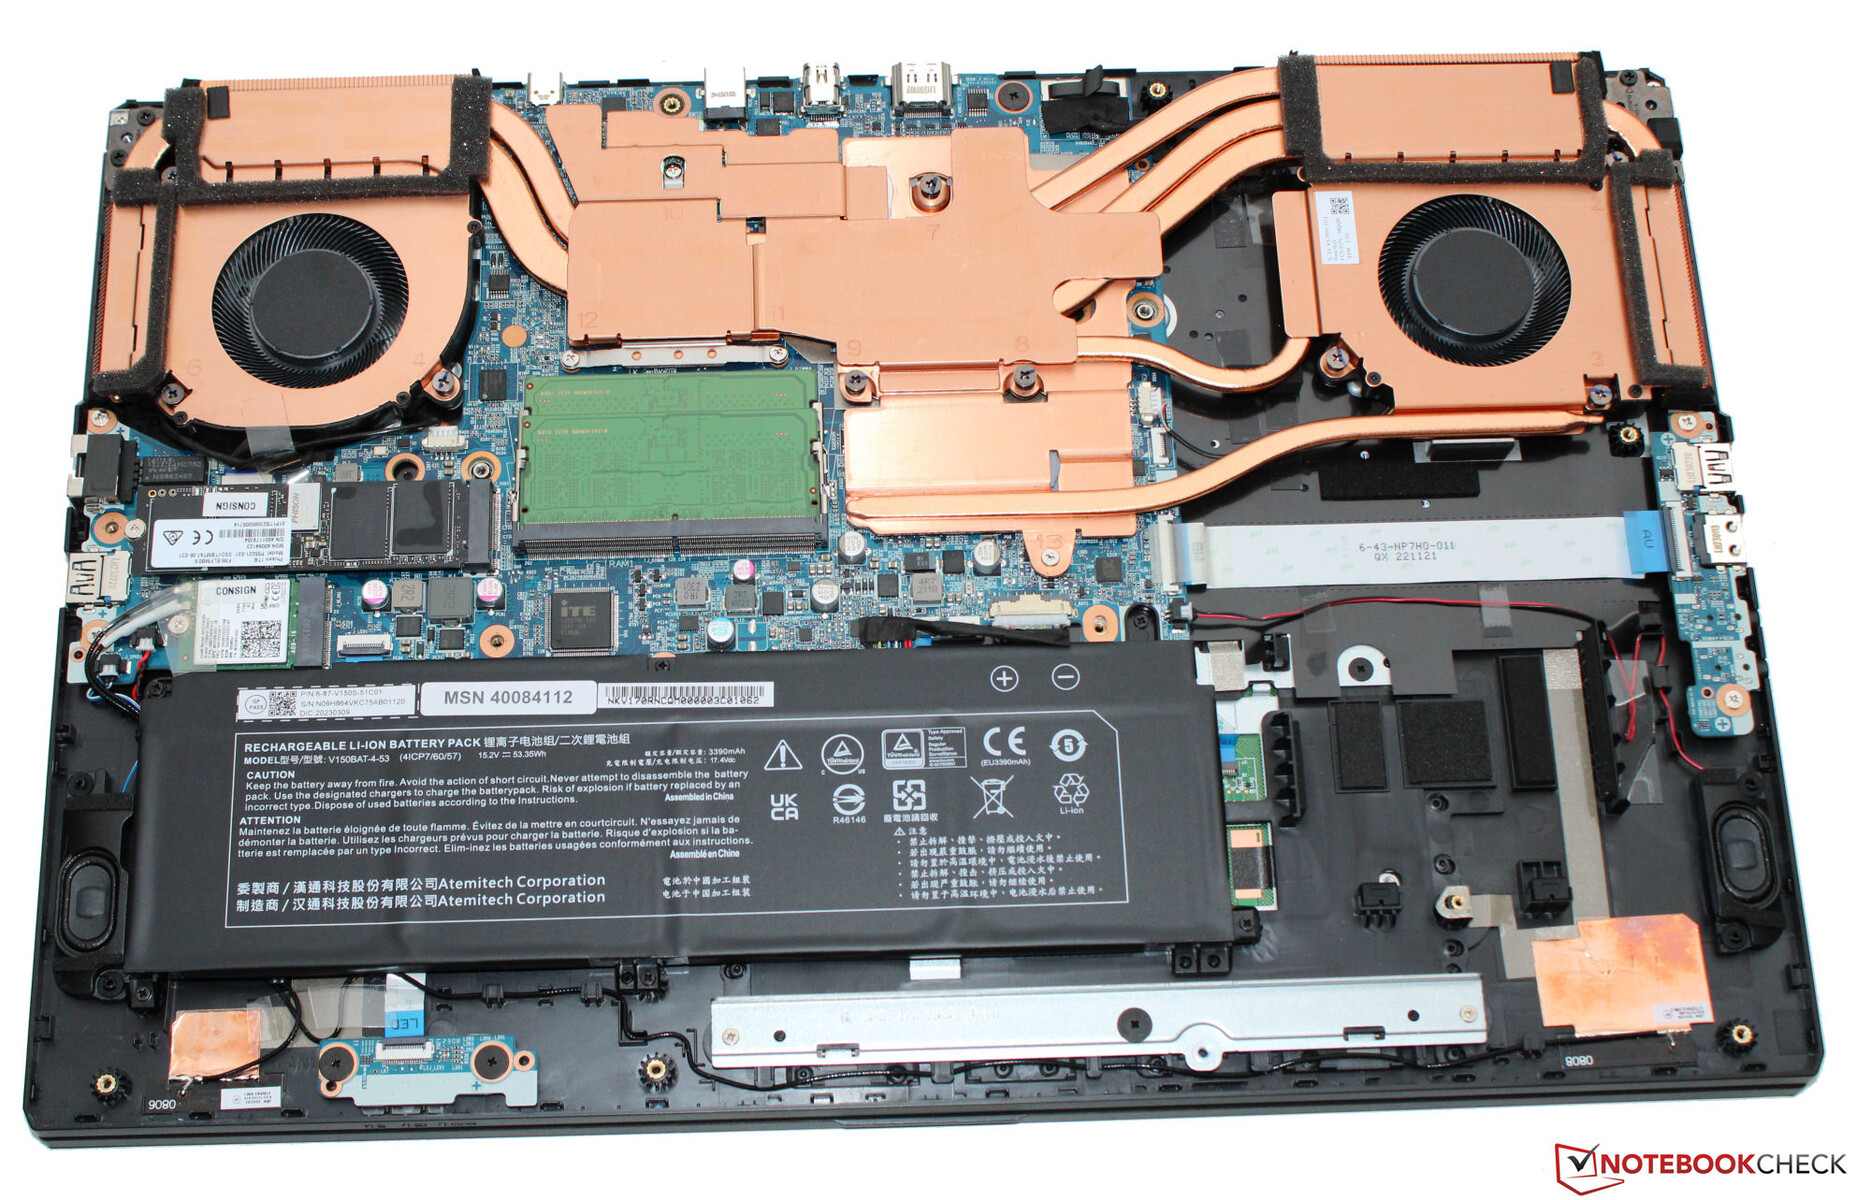
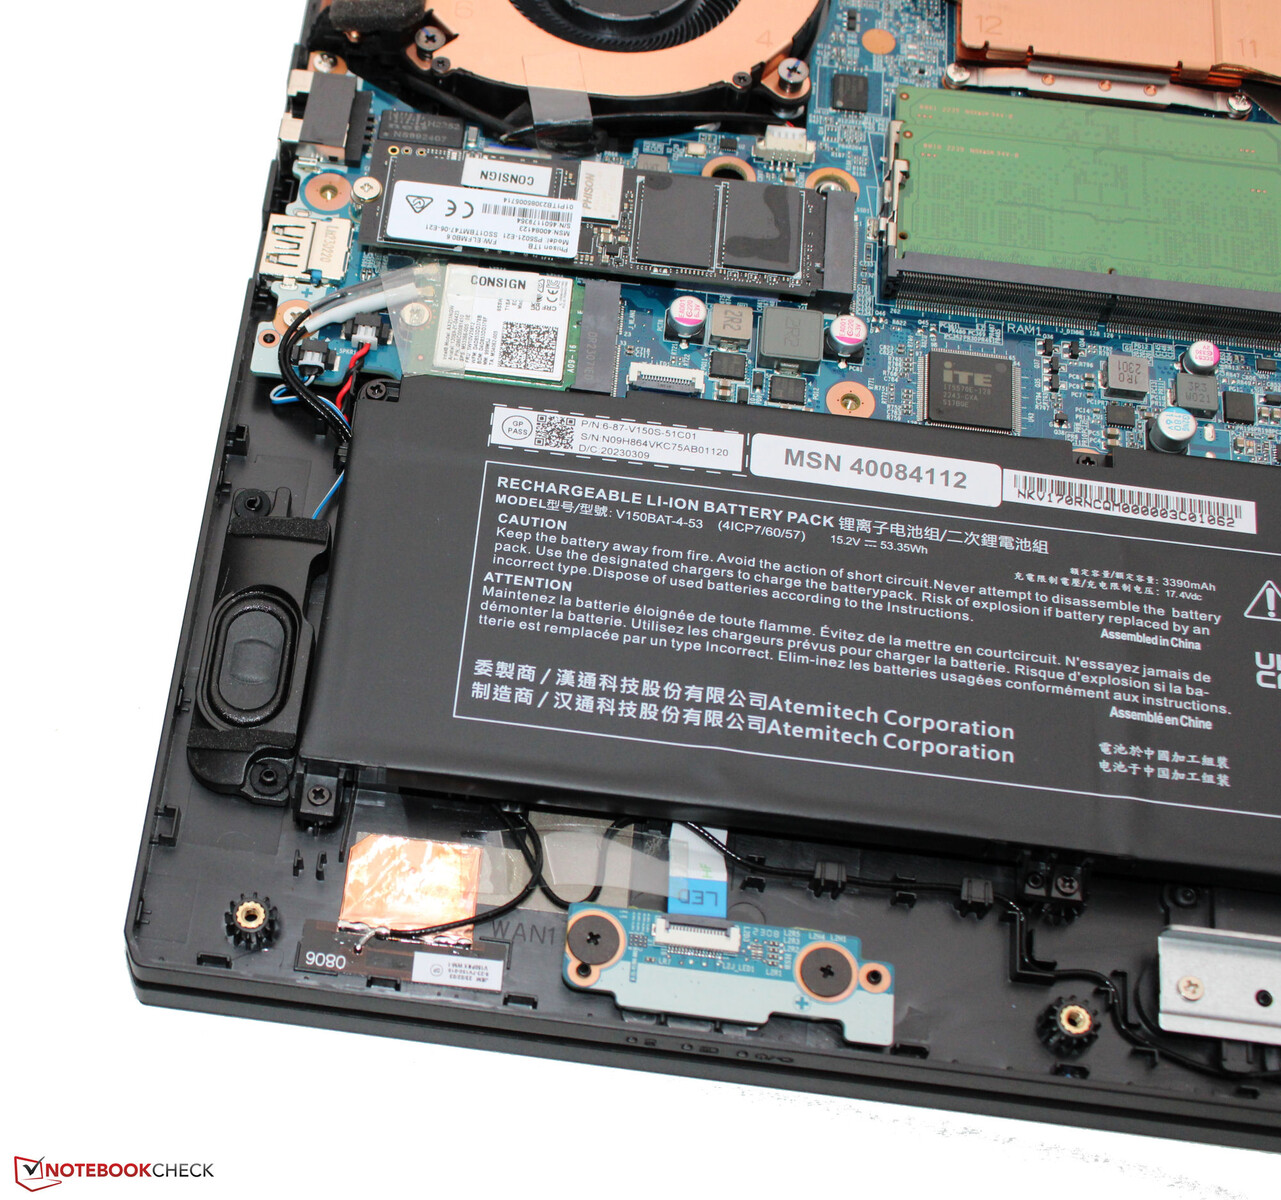
Le E20 n'offre pas de matériaux de boîtier qui lui confèrent un aspect de haute qualité, mais l'ensemble du boîtier est en plastique noir. Medion utilise des surfaces lisses et mates. Le design sans prétention de l'ordinateur portable permet également de l'utiliser dans un environnement professionnel. En dehors de l'éclairage du clavier, l'ordinateur portable ne comporte pas d'ornement coloré sous forme de bandes LED. La batterie (qui est vissée et non collée) et le reste de l'équipement sont accessibles après avoir retiré le fond du boîtier.
Le Scout ne présente aucun défaut de fabrication. Les interstices sont réguliers et il n'y a pas d'aspérités matérielles. L'unité de base ne peut se déformer que légèrement, mais le couvercle de façon plus importante, bien que cela reste dans les limites. Les charnières maintiennent fermement le couvercle en position, avec un angle d'ouverture maximal d'environ 135 degrés. Le couvercle peut être ouvert d'une seule main.

En termes de taille, le E20 se situe au niveau des ordinateurs portables de 17,3 pouces comparables, et il en va de même pour son poids dans une certaine mesure. Dans notre champ de comparaison, il représente l'appareil le plus lourd - avec le Katana 17- avec 2,8 kg (~6,2 lb). LeG7 KEpèse 200 grammes de moins que ces deux concurrents.
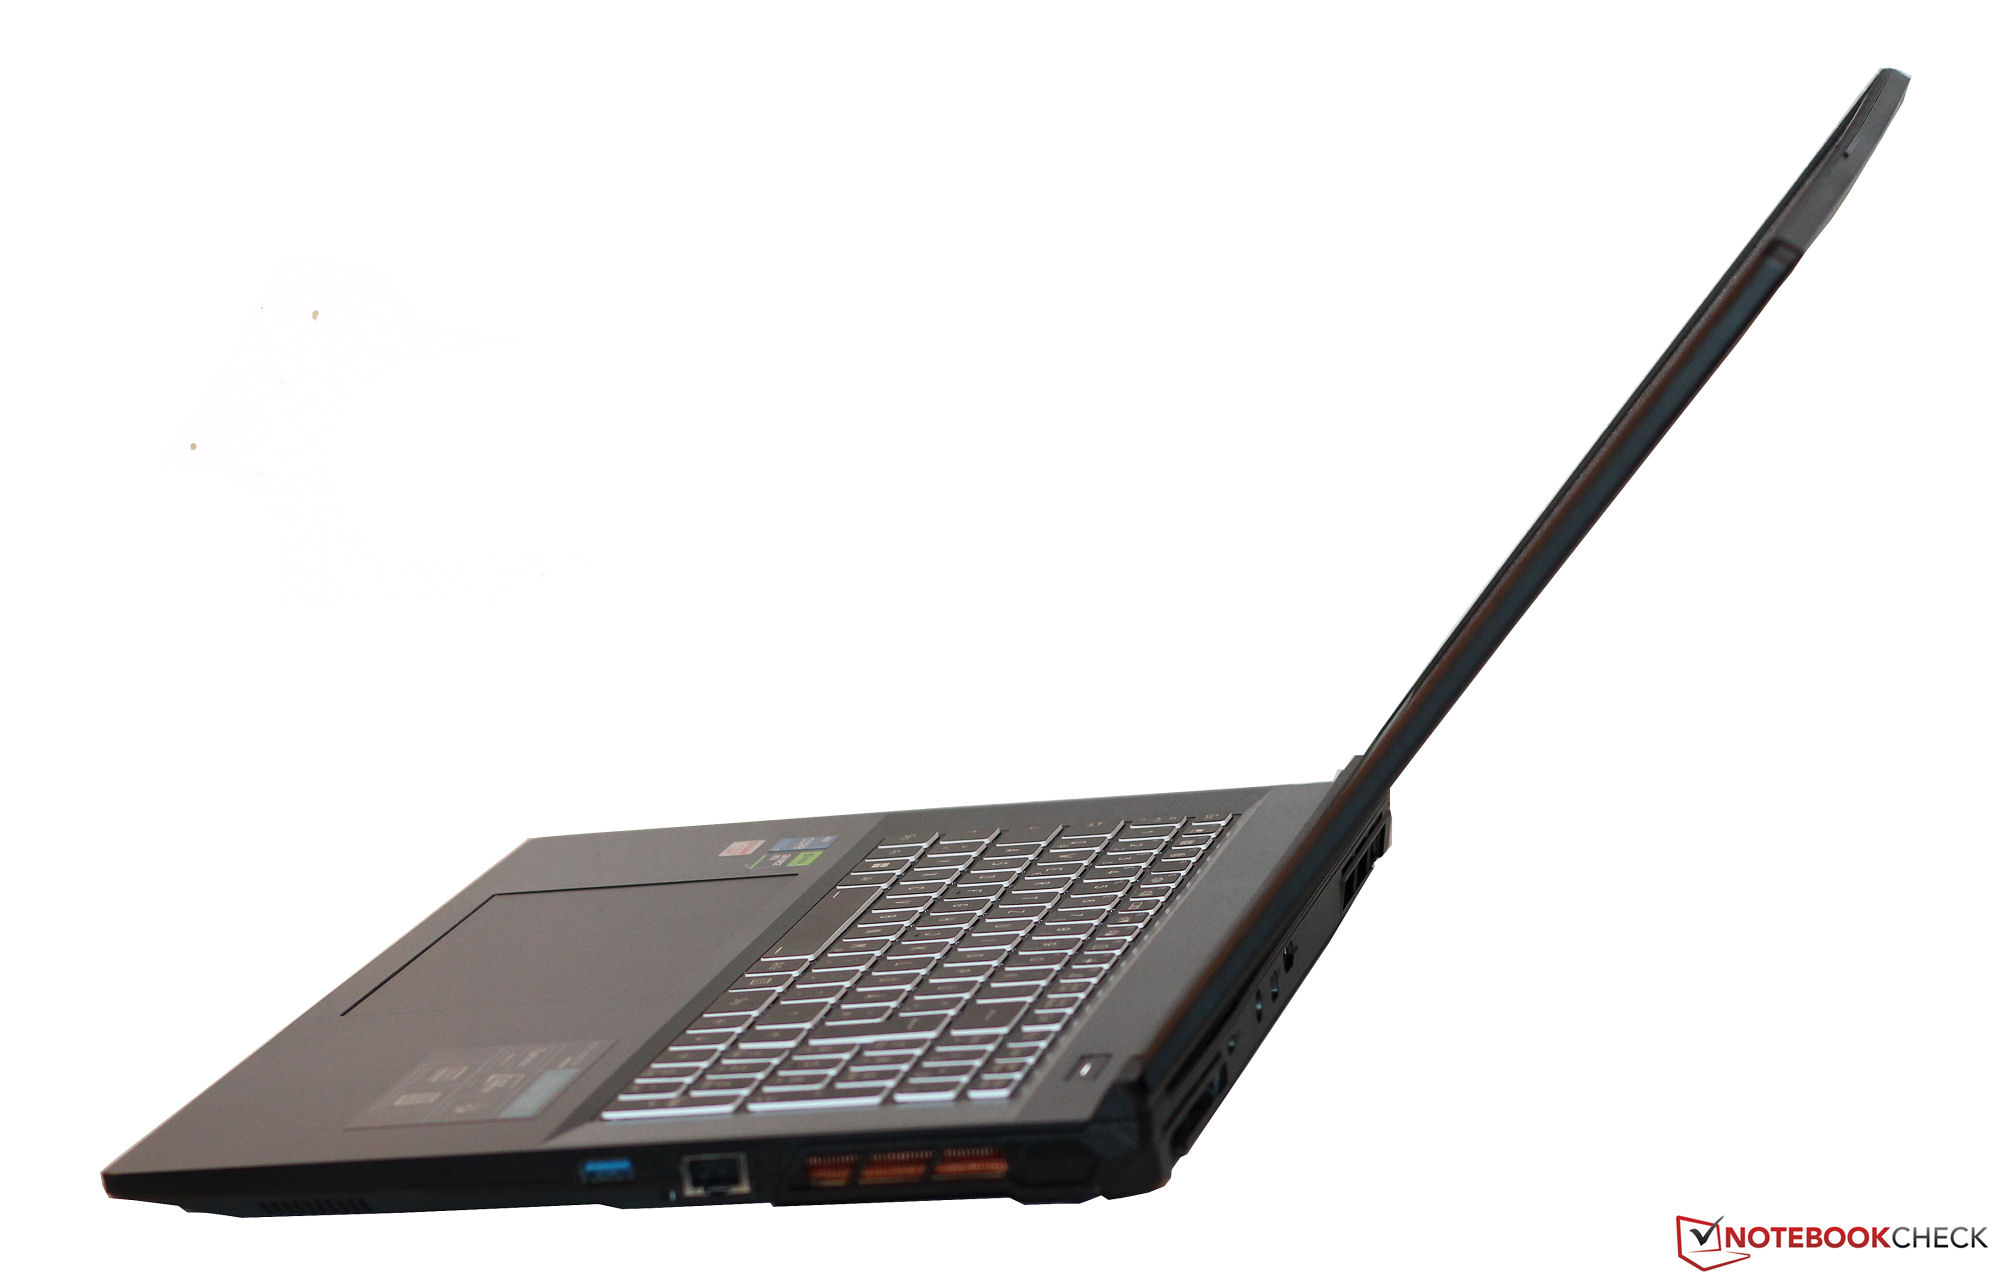
Equipement - Pas de Thunderbolt pour l'Erazer
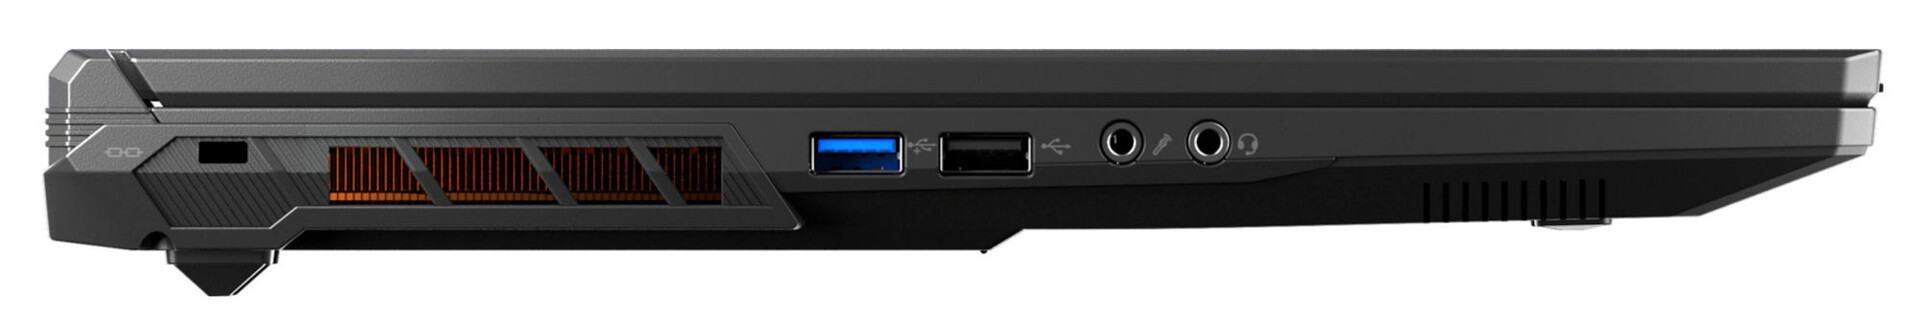
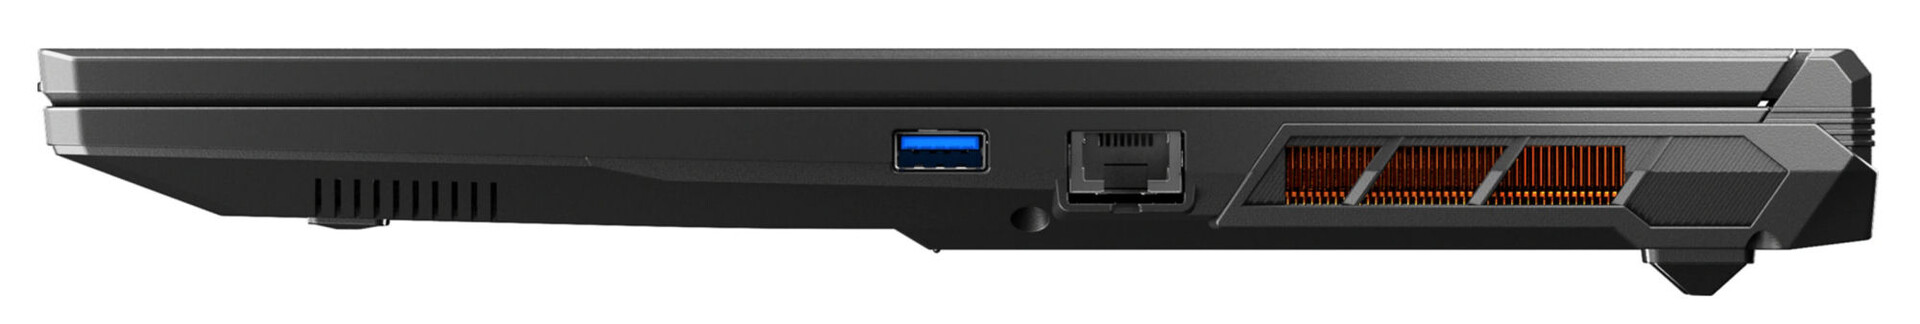
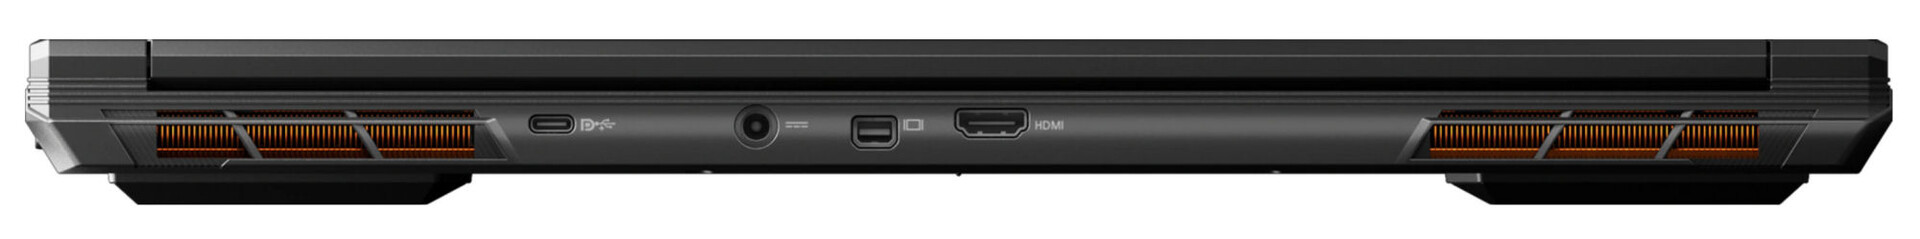
L'Erazer offre trois ports USB-A (1x USB 2.0, 1x USB 3.2 Gen 1, 1x USB 3.2 Gen 2) et un seul port USB-C (USB 3.2 Gen 2). Si ce dernier peut émettre un signal DisplayPort, il n'inclut pas la prise en charge de Power Delivery. Le Scout E20 comprend un total de trois ports de sortie vidéo (HDMI 2.1, 2x DP). L'équipement de connexion est complété par deux ports audio et un port Gigabit Ethernet. Il n'y a pas de lecteur de carte de stockage.
Les ports vidéo et la connexion d'alimentation se trouvent à l'arrière de l'appareil, de sorte que les câbles correspondants passent à l'arrière et ne gênent pas.
Communication
Dans des conditions optimales (sans autres appareils WLAN à proximité et à faible distance entre l'ordinateur portable et le PC serveur), d'excellents débits de données WiFi sont atteints. L'ordinateur portable Medion utilise une puce Intel AX211 WiFi-6E, et les connexions filaires sont également gérées par une puce Intel (I219-V ; 1 Gbit/s).
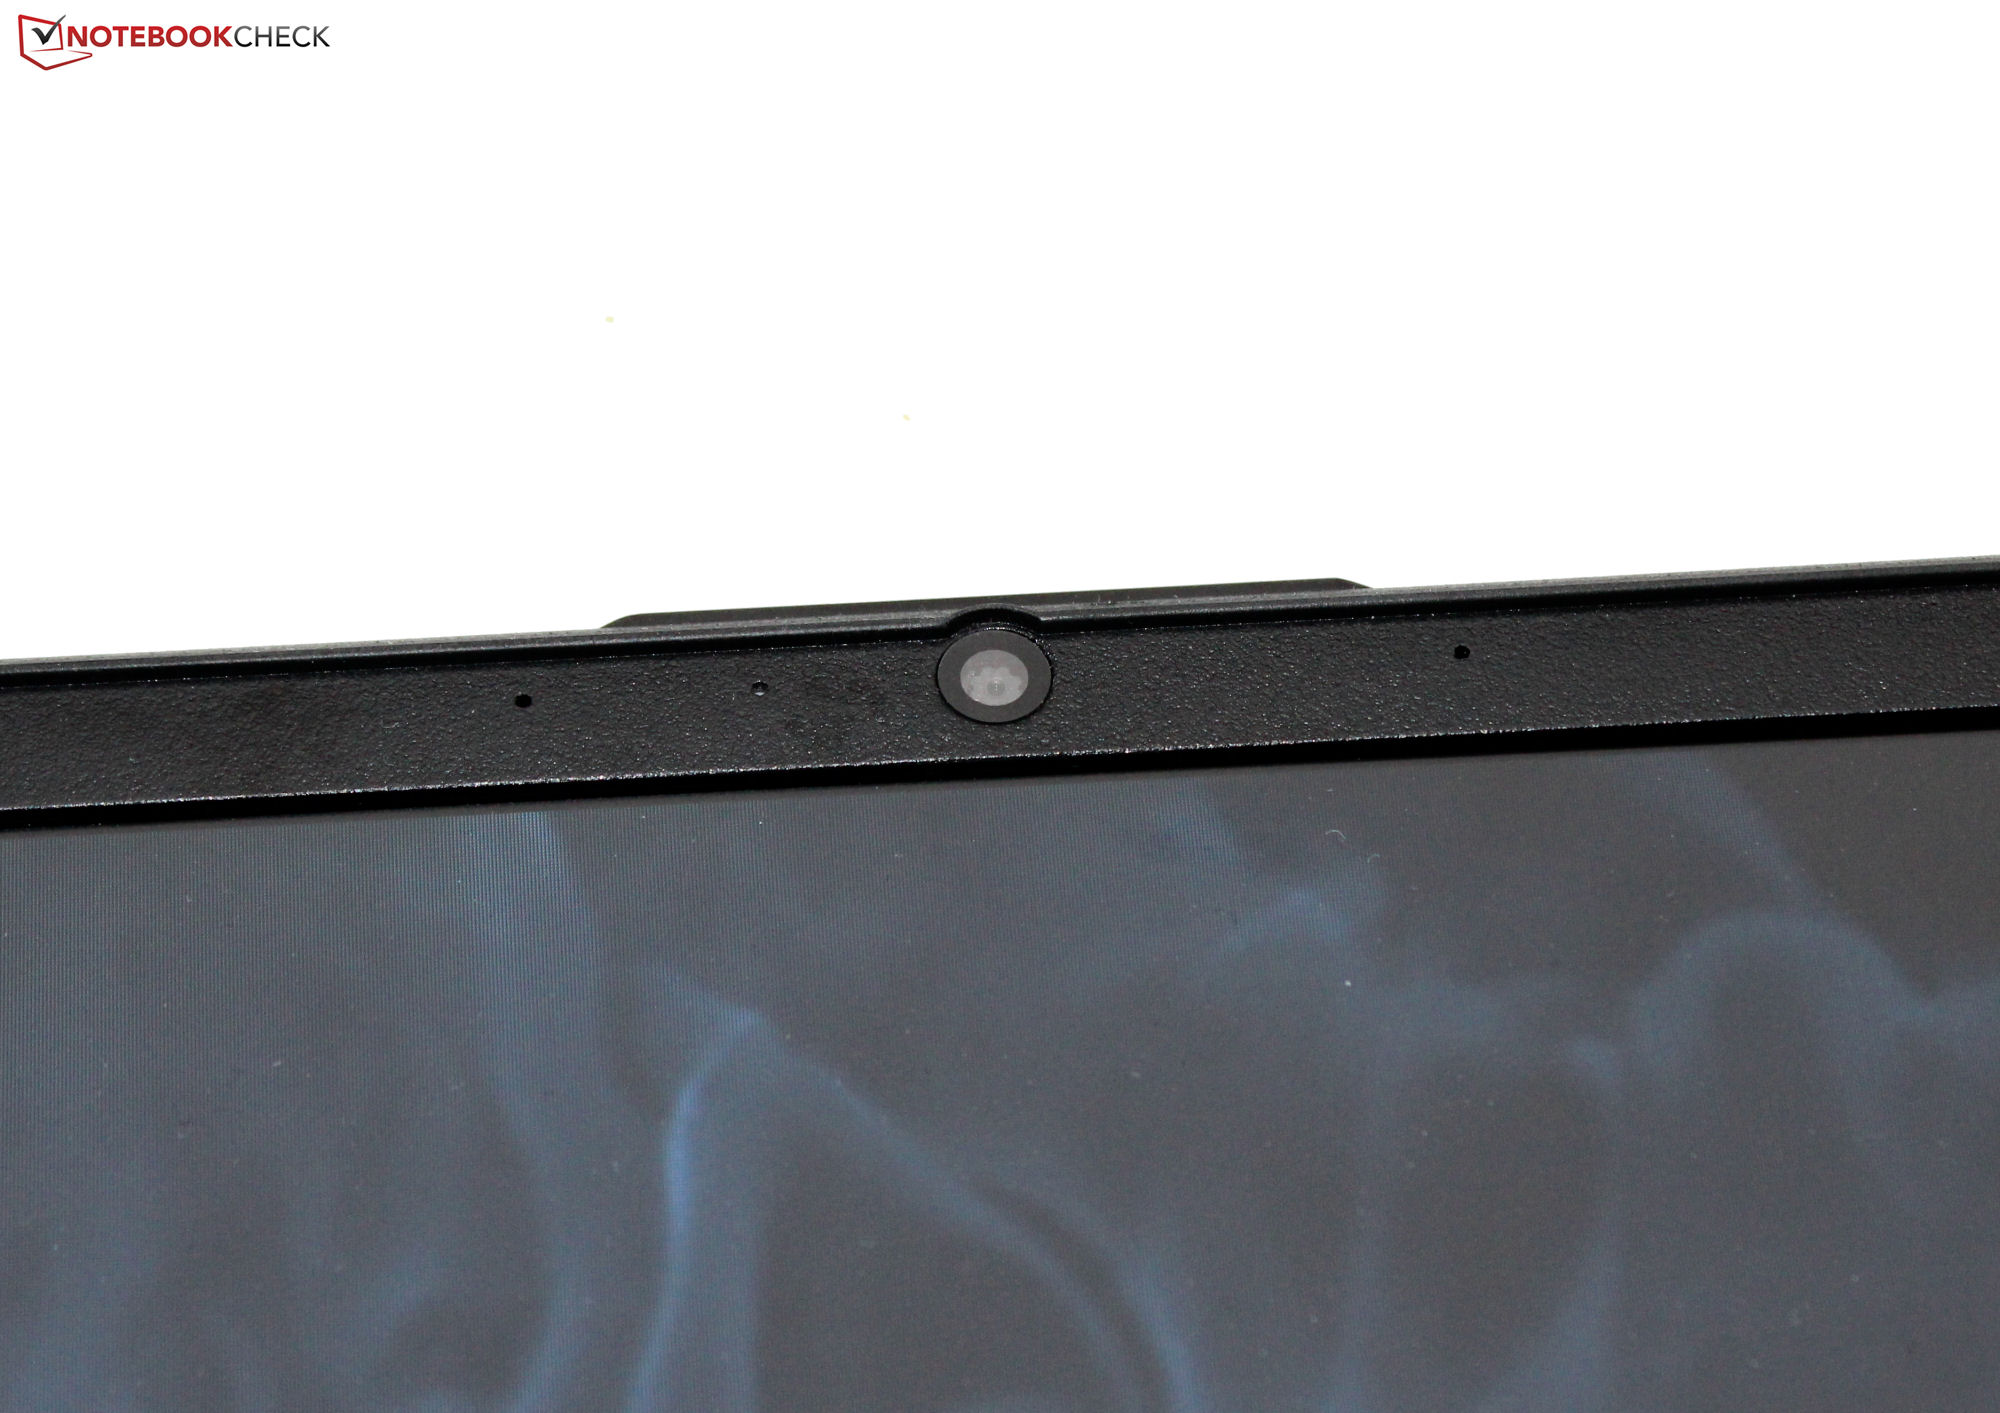
Webcam
La webcam de 0,9 Mp a une résolution maximale de 1 280 x 720 pixels et n'offre pas d'obturateur mécanique. La qualité qu'elle est capable de fournir est standard, mais au moins les résultats ne montrent qu'une déviation de couleur relativement faible.


Accessoires
L'ordinateur portable ne contient aucun accessoire supplémentaire, hormis la documentation habituelle telle que les instructions de démarrage rapide et les informations relatives à la garantie.
Maintenance
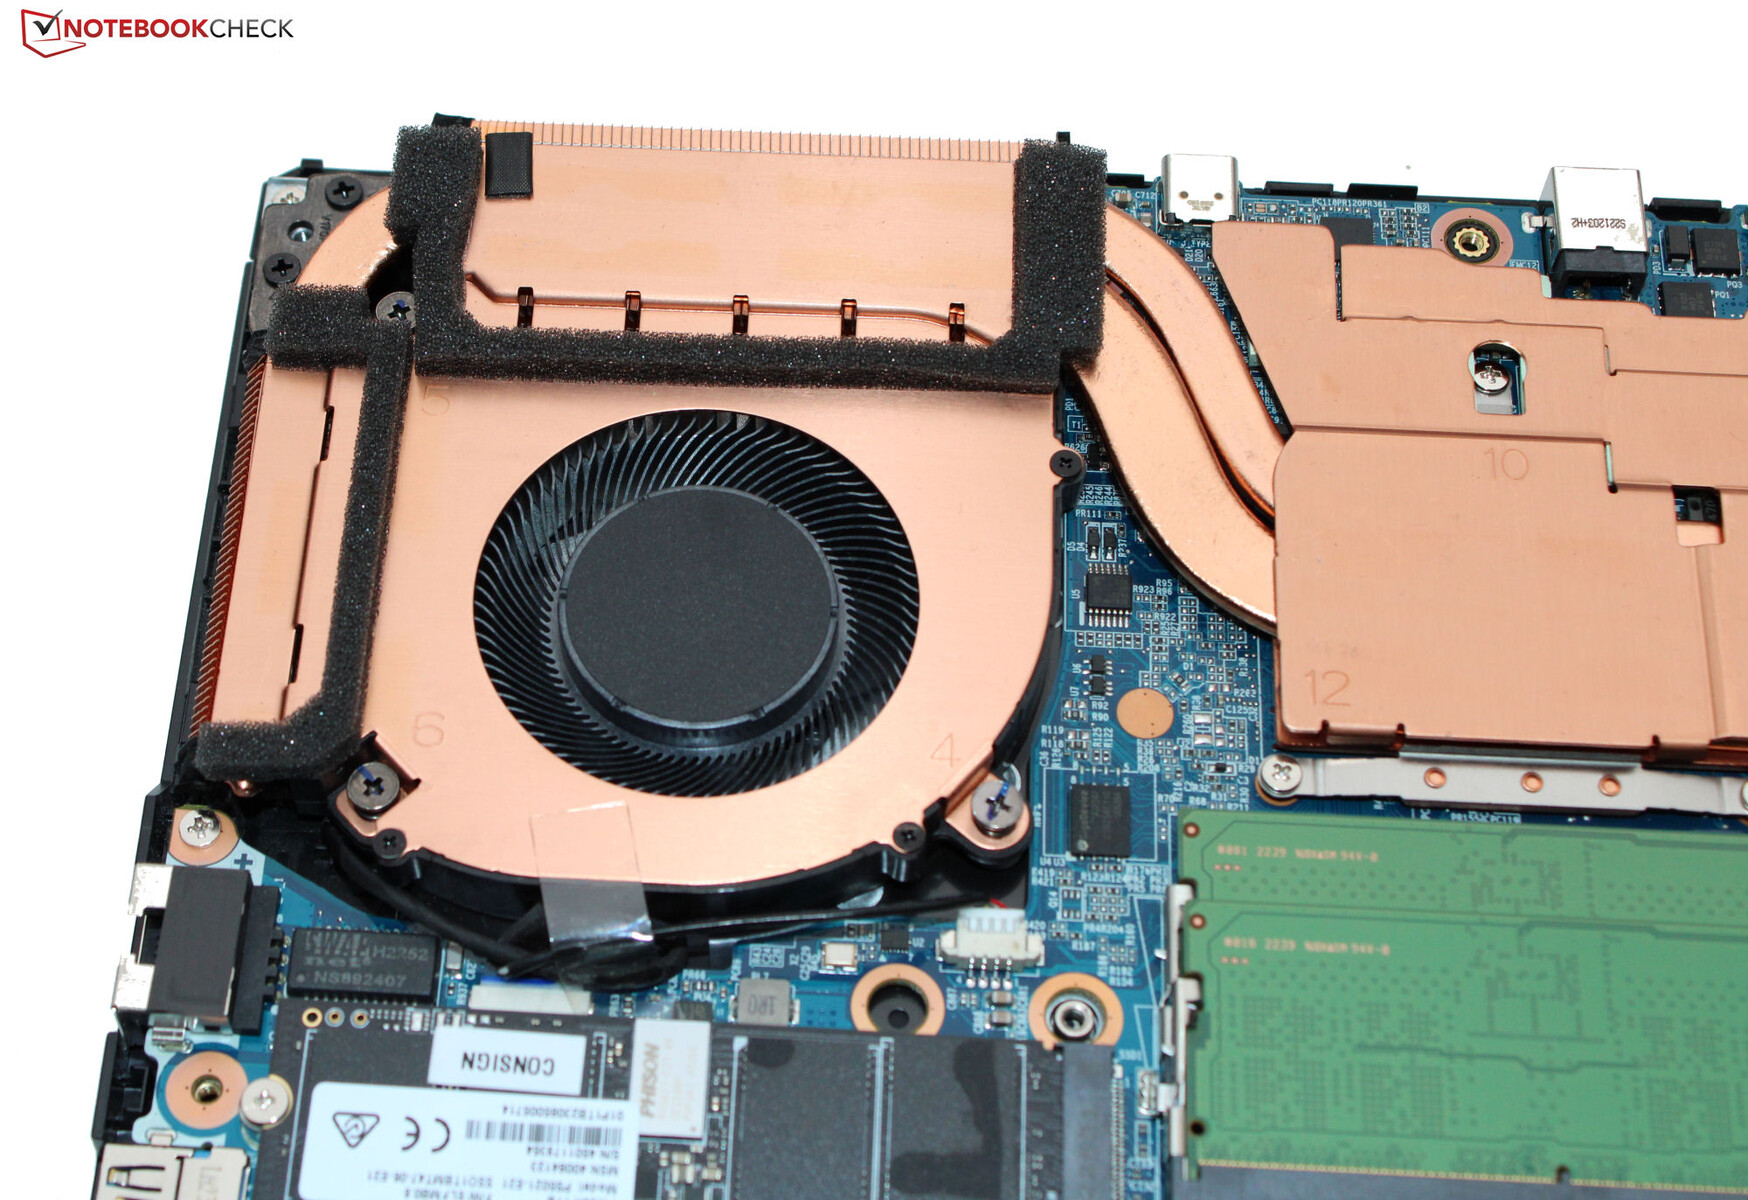
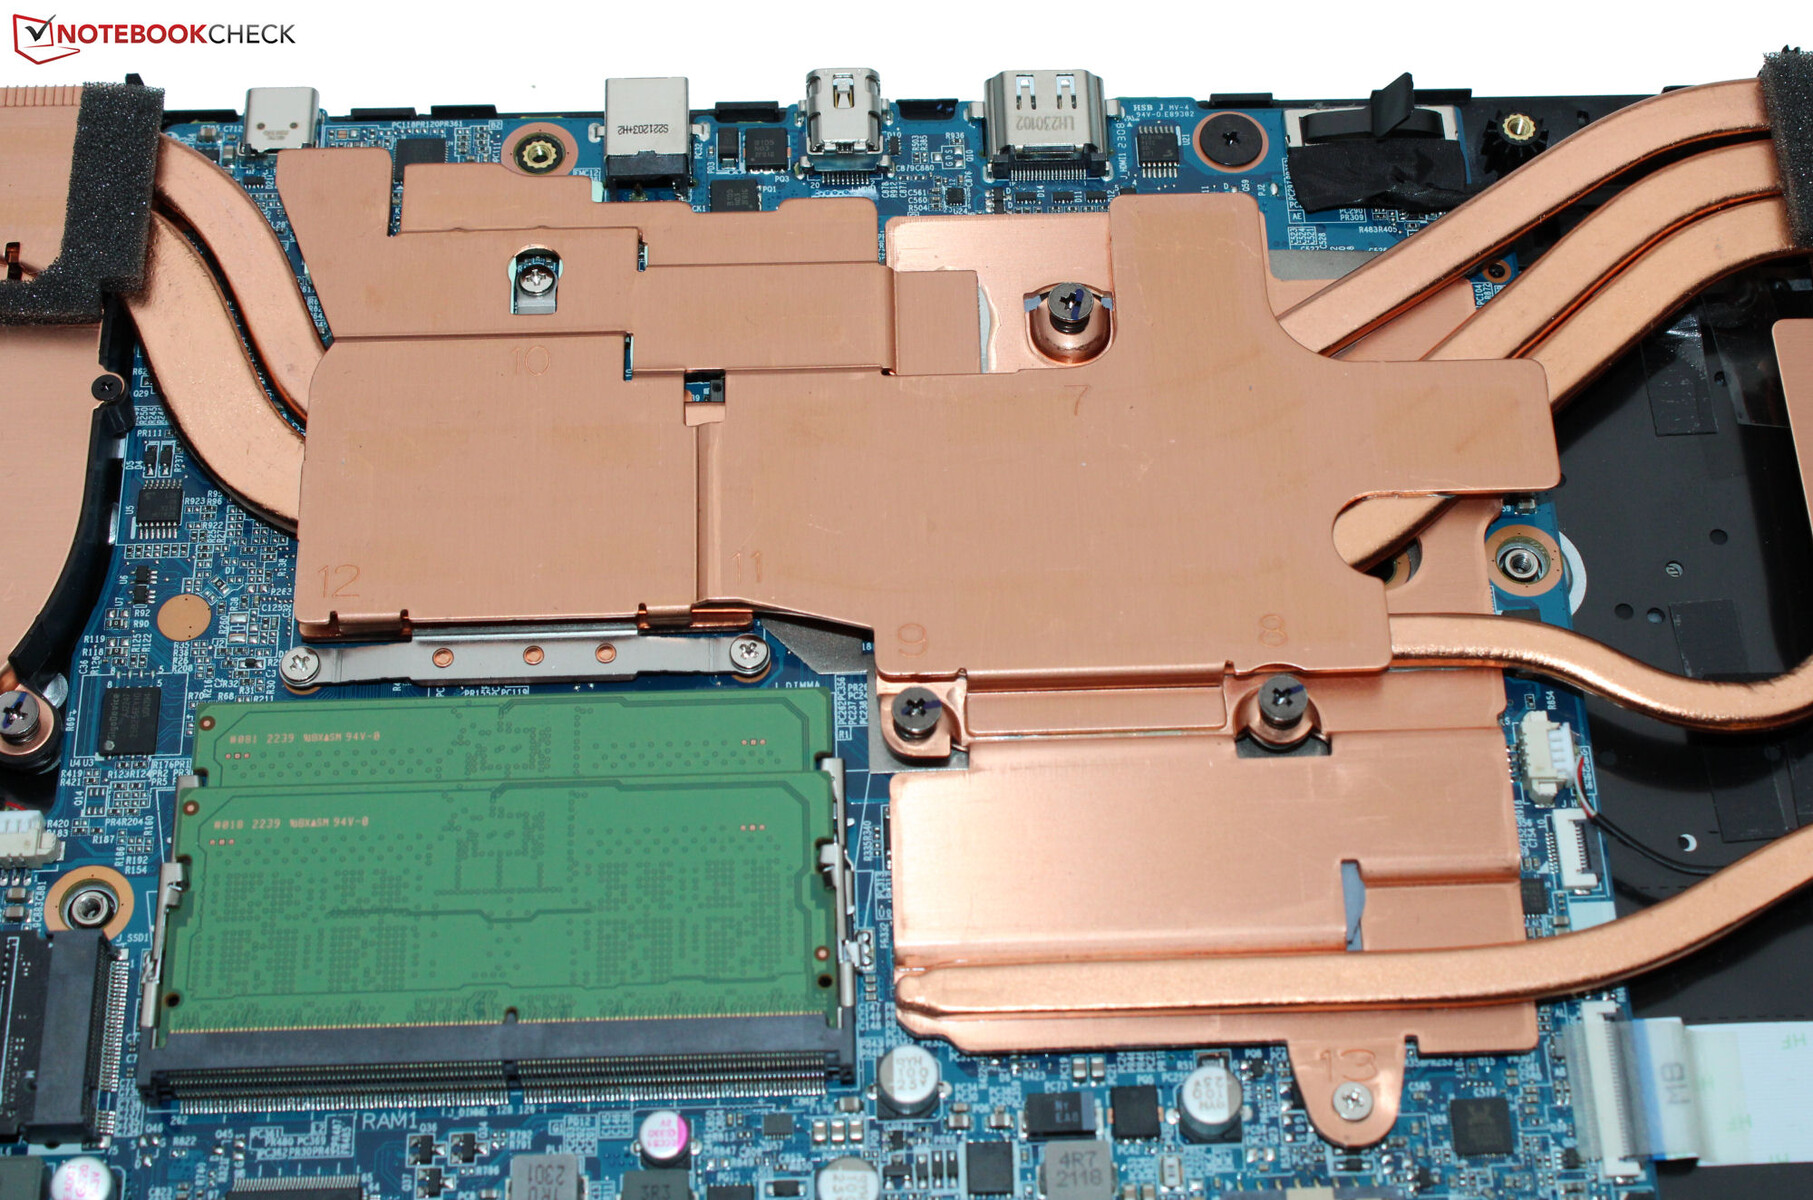
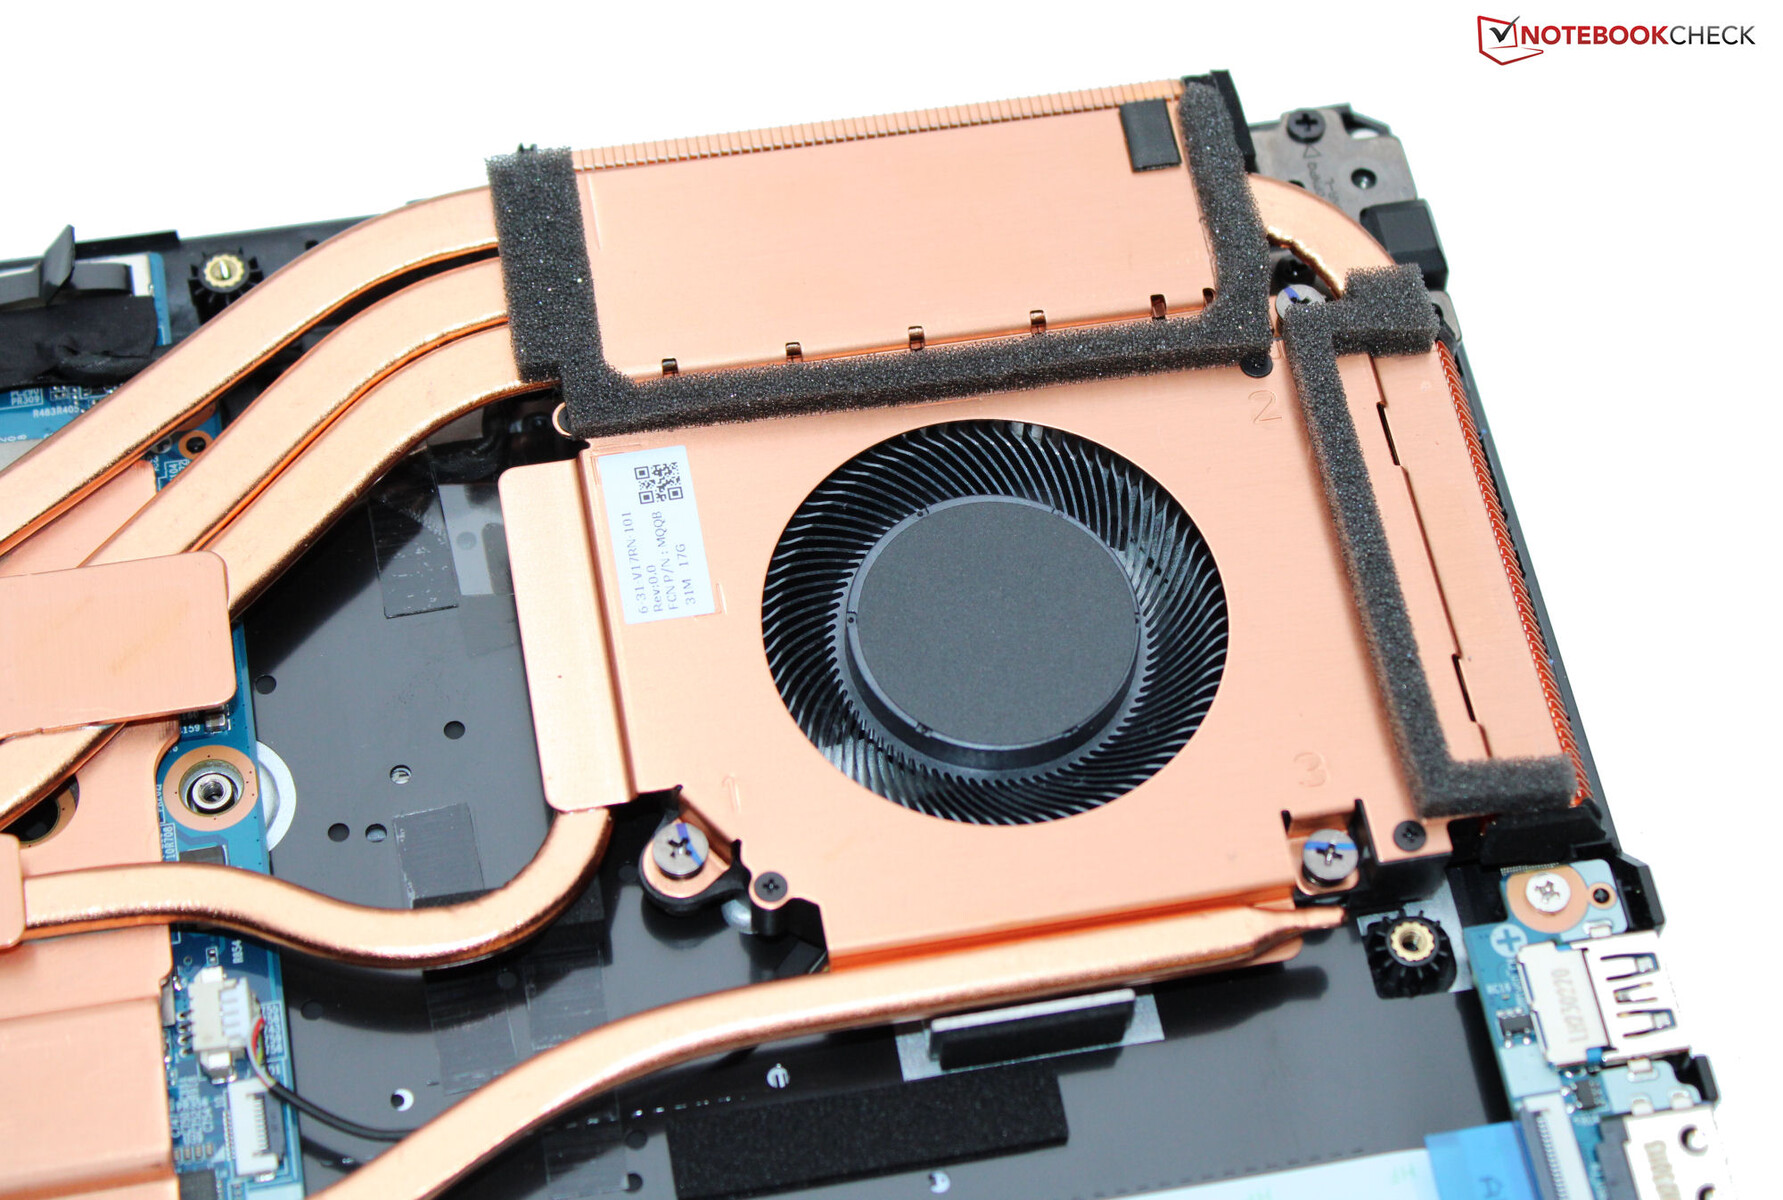
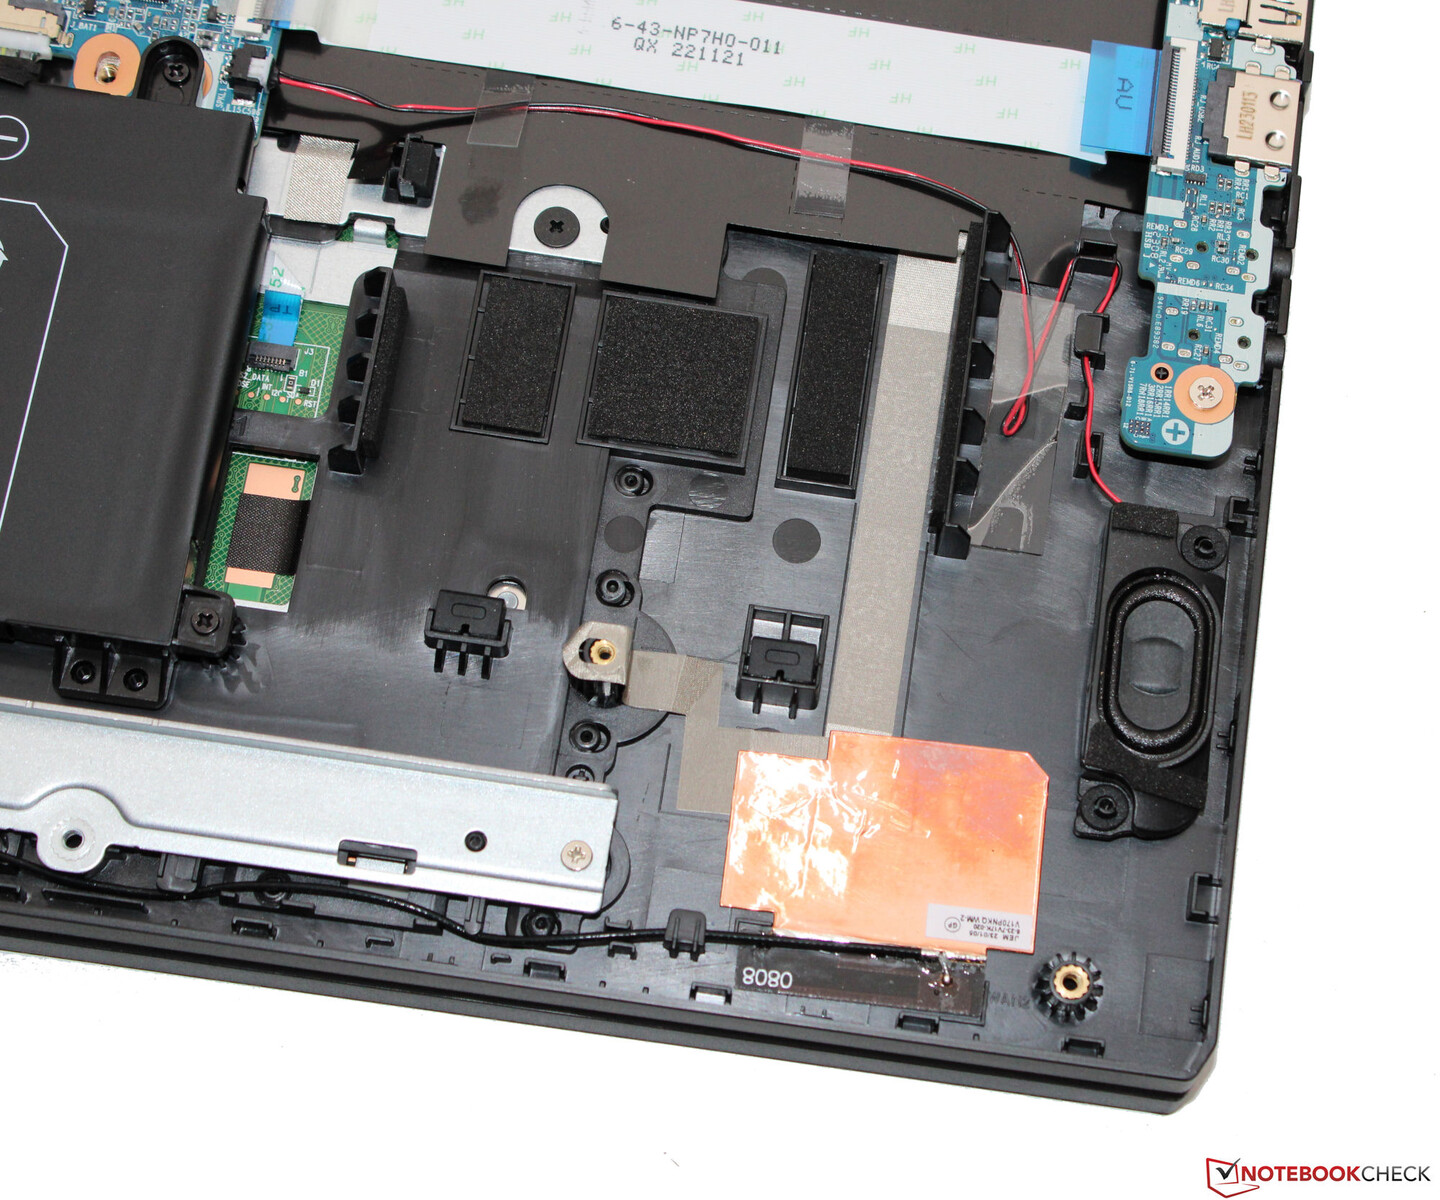
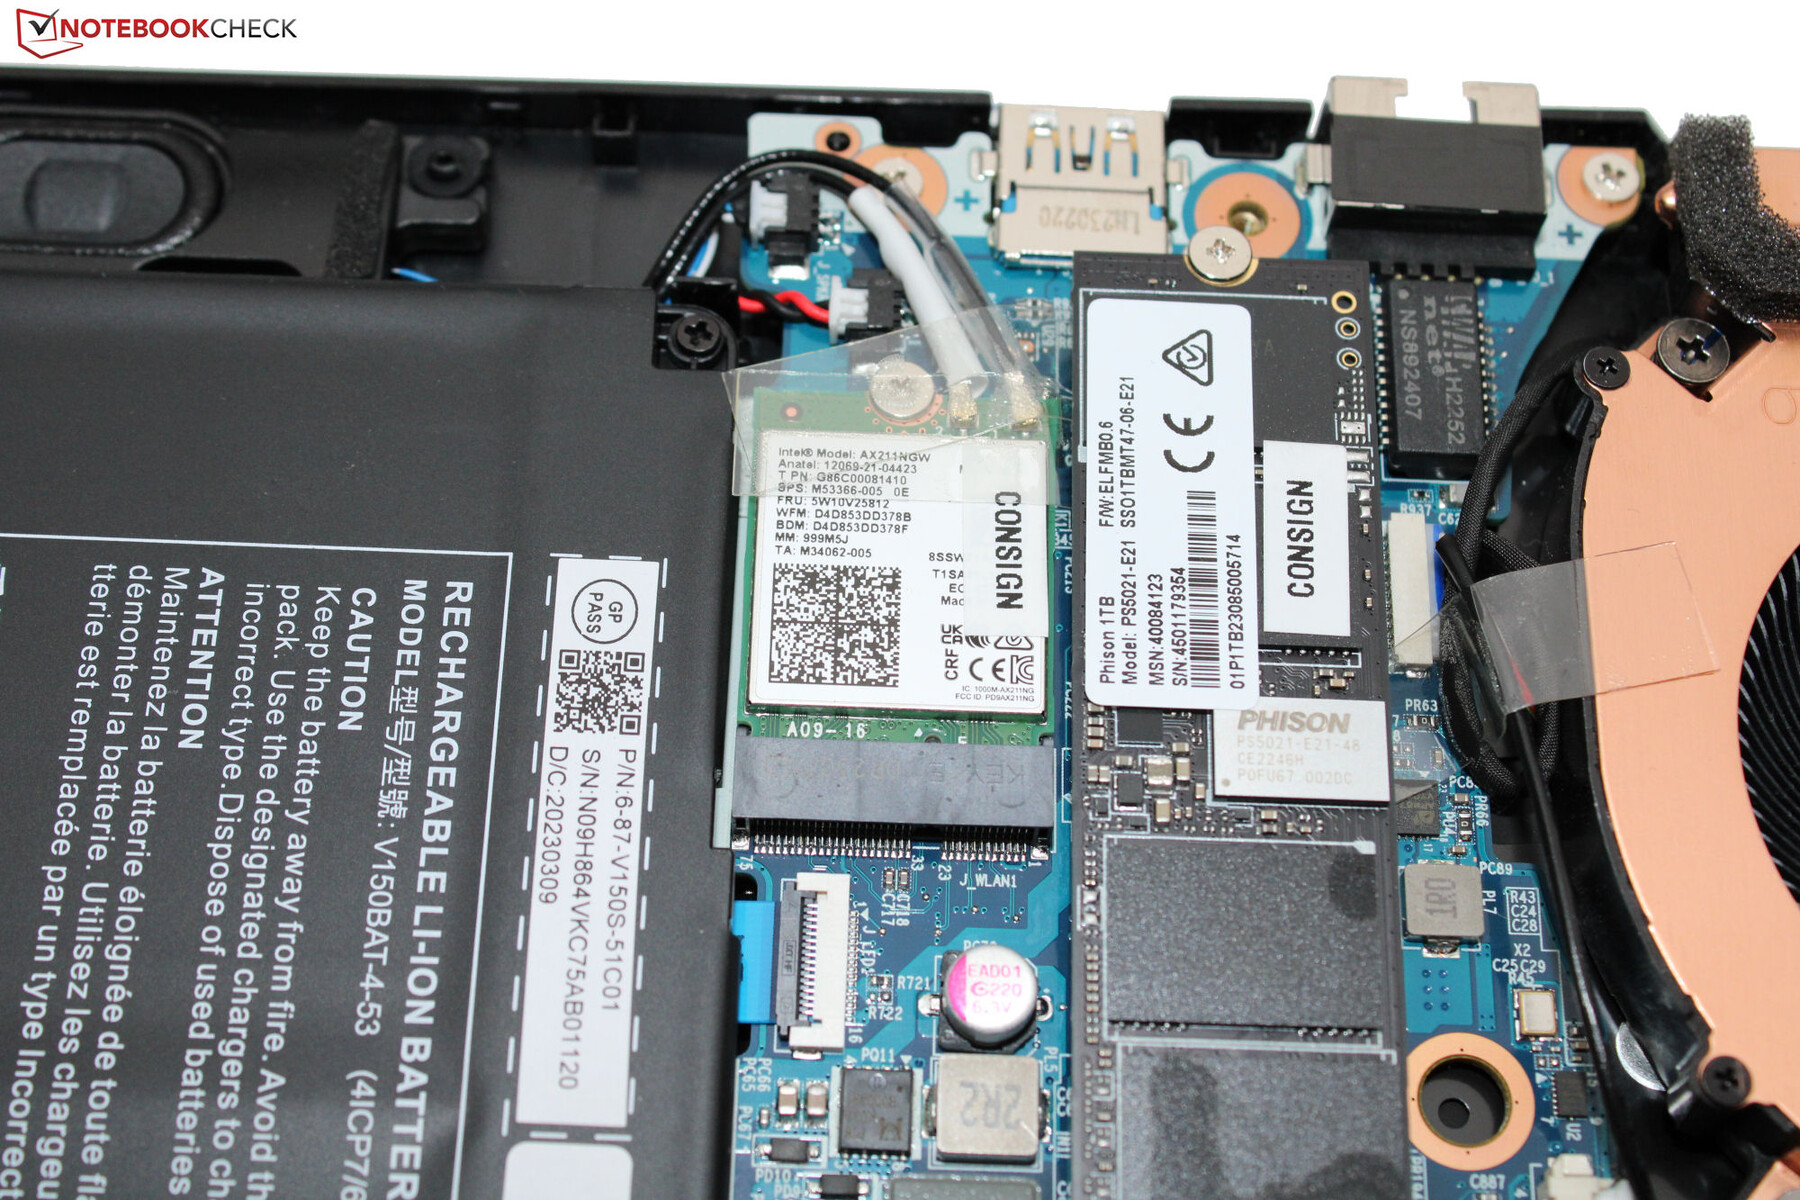
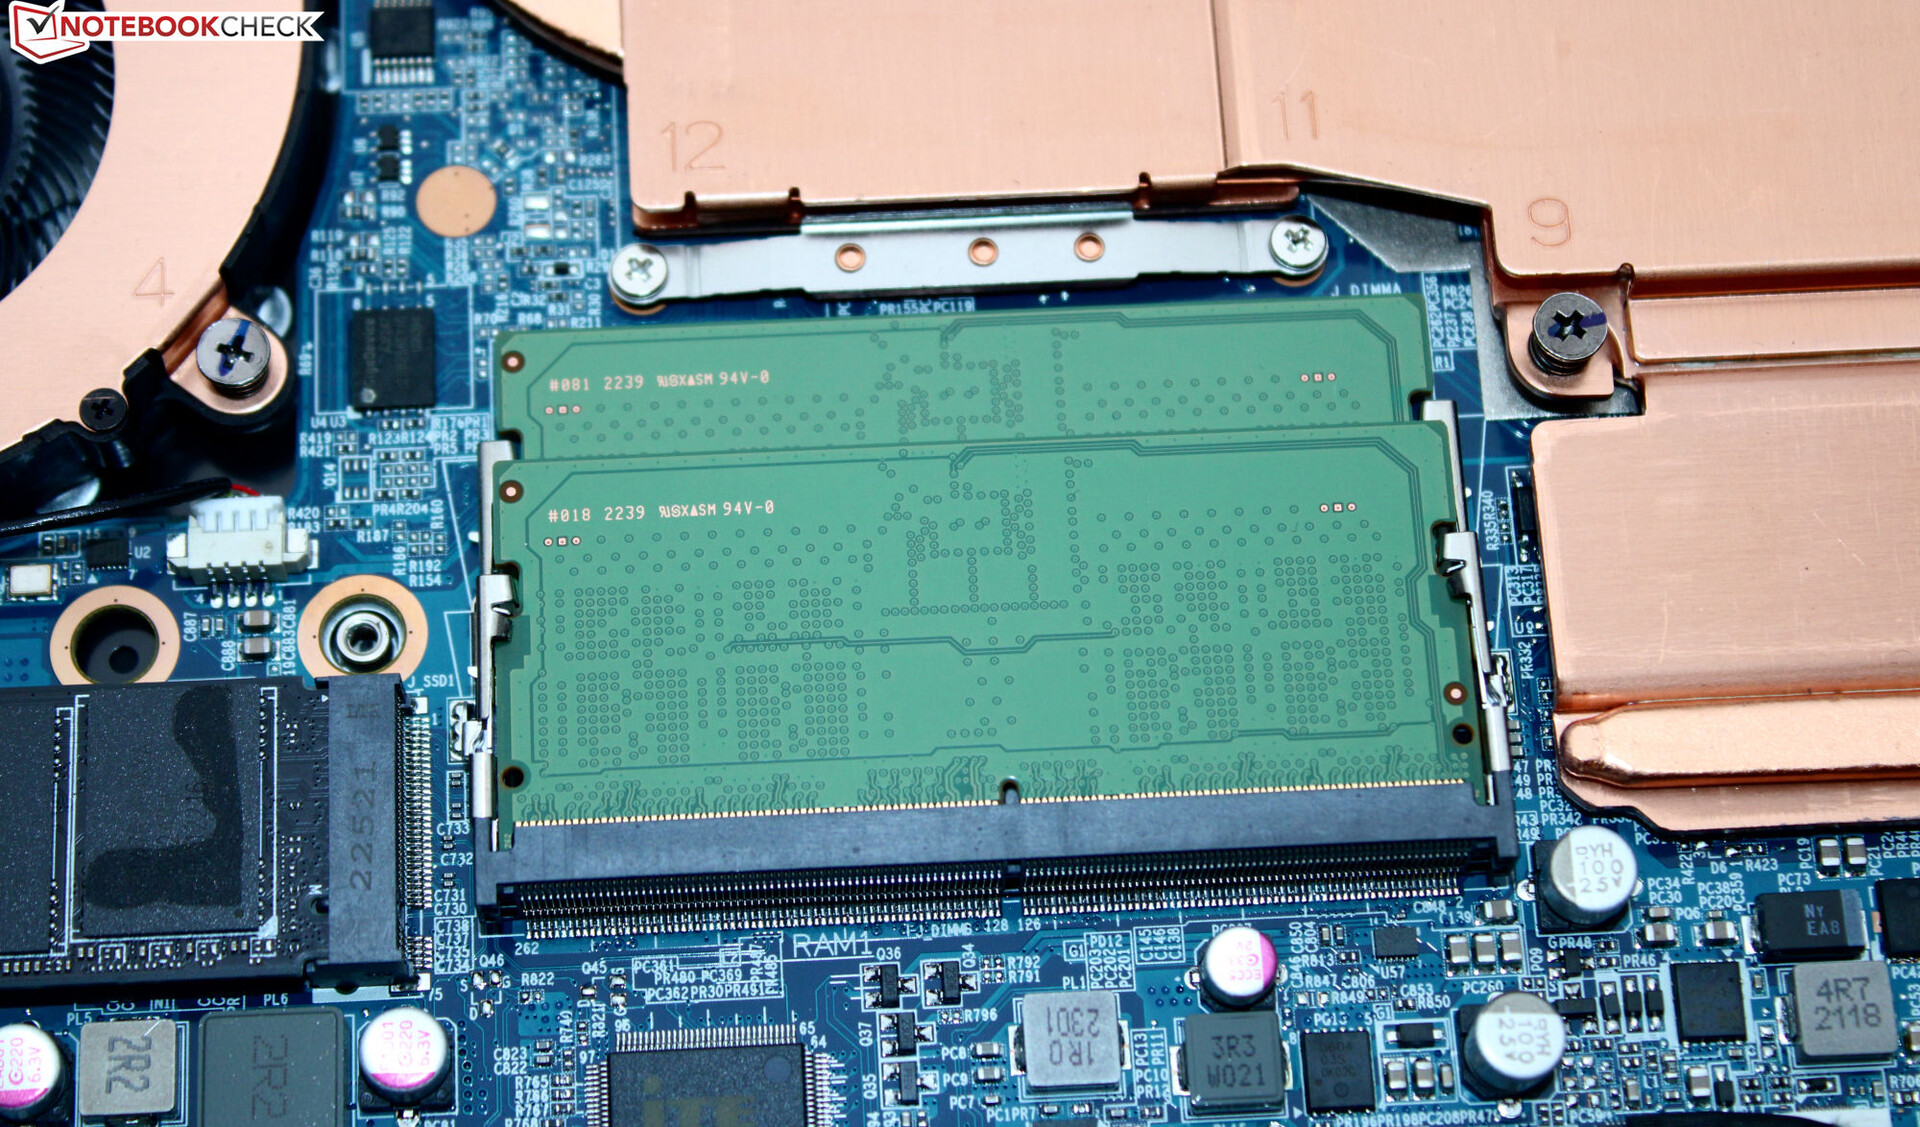
Après avoir retiré de nombreuses vis sur le fond du boîtier, vous pouvez retirer la plaque inférieure à l'aide d'un outil d'extraction tel qu'une spatule plate. Vous aurez alors accès aux banques de mémoire de travail (toutes deux occupées), au SSD PCIe 4 M.2-2280, au module WLAN, aux ventilateurs et à la batterie.
Garantie
Medion offre une garantie de deux ans pour l'Erazer. Des extensions de garantie sont disponibles, mais elles doivent être achetées en même temps que l'ordinateur portable dans la boutique en ligne de Medion. Il n'est pas possible de les acheter ultérieurement.
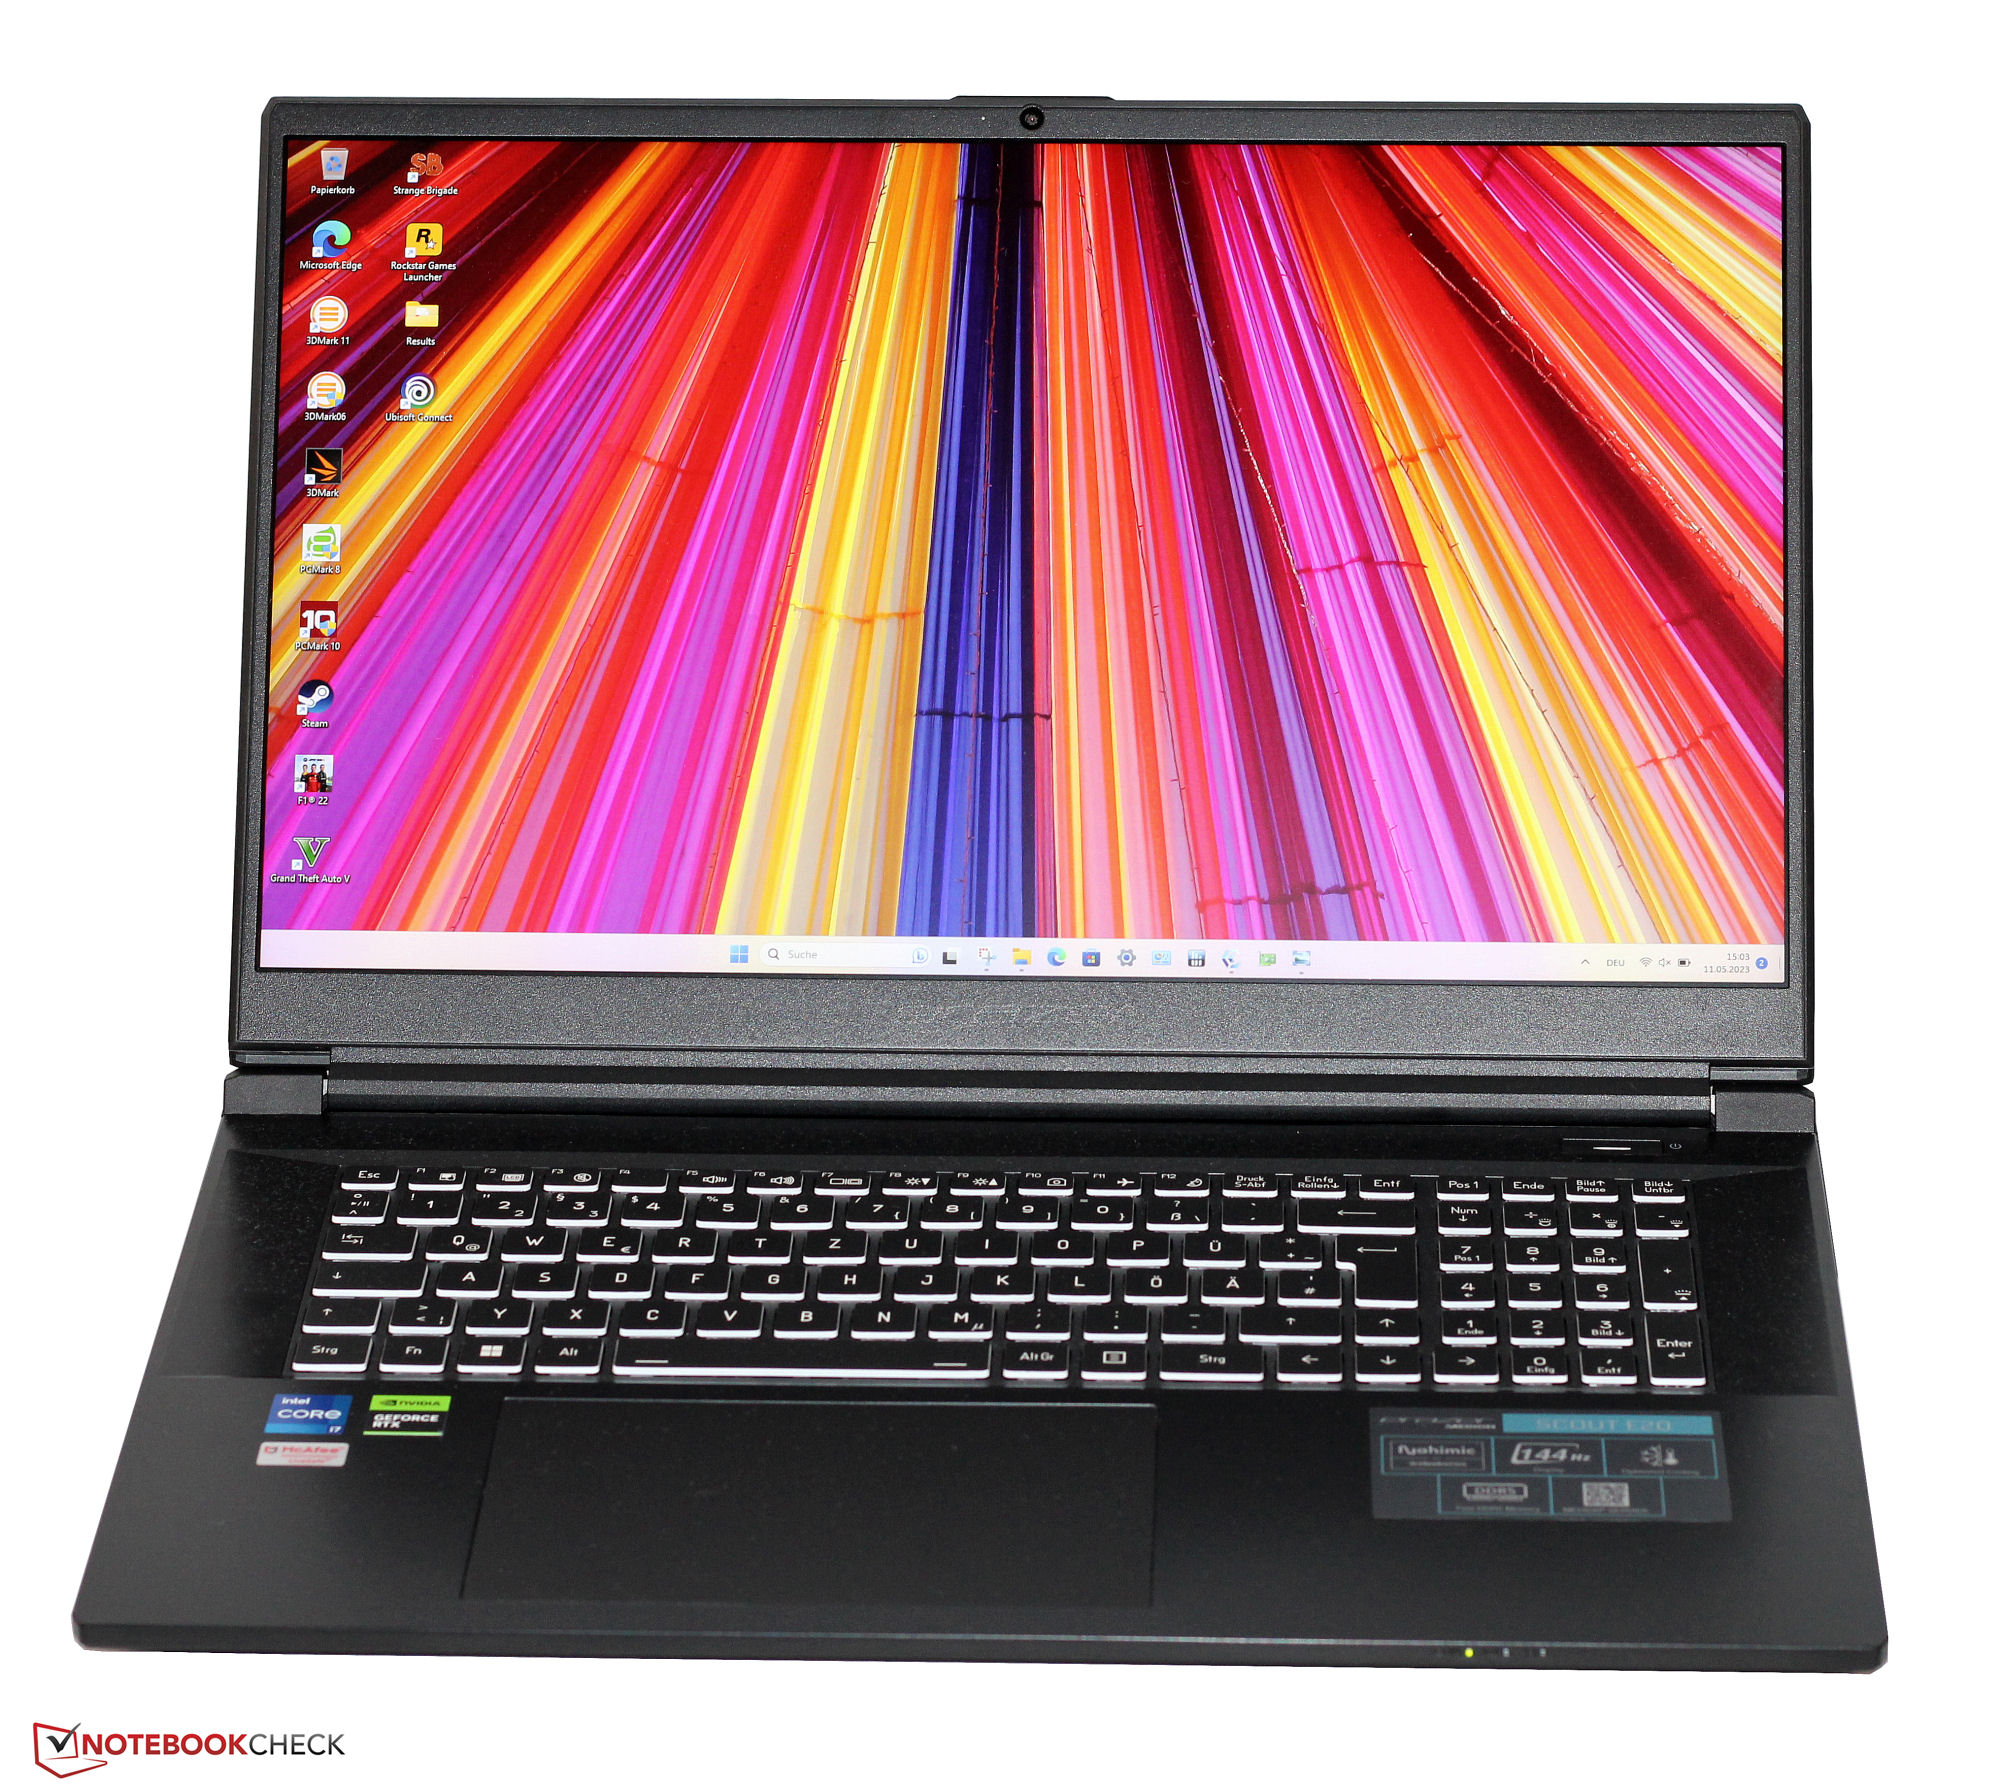
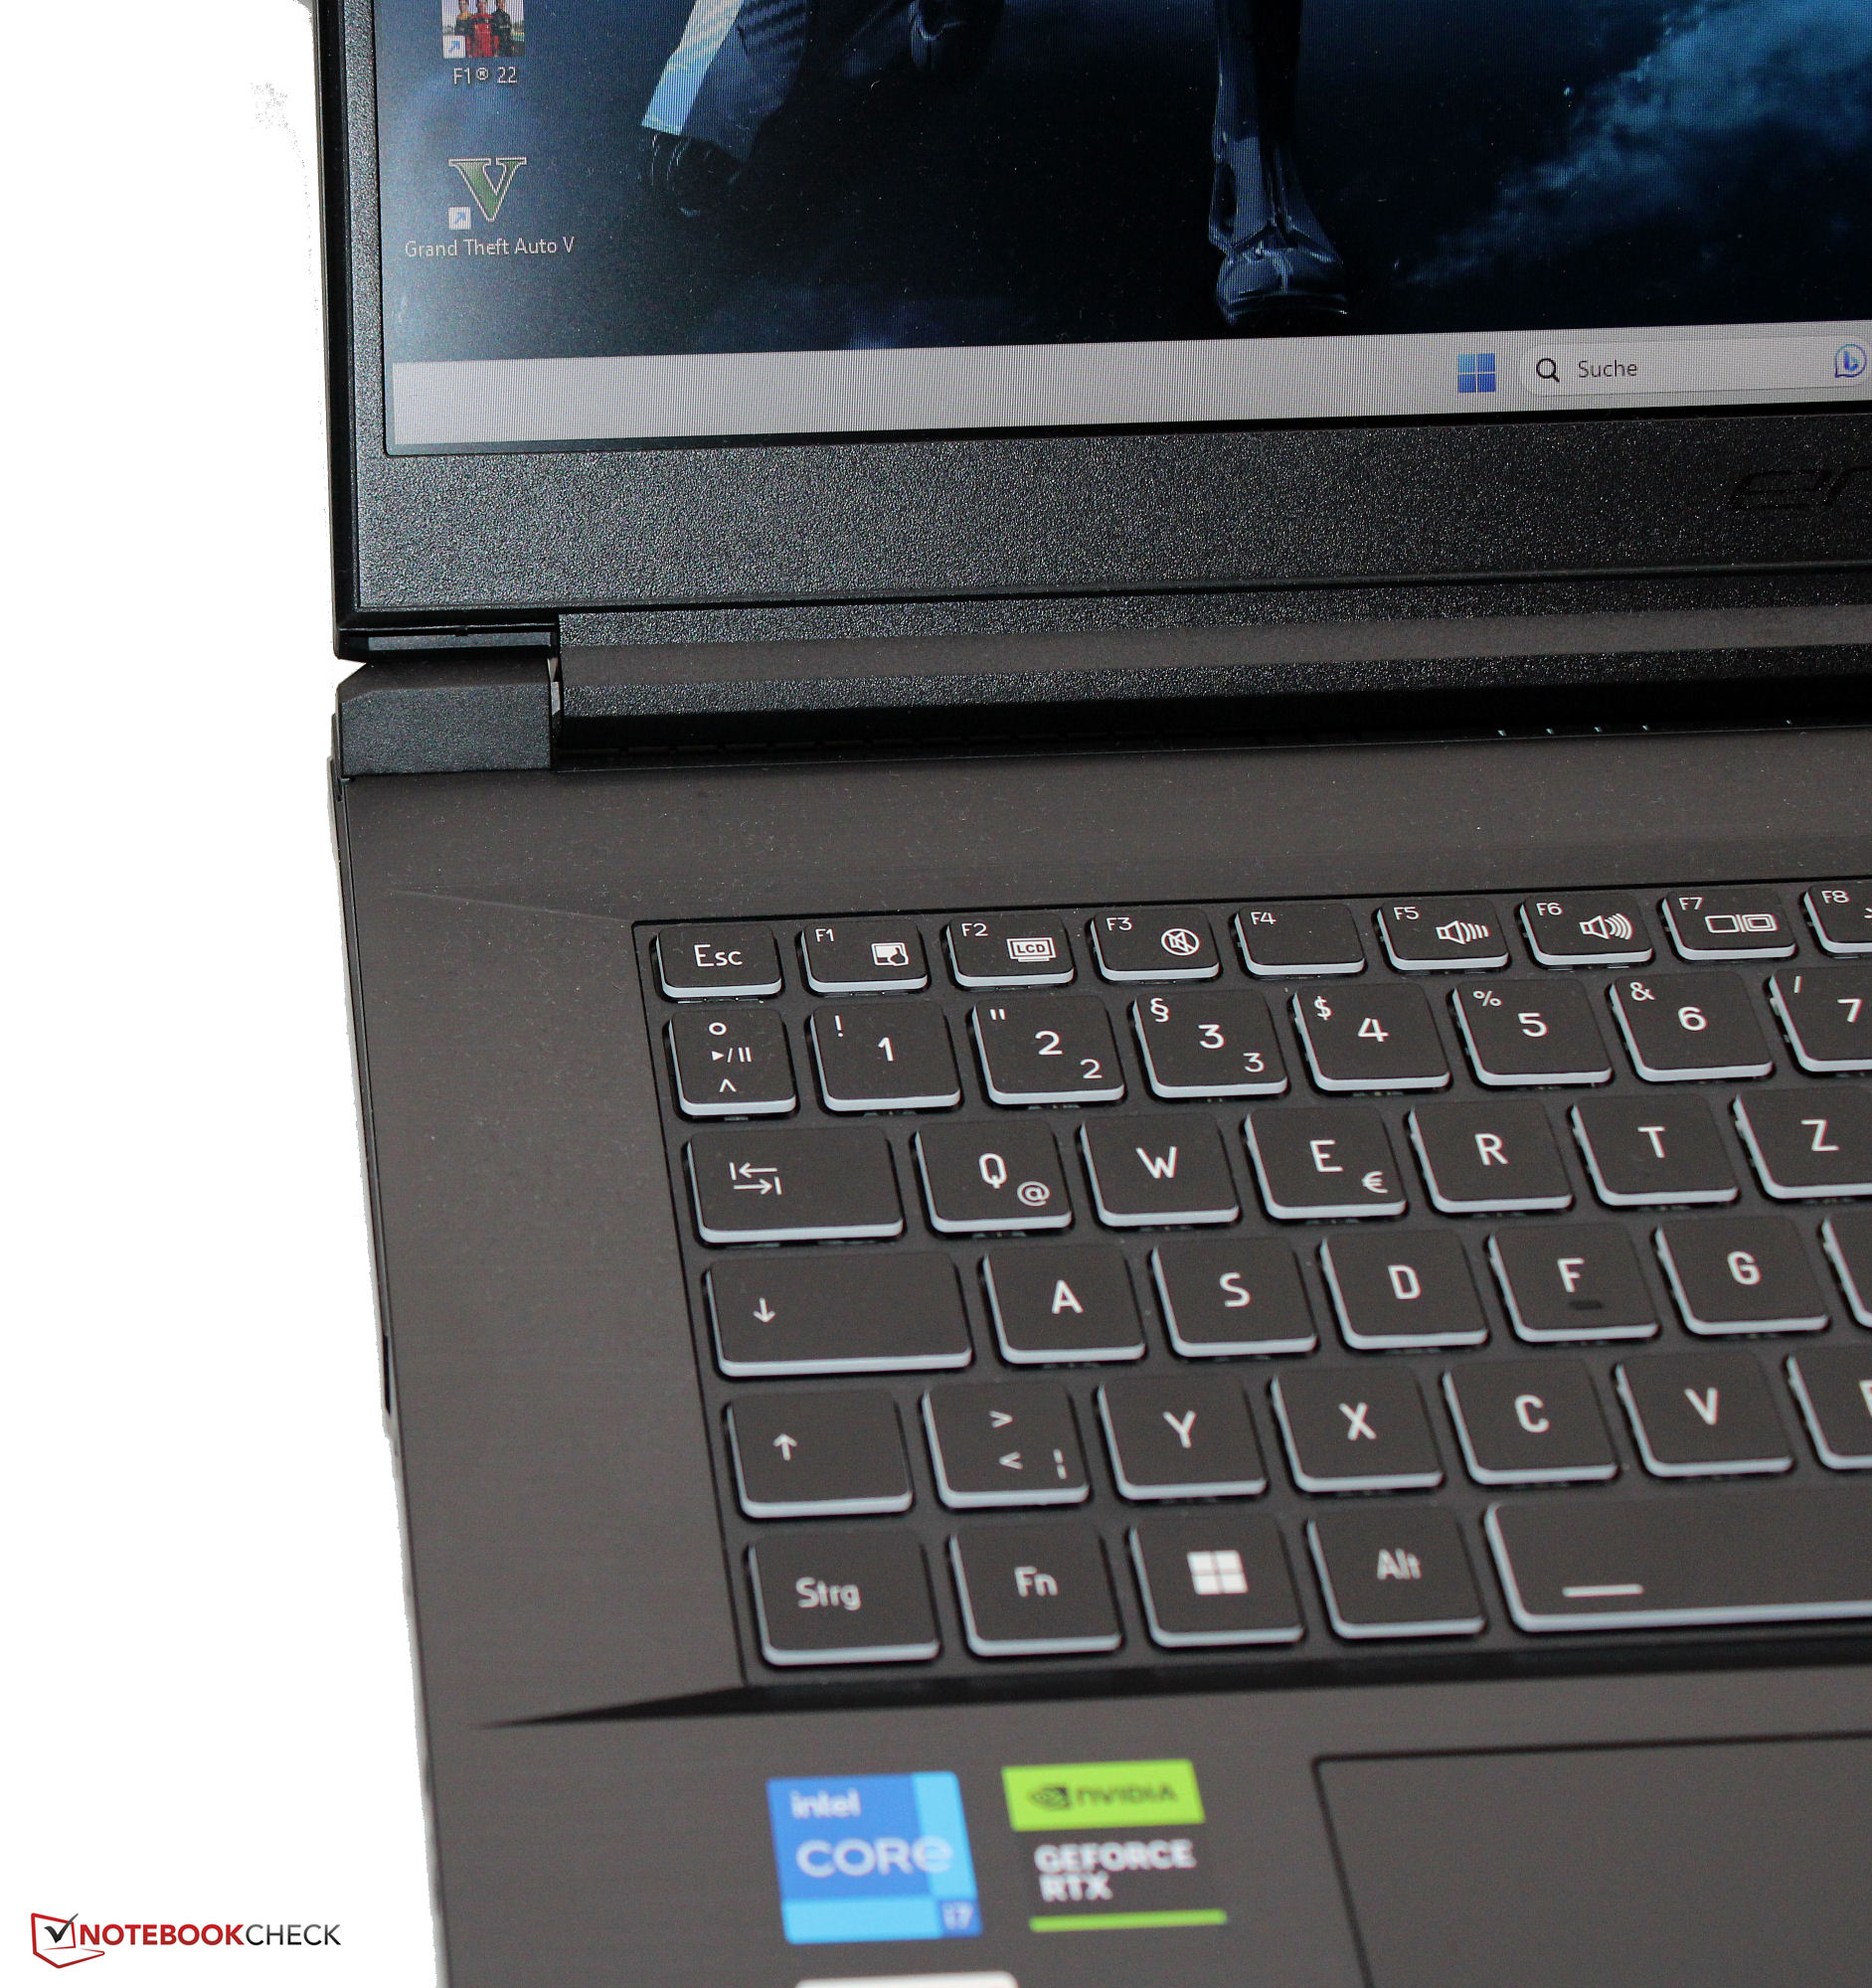
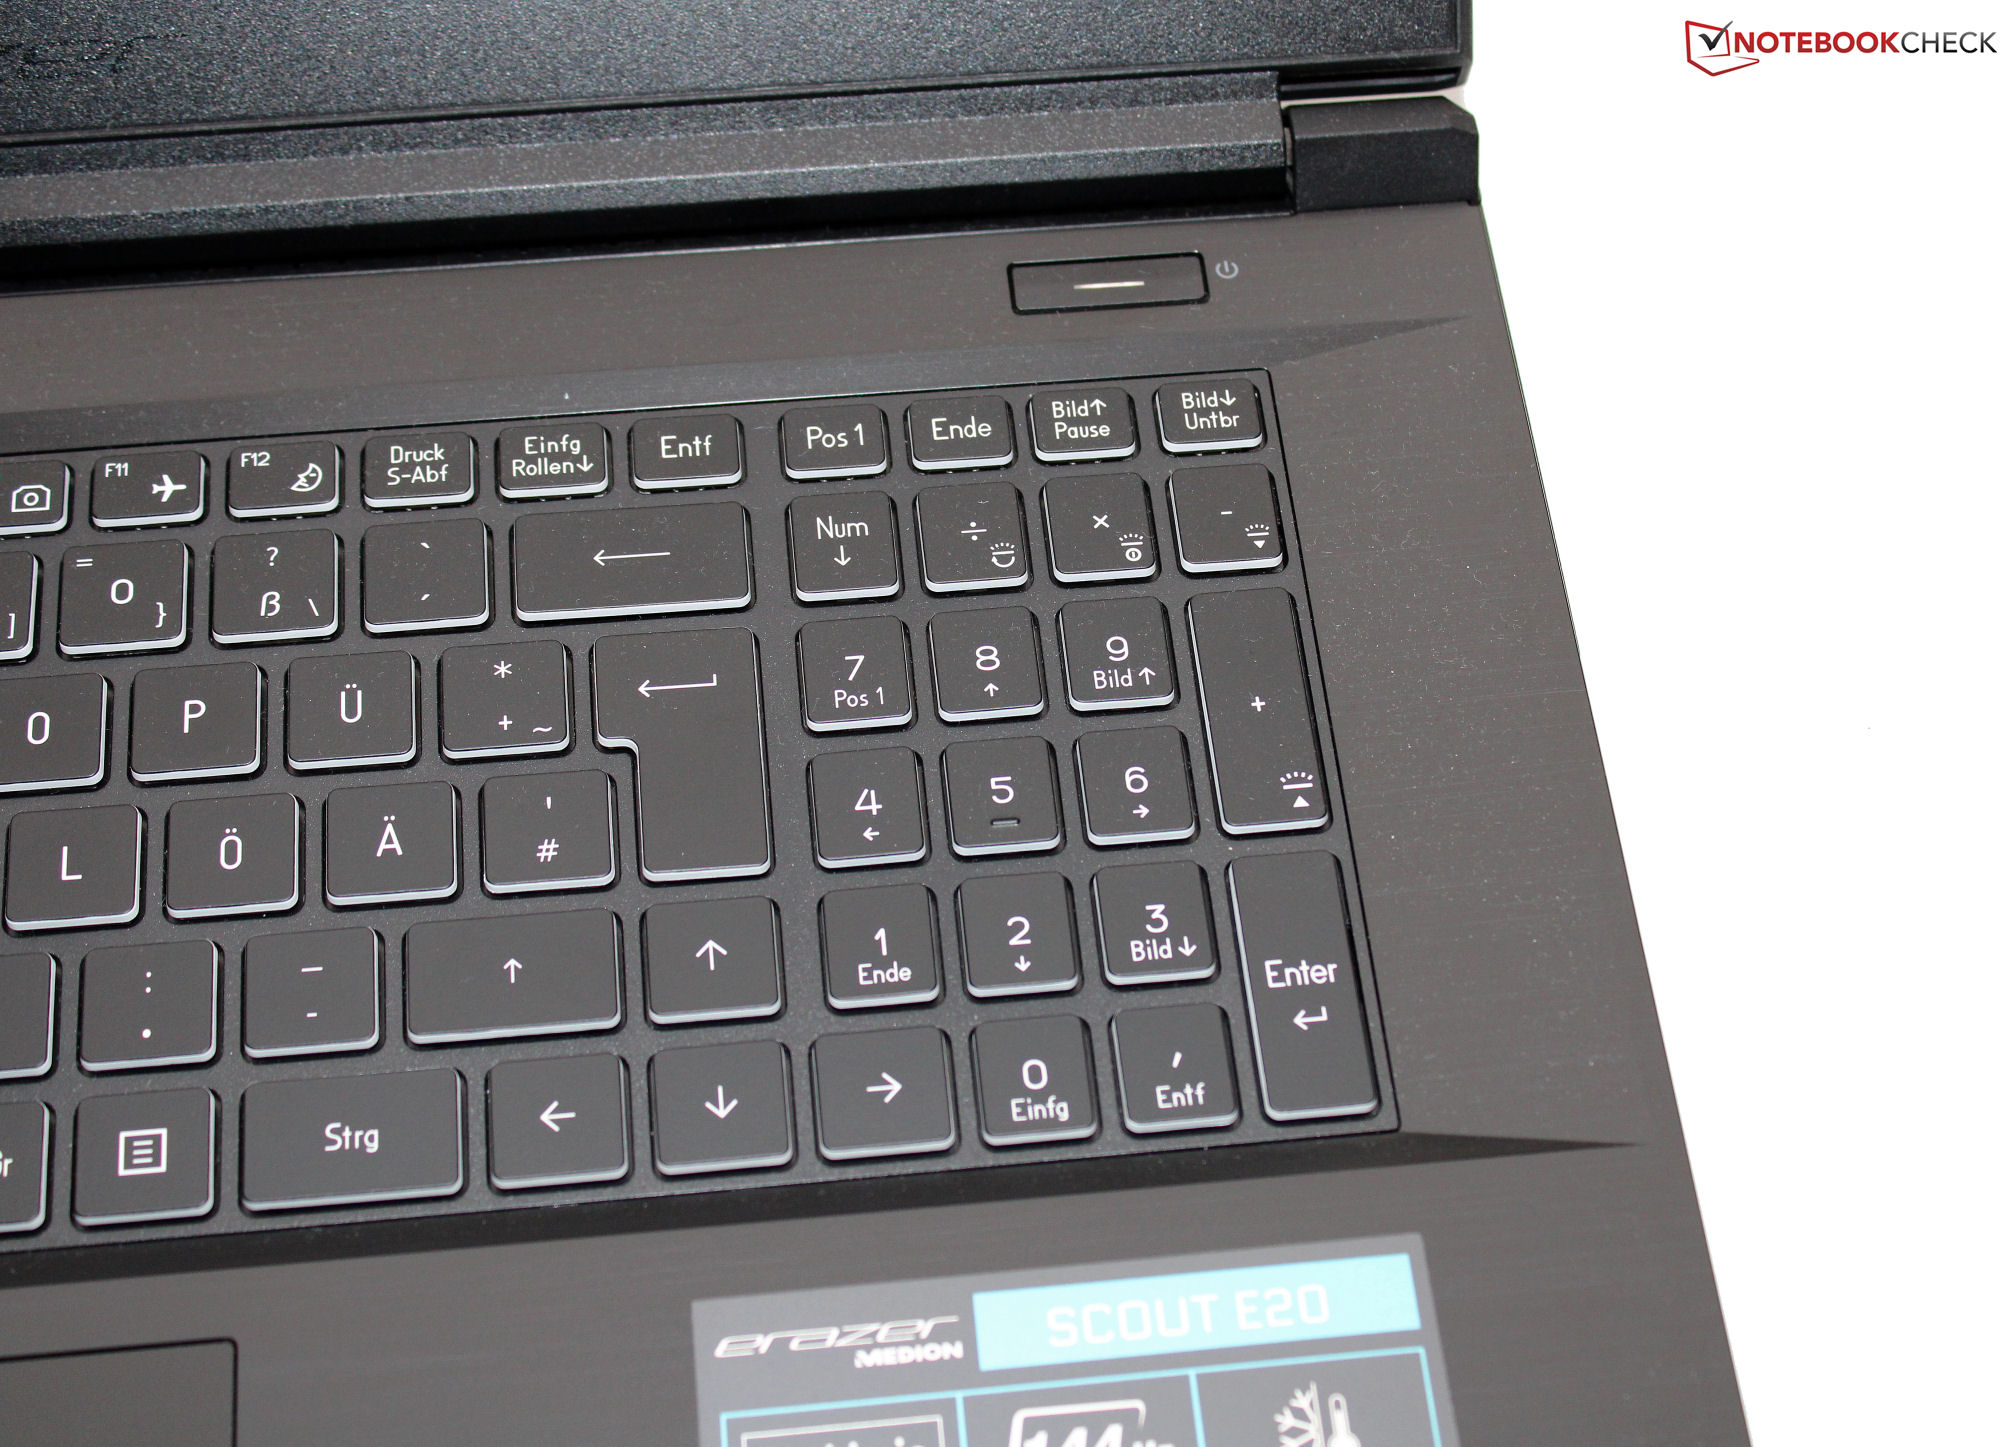
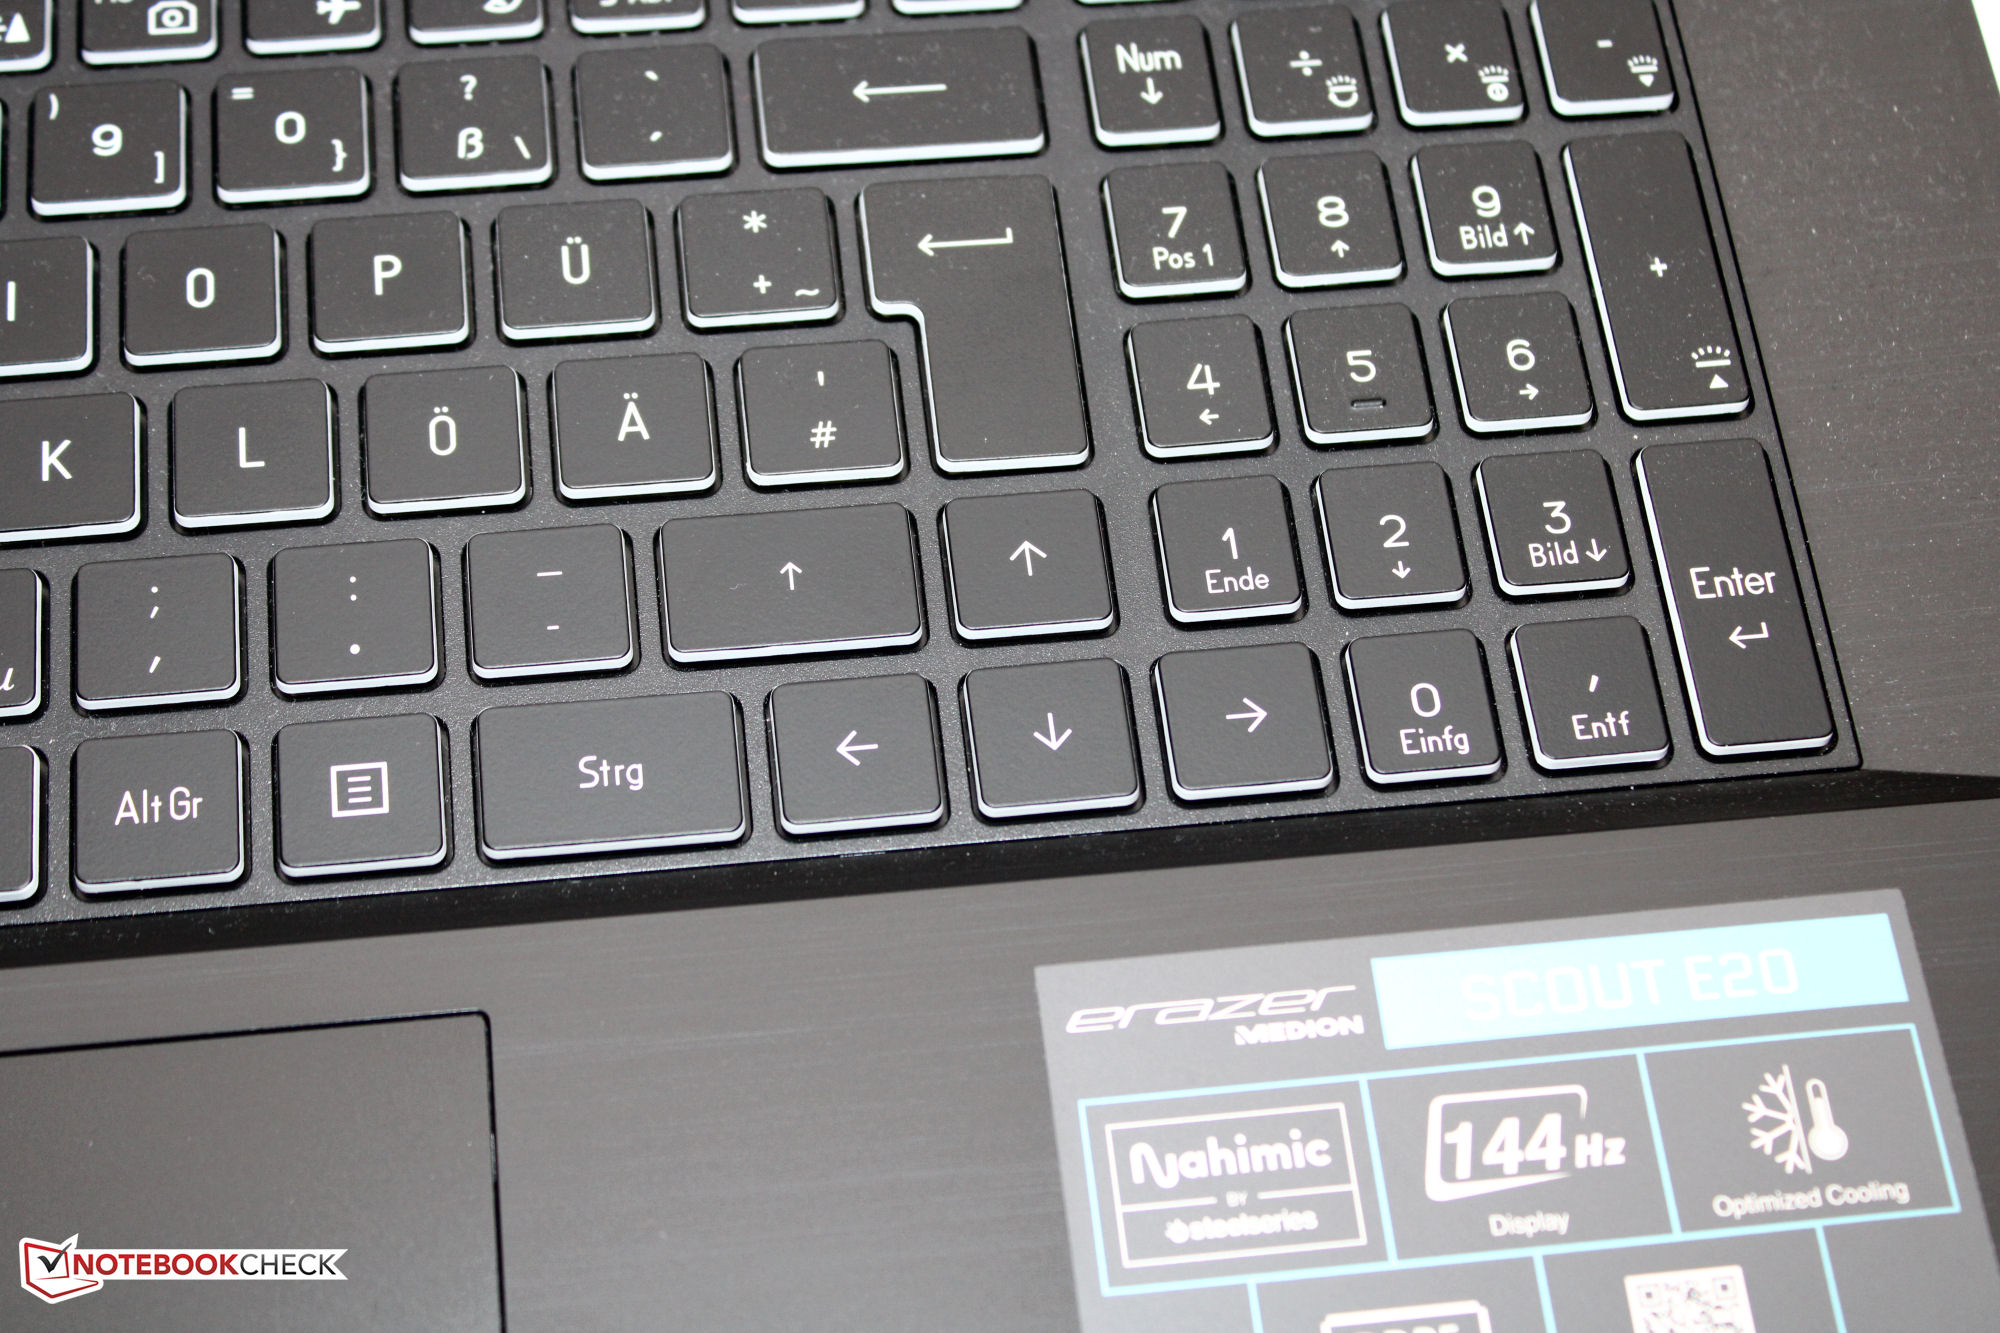
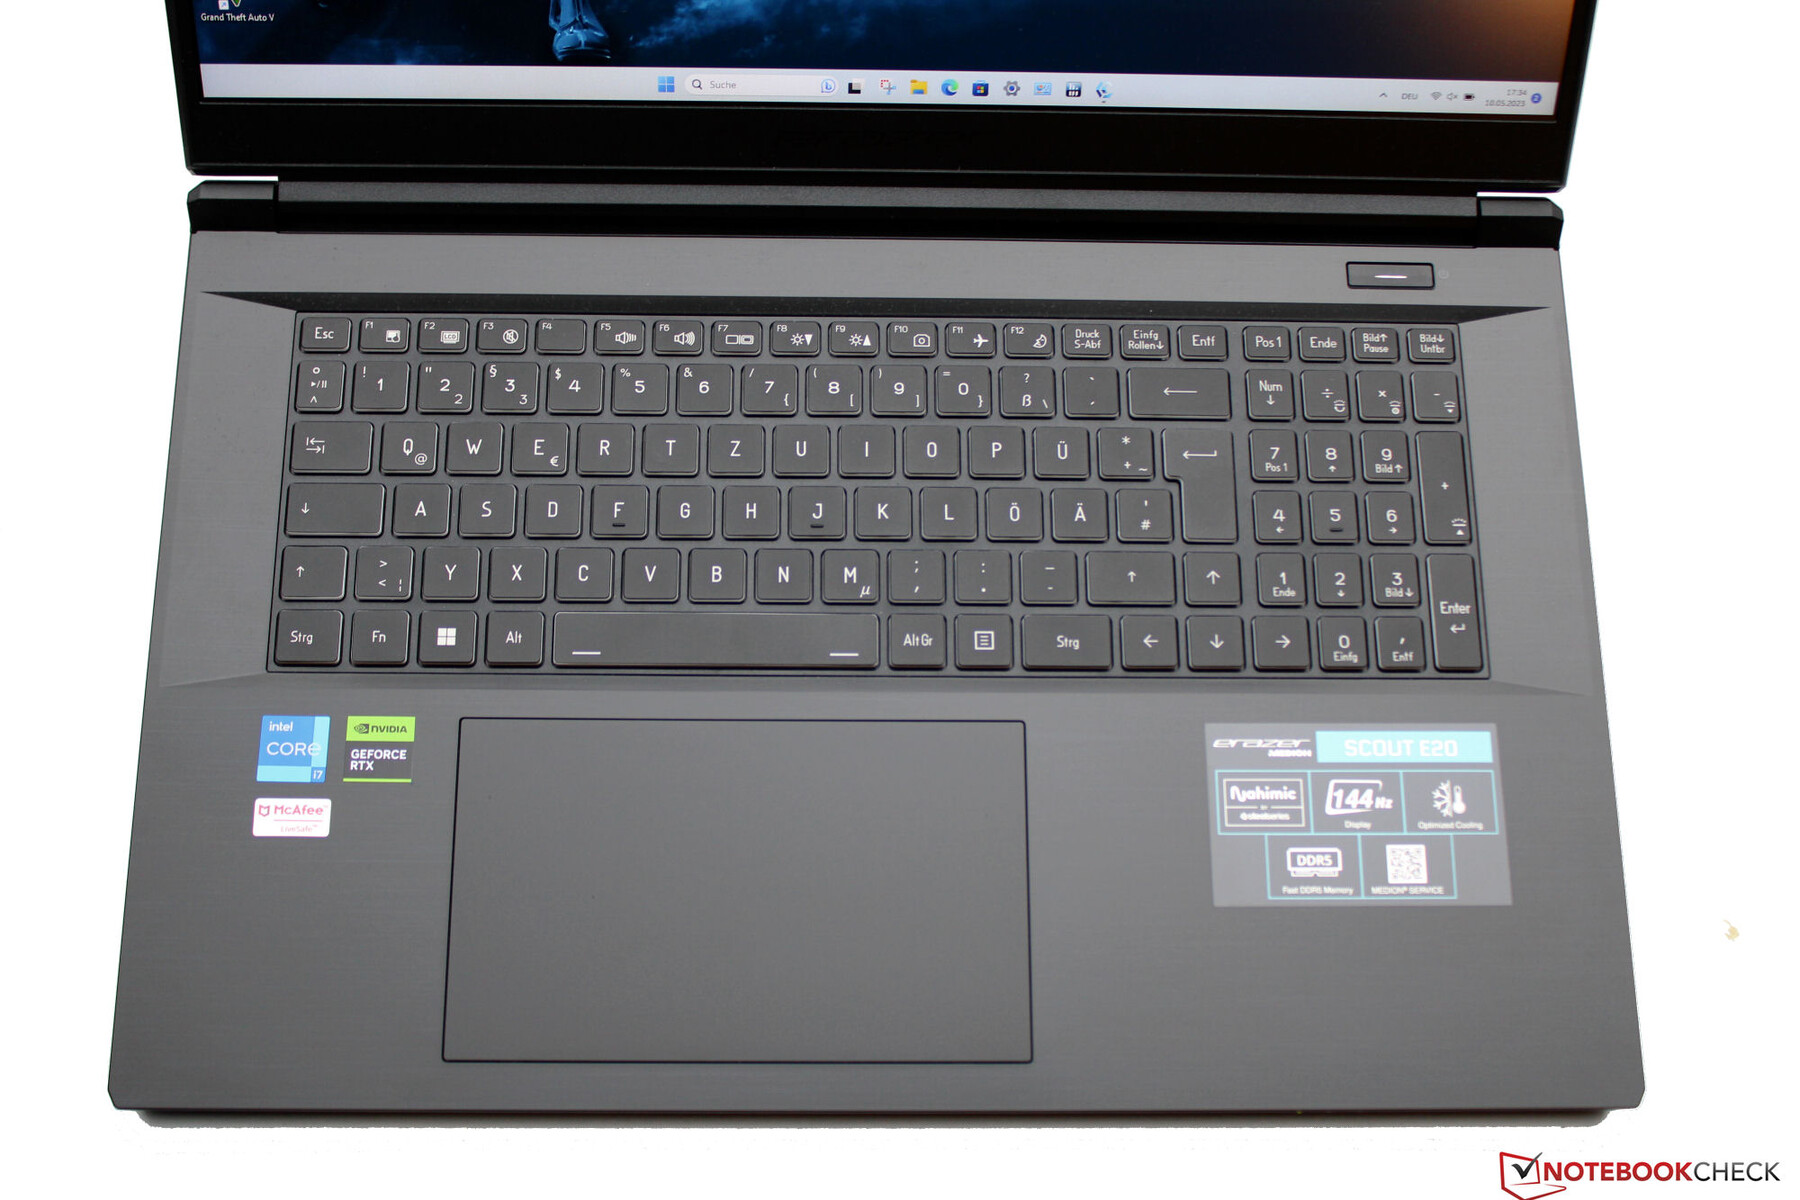
Périphériques d'entrée - Clavier E20 avec éclairage RGB
Clavier
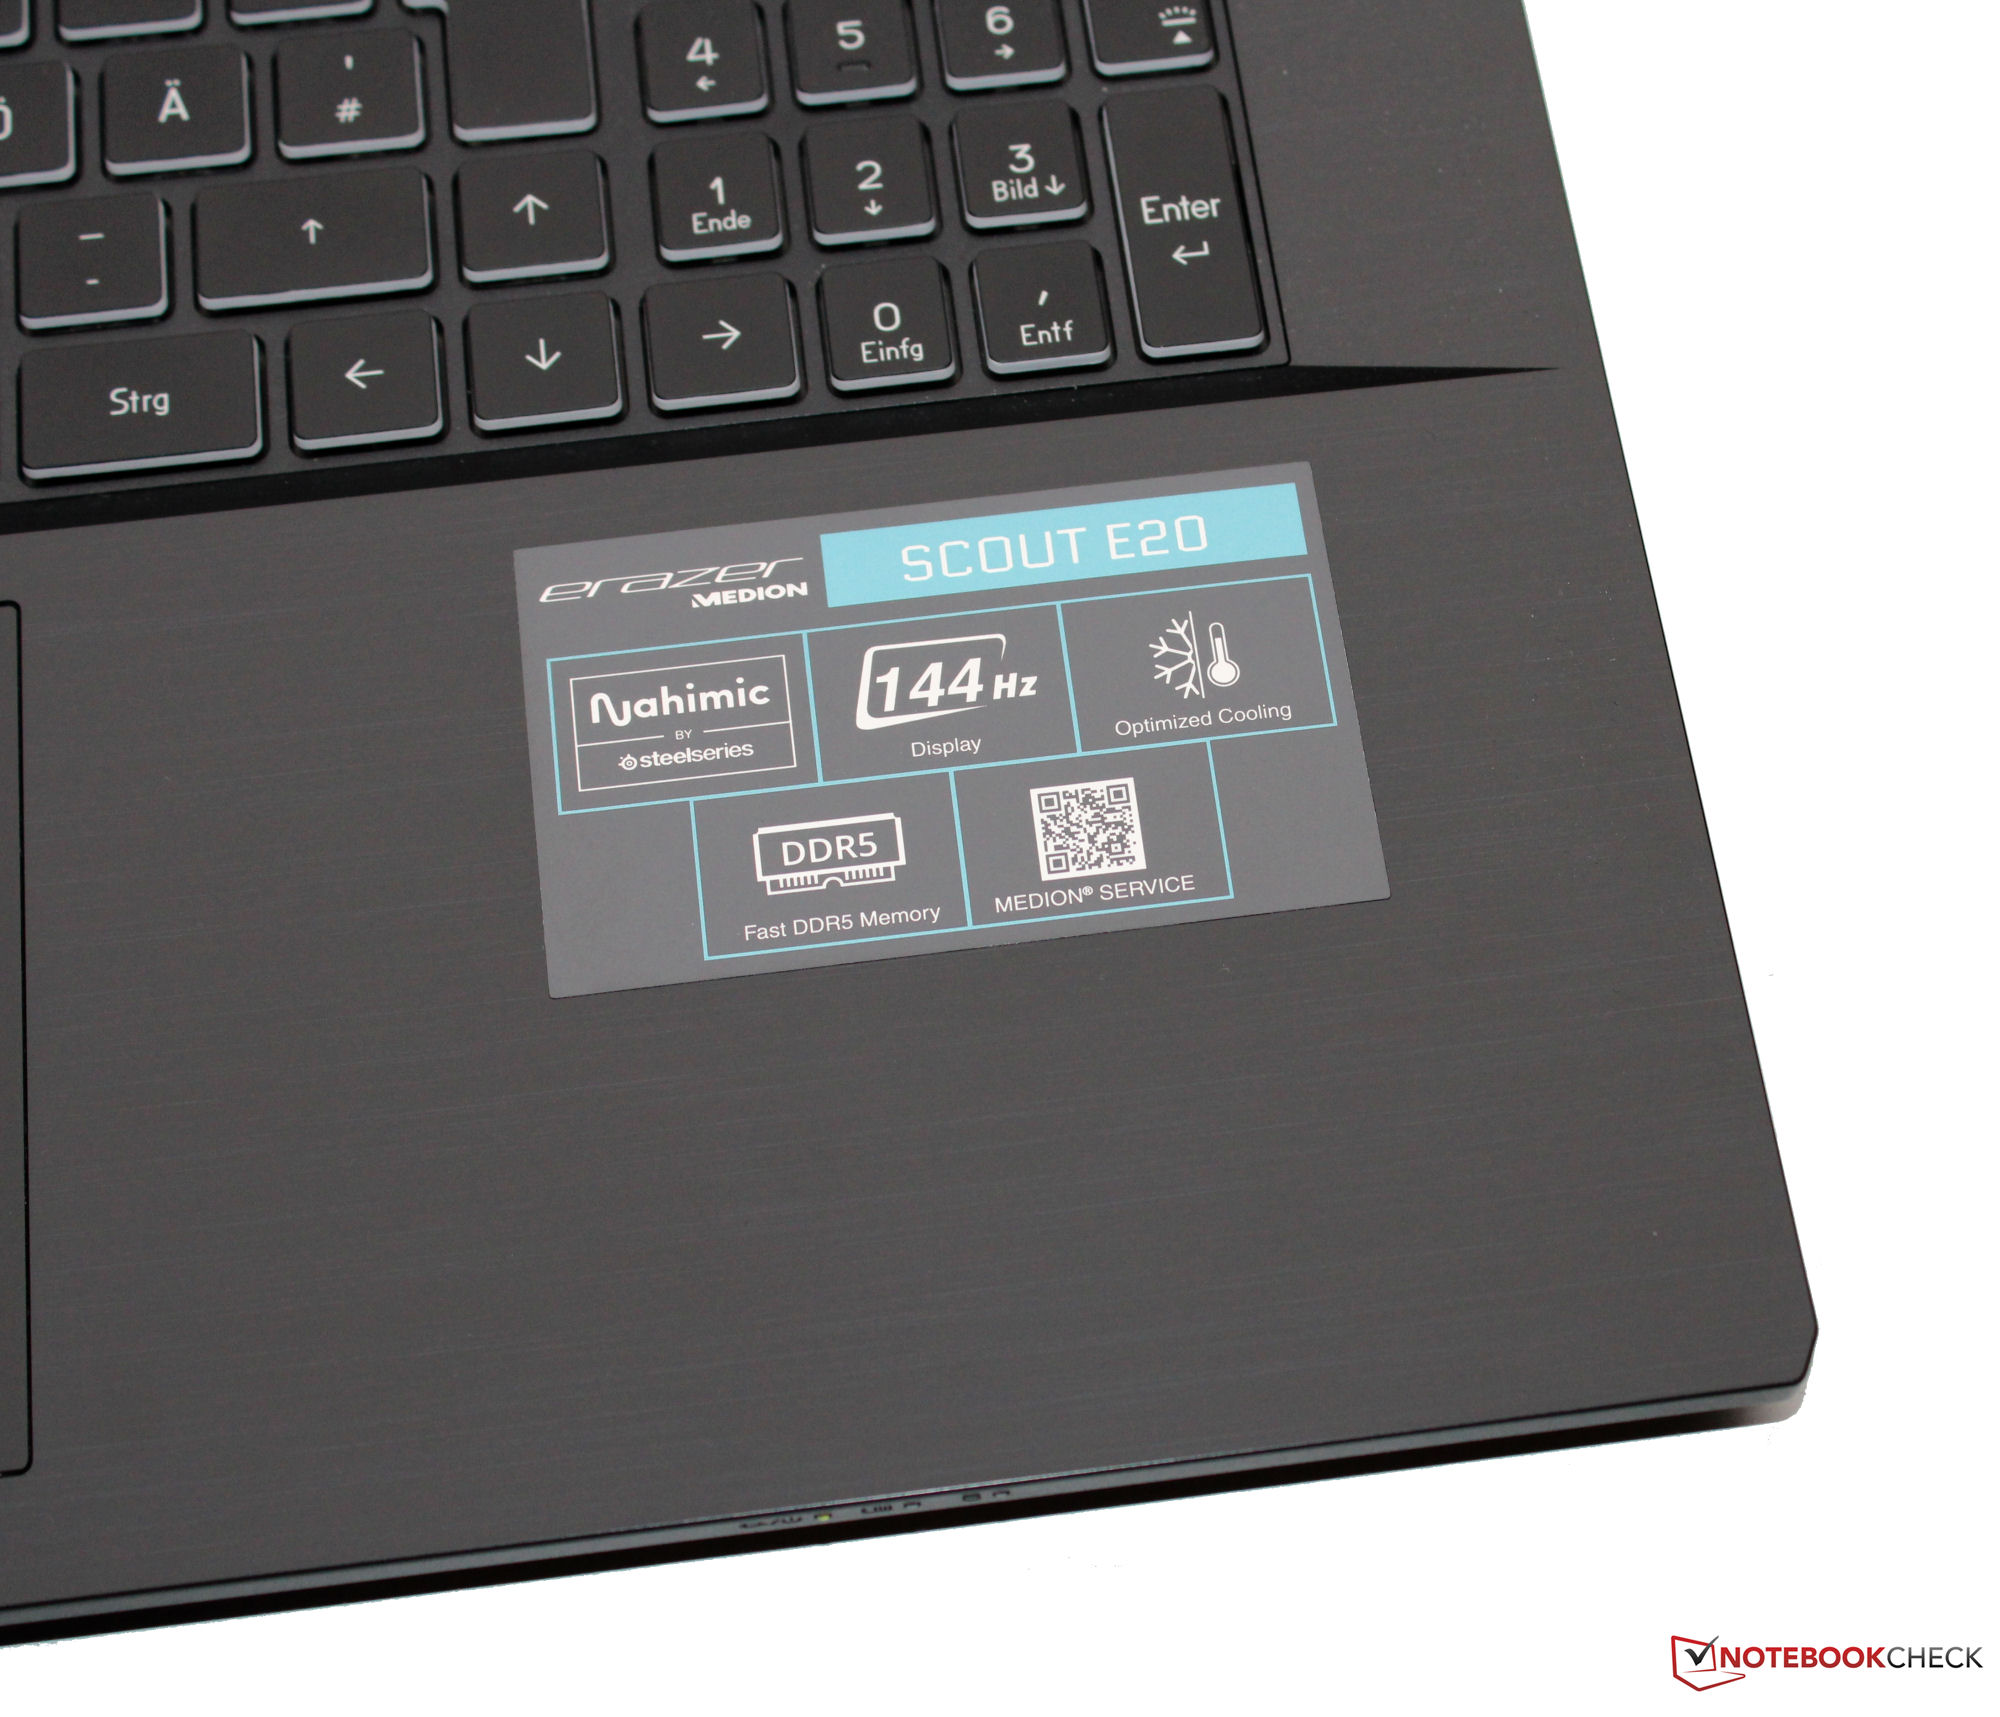
Les touches lisses et plates du clavier chiclet (qui comprend un bloc numérique) offrent une course courte et un point de pression clair. La résistance des touches est correcte. Lors de la frappe, le clavier présente tout au plus un léger jeu, ce qui n'est pas gênant. L'éclairage du clavier comporte quatre niveaux de luminosité. Dans l'ensemble, Medion propose un clavier adapté aux tâches quotidiennes.
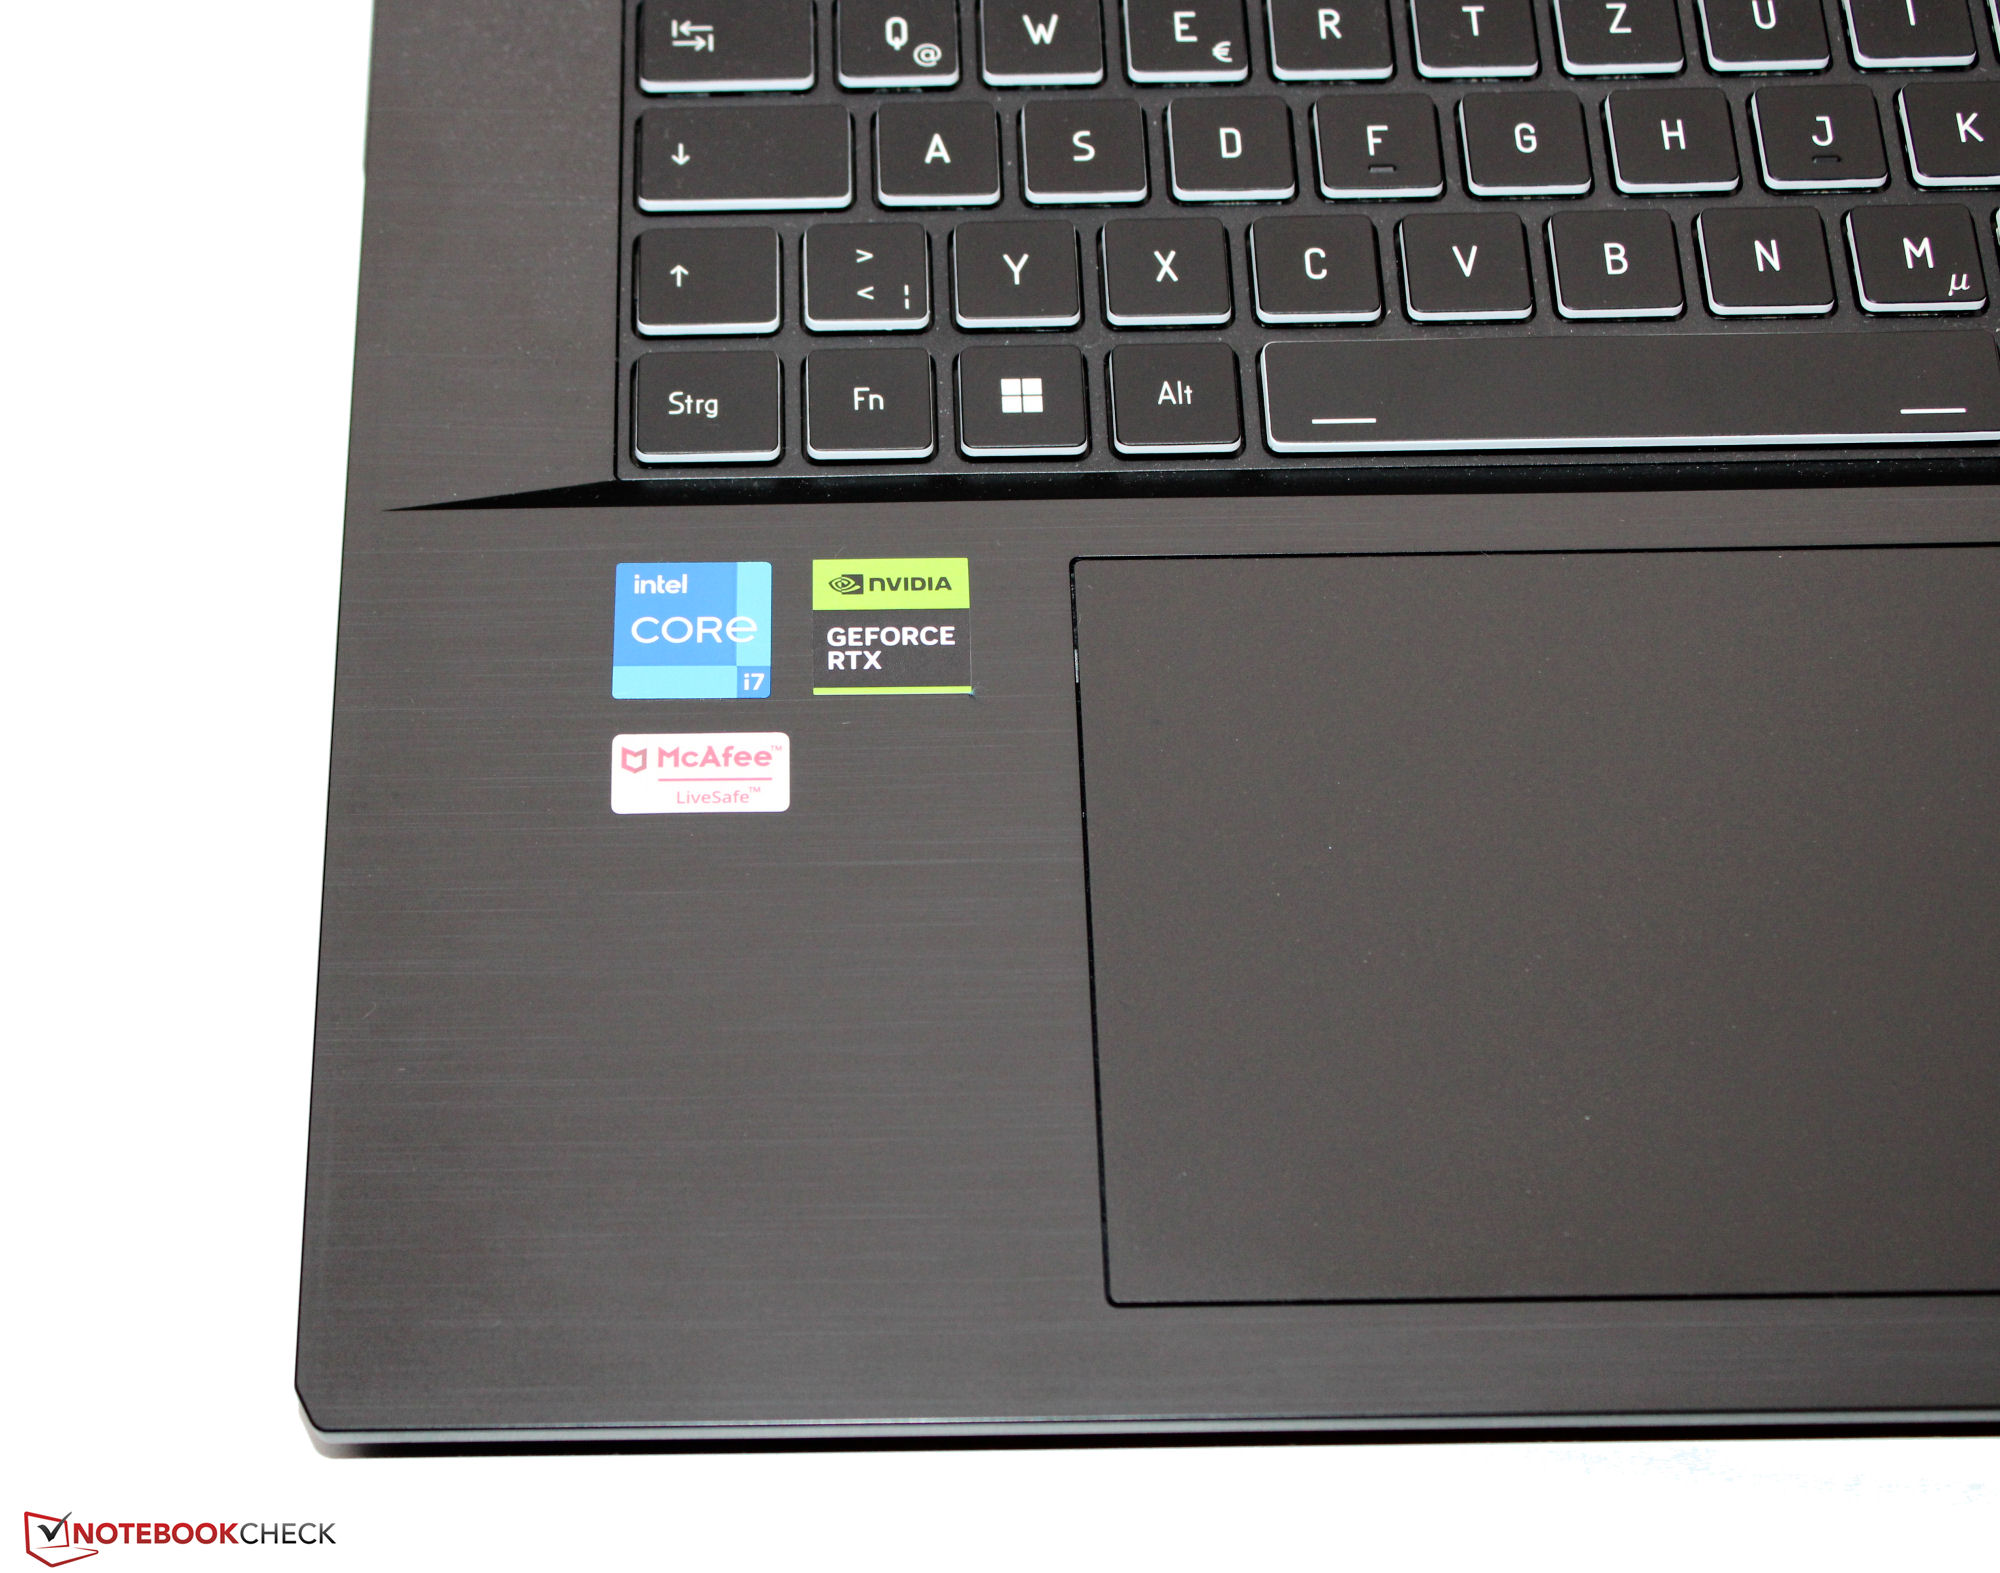
Pavé tactile
Un ClickPad de 15,1 x 9,2 cm (~6 x 3,6 in), dont la surface lisse facilite le glissement des doigts, remplace la souris. Il réagit également aux saisies dans les coins et offre une course courte et un point de pression clair.
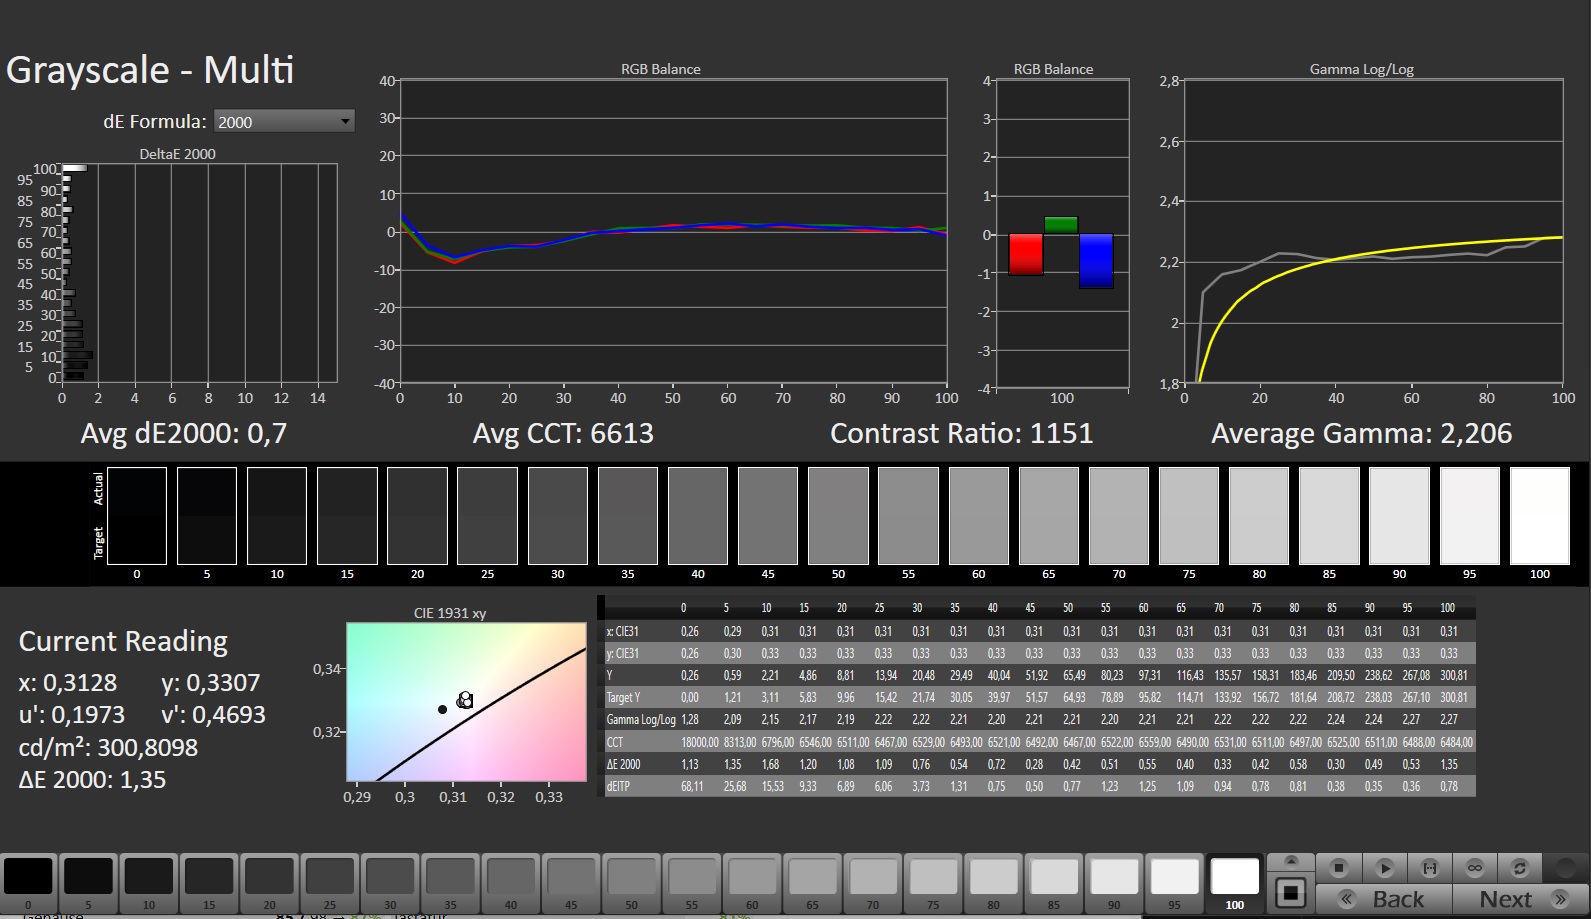
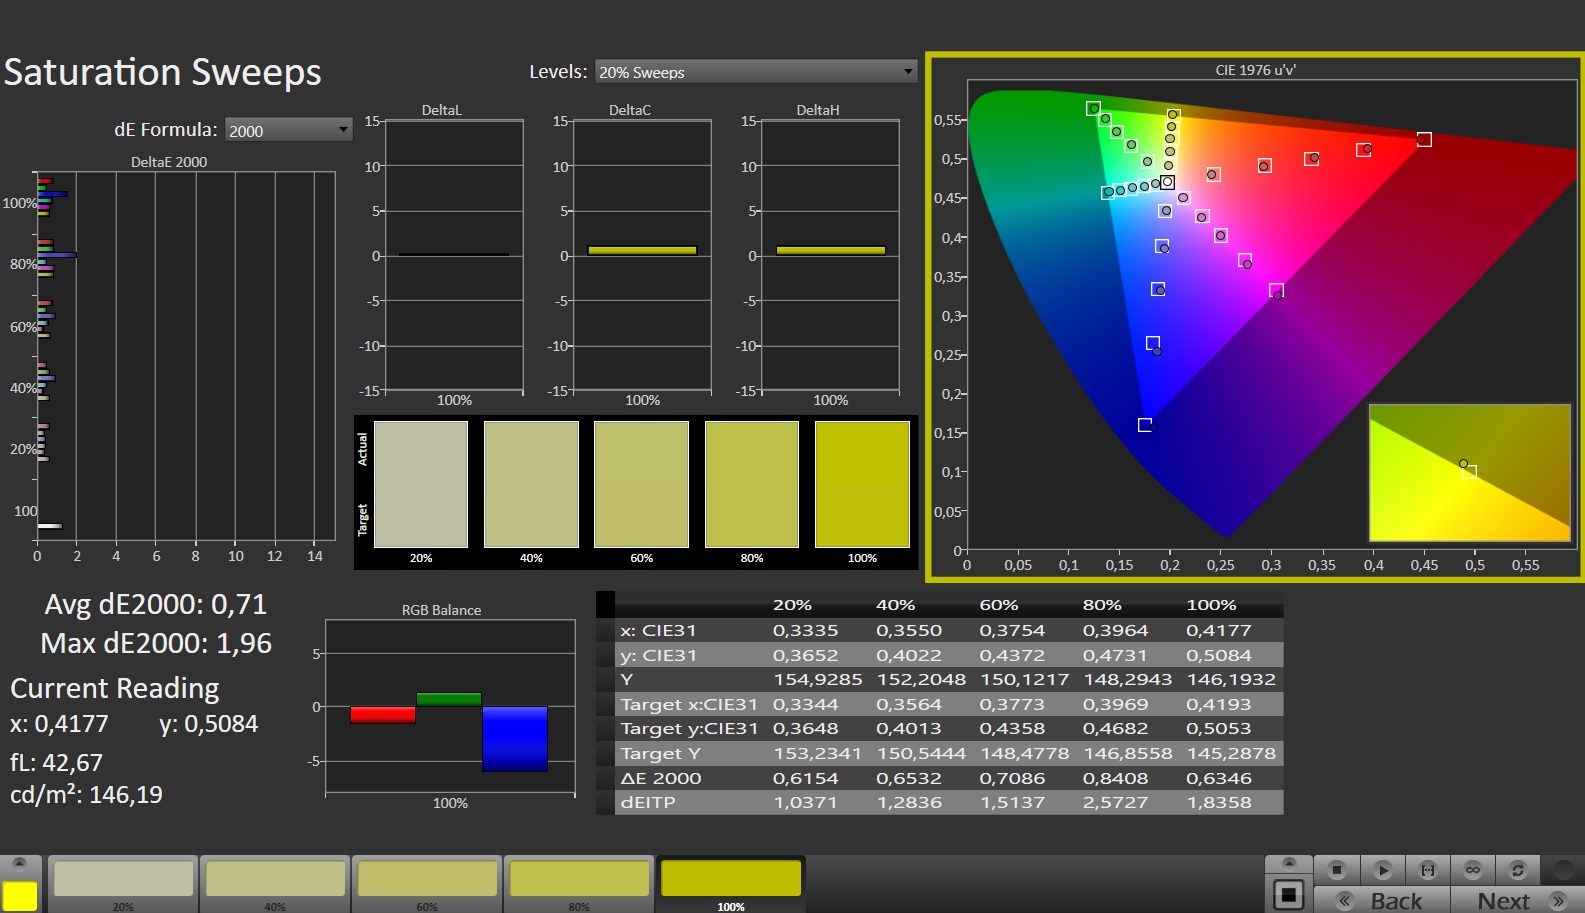
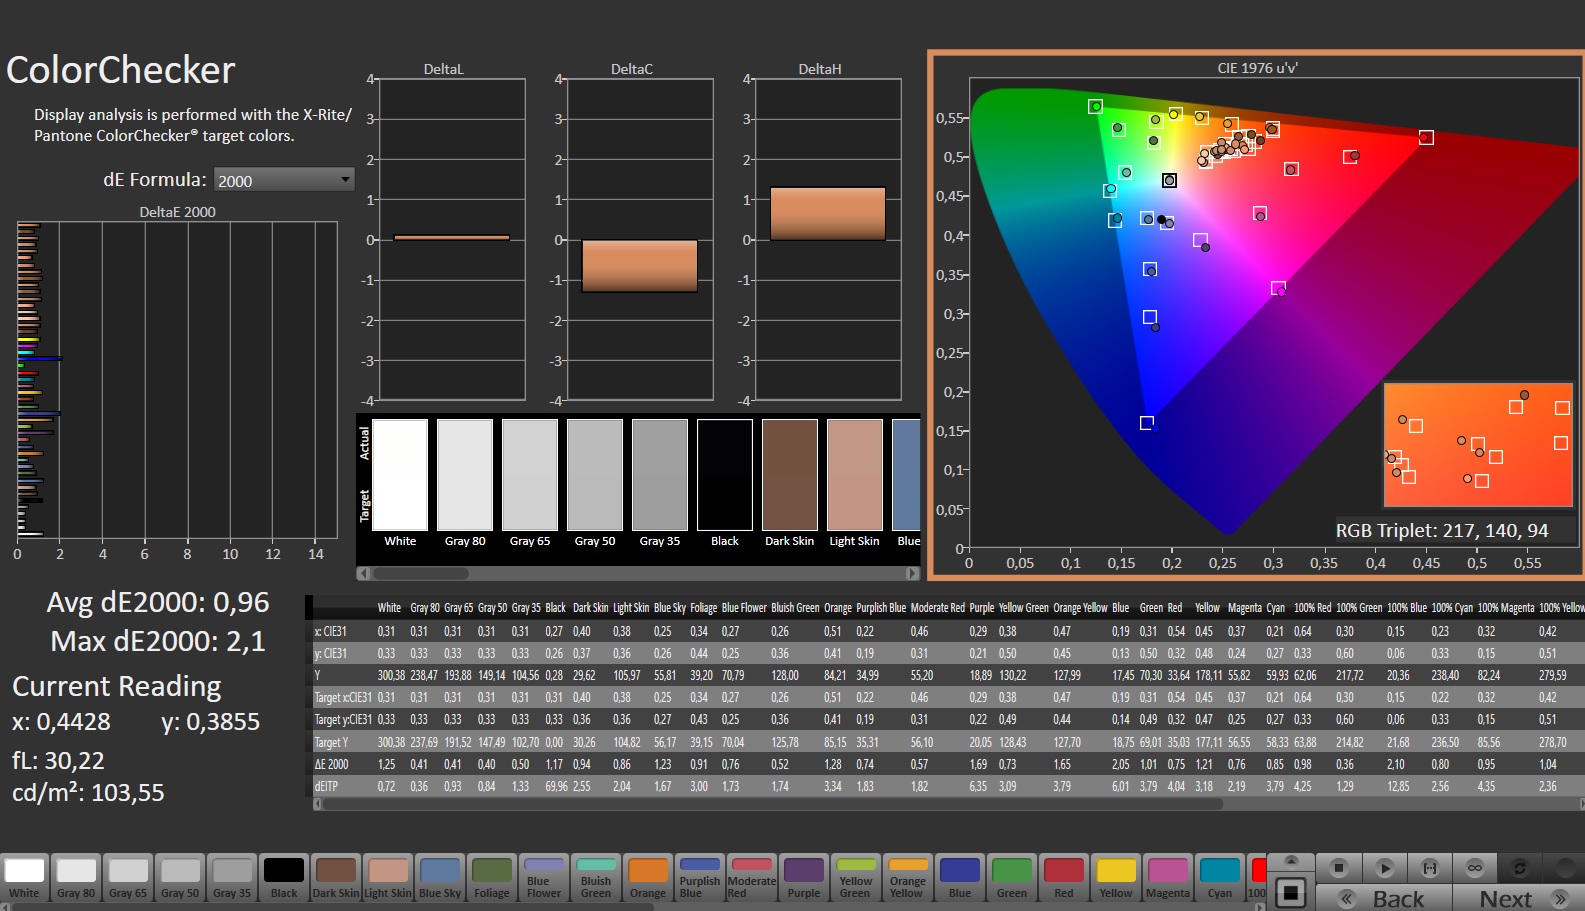
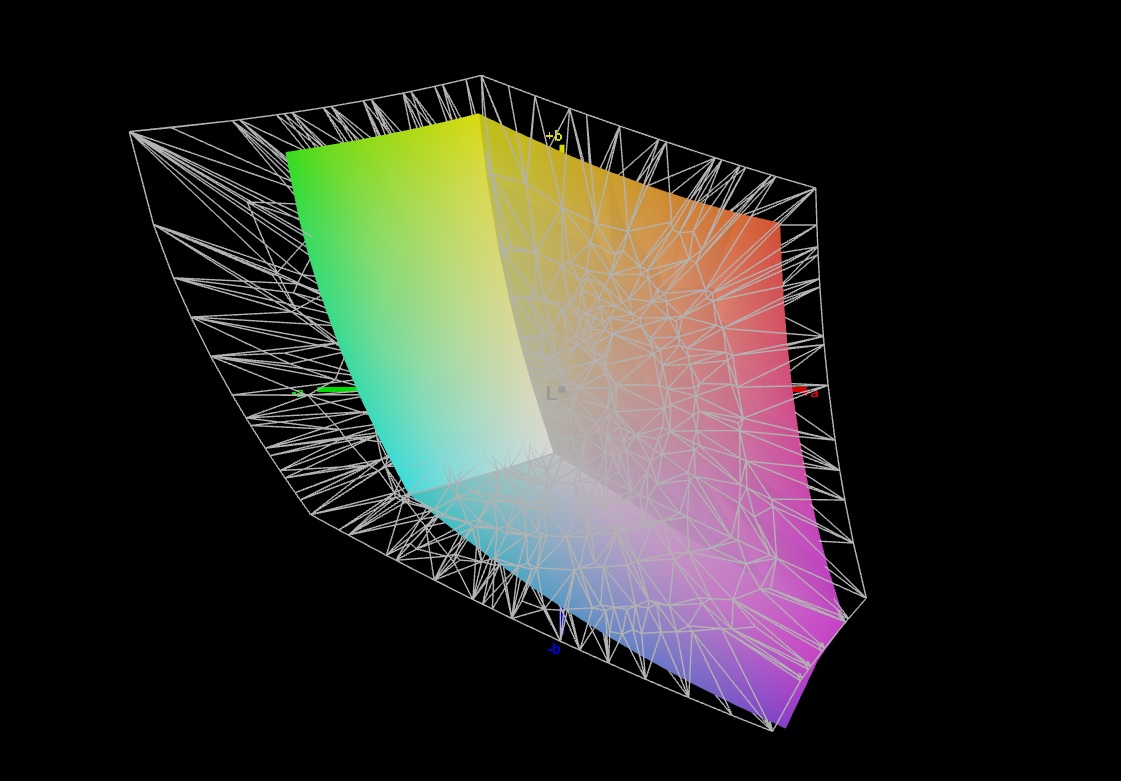
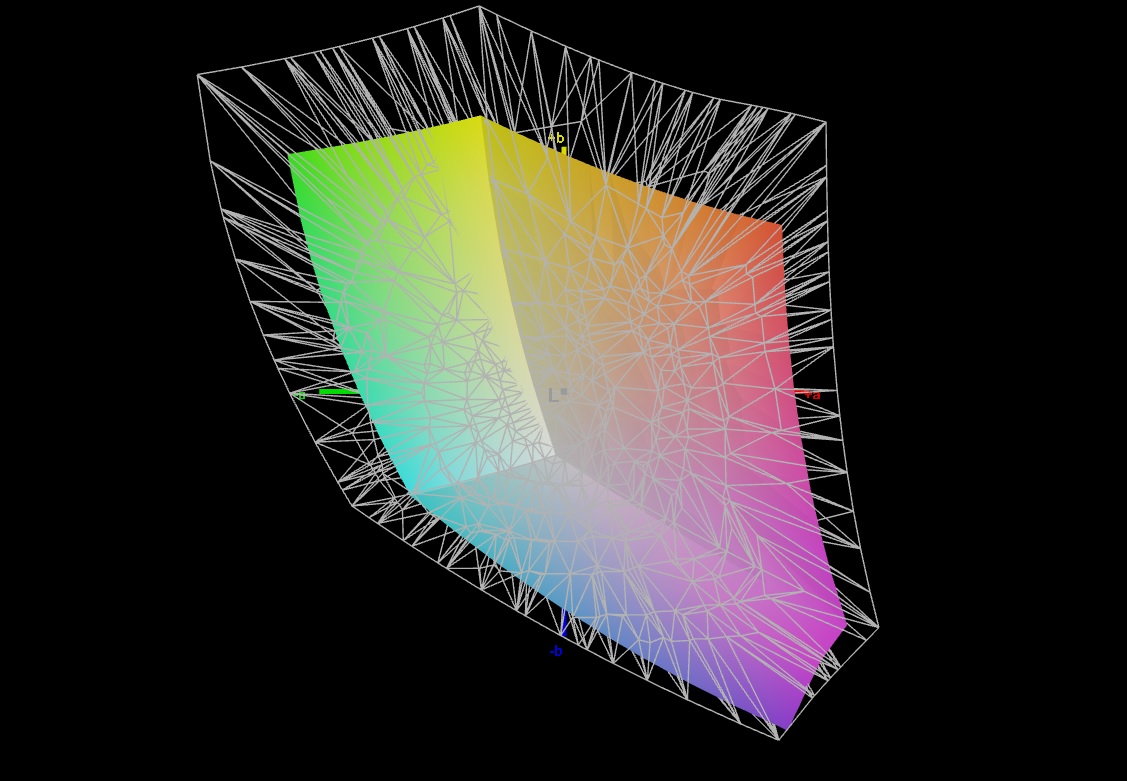
Écran - Panneau FHD avec couverture sRGB
Medion a équipé le E20 d'un écran 144 Hz très réactif au format 16:9 qui ne présente aucun scintillement PWM quel que soit le niveau de luminosité. La luminosité et le contraste de l'écran mat de 17,3 pouces (1 920 x 1 080 pixels) répondent aux exigences de >300 cd/m² et 1 000:1 respectivement.
| |||||||||||||||||||||||||
Homogénéité de la luminosité: 91 %
Valeur mesurée au centre, sur batterie: 312 cd/m²
Contraste: 1248:1 (Valeurs des noirs: 0.25 cd/m²)
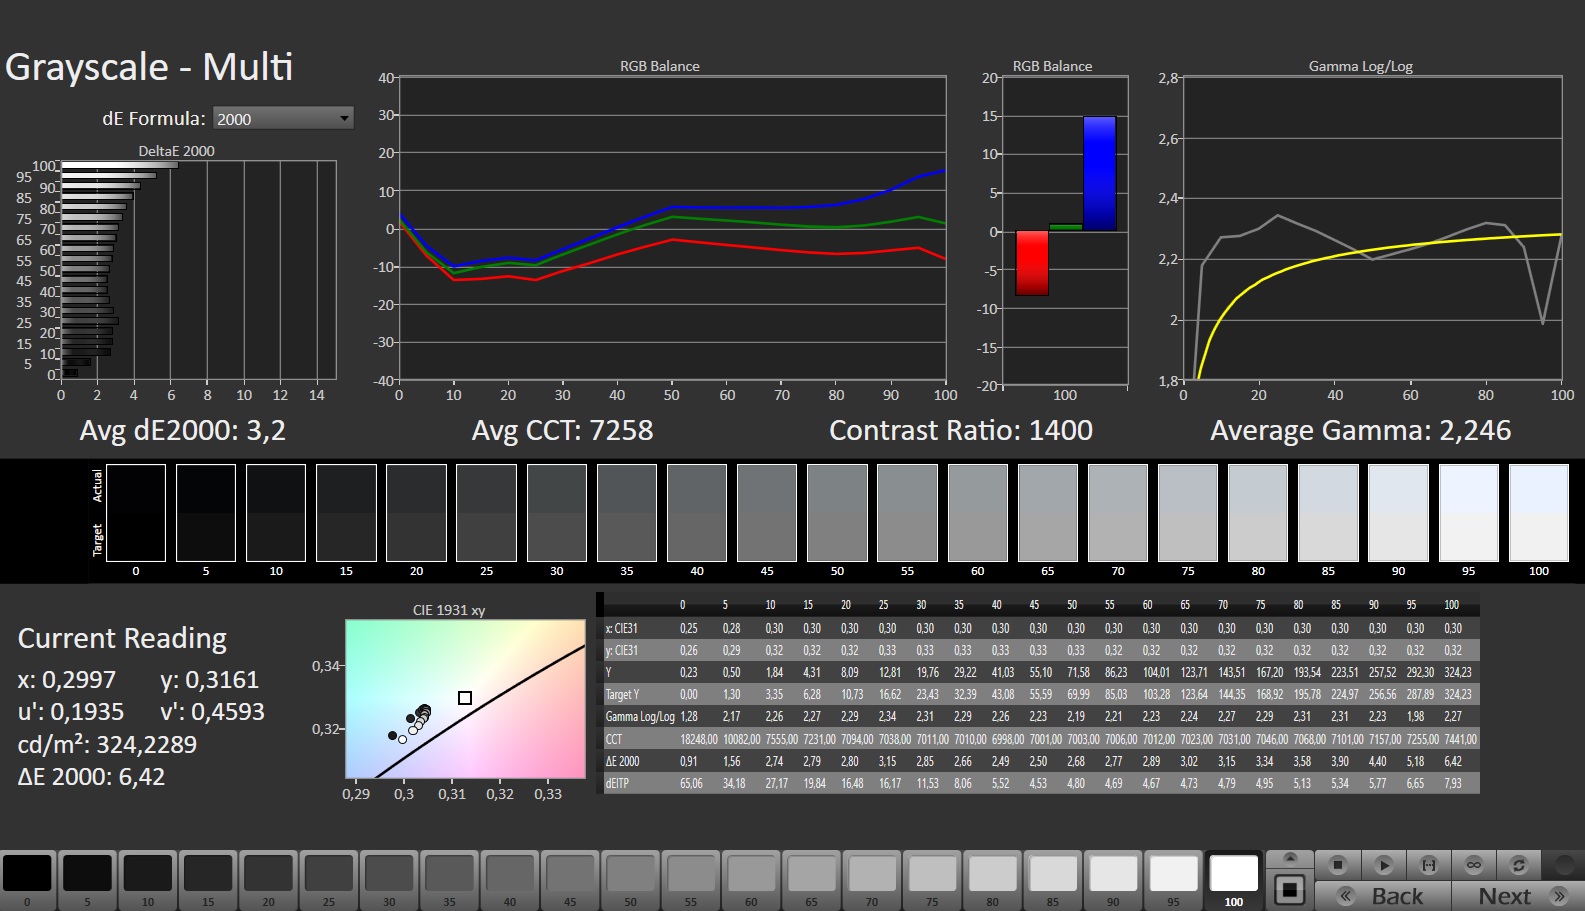
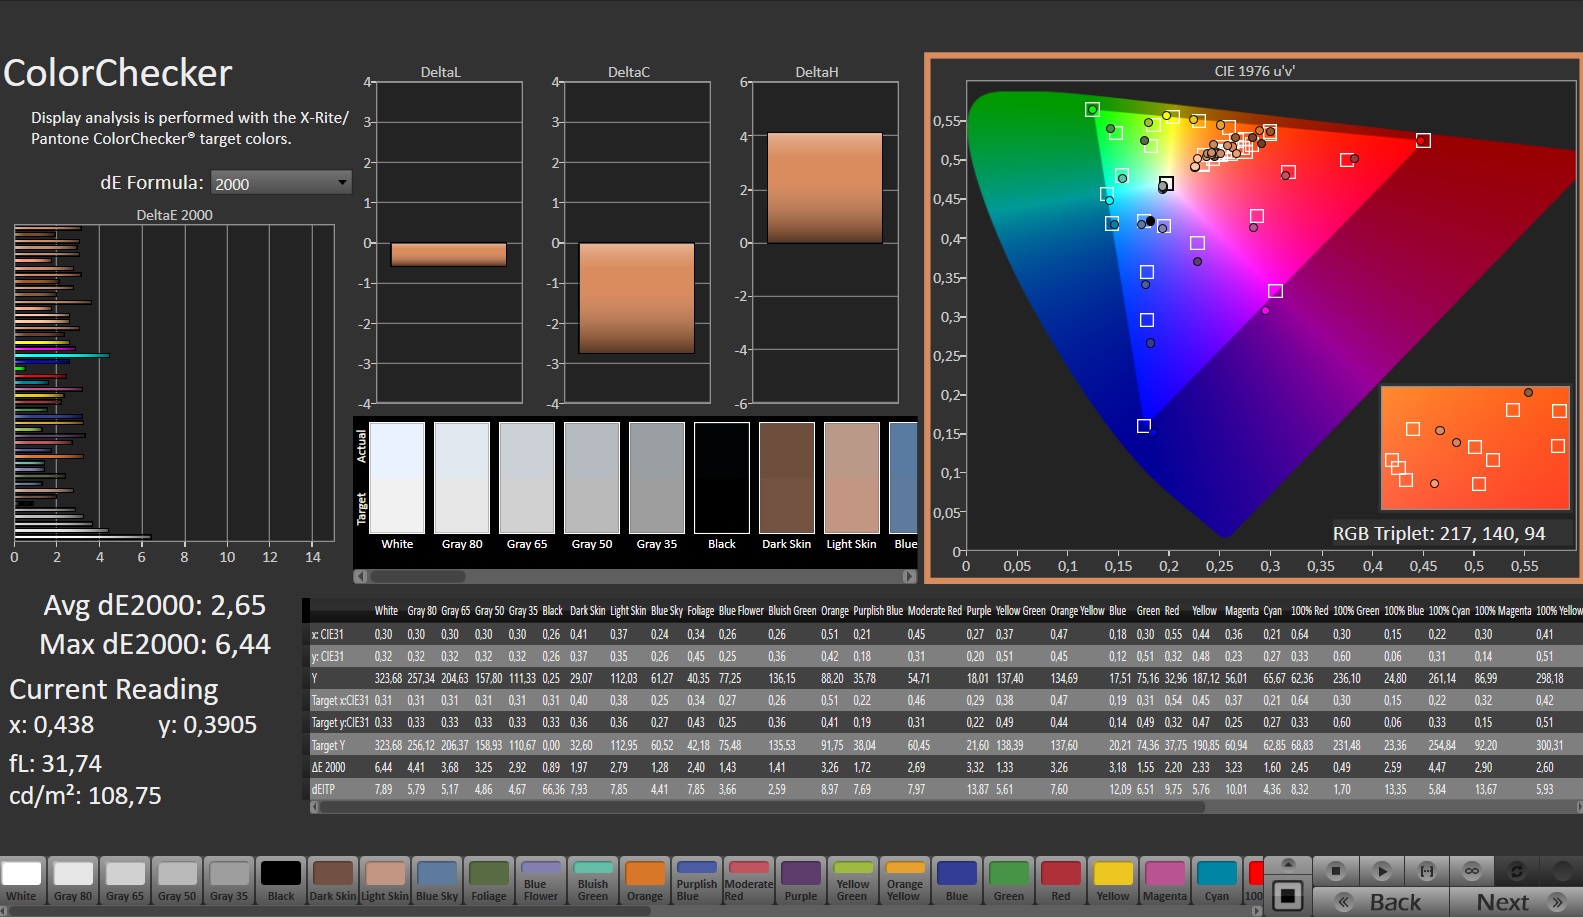
ΔE ColorChecker Calman: 2.65 | ∀{0.5-29.43 Ø4.71}
calibrated: 0.96
ΔE Greyscale Calman: 3.2 | ∀{0.09-98 Ø4.96}
66.5% AdobeRGB 1998 (Argyll 3D)
96.7% sRGB (Argyll 3D)
65.1% Display P3 (Argyll 3D)
Gamma: 2.246
CCT: 7258 K
| Medion Erazer Scout E20 LG Philips LGD0611, IPS, 1920x1080, 17.3" | Gigabyte G7 KE AU Optronics B173HAN05.1, IPS, 1920x1080, 17.3" | MSI Katana 17 B13VFK B173HAN04.9, IPS LED, 1920x1080, 17.3" | Asus TUF Gaming A16 FA617 NE160WUM-NX2 (BOE0B33), IPS-Level, 1920x1200, 16" | Lenovo Legion 5 15IAH7H 82RB CSOT MNF601CA1-3, IPS, 1920x1080, 15.6" | Acer Nitro 5 AN515-46-R1A1 AU Optronics B156HAN12.H, IPS, 1920x1080, 15.6" | |
|---|---|---|---|---|---|---|
| Display | 6% | -37% | 5% | 5% | 4% | |
| Display P3 Coverage (%) | 65.1 | 70.4 8% | 40.8 -37% | 69.4 7% | 69.1 6% | 68.8 6% |
| sRGB Coverage (%) | 96.7 | 99.8 3% | 61 -37% | 97.8 1% | 99.5 3% | 98.1 1% |
| AdobeRGB 1998 Coverage (%) | 66.5 | 71.7 8% | 42.2 -37% | 70.9 7% | 70 5% | 69.7 5% |
| Response Times | 43% | -137% | -6% | -8% | 18% | |
| Response Time Grey 50% / Grey 80% * (ms) | 14.8 ? | 5 ? 66% | 33 ? -123% | 17 ? -15% | 14.8 ? -0% | 13 ? 12% |
| Response Time Black / White * (ms) | 10.4 ? | 8.3 ? 20% | 26 ? -150% | 10.1 ? 3% | 12 ? -15% | 8 ? 23% |
| PWM Frequency (Hz) | ||||||
| Screen | 16% | -69% | 15% | -21% | -8% | |
| Brightness middle (cd/m²) | 312 | 307 -2% | 267 -14% | 308 -1% | 363.5 17% | 327 5% |
| Brightness (cd/m²) | 303 | 301 -1% | 256 -16% | 293 -3% | 350 16% | 320 6% |
| Brightness Distribution (%) | 91 | 93 2% | 93 2% | 90 -1% | 89 -2% | 93 2% |
| Black Level * (cd/m²) | 0.25 | 0.2 20% | 0.21 16% | 0.23 8% | 0.39 -56% | 0.24 4% |
| Contrast (:1) | 1248 | 1535 23% | 1271 2% | 1339 7% | 932 -25% | 1363 9% |
| Colorchecker dE 2000 * | 2.65 | 1.32 50% | 4.7 -77% | 1.47 45% | 3.68 -39% | 3.26 -23% |
| Colorchecker dE 2000 max. * | 6.44 | 4.6 29% | 20.4 -217% | 2.98 54% | 8.92 -39% | 8.73 -36% |
| Colorchecker dE 2000 calibrated * | 0.96 | 1.03 -7% | 4.5 -369% | 1.02 -6% | 0.53 45% | 0.87 9% |
| Greyscale dE 2000 * | 3.2 | 2.1 34% | 1.5 53% | 2.2 31% | 6.5 -103% | 4.87 -52% |
| Gamma | 2.246 98% | 2.247 98% | 2.12 104% | 2.228 99% | 2.2 100% | 2.3 96% |
| CCT | 7258 90% | 6815 95% | 6552 99% | 6228 104% | 5995 108% | 7070 92% |
| Moyenne finale (programmes/paramètres) | 22% /
18% | -81% /
-72% | 5% /
10% | -8% /
-13% | 5% /
-2% |
* ... Moindre est la valeur, meilleures sont les performances
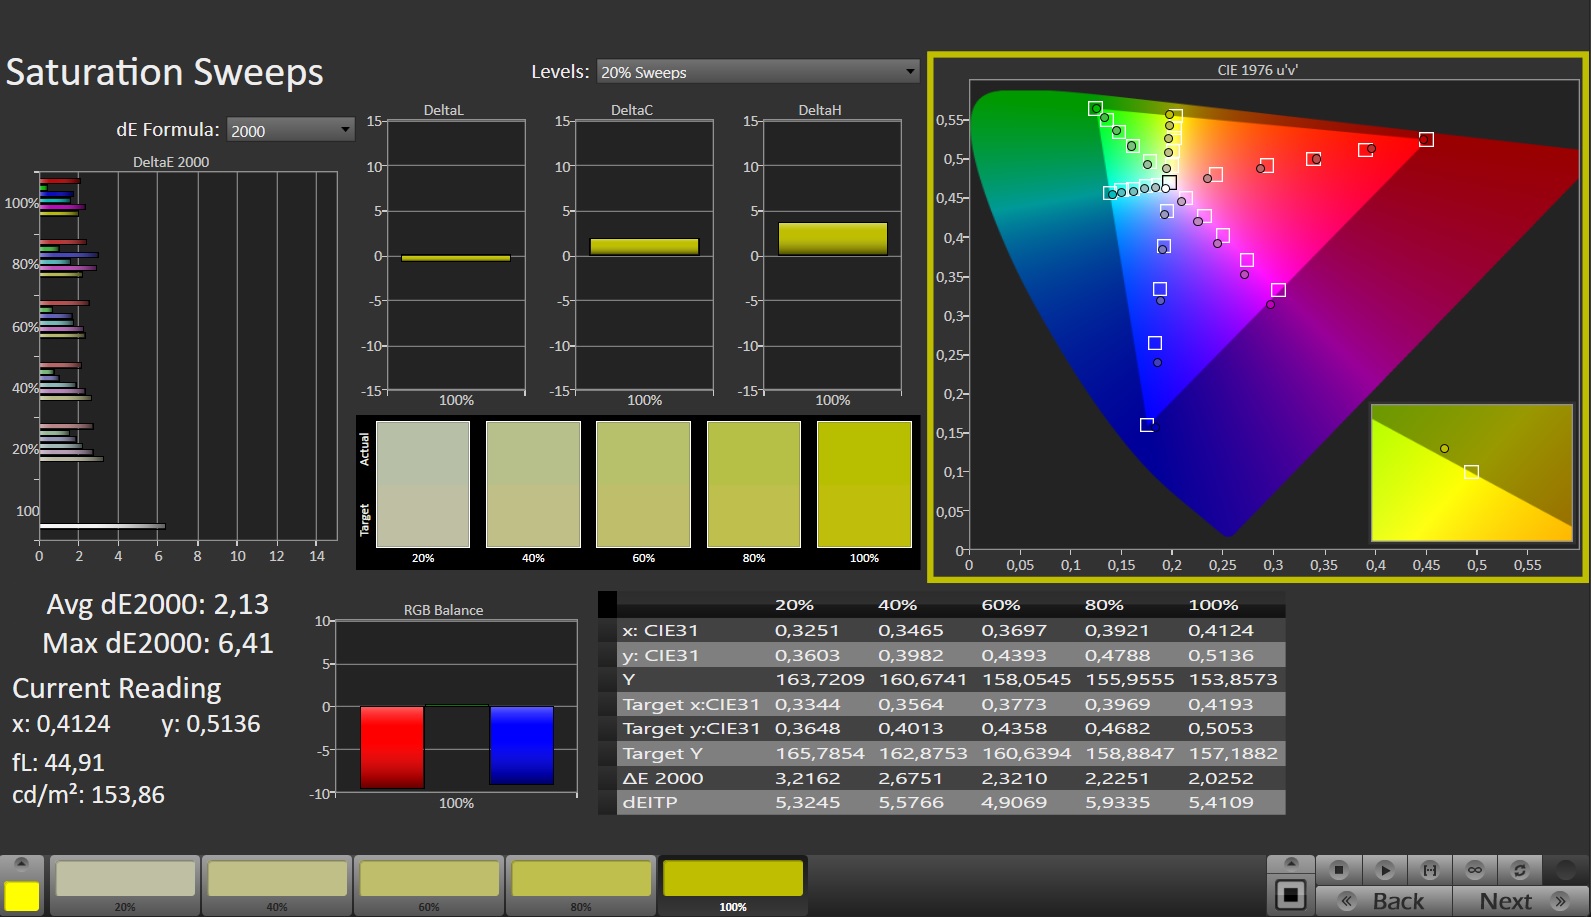
L'écran présente une bonne reproduction des couleurs dès l'état de livraison et, avec un écart d'environ 2,65, l'objectif de DeltaE < 3 est atteint. Un étalonnage supplémentaire réduit encore l'écart à 0,96 et garantit également une échelle de gris plus équilibrée.
L'écran est capable de couvrir complètement l'espace colorimétrique sRGB, mais pas les espaces colorimétriques AdobeRGB et DCI-P3. Les écrans de la plupart des concurrents présentent des qualités similaires.
Temps de réponse de l'écran
| ↔ Temps de réponse noir à blanc | ||
|---|---|---|
| 10.4 ms ... hausse ↗ et chute ↘ combinées | ↗ 5.4 ms hausse | 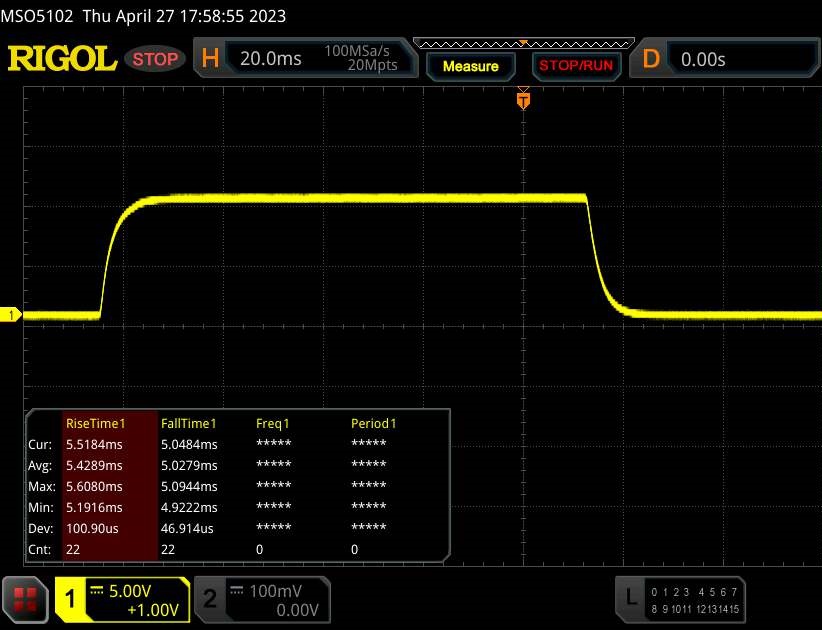 |
| ↘ 5 ms chute | ||
| L'écran montre de bons temps de réponse, mais insuffisant pour du jeu compétitif. En comparaison, tous les appareils testés affichent entre 0.1 (minimum) et 240 (maximum) ms. » 28 % des appareils testés affichent de meilleures performances. Cela signifie que les latences relevées sont meilleures que la moyenne (19.8 ms) de tous les appareils testés. | ||
| ↔ Temps de réponse gris 50% à gris 80% | ||
| 14.8 ms ... hausse ↗ et chute ↘ combinées | ↗ 7.2 ms hausse | 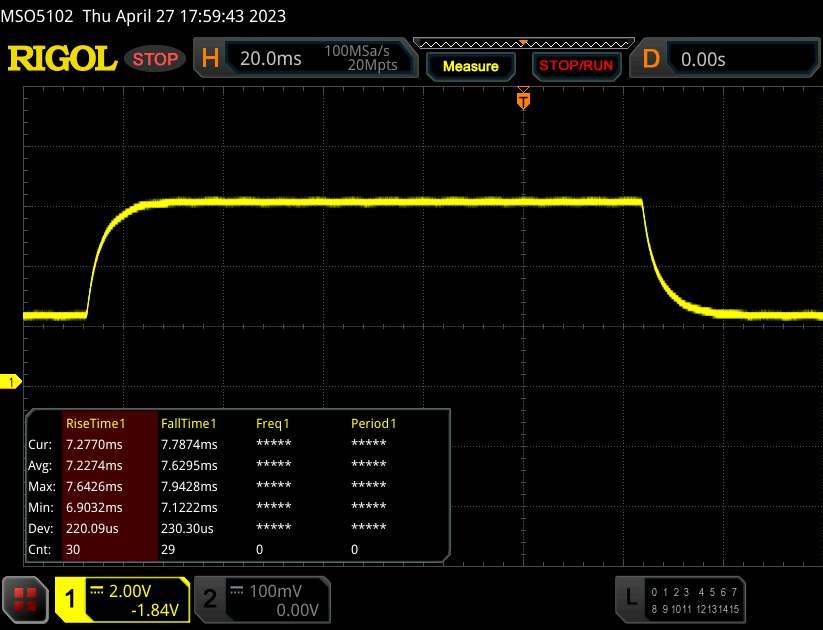 |
| ↘ 7.6 ms chute | ||
| L'écran montre de bons temps de réponse, mais insuffisant pour du jeu compétitif. En comparaison, tous les appareils testés affichent entre 0.165 (minimum) et 636 (maximum) ms. » 29 % des appareils testés affichent de meilleures performances. Cela signifie que les latences relevées sont meilleures que la moyenne (30.9 ms) de tous les appareils testés. | ||
Scintillement / MLI (Modulation de largeur d'impulsion)
| Scintillement / MLI (Modulation de largeur d'impulsion) non décelé |  | ||
En comparaison, 52 % des appareils testés n'emploient pas MDI pour assombrir leur écran. Nous avons relevé une moyenne à 7741 (minimum : 5 - maximum : 343500) Hz dans le cas où une MDI était active. | |||
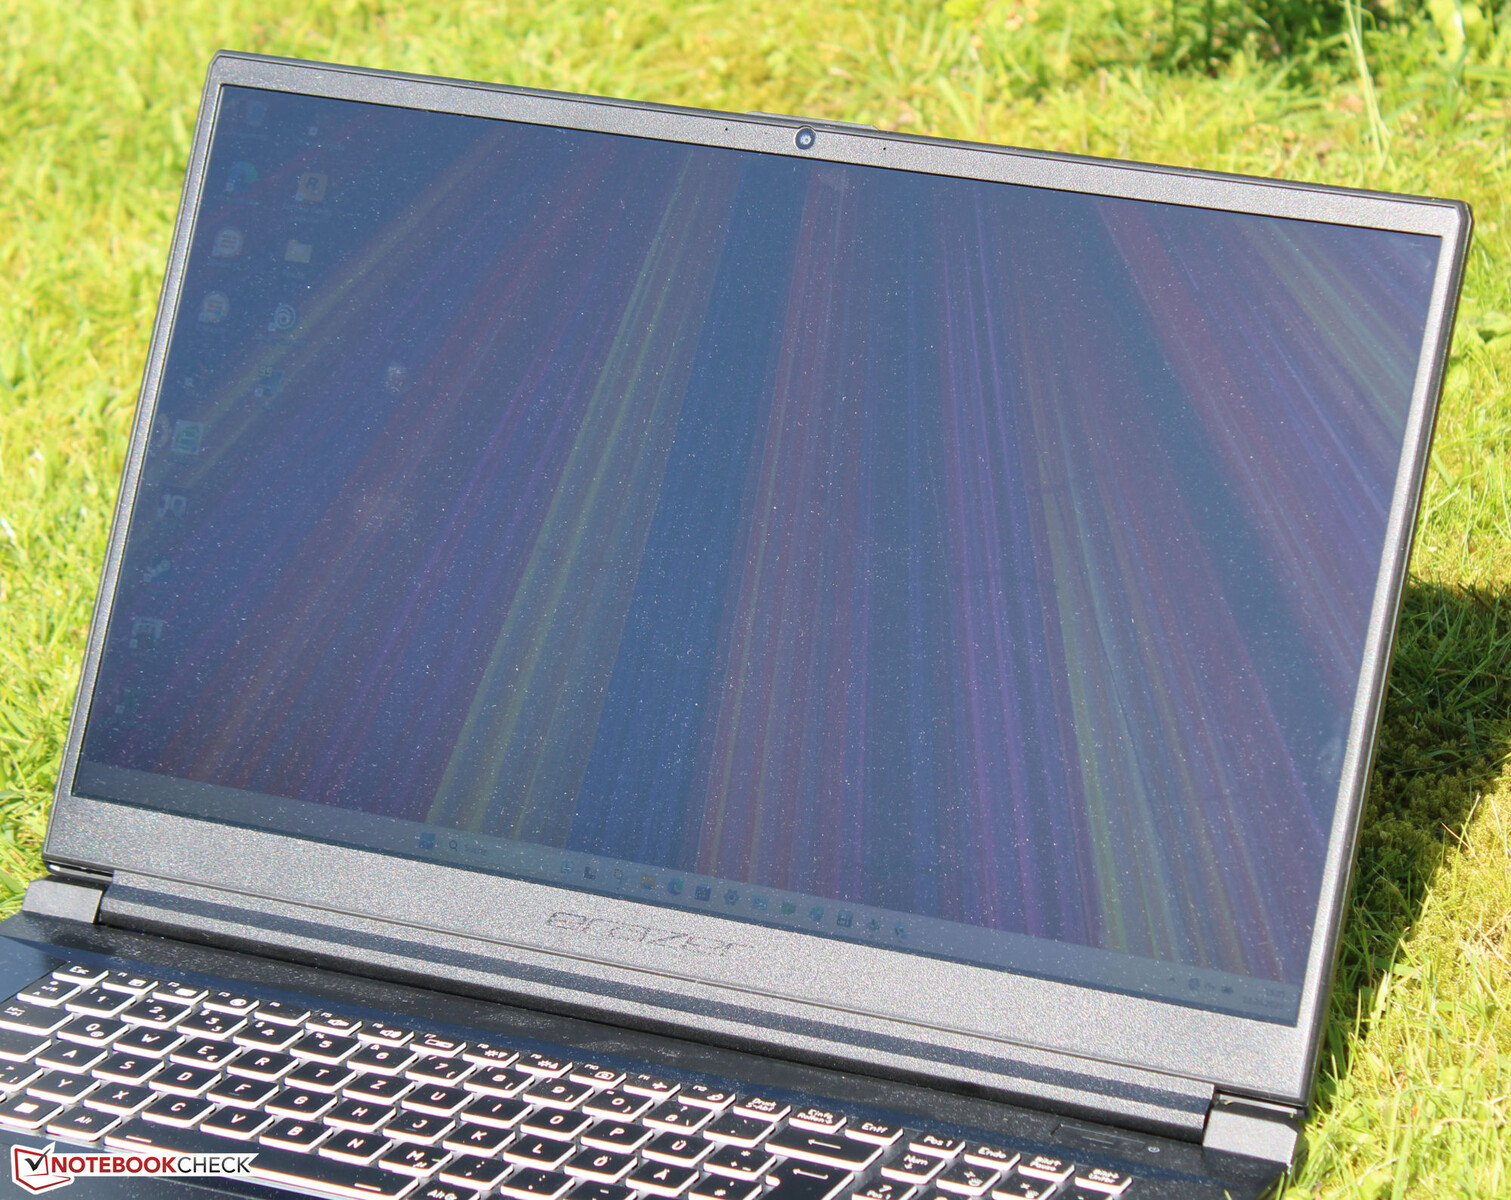
L'écran IPS présente des angles de vision stables et peut être lu dans n'importe quelle position. En extérieur, vous pouvez lire le contenu de l'écran lorsque la lumière du soleil n'est pas trop forte.

Performance - Le Scout utilise Raptor Lake et Ada Lovelace
L'Erazer Scout E20 est un ordinateur portable de jeu d'entrée de gamme. Les performances informatiques nécessaires sont fournies par les puces Raptor Lake et Ada Lovelace. Notre unité de test est disponible pour environ 1 500 euros (~1 658 $). Au moment de ce test, nous n'avons pas pu trouver d'autres configurations d'équipement.
Conditions d'essai
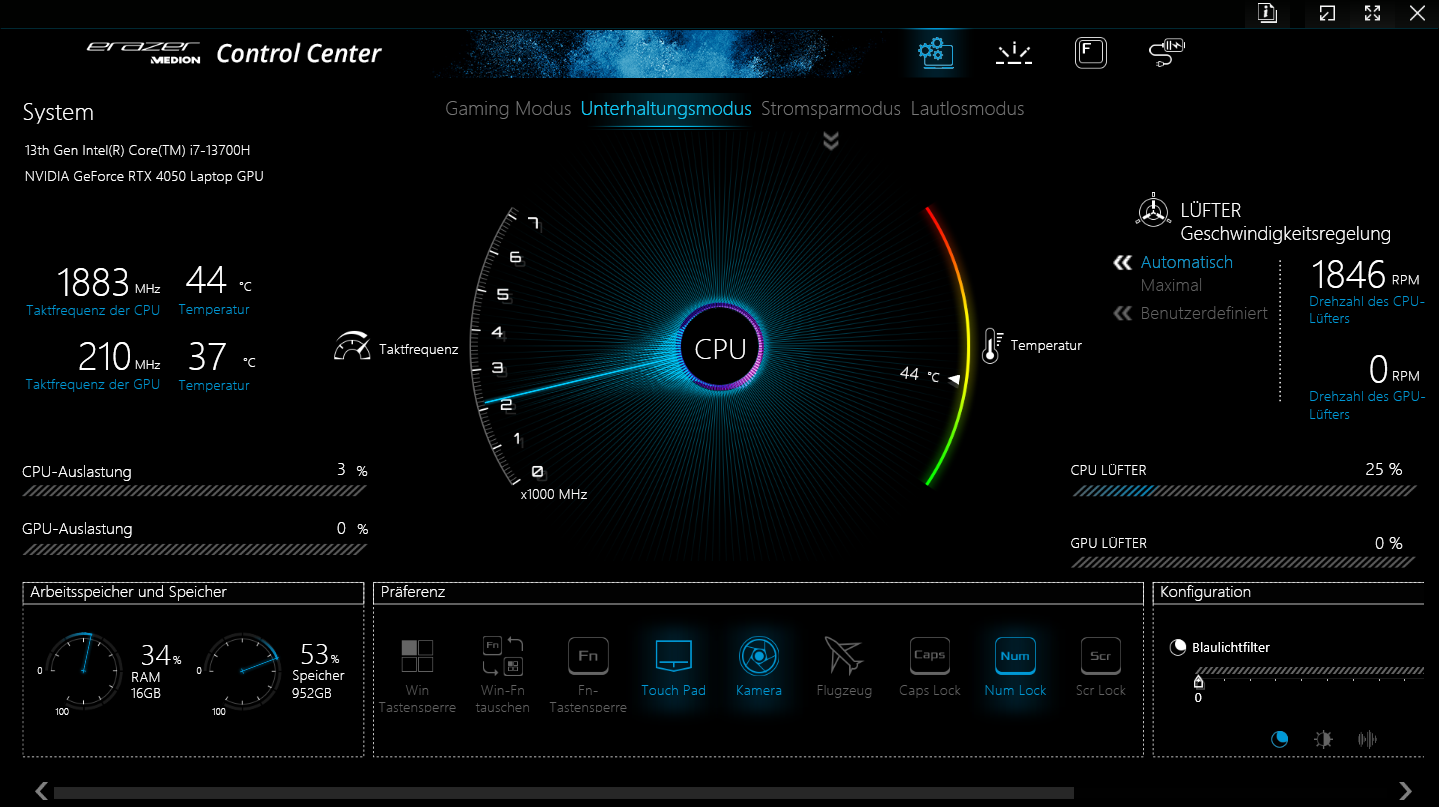
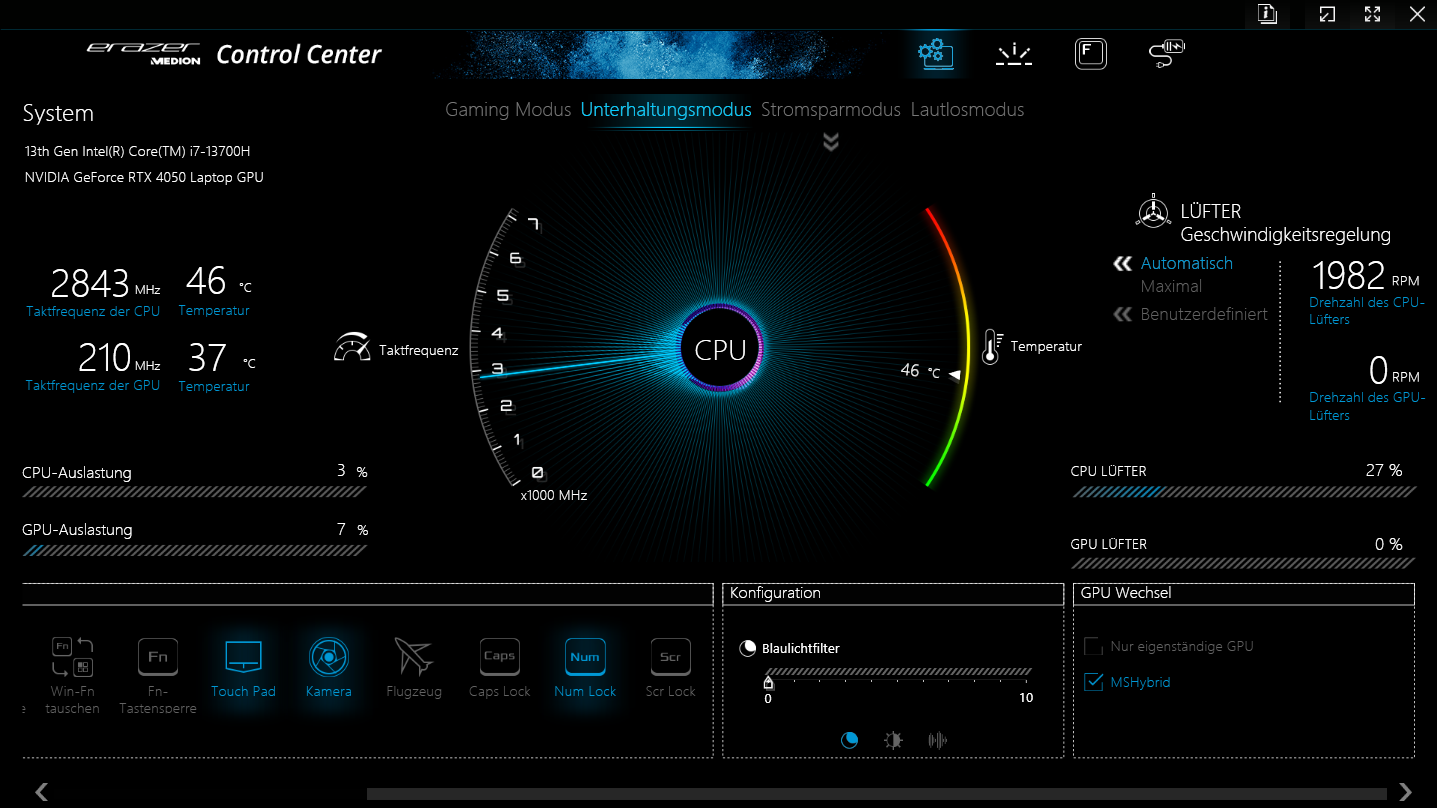
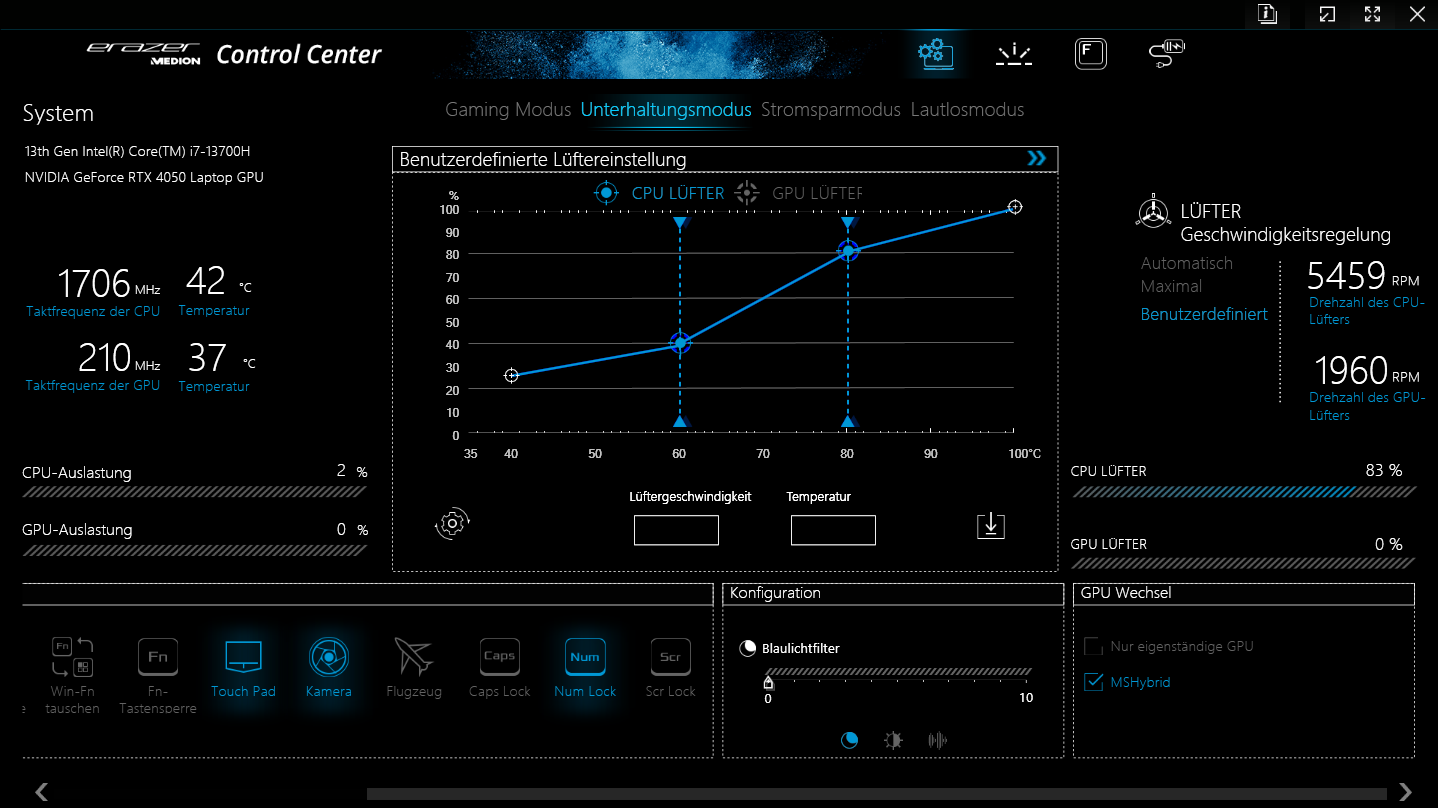
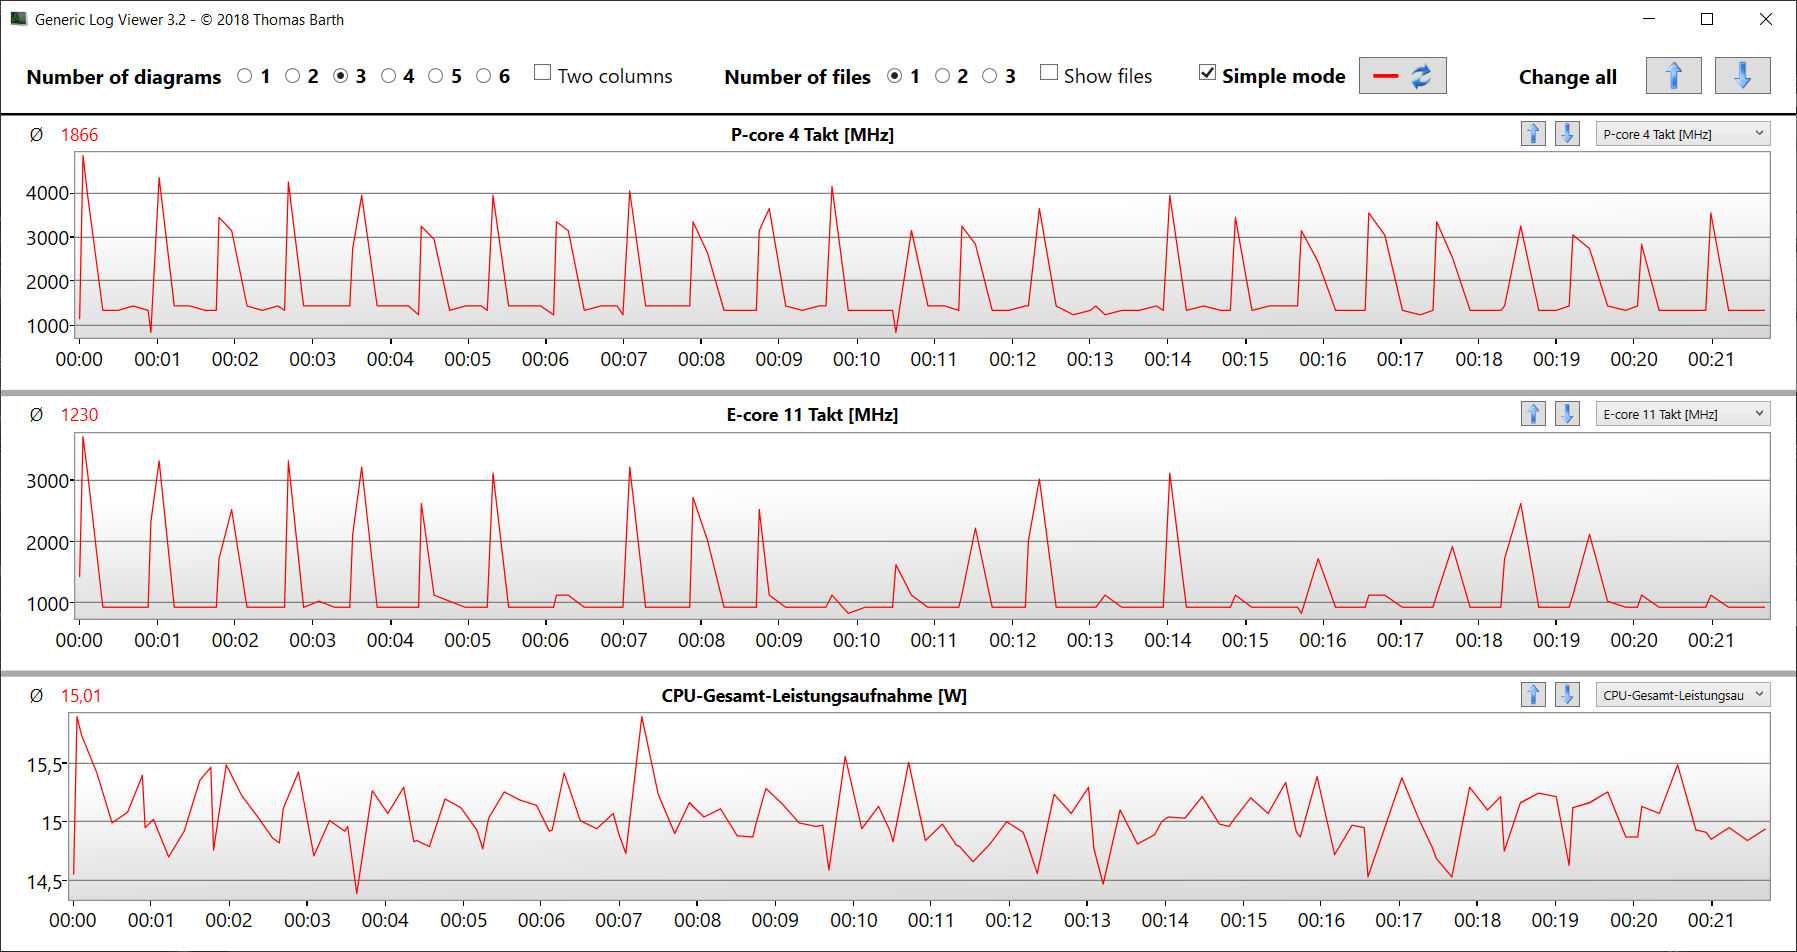
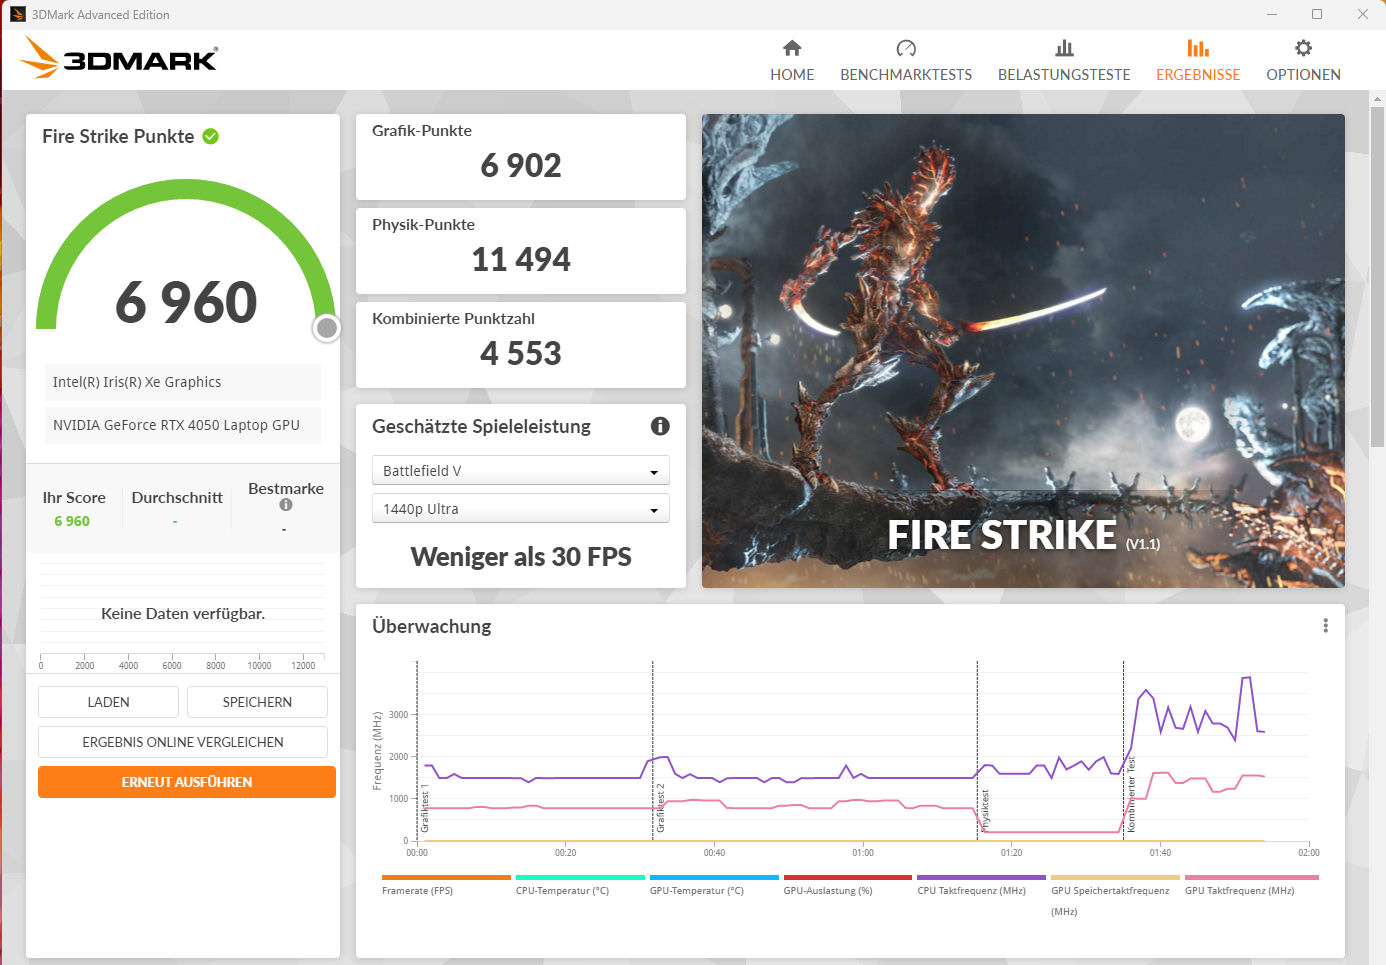
Le E20 comprend quatre modes de performance spécifiques au fabricant (voir tableau). Vous pouvez passer de l'un à l'autre en utilisant le logiciel Control Center, qui est le centre de contrôle de l'ordinateur portable. Nous avons utilisé le mode "Divertissement" pour les benchmarks et le mode "Economie d'énergie" pour les tests de batterie, avec Optimus activé. Le mode économie d'énergie représente également un cas particulier parmi les modes, puisqu'il désactive le cœur graphique GeForce.
| Mode jeu | Mode divertissement | Mode économie d'énergie | Mode silencieux | |
|---|---|---|---|---|
| Limitede puissance 1 (HWInfo) | 110 Watts | 50 Watts | 20 Watts | 15 Watts |
| Limitede puissance 2 (HWInfo) | 115 Watts | 115 Watts | 30 Watts | 30 Watts |
| Bruit (The Witcher 3 ) | 57 dB(A) | 50 dB(A) | - | 34 dB(A) |
| Performances (Le Witcher 3 ) | ~83 fps | ~80 fps | - | 30-50 fps |
Processeur
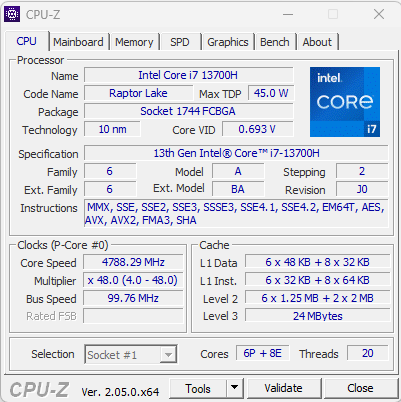
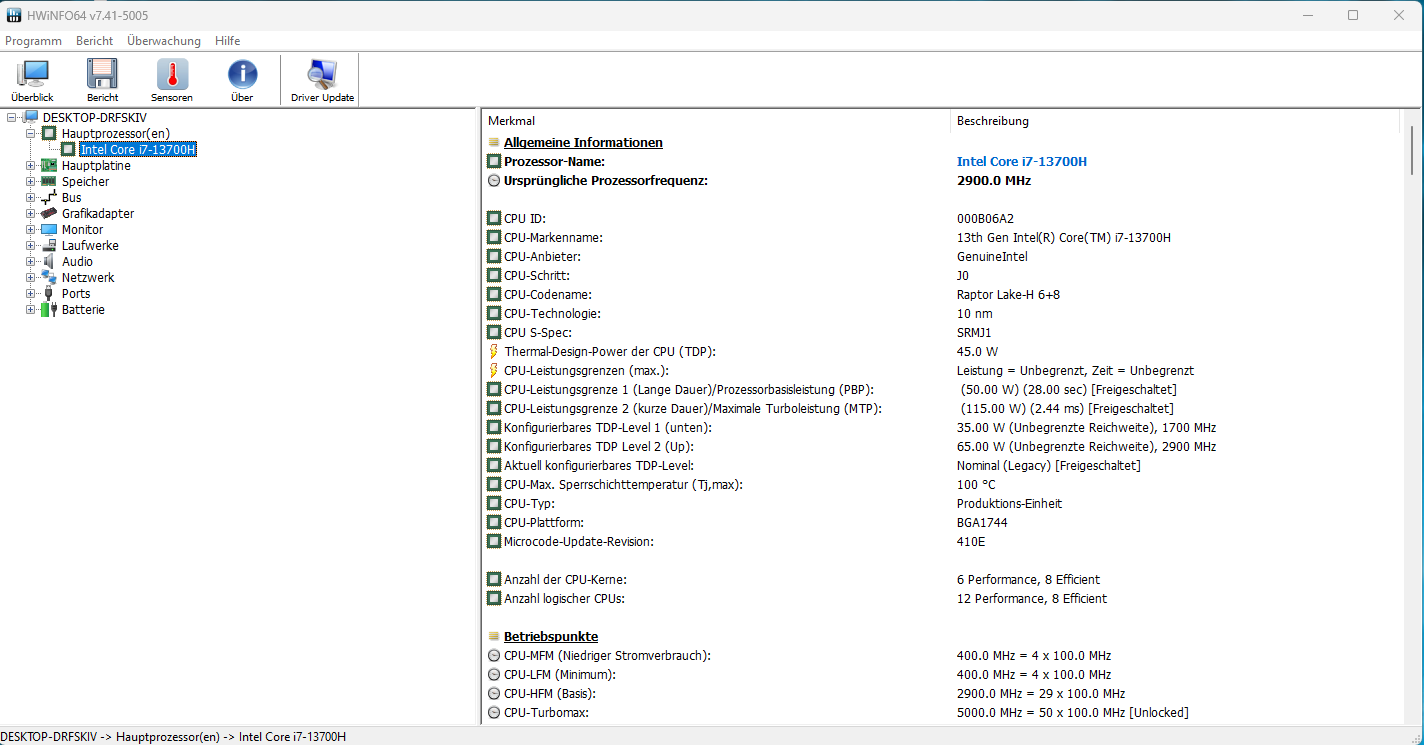
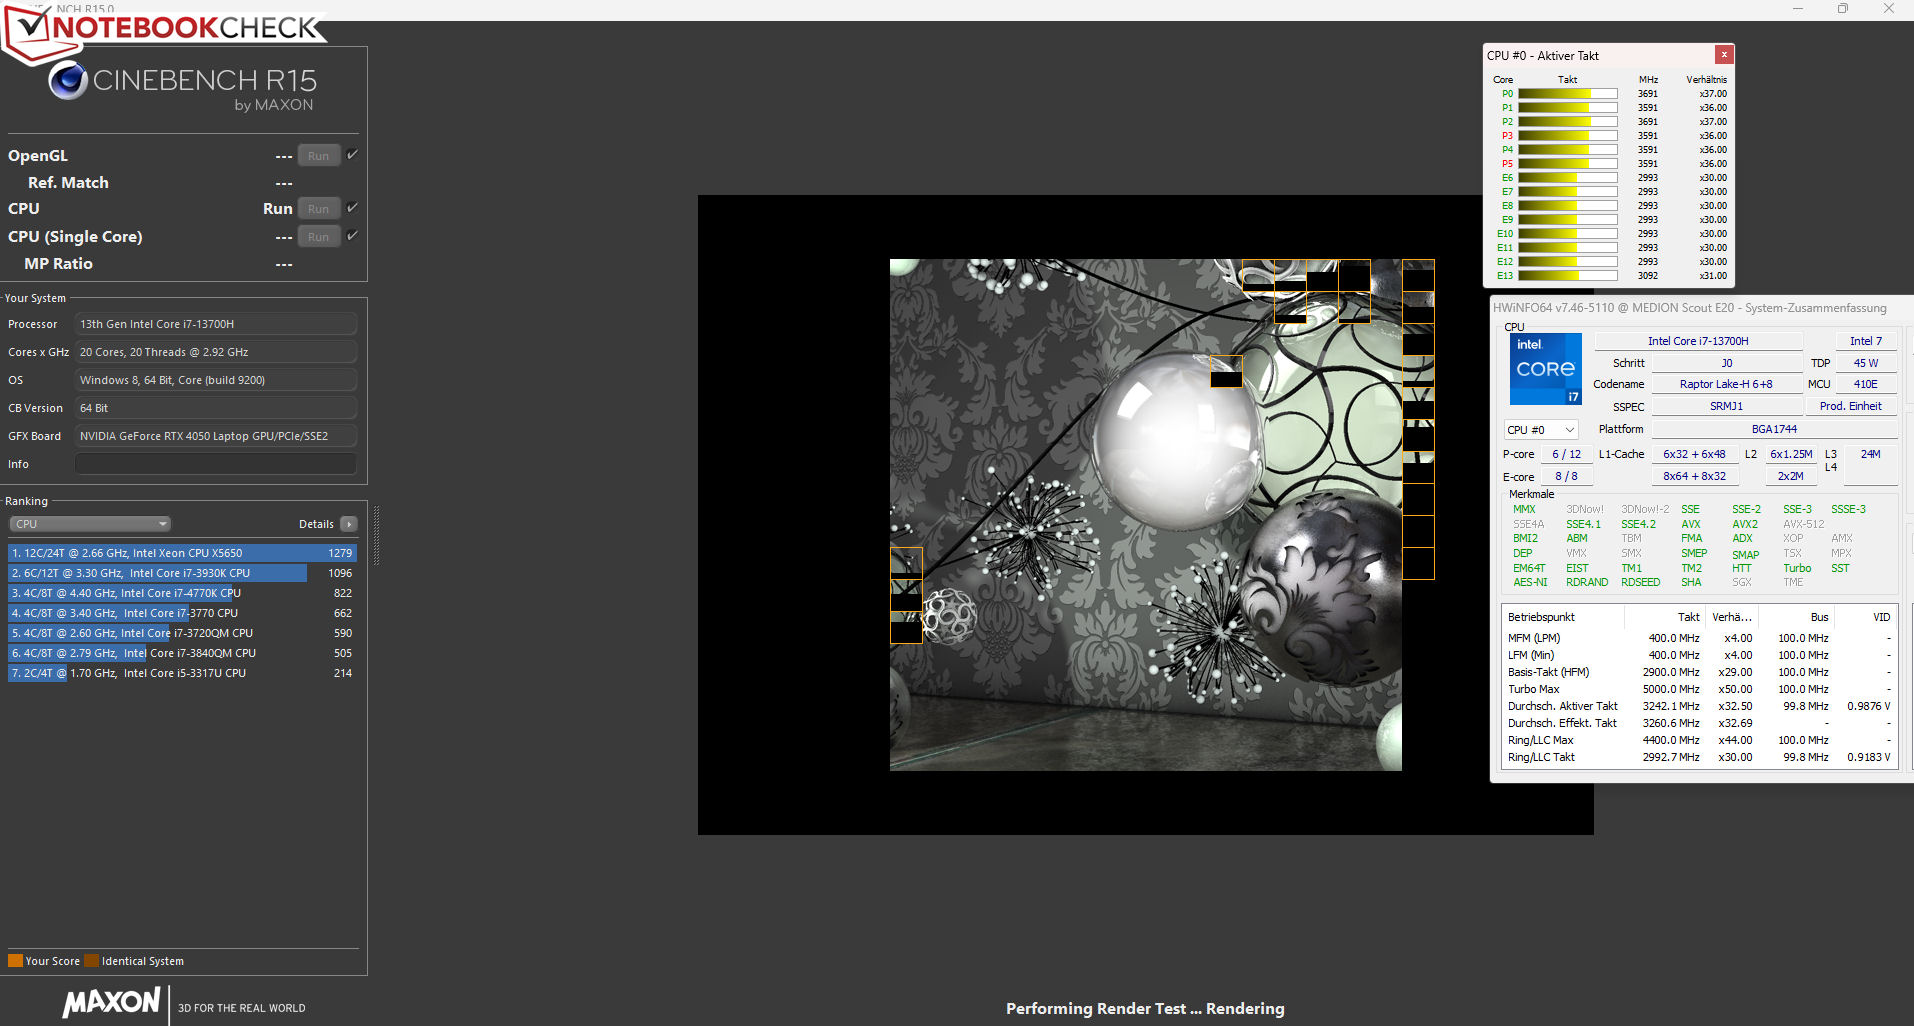
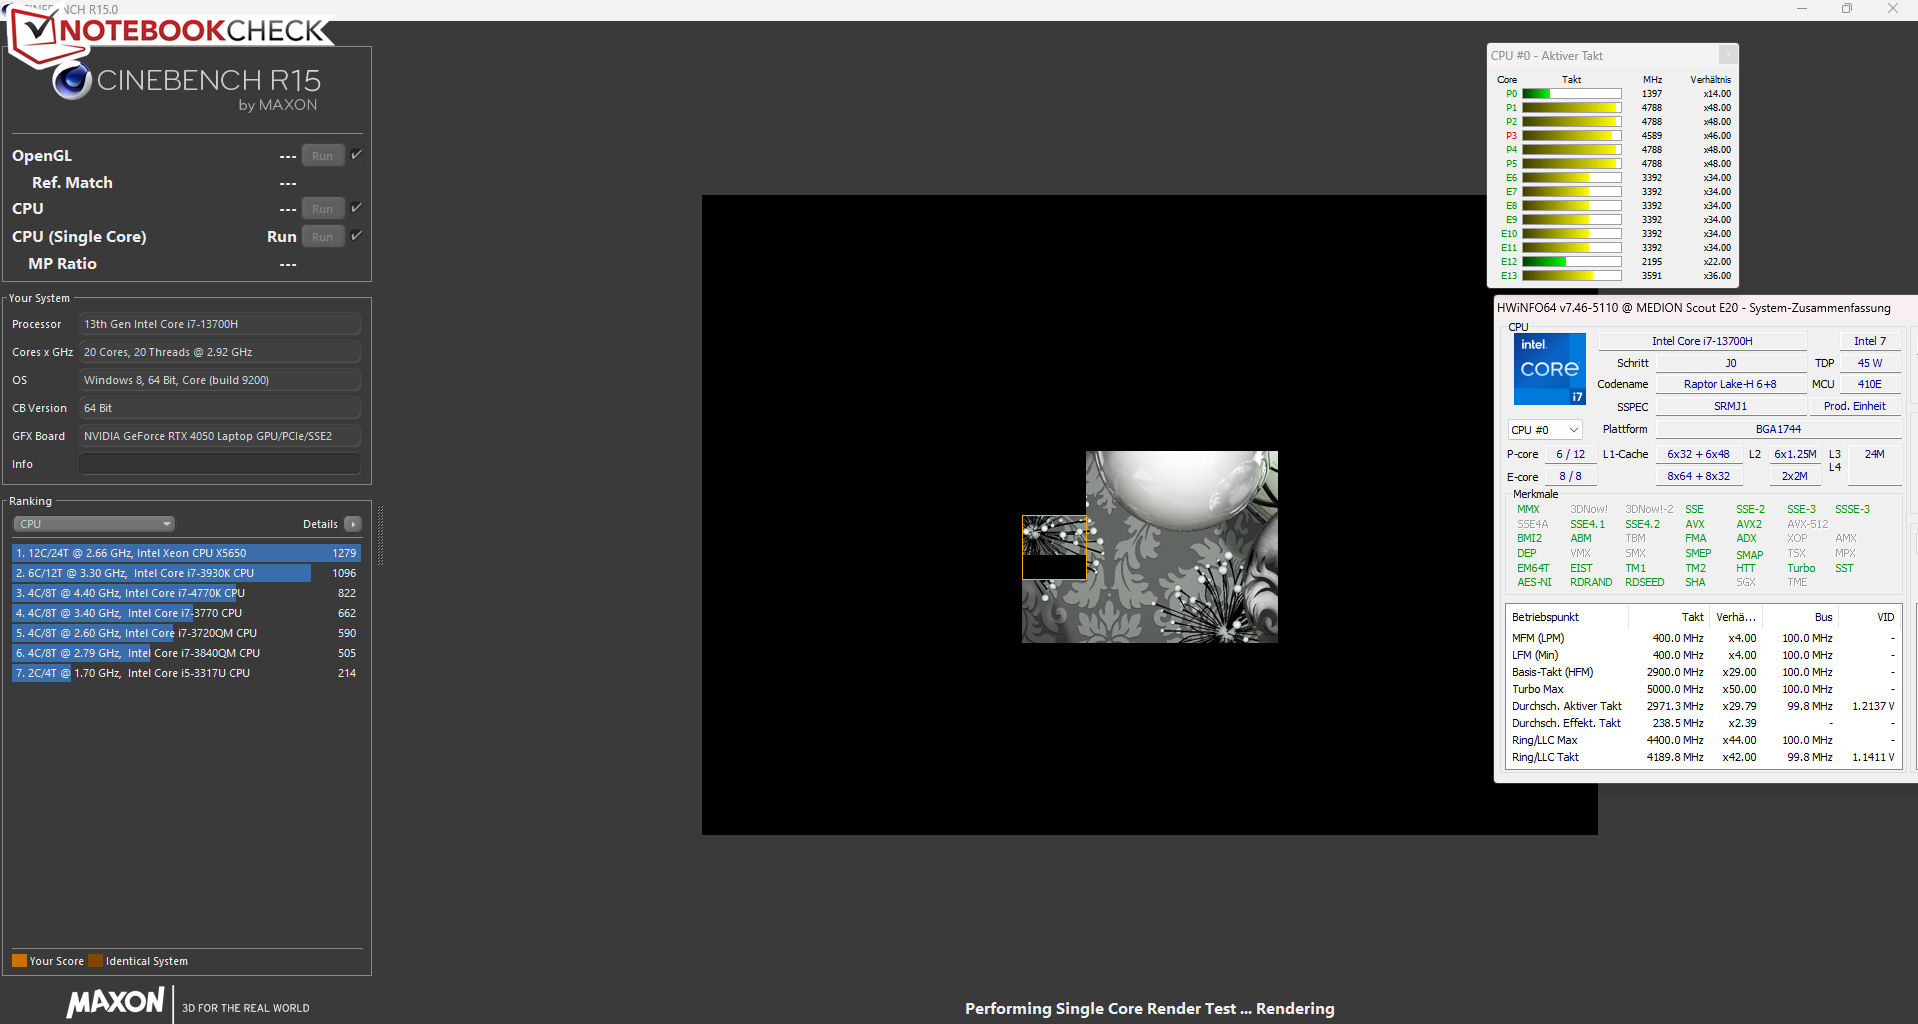
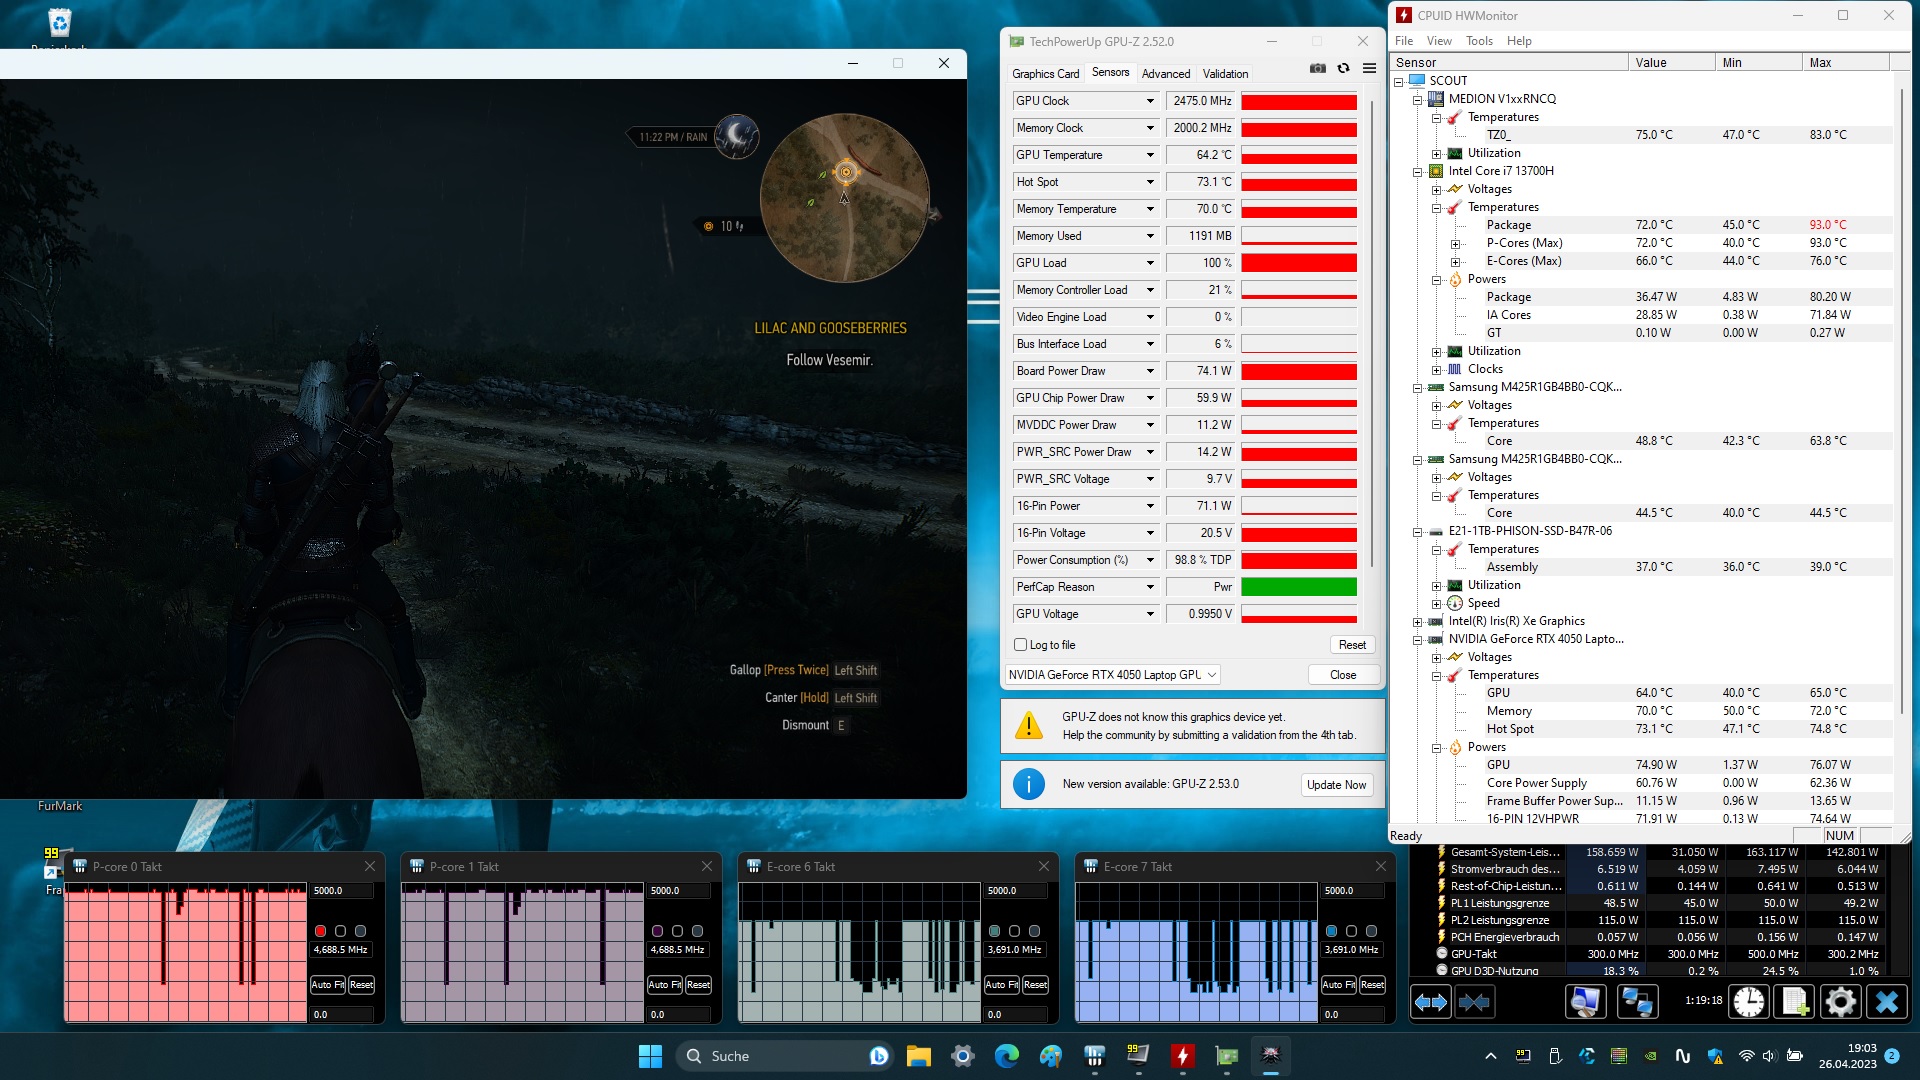
Le Raptor LakeCore i7-13700Hse compose de huit cœurs Efficiency (sans hyperthreading, 1,8 à 3,7 GHz) et de six cœurs Performance (hyperthreading, 2,4 à 5 GHz), ce qui donne un total de 20 cœurs logiques de CPU.
Les benchmarks donnent des résultats supérieurs (mode jeu, mode divertissement) et inférieurs (autres modes) à la moyenne actuelle du CPU jusqu'à présent. Les performances en mode monotâche, plus pertinentes (170 points), sont moins réduites en mode batterie que les performances en mode multithread (1 335 points).
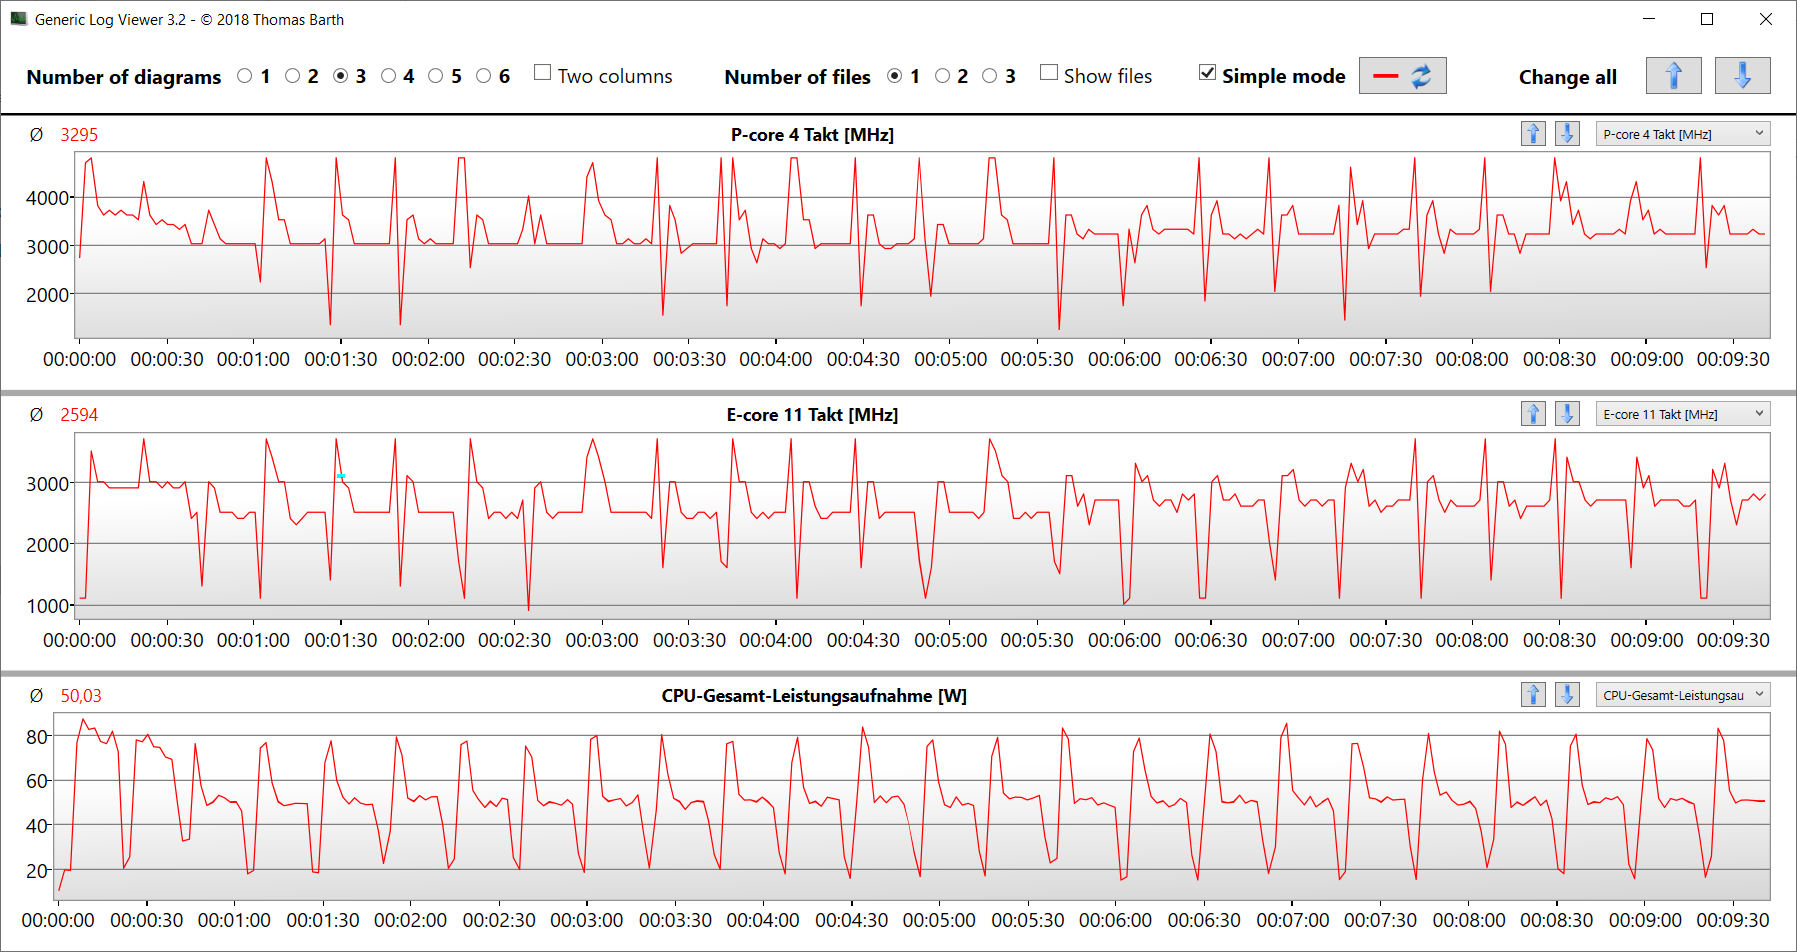
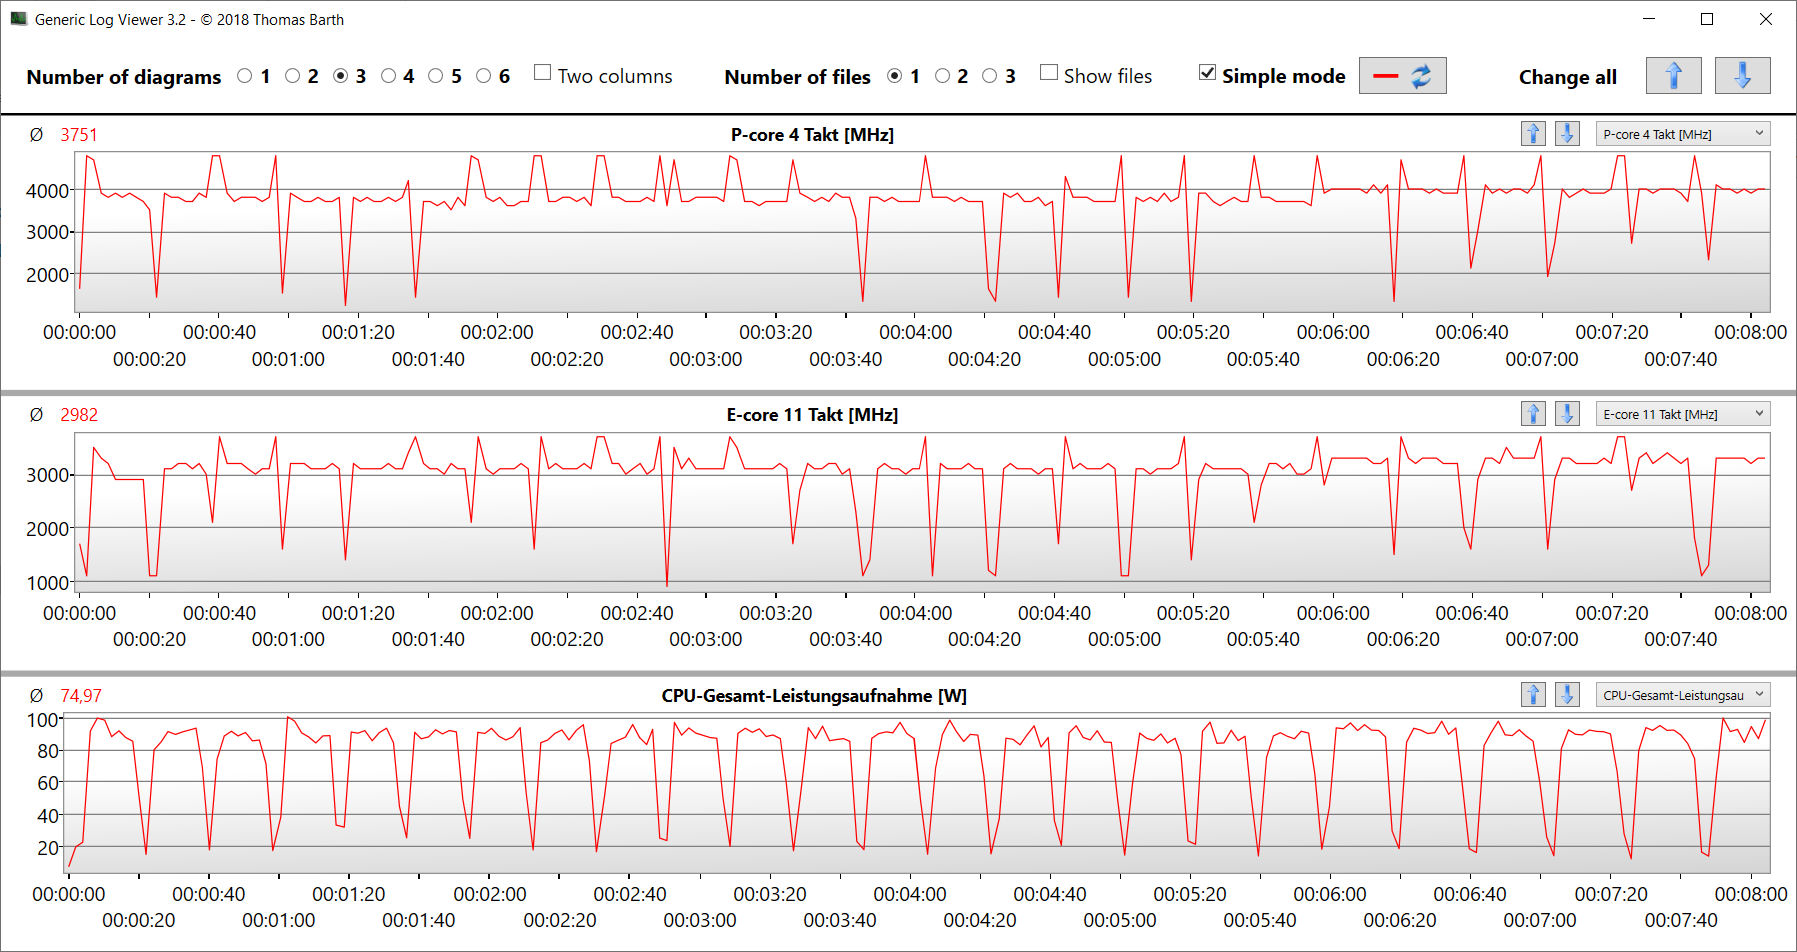
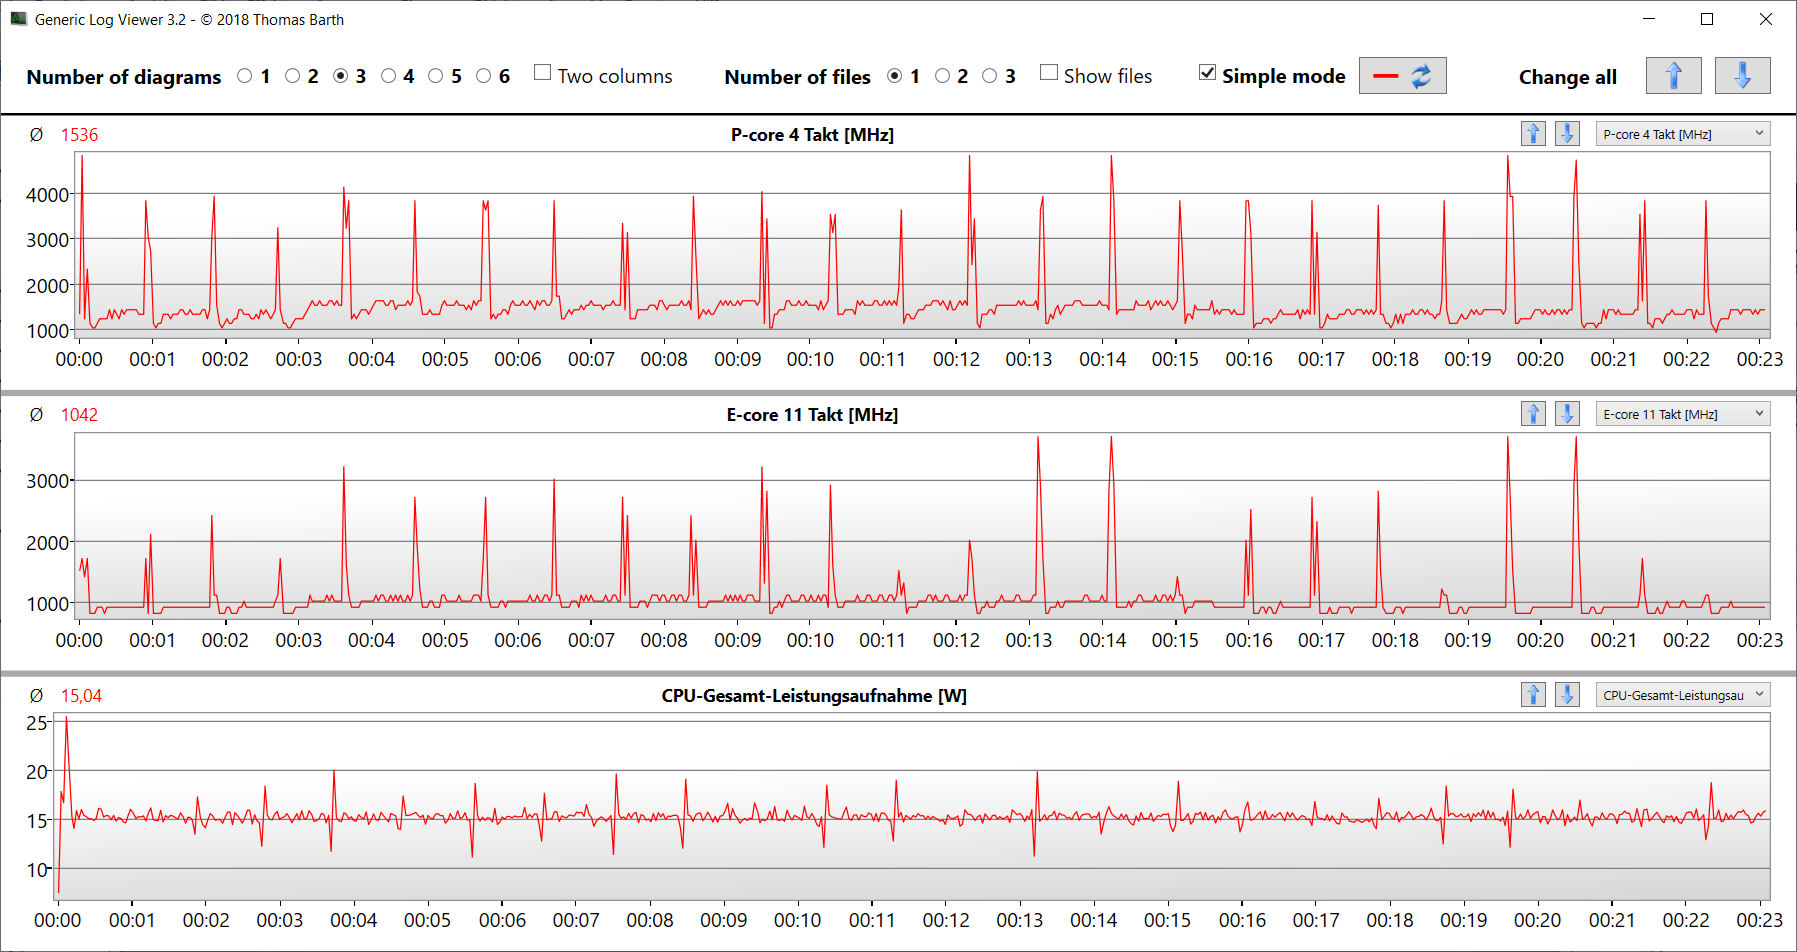
Le test en boucle CB15 montre qu'une charge multithread constante fait chuter la vitesse Turbo de la première à la troisième exécution. Ensuite, il est possible de maintenir un niveau constant, du moins pendant un certain temps. Le mode Gaming garantit une vitesse d'horloge constante plus élevée.
Cinebench R15 Multi Constant Load Test
| CPU Performance rating - Percent | |
| Moyenne de la classe Gaming | |
| Lenovo Legion 5 15IAH7H 82RB | |
| Medion Erazer Scout E20 | |
| Medion Erazer Scout E20 | |
| Moyenne Intel Core i7-13700H | |
| MSI Katana 17 B13VFK | |
| Gigabyte G7 KE | |
| Acer Nitro 5 AN515-46-R1A1 | |
| Asus TUF Gaming A16 FA617 | |
| Medion Erazer Scout E20 | |
| Cinebench R23 | |
| Multi Core | |
| Moyenne de la classe Gaming (10488 - 42661, n=104, 2 dernières années) | |
| Lenovo Legion 5 15IAH7H 82RB | |
| Medion Erazer Scout E20 (Gaming Modus) | |
| Medion Erazer Scout E20 | |
| MSI Katana 17 B13VFK | |
| Moyenne Intel Core i7-13700H (5890 - 20034, n=29) | |
| Gigabyte G7 KE | |
| Asus TUF Gaming A16 FA617 | |
| Acer Nitro 5 AN515-46-R1A1 | |
| Medion Erazer Scout E20 (Lautlosmodus) | |
| Single Core | |
| Moyenne de la classe Gaming (1601 - 2415, n=104, 2 dernières années) | |
| Medion Erazer Scout E20 (Gaming Modus) | |
| Medion Erazer Scout E20 | |
| Lenovo Legion 5 15IAH7H 82RB | |
| MSI Katana 17 B13VFK | |
| Moyenne Intel Core i7-13700H (1323 - 1914, n=29) | |
| Gigabyte G7 KE | |
| Asus TUF Gaming A16 FA617 | |
| Acer Nitro 5 AN515-46-R1A1 | |
| Medion Erazer Scout E20 (Lautlosmodus) | |
| Cinebench R20 | |
| CPU (Multi Core) | |
| Moyenne de la classe Gaming (4029 - 16433, n=103, 2 dernières années) | |
| Lenovo Legion 5 15IAH7H 82RB | |
| Medion Erazer Scout E20 (Gaming Modus) | |
| Medion Erazer Scout E20 | |
| MSI Katana 17 B13VFK | |
| Moyenne Intel Core i7-13700H (2322 - 7674, n=29) | |
| Asus TUF Gaming A16 FA617 | |
| Gigabyte G7 KE | |
| Acer Nitro 5 AN515-46-R1A1 | |
| Medion Erazer Scout E20 (Lautlosmodus) | |
| CPU (Single Core) | |
| Moyenne de la classe Gaming (622 - 913, n=103, 2 dernières années) | |
| Medion Erazer Scout E20 | |
| Medion Erazer Scout E20 (Gaming Modus) | |
| Lenovo Legion 5 15IAH7H 82RB | |
| Moyenne Intel Core i7-13700H (508 - 741, n=29) | |
| MSI Katana 17 B13VFK | |
| Gigabyte G7 KE | |
| Asus TUF Gaming A16 FA617 | |
| Acer Nitro 5 AN515-46-R1A1 | |
| Medion Erazer Scout E20 (Lautlosmodus) | |
| Cinebench R15 | |
| CPU Multi 64Bit | |
| Moyenne de la classe Gaming (1578 - 6330, n=102, 2 dernières années) | |
| Lenovo Legion 5 15IAH7H 82RB | |
| Medion Erazer Scout E20 (Gaming Modus) | |
| Medion Erazer Scout E20 | |
| Moyenne Intel Core i7-13700H (905 - 2982, n=29) | |
| MSI Katana 17 B13VFK | |
| Asus TUF Gaming A16 FA617 | |
| Acer Nitro 5 AN515-46-R1A1 | |
| Gigabyte G7 KE | |
| Medion Erazer Scout E20 (Lautlosmodus) | |
| CPU Single 64Bit | |
| Moyenne de la classe Gaming (188.8 - 350, n=103, 2 dernières années) | |
| Medion Erazer Scout E20 | |
| Medion Erazer Scout E20 (Gaming Modus) | |
| Lenovo Legion 5 15IAH7H 82RB | |
| Moyenne Intel Core i7-13700H (213 - 278, n=29) | |
| MSI Katana 17 B13VFK | |
| Gigabyte G7 KE | |
| Acer Nitro 5 AN515-46-R1A1 | |
| Asus TUF Gaming A16 FA617 | |
| Medion Erazer Scout E20 (Lautlosmodus) | |
| Blender - v2.79 BMW27 CPU | |
| Medion Erazer Scout E20 (Lautlosmodus) | |
| Acer Nitro 5 AN515-46-R1A1 | |
| Moyenne Intel Core i7-13700H (169 - 555, n=29) | |
| Gigabyte G7 KE | |
| Asus TUF Gaming A16 FA617 | |
| MSI Katana 17 B13VFK | |
| Medion Erazer Scout E20 | |
| Medion Erazer Scout E20 (Gaming Modus) | |
| Lenovo Legion 5 15IAH7H 82RB | |
| Moyenne de la classe Gaming (79 - 330, n=101, 2 dernières années) | |
| 7-Zip 18.03 | |
| 7z b 4 | |
| Moyenne de la classe Gaming (33491 - 148086, n=102, 2 dernières années) | |
| Lenovo Legion 5 15IAH7H 82RB | |
| Medion Erazer Scout E20 (Gaming Modus) | |
| Medion Erazer Scout E20 | |
| MSI Katana 17 B13VFK | |
| Acer Nitro 5 AN515-46-R1A1 | |
| Asus TUF Gaming A16 FA617 | |
| Moyenne Intel Core i7-13700H (27322 - 76344, n=29) | |
| Gigabyte G7 KE | |
| Medion Erazer Scout E20 (Lautlosmodus) | |
| 7z b 4 -mmt1 | |
| Moyenne de la classe Gaming (4824 - 7436, n=102, 2 dernières années) | |
| Medion Erazer Scout E20 | |
| Medion Erazer Scout E20 (Gaming Modus) | |
| Moyenne Intel Core i7-13700H (4825 - 6238, n=29) | |
| Lenovo Legion 5 15IAH7H 82RB | |
| Asus TUF Gaming A16 FA617 | |
| MSI Katana 17 B13VFK | |
| Acer Nitro 5 AN515-46-R1A1 | |
| Gigabyte G7 KE | |
| Medion Erazer Scout E20 (Lautlosmodus) | |
| Geekbench 5.5 | |
| Multi-Core | |
| Moyenne de la classe Gaming (6460 - 28263, n=102, 2 dernières années) | |
| Lenovo Legion 5 15IAH7H 82RB | |
| Medion Erazer Scout E20 (Gaming Modus) | |
| Medion Erazer Scout E20 | |
| Moyenne Intel Core i7-13700H (6165 - 14215, n=29) | |
| MSI Katana 17 B13VFK | |
| Gigabyte G7 KE | |
| Asus TUF Gaming A16 FA617 | |
| Acer Nitro 5 AN515-46-R1A1 | |
| Medion Erazer Scout E20 (Lautlosmodus) | |
| Single-Core | |
| Moyenne de la classe Gaming (1403 - 2474, n=102, 2 dernières années) | |
| Medion Erazer Scout E20 (Gaming Modus) | |
| Medion Erazer Scout E20 | |
| Moyenne Intel Core i7-13700H (1362 - 1919, n=29) | |
| MSI Katana 17 B13VFK | |
| Lenovo Legion 5 15IAH7H 82RB | |
| Gigabyte G7 KE | |
| Medion Erazer Scout E20 (Lautlosmodus) | |
| Asus TUF Gaming A16 FA617 | |
| Acer Nitro 5 AN515-46-R1A1 | |
| HWBOT x265 Benchmark v2.2 - 4k Preset | |
| Moyenne de la classe Gaming (11.5 - 44.4, n=102, 2 dernières années) | |
| Lenovo Legion 5 15IAH7H 82RB | |
| Medion Erazer Scout E20 (Gaming Modus) | |
| Asus TUF Gaming A16 FA617 | |
| MSI Katana 17 B13VFK | |
| Medion Erazer Scout E20 | |
| Acer Nitro 5 AN515-46-R1A1 | |
| Gigabyte G7 KE | |
| Moyenne Intel Core i7-13700H (6.72 - 21.2, n=29) | |
| Medion Erazer Scout E20 (Lautlosmodus) | |
| LibreOffice - 20 Documents To PDF | |
| Asus TUF Gaming A16 FA617 | |
| MSI Katana 17 B13VFK | |
| Acer Nitro 5 AN515-46-R1A1 | |
| Moyenne de la classe Gaming (33.2 - 88.8, n=102, 2 dernières années) | |
| Moyenne Intel Core i7-13700H (31.3 - 62.4, n=29) | |
| Medion Erazer Scout E20 (Lautlosmodus) | |
| Gigabyte G7 KE | |
| Medion Erazer Scout E20 | |
| Medion Erazer Scout E20 (Gaming Modus) | |
| Lenovo Legion 5 15IAH7H 82RB | |
| R Benchmark 2.5 - Overall mean | |
| Medion Erazer Scout E20 (Lautlosmodus) | |
| Asus TUF Gaming A16 FA617 | |
| Acer Nitro 5 AN515-46-R1A1 | |
| Gigabyte G7 KE | |
| Moyenne Intel Core i7-13700H (0.4308 - 0.607, n=29) | |
| Lenovo Legion 5 15IAH7H 82RB | |
| Medion Erazer Scout E20 (Gaming Modus) | |
| Medion Erazer Scout E20 | |
| MSI Katana 17 B13VFK | |
| Moyenne de la classe Gaming (0.3439 - 0.59, n=102, 2 dernières années) | |
* ... Moindre est la valeur, meilleures sont les performances
AIDA64: FP32 Ray-Trace | FPU Julia | CPU SHA3 | CPU Queen | FPU SinJulia | FPU Mandel | CPU AES | CPU ZLib | FP64 Ray-Trace | CPU PhotoWorxx
| Performance rating | |
| Moyenne de la classe Gaming | |
| Lenovo Legion 5 15IAH7H 82RB | |
| Acer Nitro 5 AN515-46-R1A1 | |
| Medion Erazer Scout E20 | |
| Asus TUF Gaming A16 FA617 | |
| Medion Erazer Scout E20 | |
| Moyenne Intel Core i7-13700H | |
| Gigabyte G7 KE | |
| MSI Katana 17 B13VFK | |
| Medion Erazer Scout E20 | |
| AIDA64 / FP32 Ray-Trace | |
| Moyenne de la classe Gaming (10227 - 85542, n=102, 2 dernières années) | |
| Lenovo Legion 5 15IAH7H 82RB (v6.75.6100) | |
| Asus TUF Gaming A16 FA617 (v6.85.6300) | |
| Medion Erazer Scout E20 (v6.75.6100, Gaming Modus) | |
| Acer Nitro 5 AN515-46-R1A1 (v6.75.6100) | |
| Medion Erazer Scout E20 (v6.75.6100) | |
| Moyenne Intel Core i7-13700H (4986 - 18908, n=29) | |
| MSI Katana 17 B13VFK (v6.85.6300) | |
| Gigabyte G7 KE (v6.75.6100) | |
| Medion Erazer Scout E20 (v6.75.6100, Lautlosmodus) | |
| AIDA64 / FPU Julia | |
| Moyenne de la classe Gaming (51376 - 372155, n=102, 2 dernières années) | |
| Asus TUF Gaming A16 FA617 (v6.85.6300) | |
| Acer Nitro 5 AN515-46-R1A1 (v6.75.6100) | |
| Lenovo Legion 5 15IAH7H 82RB (v6.75.6100) | |
| Medion Erazer Scout E20 (v6.75.6100, Gaming Modus) | |
| Medion Erazer Scout E20 | |
| Moyenne Intel Core i7-13700H (25360 - 92359, n=29) | |
| MSI Katana 17 B13VFK (v6.85.6300) | |
| Gigabyte G7 KE (v6.75.6100) | |
| Medion Erazer Scout E20 (v6.75.6100, Lautlosmodus) | |
| AIDA64 / CPU SHA3 | |
| Moyenne de la classe Gaming (2180 - 10115, n=102, 2 dernières années) | |
| Lenovo Legion 5 15IAH7H 82RB (v6.75.6100) | |
| Medion Erazer Scout E20 (v6.75.6100, Gaming Modus) | |
| Asus TUF Gaming A16 FA617 (v6.85.6300) | |
| Acer Nitro 5 AN515-46-R1A1 (v6.75.6100) | |
| Gigabyte G7 KE (v6.75.6100) | |
| Medion Erazer Scout E20 (v6.75.6100) | |
| Moyenne Intel Core i7-13700H (1339 - 4224, n=29) | |
| MSI Katana 17 B13VFK (v6.85.6300) | |
| Medion Erazer Scout E20 (v6.75.6100, Lautlosmodus) | |
| AIDA64 / CPU Queen | |
| Moyenne de la classe Gaming (49785 - 173351, n=86, 2 dernières années) | |
| Medion Erazer Scout E20 (v6.75.6100) | |
| Acer Nitro 5 AN515-46-R1A1 (v6.75.6100) | |
| Medion Erazer Scout E20 (v6.75.6100, Gaming Modus) | |
| Asus TUF Gaming A16 FA617 (v6.85.6300) | |
| Lenovo Legion 5 15IAH7H 82RB (v6.75.6100) | |
| Moyenne Intel Core i7-13700H (59324 - 107159, n=29) | |
| Gigabyte G7 KE (v6.75.6100) | |
| MSI Katana 17 B13VFK | |
| Medion Erazer Scout E20 (v6.75.6100, Lautlosmodus) | |
| AIDA64 / FPU SinJulia | |
| Moyenne de la classe Gaming (4424 - 33636, n=102, 2 dernières années) | |
| Acer Nitro 5 AN515-46-R1A1 (v6.75.6100) | |
| Asus TUF Gaming A16 FA617 (v6.85.6300) | |
| Medion Erazer Scout E20 (v6.75.6100, Gaming Modus) | |
| Lenovo Legion 5 15IAH7H 82RB (v6.75.6100) | |
| Medion Erazer Scout E20 (v6.75.6100) | |
| Moyenne Intel Core i7-13700H (4800 - 11050, n=29) | |
| MSI Katana 17 B13VFK | |
| Gigabyte G7 KE (v6.75.6100) | |
| Medion Erazer Scout E20 (v6.75.6100, Lautlosmodus) | |
| AIDA64 / FPU Mandel | |
| Moyenne de la classe Gaming (25115 - 196829, n=102, 2 dernières années) | |
| Acer Nitro 5 AN515-46-R1A1 (v6.75.6100) | |
| Asus TUF Gaming A16 FA617 (v6.85.6300) | |
| Lenovo Legion 5 15IAH7H 82RB (v6.75.6100) | |
| Medion Erazer Scout E20 (v6.75.6100, Gaming Modus) | |
| Medion Erazer Scout E20 (v6.75.6100) | |
| Moyenne Intel Core i7-13700H (12321 - 45118, n=29) | |
| MSI Katana 17 B13VFK (v6.85.6300) | |
| Gigabyte G7 KE (v6.75.6100) | |
| Medion Erazer Scout E20 (v6.75.6100, Lautlosmodus) | |
| AIDA64 / CPU AES | |
| Lenovo Legion 5 15IAH7H 82RB (v6.75.6100) | |
| Acer Nitro 5 AN515-46-R1A1 | |
| Gigabyte G7 KE (v6.75.6100) | |
| Moyenne de la classe Gaming (39258 - 247074, n=102, 2 dernières années) | |
| Medion Erazer Scout E20 (v6.75.6100, Gaming Modus) | |
| Moyenne Intel Core i7-13700H (28769 - 151254, n=29) | |
| Medion Erazer Scout E20 (v6.75.6100) | |
| Asus TUF Gaming A16 FA617 (v6.85.6300) | |
| MSI Katana 17 B13VFK (v6.85.6300) | |
| Medion Erazer Scout E20 (v6.75.6100, Lautlosmodus) | |
| AIDA64 / CPU ZLib | |
| Moyenne de la classe Gaming (574 - 2531, n=102, 2 dernières années) | |
| Lenovo Legion 5 15IAH7H 82RB (v6.75.6100) | |
| Medion Erazer Scout E20 (v6.75.6100, Gaming Modus) | |
| Medion Erazer Scout E20 (v6.75.6100) | |
| Moyenne Intel Core i7-13700H (389 - 1215, n=29) | |
| Gigabyte G7 KE (v6.75.6100) | |
| Asus TUF Gaming A16 FA617 (v6.85.6300) | |
| Acer Nitro 5 AN515-46-R1A1 (v6.75.6100) | |
| MSI Katana 17 B13VFK (v6.85.6300) | |
| Medion Erazer Scout E20 (v6.75.6100, Lautlosmodus) | |
| AIDA64 / FP64 Ray-Trace | |
| Moyenne de la classe Gaming (5509 - 45446, n=102, 2 dernières années) | |
| Lenovo Legion 5 15IAH7H 82RB (v6.75.6100) | |
| Asus TUF Gaming A16 FA617 (v6.85.6300) | |
| Medion Erazer Scout E20 (v6.75.6100, Gaming Modus) | |
| Acer Nitro 5 AN515-46-R1A1 (v6.75.6100) | |
| Medion Erazer Scout E20 (v6.75.6100) | |
| Moyenne Intel Core i7-13700H (2540 - 10135, n=29) | |
| MSI Katana 17 B13VFK (v6.85.6300) | |
| Gigabyte G7 KE (v6.75.6100) | |
| Medion Erazer Scout E20 (v6.75.6100, Lautlosmodus) | |
| AIDA64 / CPU PhotoWorxx | |
| Moyenne de la classe Gaming (12271 - 89891, n=102, 2 dernières années) | |
| Moyenne Intel Core i7-13700H (12872 - 52727, n=29) | |
| Medion Erazer Scout E20 (v6.75.6100, Gaming Modus) | |
| Medion Erazer Scout E20 (v6.75.6100) | |
| Lenovo Legion 5 15IAH7H 82RB (v6.75.6100) | |
| MSI Katana 17 B13VFK (v6.85.6300) | |
| Medion Erazer Scout E20 (v6.75.6100, Lautlosmodus) | |
| Gigabyte G7 KE (v6.75.6100) | |
| Acer Nitro 5 AN515-46-R1A1 | |
| Asus TUF Gaming A16 FA617 (v6.85.6300) | |
Performance du système
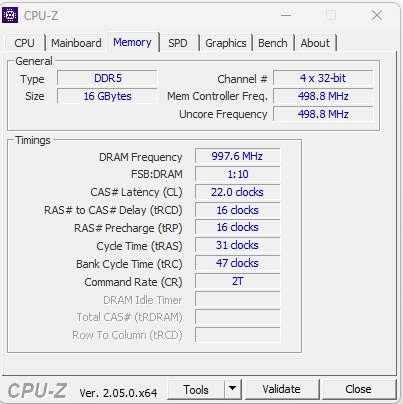
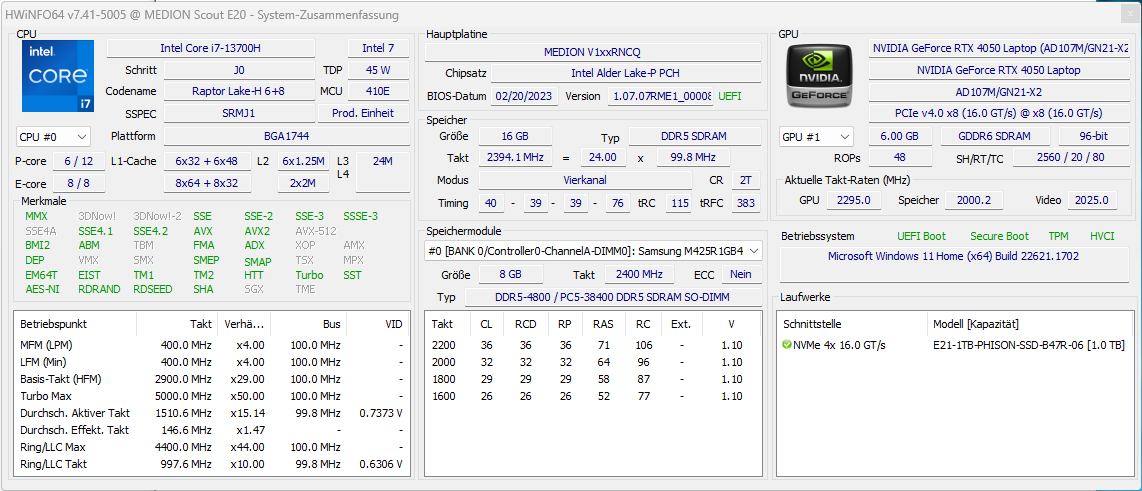
Le système fonctionne sans heurts et offre des performances suffisantes pour les tâches exigeantes telles que le rendu et les jeux, ce qui est également confirmé par les bons résultats de PCMark. Les taux de transfert de la mémoire de travail se situent à des niveaux normaux pour une mémoire DDR5-4800.
CrossMark: Overall | Productivity | Creativity | Responsiveness
| PCMark 10 / Score | |
| Moyenne de la classe Gaming (5828 - 12414, n=93, 2 dernières années) | |
| Lenovo Legion 5 15IAH7H 82RB | |
| Medion Erazer Scout E20 | |
| Asus TUF Gaming A16 FA617 | |
| Moyenne Intel Core i7-13700H, NVIDIA GeForce RTX 4050 Laptop GPU (6822 - 7556, n=7) | |
| MSI Katana 17 B13VFK | |
| Acer Nitro 5 AN515-46-R1A1 | |
| Gigabyte G7 KE | |
| PCMark 10 / Essentials | |
| Lenovo Legion 5 15IAH7H 82RB | |
| Medion Erazer Scout E20 | |
| Moyenne Intel Core i7-13700H, NVIDIA GeForce RTX 4050 Laptop GPU (10283 - 11549, n=7) | |
| MSI Katana 17 B13VFK | |
| Moyenne de la classe Gaming (8810 - 11935, n=97, 2 dernières années) | |
| Asus TUF Gaming A16 FA617 | |
| Acer Nitro 5 AN515-46-R1A1 | |
| Gigabyte G7 KE | |
| PCMark 10 / Productivity | |
| Moyenne de la classe Gaming (6845 - 25323, n=95, 2 dernières années) | |
| Lenovo Legion 5 15IAH7H 82RB | |
| Medion Erazer Scout E20 | |
| Asus TUF Gaming A16 FA617 | |
| MSI Katana 17 B13VFK | |
| Moyenne Intel Core i7-13700H, NVIDIA GeForce RTX 4050 Laptop GPU (8368 - 9836, n=7) | |
| Gigabyte G7 KE | |
| Acer Nitro 5 AN515-46-R1A1 | |
| PCMark 10 / Digital Content Creation | |
| Moyenne de la classe Gaming (7602 - 19954, n=95, 2 dernières années) | |
| Lenovo Legion 5 15IAH7H 82RB | |
| Asus TUF Gaming A16 FA617 | |
| Medion Erazer Scout E20 | |
| Moyenne Intel Core i7-13700H, NVIDIA GeForce RTX 4050 Laptop GPU (9527 - 10643, n=7) | |
| MSI Katana 17 B13VFK | |
| Acer Nitro 5 AN515-46-R1A1 | |
| Gigabyte G7 KE | |
| CrossMark / Overall | |
| Lenovo Legion 5 15IAH7H 82RB | |
| Moyenne de la classe Gaming (1366 - 2409, n=94, 2 dernières années) | |
| Medion Erazer Scout E20 | |
| MSI Katana 17 B13VFK | |
| Gigabyte G7 KE | |
| Moyenne Intel Core i7-13700H, NVIDIA GeForce RTX 4050 Laptop GPU (1205 - 1937, n=9) | |
| Acer Nitro 5 AN515-46-R1A1 | |
| CrossMark / Productivity | |
| Lenovo Legion 5 15IAH7H 82RB | |
| Medion Erazer Scout E20 | |
| Moyenne de la classe Gaming (1386 - 2254, n=94, 2 dernières années) | |
| Gigabyte G7 KE | |
| MSI Katana 17 B13VFK | |
| Moyenne Intel Core i7-13700H, NVIDIA GeForce RTX 4050 Laptop GPU (1158 - 1877, n=9) | |
| Acer Nitro 5 AN515-46-R1A1 | |
| CrossMark / Creativity | |
| Moyenne de la classe Gaming (1343 - 2786, n=94, 2 dernières années) | |
| Medion Erazer Scout E20 | |
| Lenovo Legion 5 15IAH7H 82RB | |
| MSI Katana 17 B13VFK | |
| Moyenne Intel Core i7-13700H, NVIDIA GeForce RTX 4050 Laptop GPU (1293 - 2044, n=9) | |
| Gigabyte G7 KE | |
| Acer Nitro 5 AN515-46-R1A1 | |
| CrossMark / Responsiveness | |
| Lenovo Legion 5 15IAH7H 82RB | |
| Gigabyte G7 KE | |
| Medion Erazer Scout E20 | |
| MSI Katana 17 B13VFK | |
| Moyenne de la classe Gaming (1226 - 2334, n=94, 2 dernières années) | |
| Moyenne Intel Core i7-13700H, NVIDIA GeForce RTX 4050 Laptop GPU (1097 - 1929, n=9) | |
| Acer Nitro 5 AN515-46-R1A1 | |
| PCMark 8 Home Score Accelerated v2 | 5486 points | |
| PCMark 8 Work Score Accelerated v2 | 6205 points | |
| PCMark 10 Score | 7556 points | |
Aide | ||
| AIDA64 / Memory Copy | |
| Moyenne de la classe Gaming (21750 - 129946, n=102, 2 dernières années) | |
| Moyenne Intel Core i7-13700H (24334 - 78081, n=29) | |
| Medion Erazer Scout E20 | |
| MSI Katana 17 B13VFK | |
| Lenovo Legion 5 15IAH7H 82RB | |
| Acer Nitro 5 AN515-46-R1A1 | |
| Asus TUF Gaming A16 FA617 | |
| Gigabyte G7 KE | |
| AIDA64 / Memory Read | |
| Moyenne de la classe Gaming (22956 - 118858, n=102, 2 dernières années) | |
| Medion Erazer Scout E20 | |
| Moyenne Intel Core i7-13700H (23681 - 79656, n=29) | |
| MSI Katana 17 B13VFK | |
| Lenovo Legion 5 15IAH7H 82RB | |
| Acer Nitro 5 AN515-46-R1A1 | |
| Asus TUF Gaming A16 FA617 | |
| Gigabyte G7 KE | |
| AIDA64 / Memory Write | |
| Moyenne de la classe Gaming (22297 - 135096, n=102, 2 dernières années) | |
| Moyenne Intel Core i7-13700H (22986 - 99898, n=29) | |
| Medion Erazer Scout E20 | |
| Lenovo Legion 5 15IAH7H 82RB | |
| Acer Nitro 5 AN515-46-R1A1 | |
| Asus TUF Gaming A16 FA617 | |
| MSI Katana 17 B13VFK | |
| Gigabyte G7 KE | |
| AIDA64 / Memory Latency | |
| Moyenne de la classe Gaming (75.3 - 165.4, n=102, 2 dernières années) | |
| MSI Katana 17 B13VFK | |
| Medion Erazer Scout E20 | |
| Lenovo Legion 5 15IAH7H 82RB | |
| Moyenne Intel Core i7-13700H (82.4 - 136.8, n=29) | |
| Gigabyte G7 KE | |
| Acer Nitro 5 AN515-46-R1A1 | |
| Asus TUF Gaming A16 FA617 | |
* ... Moindre est la valeur, meilleures sont les performances
Latences DPC
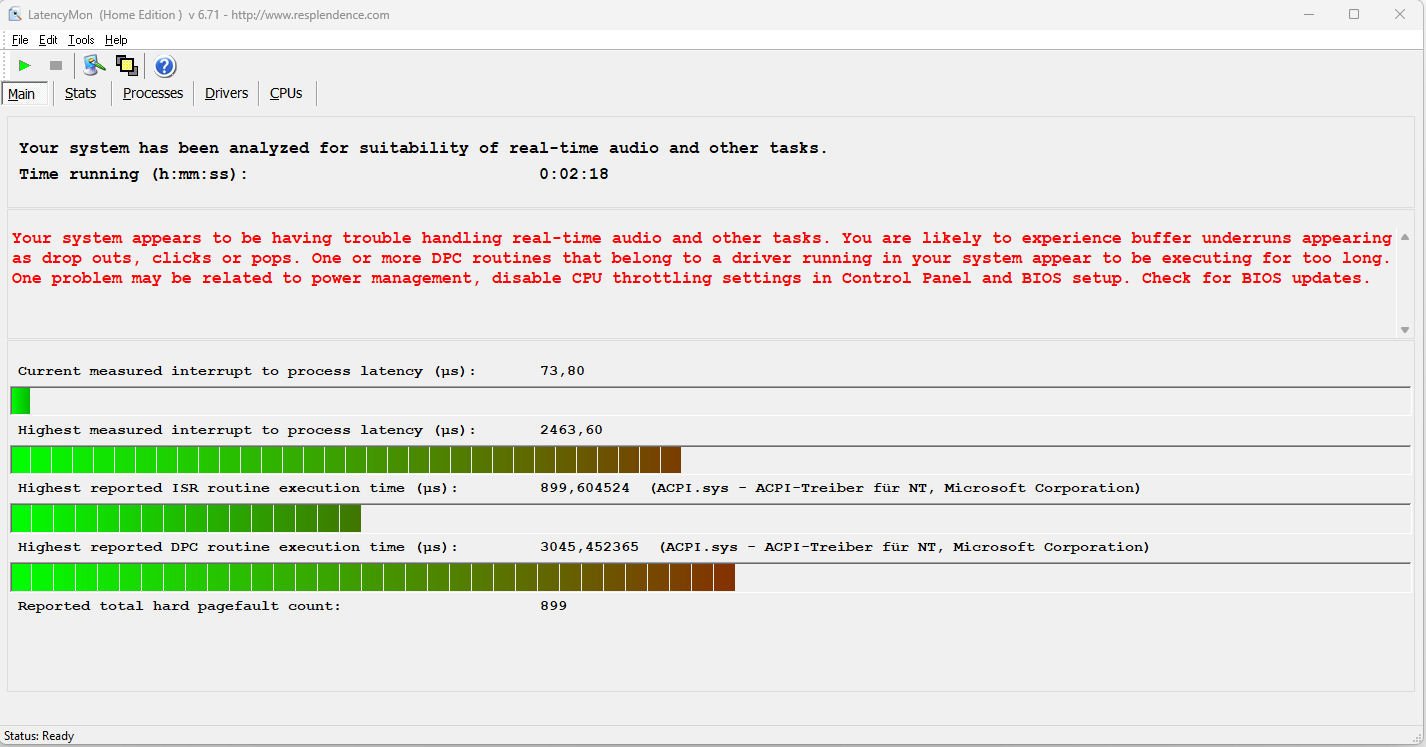
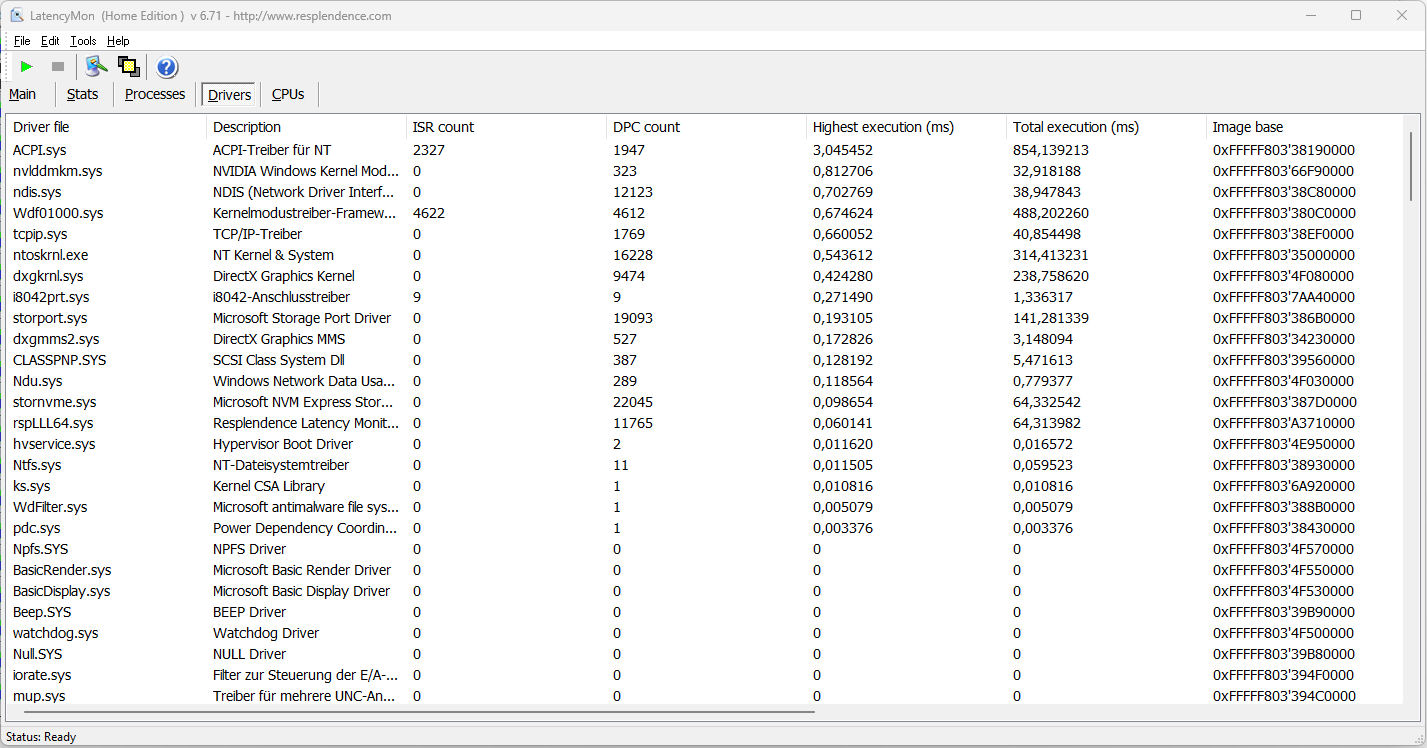
Le test standardisé Latency Monitor (avec navigation sur le web, reproduction vidéo 4k et charge élevée de Prime95) révèle quelques latences évidentes. Le système ne semble pas adapté au traitement vidéo et audio en temps réel. Les futures mises à jour logicielles pourraient apporter des améliorations ou même aggraver la situation.
| DPC Latencies / LatencyMon - interrupt to process latency (max), Web, Youtube, Prime95 | |
| Acer Nitro 5 AN515-46-R1A1 | |
| Medion Erazer Scout E20 | |
| MSI Katana 17 B13VFK | |
| Gigabyte G7 KE | |
| Lenovo Legion 5 15IAH7H 82RB | |
| Asus TUF Gaming A16 FA617 | |
* ... Moindre est la valeur, meilleures sont les performances
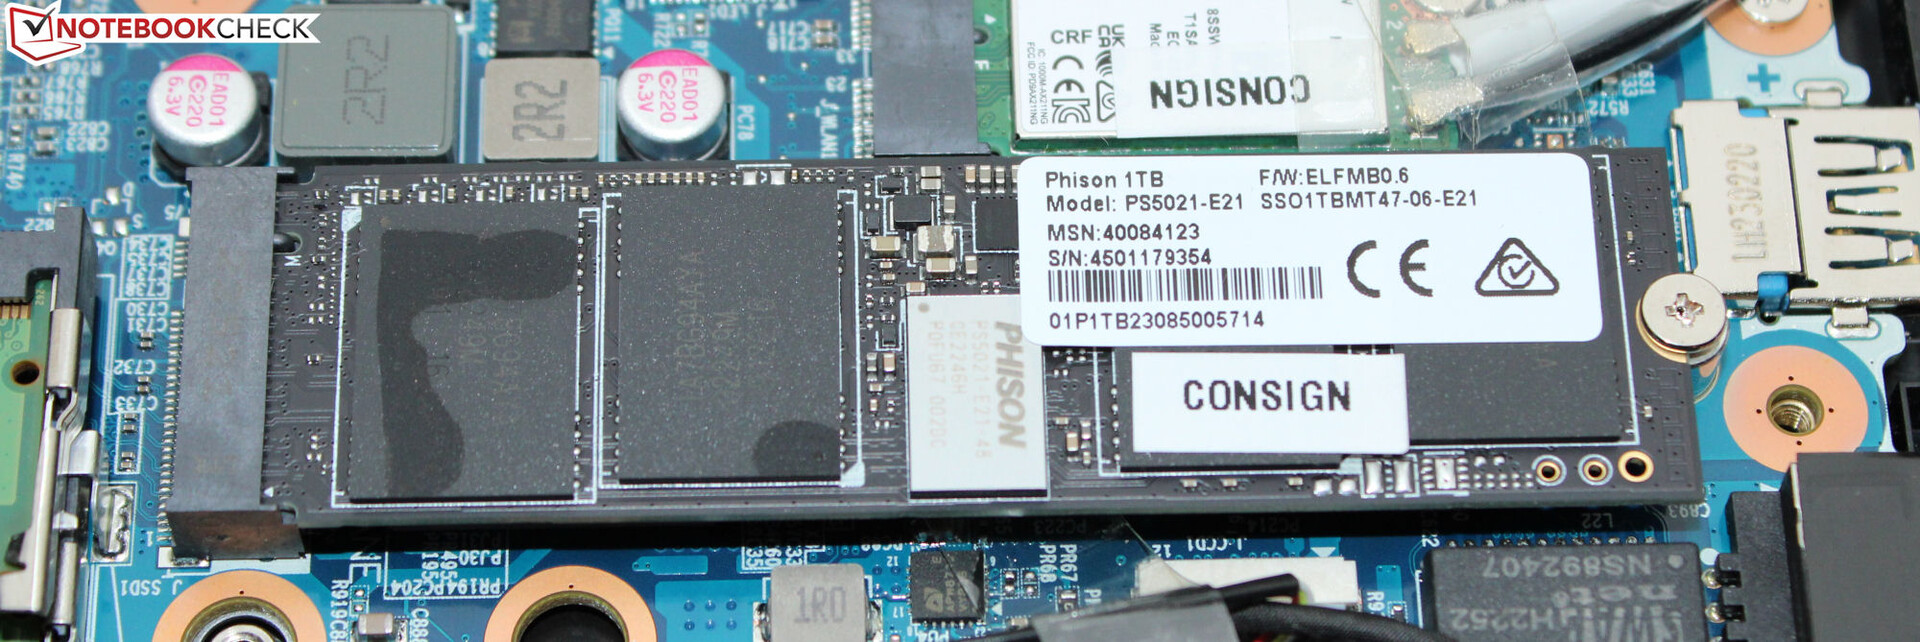
Solution de stockage
Un disque SSD PCIe 4 de 1 To au format M.2-2280 de Phison sert de disque système. Bien qu'il offre de très bons taux de transfert, il ne s'agit pas d'un des meilleurs modèles de disques SSD. Il n'y a pas de baisse de performance due à l'étranglement thermique.
Selon le site web de Medion, il est possible d'étendre la capacité de stockage de l'ordinateur portable en utilisant un support de stockage de 2,5 pouces, mais notre unité de test ne comporte ni les emplacements SATA nécessaires ni le cadre d'insertion.

* ... Moindre est la valeur, meilleures sont les performances
Disk Throttling: DiskSpd Read Loop, Queue Depth 8
Carte graphique
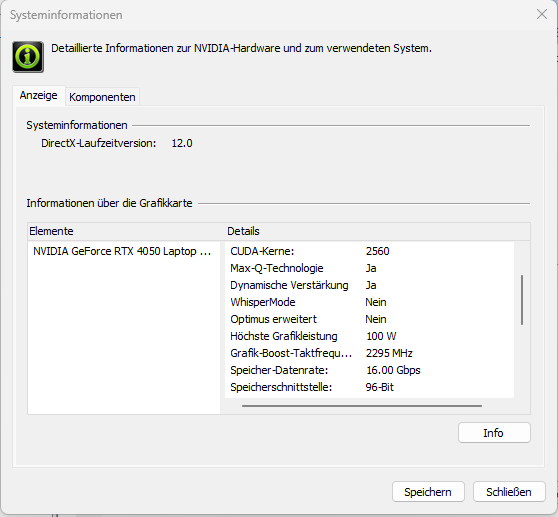
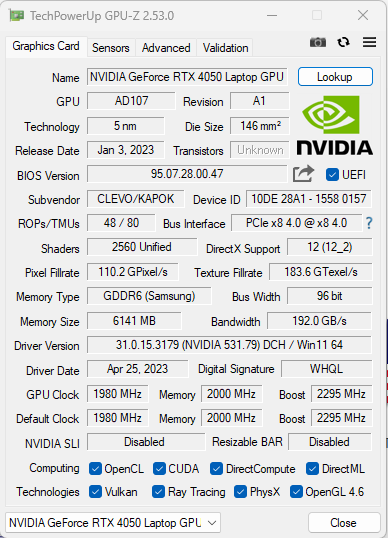
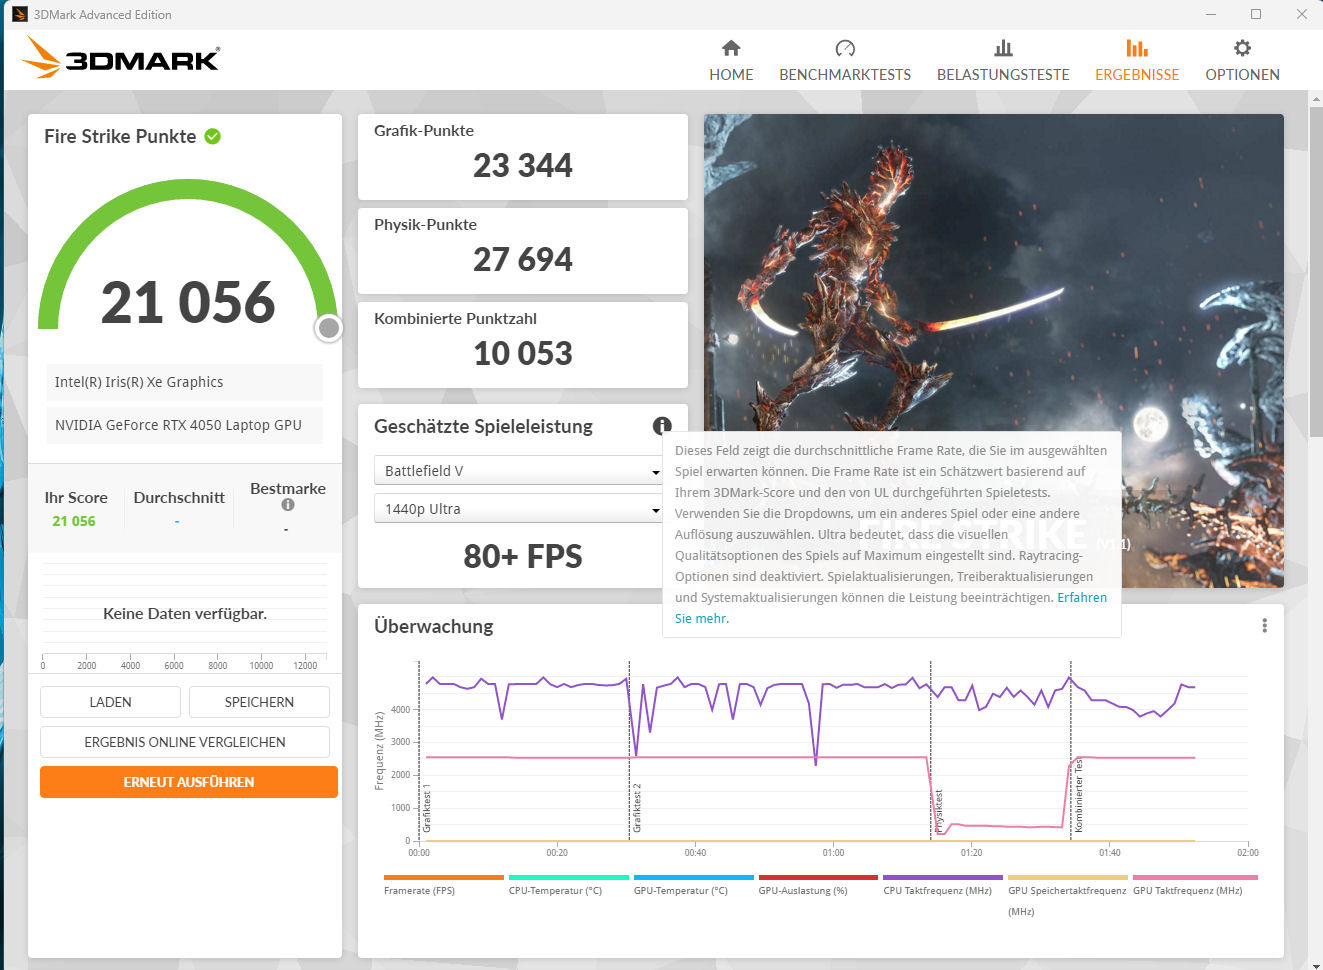
LaGeForce RTX 4050laptop offre 2 560 shaders, un bus de 96 bits et 6 144 Mo de mémoire GDDR6 rapide. Medion lui accorde une puissance maximale de 100 watts. D'après notre test The Witcher 3, le TGP maximum n'est pas entièrement utilisé.
Les résultats des benchmarks sont supérieurs à la moyenne pour la RTX 4050. Les modes Divertissement et Gaming produisent presque les mêmes performances graphiques. La sortie directe d'images via le GPU GeForce n'apporte pas d'augmentation de performance. La commutation entre le mode Optimus et le mode dGPU s'effectue dans le BIOS ou via le Control Center. Le mode Optimus avancé n'est pas pris en charge.
| 3DMark Performance rating - Percent | |
| Moyenne de la classe Gaming | |
| MSI Katana 17 B13VFK | |
| Acer Nitro 5 AN515-46-R1A1 | |
| Asus TUF Gaming A16 FA617 | |
| Medion Erazer Scout E20 | |
| Medion Erazer Scout E20 | |
| Lenovo Legion 5 15IAH7H 82RB -1! | |
| Moyenne NVIDIA GeForce RTX 4050 Laptop GPU | |
| Medion Erazer Scout E20 | |
| Gigabyte G7 KE | |
| 3DMark 11 - 1280x720 Performance GPU | |
| Moyenne de la classe Gaming (21841 - 80022, n=103, 2 dernières années) | |
| Acer Nitro 5 AN515-46-R1A1 | |
| MSI Katana 17 B13VFK | |
| Asus TUF Gaming A16 FA617 | |
| Medion Erazer Scout E20 (Gaming Performance) | |
| Lenovo Legion 5 15IAH7H 82RB | |
| Medion Erazer Scout E20 | |
| Medion Erazer Scout E20 (Lautlosmodus) | |
| Gigabyte G7 KE | |
| Moyenne NVIDIA GeForce RTX 4050 Laptop GPU (13339 - 32642, n=41) | |
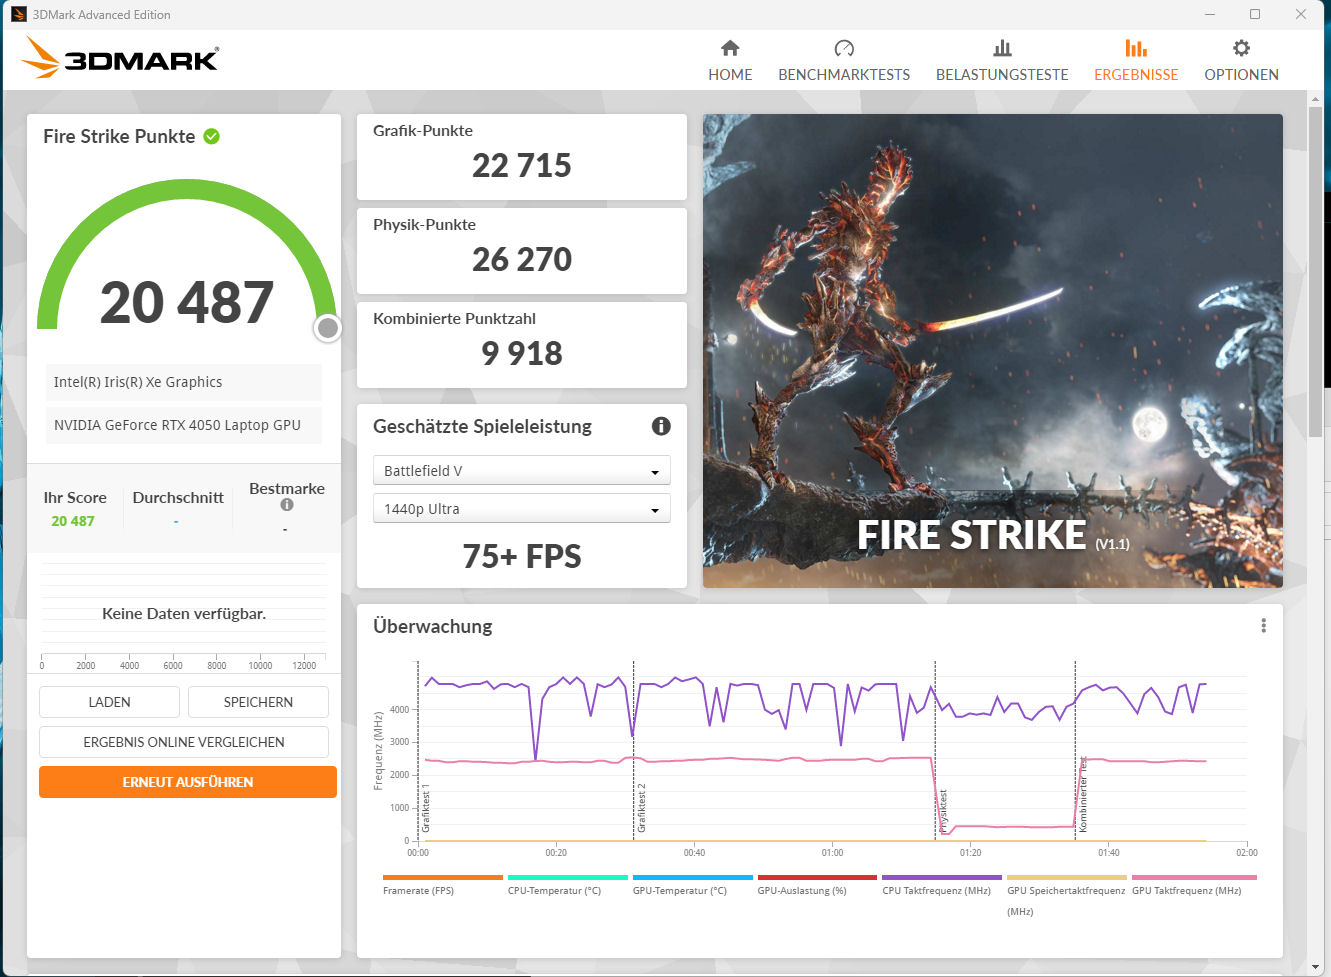
| 3DMark 06 Standard Score | 51372 points | |
| 3DMark 11 Performance | 27315 points | |
| 3DMark Cloud Gate Standard Score | 52998 points | |
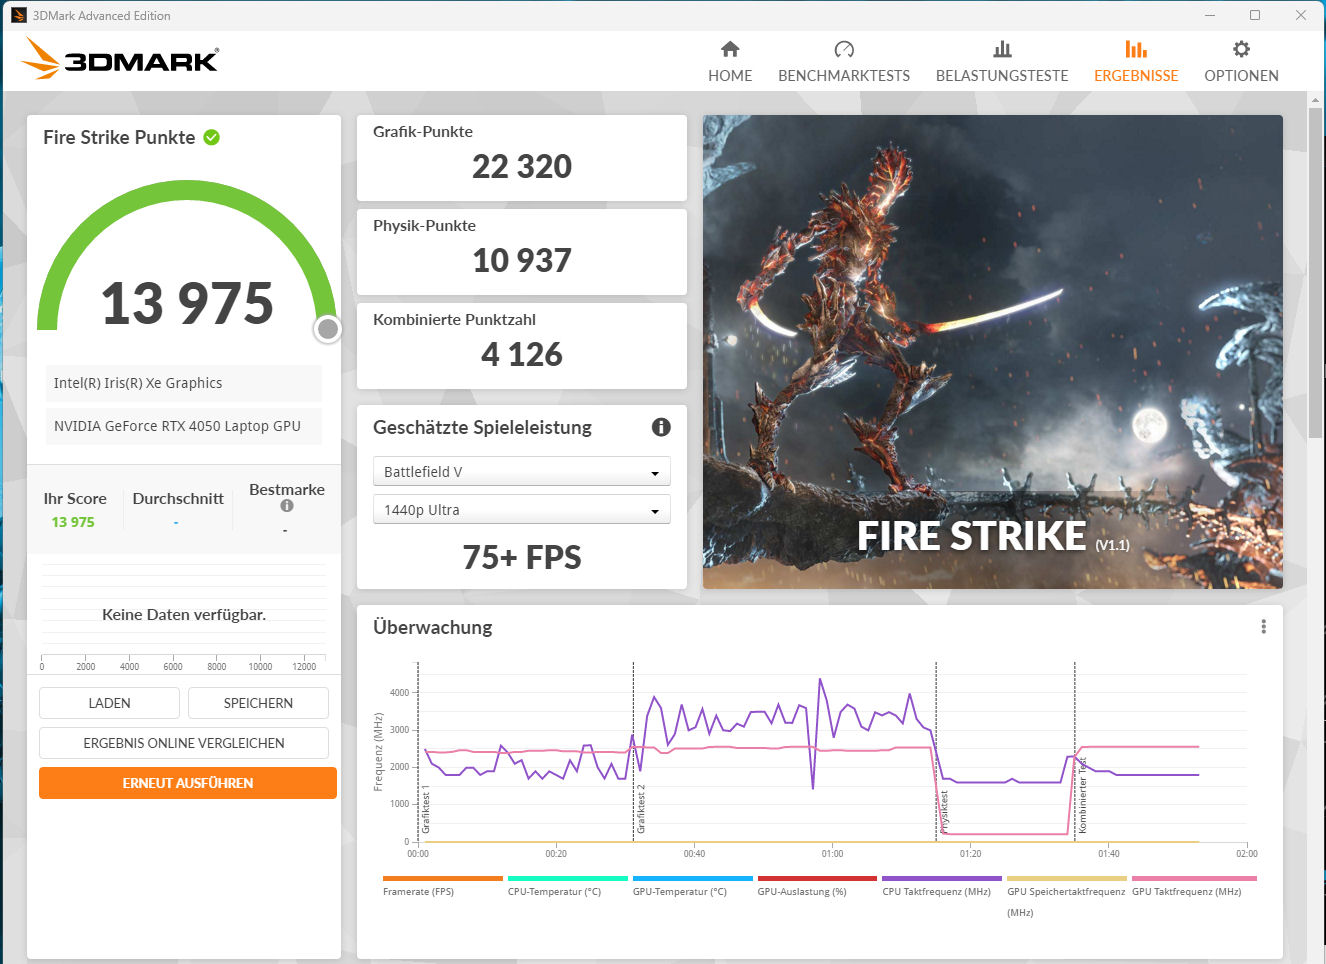
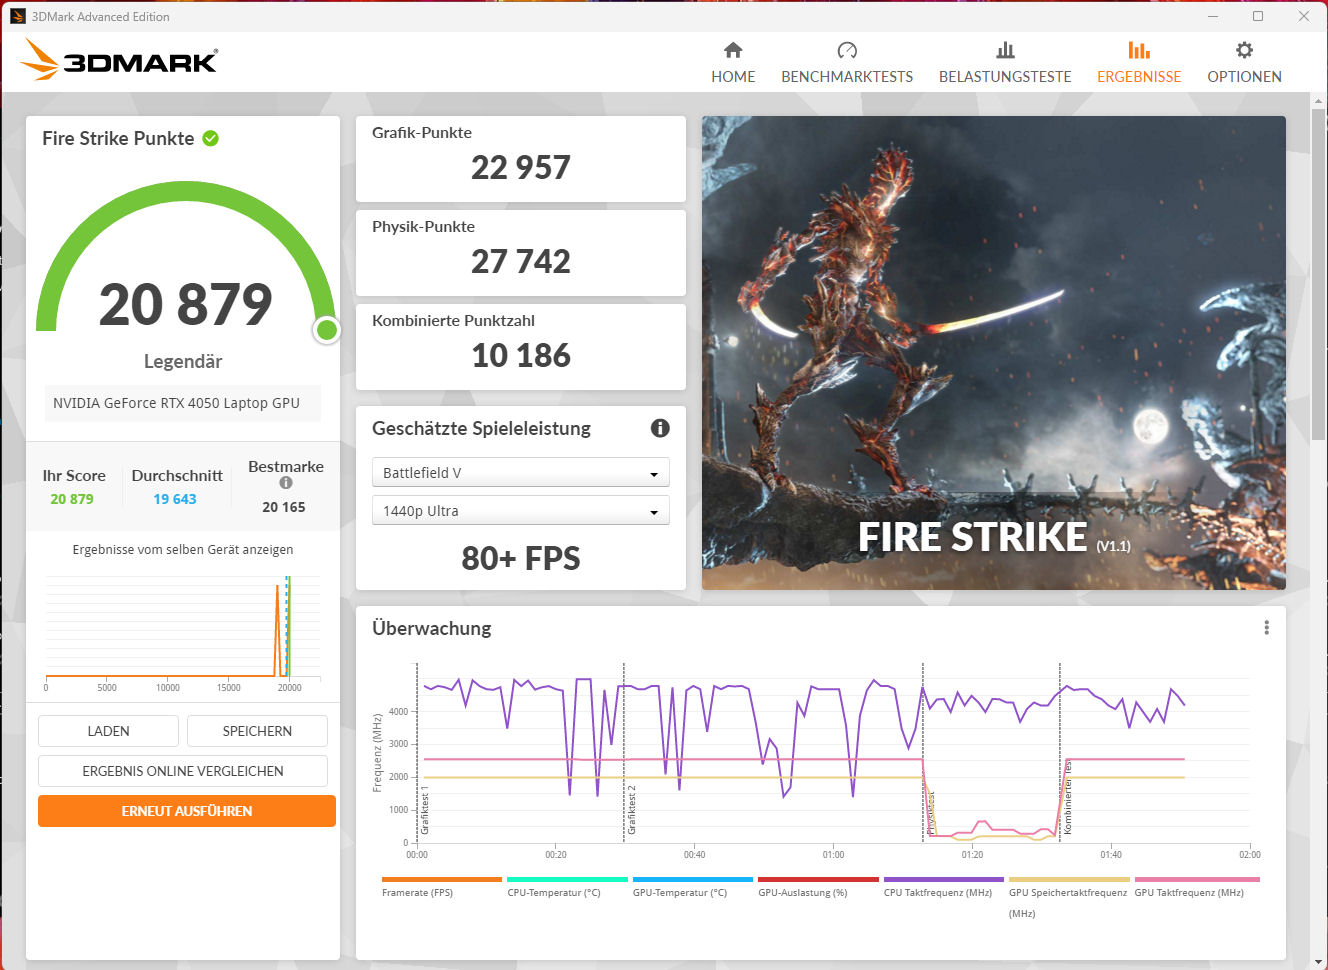
| 3DMark Fire Strike Score | 20487 points | |
| 3DMark Time Spy Score | 8594 points | |
Aide | ||
| Blender | |
| v3.3 Classroom OPTIX/RTX | |
| Gigabyte G7 KE (3.3.2) | |
| Lenovo Legion 5 15IAH7H 82RB (3.3.0) | |
| Medion Erazer Scout E20 (3.3.3) | |
| Medion Erazer Scout E20 (3.3.3, Lautlosmodus) | |
| Moyenne NVIDIA GeForce RTX 4050 Laptop GPU (25 - 37, n=40) | |
| Medion Erazer Scout E20 (3.3.3, Gaming Modus) | |
| Acer Nitro 5 AN515-46-R1A1 (3.3.0) | |
| MSI Katana 17 B13VFK (3.3.3) | |
| Moyenne de la classe Gaming (9 - 32, n=103, 2 dernières années) | |
| v3.3 Classroom CUDA | |
| Moyenne NVIDIA GeForce RTX 4050 Laptop GPU (47 - 68, n=39) | |
| Gigabyte G7 KE (3.3.2) | |
| Medion Erazer Scout E20 (3.3.3) | |
| Medion Erazer Scout E20 (3.3.3, Lautlosmodus) | |
| Lenovo Legion 5 15IAH7H 82RB (3.3.0) | |
| Medion Erazer Scout E20 (3.3.3, Gaming Modus) | |
| MSI Katana 17 B13VFK (3.3.3) | |
| Acer Nitro 5 AN515-46-R1A1 (3.3.0) | |
| Moyenne de la classe Gaming (15 - 228, n=103, 2 dernières années) | |
| Geekbench 5.5 - OpenCL Score | |
| Moyenne de la classe Gaming (80702 - 277970, n=98, 2 dernières années) | |
| Acer Nitro 5 AN515-46-R1A1 | |
| Gigabyte G7 KE | |
| Lenovo Legion 5 15IAH7H 82RB | |
| MSI Katana 17 B13VFK | |
| Medion Erazer Scout E20 (Gaming Modus) | |
| Medion Erazer Scout E20 (Lautlosmodus) | |
| Medion Erazer Scout E20 | |
| Moyenne NVIDIA GeForce RTX 4050 Laptop GPU (63538 - 90075, n=38) | |
| Asus TUF Gaming A16 FA617 | |
| Geekbench 6.0 - GPU OpenCL 6.0 | |
| Moyenne de la classe Gaming (155885 - 241981, n=3, 2 dernières années) | |
| Medion Erazer Scout E20 | |
| Moyenne NVIDIA GeForce RTX 4050 Laptop GPU (66574 - 84452, n=13) | |
| V-Ray 5 Benchmark | |
| GPU RTX | |
| Moyenne de la classe Gaming (1524 - 4363, n=29, 2 dernières années) | |
| Acer Nitro 5 AN515-46-R1A1 (5.0.1) | |
| Medion Erazer Scout E20 (5.0.1, Gaming Modus) | |
| Medion Erazer Scout E20 (5.0.1) | |
| Moyenne NVIDIA GeForce RTX 4050 Laptop GPU (618 - 1588, n=24) | |
| Medion Erazer Scout E20 (5.0.1, Lautlosmodus) | |
| Gigabyte G7 KE (5.0.1) | |
| GPU CUDA | |
| Moyenne de la classe Gaming (1202 - 3288, n=29, 2 dernières années) | |
| Acer Nitro 5 AN515-46-R1A1 (5.0.1) | |
| Medion Erazer Scout E20 (5.0.1, Gaming Modus) | |
| Medion Erazer Scout E20 (5.0.1, Lautlosmodus) | |
| Medion Erazer Scout E20 (5.0.1) | |
| Moyenne NVIDIA GeForce RTX 4050 Laptop GPU (735 - 1202, n=24) | |
| Gigabyte G7 KE (5.0.1) | |
| CPU | |
| Moyenne de la classe Gaming (5864 - 30302, n=28, 2 dernières années) | |
| Lenovo Legion 5 15IAH7H 82RB (5.0.1) | |
| Medion Erazer Scout E20 (5.0.1, Gaming Modus) | |
| Moyenne NVIDIA GeForce RTX 4050 Laptop GPU (3562 - 14401, n=24) | |
| Medion Erazer Scout E20 (5.0.1) | |
| Acer Nitro 5 AN515-46-R1A1 (5.0.1) | |
| Gigabyte G7 KE (5.0.1) | |
| Medion Erazer Scout E20 (5.0.1, Lautlosmodus) | |
| V-Ray Benchmark Next 4.10 | |
| GPU | |
| Moyenne de la classe Gaming (427 - 1627, n=96, 2 dernières années) | |
| MSI Katana 17 B13VFK (v4.10.07 ) | |
| Acer Nitro 5 AN515-46-R1A1 (v4.10.07 ) | |
| Medion Erazer Scout E20 (v4.10.07, Gaming Modus) | |
| Medion Erazer Scout E20 (v4.10.07, Lautlosmodus) | |
| Medion Erazer Scout E20 (v4.10.07 ) | |
| Moyenne NVIDIA GeForce RTX 4050 Laptop GPU (333 - 565, n=35) | |
| Gigabyte G7 KE (v4.10.07 ) | |
| Asus TUF Gaming A16 FA617 (v4.10.07 ) | |
| CPU | |
| Moyenne de la classe Gaming (10048 - 45327, n=94, 2 dernières années) | |
| Medion Erazer Scout E20 (v4.10.07, Gaming Modus) | |
| MSI Katana 17 B13VFK (v4.10.07 ) | |
| Medion Erazer Scout E20 (v4.10.07 ) | |
| Moyenne NVIDIA GeForce RTX 4050 Laptop GPU (5413 - 24181, n=35) | |
| Asus TUF Gaming A16 FA617 (v4.10.07 ) | |
| Gigabyte G7 KE (v4.10.07 ) | |
| Acer Nitro 5 AN515-46-R1A1 (v4.10.07 ) | |
| Medion Erazer Scout E20 (v4.10.07, Lautlosmodus) | |
* ... Moindre est la valeur, meilleures sont les performances
Performance des jeux
Le Scout est configuré pour les jeux en FHD avec des paramètres élevés à maximaux. Le "Silent mode" permet de jouer avec un faible bruit de fonctionnement, mais vous devez réduire votre résolution et vos paramètres en conséquence. L'ordinateur portable atteint des taux de rafraîchissement supérieurs (mode jeu, mode divertissement) et inférieurs (mode silencieux) à la moyenne que nous avons déterminée jusqu'à présent pour la RTX 4050. Selon le jeu, la sortie directe de l'image via le GPU GeForce peut conduire à une augmentation minime des taux d'images.
| Performance rating - Percent | |
| Moyenne de la classe Gaming | |
| MSI Katana 17 B13VFK | |
| Lenovo Legion 5 15IAH7H 82RB | |
| Medion Erazer Scout E20 | |
| Medion Erazer Scout E20 | |
| Acer Nitro 5 AN515-46-R1A1 | |
| Gigabyte G7 KE | |
| Moyenne NVIDIA GeForce RTX 4050 Laptop GPU | |
| Asus TUF Gaming A16 FA617 | |
| Medion Erazer Scout E20 | |
| The Witcher 3 - 1920x1080 Ultra Graphics & Postprocessing (HBAO+) | |
| Moyenne de la classe Gaming (104.7 - 240, n=7, 2 dernières années) | |
| Acer Nitro 5 AN515-46-R1A1 | |
| MSI Katana 17 B13VFK | |
| Asus TUF Gaming A16 FA617 | |
| Lenovo Legion 5 15IAH7H 82RB | |
| Medion Erazer Scout E20 (Gaming Modus) | |
| Medion Erazer Scout E20 | |
| Gigabyte G7 KE | |
| Medion Erazer Scout E20 (Lautlosmodus) | |
| Moyenne NVIDIA GeForce RTX 4050 Laptop GPU (18.5 - 94.7, n=40) | |
| GTA V - 1920x1080 Highest AA:4xMSAA + FX AF:16x | |
| Moyenne de la classe Gaming (67.1 - 186.9, n=90, 2 dernières années) | |
| MSI Katana 17 B13VFK | |
| Lenovo Legion 5 15IAH7H 82RB | |
| Gigabyte G7 KE | |
| Medion Erazer Scout E20 (Gaming Modus) | |
| Medion Erazer Scout E20 | |
| Acer Nitro 5 AN515-46-R1A1 | |
| Asus TUF Gaming A16 FA617 | |
| Moyenne NVIDIA GeForce RTX 4050 Laptop GPU (14.9 - 101.7, n=35) | |
| Medion Erazer Scout E20 (Lautlosmodus) | |
| Final Fantasy XV Benchmark - 1920x1080 High Quality | |
| Moyenne de la classe Gaming (64.2 - 215, n=91, 2 dernières années) | |
| Acer Nitro 5 AN515-46-R1A1 (1.3) | |
| Lenovo Legion 5 15IAH7H 82RB (1.3) | |
| MSI Katana 17 B13VFK (1.3) | |
| Gigabyte G7 KE (1.3) | |
| Medion Erazer Scout E20 (1.3) | |
| Medion Erazer Scout E20 (1.3, Gaming Modus) | |
| Asus TUF Gaming A16 FA617 (1.3) | |
| Moyenne NVIDIA GeForce RTX 4050 Laptop GPU (15.5 - 122.3, n=39) | |
| Medion Erazer Scout E20 (1.3, Lautlosmodus) | |
| Strange Brigade - 1920x1080 ultra AA:ultra AF:16 | |
| Moyenne de la classe Gaming (113.6 - 458, n=83, 2 dernières années) | |
| MSI Katana 17 B13VFK (1.47.22.14 D3D12) | |
| Acer Nitro 5 AN515-46-R1A1 (1.47.22.14 D3D12) | |
| Lenovo Legion 5 15IAH7H 82RB (1.47.22.14 D3D12) | |
| Asus TUF Gaming A16 FA617 (1.47.22.14 D3D12) | |
| Medion Erazer Scout E20 (1.47.22.14 D3D12, Gaming Modus) | |
| Gigabyte G7 KE (1.47.22.14 D3D12) | |
| Medion Erazer Scout E20 (1.47.22.14 D3D12) | |
| Medion Erazer Scout E20 (1.47.22.14 D3D12, Lautlosmodus) | |
| Moyenne NVIDIA GeForce RTX 4050 Laptop GPU (21.2 - 156.6, n=38) | |
| Dota 2 Reborn - 1920x1080 ultra (3/3) best looking | |
| MSI Katana 17 B13VFK | |
| Moyenne de la classe Gaming (84.8 - 252, n=104, 2 dernières années) | |
| Lenovo Legion 5 15IAH7H 82RB | |
| Medion Erazer Scout E20 (Gaming Modus) | |
| Medion Erazer Scout E20 | |
| Gigabyte G7 KE | |
| Moyenne NVIDIA GeForce RTX 4050 Laptop GPU (73.5 - 175.6, n=39) | |
| Asus TUF Gaming A16 FA617 | |
| Acer Nitro 5 AN515-46-R1A1 | |
| Medion Erazer Scout E20 (Lautlosmodus) | |
| X-Plane 11.11 - 1920x1080 high (fps_test=3) | |
| MSI Katana 17 B13VFK | |
| Medion Erazer Scout E20 (Gaming Modus) | |
| Lenovo Legion 5 15IAH7H 82RB | |
| Medion Erazer Scout E20 | |
| Moyenne de la classe Gaming (55.5 - 148.5, n=106, 2 dernières années) | |
| Moyenne NVIDIA GeForce RTX 4050 Laptop GPU (55.5 - 117, n=40) | |
| Gigabyte G7 KE | |
| Acer Nitro 5 AN515-46-R1A1 | |
| Medion Erazer Scout E20 (Lautlosmodus) | |
| Asus TUF Gaming A16 FA617 | |
Afin d'évaluer si les fréquences d'images restent dans une large mesure constantes sur une période de temps plus longue, nous avons lancé le jeu "The Witcher 3" pendant environ 60 minutes en résolution Full-HD et avec les paramètres de qualité maximum. Le personnage du jeu n'est pas déplacé pendant cette période. Ce n'est que lorsque le "mode silencieux" est activé que l'on constate une diminution du nombre d'images par seconde.
The Witcher 3 FPS Chart
| Bas | Moyen | Élevé | Ultra | |
|---|---|---|---|---|
| GTA V (2015) | 184.8 | 180.1 | 172.4 | 94.2 |
| The Witcher 3 (2015) | 382.6 | 265.3 | 150.9 | 83.4 |
| Dota 2 Reborn (2015) | 177.6 | 160.3 | 150.3 | 142.5 |
| Final Fantasy XV Benchmark (2018) | 187.5 | 116.9 | 82.6 | |
| X-Plane 11.11 (2018) | 153.9 | 132.7 | 104.4 | |
| Far Cry 5 (2018) | 172 | 136 | 126 | 119 |
| Strange Brigade (2018) | 447 | 206 | 166.5 | 144 |
| Gears Tactics (2020) | 341.6 | 204.1 | 133.9 | 96.7 |
| Death Stranding (2020) | 174.8 | 140.5 | 132 | 128.8 |
| Assassin´s Creed Valhalla (2020) | 184 | 117 | 92 | 70 |
| Immortals Fenyx Rising (2020) | 171 | 112 | 101 | 93 |
| Mass Effect Legendary Edition (2021) | 150.1 | 135.1 | ||
| Far Cry 6 (2021) | 153.2 | 125.3 | 107.3 | 76.7 |
| Back 4 Blood (2021) | 332 | 221 | 166.1 | 155.3 |
| Guardians of the Galaxy (2021) | 144 | 120 | 119 | 113 |
| Riders Republic (2021) | 164 | 131 | 107 | 96 |
| Halo Infinite (2021) | 122.8 | 104.6 | 85.9 | |
| Rainbow Six Extraction (2022) | 208 | 166 | 159 | 125 |
| GRID Legends (2022) | 206.2 | 171.4 | 140.9 | 109.8 |
| Elex 2 (2022) | 116.3 | 115.7 | 103.4 | 81.4 |
| F1 22 (2022) | 215 | 197.2 | 152.3 | 52.5 |
| Uncharted Legacy of Thieves Collection (2022) | 75.1 | 71.1 | 67.2 | 62.6 |
| Dead Island 2 (2023) | 196 | 171.7 | 133.1 | 120.6 |
| Star Wars Jedi Survivor (2023) | 99.2 | 86.3 | 62.9 | 49.4 |
| Anno 117: Pax Romana (2025) | 83.6 | 64 | 47.8 | 26.2 |
| Forza Horizon 6 (2026) | 147 | 96 | 50 | 18 |
Émissions - L'Erazer Scout chauffe à peine
Niveaux de bruit
Les profils de performance ont une forte influence sur l'évolution du bruit de l'ordinateur portable. Lorsque vous jouez, le mode "Gaming" produit un niveau sonore d'environ 57 dB(A), et lorsque le mode "Entertainment" est sélectionné, le niveau est sensiblement plus bas, à 50 dB(A). Dans les deux cas, les valeurs sont trop élevées. Le CPU et le GPU devraient être suffisamment refroidis même avec des ventilateurs plus lents, et Medion a encore du travail à faire pour mettre à jour le contrôle des ventilateurs.
Les deux autres modes sont nettement plus conviviaux, puisqu'ils permettent au E20 de fonctionner plus silencieusement. Même si le mode silencieux ne tient pas ses promesses, il permet de jouer à un faible niveau de bruit. Par exemple, l'ordinateur portable passe notre test The Witcher 3 à environ 34 dB(A).
En mode veille ou en utilisation quotidienne (bureautique, Internet), l'ordinateur portable fonctionne souvent silencieusement, et parfois même sans bruit. D'un autre côté, les ventilateurs s'emballent parfois inutilement (ce qui est un phénomène typique des barebones de Clevo).
Degré de la nuisance sonore
| Au repos |
| 26 / 27 / 32 dB(A) |
| Fortement sollicité |
| 57 / 57 dB(A) |
 | ||
30 dB silencieux 40 dB(A) audible 50 dB(A) bruyant |
||
min: | ||
| Medion Erazer Scout E20 i7-13700H, GeForce RTX 4050 Laptop GPU | Gigabyte G7 KE i5-12500H, GeForce RTX 3060 Laptop GPU | MSI Katana 17 B13VFK i7-13620H, GeForce RTX 4060 Laptop GPU | Asus TUF Gaming A16 FA617 R7 7735HS, Radeon RX 7600S | Lenovo Legion 5 15IAH7H 82RB i7-12700H, GeForce RTX 3060 Laptop GPU | Acer Nitro 5 AN515-46-R1A1 R7 6800H, GeForce RTX 3070 Ti Laptop GPU | |
|---|---|---|---|---|---|---|
| Noise | -10% | -1% | 10% | 14% | -3% | |
| arrêt / environnement * (dB) | 25 | 27 -8% | 24.5 2% | 24 4% | 23.3 7% | 25 -0% |
| Idle Minimum * (dB) | 26 | 27 -4% | 24.5 6% | 24 8% | 23.5 10% | 25 4% |
| Idle Average * (dB) | 27 | 35 -30% | 24.5 9% | 25 7% | 23.5 13% | 28.6 -6% |
| Idle Maximum * (dB) | 32 | 38 -19% | 40 -25% | 28 12% | 26.8 16% | 44.3 -38% |
| Load Average * (dB) | 57 | 52 9% | 48.3 15% | 42 26% | 29.3 49% | 47.6 16% |
| Witcher 3 ultra * (dB) | 50 | 56 -12% | 56 -12% | 50 -0% | 51.4 -3% | |
| Load Maximum * (dB) | 57 | 59 -4% | 59.1 -4% | 50 12% | 53 7% | 53.6 6% |
* ... Moindre est la valeur, meilleures sont les performances
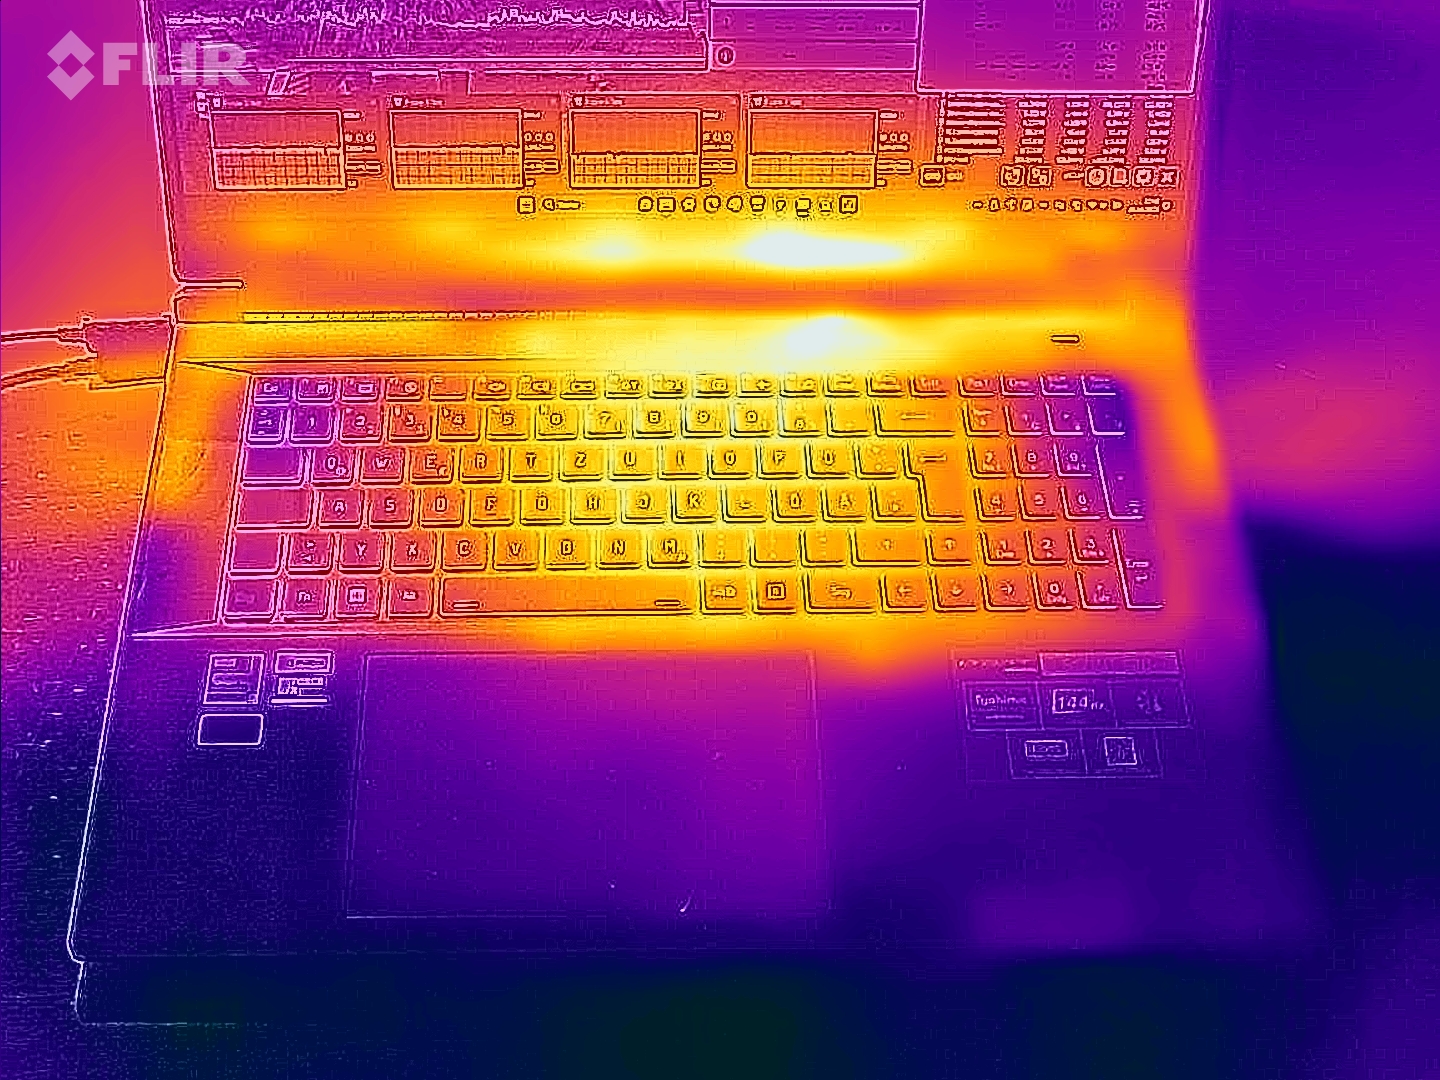
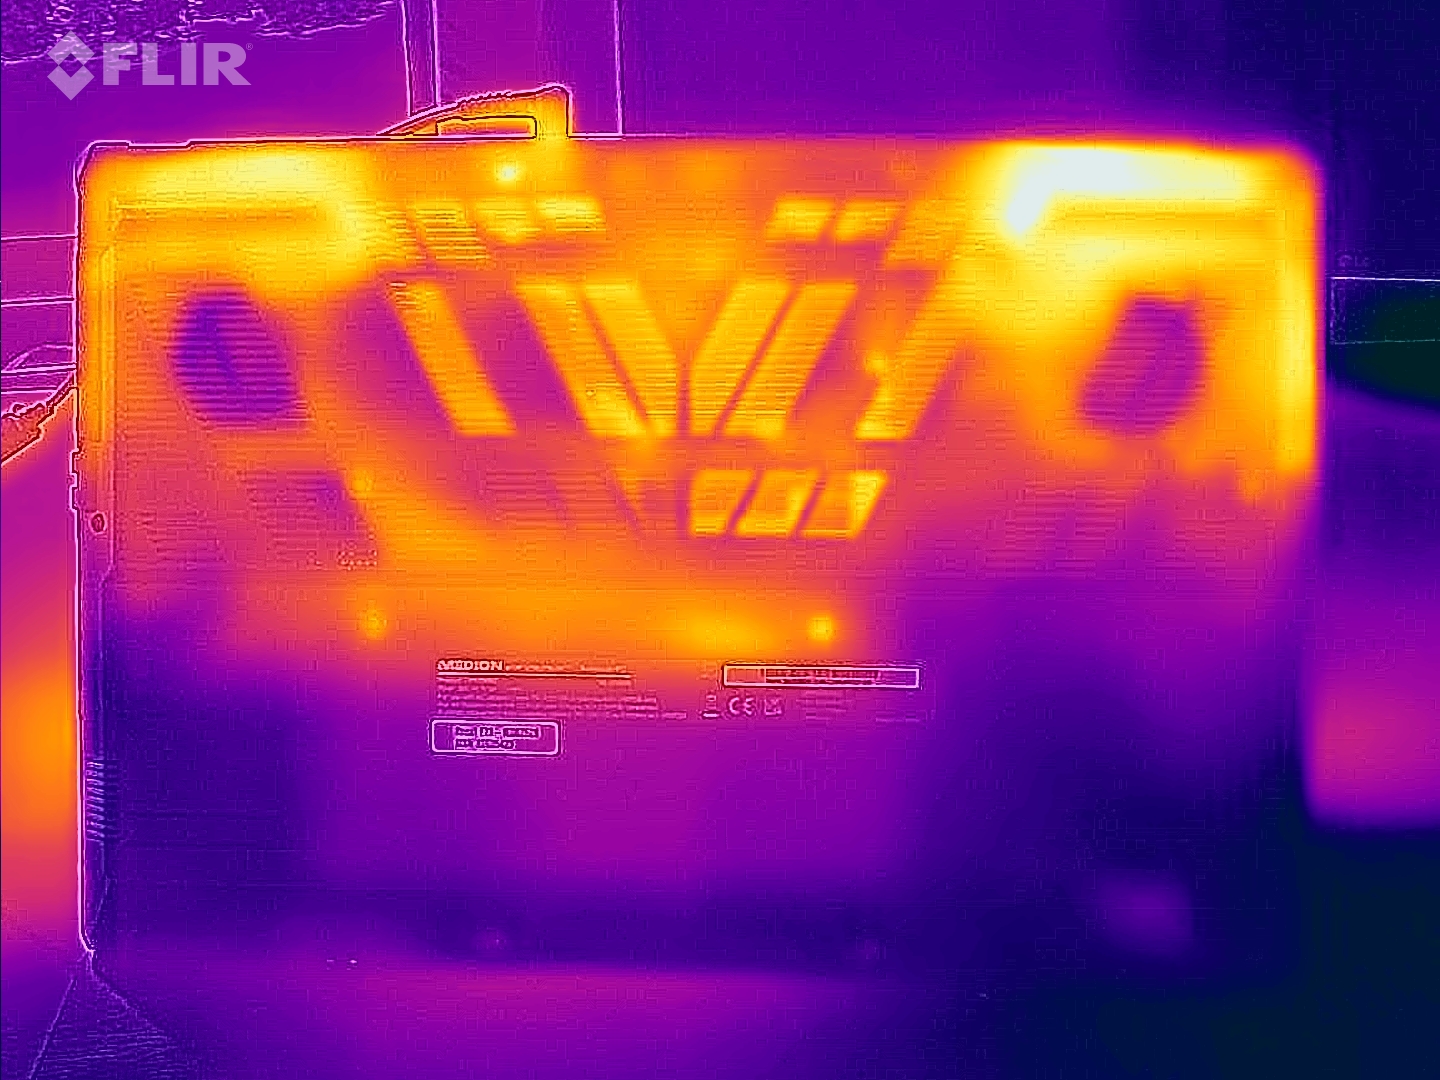
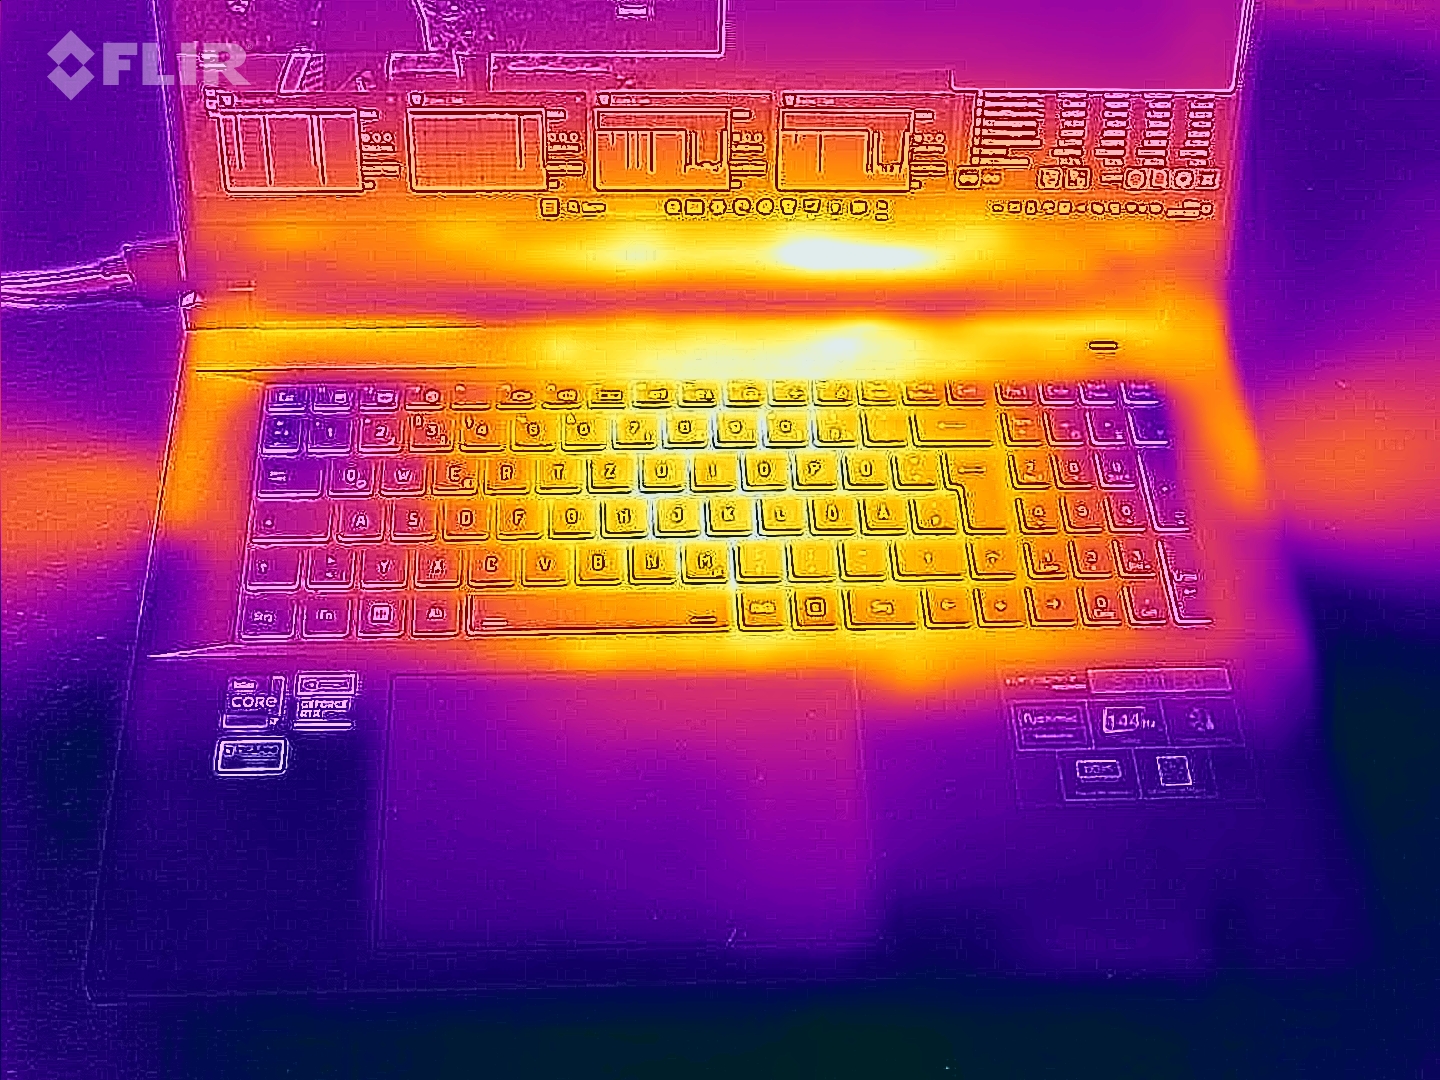
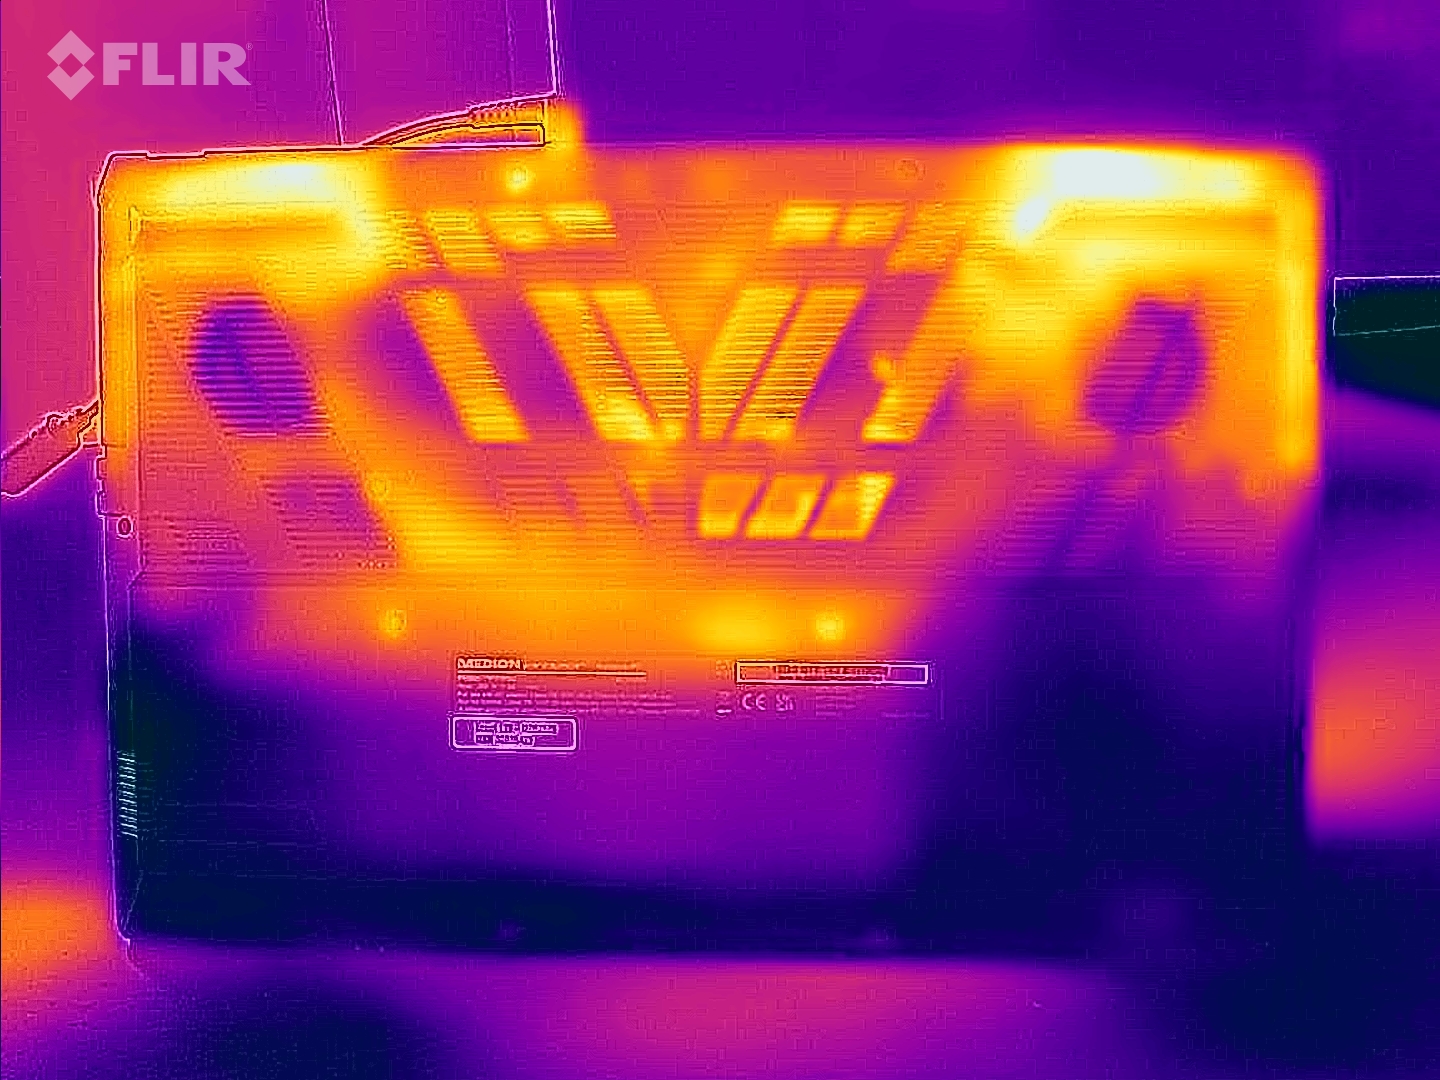
Températures
L'ordinateur portable chauffe modérément tout au plus. La température la plus élevée est atteinte lors du test de stress, avec 41 °C en un seul point de mesure. Au quotidien, les températures restent dans la fourchette verte.
(±) La température maximale du côté supérieur est de 41 °C / 106 F, par rapport à la moyenne de 40.4 °C / 105 F, allant de 21.2 à 68.8 °C pour la classe Gaming.
(+) Le fond chauffe jusqu'à un maximum de 39 °C / 102 F, contre une moyenne de 43.2 °C / 110 F
(+) En utilisation inactive, la température moyenne du côté supérieur est de 26.8 °C / 80 F, par rapport à la moyenne du dispositif de 33.9 °C / 93 F.
(±) En jouant à The Witcher 3, la température moyenne du côté supérieur est de 34.1 °C / 93 F, alors que la moyenne de l'appareil est de 33.9 °C / 93 F.
(+) Les repose-poignets et le pavé tactile sont plus froids que la température de la peau avec un maximum de 26 °C / 78.8 F et sont donc froids au toucher.
(+) La température moyenne de la zone de l'appui-paume de dispositifs similaires était de 28.8 °C / 83.8 F (+2.8 °C / #5 F).
| Medion Erazer Scout E20 Intel Core i7-13700H, NVIDIA GeForce RTX 4050 Laptop GPU | Gigabyte G7 KE Intel Core i5-12500H, NVIDIA GeForce RTX 3060 Laptop GPU | MSI Katana 17 B13VFK Intel Core i7-13620H, NVIDIA GeForce RTX 4060 Laptop GPU | Asus TUF Gaming A16 FA617 AMD Ryzen 7 7735HS, AMD Radeon RX 7600S | Lenovo Legion 5 15IAH7H 82RB Intel Core i7-12700H, NVIDIA GeForce RTX 3060 Laptop GPU | Acer Nitro 5 AN515-46-R1A1 AMD Ryzen 7 6800H, NVIDIA GeForce RTX 3070 Ti Laptop GPU | |
|---|---|---|---|---|---|---|
| Heat | -16% | -10% | -30% | -1% | -13% | |
| Maximum Upper Side * (°C) | 41 | 52 -27% | 41.6 -1% | 54 -32% | 37.8 8% | 48.1 -17% |
| Maximum Bottom * (°C) | 39 | 54 -38% | 43.1 -11% | 47 -21% | 51 -31% | 49.7 -27% |
| Idle Upper Side * (°C) | 31 | 28 10% | 32 -3% | 40 -29% | 25.8 17% | 30 3% |
| Idle Bottom * (°C) | 29 | 32 -10% | 35.8 -23% | 40 -38% | 28.8 1% | 31.7 -9% |
* ... Moindre est la valeur, meilleures sont les performances
Test de stress
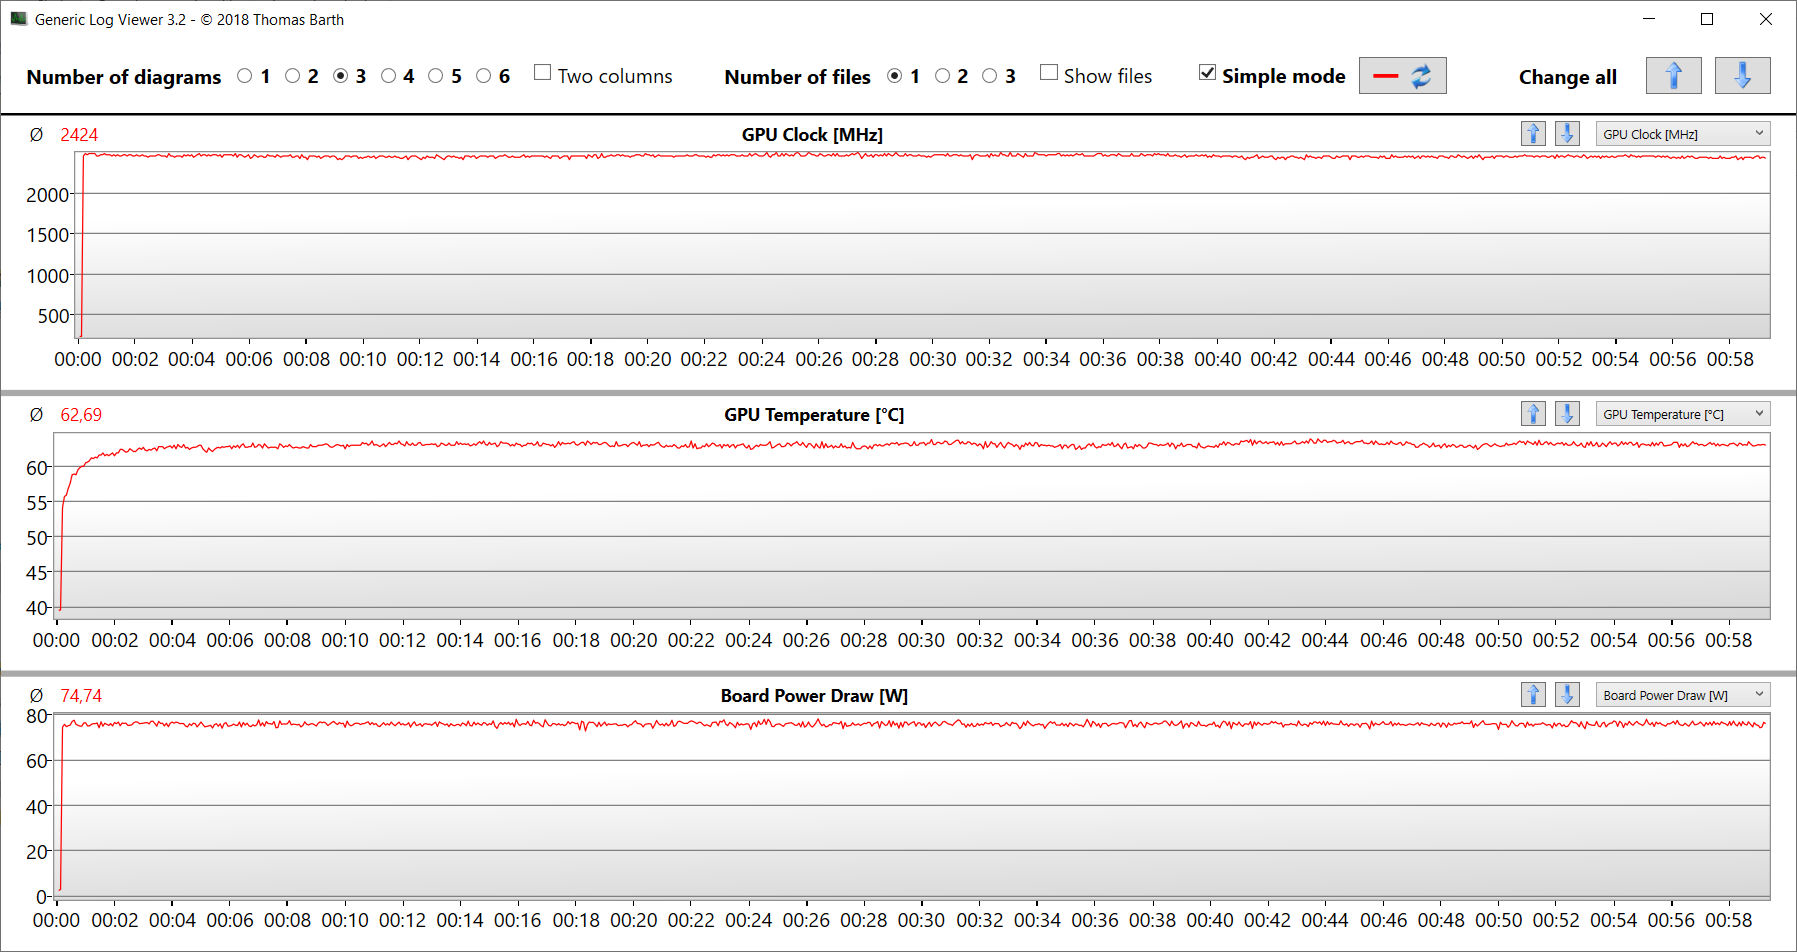
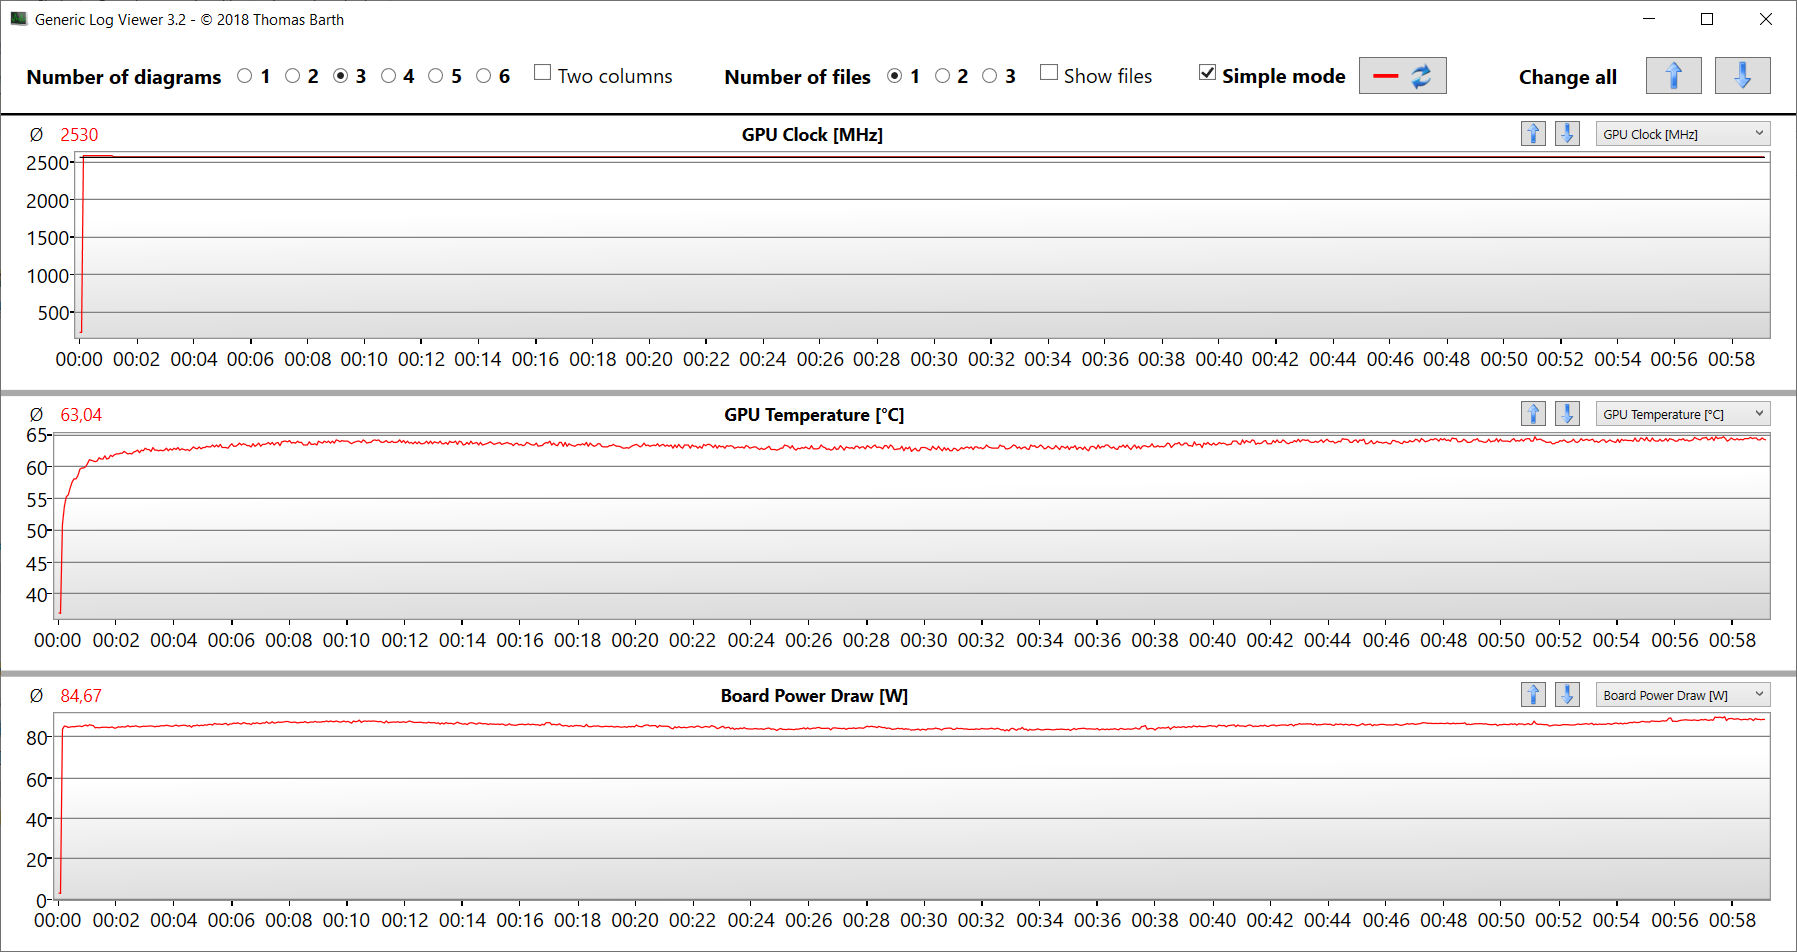
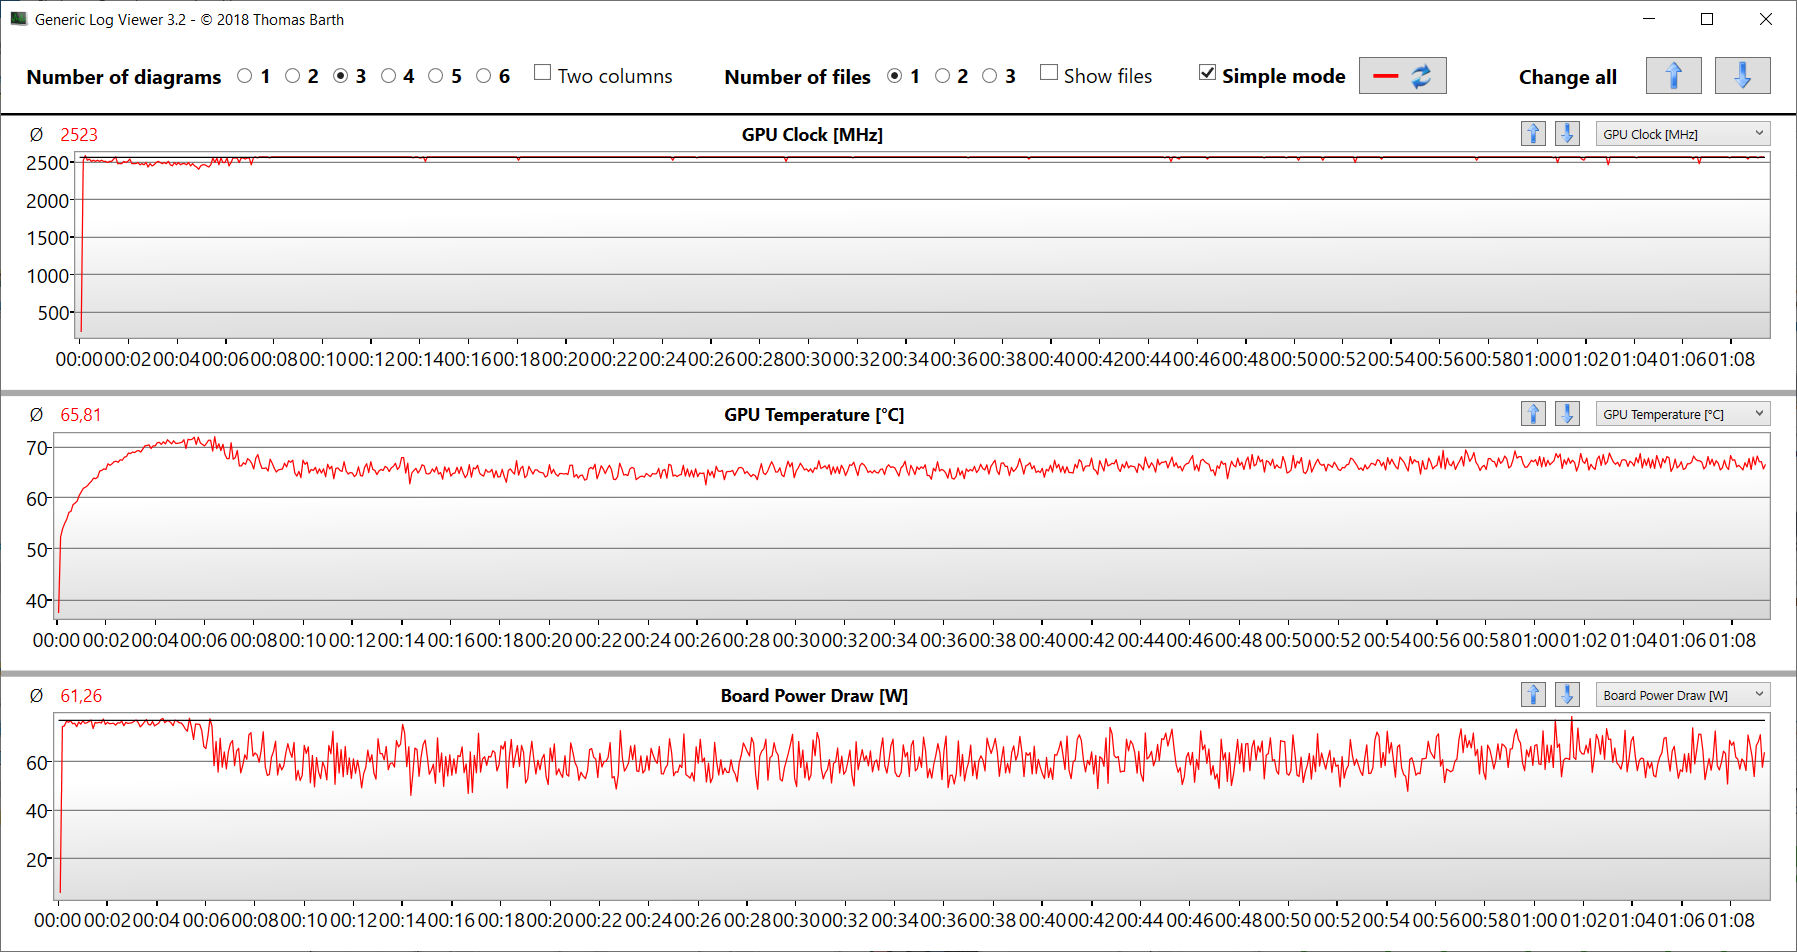
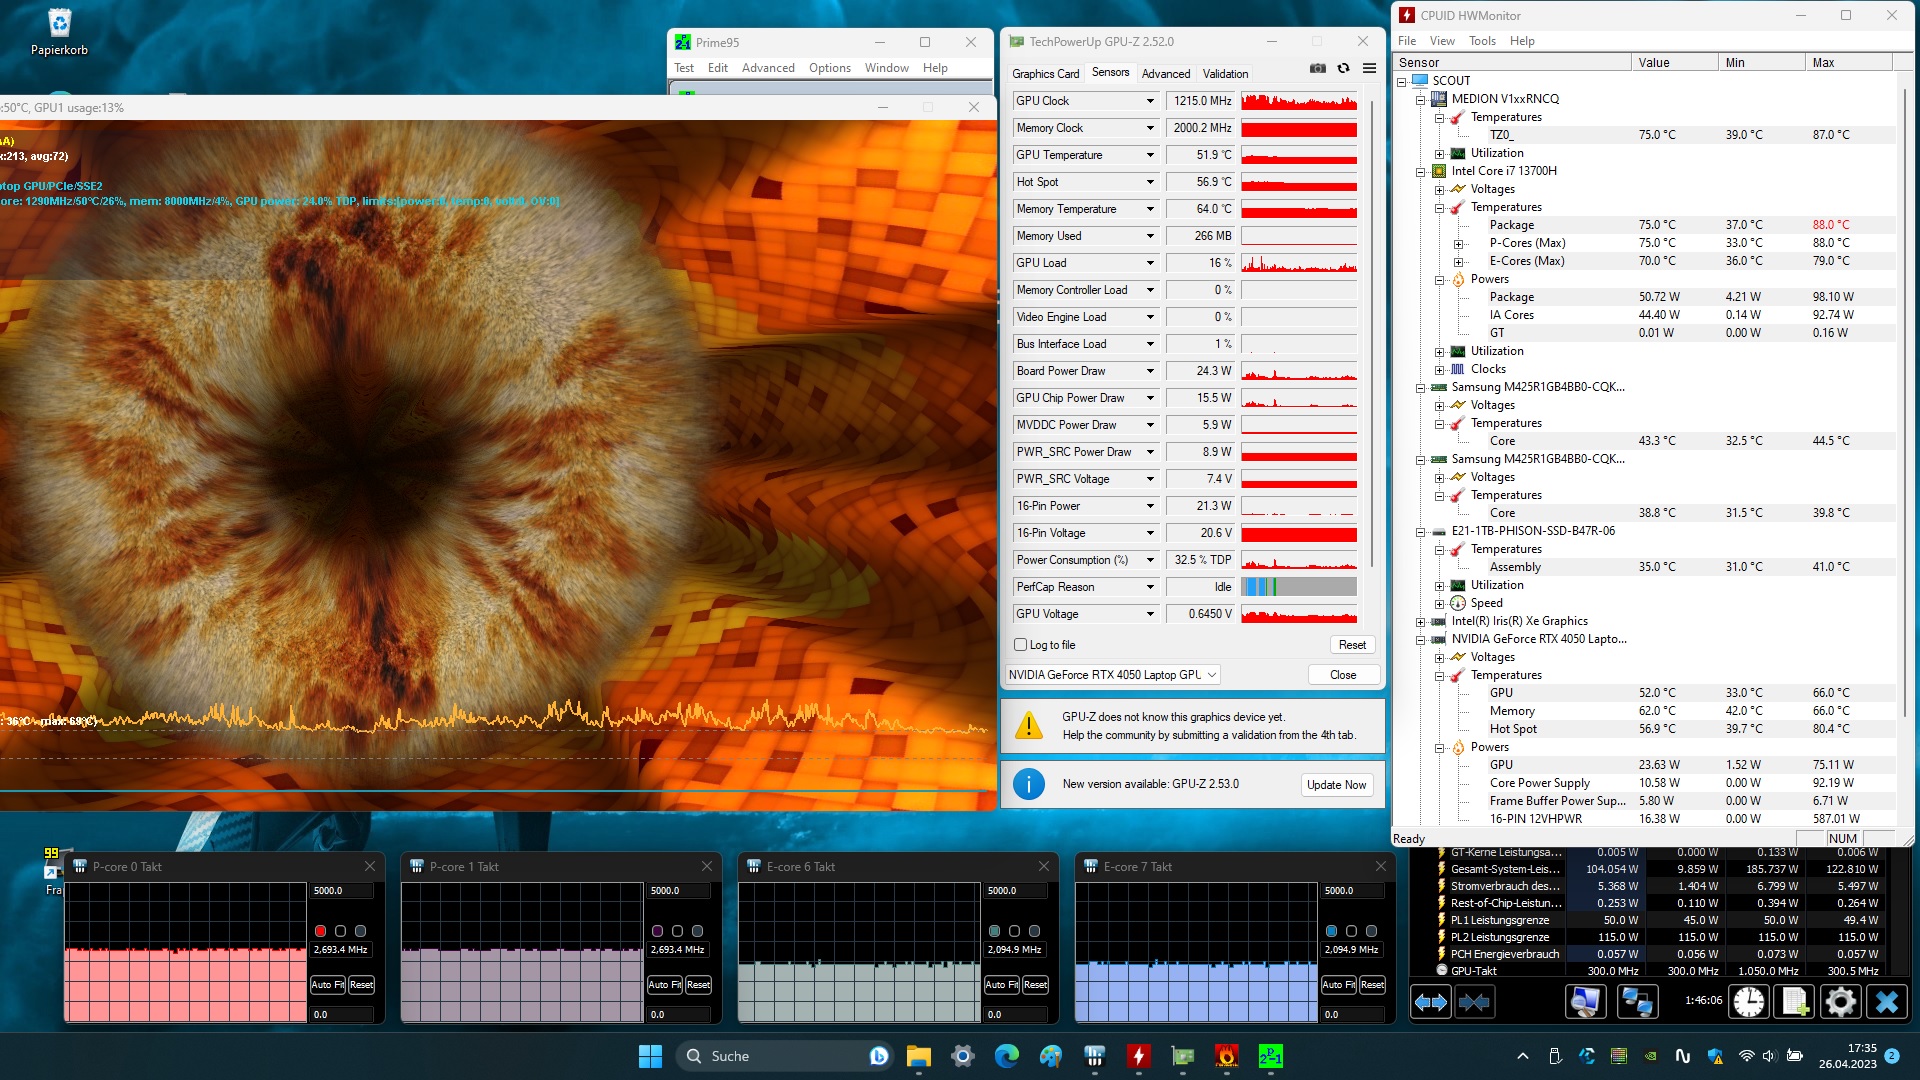
Le test de stress (avec Prime95 et Furmark fonctionnant en permanence) représente un scénario extrême que nous utilisons pour évaluer la stabilité du système à pleine charge. Le CPU commence le test avec des vitesses d'horloge moyennes à élevées (P : 3,4 à 3,7 GHz, E : 2,8 à 2,9 GHz), et le GPU tourne à 2,3 GHz. En continuant le test, les vitesses d'horloge du CPU et du GPU diminuent.
Intervenants
Les haut-parleurs stéréo produisent un son médiocre et n'offrent pratiquement pas de basses. Pour une meilleure écoute, nous vous recommandons d'utiliser un casque ou des haut-parleurs externes.
Medion Erazer Scout E20 analyse audio
(+) | les haut-parleurs peuvent jouer relativement fort (84# dB)
Basses 100 - 315 Hz
(-) | presque aucune basse - en moyenne 33.1% plus bas que la médiane
(±) | la linéarité des basses est moyenne (9.9% delta à la fréquence précédente)
Médiums 400 - 2000 Hz
(±) | médiane supérieure - en moyenne 6.6% supérieure à la médiane
(±) | la linéarité des médiums est moyenne (8.2% delta à la fréquence précédente)
Aiguës 2 - 16 kHz
(+) | des sommets équilibrés - à seulement 2.1% de la médiane
(±) | la linéarité des aigus est moyenne (7.5% delta à la fréquence précédente)
Globalement 100 - 16 000 Hz
(±) | la linéarité du son global est moyenne (22.2% de différence avec la médiane)
Par rapport à la même classe
» 79% de tous les appareils testés de cette catégorie étaient meilleurs, 6% similaires, 14% pires
» Le meilleur avait un delta de 6%, la moyenne était de 18%, le pire était de 132%.
Par rapport à tous les appareils testés
» 65% de tous les appareils testés étaient meilleurs, 6% similaires, 29% pires
» Le meilleur avait un delta de 4%, la moyenne était de 23%, le pire était de 134%.
MSI Katana 17 B13VFK analyse audio
(±) | le niveau sonore du haut-parleur est moyen mais bon (78.5# dB)
Basses 100 - 315 Hz
(-) | presque aucune basse - en moyenne 17.7% plus bas que la médiane
(±) | la linéarité des basses est moyenne (11.7% delta à la fréquence précédente)
Médiums 400 - 2000 Hz
(±) | médiane supérieure - en moyenne 6.8% supérieure à la médiane
(+) | les médiums sont linéaires (6.7% delta à la fréquence précédente)
Aiguës 2 - 16 kHz
(+) | des sommets équilibrés - à seulement 3.2% de la médiane
(±) | la linéarité des aigus est moyenne (7.2% delta à la fréquence précédente)
Globalement 100 - 16 000 Hz
(±) | la linéarité du son global est moyenne (19.4% de différence avec la médiane)
Par rapport à la même classe
» 67% de tous les appareils testés de cette catégorie étaient meilleurs, 7% similaires, 26% pires
» Le meilleur avait un delta de 6%, la moyenne était de 18%, le pire était de 132%.
Par rapport à tous les appareils testés
» 48% de tous les appareils testés étaient meilleurs, 7% similaires, 45% pires
» Le meilleur avait un delta de 4%, la moyenne était de 23%, le pire était de 134%.
Gestion de l'énergie - L'ordinateur portable Medion n'offre qu'une faible autonomie
Consommation électrique
La consommation d'énergie de l'ordinateur portable Medion ne montre aucun comportement notable, et les valeurs se situent à des niveaux normaux pour le matériel utilisé. L'ordinateur portable passe notre test The Witcher 3 et notre test de stress avec une consommation d'énergie constante. Le bloc d'alimentation de 230 watts fournit une quantité suffisante d'énergie à tout moment.
| Éteint/en veille | |
| Au repos | |
| Fortement sollicité |
|
Légende:
min: | |
| Medion Erazer Scout E20 i7-13700H, GeForce RTX 4050 Laptop GPU | Gigabyte G7 KE i5-12500H, GeForce RTX 3060 Laptop GPU | MSI Katana 17 B13VFK i7-13620H, GeForce RTX 4060 Laptop GPU | Asus TUF Gaming A16 FA617 R7 7735HS, Radeon RX 7600S | Lenovo Legion 5 15IAH7H 82RB i7-12700H, GeForce RTX 3060 Laptop GPU | Acer Nitro 5 AN515-46-R1A1 R7 6800H, GeForce RTX 3070 Ti Laptop GPU | Moyenne NVIDIA GeForce RTX 4050 Laptop GPU | Moyenne de la classe Gaming | |
|---|---|---|---|---|---|---|---|---|
| Power Consumption | -51% | -25% | -5% | -104% | -25% | -23% | -58% | |
| Idle Minimum * (Watt) | 5 | 15 -200% | 12.2 -144% | 8 -60% | 19.8 -296% | 7 -40% | 9.95 ? -99% | 13.1 ? -162% |
| Idle Average * (Watt) | 11 | 17 -55% | 14.9 -35% | 11 -0% | 26.2 -138% | 8.9 19% | 15.8 ? -44% | 19 ? -73% |
| Idle Maximum * (Watt) | 22 | 24 -9% | 15.8 28% | 16 27% | 48.2 -119% | 14.4 35% | 20.1 ? 9% | 24.6 ? -12% |
| Load Average * (Watt) | 96 | 111 -16% | 85.22 11% | 97 -1% | 102.9 -7% | 202 -110% | 88 ? 8% | 111.3 ? -16% |
| Witcher 3 ultra * (Watt) | 145.2 | 174.1 -20% | 151.1 -4% | 161.5 -11% | 186.7 -29% | 203 -40% | ||
| Load Maximum * (Watt) | 201 | 208 -3% | 212.8 -6% | 168 16% | 268 -33% | 230 -14% | 176.3 ? 12% | 260 ? -29% |
* ... Moindre est la valeur, meilleures sont les performances
Power Consumption The Witcher 3 / Stress Test
Power Consumption With External Monitor
Autonomie de la batterie
Lors de notre test WLAN consistant à appeler des sites web via un script et de notre test vidéo consistant à lire en boucle le court métrage Big Buck Bunny (codage H.264, FHD), l'ordinateur portable de 17,3 pouces atteint des durées d'exécution de 4:44 h et 4:37 h respectivement. Pendant les deux tests, les fonctions d'économie d'énergie de l'ordinateur portable sont désactivées et la luminosité de l'écran est réglée à environ 150 cd/m². En outre, les modules de communication sont également désactivés pendant le test vidéo.
| Medion Erazer Scout E20 i7-13700H, GeForce RTX 4050 Laptop GPU, 53.35 Wh | Gigabyte G7 KE i5-12500H, GeForce RTX 3060 Laptop GPU, 54 Wh | MSI Katana 17 B13VFK i7-13620H, GeForce RTX 4060 Laptop GPU, 53.5 Wh | Asus TUF Gaming A16 FA617 R7 7735HS, Radeon RX 7600S, 90 Wh | Lenovo Legion 5 15IAH7H 82RB i7-12700H, GeForce RTX 3060 Laptop GPU, 80 Wh | Acer Nitro 5 AN515-46-R1A1 R7 6800H, GeForce RTX 3070 Ti Laptop GPU, 57.5 Wh | Moyenne de la classe Gaming | |
|---|---|---|---|---|---|---|---|
| Autonomie de la batterie | -12% | -36% | 119% | 0% | 23% | 37% | |
| Reader / Idle (h) | 6.7 | 7.1 6% | 20.2 201% | 8.1 21% | 10.5 57% | 7.84 ? 17% | |
| H.264 (h) | 4.6 | 2.2 -52% | 5.7 24% | 8.27 ? 80% | |||
| WiFi v1.3 (h) | 4.7 | 5.3 13% | 2.9 -38% | 12.1 157% | 5 6% | 5.8 23% | 7.08 ? 51% |
| Load (h) | 1.5 | 1.3 -13% | 1 -33% | 1.5 0% | 1.1 -27% | 1.3 -13% | 1.496 ? 0% |
Points positifs
Points négatifs
Verdict - Un ordinateur portable de jeu d'entrée de gamme bien équilibré
Si l'Erazer Scout E20 se concentre sur le jeu en FHD, l'ordinateur portable fait également bonne figure dans d'autres domaines tels que le rendu et le traitement vidéo. LeCore i7-13700Het GeForce RTX 4050sont capables de tourner à des vitesses d'horloge élevées, et un SSD de 1 To assure des temps de chargement courts et fournit l'espace de stockage nécessaire.
Avec l'Erazer Scout E20, Medion propose un ordinateur portable de jeu cohérent dans le segment d'entrée de gamme. Le contrôle du ventilateur pourrait encore être ajusté.
Bien que l'ordinateur portable ne chauffe que modérément sous charge, il peut alors produire beaucoup de bruit. Heureusement, il existe un "mode silencieux" qui permet de jouer à un faible niveau sonore - mais pas dans le silence.
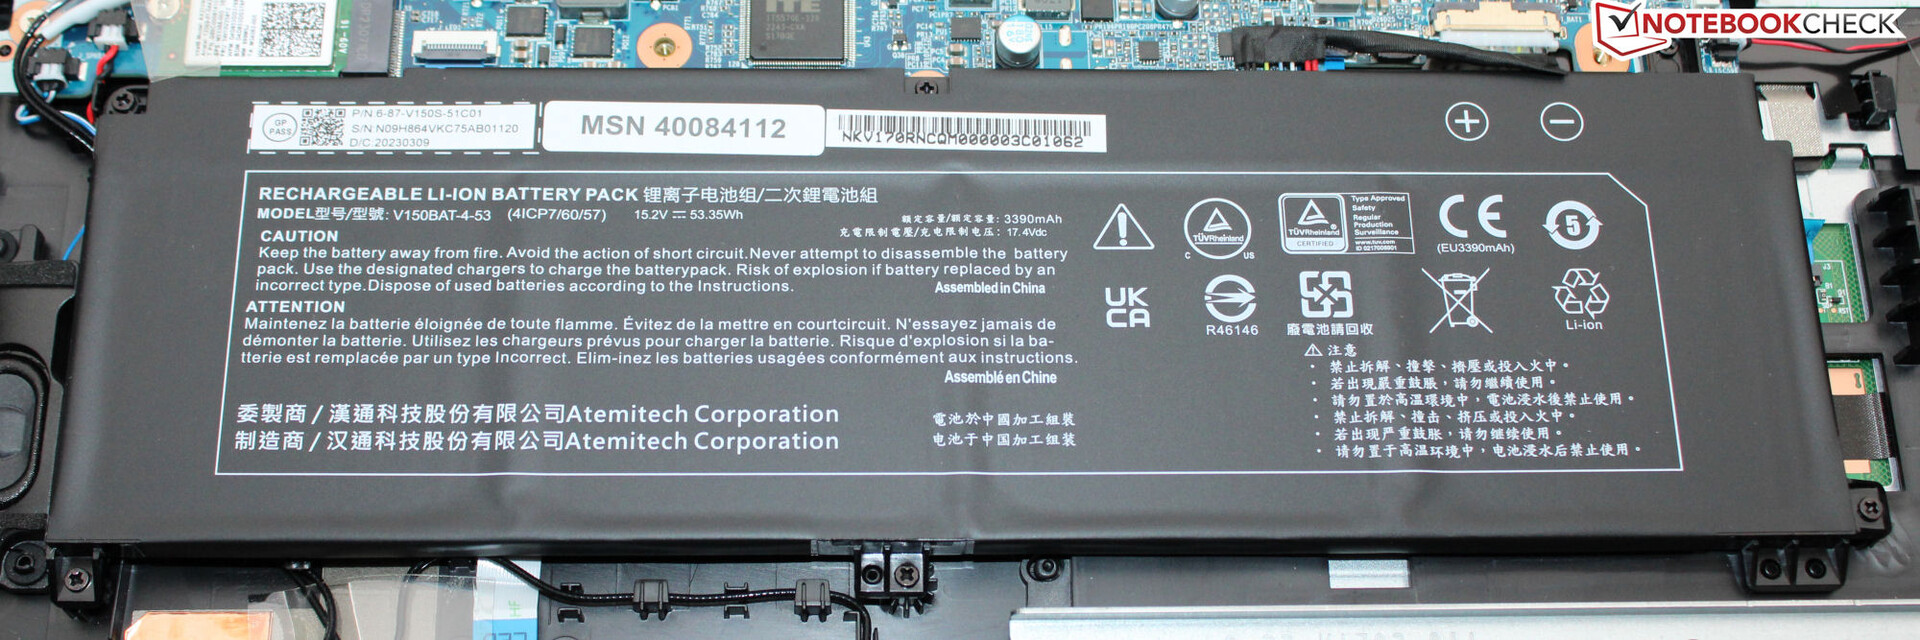
L'autonomie réaliste d'à peine 4,5 à 5 heures ne suscite pas l'enthousiasme et la capacité relativement faible de la batterie (53,35 Wh) se fait sentir. Comme la batterie ne peut pas être rechargée avec un chargeur USB-C, il faut toujours apporter l'alimentation électrique. L'écran mat de 17,3 pouces (FHD, IPS, 144 Hz, sRGB) a laissé une bonne impression dans l'ensemble.
Une alternative au E20 pourrait être leAsus TUF Gaming A16 Advantage Edition. Bien que les performances soient similaires, il dispose d'une autonomie de batterie nettement supérieure et d'un écran au format 16:10. Une alternative économique serait leGigabyte G7 KEqui présente des performances graphiques comparables mais un prix d'achat inférieur d'environ 450 euros (~498 $). Cependant, le système d'exploitation Windows n'est pas inclus.
Prix et disponibilité
En Allemagne, le Medion Erazer Scout E20 est disponible sur la boutique en ligne Medionpour près de 1 500 euros (~1 658 $). Il est basé sur le Clevo V170RNCQ, qui est disponible sur Clevo pour 1399 euros (~$1,547) (~$1,547). Clevo propose également différentes options de configuration.
Medion Erazer Scout E20
- 05/16/2023 v7 (old)
Sascha Mölck
Transparency
La sélection des appareils à examiner est effectuée par notre équipe éditoriale. L'échantillon de test a été prêté à l'auteur par le fabricant ou le détaillant pour les besoins de cet examen. Le prêteur n'a pas eu d'influence sur cette évaluation et le fabricant n'a pas reçu de copie de cette évaluation avant sa publication. Il n'y avait aucune obligation de publier cet article. En tant que média indépendant, Notebookcheck n'est pas soumis à l'autorité des fabricants, des détaillants ou des éditeurs.
Voici comment Notebookcheck teste
Chaque année, Notebookcheck examine de manière indépendante des centaines d'ordinateurs portables et de smartphones en utilisant des procédures standardisées afin de garantir que tous les résultats sont comparables. Nous avons continuellement développé nos méthodes de test depuis environ 20 ans et avons établi des normes industrielles dans le processus. Dans nos laboratoires de test, des équipements de mesure de haute qualité sont utilisés par des techniciens et des rédacteurs expérimentés. Ces tests impliquent un processus de validation en plusieurs étapes. Notre système d'évaluation complexe repose sur des centaines de mesures et de points de référence bien fondés, ce qui garantit l'objectivité.Price comparison

