Test du Schenker Key 17 Pro (début 2023) : PC portable de jeu 4k avec Core i9 et RTX 4090
Le puissant Key 17 Pro est destiné aux créatifs et aux joueurs. Raptor Lake et Ada Lovelace fournissent la puissance de calcul nécessaire à cet ordinateur portable, qui dispose d'un processeur Core i9-13900HX et d'uneGeForce RTX 4090et est basé sur un barebone Clevo (X370SNW-G). Il est en concurrence avec des appareils tels que le MSI Stealth 17 Studio A13VHet le Asus ROG Strix Scar 17 G733PYl'Asus ROG Strix Scar 17 G733PY Aorus 17X AZF et le Medion Erazer Beast X40.
Comparaison avec les concurrents potentiels
Note | Date | Modèle | Poids | Épaisseur | Taille | Résolution | Prix |
|---|---|---|---|---|---|---|---|
| 85.5 % v7 (old) | 06/23 | Schenker Key 17 Pro (Early 23) i9-13900HX, GeForce RTX 4090 Laptop GPU | 3.4 kg | 24.9 mm | 17.30" | 3840x2160 | |
| 89.2 % v7 (old) | 04/23 | MSI Stealth 17 Studio A13VH-014 i9-13900H, GeForce RTX 4080 Laptop GPU | 3 kg | 21.3 mm | 17.30" | 3840x2160 | |
| 88.3 % v7 (old) | 04/23 | Asus ROG Strix Scar 17 G733PY-XS96 R9 7945HX, GeForce RTX 4090 Laptop GPU | 2.9 kg | 28.3 mm | 17.30" | 2560x1440 | |
| 86 % v7 (old) | 04/23 | Aorus 17X AZF i9-13900HX, GeForce RTX 4090 Laptop GPU | 2.9 kg | 21.8 mm | 17.30" | 2560x1440 | |
| 88.4 % v7 (old) | 03/23 | Medion Erazer Beast X40 i9-13900HX, GeForce RTX 4090 Laptop GPU | 2.9 kg | 33 mm | 17.00" | 2560x1600 |
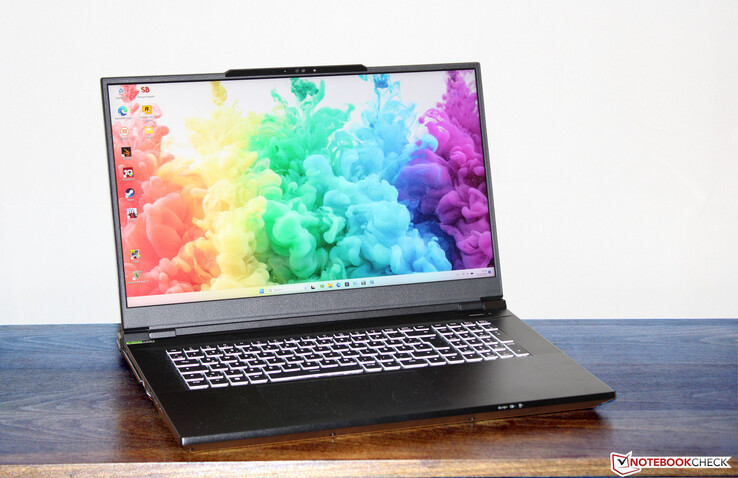
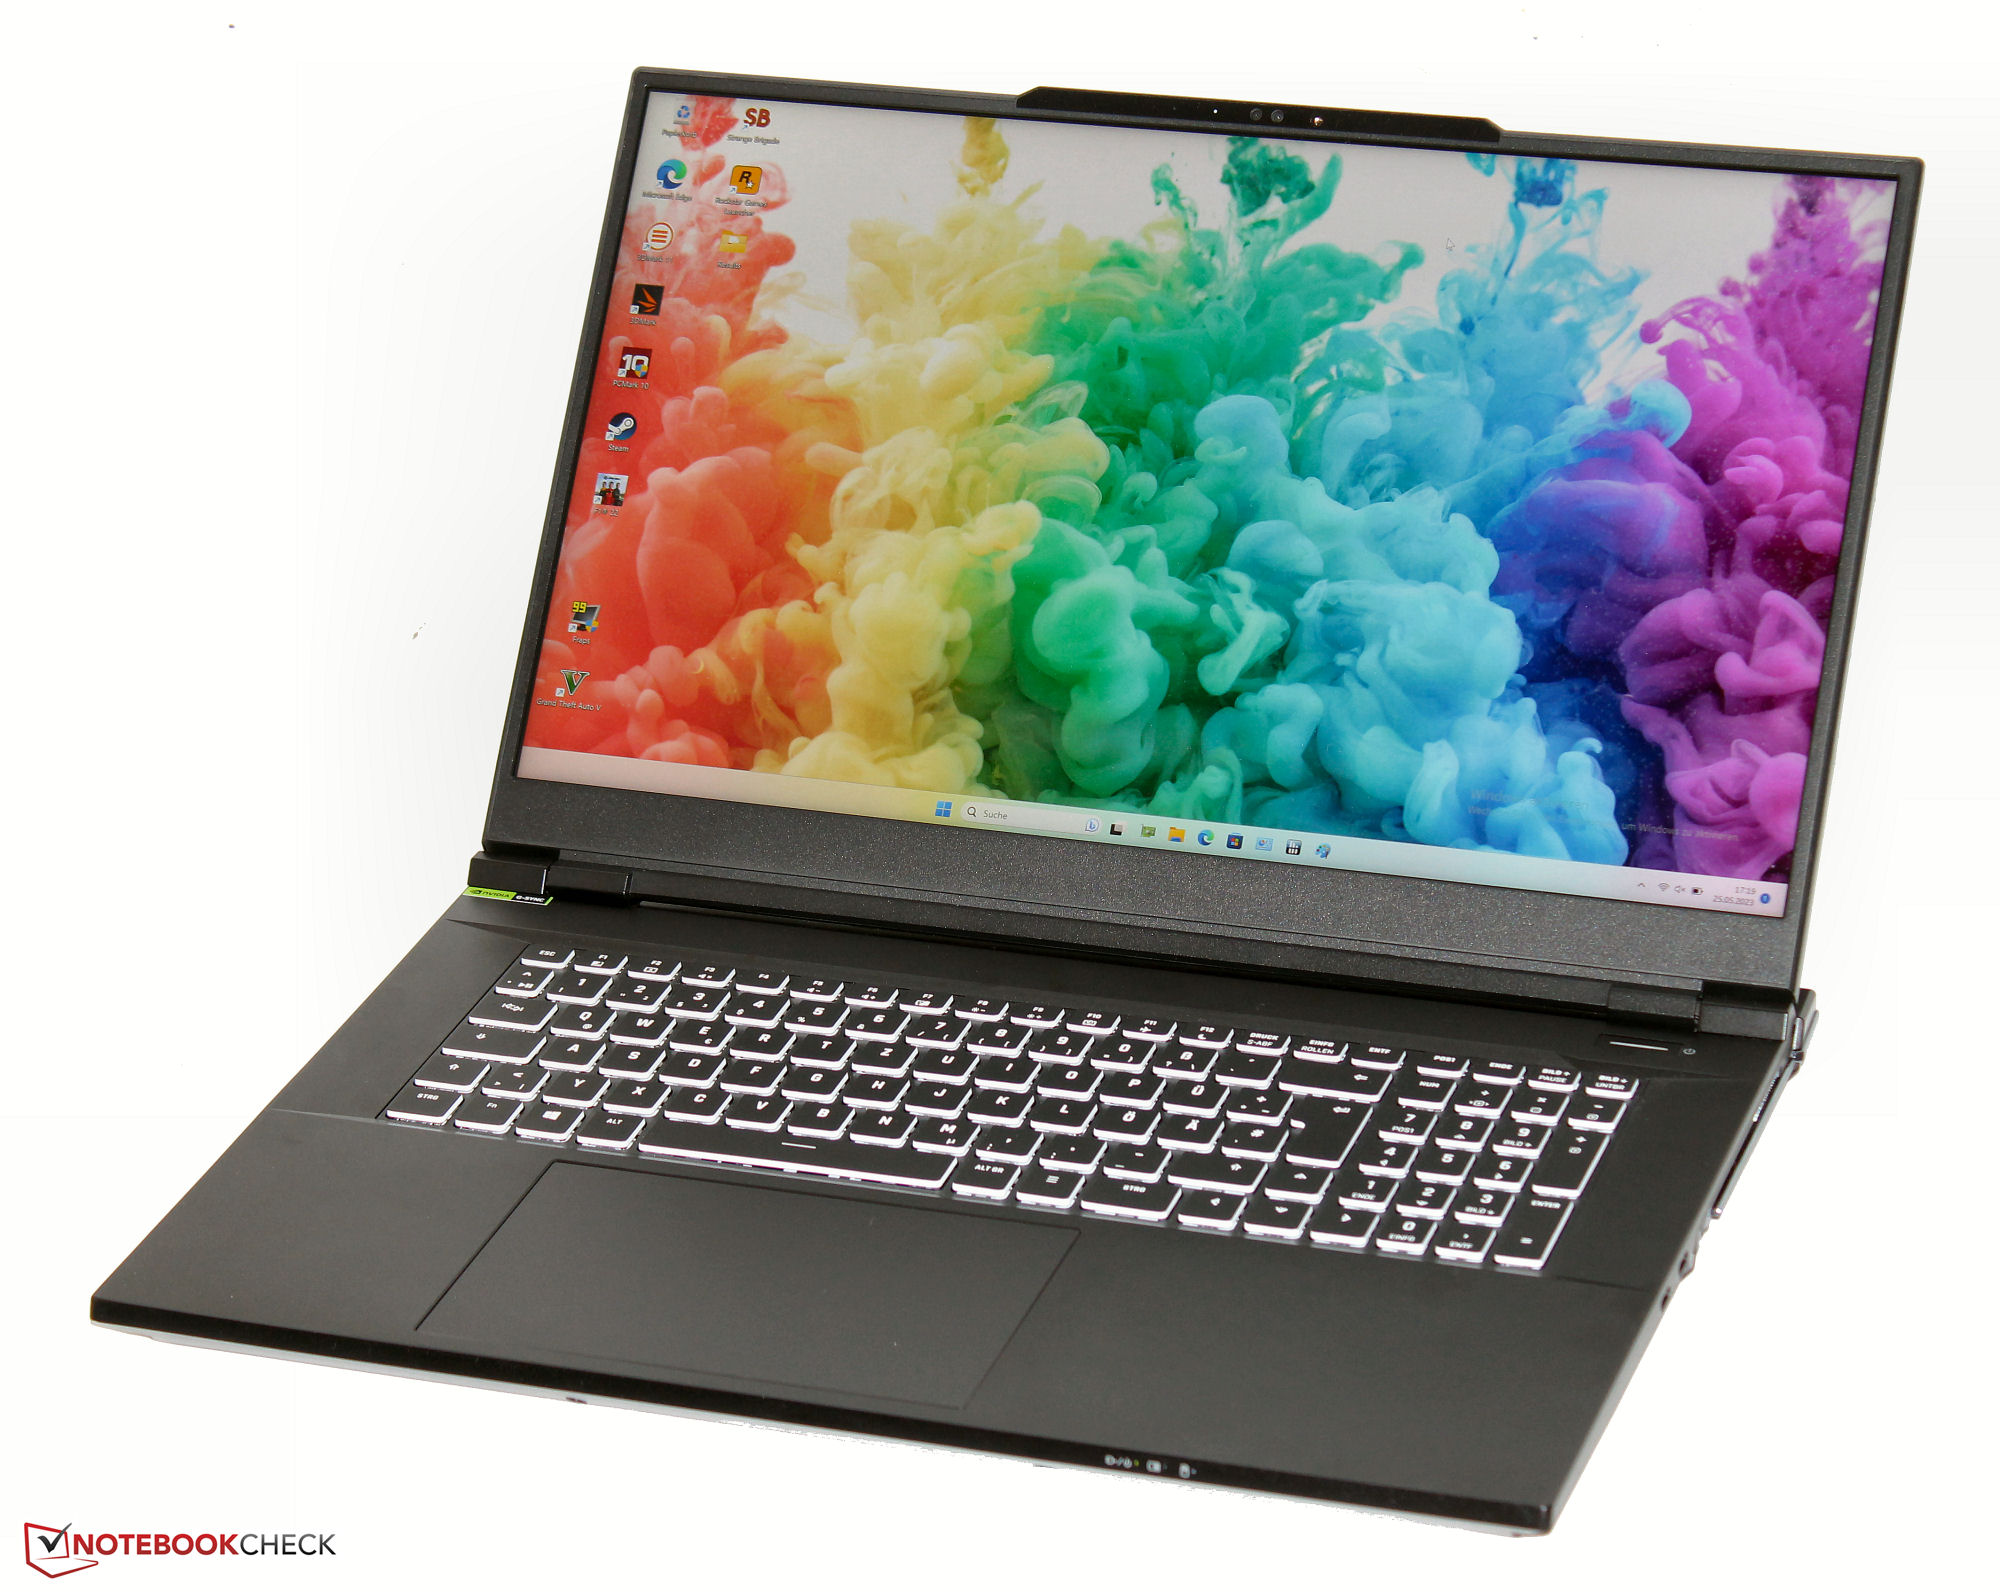
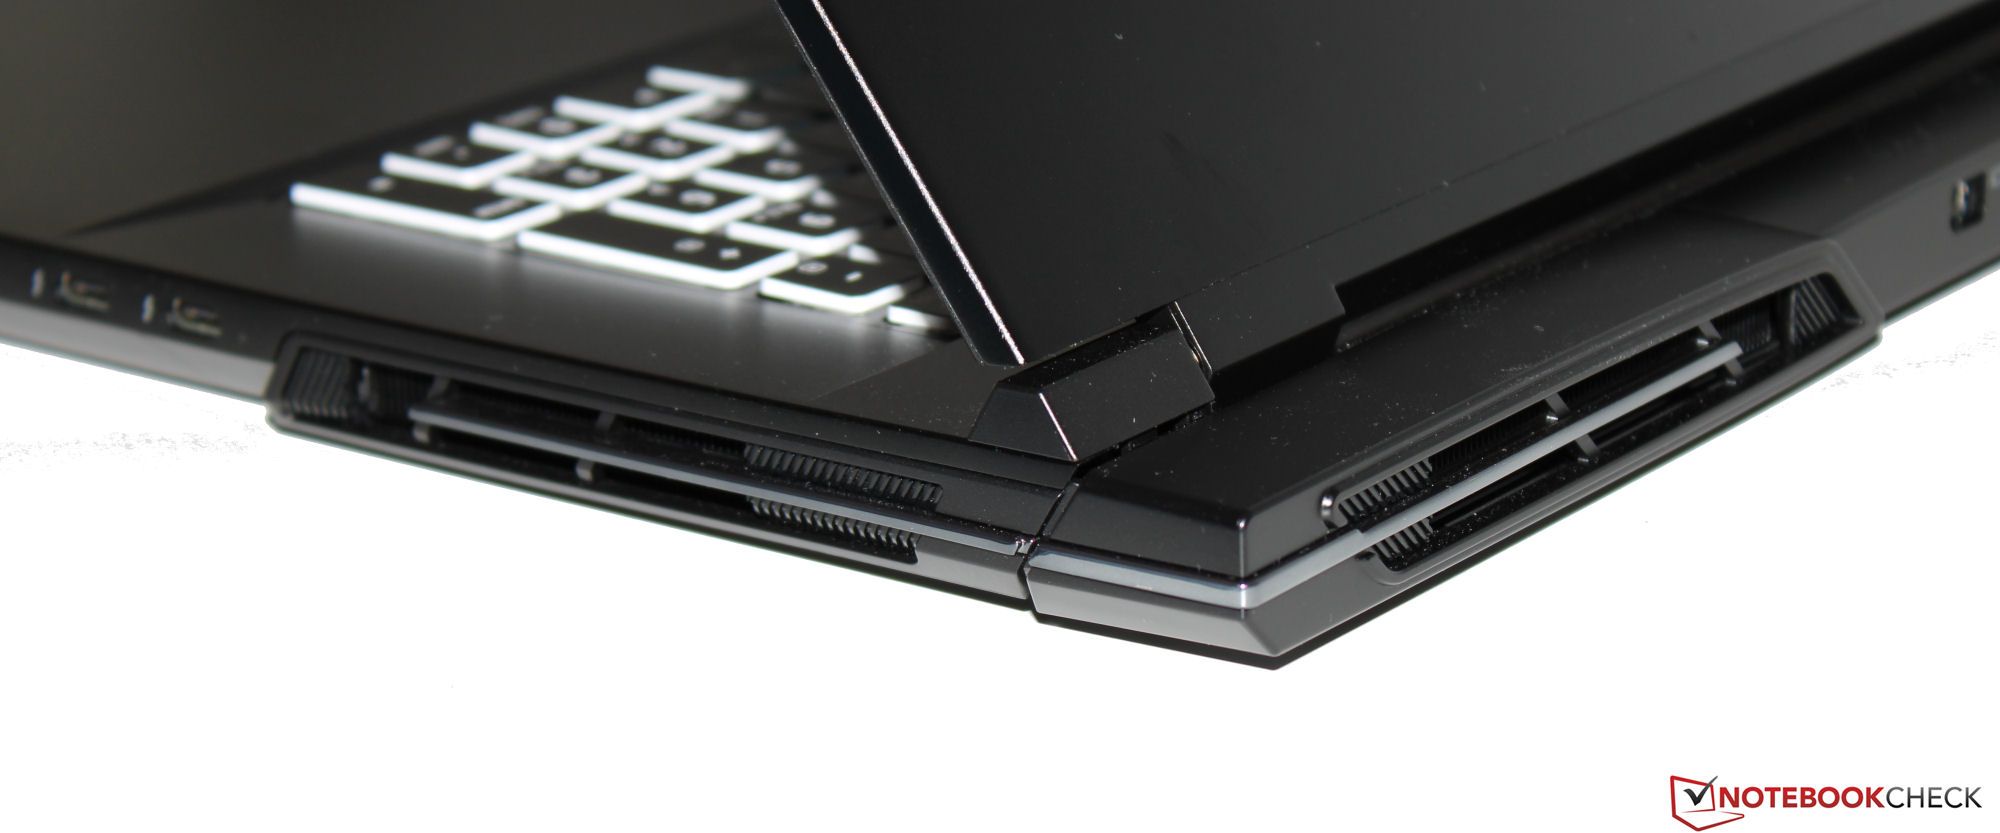
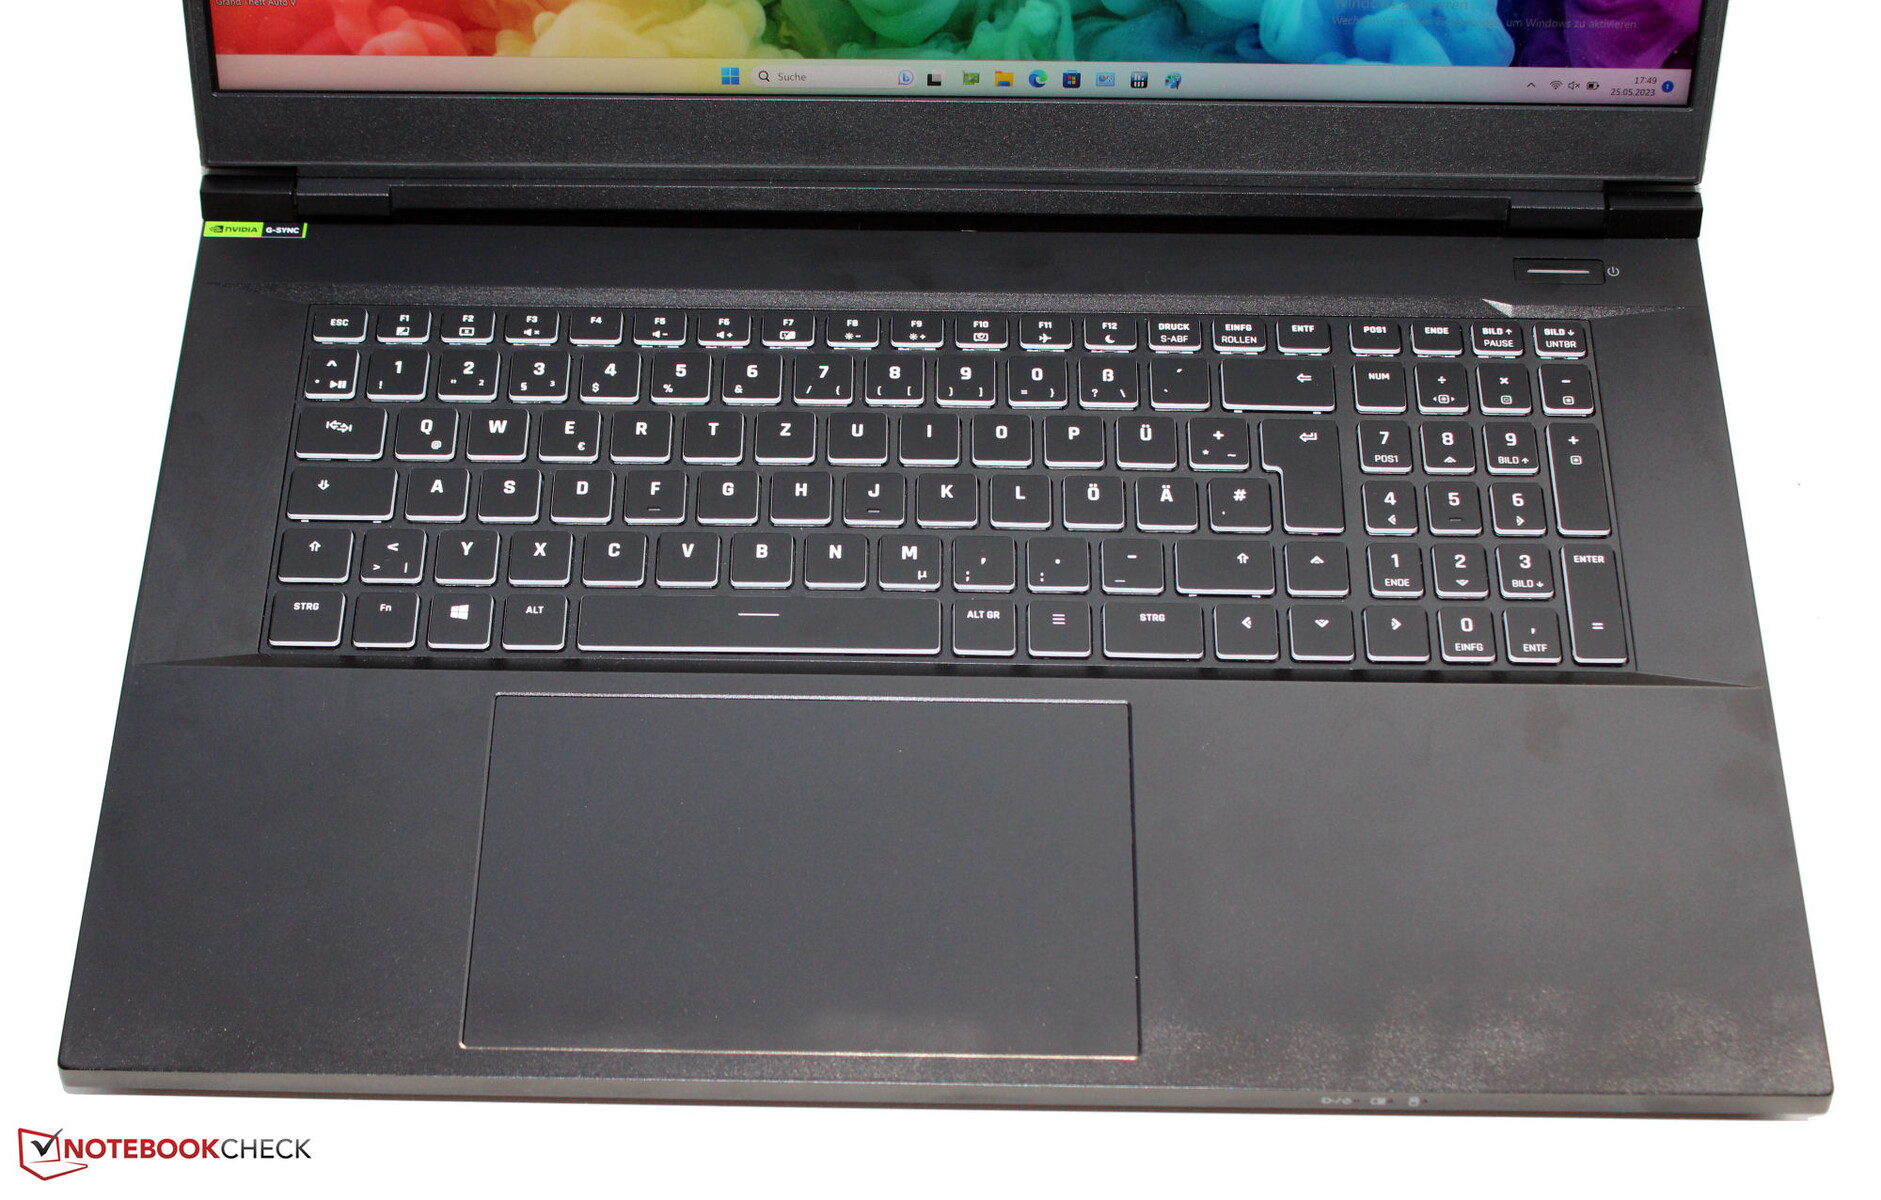
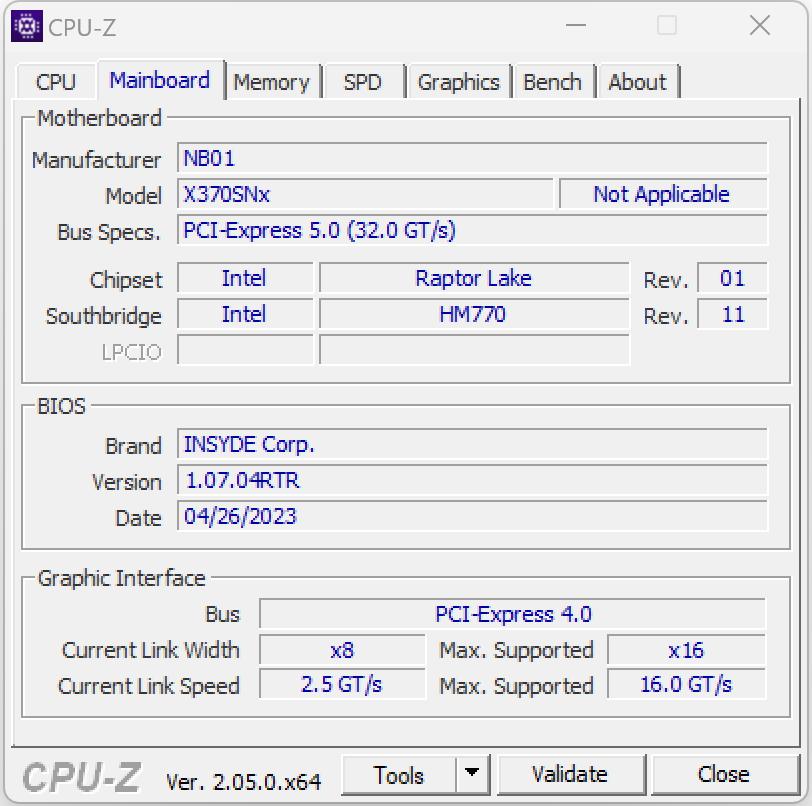
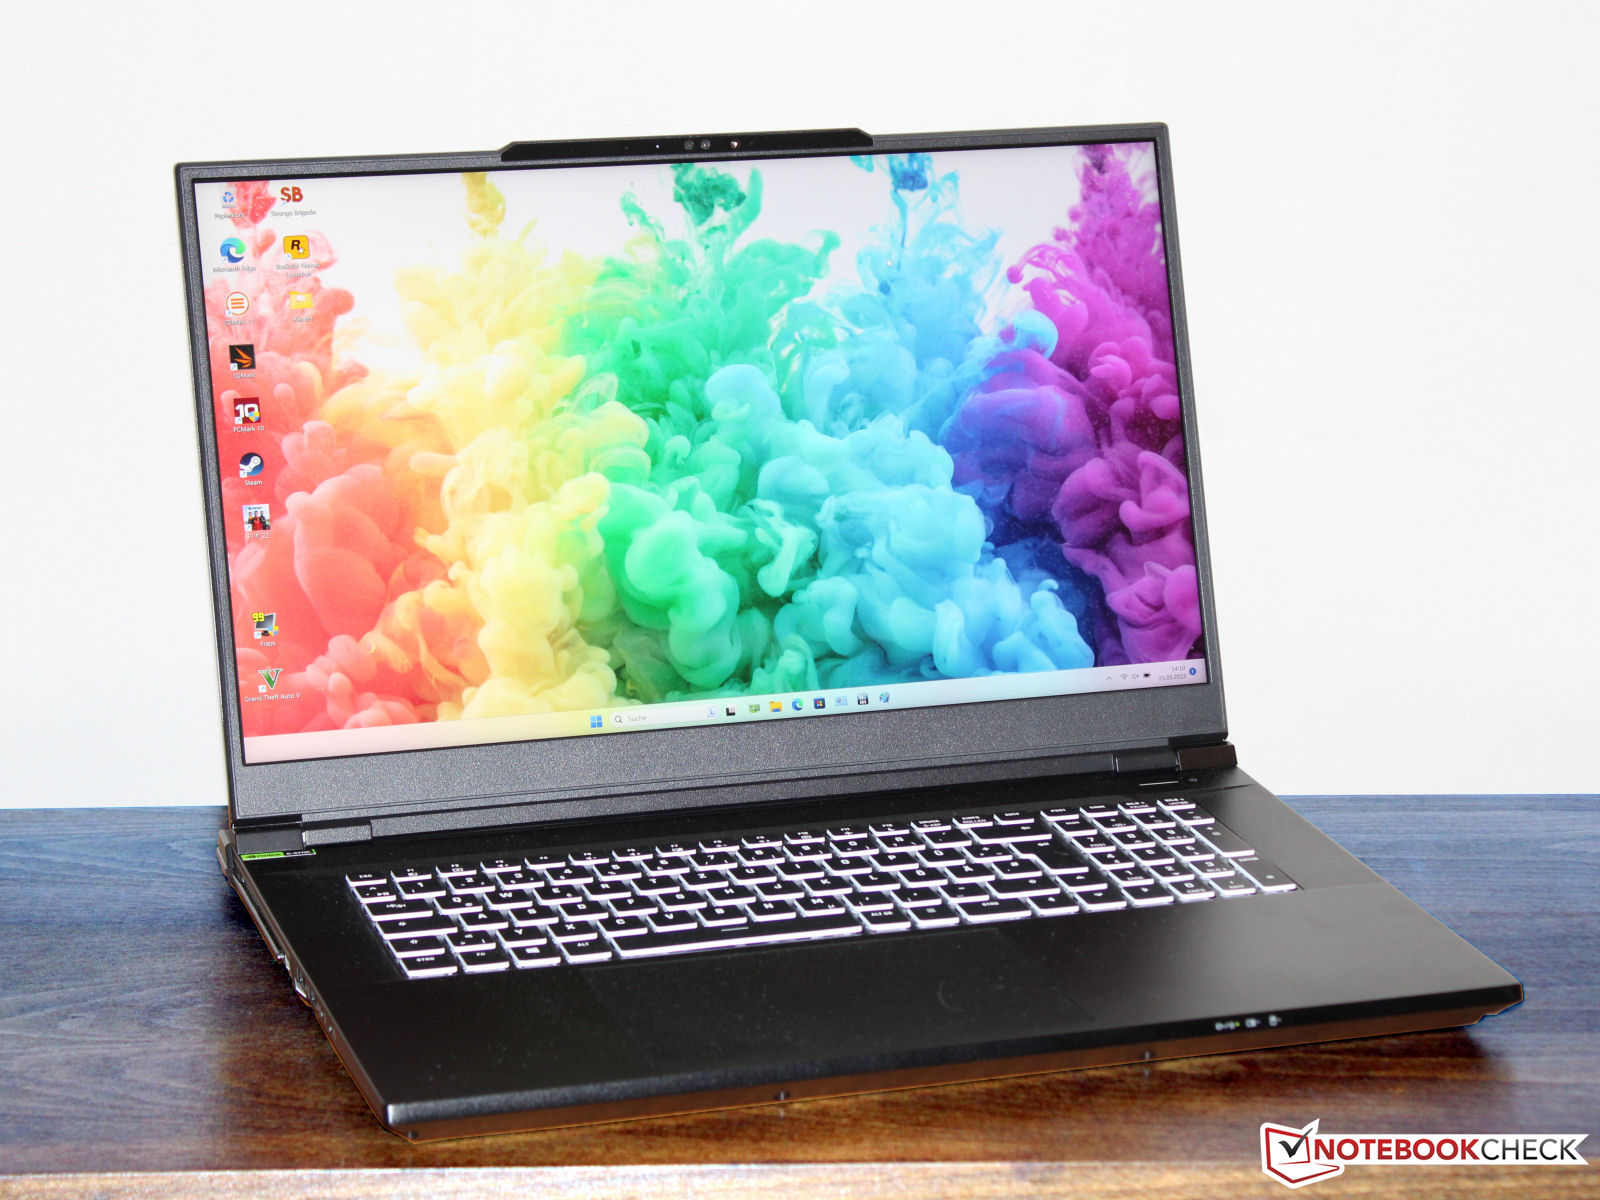
Boîtier et spécifications - Clevo barebone offrant Thunderbolt 4
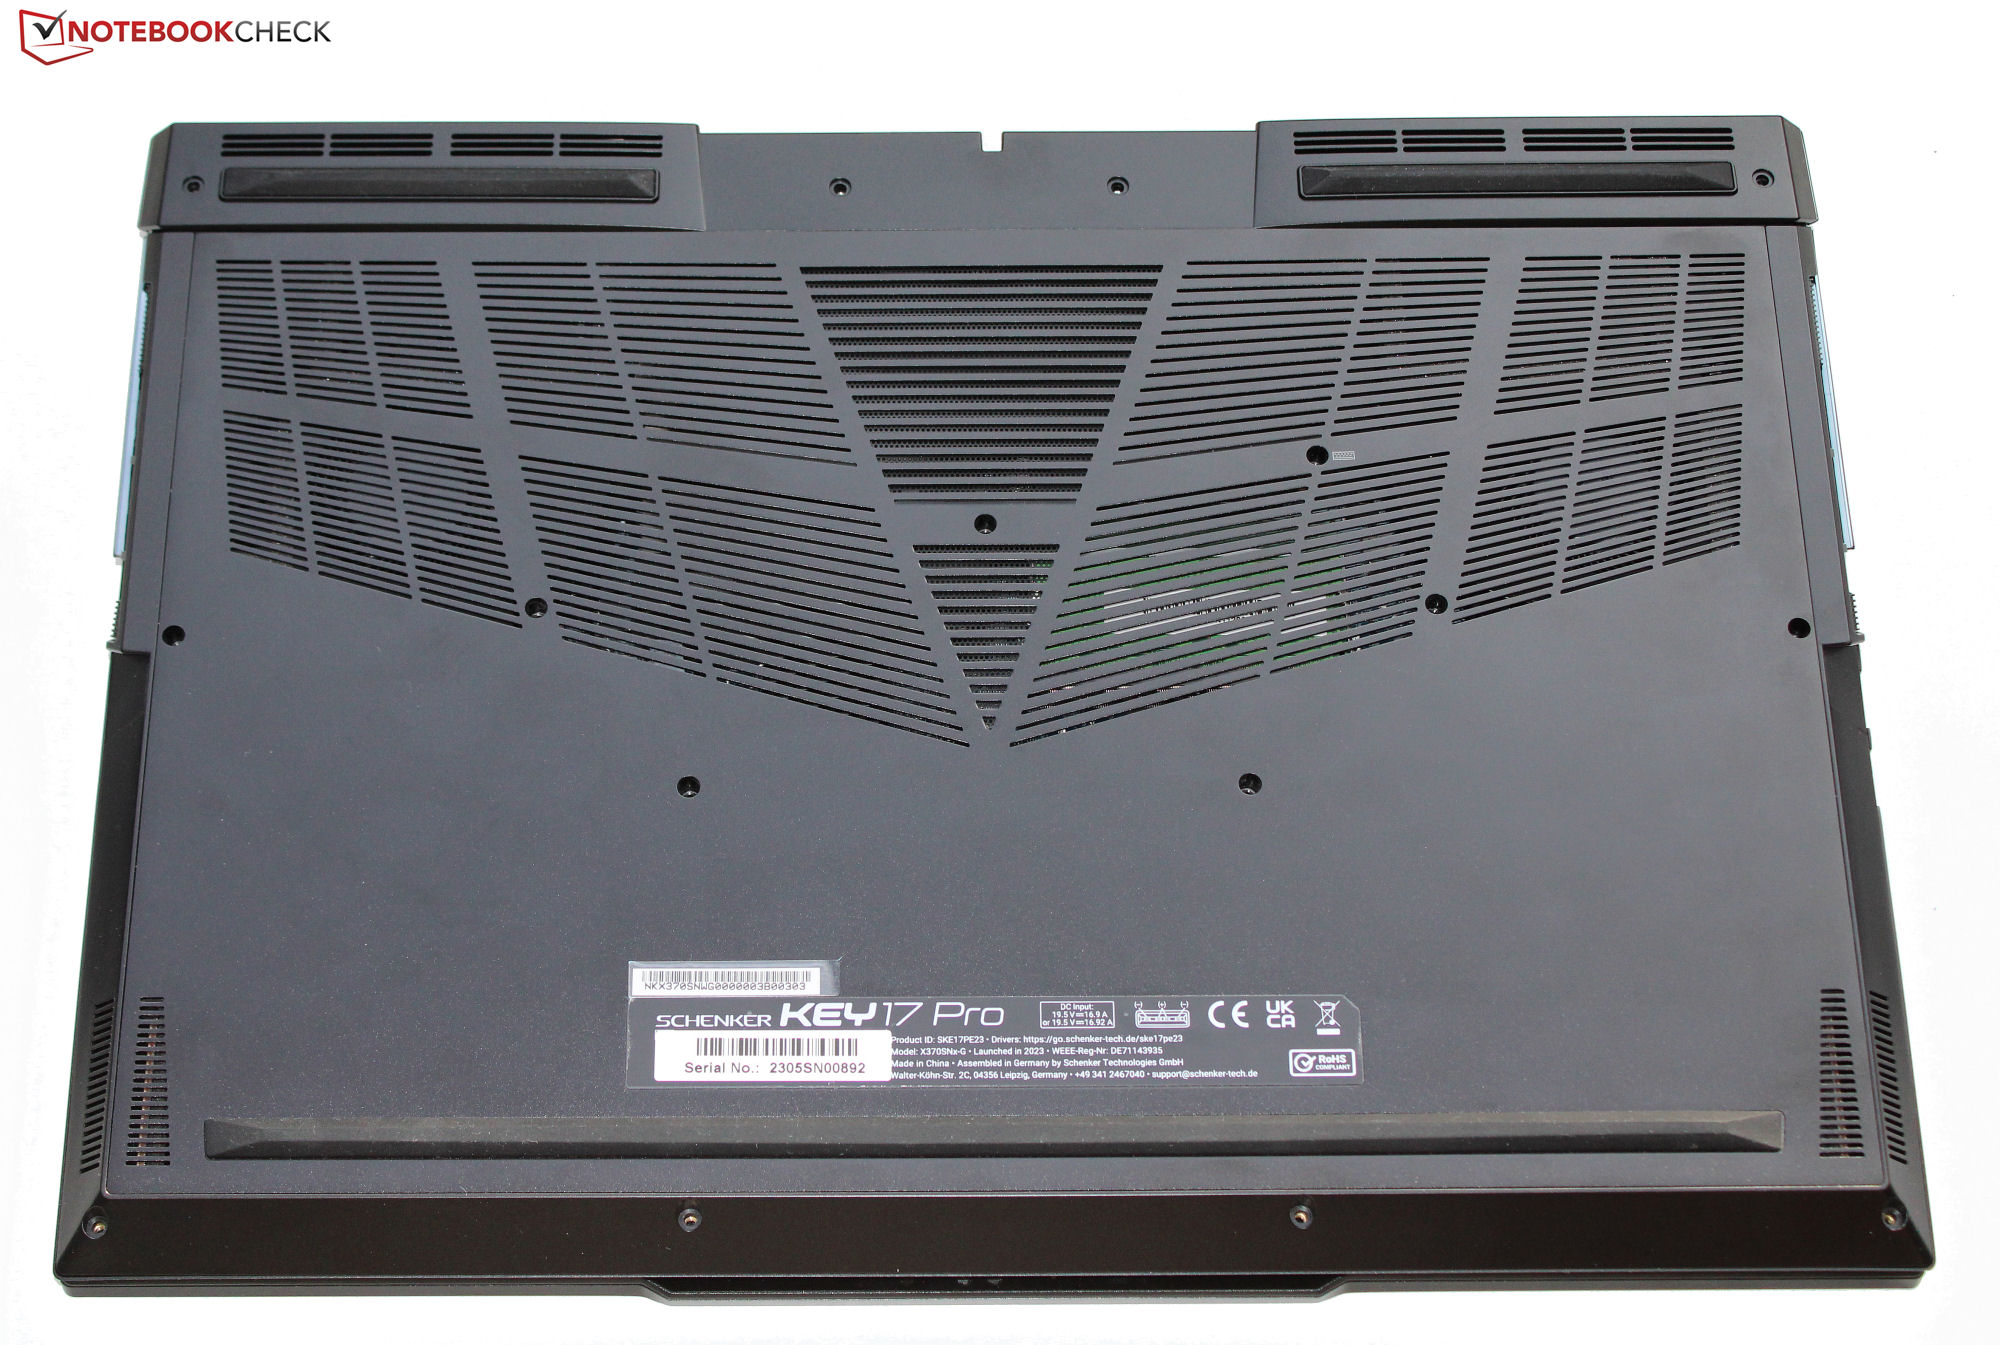
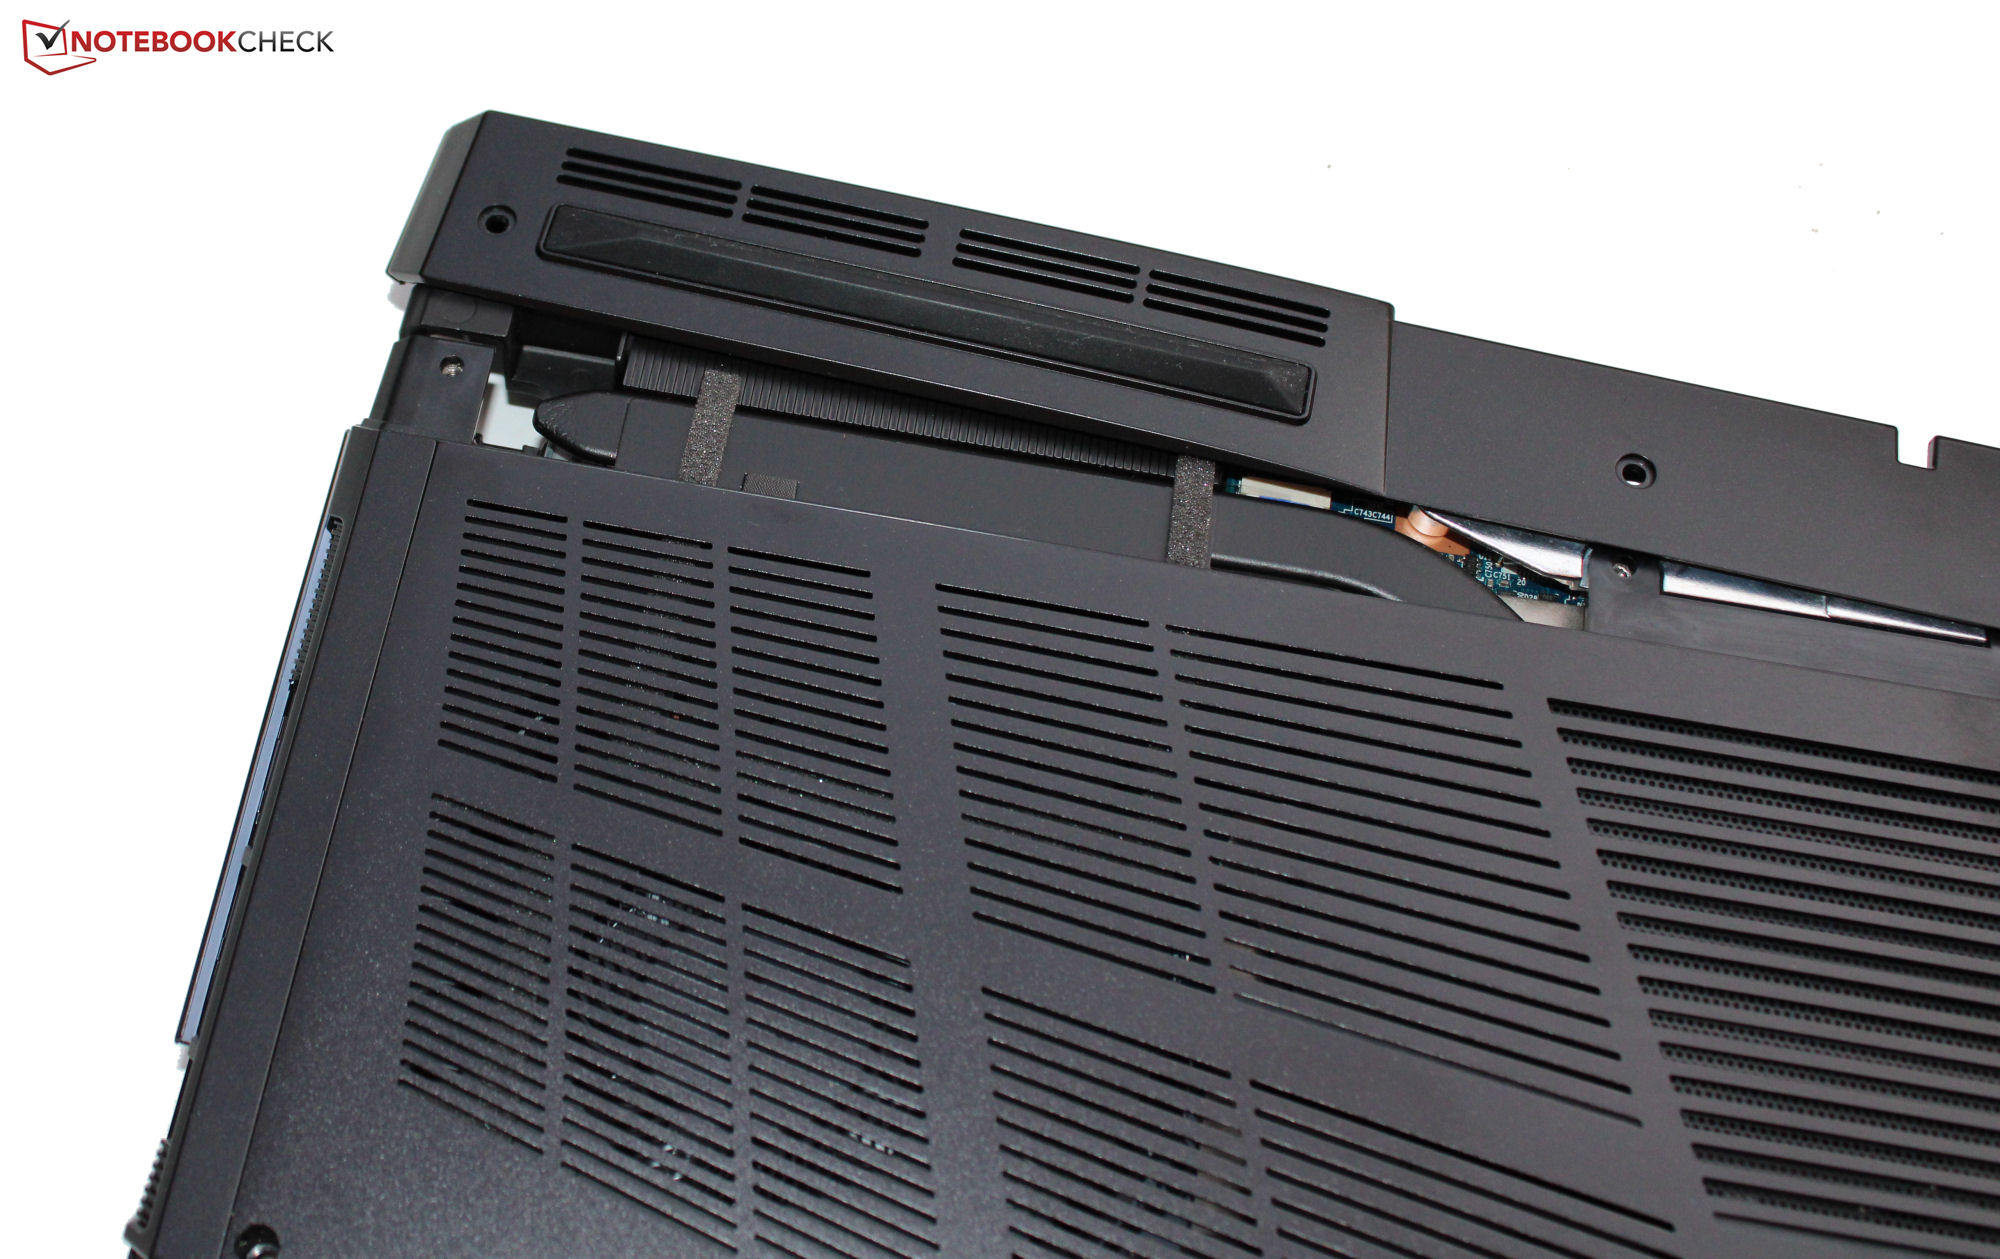
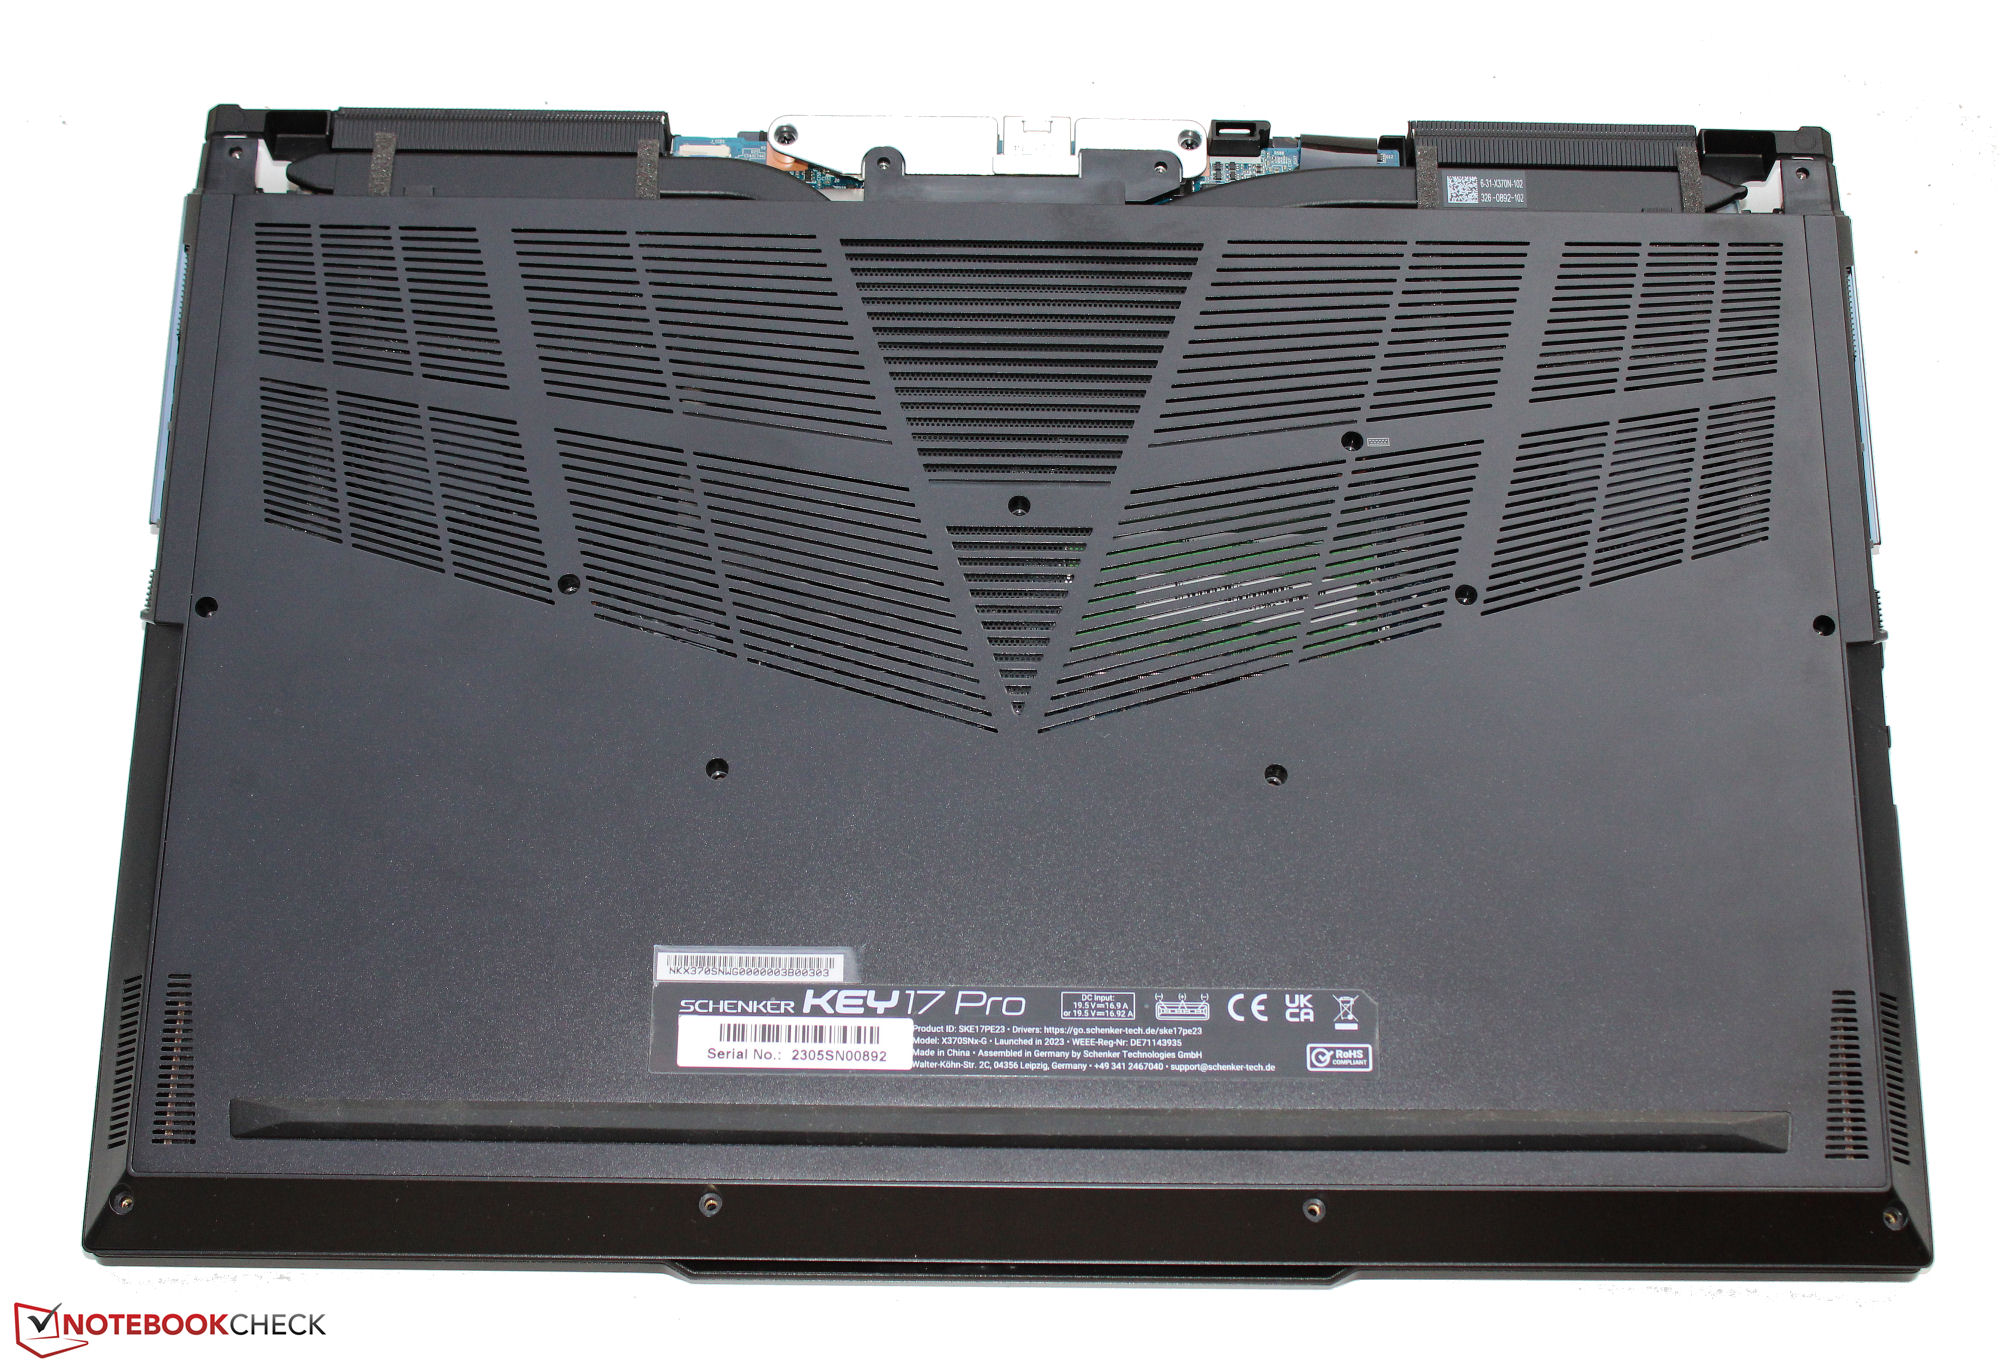
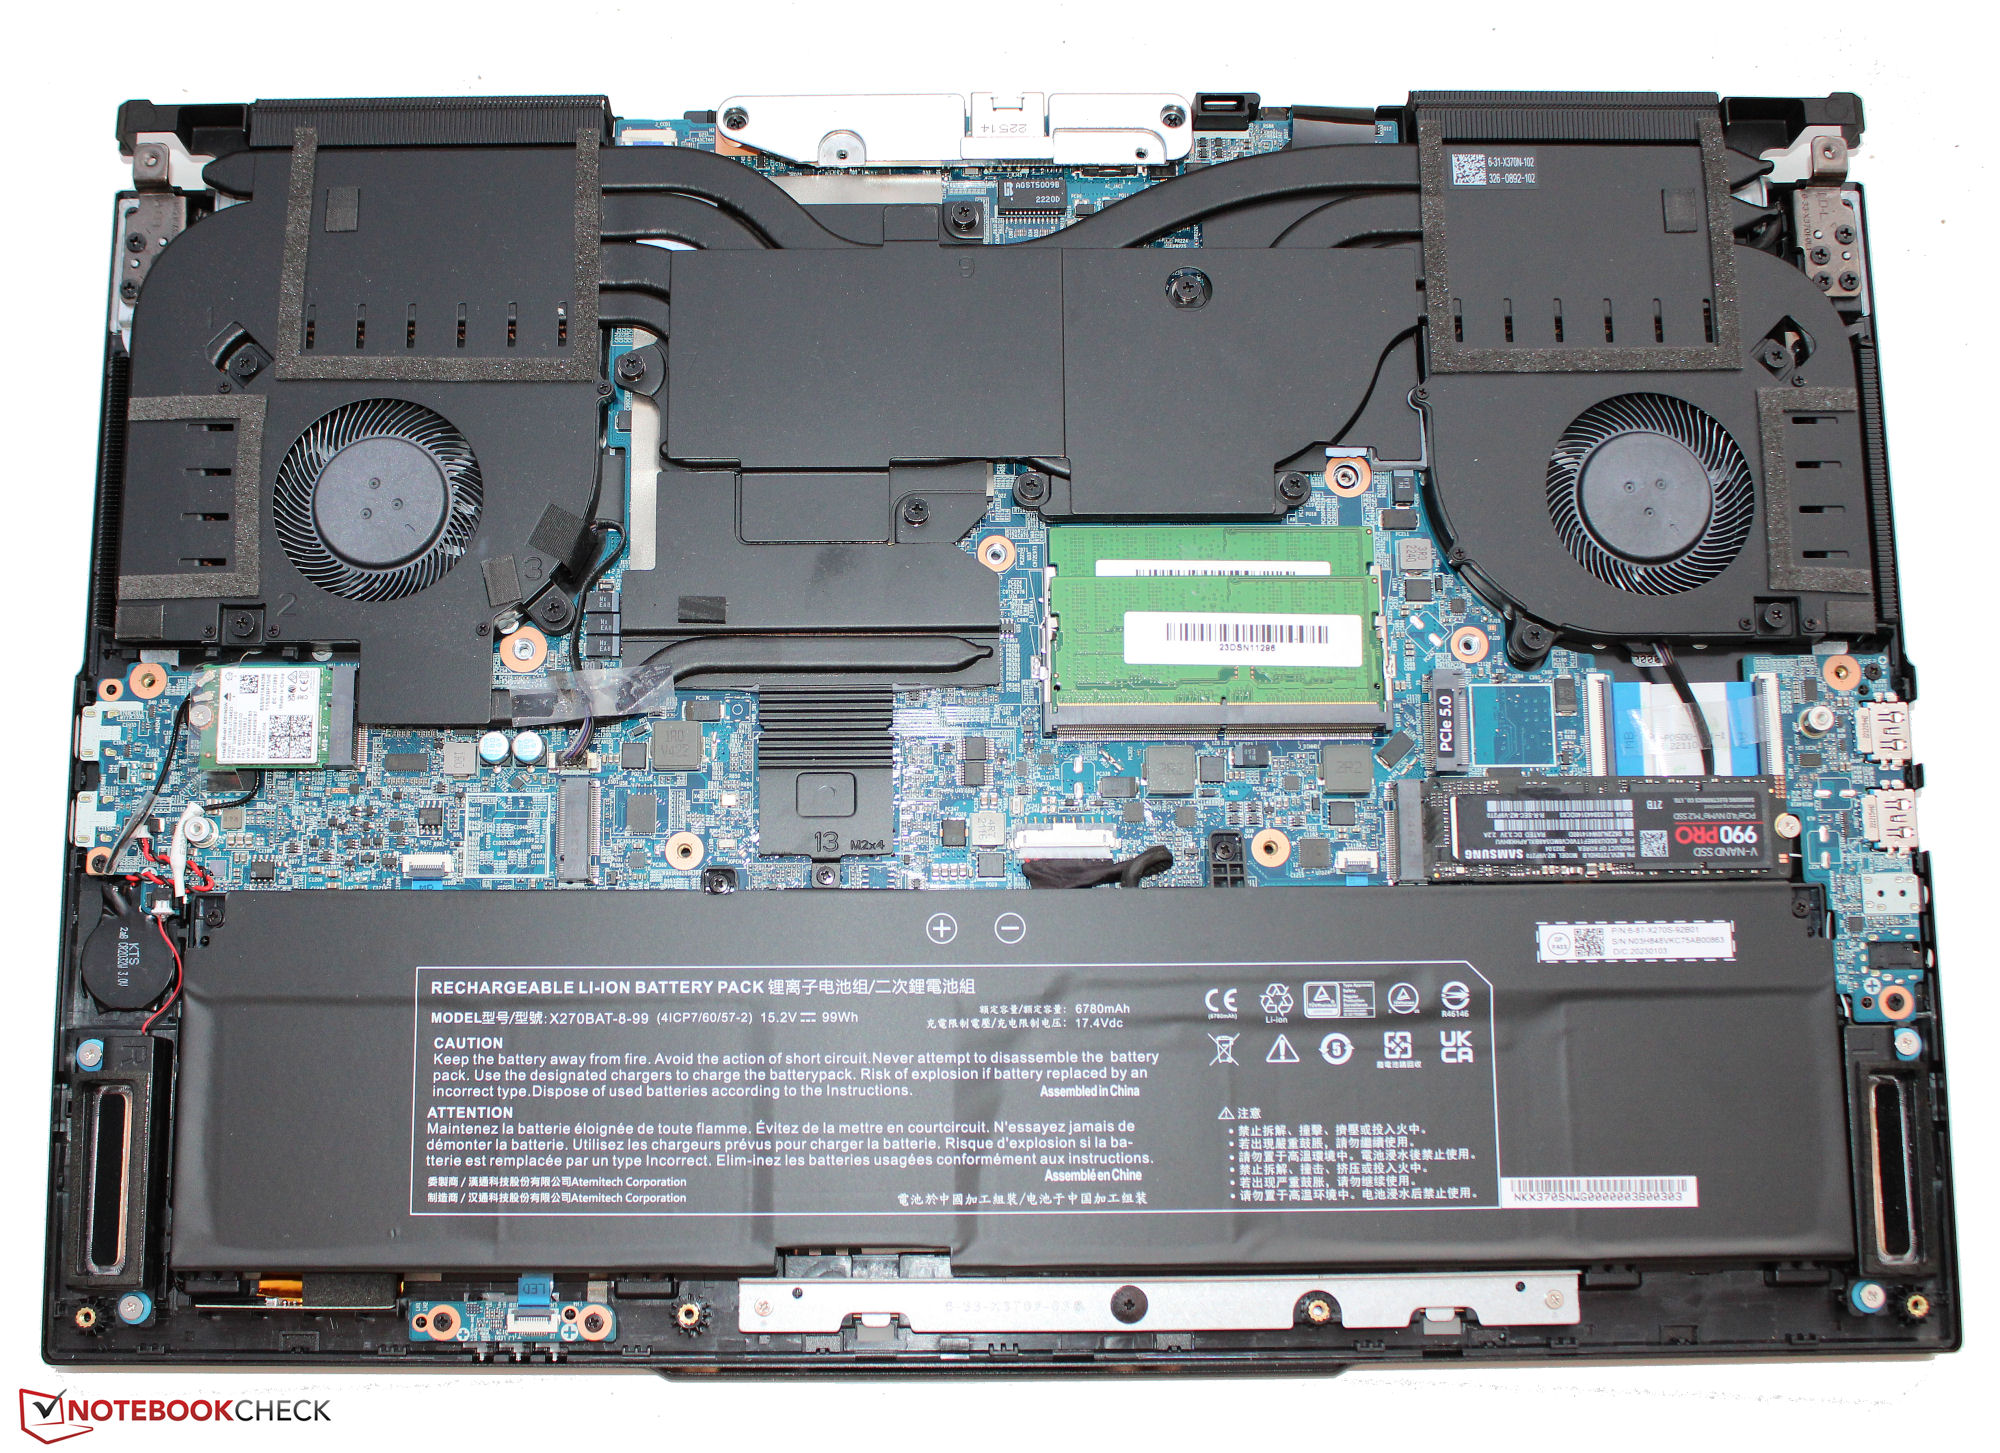
Le châssis subtil en métal noir mat de notre modèle d'essai ne présente aucun problème de fabrication. La base ne fléchit pratiquement pas et le couvercle présente un léger jeu, mais tout à fait acceptable. La batterie du portable (vissée et non collée) et les autres composants internes sont accessibles une fois que vous avez retiré le couvercle inférieur en deux parties.
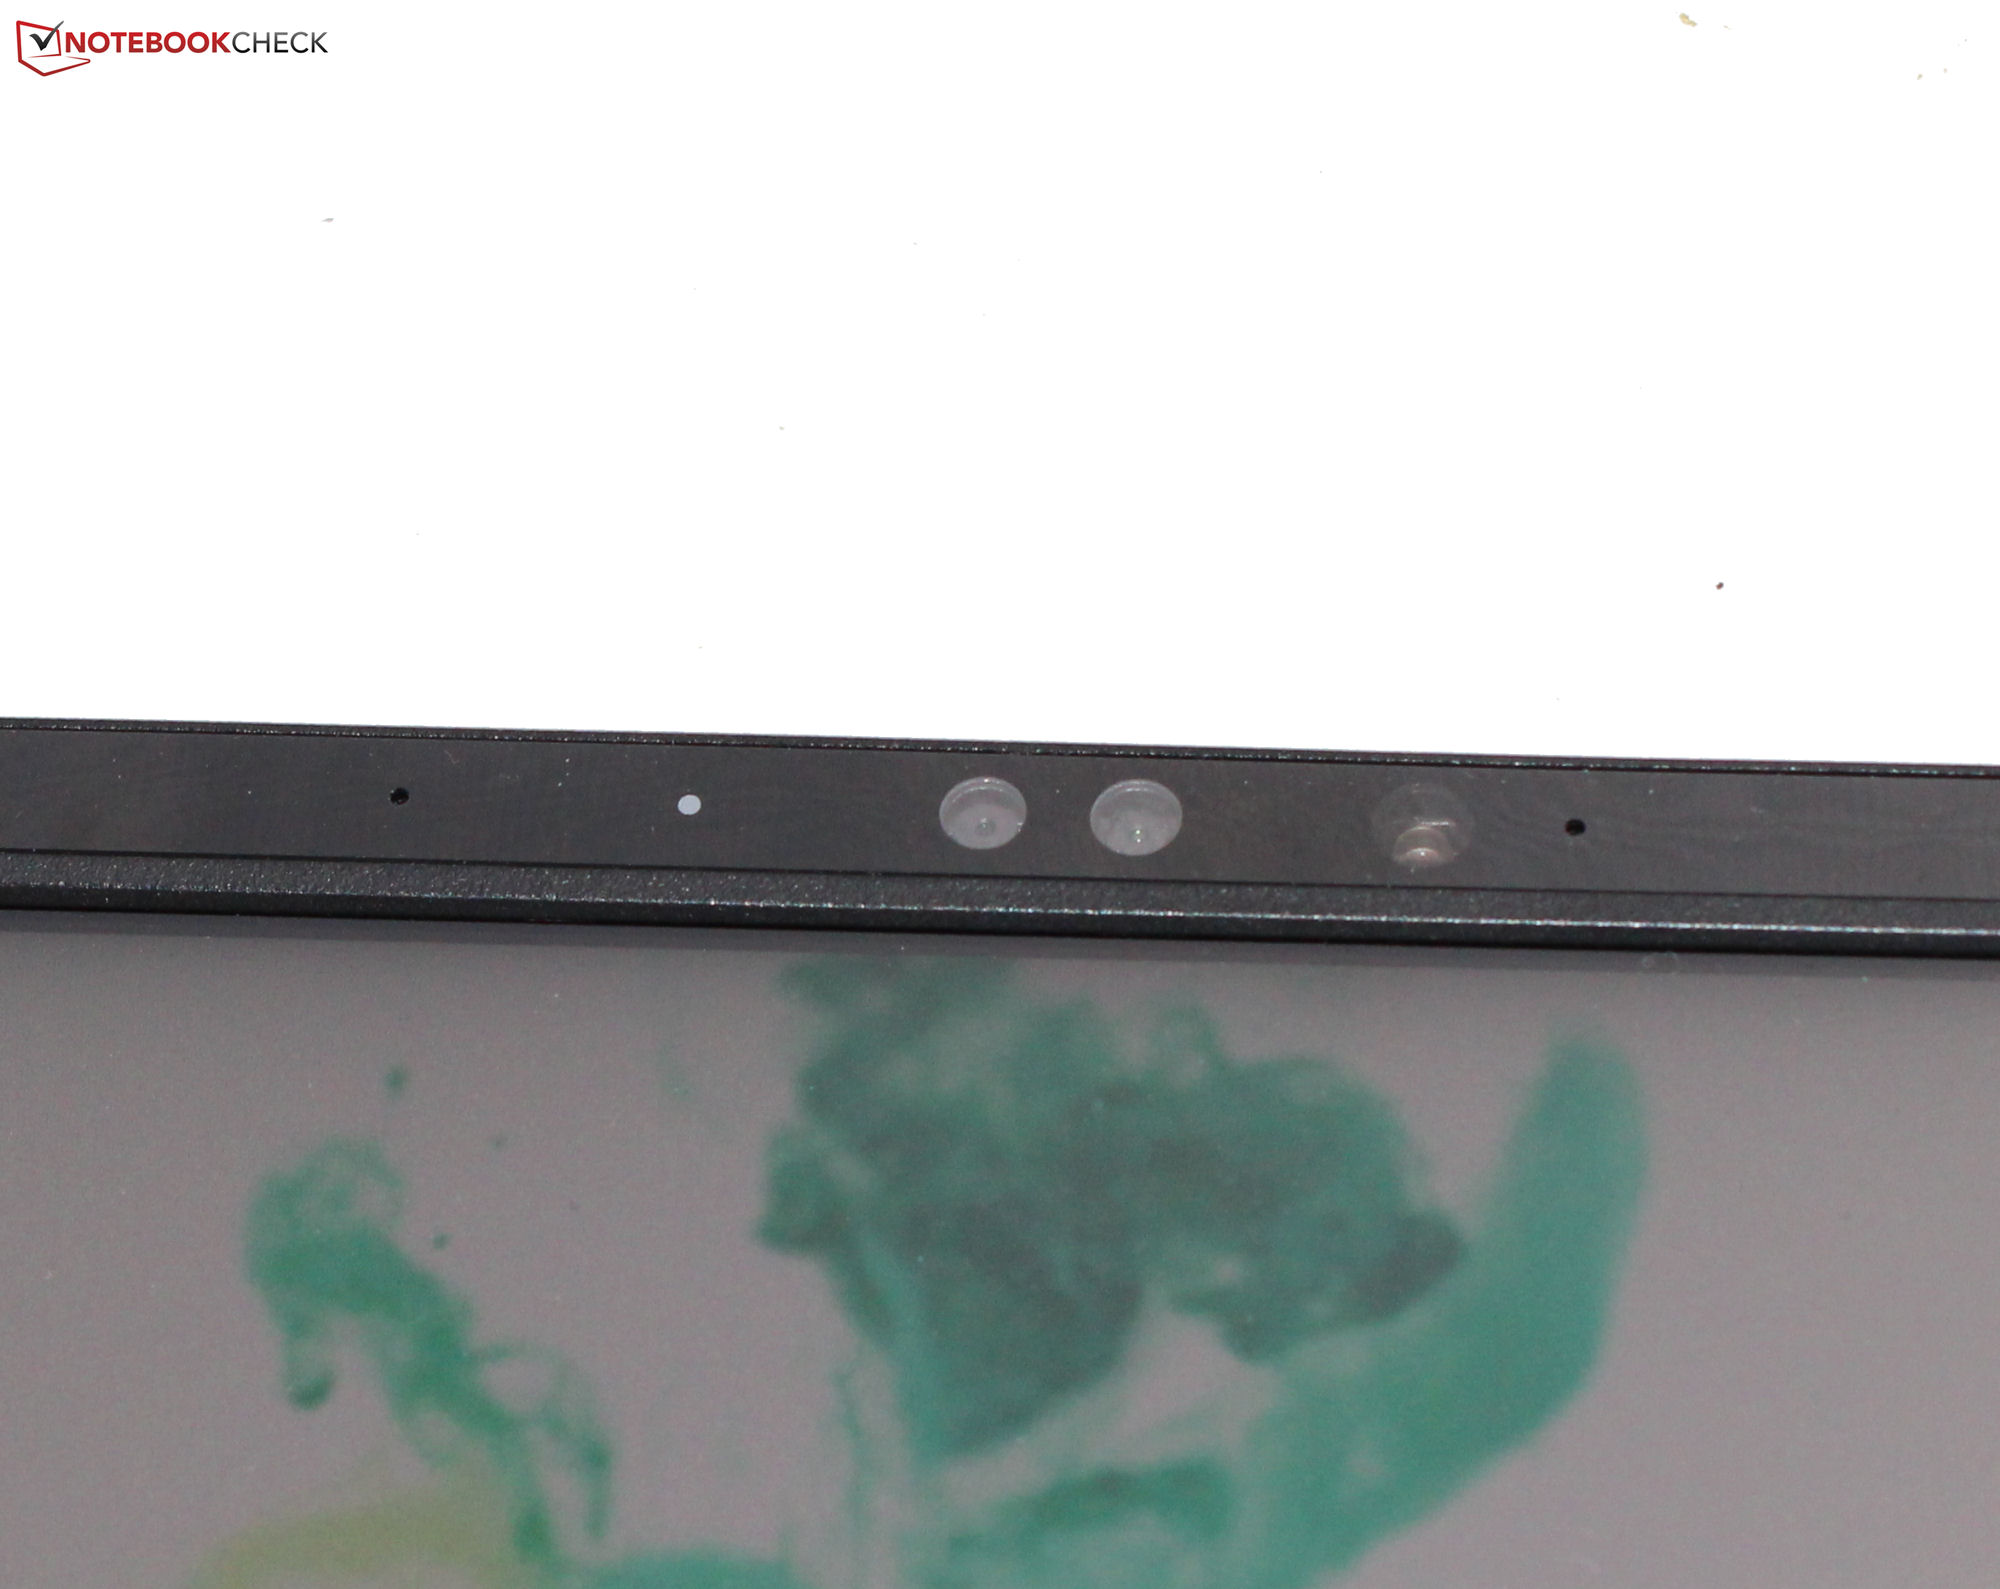
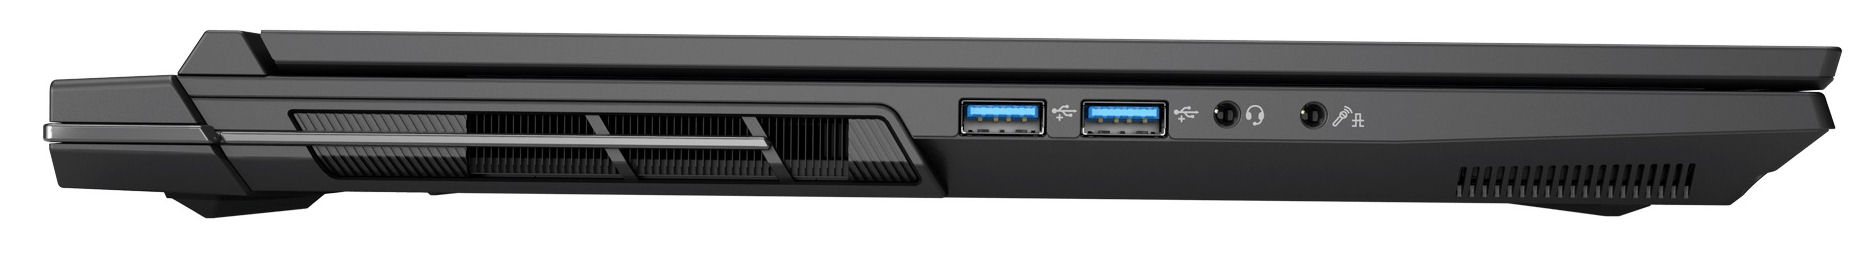
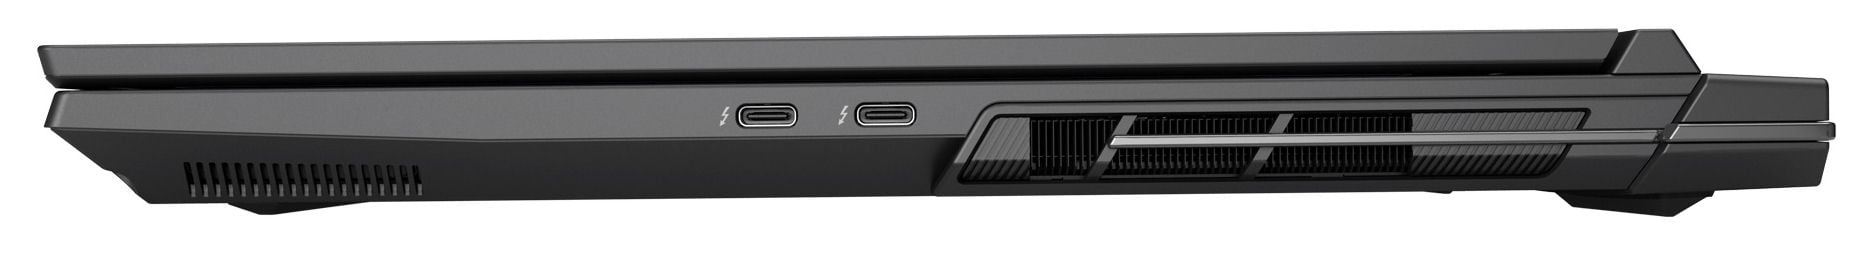
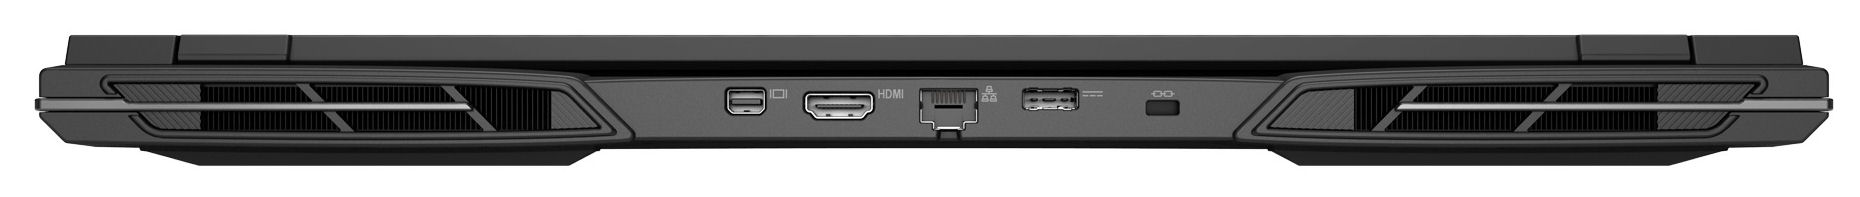
La clé dispose de deux ports USB-A (USB 3.2 Gen 2) et de deux ports USB-C (Thunderbolt 4). Un seul des ports Thunderbolt 4 prend en charge Power Delivery, mais les deux sont capables d'émettre un signal DisplayPort. L'ordinateur portable offre un total de quatre sorties vidéo (1x HDMI, 3x DP). Malheureusement, l'appareil n'est pas équipé d'un lecteur de cartes et la webcam (2,1 Mpx, résolution maximale de 1 920 x 1 080, pas d'obturateur de confidentialité) n'a rien d'extraordinaire.
Grâce à sa carte Wi-Fi 6E (Intel AX211), le Key 17 Pro est capable d'atteindre d'excellents débits de données Wi-Fi dans des conditions idéales (pas d'autres appareils Wi-Fi à proximité, courte distance entre l'ordinateur portable et le PC serveur). Les connexions filaires sont gérées par un contrôleur Killer E3100X (2,5 Gbit/s).

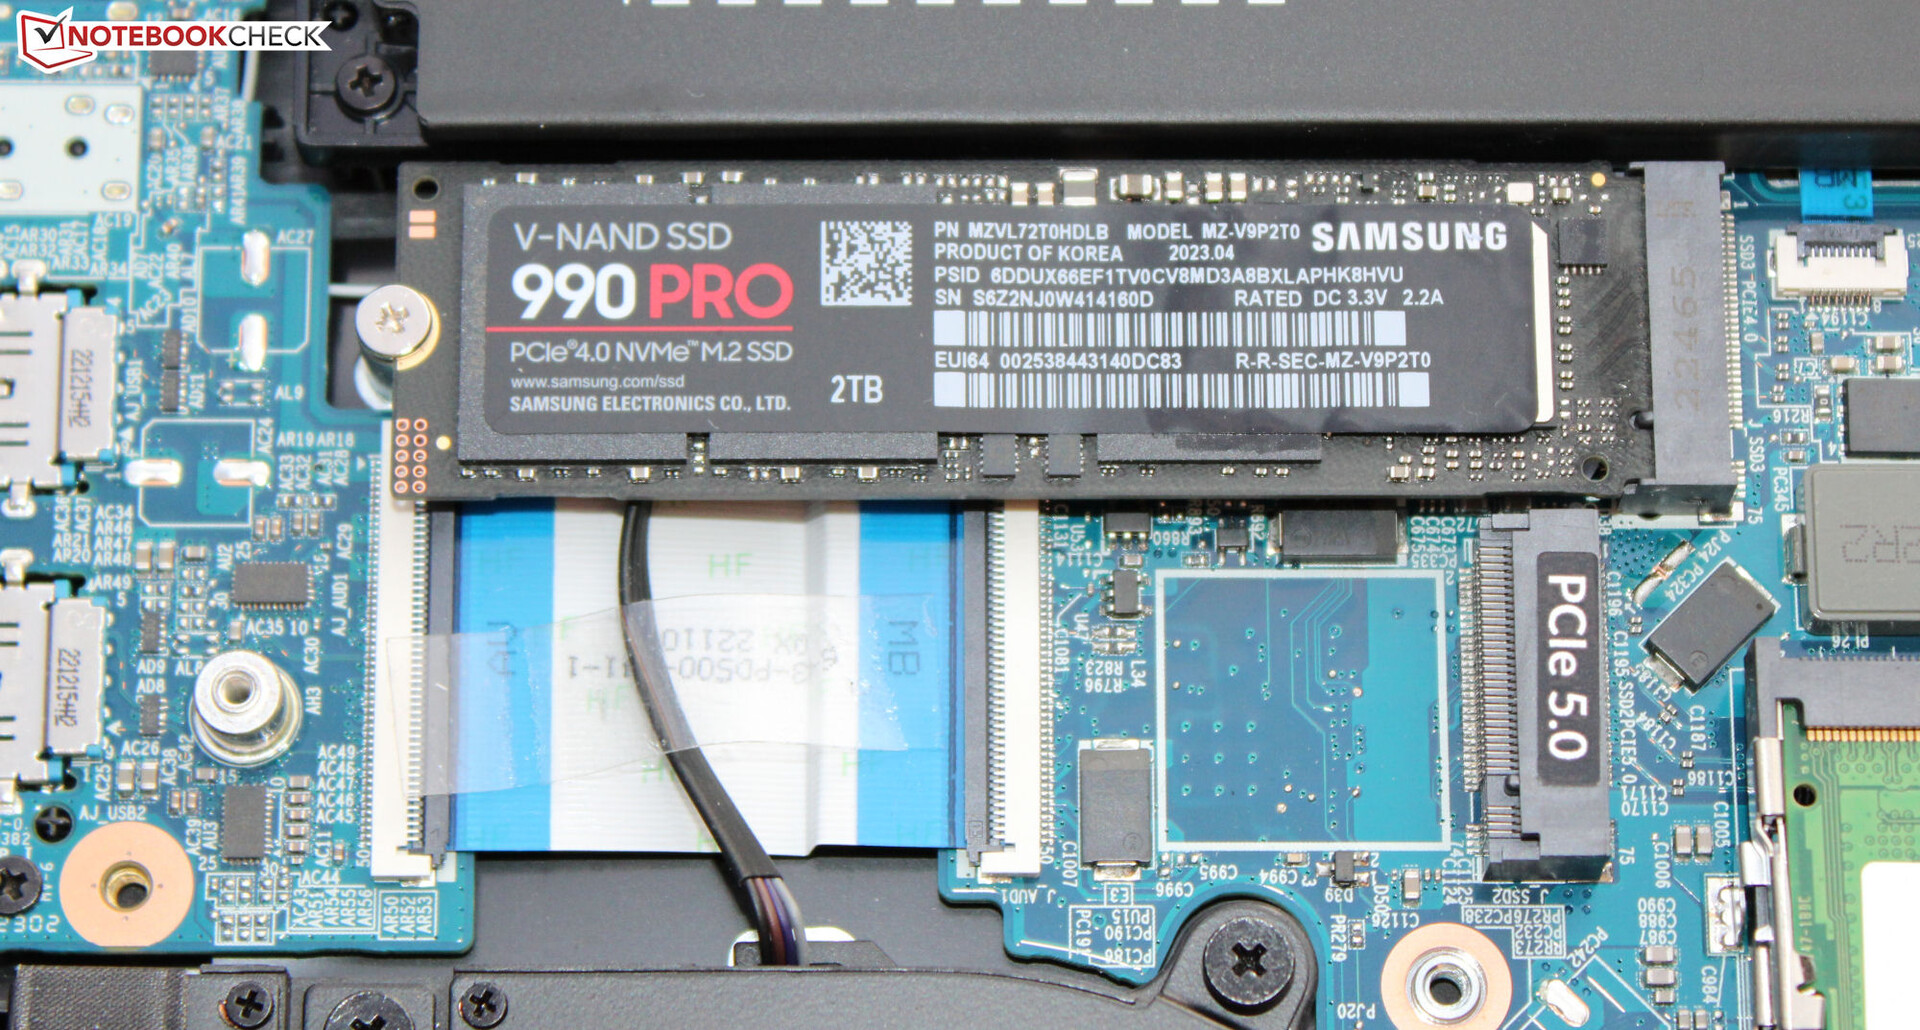
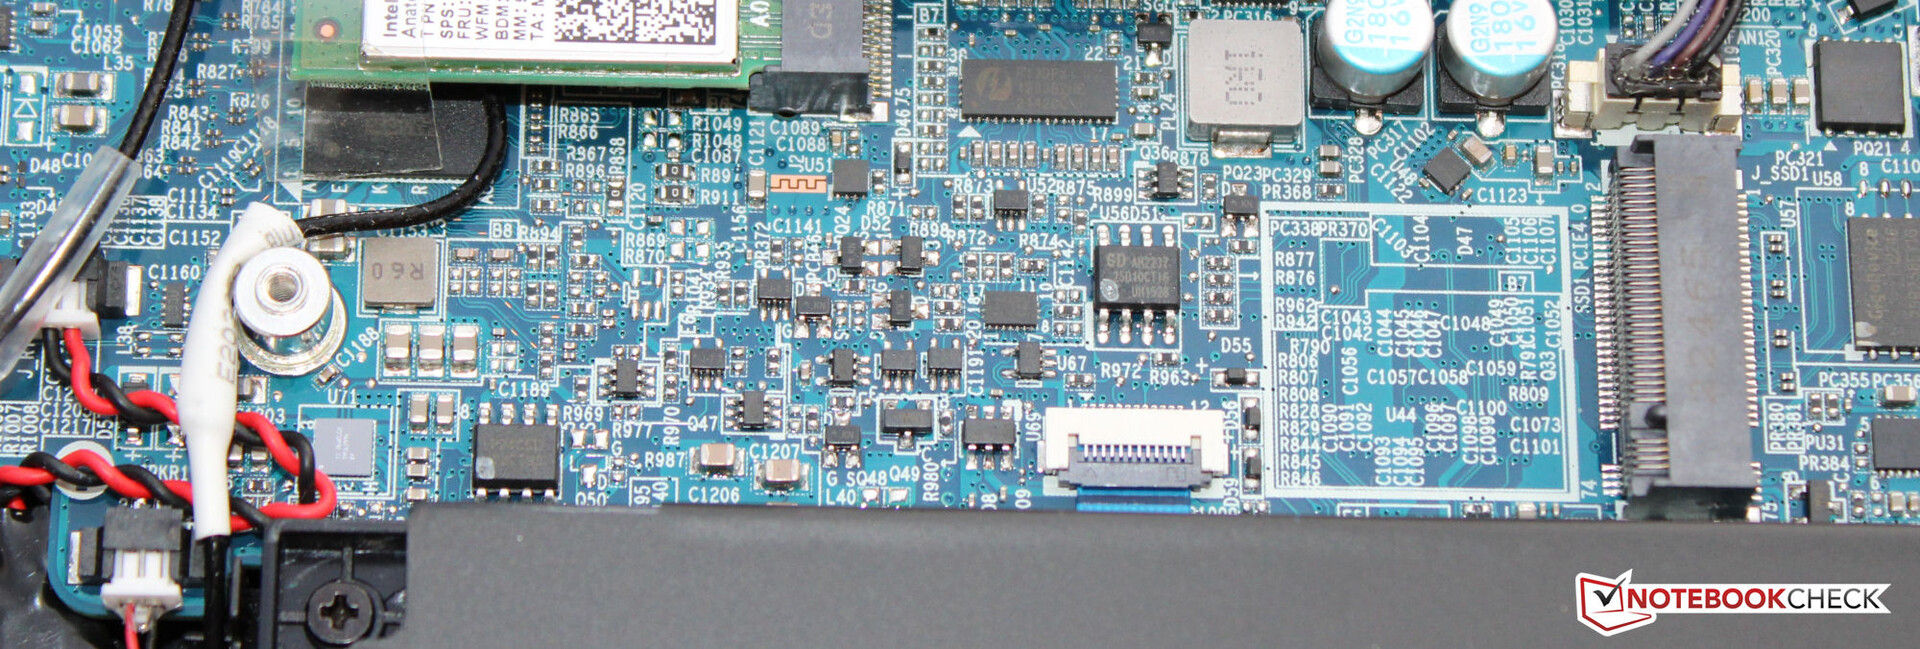
 GeForce RTX 4090 Laptop GPU, i9-13900HX, Samsung 990 Pro 2 TB MZVL72T0HDLB")
 GeForce RTX 4090 Laptop GPU, i9-13900HX, Samsung 990 Pro 2 TB MZVL72T0HDLB")
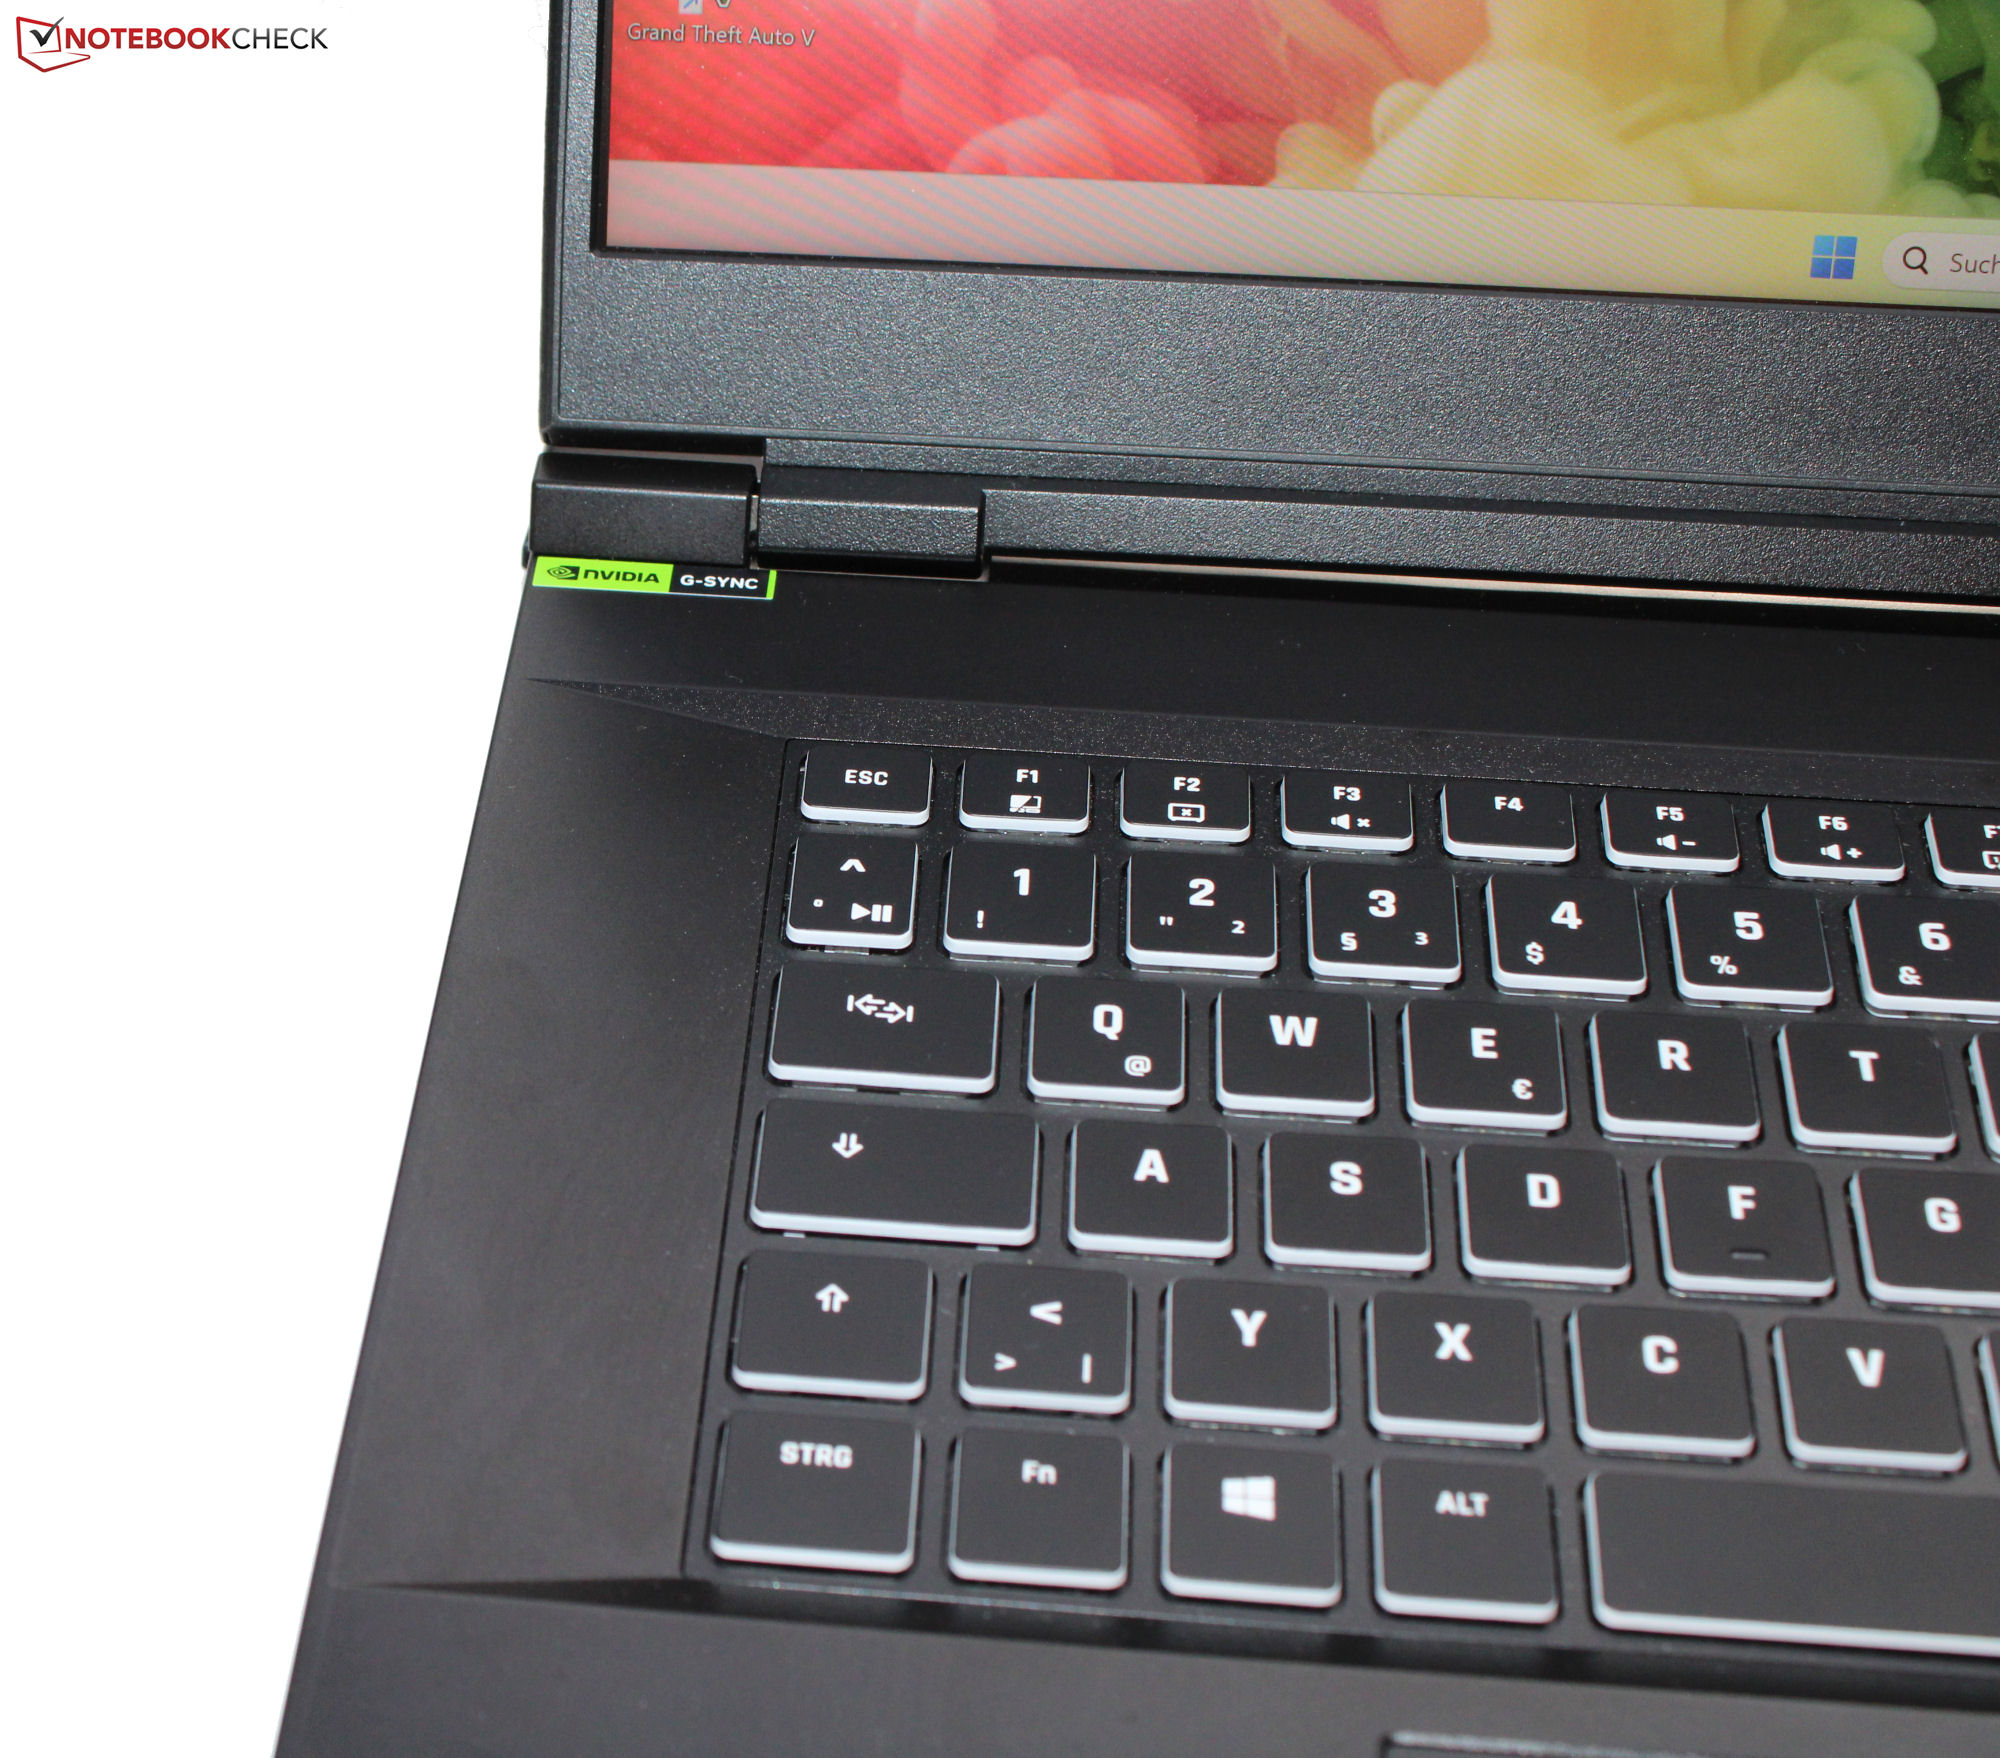
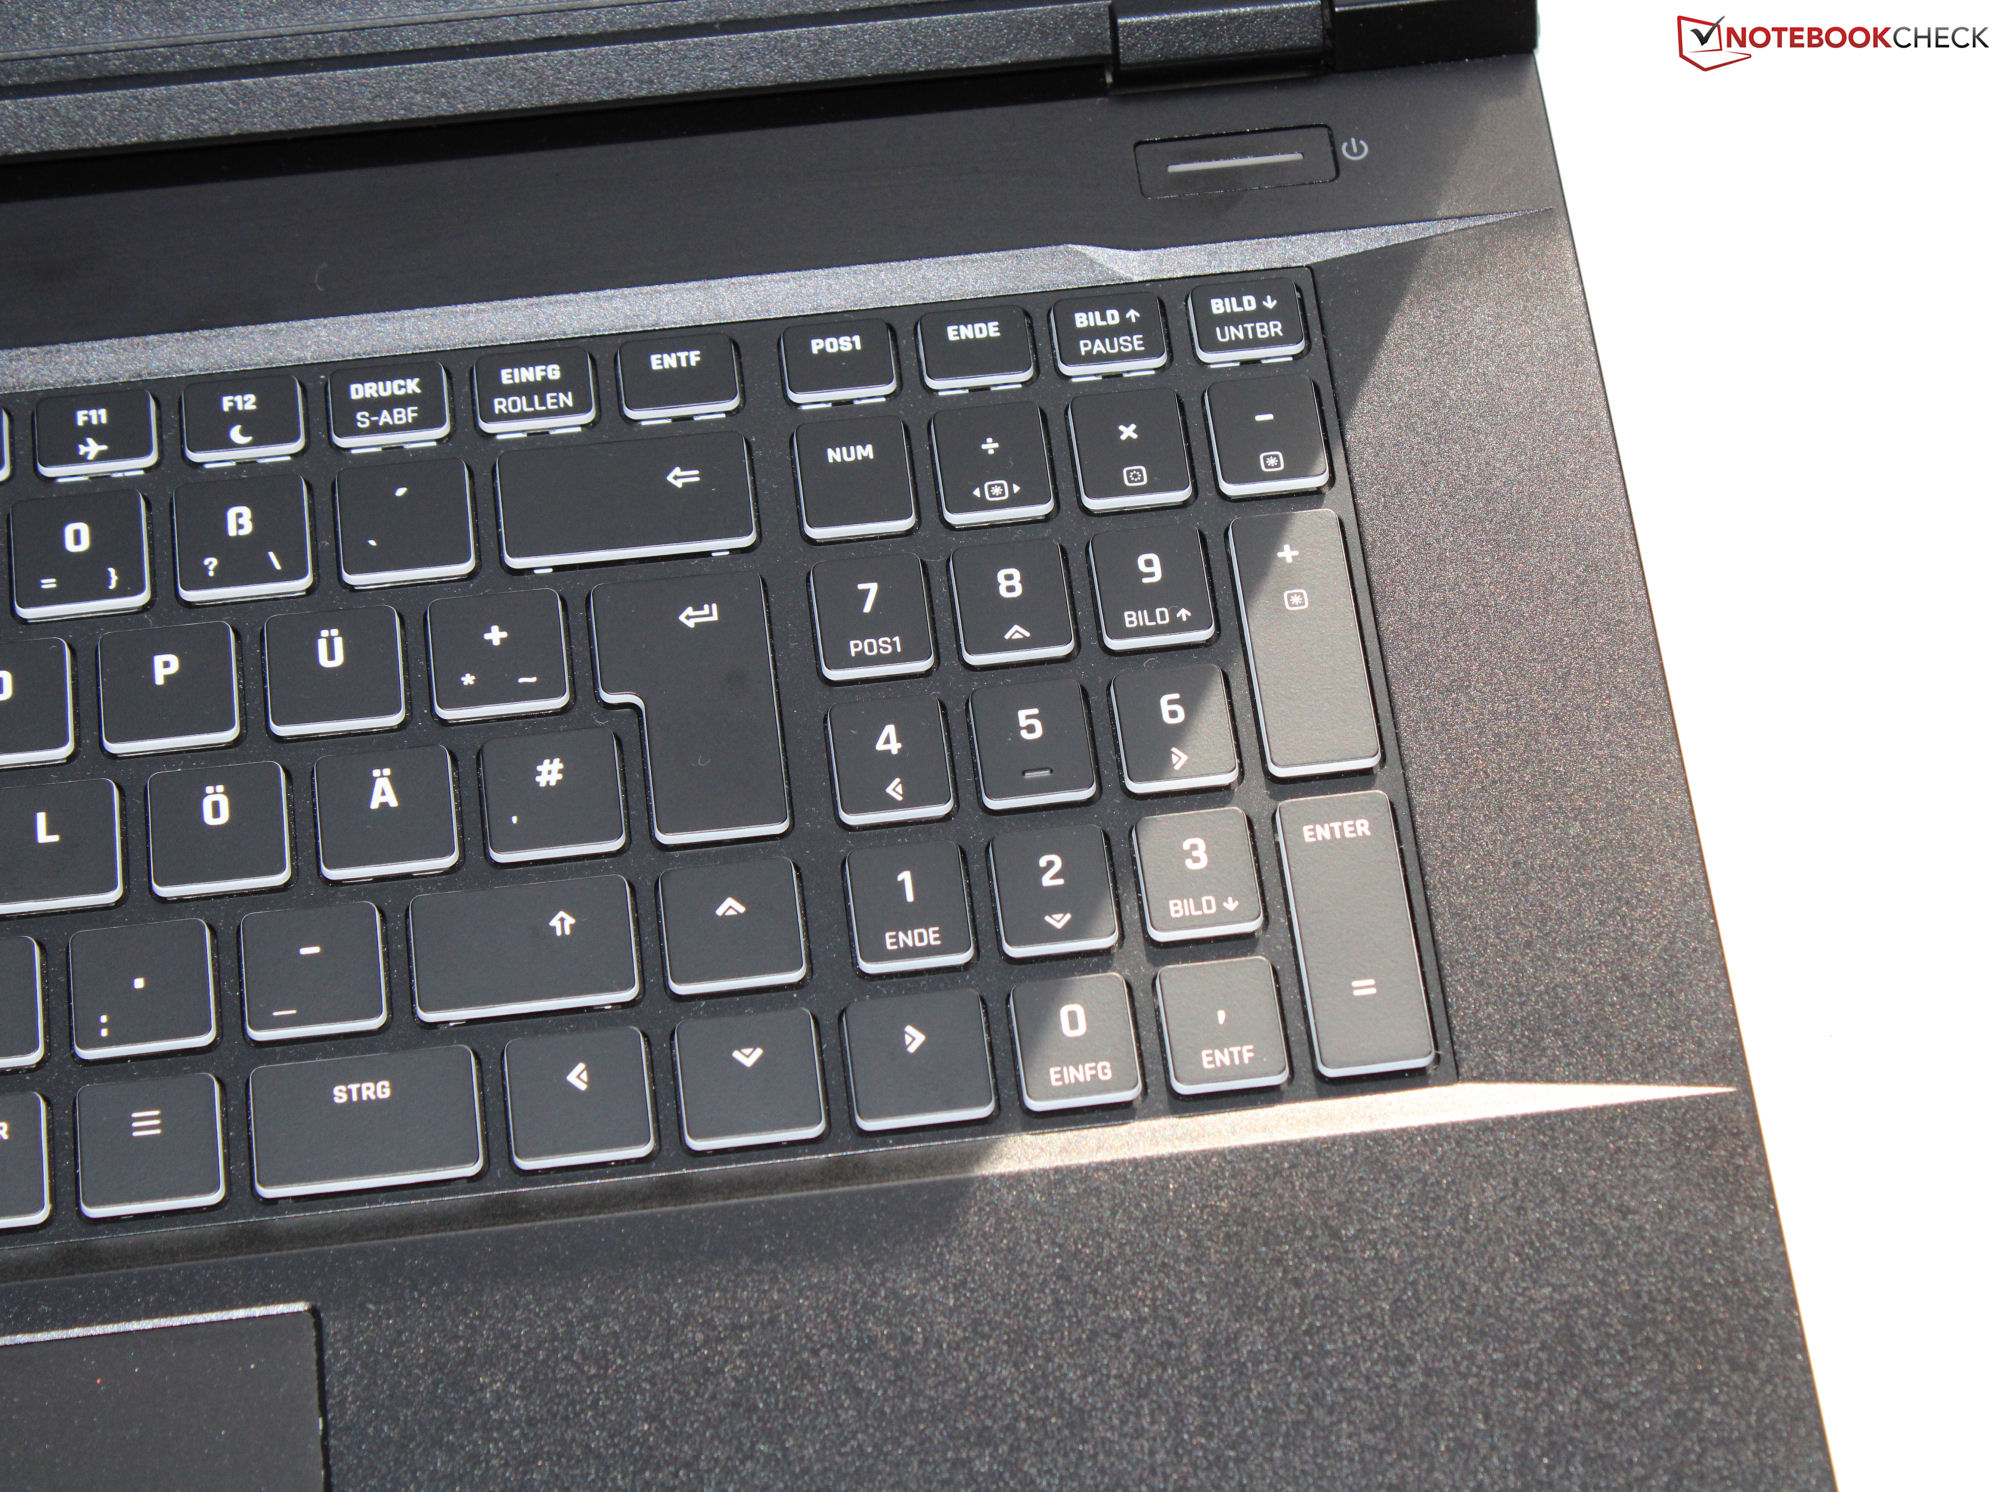
Périphériques d'entrée - Ordinateur portable Schenker avec RGB par touche
Les touches plates et lisses du clavier chiclet (avec éclairage RVB par touche) ont une course modérée et un point d'action distinctif. Cependant, la résistance des touches pourrait être plus nette à notre avis. Le clavier fléchit un peu pendant la frappe, mais Schenker a livré un clavier adéquat pour un usage quotidien. Le Key 17 Pro dispose également d'un pavé tactile (mesurant environ 15 x 9,1 cm, ou 5,9 x 3,6") avec une courte distance de déplacement et un point d'enclenchement clair.
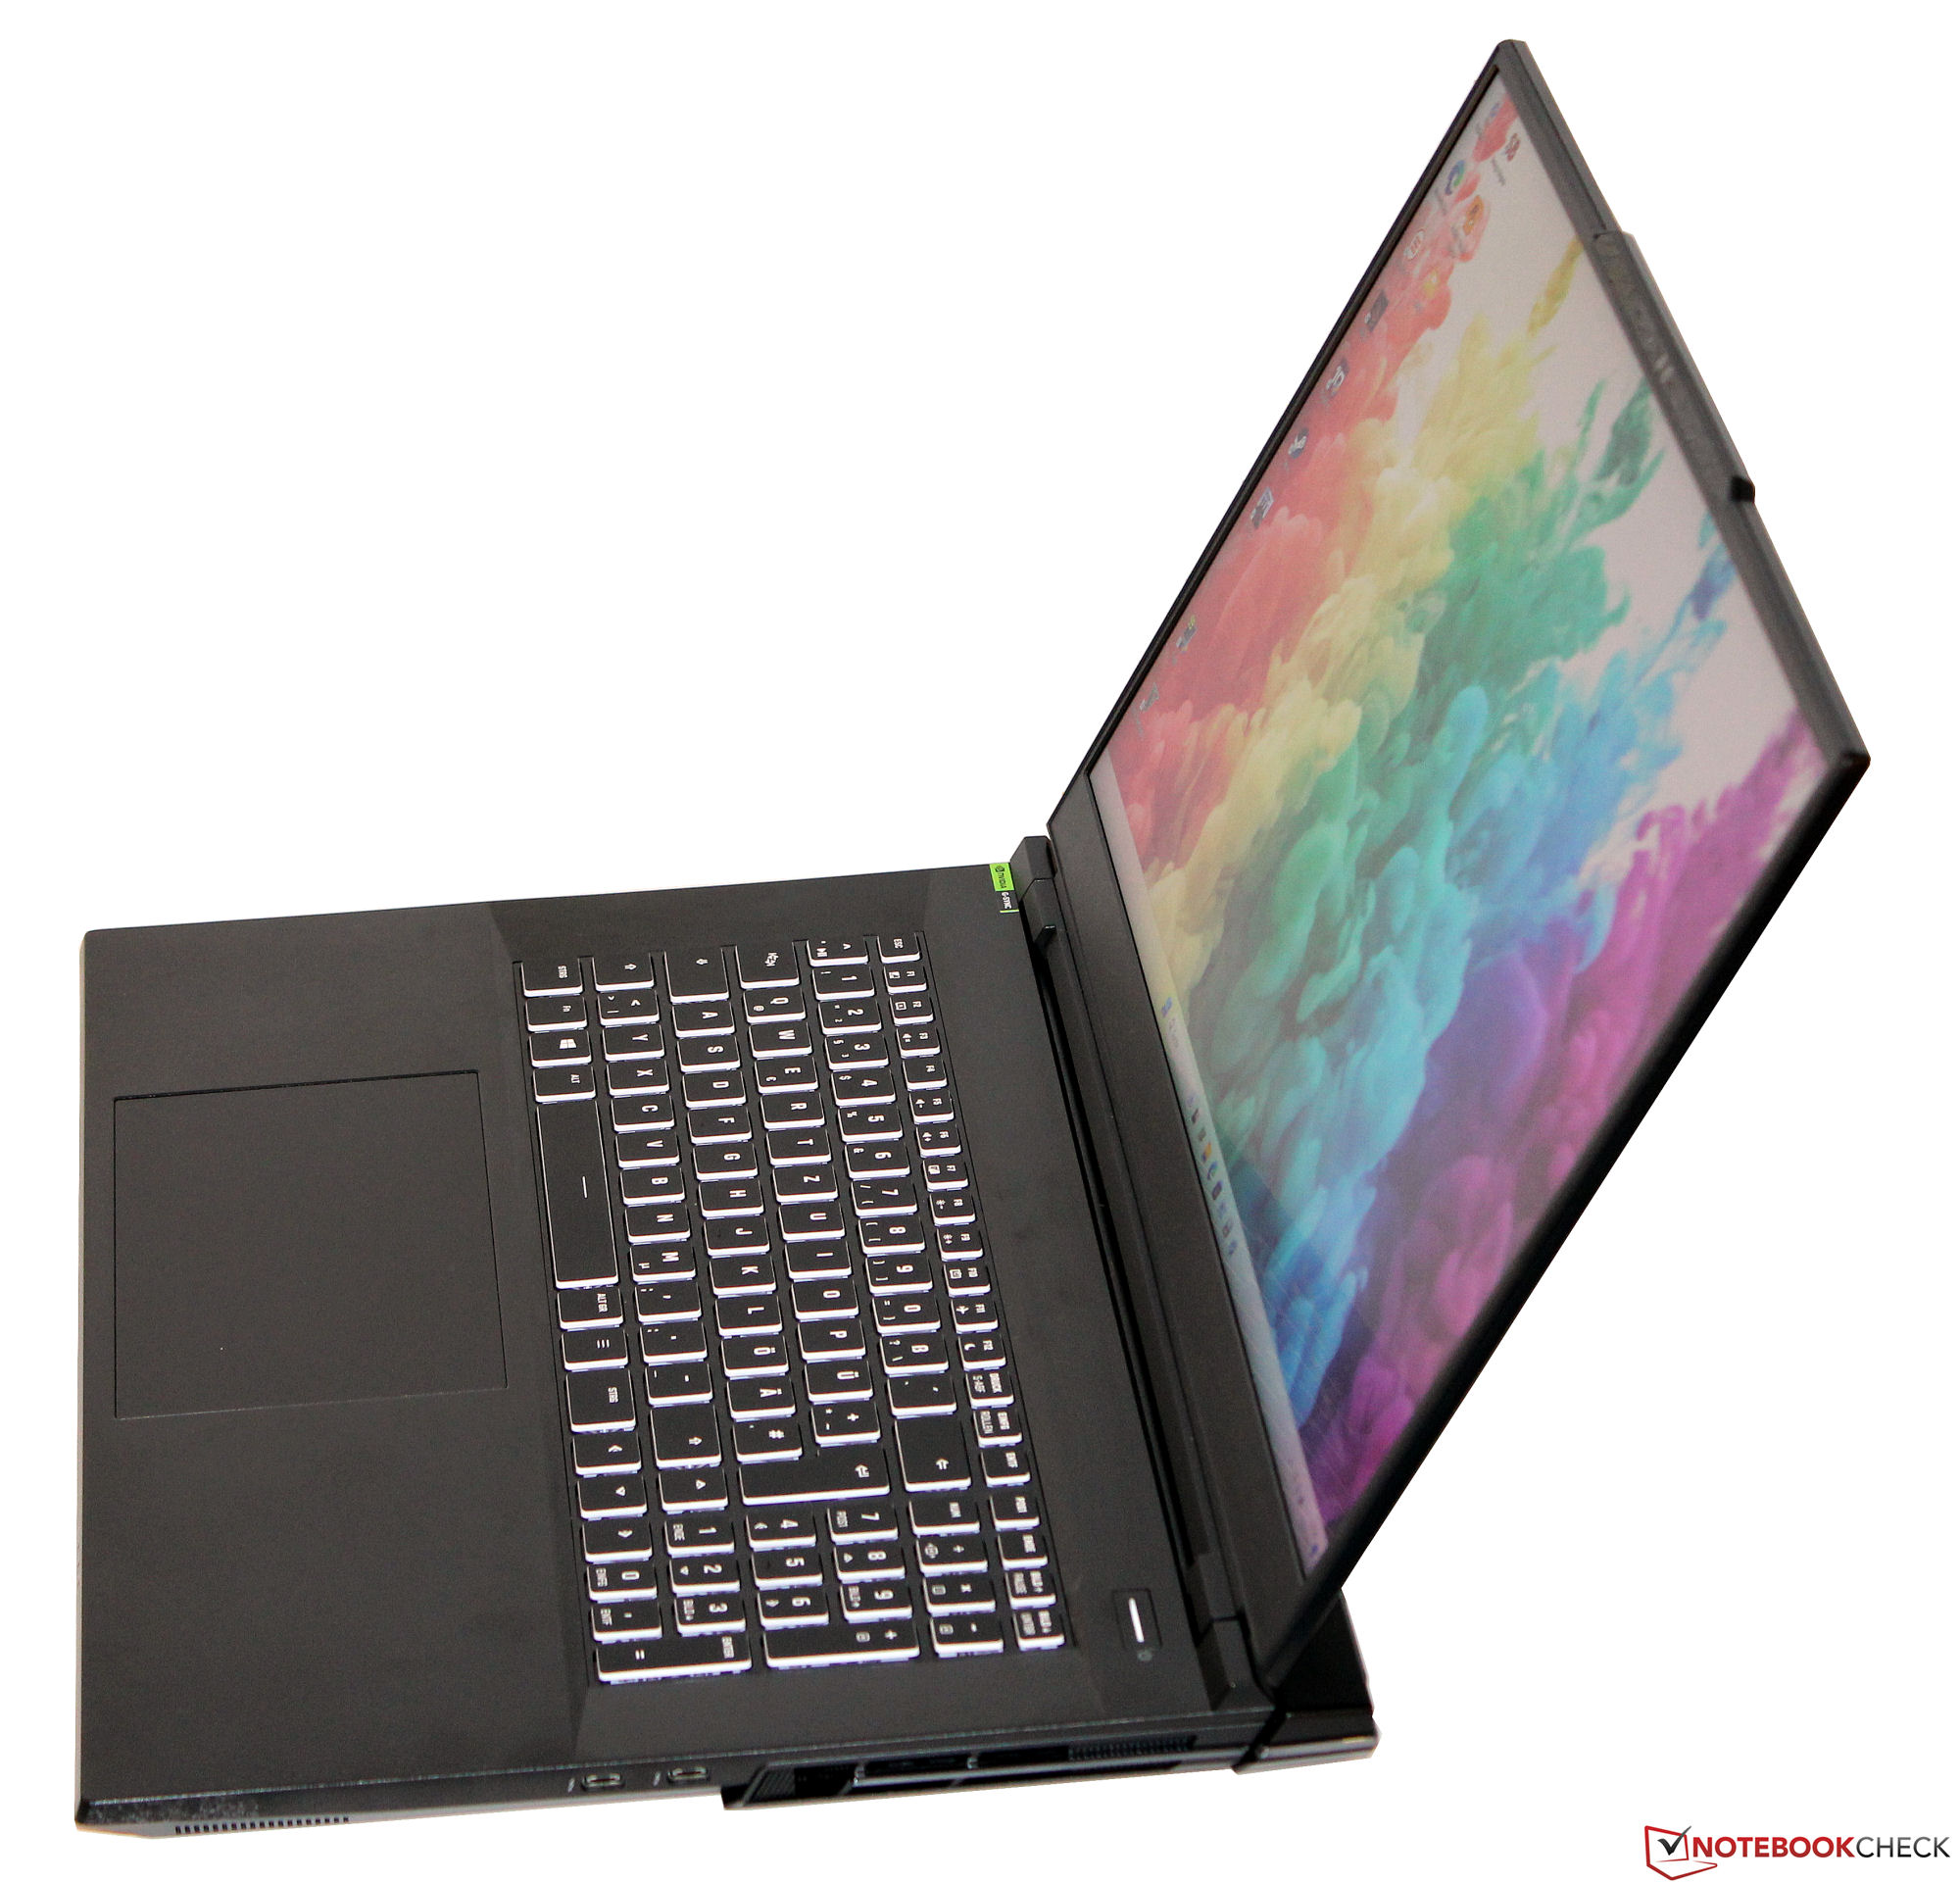
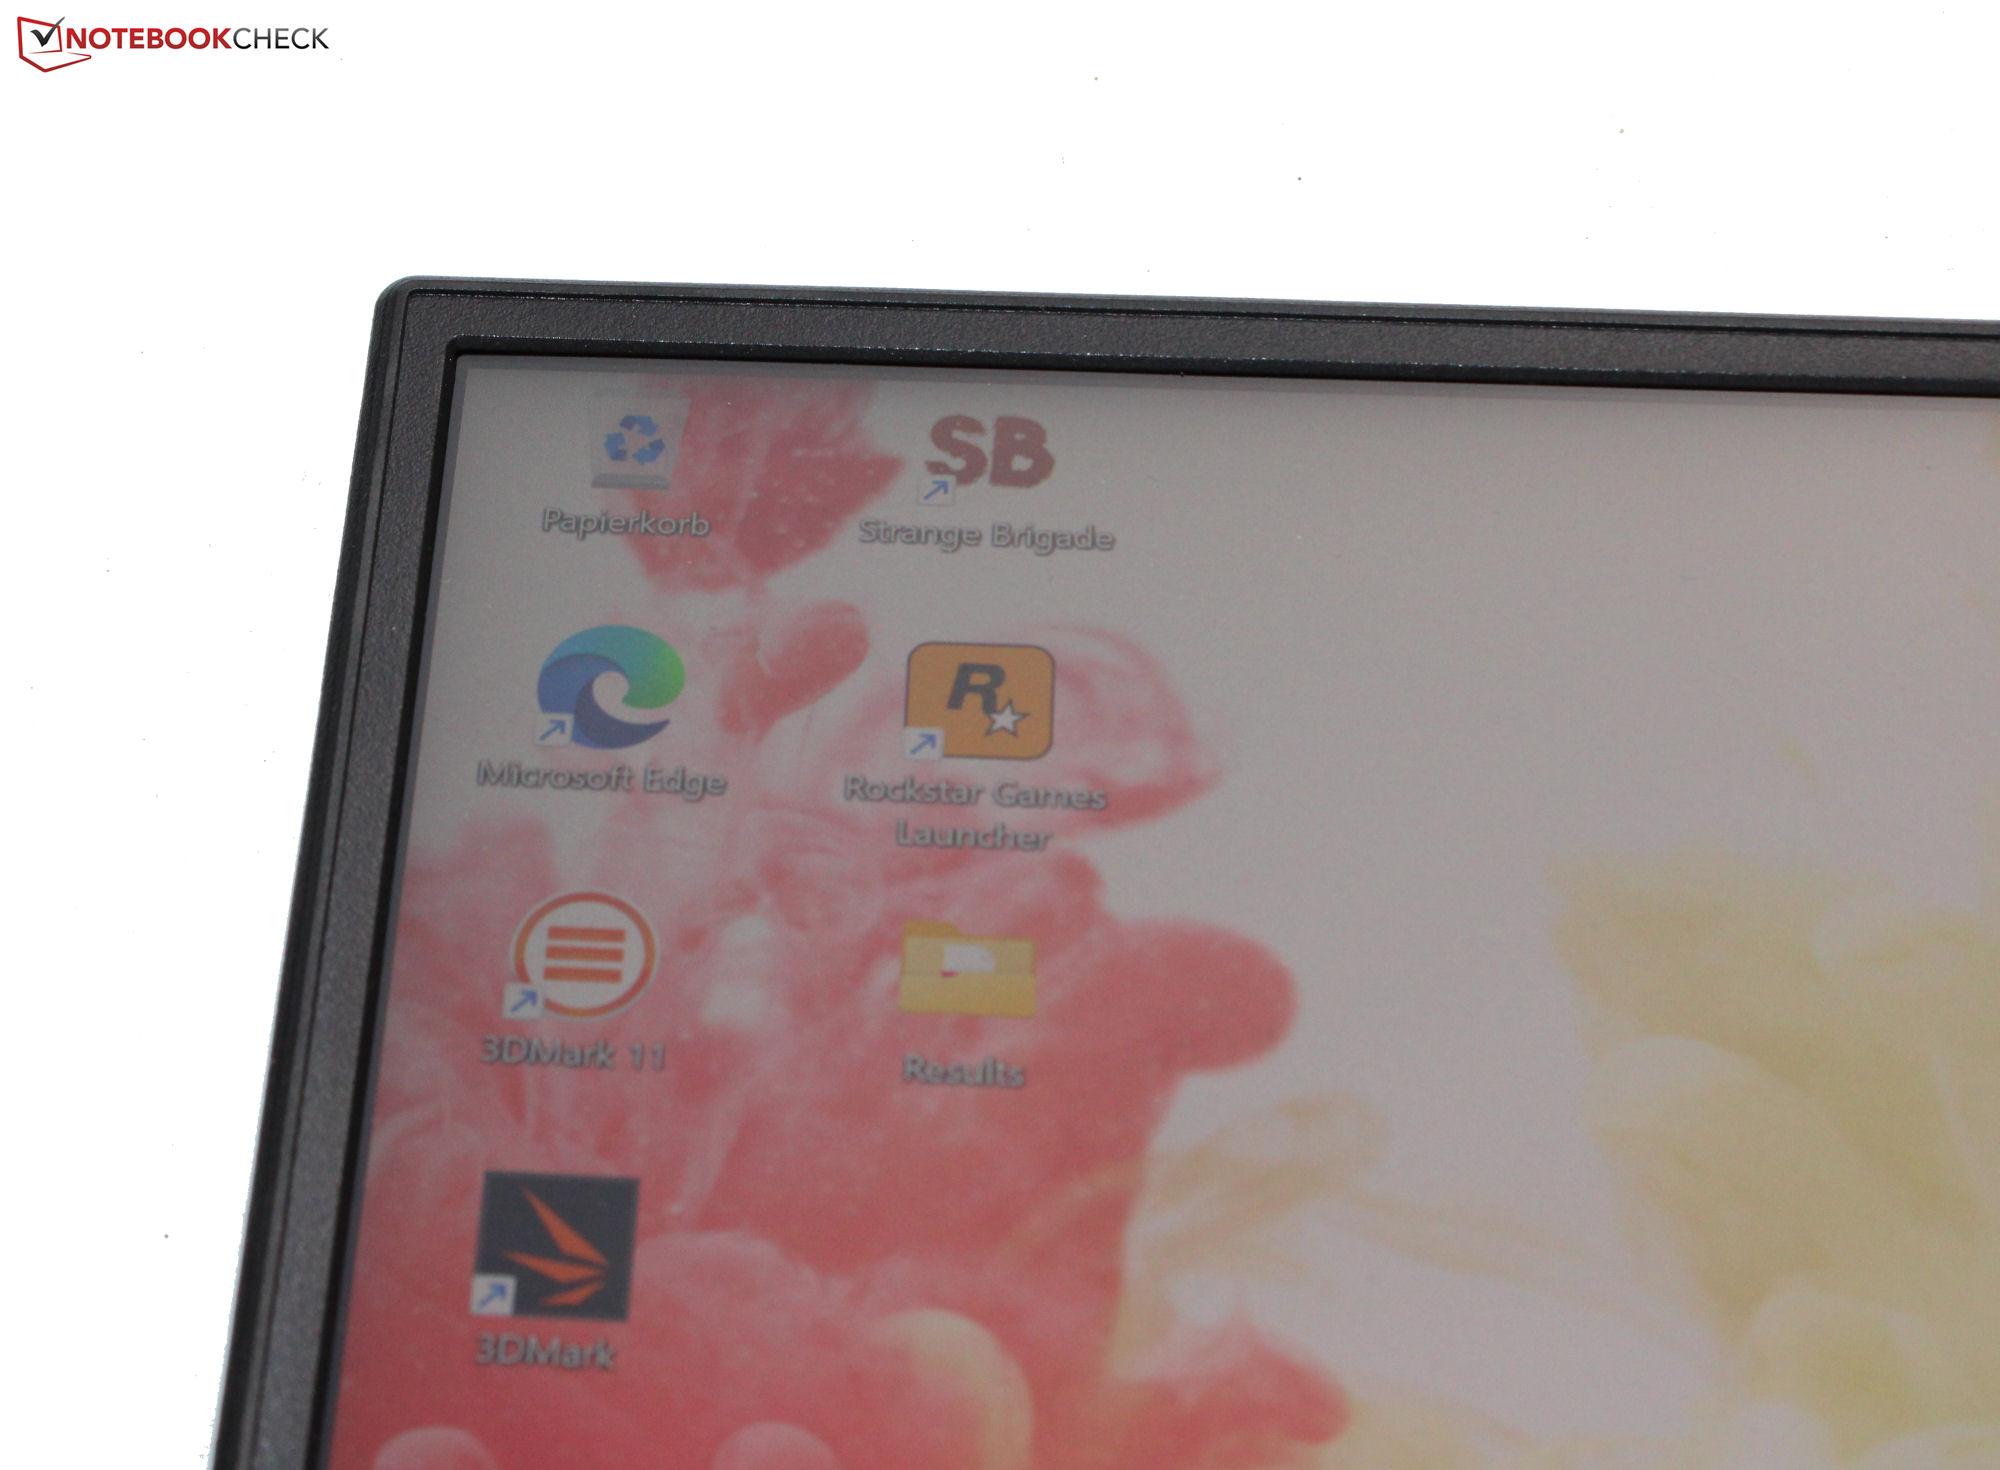
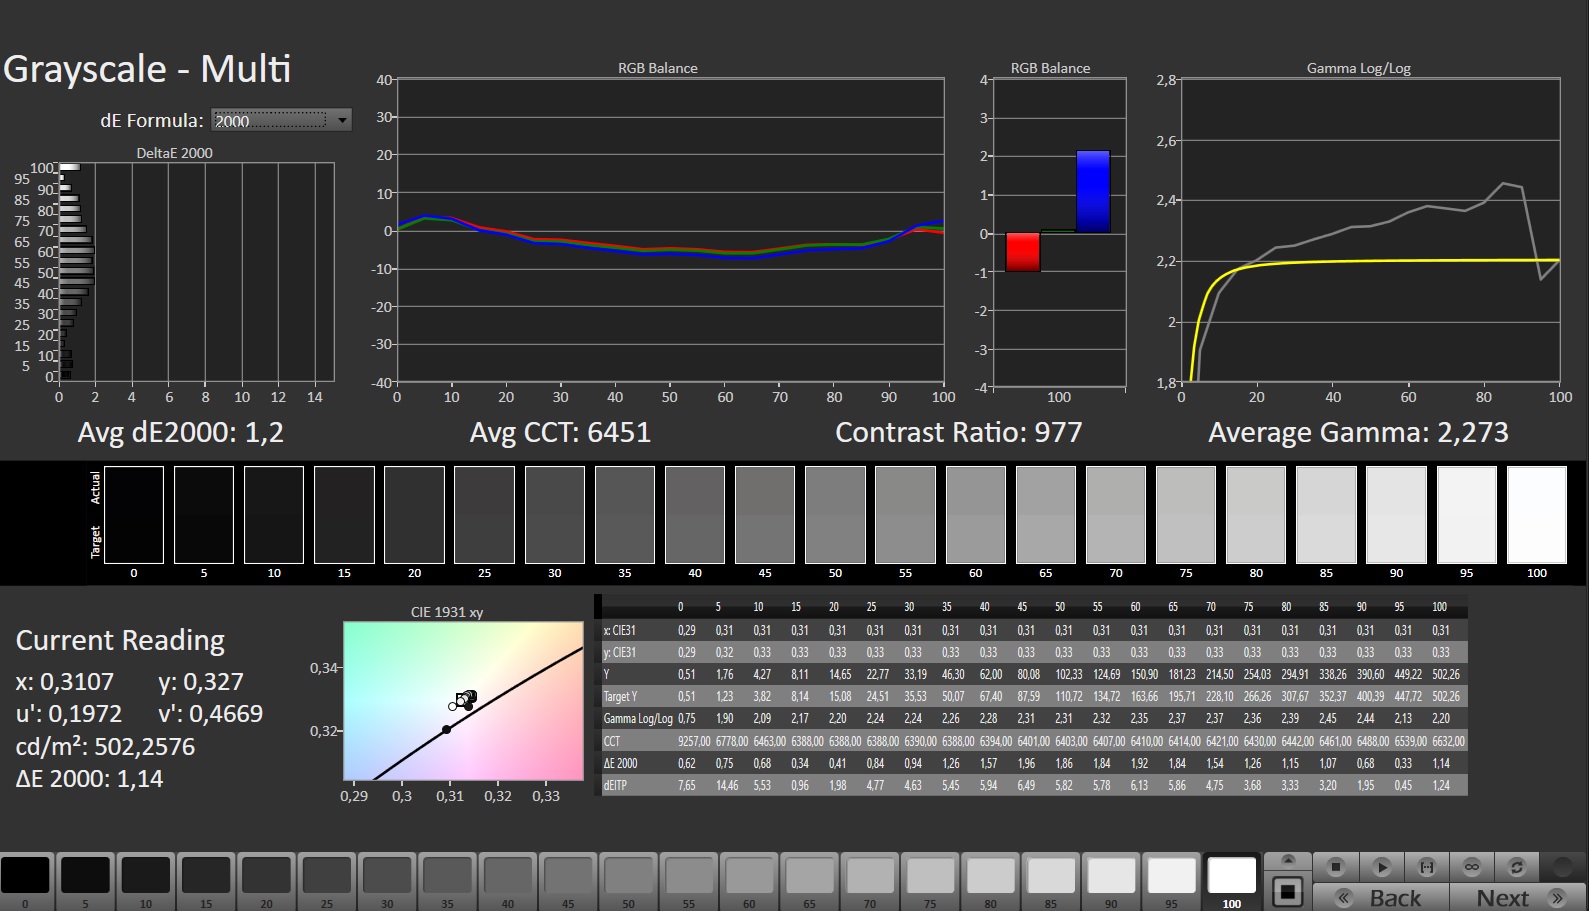
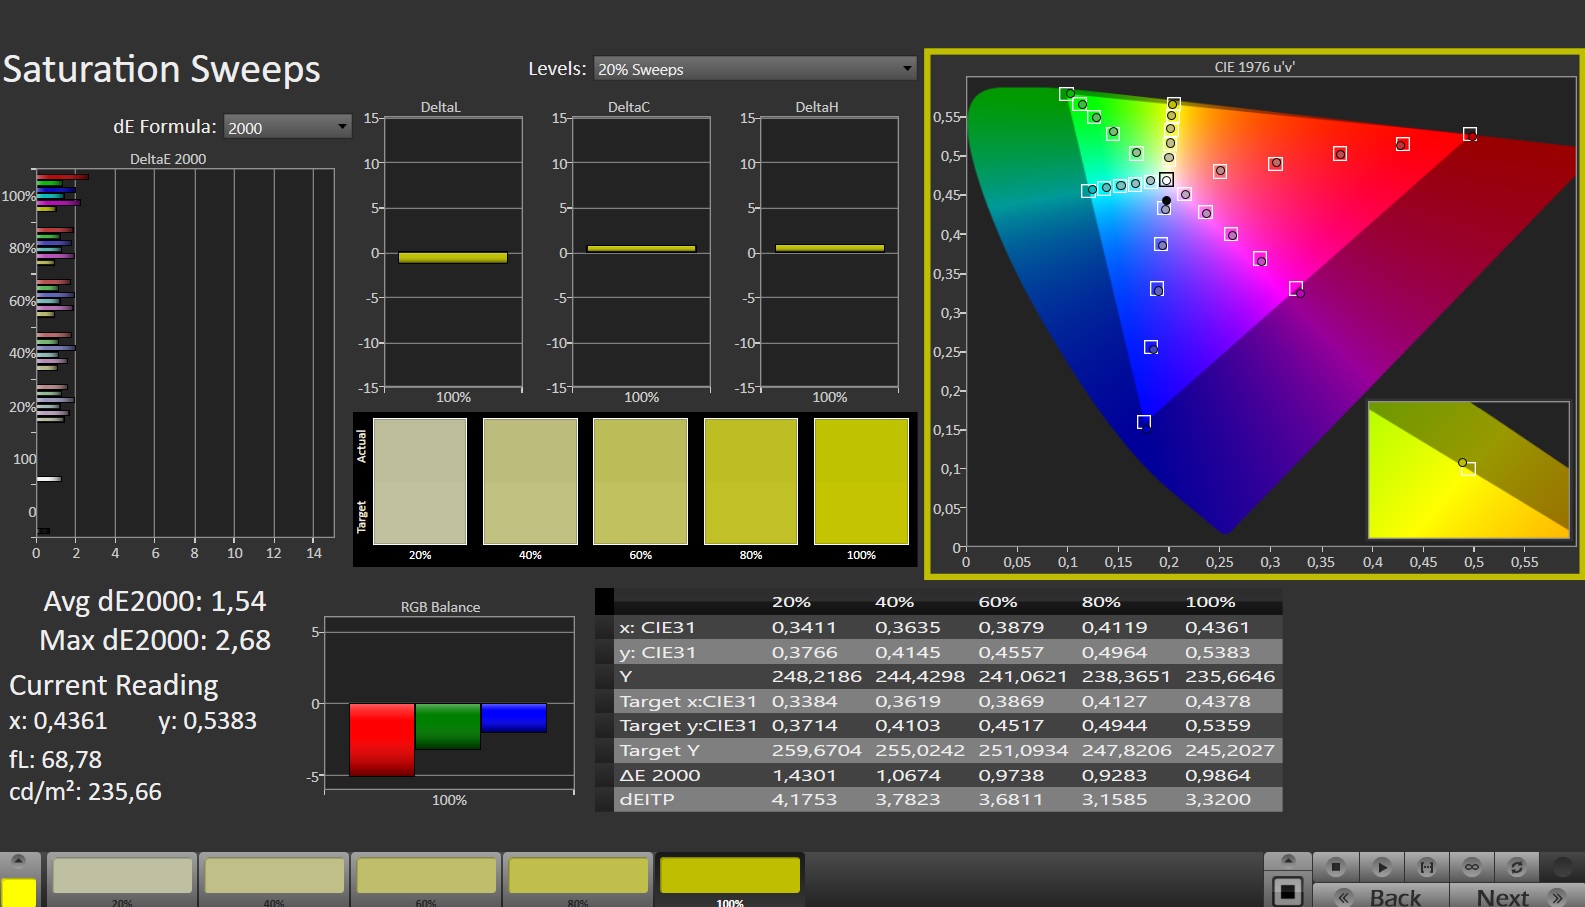
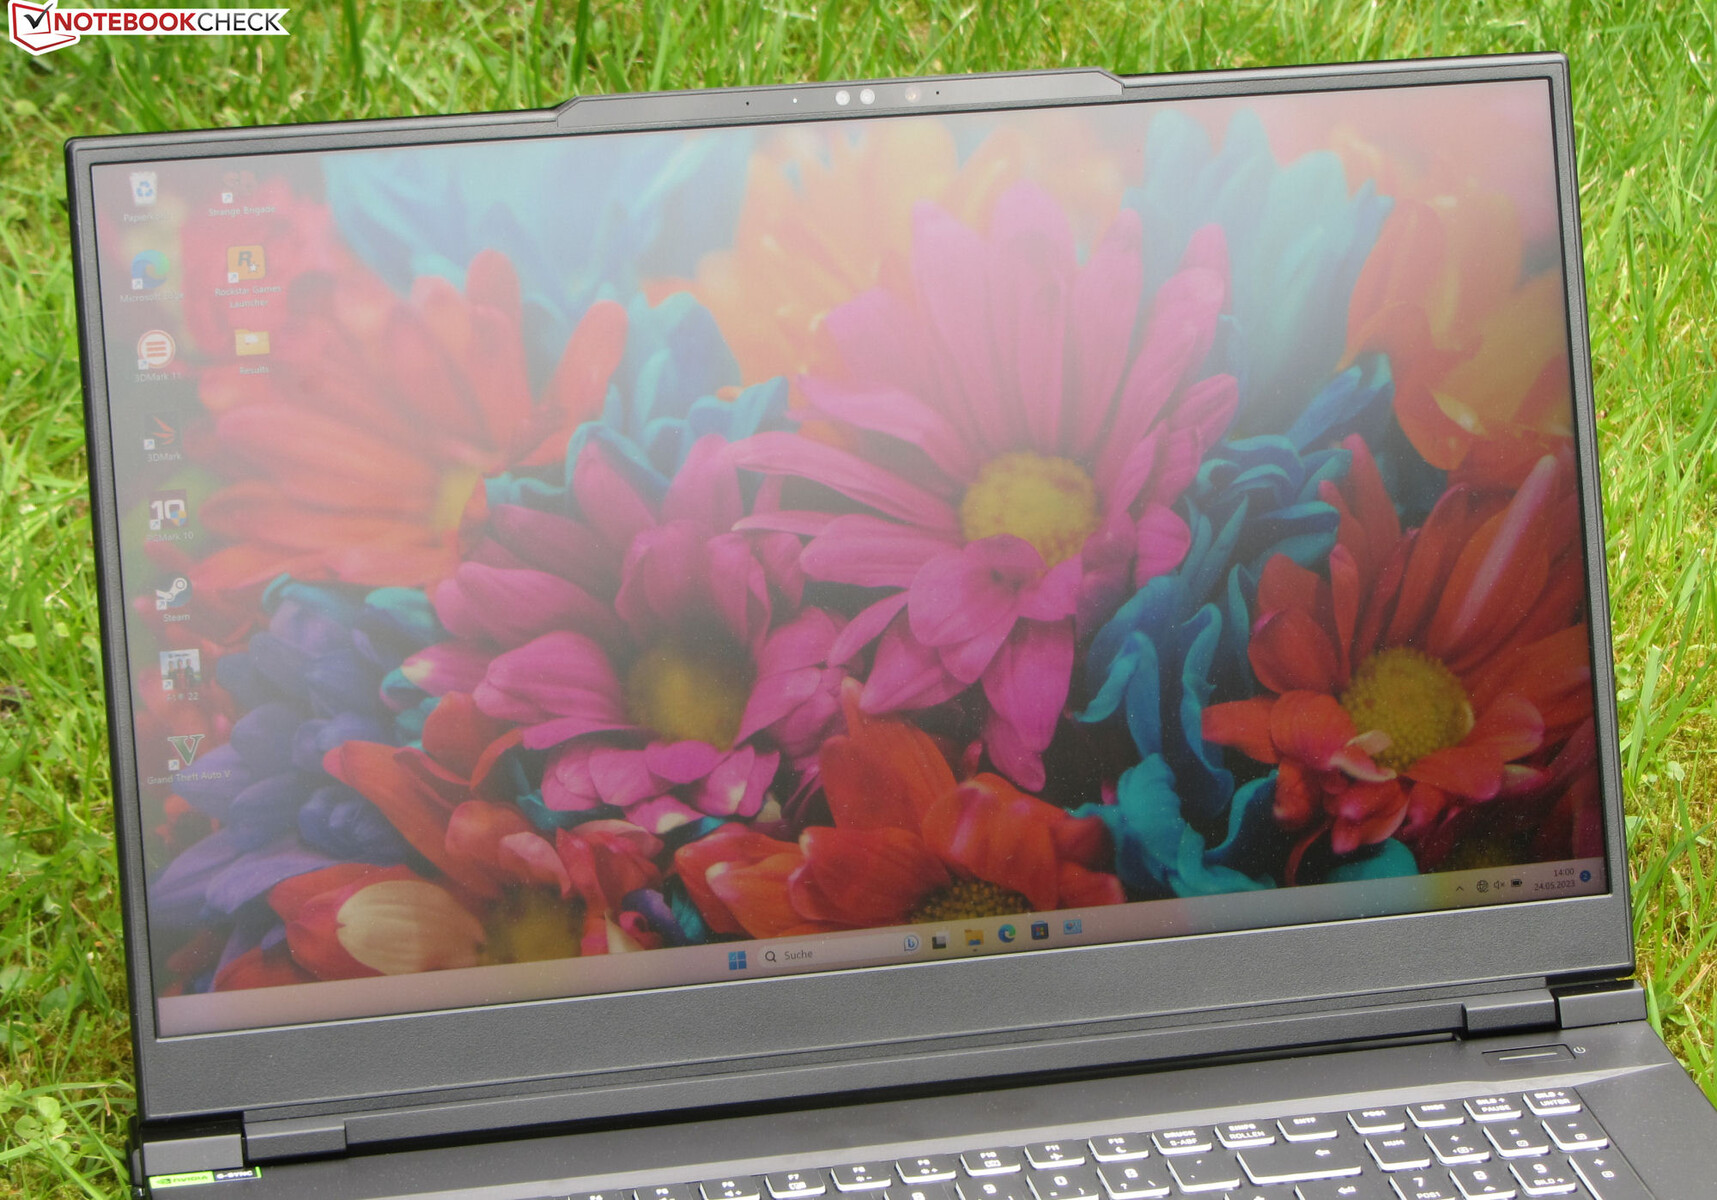
Affichage - Panneau UHD avec couverture DCI-P3
Outre l'écran IPS 4K (3 840 x 2 150 pixels, 144 Hz) de l'appareil testé, Schenker propose également le Key 17 Pro avec un écran IPS QHD (2 560 x 1 440 pixels, 240 Hz) - les deux écrans de 17,3 pouces prennent en charge la technologie G-Sync.
La dalle 4K se caractérise par sa grande luminosité et l'absence de scintillement PWM. Elle offre également un taux de rafraîchissement élevé (144 Hz) et des temps de réponse rapides. Cela dit, le rapport de contraste n'est pas à la hauteur (> 1 000:1).
| |||||||||||||||||||||||||
Homogénéité de la luminosité: 87 %
Valeur mesurée au centre, sur batterie: 487 cd/m²
Contraste: 955:1 (Valeurs des noirs: 0.51 cd/m²)
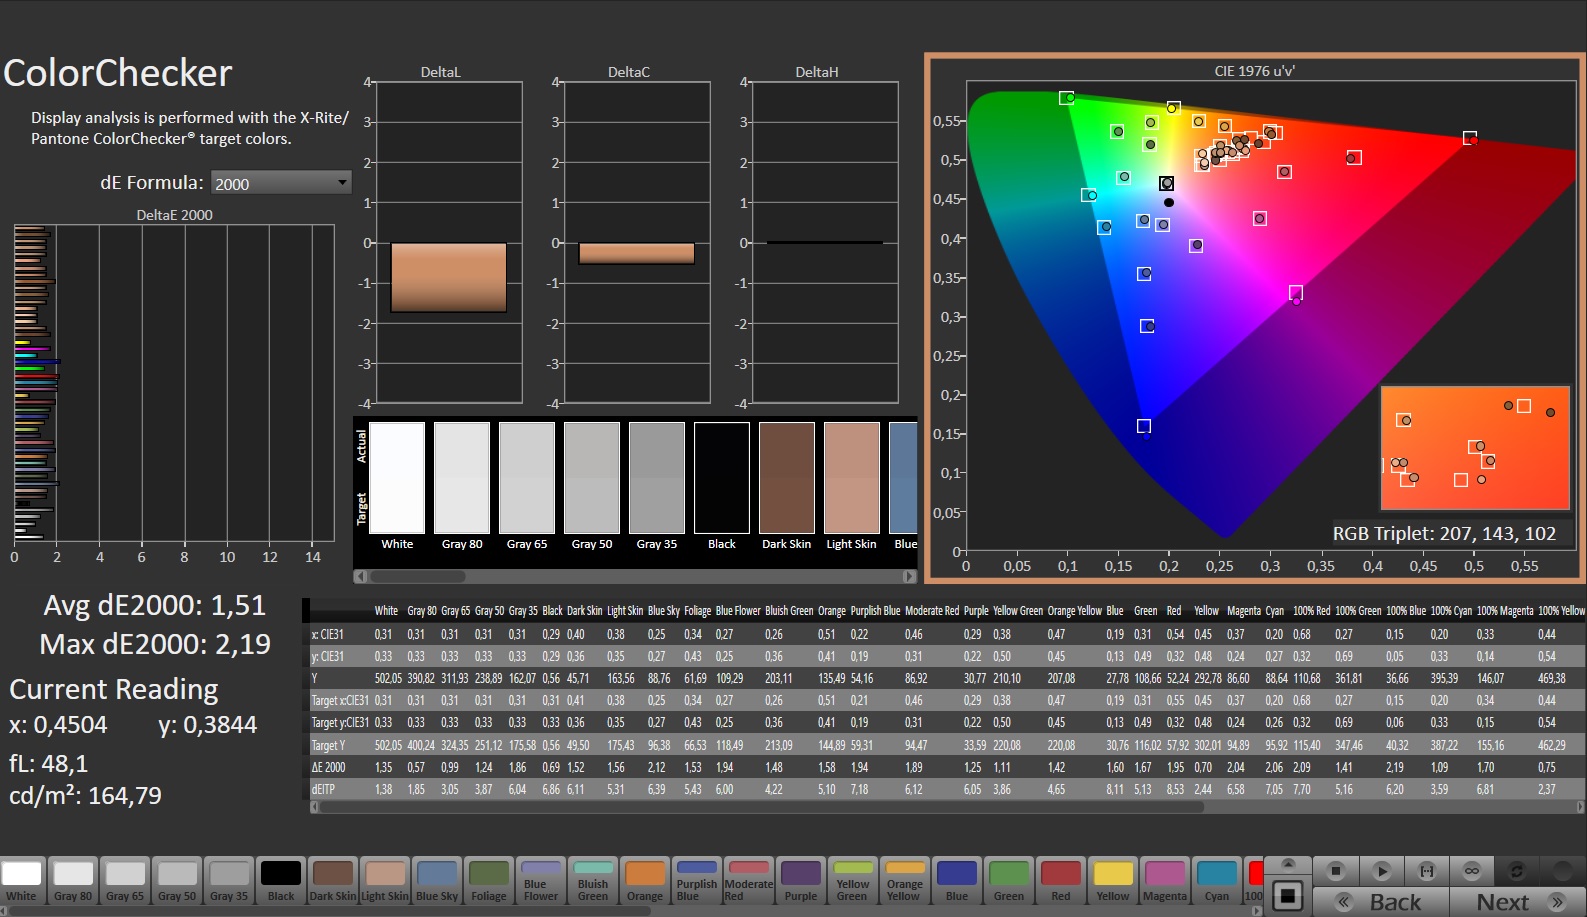
ΔE ColorChecker Calman: 1.51 | ∀{0.5-29.43 Ø4.71}
ΔE Greyscale Calman: 1.2 | ∀{0.09-98 Ø4.96}
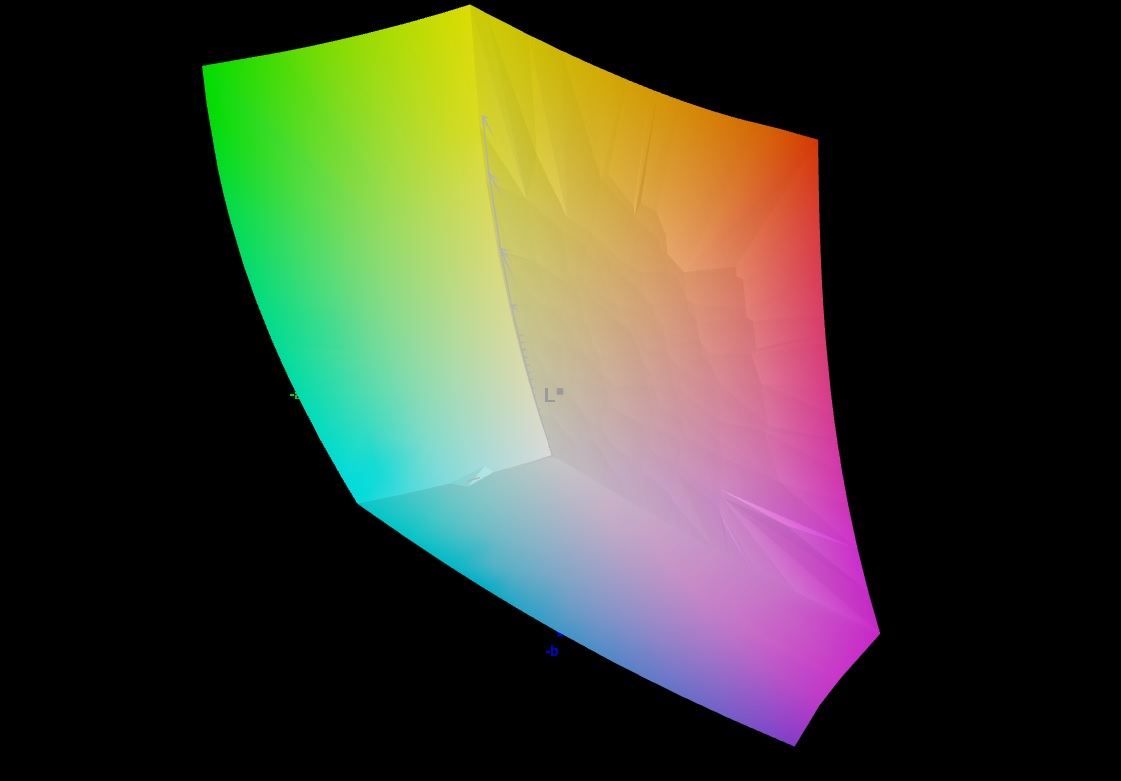
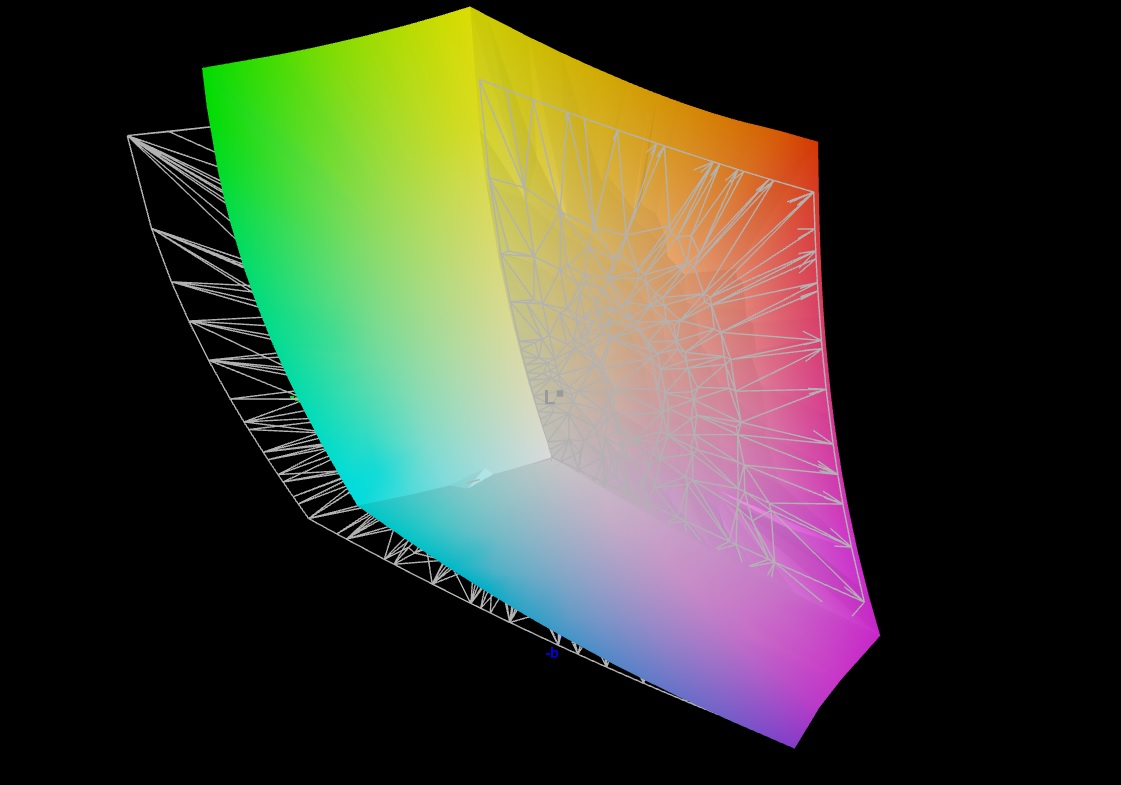
84.3% AdobeRGB 1998 (Argyll 3D)
99.9% sRGB (Argyll 3D)
96.4% Display P3 (Argyll 3D)
Gamma: 2.273
CCT: 6451 K
| Schenker Key 17 Pro (Early 23) BOE CQ NE173QUM-NY1, IPS, 3840x2160, 17.3" | MSI Stealth 17 Studio A13VH-014 AUO41A2 B173ZAN06.C, Mini LED, 3840x2160, 17.3" | Asus ROG Strix Scar 17 G733PY-XS96 NE173QHM-NZ2, IPS, 2560x1440, 17.3" | Aorus 17X AZF BOE09F9, IPS, 2560x1440, 17.3" | Medion Erazer Beast X40 BOE NE170QDM-NZ1, IPS, 2560x1600, 17" | |
|---|---|---|---|---|---|
| Display | 2% | 1% | 0% | -16% | |
| Display P3 Coverage (%) | 96.4 | 92 -5% | 98 2% | 96.7 0% | 68.6 -29% |
| sRGB Coverage (%) | 99.9 | 99.1 -1% | 100 0% | 99.9 0% | 99.8 0% |
| AdobeRGB 1998 Coverage (%) | 84.3 | 94.07 12% | 85.6 2% | 84.5 0% | 69.4 -18% |
| Response Times | -62% | 0% | -18% | 10% | |
| Response Time Grey 50% / Grey 80% * (ms) | 14.8 ? | 46.4 ? -214% | 6.2 ? 58% | 14 ? 5% | 11.3 ? 24% |
| Response Time Black / White * (ms) | 7.2 ? | 0.62 ? 91% | 11.4 ? -58% | 10.1 ? -40% | 7.5 ? -4% |
| PWM Frequency (Hz) | 2400 | ||||
| Screen | 221% | -8% | -57% | -29% | |
| Brightness middle (cd/m²) | 487 | 397.29 -18% | 322.5 -34% | 294 -40% | 384 -21% |
| Brightness (cd/m²) | 485 | 392 -19% | 317 -35% | 276 -43% | 377 -22% |
| Brightness Distribution (%) | 87 | 93 7% | 86 -1% | 90 3% | 90 3% |
| Black Level * (cd/m²) | 0.51 | 0.02 96% | 0.29 43% | 0.28 45% | 0.45 12% |
| Contrast (:1) | 955 | 19865 1980% | 1112 16% | 1050 10% | 853 -11% |
| Colorchecker dE 2000 * | 1.51 | 2.52 -67% | 1.15 24% | 2.81 -86% | 2.05 -36% |
| Colorchecker dE 2000 max. * | 2.19 | 3.91 -79% | 3.03 -38% | 5.7 -160% | 3.64 -66% |
| Greyscale dE 2000 * | 1.2 | 2.78 -132% | 1.7 -42% | 3.4 -183% | 2.3 -92% |
| Gamma | 2.273 97% | 2.63 84% | 2.27 97% | 2.301 96% | 2.017 109% |
| CCT | 6451 101% | 6412 101% | 6299 103% | 7389 88% | 6546 99% |
| Colorchecker dE 2000 calibrated * | 2.52 | 0.56 | 0.86 | 0.74 | |
| Moyenne finale (programmes/paramètres) | 54% /
127% | -2% /
-5% | -25% /
-38% | -12% /
-20% |
* ... Moindre est la valeur, meilleures sont les performances
L'écran présentait déjà une excellente reproduction des couleurs dès sa sortie de l'emballage. Avec environ 1,5, sa différence de couleur moyenne se situe certainement dans ce que nous considérons comme bon (Delta E < 3). La précision des couleurs est une évidence : l'écran a une couverture sRGB complète et peut couvrir la quasi-totalité de l'espace DCI-P3 ; il est également capable de reproduire jusqu'à 84 % de la gamme AdobeRGB.

Temps de réponse de l'écran
| ↔ Temps de réponse noir à blanc | ||
|---|---|---|
| 7.2 ms ... hausse ↗ et chute ↘ combinées | ↗ 2.2 ms hausse | 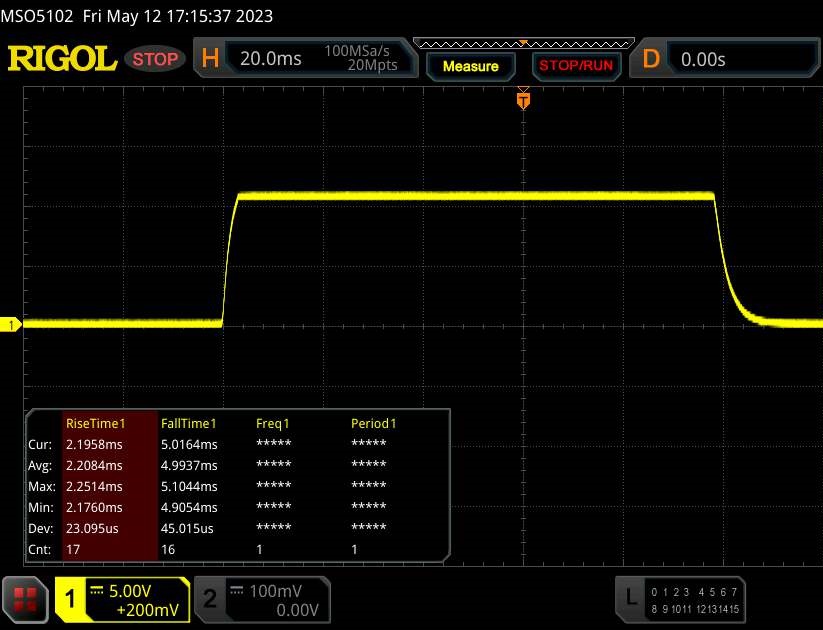 |
| ↘ 5 ms chute | ||
| L'écran montre de très faibles temps de réponse, parfait pour le jeu. En comparaison, tous les appareils testés affichent entre 0.1 (minimum) et 240 (maximum) ms. » 22 % des appareils testés affichent de meilleures performances. Cela signifie que les latences relevées sont meilleures que la moyenne (19.8 ms) de tous les appareils testés. | ||
| ↔ Temps de réponse gris 50% à gris 80% | ||
| 14.8 ms ... hausse ↗ et chute ↘ combinées | ↗ 7.2 ms hausse | 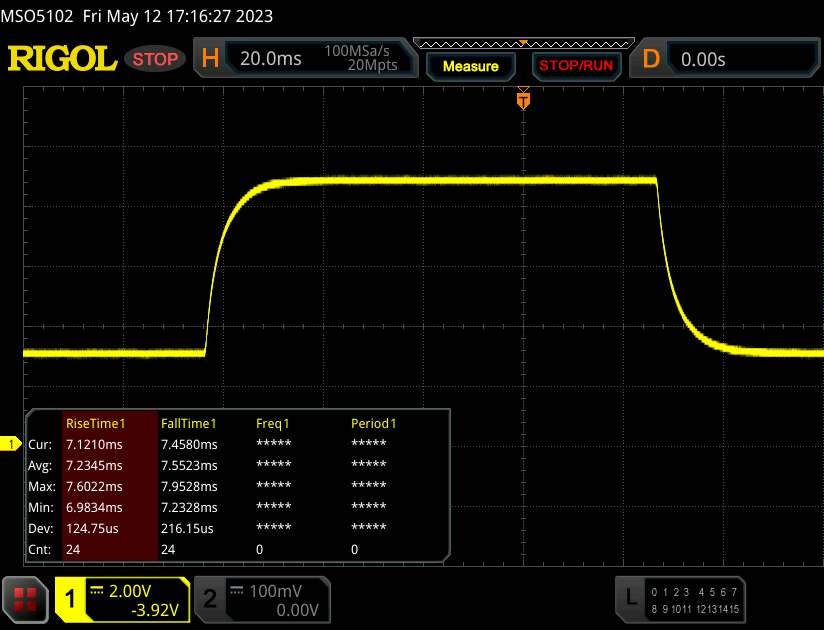 |
| ↘ 7.6 ms chute | ||
| L'écran montre de bons temps de réponse, mais insuffisant pour du jeu compétitif. En comparaison, tous les appareils testés affichent entre 0.165 (minimum) et 636 (maximum) ms. » 29 % des appareils testés affichent de meilleures performances. Cela signifie que les latences relevées sont meilleures que la moyenne (31 ms) de tous les appareils testés. | ||
Scintillement / MLI (Modulation de largeur d'impulsion)
| Scintillement / MLI (Modulation de largeur d'impulsion) non décelé | 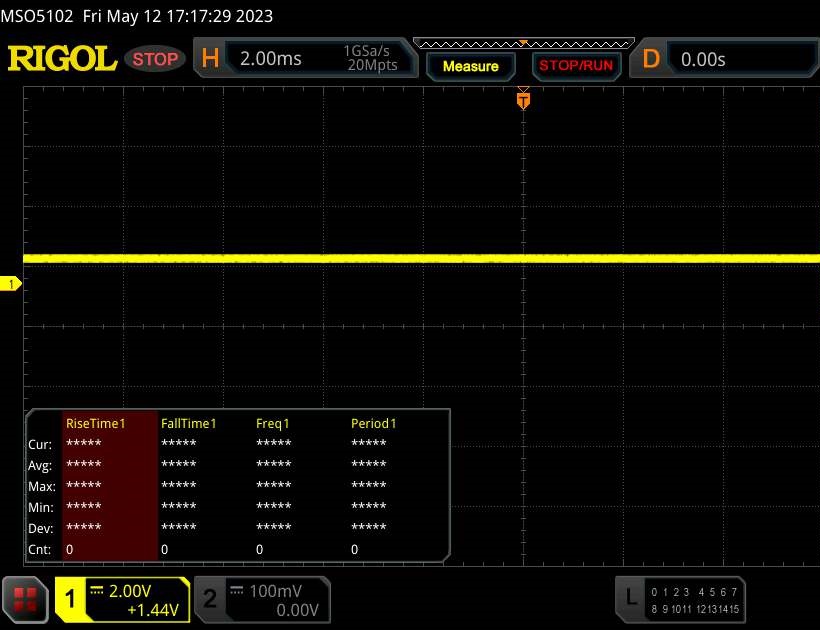 | ||
En comparaison, 52 % des appareils testés n'emploient pas MDI pour assombrir leur écran. Nous avons relevé une moyenne à 7754 (minimum : 5 - maximum : 343500) Hz dans le cas où une MDI était active. | |||
L'écran IPS est lisible dans toutes les positions grâce à son grand angle de vision. Vous pouvez certainement distinguer le contenu de l'écran même à l'extérieur, à condition que le soleil ne brille pas trop fort.
Performance - Le Key 17 est doté d'un matériel haut de gamme
Le Schenker Key 17 Pro est un ordinateur portable haut de gamme de 17,3 pouces qui exploite la puissance de Raptor Lake et d'Ada Lovelace. Vous pouvez configurer l'ordinateur portable selon vos besoins dans la boutique en ligne de Schenker. Notre modèle d'essai coûte environ 4 500 euros (4 820 dollars). Les prix commencent à 3 200 euros (3 427 euros).
Conditions d'essai
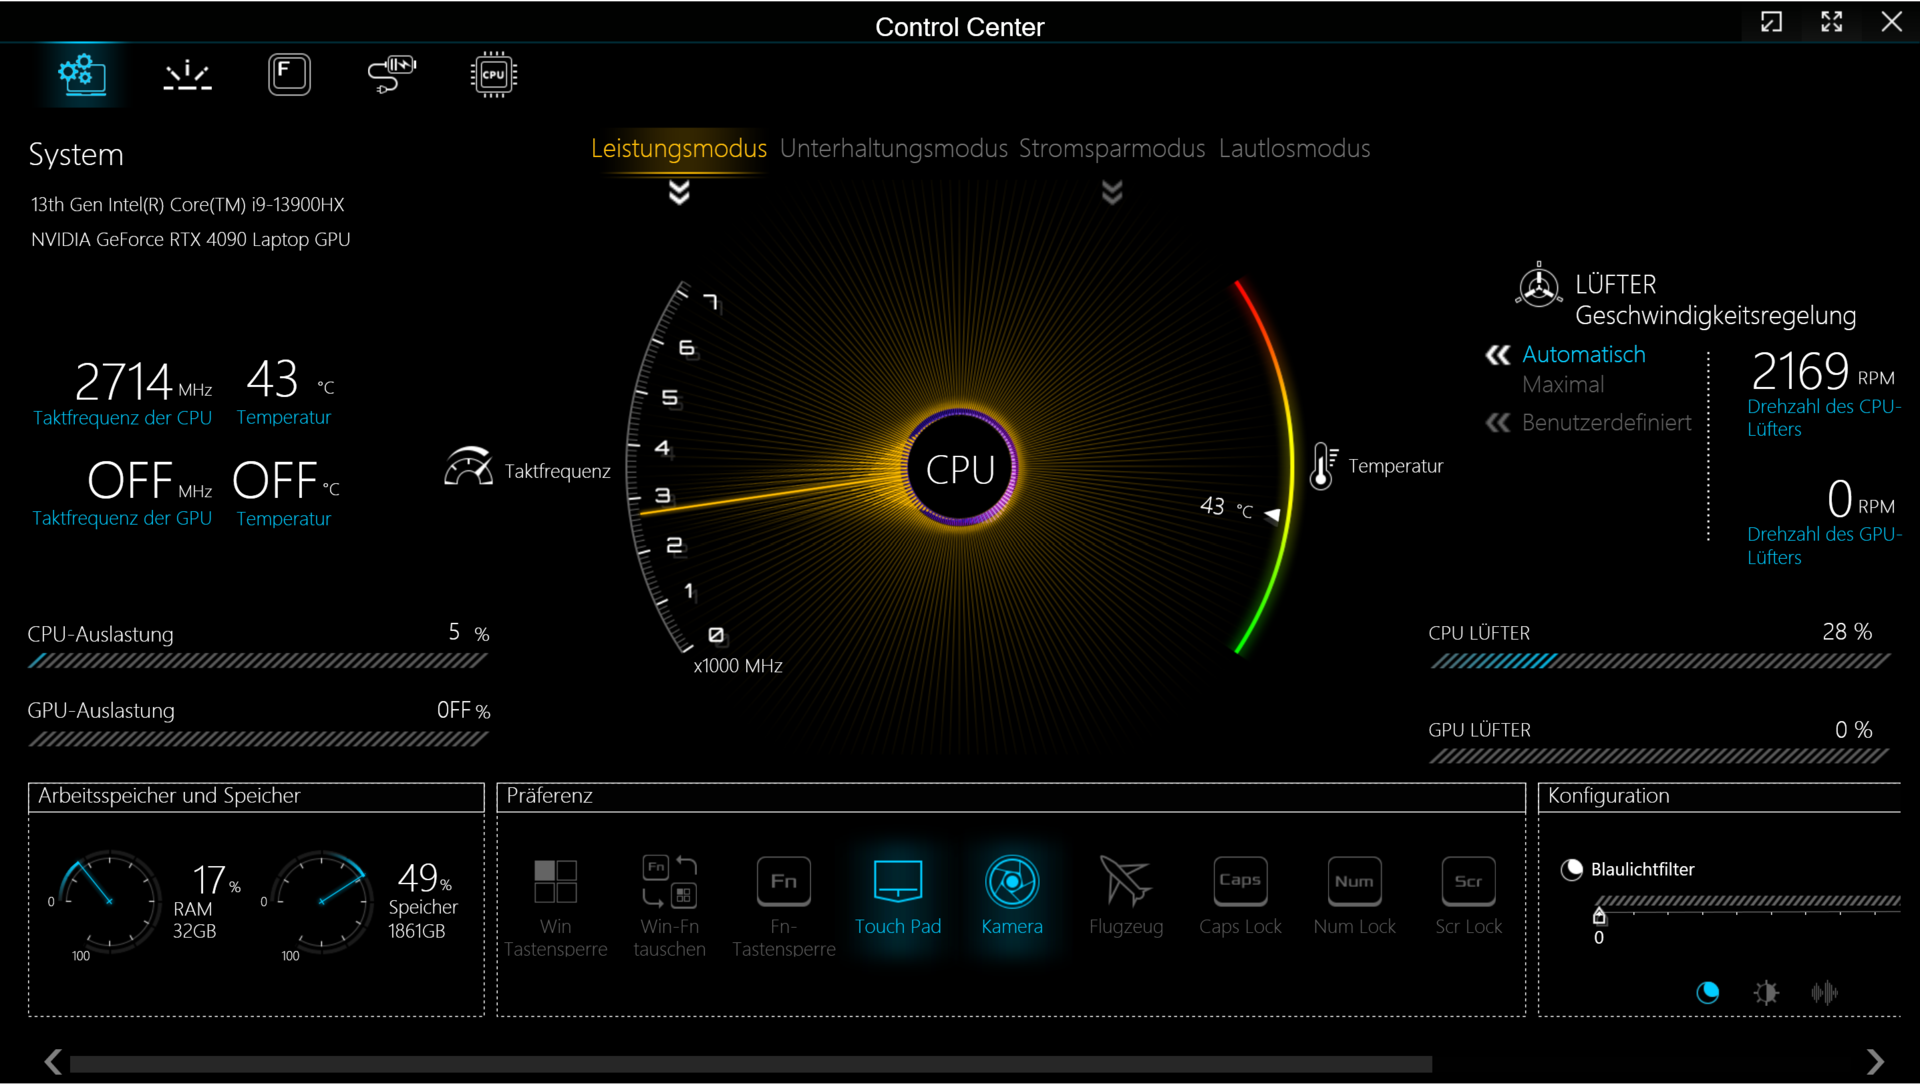
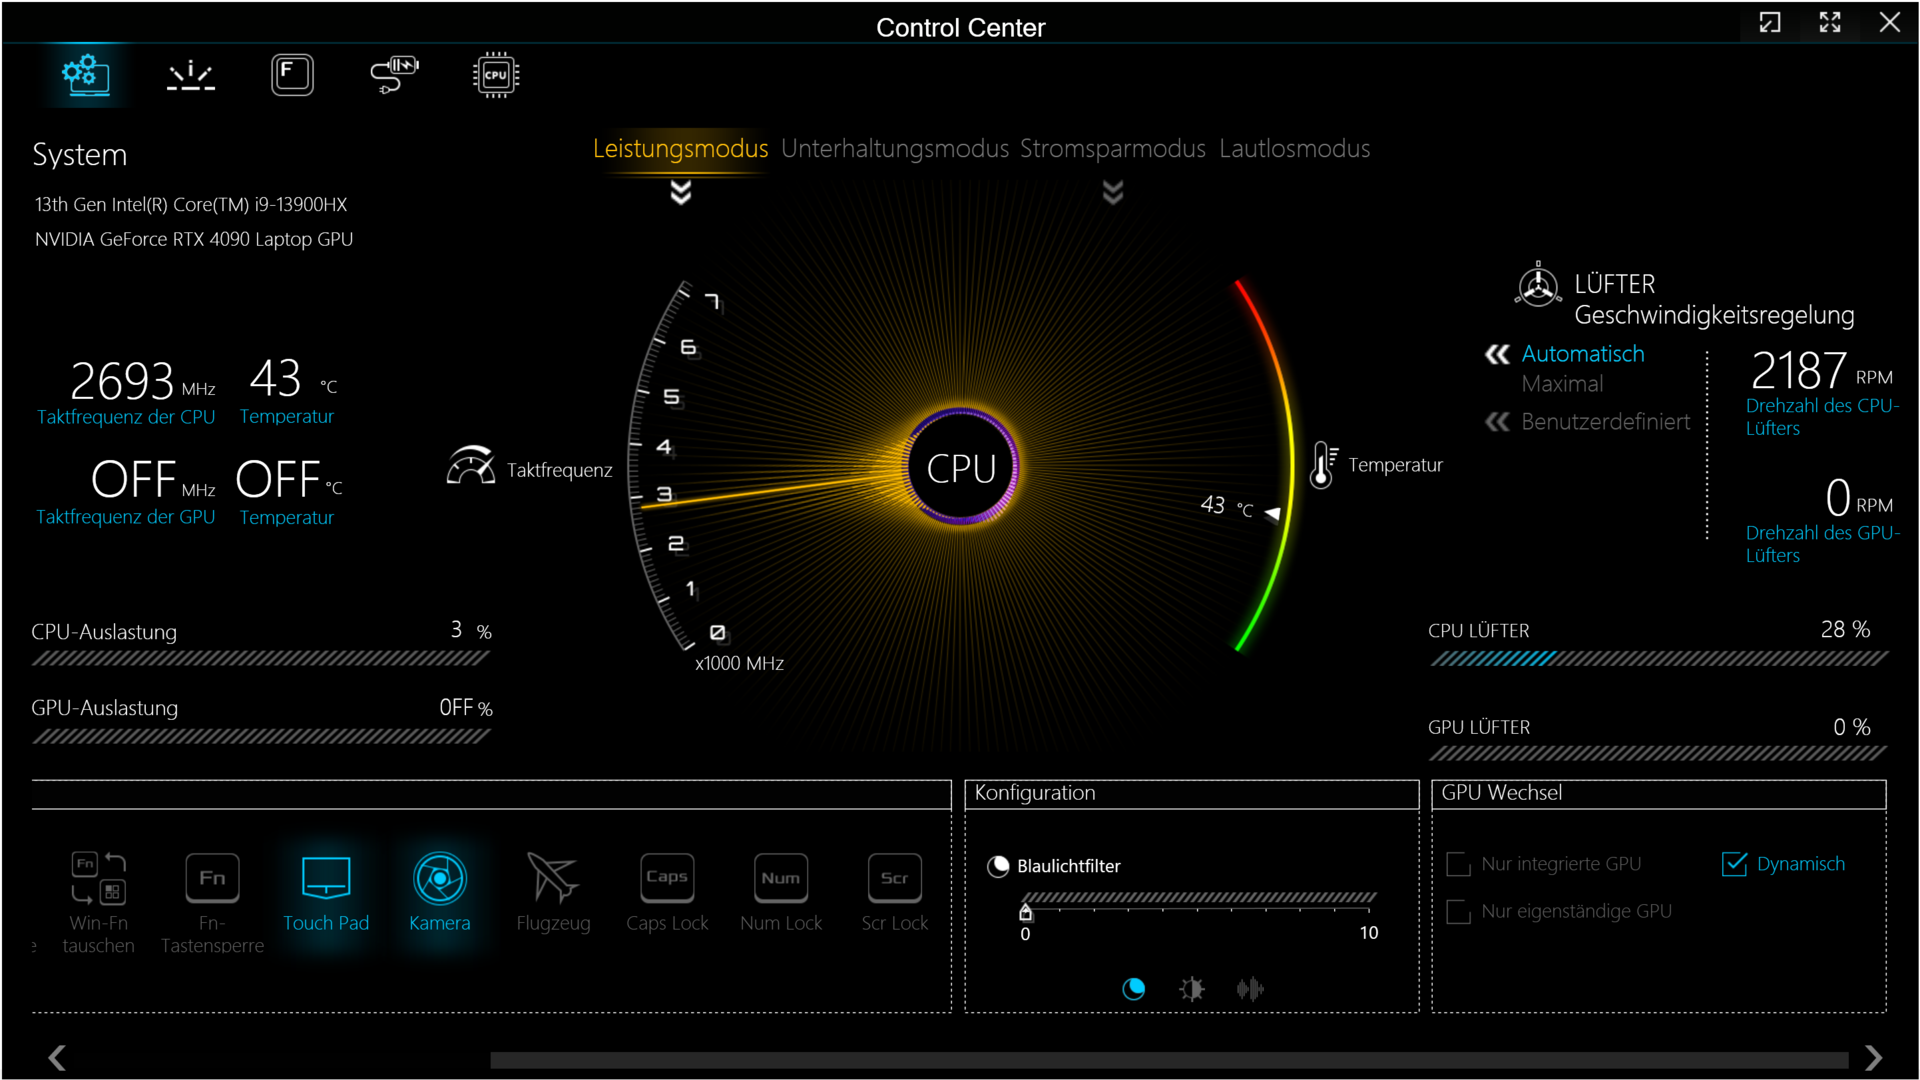
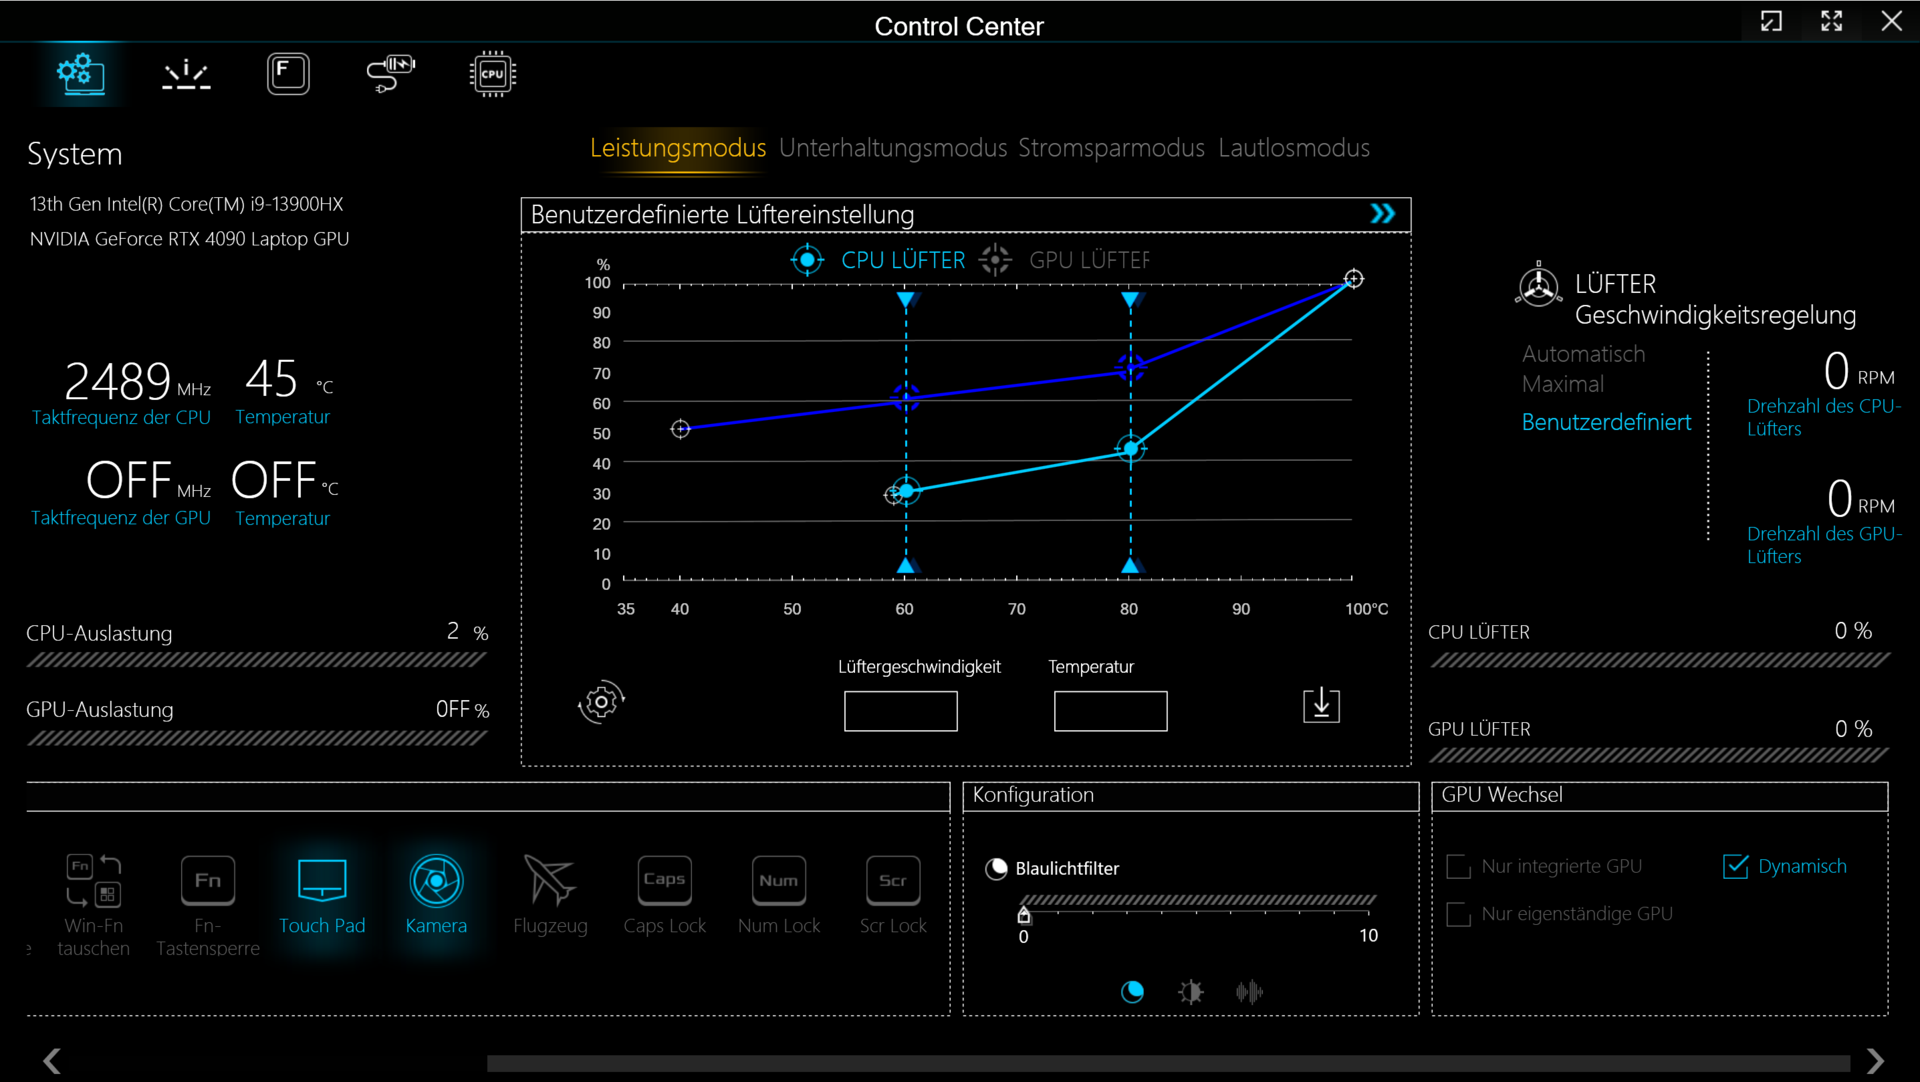
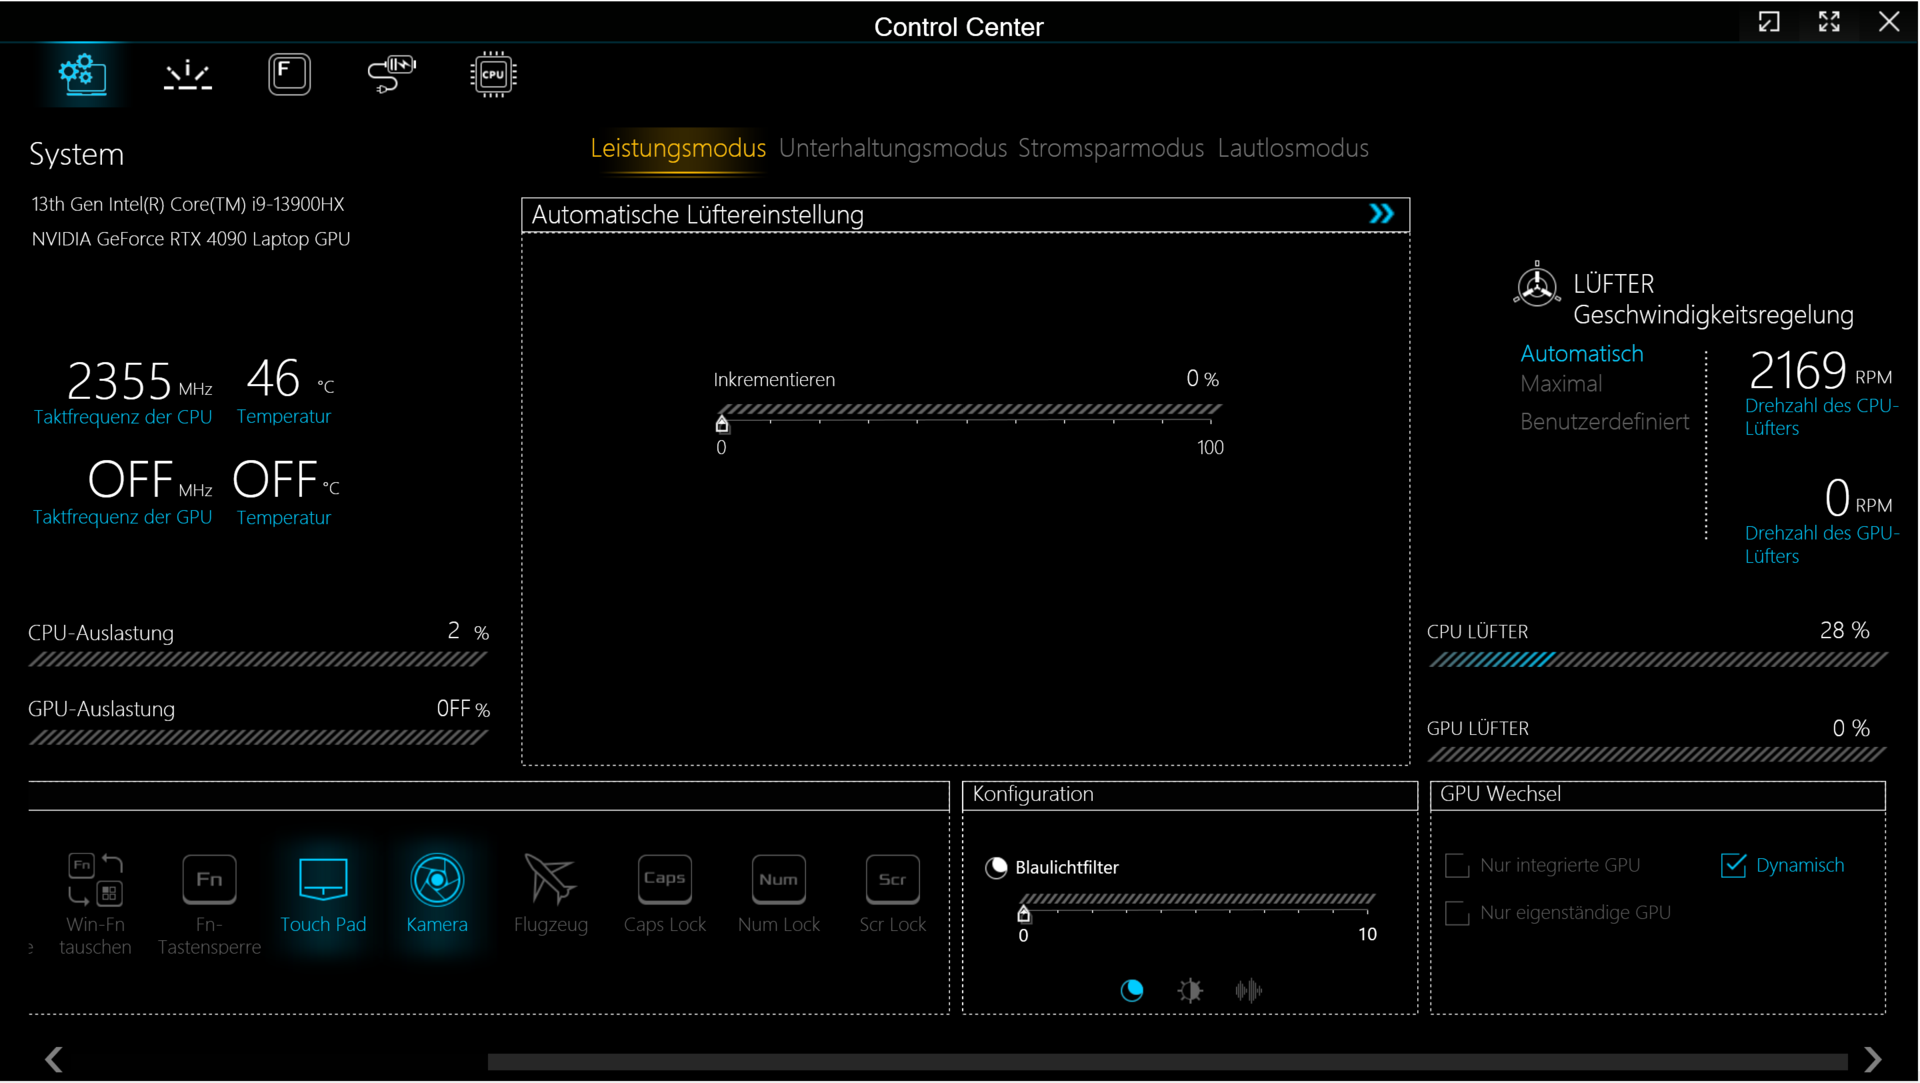
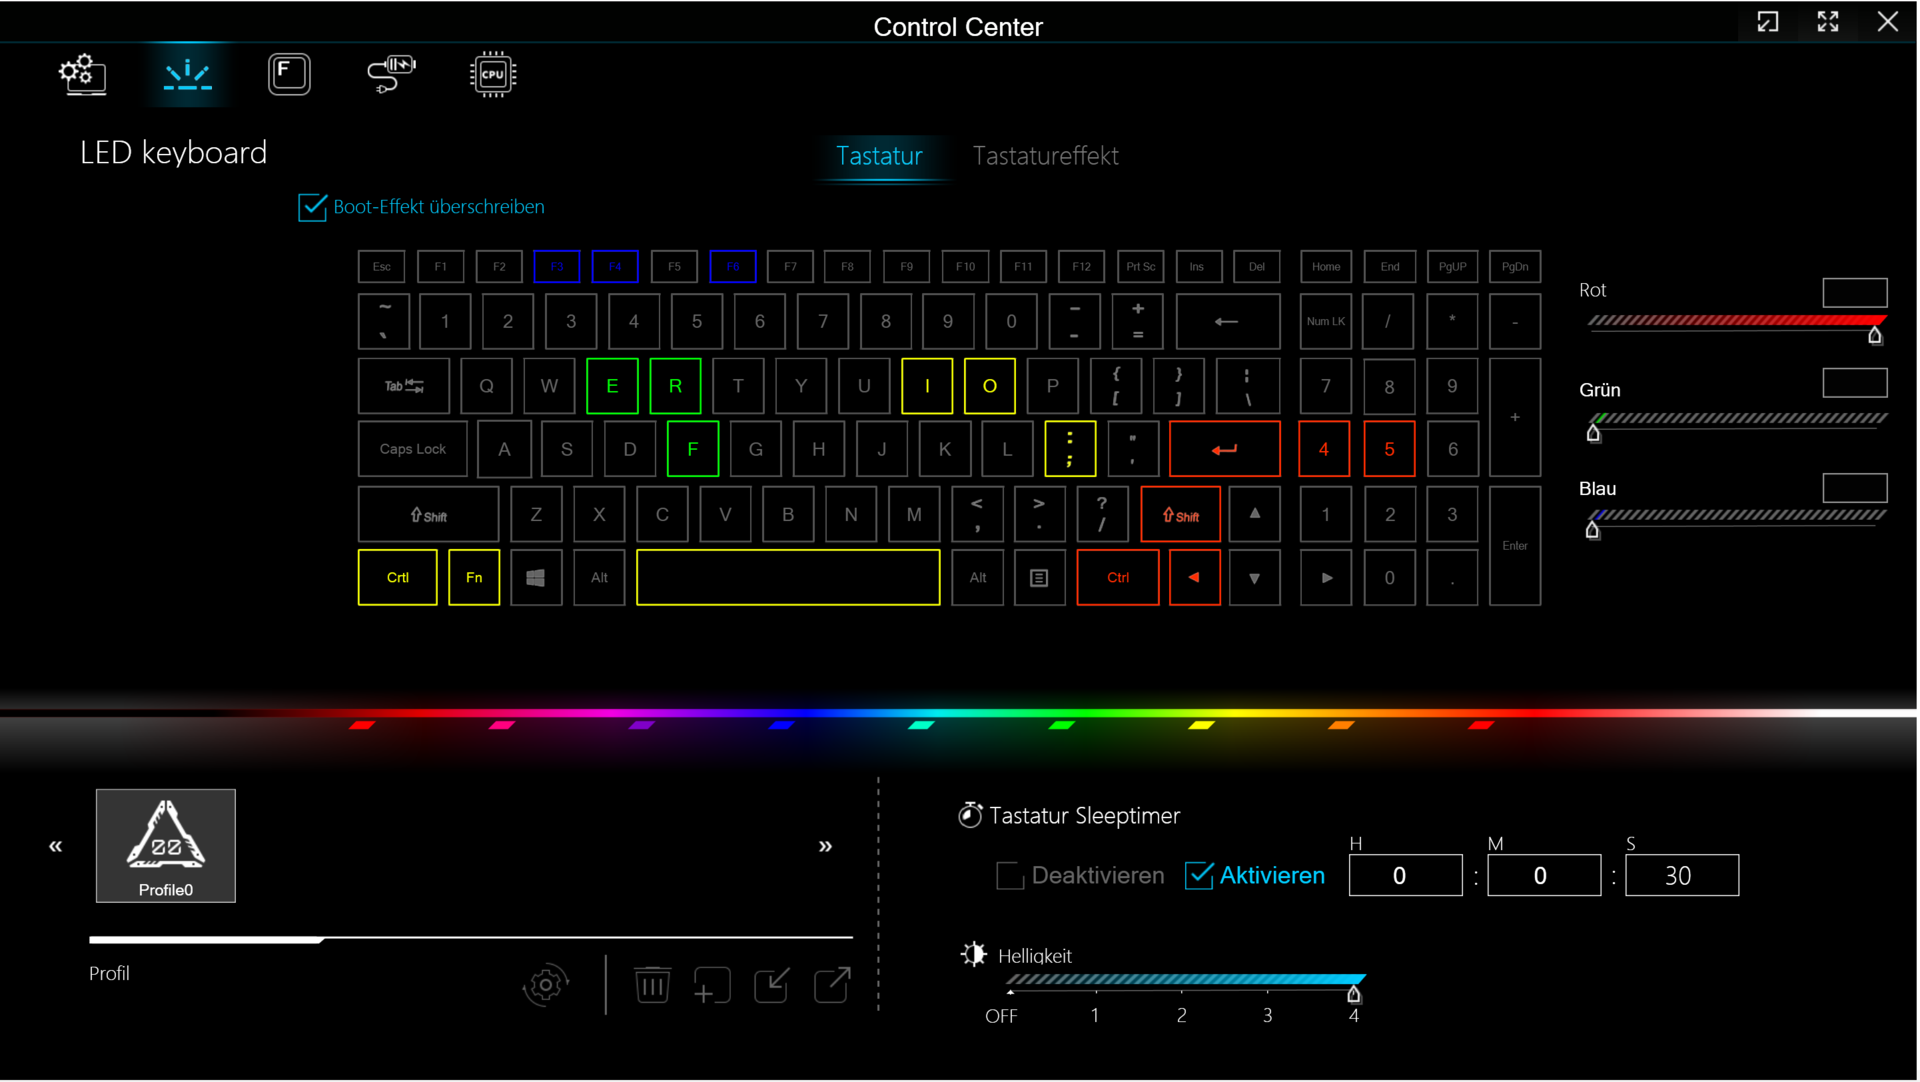
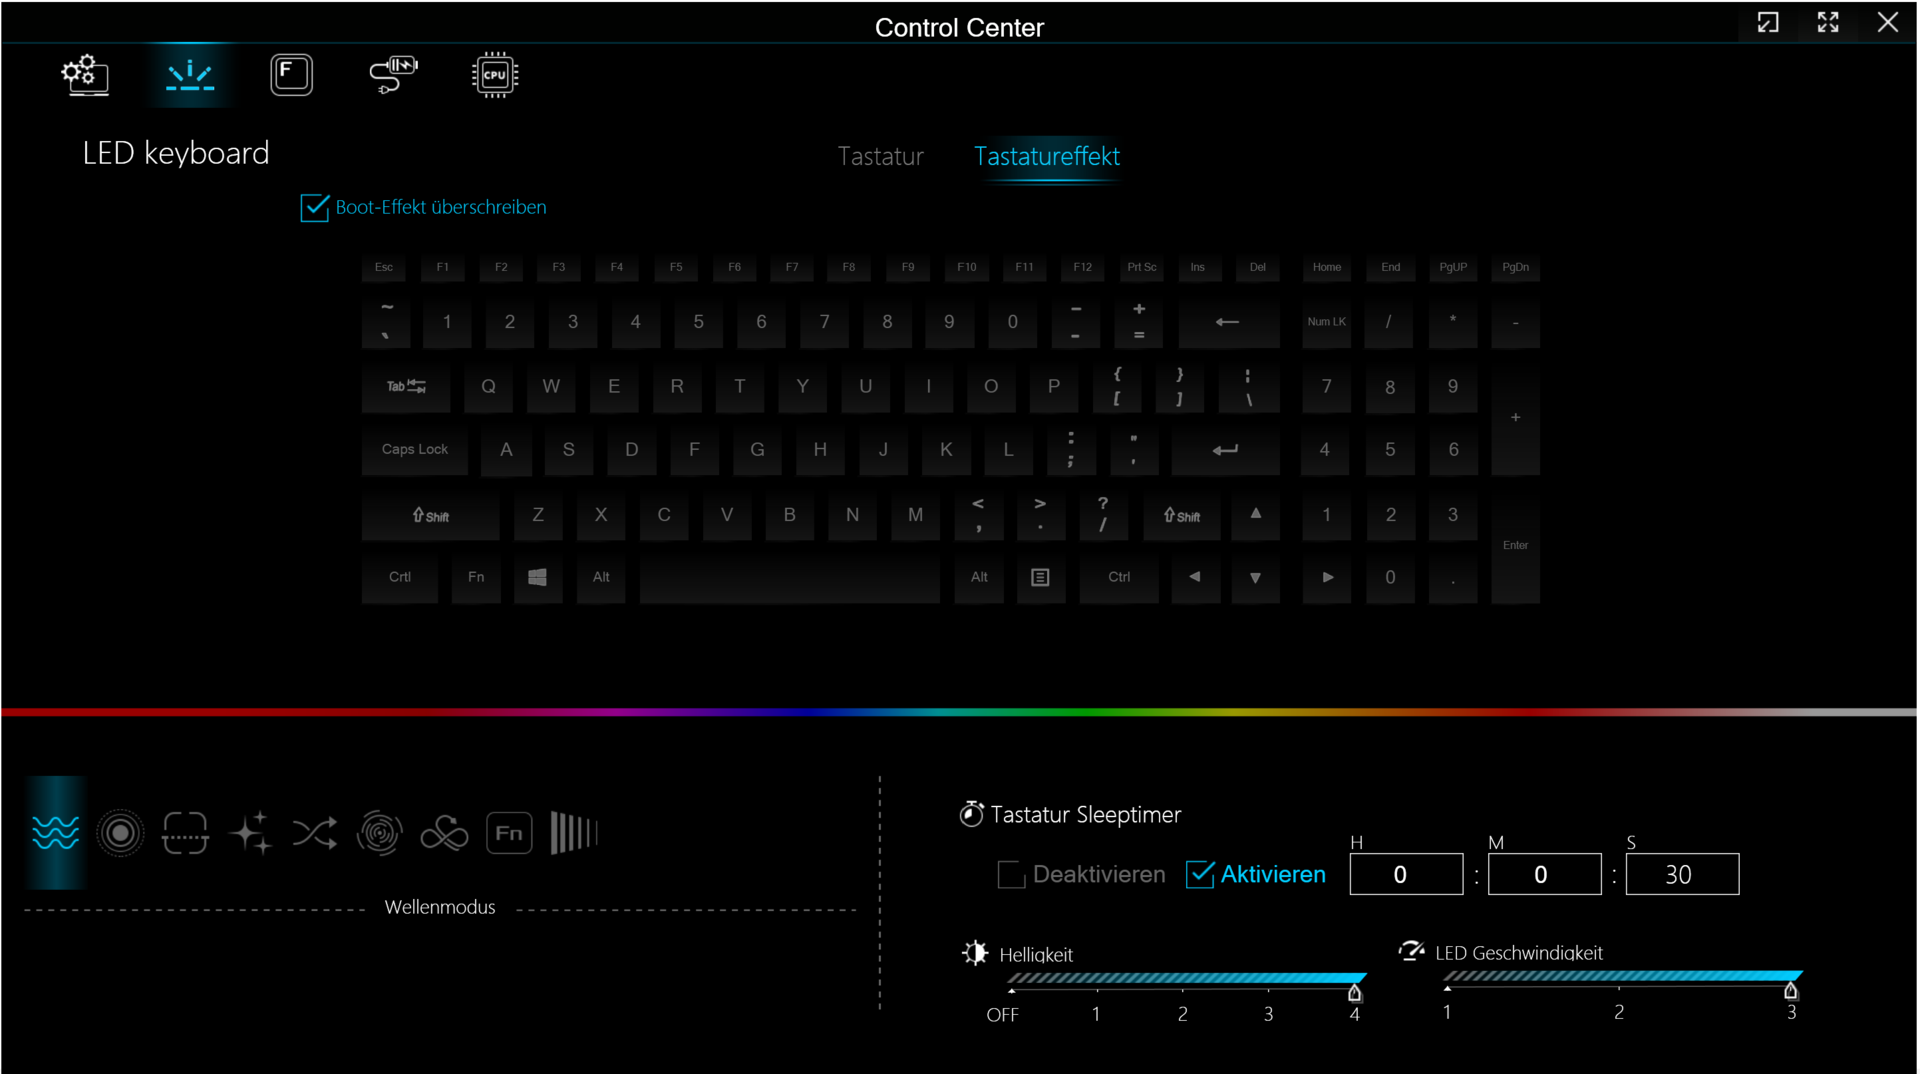
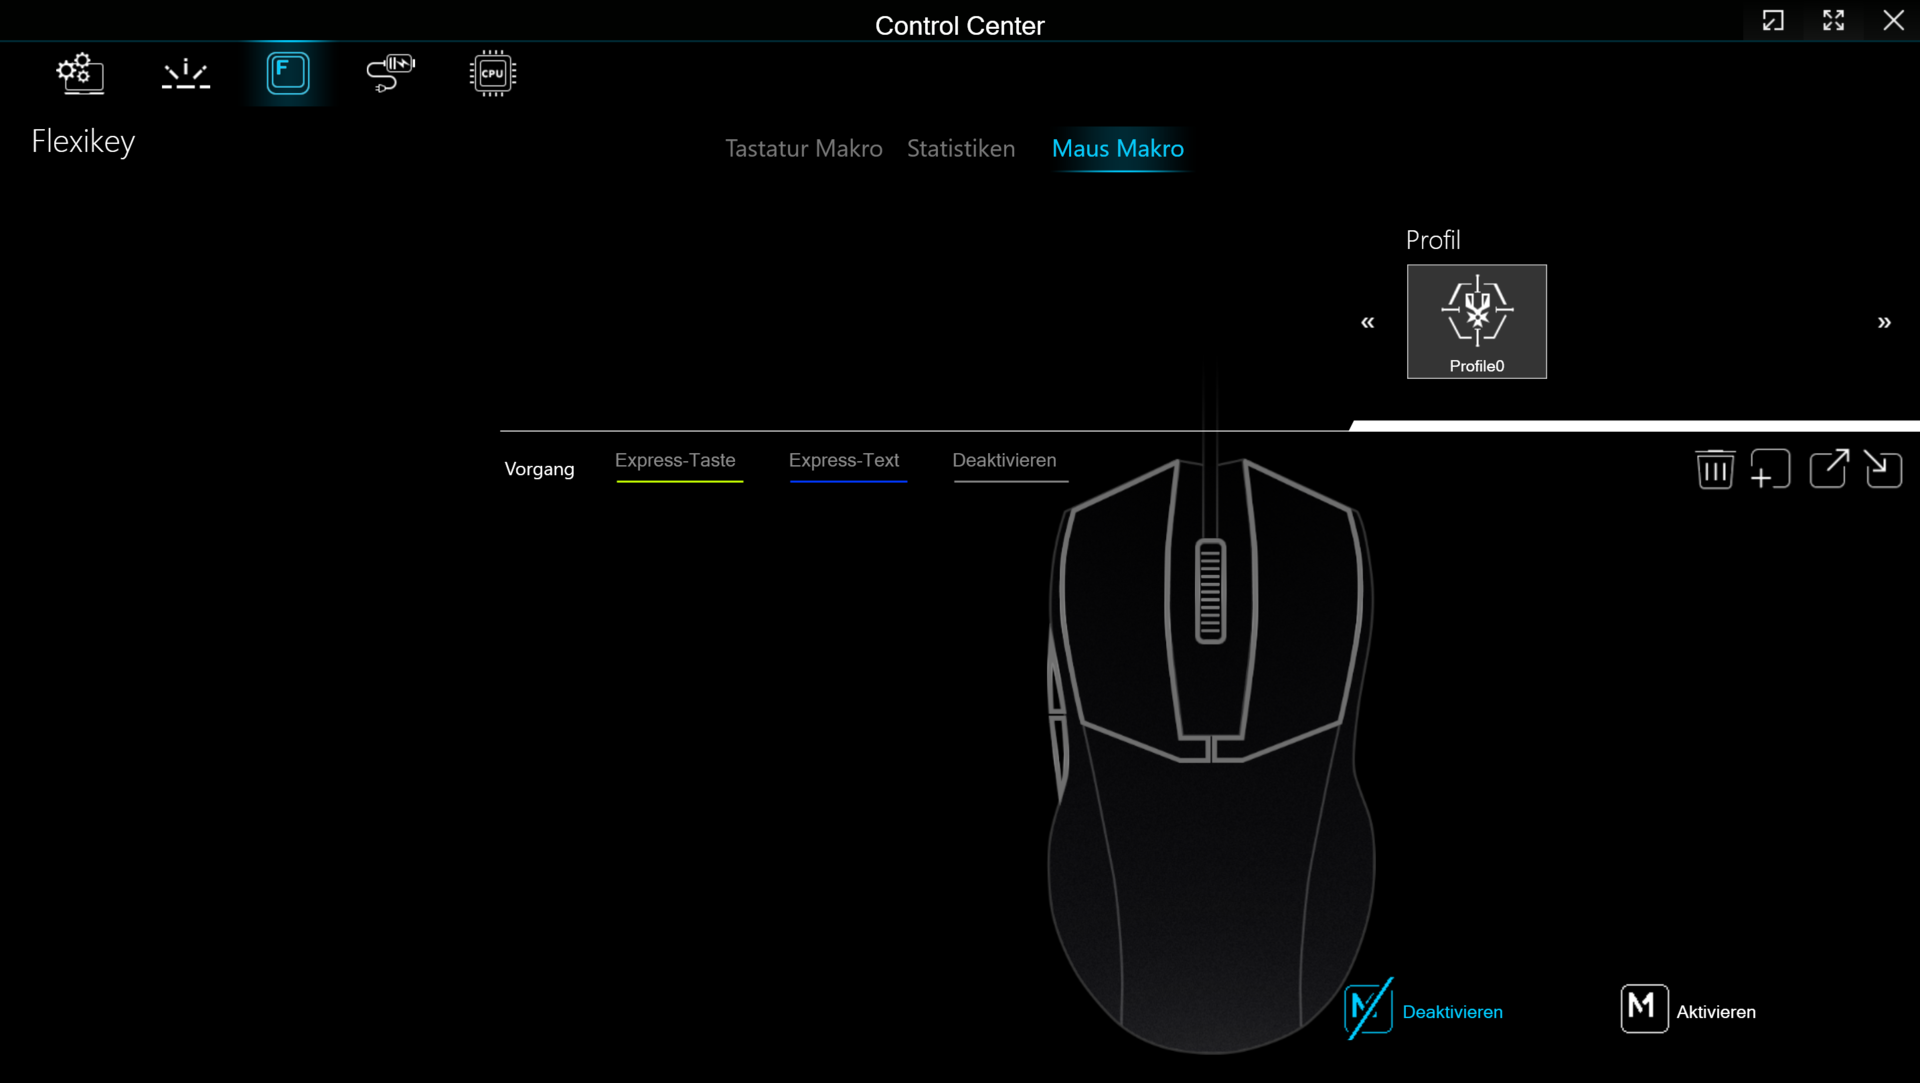
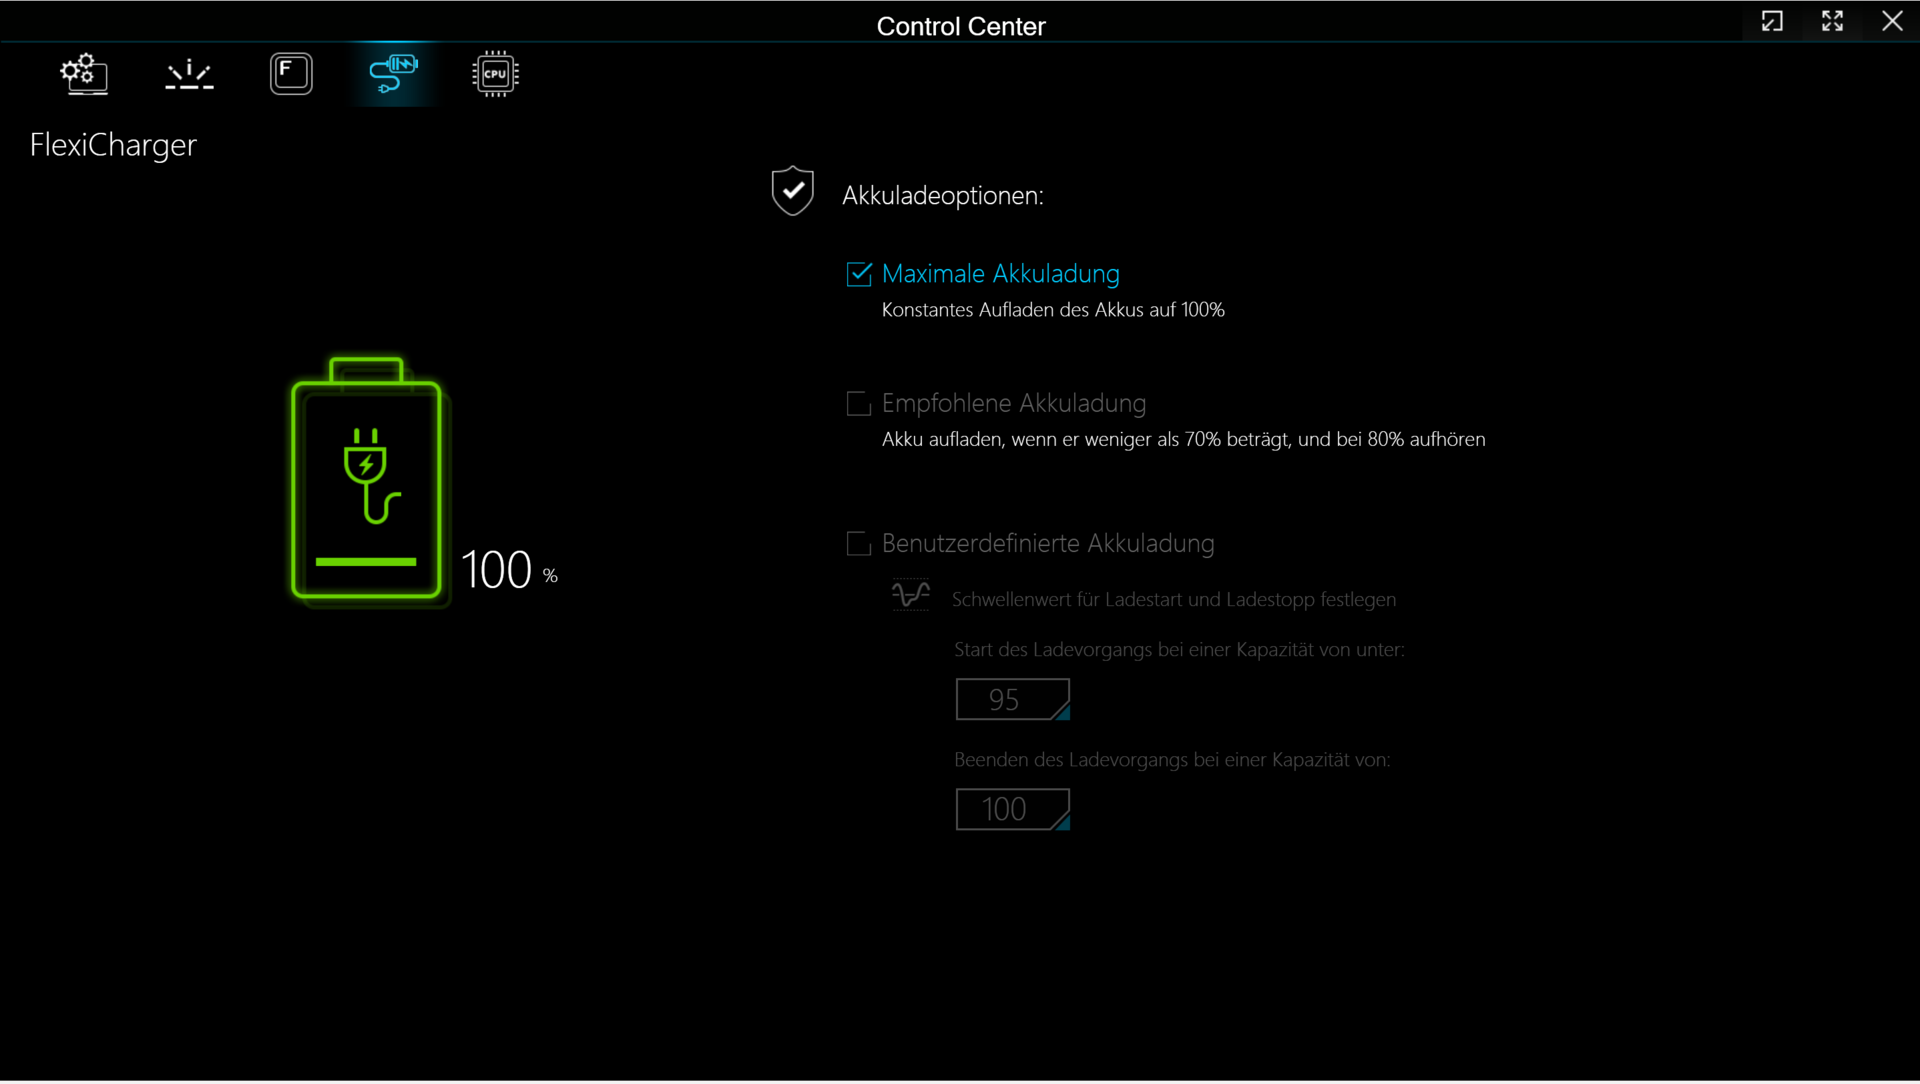
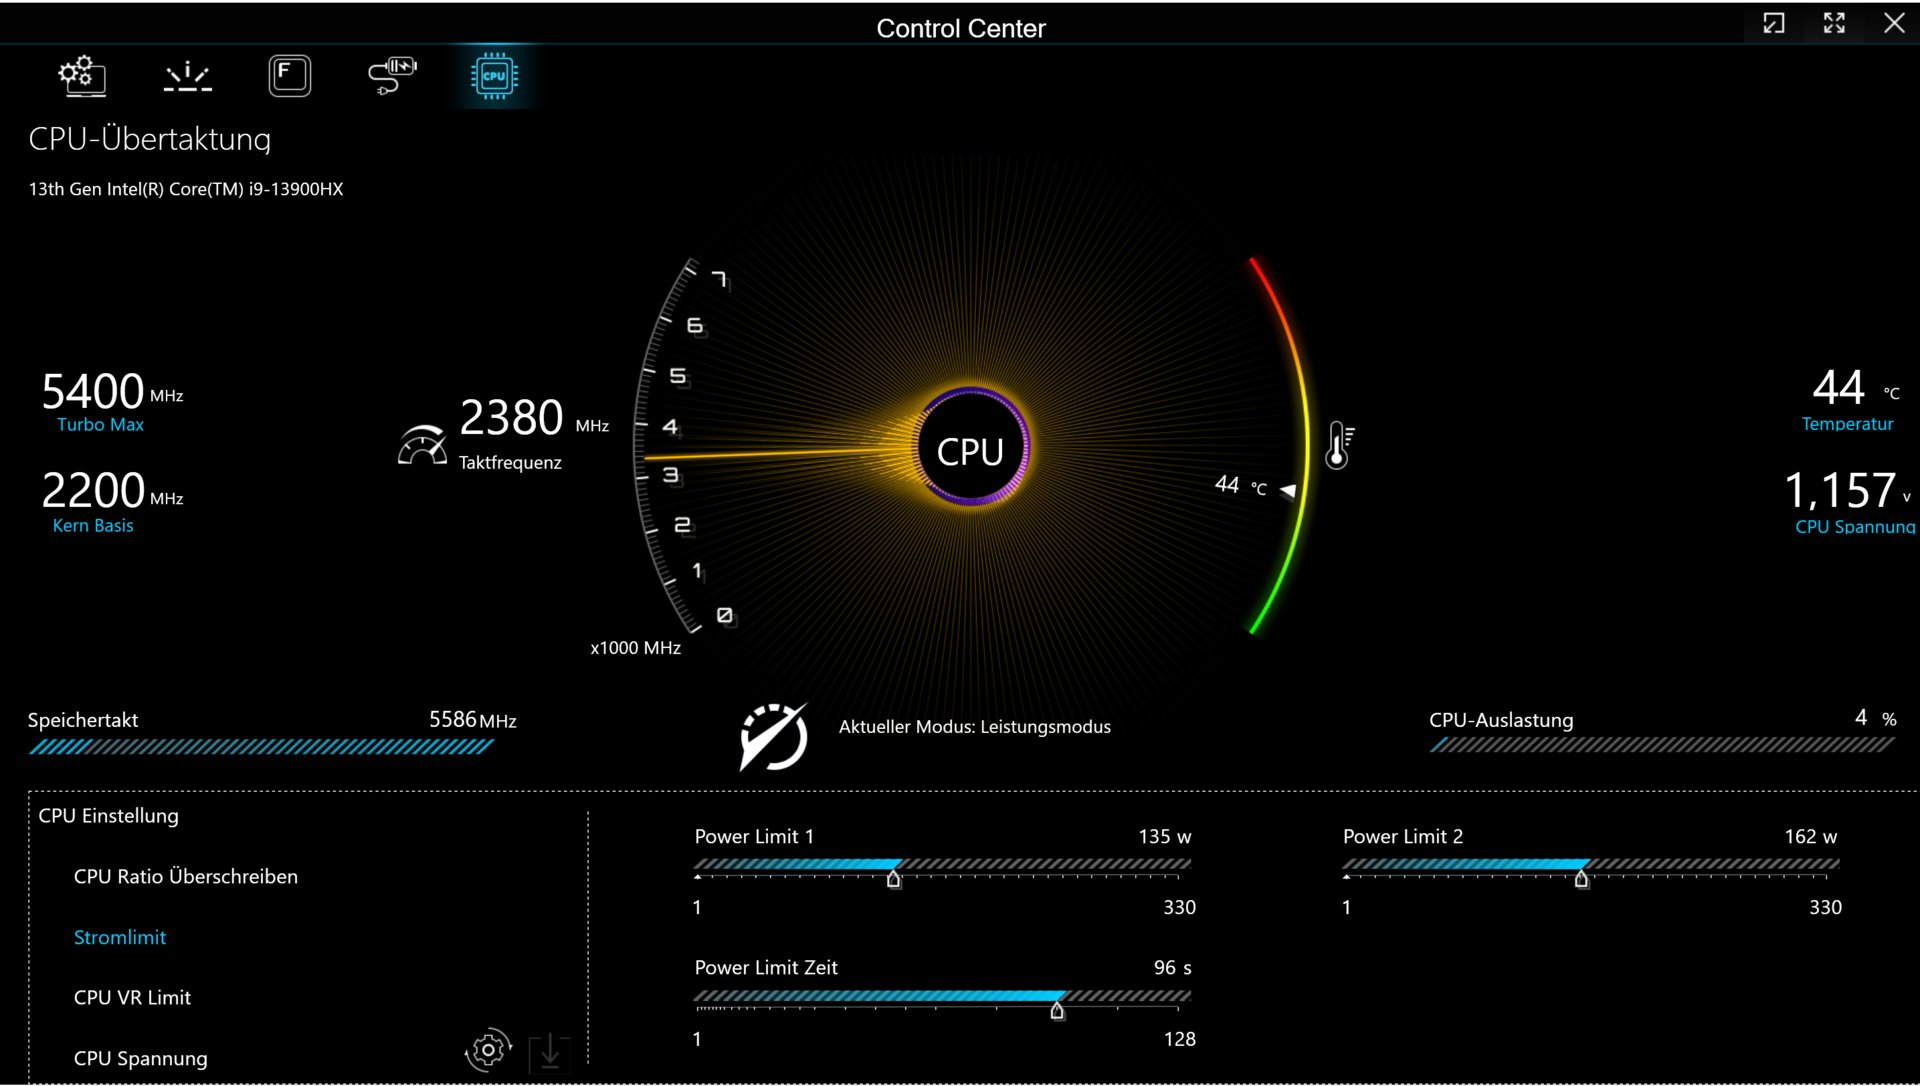
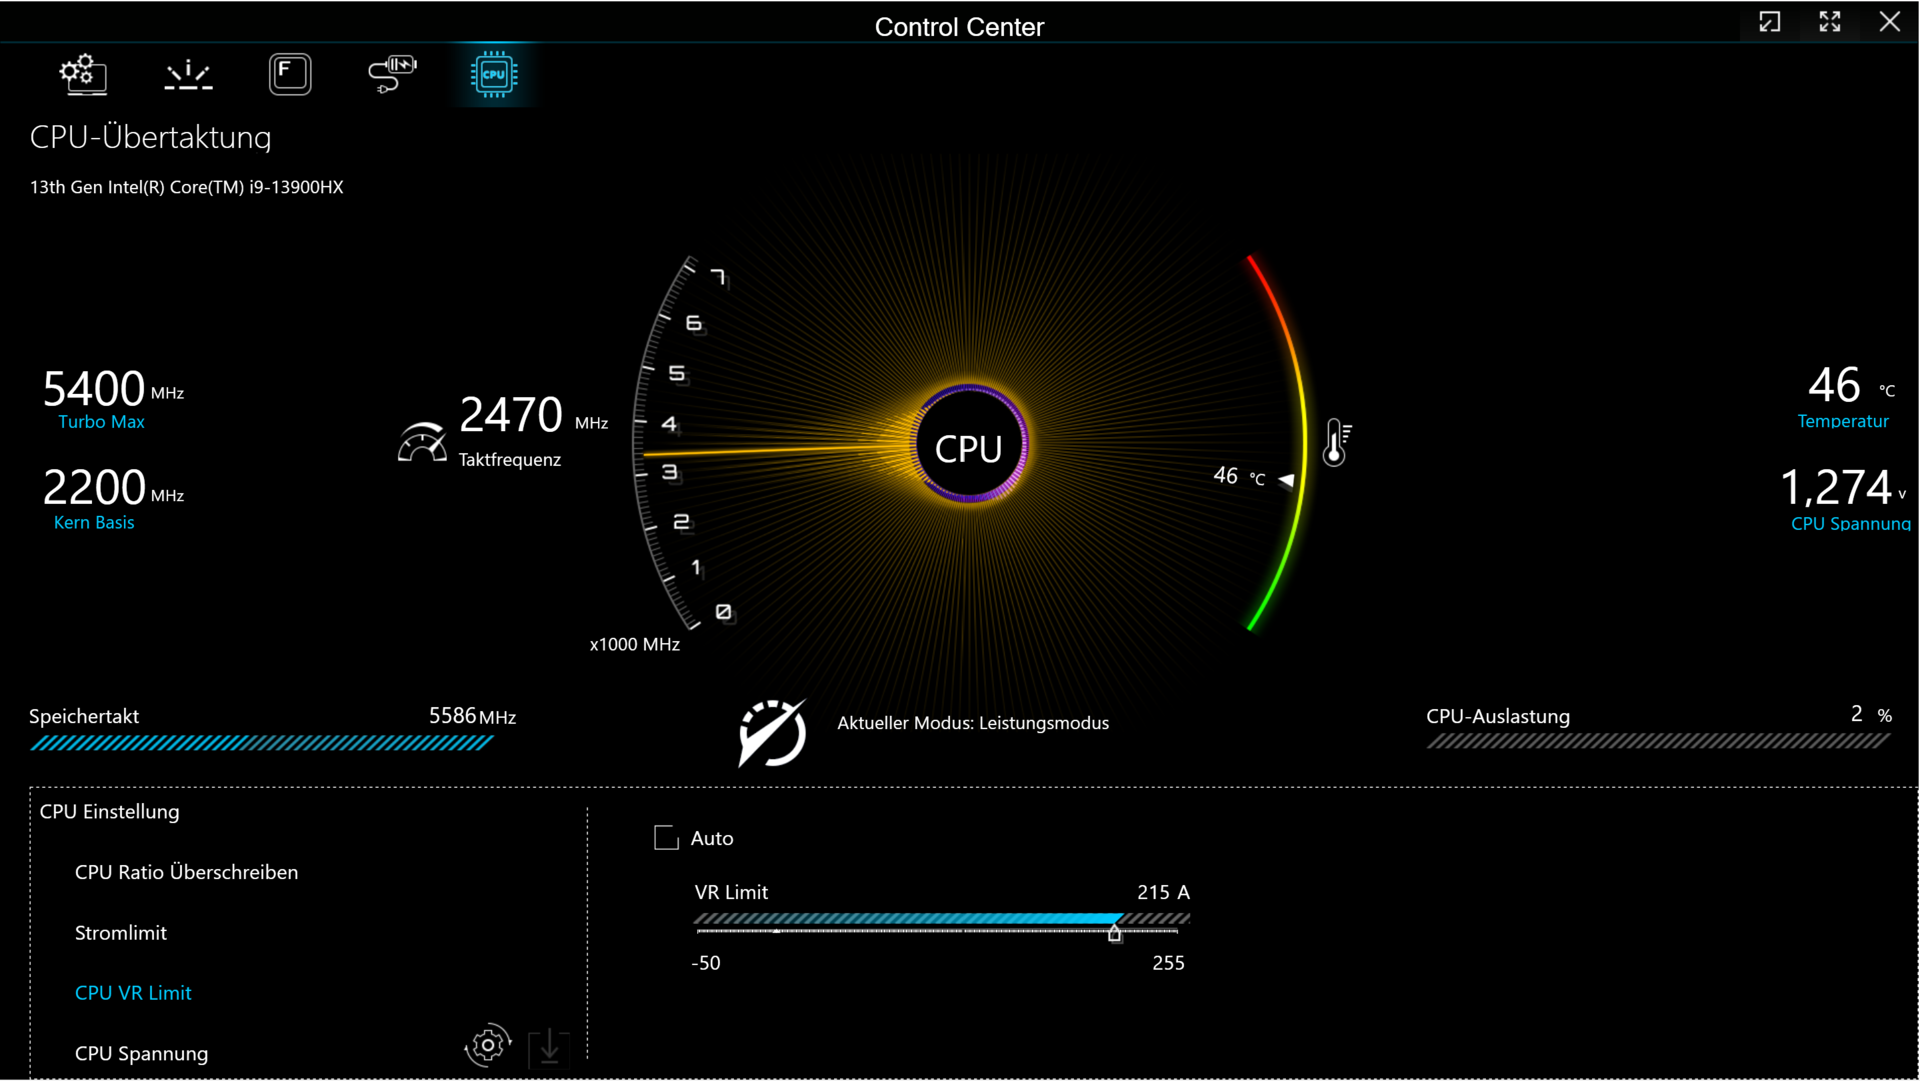
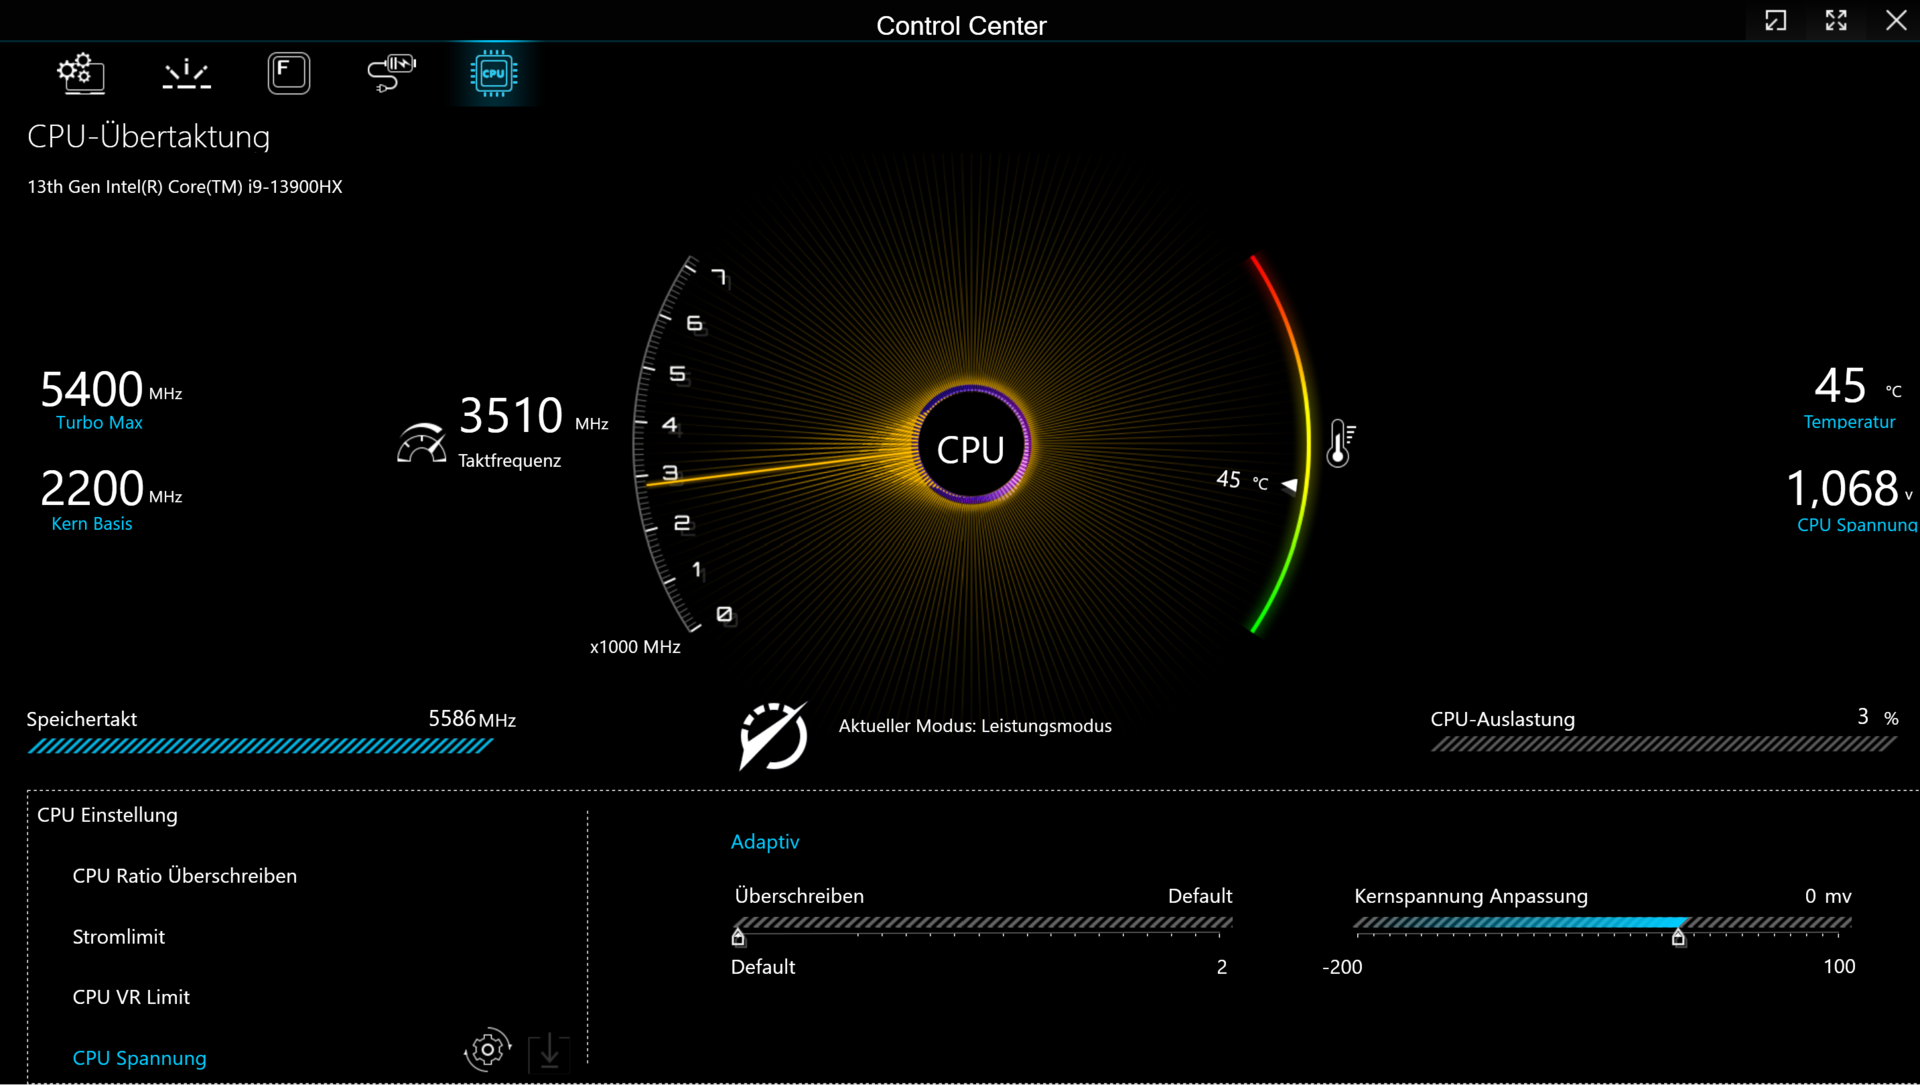
Le Key 17 Pro offre quatre modes d'alimentation spécifiés par le fabricant (voir tableau). Vous pouvez passer de l'un à l'autre en utilisant le logiciel Control Center installé sur l'ordinateur portable. Nous avons effectué nos tests de performance en mode "Performance" et notre test d'autonomie en mode "Power Saver" (avec la RTX 4090 désactivée). Optimus était activé pendant nos tests.
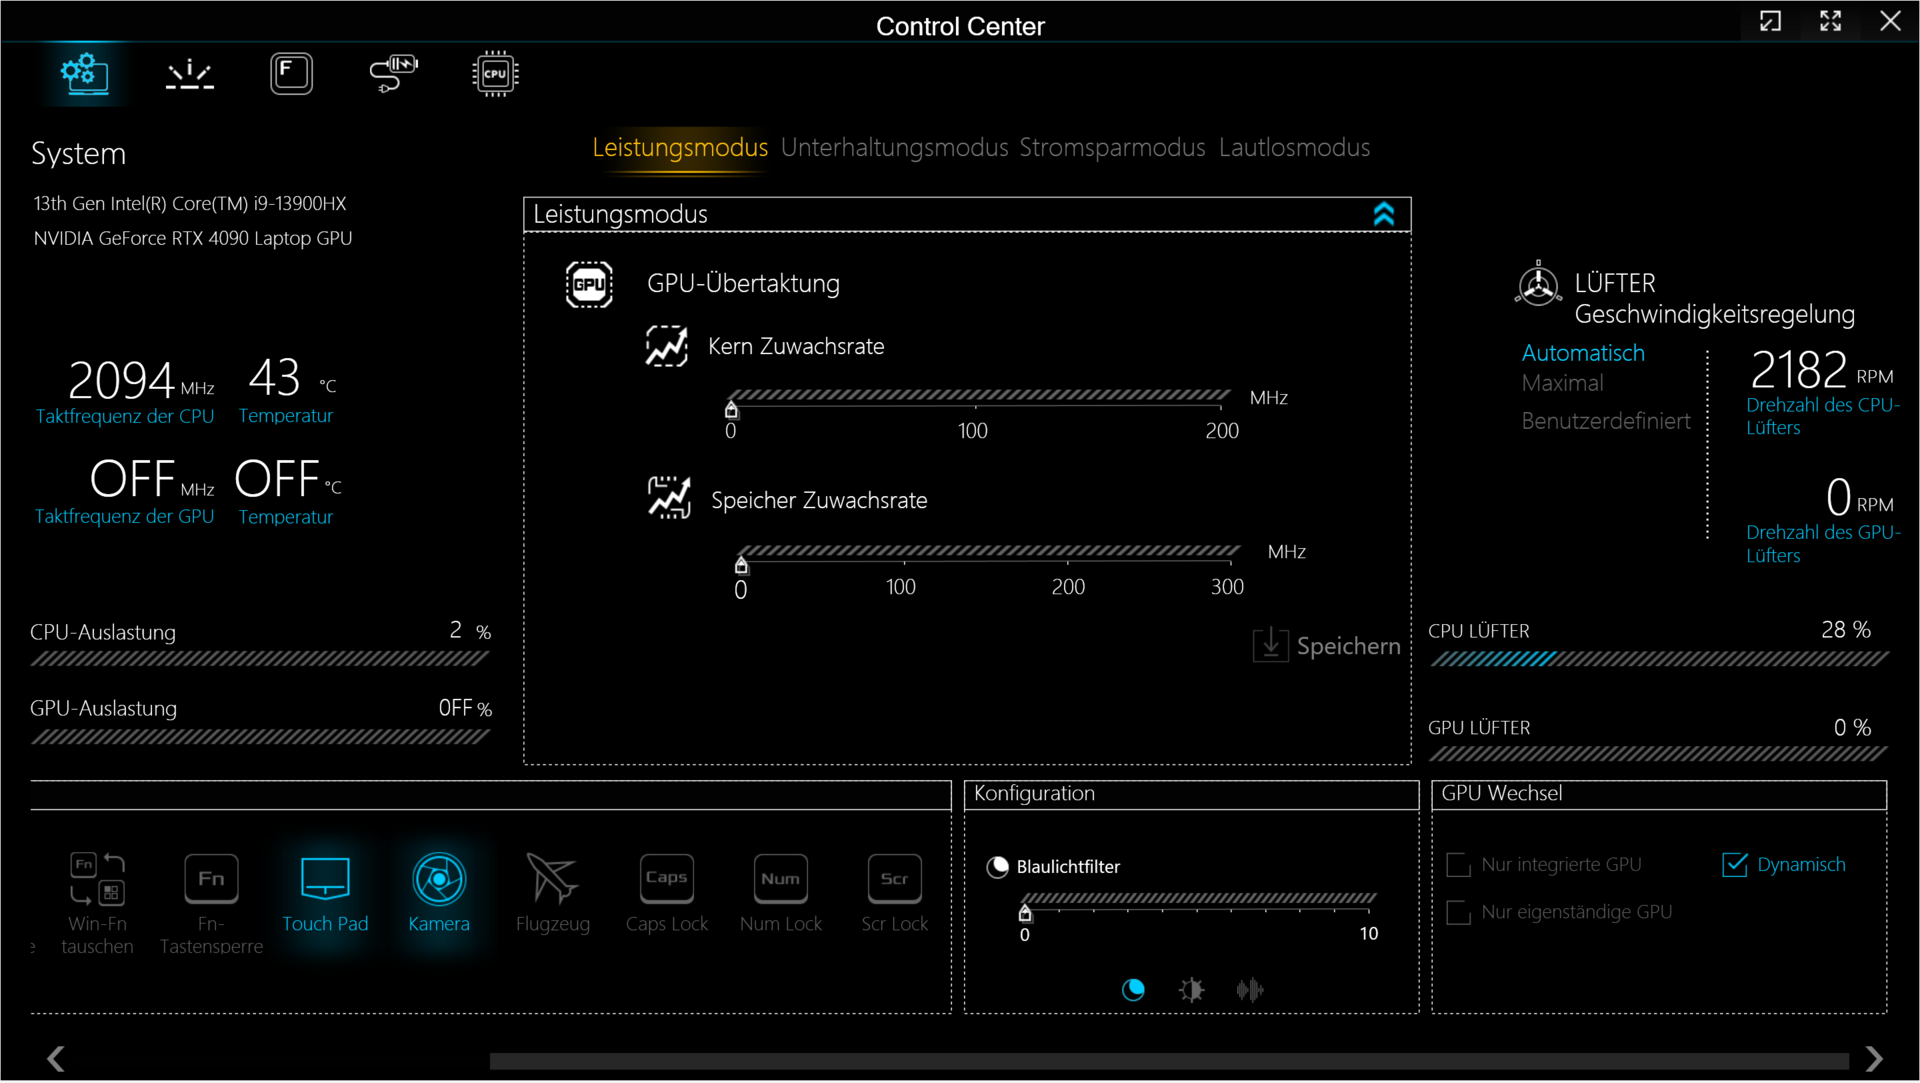
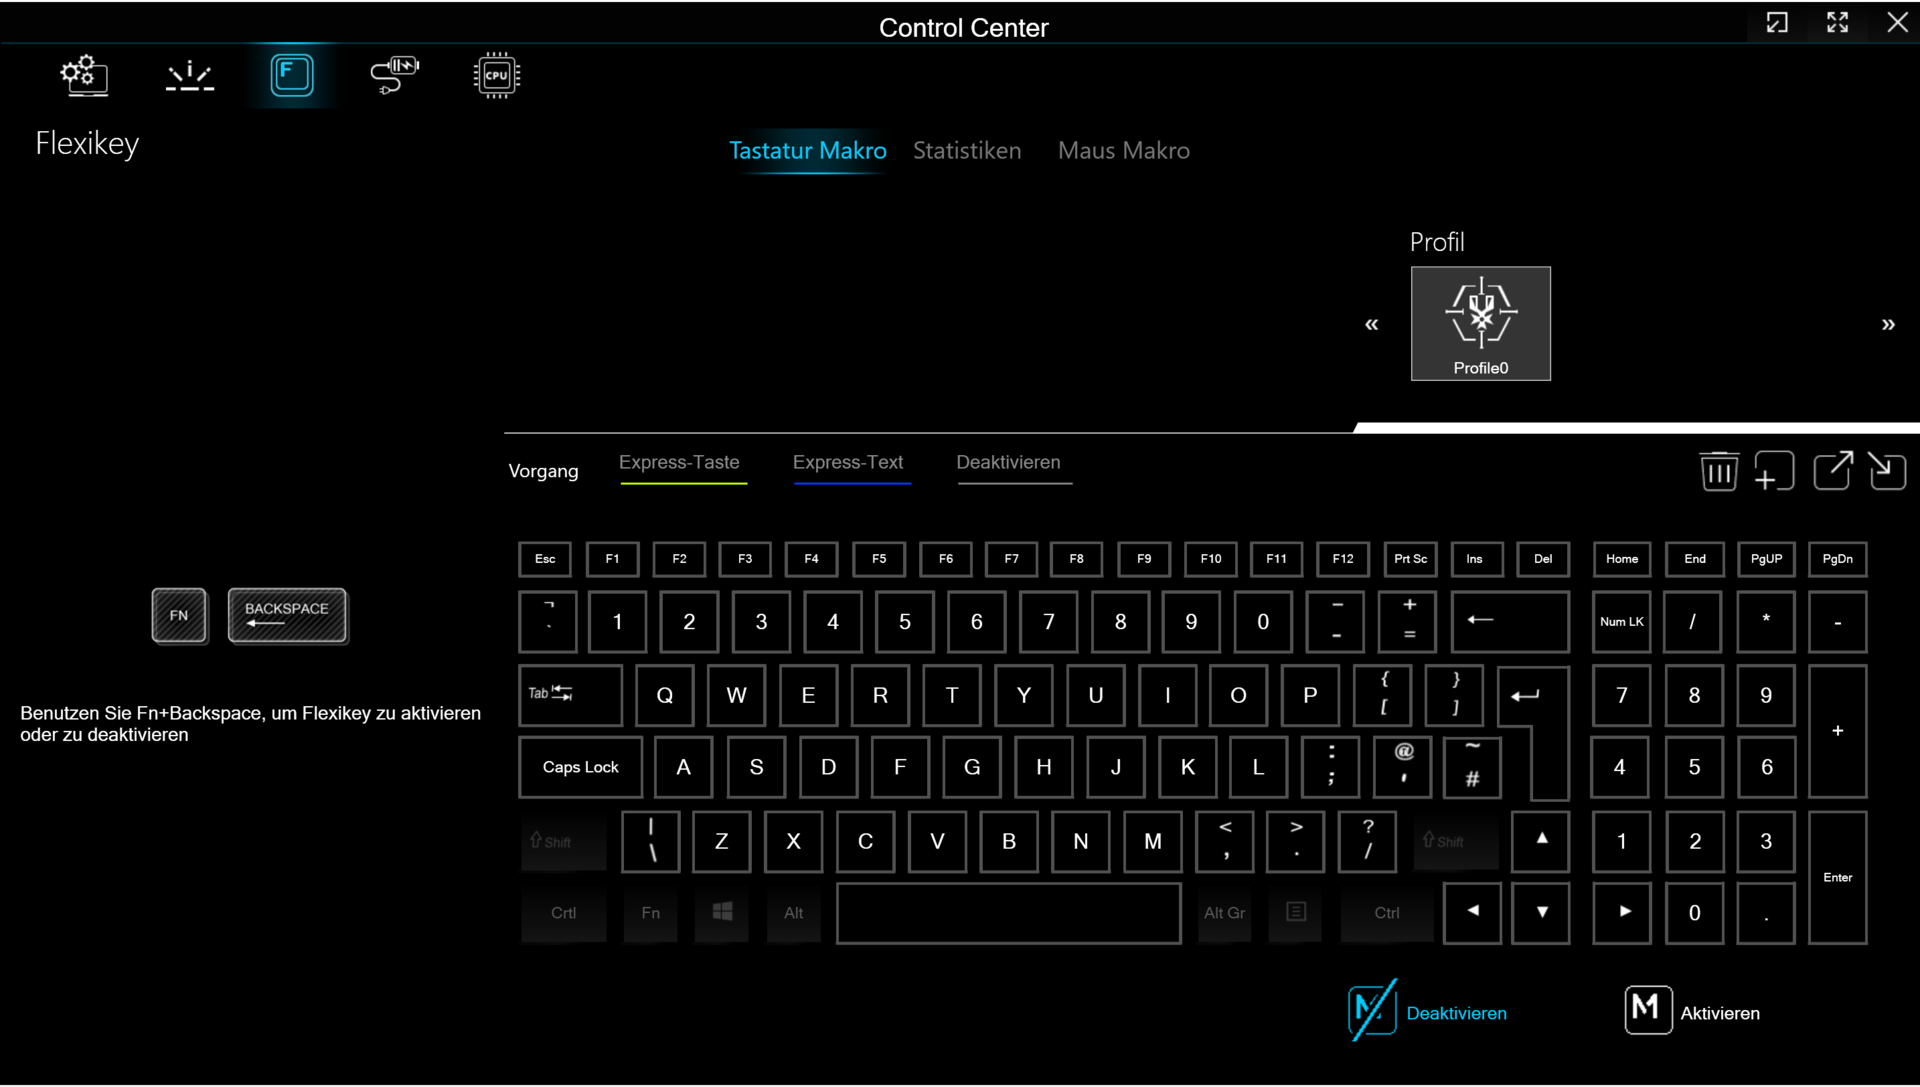
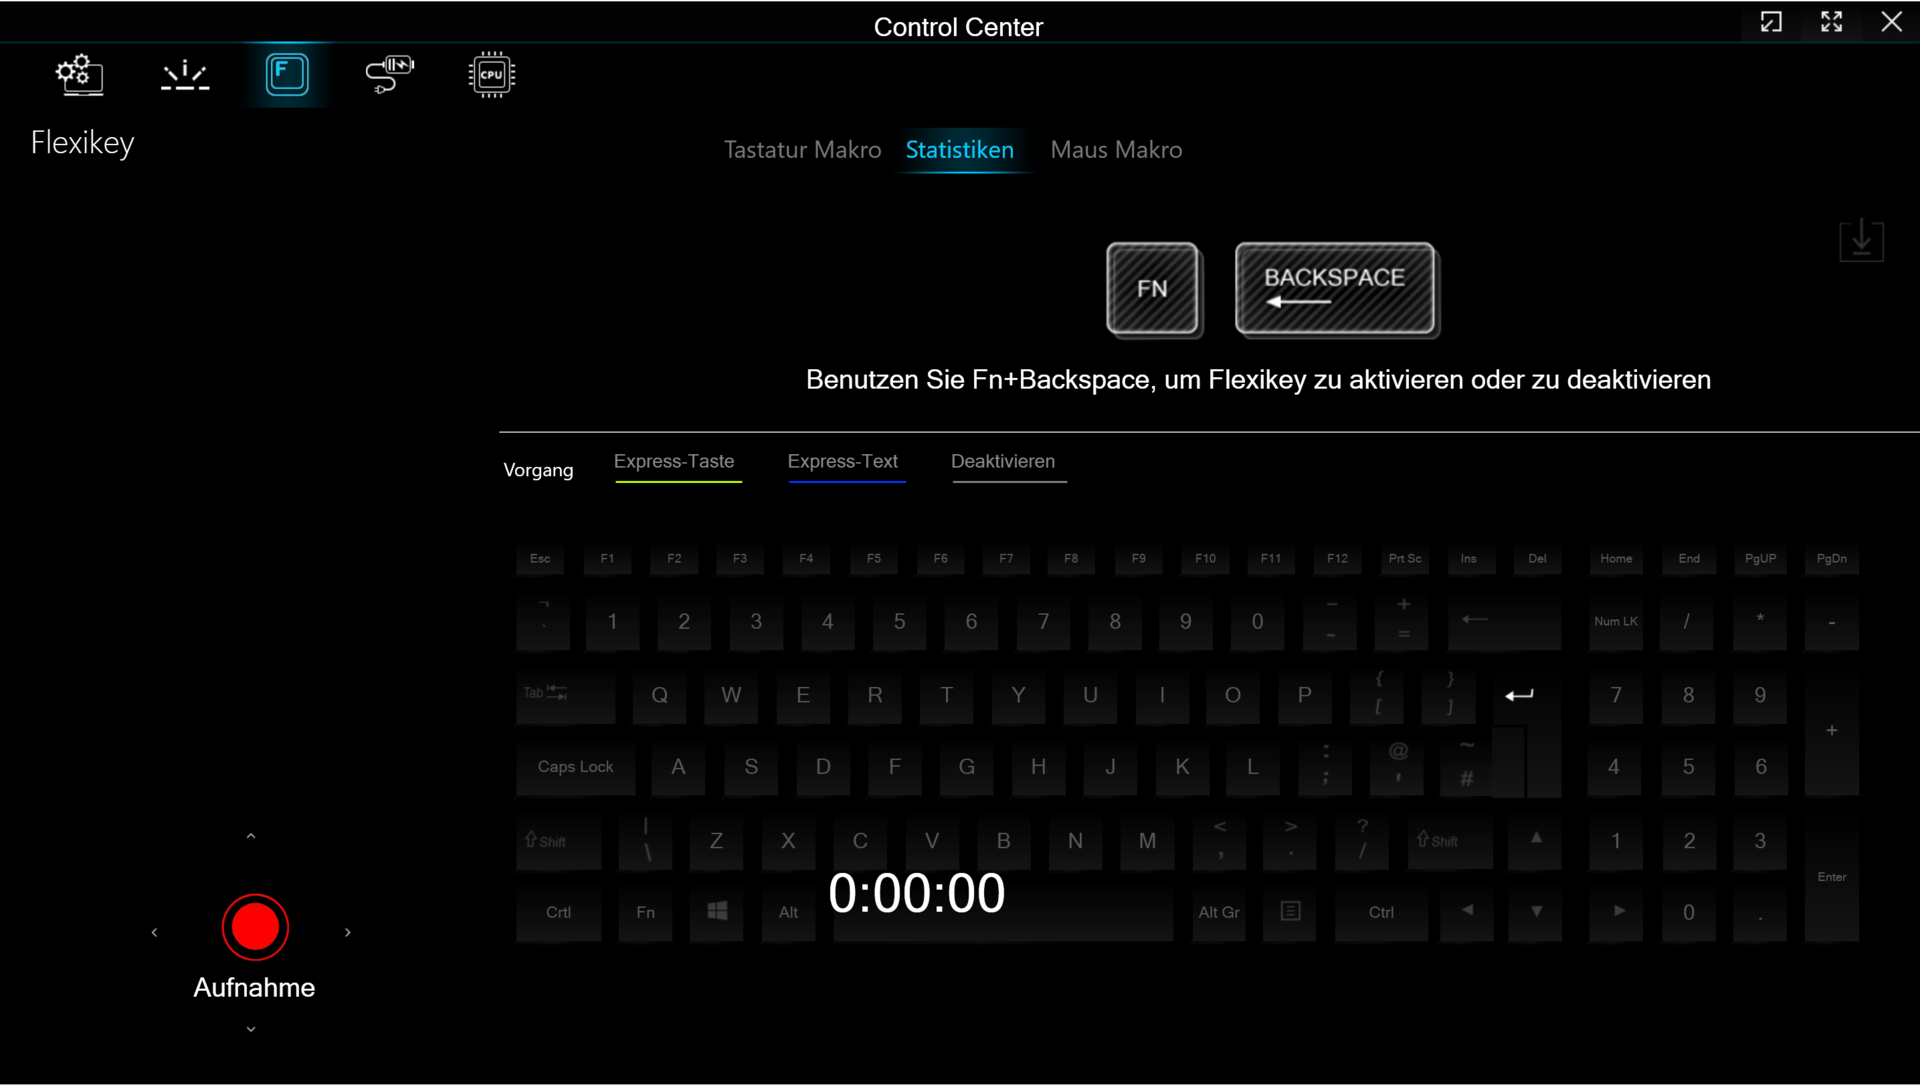
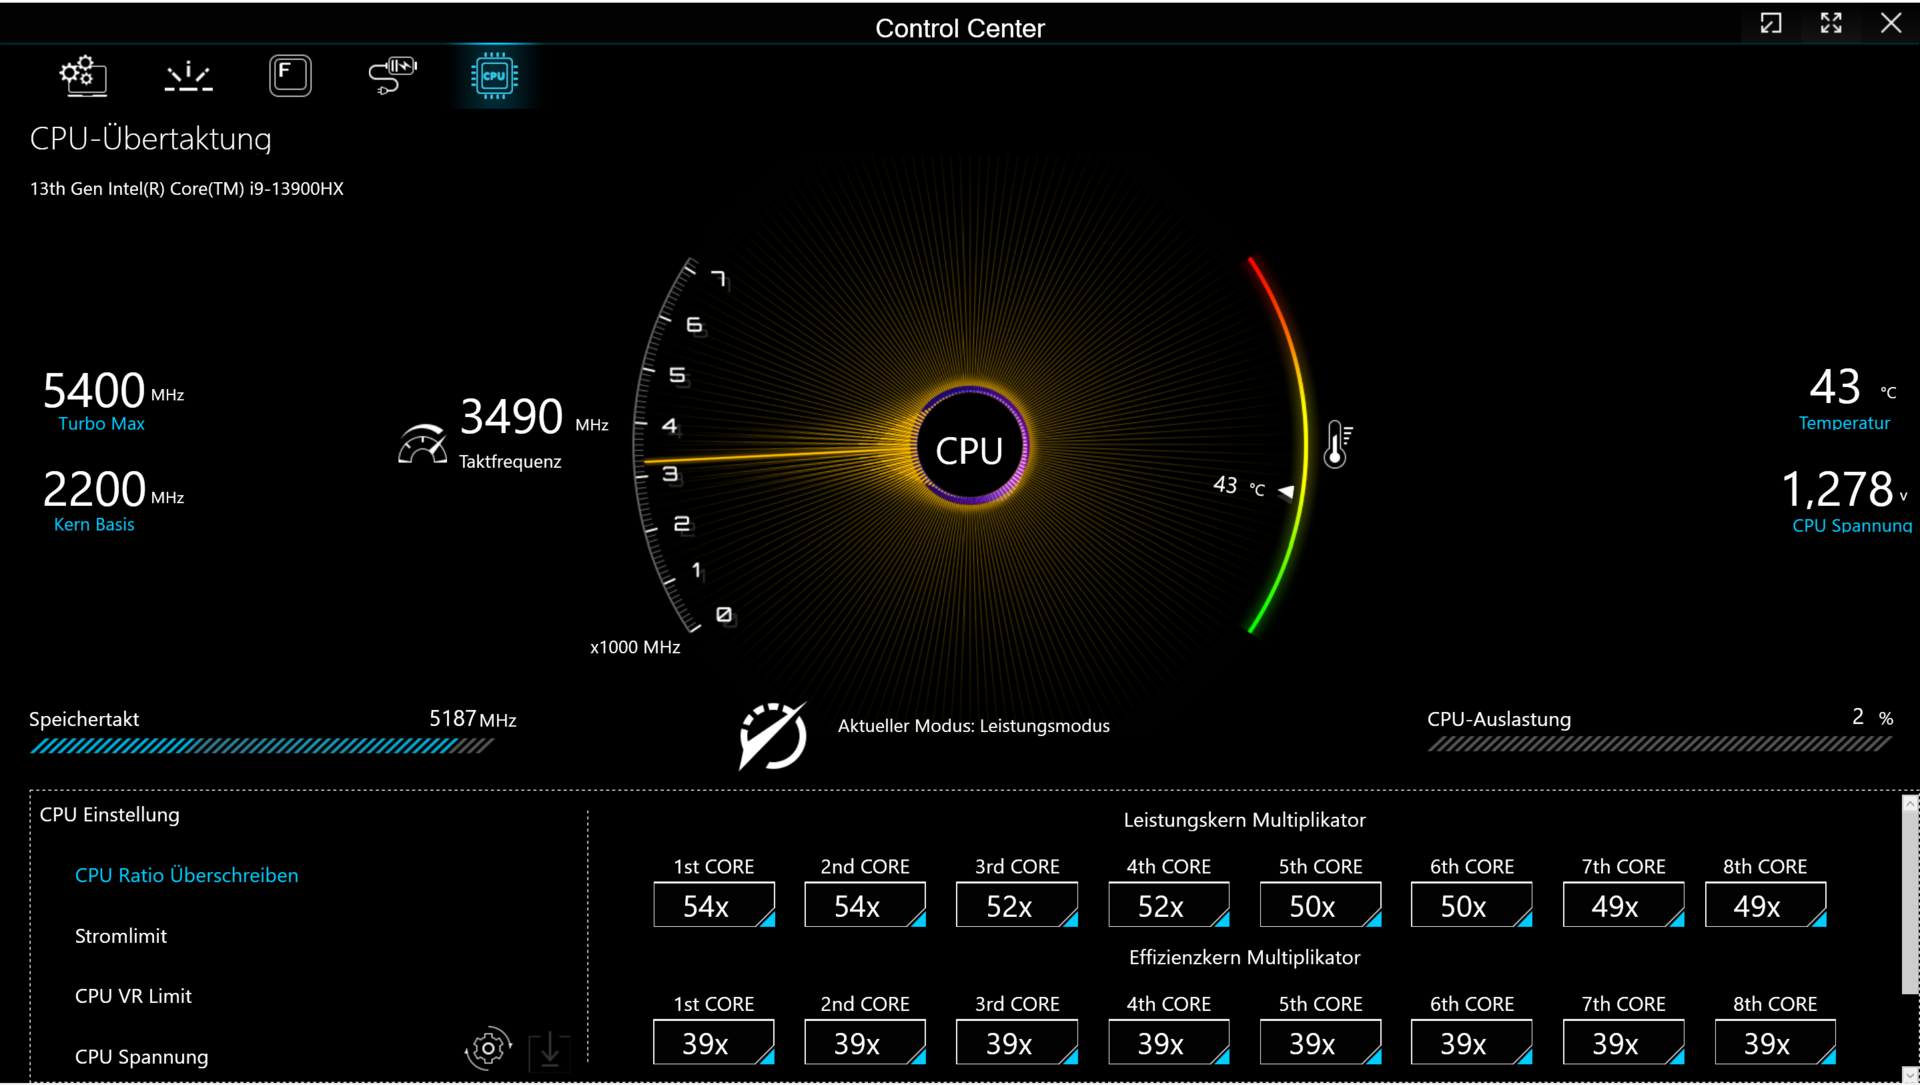
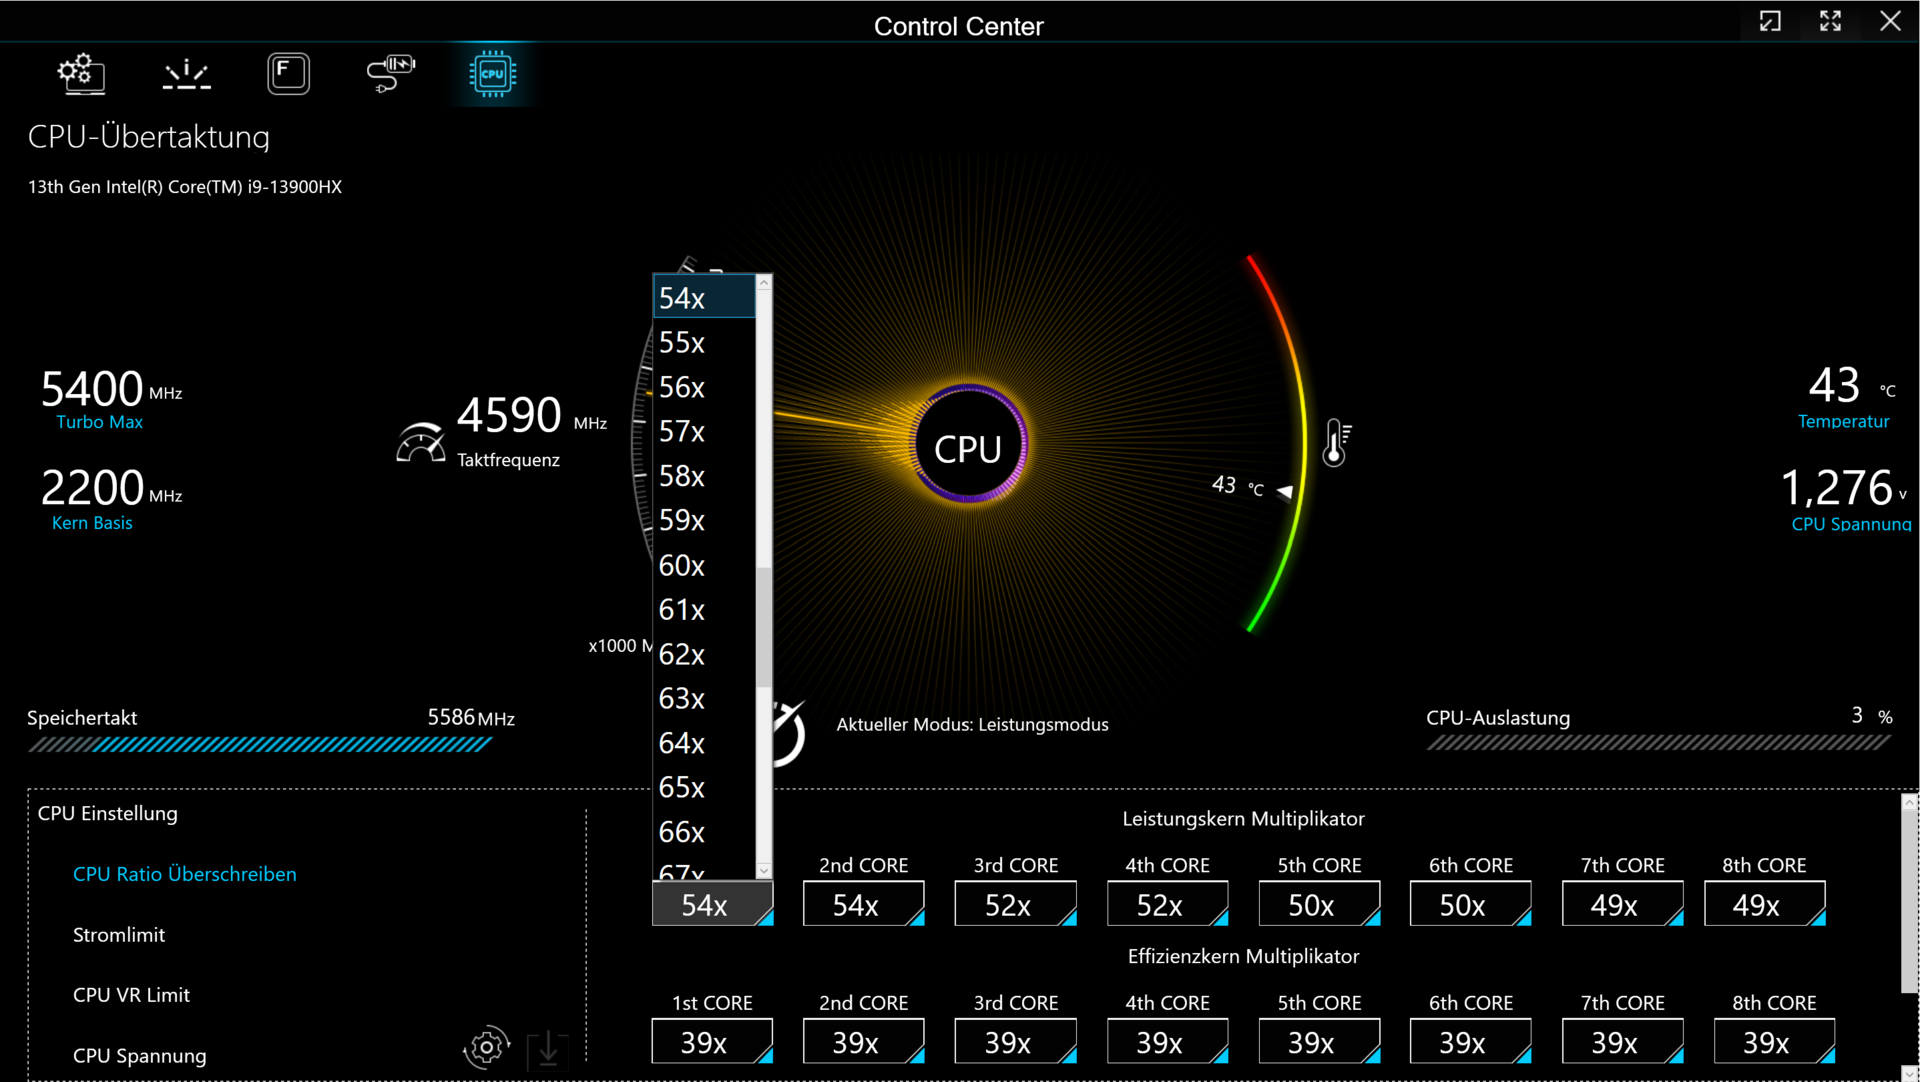
le mode "Performance" permet aux utilisateurs d'overclocker le GPU et la VRAM dans le Control Center. En cliquant sur les deux flèches vers le bas, le menu correspondant s'ouvre (figure 3). Vous devez activer l'overclocking du CPU dans le BIOS avant qu'un nouvel onglet n'apparaisse dans le Control Center (voir figures 12 à 16). Mais attention : l'overclocking du matériel se fait à vos risques et périls - vous êtes responsable de tout dommage qui en résulterait.
| Mode performance | Mode divertissement | Mode économie d'énergie | Mode silencieux | |
|---|---|---|---|---|
| CPU PL1 (HWInfo) | 135 Watt | 75 Watt | 15 Watt | 15 Watt |
| CPU PL2 (HWInfo) | 162 Watt | 130 Watt | 30 Watt | 30 Watt |
| Bruit (Witcher 3) | 62 dB(A) | 54 dB(A) | - | 42 dB(A) |
| Performance (Witcher 3) | ~204 fps | ~188 fps | - | 50 bis 60 fps |
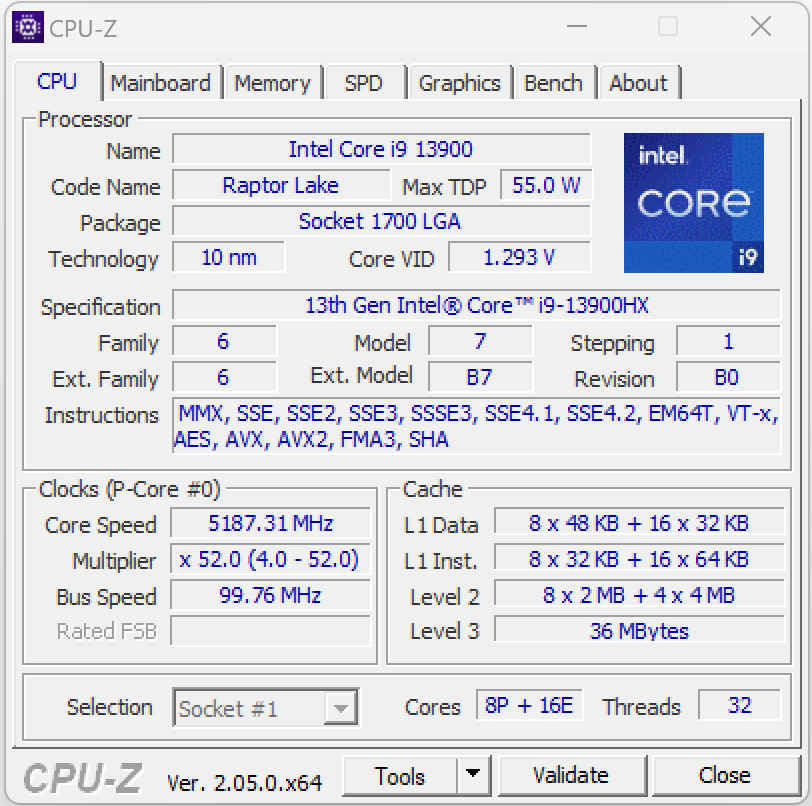
Processeur
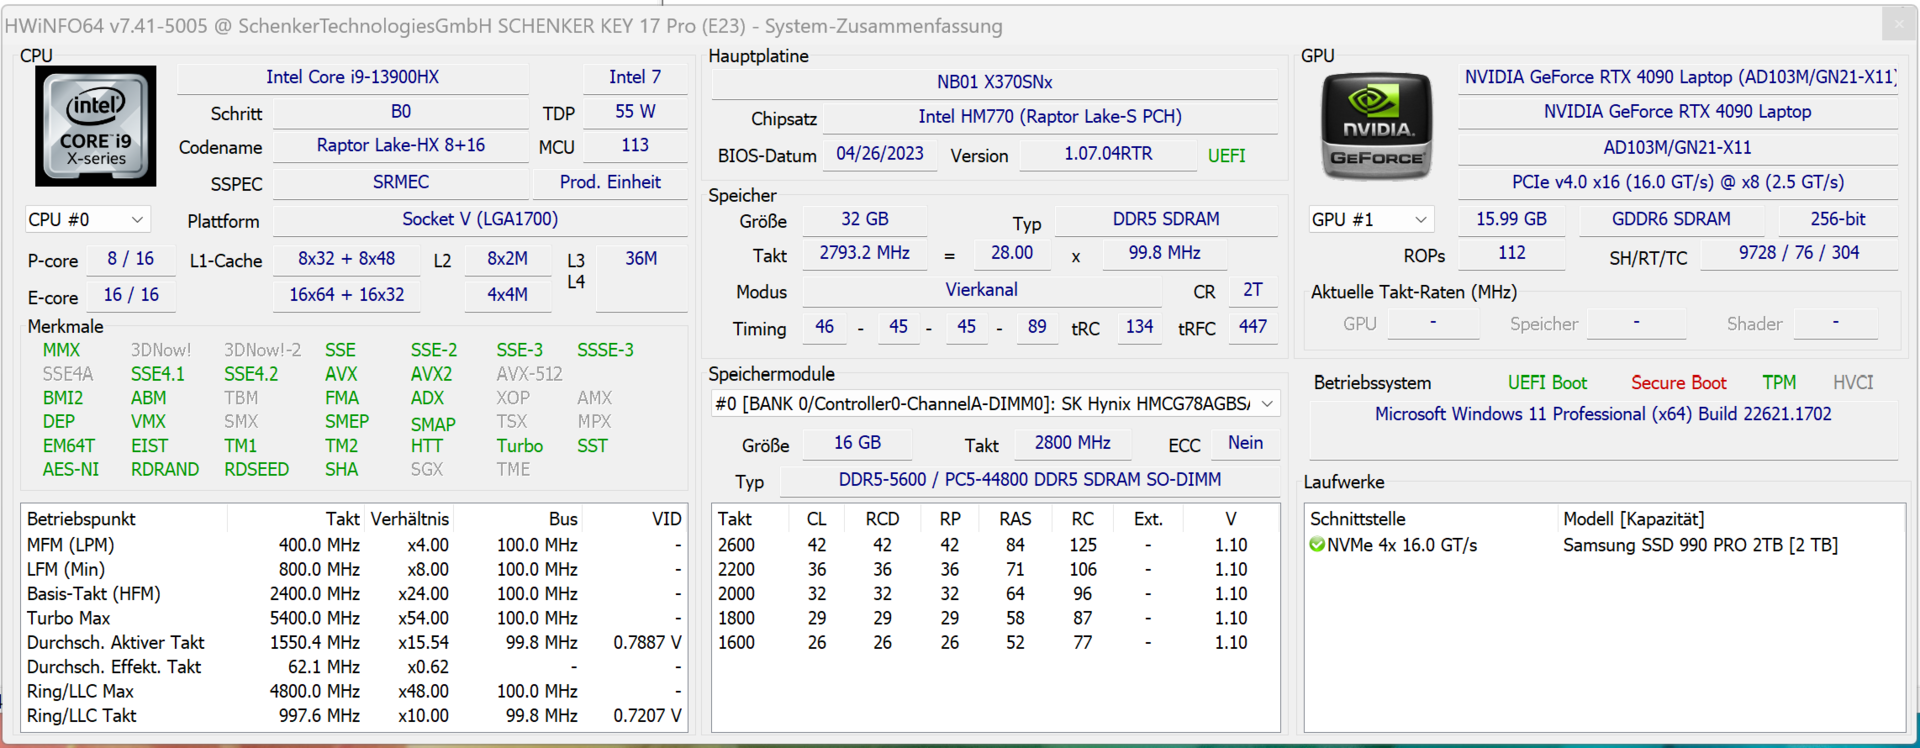
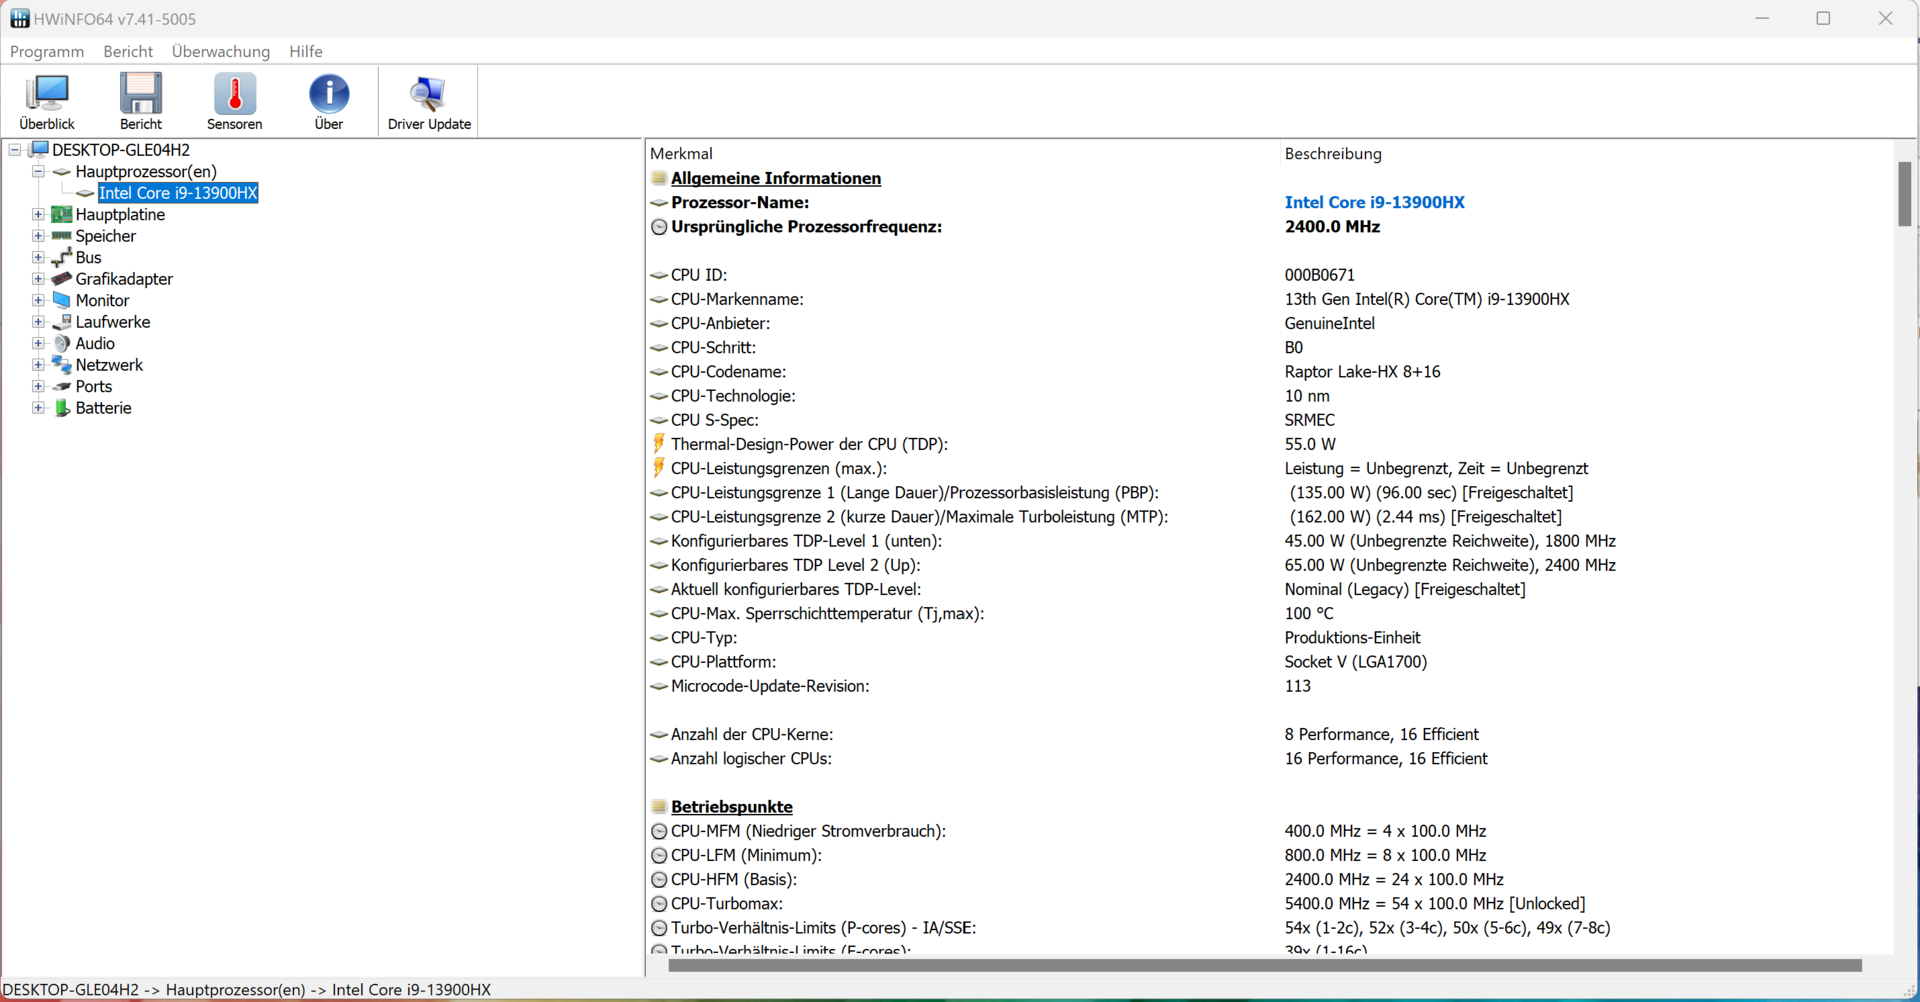
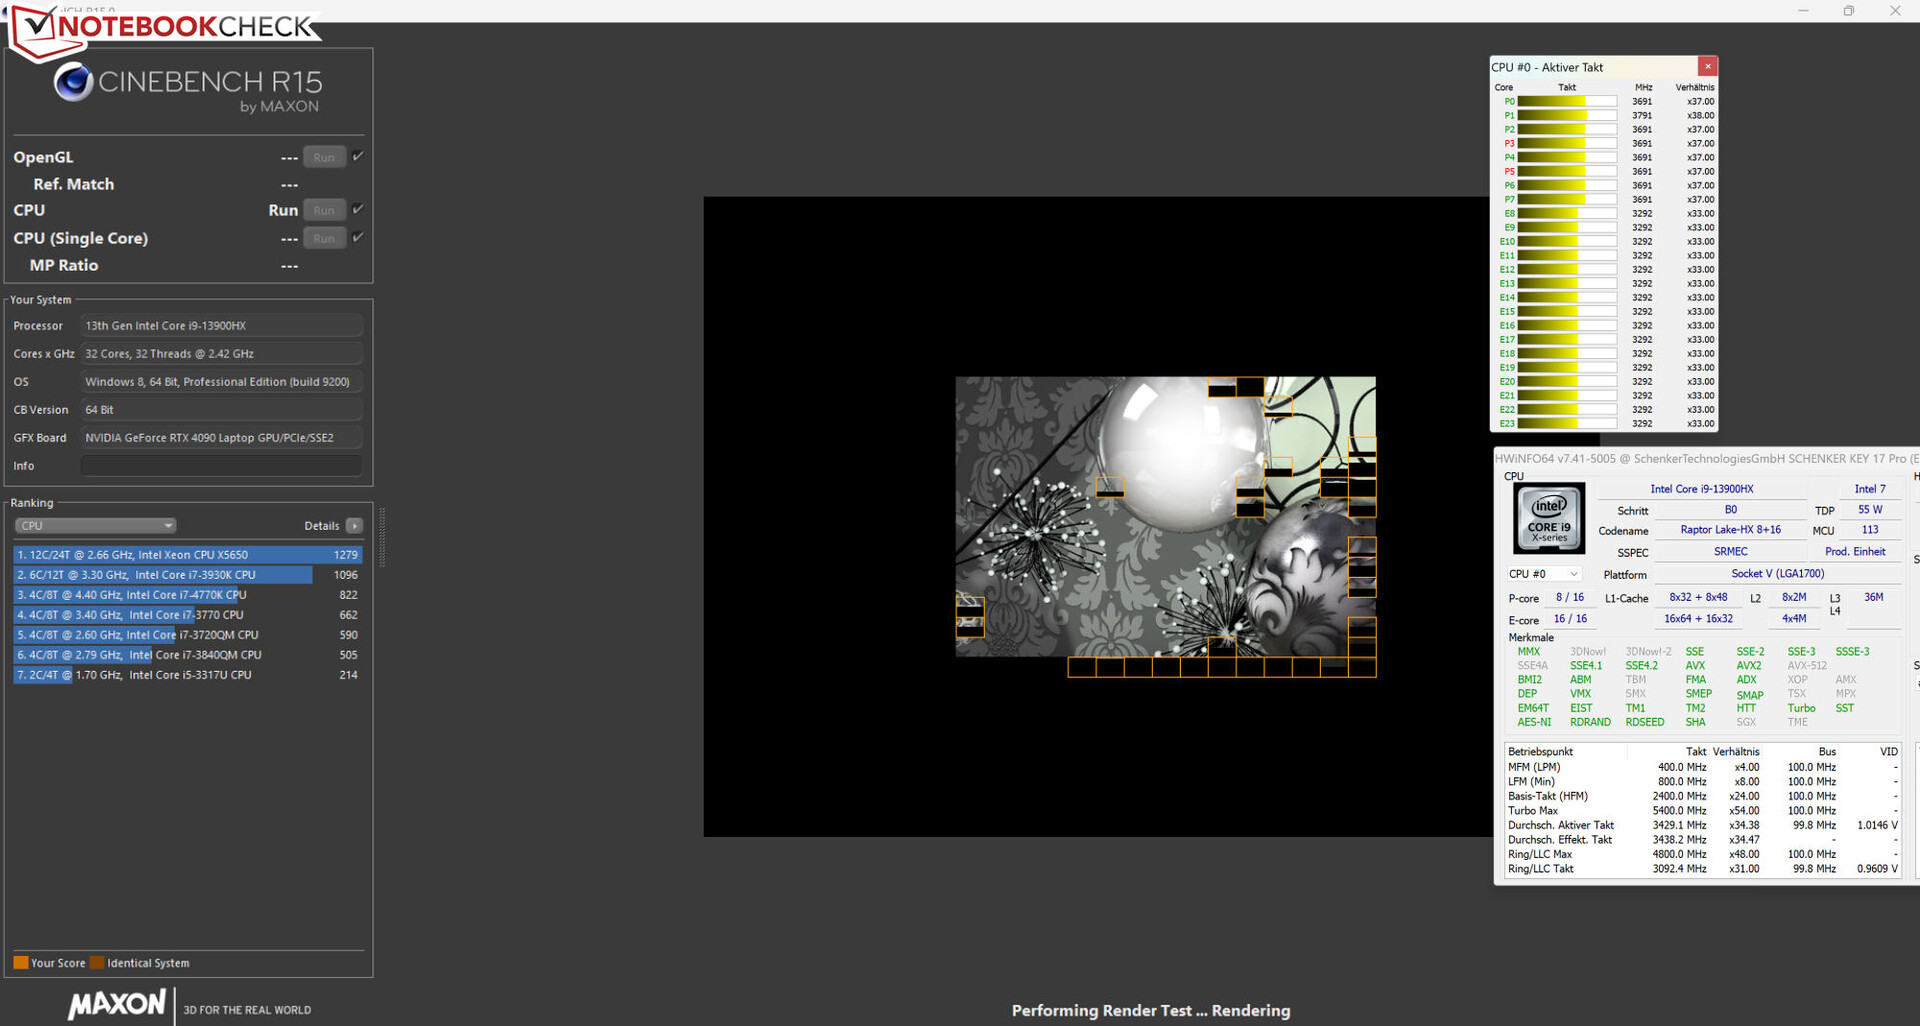
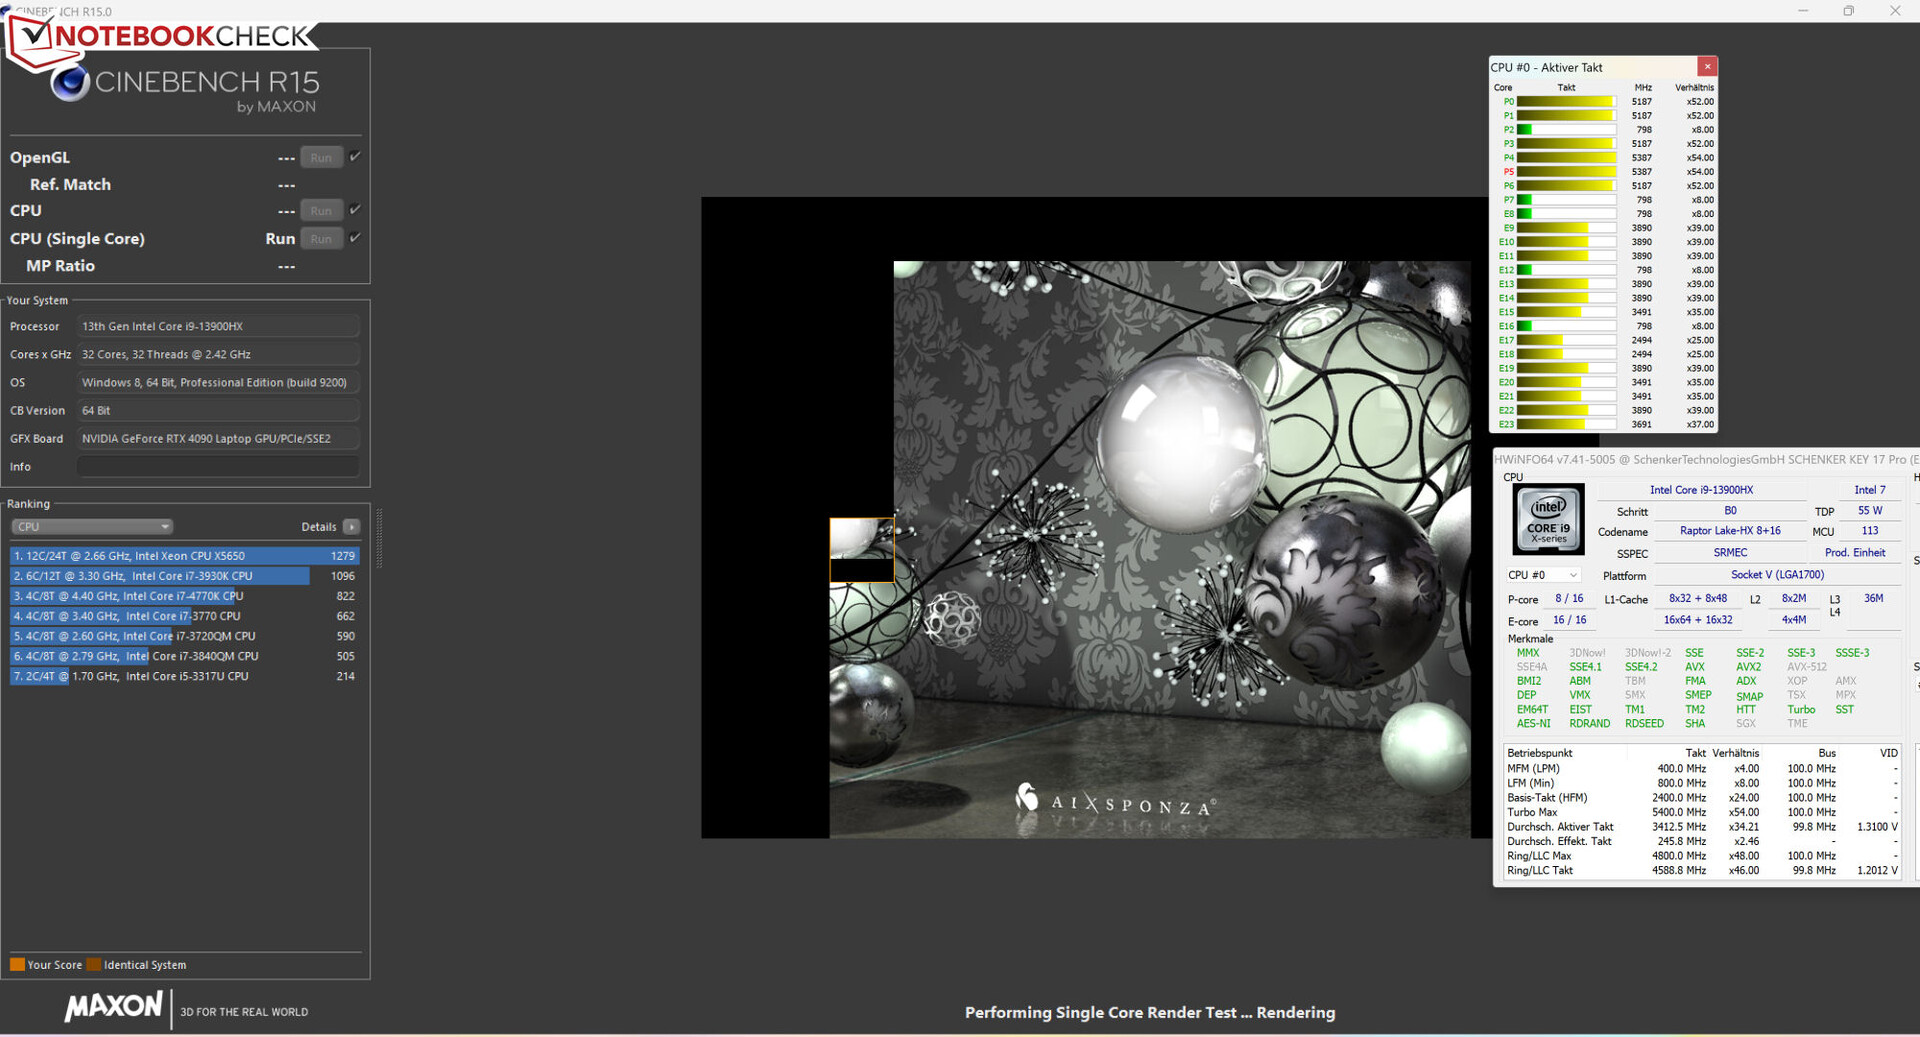
Le processeur Core i9-13900HX Raptor Lake se compose de huit cœurs de performance (Hyperthreading, 2,2 à 5,4 GHz) et de seize cœurs d'efficacité (pas d'Hyperthreading, 1,6 à 3,9 GHz), ce qui donne un total de 32 cœurs logiques de CPU.
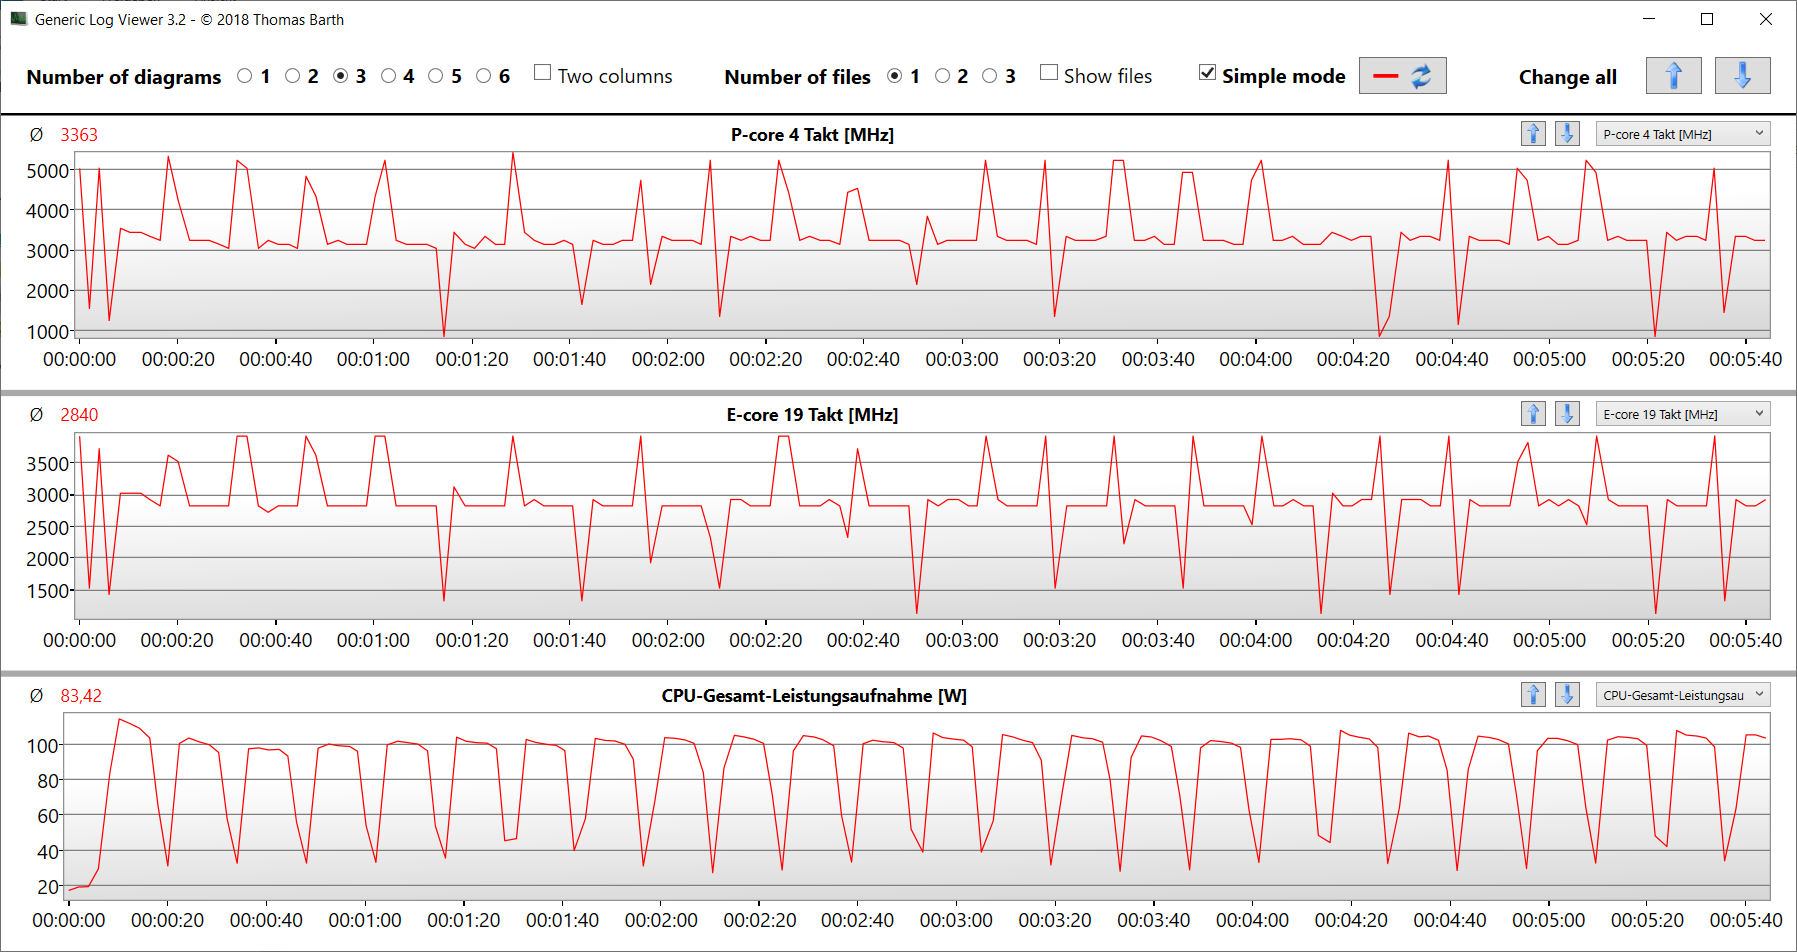
Les résultats obtenus avec la Key 17 Pro sont à peu près dans la même fourchette que ce que nous avons vu avec ce processeur en moyenne. Lors de notre test en boucle Cinebench 15, la charge multithread soutenue a entraîné une légère baisse de la vitesse d'horloge turbo du CPU au cours des deux premières exécutions, avant de se stabiliser à un niveau constant.
Cinebench R15 Multi sustained load
* ... Moindre est la valeur, meilleures sont les performances
AIDA64: FP32 Ray-Trace | FPU Julia | CPU SHA3 | CPU Queen | FPU SinJulia | FPU Mandel | CPU AES | CPU ZLib | FP64 Ray-Trace | CPU PhotoWorxx
| Performance rating | |
| Asus ROG Strix Scar 17 G733PY-XS96 | |
| Schenker Key 17 Pro (Early 23) | |
| Medion Erazer Beast X40 | |
| Moyenne de la classe Gaming | |
| Moyenne Intel Core i9-13900HX | |
| Aorus 17X AZF | |
| MSI Stealth 17 Studio A13VH-014 | |
| AIDA64 / FP32 Ray-Trace | |
| Asus ROG Strix Scar 17 G733PY-XS96 | |
| Moyenne de la classe Gaming (10227 - 85542, n=105, 2 dernières années) | |
| Medion Erazer Beast X40 | |
| Moyenne Intel Core i9-13900HX (17589 - 27615, n=22) | |
| Schenker Key 17 Pro (Early 23) | |
| MSI Stealth 17 Studio A13VH-014 | |
| Aorus 17X AZF | |
| AIDA64 / FPU Julia | |
| Asus ROG Strix Scar 17 G733PY-XS96 | |
| Moyenne de la classe Gaming (51376 - 238426, n=105, 2 dernières années) | |
| Medion Erazer Beast X40 | |
| Moyenne Intel Core i9-13900HX (88686 - 137015, n=22) | |
| Schenker Key 17 Pro (Early 23) | |
| MSI Stealth 17 Studio A13VH-014 | |
| Aorus 17X AZF | |
| AIDA64 / CPU SHA3 | |
| Asus ROG Strix Scar 17 G733PY-XS96 | |
| Medion Erazer Beast X40 | |
| Moyenne de la classe Gaming (2180 - 10115, n=105, 2 dernières années) | |
| Moyenne Intel Core i9-13900HX (4362 - 7029, n=22) | |
| Schenker Key 17 Pro (Early 23) | |
| Aorus 17X AZF | |
| MSI Stealth 17 Studio A13VH-014 | |
| AIDA64 / CPU Queen | |
| Asus ROG Strix Scar 17 G733PY-XS96 | |
| Schenker Key 17 Pro (Early 23) | |
| Moyenne Intel Core i9-13900HX (125644 - 141385, n=22) | |
| Medion Erazer Beast X40 | |
| Aorus 17X AZF | |
| Moyenne de la classe Gaming (49785 - 173351, n=90, 2 dernières années) | |
| MSI Stealth 17 Studio A13VH-014 | |
| AIDA64 / FPU SinJulia | |
| Asus ROG Strix Scar 17 G733PY-XS96 | |
| Medion Erazer Beast X40 | |
| Moyenne Intel Core i9-13900HX (12334 - 17179, n=22) | |
| Schenker Key 17 Pro (Early 23) | |
| Moyenne de la classe Gaming (4424 - 33636, n=105, 2 dernières années) | |
| Aorus 17X AZF | |
| MSI Stealth 17 Studio A13VH-014 | |
| AIDA64 / FPU Mandel | |
| Asus ROG Strix Scar 17 G733PY-XS96 | |
| Moyenne de la classe Gaming (25115 - 128721, n=105, 2 dernières années) | |
| Medion Erazer Beast X40 | |
| Moyenne Intel Core i9-13900HX (43850 - 69202, n=22) | |
| Schenker Key 17 Pro (Early 23) | |
| MSI Stealth 17 Studio A13VH-014 | |
| Aorus 17X AZF | |
| AIDA64 / CPU AES | |
| Schenker Key 17 Pro (Early 23) | |
| Asus ROG Strix Scar 17 G733PY-XS96 | |
| Aorus 17X AZF | |
| Moyenne Intel Core i9-13900HX (89413 - 237881, n=22) | |
| Medion Erazer Beast X40 | |
| Moyenne de la classe Gaming (39258 - 247074, n=105, 2 dernières années) | |
| MSI Stealth 17 Studio A13VH-014 | |
| AIDA64 / CPU ZLib | |
| Asus ROG Strix Scar 17 G733PY-XS96 | |
| Medion Erazer Beast X40 | |
| Moyenne Intel Core i9-13900HX (1284 - 1958, n=22) | |
| Schenker Key 17 Pro (Early 23) | |
| Moyenne de la classe Gaming (574 - 2531, n=105, 2 dernières années) | |
| Aorus 17X AZF | |
| MSI Stealth 17 Studio A13VH-014 | |
| AIDA64 / FP64 Ray-Trace | |
| Asus ROG Strix Scar 17 G733PY-XS96 | |
| Moyenne de la classe Gaming (5509 - 45446, n=105, 2 dernières années) | |
| Medion Erazer Beast X40 | |
| Moyenne Intel Core i9-13900HX (9481 - 15279, n=22) | |
| Schenker Key 17 Pro (Early 23) | |
| MSI Stealth 17 Studio A13VH-014 | |
| Aorus 17X AZF | |
| AIDA64 / CPU PhotoWorxx | |
| Schenker Key 17 Pro (Early 23) | |
| MSI Stealth 17 Studio A13VH-014 | |
| Aorus 17X AZF | |
| Moyenne Intel Core i9-13900HX (42994 - 51994, n=22) | |
| Moyenne de la classe Gaming (12271 - 89891, n=105, 2 dernières années) | |
| Medion Erazer Beast X40 | |
| Asus ROG Strix Scar 17 G733PY-XS96 | |
Performance du système
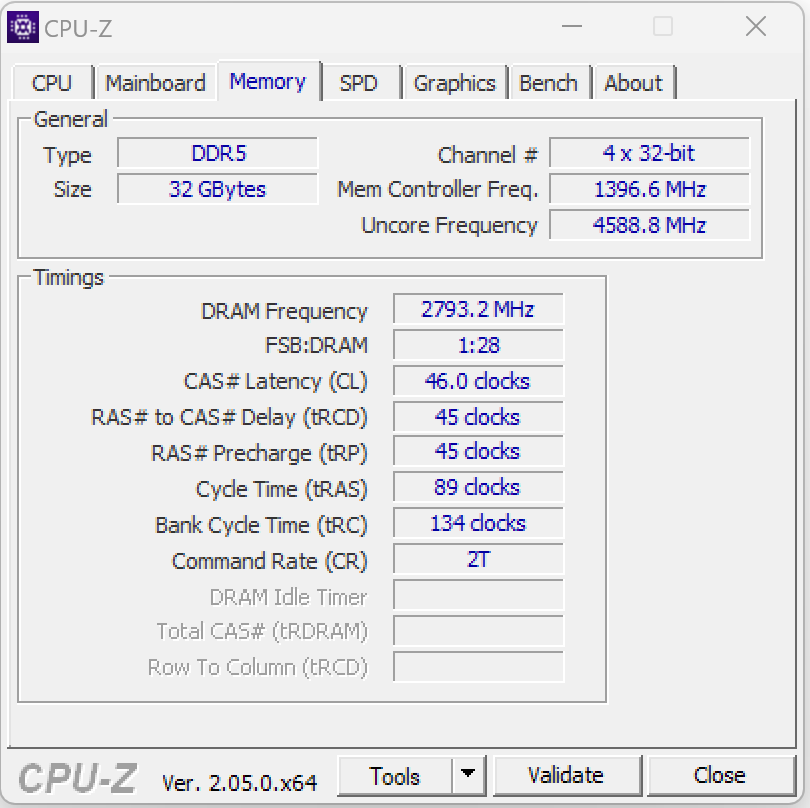
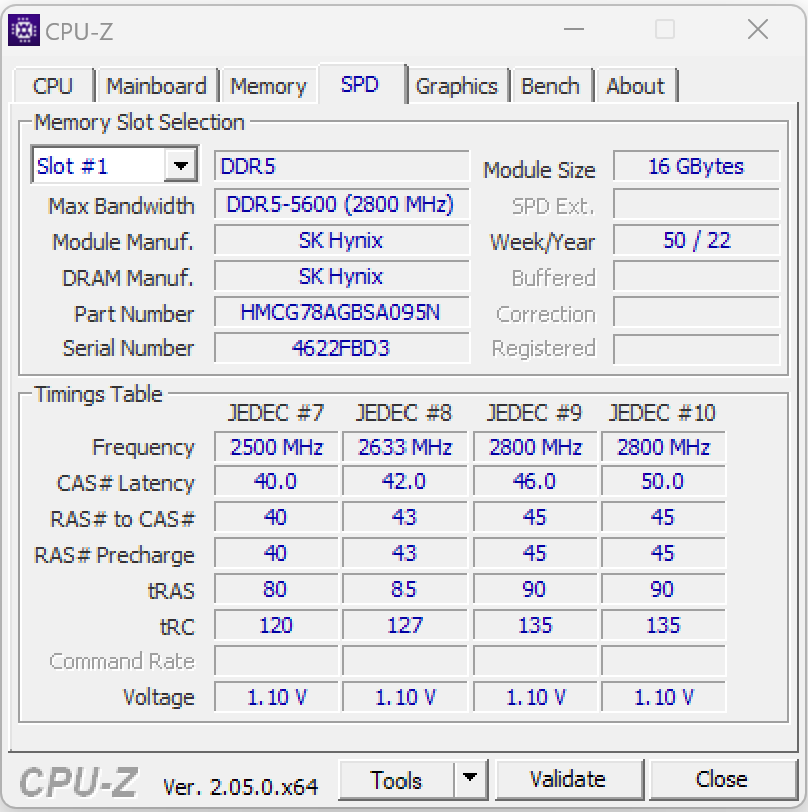
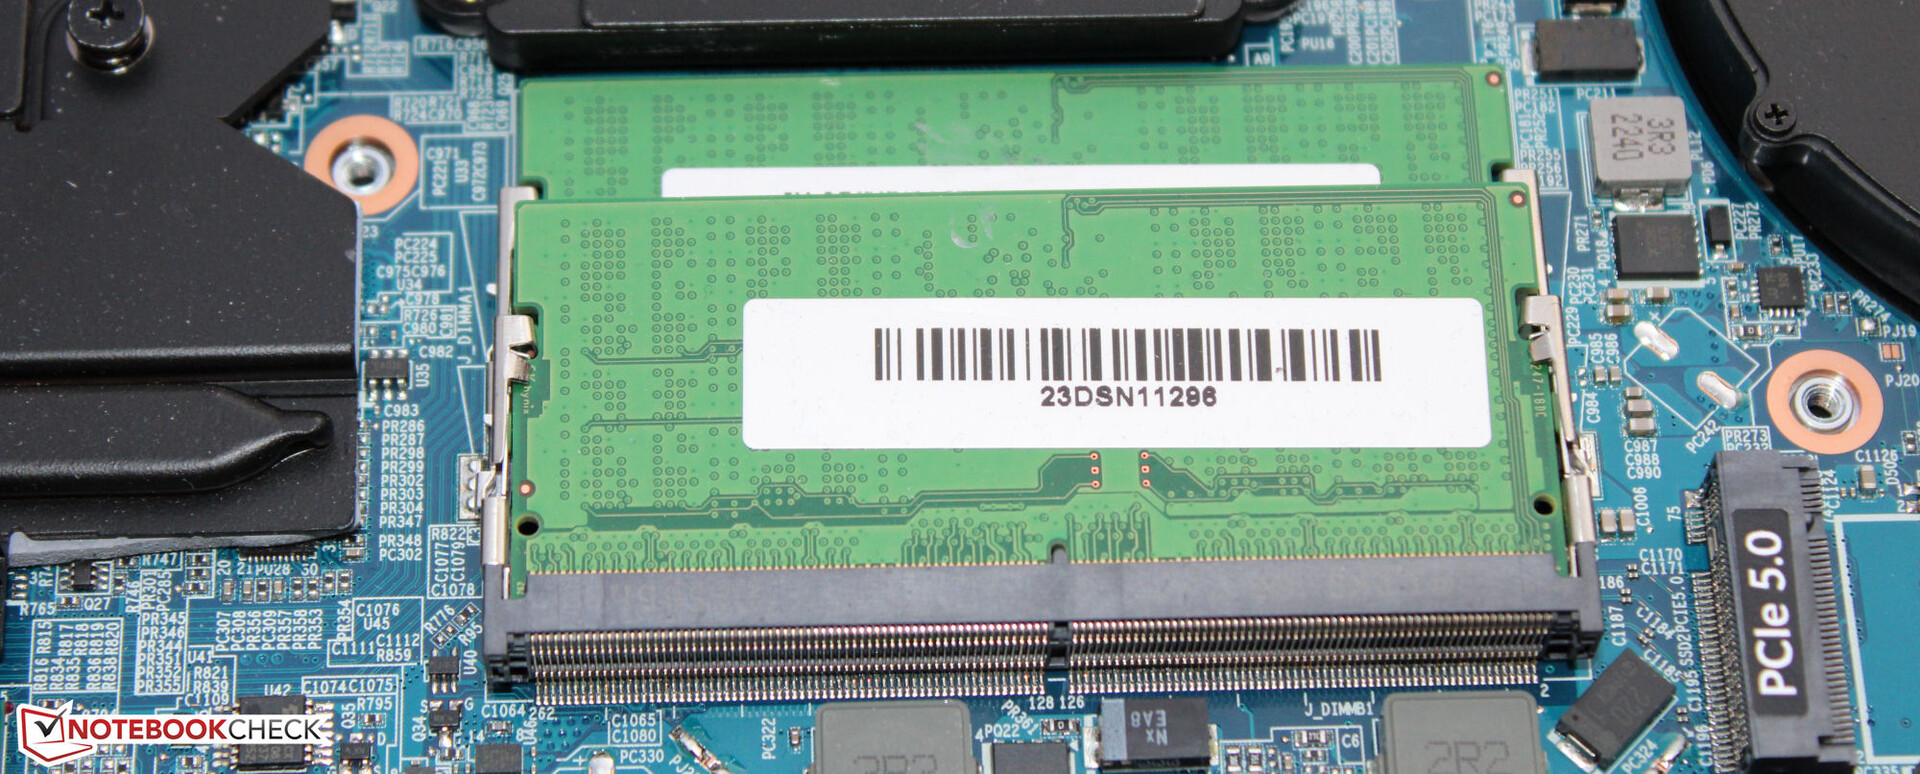
Le système fonctionne en douceur et dispose de suffisamment de puissance de calcul pour gérer confortablement le rendu, l'édition vidéo et les jeux. Les taux de transfert de la mémoire vive sont relativement standard pour une mémoire DDR5-5600.
CrossMark: Overall | Productivity | Creativity | Responsiveness
| PCMark 10 / Score | |
| Schenker Key 17 Pro (Early 23) | |
| Asus ROG Strix Scar 17 G733PY-XS96 | |
| Moyenne Intel Core i9-13900HX, NVIDIA GeForce RTX 4090 Laptop GPU (7690 - 9331, n=8) | |
| Moyenne de la classe Gaming (5828 - 12414, n=93, 2 dernières années) | |
| Medion Erazer Beast X40 | |
| Aorus 17X AZF | |
| MSI Stealth 17 Studio A13VH-014 | |
| PCMark 10 / Essentials | |
| Schenker Key 17 Pro (Early 23) | |
| Moyenne Intel Core i9-13900HX, NVIDIA GeForce RTX 4090 Laptop GPU (10972 - 11983, n=8) | |
| Medion Erazer Beast X40 | |
| Aorus 17X AZF | |
| Asus ROG Strix Scar 17 G733PY-XS96 | |
| Moyenne de la classe Gaming (8810 - 11935, n=97, 2 dernières années) | |
| MSI Stealth 17 Studio A13VH-014 | |
| PCMark 10 / Productivity | |
| Medion Erazer Beast X40 | |
| Schenker Key 17 Pro (Early 23) | |
| Moyenne de la classe Gaming (6845 - 25323, n=95, 2 dernières années) | |
| Moyenne Intel Core i9-13900HX, NVIDIA GeForce RTX 4090 Laptop GPU (9038 - 11680, n=8) | |
| Aorus 17X AZF | |
| Asus ROG Strix Scar 17 G733PY-XS96 | |
| MSI Stealth 17 Studio A13VH-014 | |
| PCMark 10 / Digital Content Creation | |
| Asus ROG Strix Scar 17 G733PY-XS96 | |
| Schenker Key 17 Pro (Early 23) | |
| Moyenne de la classe Gaming (7602 - 19954, n=95, 2 dernières années) | |
| Moyenne Intel Core i9-13900HX, NVIDIA GeForce RTX 4090 Laptop GPU (10605 - 16395, n=8) | |
| MSI Stealth 17 Studio A13VH-014 | |
| Medion Erazer Beast X40 | |
| Aorus 17X AZF | |
| CrossMark / Overall | |
| Schenker Key 17 Pro (Early 23) | |
| Aorus 17X AZF | |
| Medion Erazer Beast X40 | |
| Moyenne Intel Core i9-13900HX, NVIDIA GeForce RTX 4090 Laptop GPU (1825 - 2295, n=8) | |
| Asus ROG Strix Scar 17 G733PY-XS96 | |
| Moyenne de la classe Gaming (1366 - 2409, n=94, 2 dernières années) | |
| MSI Stealth 17 Studio A13VH-014 | |
| CrossMark / Productivity | |
| Schenker Key 17 Pro (Early 23) | |
| Aorus 17X AZF | |
| Medion Erazer Beast X40 | |
| Moyenne Intel Core i9-13900HX, NVIDIA GeForce RTX 4090 Laptop GPU (1666 - 2166, n=8) | |
| Moyenne de la classe Gaming (1386 - 2254, n=94, 2 dernières années) | |
| Asus ROG Strix Scar 17 G733PY-XS96 | |
| MSI Stealth 17 Studio A13VH-014 | |
| CrossMark / Creativity | |
| Schenker Key 17 Pro (Early 23) | |
| Medion Erazer Beast X40 | |
| Moyenne Intel Core i9-13900HX, NVIDIA GeForce RTX 4090 Laptop GPU (2162 - 2514, n=8) | |
| Asus ROG Strix Scar 17 G733PY-XS96 | |
| Aorus 17X AZF | |
| Moyenne de la classe Gaming (1343 - 2786, n=94, 2 dernières années) | |
| MSI Stealth 17 Studio A13VH-014 | |
| CrossMark / Responsiveness | |
| Schenker Key 17 Pro (Early 23) | |
| Aorus 17X AZF | |
| Medion Erazer Beast X40 | |
| Moyenne Intel Core i9-13900HX, NVIDIA GeForce RTX 4090 Laptop GPU (1441 - 2275, n=8) | |
| Moyenne de la classe Gaming (1226 - 2334, n=94, 2 dernières années) | |
| Asus ROG Strix Scar 17 G733PY-XS96 | |
| MSI Stealth 17 Studio A13VH-014 | |
| PCMark 10 Score | 8913 points | |
Aide | ||
| AIDA64 / Memory Copy | |
| Schenker Key 17 Pro (Early 23) | |
| Aorus 17X AZF | |
| Moyenne Intel Core i9-13900HX (67716 - 79193, n=22) | |
| MSI Stealth 17 Studio A13VH-014 | |
| Moyenne de la classe Gaming (21750 - 129946, n=105, 2 dernières années) | |
| Medion Erazer Beast X40 | |
| Asus ROG Strix Scar 17 G733PY-XS96 | |
| AIDA64 / Memory Read | |
| Aorus 17X AZF | |
| Schenker Key 17 Pro (Early 23) | |
| Moyenne Intel Core i9-13900HX (73998 - 88462, n=22) | |
| MSI Stealth 17 Studio A13VH-014 | |
| Medion Erazer Beast X40 | |
| Moyenne de la classe Gaming (22956 - 118858, n=105, 2 dernières années) | |
| Asus ROG Strix Scar 17 G733PY-XS96 | |
| AIDA64 / Memory Write | |
| Schenker Key 17 Pro (Early 23) | |
| Aorus 17X AZF | |
| Moyenne de la classe Gaming (22297 - 135096, n=105, 2 dernières années) | |
| MSI Stealth 17 Studio A13VH-014 | |
| Moyenne Intel Core i9-13900HX (65472 - 77045, n=22) | |
| Medion Erazer Beast X40 | |
| Asus ROG Strix Scar 17 G733PY-XS96 | |
| AIDA64 / Memory Latency | |
| Moyenne de la classe Gaming (75.3 - 259, n=105, 2 dernières années) | |
| MSI Stealth 17 Studio A13VH-014 | |
| Schenker Key 17 Pro (Early 23) | |
| Medion Erazer Beast X40 | |
| Moyenne Intel Core i9-13900HX (75.3 - 91.1, n=22) | |
| Asus ROG Strix Scar 17 G733PY-XS96 | |
| Aorus 17X AZF | |
* ... Moindre est la valeur, meilleures sont les performances
Latence DPC
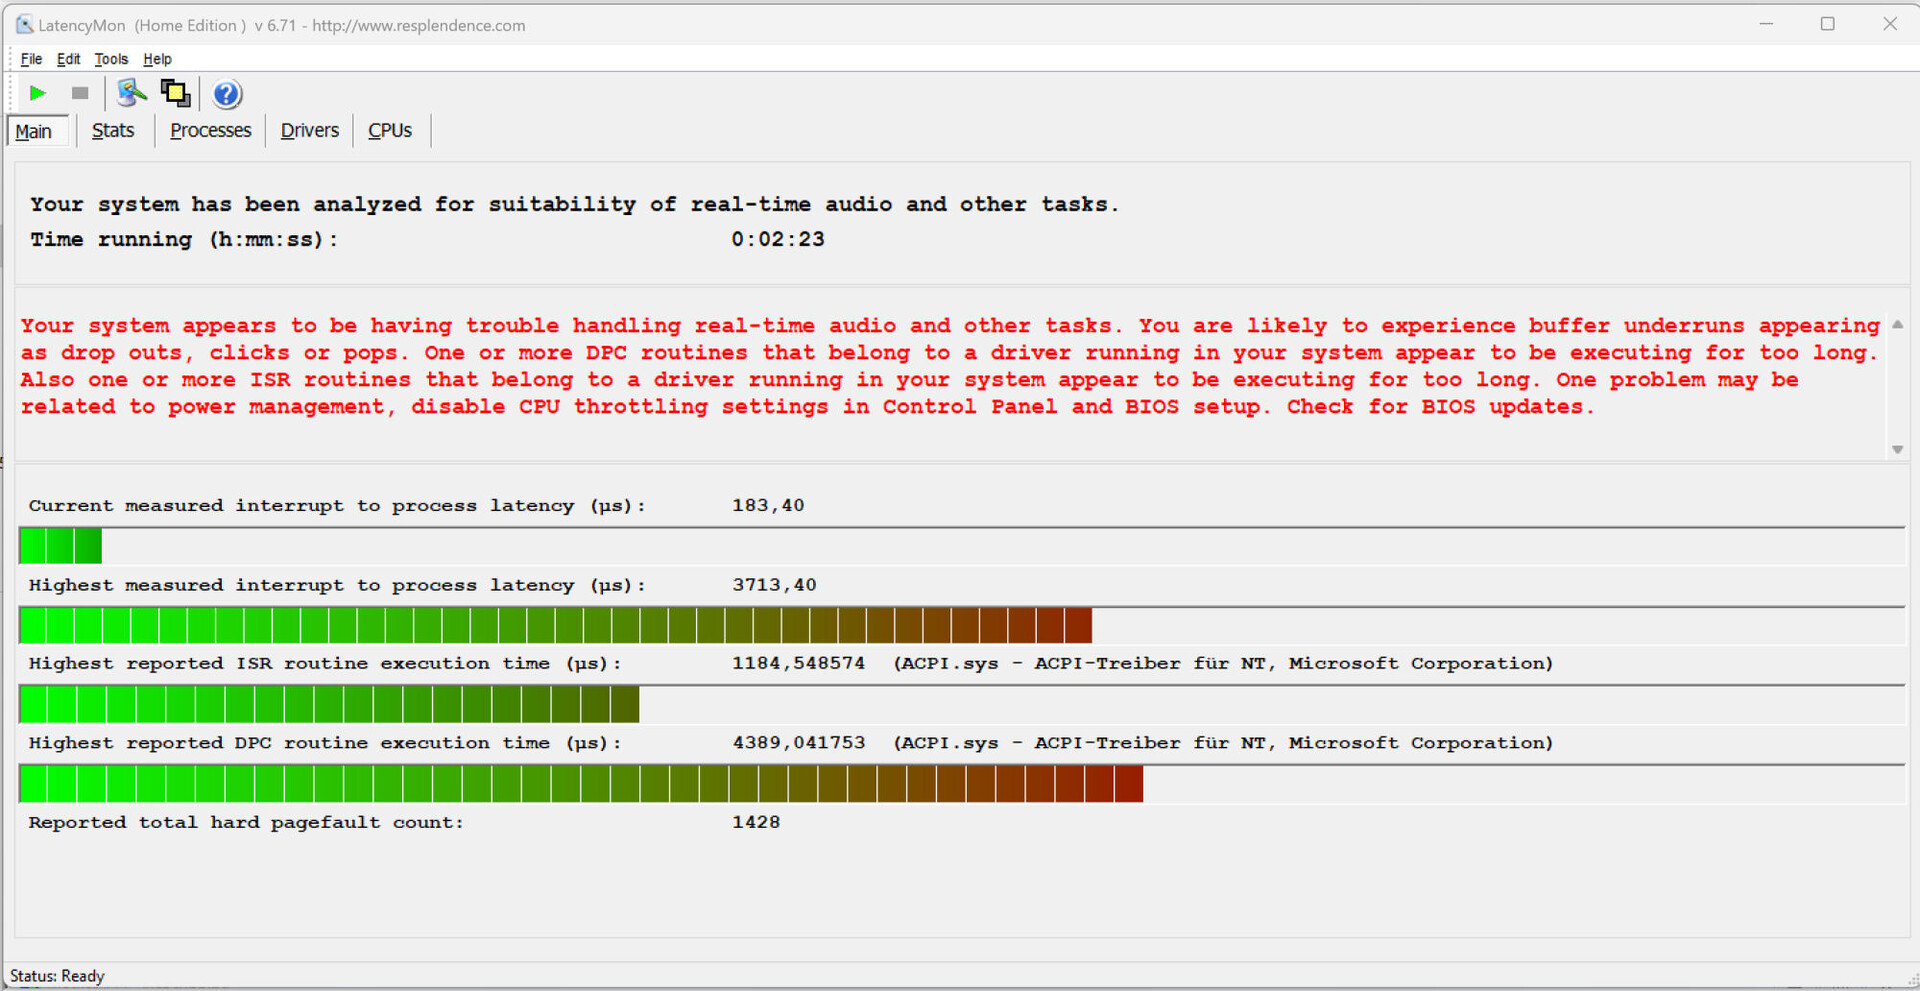
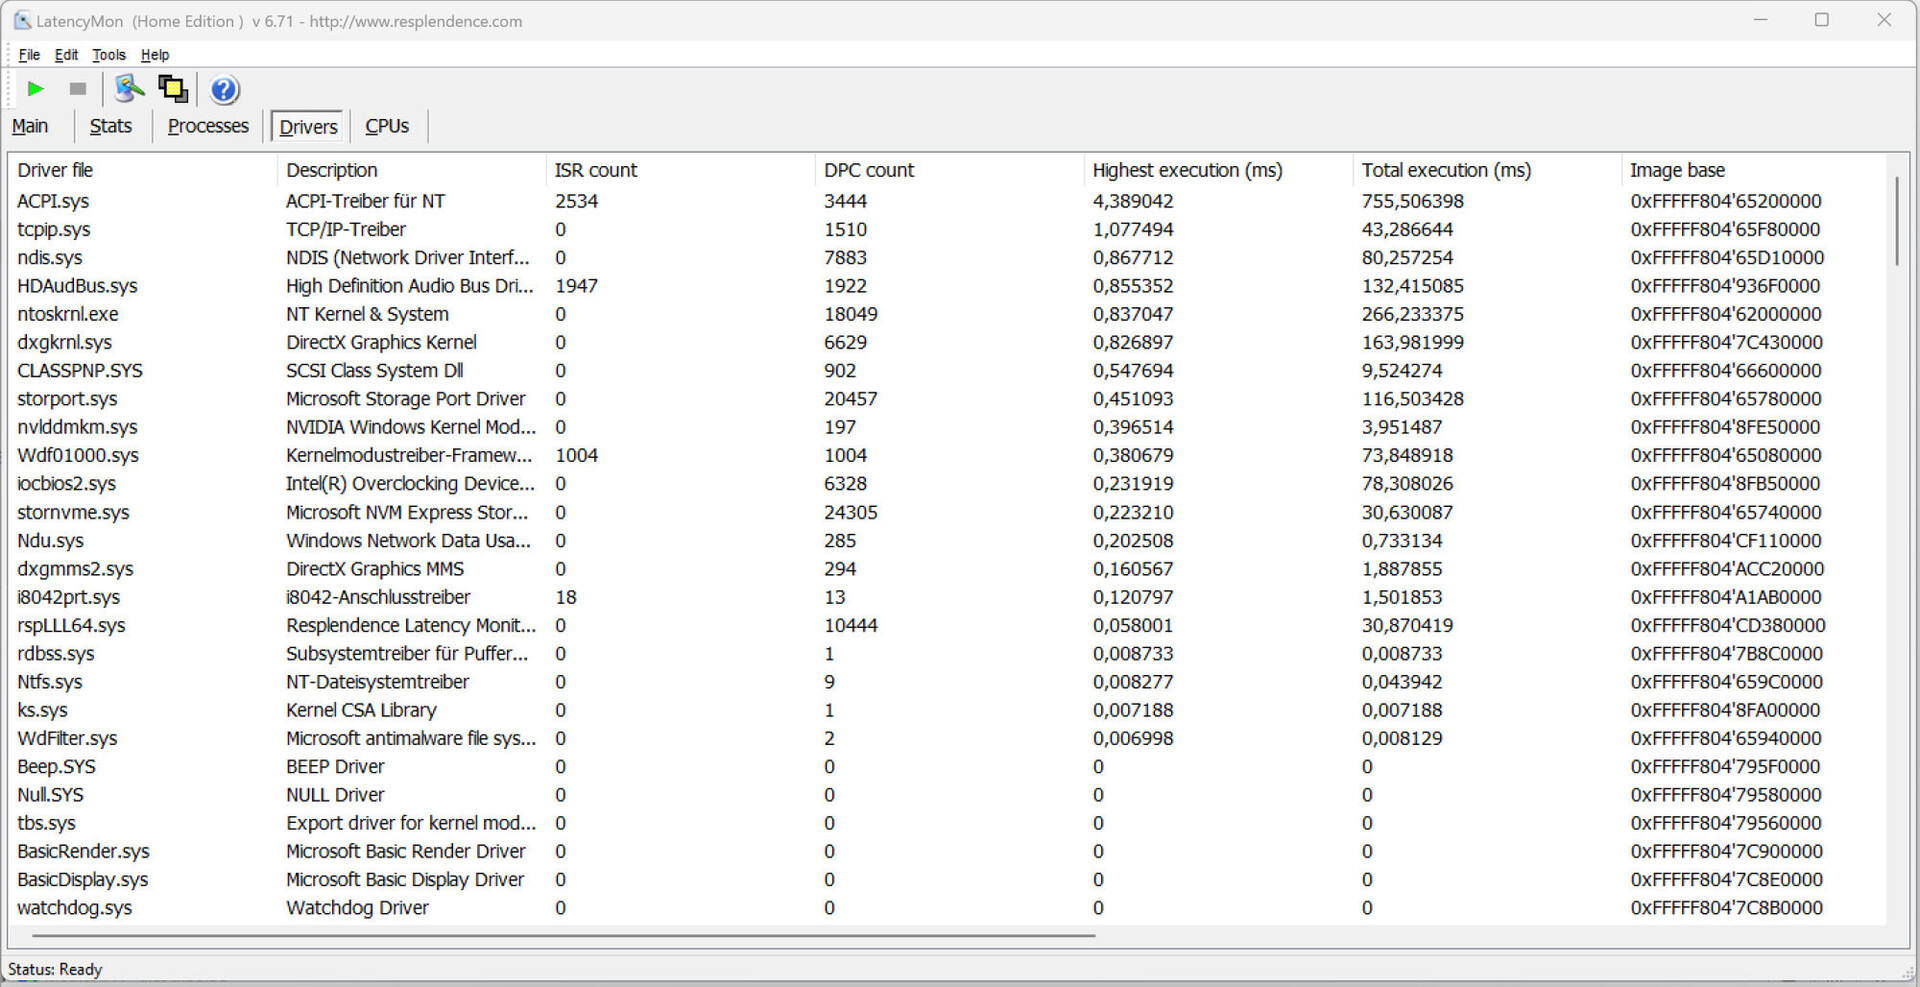
Notre test standardisé de contrôle de la latence (navigation Internet, lecture vidéo 4K, charge élevée Prime95) a révélé quelques problèmes de latence. Le système ne semble pas adapté à la gestion des tâches vidéo et audio en temps réel. Espérons que ces problèmes seront résolus dans les prochaines mises à jour logicielles.
| DPC Latencies / LatencyMon - interrupt to process latency (max), Web, Youtube, Prime95 | |
| Aorus 17X AZF | |
| Schenker Key 17 Pro (Early 23) | |
| MSI Stealth 17 Studio A13VH-014 | |
| Medion Erazer Beast X40 | |
| Asus ROG Strix Scar 17 G733PY-XS96 | |
* ... Moindre est la valeur, meilleures sont les performances
Mémoire de masse
Le Schenker Key 17 Pro peut accueillir jusqu'à trois disques durs SSD M.2-2280 (2x PCIe 4.0, 1x PCIe 5.0). Le disque Samsung PCIe 4.0 préinstallé offre une grande capacité de stockage (2 To) et des taux de transfert fantastiques. Nous n'avons pas remarqué de baisse de performance causée par l'étranglement thermique.

* ... Moindre est la valeur, meilleures sont les performances
Sustained load Read: DiskSpd Read Loop, Queue Depth 8
Carte graphique
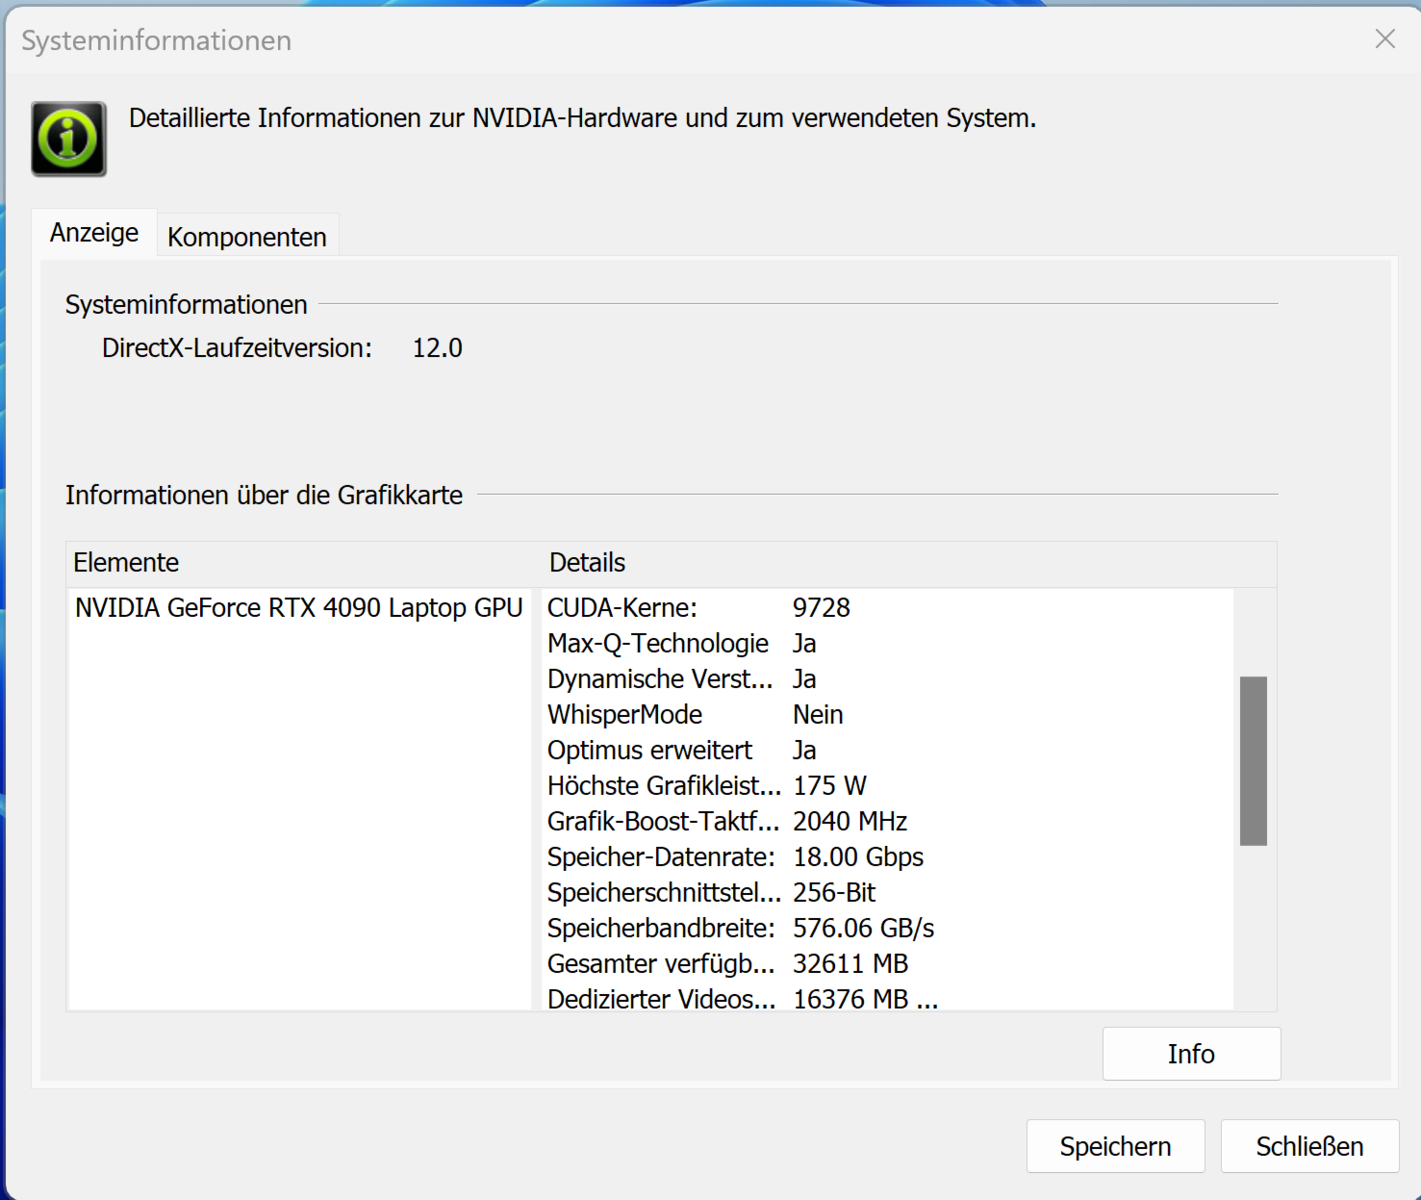
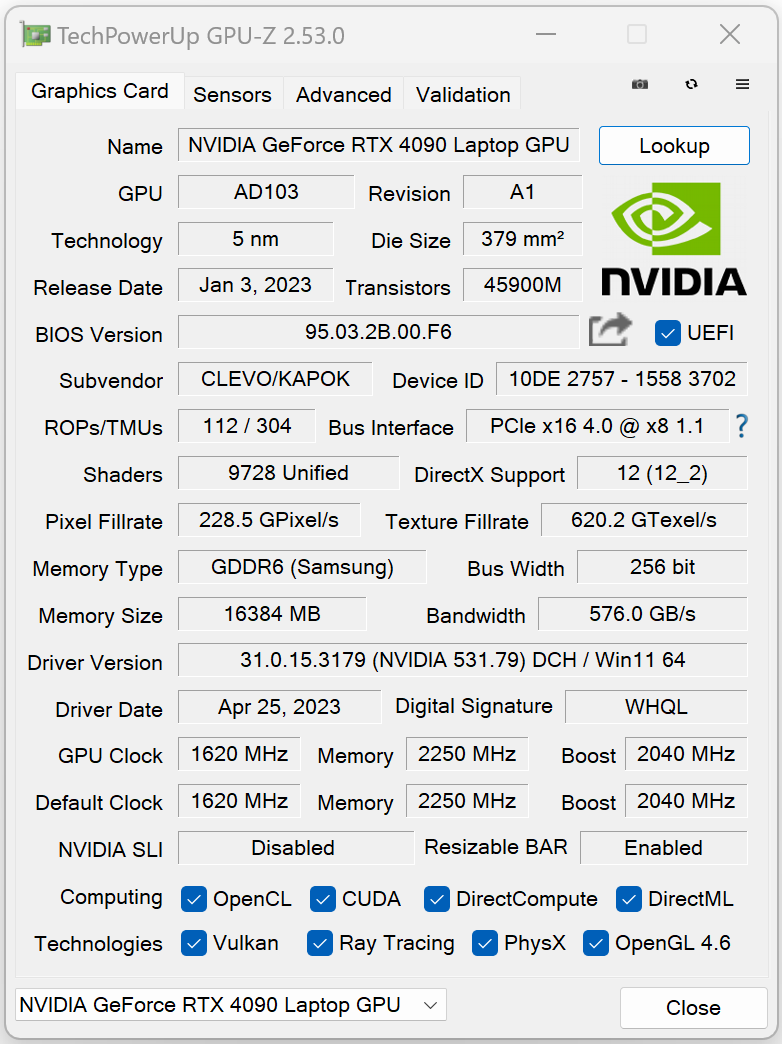
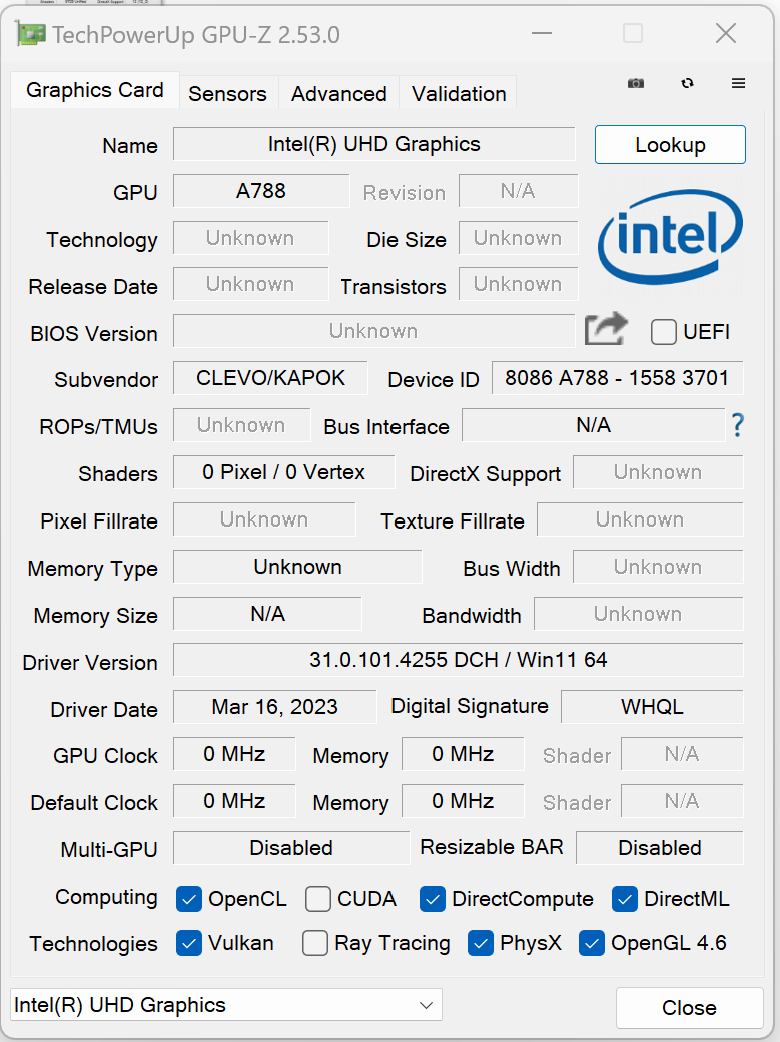
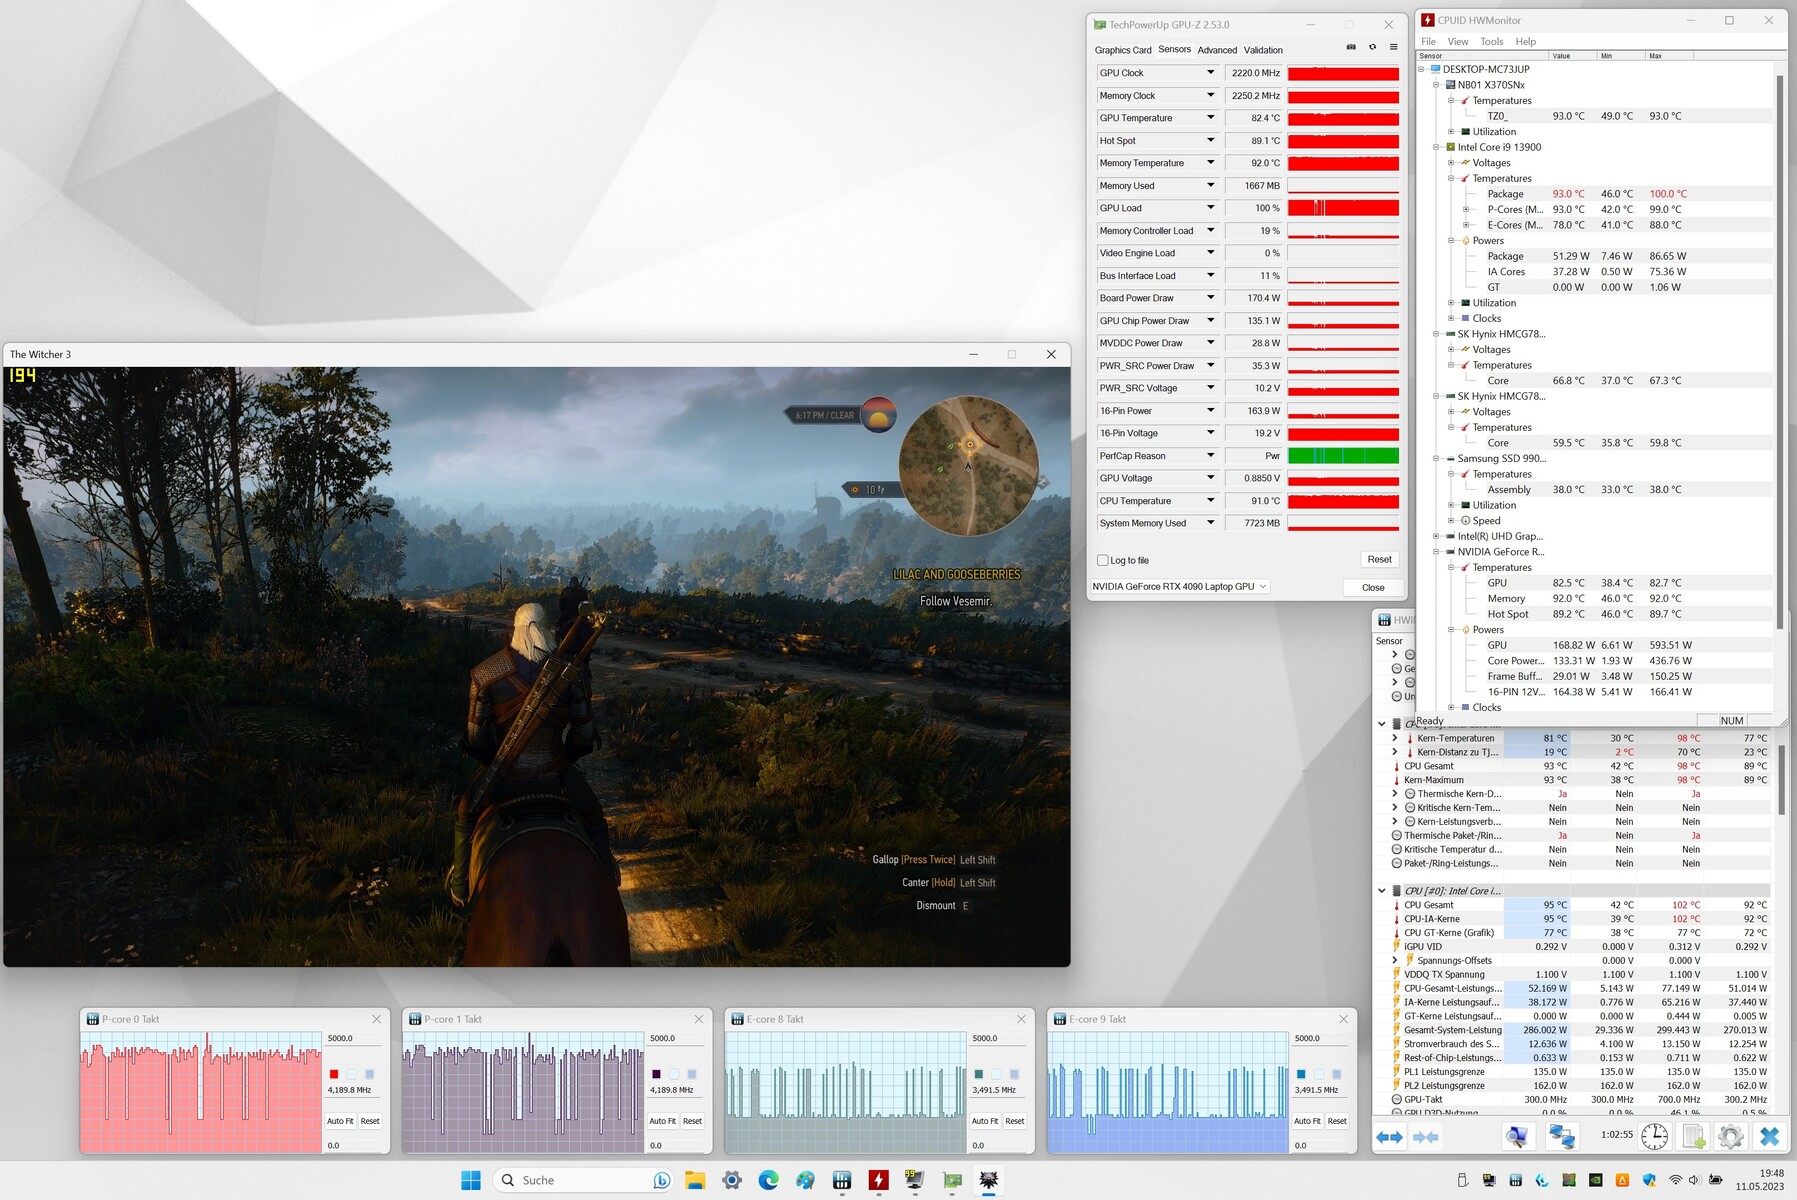
L'ordinateur portable GeForce RTX 4090 est l'actuel GPU mobile haut de gamme de Nvidia. Il est équipé de 9 728 unités de shaders, d'un bus mémoire de 256 bits et de 16 Go de mémoire vive GDDR6. La carte graphique a un TGP maximal de 175 watts (150 watts + 25 watts Dynamic Boost) - c'est le maximum. Le TGP n'a pas été pleinement utilisé lors de notre test Witcher 3.
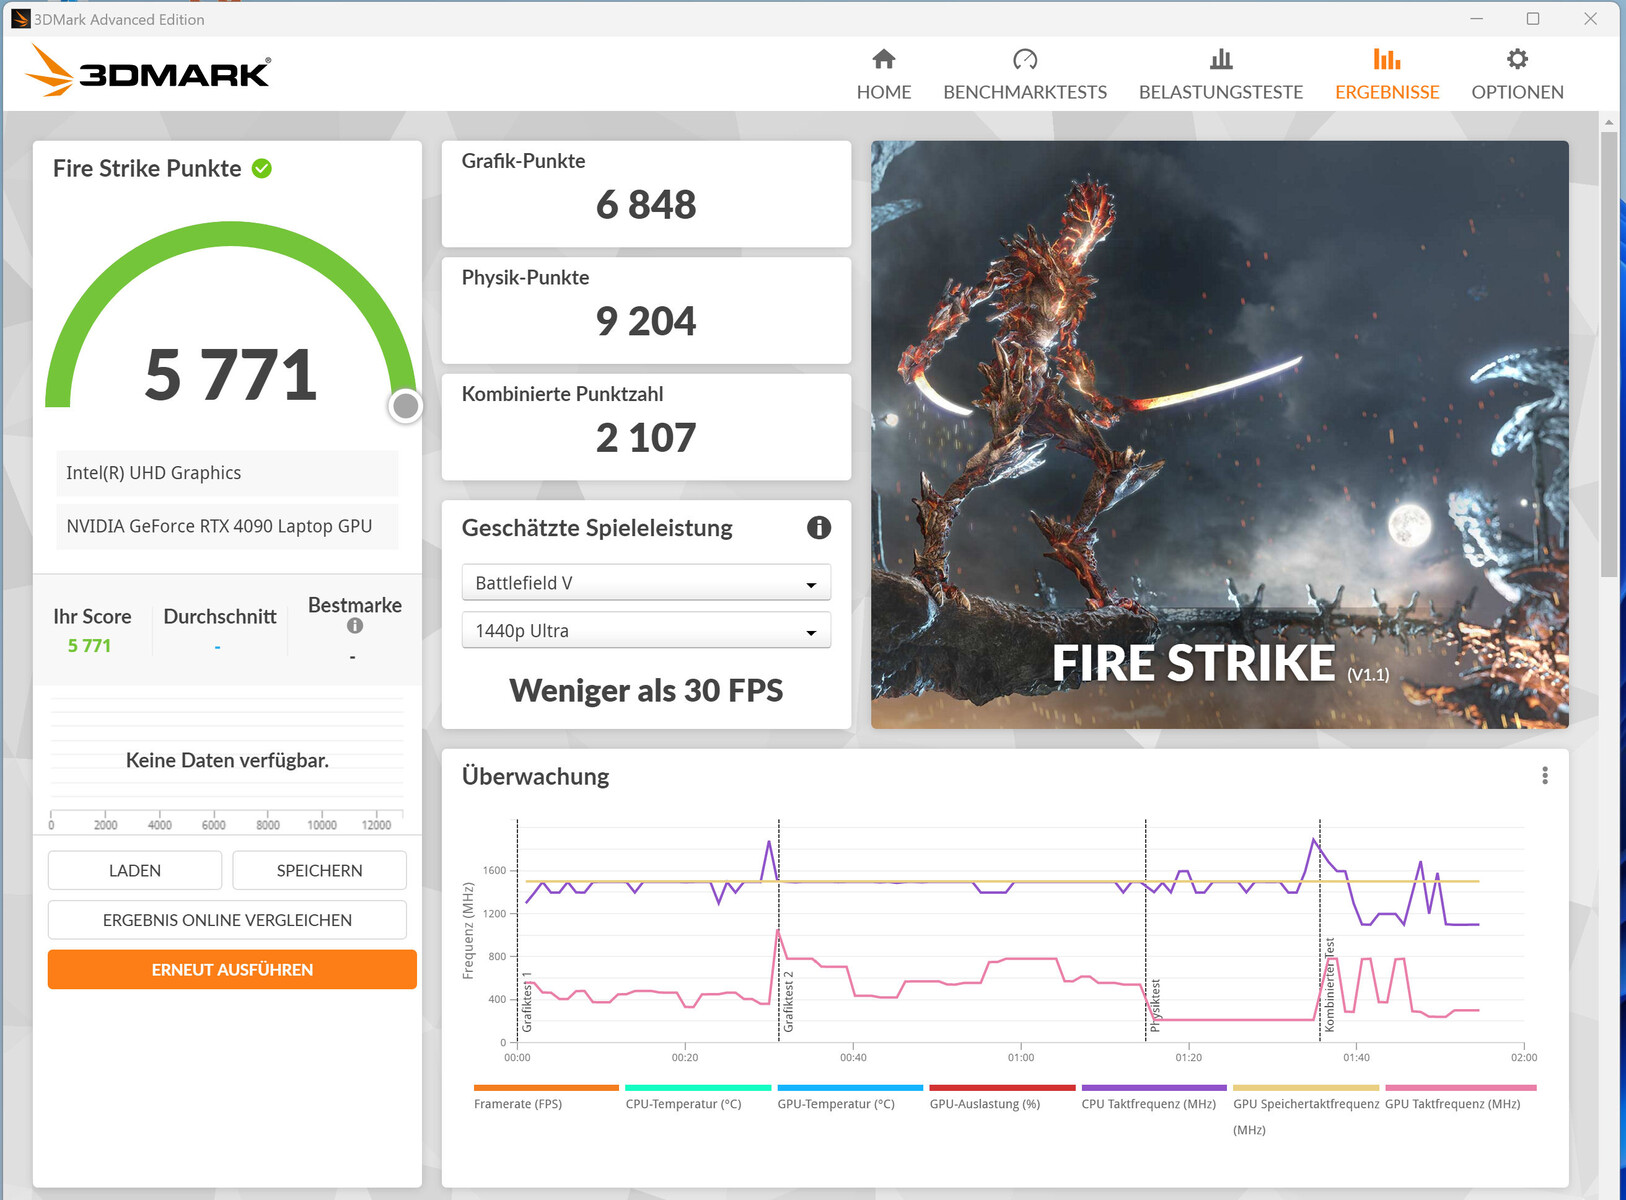
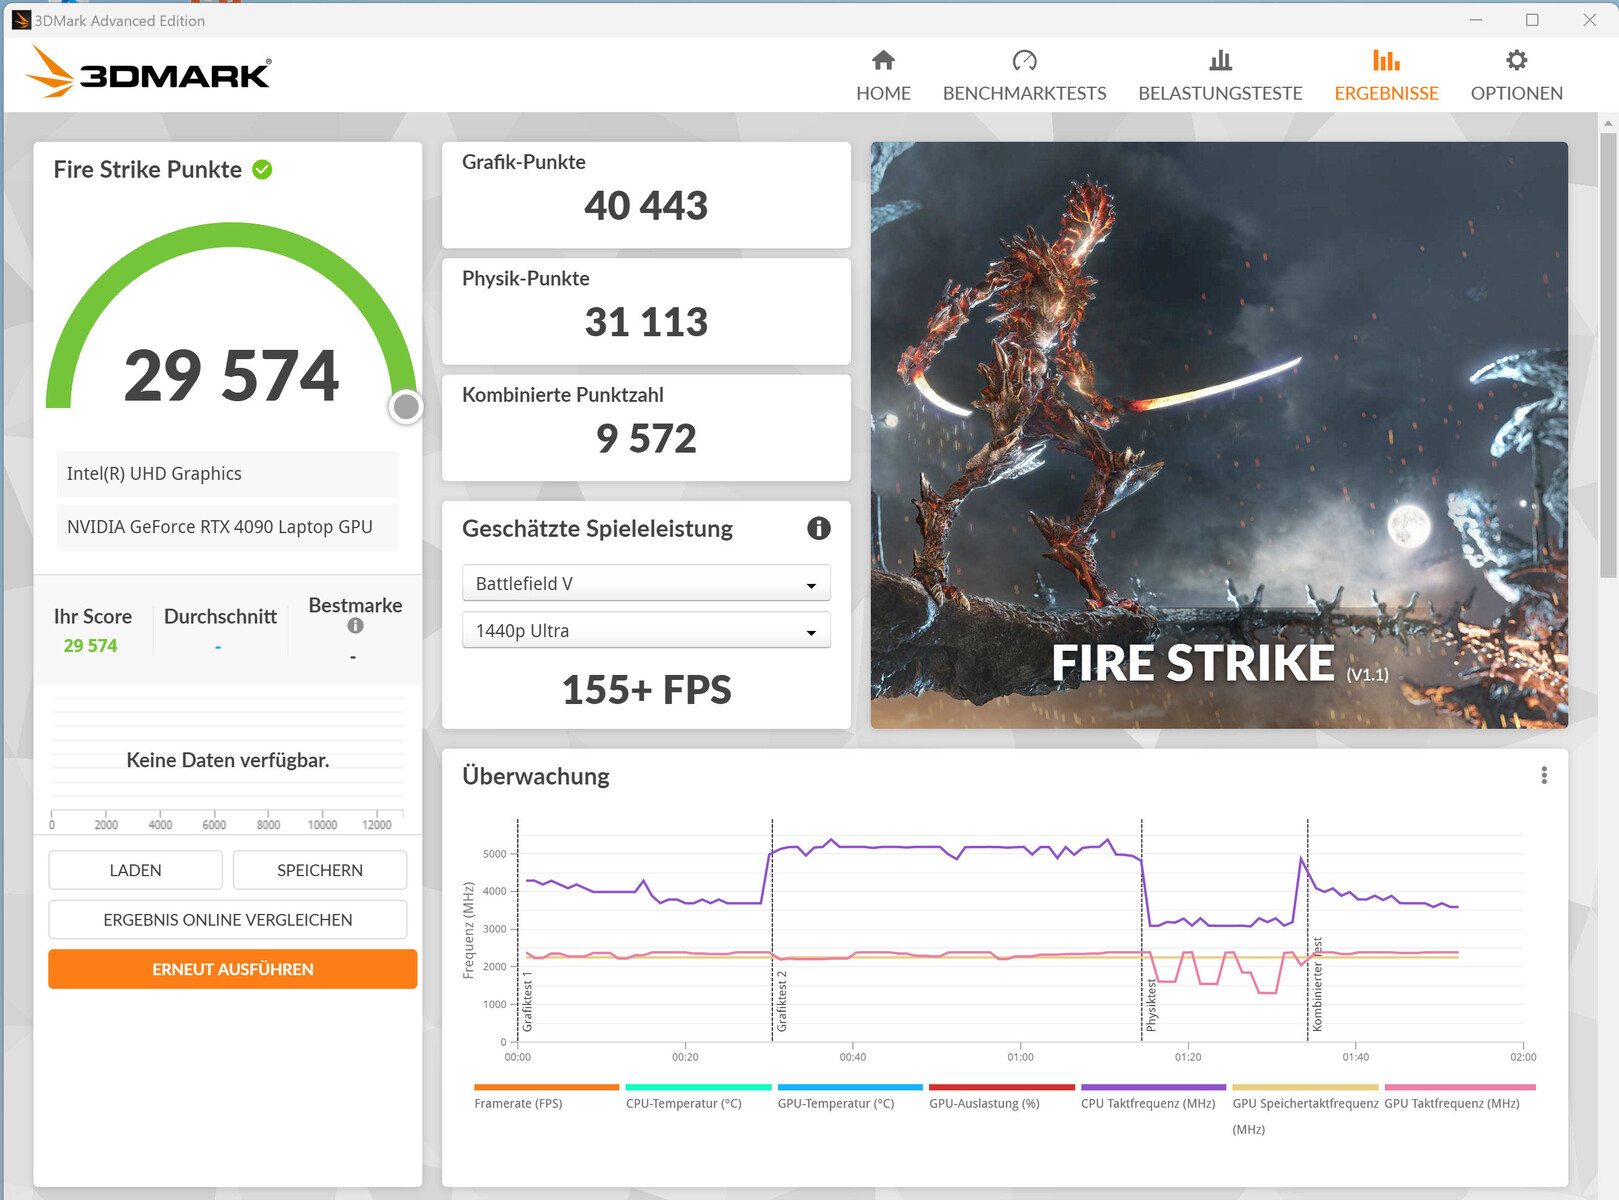
Même si le GPU a fourni des résultats inférieurs à la moyenne dans les benchmarks synthétiques, ses performances dans les jeux réels ont été supérieures à la moyenne. Le passage en mode dGPU (via le centre de contrôle) a également permis d'améliorer les performances. Avec un matériel aussi puissant, l'ordinateur portable est tout à fait capable de jouer en 4K avec des paramètres élevés ou maximaux.


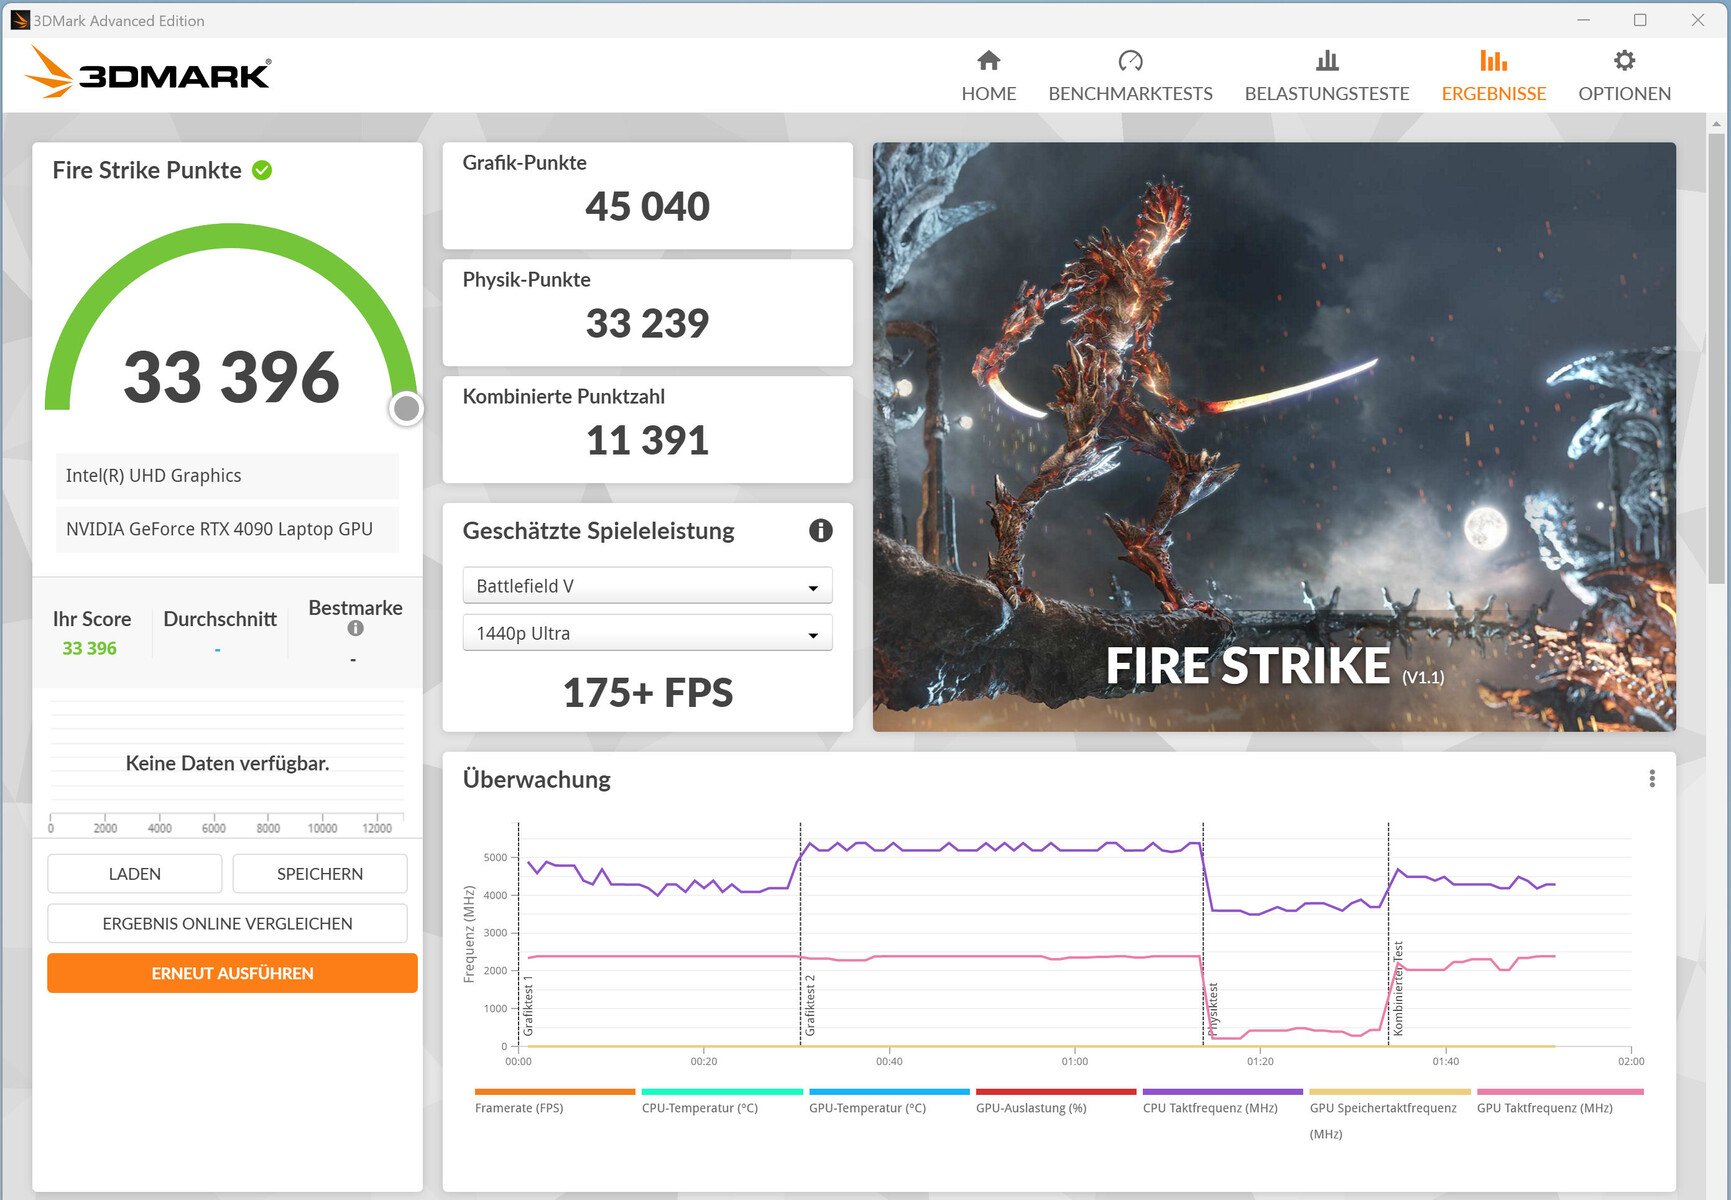
| 3DMark 11 Performance | 44742 points | |
| 3DMark Cloud Gate Standard Score | 54257 points | |
| 3DMark Fire Strike Score | 31208 points | |
| 3DMark Time Spy Score | 19893 points | |
Aide | ||
* ... Moindre est la valeur, meilleures sont les performances
| The Witcher 3 - 1920x1080 Ultra Graphics & Postprocessing (HBAO+) | |
| Schenker Key 17 Pro (Early 23) | |
| Asus ROG Strix Scar 17 G733PY-XS96 | |
| Aorus 17X AZF | |
| Moyenne NVIDIA GeForce RTX 4090 Laptop GPU (139.2 - 216, n=35) | |
| Moyenne de la classe Gaming (104.7 - 240, n=7, 2 dernières années) | |
| Medion Erazer Beast X40 | |
| MSI Stealth 17 Studio A13VH-014 | |
| Strange Brigade - 1920x1080 ultra AA:ultra AF:16 | |
| Aorus 17X AZF | |
| Schenker Key 17 Pro (Early 23) | |
| Medion Erazer Beast X40 | |
| Moyenne NVIDIA GeForce RTX 4090 Laptop GPU (233 - 421, n=39) | |
| Moyenne de la classe Gaming (76.3 - 458, n=87, 2 dernières années) | |
| MSI Stealth 17 Studio A13VH-014 | |
| Sons of the Forest | |
| 1920x1080 Ultra Preset AA:T | |
| Schenker Key 17 Pro (Early 23) | |
| Moyenne NVIDIA GeForce RTX 4090 Laptop GPU (85.7 - 93.9, n=2) | |
| Medion Erazer Beast X40 | |
| 3840x2160 Ultra Preset AA:T | |
| Schenker Key 17 Pro (Early 23) | |
| Moyenne NVIDIA GeForce RTX 4090 Laptop GPU (n=1) | |
| Star Wars Jedi Survivor | |
| 1920x1080 Epic Preset | |
| Schenker Key 17 Pro (Early 23) | |
| Moyenne NVIDIA GeForce RTX 4090 Laptop GPU (103 - 148, n=6) | |
| Asus ROG Strix Scar 17 G733PY-XS96 | |
| 3840x2160 Epic Preset | |
| Moyenne NVIDIA GeForce RTX 4090 Laptop GPU (39 - 59, n=6) | |
| Asus ROG Strix Scar 17 G733PY-XS96 | |
| Schenker Key 17 Pro (Early 23) | |
| Resident Evil 4 Remake | |
| 1920x1080 Max Preset | |
| Schenker Key 17 Pro (Early 23) | |
| Moyenne NVIDIA GeForce RTX 4090 Laptop GPU (136.3 - 143.2, n=2) | |
| Aorus 17X AZF | |
| 3840x2160 Max Preset | |
| Schenker Key 17 Pro (Early 23) | |
| Moyenne NVIDIA GeForce RTX 4090 Laptop GPU (63.4 - 64.9, n=2) | |
| Aorus 17X AZF | |
| Dead Island 2 | |
| 1920x1080 Ultra Preset AA:High T | |
| Moyenne NVIDIA GeForce RTX 4090 Laptop GPU (181.7 - 206, n=2) | |
| Schenker Key 17 Pro (Early 23) | |
| 3840x2160 Ultra Preset AA:High T | |
| Moyenne NVIDIA GeForce RTX 4090 Laptop GPU (94.8 - 101.2, n=2) | |
| Schenker Key 17 Pro (Early 23) | |
| The Callisto Protocol | |
| 1920x1080 Ultra Preset (without FSR Upscaling) | |
| Schenker Key 17 Pro (Early 23) | |
| Aorus 17X AZF | |
| Moyenne NVIDIA GeForce RTX 4090 Laptop GPU (102.6 - 150.7, n=6) | |
| 3840x2160 Ultra Preset (without FSR Upscaling) | |
| Schenker Key 17 Pro (Early 23) | |
| Moyenne NVIDIA GeForce RTX 4090 Laptop GPU (48.1 - 81.4, n=6) | |
| Aorus 17X AZF | |
Witcher 3 FPS chart
| Bas | Moyen | Élevé | Ultra | QHD | 4K | |
|---|---|---|---|---|---|---|
| GTA V (2015) | 187.7 | 186.4 | 184.8 | 142.3 | 141.5 | 167.9 |
| The Witcher 3 (2015) | 474.4 | 382.6 | 299.2 | 206 | 96.3 | |
| Dota 2 Reborn (2015) | 231 | 207 | 195.3 | 182.5 | 141.9 | |
| Final Fantasy XV Benchmark (2018) | 230 | 217 | 183.1 | 156.4 | 91.9 | |
| X-Plane 11.11 (2018) | 180.8 | 171.7 | 136.6 | 109.7 | ||
| Strange Brigade (2018) | 558 | 437 | 410 | 378 | 291 | 153.4 |
| The Callisto Protocol (2022) | 194.5 | 182.6 | 175.5 | 150.7 | 126.7 | 81.4 |
| Sons of the Forest (2023) | 103.2 | 97.5 | 93.9 | 93.9 | 89.6 | 72.5 |
| Resident Evil 4 Remake (2023) | 203 | 194.6 | 173.1 | 143.2 | 113.2 | 64.9 |
| Dead Island 2 (2023) | 226 | 212 | 190.3 | 181.7 | 178.5 | 94.8 |
| Star Wars Jedi Survivor (2023) | 131.2 | 127.6 | 122.1 | 117.4 | 84.4 | 41.8 |
Emissions et gestion de l'énergie - L'ordinateur portable de Schenker peut devenir très bruyant
Émissions sonores
Un ordinateur portable puissant comme le Key 17 Pro peut produire une quantité énorme de bruit sous charge : le niveau de bruit a atteint 62 dB(A) lorsque l'ordinateur portable exécutait des jeux en mode "Performance". Même en mode "Divertissement", l'appareil a réussi à atteindre un niveau sonore extrêmement élevé de 54 dB(A). Les deux autres modes d'alimentation permettent au Key 17 Pro de fonctionner silencieusement la plupart du temps avec des performances réduites de manière significative.
L'ordinateur portable est généralement silencieux, parfois même silencieux, au repos ou en utilisation quotidienne (p. ex. logiciels de bureautique, navigation sur Internet). Cependant, les ventilateurs tournent parfois sans raison (un phénomène qui se produit généralement avec les barebones de Clevo).
Degré de la nuisance sonore
| Au repos |
| 26 / 33 / 46 dB(A) |
| Fortement sollicité |
| 56 / 64 dB(A) |
 | ||
30 dB silencieux 40 dB(A) audible 50 dB(A) bruyant |
||
min: | ||
| Schenker Key 17 Pro (Early 23) i9-13900HX, GeForce RTX 4090 Laptop GPU | MSI Stealth 17 Studio A13VH-014 i9-13900H, GeForce RTX 4080 Laptop GPU | Asus ROG Strix Scar 17 G733PY-XS96 R9 7945HX, GeForce RTX 4090 Laptop GPU | Aorus 17X AZF i9-13900HX, GeForce RTX 4090 Laptop GPU | Medion Erazer Beast X40 i9-13900HX, GeForce RTX 4090 Laptop GPU | |
|---|---|---|---|---|---|
| Noise | 25% | 22% | 10% | 13% | |
| arrêt / environnement * (dB) | 26 | 24 8% | 22.7 13% | 25 4% | 24 8% |
| Idle Minimum * (dB) | 26 | 24 8% | 23.5 10% | 28 -8% | 25 4% |
| Idle Average * (dB) | 33 | 24 27% | 27.7 16% | 29 12% | 29 12% |
| Idle Maximum * (dB) | 46 | 24 48% | 27.7 40% | 34 26% | 35 24% |
| Load Average * (dB) | 56 | 34.49 38% | 30.5 46% | 51 9% | 51 9% |
| Witcher 3 ultra * (dB) | 62 | 48.29 22% | 51.4 17% | 57 8% | 51 18% |
| Load Maximum * (dB) | 64 | 49.66 22% | 54.1 15% | 54 16% | 53 17% |
* ... Moindre est la valeur, meilleures sont les performances
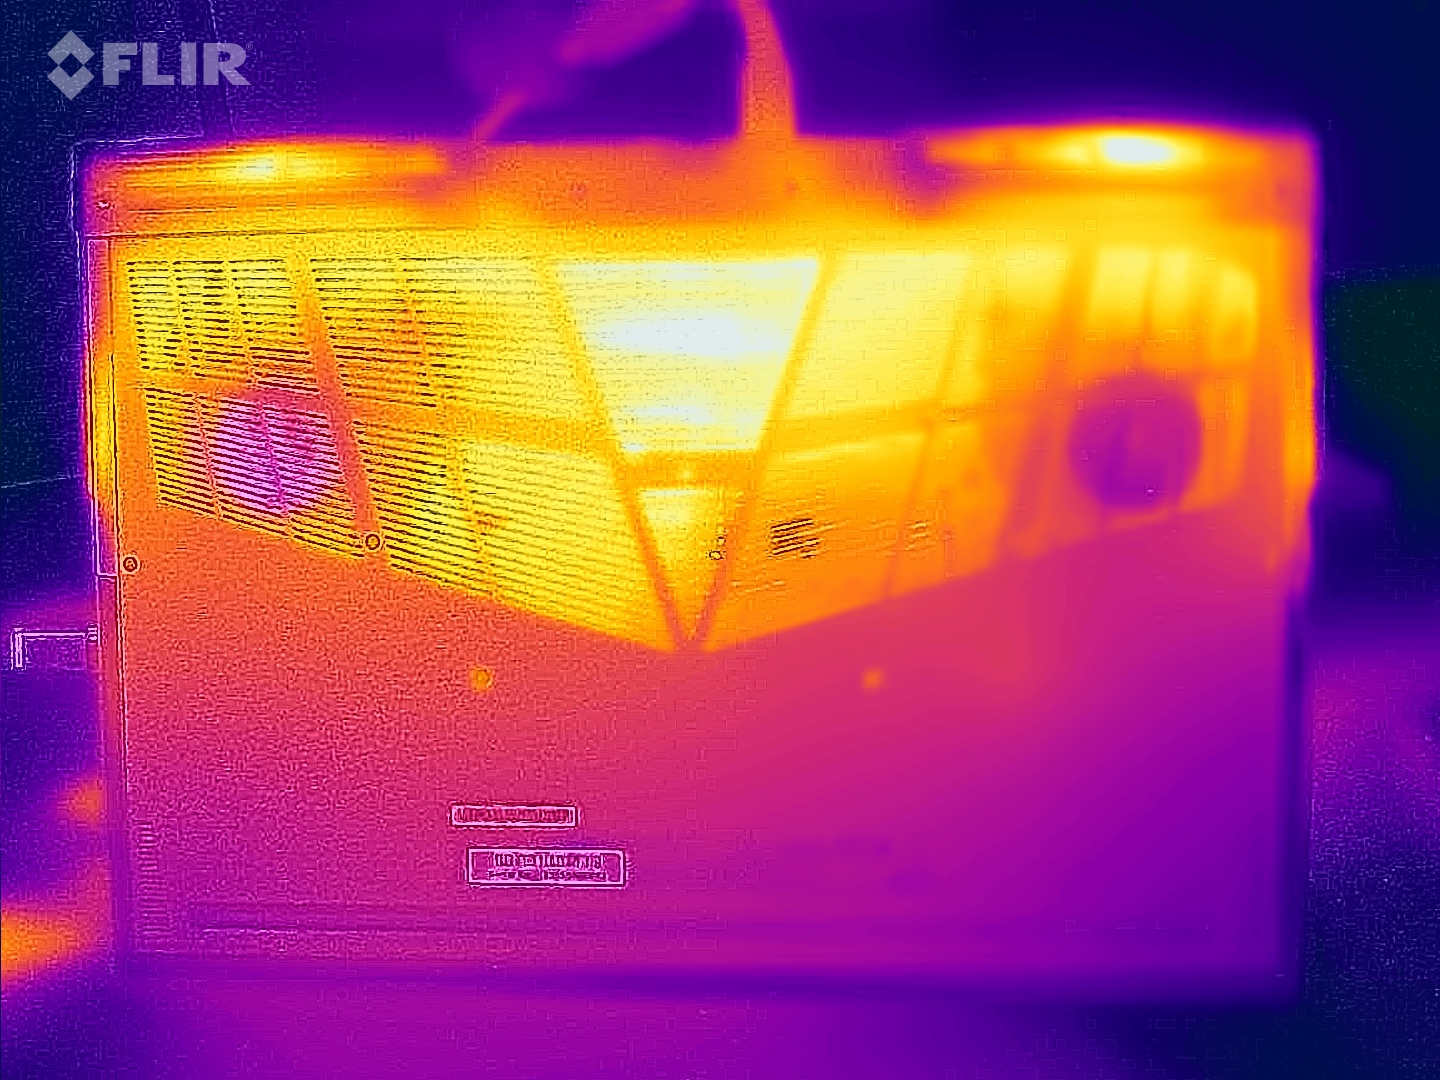
Température
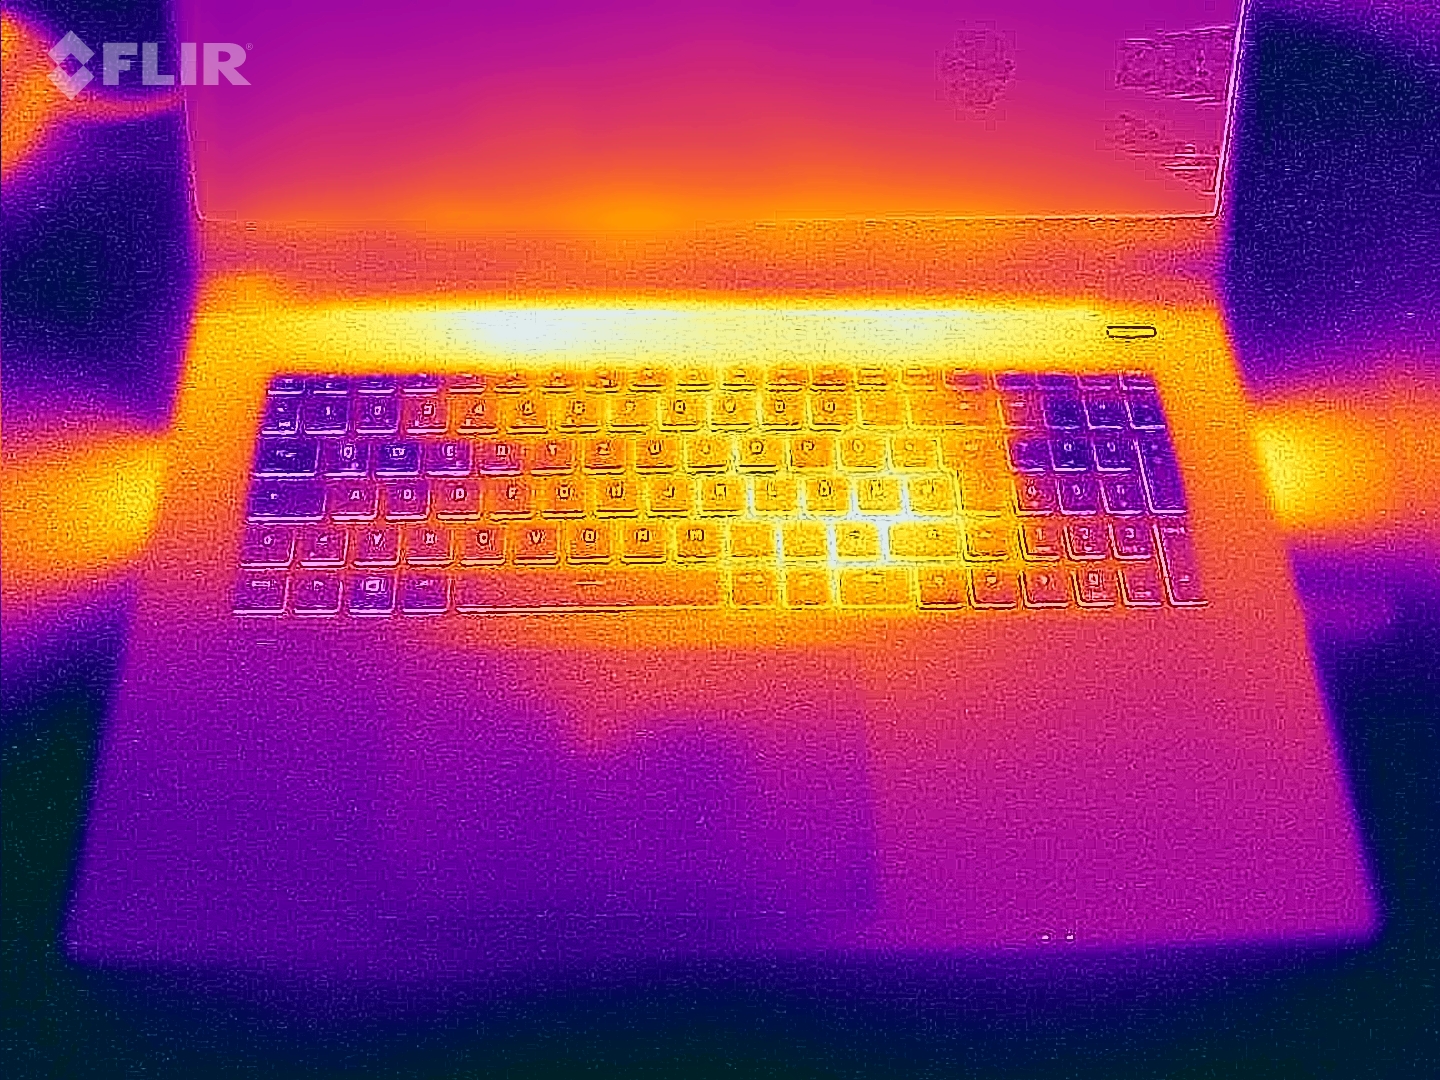
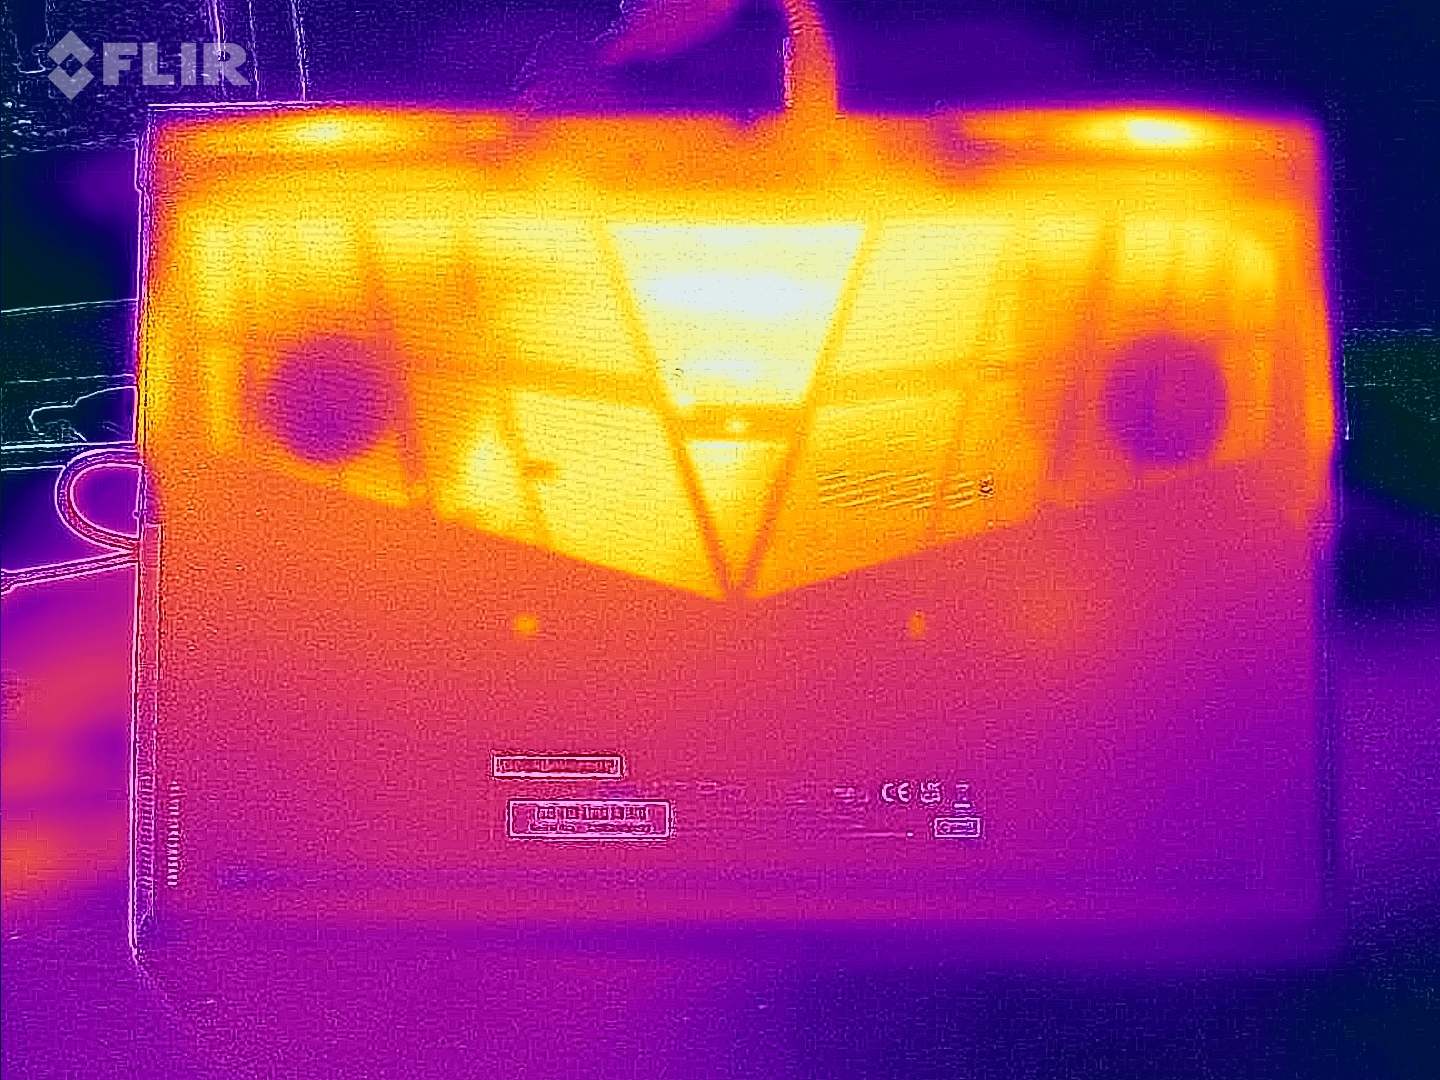
L'ordinateur portable chauffe sensiblement sous charge : nous avons mesuré des températures comprises entre 55 et 60°C à certains endroits du châssis. En utilisation normale, cependant, les températures du châssis sont restées dans une fourchette confortable
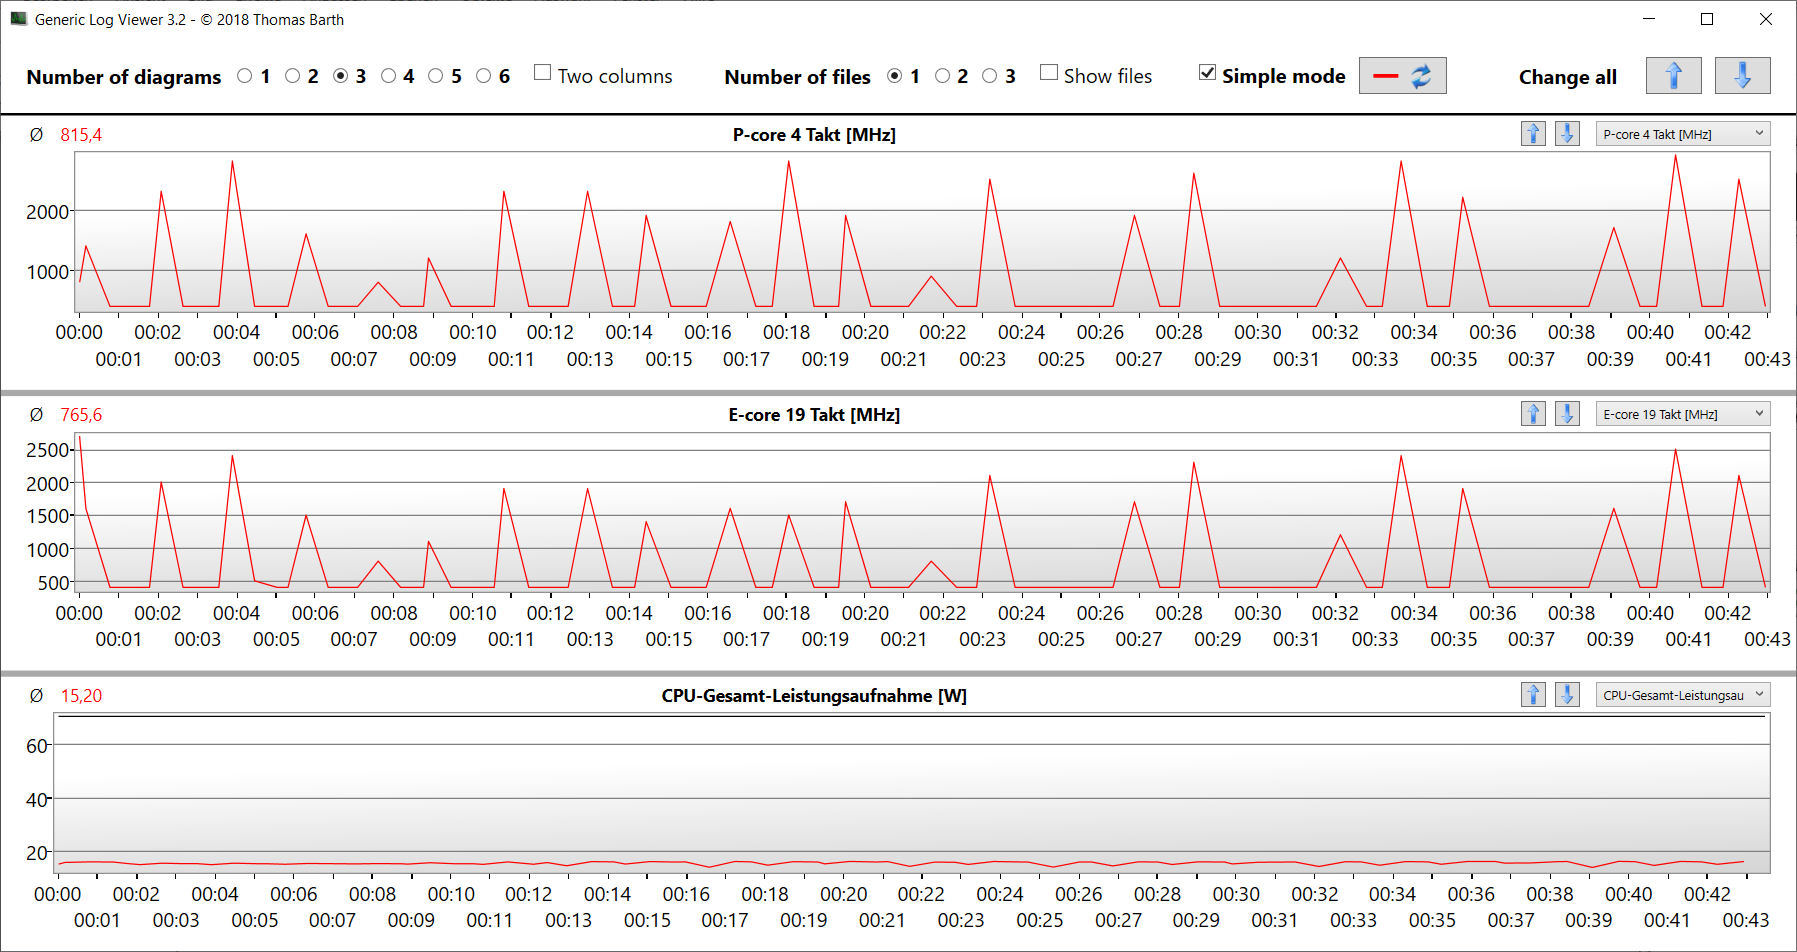
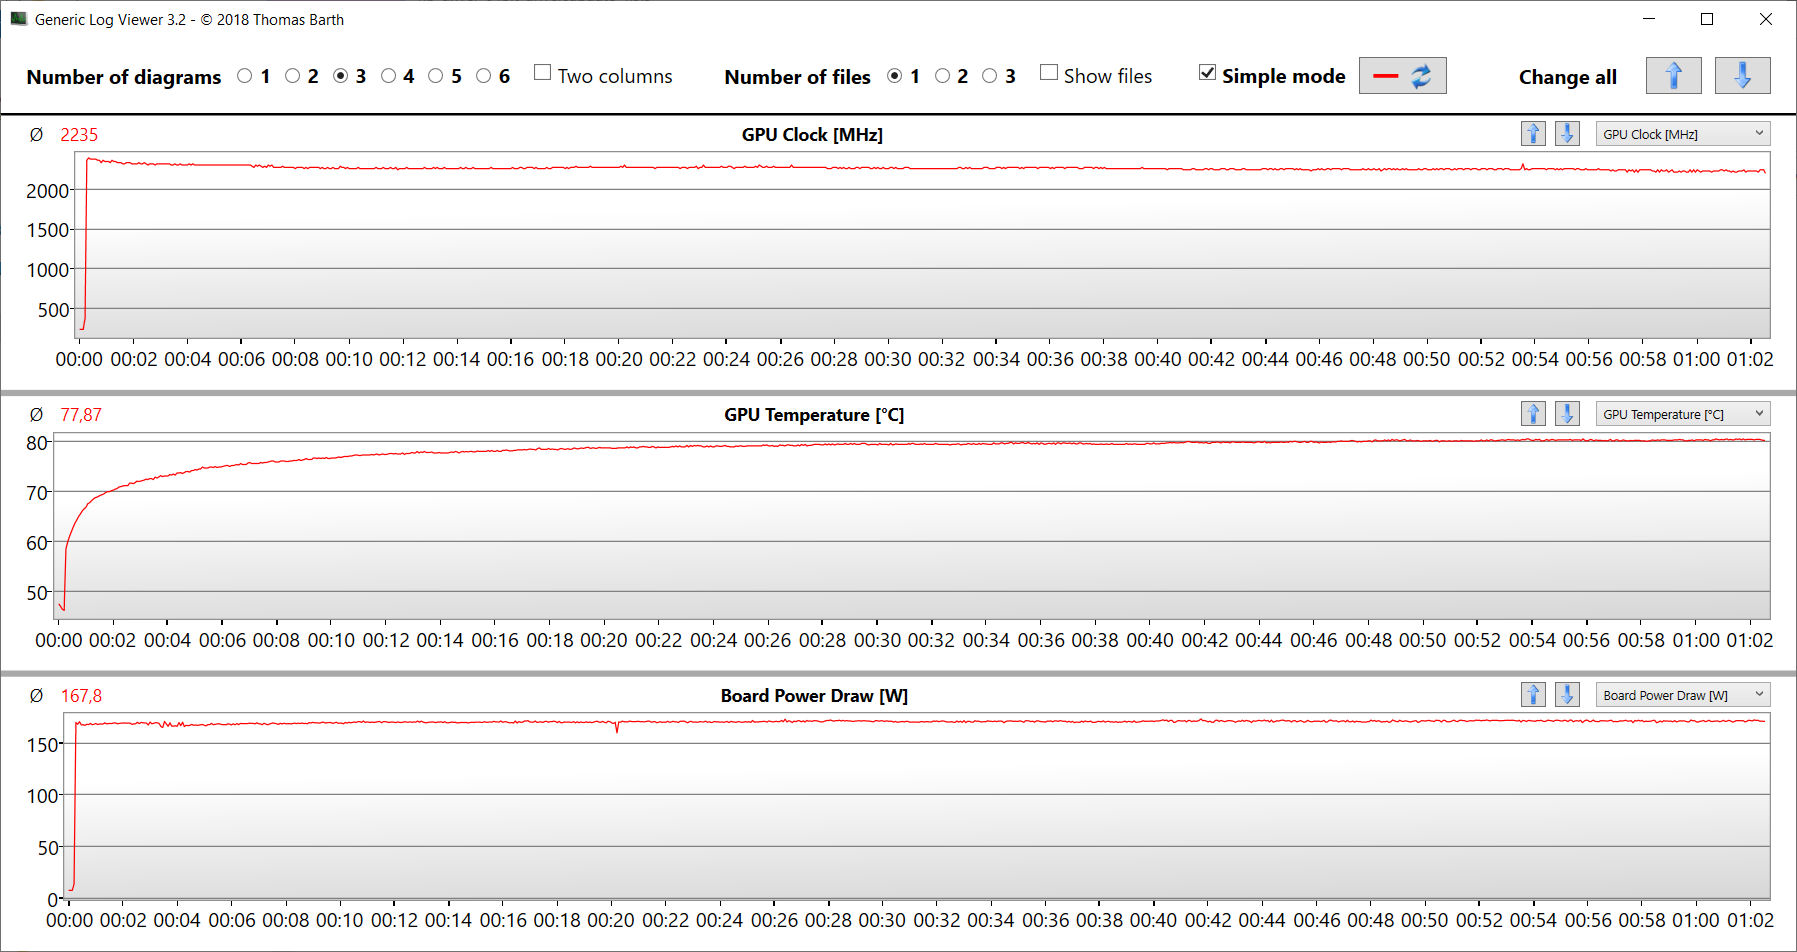
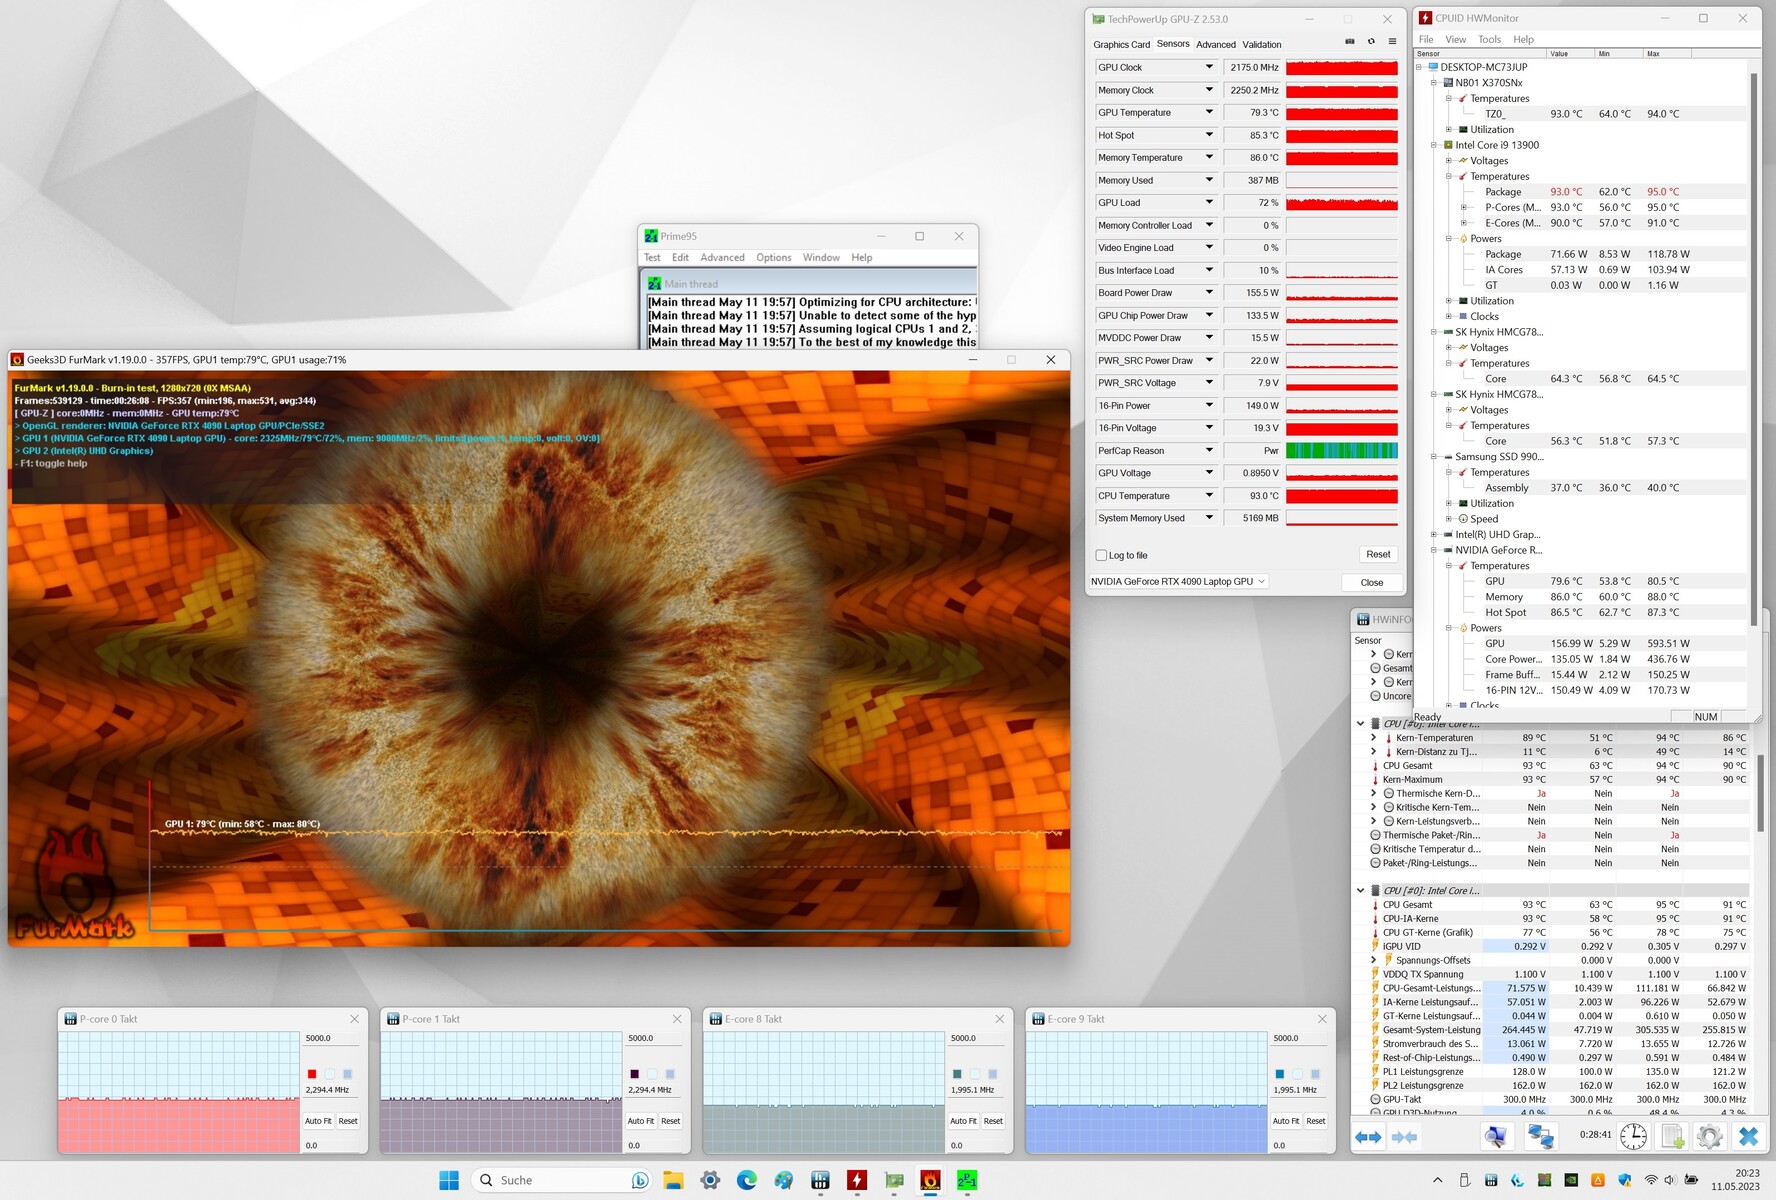
Notre test de stress (exécution de Prime95 et FurMark sur une période prolongée) représente un scénario extrême conçu pour vérifier la stabilité d'un système à pleine charge. Le CPU a fonctionné à des vitesses d'horloge élevées (P-cores : 3,4 à 3,5 GHz, E-cores : 3,1 à 3,2 GHz) dès le départ, et le GPU a tourné à une fréquence de 1,0 à 1,6 GHz. Par la suite, l'horloge du CPU a chuté relativement rapidement tandis que l'horloge du GPU a grimpé au-dessus de 2 GHz.
(-) La température maximale du côté supérieur est de 57 °C / 135 F, par rapport à la moyenne de 40.4 °C / 105 F, allant de 21.2 à 68.8 °C pour la classe Gaming.
(-) Le fond chauffe jusqu'à un maximum de 60 °C / 140 F, contre une moyenne de 43.2 °C / 110 F
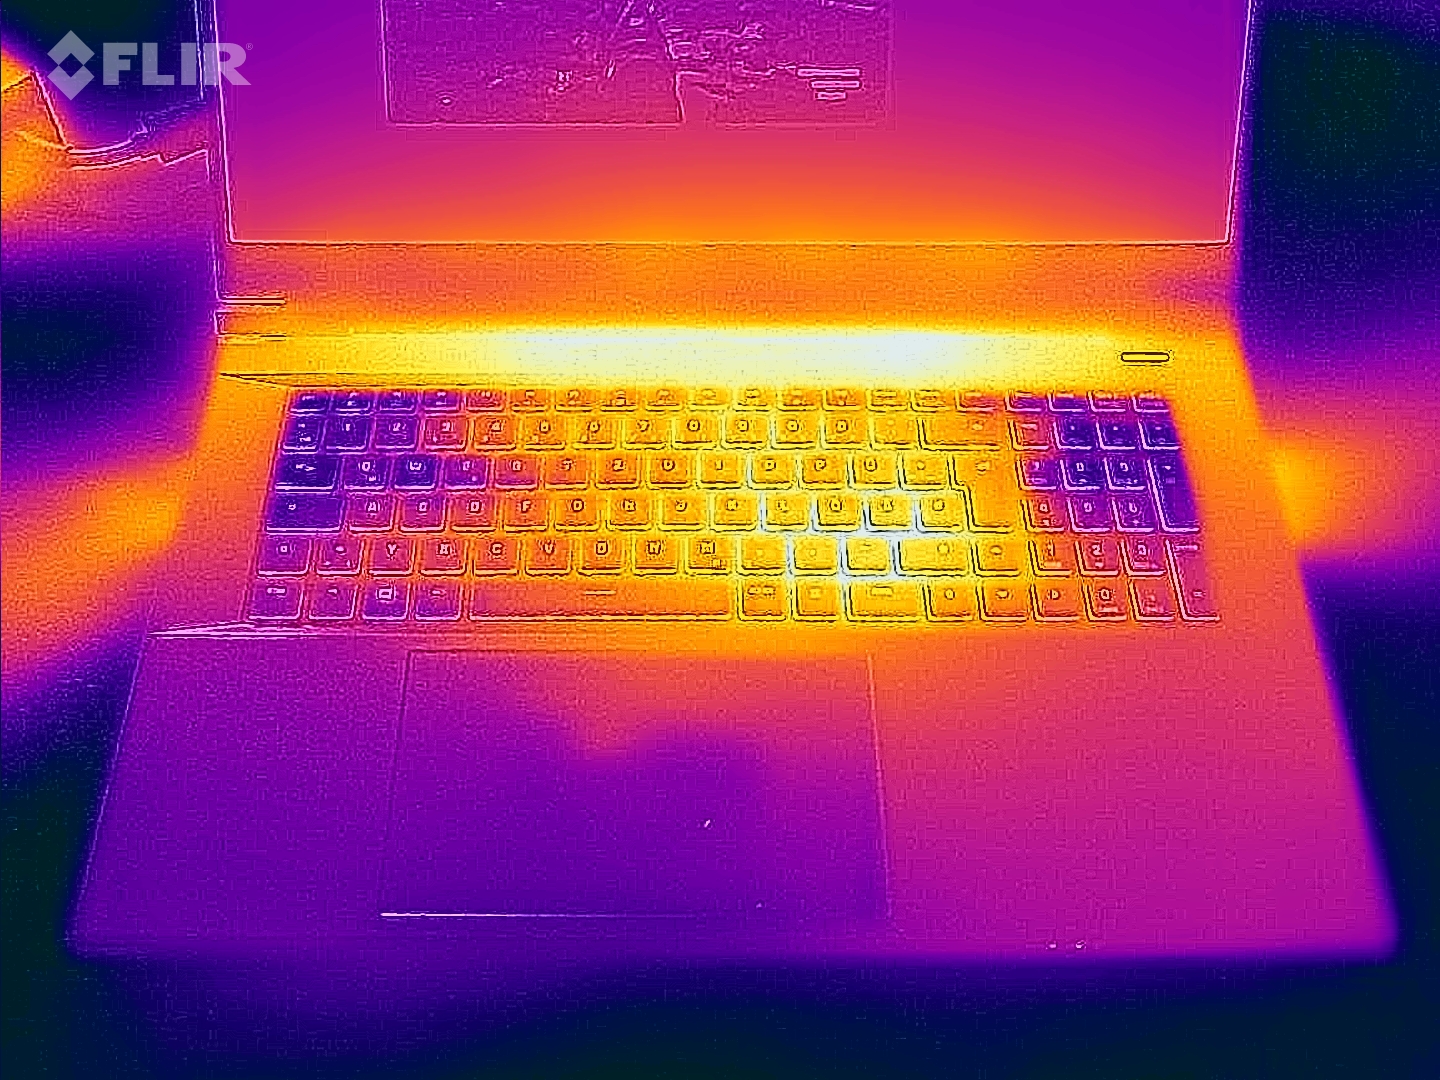
(+) En utilisation inactive, la température moyenne du côté supérieur est de 28.7 °C / 84 F, par rapport à la moyenne du dispositif de 33.9 °C / 93 F.
(-) En jouant à The Witcher 3, la température moyenne du côté supérieur est de 47.3 °C / 117 F, alors que la moyenne de l'appareil est de 33.9 °C / 93 F.
(±) Les repose-poignets et le pavé tactile peuvent devenir très chauds au toucher, avec un maximum de 38 °C / 100.4# F.
(-) La température moyenne de la zone de l'appui-paume de dispositifs similaires était de 28.8 °C / 83.8 F (-9.2 °C / #-16.6 F).
| Schenker Key 17 Pro (Early 23) Intel Core i9-13900HX, NVIDIA GeForce RTX 4090 Laptop GPU | MSI Stealth 17 Studio A13VH-014 Intel Core i9-13900H, NVIDIA GeForce RTX 4080 Laptop GPU | Asus ROG Strix Scar 17 G733PY-XS96 AMD Ryzen 9 7945HX, NVIDIA GeForce RTX 4090 Laptop GPU | Aorus 17X AZF Intel Core i9-13900HX, NVIDIA GeForce RTX 4090 Laptop GPU | Medion Erazer Beast X40 Intel Core i9-13900HX, NVIDIA GeForce RTX 4090 Laptop GPU | |
|---|---|---|---|---|---|
| Heat | 10% | 27% | 12% | 11% | |
| Maximum Upper Side * (°C) | 57 | 47 18% | 34.6 39% | 47 18% | 48 16% |
| Maximum Bottom * (°C) | 60 | 54 10% | 35.6 41% | 51 15% | 52 13% |
| Idle Upper Side * (°C) | 32 | 30 6% | 27.2 15% | 30 6% | 30 6% |
| Idle Bottom * (°C) | 34 | 32 6% | 30 12% | 31 9% | 31 9% |
* ... Moindre est la valeur, meilleures sont les performances
Intervenants
Les haut-parleurs stéréo offrent un son plutôt correct dans l'ensemble.
Schenker Key 17 Pro (Early 23) analyse audio
(±) | le niveau sonore du haut-parleur est moyen mais bon (78# dB)
Basses 100 - 315 Hz
(±) | basse réduite - en moyenne 11.7% inférieure à la médiane
(±) | la linéarité des basses est moyenne (7.1% delta à la fréquence précédente)
Médiums 400 - 2000 Hz
(+) | médiane équilibrée - seulement 2.1% de la médiane
(+) | les médiums sont linéaires (3.5% delta à la fréquence précédente)
Aiguës 2 - 16 kHz
(+) | des sommets équilibrés - à seulement 1.8% de la médiane
(+) | les aigus sont linéaires (6.4% delta à la fréquence précédente)
Globalement 100 - 16 000 Hz
(+) | le son global est linéaire (11.9% différence à la médiane)
Par rapport à la même classe
» 12% de tous les appareils testés de cette catégorie étaient meilleurs, 4% similaires, 84% pires
» Le meilleur avait un delta de 6%, la moyenne était de 18%, le pire était de 132%.
Par rapport à tous les appareils testés
» 9% de tous les appareils testés étaient meilleurs, 2% similaires, 89% pires
» Le meilleur avait un delta de 4%, la moyenne était de 23%, le pire était de 134%.
MSI Stealth 17 Studio A13VH-014 analyse audio
(+) | les haut-parleurs peuvent jouer relativement fort (82.44# dB)
Basses 100 - 315 Hz
(±) | basse réduite - en moyenne 8% inférieure à la médiane
(±) | la linéarité des basses est moyenne (8.8% delta à la fréquence précédente)
Médiums 400 - 2000 Hz
(±) | médiane supérieure - en moyenne 8.2% supérieure à la médiane
(+) | les médiums sont linéaires (6.8% delta à la fréquence précédente)
Aiguës 2 - 16 kHz
(+) | des sommets équilibrés - à seulement 1% de la médiane
(+) | les aigus sont linéaires (4% delta à la fréquence précédente)
Globalement 100 - 16 000 Hz
(+) | le son global est linéaire (11.6% différence à la médiane)
Par rapport à la même classe
» 10% de tous les appareils testés de cette catégorie étaient meilleurs, 3% similaires, 87% pires
» Le meilleur avait un delta de 6%, la moyenne était de 18%, le pire était de 132%.
Par rapport à tous les appareils testés
» 8% de tous les appareils testés étaient meilleurs, 2% similaires, 90% pires
» Le meilleur avait un delta de 4%, la moyenne était de 23%, le pire était de 134%.
Consommation électrique
La Key 17 Pro n'a pas montré de problèmes de consommation d'énergie. Il a maintenu une consommation d'énergie constante pendant le test de stress et le test Witcher 3. L'adaptateur fourni (330 watts) est suffisamment puissant pour l'appareil.
| Éteint/en veille | |
| Au repos | |
| Fortement sollicité |
|
Légende:
min: | |
Power consumption Witcher 3 / Stresstest
Power consumption with external monitor
Durée de vie de la batterie
Notre test Wi-Fi est conçu pour simuler une utilisation réelle et consiste à accéder à différents sites web à l'aide d'un script. L'ordinateur portable de 17,3 pouces a réussi à tenir 6h 51m pendant le test - un résultat très respectable pour un ordinateur portable 4K aussi puissant.
Points positifs
Points négatifs
Verdict - Un concentré de puissance personnalisable
Le Key 17 Pro est conçu pour des scénarios d'utilisation nécessitant une grande puissance de calcul, tels que l'édition vidéo, les jeux et le rendu. L'ordinateur portable GeForce Ordinateur portable RTX 4090 et Core i9-13900HX à l'intérieur de l'ordinateur portable fournissent la puissance nécessaire pour gérer ces tâches - les deux composants sont capables de fonctionner en permanence à des vitesses élevées. L'ordinateur portable génère une quantité normale de chaleur et de bruit pour cette catégorie d'appareil.
Schenker a livré un puissant ordinateur portable haut de gamme avec le Key 17 Pro (Early 23).
Le Key 17 Pro dispose de trois emplacements SSD (1x PCIe 5.0, 2x PCIe 4.0 ; M.2-2280), ce qui signifie que vous pouvez rapidement ajouter des disques si vous manquez de stockage. Les deux emplacements PCIe 4.0 prennent en charge le RAID 0/1. L'installation de disques SSD supplémentaires n'est pas très compliquée. Le panneau inférieur peut être retiré sans outil après avoir dévissé toutes les vis.
Les deux ports USB-C (Thunderbolt 4) vous permettent d'intégrer sans effort l'ordinateur portable dans une configuration de bureau existante et d'ouvrir des options d'extension (par exemple, GPU externe). L'un des ports prend également en charge Power Delivery. L'autonomie de la batterie est très correcte. L'écran mat de 17,3 pouces (4K, IPS, 144Hz, G-Sync et DCI-P3) a laissé une impression majoritairement positive lors de nos tests, bien qu'il gagnerait à avoir un contraste plus élevé.
Une alternative au Key 17 Pro est le MSI Stealth 17 Studio. Il est équipé d'un écran mini-LED et produit beaucoup moins de bruit à plein régime. Au moment de la rédaction de cet article, l'Aorus 17X AZF de MSI, dont les spécifications sont presque identiques à celles de la Key 17 Pro, était en vente Aorus 17X AZF (bien qu'il soit équipé d'un écran QHD au lieu d'un écran 4K) est nettement moins cher que le Key et constitue donc une option plus avantageuse pour le portefeuille.
Prix et disponibilité
Le Schenker Key 17 Pro (Early 23), tel qu'il est spécifié dans cet article, vous coûtera environ 4 479 € (4 820 $ US). Vous pouvez également configurer l'appareil en fonction de vos besoins dans la boutique en ligne de Schenker. Les prix commencent à 3 199 euros (3 445 dollars).
Schenker Key 17 Pro (Early 23)
- 05/30/2023 v7 (old)
Sascha Mölck
Transparency
La sélection des appareils à examiner est effectuée par notre équipe éditoriale. L'échantillon de test a été prêté à l'auteur par le fabricant ou le détaillant pour les besoins de cet examen. Le prêteur n'a pas eu d'influence sur cette évaluation et le fabricant n'a pas reçu de copie de cette évaluation avant sa publication. Il n'y avait aucune obligation de publier cet article. En tant que média indépendant, Notebookcheck n'est pas soumis à l'autorité des fabricants, des détaillants ou des éditeurs.
Voici comment Notebookcheck teste
Chaque année, Notebookcheck examine de manière indépendante des centaines d'ordinateurs portables et de smartphones en utilisant des procédures standardisées afin de garantir que tous les résultats sont comparables. Nous avons continuellement développé nos méthodes de test depuis environ 20 ans et avons établi des normes industrielles dans le processus. Dans nos laboratoires de test, des équipements de mesure de haute qualité sont utilisés par des techniciens et des rédacteurs expérimentés. Ces tests impliquent un processus de validation en plusieurs étapes. Notre système d'évaluation complexe repose sur des centaines de mesures et de points de référence bien fondés, ce qui garantit l'objectivité.Price comparison

