Test du Medion Erazer Beast X40 : ordinateur portable de jeu avec RTX 4090

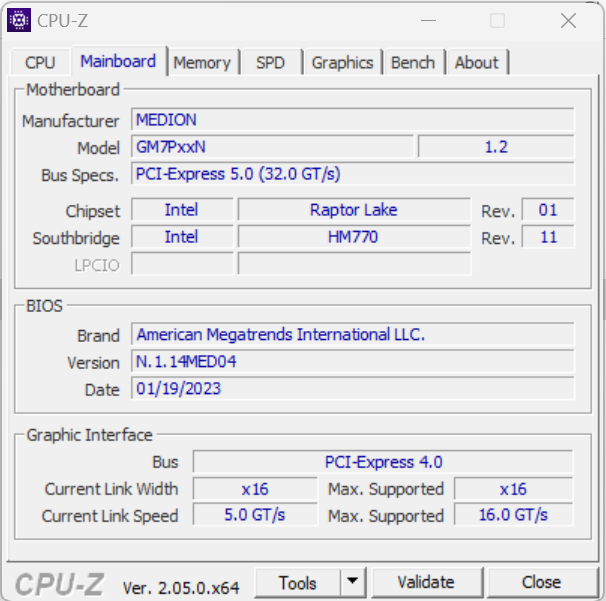
Même s'il entre dans la catégorie des ordinateurs portables de jeu, l'Erazer Beast X40 est également conçu pour d'autres scénarios d'utilisation très exigeants. Les performances informatiques nécessaires sont fournies par un CPU Raptor Lake et un GPU Ada Lovelace. Par rapport à ses prédécesseurs Test du Medion Erazer Beast X30 : PC portable de jeu QHD fin et puissant , l'ordinateur portable a bénéficié d'une refonte majeure : Medion lui a donné un nouveau format d'écran (16:10 au lieu de 16:9), un système de refroidissement avec refroidissement à l'eau en option et un clavier mécanique.
Le X40 est basé sur un barebone Tongfang (GM7PX9N) qui est pratiquement identique à celui utilisé pour le XMG Neo 17. Il est en concurrence avec les modèles suivants MSI Titan GT77 HX 13VI, Alienware x17 R2 P48E, Razer Blade 16 (début 2023)et Asus ROG Strix Scar 18 2023 G834JY.
Comparaison avec les concurrents potentiels
Note | Date | Modèle | Poids | Épaisseur | Taille | Résolution | Prix |
|---|---|---|---|---|---|---|---|
| 88.4 % v7 (old) | 03/23 | Medion Erazer Beast X40 i9-13900HX, GeForce RTX 4090 Laptop GPU | 2.9 kg | 33 mm | 17.00" | 2560x1600 | |
| 89 % v7 (old) | 02/23 | MSI Titan GT77 HX 13VI i9-13950HX, GeForce RTX 4090 Laptop GPU | 3.5 kg | 23 mm | 17.30" | 3840x2160 | |
| 91.2 % v7 (old) | 02/23 | Razer Blade 16 Early 2023 i9-13950HX, GeForce RTX 4080 Laptop GPU | 2.4 kg | 21.99 mm | 16.00" | 2560x1600 | |
| 87.6 % v7 (old) | 09/22 | Schenker XMG Neo 17 M22 R9 6900HX, GeForce RTX 3080 Ti Laptop GPU | 2.8 kg | 27 mm | 17.00" | 2560x1600 | |
| 89.2 % v7 (old) | 05/22 | Alienware x17 R2 P48E i9-12900HK, GeForce RTX 3080 Ti Laptop GPU | 3.1 kg | 20.9 mm | 17.30" | 1920x1080 | |
| 86.6 % v7 (old) | 02/23 | Asus ROG Strix Scar 18 2023 G834JY-N6005W i9-13980HX, GeForce RTX 4090 Laptop GPU | 3.1 kg | 30.8 mm | 18.00" | 2560x1600 |
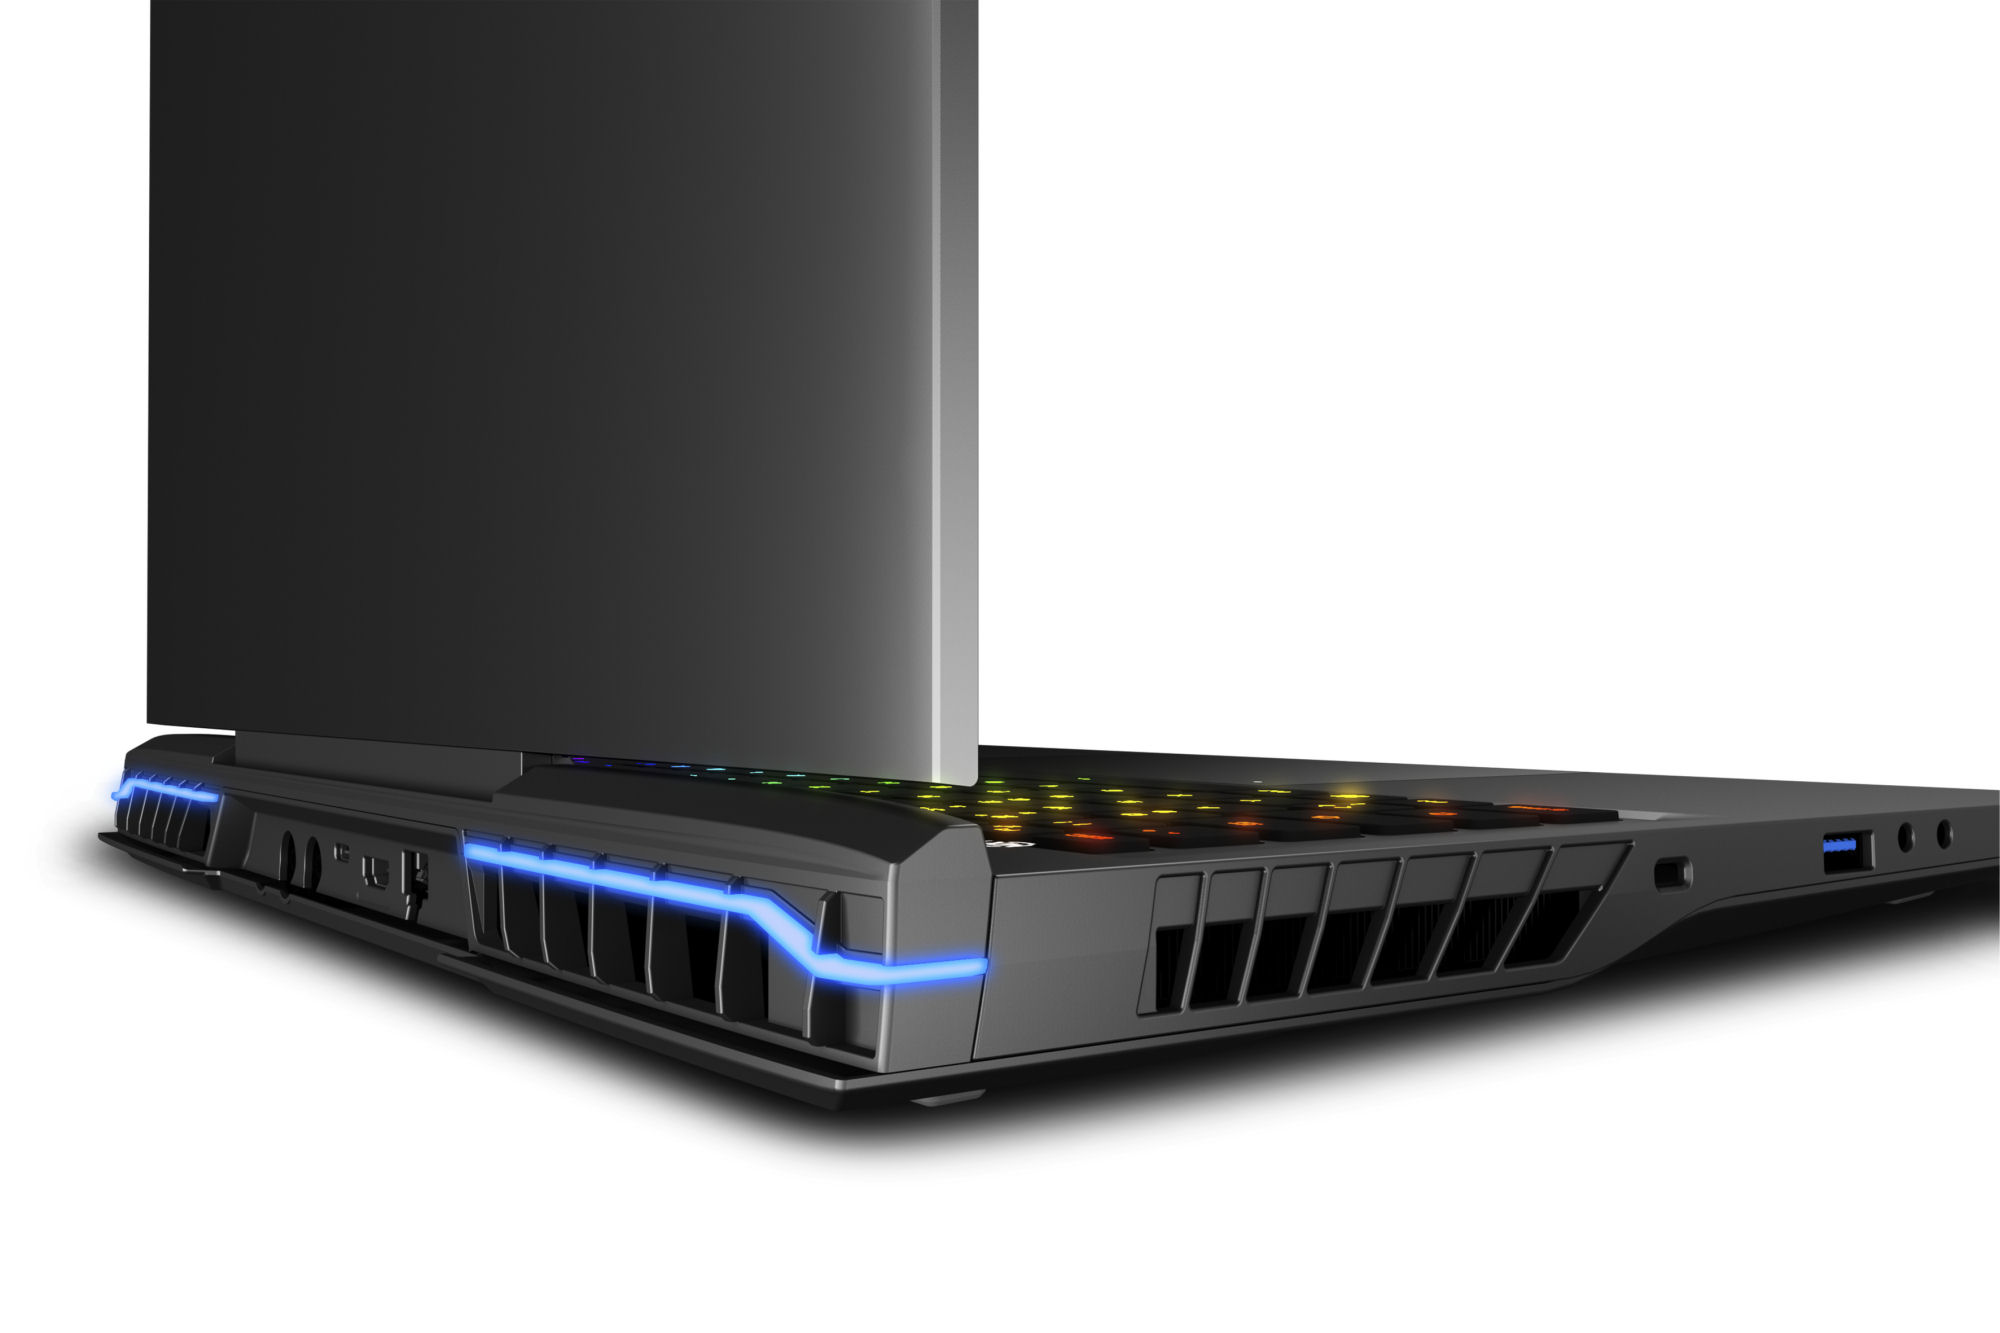
Boîtier - L'Erazer est doté d'un châssis métallique
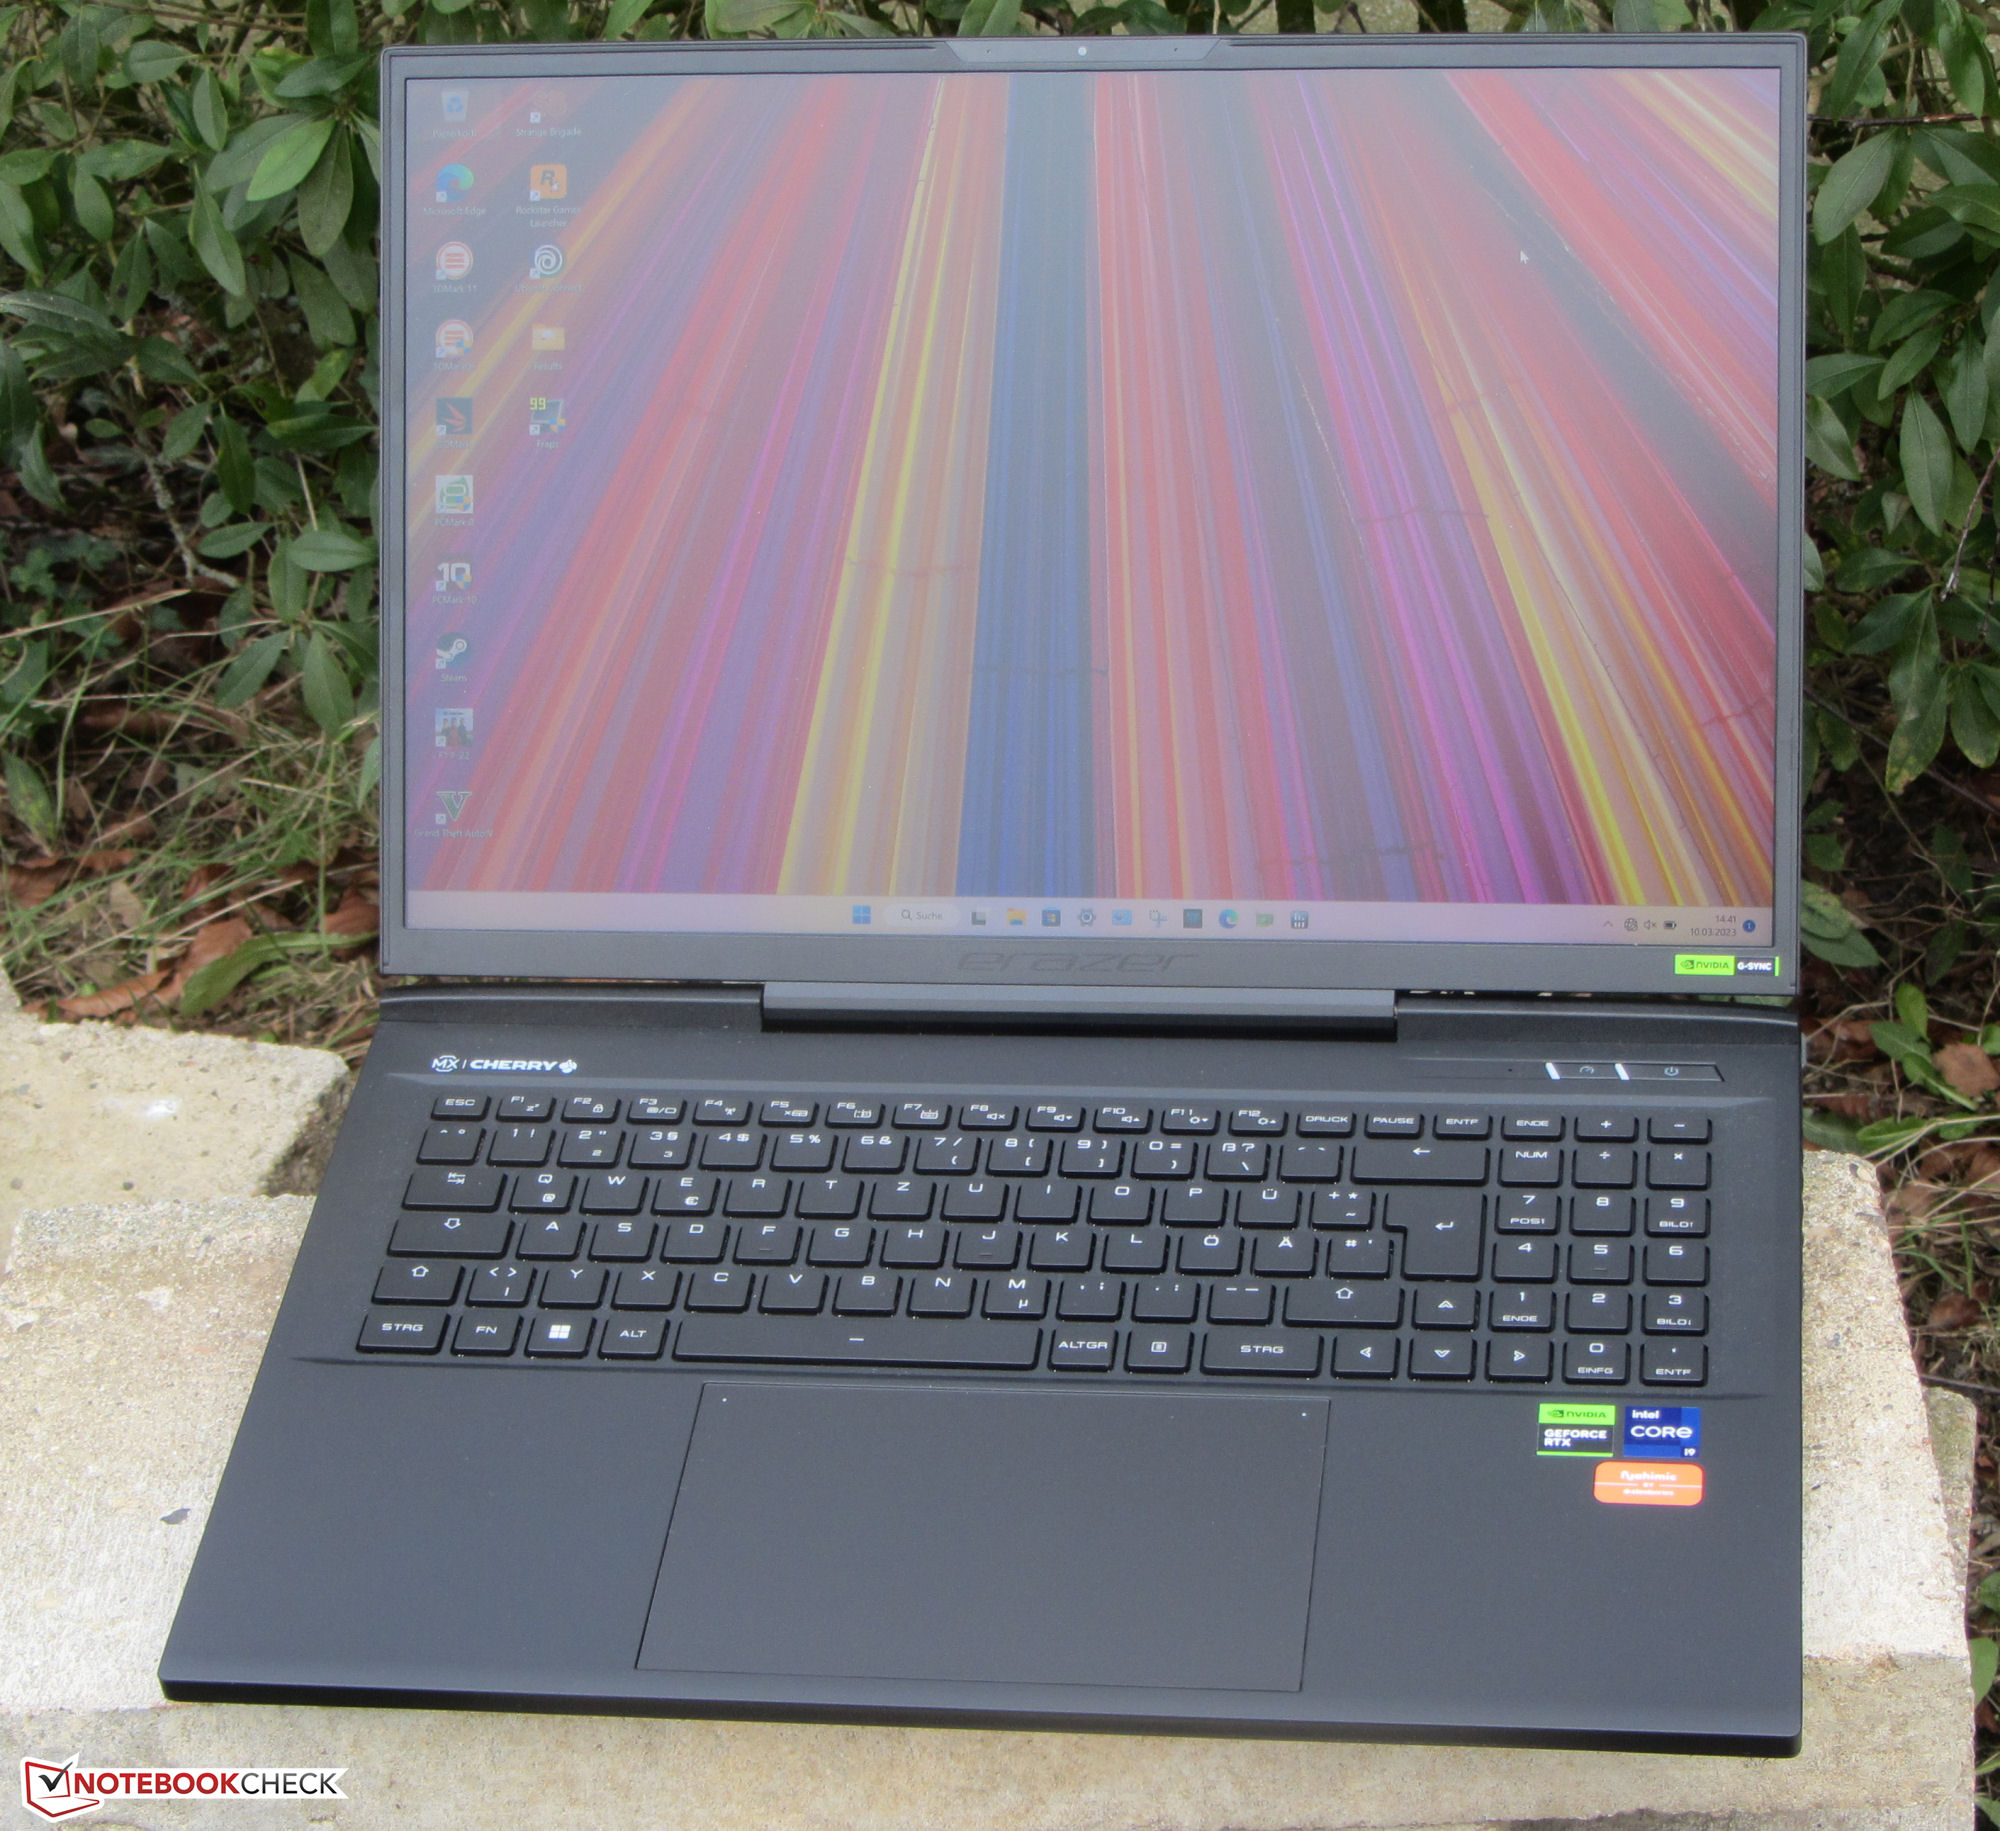
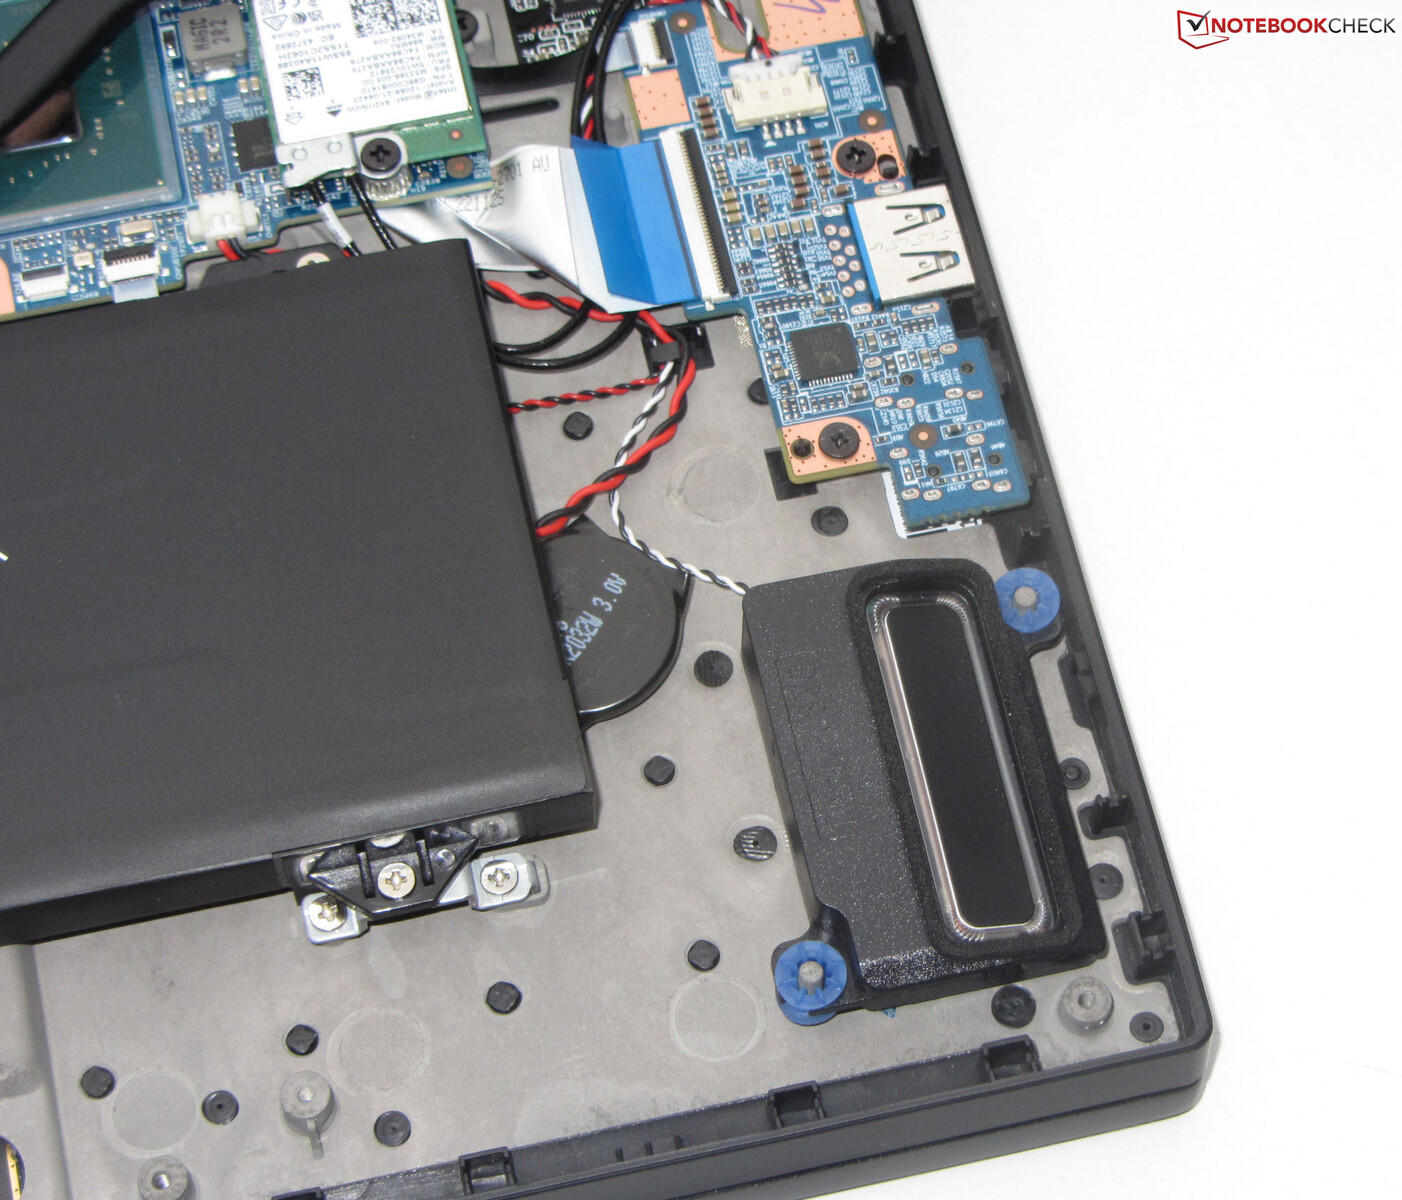
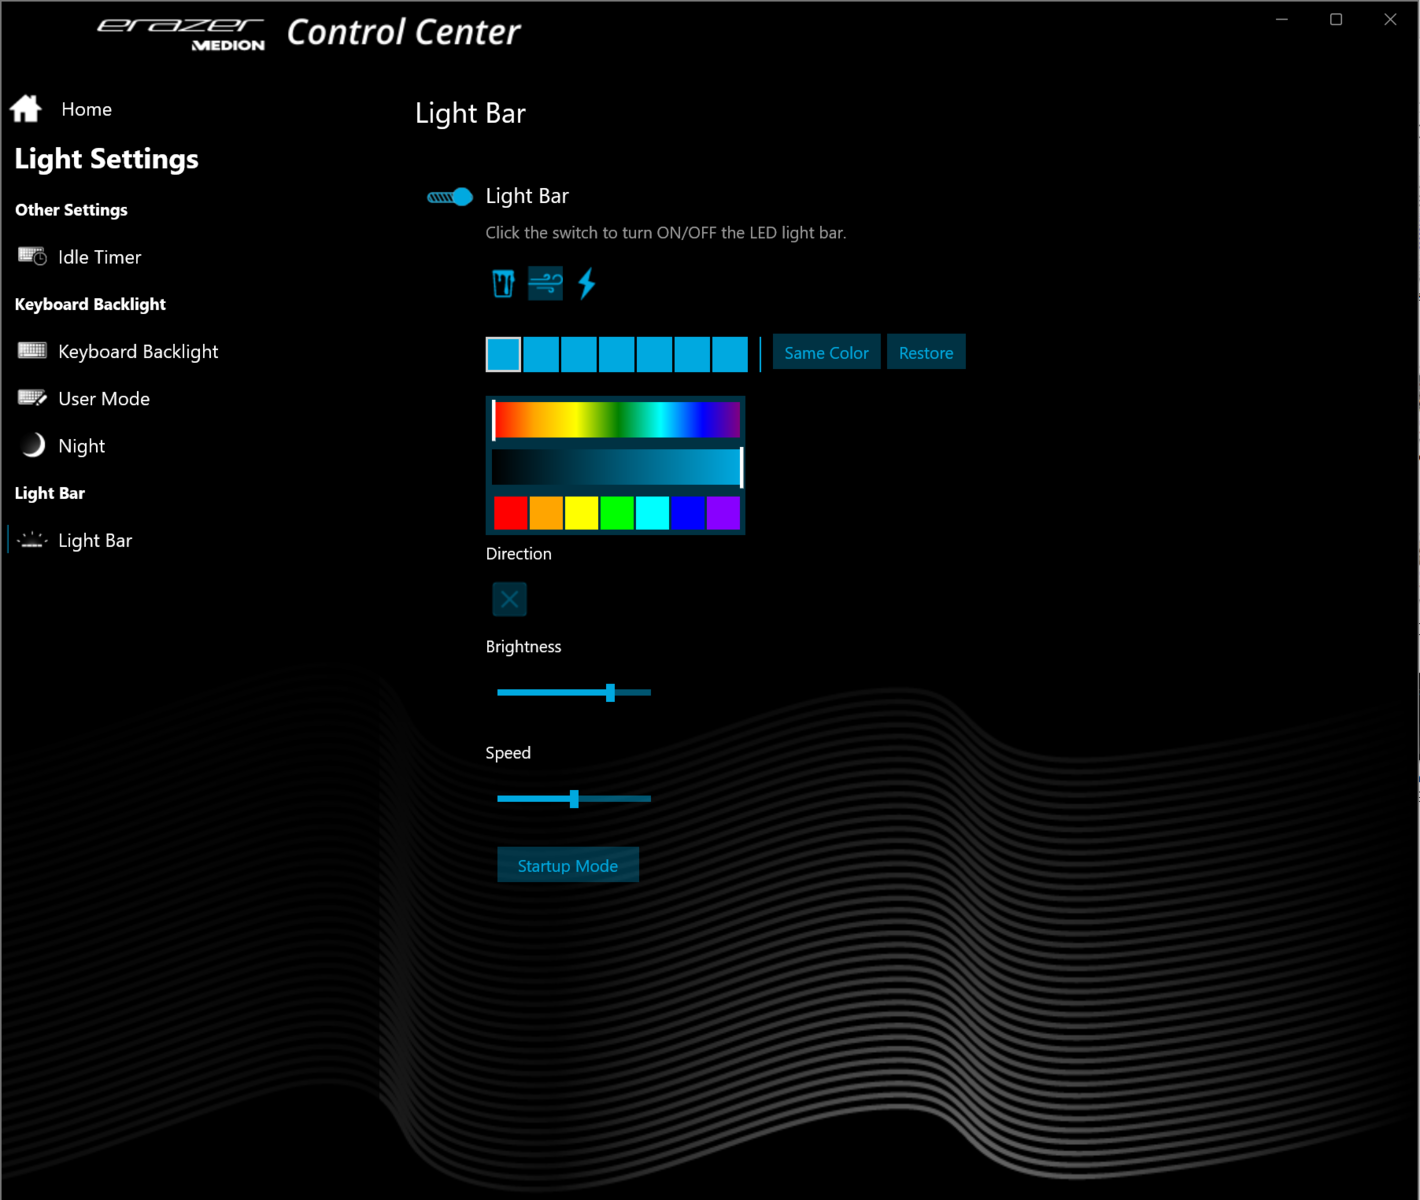
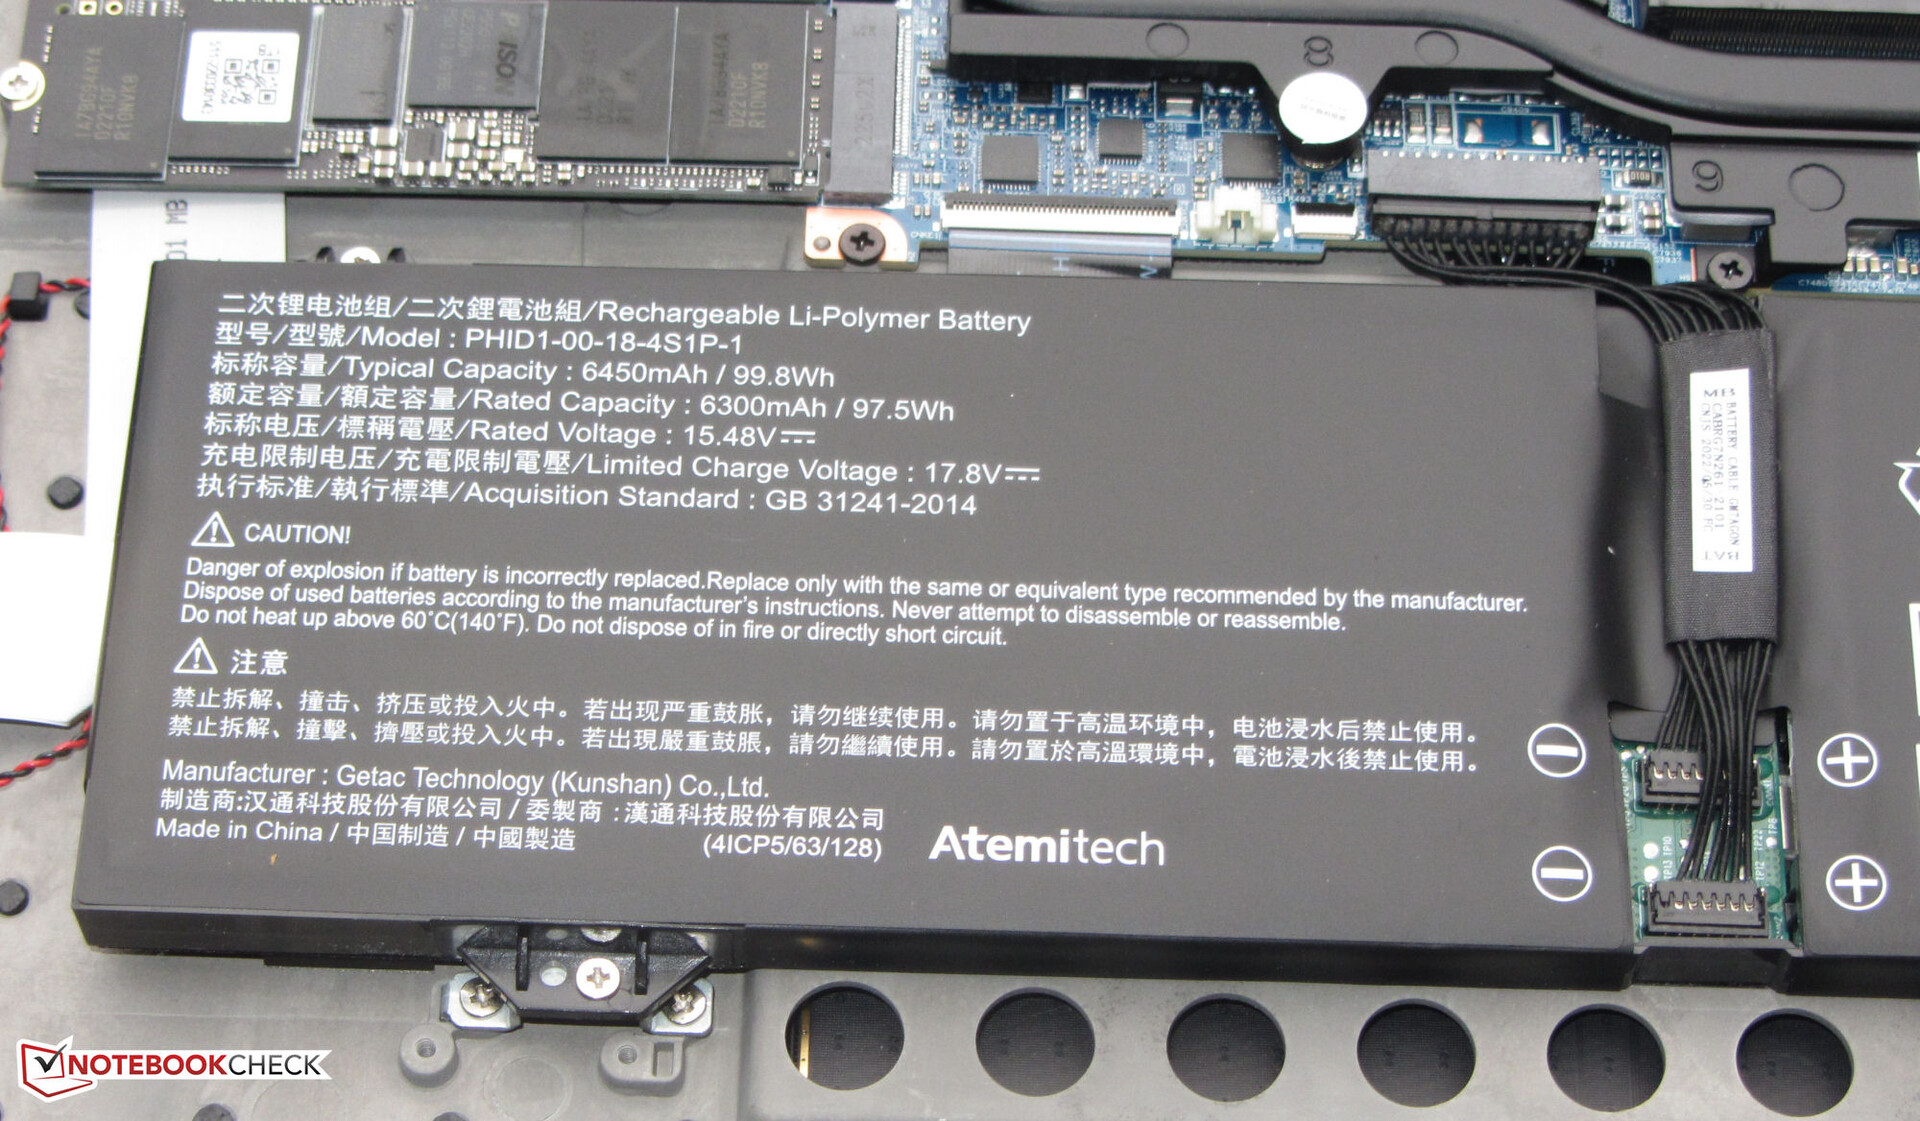
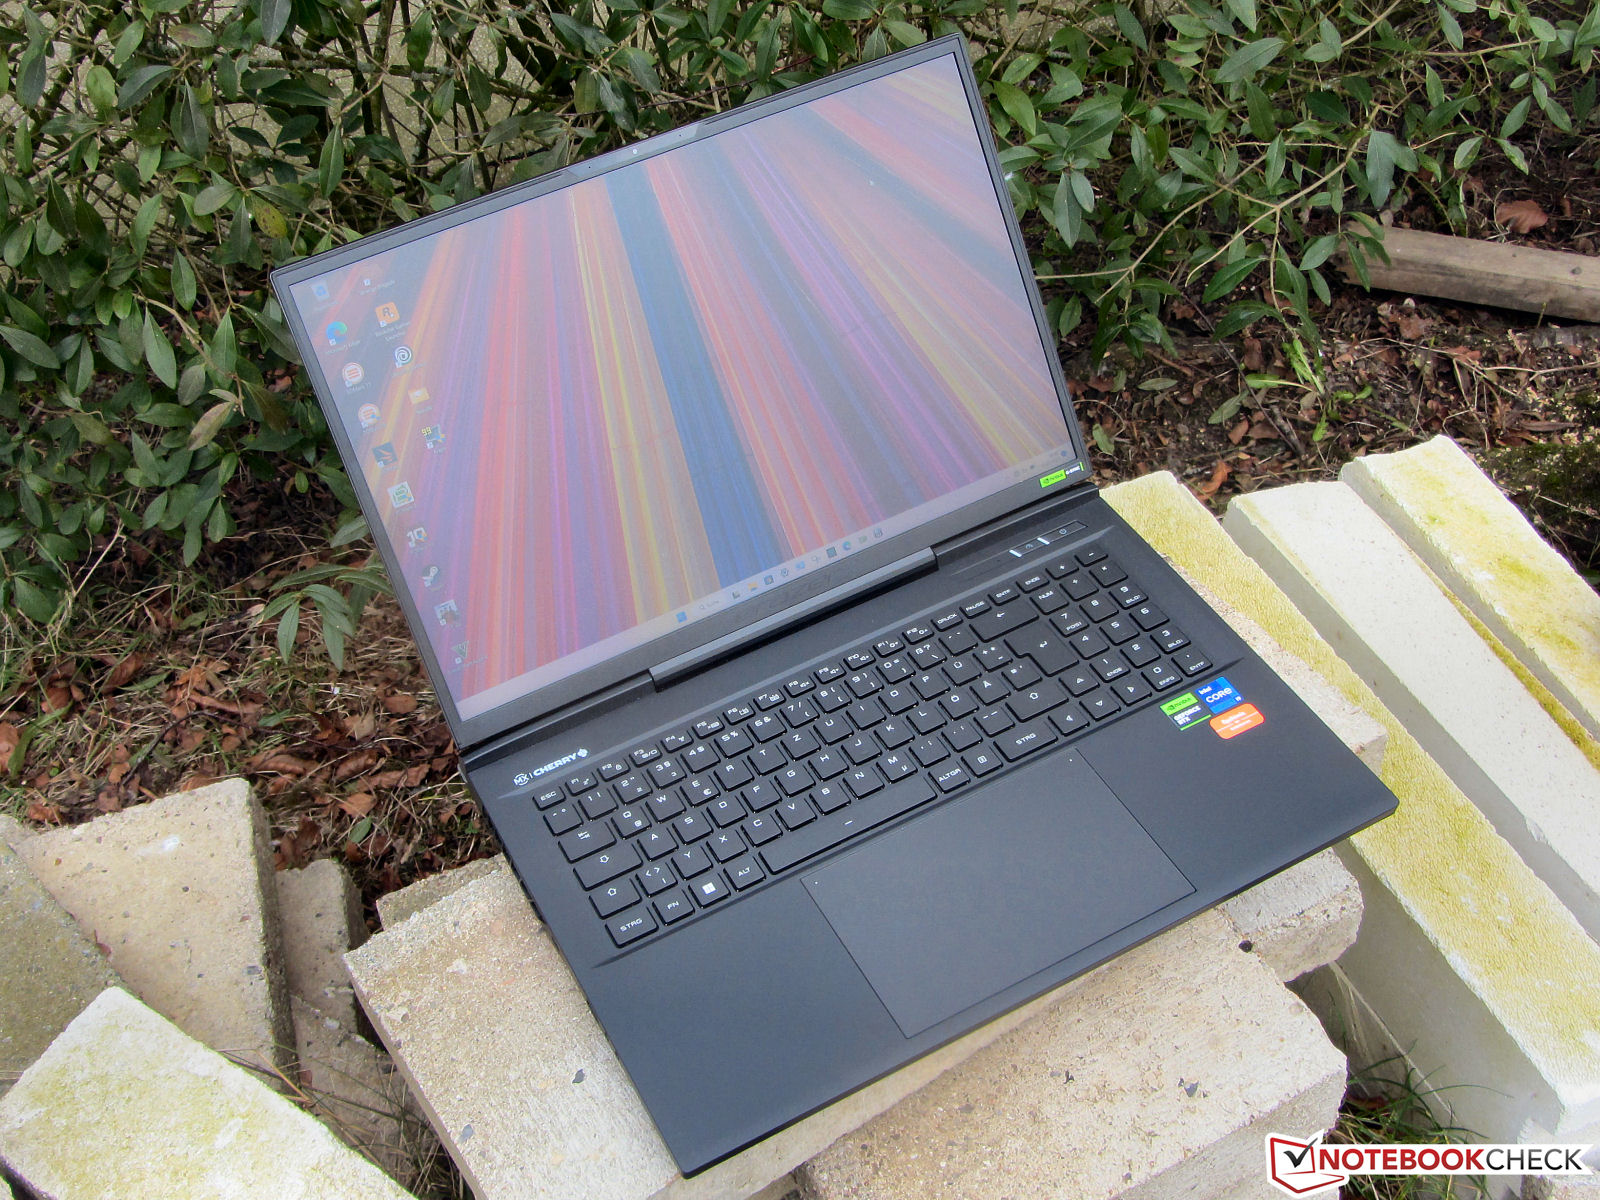
L'Erazer Beast X40 renonce à un look bruyant et tape-à-l'œil au profit d'un design discret qui ne se démarquerait pas dans un environnement professionnel. Comme ses prédécesseurs, le X40 utilise un châssis en métal noir avec des finitions mates. La base est recouverte d'un revêtement en caoutchouc très adhérent. Le rétroéclairage du clavier (RVB) ainsi que deux bandes LED entièrement configurables (RVB) au-dessus des évents d'échappement arrière apportent une touche de couleur à l'ordinateur portable. La batterie, qui est vissée plutôt que collée, et le reste des composants internes sont accessibles une fois le capot inférieur retiré.
Nous n'avons pas remarqué de problèmes de fabrication sur notre unité de test. Les espaces dans le châssis sont bien serrés et il n'y a pas d'excès de matériaux laissés par le processus de fabrication. Il est pratiquement impossible de tordre la section de base. Le couvercle peut être légèrement fléchi, mais le degré de flexion est tout à fait acceptable. Les charnières maintiennent l'écran fermement en place et permettent de le replier d'environ 140 degrés. Le couvercle de l'ordinateur portable ne peut pas être ouvert d'une seule main.
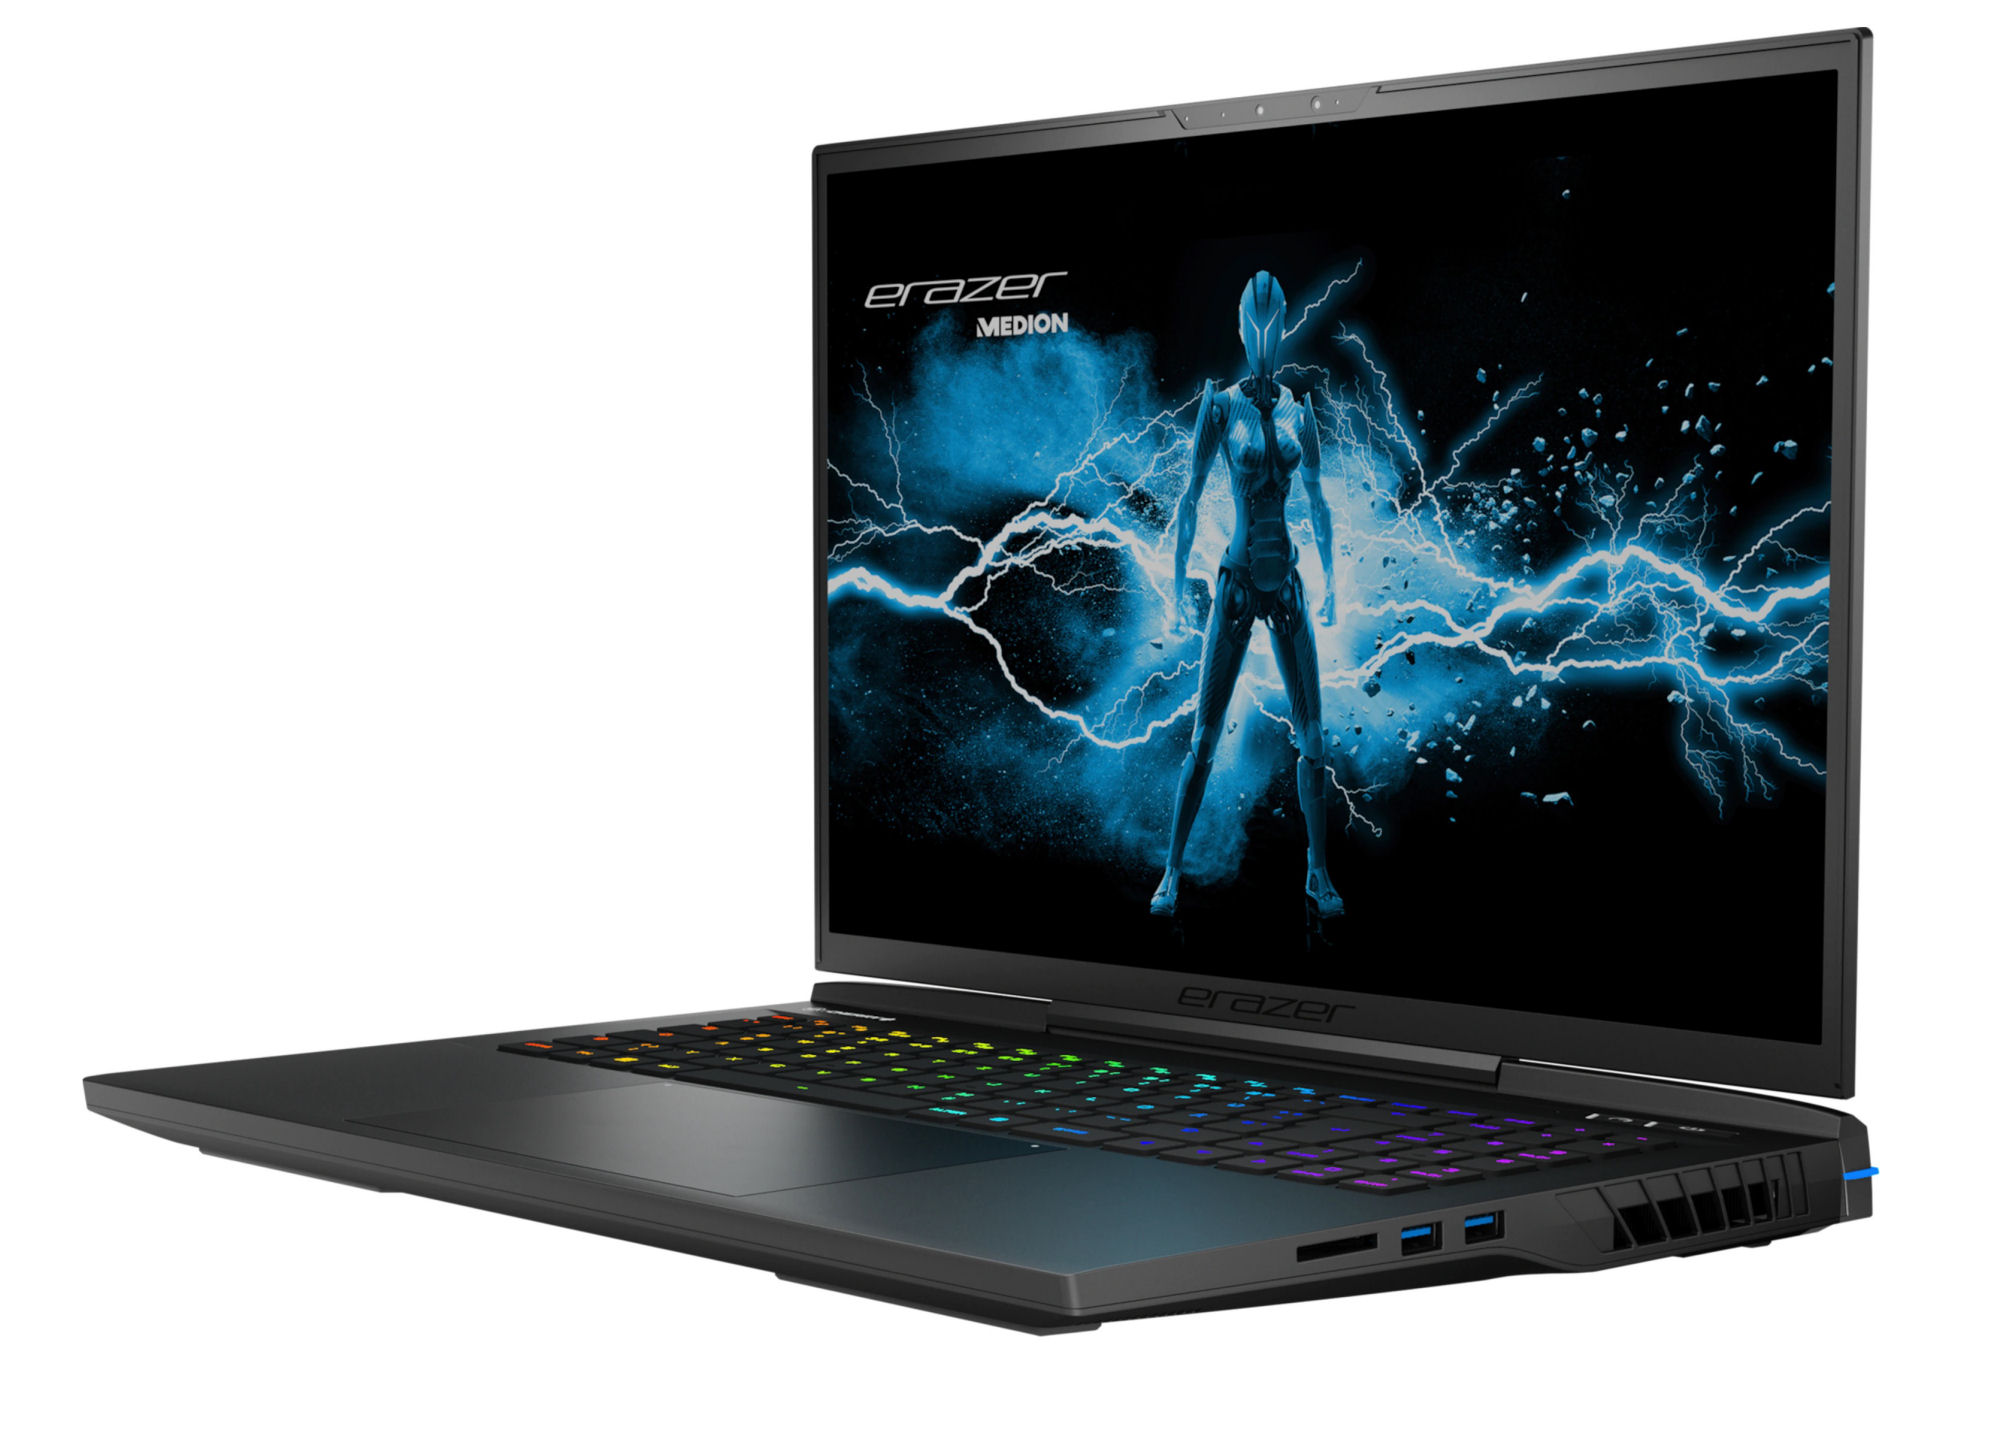
Le Medion Erazer Beast X40 est l'un des appareils les plus compacts de notre comparatif et se situe dans la moyenne en termes de poids.
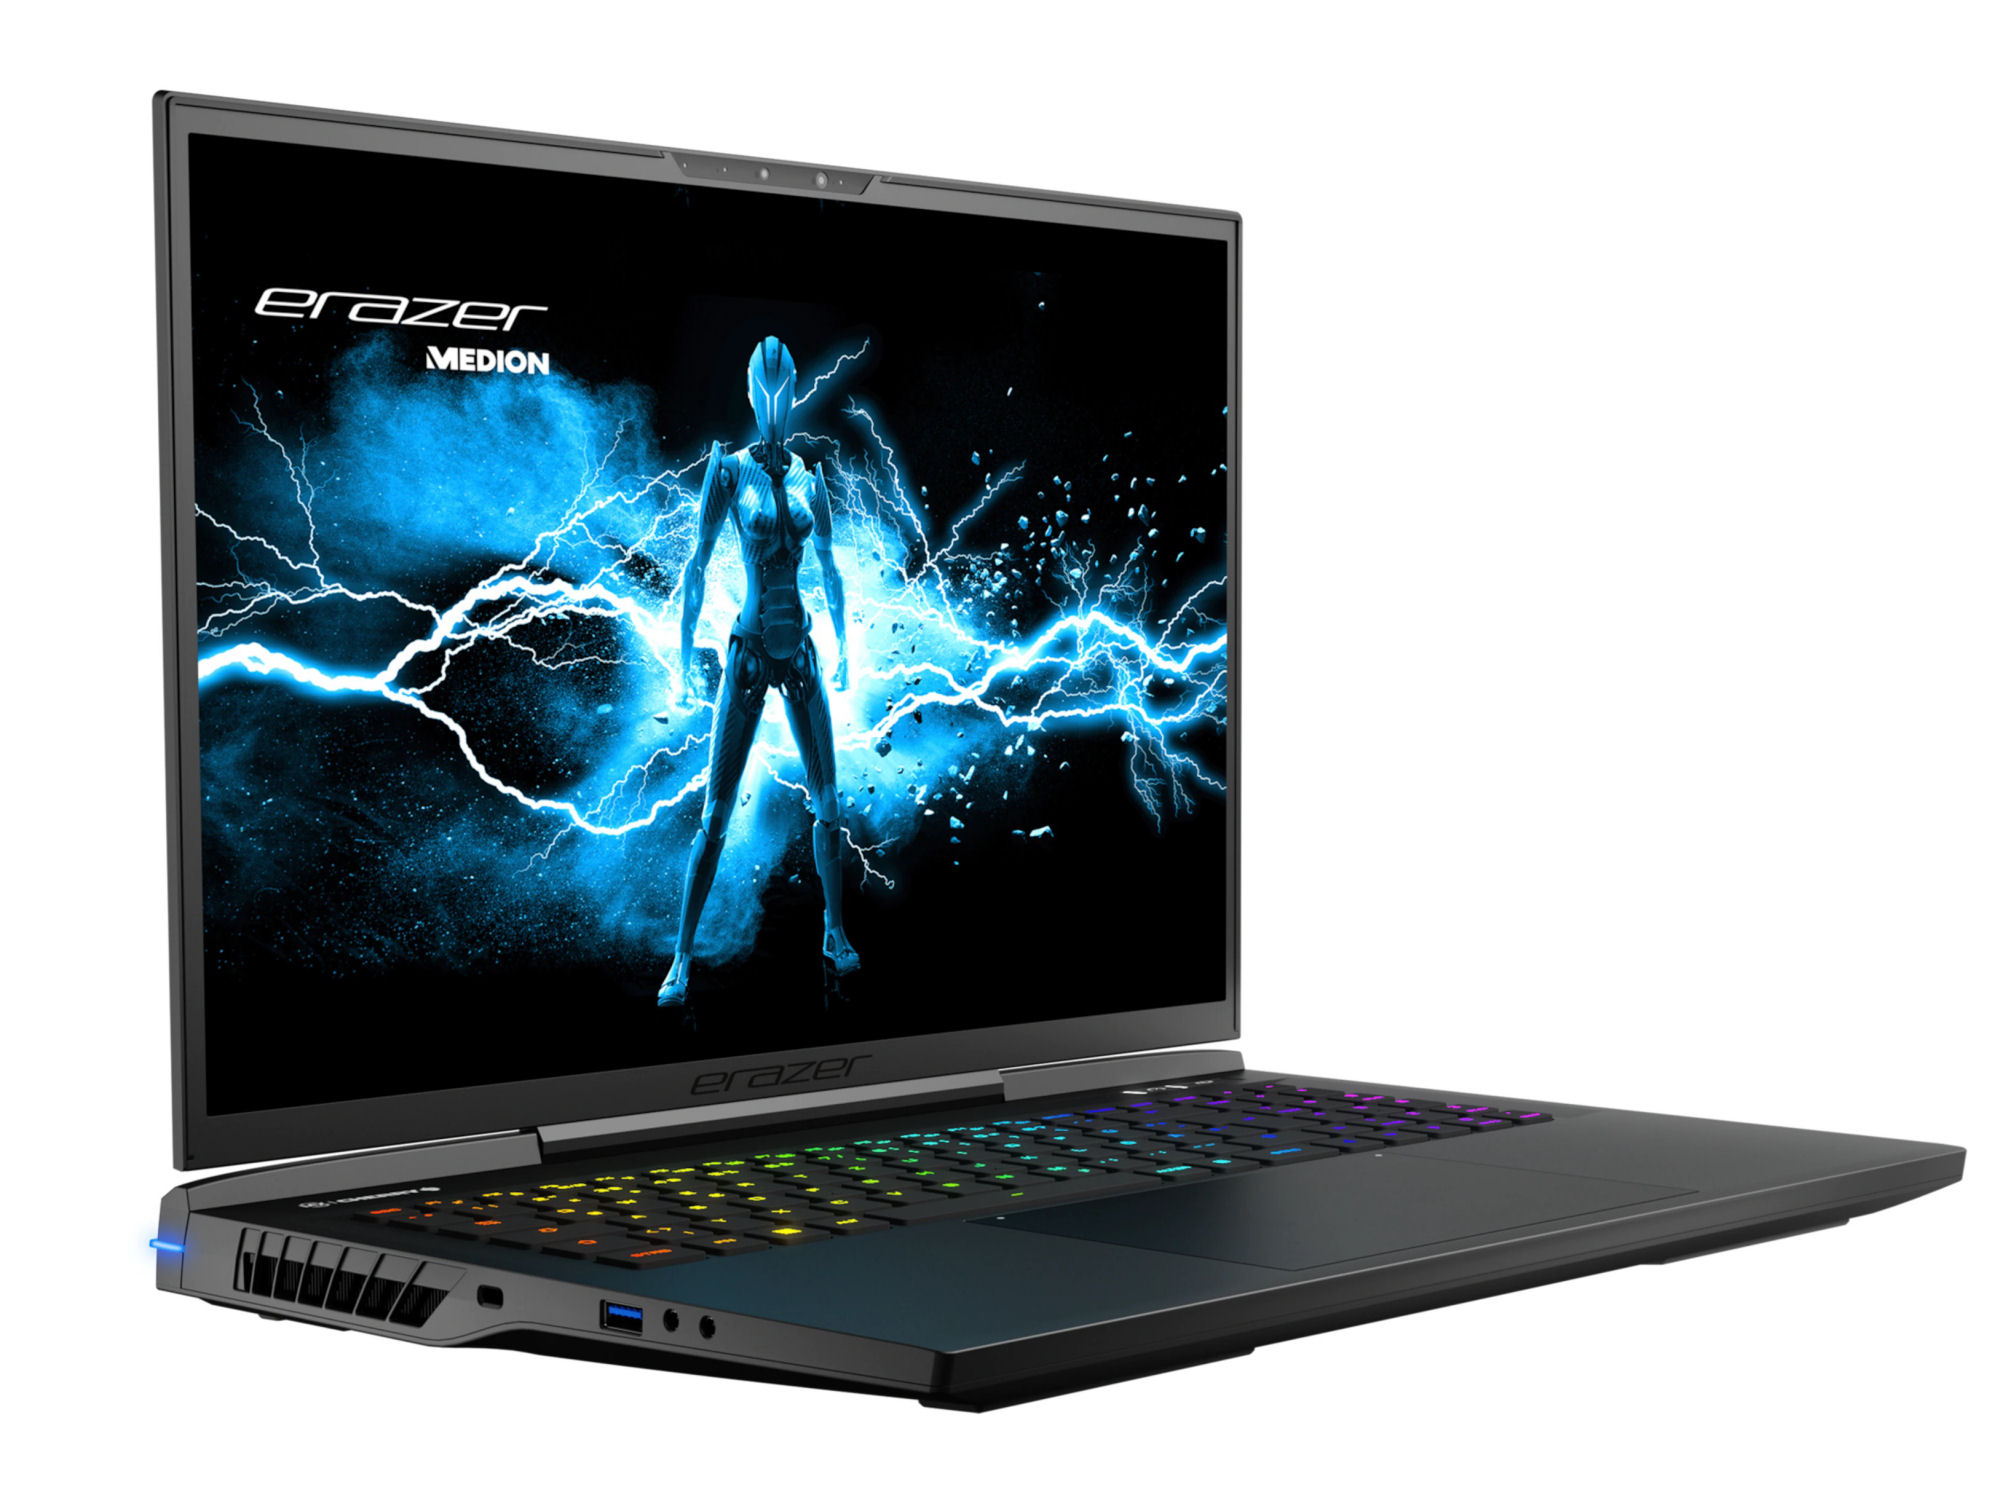
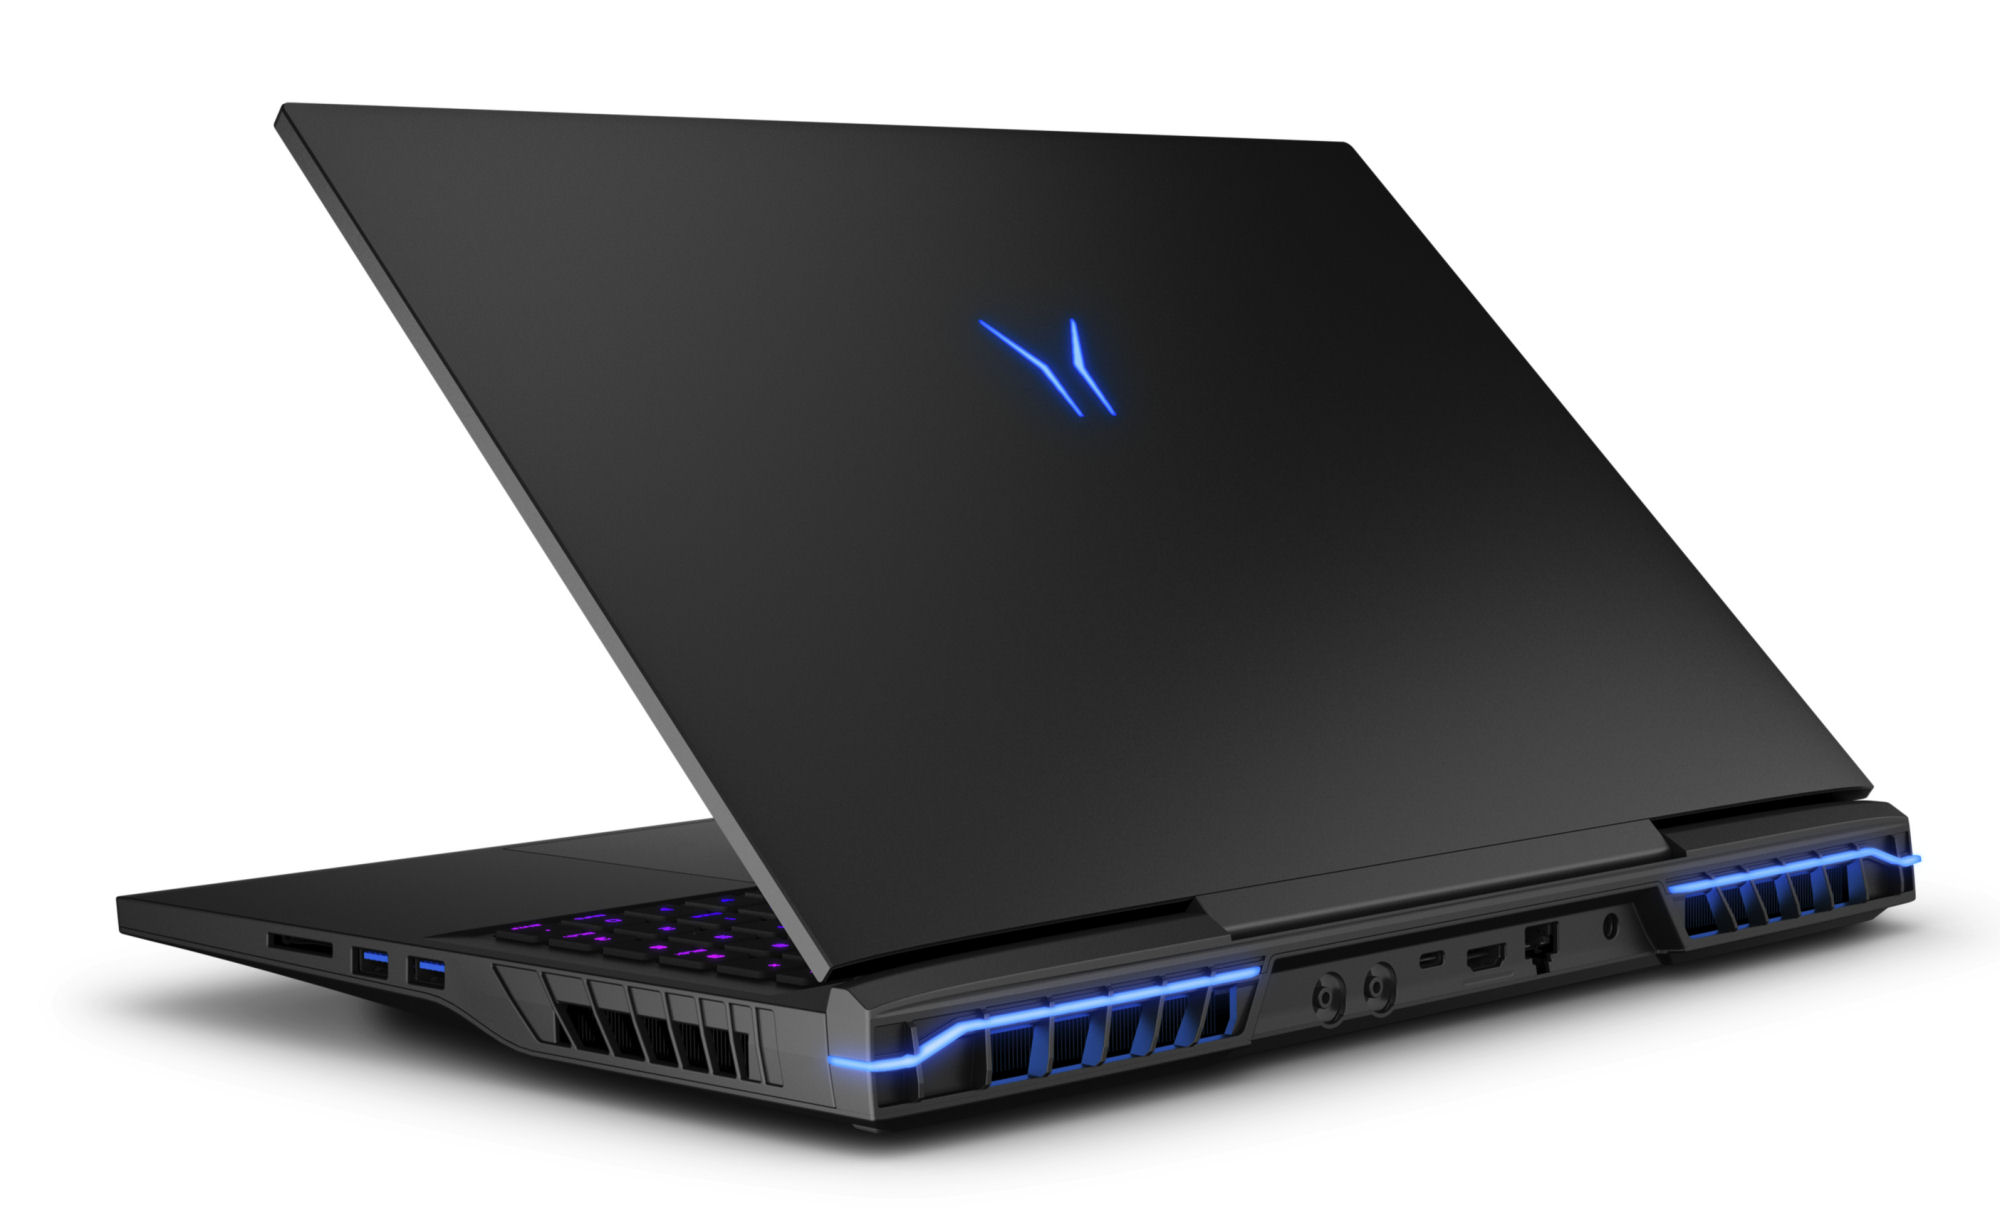
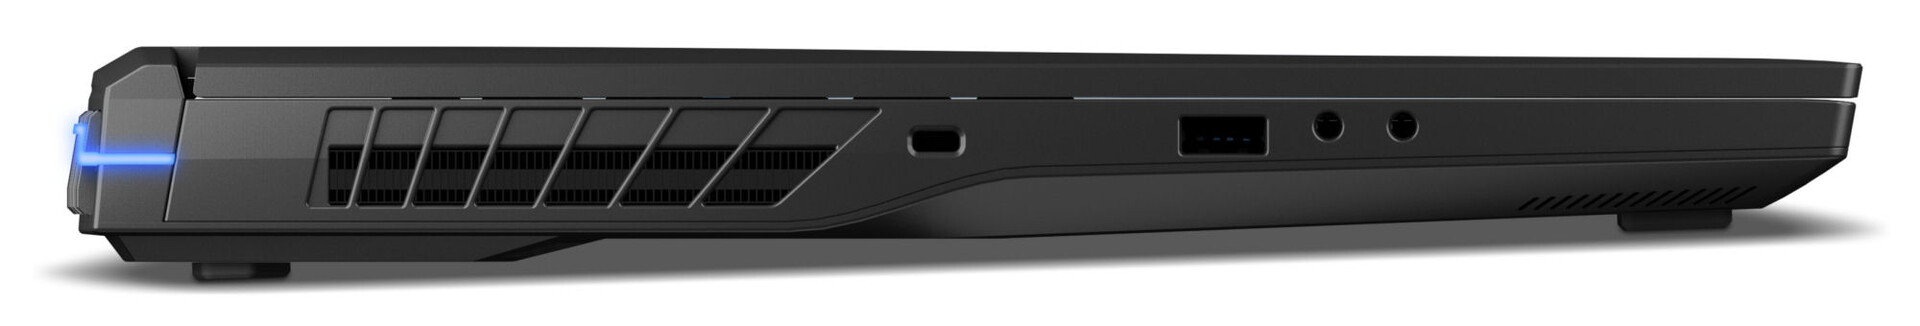
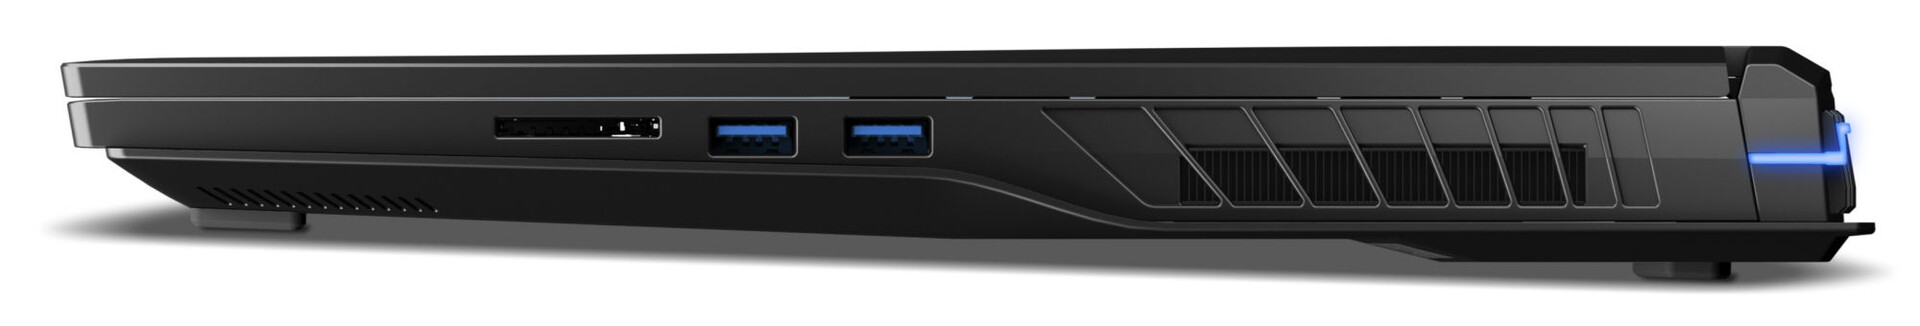
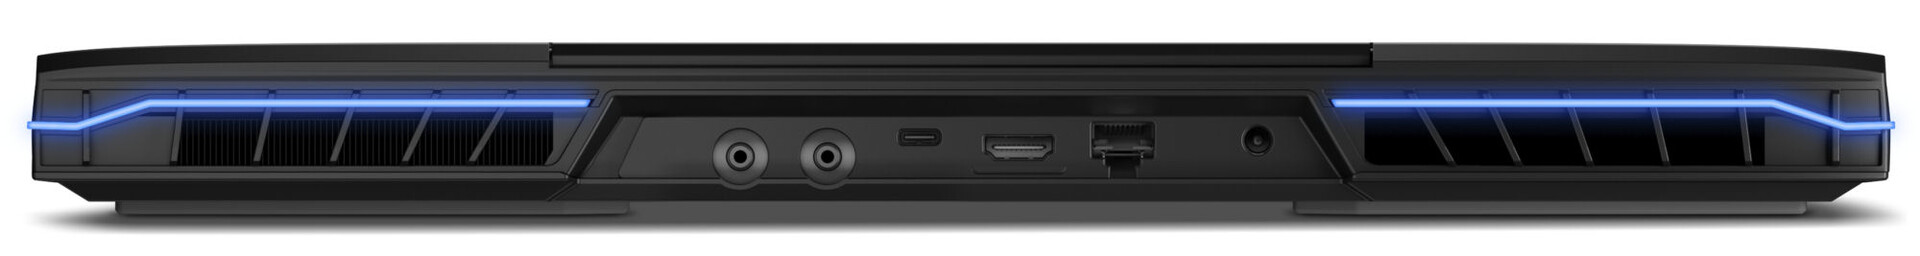
Spécifications - Thunderbolt 4 pour la bête
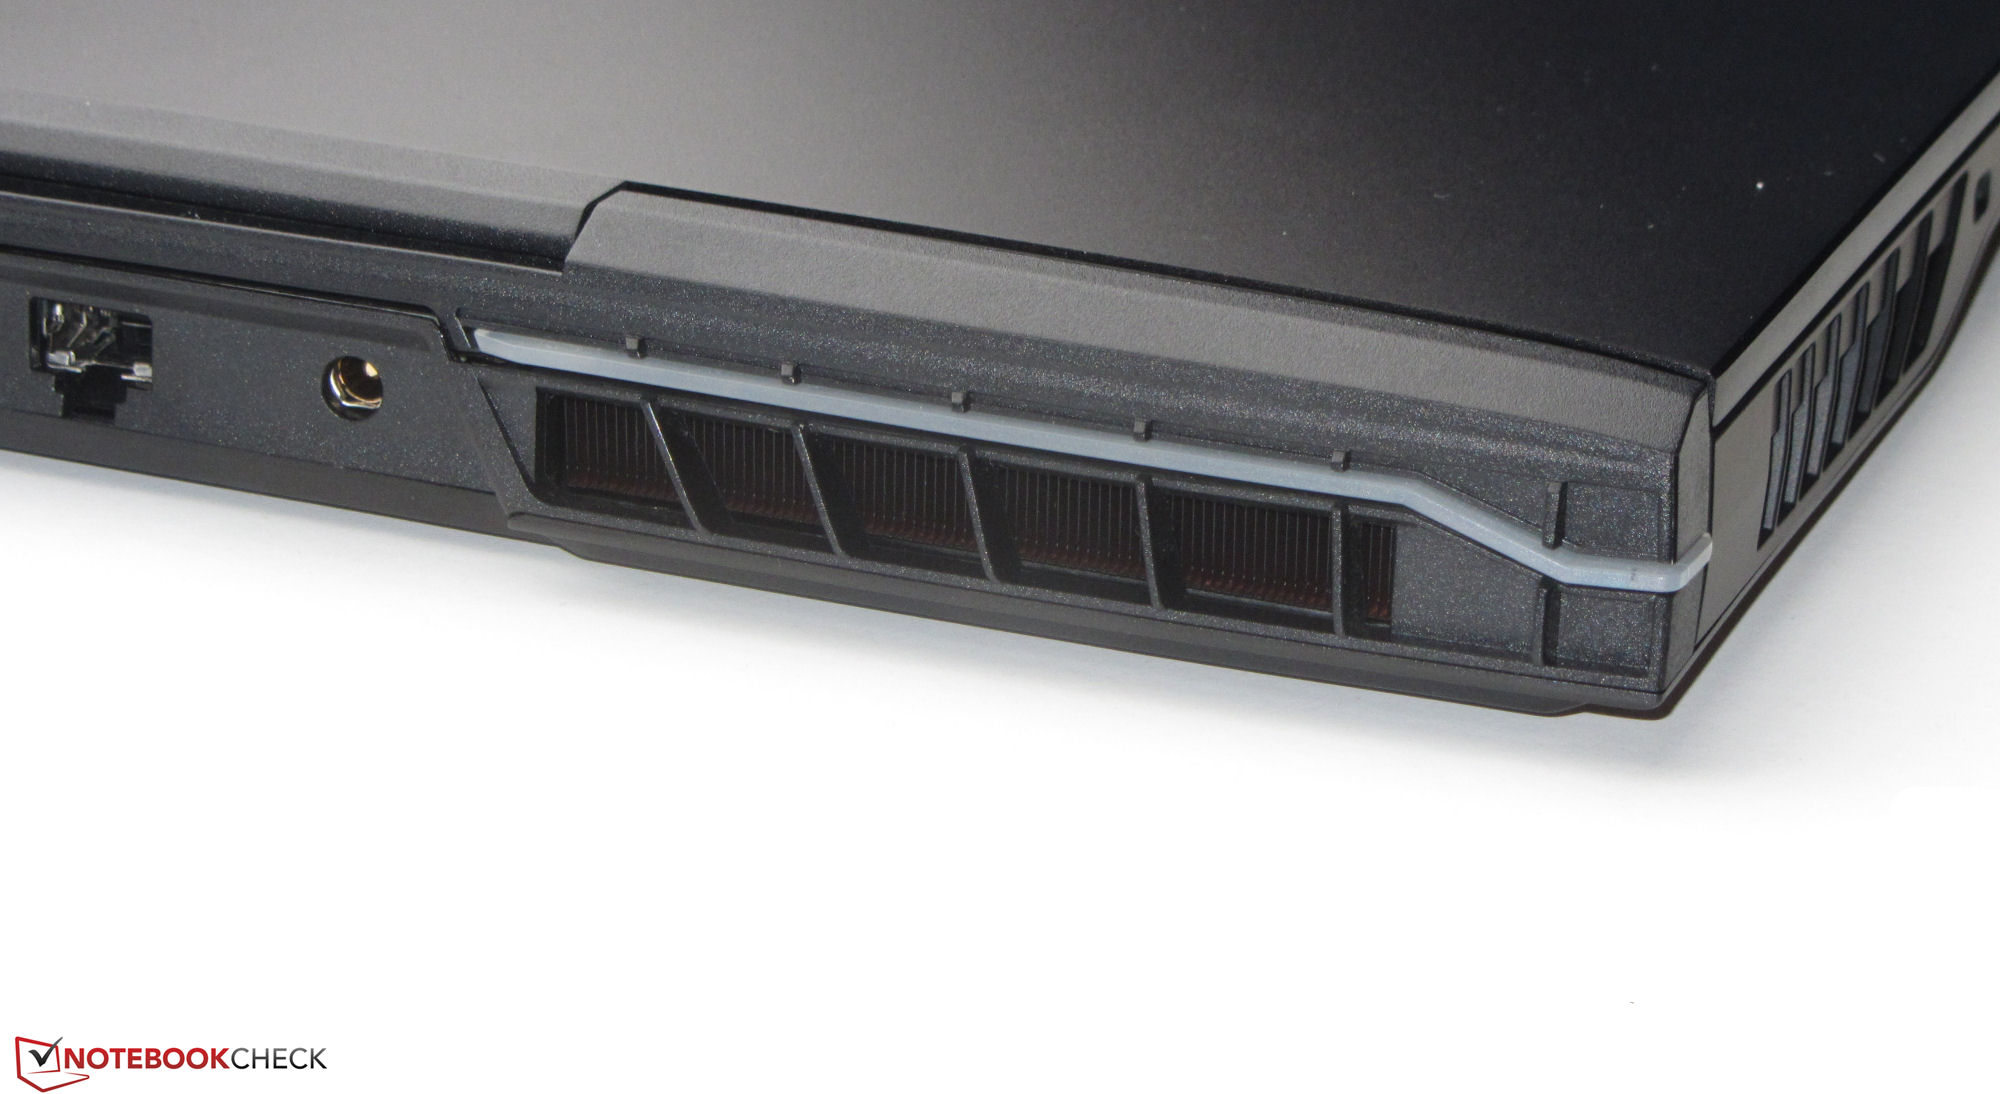
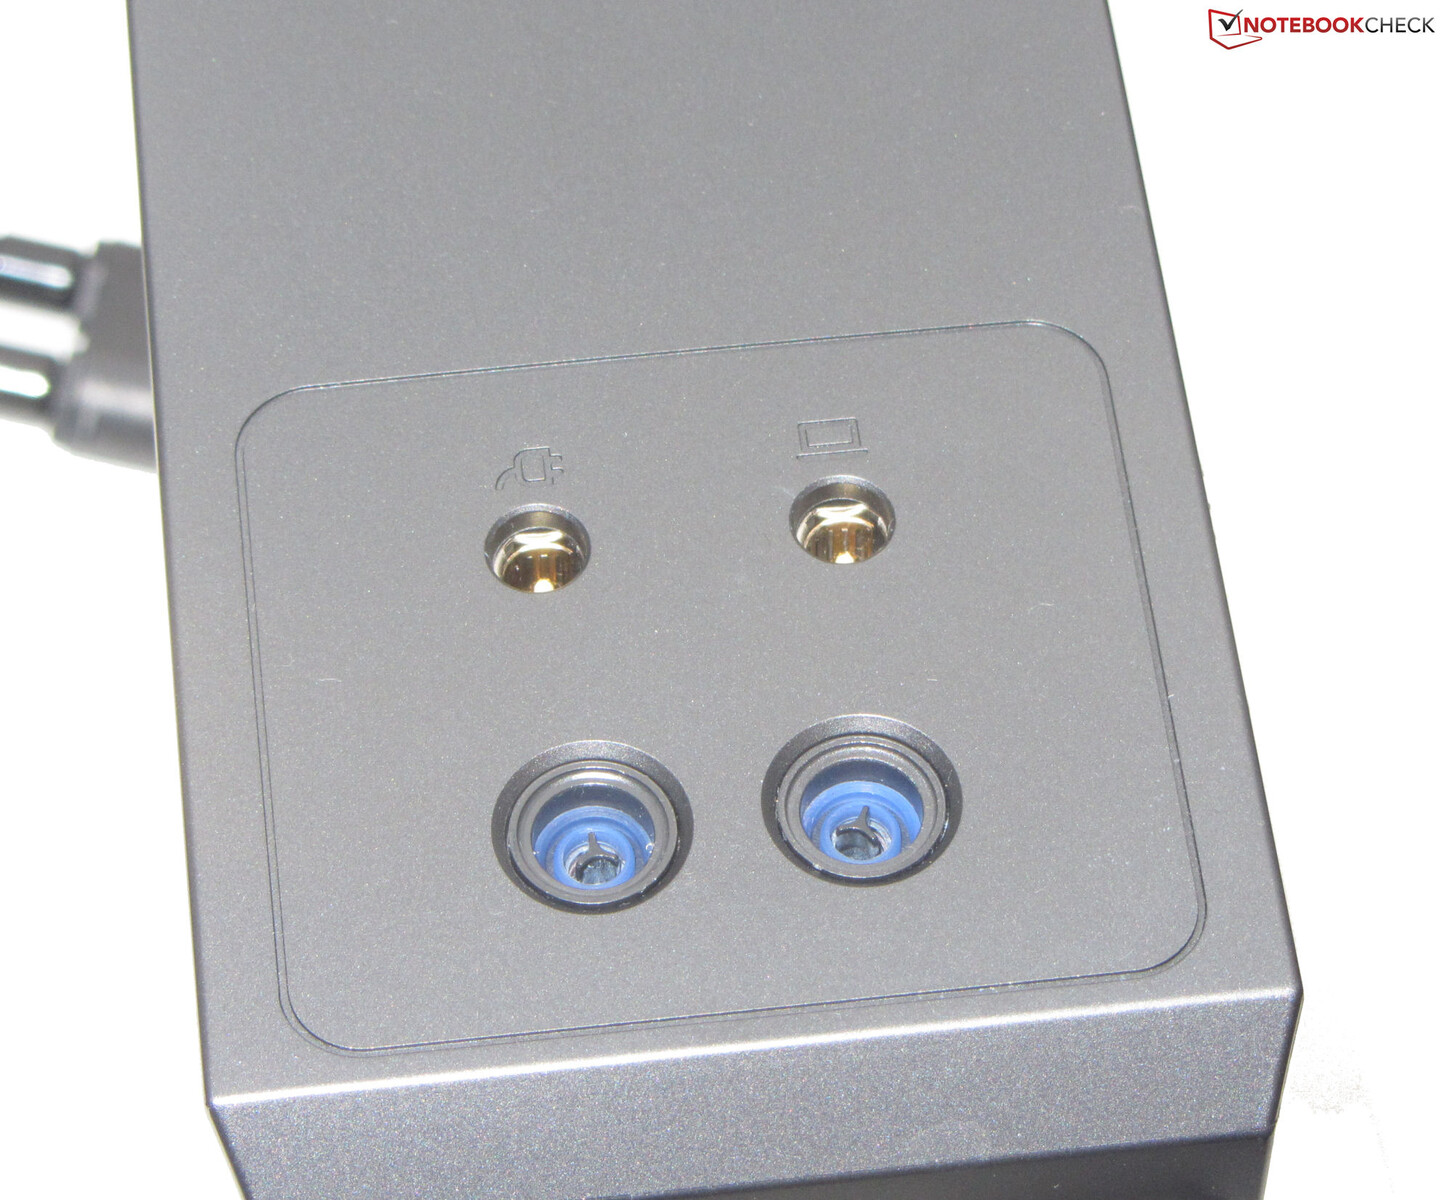
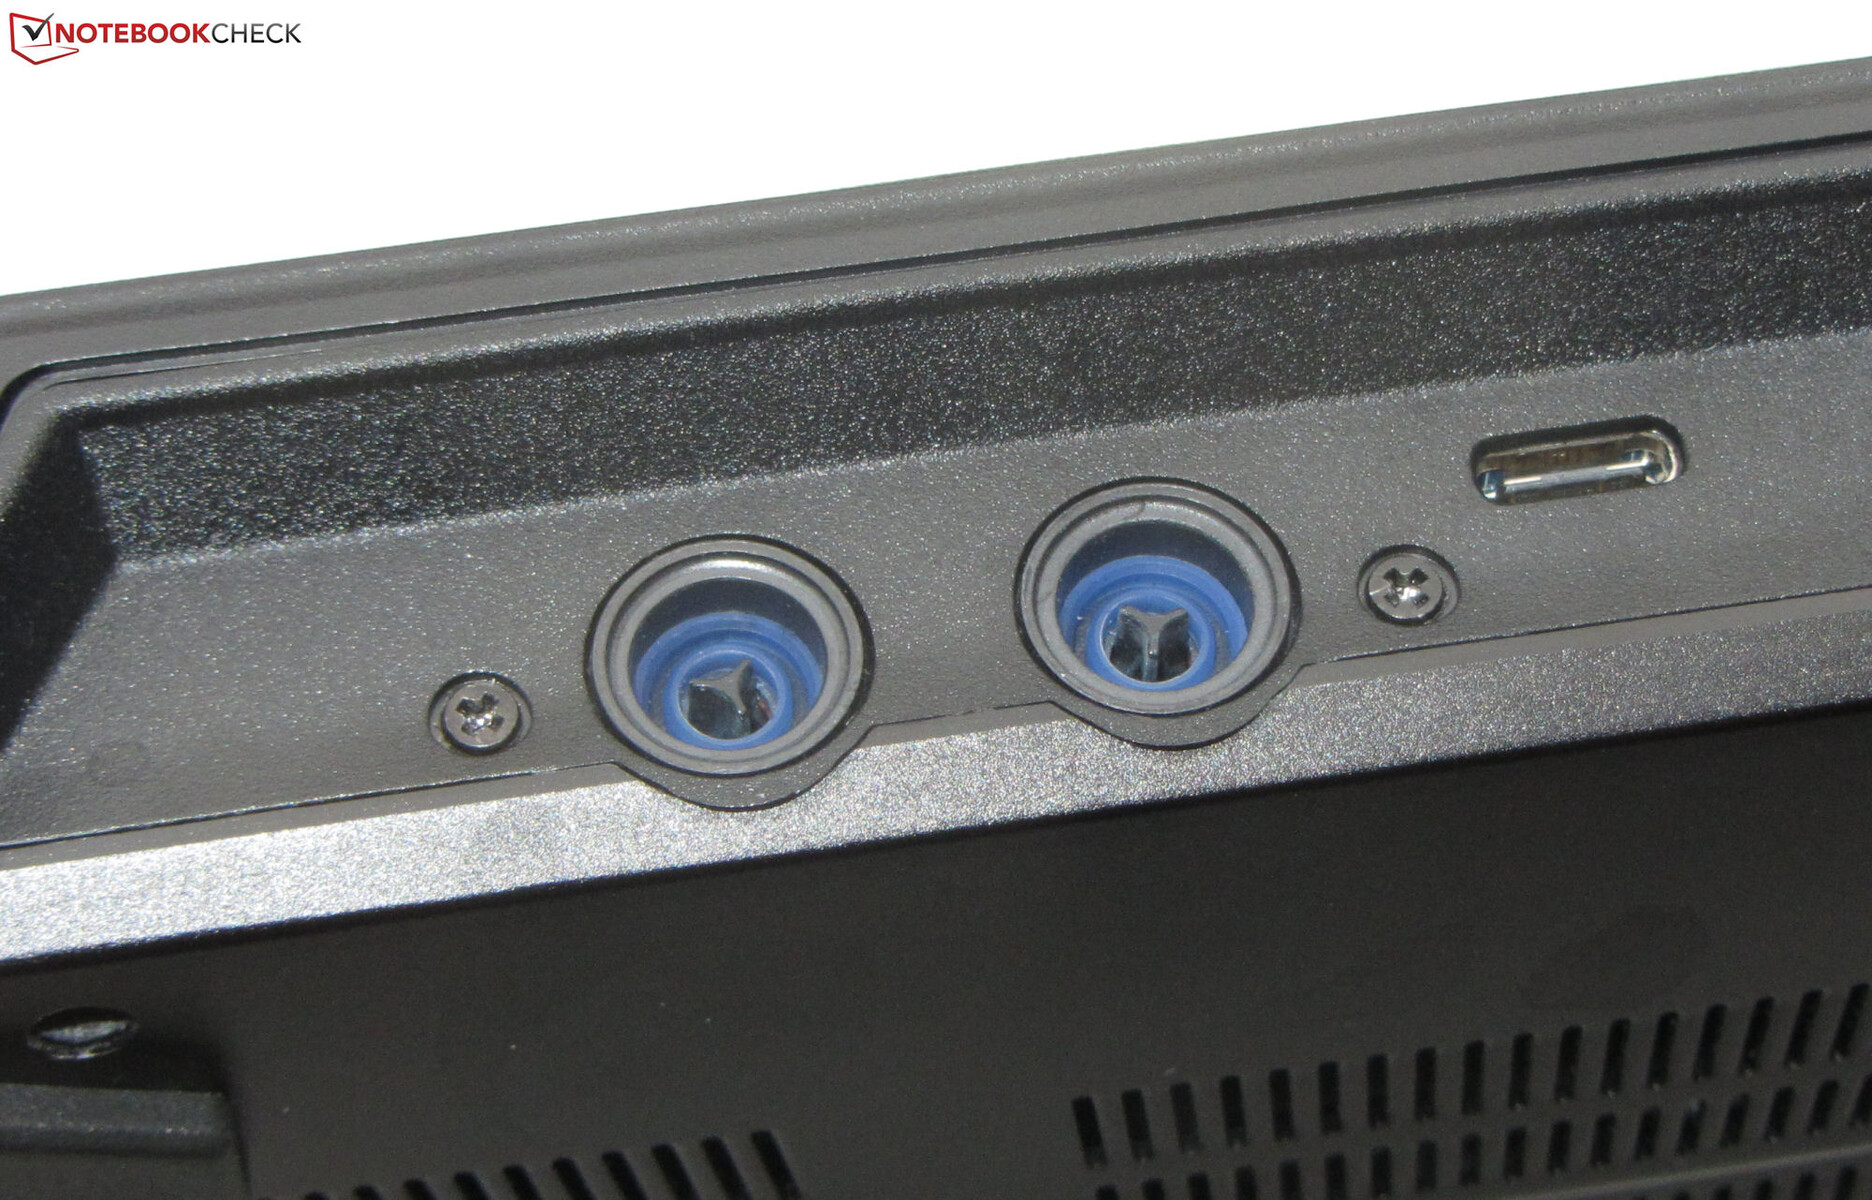
L'Erazer embarque trois ports USB-A (2x USB 3.2 Gen 1, 1x USB 3.2 Gen 2) et un port USB-C (Thunderbolt 4). Ce dernier ne prend pas en charge Power Delivery mais est capable de sortir des signaux DisplayPort. L'ordinateur portable dispose au total de deux sorties vidéo (HDMI 2.1, DP), de deux prises audio (casque et entrée micro), d'un port Gigabit Ethernet et d'un emplacement Kensington. À l'arrière, vous trouverez également des connecteurs pour la solution optionnelle de refroidissement par eau.
Lecteur de carte SD
Le lecteur de carte SD est un modèle à vitesse moyenne qui, associé à notre carte de référence AV Pro microSD 128 Go V60, a permis d'atteindre des vitesses allant jusqu'à 77 Mo/s lors du transfert de 250 images JPEG d'environ 5 Mo chacune et 86 Mo/s lors de la copie de gros volumes de données.
| SD Card Reader | |
| average JPG Copy Test (av. of 3 runs) | |
| Alienware x17 R2 P48E (AV Pro V60) | |
| Moyenne de la classe Gaming (20.9 - 210, n=54, 2 dernières années) | |
| Razer Blade 16 Early 2023 (AV PRO microSD 128 GB V60) | |
| MSI Titan GT77 HX 13VI (Angelibird AV Pro V60) | |
| Medion Erazer Beast X40 (AV PRO microSD 128 GB V60) | |
| Schenker XMG Neo 17 M22 (AV PRO microSD 128 GB V60) | |
| maximum AS SSD Seq Read Test (1GB) | |
| Alienware x17 R2 P48E (AV Pro V60) | |
| Razer Blade 16 Early 2023 (AV PRO microSD 128 GB V60) | |
| Moyenne de la classe Gaming (25.5 - 261, n=51, 2 dernières années) | |
| MSI Titan GT77 HX 13VI (Angelibird AV Pro V60) | |
| Medion Erazer Beast X40 (AV PRO microSD 128 GB V60) | |
Connectivité
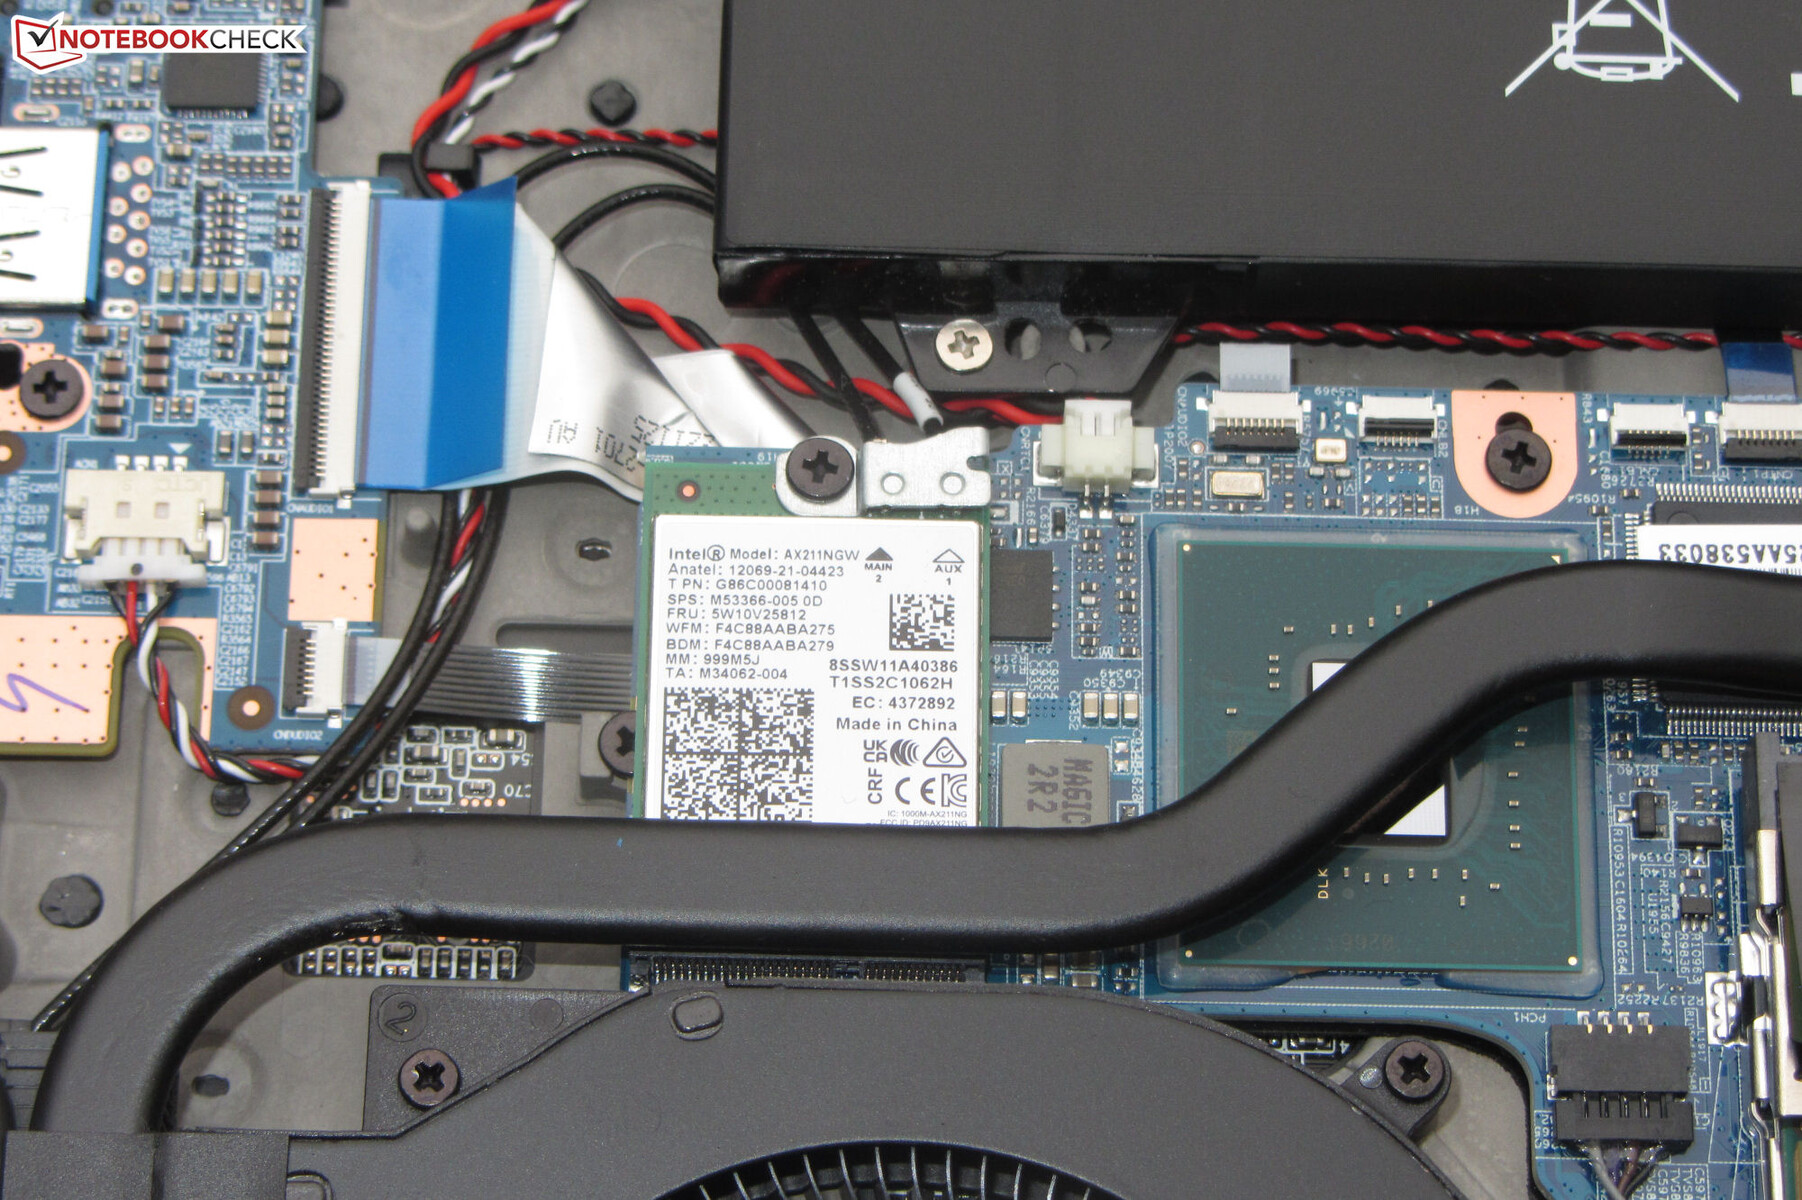
Dans des conditions optimales (pas d'autres appareils Wi-Fi dans l'environnement immédiat, courte distance entre l'ordinateur portable et le PC serveur), l'Erazer a fourni d'excellents taux de transfert par Wi-Fi car Medion a décidé d'opter pour un module Intel AX211 Wi-Fi 6E. Les connexions réseau filaires sont gérées par la puce Ethernet Gigabit Realtek RTL8125, capable de débits allant jusqu'à 2,5 Gbit/s.
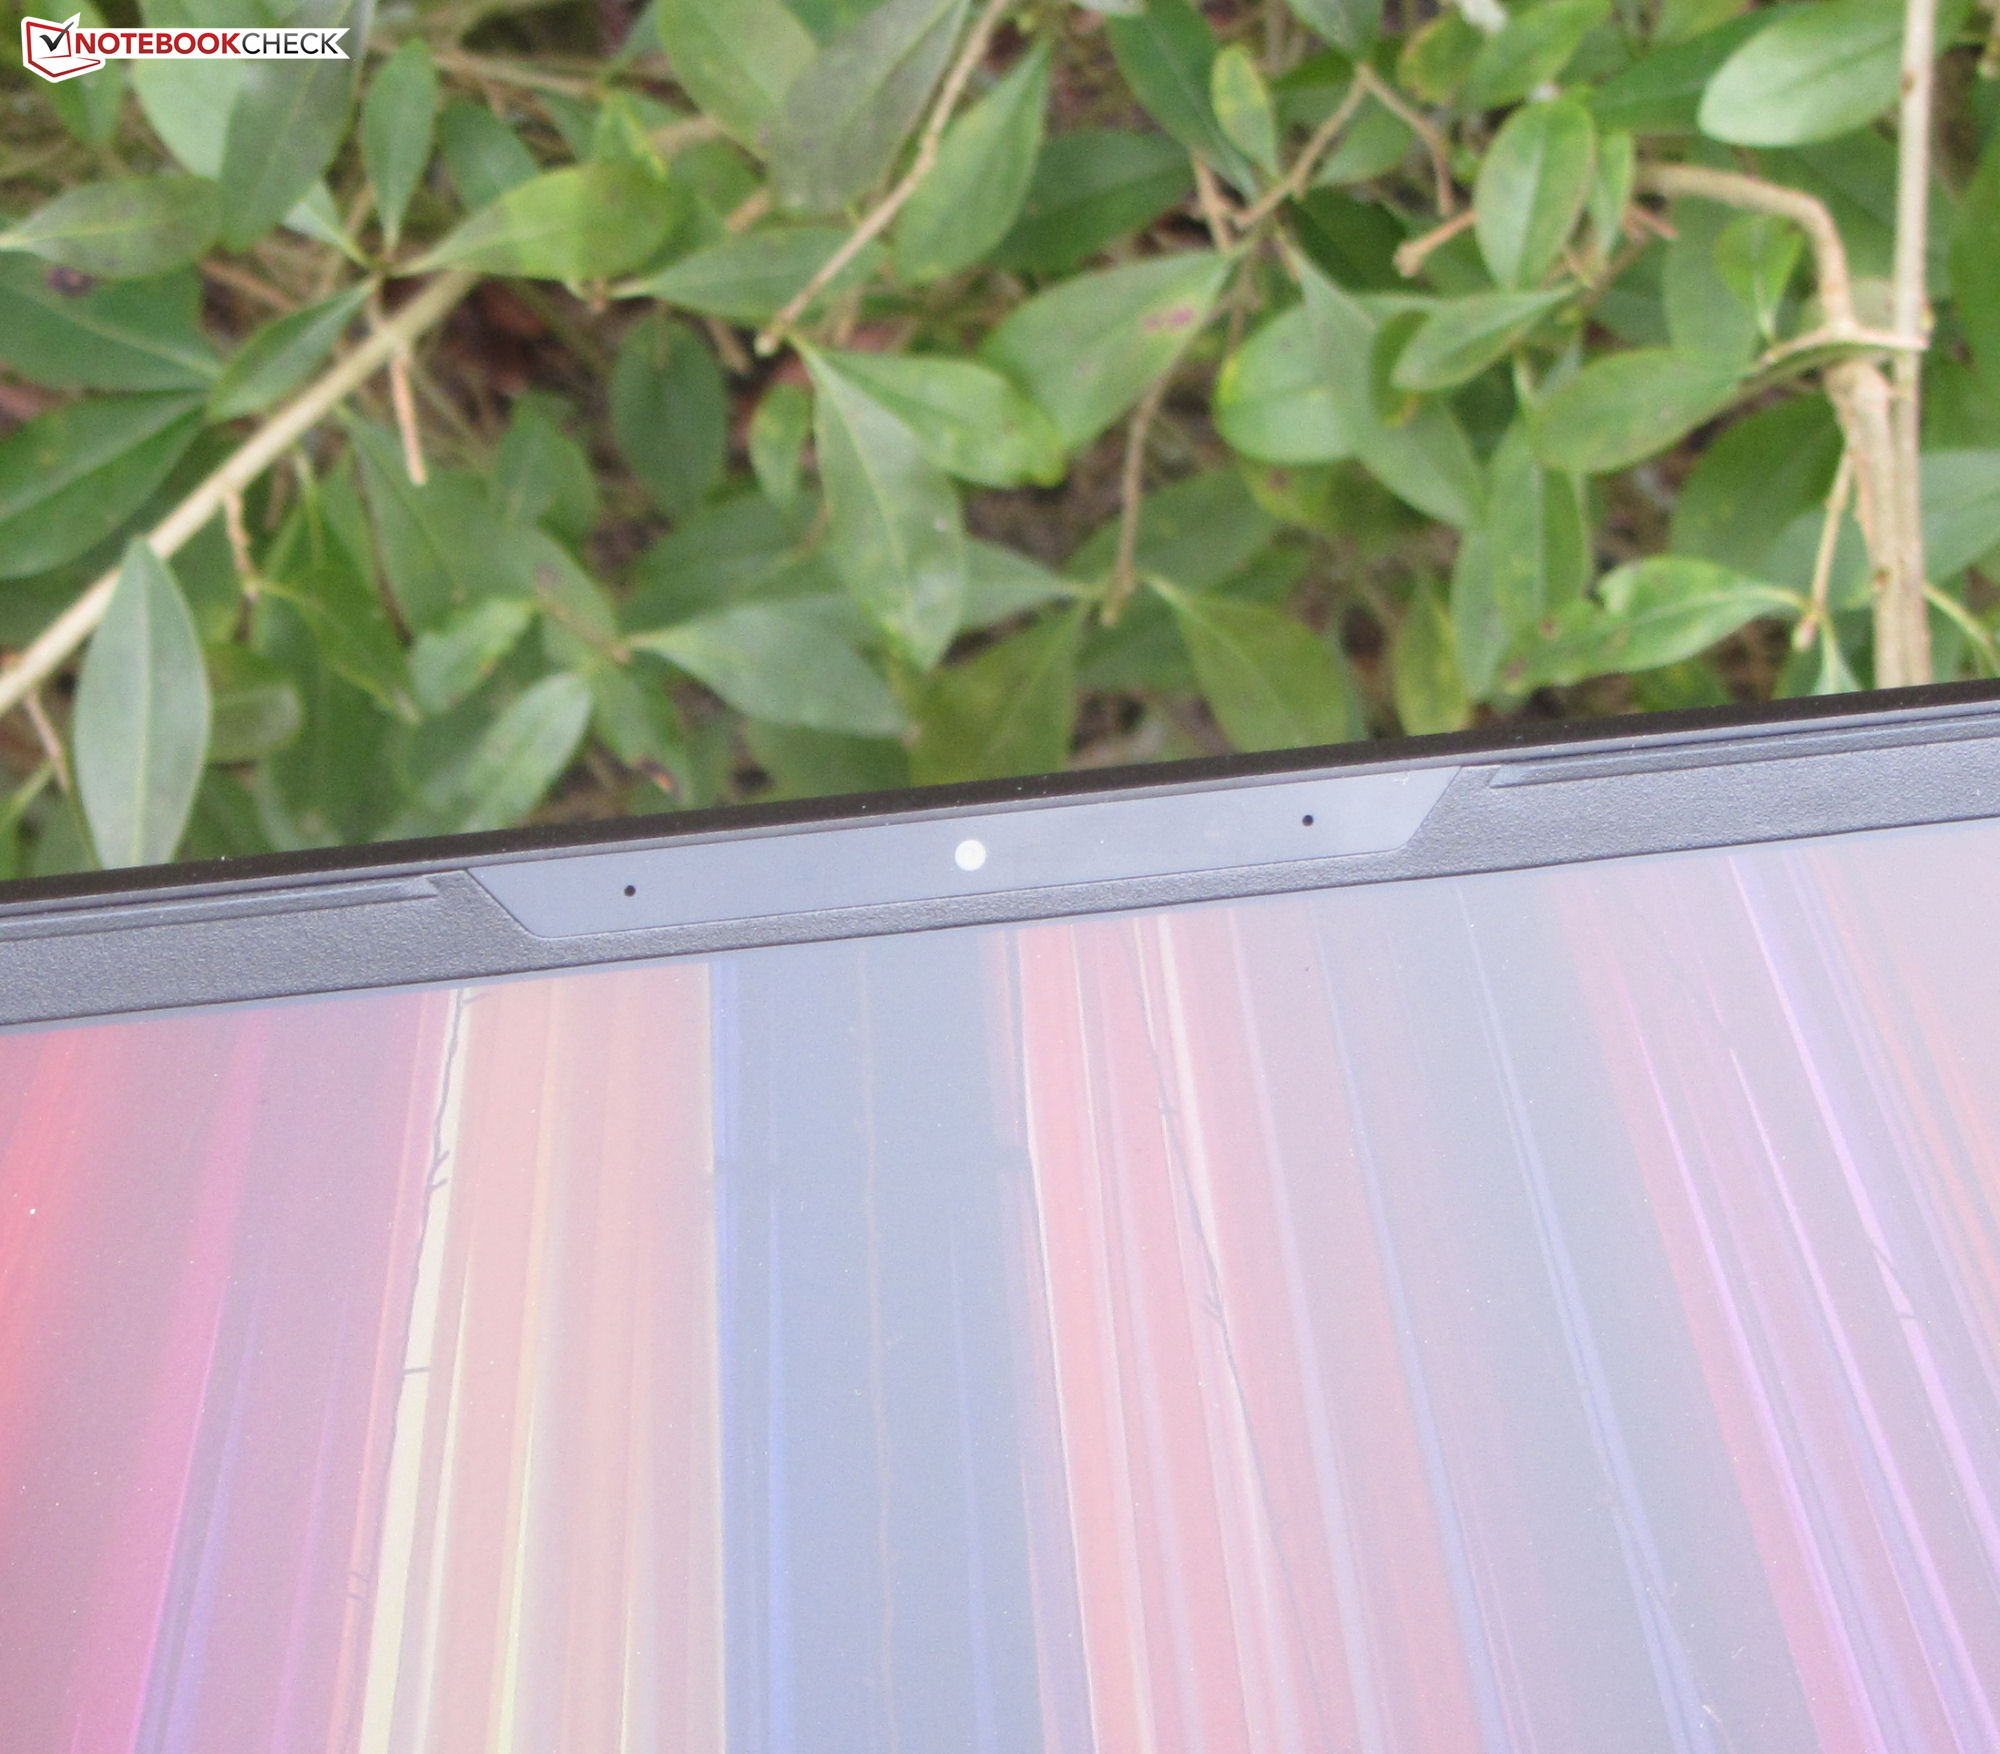
Webcam
La webcam de 2,1 mégapixels capture des images à une résolution maximale de 1 920 x 1 080. Elle manque de précision au niveau des couleurs : les couleurs produites par la caméra s'écartent considérablement des couleurs de référence. La webcam n'est pas équipée d'un obturateur mécanique.


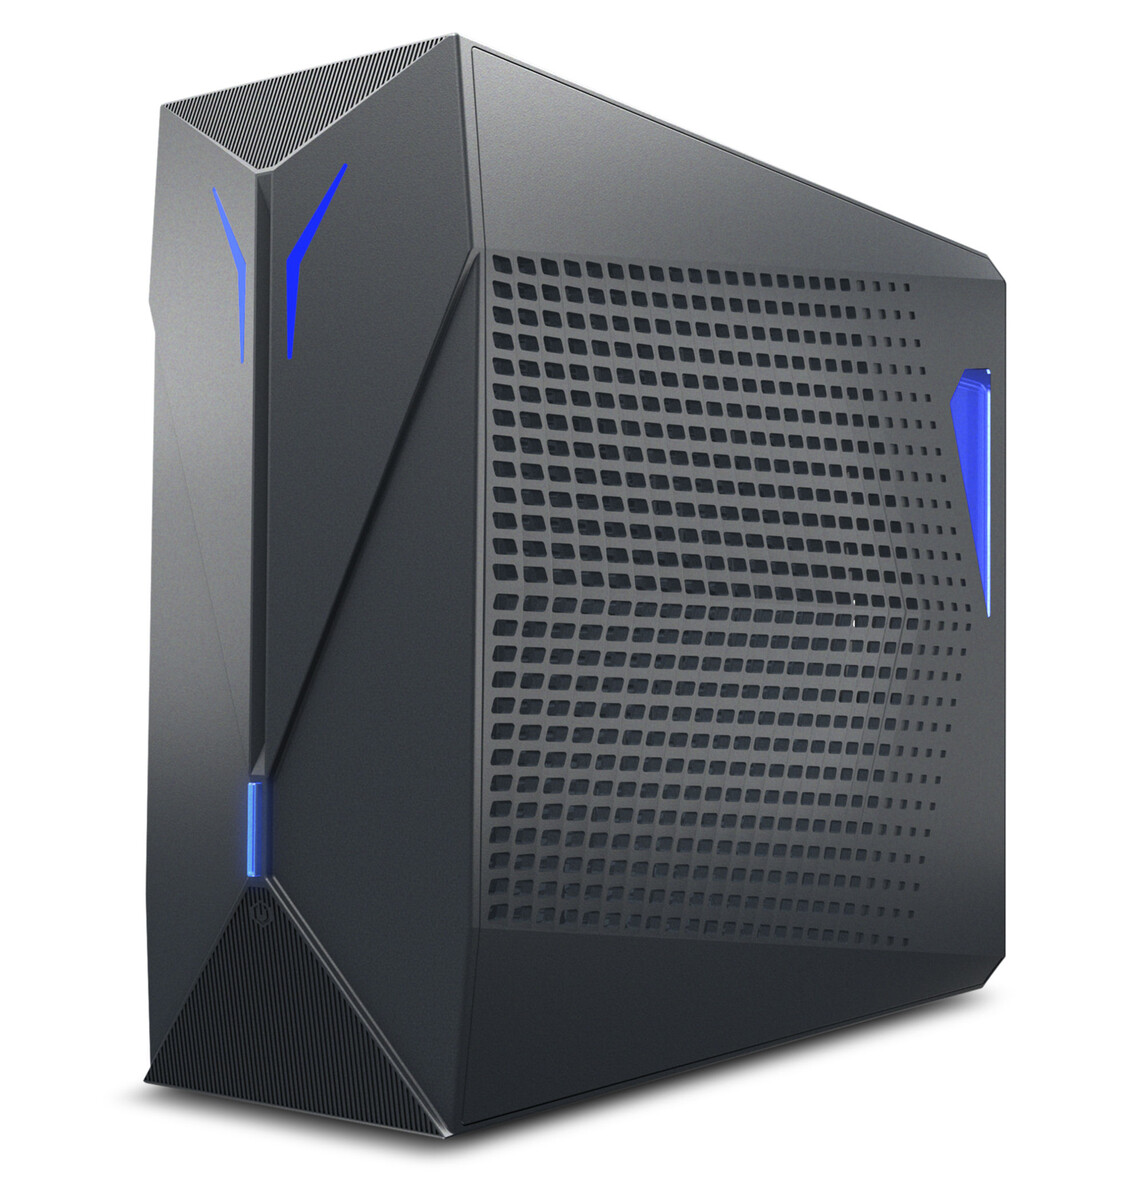
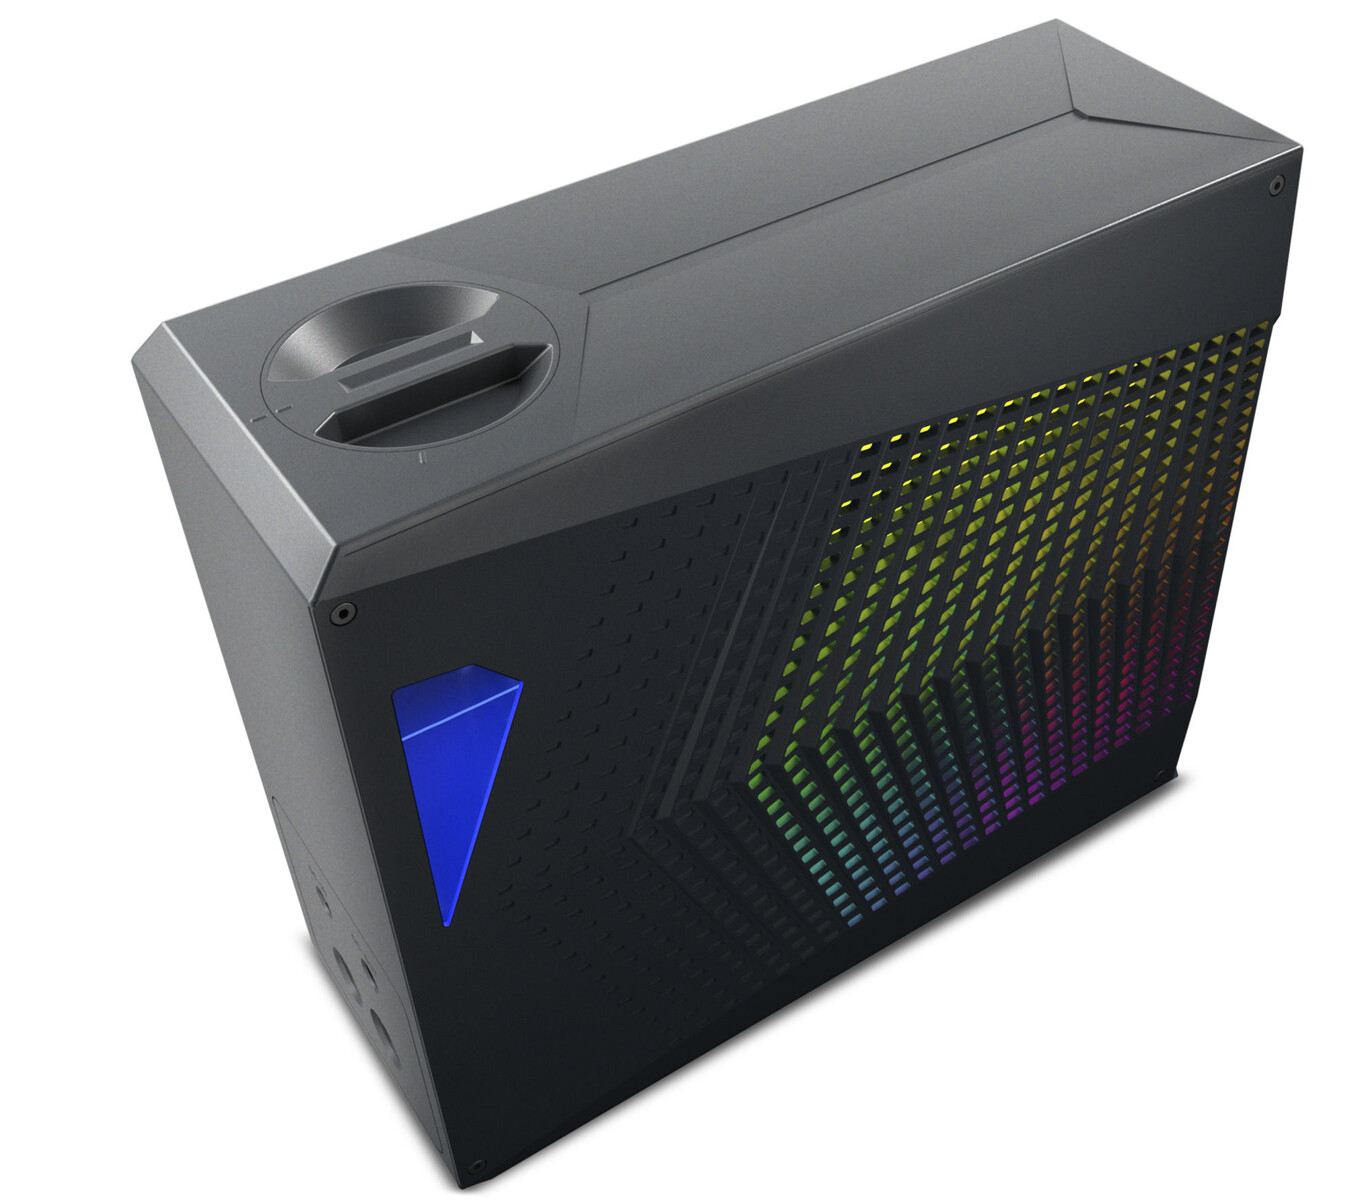
Accessoires
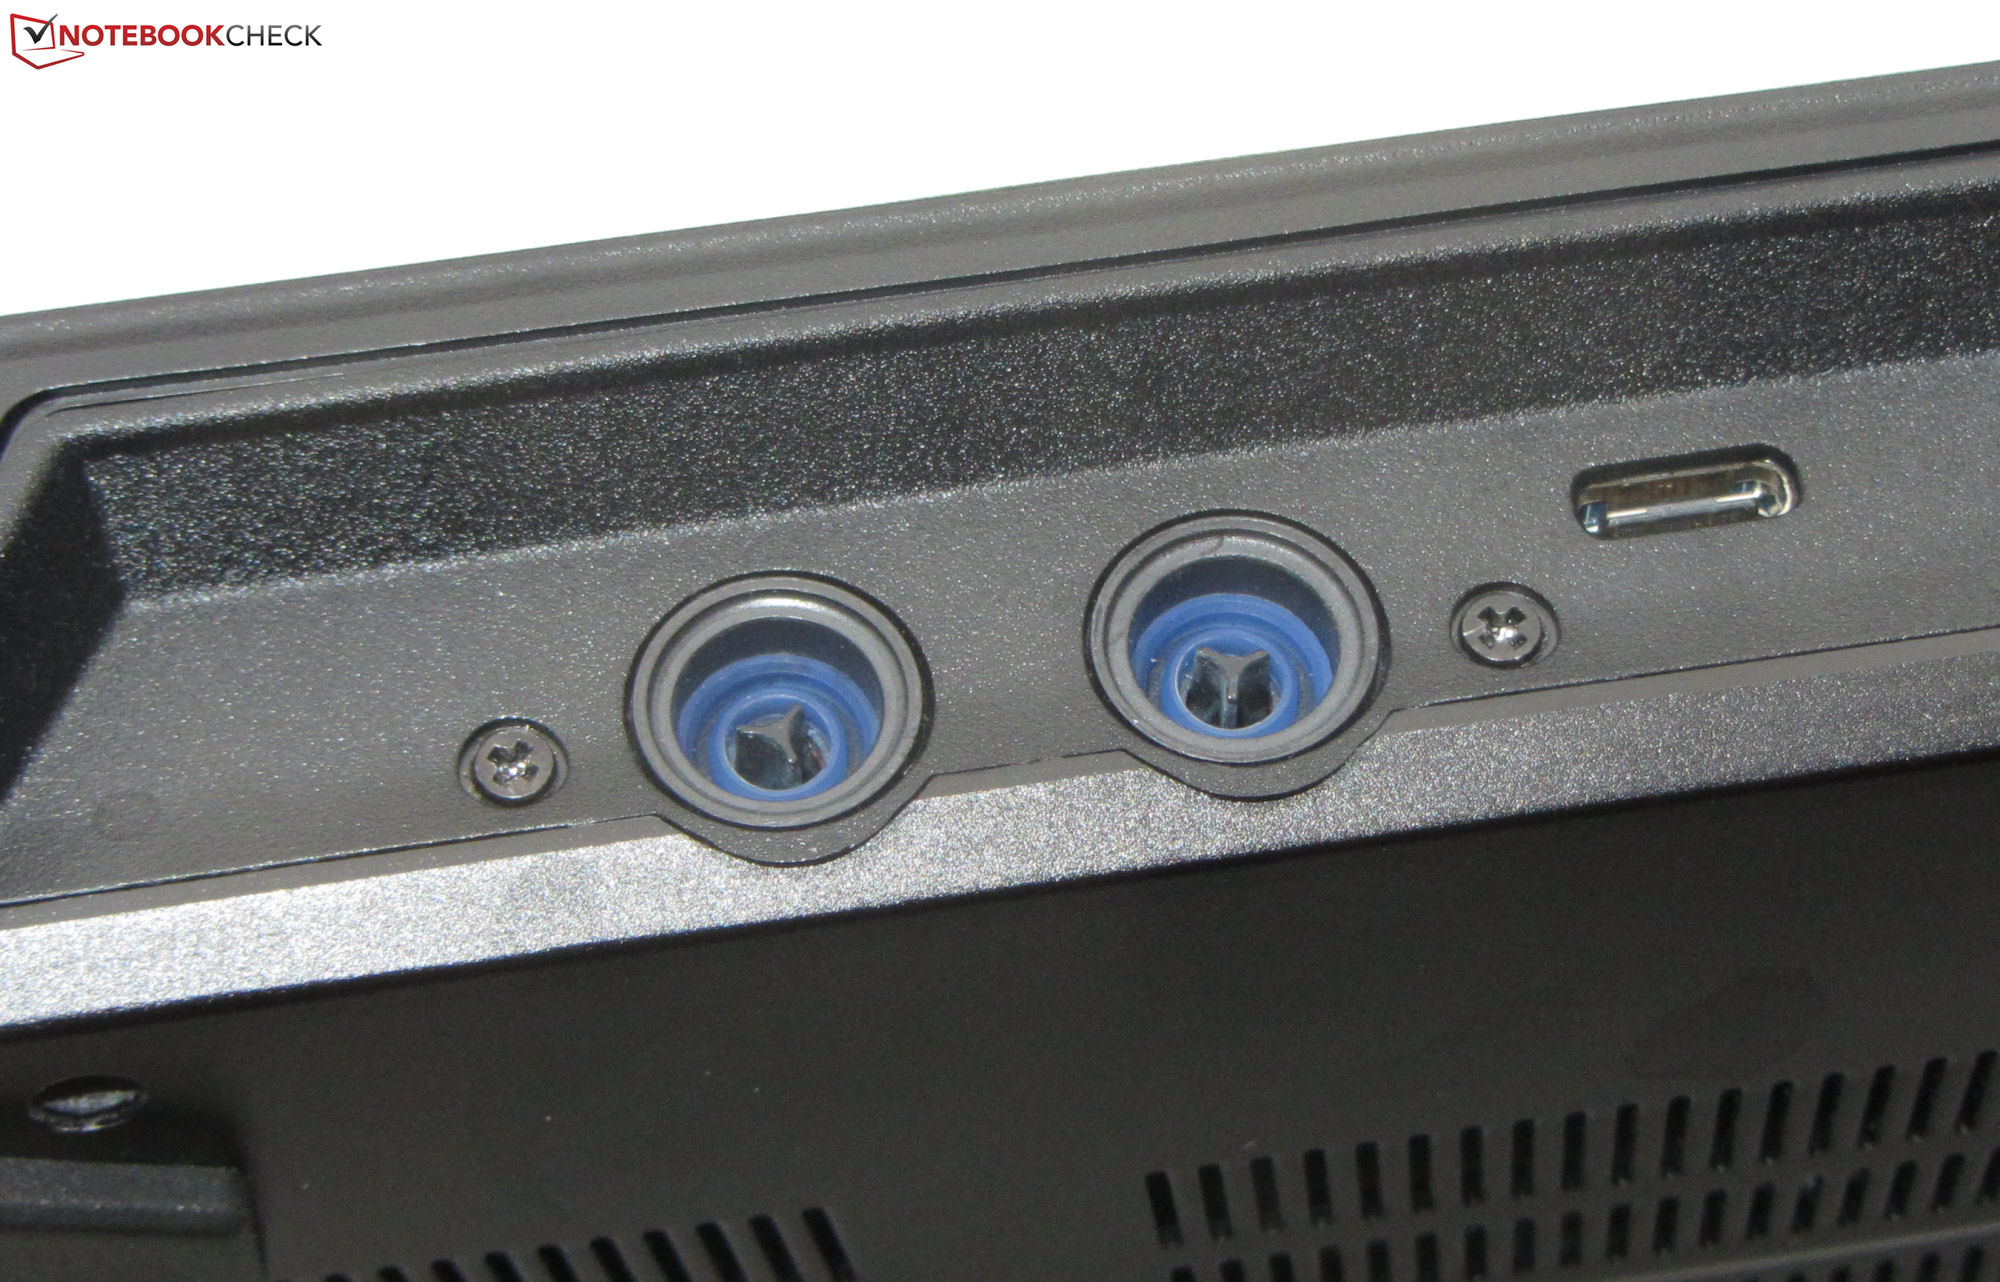
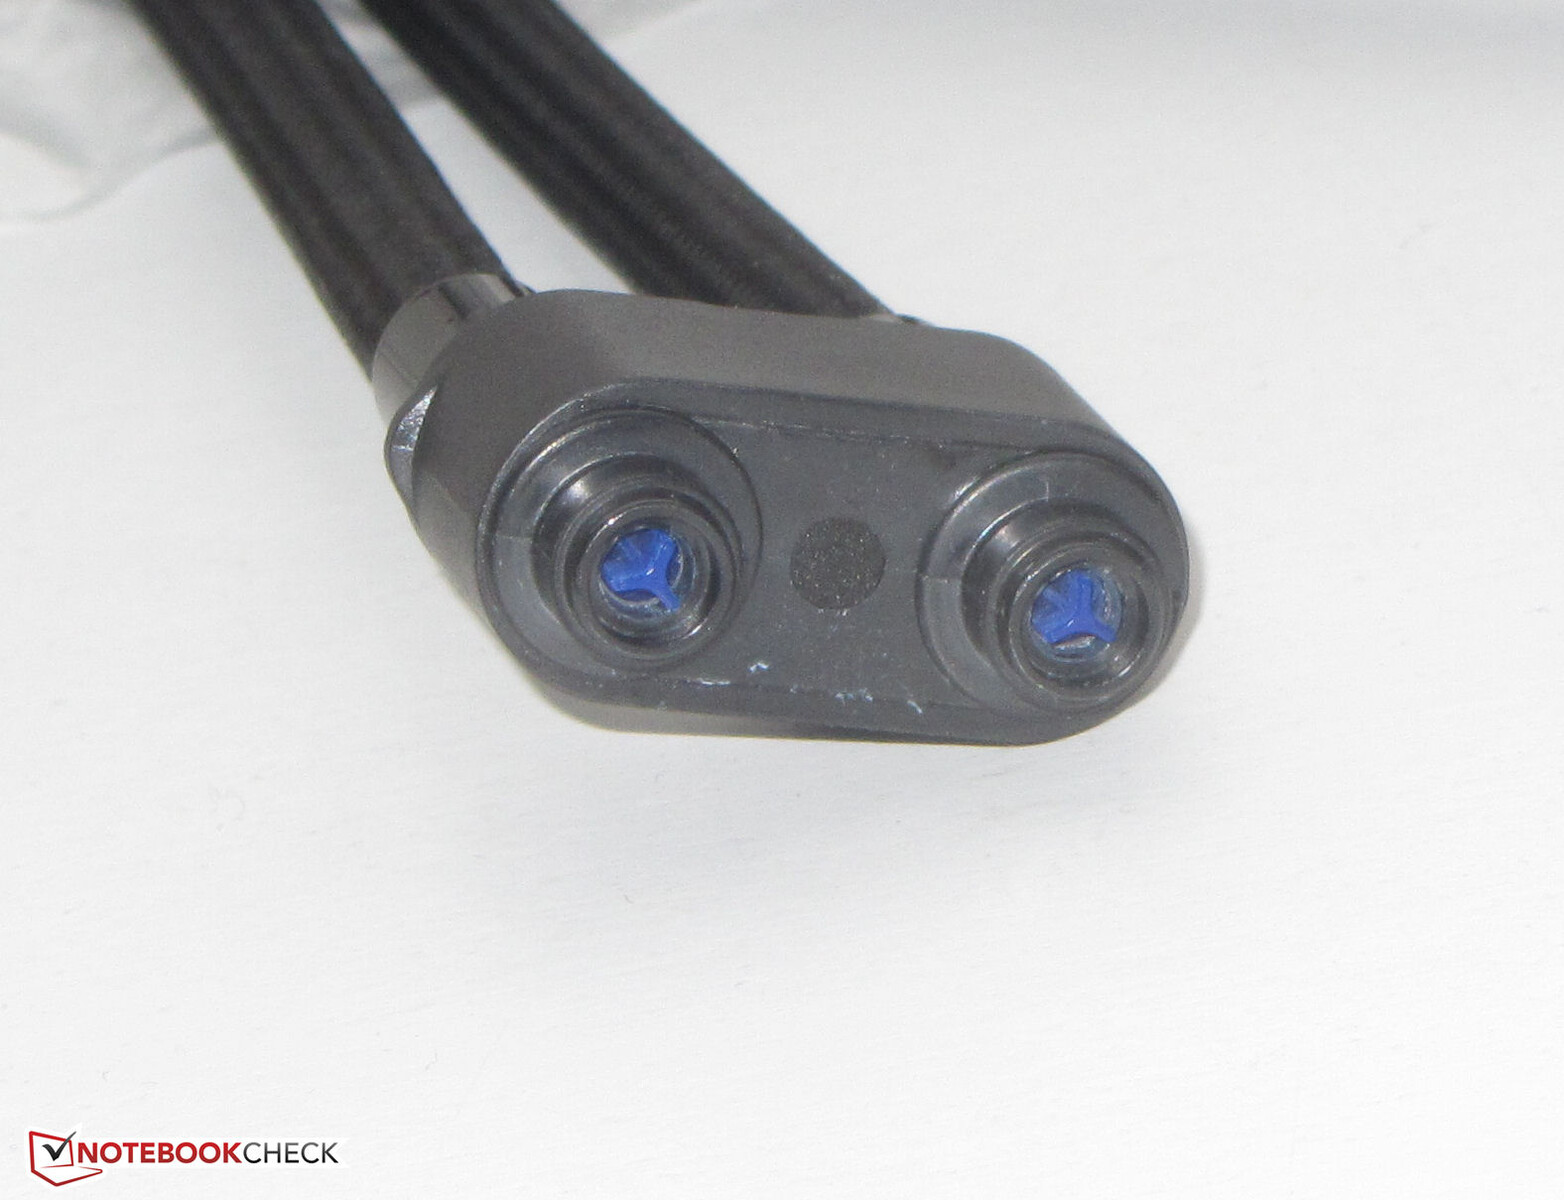
L'ordinateur portable est livré sans autres accessoires que la documentation habituelle et un adaptateur d'alimentation. Medion propose en option une solution de refroidissement à l'eau externe au prix d'environ 250 € (270 $ US), que la société nous a également fournie pour nos tests.
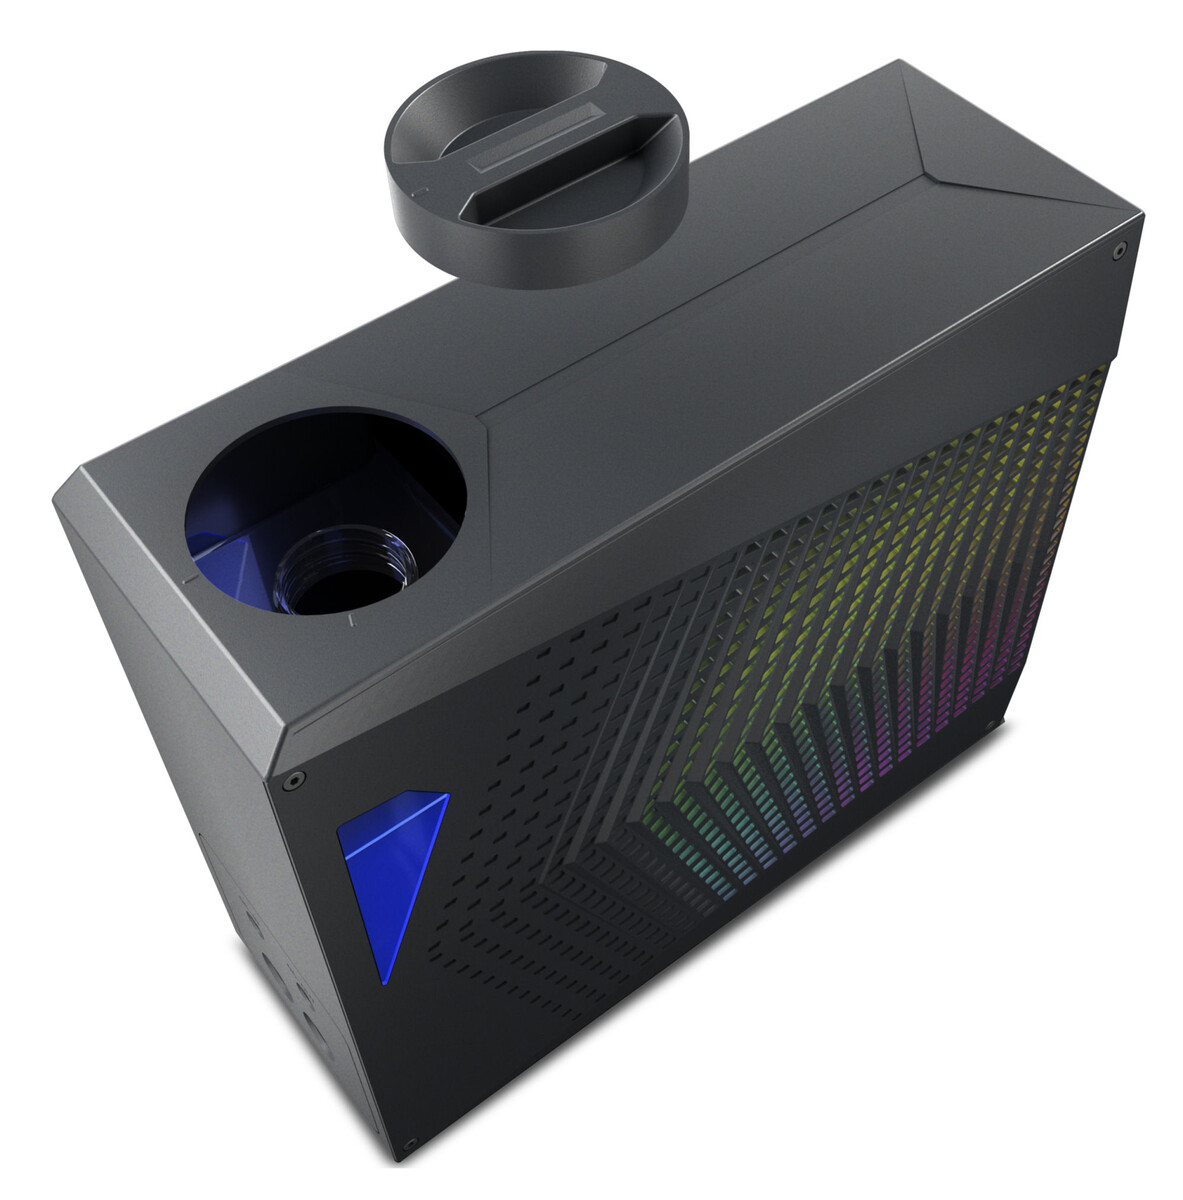
La petite unité de refroidissement est assez facile à utiliser : il suffit de la remplir d'eau distillée, de connecter les câbles et les tubes, et de l'allumer. L'ordinateur portable et l'unité de refroidissement externe communiquent par Bluetooth et la connexion s'établit automatiquement. Le chargeur de l'ordinateur portable alimente le X40 et l'unité de refroidissement. Les tubes d'eau sont maintenus en place magnétiquement - aucun serrage de vis n'est nécessaire. Cependant, quelques gouttes d'eau peuvent s'écouler lorsque vous déconnectez les tubes.
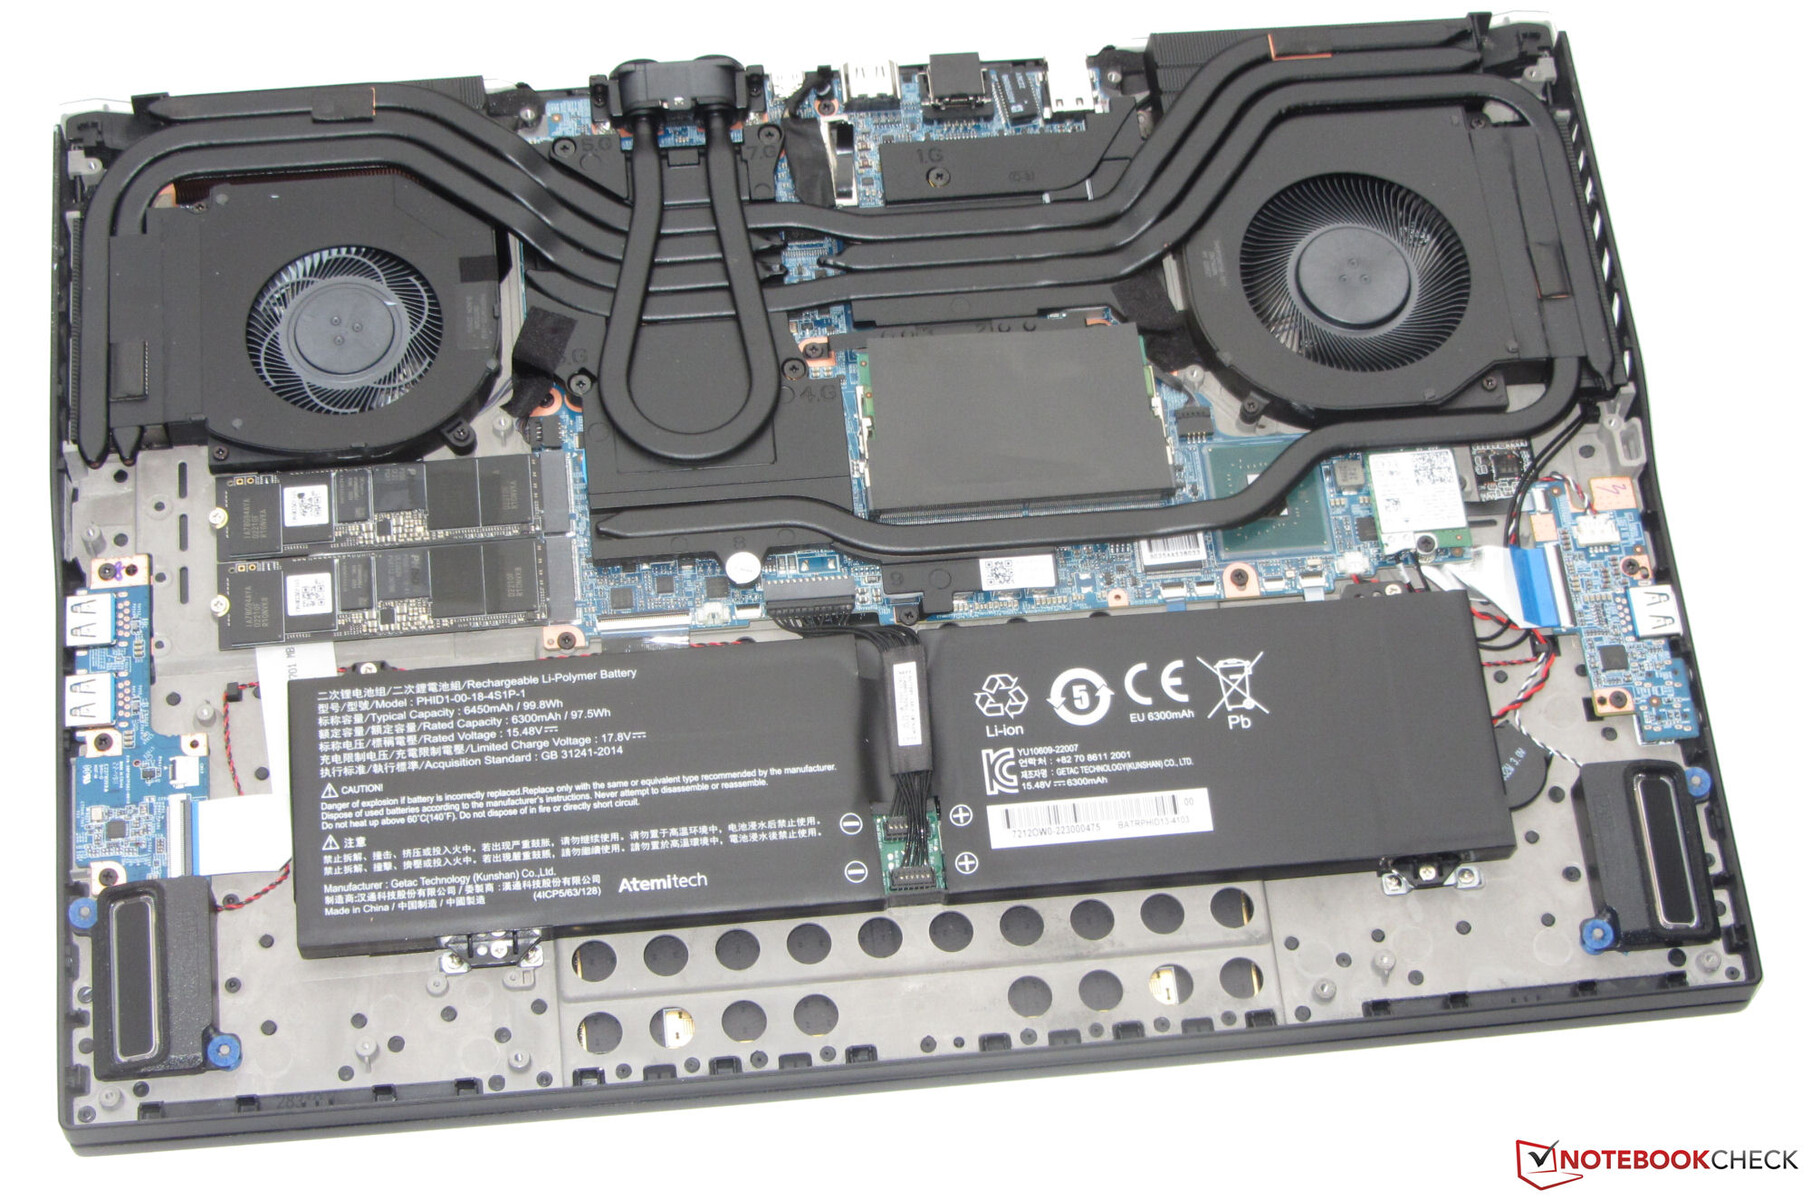
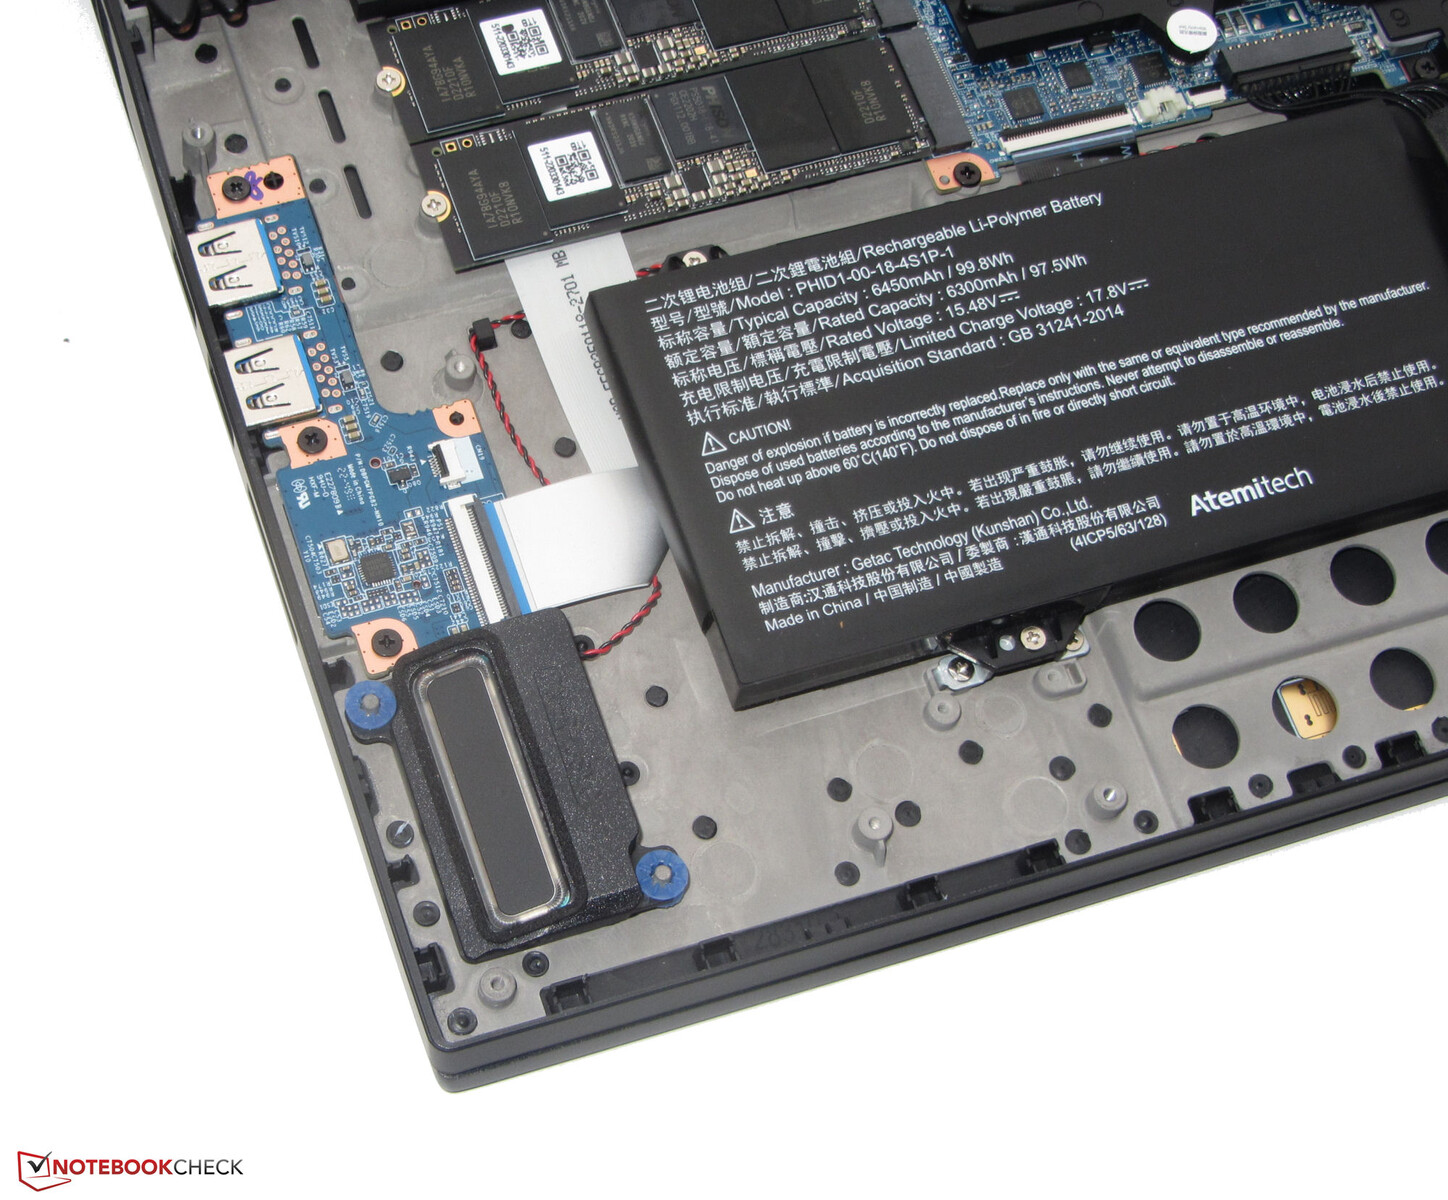
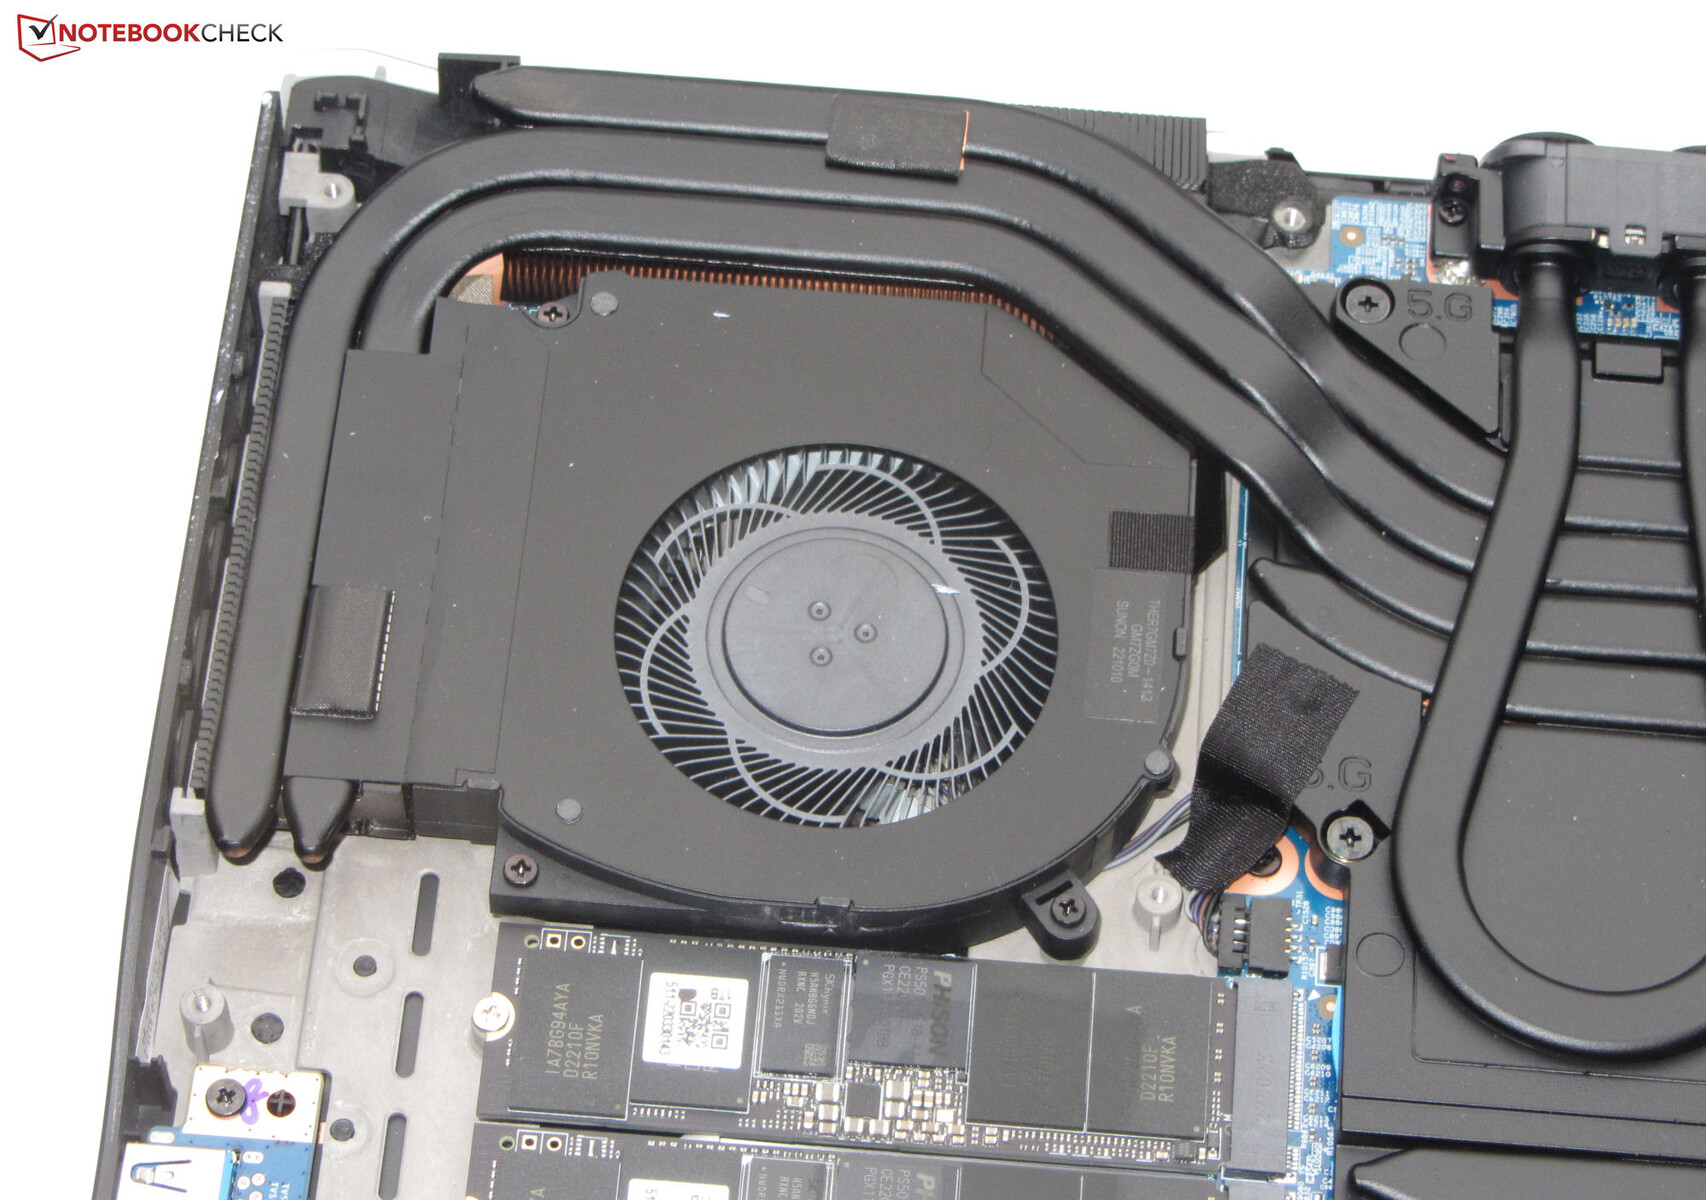
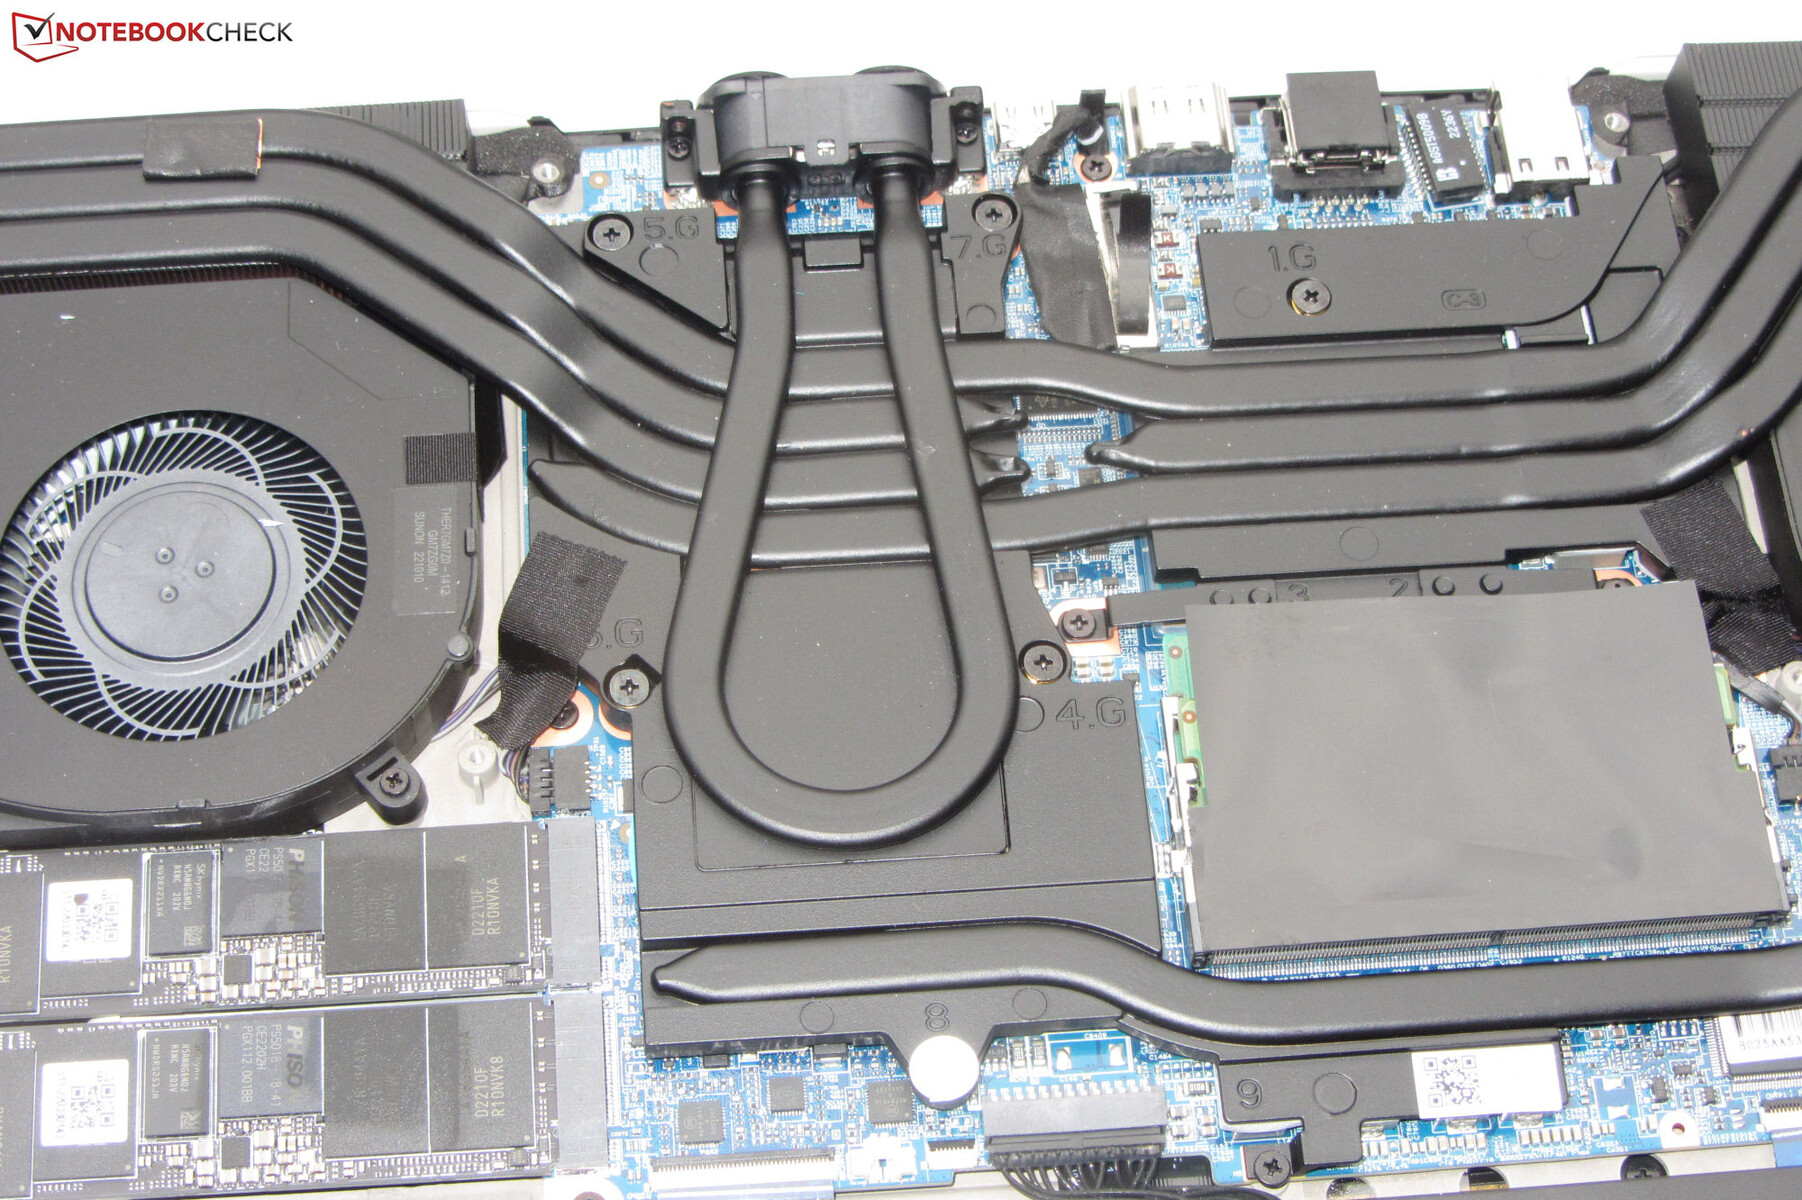
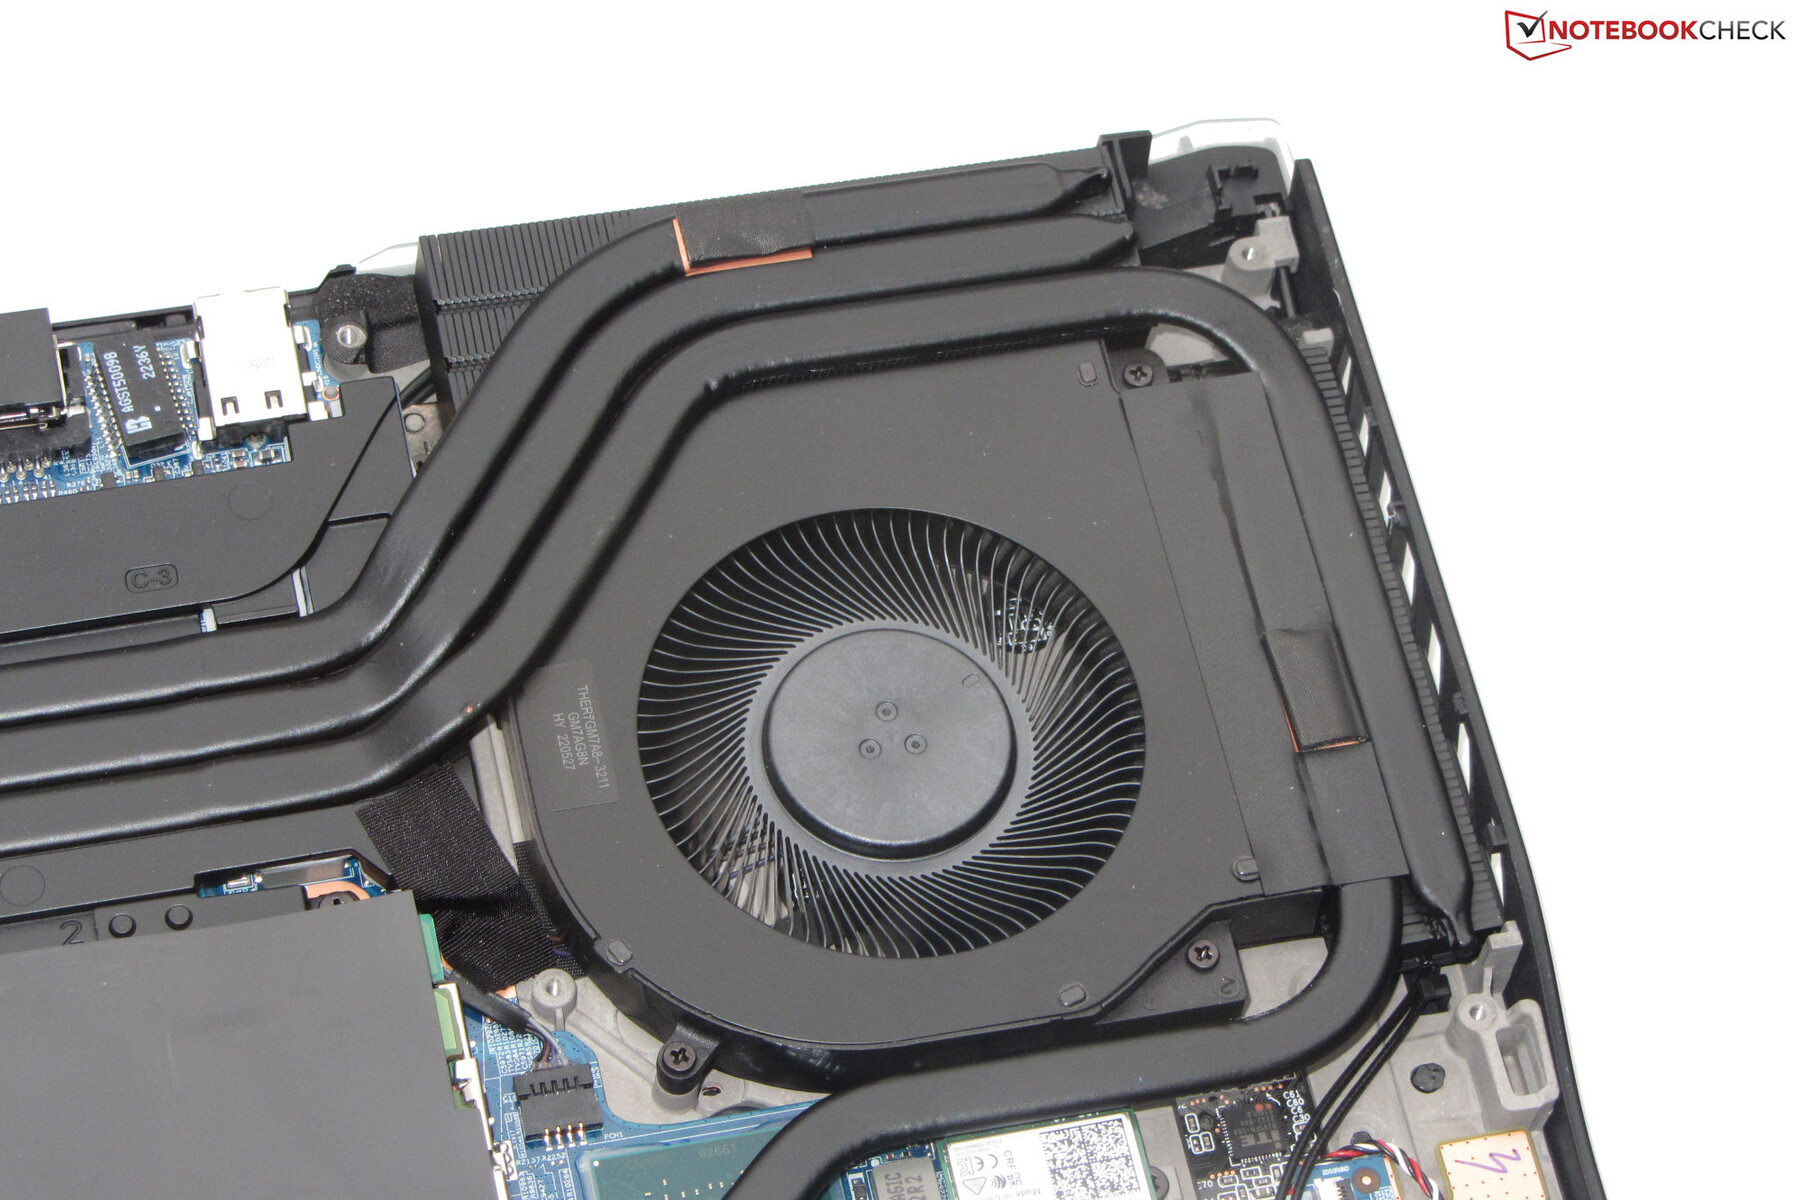
Maintenance
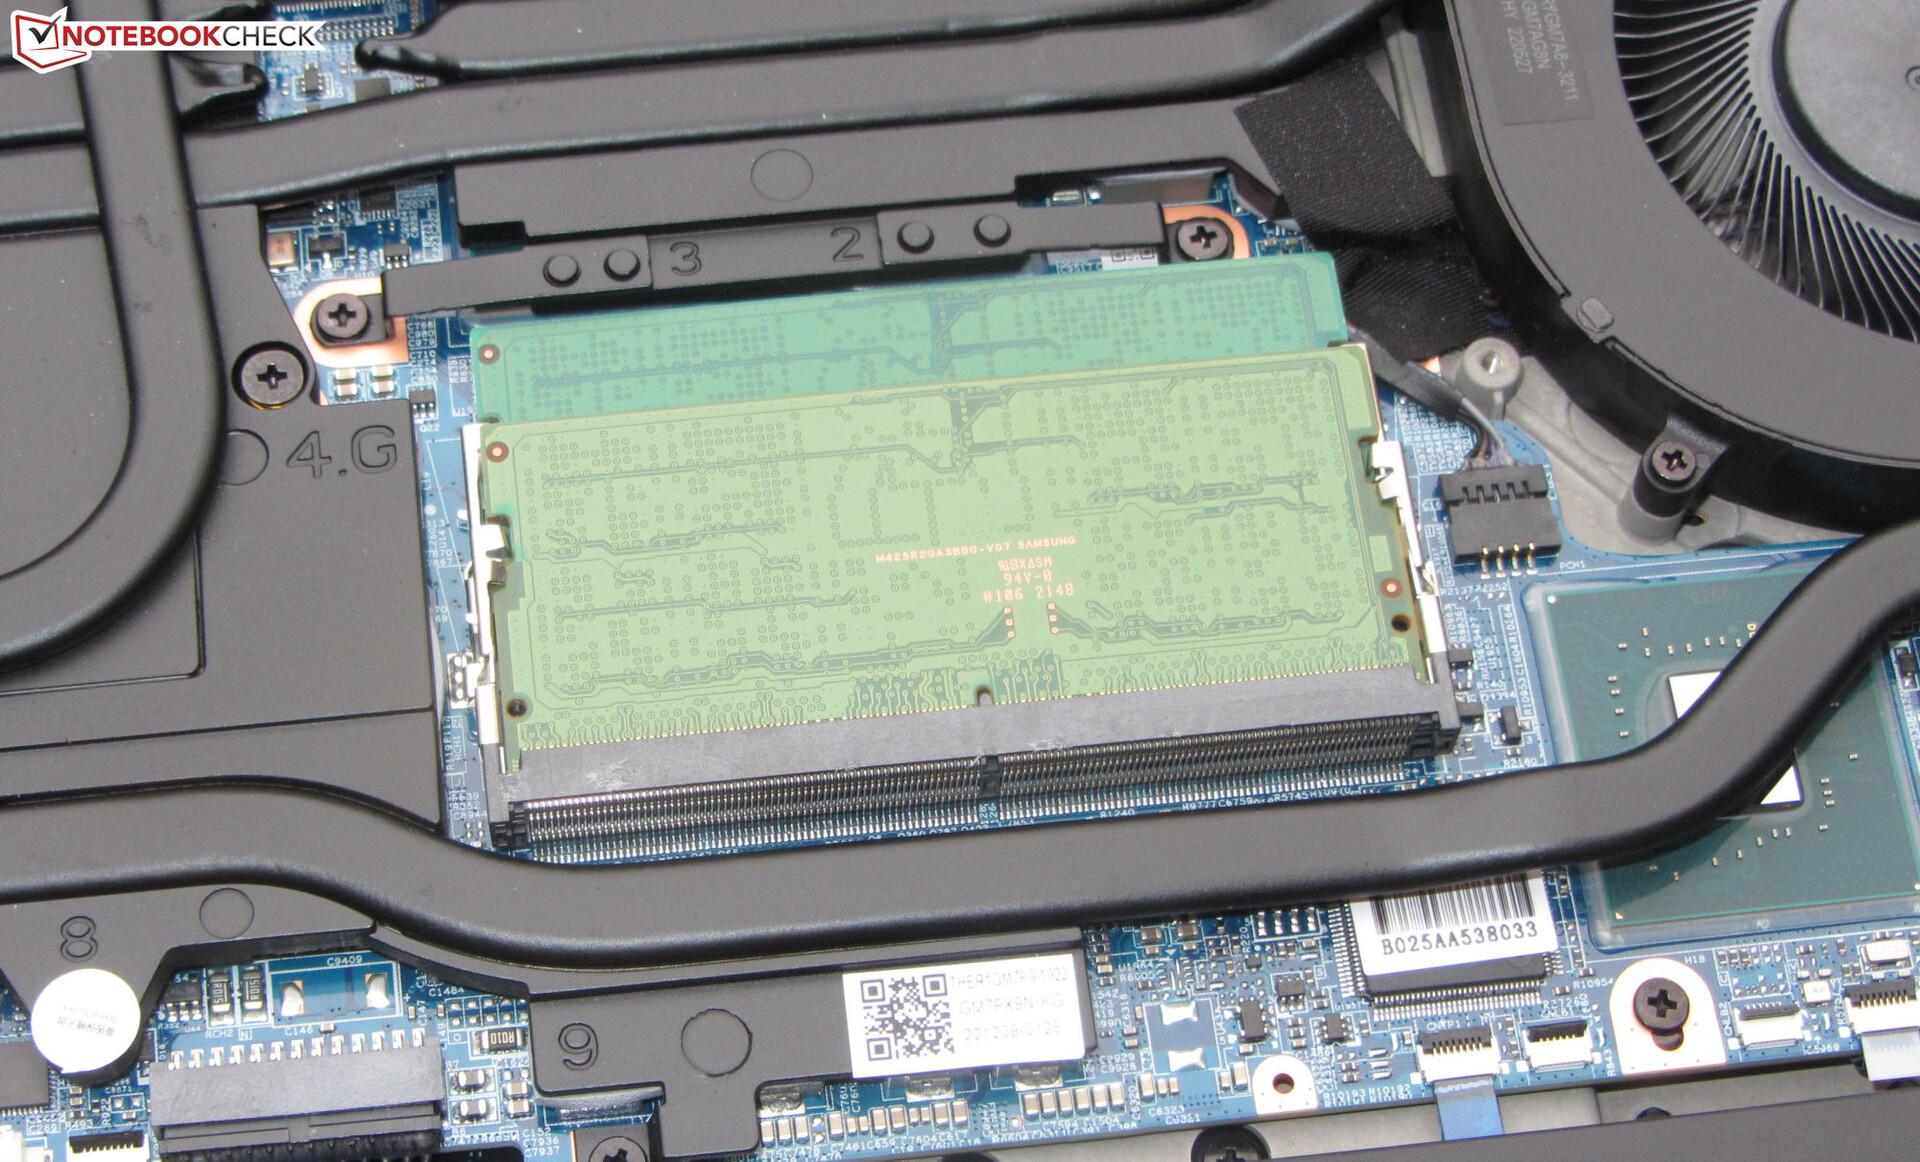
Pour retirer le couvercle inférieur, il faut desserrer toutes les vis sur le dessous ainsi que deux autres vis à l'arrière, à côté des connecteurs de refroidissement de l'eau. Ensuite, le couvercle inférieur peut être retiré d'un mouvement sec par les évents d'échappement. Le retrait du couvercle permet d'accéder aux emplacements mémoire (tous deux utilisés), aux deux SSD PCIe 4.0, au module Wi-Fi, aux ventilateurs, à la batterie BIOS et à la batterie rechargeable.
Garantie
Medion offre une garantie de deux ans sur l'Erazer. Des options de mise à niveau sont disponibles, mais elles doivent être achetées en même temps que l'ordinateur portable dans la boutique en ligne de Medion. Il n'est pas possible de mettre à niveau ou d'étendre la garantie après l'achat de l'ordinateur portable. L'extension d'un an de la garantie coûte près de 200 euros (216 dollars américains).
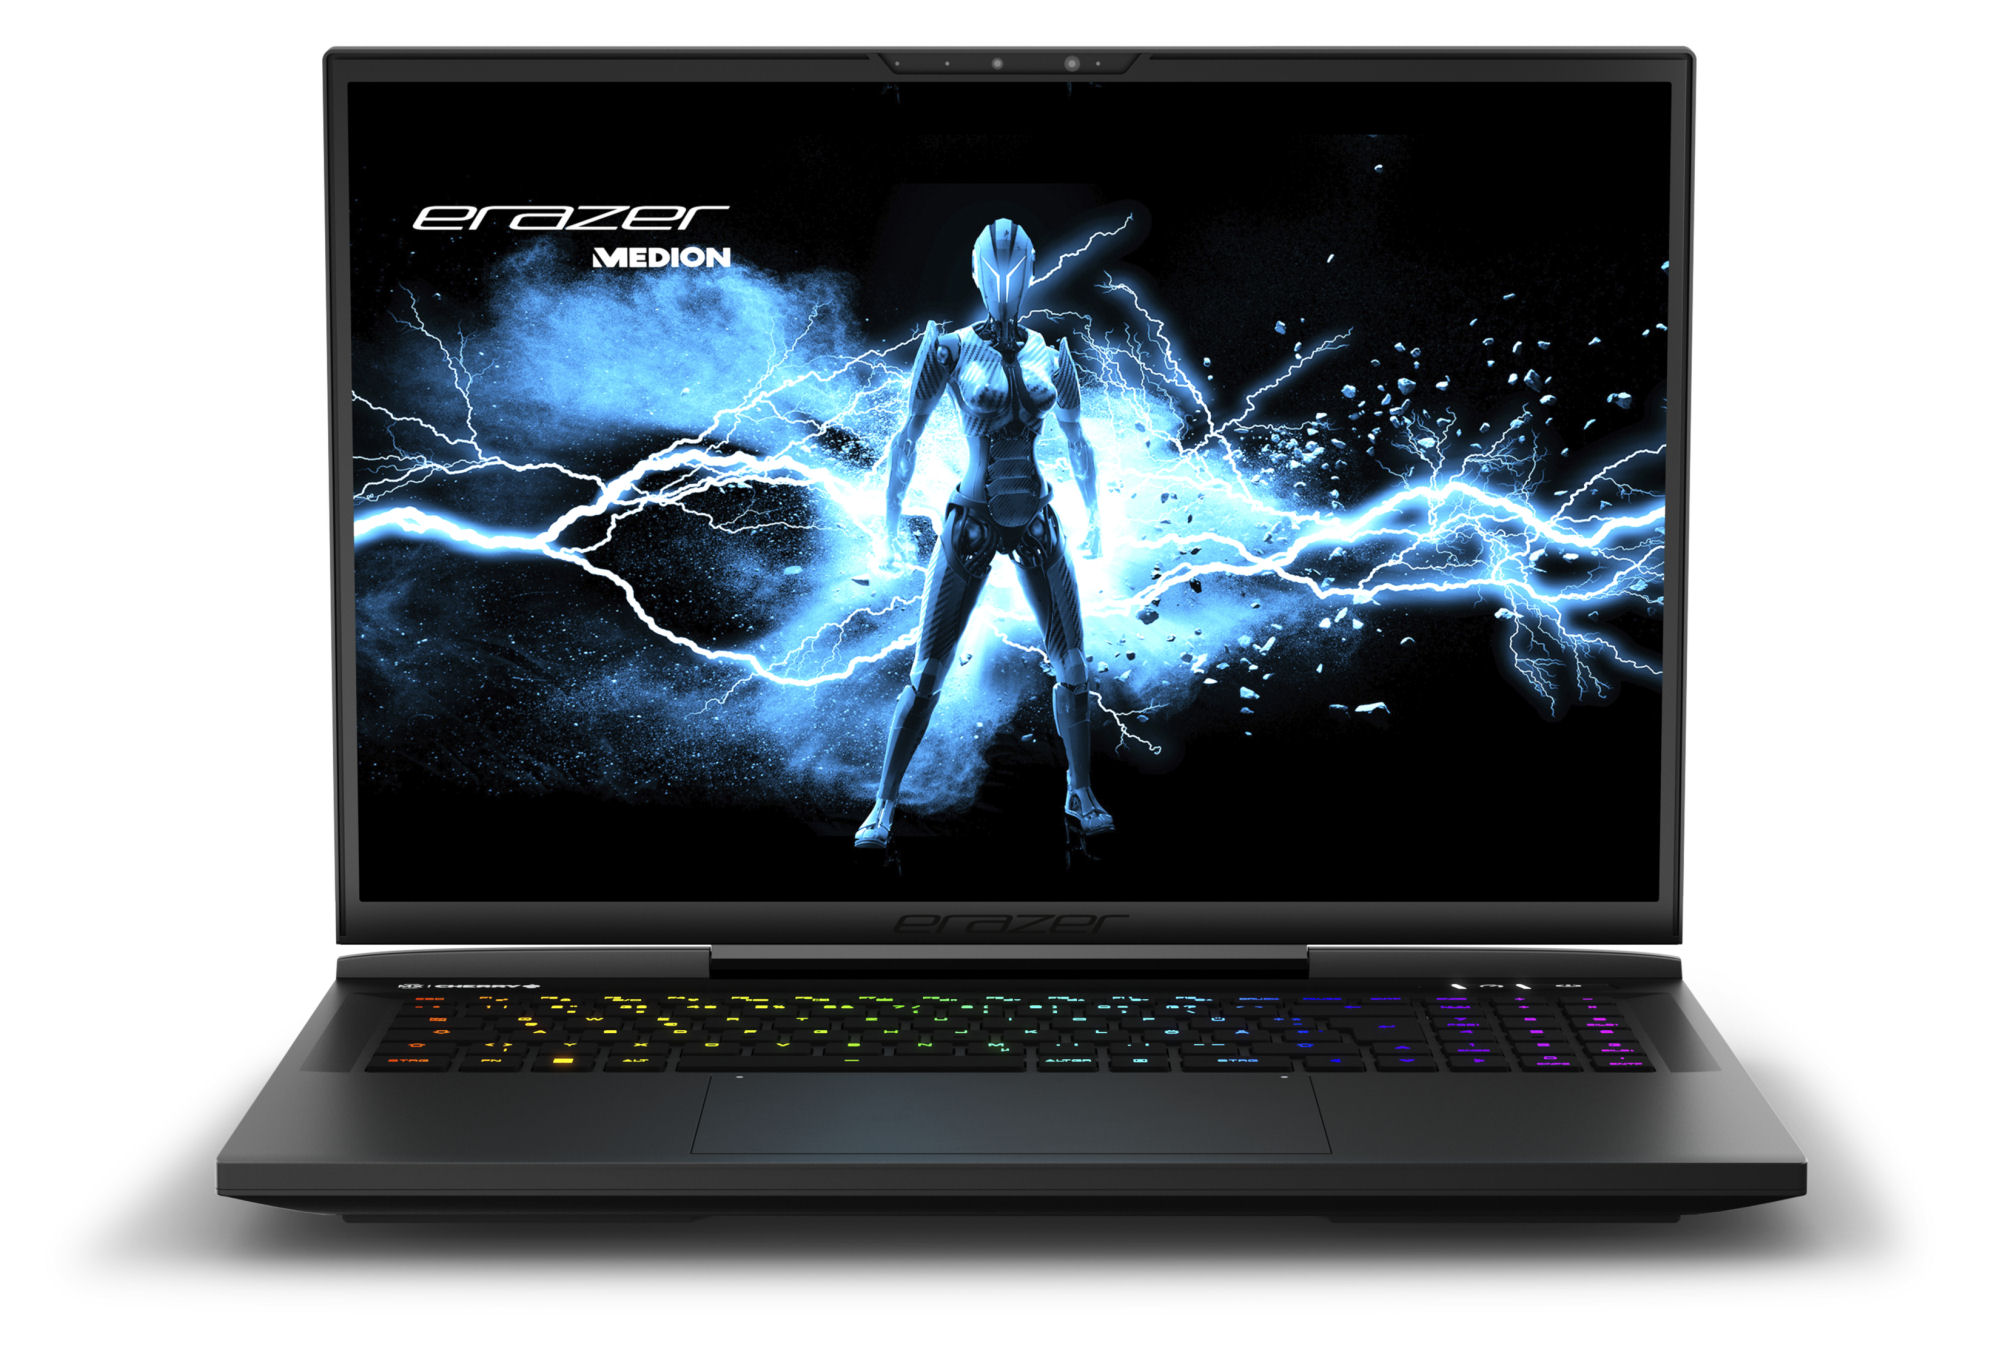
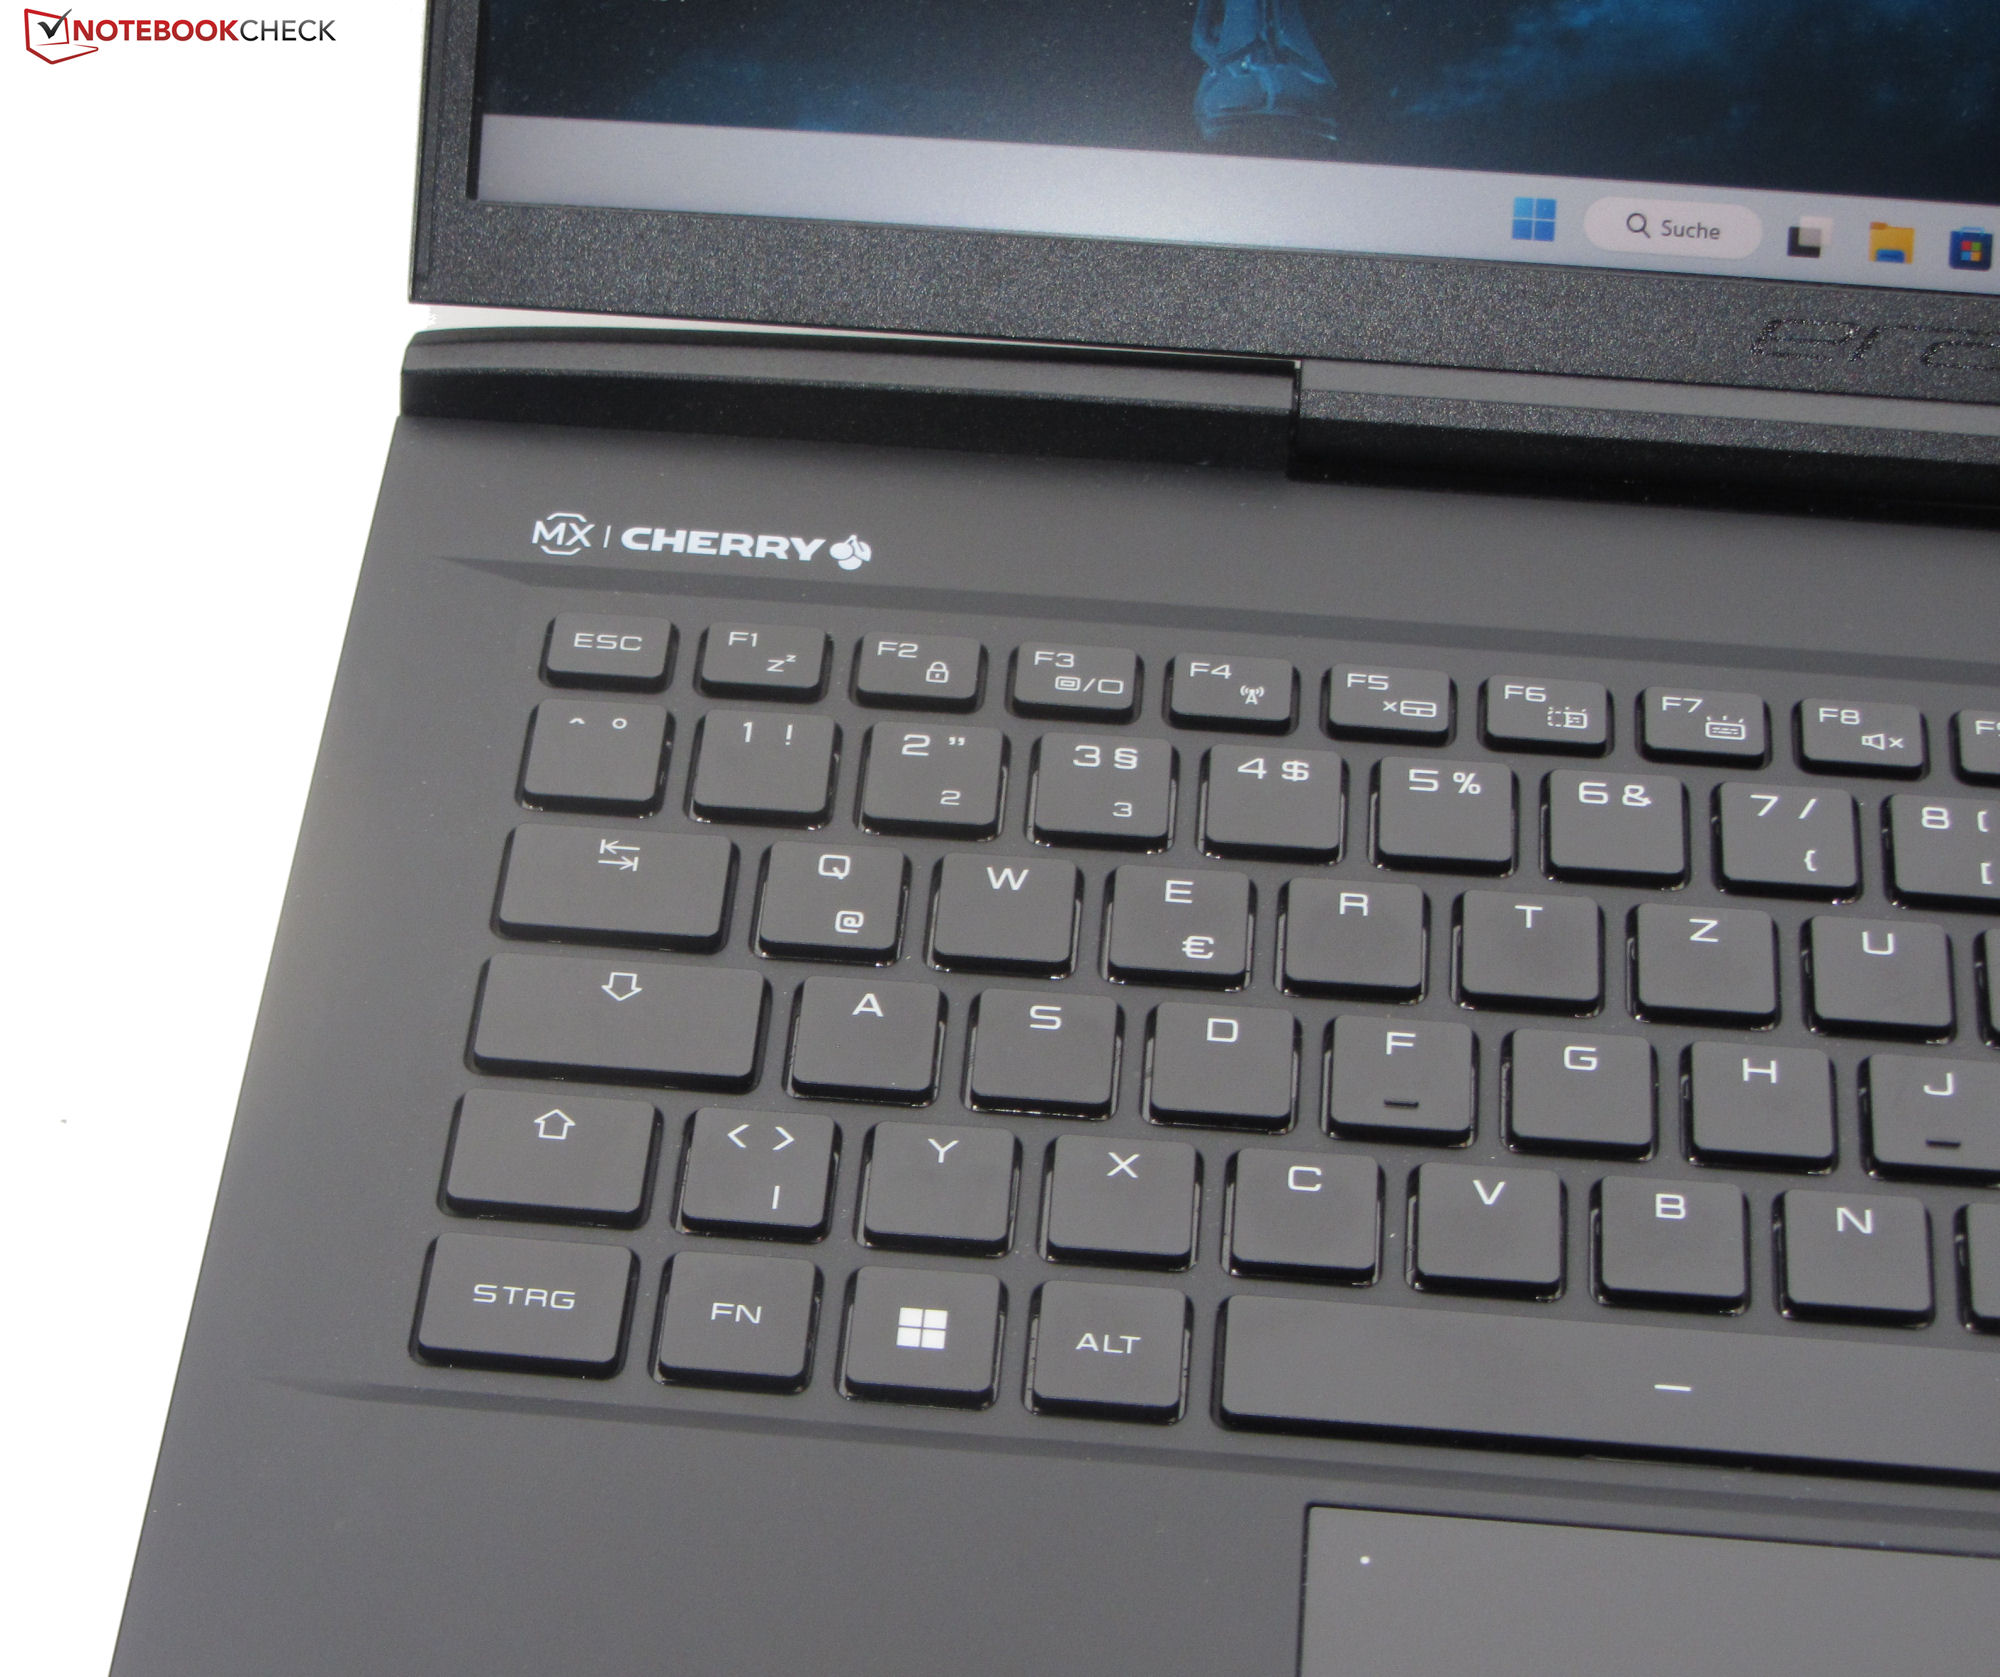
Périphériques d'entrée - Clavier mécanique avec commutateurs Cherry MX
Clavier
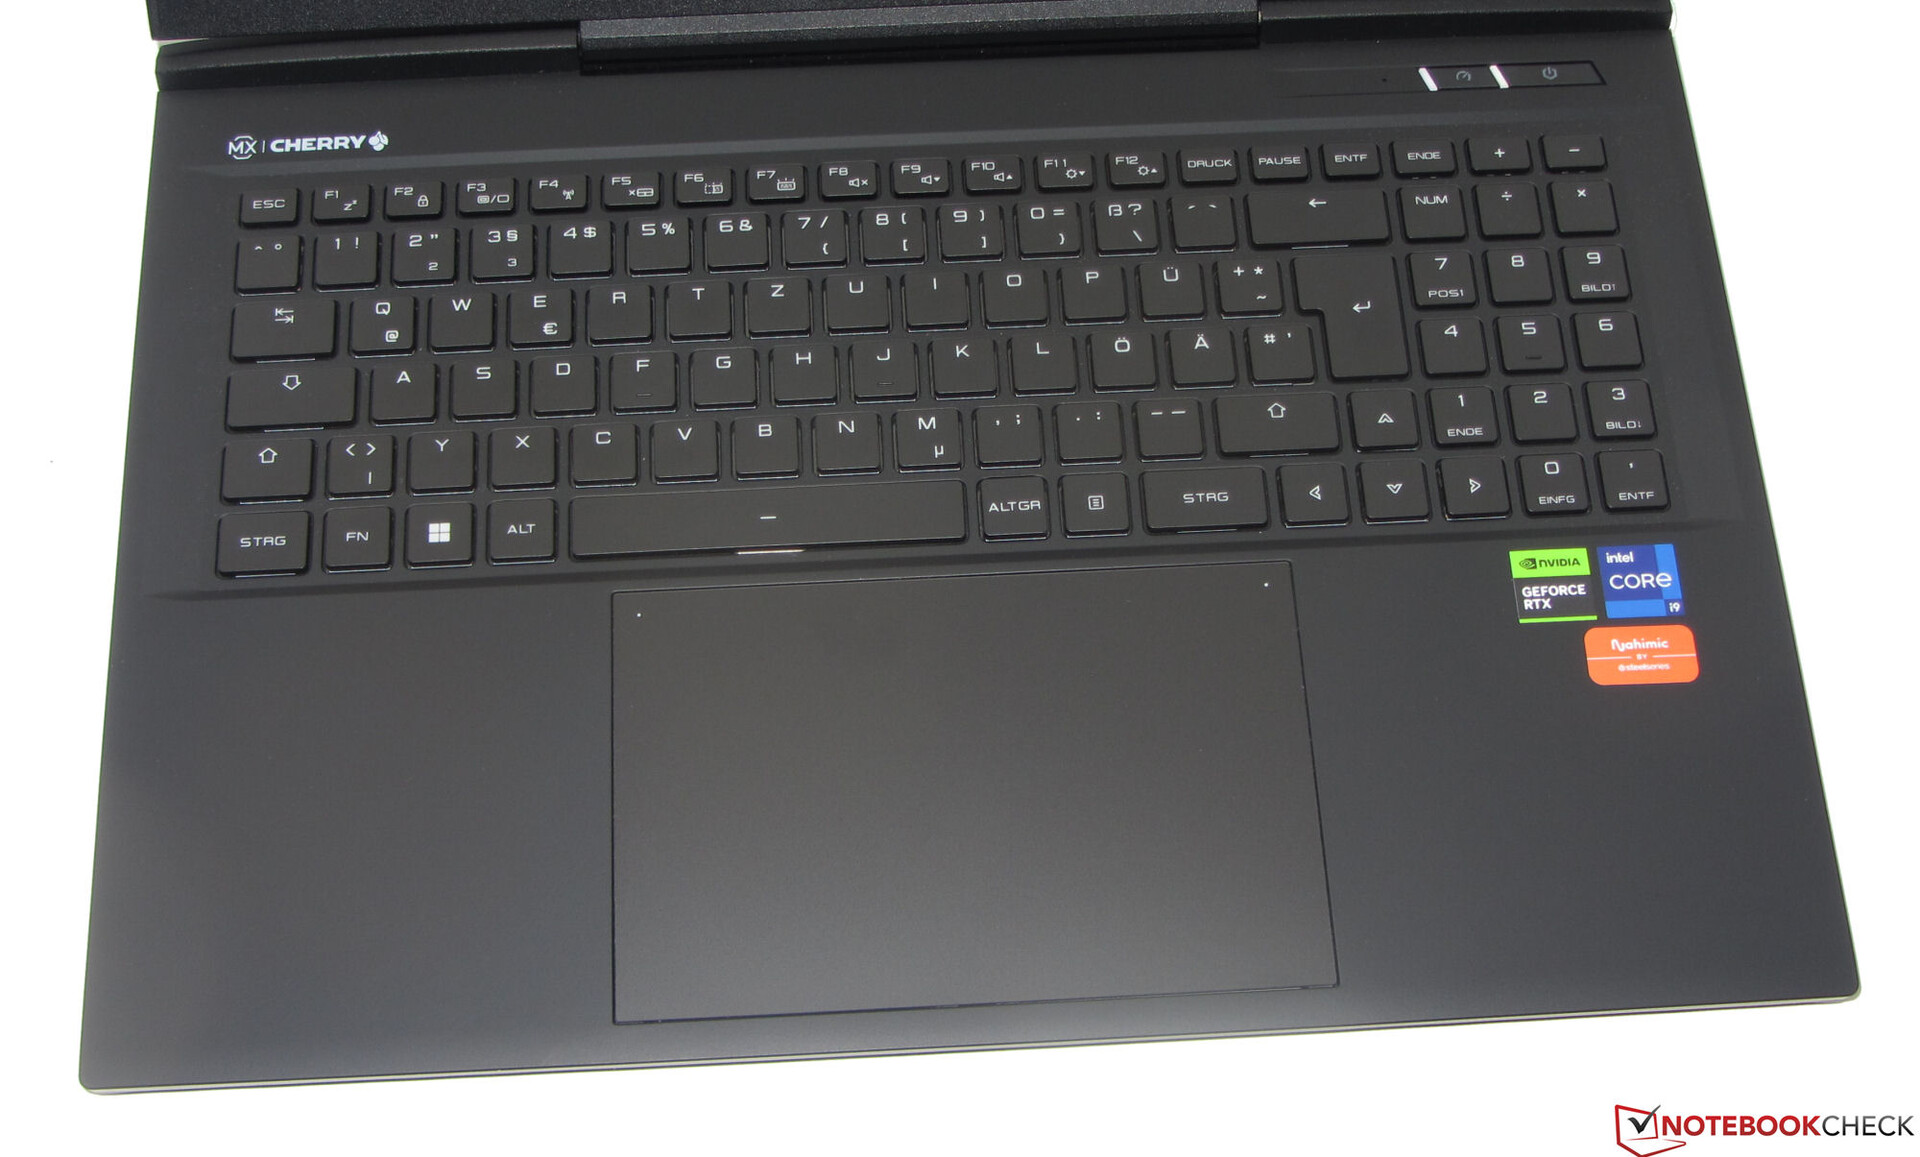
Les claviers mécaniques sont généralement réputés pour la précision de leurs entrées et de leurs retours d'informations, ainsi que pour la sensation de frappe qu'ils procurent - il en va de même pour le clavier du X40. Ses commutateurs Cherry MX offrent une course modérée et un point d'actionnement audible et tactile. Le clavier ne fléchit pas lorsque vous tapez. Deux touches de fonction permettent de régler l'éclairage RGB par touche sur l'un des quatre niveaux de luminosité. Dans l'ensemble, le Erazer Beast X40 est un clavier fantastique.
Pavé tactile
Mesurant environ 15,5 x 10 cm (6,1 x 3,9"), le pavé tactile multitouch présente une surface lisse qui permet de faire glisser facilement les doigts. Il offre une course courte et un point de clic distinct. Des voyants d'état se trouvent dans les coins supérieurs du pavé. Le fait d'appuyer sur le voyant de gauche permet d'activer ou de désactiver l'ensemble du pavé tactile, tandis que le voyant de droite permet d'activer ou de désactiver uniquement la moitié droite du pavé.
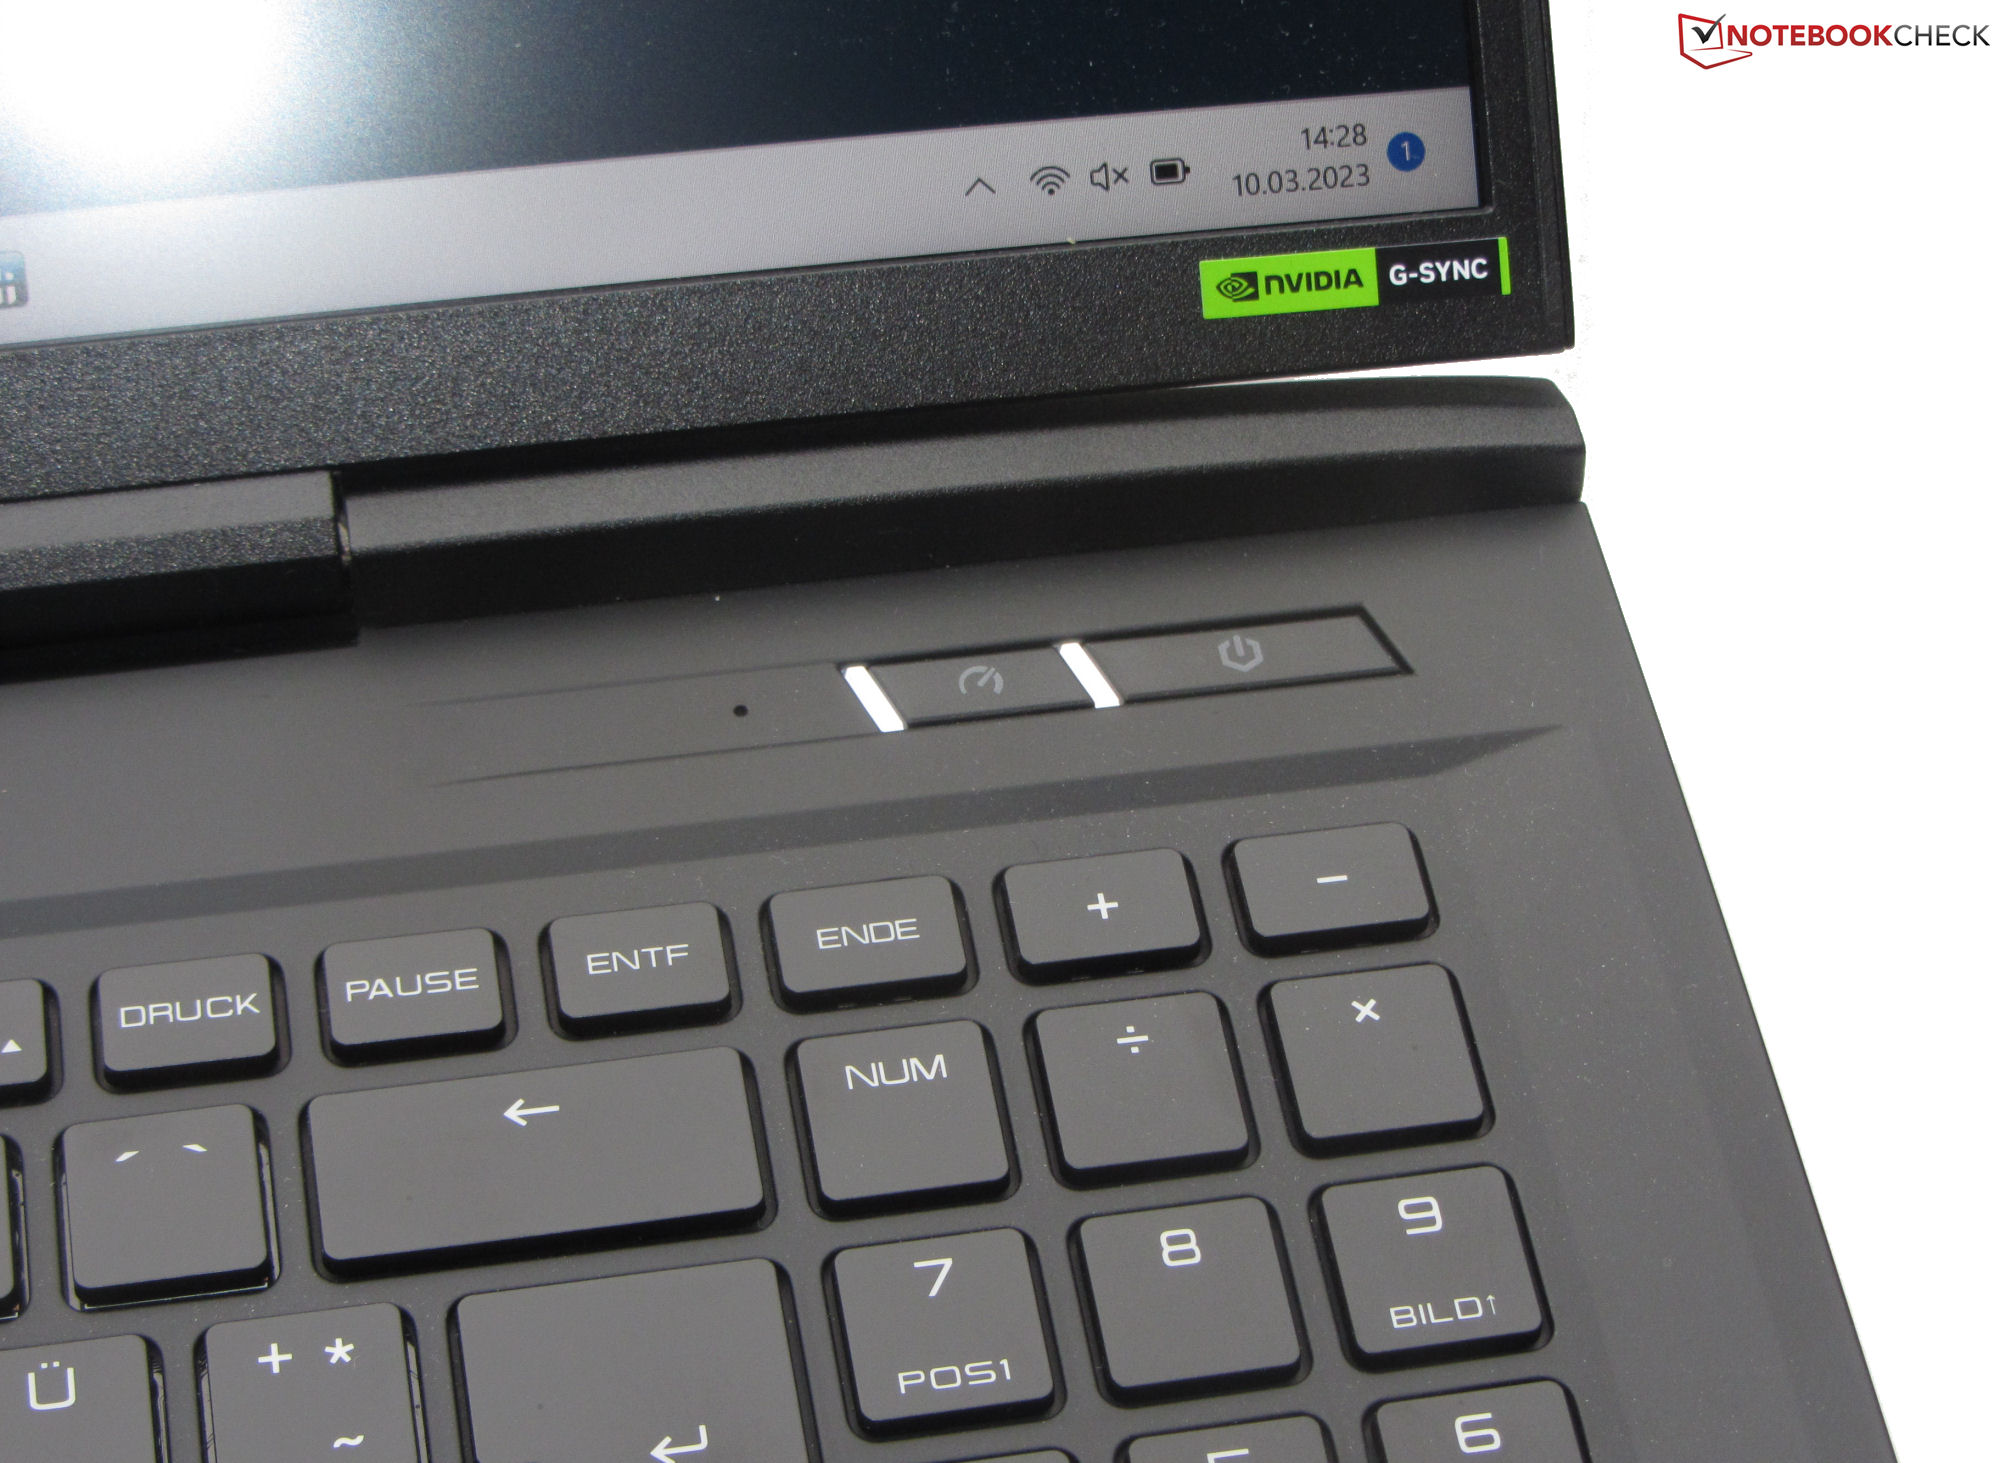
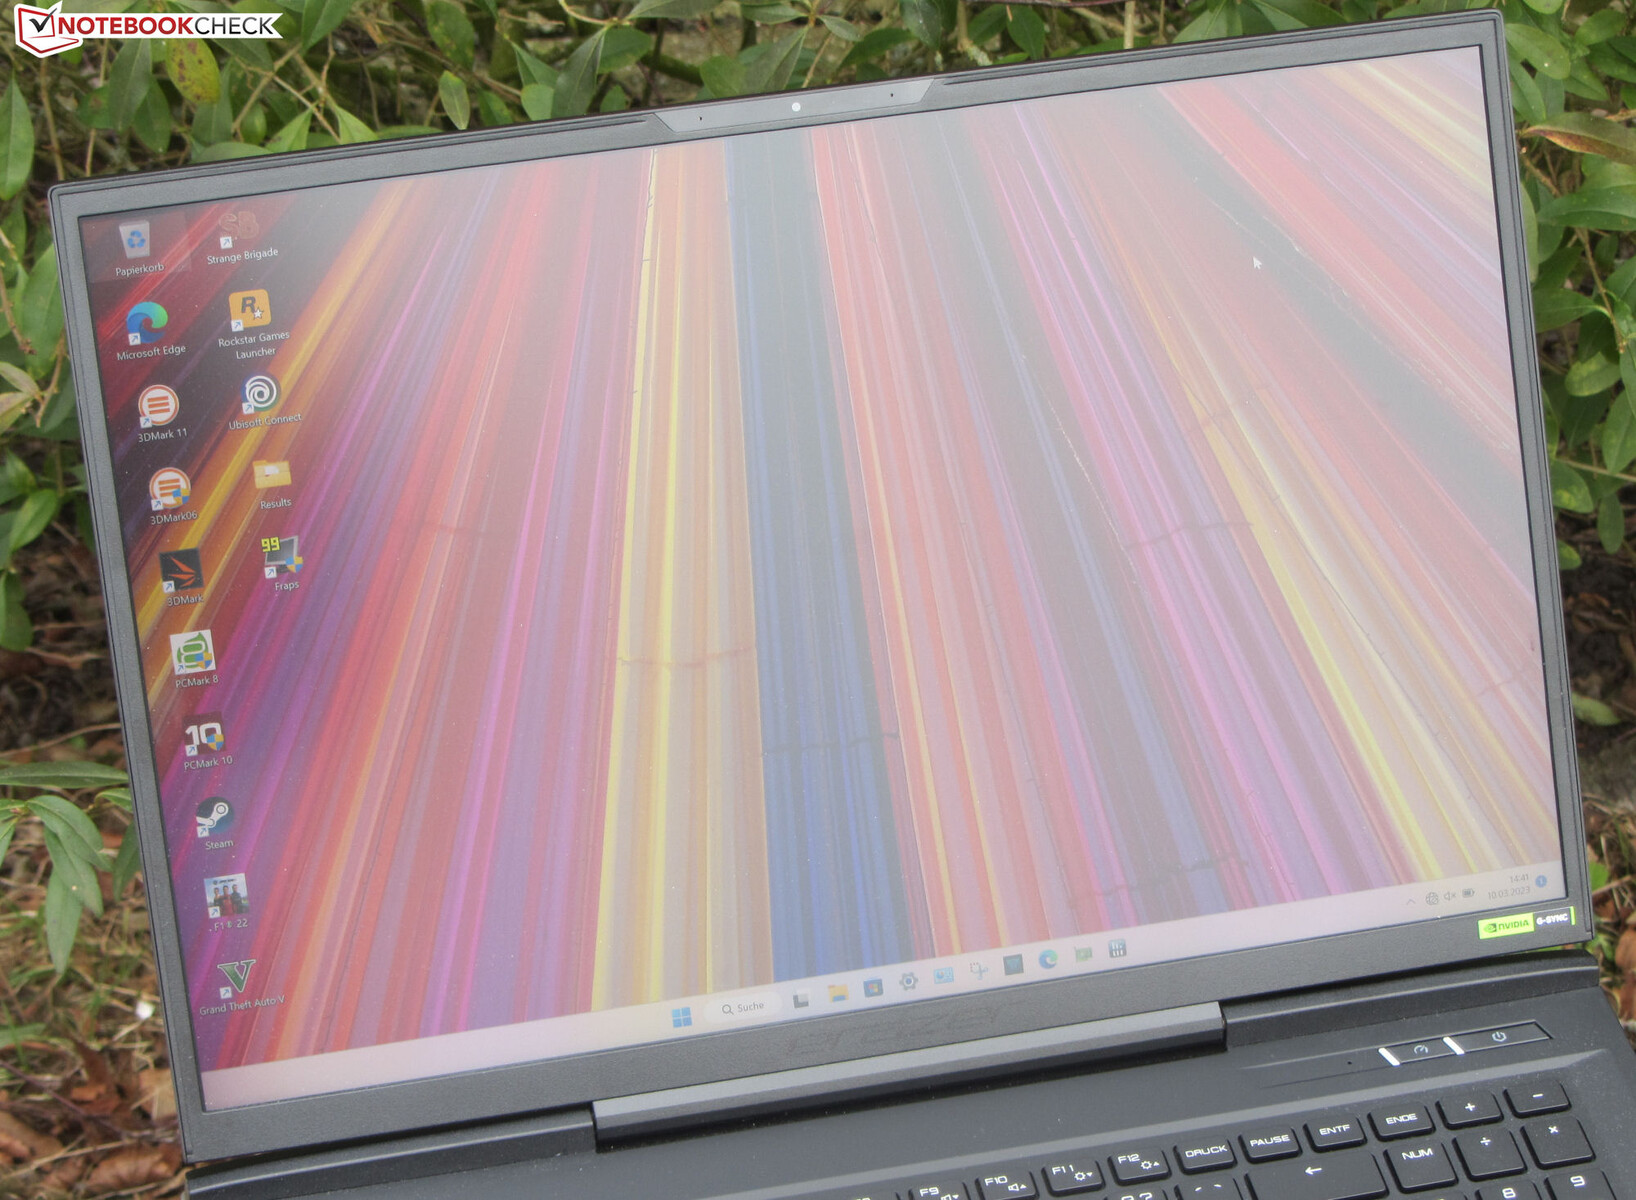
Écran - QHD+ avec format 16:10
L'écran IPS mat de 17 pouces (2 560 x 1 440) au format 16:10 se distingue par une luminosité adéquate, des temps de réponse rapides, un taux de rafraîchissement élevé (240 Hz) et l'absence de scintillement PWM. Mais son rapport de contraste n'est pas à la hauteur de ce qui est considéré comme bon (>1 000:1).
L'écran prend en charge la technologie G-Sync, qui permet d'adapter dynamiquement le taux de rafraîchissement de l'écran à la fréquence d'images émise par le GPU. Cette technologie est conçue pour offrir une expérience visuelle plus fluide, en particulier pour les jeux.
| |||||||||||||||||||||||||
Homogénéité de la luminosité: 90 %
Valeur mesurée au centre, sur batterie: 384 cd/m²
Contraste: 853:1 (Valeurs des noirs: 0.45 cd/m²)
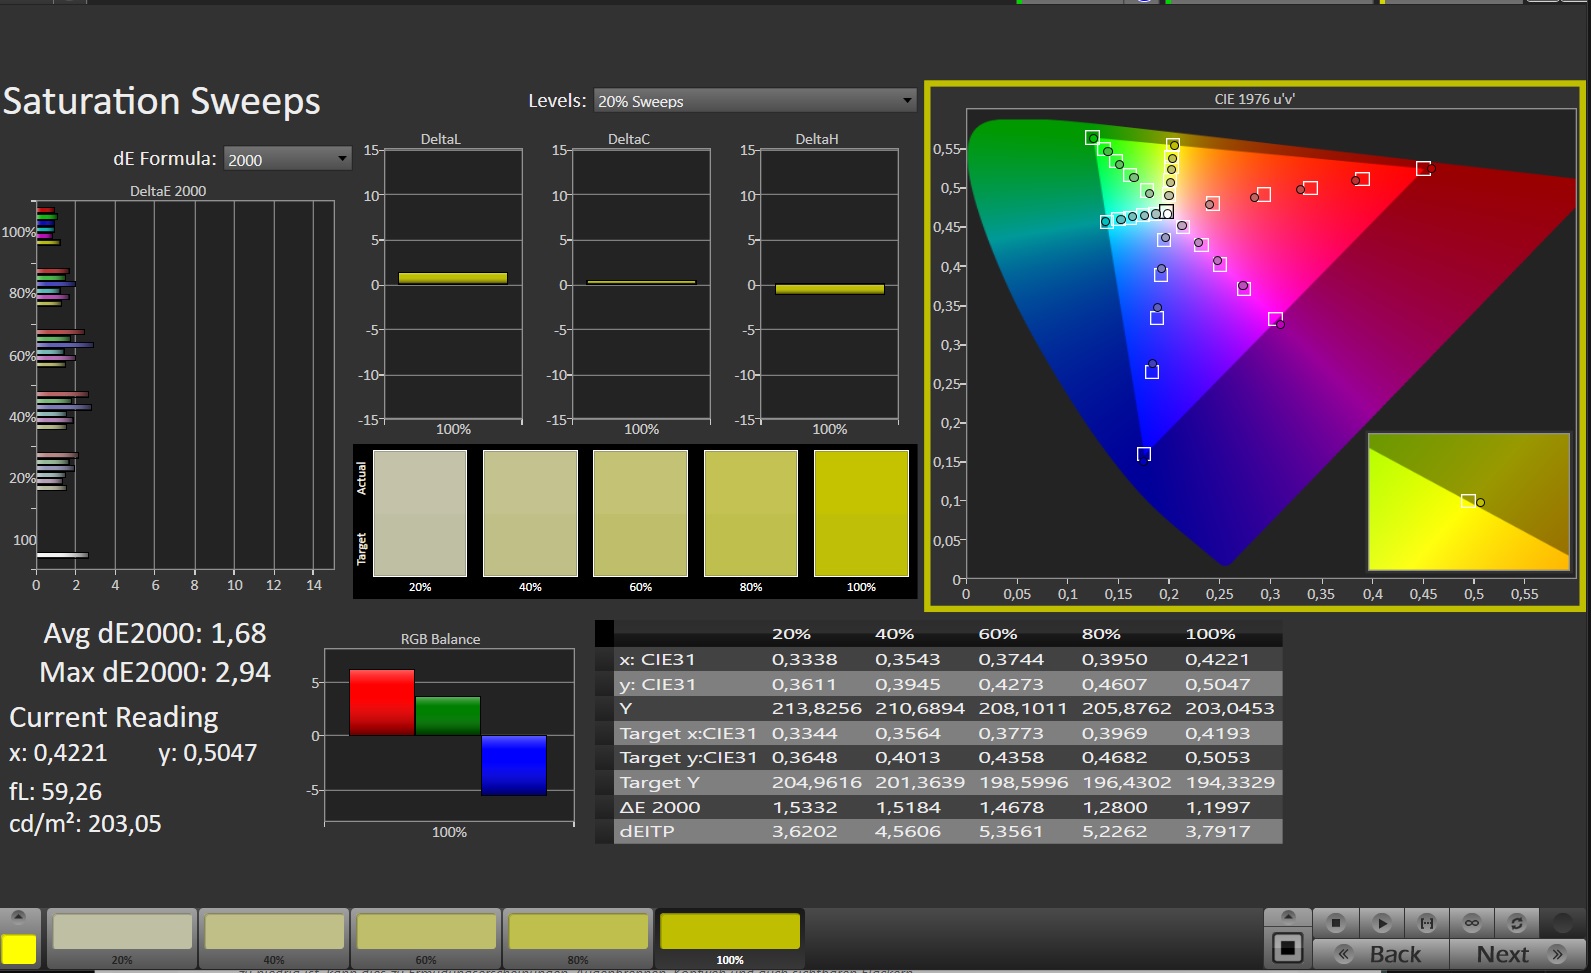
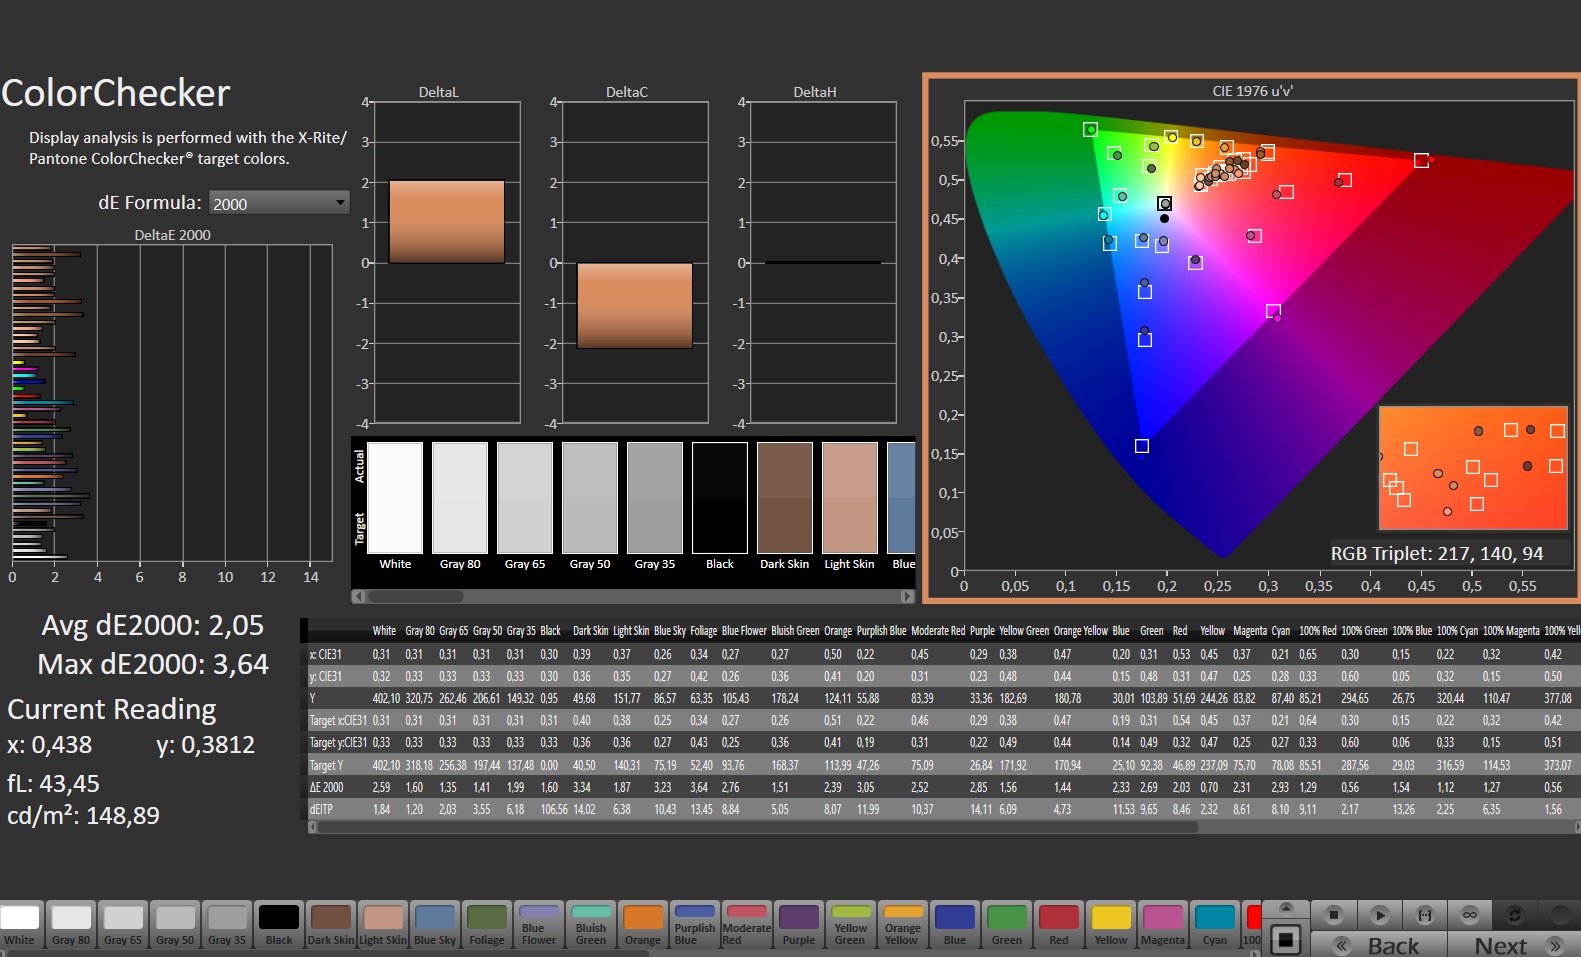
ΔE ColorChecker Calman: 2.05 | ∀{0.5-29.43 Ø4.71}
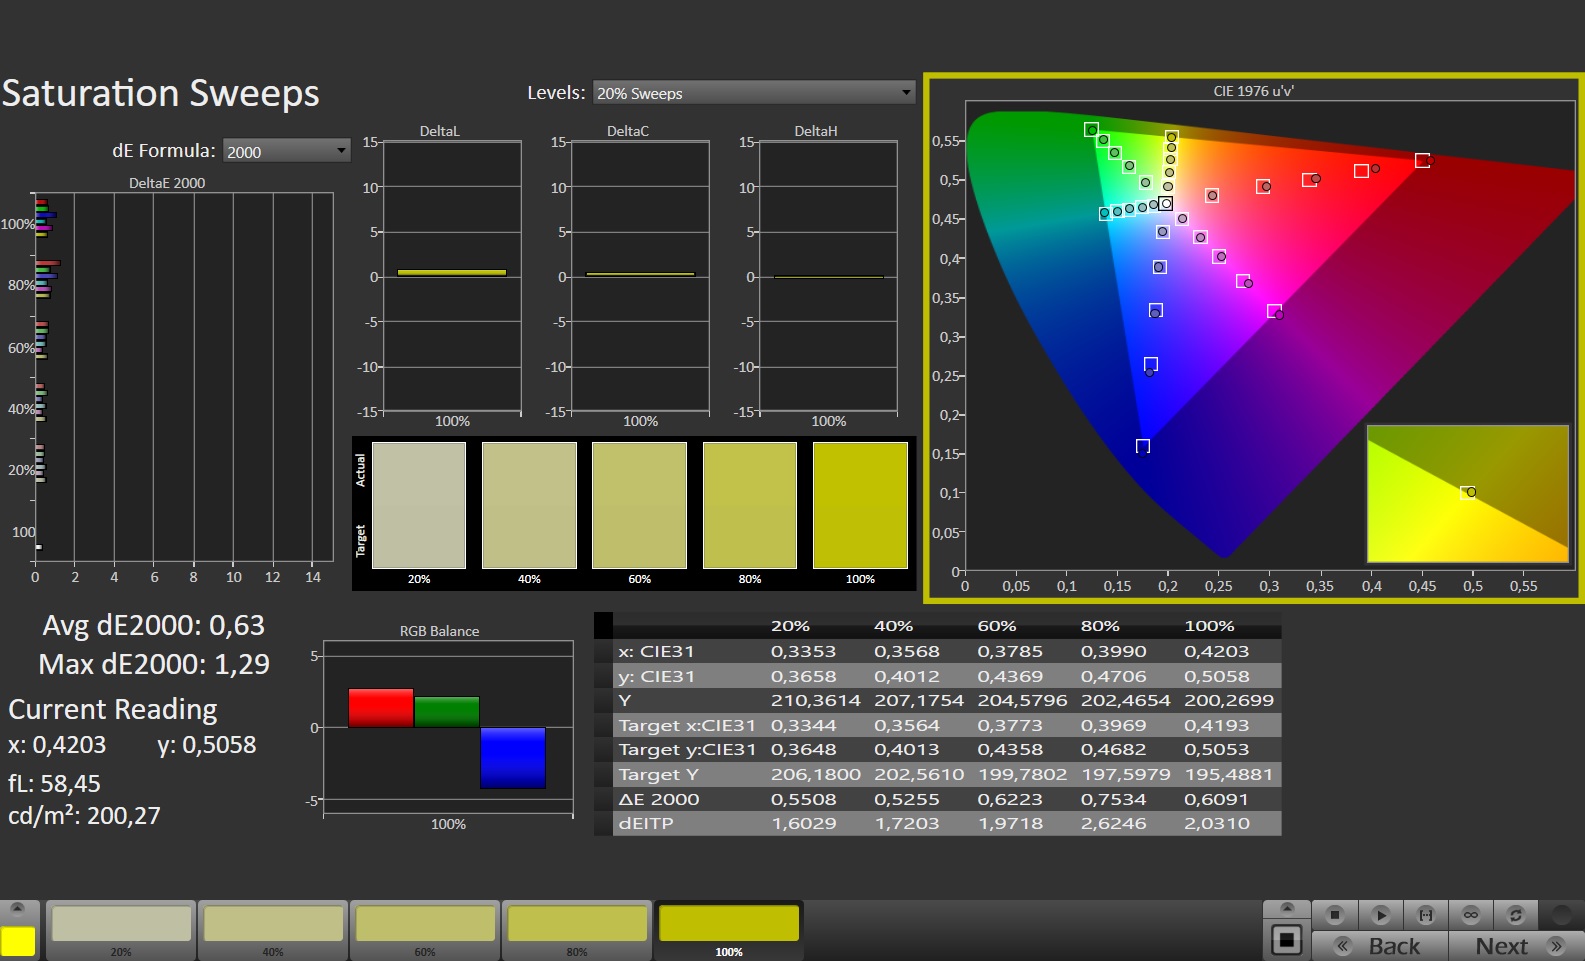
calibrated: 0.74
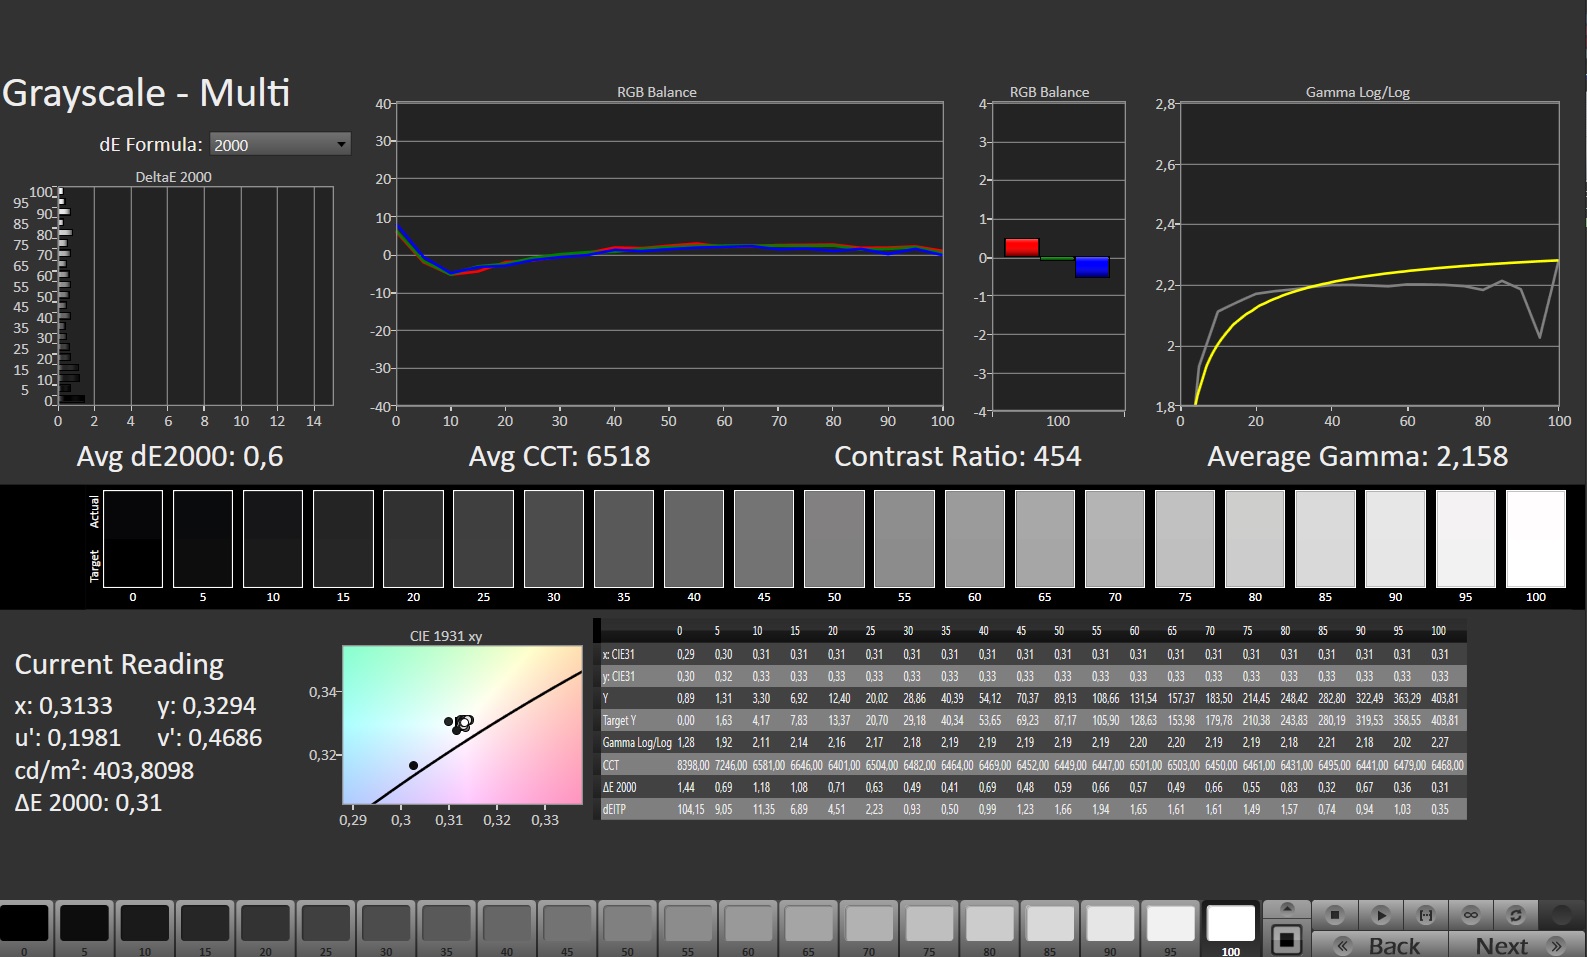
ΔE Greyscale Calman: 2.3 | ∀{0.09-98 Ø4.96}
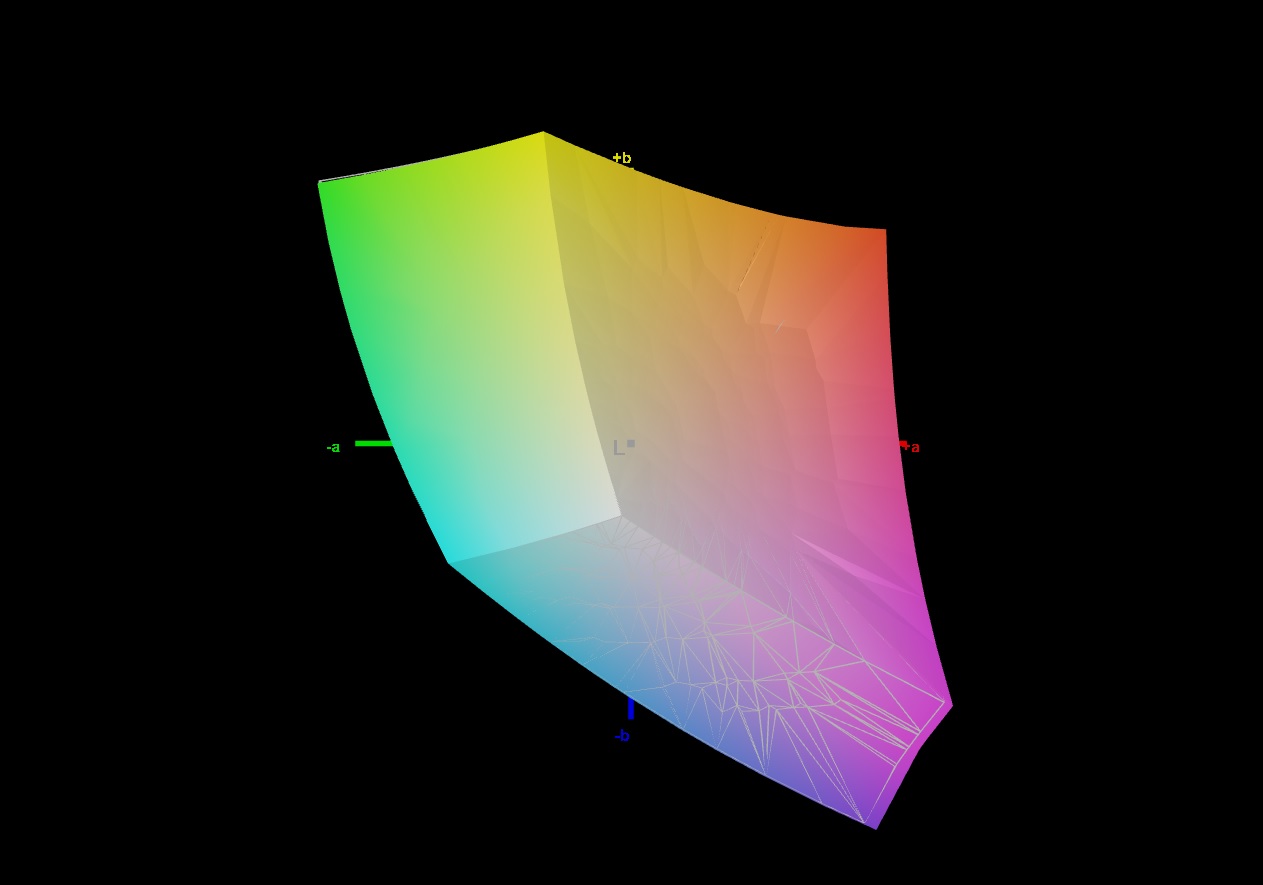
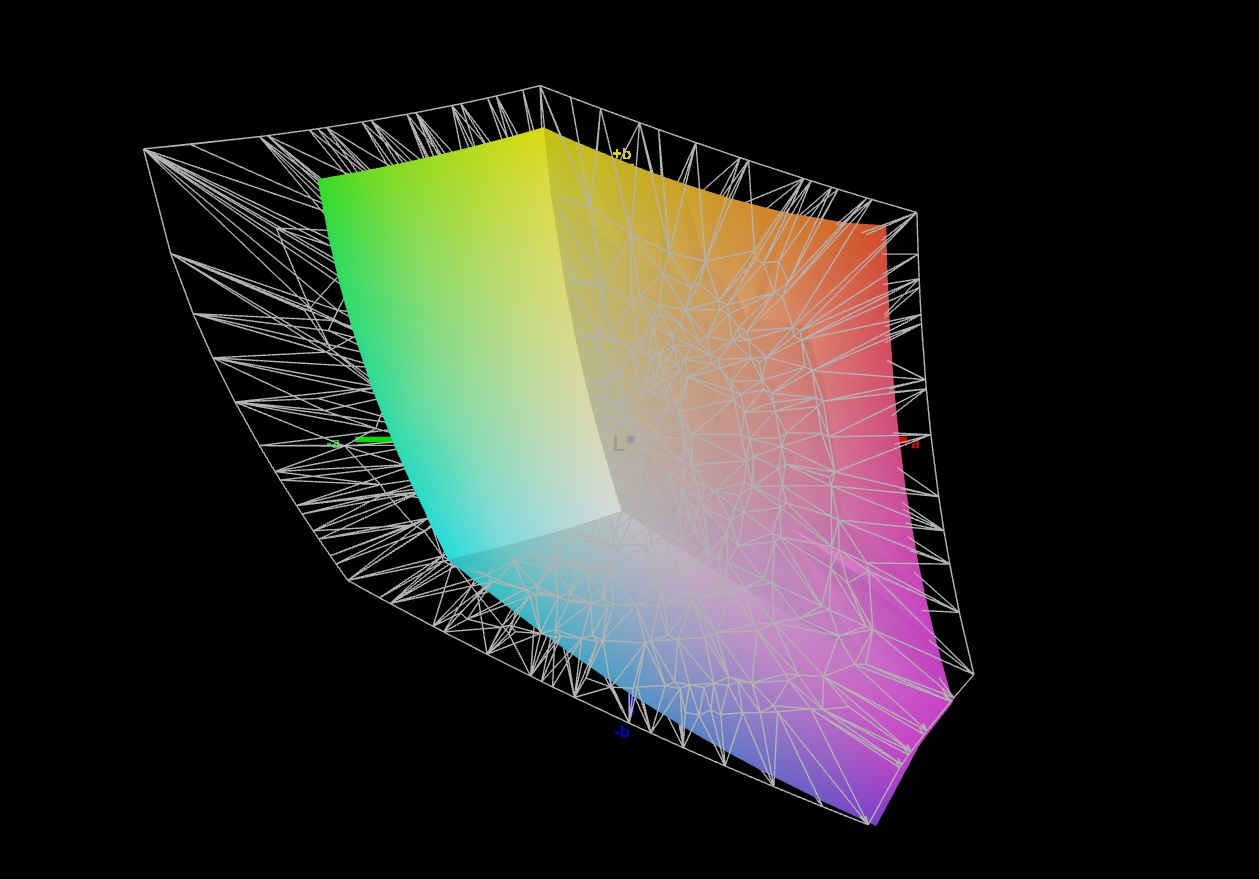
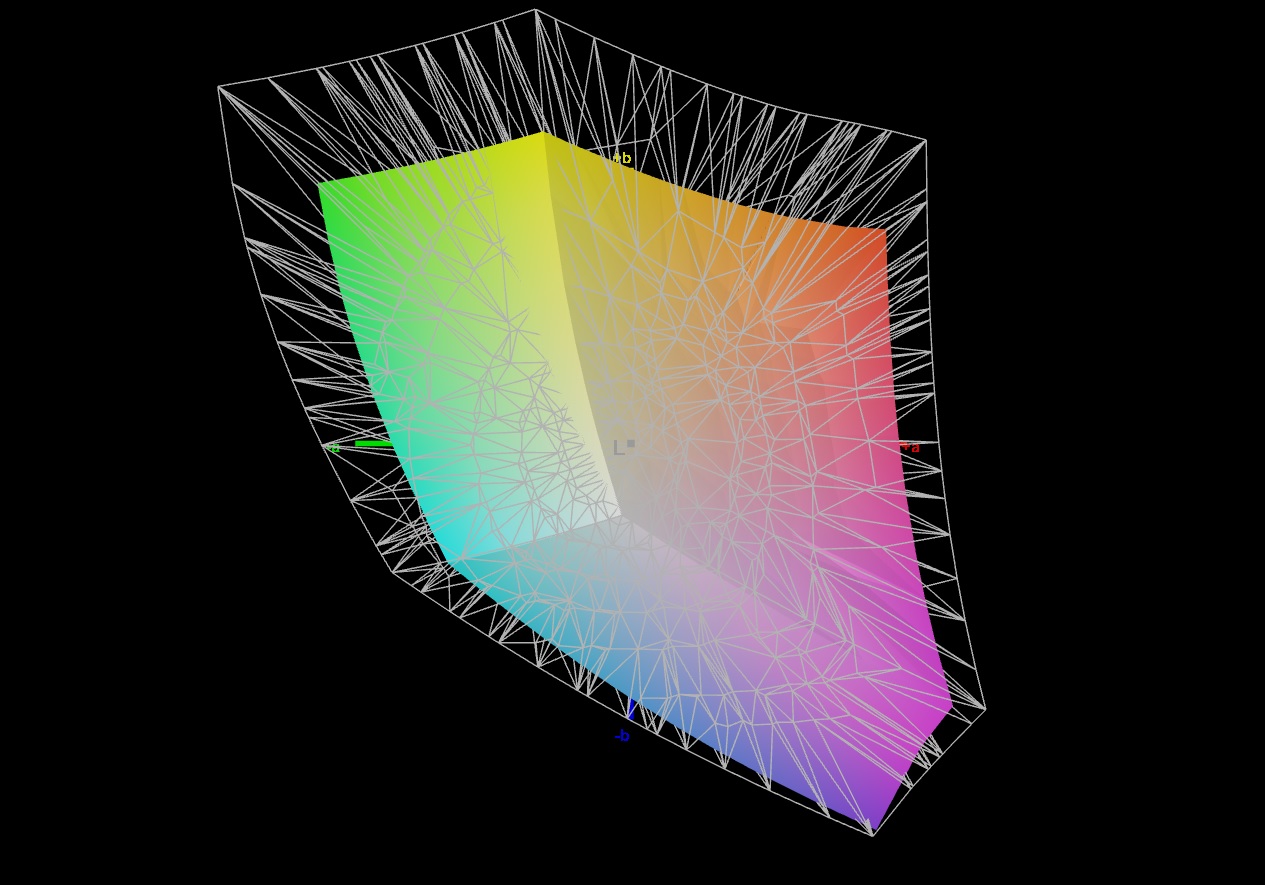
69.4% AdobeRGB 1998 (Argyll 3D)
99.8% sRGB (Argyll 3D)
68.6% Display P3 (Argyll 3D)
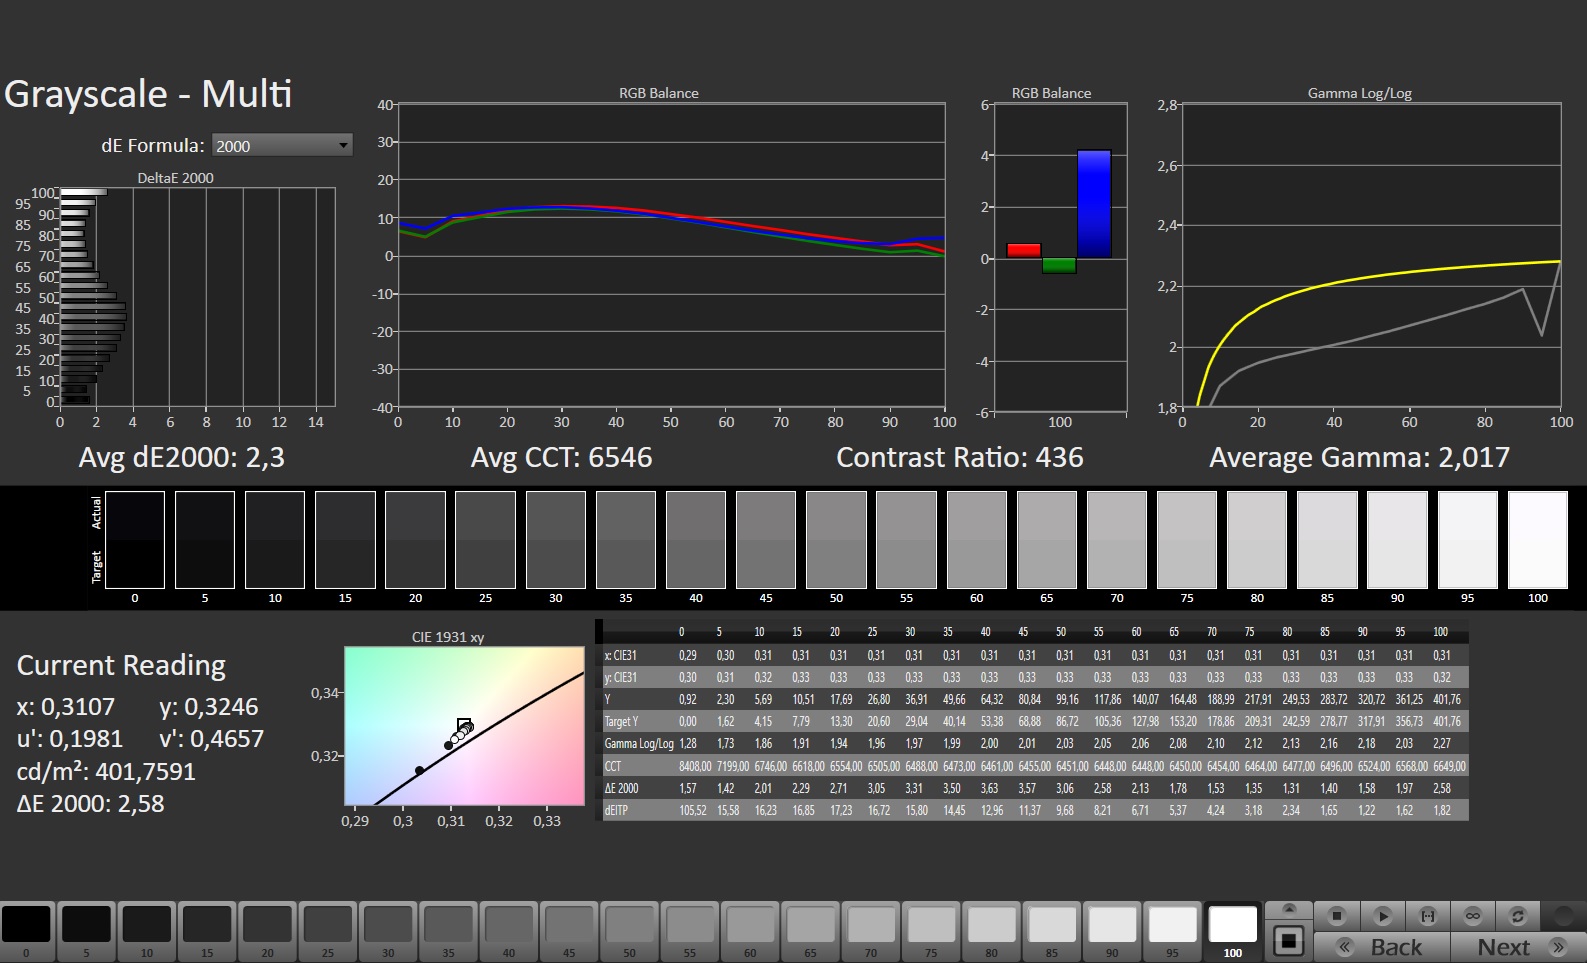
Gamma: 2.017
CCT: 6546 K
| Medion Erazer Beast X40 BOE NE170QDM-NZ1, IPS, 2560x1600, 17" | MSI Titan GT77 HX 13VI B173ZAN06.C, Mini-LED, 3840x2160, 17.3" | Razer Blade 16 Early 2023 CSOT T3 MNG007DA4-1, IPS, 2560x1600, 16" | Schenker XMG Neo 17 M22 BOE0A99, IPS, 2560x1600, 17" | Alienware x17 R2 P48E AU Optronics B173HAN, IPS, 1920x1080, 17.3" | Asus ROG Strix Scar 18 2023 G834JY-N6005W NE180QDM-NZ2, IPS, 2560x1600, 18" | |
|---|---|---|---|---|---|---|
| Display | 24% | 24% | 0% | 10% | 21% | |
| Display P3 Coverage (%) | 68.6 | 94.9 38% | 98.5 44% | 69 1% | 79.2 15% | 97.2 42% |
| sRGB Coverage (%) | 99.8 | 99.9 0% | 100 0% | 99.8 0% | 99.8 0% | 99.9 0% |
| AdobeRGB 1998 Coverage (%) | 69.4 | 92.4 33% | 89.7 29% | 69.6 0% | 79.6 15% | 84.9 22% |
| Response Times | -248% | -9% | 12% | -17% | 19% | |
| Response Time Grey 50% / Grey 80% * (ms) | 11.3 ? | 38.4 ? -240% | 6.6 ? 42% | 10.8 ? 4% | 12.4 ? -10% | 5.41 ? 52% |
| Response Time Black / White * (ms) | 7.5 ? | 26.6 ? -255% | 12 ? -60% | 6.1 ? 19% | 9.2 ? -23% | 8.62 ? -15% |
| PWM Frequency (Hz) | 2380 ? | |||||
| Screen | 78886% | -6% | 11% | -22% | -92% | |
| Brightness middle (cd/m²) | 384 | 606 58% | 456.8 19% | 415 8% | 365.4 -5% | 490 28% |
| Brightness (cd/m²) | 377 | 602 60% | 437 16% | 399 6% | 344 -9% | 468 24% |
| Brightness Distribution (%) | 90 | 93 3% | 83 -8% | 90 0% | 85 -6% | 86 -4% |
| Black Level * (cd/m²) | 0.45 | 0.0001 100% | 0.35 22% | 0.43 4% | 0.29 36% | 0.54 -20% |
| Contrast (:1) | 853 | 6060000 710334% | 1305 53% | 965 13% | 1260 48% | 907 6% |
| Colorchecker dE 2000 * | 2.05 | 4.8 -134% | 3.7 -80% | 1.44 30% | 3.17 -55% | 4.97 -142% |
| Colorchecker dE 2000 max. * | 3.64 | 8.2 -125% | 6.42 -76% | 2.33 36% | 7.69 -111% | 11.02 -203% |
| Colorchecker dE 2000 calibrated * | 0.74 | 1.8 -143% | 0.66 11% | 0.89 -20% | 0.51 31% | 2.97 -301% |
| Greyscale dE 2000 * | 2.3 | 6.5 -183% | 2.6 -13% | 1.8 22% | 5.3 -130% | 7.2 -213% |
| Gamma | 2.017 109% | 2.63 84% | 2.3 96% | 2.132 103% | 2.18 101% | 2.161 102% |
| CCT | 6546 99% | 6596 99% | 6108 106% | 6327 103% | 5879 111% | 6515 100% |
| Moyenne finale (programmes/paramètres) | 26221% /
50682% | 3% /
-0% | 8% /
9% | -10% /
-15% | -17% /
-52% |
* ... Moindre est la valeur, meilleures sont les performances
L'écran offre déjà une excellente reproduction des couleurs dès sa sortie de l'emballage. Sa différence de couleur moyenne d'environ 2 est nettement inférieure au seuil de ce qui est considéré comme bon (Delta E < 3). L'étalonnage de l'écran a permis de réduire la différence de couleur moyenne à 0,74 et de rendre l'échelle de gris plus équilibrée. L'écran est capable de couvrir l'ensemble de l'espace colorimétrique sRGB, mais pas AdobeRGB ni DCI-P3. Les écrans de certains ordinateurs portables concurrents sont plus performants en termes de couverture des couleurs.

Temps de réponse de l'écran
| ↔ Temps de réponse noir à blanc | ||
|---|---|---|
| 7.5 ms ... hausse ↗ et chute ↘ combinées | ↗ 3.3 ms hausse | 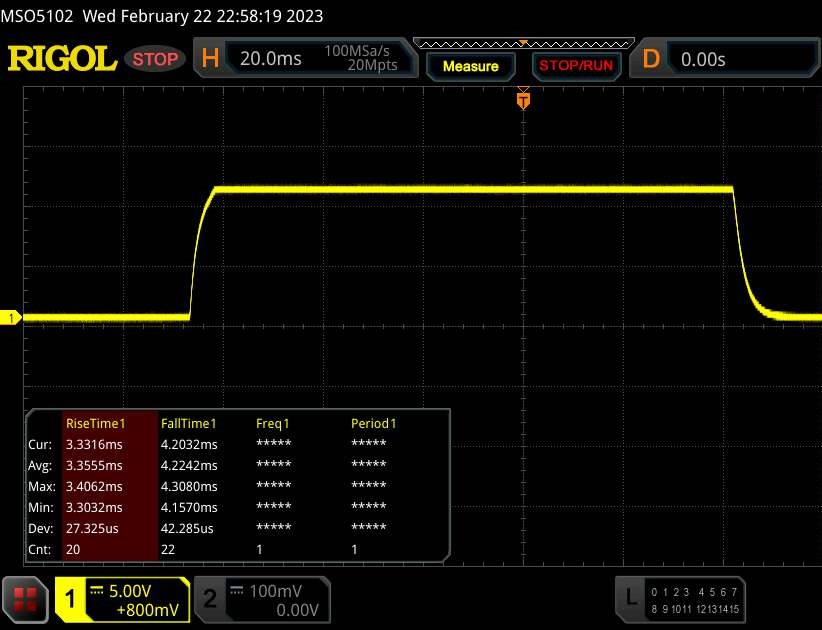 |
| ↘ 4.2 ms chute | ||
| L'écran montre de très faibles temps de réponse, parfait pour le jeu. En comparaison, tous les appareils testés affichent entre 0.1 (minimum) et 240 (maximum) ms. » 22 % des appareils testés affichent de meilleures performances. Cela signifie que les latences relevées sont meilleures que la moyenne (19.8 ms) de tous les appareils testés. | ||
| ↔ Temps de réponse gris 50% à gris 80% | ||
| 11.3 ms ... hausse ↗ et chute ↘ combinées | ↗ 5.4 ms hausse | 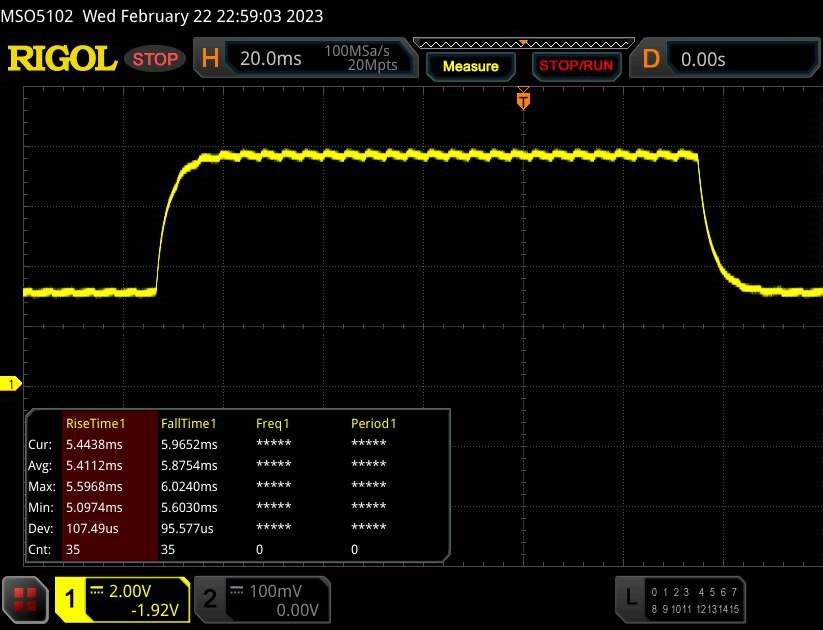 |
| ↘ 5.9 ms chute | ||
| L'écran montre de bons temps de réponse, mais insuffisant pour du jeu compétitif. En comparaison, tous les appareils testés affichent entre 0.165 (minimum) et 636 (maximum) ms. » 25 % des appareils testés affichent de meilleures performances. Cela signifie que les latences relevées sont meilleures que la moyenne (31 ms) de tous les appareils testés. | ||
Scintillement / MLI (Modulation de largeur d'impulsion)
| Scintillement / MLI (Modulation de largeur d'impulsion) non décelé | 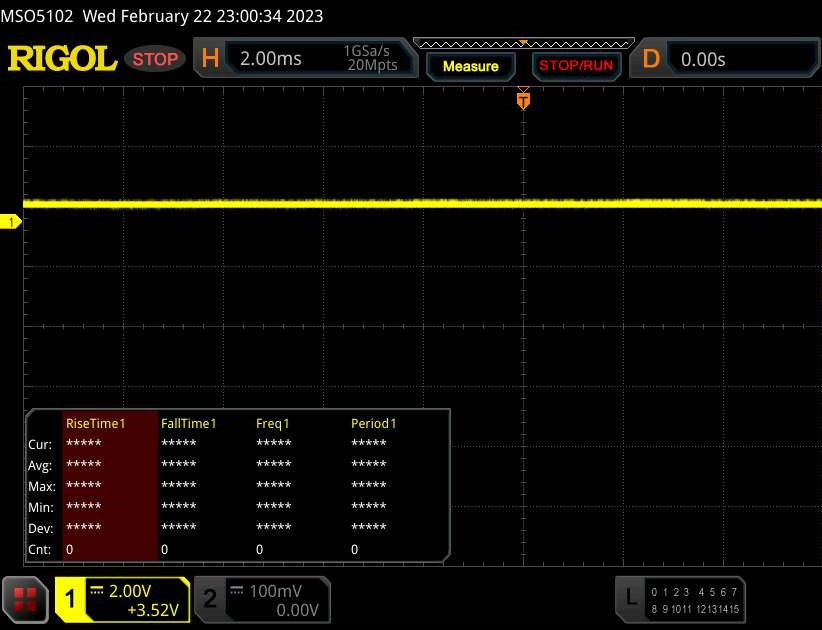 | ||
En comparaison, 52 % des appareils testés n'emploient pas MDI pour assombrir leur écran. Nous avons relevé une moyenne à 7757 (minimum : 5 - maximum : 343500) Hz dans le cas où une MDI était active. | |||
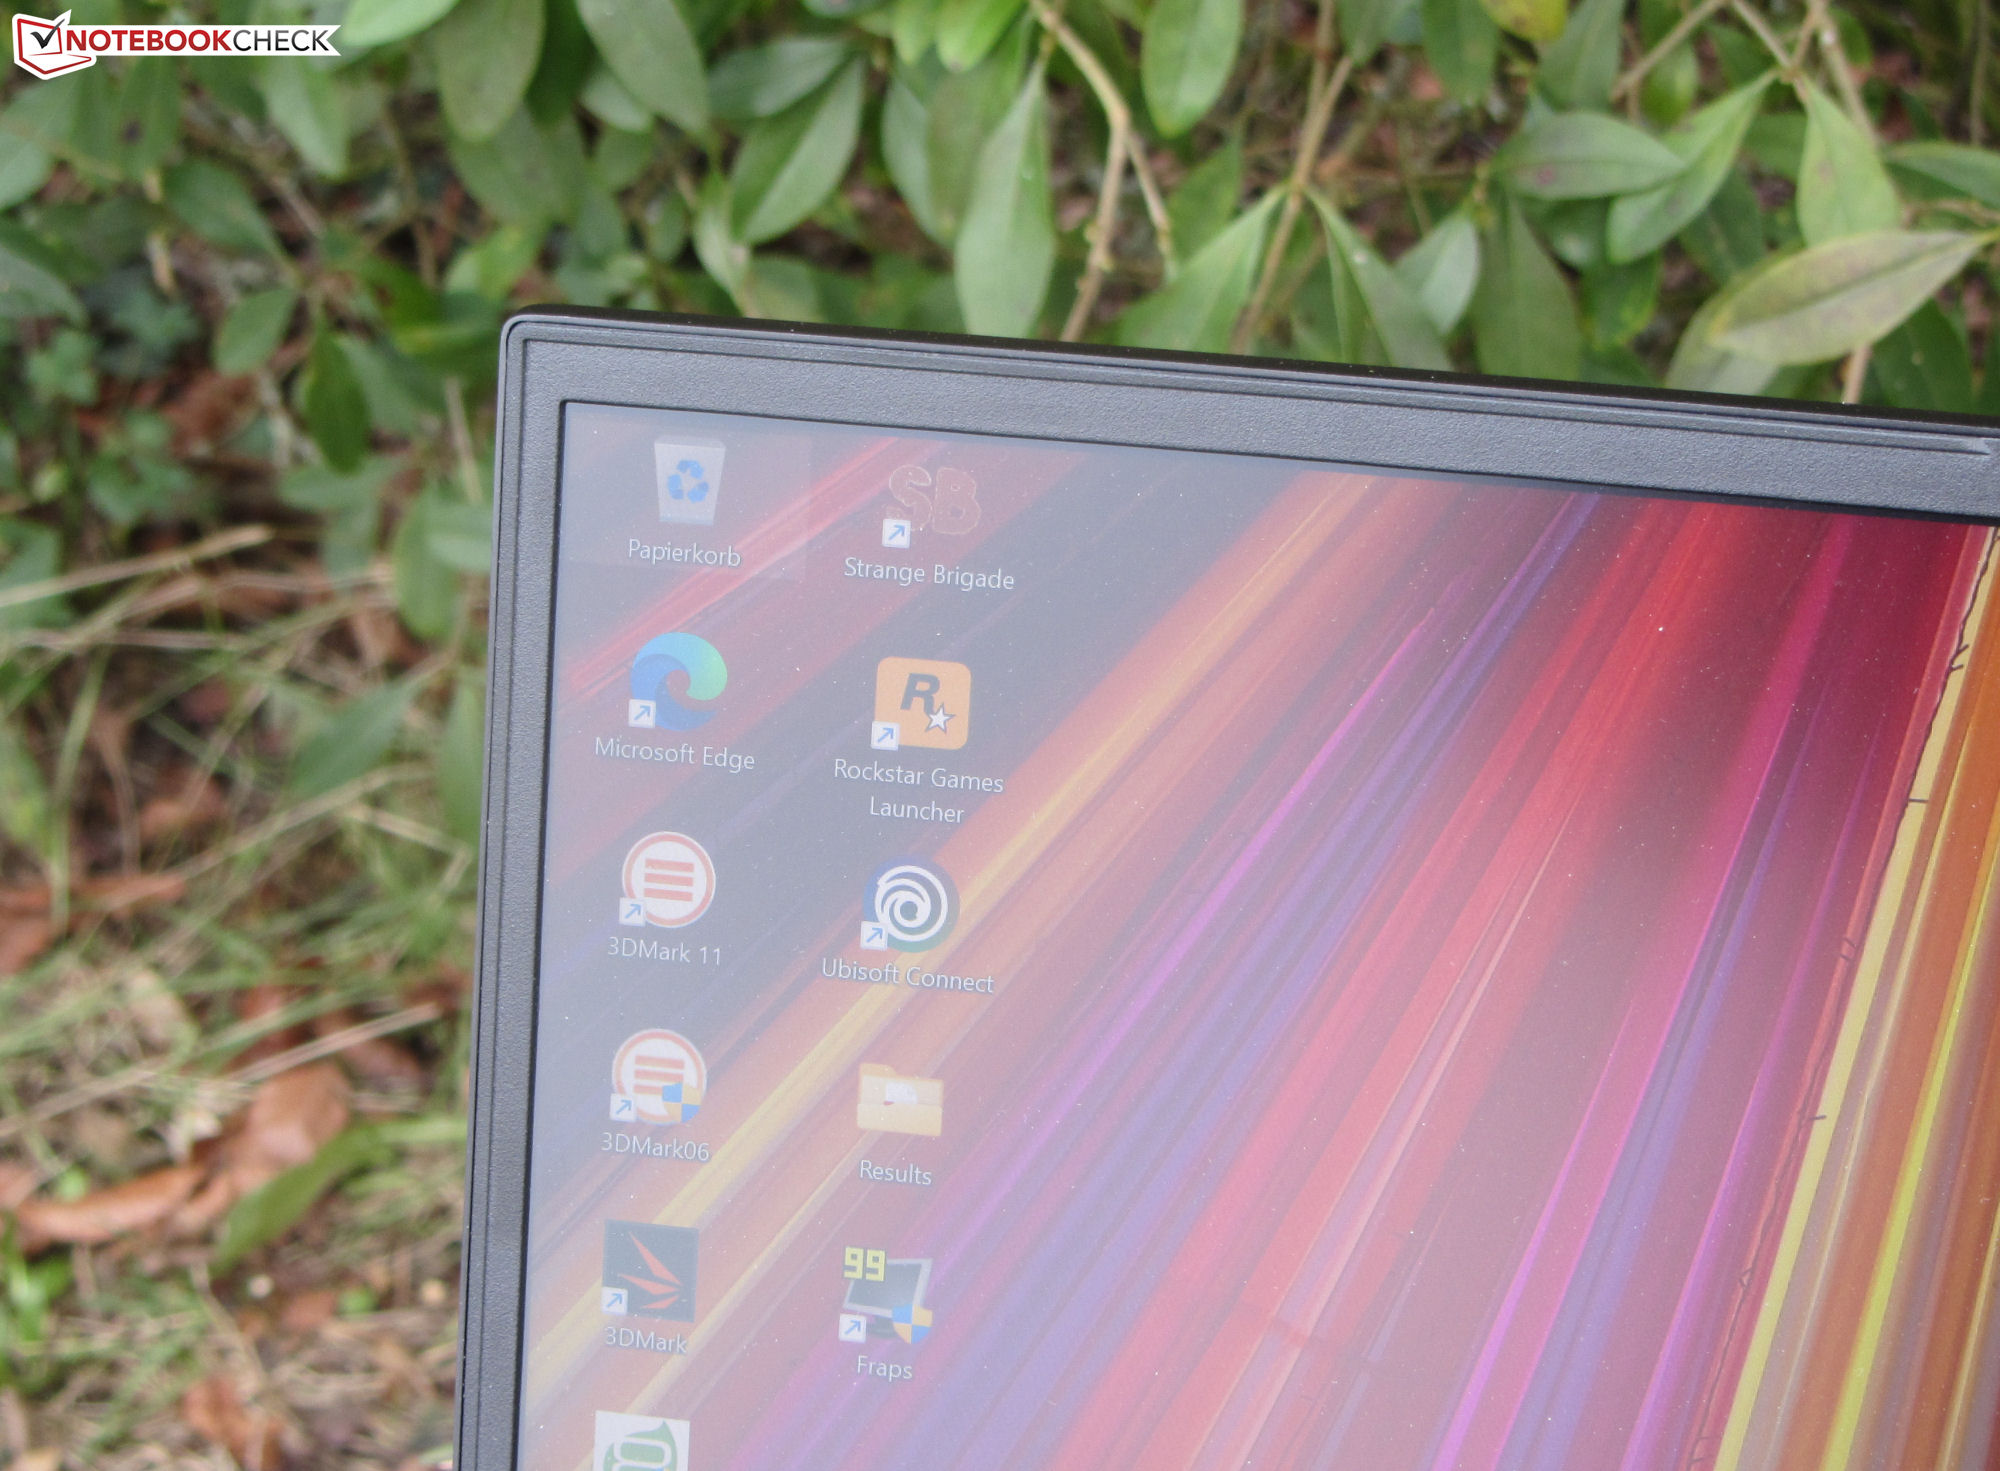
L'écran IPS présente un grand angle de vision et est facilement lisible dans n'importe quelle position. L'écran est tout à fait utilisable en extérieur, à condition que le soleil ne soit pas trop fort.

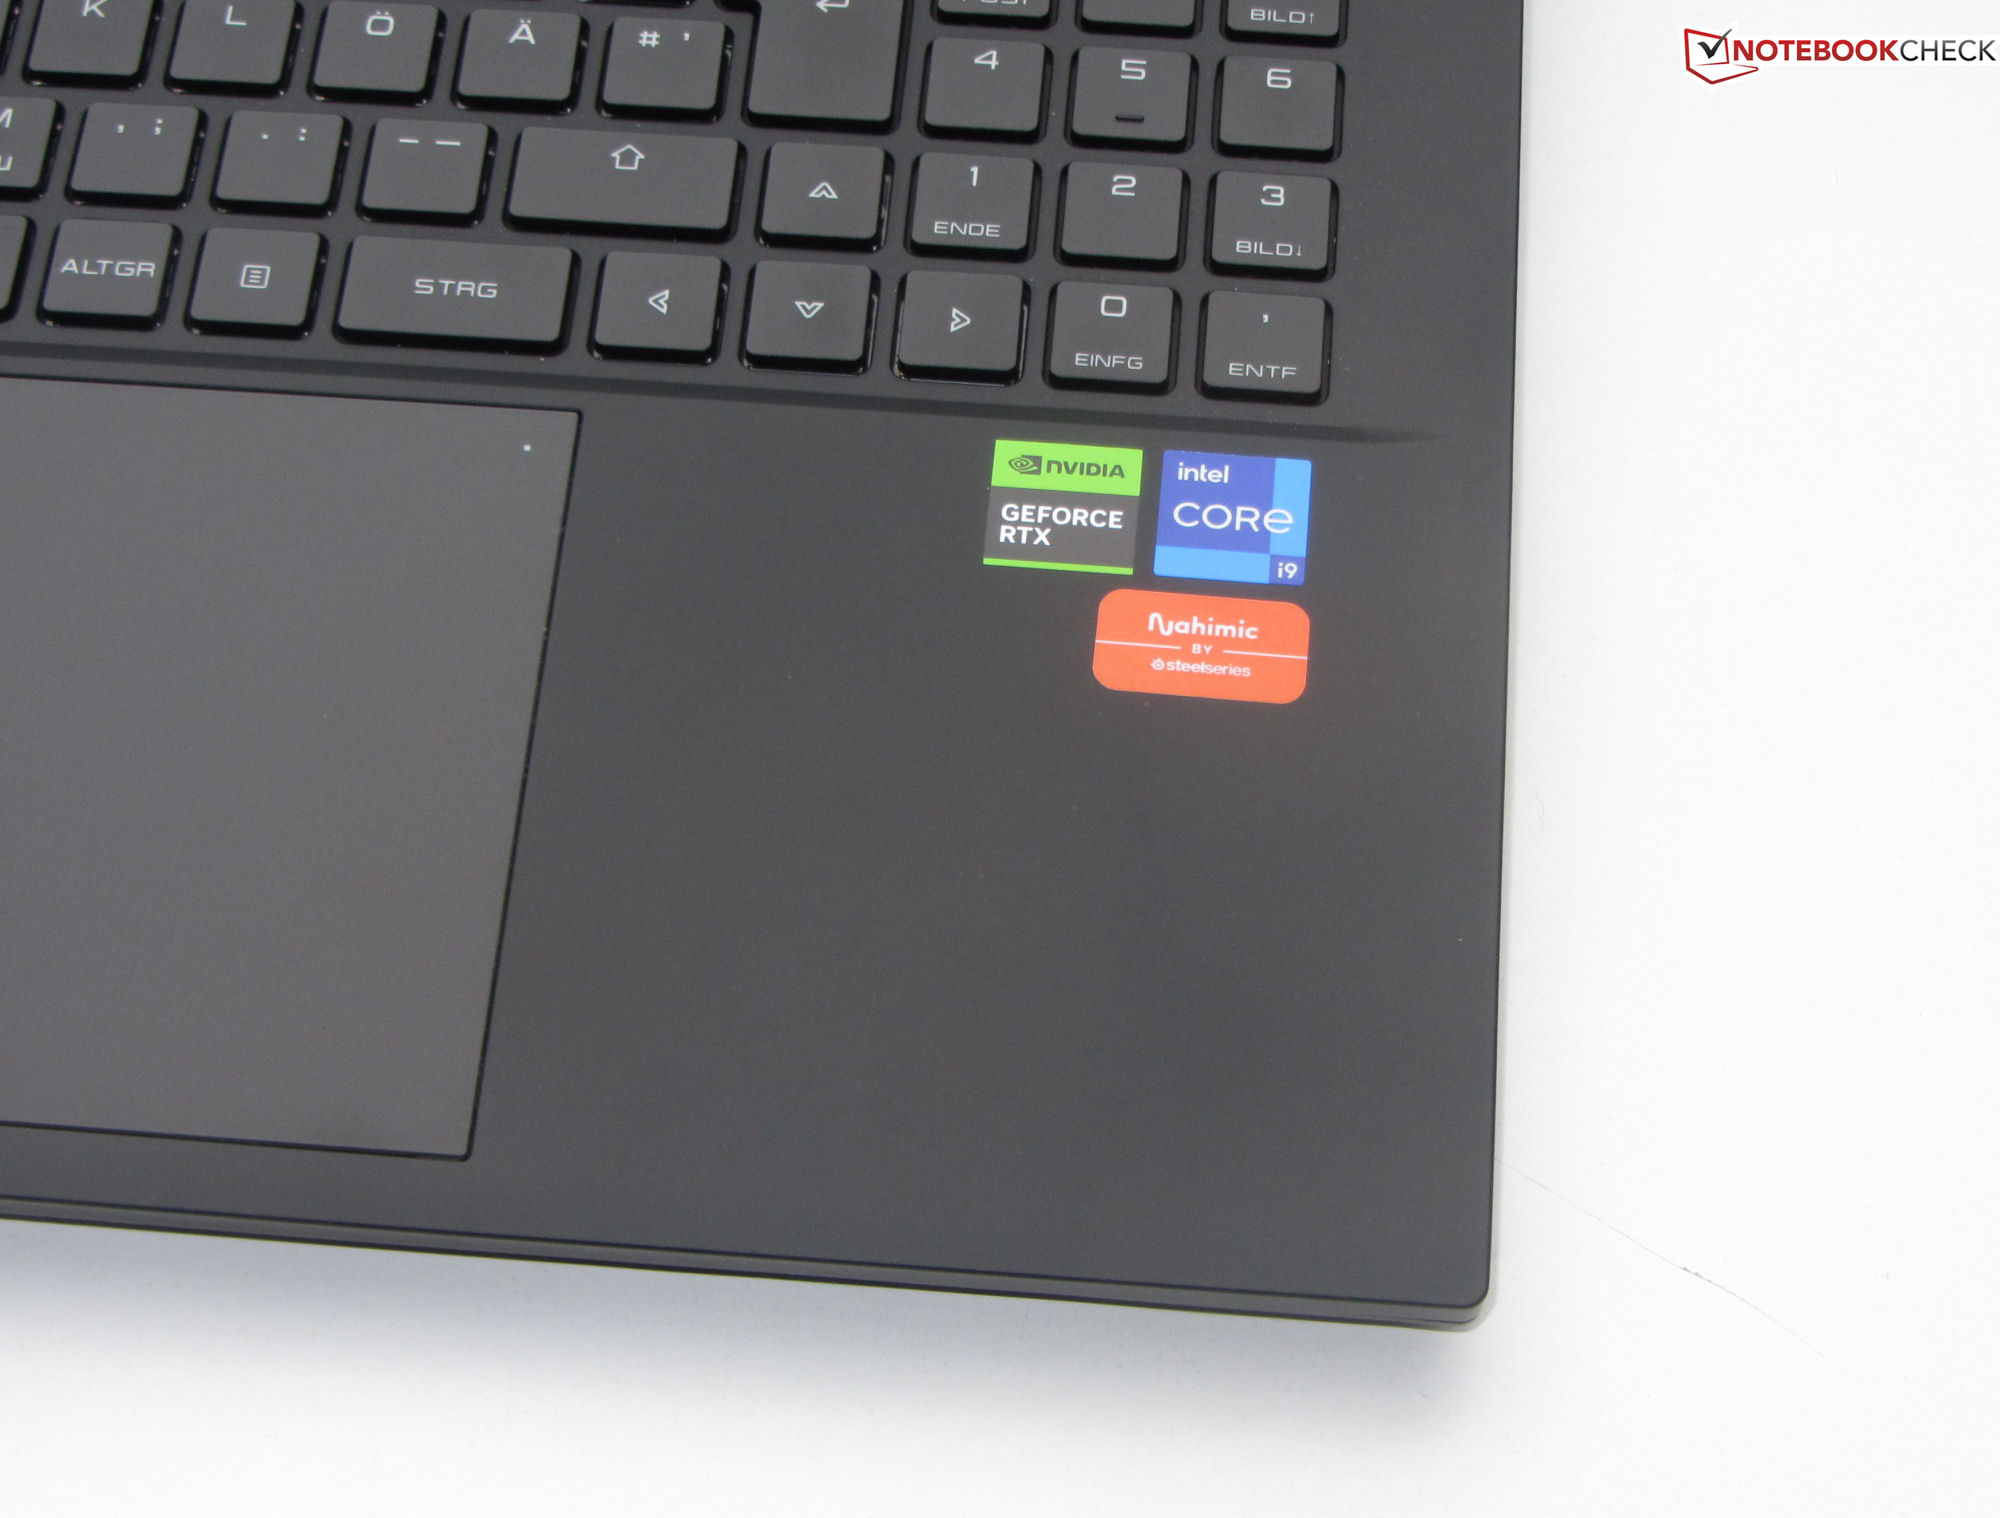
Performance - Raptor Lake rencontre Ada Lovelace
Bien qu'il soit conçu principalement pour les jeux en QHD+, l'Erazer Beast X40 fait également bonne figure dans des applications telles que l'édition vidéo et le rendu. La puissance de calcul nécessaire est fournie par Raptor Lake et Ada Lovelace. Le modèle X40 présenté dans cet article est disponible pour environ 4 500 € (4 856 $). Mais Medion propose également une configuration légèrement inférieure (RTX 4080 et disque SSD de 1 To ; autrement identique) à 3 500 € (3 777 $).
Conditions d'essai
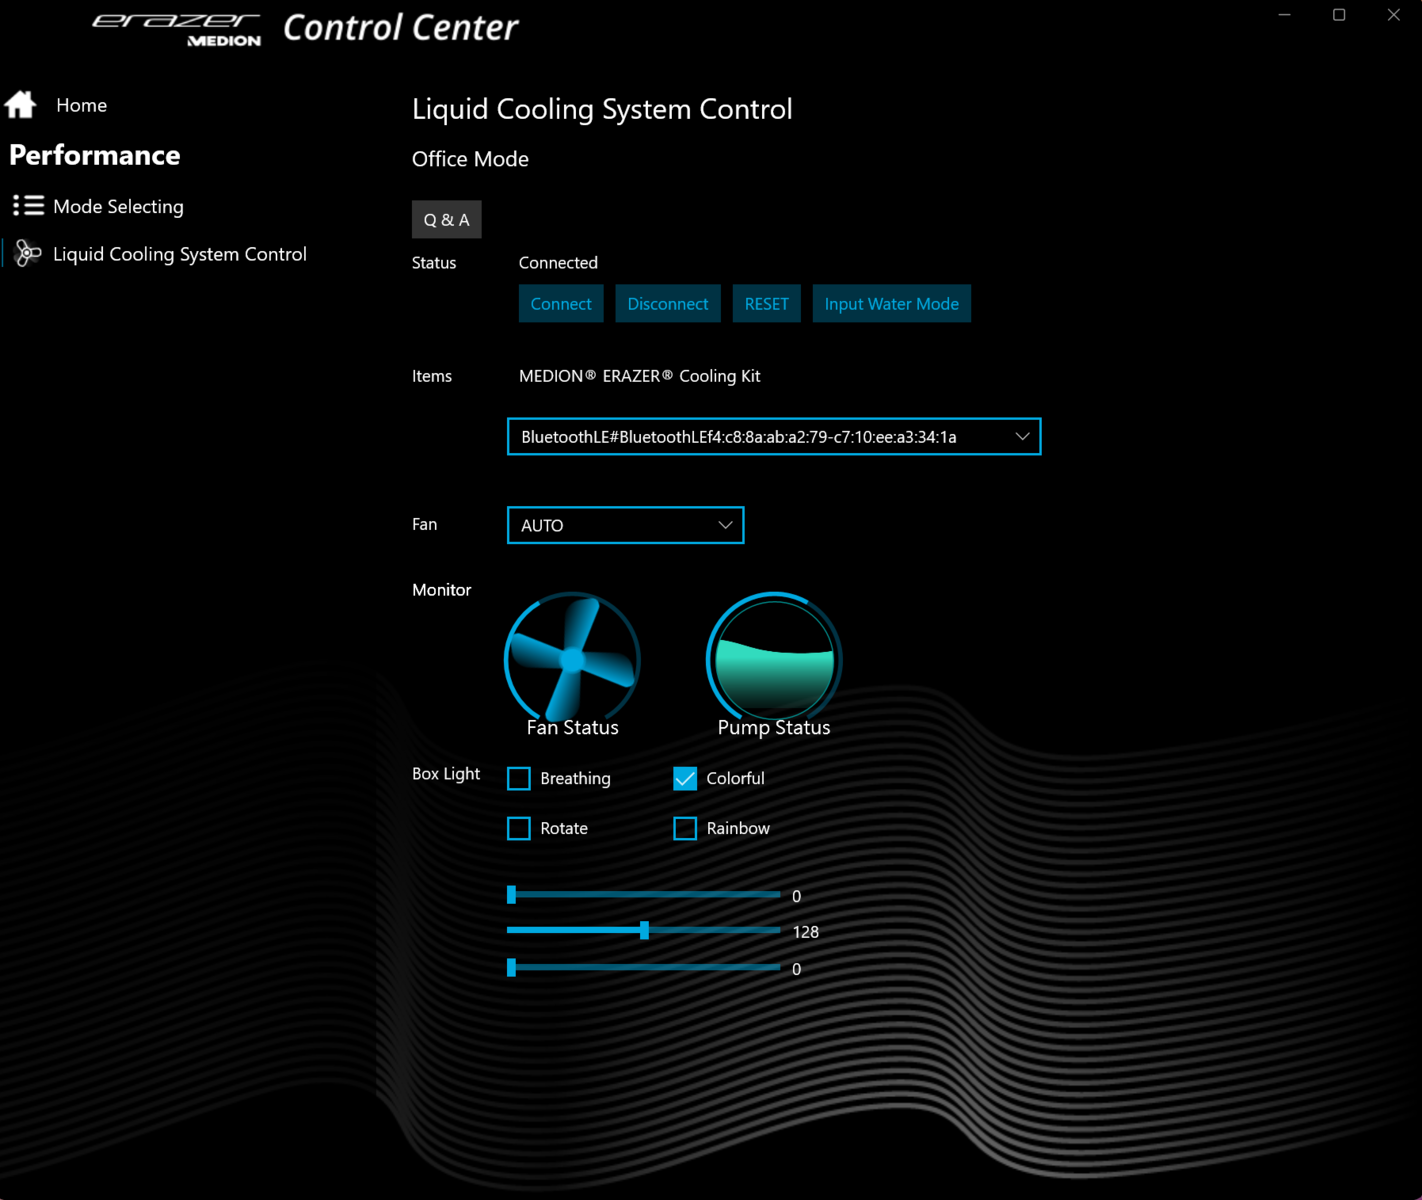
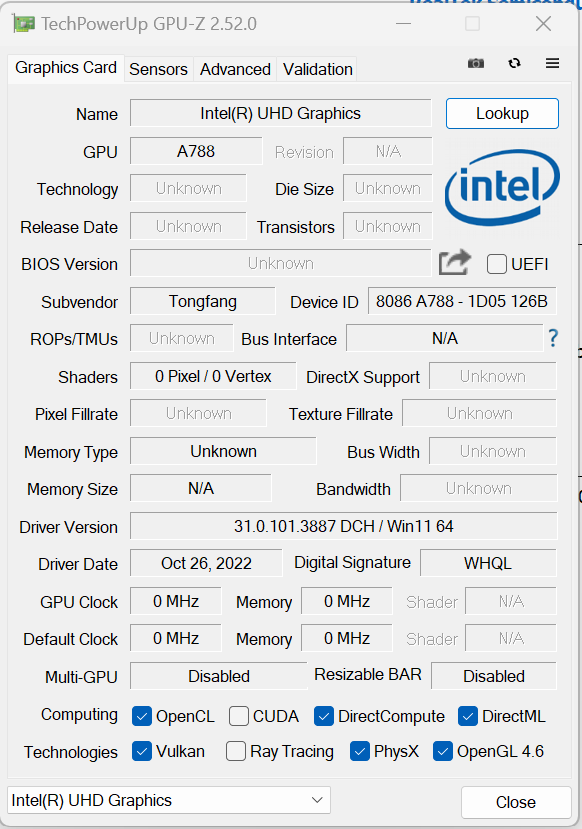
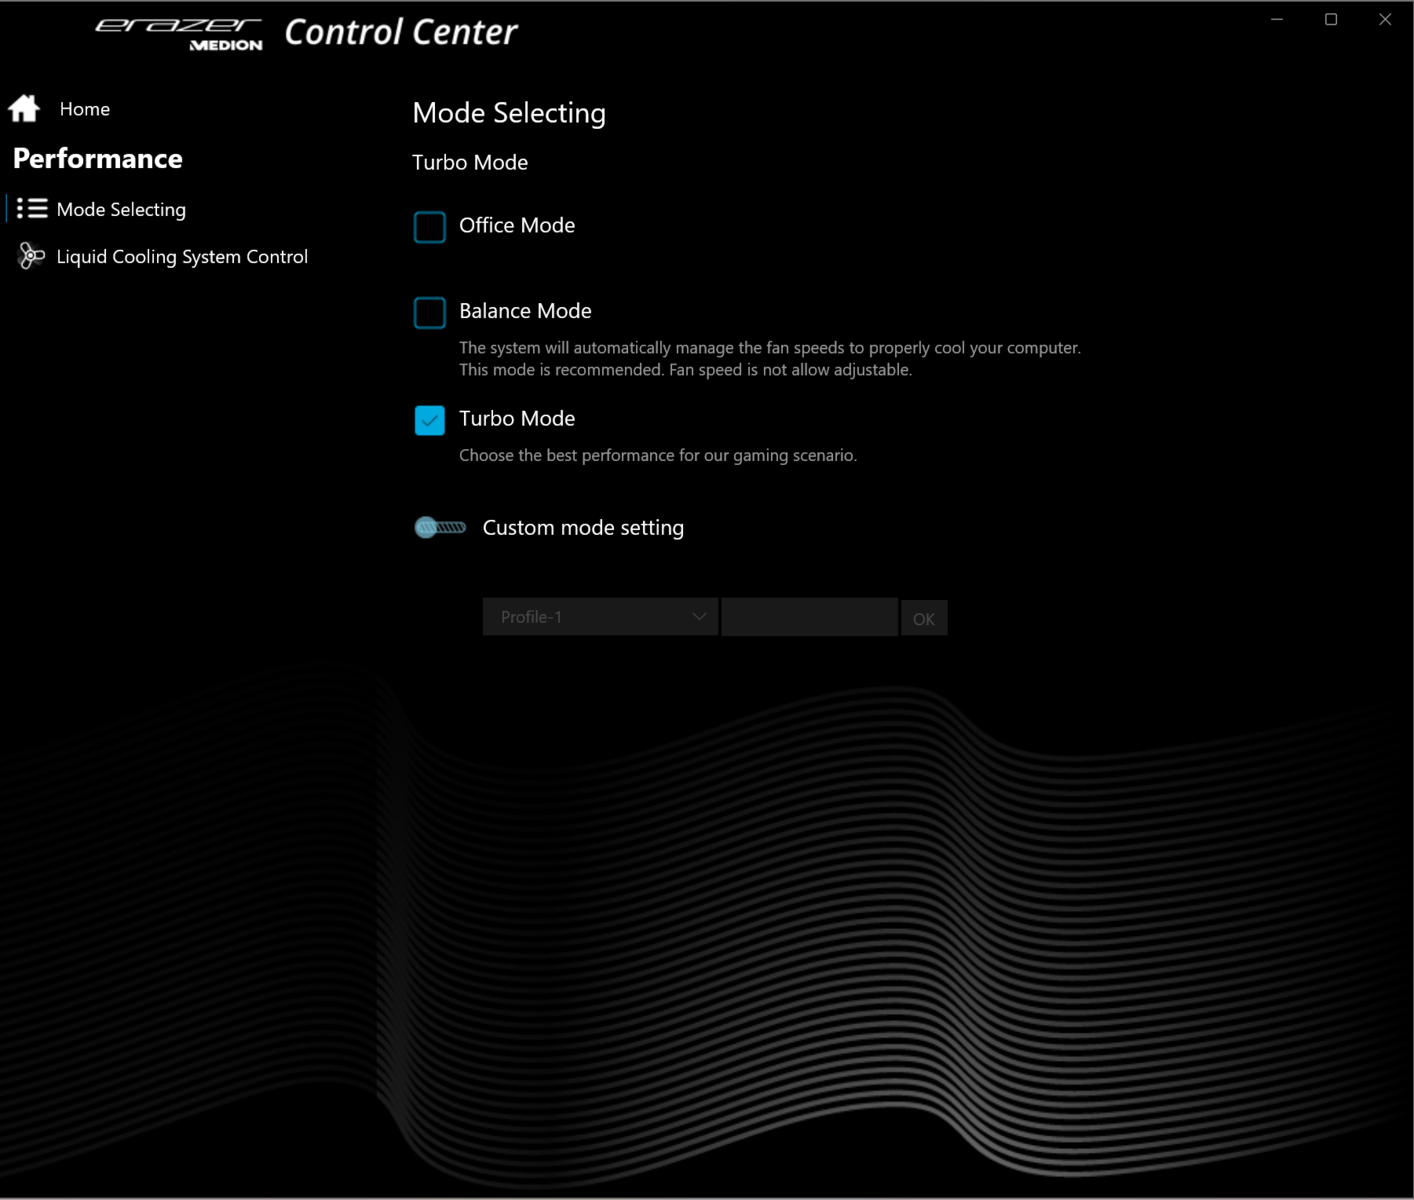
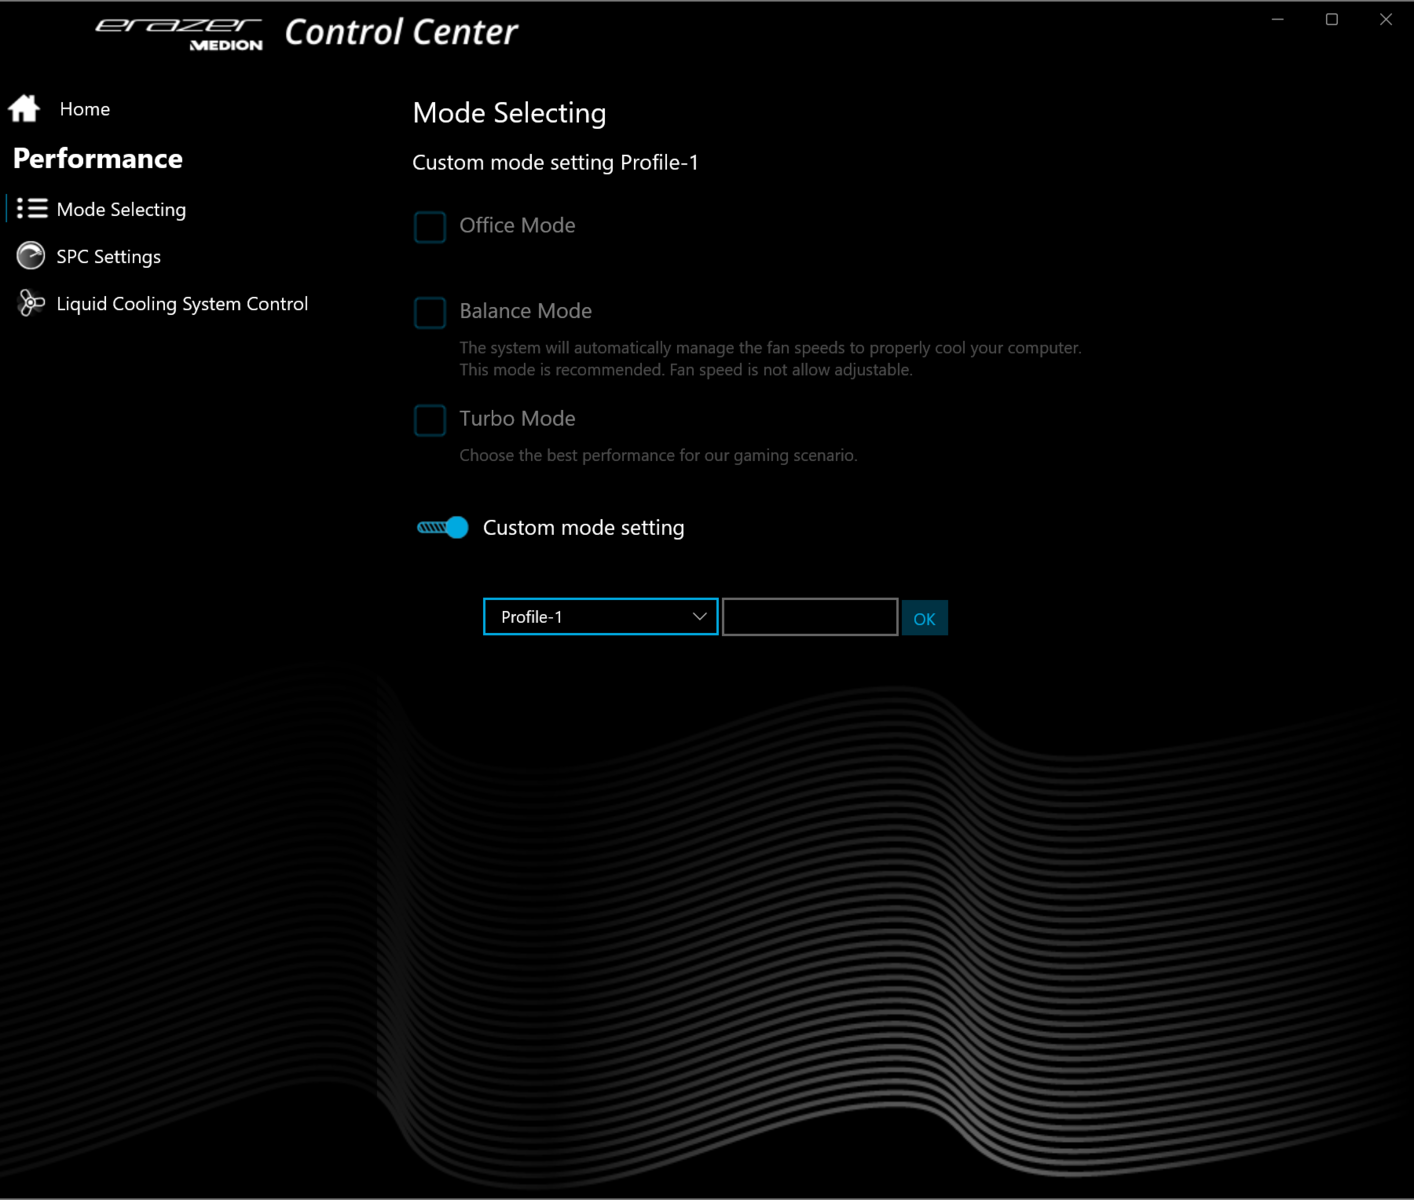
Il existe trois modes de performance spécifiés par le fabricant : Office, Balance et Turbo. Nous avons utilisé le mode Turbo pour les analyses comparatives et le mode Office pour nos tests de durée de vie de la batterie, et nous avons activé Nvidia Optimus dans les deux cas. Une fois ces tests terminés, nous avons effectué d'autres tests de référence en activant le mode dGPU et en branchant le refroidisseur d'eau externe. Vous trouverez les résultats de ces tests supplémentaires dans le tableau comparatif, mais ils ne sont pas pris en compte pour l'évaluation.
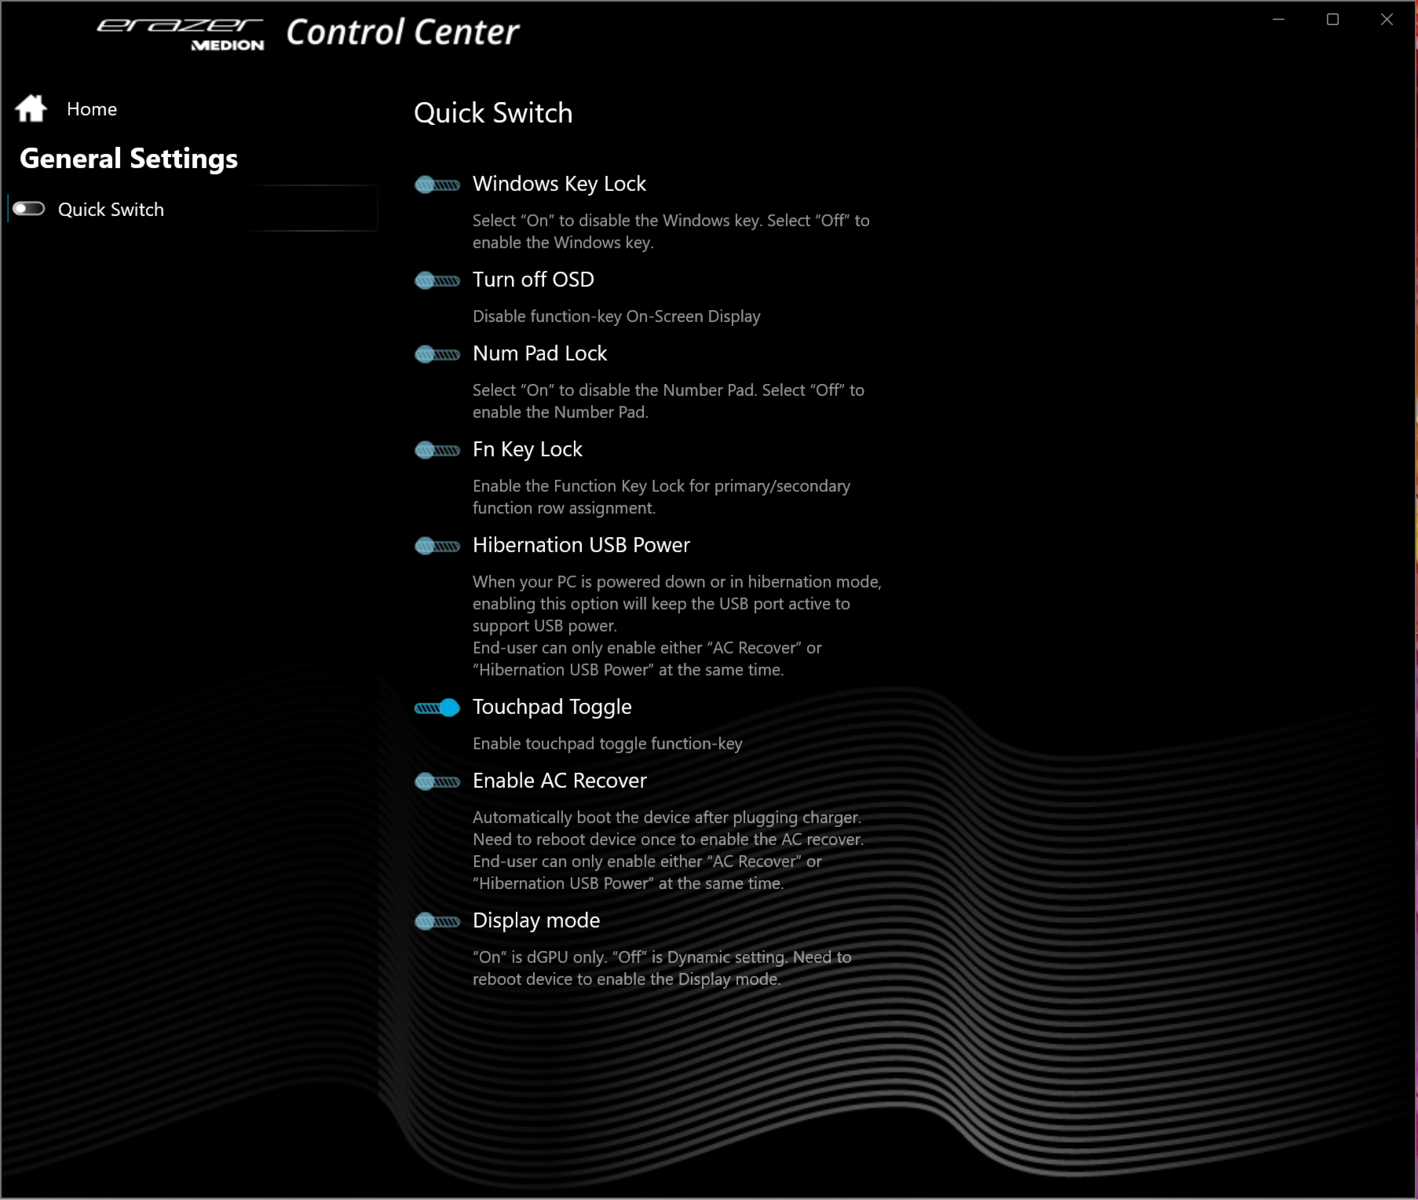
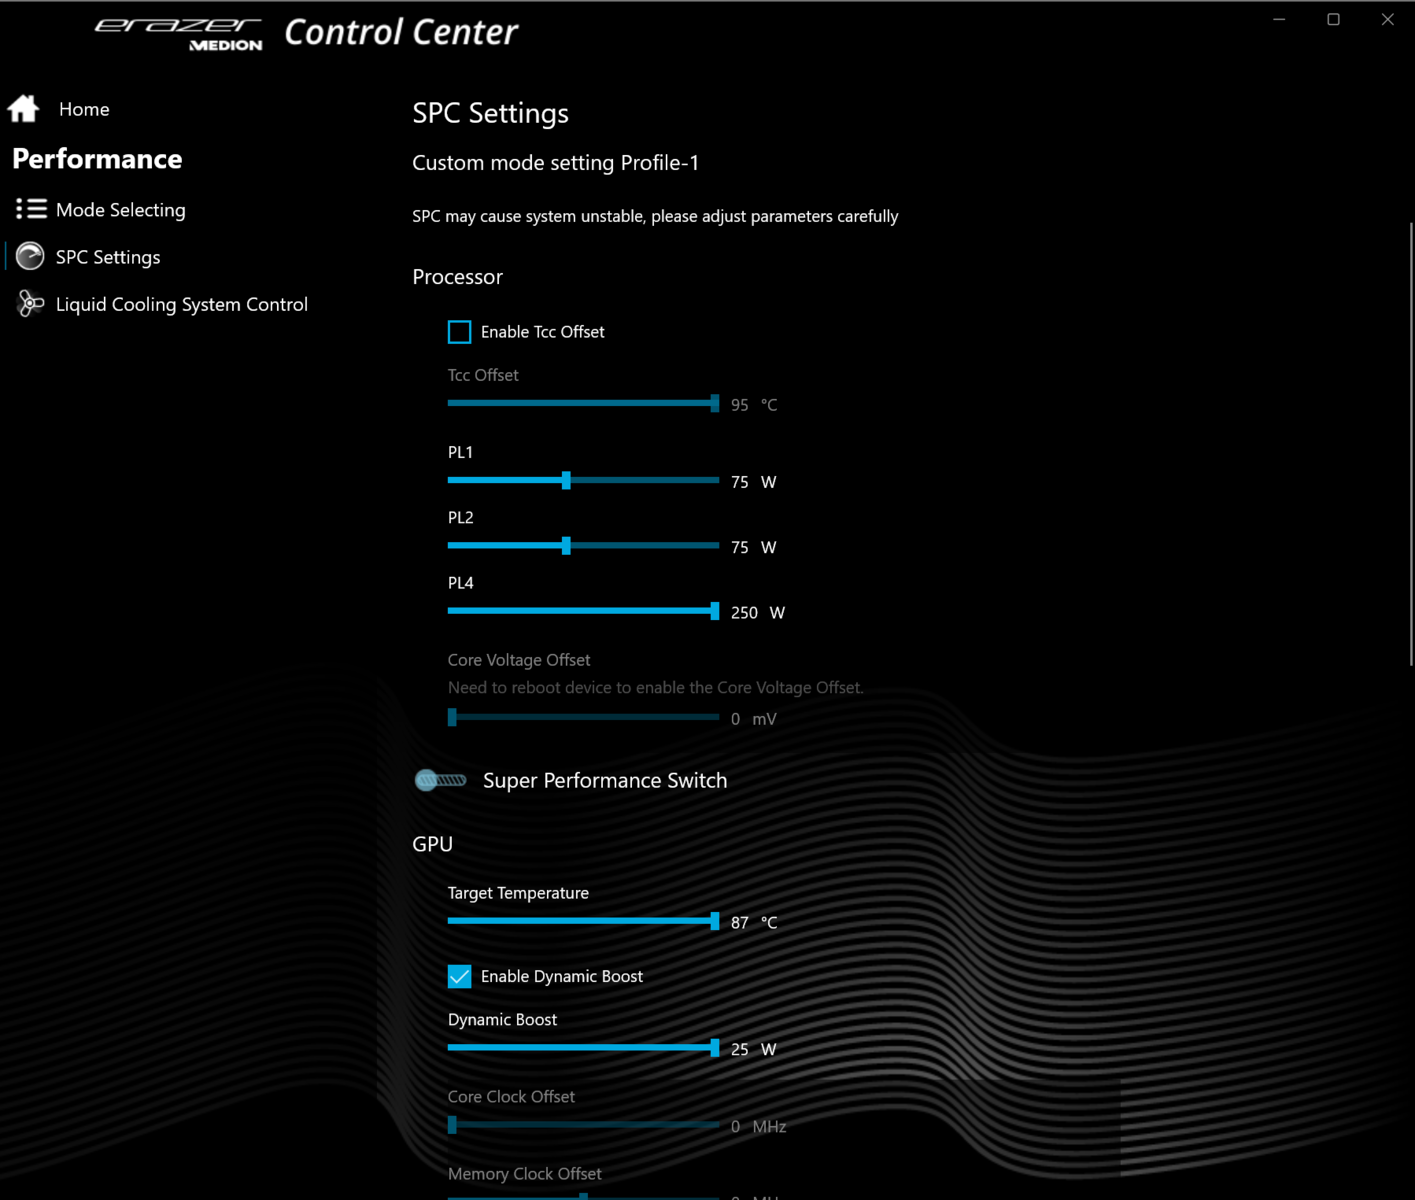
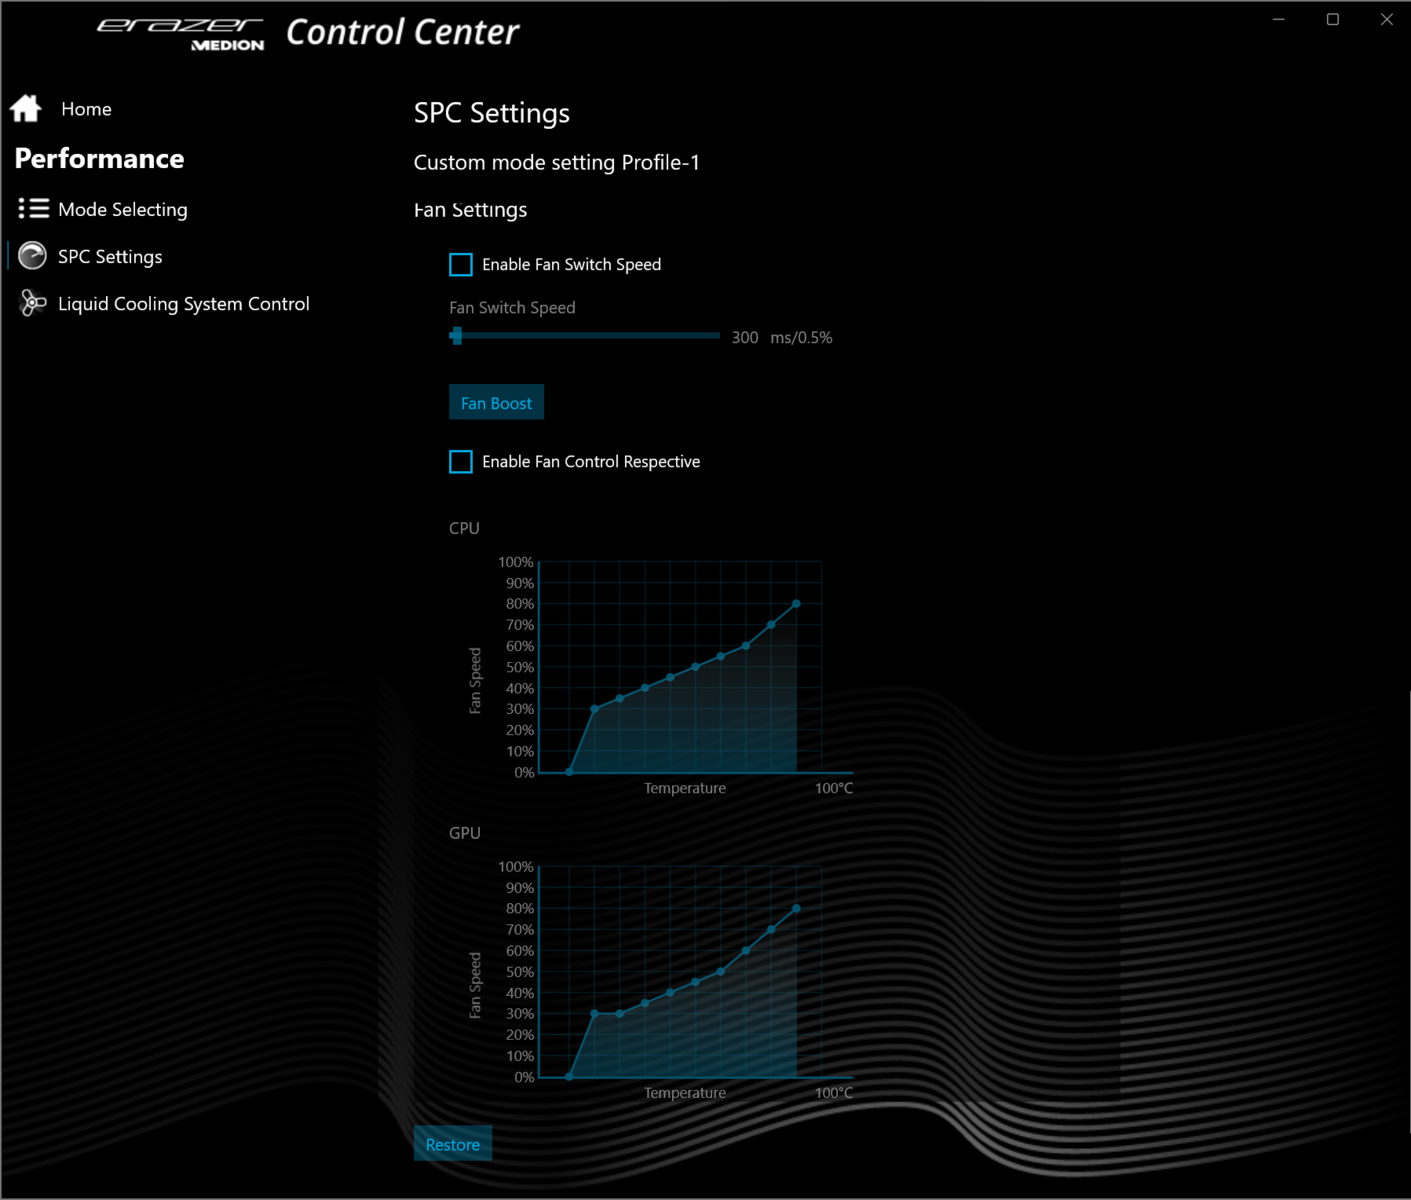
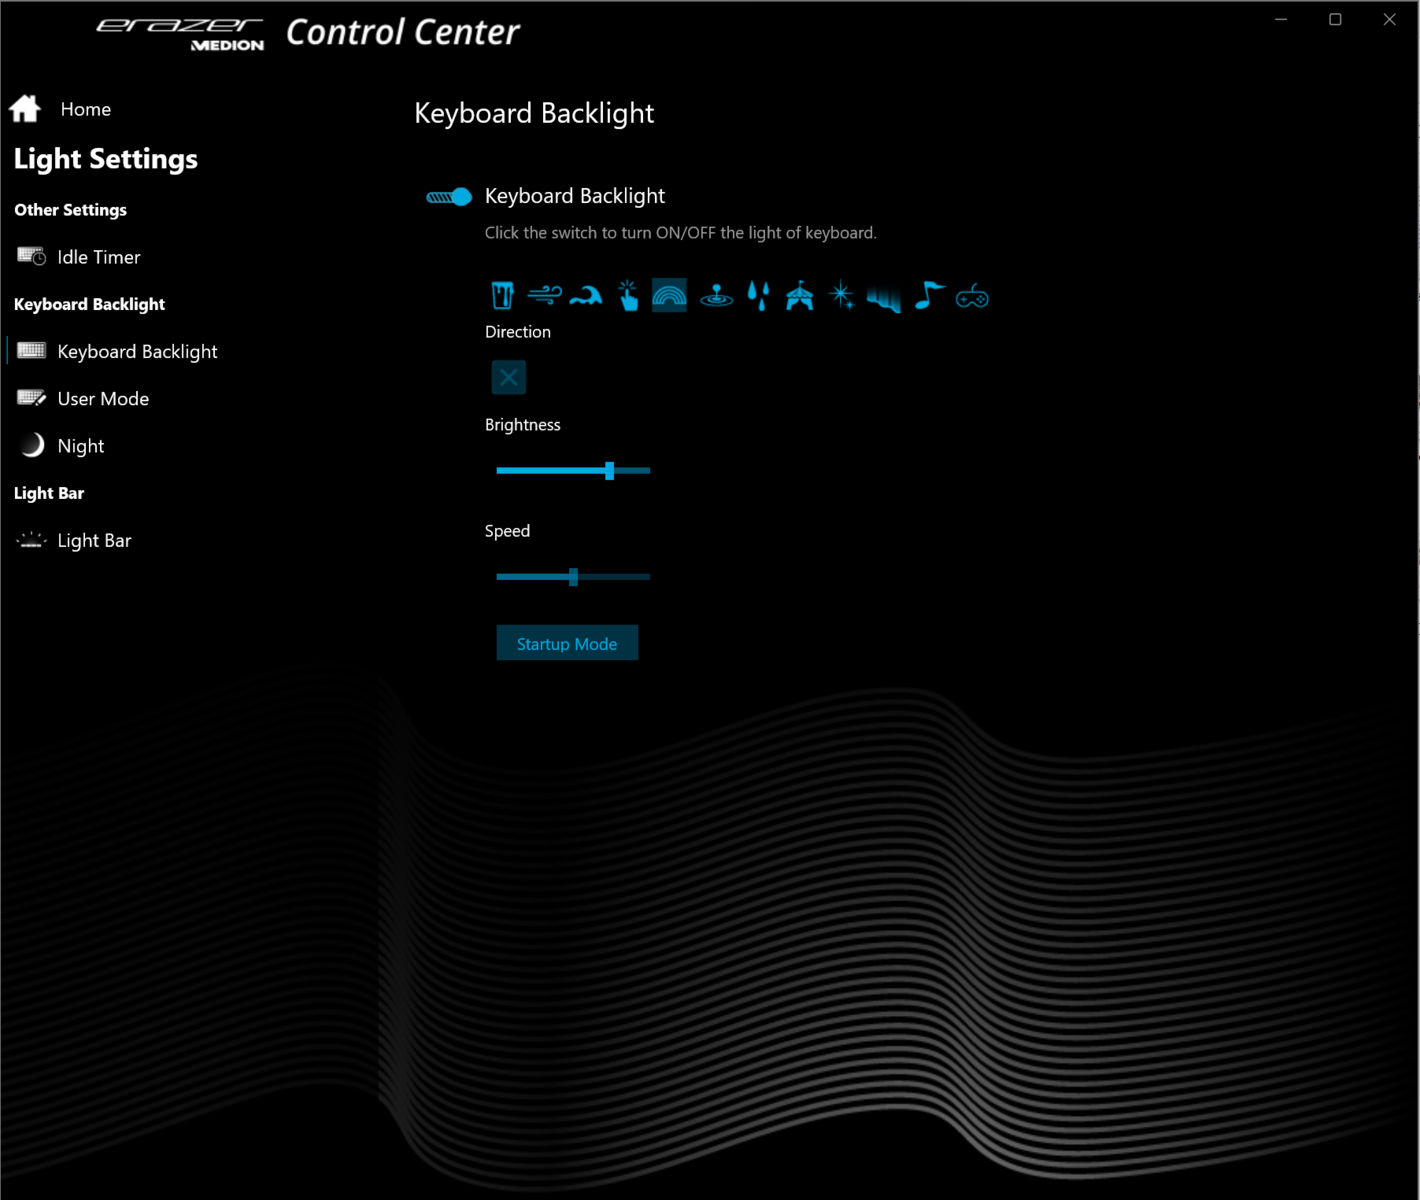
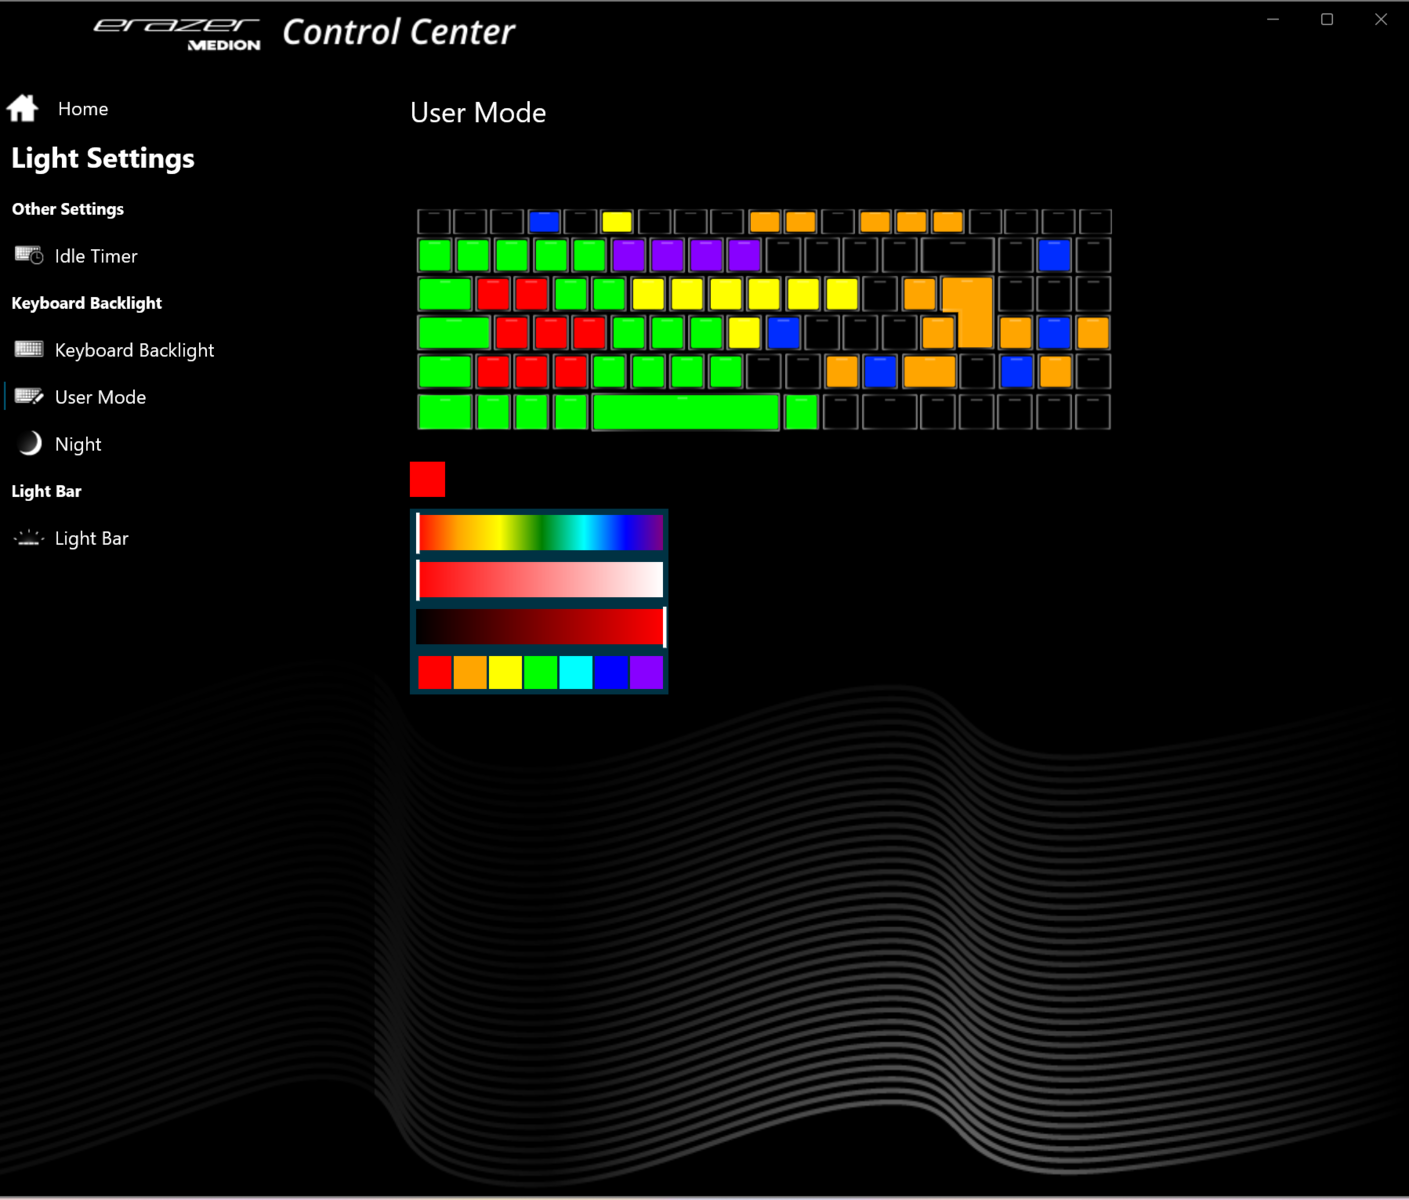
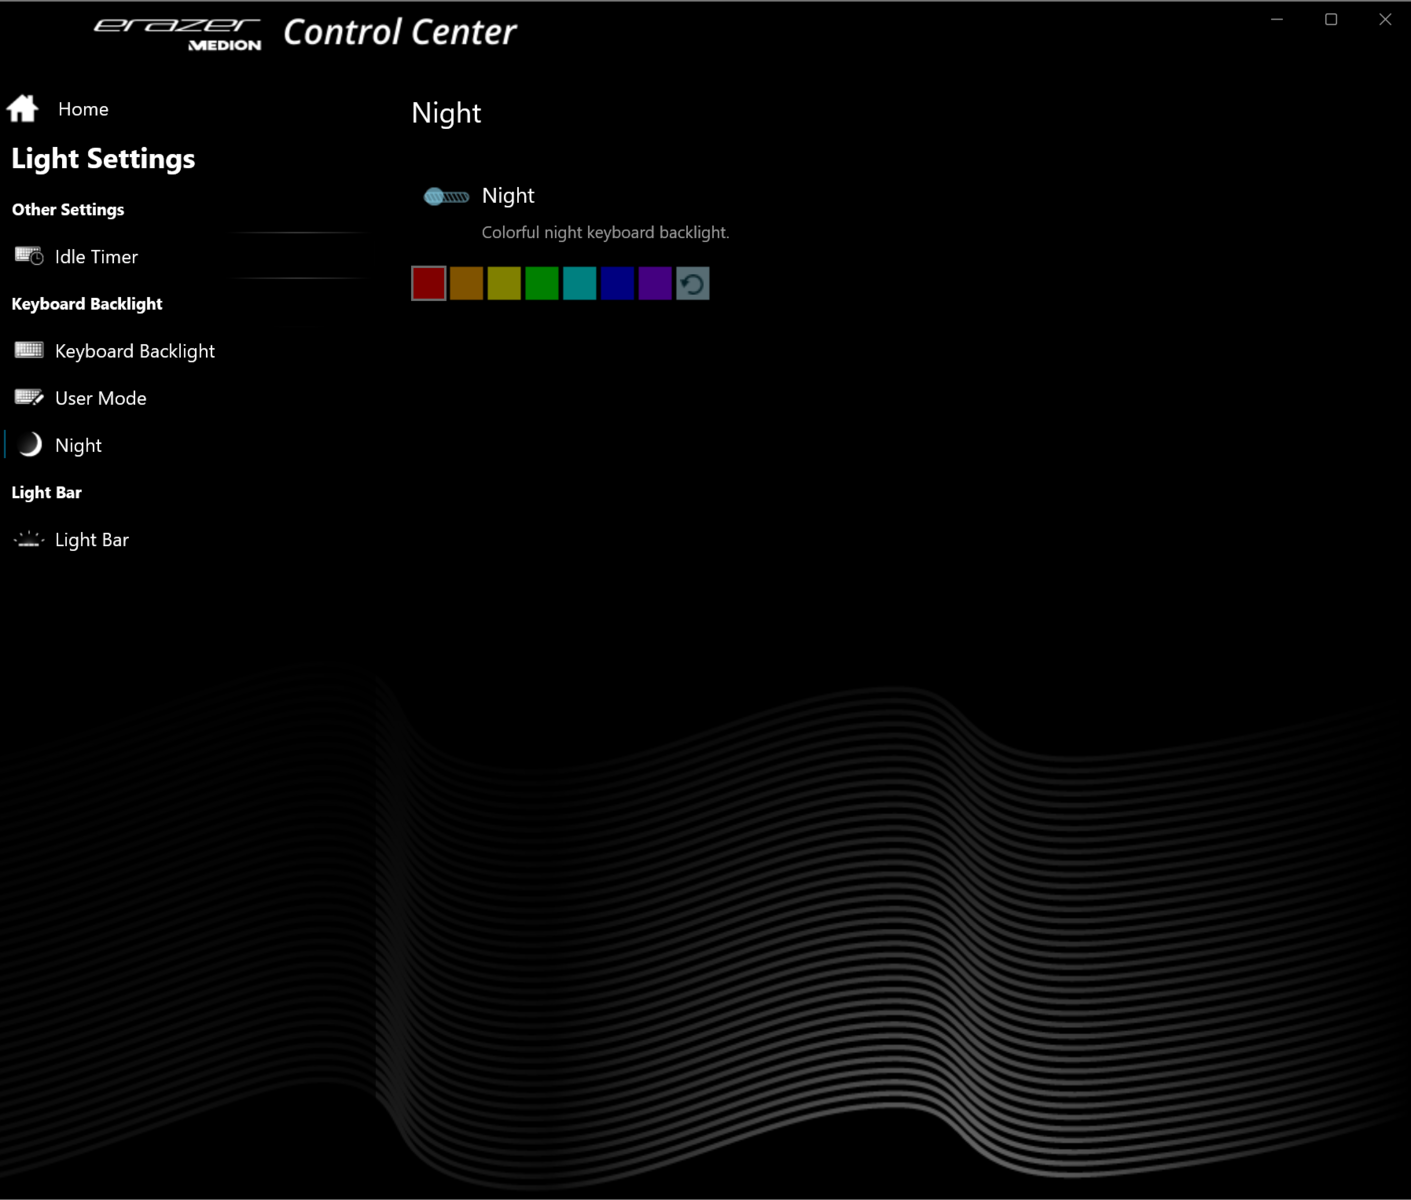
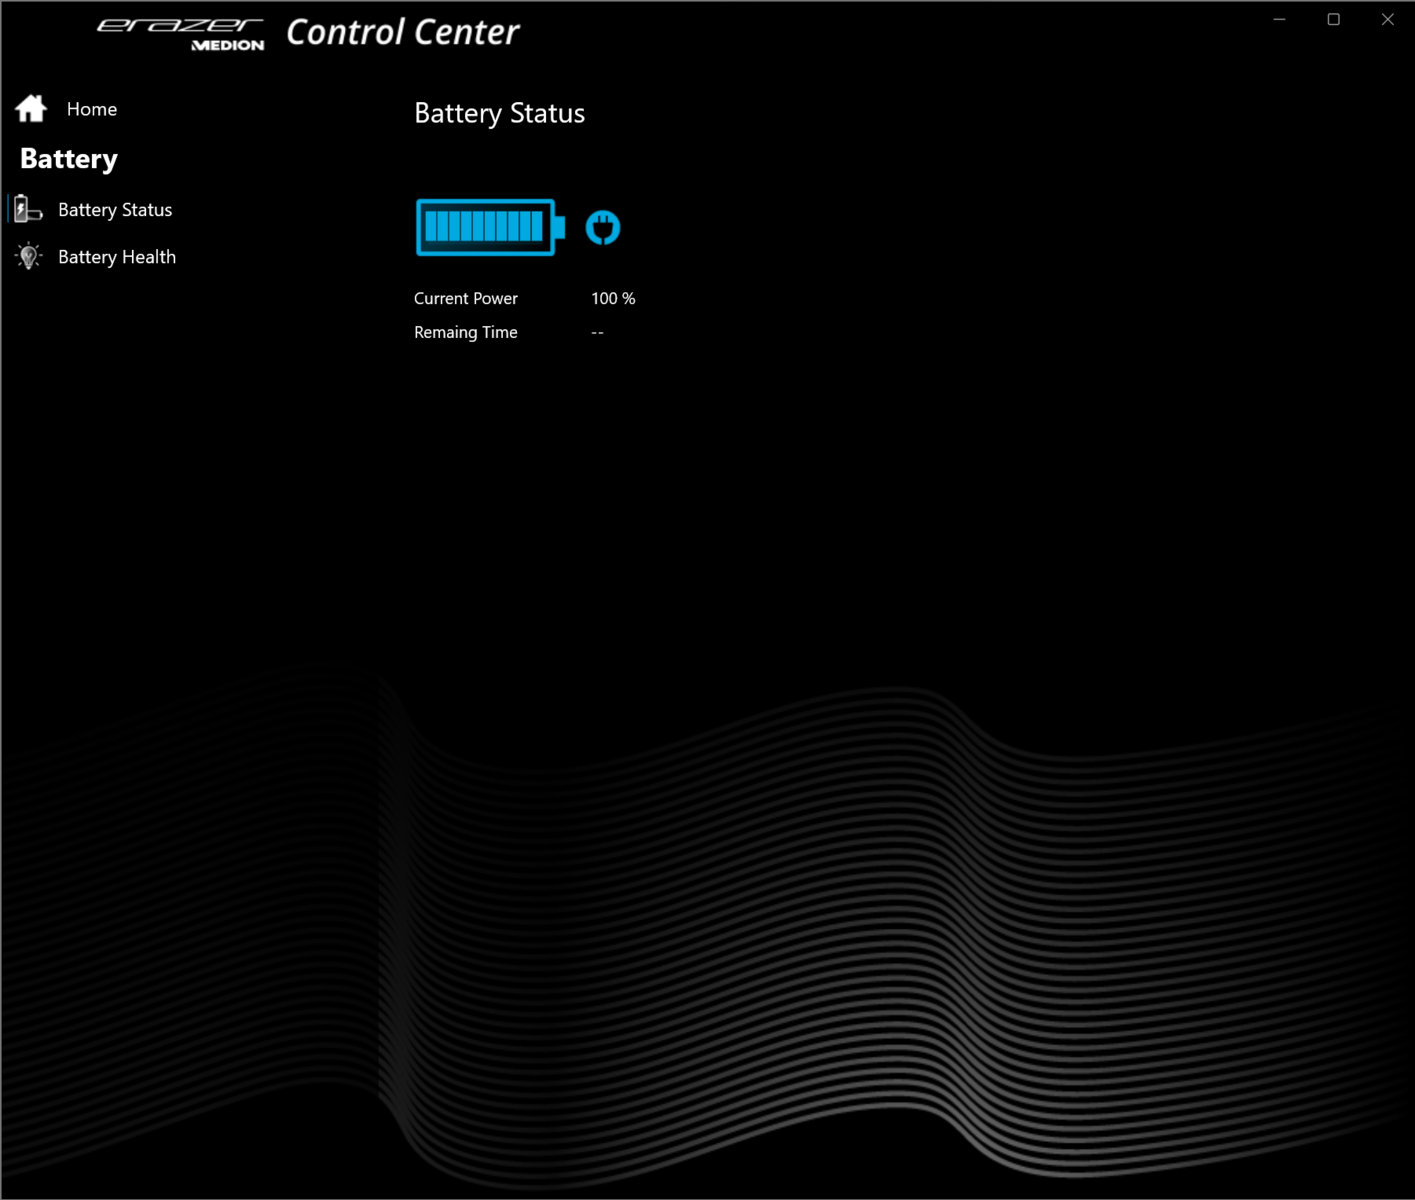
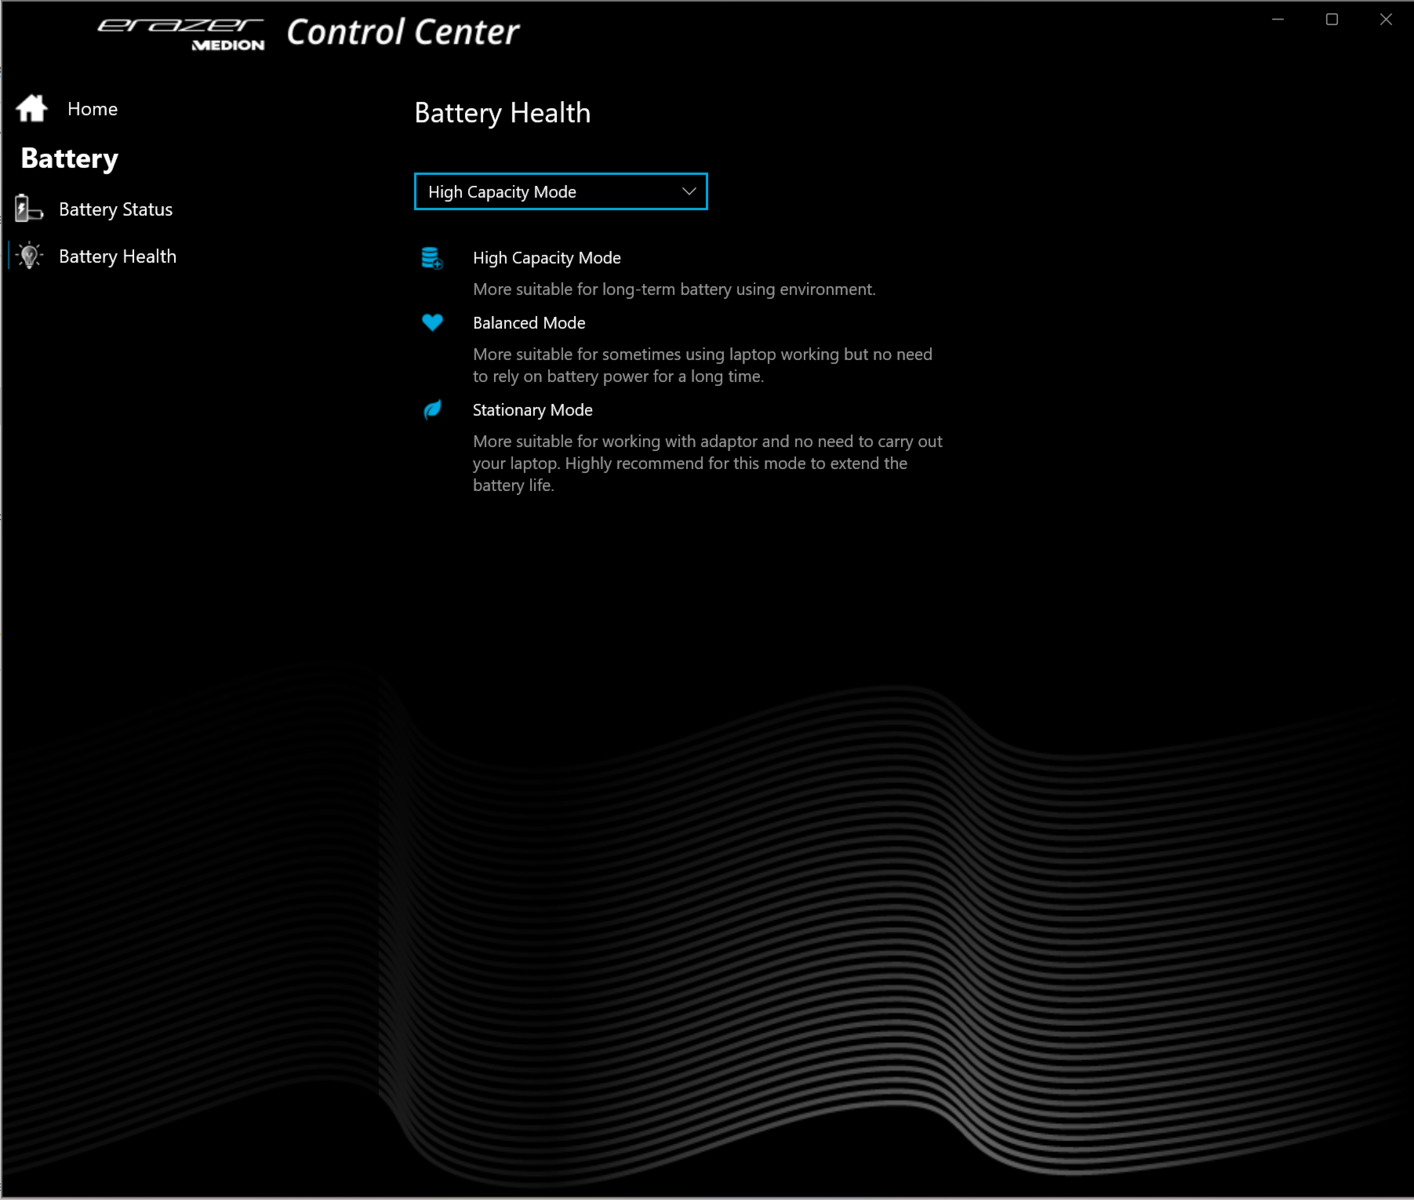
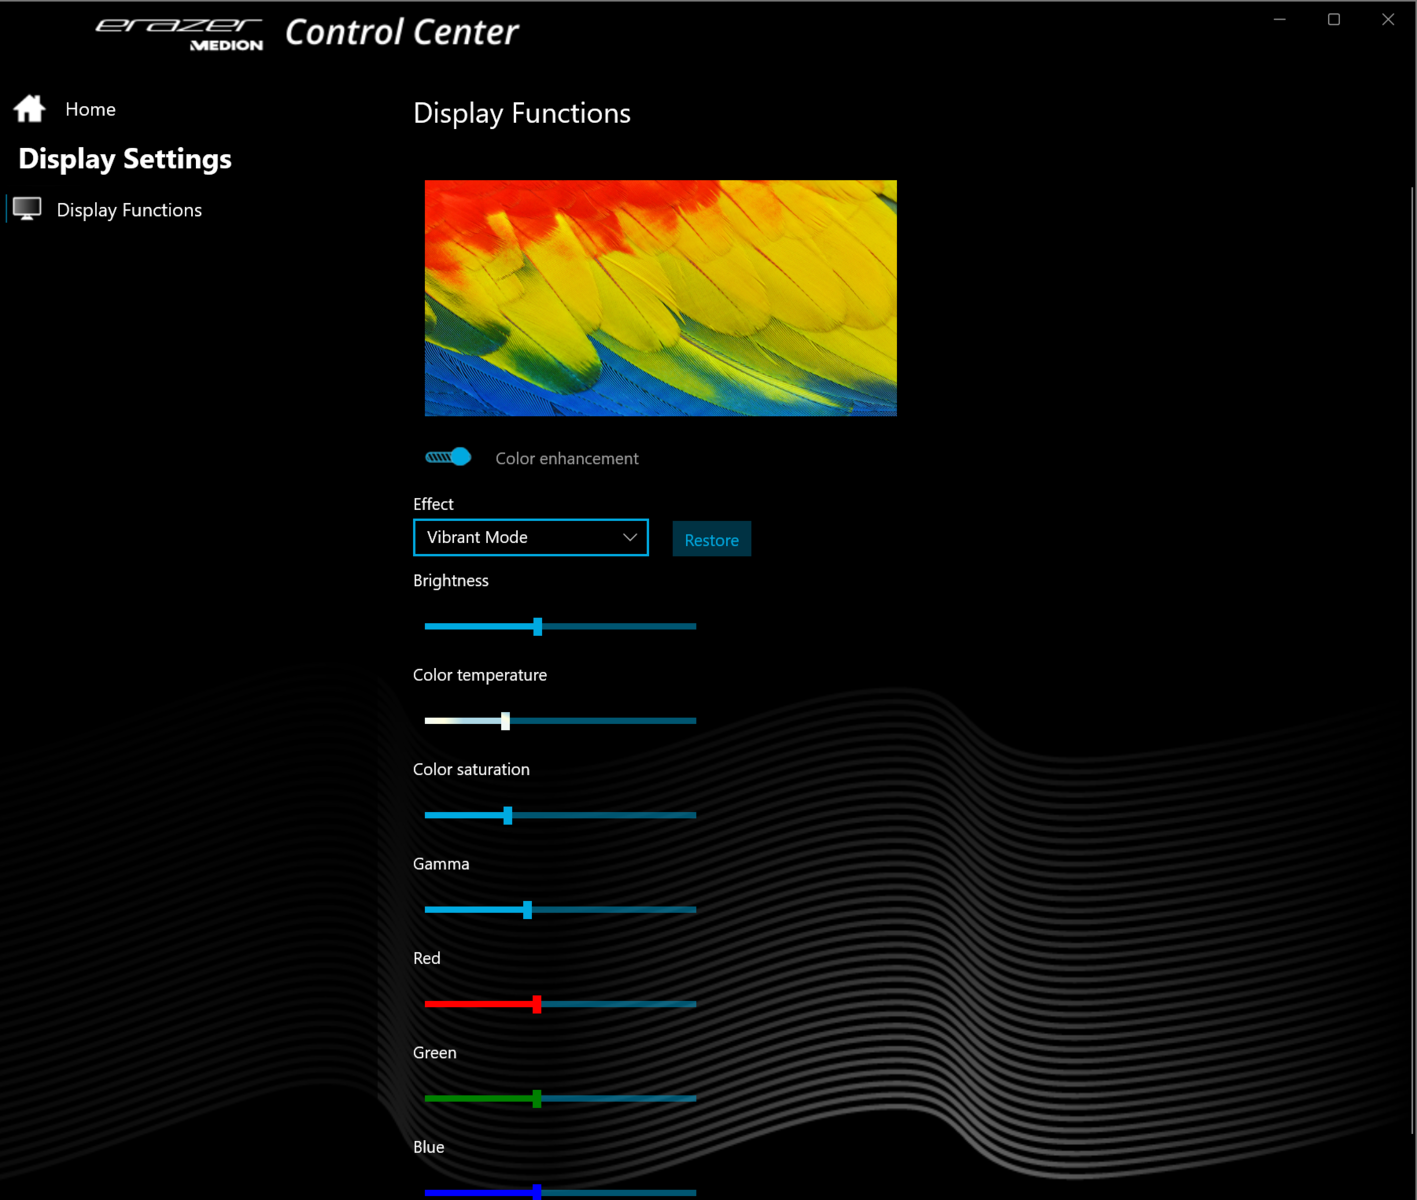
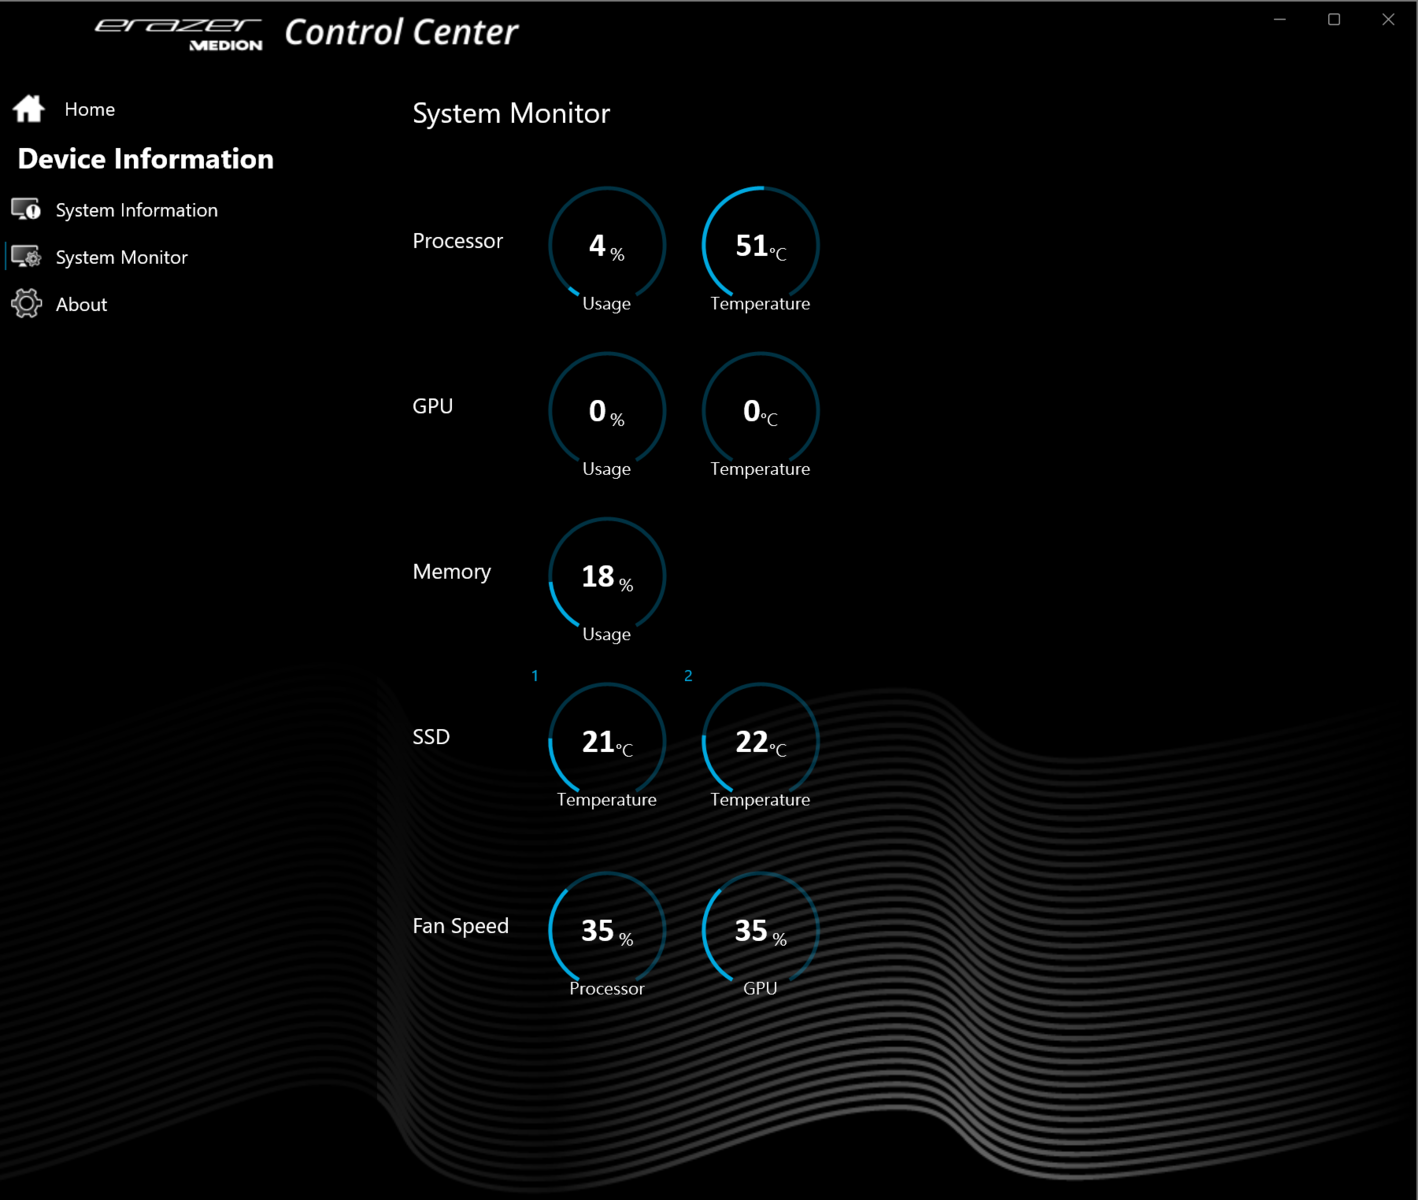
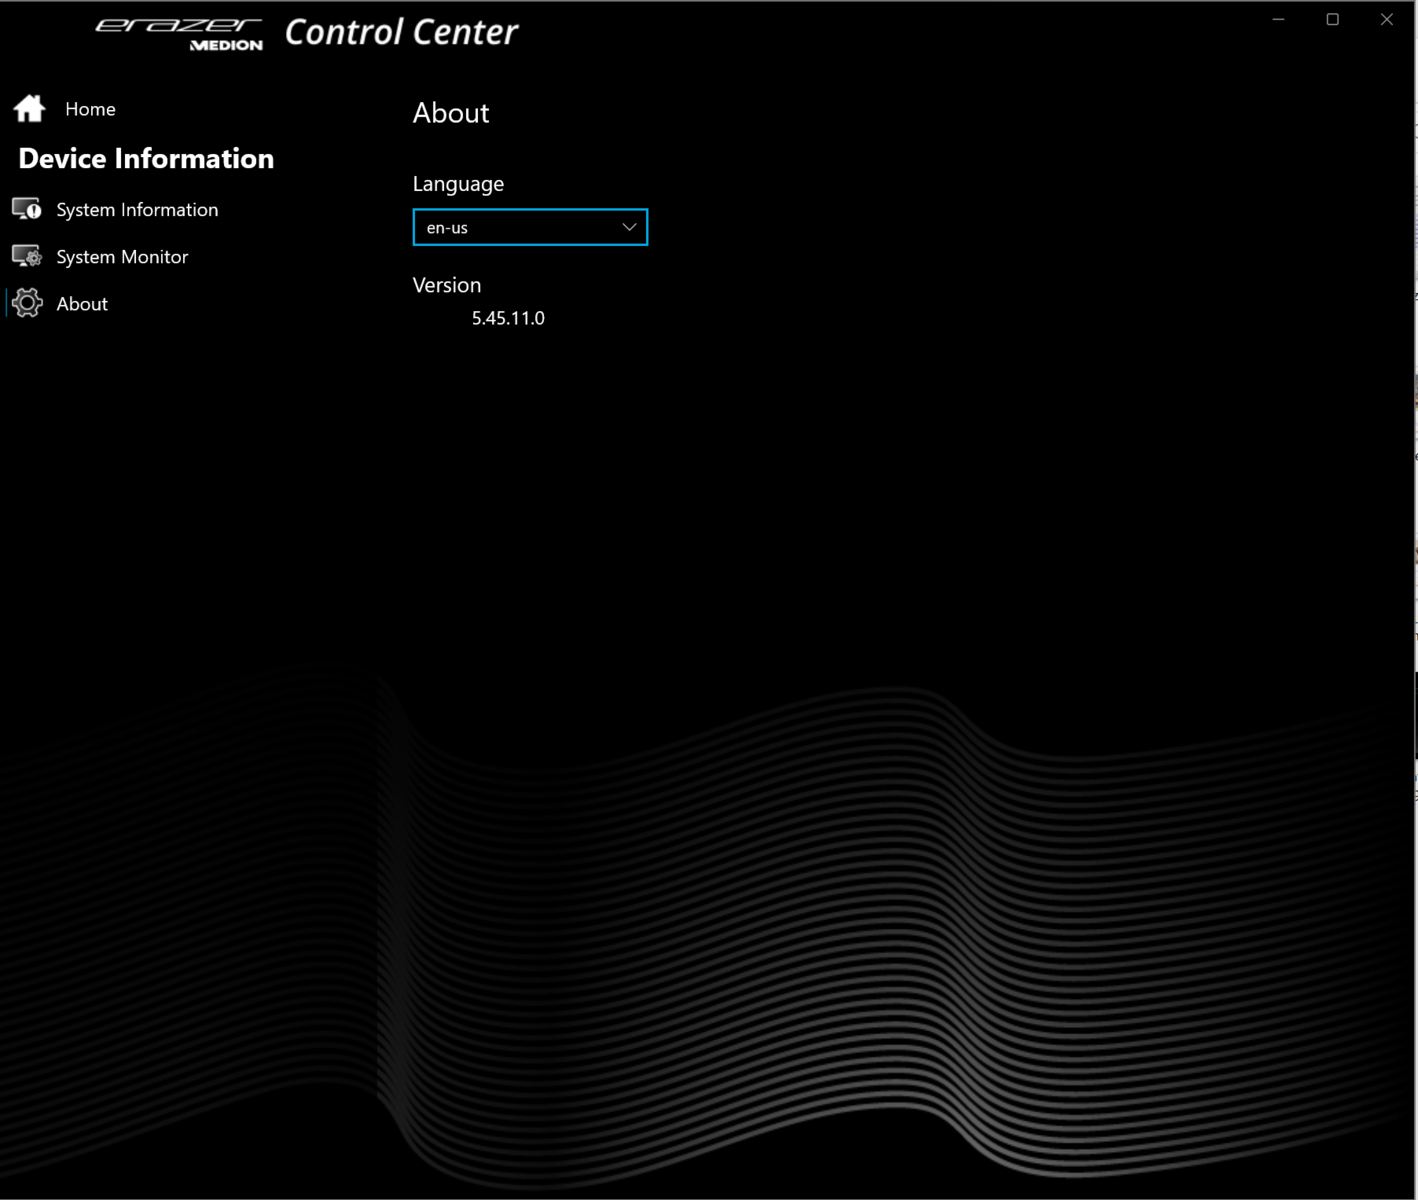
Les utilisateurs peuvent basculer entre les trois modes à l'aide d'un bouton dédié situé juste à côté du bouton d'alimentation. Une LED d'état indique quel mode est actuellement activé. Il est également possible de créer des profils personnalisés à l'aide du logiciel Control Center préinstallé. Par exemple, vous pouvez spécifier les limites de puissance du CPU, le TGP du GPU, les limites de température, etc.
Remarque : nous avons utilisé l'interface utilisateur anglaise du logiciel Control Center en raison de problèmes liés à la traduction allemande. Le logiciel vous permet de passer d'une langue à l'autre.
| Mode Turbo | Mode Balance | Mode Bureau | |
|---|---|---|---|
| Limite de puissance 1 | 160 Watt | 160 Watt | 160 Watt |
| Limite de puissance 2 | 160 Watt | 160 Watt | 160 Watt |
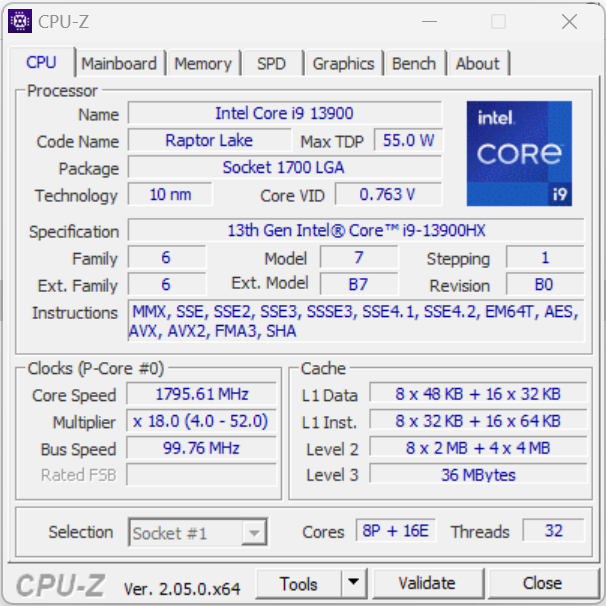
Processeur
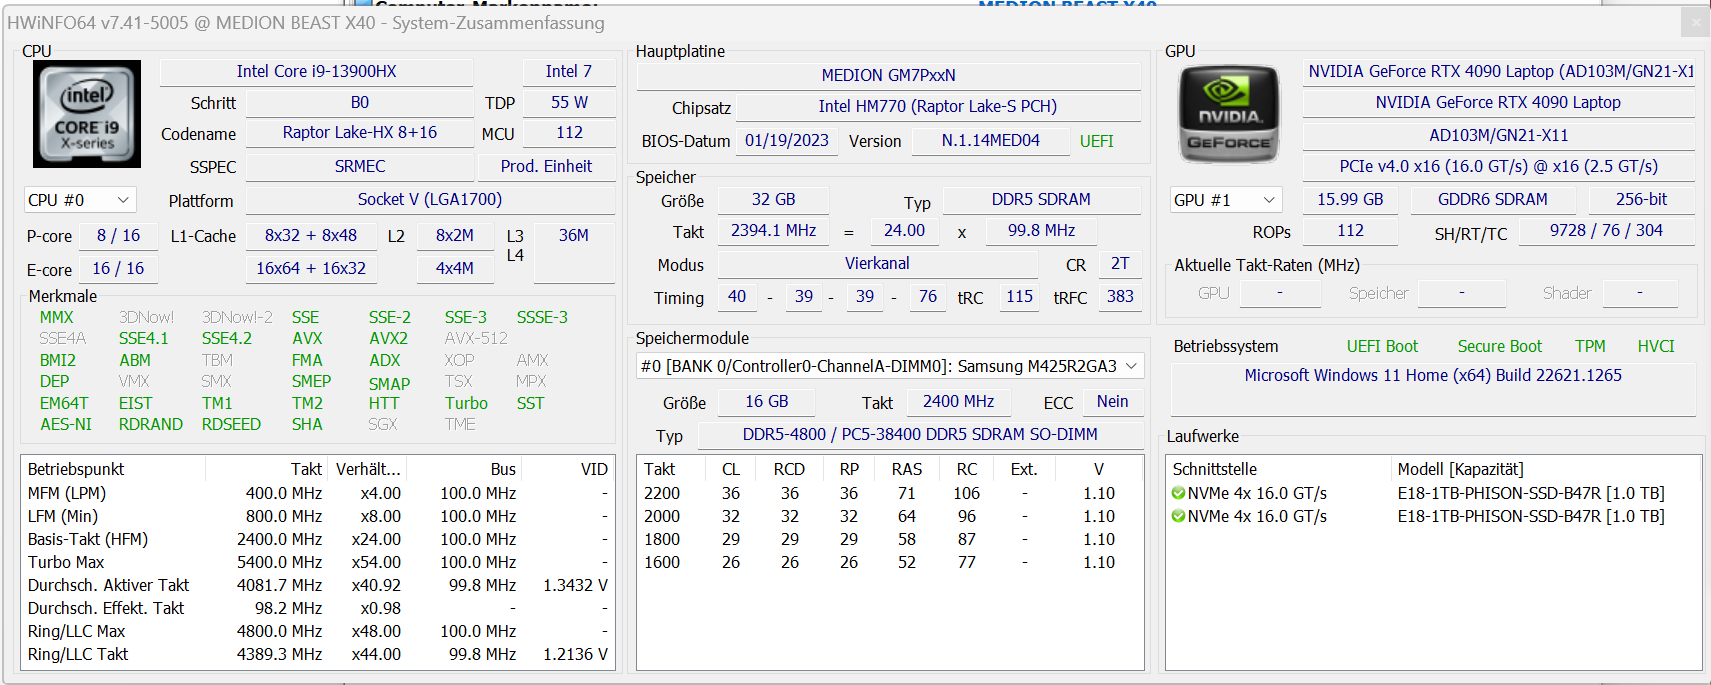
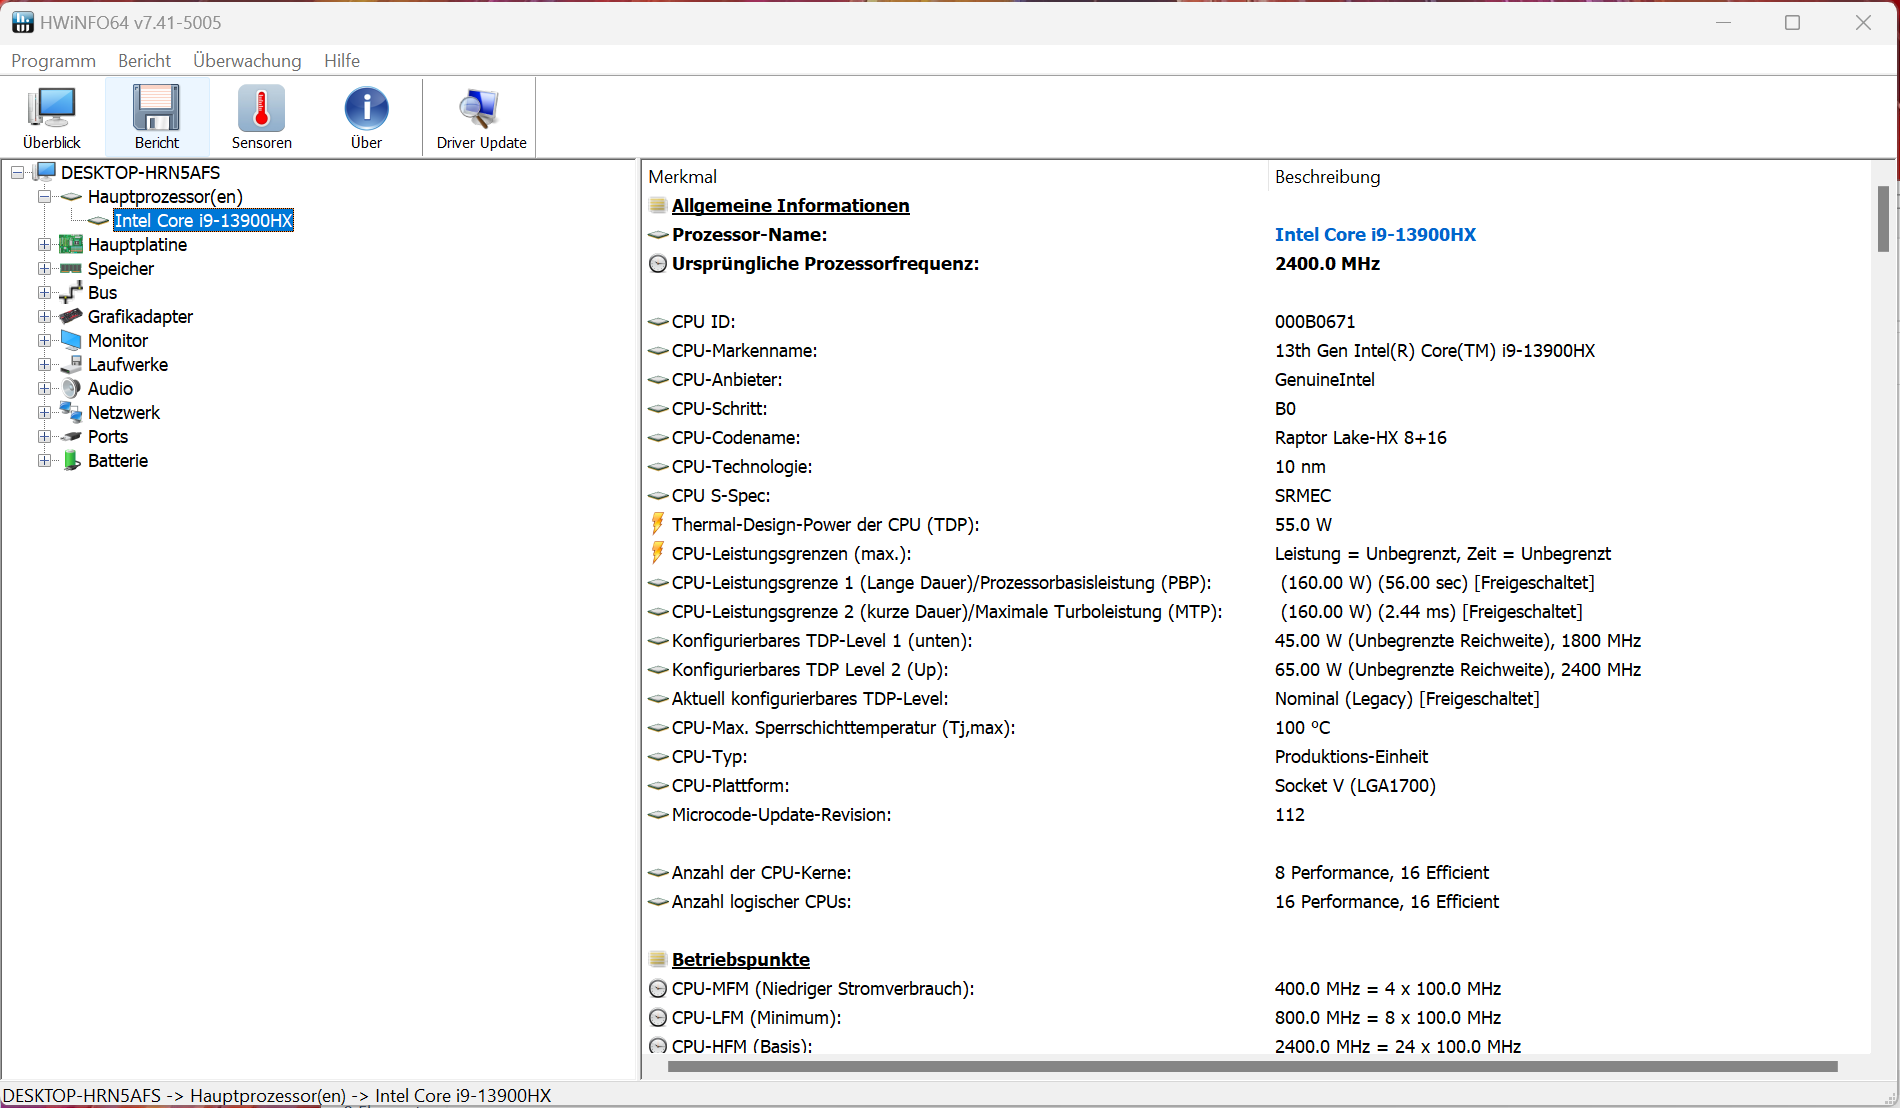
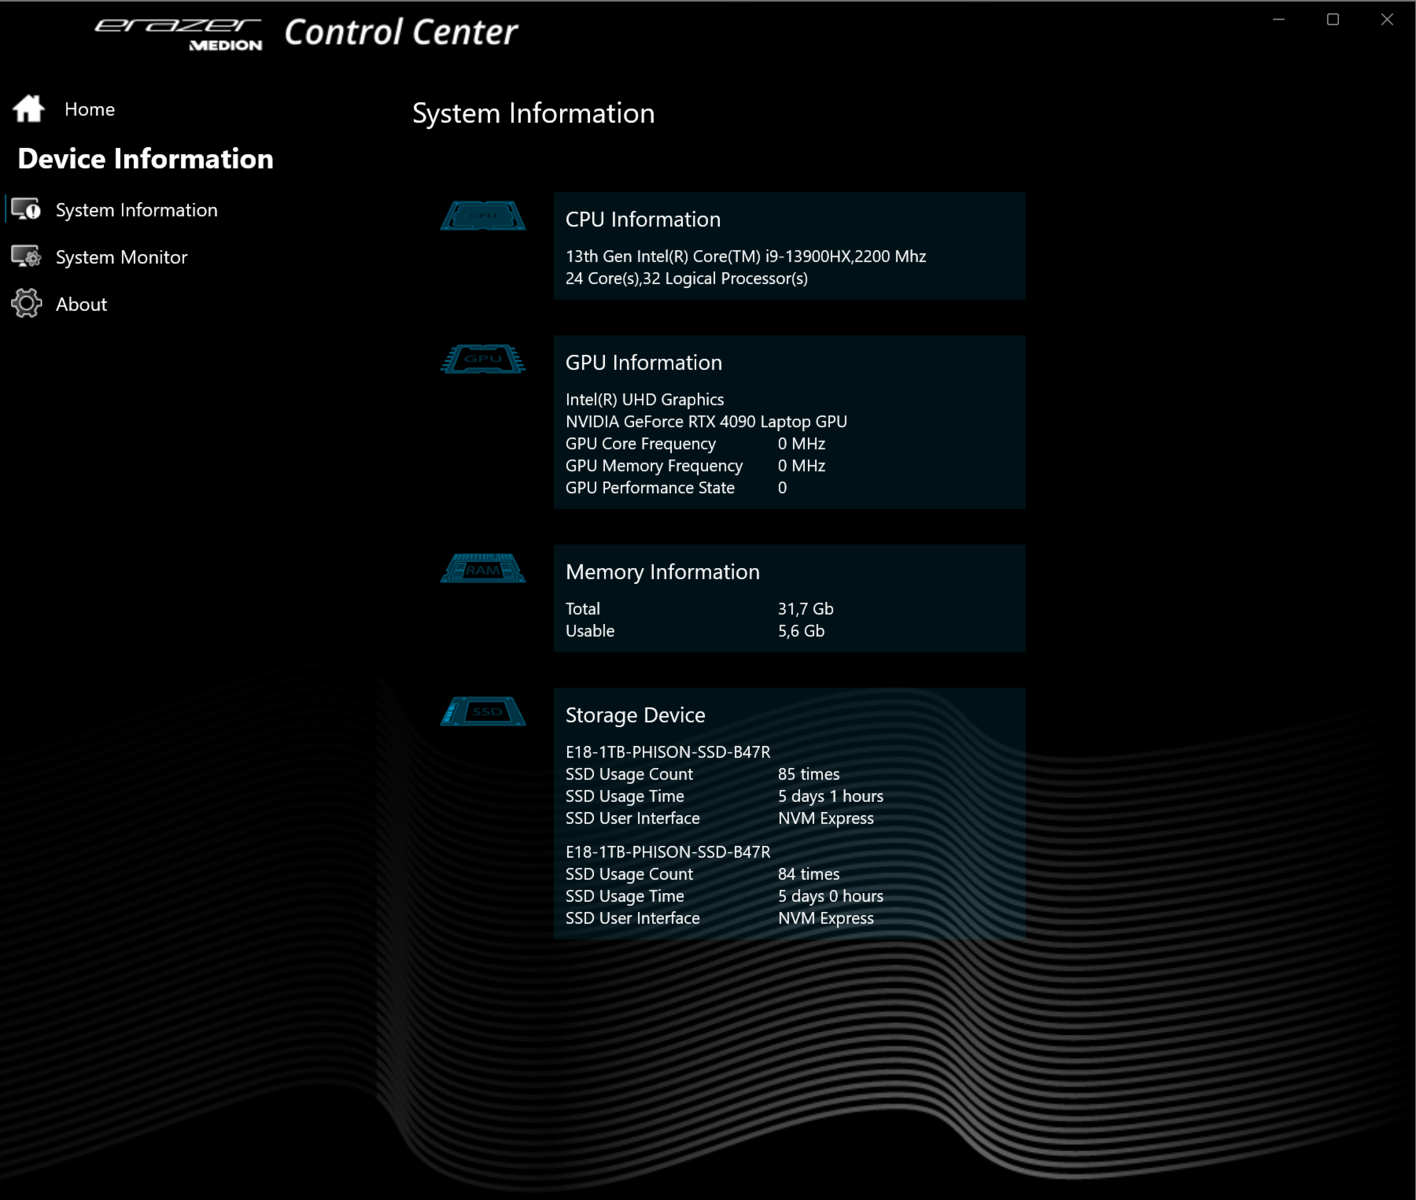
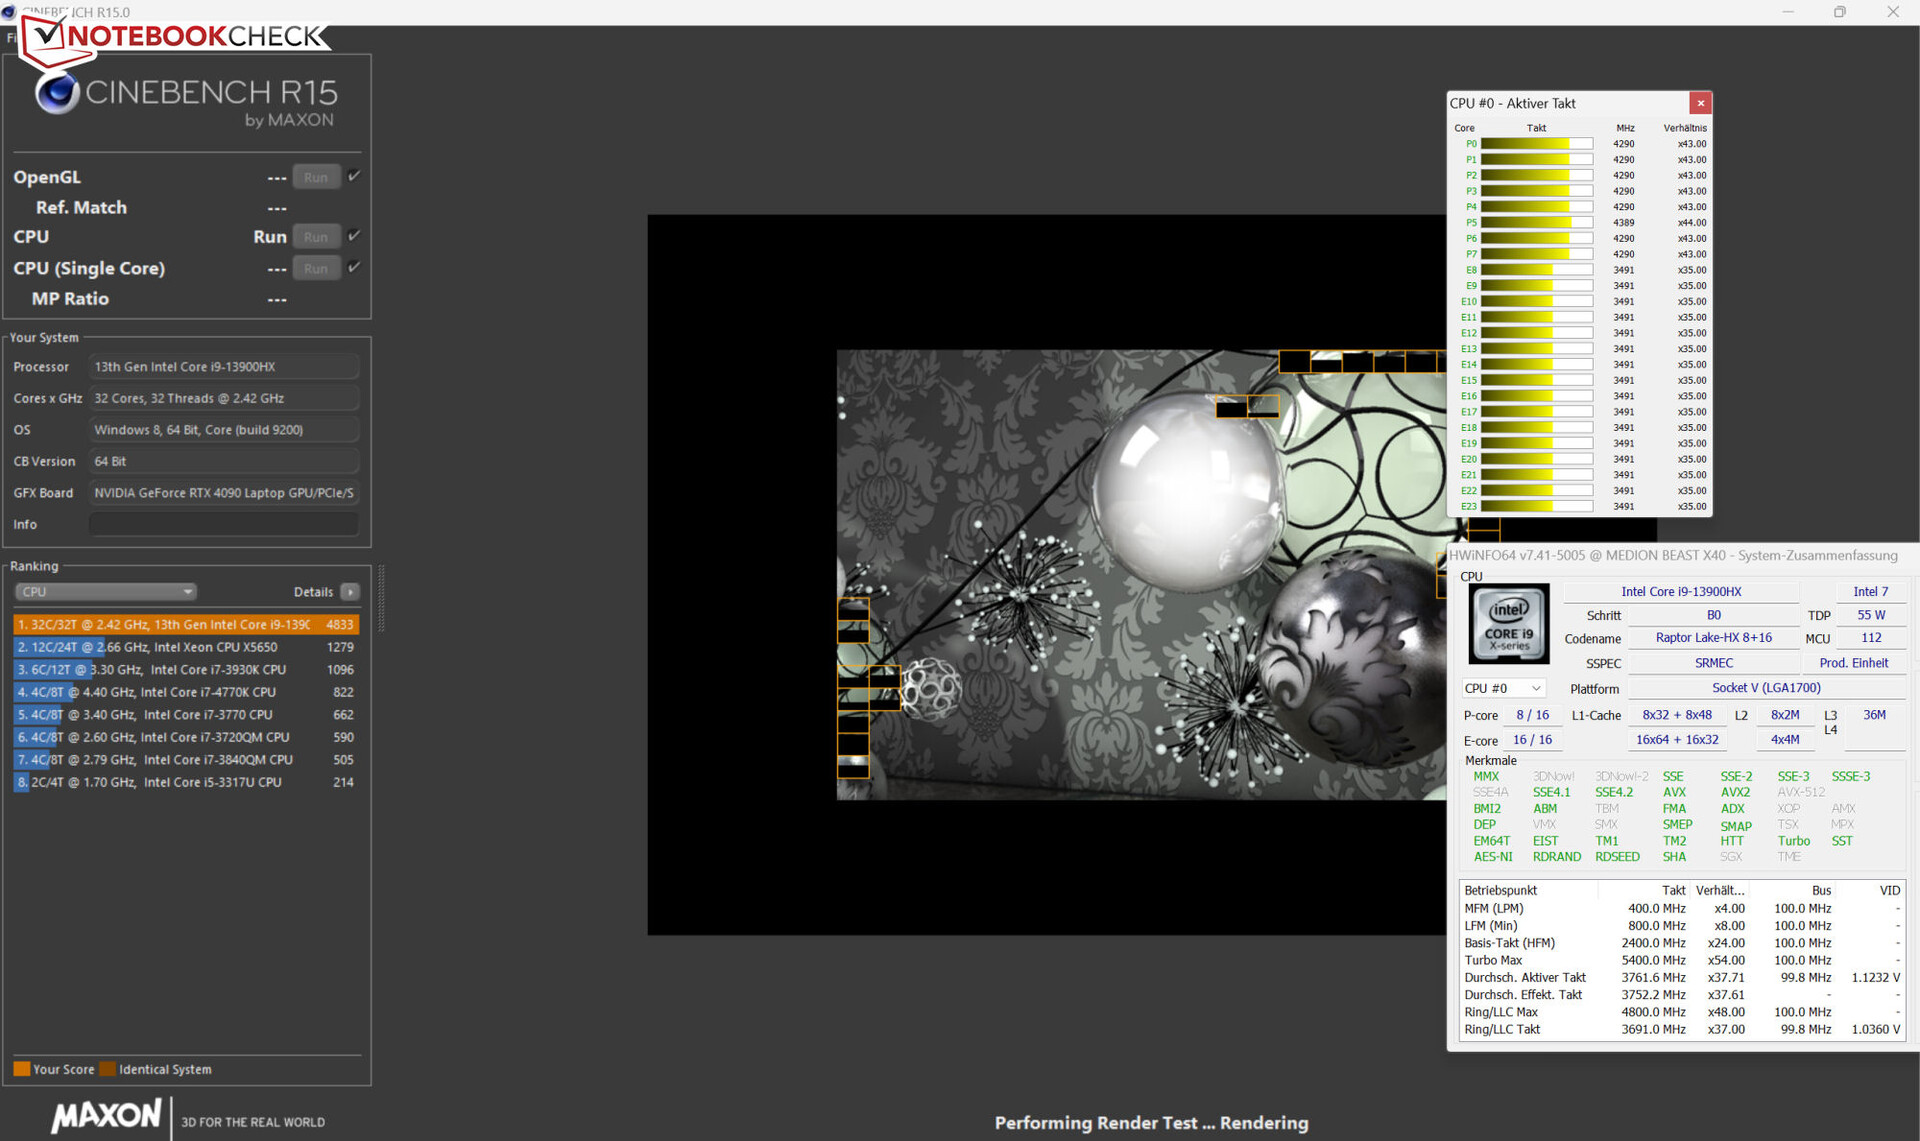
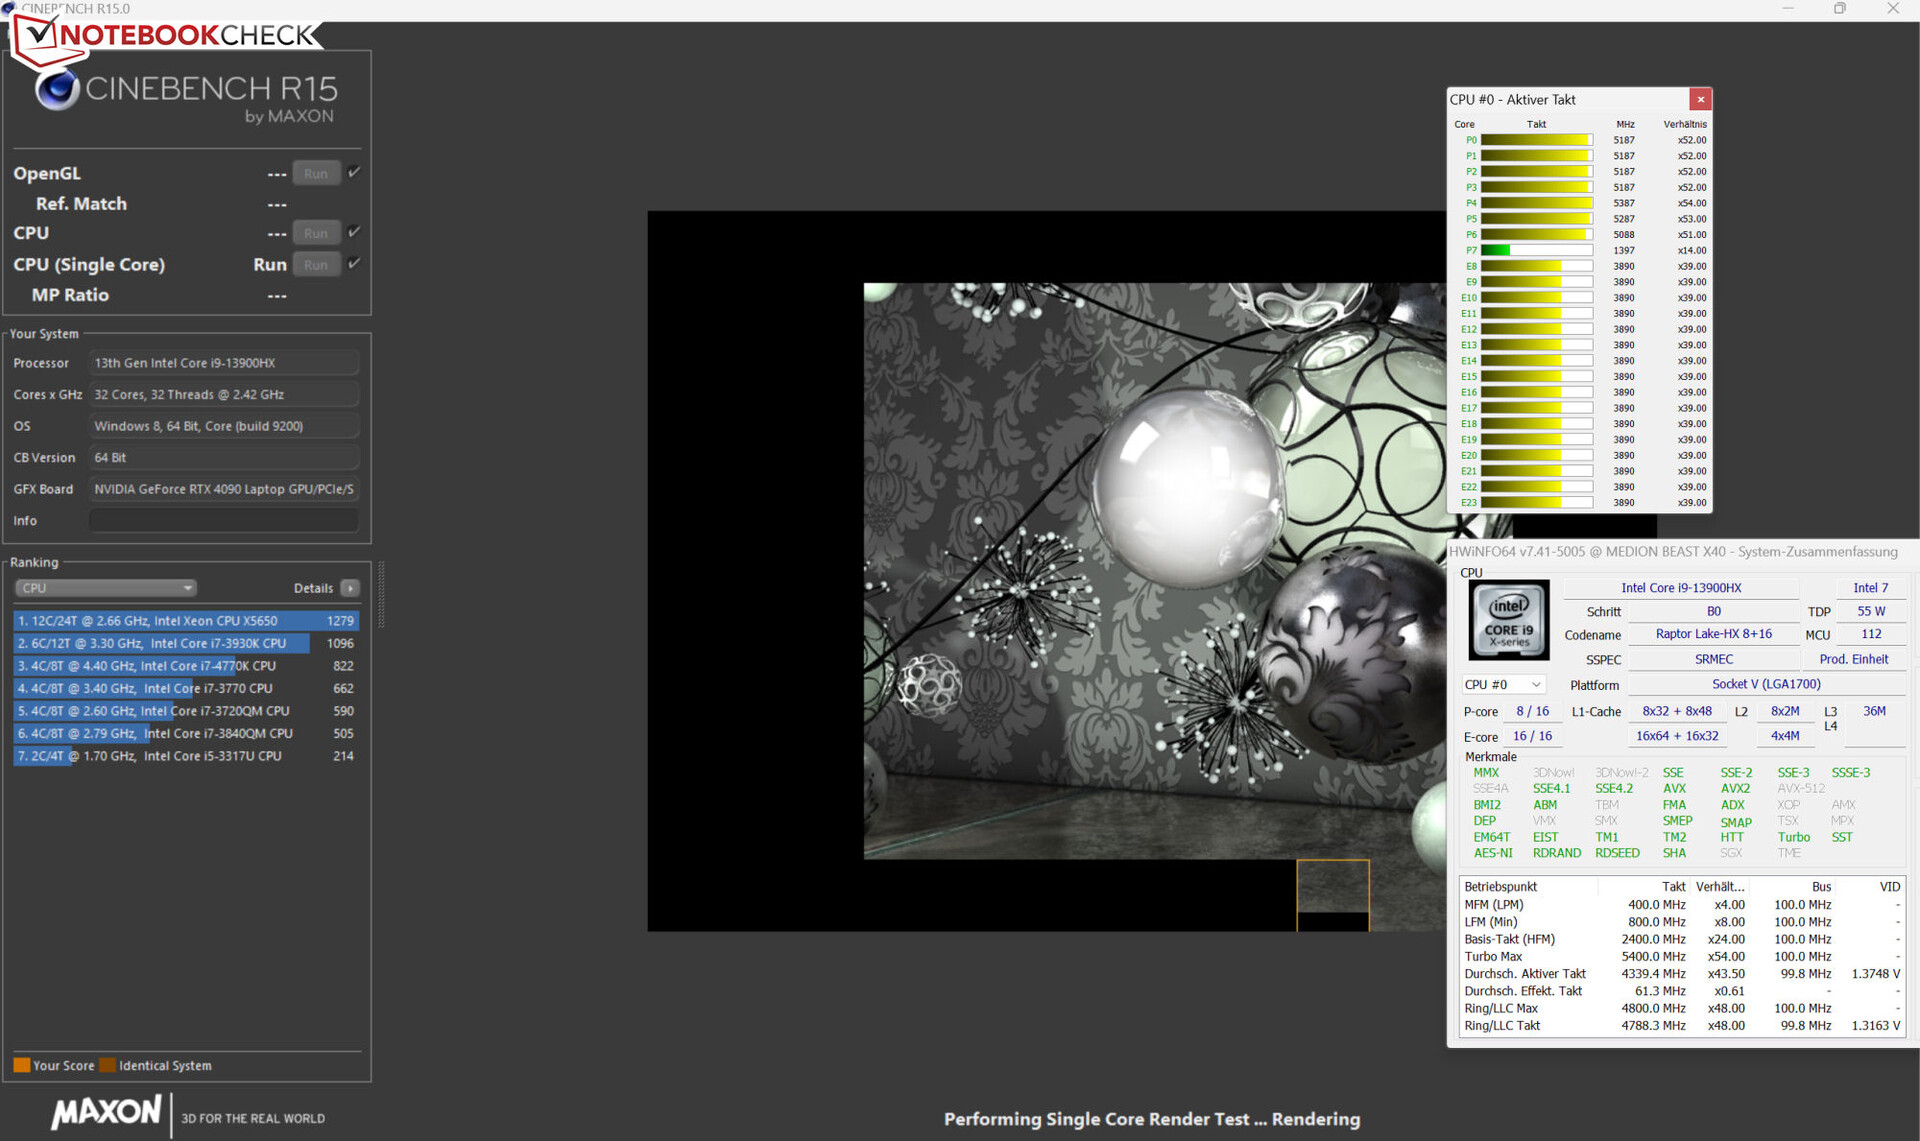
Le Core i9-13900HX (Raptor Lake) se compose de huit cœurs de performance (Hyper-Threading, 2,2 à 5,4 GHz) et de seize cœurs d'efficacité (pas d'Hyper-Threading, 1,6 à 3,9 GHz), ce qui donne un total de 40 cœurs logiques. Les résultats obtenus sont légèrement supérieurs à ce que le processeur peut produire en moyenne.
Lorsque l'Erazer Beast X40 est branché, son processeur exécute Cinebench R15 à des vitesses d'horloge élevées à maximales. Sur batterie, les performances monofilaires n'étaient que légèrement inférieures (score : 228), tandis que les performances multi-filières étaient considérablement réduites (score : 1 154). L'exécution en boucle de Cinebench 15 a démontré que le processeur est capable de fonctionner en permanence à des vitesses élevées lorsqu'il est alimenté par le secteur.
L'utilisation du système de refroidissement par eau n'a pas entraîné d'augmentation spectaculaire des performances. Néanmoins, les performances du processeur ont été plus stables sous une charge multithread soutenue (boucle CB15) et la température moyenne du processeur a baissé d'environ 5°C (9°F).
Cinebench R15 Multi Sustained Load
| CPU Performance rating - Percent | |
| Asus ROG Strix Scar 18 2023 G834JY-N6005W | |
| MSI Titan GT77 HX 13VI | |
| Medion Erazer Beast X40 | |
| Medion Erazer Beast X40 | |
| Moyenne Intel Core i9-13900HX | |
| Razer Blade 16 Early 2023 | |
| Moyenne de la classe Gaming | |
| Alienware x17 R2 P48E | |
| Schenker XMG Neo 17 M22 | |
| Cinebench R20 | |
| CPU (Multi Core) | |
| MSI Titan GT77 HX 13VI | |
| Asus ROG Strix Scar 18 2023 G834JY-N6005W | |
| Medion Erazer Beast X40 (dGPU, Cooling) | |
| Medion Erazer Beast X40 | |
| Moyenne Intel Core i9-13900HX (9152 - 12541, n=21) | |
| Moyenne de la classe Gaming (4029 - 16433, n=106, 2 dernières années) | |
| Razer Blade 16 Early 2023 | |
| Alienware x17 R2 P48E | |
| Schenker XMG Neo 17 M22 | |
| CPU (Single Core) | |
| Asus ROG Strix Scar 18 2023 G834JY-N6005W | |
| MSI Titan GT77 HX 13VI | |
| Medion Erazer Beast X40 (dGPU, Cooling) | |
| Moyenne Intel Core i9-13900HX (722 - 810, n=21) | |
| Medion Erazer Beast X40 | |
| Moyenne de la classe Gaming (442 - 913, n=106, 2 dernières années) | |
| Razer Blade 16 Early 2023 | |
| Alienware x17 R2 P48E | |
| Schenker XMG Neo 17 M22 | |
| Cinebench R15 | |
| CPU Multi 64Bit | |
| MSI Titan GT77 HX 13VI | |
| Medion Erazer Beast X40 | |
| Medion Erazer Beast X40 (dGPU, Cooling) | |
| Medion Erazer Beast X40 (dGPU, Cooling) | |
| Asus ROG Strix Scar 18 2023 G834JY-N6005W | |
| Razer Blade 16 Early 2023 | |
| Moyenne Intel Core i9-13900HX (3913 - 4970, n=22) | |
| Moyenne de la classe Gaming (1578 - 6330, n=105, 2 dernières années) | |
| Alienware x17 R2 P48E | |
| Schenker XMG Neo 17 M22 | |
| CPU Single 64Bit | |
| Asus ROG Strix Scar 18 2023 G834JY-N6005W | |
| MSI Titan GT77 HX 13VI | |
| Medion Erazer Beast X40 | |
| Moyenne de la classe Gaming (188.8 - 350, n=106, 2 dernières années) | |
| Medion Erazer Beast X40 (dGPU, Cooling) | |
| Medion Erazer Beast X40 (dGPU, Cooling) | |
| Moyenne Intel Core i9-13900HX (247 - 304, n=22) | |
| Razer Blade 16 Early 2023 | |
| Alienware x17 R2 P48E | |
| Schenker XMG Neo 17 M22 | |
| Blender - v2.79 BMW27 CPU | |
| Schenker XMG Neo 17 M22 | |
| Alienware x17 R2 P48E | |
| Moyenne de la classe Gaming (79 - 330, n=104, 2 dernières années) | |
| Moyenne Intel Core i9-13900HX (101 - 153, n=22) | |
| Razer Blade 16 Early 2023 | |
| Medion Erazer Beast X40 | |
| Asus ROG Strix Scar 18 2023 G834JY-N6005W | |
| Medion Erazer Beast X40 (dGPU, Cooling) | |
| MSI Titan GT77 HX 13VI | |
| HWBOT x265 Benchmark v2.2 - 4k Preset | |
| Asus ROG Strix Scar 18 2023 G834JY-N6005W | |
| MSI Titan GT77 HX 13VI | |
| Medion Erazer Beast X40 (dGPU, Cooling) | |
| Medion Erazer Beast X40 | |
| Moyenne Intel Core i9-13900HX (23.5 - 34.4, n=22) | |
| Moyenne de la classe Gaming (11.5 - 44.4, n=105, 2 dernières années) | |
| Razer Blade 16 Early 2023 | |
| Alienware x17 R2 P48E | |
| Schenker XMG Neo 17 M22 | |
| LibreOffice - 20 Documents To PDF | |
| Schenker XMG Neo 17 M22 | |
| Moyenne de la classe Gaming (33.2 - 88.8, n=105, 2 dernières années) | |
| Razer Blade 16 Early 2023 | |
| MSI Titan GT77 HX 13VI | |
| Medion Erazer Beast X40 | |
| Moyenne Intel Core i9-13900HX (32.8 - 51.1, n=21) | |
| Alienware x17 R2 P48E | |
| Medion Erazer Beast X40 (dGPU, Cooling) | |
| Asus ROG Strix Scar 18 2023 G834JY-N6005W | |
| R Benchmark 2.5 - Overall mean | |
| Schenker XMG Neo 17 M22 | |
| Alienware x17 R2 P48E | |
| Moyenne de la classe Gaming (0.3439 - 0.759, n=106, 2 dernières années) | |
| Razer Blade 16 Early 2023 | |
| MSI Titan GT77 HX 13VI | |
| Moyenne Intel Core i9-13900HX (0.375 - 0.4564, n=22) | |
| Medion Erazer Beast X40 | |
| Medion Erazer Beast X40 (dGPU, Cooling) | |
| Asus ROG Strix Scar 18 2023 G834JY-N6005W | |
* ... Moindre est la valeur, meilleures sont les performances
AIDA64: FP32 Ray-Trace | FPU Julia | CPU SHA3 | CPU Queen | FPU SinJulia | FPU Mandel | CPU AES | CPU ZLib | FP64 Ray-Trace | CPU PhotoWorxx
| Performance rating | |
| MSI Titan GT77 HX 13VI | |
| Asus ROG Strix Scar 18 2023 G834JY-N6005W | |
| Medion Erazer Beast X40 | |
| Medion Erazer Beast X40 | |
| Moyenne de la classe Gaming | |
| Moyenne Intel Core i9-13900HX | |
| Razer Blade 16 Early 2023 | |
| Schenker XMG Neo 17 M22 | |
| Alienware x17 R2 P48E | |
| AIDA64 / FP32 Ray-Trace | |
| Moyenne de la classe Gaming (10227 - 85542, n=105, 2 dernières années) | |
| MSI Titan GT77 HX 13VI (v6.85.6300) | |
| Asus ROG Strix Scar 18 2023 G834JY-N6005W (v6.85.6300) | |
| Medion Erazer Beast X40 (v6.75.6100, dGPU, Cooling) | |
| Medion Erazer Beast X40 (v6.75.6100) | |
| Razer Blade 16 Early 2023 (v6.85.6300) | |
| Razer Blade 16 Early 2023 (v8.20.8100) | |
| Razer Blade 16 Early 2023 (v6.92.6600) | |
| Moyenne Intel Core i9-13900HX (17589 - 27615, n=22) | |
| Schenker XMG Neo 17 M22 (v6.70.6000) | |
| Alienware x17 R2 P48E (v6.50.5800) | |
| AIDA64 / FPU Julia | |
| MSI Titan GT77 HX 13VI (v6.85.6300) | |
| Moyenne de la classe Gaming (51376 - 238426, n=105, 2 dernières années) | |
| Asus ROG Strix Scar 18 2023 G834JY-N6005W (v6.85.6300) | |
| Medion Erazer Beast X40 (v6.75.6100, dGPU, Cooling) | |
| Medion Erazer Beast X40 (v6.75.6100) | |
| Razer Blade 16 Early 2023 (v6.85.6300) | |
| Razer Blade 16 Early 2023 (v8.20.8100) | |
| Razer Blade 16 Early 2023 (v6.92.6600) | |
| Moyenne Intel Core i9-13900HX (88686 - 137015, n=22) | |
| Schenker XMG Neo 17 M22 (v6.70.6000) | |
| Alienware x17 R2 P48E (v6.50.5800) | |
| AIDA64 / CPU SHA3 | |
| MSI Titan GT77 HX 13VI (v6.85.6300) | |
| Asus ROG Strix Scar 18 2023 G834JY-N6005W (v6.85.6300) | |
| Medion Erazer Beast X40 (v6.75.6100, dGPU, Cooling) | |
| Medion Erazer Beast X40 (v6.75.6100) | |
| Moyenne de la classe Gaming (2180 - 10115, n=105, 2 dernières années) | |
| Razer Blade 16 Early 2023 (v6.85.6300) | |
| Razer Blade 16 Early 2023 (v6.92.6600) | |
| Razer Blade 16 Early 2023 (v8.20.8100) | |
| Moyenne Intel Core i9-13900HX (4362 - 7029, n=22) | |
| Alienware x17 R2 P48E (v6.50.5800) | |
| Schenker XMG Neo 17 M22 (v6.70.6000) | |
| AIDA64 / CPU Queen | |
| Asus ROG Strix Scar 18 2023 G834JY-N6005W (v6.85.6300) | |
| MSI Titan GT77 HX 13VI (v6.85.6300) | |
| Razer Blade 16 Early 2023 (v6.92.6600) | |
| Razer Blade 16 Early 2023 (v6.85.6300) | |
| Medion Erazer Beast X40 (v6.75.6100, dGPU, Cooling) | |
| Moyenne Intel Core i9-13900HX (125644 - 141385, n=22) | |
| Medion Erazer Beast X40 (v6.75.6100) | |
| Moyenne de la classe Gaming (49785 - 173351, n=90, 2 dernières années) | |
| Alienware x17 R2 P48E (v6.50.5800) | |
| Schenker XMG Neo 17 M22 (v6.70.6000) | |
| AIDA64 / FPU SinJulia | |
| Asus ROG Strix Scar 18 2023 G834JY-N6005W (v6.85.6300) | |
| MSI Titan GT77 HX 13VI (v6.85.6300) | |
| Medion Erazer Beast X40 (v6.75.6100, dGPU, Cooling) | |
| Medion Erazer Beast X40 (v6.75.6100) | |
| Razer Blade 16 Early 2023 (v6.85.6300) | |
| Razer Blade 16 Early 2023 (v8.20.8100) | |
| Razer Blade 16 Early 2023 (v6.92.6600) | |
| Moyenne Intel Core i9-13900HX (12334 - 17179, n=22) | |
| Moyenne de la classe Gaming (4424 - 33636, n=105, 2 dernières années) | |
| Schenker XMG Neo 17 M22 (v6.70.6000) | |
| Alienware x17 R2 P48E (v6.50.5800) | |
| AIDA64 / FPU Mandel | |
| Moyenne de la classe Gaming (25115 - 128721, n=105, 2 dernières années) | |
| MSI Titan GT77 HX 13VI (v6.85.6300) | |
| Asus ROG Strix Scar 18 2023 G834JY-N6005W (v6.85.6300) | |
| Medion Erazer Beast X40 (v6.75.6100, dGPU, Cooling) | |
| Medion Erazer Beast X40 (v6.75.6100) | |
| Razer Blade 16 Early 2023 (v6.85.6300) | |
| Razer Blade 16 Early 2023 (v8.20.8100) | |
| Razer Blade 16 Early 2023 (v6.92.6600) | |
| Moyenne Intel Core i9-13900HX (43850 - 69202, n=22) | |
| Schenker XMG Neo 17 M22 (v6.70.6000) | |
| Alienware x17 R2 P48E (v6.50.5800) | |
| AIDA64 / CPU AES | |
| Razer Blade 16 Early 2023 (v6.92.6600) | |
| Razer Blade 16 Early 2023 (v8.20.8100) | |
| Razer Blade 16 Early 2023 (v6.85.6300) | |
| Moyenne Intel Core i9-13900HX (89413 - 237881, n=22) | |
| MSI Titan GT77 HX 13VI (v6.85.6300) | |
| Schenker XMG Neo 17 M22 (v6.70.6000) | |
| Asus ROG Strix Scar 18 2023 G834JY-N6005W (v6.85.6300) | |
| Medion Erazer Beast X40 (v6.75.6100, dGPU, Cooling) | |
| Medion Erazer Beast X40 (v6.75.6100) | |
| Moyenne de la classe Gaming (39258 - 247074, n=105, 2 dernières années) | |
| Alienware x17 R2 P48E (v6.50.5800) | |
| AIDA64 / CPU ZLib | |
| MSI Titan GT77 HX 13VI (v6.85.6300) | |
| Asus ROG Strix Scar 18 2023 G834JY-N6005W (v6.85.6300) | |
| Medion Erazer Beast X40 (v6.75.6100, dGPU, Cooling) | |
| Medion Erazer Beast X40 (v6.75.6100) | |
| Razer Blade 16 Early 2023 (v6.85.6300) | |
| Razer Blade 16 Early 2023 (v6.92.6600) | |
| Razer Blade 16 Early 2023 (v8.20.8100) | |
| Moyenne Intel Core i9-13900HX (1284 - 1958, n=22) | |
| Moyenne de la classe Gaming (574 - 2531, n=105, 2 dernières années) | |
| Alienware x17 R2 P48E (v6.50.5800) | |
| Schenker XMG Neo 17 M22 (v6.70.6000) | |
| AIDA64 / FP64 Ray-Trace | |
| Moyenne de la classe Gaming (5509 - 45446, n=105, 2 dernières années) | |
| MSI Titan GT77 HX 13VI (v6.85.6300) | |
| Asus ROG Strix Scar 18 2023 G834JY-N6005W (v6.85.6300) | |
| Medion Erazer Beast X40 (v6.75.6100, dGPU, Cooling) | |
| Medion Erazer Beast X40 (v6.75.6100) | |
| Razer Blade 16 Early 2023 (v6.85.6300) | |
| Razer Blade 16 Early 2023 (v6.92.6600) | |
| Razer Blade 16 Early 2023 (v8.20.8100) | |
| Moyenne Intel Core i9-13900HX (9481 - 15279, n=22) | |
| Schenker XMG Neo 17 M22 (v6.70.6000) | |
| Alienware x17 R2 P48E (v6.50.5800) | |
| AIDA64 / CPU PhotoWorxx | |
| Razer Blade 16 Early 2023 (v6.85.6300) | |
| Razer Blade 16 Early 2023 (v6.92.6600) | |
| Razer Blade 16 Early 2023 (v8.20.8100) | |
| Moyenne Intel Core i9-13900HX (42994 - 51994, n=22) | |
| Moyenne de la classe Gaming (12271 - 89891, n=105, 2 dernières années) | |
| Medion Erazer Beast X40 (v6.75.6100, dGPU, Cooling) | |
| Asus ROG Strix Scar 18 2023 G834JY-N6005W (v6.85.6300) | |
| Medion Erazer Beast X40 (v6.75.6100) | |
| MSI Titan GT77 HX 13VI (v6.85.6300) | |
| Alienware x17 R2 P48E (v6.50.5800) | |
| Schenker XMG Neo 17 M22 (v6.70.6000) | |
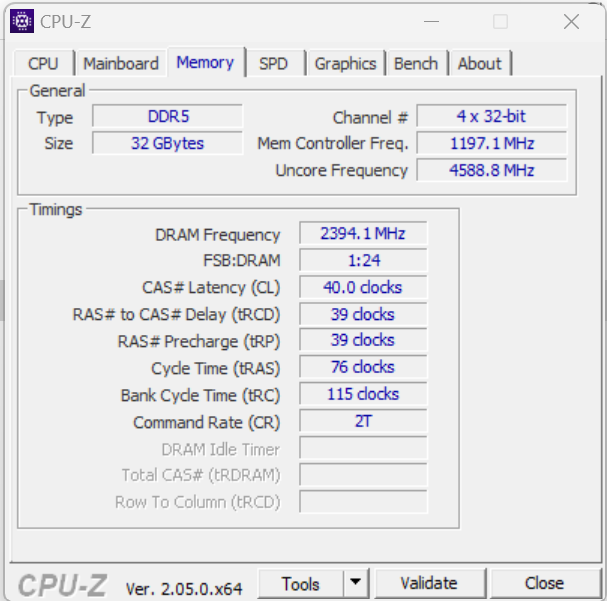
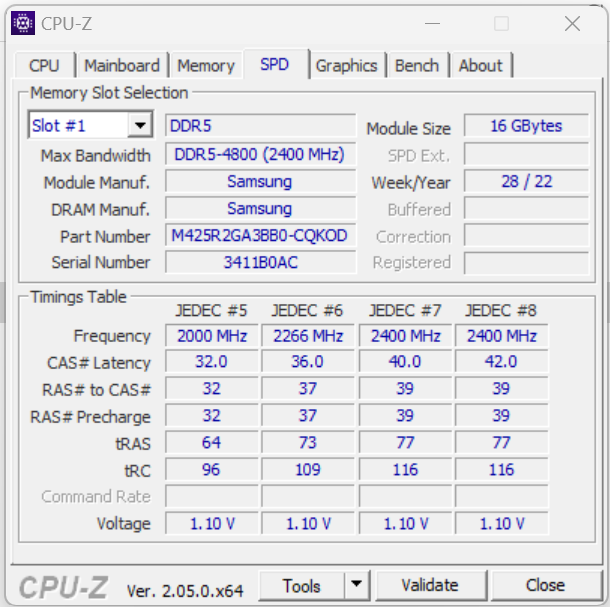
Performance du système
Le matériel à l'intérieur de ce système rapide offre des performances plus que suffisantes pour des tâches telles que les jeux et le rendu. L'ordinateur portable est équipé de 32 Go de mémoire fonctionnant en mode bicanal. Les taux de transfert de la mémoire sont typiques de la RAM DDR5-4800. De plus, le système a obtenu d'excellents résultats avec PCMark lors de nos tests.
CrossMark: Overall | Productivity | Creativity | Responsiveness
| PCMark 10 / Score | |
| Medion Erazer Beast X40 (dGPU, Cooling) | |
| MSI Titan GT77 HX 13VI | |
| Asus ROG Strix Scar 18 2023 G834JY-N6005W | |
| Moyenne Intel Core i9-13900HX, NVIDIA GeForce RTX 4090 Laptop GPU (7690 - 9331, n=8) | |
| Moyenne de la classe Gaming (5828 - 12414, n=93, 2 dernières années) | |
| Alienware x17 R2 P48E | |
| Medion Erazer Beast X40 | |
| Razer Blade 16 Early 2023 | |
| Schenker XMG Neo 17 M22 | |
| PCMark 10 / Essentials | |
| MSI Titan GT77 HX 13VI | |
| Medion Erazer Beast X40 (dGPU, Cooling) | |
| Moyenne Intel Core i9-13900HX, NVIDIA GeForce RTX 4090 Laptop GPU (10972 - 11983, n=8) | |
| Medion Erazer Beast X40 | |
| Alienware x17 R2 P48E | |
| Razer Blade 16 Early 2023 | |
| Moyenne de la classe Gaming (8810 - 11935, n=97, 2 dernières années) | |
| Schenker XMG Neo 17 M22 | |
| PCMark 10 / Productivity | |
| Medion Erazer Beast X40 (dGPU, Cooling) | |
| Medion Erazer Beast X40 | |
| Moyenne de la classe Gaming (6845 - 25323, n=95, 2 dernières années) | |
| Moyenne Intel Core i9-13900HX, NVIDIA GeForce RTX 4090 Laptop GPU (9038 - 11680, n=8) | |
| Alienware x17 R2 P48E | |
| MSI Titan GT77 HX 13VI | |
| Schenker XMG Neo 17 M22 | |
| Razer Blade 16 Early 2023 | |
| PCMark 10 / Digital Content Creation | |
| MSI Titan GT77 HX 13VI | |
| Medion Erazer Beast X40 (dGPU, Cooling) | |
| Razer Blade 16 Early 2023 | |
| Moyenne de la classe Gaming (7602 - 19954, n=95, 2 dernières années) | |
| Moyenne Intel Core i9-13900HX, NVIDIA GeForce RTX 4090 Laptop GPU (10605 - 16395, n=8) | |
| Alienware x17 R2 P48E | |
| Medion Erazer Beast X40 | |
| Schenker XMG Neo 17 M22 | |
| CrossMark / Overall | |
| Medion Erazer Beast X40 (dGPU, Cooling) | |
| MSI Titan GT77 HX 13VI | |
| Medion Erazer Beast X40 | |
| Moyenne Intel Core i9-13900HX, NVIDIA GeForce RTX 4090 Laptop GPU (1825 - 2295, n=8) | |
| Asus ROG Strix Scar 18 2023 G834JY-N6005W | |
| Moyenne de la classe Gaming (1366 - 2409, n=94, 2 dernières années) | |
| Alienware x17 R2 P48E | |
| Schenker XMG Neo 17 M22 | |
| Razer Blade 16 Early 2023 | |
| CrossMark / Productivity | |
| Medion Erazer Beast X40 (dGPU, Cooling) | |
| Medion Erazer Beast X40 | |
| MSI Titan GT77 HX 13VI | |
| Moyenne Intel Core i9-13900HX, NVIDIA GeForce RTX 4090 Laptop GPU (1666 - 2166, n=8) | |
| Asus ROG Strix Scar 18 2023 G834JY-N6005W | |
| Moyenne de la classe Gaming (1386 - 2254, n=94, 2 dernières années) | |
| Alienware x17 R2 P48E | |
| Schenker XMG Neo 17 M22 | |
| Razer Blade 16 Early 2023 | |
| CrossMark / Creativity | |
| Asus ROG Strix Scar 18 2023 G834JY-N6005W | |
| MSI Titan GT77 HX 13VI | |
| Medion Erazer Beast X40 (dGPU, Cooling) | |
| Medion Erazer Beast X40 | |
| Moyenne Intel Core i9-13900HX, NVIDIA GeForce RTX 4090 Laptop GPU (2162 - 2514, n=8) | |
| Moyenne de la classe Gaming (1343 - 2786, n=94, 2 dernières années) | |
| Alienware x17 R2 P48E | |
| Schenker XMG Neo 17 M22 | |
| Razer Blade 16 Early 2023 | |
| CrossMark / Responsiveness | |
| Medion Erazer Beast X40 (dGPU, Cooling) | |
| MSI Titan GT77 HX 13VI | |
| Medion Erazer Beast X40 | |
| Moyenne Intel Core i9-13900HX, NVIDIA GeForce RTX 4090 Laptop GPU (1441 - 2275, n=8) | |
| Moyenne de la classe Gaming (1226 - 2334, n=94, 2 dernières années) | |
| Alienware x17 R2 P48E | |
| Asus ROG Strix Scar 18 2023 G834JY-N6005W | |
| Schenker XMG Neo 17 M22 | |
| Razer Blade 16 Early 2023 | |
| PCMark 8 Home Score Accelerated v2 | 4936 points | |
| PCMark 8 Work Score Accelerated v2 | 6075 points | |
| PCMark 10 Score | 7932 points | |
Aide | ||
| AIDA64 / Memory Copy | |
| Razer Blade 16 Early 2023 | |
| Razer Blade 16 Early 2023 | |
| Razer Blade 16 Early 2023 | |
| Moyenne Intel Core i9-13900HX (67716 - 79193, n=22) | |
| Moyenne de la classe Gaming (21750 - 129946, n=105, 2 dernières années) | |
| Medion Erazer Beast X40 | |
| Asus ROG Strix Scar 18 2023 G834JY-N6005W | |
| MSI Titan GT77 HX 13VI | |
| Alienware x17 R2 P48E | |
| Schenker XMG Neo 17 M22 | |
| AIDA64 / Memory Read | |
| Razer Blade 16 Early 2023 | |
| Razer Blade 16 Early 2023 | |
| Razer Blade 16 Early 2023 | |
| Moyenne Intel Core i9-13900HX (73998 - 88462, n=22) | |
| Asus ROG Strix Scar 18 2023 G834JY-N6005W | |
| Medion Erazer Beast X40 | |
| Moyenne de la classe Gaming (22956 - 118858, n=105, 2 dernières années) | |
| MSI Titan GT77 HX 13VI | |
| Alienware x17 R2 P48E | |
| Schenker XMG Neo 17 M22 | |
| AIDA64 / Memory Write | |
| Razer Blade 16 Early 2023 | |
| Razer Blade 16 Early 2023 | |
| Razer Blade 16 Early 2023 | |
| Moyenne de la classe Gaming (22297 - 135096, n=105, 2 dernières années) | |
| Moyenne Intel Core i9-13900HX (65472 - 77045, n=22) | |
| Asus ROG Strix Scar 18 2023 G834JY-N6005W | |
| Medion Erazer Beast X40 | |
| MSI Titan GT77 HX 13VI | |
| Schenker XMG Neo 17 M22 | |
| Alienware x17 R2 P48E | |
| AIDA64 / Memory Latency | |
| Moyenne de la classe Gaming (75.3 - 259, n=105, 2 dernières années) | |
| Razer Blade 16 Early 2023 | |
| Razer Blade 16 Early 2023 | |
| Razer Blade 16 Early 2023 | |
| Alienware x17 R2 P48E | |
| MSI Titan GT77 HX 13VI | |
| Schenker XMG Neo 17 M22 | |
| Asus ROG Strix Scar 18 2023 G834JY-N6005W | |
| Medion Erazer Beast X40 | |
| Moyenne Intel Core i9-13900HX (75.3 - 91.1, n=22) | |
* ... Moindre est la valeur, meilleures sont les performances
Latence DPC
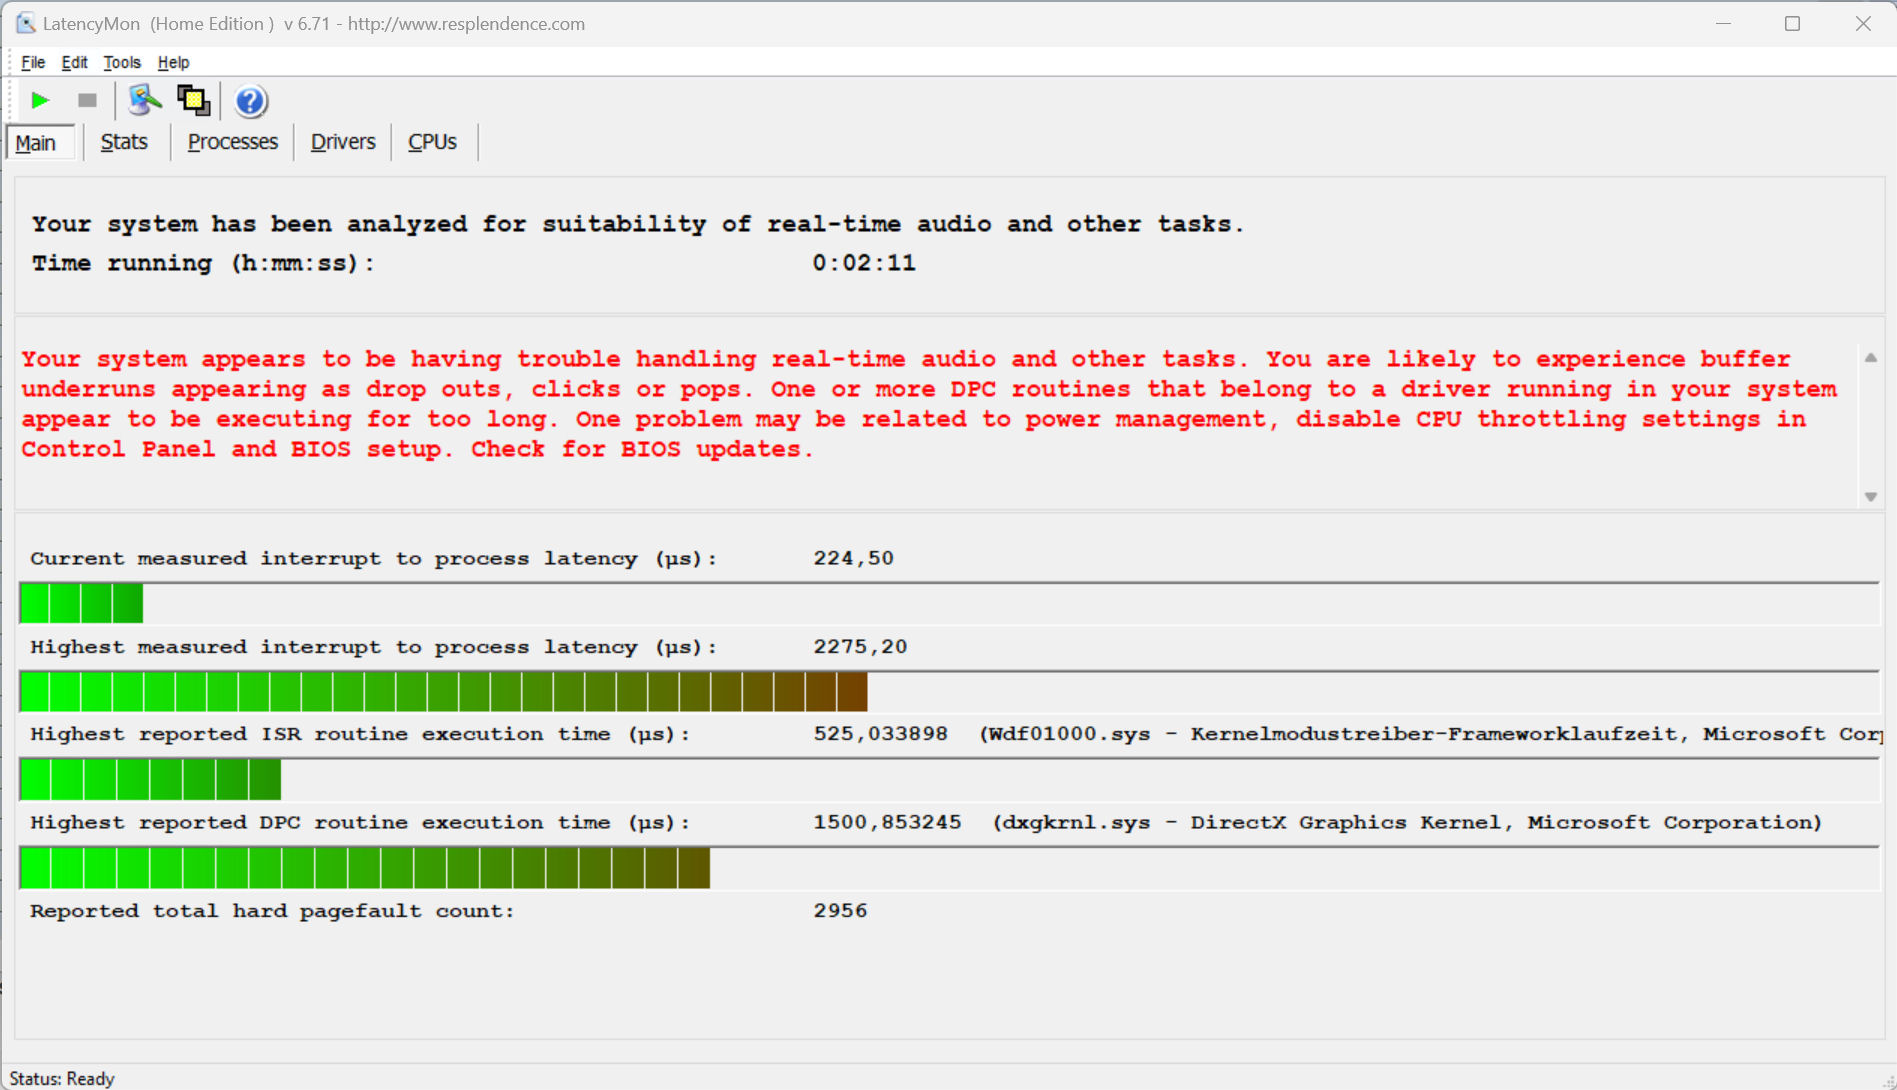
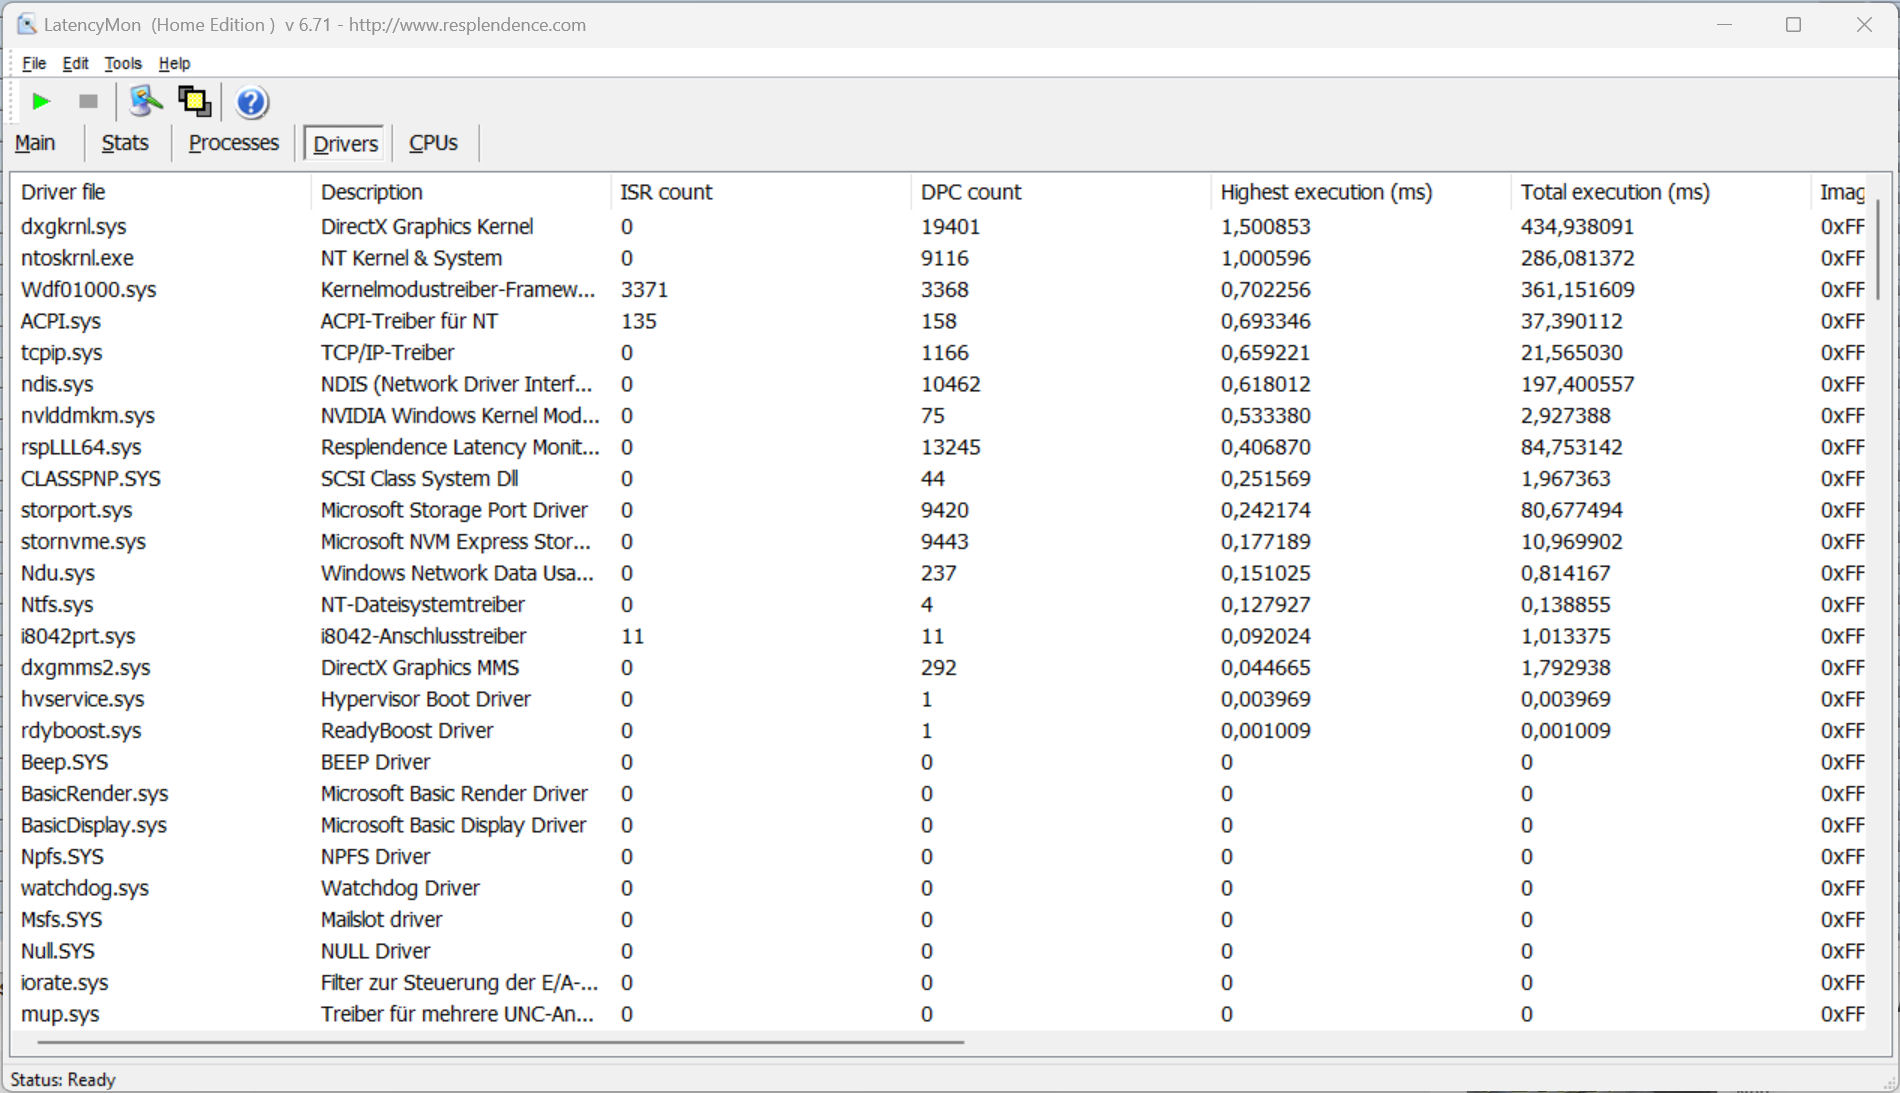
Notre test standardisé du moniteur de latence, qui comprend la navigation web, la lecture de vidéos 4K et la charge élevée de Prime95, a révélé quelques problèmes. Le système ne semble pas adapté au traitement vidéo et audio en temps réel. Nous espérons que les futures mises à jour logicielles permettront de rectifier ces problèmes.
| DPC Latencies / LatencyMon - interrupt to process latency (max), Web, Youtube, Prime95 | |
| MSI Titan GT77 HX 13VI | |
| Schenker XMG Neo 17 M22 | |
| Razer Blade 16 Early 2023 | |
| Medion Erazer Beast X40 | |
| Alienware x17 R2 P48E | |
| Asus ROG Strix Scar 18 2023 G834JY-N6005W | |
* ... Moindre est la valeur, meilleures sont les performances
Mémoire de masse
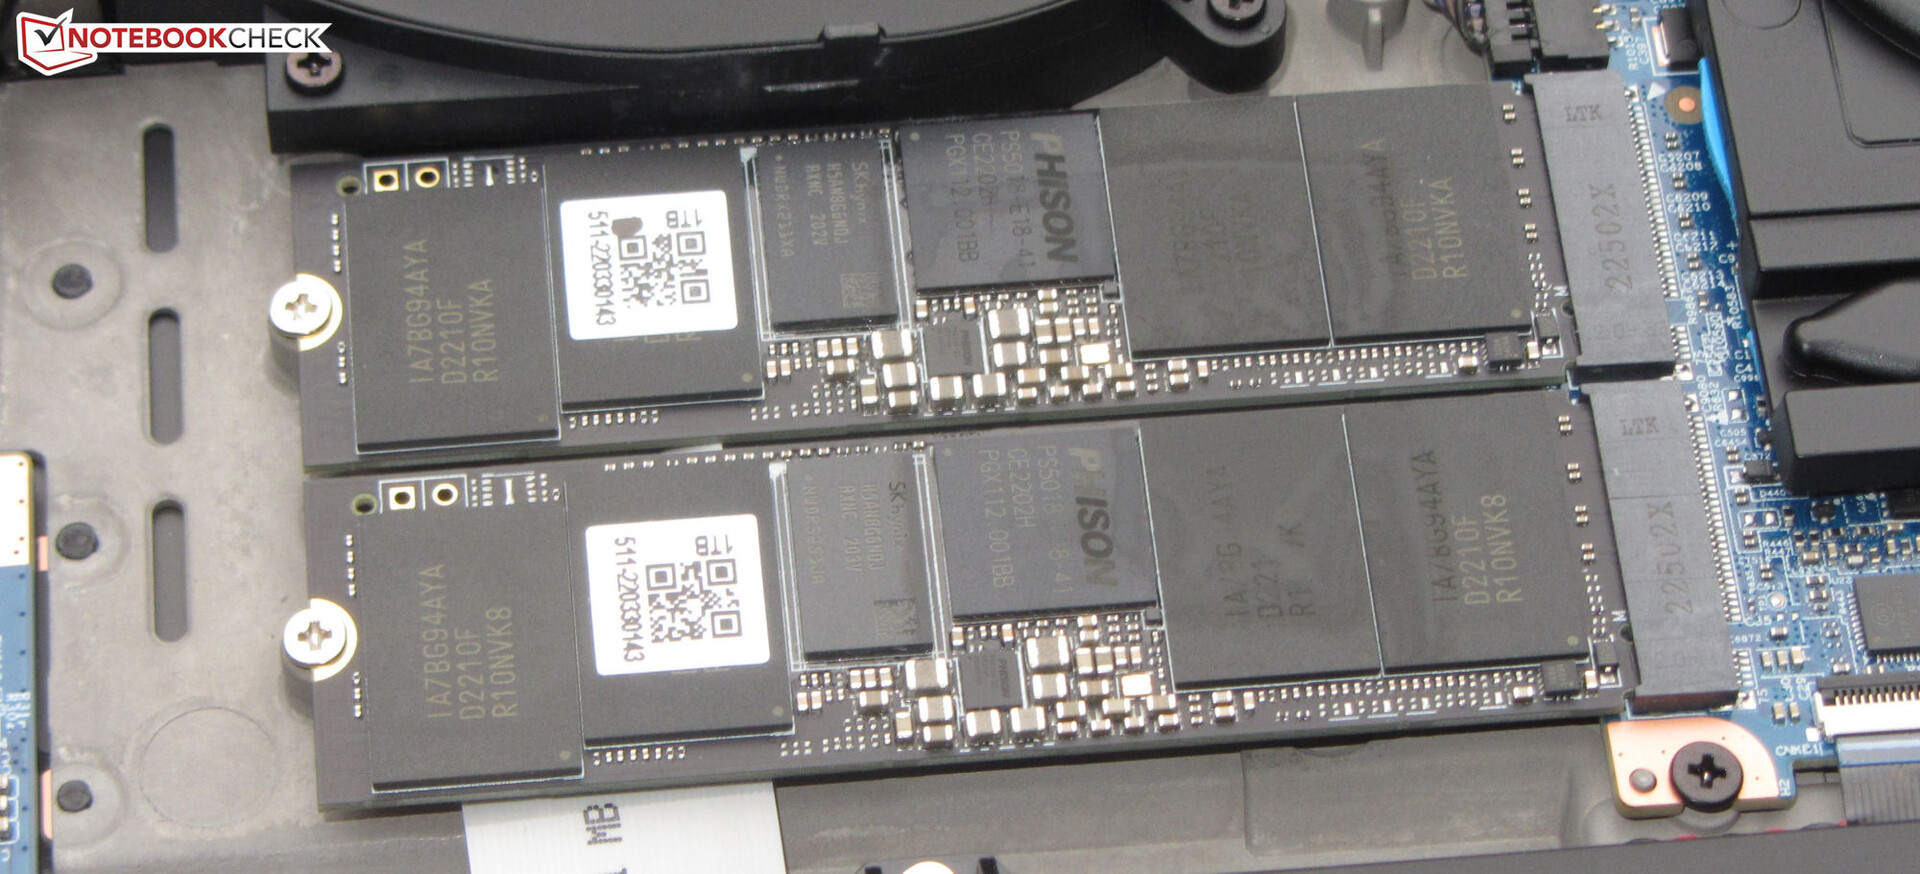
Medion a équipé notre X40 de deux disques durs SSD de 1 To (PCIe 4.0, M.2-2280) fabriqués par Phison. L'un d'entre eux sert de disque système et l'autre est utilisé pour le stockage des données. Non seulement les disques SSD ne forment pas une configuration RAID, mais l'ordinateur portable lui-même ne prend pas en charge le RAID. Les disques inclus ne font pas partie des meilleurs SSD du marché. Malgré cela, ils offrent d'excellentes performances. Un autre point positif à mentionner est que nous n'avons pas remarqué de baisse de performance causée par l'étranglement thermique.

* ... Moindre est la valeur, meilleures sont les performances
Sustained Load Read: DiskSpd Read Loop, Queue Depth 8
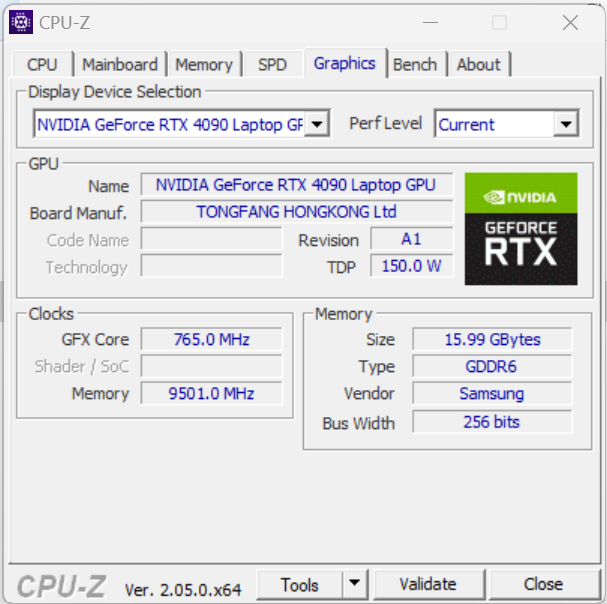
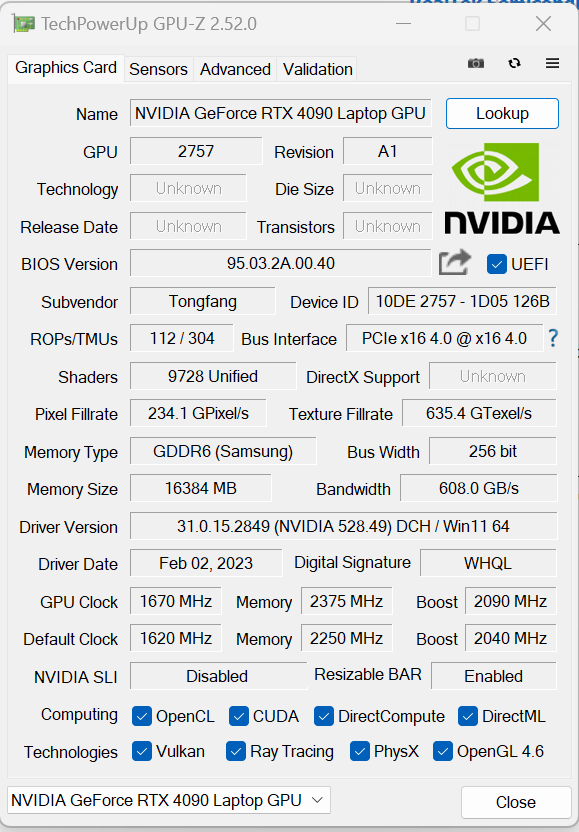
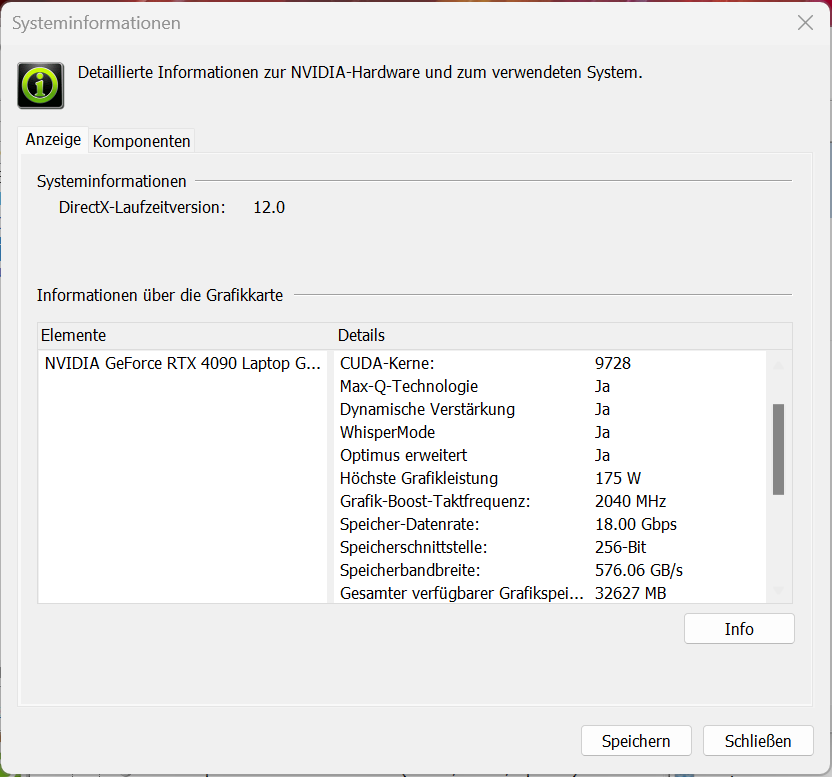
Carte graphique
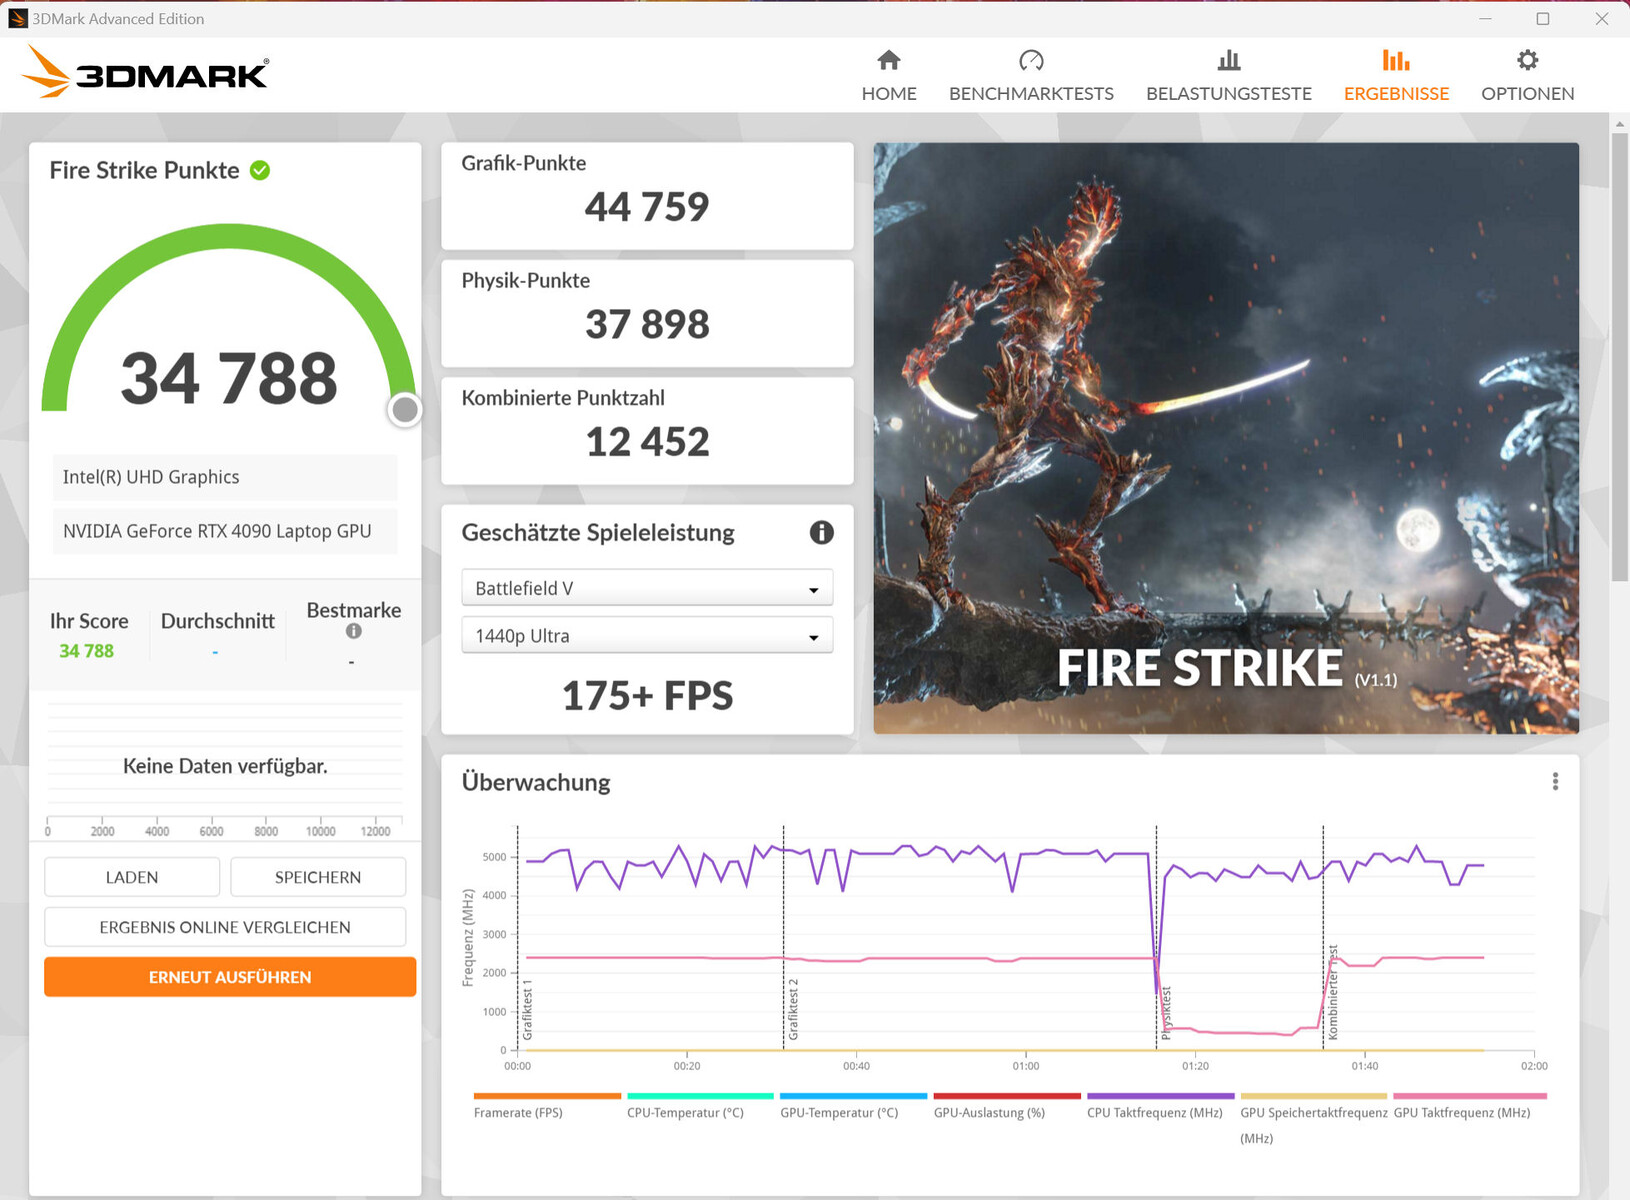
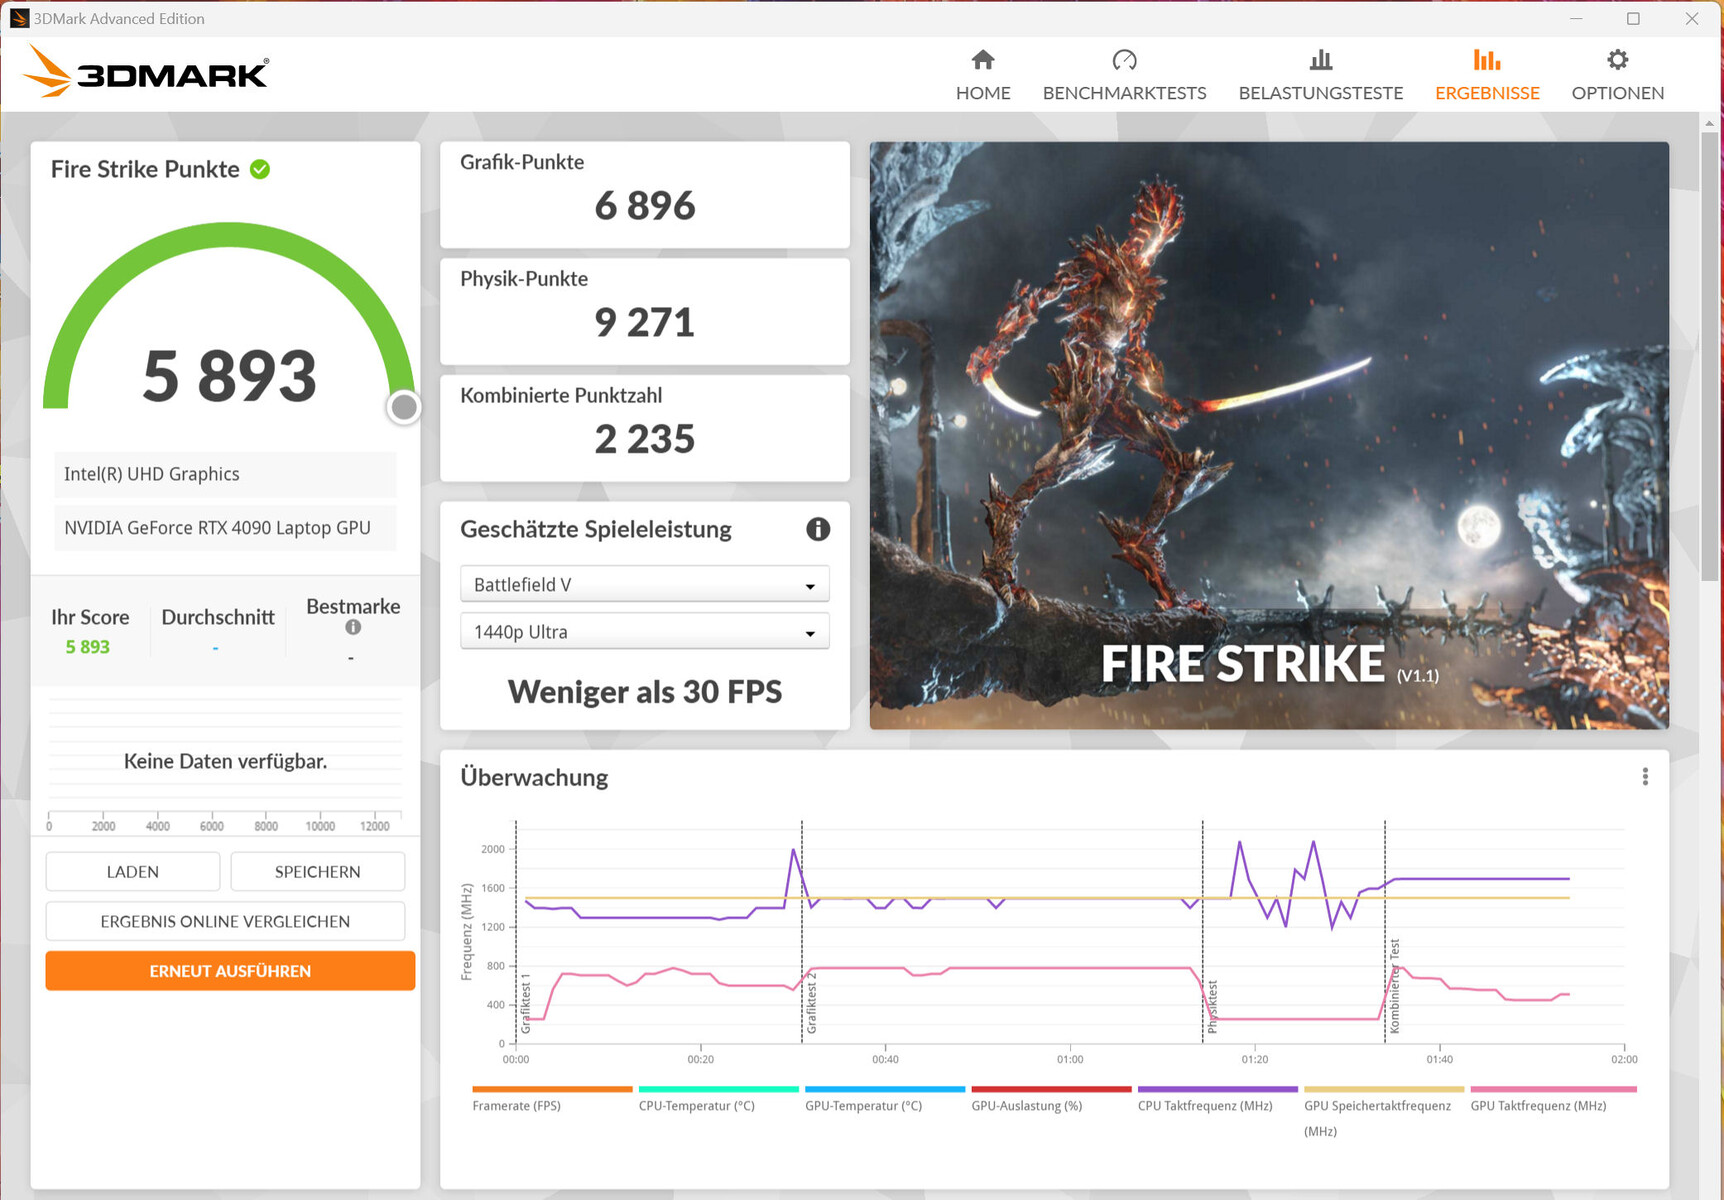
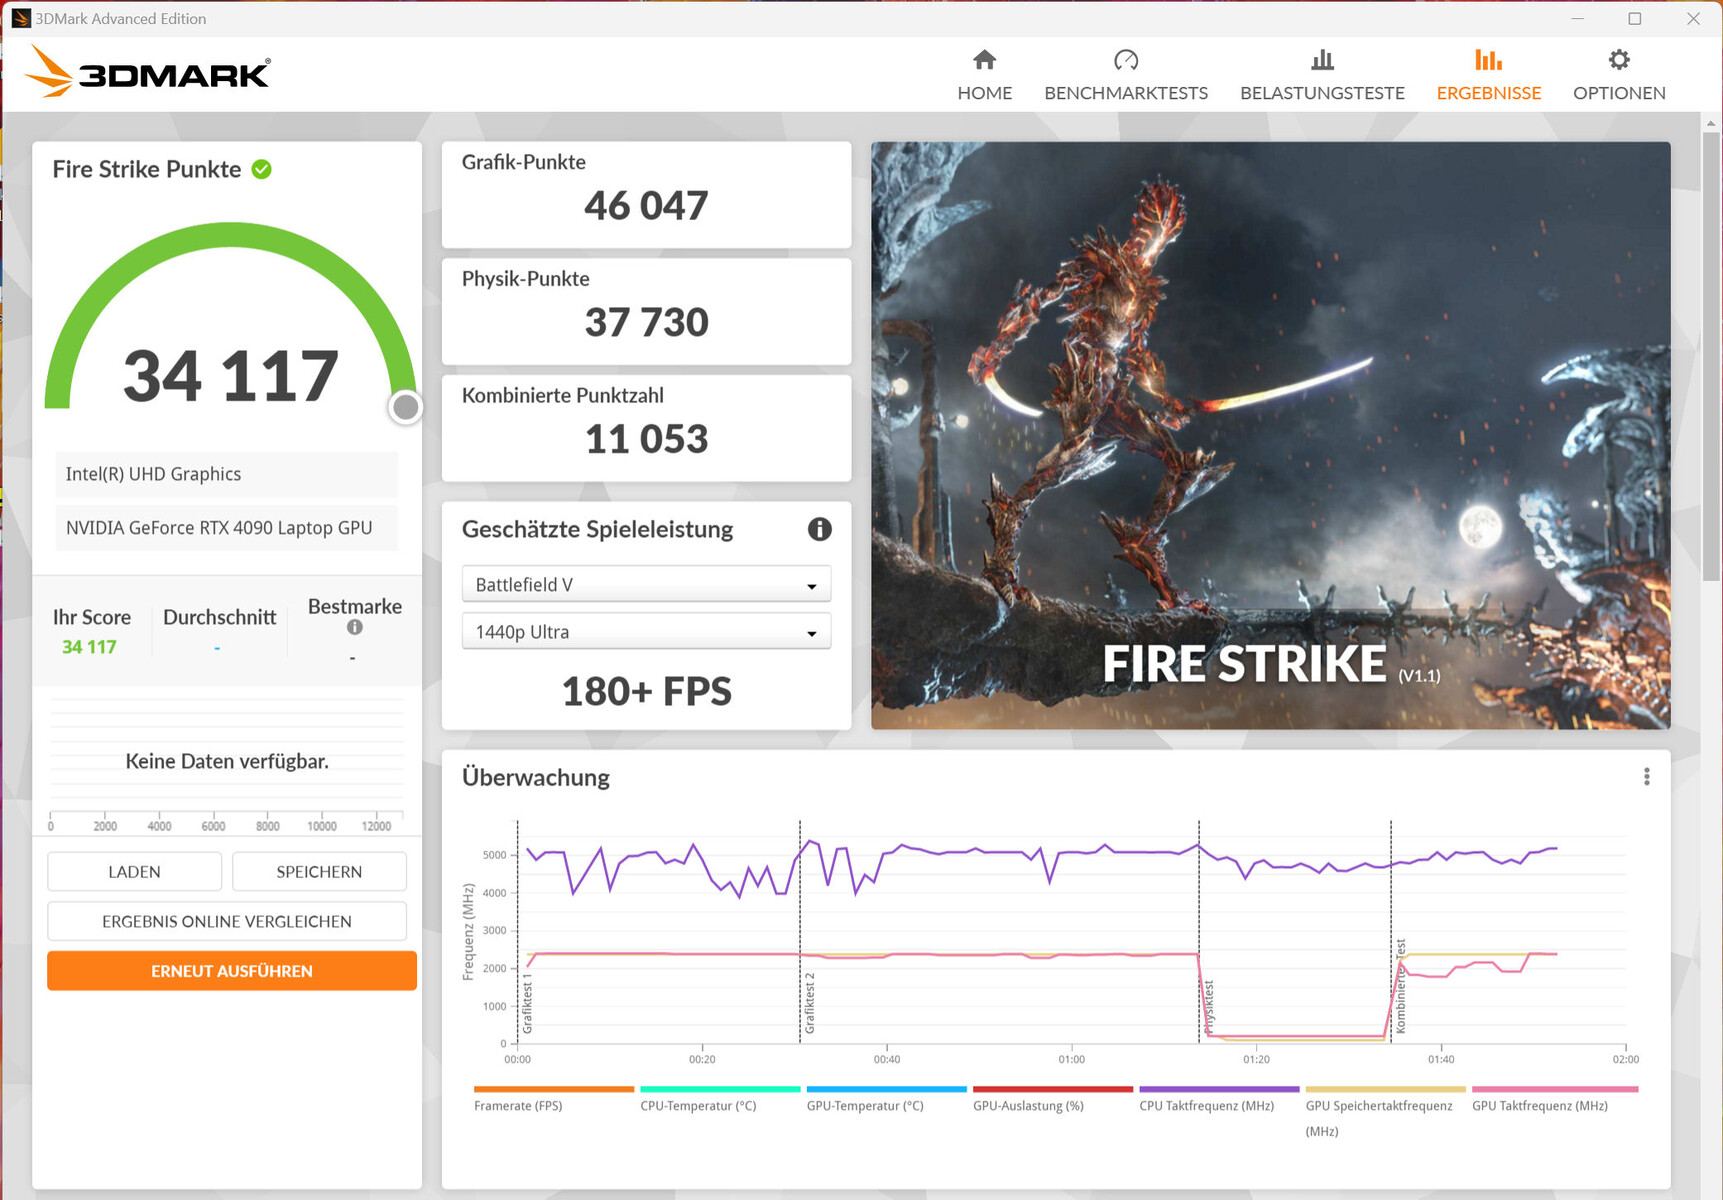
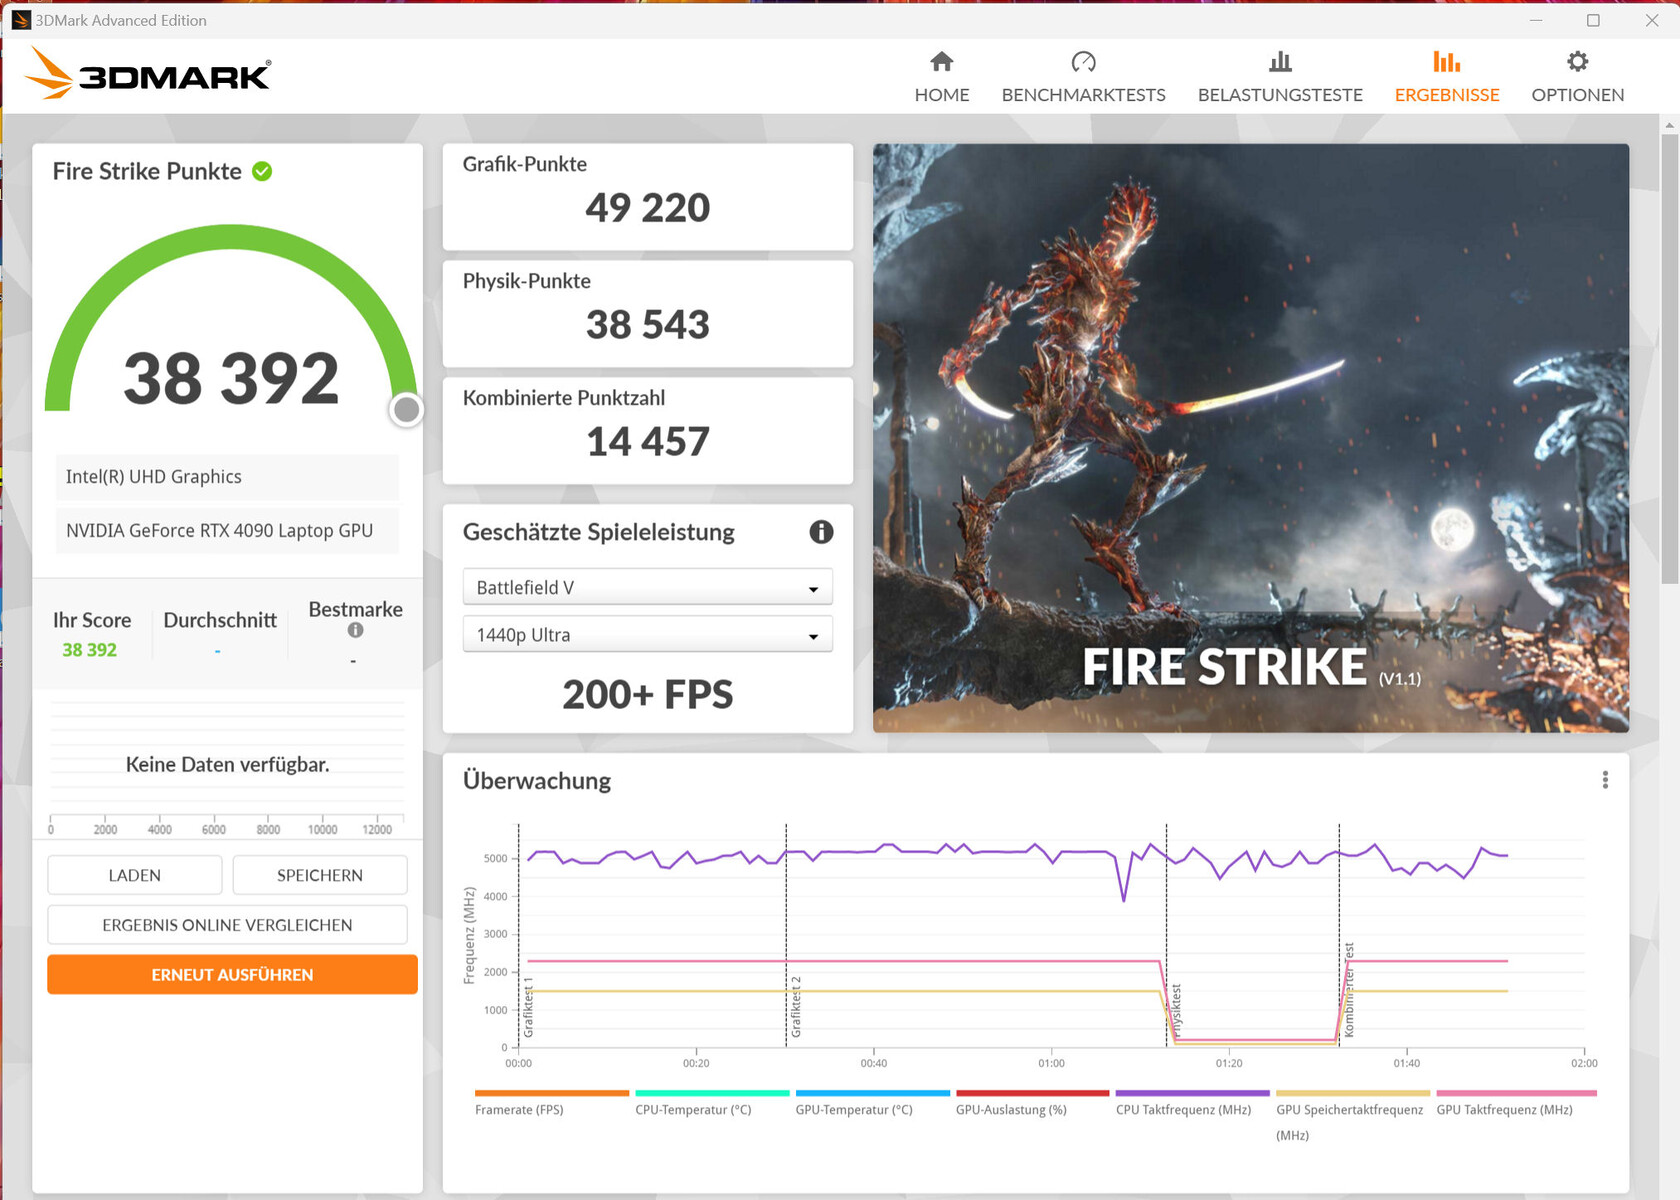
Le portable GeForce RTX 4090 est l'actuel GPU mobile phare de Nvidia. Il dispose de 9 728 unités d'ombrage, d'un bus mémoire de 256 bits et de 16 384 Mo de mémoire GDDR6 à haute vitesse. La RTX 4090 dispose d'un TGP de 175 watts (150 watts + 25 watts de Dynamic Boost). Mais le TGP n'a pas été pleinement utilisé lors de notre test Witcher 3.
Les résultats des tests sont équivalents (mode Optimus) ou légèrement supérieurs (mode dGPU) à ce que nous avons vu jusqu'à présent avec la RTX 4090 Laptop en moyenne. L'ordinateur portable supporte également le mode Advanced Optimus. Passer du mode dGPU au mode Optimus ne nécessite pas de redémarrer l'ordinateur.
Le refroidissement par eau optionnel peut donner un léger gain de performance dans certains benchmarks et jeux. Witcher 3 par exemple, la vitesse de défilement des images a été plus élevée dans les jeux de la série "La vie en rose", lors de nos tests. La température moyenne du GPU était également plus basse que lors de l'utilisation d'un refroidissement par air.
| 3DMark Performance rating - Percent | |
| MSI Titan GT77 HX 13VI -1! | |
| Medion Erazer Beast X40 | |
| Medion Erazer Beast X40 | |
| Asus ROG Strix Scar 18 2023 G834JY-N6005W | |
| Medion Erazer Beast X40 | |
| Moyenne NVIDIA GeForce RTX 4090 Laptop GPU | |
| Razer Blade 16 Early 2023 -1! | |
| Moyenne de la classe Gaming | |
| Alienware x17 R2 P48E | |
| Schenker XMG Neo 17 M22 -1! | |
| 3DMark 11 - 1280x720 Performance GPU | |
| Medion Erazer Beast X40 (dGPU, Cooling) | |
| MSI Titan GT77 HX 13VI | |
| Medion Erazer Beast X40 | |
| Medion Erazer Beast X40 (dGPU) | |
| Moyenne NVIDIA GeForce RTX 4090 Laptop GPU (54073 - 73027, n=42) | |
| Asus ROG Strix Scar 18 2023 G834JY-N6005W | |
| Razer Blade 16 Early 2023 | |
| Moyenne de la classe Gaming (21841 - 80022, n=104, 2 dernières années) | |
| Alienware x17 R2 P48E | |
| Schenker XMG Neo 17 M22 | |
| 3DMark 06 Standard Score | 60717 points | |
| 3DMark 11 Performance | 47487 points | |
| 3DMark Cloud Gate Standard Score | 66757 points | |
| 3DMark Fire Strike Score | 34788 points | |
| 3DMark Time Spy Score | 19708 points | |
Aide | ||
| Blender | |
| v3.3 Classroom OPTIX/RTX | |
| Moyenne de la classe Gaming (9 - 32, n=106, 2 dernières années) | |
| Razer Blade 16 Early 2023 (3.3.3) | |
| Medion Erazer Beast X40 (3.3.3) | |
| Moyenne NVIDIA GeForce RTX 4090 Laptop GPU (9 - 19, n=39) | |
| Medion Erazer Beast X40 (3.3.3, dGPU, Cooling) | |
| MSI Titan GT77 HX 13VI (3.3.3) | |
| Asus ROG Strix Scar 18 2023 G834JY-N6005W (3.3.3) | |
| Medion Erazer Beast X40 (3.3.3, dGPU) | |
| v3.3 Classroom CUDA | |
| Moyenne de la classe Gaming (15 - 228, n=106, 2 dernières années) | |
| Razer Blade 16 Early 2023 (3.3.3) | |
| Medion Erazer Beast X40 (3.3.3) | |
| Medion Erazer Beast X40 (3.3.3, dGPU, Cooling) | |
| Moyenne NVIDIA GeForce RTX 4090 Laptop GPU (16 - 24, n=39) | |
| Asus ROG Strix Scar 18 2023 G834JY-N6005W (3.3.3) | |
| Asus ROG Strix Scar 18 2023 G834JY-N6005W (3.3.3) | |
| Medion Erazer Beast X40 (3.3.3, dGPU) | |
| MSI Titan GT77 HX 13VI (3.3.3) | |
| Geekbench 5.5 | |
| OpenCL Score | |
| Medion Erazer Beast X40 (dGPU) | |
| MSI Titan GT77 HX 13VI | |
| Asus ROG Strix Scar 18 2023 G834JY-N6005W | |
| Moyenne NVIDIA GeForce RTX 4090 Laptop GPU (6841 - 237138, n=39) | |
| Medion Erazer Beast X40 | |
| Medion Erazer Beast X40 (dGPU, Cooling) | |
| Razer Blade 16 Early 2023 | |
| Moyenne de la classe Gaming (80702 - 277970, n=101, 2 dernières années) | |
| Alienware x17 R2 P48E | |
| Schenker XMG Neo 17 M22 | |
| Vulkan Score 5.5 | |
| Medion Erazer Beast X40 (dGPU, Cooling) | |
| Moyenne de la classe Gaming (18857 - 246759, n=76, 2 dernières années) | |
| Moyenne NVIDIA GeForce RTX 4090 Laptop GPU (49663 - 163089, n=28) | |
| MSI Titan GT77 HX 13VI | |
| Alienware x17 R2 P48E | |
| Medion Erazer Beast X40 (dGPU) | |
| Razer Blade 16 Early 2023 | |
| Asus ROG Strix Scar 18 2023 G834JY-N6005W | |
| V-Ray Benchmark Next 4.10 | |
| GPU | |
| Asus ROG Strix Scar 18 2023 G834JY-N6005W (v4.10.07 ) | |
| MSI Titan GT77 HX 13VI (v4.10.07 ) | |
| Medion Erazer Beast X40 (v4.10.07 ) | |
| Medion Erazer Beast X40 (v4.10.07, dGPU) | |
| Moyenne NVIDIA GeForce RTX 4090 Laptop GPU (873 - 1334, n=30) | |
| Medion Erazer Beast X40 (v4.10.07, dGPU, Cooling ) | |
| Moyenne de la classe Gaming (427 - 1627, n=99, 2 dernières années) | |
| Schenker XMG Neo 17 M22 (v4.10.07 ) | |
| CPU | |
| MSI Titan GT77 HX 13VI (v4.10.07 ) | |
| Medion Erazer Beast X40 (v4.10.07, dGPU, Cooling) | |
| Asus ROG Strix Scar 18 2023 G834JY-N6005W (v4.10.07 ) | |
| Medion Erazer Beast X40 (v4.10.07 ) | |
| Medion Erazer Beast X40 (v4.10.07, dGPU) | |
| Moyenne NVIDIA GeForce RTX 4090 Laptop GPU (18206 - 37629, n=30) | |
| Moyenne de la classe Gaming (10048 - 45327, n=97, 2 dernières années) | |
| Schenker XMG Neo 17 M22 (v4.10.07 ) | |
* ... Moindre est la valeur, meilleures sont les performances
Performances de jeu
Le X40 permet aux utilisateurs de jouer à des jeux en QHD+ et avec des paramètres maximaux. Il est possible d'utiliser une résolution plus élevée en connectant l'ordinateur portable à un moniteur approprié. Les jeux que nous avons testés ont généralement fonctionné à des taux de rafraîchissement similaires à ceux que nous avons vus avec la RTX 4090 jusqu'à présent. En fonction du jeu, il est possible d'obtenir des taux de rafraîchissement plus élevés en pilotant l'écran directement à partir du GPU GeForce.
| Performance rating - Percent | |
| Medion Erazer Beast X40 | |
| Medion Erazer Beast X40 | |
| Asus ROG Strix Scar 18 2023 G834JY-N6005W -1! | |
| MSI Titan GT77 HX 13VI | |
| Medion Erazer Beast X40 | |
| Moyenne NVIDIA GeForce RTX 4090 Laptop GPU | |
| Razer Blade 16 Early 2023 | |
| Moyenne de la classe Gaming | |
| Alienware x17 R2 P48E | |
| Schenker XMG Neo 17 M22 | |
| The Witcher 3 - 1920x1080 Ultra Graphics & Postprocessing (HBAO+) | |
| Medion Erazer Beast X40 (dGPU) | |
| Medion Erazer Beast X40 (dGPU, Cooling) | |
| MSI Titan GT77 HX 13VI | |
| Moyenne NVIDIA GeForce RTX 4090 Laptop GPU (139.2 - 216, n=35) | |
| Moyenne de la classe Gaming (104.7 - 240, n=7, 2 dernières années) | |
| Medion Erazer Beast X40 | |
| Razer Blade 16 Early 2023 | |
| Alienware x17 R2 P48E | |
| Schenker XMG Neo 17 M22 | |
| GTA V - 1920x1080 Highest AA:4xMSAA + FX AF:16x | |
| Medion Erazer Beast X40 (dGPU) | |
| Medion Erazer Beast X40 | |
| Medion Erazer Beast X40 (dGPU, Cooling) | |
| Asus ROG Strix Scar 18 2023 G834JY-N6005W | |
| MSI Titan GT77 HX 13VI | |
| Razer Blade 16 Early 2023 | |
| Moyenne NVIDIA GeForce RTX 4090 Laptop GPU (91.1 - 167.7, n=40) | |
| Moyenne de la classe Gaming (48.3 - 186.9, n=94, 2 dernières années) | |
| Alienware x17 R2 P48E | |
| Schenker XMG Neo 17 M22 | |
| Final Fantasy XV Benchmark - 1920x1080 High Quality | |
| MSI Titan GT77 HX 13VI (1.3) | |
| Medion Erazer Beast X40 (1.3, dGPU) | |
| Medion Erazer Beast X40 (1.3, dGPU, Cooling) | |
| Asus ROG Strix Scar 18 2023 G834JY-N6005W (1.3) | |
| Medion Erazer Beast X40 (1.3) | |
| Moyenne NVIDIA GeForce RTX 4090 Laptop GPU (122.2 - 201, n=40) | |
| Razer Blade 16 Early 2023 (1.3) | |
| Moyenne de la classe Gaming (41 - 215, n=95, 2 dernières années) | |
| Alienware x17 R2 P48E (1.3) | |
| Schenker XMG Neo 17 M22 (1.3) | |
| Strange Brigade - 1920x1080 ultra AA:ultra AF:16 | |
| Medion Erazer Beast X40 (1.47.22.14 D3D12, dGPU, Cooling) | |
| Medion Erazer Beast X40 (1.47.22.14 D3D12, dGPU) | |
| MSI Titan GT77 HX 13VI (1.47.22.14 D3D12) | |
| Asus ROG Strix Scar 18 2023 G834JY-N6005W (1.47.22.14 D3D12) | |
| Medion Erazer Beast X40 (1.47.22.14 D3D12) | |
| Moyenne NVIDIA GeForce RTX 4090 Laptop GPU (233 - 421, n=39) | |
| Razer Blade 16 Early 2023 (1.47.22.14 D3D12) | |
| Moyenne de la classe Gaming (76.3 - 458, n=87, 2 dernières années) | |
| Alienware x17 R2 P48E (1.47.22.14 D3D12) | |
| Schenker XMG Neo 17 M22 (1.47.22.14 D3D12) | |
| Dota 2 Reborn - 1920x1080 ultra (3/3) best looking | |
| Razer Blade 16 Early 2023 | |
| Asus ROG Strix Scar 18 2023 G834JY-N6005W | |
| MSI Titan GT77 HX 13VI | |
| Medion Erazer Beast X40 (dGPU, Cooling) | |
| Medion Erazer Beast X40 (dGPU) | |
| Moyenne NVIDIA GeForce RTX 4090 Laptop GPU (115.7 - 220, n=42) | |
| Medion Erazer Beast X40 | |
| Alienware x17 R2 P48E | |
| Moyenne de la classe Gaming (84.8 - 248, n=107, 2 dernières années) | |
| Schenker XMG Neo 17 M22 | |
| X-Plane 11.11 - 1920x1080 high (fps_test=3) | |
| Asus ROG Strix Scar 18 2023 G834JY-N6005W | |
| Razer Blade 16 Early 2023 | |
| Medion Erazer Beast X40 (dGPU) | |
| Medion Erazer Beast X40 (dGPU, Cooling) | |
| MSI Titan GT77 HX 13VI | |
| MSI Titan GT77 HX 13VI | |
| Moyenne NVIDIA GeForce RTX 4090 Laptop GPU (77.8 - 166.2, n=46) | |
| Medion Erazer Beast X40 | |
| Alienware x17 R2 P48E | |
| Moyenne de la classe Gaming (55.5 - 143.5, n=109, 2 dernières années) | |
| Schenker XMG Neo 17 M22 | |
| Returnal | |
| 1920x1080 Epic Preset | |
| Moyenne NVIDIA GeForce RTX 4090 Laptop GPU (141 - 155, n=3) | |
| Medion Erazer Beast X40 | |
| 2560x1440 Epic Preset | |
| Moyenne NVIDIA GeForce RTX 4090 Laptop GPU (113 - 119, n=3) | |
| Medion Erazer Beast X40 | |
| 1920x1080 Epic Preset + Epic Ray-Tracing | |
| Moyenne NVIDIA GeForce RTX 4090 Laptop GPU (126 - 128, n=2) | |
| Medion Erazer Beast X40 | |
| Atomic Heart | |
| 1920x1080 Atomic Preset | |
| Moyenne NVIDIA GeForce RTX 4090 Laptop GPU (128.6 - 166, n=3) | |
| Medion Erazer Beast X40 | |
| 2560x1440 Atomic Preset | |
| Moyenne NVIDIA GeForce RTX 4090 Laptop GPU (93.8 - 135, n=3) | |
| Medion Erazer Beast X40 | |
| Hogwarts Legacy | |
| 1920x1080 Ultra Preset AA:High T | |
| Medion Erazer Beast X40 | |
| Moyenne de la classe Gaming (n=12 dernières années) | |
| Moyenne NVIDIA GeForce RTX 4090 Laptop GPU (41.2 - 166.1, n=4) | |
| 2560x1440 Ultra Preset AA:High T | |
| Medion Erazer Beast X40 | |
| Moyenne de la classe Gaming (n=12 dernières années) | |
| Moyenne NVIDIA GeForce RTX 4090 Laptop GPU (40.6 - 125.9, n=4) | |
| 1920x1080 Ultra Preset + Full Ray Tracing AA:High T | |
| Medion Erazer Beast X40 | |
| Moyenne NVIDIA GeForce RTX 4090 Laptop GPU (52.2 - 67, n=3) | |
| Company of Heroes 3 | |
| 1920x1080 Maximum Settings | |
| Moyenne NVIDIA GeForce RTX 4090 Laptop GPU (215 - 235, n=2) | |
| Medion Erazer Beast X40 | |
| 2560x1440 Maximum Settings | |
| Moyenne NVIDIA GeForce RTX 4090 Laptop GPU (176.4 - 194.8, n=2) | |
| Medion Erazer Beast X40 | |
| Sons of the Forest | |
| 1920x1080 Ultra Preset AA:T | |
| Moyenne NVIDIA GeForce RTX 4090 Laptop GPU (85.7 - 93.9, n=2) | |
| Medion Erazer Beast X40 | |
| 2560x1440 Ultra Preset AA:T | |
| Moyenne NVIDIA GeForce RTX 4090 Laptop GPU (85.2 - 89.6, n=2) | |
| Medion Erazer Beast X40 | |
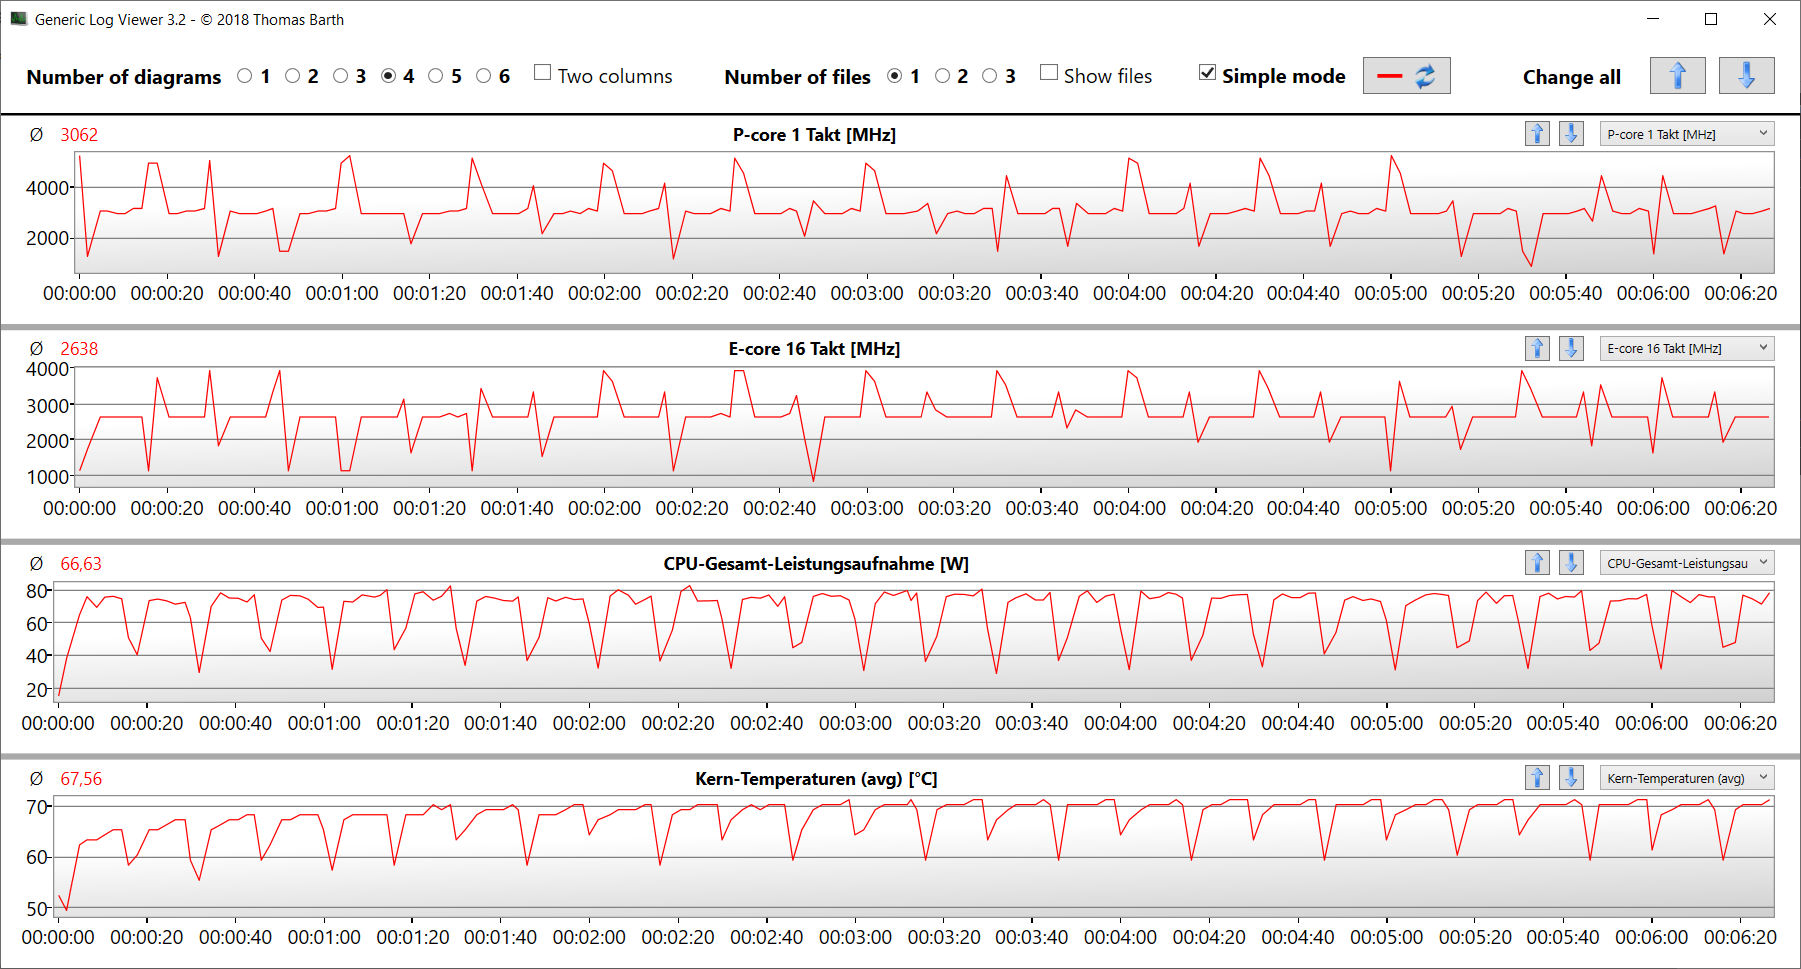
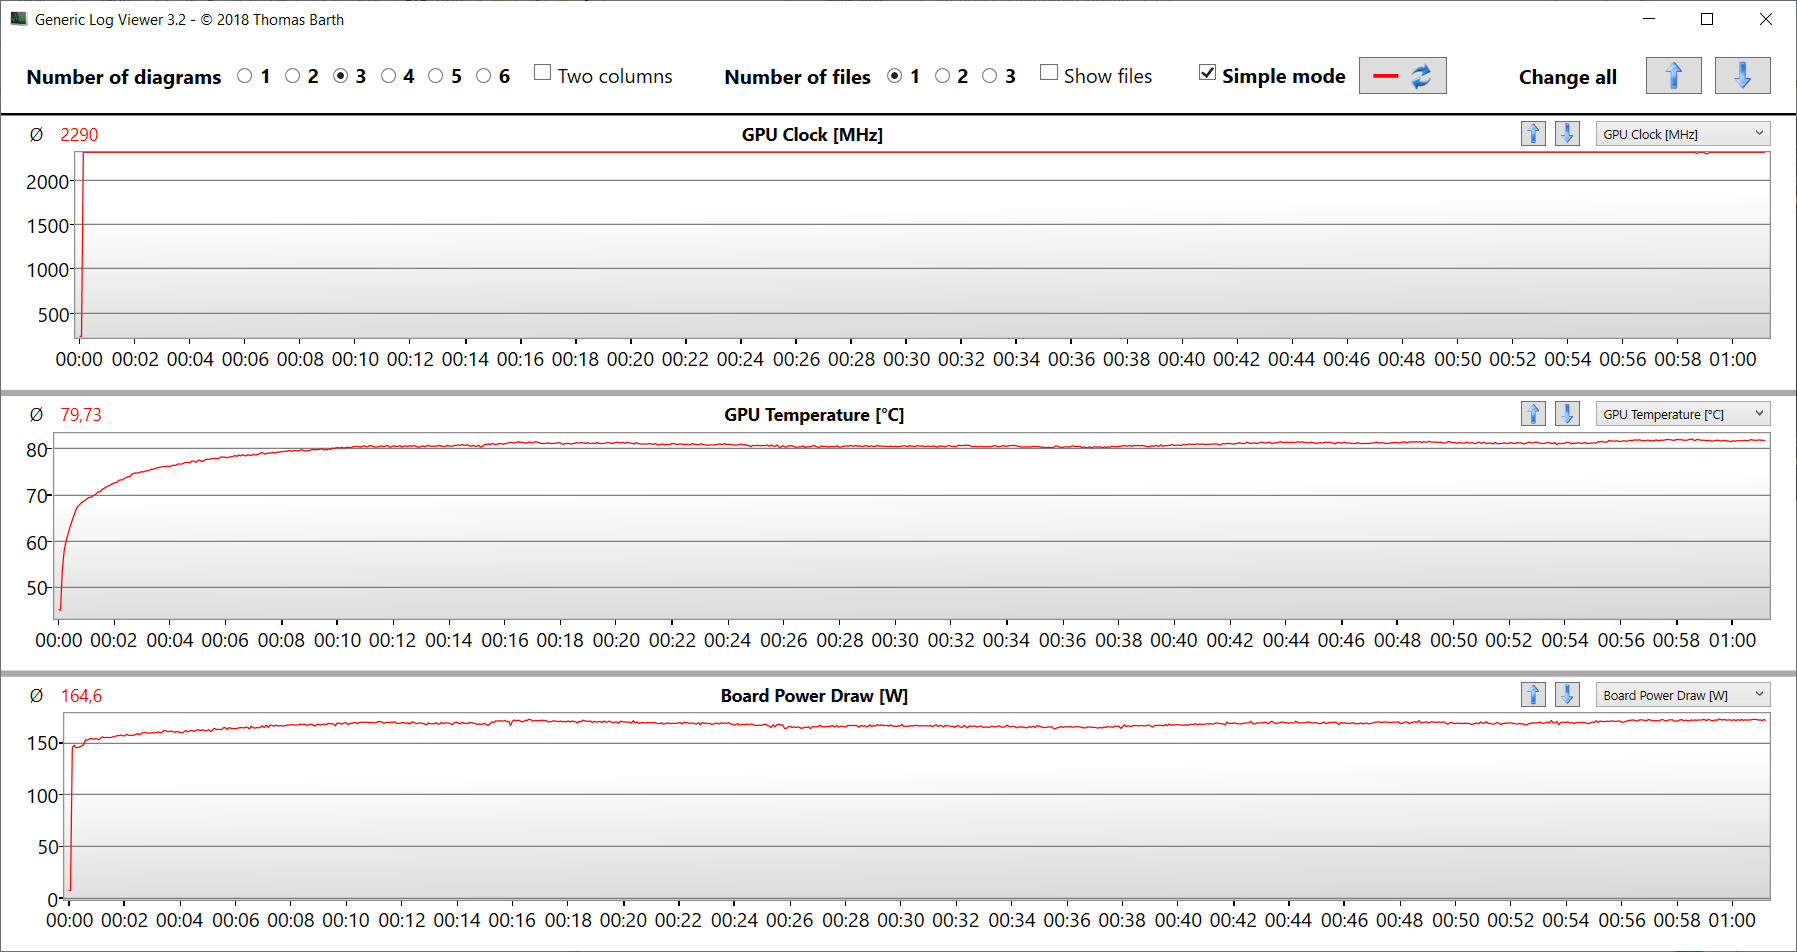
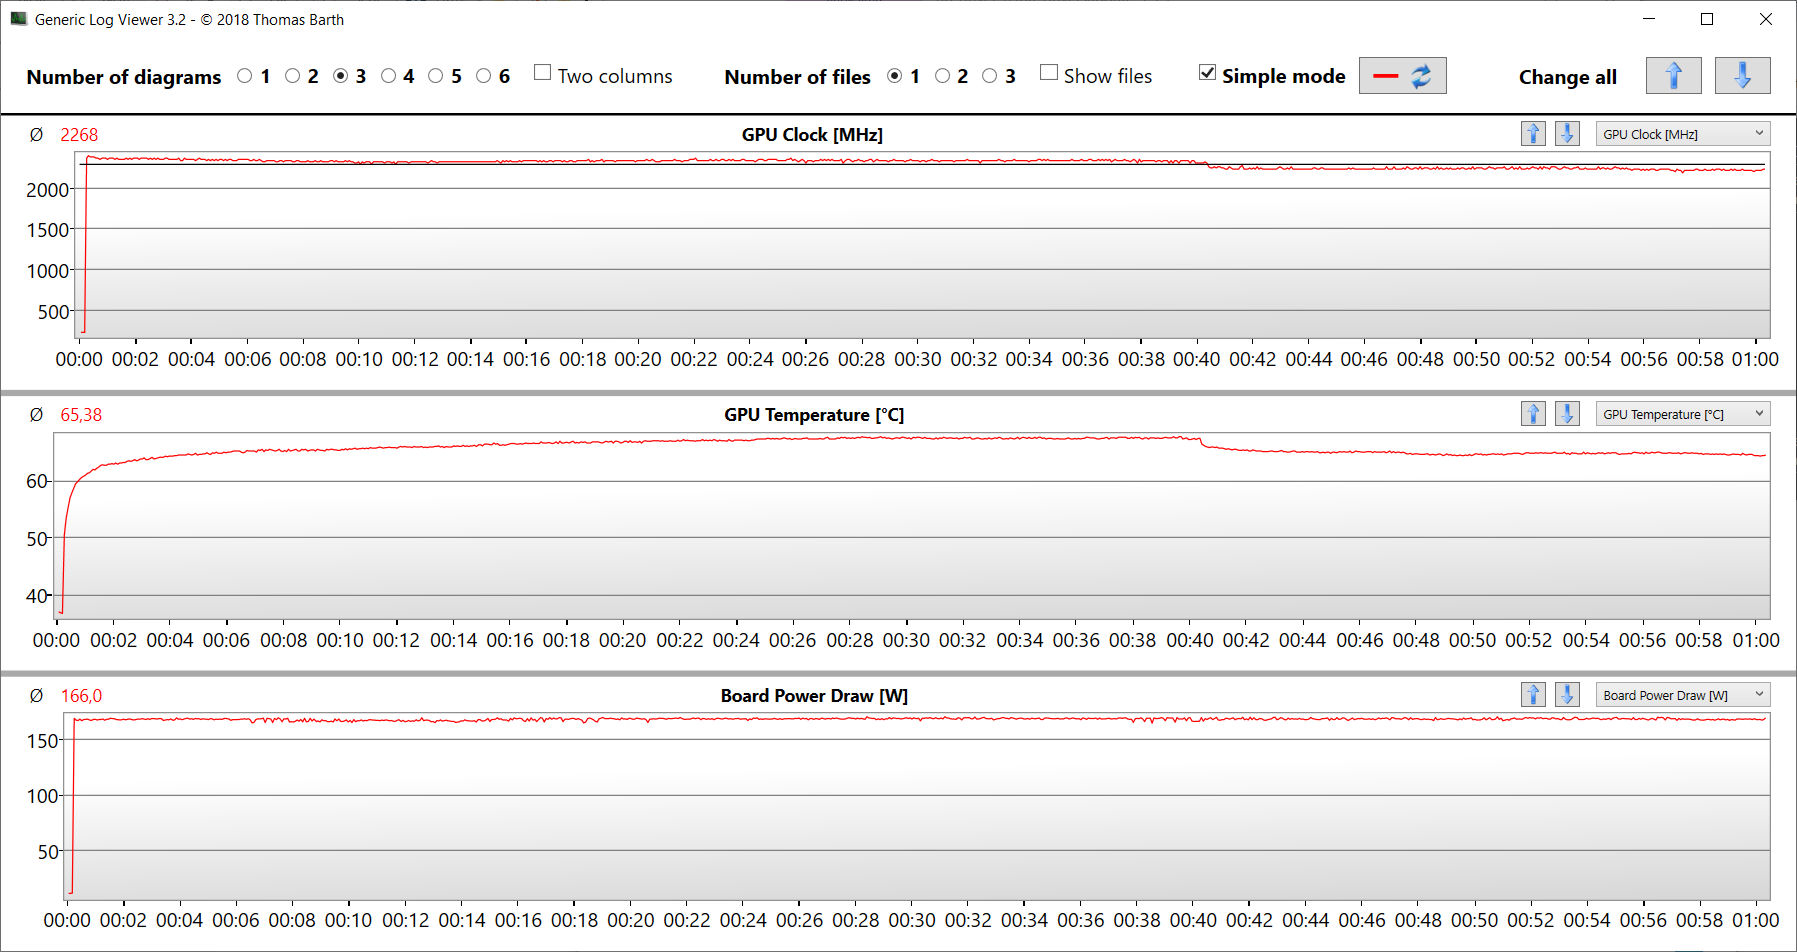
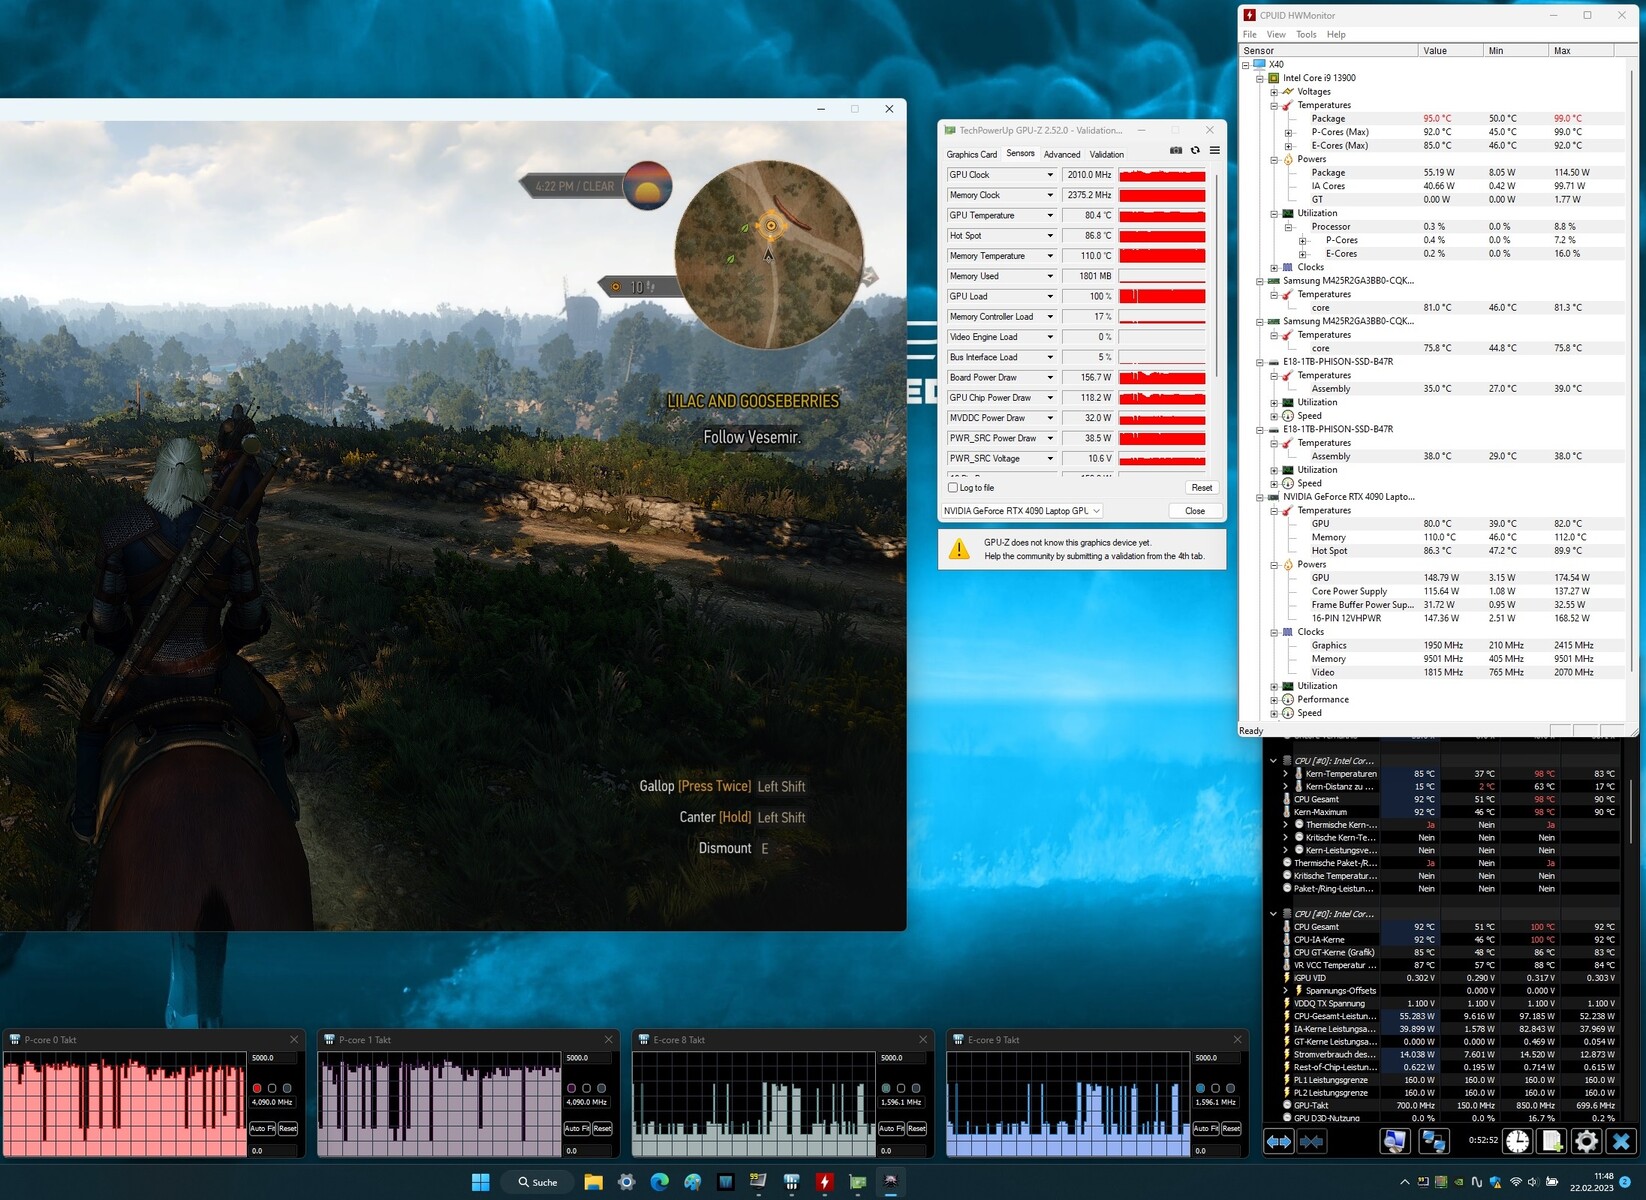
Pour vérifier si l'ordinateur portable peut faire tourner des jeux à des taux de rafraîchissement stables sur une longue période, nous avons fait tourner The Witcher 3 pendant environ 60 minutes en Full HD et avec des paramètres de qualité maximum, sans déplacer le personnage du joueur. Nous n'avons pas observé de baisse de la fréquence des images.
Witcher 3 FPS graph
| Bas | Moyen | Élevé | Ultra | QHD | |
|---|---|---|---|---|---|
| GTA V (2015) | 187.5 | 187.1 | 186 | 151.3 | 145.3 |
| The Witcher 3 (2015) | 586.4 | 511.4 | 363.8 | 195.1 | |
| Dota 2 Reborn (2015) | 215 | 193.5 | 182.6 | 171.5 | |
| Final Fantasy XV Benchmark (2018) | 232 | 207 | 176.2 | 146.7 | |
| X-Plane 11.11 (2018) | 187.1 | 162.9 | 128.3 | ||
| Far Cry 5 (2018) | 199 | 172 | 167 | 158 | 151 |
| Strange Brigade (2018) | 515 | 387 | 369 | 365 | 292 |
| Hunt Showdown (2020) | 367 | 285 | 262 | 168 | |
| Death Stranding (2020) | 179 | 171.4 | 166.6 | 163 | 162.1 |
| Yakuza Like a Dragon (2020) | 179.7 | 167.7 | 166.6 | 152.3 | 138.1 |
| Back 4 Blood (2021) | 403 | 309 | 309 | 327 | |
| Guardians of the Galaxy (2021) | 163 | 160 | 158 | 152 | 141 |
| Riders Republic (2021) | 209 | 200 | 185 | 179 | 146 |
| Elex 2 (2022) | 118.2 | 117.1 | 116.2 | 116.2 | 116.7 |
| F1 22 (2022) | 301 | 290 | 268 | 118.2 | 79.9 |
| The Quarry (2022) | 278 | 211 | 177.3 | 146.1 | 100.2 |
| Hogwarts Legacy (2023) | 242 | 204 | 186.5 | 166.1 | 125.9 |
| Returnal (2023) | 178 | 171 | 164 | 146 | 113 |
| Atomic Heart (2023) | 205 | 161.8 | 144.2 | 128.6 | 93.8 |
| Company of Heroes 3 (2023) | 285.3 | 262.9 | 235.2 | 215.2 | 176.4 |
| Sons of the Forest (2023) | 96.1 | 90 | 87.9 | 85.7 | 85.2 |
Émissions - L'ordinateur portable Erazer peut être assez bruyant
Émissions sonores
L'ordinateur portable est relativement silencieux lors d'une utilisation quotidienne (par exemple, applications bureautiques, navigation sur Internet). Les ventilateurs peuvent même s'arrêter de tourner de temps en temps. Sans surprise, le X40 peut devenir assez bruyant sous forte charge, produisant jusqu'à 53 dB(A) de bruit pendant le test de stress et le test Witcher 3. Malgré les niveaux sonores assez élevés, le son produit par les deux ventilateurs est tolérable dans l'ensemble : un bruit de souffle est accompagné d'un ronronnement sonore qui se transforme progressivement en un léger sifflement à mesure que la vitesse du ventilateur augmente.
Les ventilateurs de l'ordinateur portable s'arrêtent lorsque l'unité externe de refroidissement à l'eau est connectée. Cependant, l'unité elle-même ajoute au bruit général : bien que la pompe soit relativement silencieuse, le ventilateur à l'intérieur du refroidisseur fait plus de bruit. Tout bien considéré, nous pensons que le bruit global est plus agréable lorsque l'unité de refroidissement à l'eau est utilisée.
Degré de la nuisance sonore
| Au repos |
| 25 / 29 / 35 dB(A) |
| Fortement sollicité |
| 51 / 53 dB(A) |
 | ||
30 dB silencieux 40 dB(A) audible 50 dB(A) bruyant |
||
min: | ||
| Medion Erazer Beast X40 GeForce RTX 4090 Laptop GPU, i9-13900HX | MSI Titan GT77 HX 13VI GeForce RTX 4090 Laptop GPU, i9-13950HX | Razer Blade 16 Early 2023 GeForce RTX 4080 Laptop GPU, i9-13950HX | Schenker XMG Neo 17 M22 GeForce RTX 3080 Ti Laptop GPU, R9 6900HX | Alienware x17 R2 P48E GeForce RTX 3080 Ti Laptop GPU, i9-12900HK | Asus ROG Strix Scar 18 2023 G834JY-N6005W GeForce RTX 4090 Laptop GPU, i9-13980HX | |
|---|---|---|---|---|---|---|
| Noise | -3% | 13% | -3% | 15% | 4% | |
| arrêt / environnement * (dB) | 24 | 24.6 -3% | 23 4% | 26 -8% | 22.7 5% | 23.9 -0% |
| Idle Minimum * (dB) | 25 | 29.2 -17% | 23 8% | 26 -4% | 23.1 8% | 23.9 4% |
| Idle Average * (dB) | 29 | 29.2 -1% | 23 21% | 29 -0% | 23.1 20% | 32.6 -12% |
| Idle Maximum * (dB) | 35 | 29.2 17% | 23.6 33% | 40 -14% | 23.1 34% | 32.6 7% |
| Load Average * (dB) | 51 | 50.7 1% | 39 24% | 47 8% | 31.9 37% | 35.9 30% |
| Witcher 3 ultra * (dB) | 51 | 53.3 -5% | 51.6 -1% | 52 -2% | 52.5 -3% | |
| Load Maximum * (dB) | 53 | 61 -15% | 51.3 3% | 54 -2% | 52.5 1% | 55.8 -5% |
* ... Moindre est la valeur, meilleures sont les performances
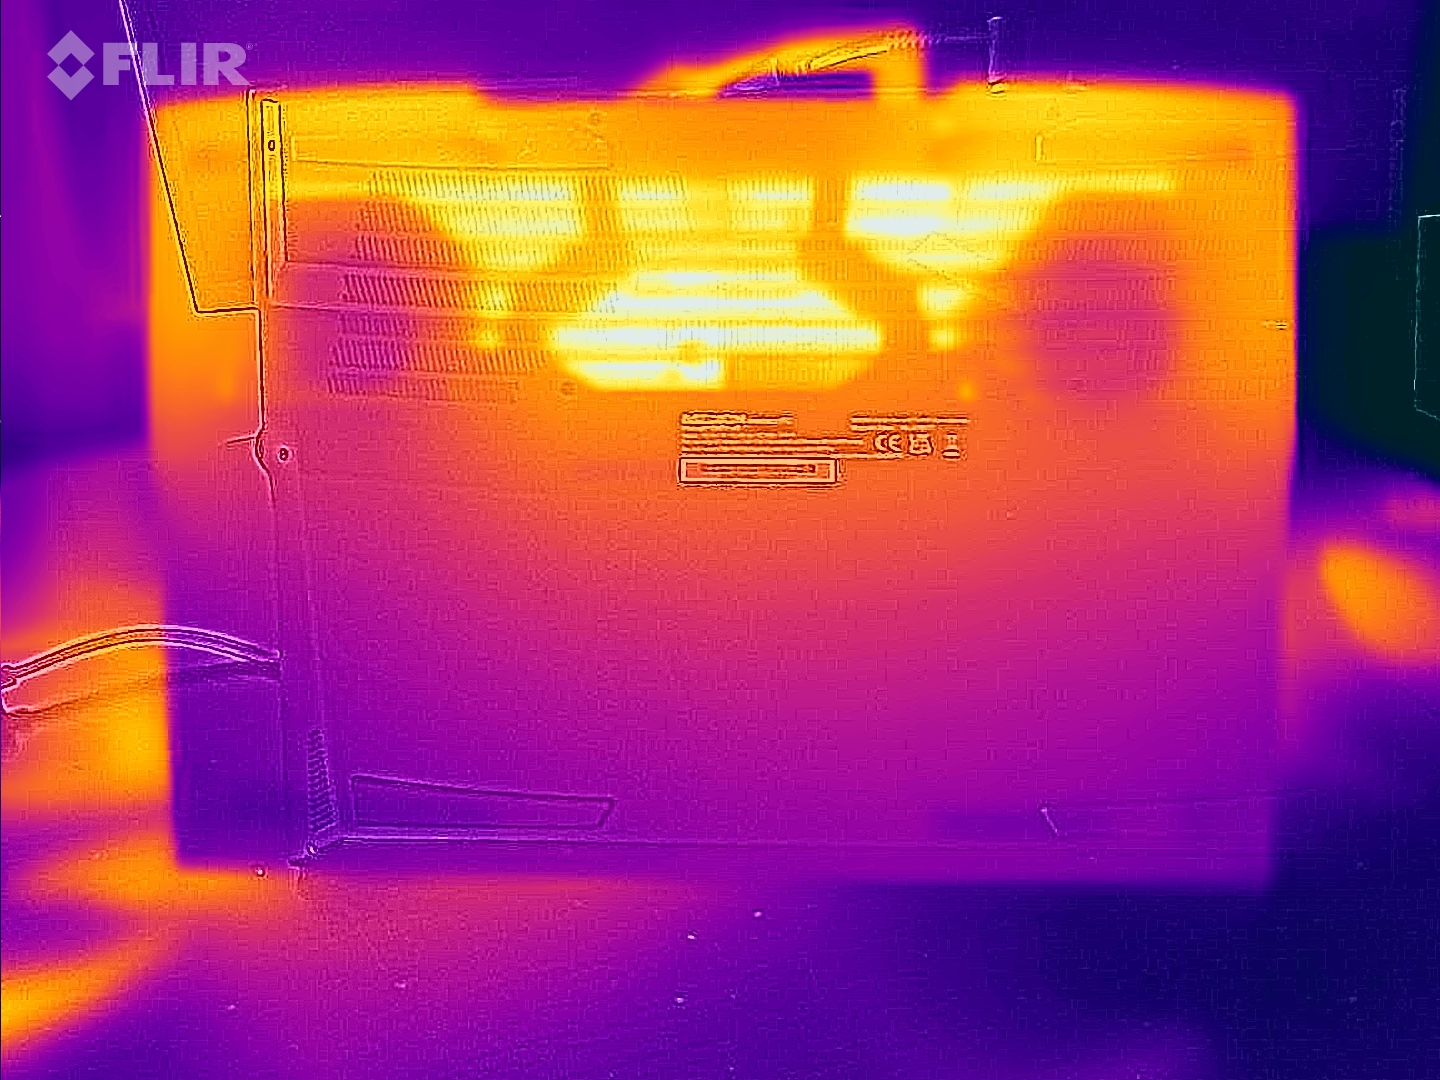
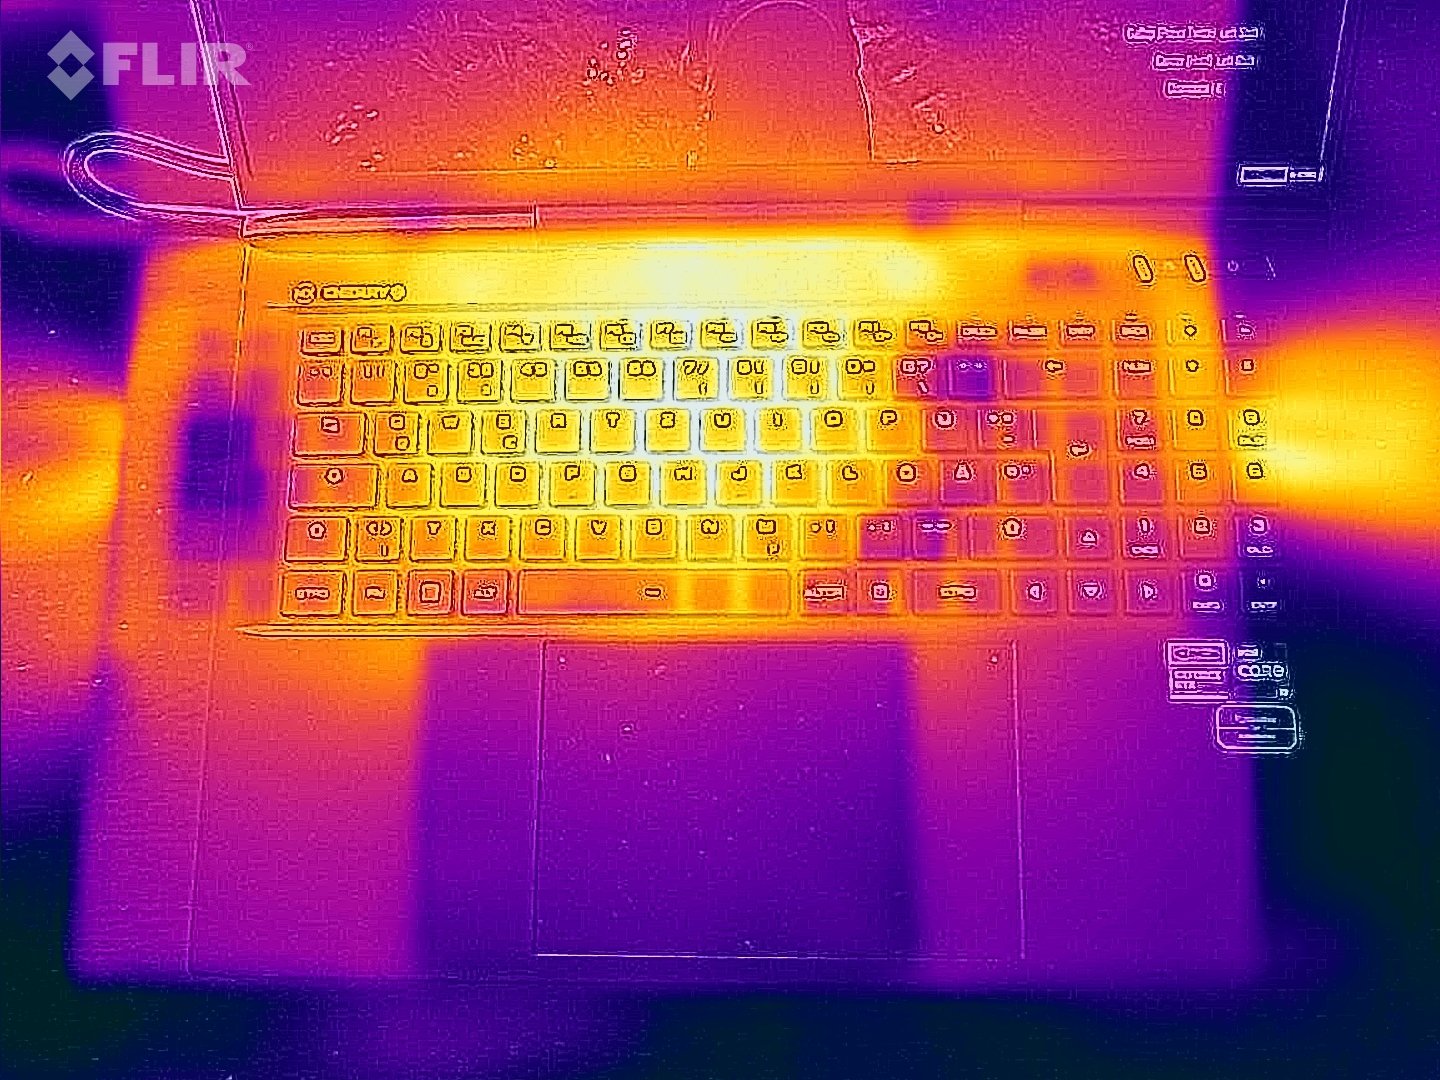
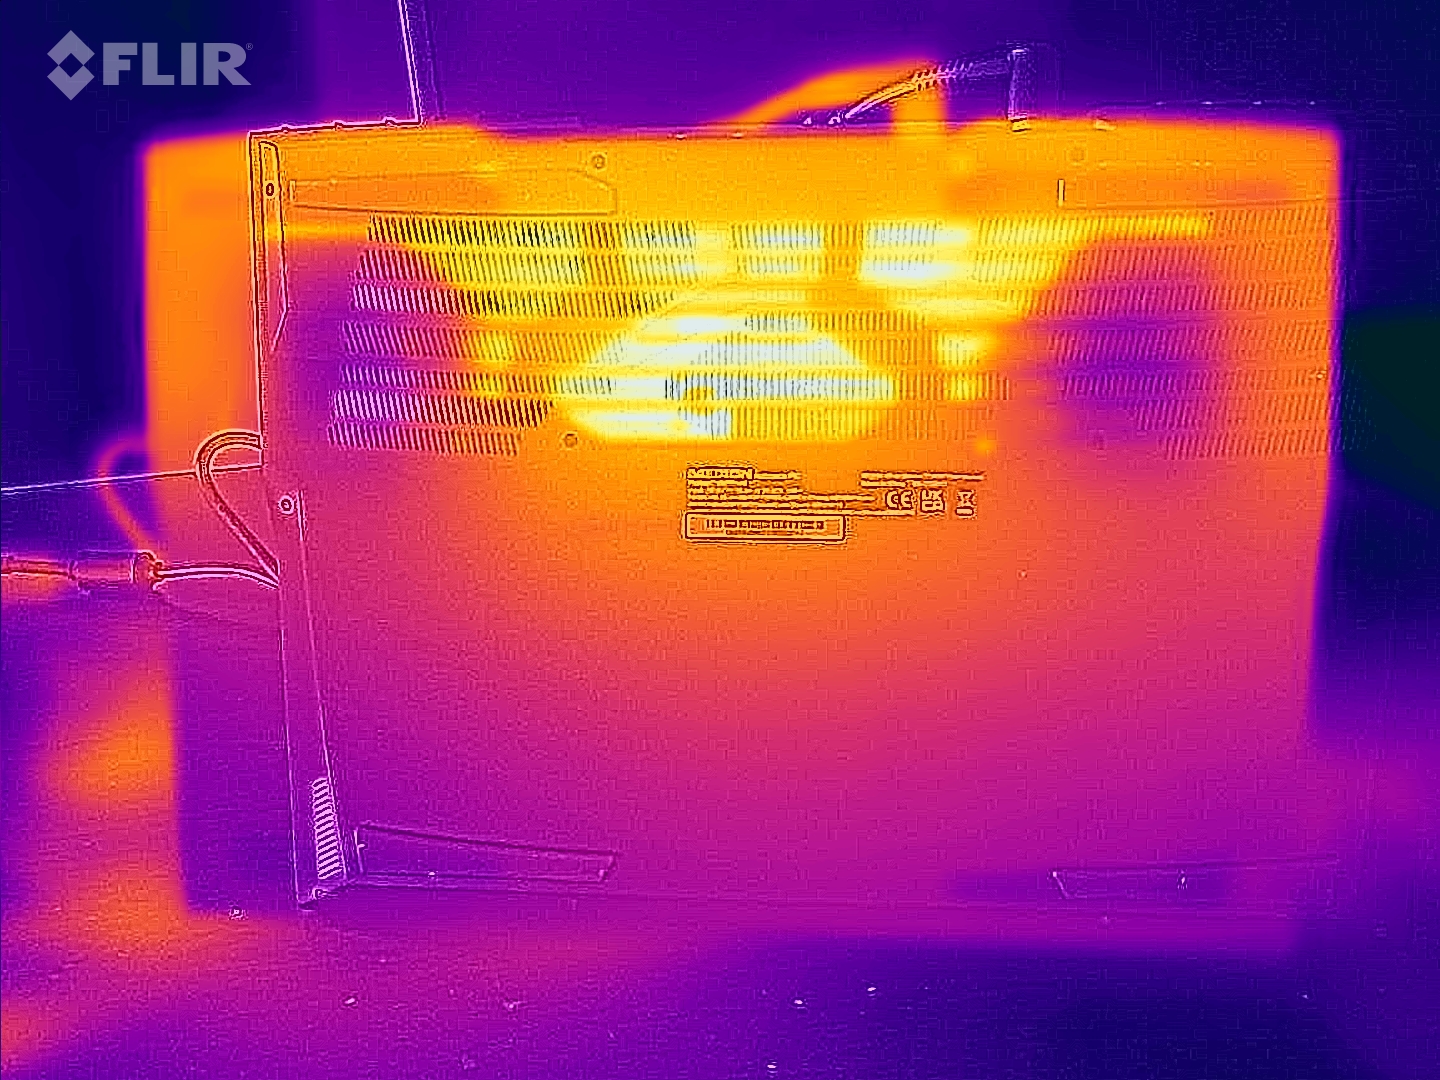
Température
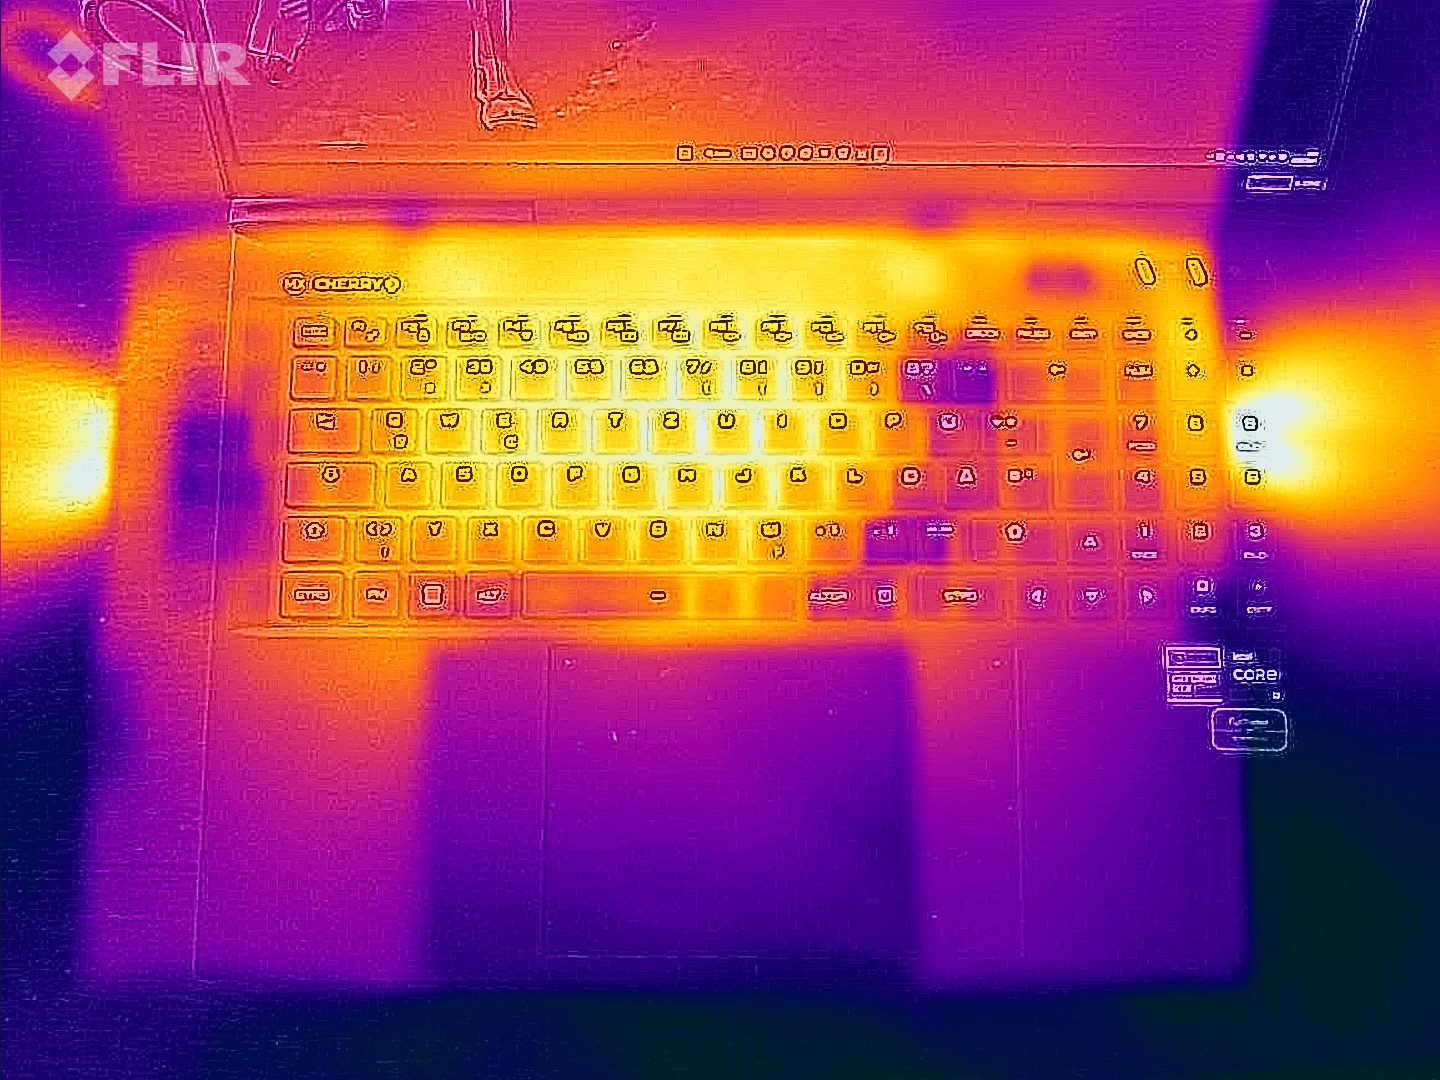
Les températures du châssis restent dans une fourchette acceptable dans les cas d'utilisation quotidienne, tels que l'exécution de logiciels de bureautique et de navigateurs Internet. L'ordinateur portable chauffe sensiblement mais pas trop sous charge, comme nous l'avons constaté lors du test de stress et du test Witcher 3. Les températures du processeur n'ont pas non plus suscité d'inquiétude.
(-) La température maximale du côté supérieur est de 48 °C / 118 F, par rapport à la moyenne de 40.4 °C / 105 F, allant de 21.2 à 68.8 °C pour la classe Gaming.
(-) Le fond chauffe jusqu'à un maximum de 52 °C / 126 F, contre une moyenne de 43.2 °C / 110 F
(+) En utilisation inactive, la température moyenne du côté supérieur est de 28.2 °C / 83 F, par rapport à la moyenne du dispositif de 33.9 °C / 93 F.
(-) En jouant à The Witcher 3, la température moyenne du côté supérieur est de 40.7 °C / 105 F, alors que la moyenne de l'appareil est de 33.9 °C / 93 F.
(+) Les repose-poignets et le pavé tactile atteignent la température maximale de la peau (34 °C / 93.2 F) et ne sont donc pas chauds.
(-) La température moyenne de la zone de l'appui-paume de dispositifs similaires était de 28.8 °C / 83.8 F (-5.2 °C / #-9.4 F).
| Medion Erazer Beast X40 Intel Core i9-13900HX, NVIDIA GeForce RTX 4090 Laptop GPU | MSI Titan GT77 HX 13VI Intel Core i9-13950HX, NVIDIA GeForce RTX 4090 Laptop GPU | Razer Blade 16 Early 2023 Intel Core i9-13950HX, NVIDIA GeForce RTX 4080 Laptop GPU | Schenker XMG Neo 17 M22 AMD Ryzen 9 6900HX, NVIDIA GeForce RTX 3080 Ti Laptop GPU | Alienware x17 R2 P48E Intel Core i9-12900HK, NVIDIA GeForce RTX 3080 Ti Laptop GPU | Asus ROG Strix Scar 18 2023 G834JY-N6005W Intel Core i9-13980HX, NVIDIA GeForce RTX 4090 Laptop GPU | |
|---|---|---|---|---|---|---|
| Heat | 13% | 9% | -2% | 4% | -0% | |
| Maximum Upper Side * (°C) | 48 | 40.6 15% | 40 17% | 49 -2% | 49.6 -3% | 54 -13% |
| Maximum Bottom * (°C) | 52 | 41.1 21% | 37.6 28% | 52 -0% | 42.4 18% | 46 12% |
| Idle Upper Side * (°C) | 30 | 26.2 13% | 32.4 -8% | 30 -0% | 29.2 3% | 30 -0% |
| Idle Bottom * (°C) | 31 | 30.3 2% | 31.4 -1% | 33 -6% | 32 -3% | 31 -0% |
* ... Moindre est la valeur, meilleures sont les performances
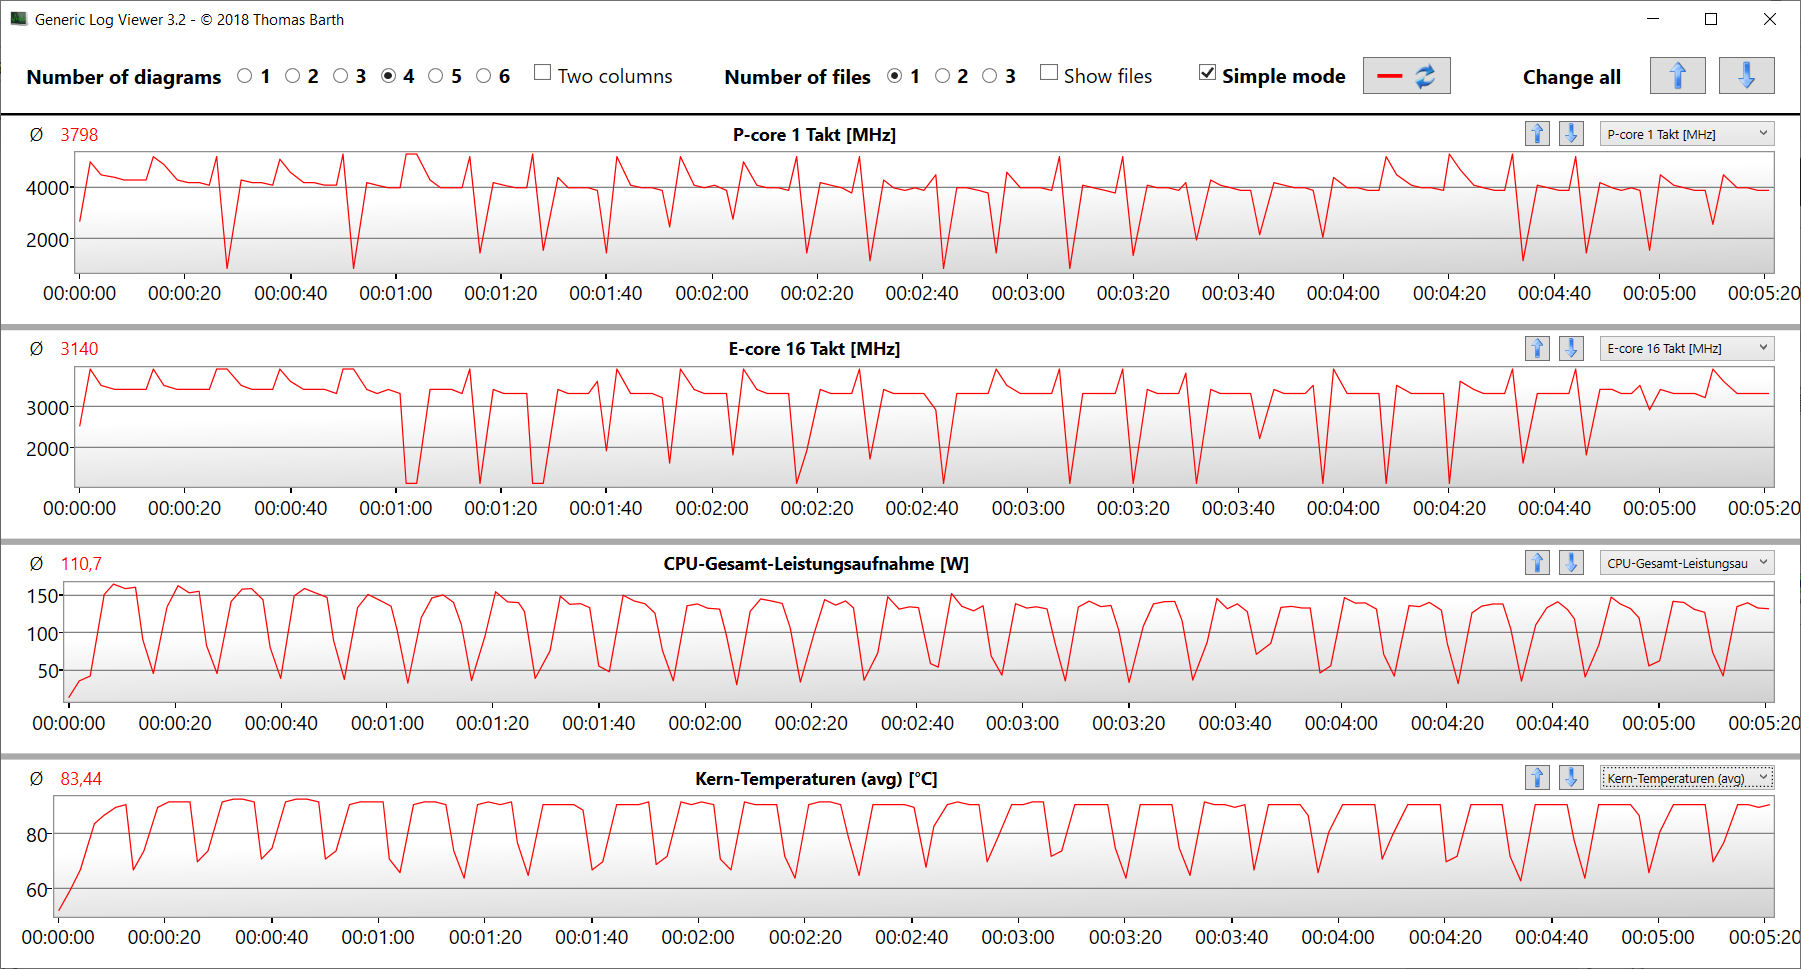
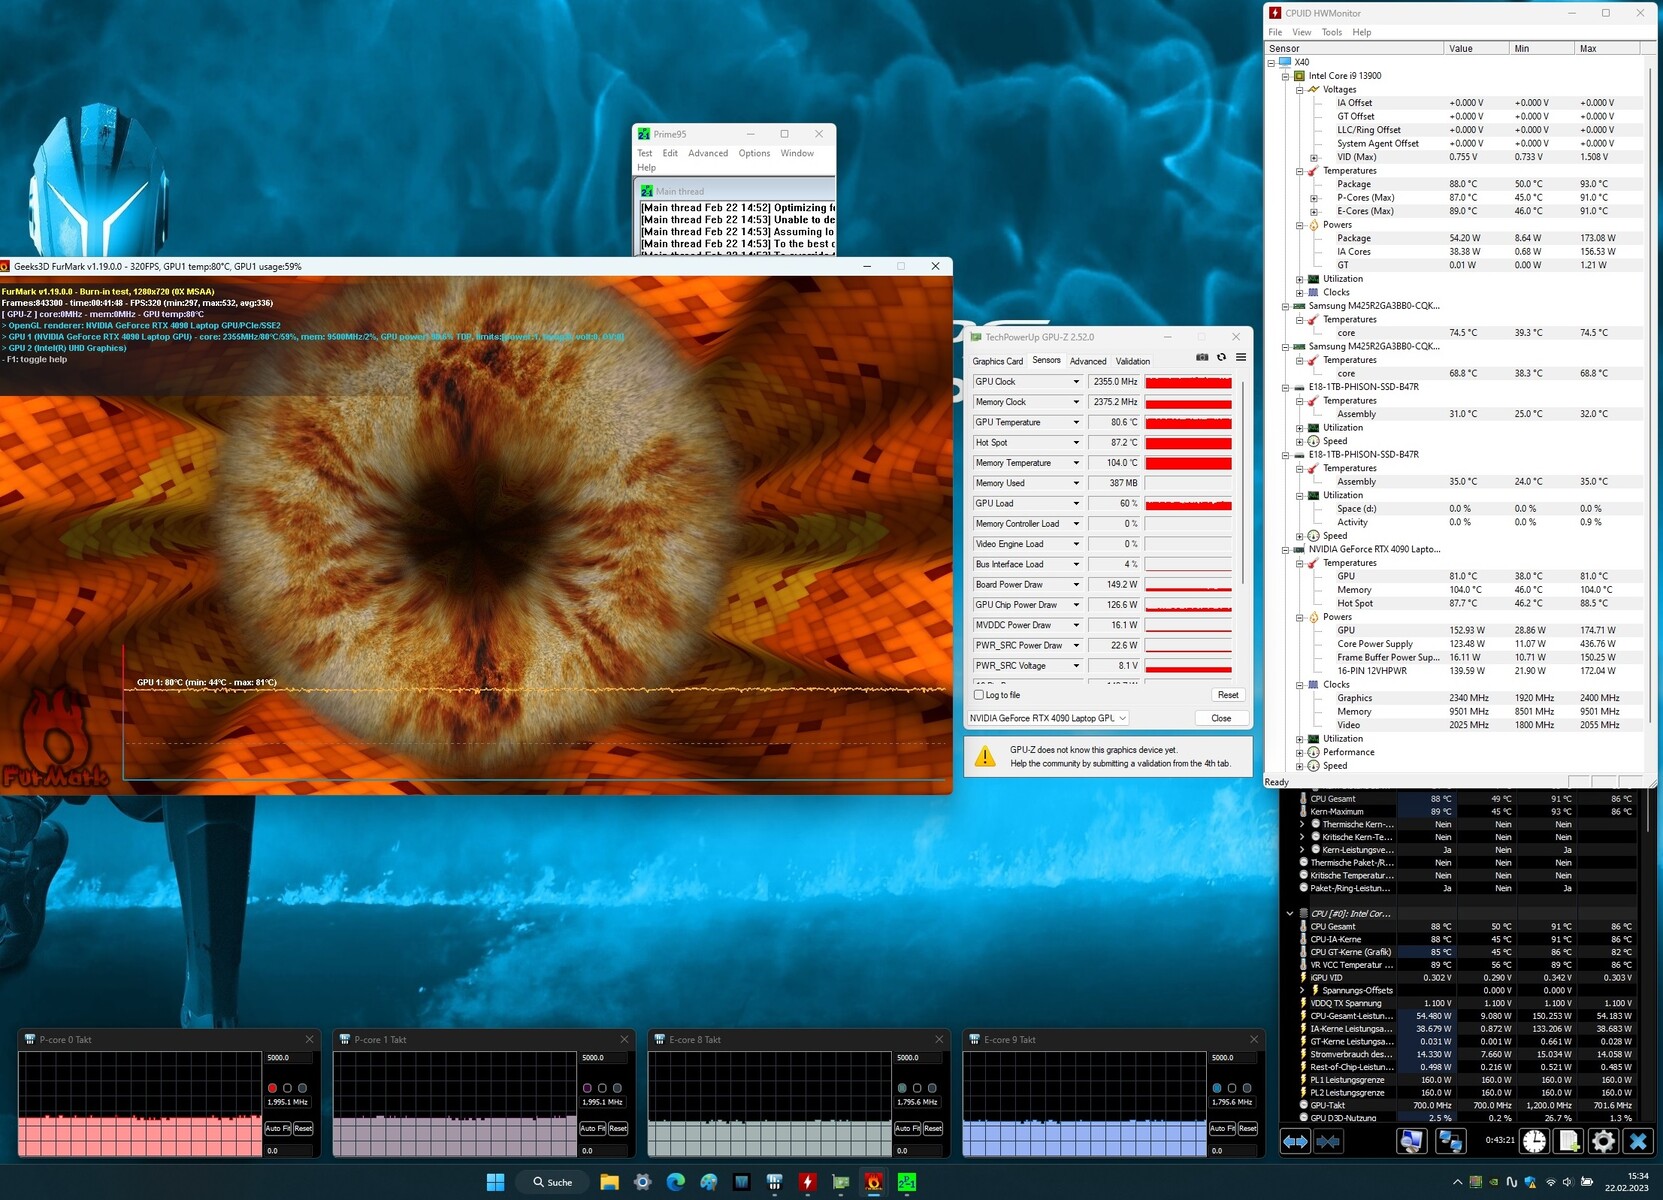
Épreuve d'effort
Pour le test de stress, nous avons laissé Prime95 et FurMark fonctionner pendant une période prolongée. Il s'agit d'un scénario extrême destiné à évaluer la stabilité du système à pleine charge. Le CPU a démarré à des vitesses d'horloge élevées (P-cores : 4 GHz, E-cores : 3,3 GHz) tandis que le GPU fluctuait entre 1 et 1,5 GHz. Après environ cinq minutes, les cœurs P et E du CPU ont progressivement baissé à 2 GHz et 1,8 GHz respectivement, mais l'horloge du GPU a grimpé à environ 2,3 à 2,4 GHz
Les conférenciers
Les haut-parleurs stéréo offrent un son décent mais ne produisent pratiquement pas de basses. Nous recommandons l'utilisation d'un casque ou de haut-parleurs externes pour une meilleure expérience audio.
Medion Erazer Beast X40 analyse audio
(+) | les haut-parleurs peuvent jouer relativement fort (88# dB)
Basses 100 - 315 Hz
(-) | presque aucune basse - en moyenne 20.2% plus bas que la médiane
(±) | la linéarité des basses est moyenne (8.4% delta à la fréquence précédente)
Médiums 400 - 2000 Hz
(±) | médiane supérieure - en moyenne 5.5% supérieure à la médiane
(+) | les médiums sont linéaires (6.5% delta à la fréquence précédente)
Aiguës 2 - 16 kHz
(+) | des sommets équilibrés - à seulement 3.1% de la médiane
(+) | les aigus sont linéaires (5.8% delta à la fréquence précédente)
Globalement 100 - 16 000 Hz
(±) | la linéarité du son global est moyenne (16.1% de différence avec la médiane)
Par rapport à la même classe
» 39% de tous les appareils testés de cette catégorie étaient meilleurs, 7% similaires, 54% pires
» Le meilleur avait un delta de 6%, la moyenne était de 18%, le pire était de 132%.
Par rapport à tous les appareils testés
» 26% de tous les appareils testés étaient meilleurs, 5% similaires, 69% pires
» Le meilleur avait un delta de 4%, la moyenne était de 23%, le pire était de 134%.
MSI Titan GT77 HX 13VI analyse audio
(+) | les haut-parleurs peuvent jouer relativement fort (90.1# dB)
Basses 100 - 315 Hz
(±) | basse réduite - en moyenne 14.3% inférieure à la médiane
(±) | la linéarité des basses est moyenne (7.5% delta à la fréquence précédente)
Médiums 400 - 2000 Hz
(+) | médiane équilibrée - seulement 3.5% de la médiane
(+) | les médiums sont linéaires (3.2% delta à la fréquence précédente)
Aiguës 2 - 16 kHz
(+) | des sommets équilibrés - à seulement 1.9% de la médiane
(+) | les aigus sont linéaires (3.8% delta à la fréquence précédente)
Globalement 100 - 16 000 Hz
(+) | le son global est linéaire (11.1% différence à la médiane)
Par rapport à la même classe
» 8% de tous les appareils testés de cette catégorie étaient meilleurs, 3% similaires, 89% pires
» Le meilleur avait un delta de 6%, la moyenne était de 18%, le pire était de 132%.
Par rapport à tous les appareils testés
» 7% de tous les appareils testés étaient meilleurs, 2% similaires, 91% pires
» Le meilleur avait un delta de 4%, la moyenne était de 23%, le pire était de 134%.
Gestion de l'énergie - Le X40 offre une assez bonne endurance
Consommation électrique
La consommation d'énergie du X40 était en moyenne de 280 watts lors du test Witcher 3 et a brièvement atteint 363 watts lors du test de stress. Alors que la consommation d'énergie a légèrement baissé au cours du test Witcher 3, elle a fluctué tout au long du test de stress. Au repos, l'ordinateur portable consomme une quantité d'énergie relativement normale pour le matériel qu'il contient. Le chargeur fourni a une capacité de 330 watts et peut donc fournir suffisamment d'énergie à l'ordinateur portable.
| Éteint/en veille | |
| Au repos | |
| Fortement sollicité |
|
Légende:
min: | |
| Medion Erazer Beast X40 i9-13900HX, GeForce RTX 4090 Laptop GPU | MSI Titan GT77 HX 13VI i9-13950HX, GeForce RTX 4090 Laptop GPU | Razer Blade 16 Early 2023 i9-13950HX, GeForce RTX 4080 Laptop GPU | Schenker XMG Neo 17 M22 R9 6900HX, GeForce RTX 3080 Ti Laptop GPU | Alienware x17 R2 P48E i9-12900HK, GeForce RTX 3080 Ti Laptop GPU | Asus ROG Strix Scar 18 2023 G834JY-N6005W i9-13980HX, GeForce RTX 4090 Laptop GPU | Moyenne NVIDIA GeForce RTX 4090 Laptop GPU | Moyenne de la classe Gaming | |
|---|---|---|---|---|---|---|---|---|
| Power Consumption | -5% | -14% | 31% | -42% | -30% | -15% | 8% | |
| Idle Minimum * (Watt) | 11 | 14 -27% | 15.2 -38% | 7 36% | 24.1 -119% | 17.3 -57% | 16.2 ? -47% | 13 ? -18% |
| Idle Average * (Watt) | 18 | 21.6 -20% | 22.8 -27% | 11 39% | 28.5 -58% | 27 -50% | 23.1 ? -28% | 19 ? -6% |
| Idle Maximum * (Watt) | 30 | 24.8 17% | 49.8 -66% | 17 43% | 60 -100% | 46 -53% | 34.2 ? -14% | 24.6 ? 18% |
| Load Average * (Watt) | 136 | 122.5 10% | 121.2 11% | 92 32% | 128.7 5% | 133 2% | 130.5 ? 4% | 110.7 ? 19% |
| Witcher 3 ultra * (Watt) | 280 | 265 5% | 242 14% | 221 21% | 254 9% | |||
| Load Maximum * (Watt) | 363 | 418 -15% | 273.7 25% | 306 16% | 323 11% | 329 9% | 324 ? 11% | 259 ? 29% |
* ... Moindre est la valeur, meilleures sont les performances
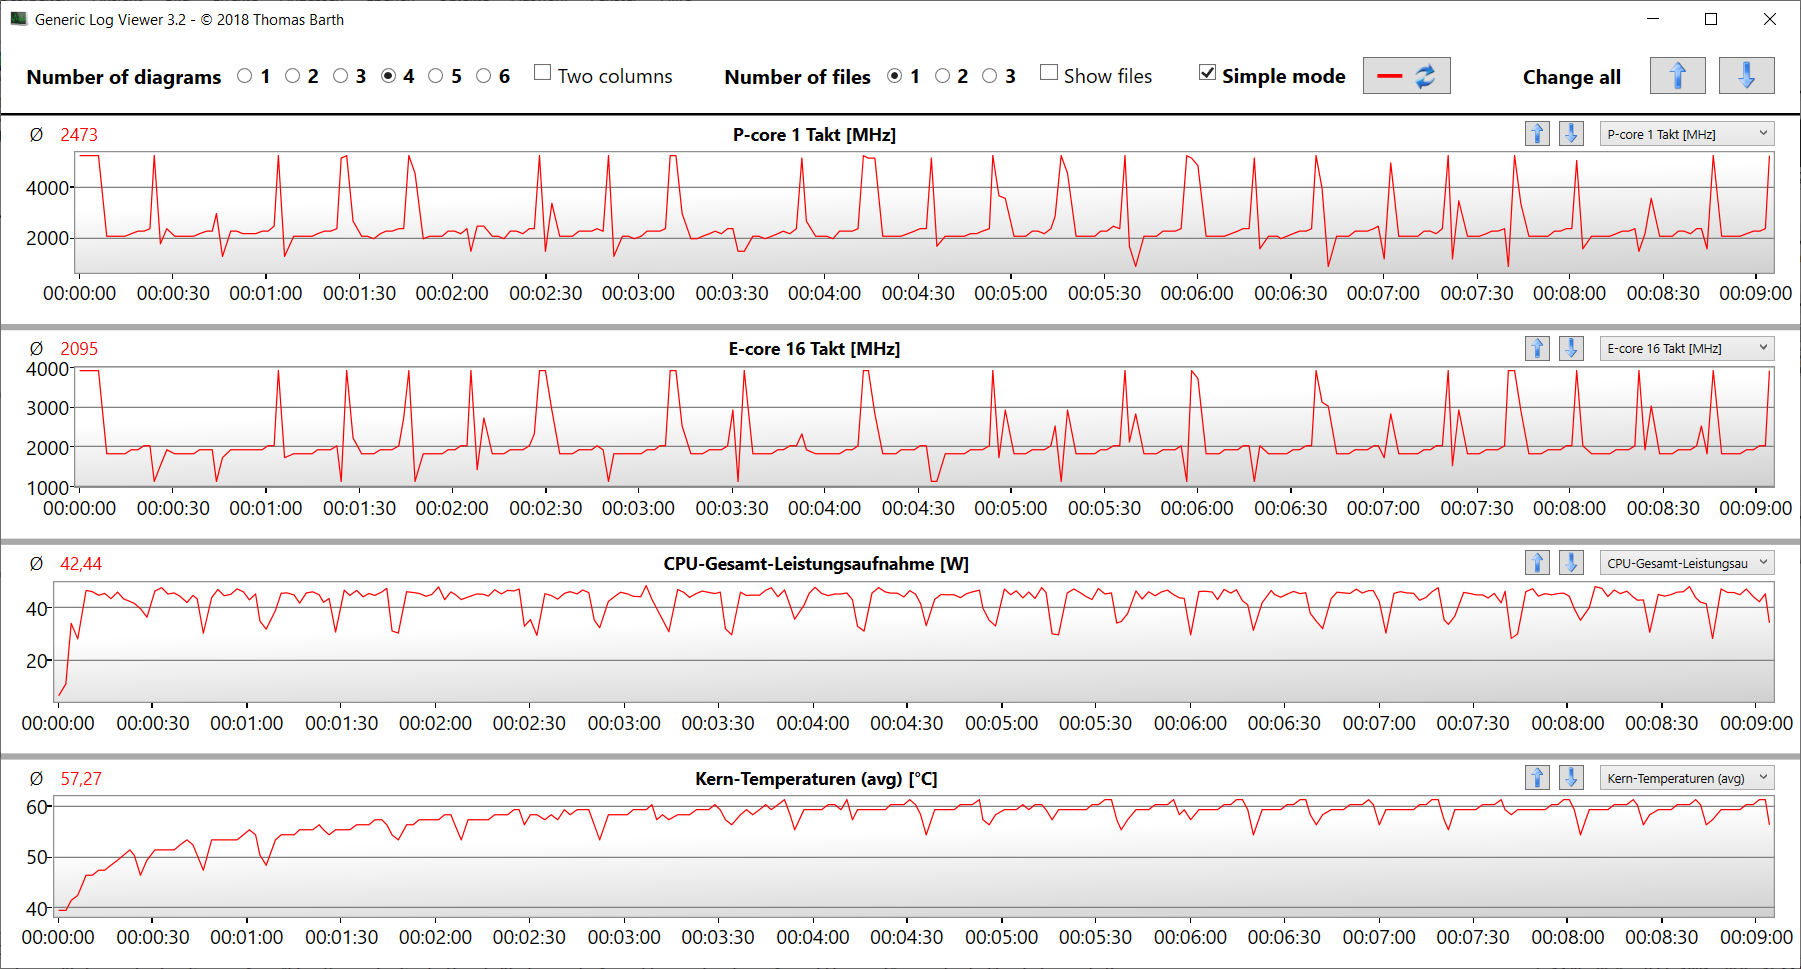
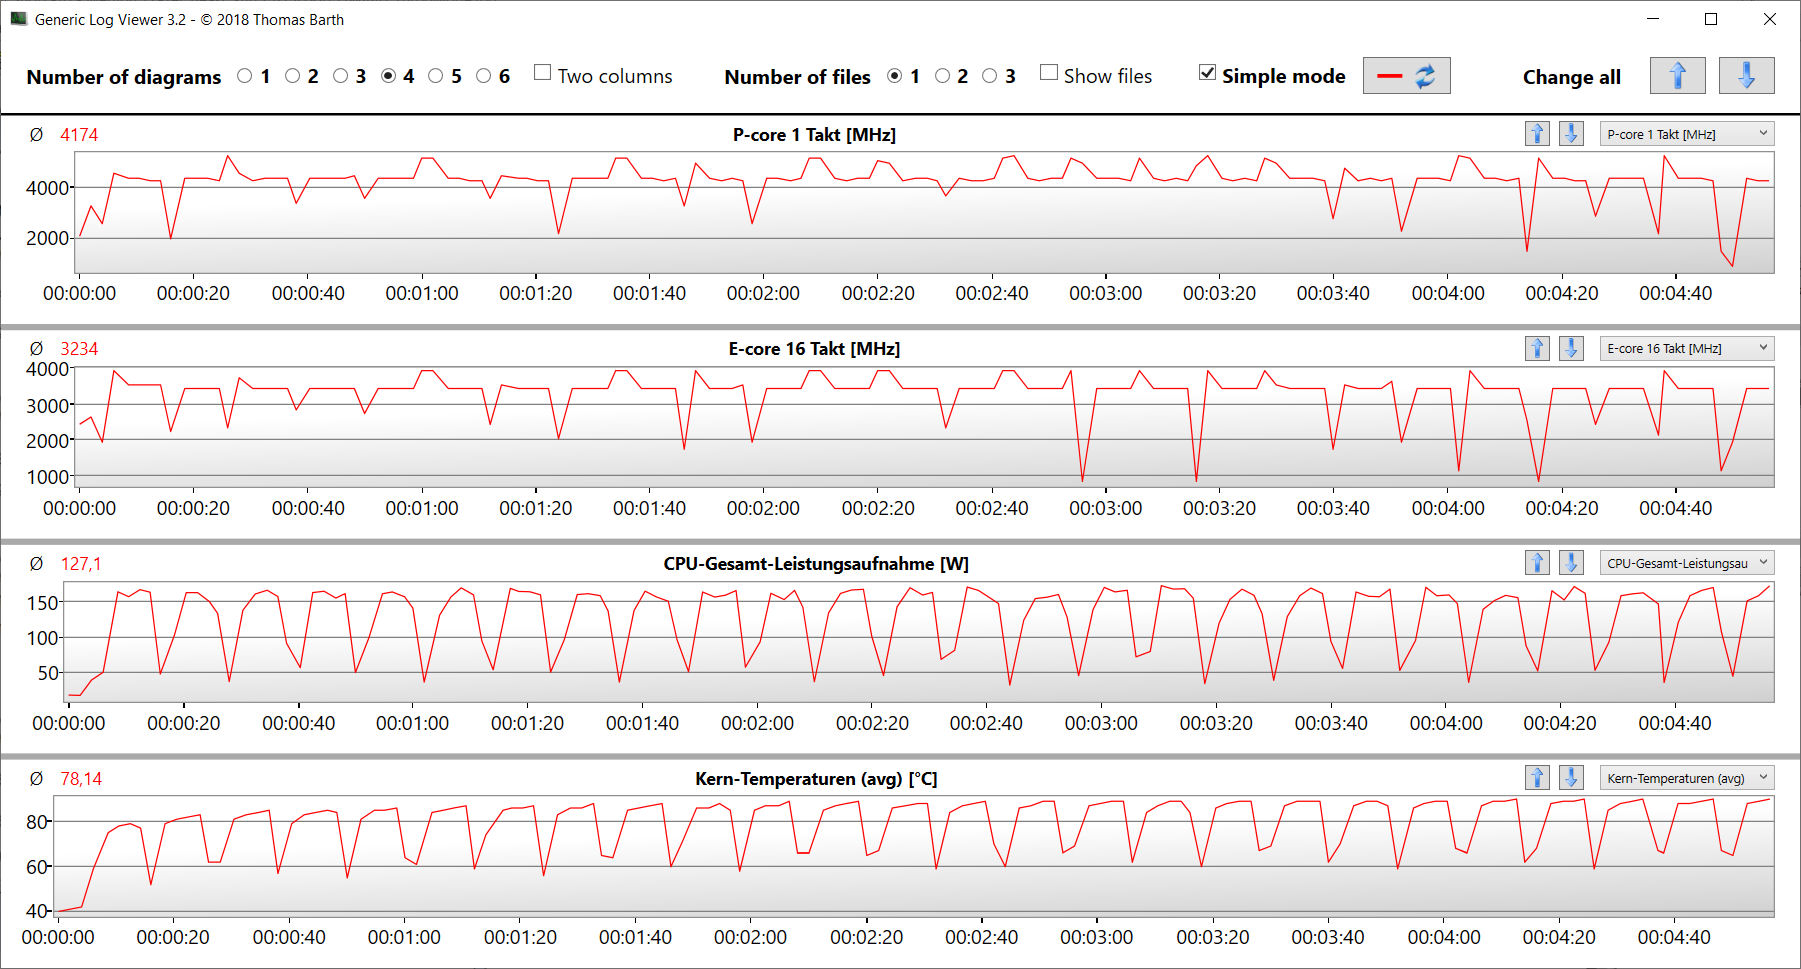
Power consumption Witcher 3 / Stress test
Power consumption with external monitor
Durée de vie de la batterie
L'ordinateur portable de 17 pouces a tenu 6h 22m et 6h 56m respectivement lors du test Wi-Fi (accès automatique à des sites web à l'aide d'un script) et du test vidéo (lecture en boucle du court métrage Big Buck Bunny, encodé en H.264, en Full HD). Pour les deux tests, toutes les fonctions d'économie d'énergie ont été désactivées sur l'ordinateur portable et la luminosité de l'écran a été réglée à environ 150 cd/m². L'adaptateur sans fil a également été désactivé lors du test vidéo.
Dans l'ensemble, l'Erazer offre une excellente autonomie pour un ordinateur portable aussi performant. Il peut surpasser la plupart de ses concurrents, même ceux qui ont une capacité de batterie identique.
| Medion Erazer Beast X40 i9-13900HX, GeForce RTX 4090 Laptop GPU, 99.8 Wh | MSI Titan GT77 HX 13VI i9-13950HX, GeForce RTX 4090 Laptop GPU, 99.9 Wh | Razer Blade 16 Early 2023 i9-13950HX, GeForce RTX 4080 Laptop GPU, 95.2 Wh | Schenker XMG Neo 17 M22 R9 6900HX, GeForce RTX 3080 Ti Laptop GPU, 99 Wh | Alienware x17 R2 P48E i9-12900HK, GeForce RTX 3080 Ti Laptop GPU, 87 Wh | Asus ROG Strix Scar 18 2023 G834JY-N6005W i9-13980HX, GeForce RTX 4090 Laptop GPU, 90 Wh | Moyenne de la classe Gaming | |
|---|---|---|---|---|---|---|---|
| Autonomie de la batterie | -19% | -12% | 15% | -62% | -14% | -0% | |
| Reader / Idle (h) | 9.4 | 8.9 -5% | 12 28% | 3.9 -59% | 8.27 ? -12% | ||
| H.264 (h) | 6.9 | 6 -13% | 6.6 -4% | 7 1% | 8.32 ? 21% | ||
| WiFi v1.3 (h) | 6.4 | 5.3 -17% | 6.1 -5% | 9 41% | 2 -69% | 7.1 11% | 7.11 ? 11% |
| Load (h) | 1.9 | 1.4 -26% | 1.4 -26% | 1.8 -5% | 0.8 -58% | 0.9 -53% | 1.502 ? -21% |
| Witcher 3 ultra (h) | 0.9 |
Points positifs
Points négatifs
Verdict - Un ordinateur portable de jeu haut de gamme exceptionnel
Le Medion Erazer Beast X40 est un ordinateur portable conçu pour des scénarios d'utilisation très exigeants, tels que l'édition vidéo, le rendu et les jeux. La puissance de calcul requise pour ces applications est fournie par l'une des combinaisons CPU-GPU les plus puissantes à l'heure actuelle : un processeur Core i9-13900HX associé à un processeur GeForce RTX 4090.
Le processeur et la carte graphique sont capables de fonctionner régulièrement à des vitesses d'horloge élevées, et le X40 produit une quantité de chaleur et de bruit assez normale pour cette catégorie d'appareil.
Dans l'ensemble, l'Erazer Beast X40 est un ordinateur portable convaincant pour les jeux et autres applications exigeantes.
L'écran mat 17 pouces 16:10 (QHD, IPS, 240Hz, G-Sync, sRGB) est très beau. Le seul inconvénient est que son contraste est légèrement trop faible. Le superbe clavier mécanique (avec éclairage RGB) rend l'ordinateur portable encore plus attrayant. Ceux qui n'ont jamais utilisé de clavier mécanique auparavant vont vivre une nouvelle expérience de frappe. Le port Thunderbolt 4 de l'ordinateur portable offre des possibilités d'extension (par exemple, GPU externe, solution d'accueil), mais ne prend pas en charge Power Delivery.
Une alternative possible à l'Erazer Beast X40 est le Asus ROG Strix Scar 18 2023 G834JY. Le ROG d'Asus se distingue par son écran 16:10 QHD+ de 18 pouces, plus de mémoire vive (64 Go) et la prise en charge du RAID. À environ 4 800 € (5 177 $), il se situe dans la même tranche de prix que le Beast. Si l'argent n'est pas un problème, vous pouvez jeter un coup d'œil auMSI Titan GT77 HX 13V comme autre alternative. Il offre une performance CPU légèrement supérieure, trois emplacements SSD, un support RAID et quatre emplacements RAM. L'écran mini-LED exceptionnellement lumineux avec un excellent contraste est un point fort de l'appareil. Mais l'ensemble vous coûtera environ 6 600 euros (7 120 dollars).
Verdict sur le refroidissement par eau
L'unité de refroidissement par eau optionnelle fait fondamentalement ce qu'elle est censée faire : améliorer les performances (Medion promet jusqu'à 10 % d'augmentation) et réduire la chaleur et le bruit. Dans la pratique, cependant, le gain de performance est plutôt modeste, et l'ordinateur portable est confiné à un endroit stationnaire. Les seuls avantages restants sont la réduction de la température et du bruit. Il appartient à chaque propriétaire de X40 de décider si ces avantages valent les 250 euros (270 dollars) supplémentaires.
Prix et disponibilité
En Allemagne, la configuration de test du Medion Erazer Beast X40 est disponible sur Saturn.de au prix de 4 499 euros (4 856 dollars).
Medion Erazer Beast X40
- 03/20/2023 v7 (old)
Sascha Mölck
Transparency
La sélection des appareils à examiner est effectuée par notre équipe éditoriale. L'échantillon de test a été prêté à l'auteur par le fabricant ou le détaillant pour les besoins de cet examen. Le prêteur n'a pas eu d'influence sur cette évaluation et le fabricant n'a pas reçu de copie de cette évaluation avant sa publication. Il n'y avait aucune obligation de publier cet article. En tant que média indépendant, Notebookcheck n'est pas soumis à l'autorité des fabricants, des détaillants ou des éditeurs.
Voici comment Notebookcheck teste
Chaque année, Notebookcheck examine de manière indépendante des centaines d'ordinateurs portables et de smartphones en utilisant des procédures standardisées afin de garantir que tous les résultats sont comparables. Nous avons continuellement développé nos méthodes de test depuis environ 20 ans et avons établi des normes industrielles dans le processus. Dans nos laboratoires de test, des équipements de mesure de haute qualité sont utilisés par des techniciens et des rédacteurs expérimentés. Ces tests impliquent un processus de validation en plusieurs étapes. Notre système d'évaluation complexe repose sur des centaines de mesures et de points de référence bien fondés, ce qui garantit l'objectivité.Price comparison

