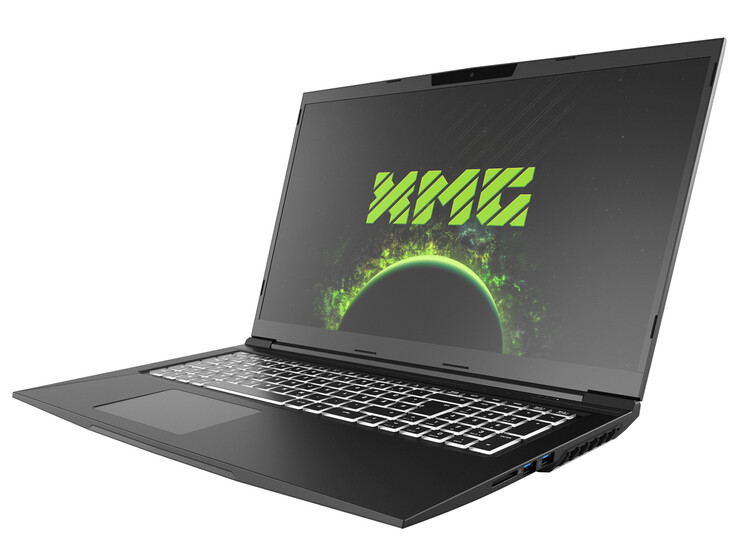
Test du Schenker XMG Core 17 (Tongfang GM7MG0R) : PC portable de jeu configurable avec écran WQHD

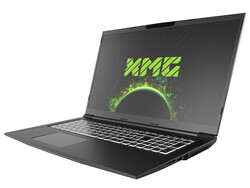
Avec le XMG Core 17 (début 2021), Schenker ajoute à son offre un ordinateur portable de jeu de la gamme moyenne supérieure. L'unité de test qui nous a été fournie fonctionne avec un Core i7-10870Het d'unGeForce RTX-3060 laptopGPU. Parmi les concurrents, on trouve des appareils tels que le MSI Alpha 17 A4DEKleAcer Predator Helios 300 PH317-54et le Medion Erazer Beast X10.
La construction de l'ordinateur portable étant dans une large mesure identique à celle de ses deux prédécesseurs, nous ne parlerons pas du boîtier, du matériel de connexion, des périphériques d'entrée et des haut-parleurs, sauf en cas de différences. Vous trouverez les informations correspondantes sur ces caractéristiques dans notre critique duXMG Core 17 (2019).
Possible Competitors in the Comparison
Note | Date | Modèle | Poids | Épaisseur | Taille | Résolution | Prix |
|---|---|---|---|---|---|---|---|
| 83.9 % v7 (old) | 06/21 | Schenker XMG Core 17 (Early 2021) i7-10870H, GeForce RTX 3060 Laptop GPU | 2.5 kg | 30.05 mm | 17.30" | 2560x1440 | |
| 83.3 % v7 (old) | 02/21 | MSI Alpha 17 A4DEK R7 4800H, Radeon RX 5600M | 2.6 kg | 28 mm | 17.30" | 1920x1080 | |
| 83.6 % v7 (old) | 10/20 | Acer Predator Helios 300 PH317-54-75G8 i7-10750H, GeForce RTX 2060 Mobile | 2.8 kg | 25 mm | 17.30" | 1920x1080 | |
| 84.7 % v7 (old) | 11/20 | Medion Erazer Beast X10 MD61804 i7-10750H, GeForce RTX 2070 Super Max-Q | 2.3 kg | 24.6 mm | 17.30" | 1920x1080 |
Top 10
» Le Top 10 des PC portables multimédia
» Le Top 10 des PC portables de jeu
» Le Top 10 des PC portables de jeu légers
» Le Top 10 des ordinateurs portables bureautiques
» Le Top 10 des PC portables bureautiques premium/professionnels
» Le Top 10 des Stations de travail mobiles
» Le Top 10 des Ultraportables
» Le Top 10 des Ultrabooks
» Le Top 10 des Convertibles
» Le Top 10 des Tablettes
» Le Top 10 des Tablettes Windows
» Le Top 10 des Smartphones
» Le Top 10 des PC Portables á moins de 300 euros
» Le Top 10 des PC Portables á moins de 500 euros
» Le Top 25 des meilleurs écrans d'ordinateurs
Connexions - L'ordinateur portable Schenker n'offre pas de Thunderbolt
Au niveau des connexions, quelque chose a changé par rapport aux prédécesseurs : Les deux connexions Mini-DisplayPort ont été supprimées, et le port USB-C prend désormais en charge la norme USB 3.2 Gen 2 (avant : USB 3.2 Gen 1) et également DisplayPort via USB-C.
| SD Card Reader | |
| average JPG Copy Test (av. of 3 runs) | |
| Moyenne de la classe Gaming (20 - 210, n=66, 2 dernières années) | |
| MSI Alpha 17 A4DEK (Toshiba Exceria Pro SDXC 64 GB UHS-II) | |
| Schenker XMG Core 17 (Toshiba Exceria Pro SDXC 64 GB UHS-II) | |
| Schenker XMG Core 17 Comet Lake (Toshiba Exceria Pro SDXC 64 GB UHS-II) | |
| Schenker XMG Core 17 (Early 2021) (AV PRO microSD 128 GB V60) | |
| maximum AS SSD Seq Read Test (1GB) | |
| Moyenne de la classe Gaming (25.5 - 261, n=63, 2 dernières années) | |
| MSI Alpha 17 A4DEK (Toshiba Exceria Pro SDXC 64 GB UHS-II) | |
| Schenker XMG Core 17 (Toshiba Exceria Pro SDXC 64 GB UHS-II) | |
| Schenker XMG Core 17 Comet Lake (Toshiba Exceria Pro SDXC 64 GB UHS-II) | |
| Schenker XMG Core 17 (Early 2021) (AV PRO microSD 128 GB V60) | |
Affichage - IPS WQHD 165 Hz
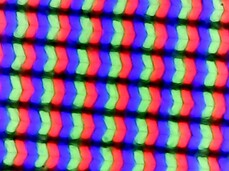
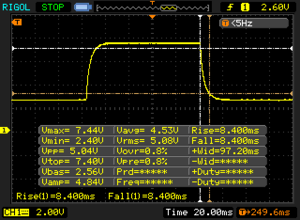
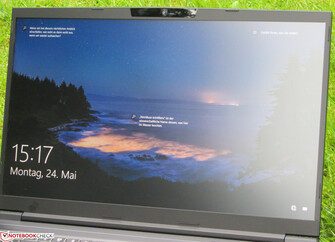
Si la luminosité (332,7 cd/m²) de l'écran mat de 17,3 pouces (2560 x 1440 pixels) s'avère bonne, le contraste (974:1) pourrait être amélioré, manquant de peu l'objectif (> 1000:1). La dalle de 165 Hz offre des temps de réponse rapides et ne produit pas de scintillement PWM. Schenker propose également en option un écran FHD (IPS, 144 Hz)
| |||||||||||||||||||||||||
Homogénéité de la luminosité: 84 %
Valeur mesurée au centre, sur batterie: 370 cd/m²
Contraste: 974:1 (Valeurs des noirs: 0.38 cd/m²)
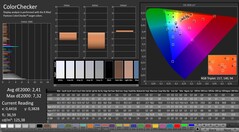
ΔE ColorChecker Calman: 2.41 | ∀{0.5-29.43 Ø4.77}
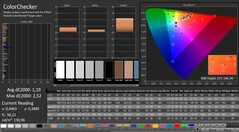
calibrated: 1.19
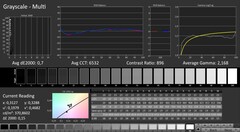
ΔE Greyscale Calman: 3.9 | ∀{0.09-98 Ø5}
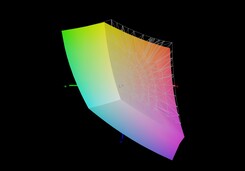
93% sRGB (Argyll 1.6.3 3D)
69% AdobeRGB 1998 (Argyll 1.6.3 3D)
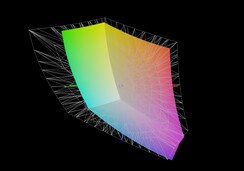
69.3% AdobeRGB 1998 (Argyll 3D)
98.5% sRGB (Argyll 3D)
68.1% Display P3 (Argyll 3D)
Gamma: 2.287
CCT: 7302 K
| Schenker XMG Core 17 (Early 2021) BOE CQ NE173QHM-NY2, IPS, 2560x1440, 17.3" | MSI Alpha 17 A4DEK AU Optronics AUO978F, IPS, 1920x1080, 17.3" | Acer Predator Helios 300 PH317-54-75G8 Chi Mei N173HCE-G33, IPS, 1920x1080, 17.3" | Medion Erazer Beast X10 MD61804 LG Phillips LP173WFG-SPB3, IPS, 1920x1080, 17.3" | Schenker XMG Core 17 LG Philips LP173WFG-SPB1 (LGD0615), IPS, 1920x1080, 17.3" | Schenker XMG Core 17 Comet Lake BOE HF NV173FHM-N44, IPS, 1920x1080, 17.3" | |
|---|---|---|---|---|---|---|
| Display | -41% | -6% | -4% | -4% | -5% | |
| Display P3 Coverage (%) | 68.1 | 39.55 -42% | 62.6 -8% | 64.5 -5% | 64.4 -5% | 65.3 -4% |
| sRGB Coverage (%) | 98.5 | 59.2 -40% | 94.3 -4% | 95.6 -3% | 95.6 -3% | 92.6 -6% |
| AdobeRGB 1998 Coverage (%) | 69.3 | 40.86 -41% | 64.7 -7% | 65.6 -5% | 65.6 -5% | 66.5 -4% |
| Response Times | -165% | -3% | 7% | 9% | -3% | |
| Response Time Grey 50% / Grey 80% * (ms) | 16.8 ? | 40 ? -138% | 16.4 ? 2% | 14.4 ? 14% | 14.4 ? 14% | 17.6 ? -5% |
| Response Time Black / White * (ms) | 10 ? | 29.2 ? -192% | 10.8 ? -8% | 10 ? -0% | 9.6 ? 4% | 10 ? -0% |
| PWM Frequency (Hz) | 24510 ? | 1000 ? | ||||
| Screen | -46% | 27% | -5% | 1% | -16% | |
| Brightness middle (cd/m²) | 370 | 254 -31% | 322 -13% | 313 -15% | 329 -11% | 315 -15% |
| Brightness (cd/m²) | 333 | 254 -24% | 308 -8% | 297 -11% | 286 -14% | 298 -11% |
| Brightness Distribution (%) | 84 | 93 11% | 92 10% | 88 5% | 79 -6% | 88 5% |
| Black Level * (cd/m²) | 0.38 | 0.23 39% | 0.18 53% | 0.27 29% | 0.3 21% | 0.29 24% |
| Contrast (:1) | 974 | 1104 13% | 1789 84% | 1159 19% | 1097 13% | 1086 11% |
| Colorchecker dE 2000 * | 2.41 | 4.12 -71% | 1.53 37% | 2.96 -23% | 2.52 -5% | 4.3 -78% |
| Colorchecker dE 2000 max. * | 7.32 | 19.66 -169% | 3.14 57% | 9.83 -34% | 6.9 6% | 7.3 -0% |
| Colorchecker dE 2000 calibrated * | 1.19 | 3.78 -218% | 0.74 38% | 1.03 13% | 1.31 -10% | 2.29 -92% |
| Greyscale dE 2000 * | 3.9 | 3.2 18% | 1.9 51% | 4.9 -26% | 2.98 24% | 4.3 -10% |
| Gamma | 2.287 96% | 2.179 101% | 2.144 103% | 2.187 101% | 2.38 92% | 2.084 106% |
| CCT | 7302 89% | 6754 96% | 6809 95% | 7559 86% | 6738 96% | 7434 87% |
| Color Space (Percent of AdobeRGB 1998) (%) | 69 | 41 -41% | 65 -6% | 66 -4% | 60 -13% | 66 -4% |
| Color Space (Percent of sRGB) (%) | 93 | 59 -37% | 87 -6% | 89 -4% | 95 2% | 92 -1% |
| Moyenne finale (programmes/paramètres) | -84% /
-60% | 6% /
17% | -1% /
-3% | 2% /
1% | -8% /
-12% |
* ... Moindre est la valeur, meilleures sont les performances
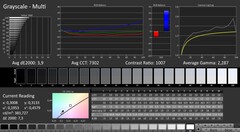
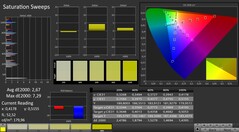
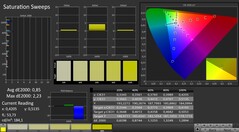
En l'état de livraison, l'écran offre une bonne reproduction des couleurs, répondant à l'objectif (Delta E < 3) avec un écart de couleur de 2,41. L'écran ne souffre pas d'une teinte bleue. L'étalonnage permet d'obtenir quelques améliorations, l'écart de couleur tombant à 1,19 et l'affichage en niveaux de gris devenant plus équilibré. Les espaces couleur AdobeRGB (69 %) et sRGB (93 %) ne sont pas entièrement couverts
Temps de réponse de l'écran
| ↔ Temps de réponse noir à blanc | ||
|---|---|---|
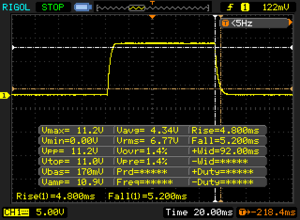
| 10 ms ... hausse ↗ et chute ↘ combinées | ↗ 4.8 ms hausse | |
| ↘ 5.2 ms chute | ||
| L'écran montre de bons temps de réponse, mais insuffisant pour du jeu compétitif. En comparaison, tous les appareils testés affichent entre 0.1 (minimum) et 240 (maximum) ms. » 26 % des appareils testés affichent de meilleures performances. Cela signifie que les latences relevées sont meilleures que la moyenne (20.1 ms) de tous les appareils testés. | ||
| ↔ Temps de réponse gris 50% à gris 80% | ||
| 16.8 ms ... hausse ↗ et chute ↘ combinées | ↗ 8.4 ms hausse | |
| ↘ 8.4 ms chute | ||
| L'écran montre de bons temps de réponse, mais insuffisant pour du jeu compétitif. En comparaison, tous les appareils testés affichent entre 0.165 (minimum) et 636 (maximum) ms. » 30 % des appareils testés affichent de meilleures performances. Cela signifie que les latences relevées sont meilleures que la moyenne (31.5 ms) de tous les appareils testés. | ||
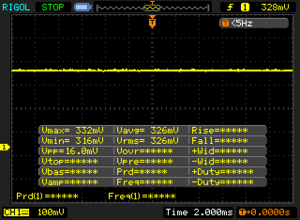
Scintillement / MLI (Modulation de largeur d'impulsion)
| Scintillement / MLI (Modulation de largeur d'impulsion) non décelé | |||
En comparaison, 53 % des appareils testés n'emploient pas MDI pour assombrir leur écran. Nous avons relevé une moyenne à 8042 (minimum : 5 - maximum : 343500) Hz dans le cas où une MDI était active. | |||
Performance - Suffisante pour les prochaines années
Le XMG Core 17 est capable de porter à l'écran tous les jeux actuels en douceur et fait également bonne figure dans tous les autres domaines d'application
Conditions d'essai
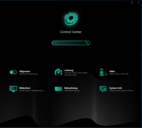
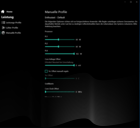
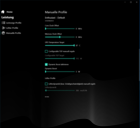
Vous pouvez basculer entre les trois profils de performance "Balanced", "Enthusiast" et "Overboost" via le centre de contrôle préinstallé ou la touche de changement de profil (à côté du bouton d'alimentation). Pour notre test, nous avons utilisé le profil "Enthusiast" (PL1/PL2 : 60 watts) et le contrôle automatique du ventilateur. Plusieurs benchmarks ont également été effectués avec le profil "Overboost" (PL1/PL2 : 75 watts) activé. Pour les tests de batterie, nous avons utilisé le profil "Balanced" (PL1/PL2 : 35 watts).
Processeur
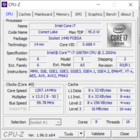
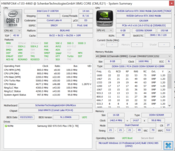
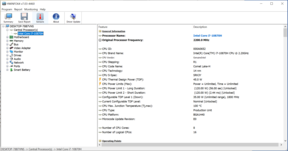
Le siteCore i7-10870Hocta-core (Comet Lake) fonctionne à une vitesse d'horloge de base de 2,2 GHz. Via Turbo, celle-ci peut être augmentée jusqu'à un maximum de 4,2 GHz (huit cœurs) et 5 GHz (un seul cœur). L'hyperthreading (deux threads par cœur) est pris en charge.
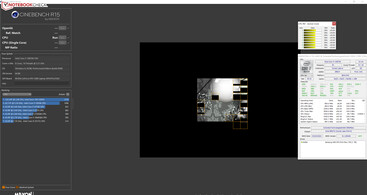
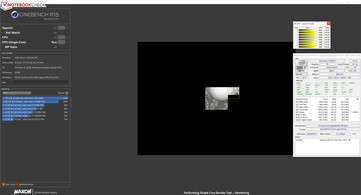
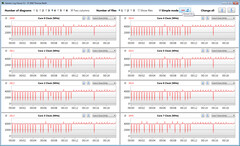
Le processeur passe les tests CPU du benchmark Cinebench R15 entre 3 et 3,8 GHz (multithread) et entre 4 et 4,8 GHz (single thread). En mode batterie, le processeur fonctionne à des vitesses d'horloge comprises entre 2,6 et 2,9 GHz (multithread) et entre 2,4 et 4,2 GHz (single thread).
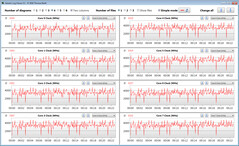
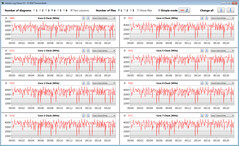
Nous évaluons si le CPU Turbo est également utilisé de manière constante en fonctionnement sur secteur en exécutant le test multithread du benchmark Cinebench R15 pendant au moins 30 minutes dans une boucle constante. Le Turbo est utilisé à un niveau moyen. Le profil de performance "Overboost" n'entraîne qu'une légère augmentation de la vitesse d'horloge.
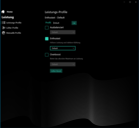
Globalement, le Core i7 n'exploite pas pleinement ses capacités dans les benchmarks multithread. Pour en tirer plus de performances, il faudrait relever les limites de puissance du CPU, ce qui serait possible via le Control Center préinstallé, où le maximum configurable serait de 120 watts (PL1/PL2). Nous avons également fait tourner la boucle CB15 avec ce paramètre de performance afin de tester cela - sans rencontrer de problème.
* ... Moindre est la valeur, meilleures sont les performances
Performance du système
Ce système rapide et fluide offrira également des performances suffisantes pour les prochaines années dans des domaines d'application exigeants tels que les jeux et le traitement des vidéos et des images. Les résultats de PC-Mark sont également bons.
| PCMark 8 Home Score Accelerated v2 | 4073 points | |
| PCMark 8 Creative Score Accelerated v2 | 5816 points | |
| PCMark 8 Work Score Accelerated v2 | 5375 points | |
| PCMark 10 Score | 5685 points | |
Aide | ||
Latences DPC
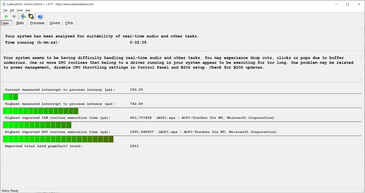
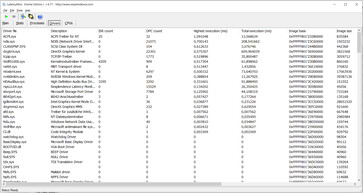
Dans notre test standardisé Latency Monitor (surf sur le Web, reproduction de vidéos 4K, charge élevée Prime95), nous avons pu observer un comportement manifeste en termes de latences DPC. Cela signifie que le système ne semble pas être adapté au traitement vidéo et audio en temps réel
| DPC Latencies / LatencyMon - interrupt to process latency (max), Web, Youtube, Prime95 | |
| MSI Alpha 17 A4DEK | |
| Schenker XMG Core 17 Comet Lake | |
| Medion Erazer Beast X10 MD61804 | |
| Schenker XMG Core 17 (Early 2021) | |
| Acer Predator Helios 300 PH317-54-75G8 | |
* ... Moindre est la valeur, meilleures sont les performances
Solution de stockage
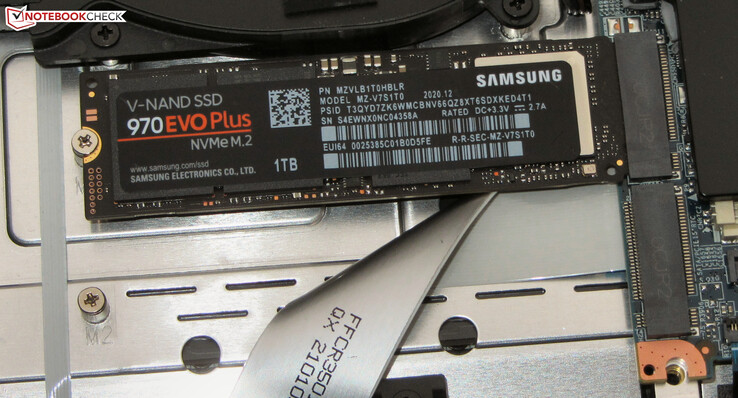
| Schenker XMG Core 17 (Early 2021) Samsung SSD 970 EVO Plus 1TB | MSI Alpha 17 A4DEK Kingston OM8PCP3512F-AB | Acer Predator Helios 300 PH317-54-75G8 WDC PC SN730 SDBQNTY-1T00 | Medion Erazer Beast X10 MD61804 Samsung PM981a MZVLB1T0HBLR | Schenker XMG Core 17 Samsung SSD 970 EVO Plus 500GB | Schenker XMG Core 17 Comet Lake Samsung SSD 970 EVO Plus 1TB | |
|---|---|---|---|---|---|---|
| CrystalDiskMark 5.2 / 6 | -31% | -12% | -17% | -29% | 4% | |
| Write 4K (MB/s) | 145.7 | 204.7 40% | 141.9 -3% | 151 4% | 99.3 -32% | 169.5 16% |
| Read 4K (MB/s) | 51.3 | 50.4 -2% | 48.75 -5% | 49.29 -4% | 38.47 -25% | 51.5 0% |
| Write Seq (MB/s) | 3036 | 985 -68% | 2734 -10% | 1109 -63% | 1449 -52% | 3009 -1% |
| Read Seq (MB/s) | 2837 | 1193 -58% | 1921 -32% | 1049 -63% | 1237 -56% | 2959 4% |
| Write 4K Q32T1 (MB/s) | 511 | 537 5% | 422.6 -17% | 494.4 -3% | 364.4 -29% | 536 5% |
| Read 4K Q32T1 (MB/s) | 582 | 300 -48% | 509 -13% | 569 -2% | 421.9 -28% | 621 7% |
| Write Seq Q32T1 (MB/s) | 3294 | 982 -70% | 3055 -7% | 3017 -8% | 3276 -1% | 3339 1% |
| Read Seq Q32T1 (MB/s) | 3522 | 1985 -44% | 3257 -8% | 3542 1% | 3338 -5% | 3561 1% |
| AS SSD | -43% | -11% | -3% | -20% | 11% | |
| Seq Read (MB/s) | 2876 | 251.9 -91% | 2828 -2% | 2470 -14% | 2283 -21% | 2937 2% |
| Seq Write (MB/s) | 2803 | 925 -67% | 2677 -4% | 2473 -12% | 2779 -1% | 2858 2% |
| 4K Read (MB/s) | 55.3 | 58.2 5% | 39.94 -28% | 50.2 -9% | 29.99 -46% | 50.3 -9% |
| 4K Write (MB/s) | 106.9 | 98 -8% | 100.9 -6% | 124.4 16% | 99.1 -7% | 130.6 22% |
| 4K-64 Read (MB/s) | 1662 | 461.4 -72% | 1562 -6% | 1711 3% | 1156 -30% | 1710 3% |
| 4K-64 Write (MB/s) | 2101 | 924 -56% | 1867 -11% | 1848 -12% | 2333 11% | 2355 12% |
| Access Time Read * (ms) | 0.067 | 0.09 -34% | 0.039 42% | 0.092 -37% | 0.037 45% | |
| Access Time Write * (ms) | 0.037 | 0.022 41% | 0.037 -0% | 0.029 22% | 0.037 -0% | 0.028 24% |
| Score Read (Points) | 2005 | 545 -73% | 1885 -6% | 2008 0% | 1414 -29% | 2054 2% |
| Score Write (Points) | 2488 | 1114 -55% | 2236 -10% | 2220 -11% | 2710 9% | 2771 11% |
| Score Total (Points) | 5520 | 1994 -64% | 5076 -8% | 5257 -5% | 4871 -12% | 5873 6% |
| Copy ISO MB/s (MB/s) | 2029 | 1870 -8% | 1909 -6% | 1394 -31% | 2225 10% | |
| Copy Program MB/s (MB/s) | 691 | 545 -21% | 588 -15% | 379.8 -45% | 779 13% | |
| Copy Game MB/s (MB/s) | 1513 | 1083 -28% | 975 -36% | 976 -35% | 1590 5% | |
| Moyenne finale (programmes/paramètres) | -37% /
-38% | -12% /
-11% | -10% /
-8% | -25% /
-23% | 8% /
8% |
* ... Moindre est la valeur, meilleures sont les performances
Constant Performance Reads: DiskSpd Read Loop, Queue Depth 8
Carte graphique
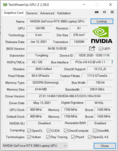
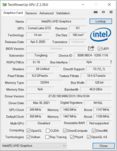
LeGeForce RTX-3060représente le modèle d'entrée de gamme actuel de Nvidia en matière de GPU haut de gamme. Le GPU est capable d'utiliser un stockage graphique rapide GDDR6 (6144 Mo). Le site UHD Graphics-630intégré au processeur est actif, et l'ordinateur portable utilise la solution de commutation graphique Optimus de Nvidia. Le GPU GeForce peut être désactivé dans le BIOS.
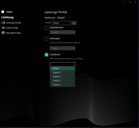
Les fabricants d'ordinateurs portables peuvent configurer assez librement le TGP et donc la puissance de calcul maximale disponible d'un cœur graphique RTX 3000, tant qu'ils restent dans les limites définies par Nvidia (voir ci-dessous)Aperçu de tous les ordinateurs portables RTX 3060, y compris leurs TGPSchenker étend cette possibilité aux utilisateurs en leur permettant de régler librement le TGP jusqu'à un maximum de 130 watts (115 watts + 15 watts Dynamic Boost).
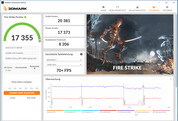
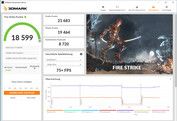
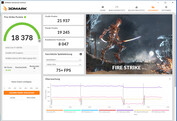
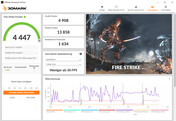
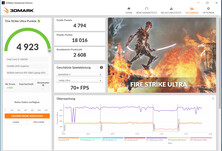
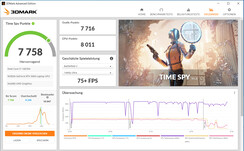
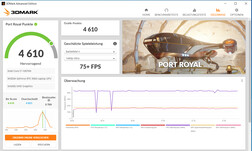
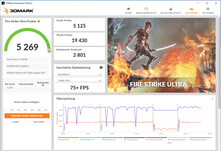
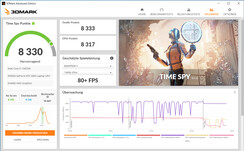
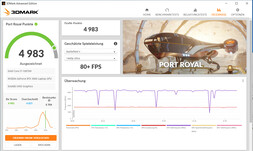
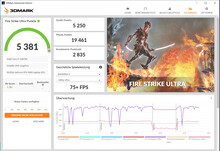
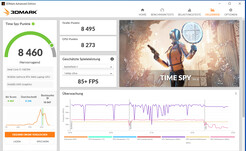
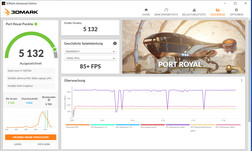
Cependant, à un TGP élevé TGP élevé, l'augmentation des performances s'avère limitée : Même si le profil "Overboost" (115 watts + 5 watts Dynamic Boost) utilise un TGP qui est environ 26% plus élevé que le profil "Enthusiast" (90 watts + 5 watts Dynamic Boost)En revanche, les résultats des tests ne sont supérieurs que de 10 %, que ce soit pour les tests du GPU ou pour les benchmarks de jeu.
| 3DMark 11 Performance | 21813 points | |
| 3DMark Cloud Gate Standard Score | 41707 points | |
| 3DMark Fire Strike Score | 17355 points | |
| 3DMark Time Spy Score | 7758 points | |
Aide | ||
| 3DMark | |
| 1920x1080 Fire Strike Graphics | |
| Moyenne de la classe Gaming (8098 - 62849, n=147, 2 dernières années) | |
| Schenker XMG Core 17 (Early 2021) (Overboost, TGP: 130 Watt) | |
| Schenker XMG Core 17 (Early 2021) (Overboost) | |
| Medion Erazer Beast X10 MD61804 | |
| Moyenne NVIDIA GeForce RTX 3060 Laptop GPU (16354 - 23109, n=49) | |
| Schenker XMG Core 17 (Early 2021) | |
| MSI Alpha 17 A4DEK | |
| Acer Predator Helios 300 PH317-54-75G8 | |
| Schenker XMG Core 17 | |
| Schenker XMG Core 17 Comet Lake | |
| 2560x1440 Time Spy Graphics | |
| Moyenne de la classe Gaming (2887 - 25984, n=144, 2 dernières années) | |
| Schenker XMG Core 17 (Early 2021) (Overboost, TGP: 130 Watt) | |
| Schenker XMG Core 17 (Early 2021) (Overboost) | |
| Moyenne NVIDIA GeForce RTX 3060 Laptop GPU (6285 - 9235, n=49) | |
| Medion Erazer Beast X10 MD61804 | |
| Schenker XMG Core 17 (Early 2021) | |
| Acer Predator Helios 300 PH317-54-75G8 | |
| MSI Alpha 17 A4DEK | |
| Schenker XMG Core 17 | |
| Schenker XMG Core 17 Comet Lake | |
Performances en matière de jeux
Le matériel est capable de porter à l'écran tous les jeux actuels de manière fluide. En règle générale, vous pouvez utiliser la pleine résolution de l'écran (2560 x 1440 pixels, WQHD) et des paramètres de qualité élevés à maximaux lorsque vous jouez. La résolution FHD permet d'obtenir un niveau de qualité maximal.
Comparé à tous les ordinateurs portables RTX 3060 que nous avons testés jusqu'à présent, le Core 17 s'en sort très bien. En général, les différences de taux de trame entre les appareils ne s'avèrent pas trop importantes, malgré les différentes configurations TGP. Comme le montrent les résultats du Core 17, même une augmentation significative de la valeur TGP n'entraînera qu'une légère augmentation des taux de trame
| The Witcher 3 - 1920x1080 Ultra Graphics & Postprocessing (HBAO+) | |
| Moyenne de la classe Gaming (29.6 - 240, n=44, 2 dernières années) | |
| Medion Erazer Beast X10 MD61804 | |
| Schenker XMG Core 15 Ampere | |
| Schenker XMG Core 17 (Early 2021) (Overboost) | |
| Razer Blade 15 Base Edition 2021, i7-10750H RTX 3060 | |
| Schenker XMG Core 17 (Early 2021) | |
| Schenker XMG Core 17 (Early 2021, RTX 3060, 5800H) | |
| Moyenne NVIDIA GeForce RTX 3060 Laptop GPU (58.2 - 91.5, n=48) | |
| Acer Aspire Nitro 5 AN515-55-57GF | |
| MSI GF65 Thin 10UE | |
| Acer Predator Helios 300 PH317-54-75G8 | |
| MSI Alpha 17 A4DEK | |
| Schenker XMG Core 17 | |
| Schenker XMG Core 17 Comet Lake | |
| Dota 2 Reborn - 1920x1080 ultra (3/3) best looking | |
| Moyenne de la classe Gaming (65.1 - 248, n=140, 2 dernières années) | |
| Moyenne NVIDIA GeForce RTX 3060 Laptop GPU (90.7 - 154.8, n=49) | |
| Schenker XMG Core 17 (Early 2021, RTX 3060, 5800H) | |
| Razer Blade 15 Base Edition 2021, i7-10750H RTX 3060 | |
| Schenker XMG Core 17 (Early 2021) | |
| Acer Aspire Nitro 5 AN515-55-57GF | |
| Schenker XMG Core 17 Comet Lake | |
| Schenker XMG Core 17 (Early 2021) (Overboost) | |
| MSI Alpha 17 A4DEK | |
| Schenker XMG Core 15 Ampere | |
| MSI GF65 Thin 10UE | |
| X-Plane 11.11 - 1920x1080 high (fps_test=3) | |
| Moyenne de la classe Gaming (33.4 - 150.2, n=143, 2 dernières années) | |
| Moyenne NVIDIA GeForce RTX 3060 Laptop GPU (61.9 - 109.3, n=48) | |
| Razer Blade 15 Base Edition 2021, i7-10750H RTX 3060 | |
| Schenker XMG Core 17 (Early 2021, RTX 3060, 5800H) | |
| Schenker XMG Core 17 Comet Lake | |
| Schenker XMG Core 17 (Early 2021) (Overboost) | |
| Schenker XMG Core 17 (Early 2021) | |
| Acer Aspire Nitro 5 AN515-55-57GF | |
| Schenker XMG Core 15 Ampere | |
| MSI GF65 Thin 10UE | |
| MSI Alpha 17 A4DEK | |
| Final Fantasy XV Benchmark | |
| 2560x1440 High Quality | |
| Moyenne de la classe Gaming (32.5 - 184.3, n=109, 2 dernières années) | |
| Schenker XMG Core 17 (Early 2021) (1.3, Overboost, TGP: 130 Watt) | |
| Schenker XMG Core 17 (Early 2021) (1.3, Overboost) | |
| Schenker XMG Core 17 (Early 2021) (1.3) | |
| Moyenne NVIDIA GeForce RTX 3060 Laptop GPU (41.1 - 73.7, n=25) | |
| MSI GF65 Thin 10UE (1.3) | |
| 1920x1080 High Quality | |
| Moyenne de la classe Gaming (28.2 - 215, n=134, 2 dernières années) | |
| Schenker XMG Core 17 (Early 2021) (1.3, Overboost, TGP: 130 Watt) | |
| Schenker XMG Core 17 (Early 2021) (1.3, Overboost) | |
| Razer Blade 15 Base Edition 2021, i7-10750H RTX 3060 (1.3) | |
| Schenker XMG Core 17 (Early 2021) (1.3) | |
| Moyenne NVIDIA GeForce RTX 3060 Laptop GPU (55 - 100.9, n=42) | |
| Acer Aspire Nitro 5 AN515-55-57GF (1.3) | |
| MSI GF65 Thin 10UE (1.3) | |
| Schenker XMG Core 17 | |
| MSI Alpha 17 A4DEK | |
| Strange Brigade | |
| 2560x1440 ultra AA:ultra AF:16 | |
| Moyenne de la classe Gaming (52.8 - 350, n=99, 2 dernières années) | |
| Schenker XMG Core 17 (Early 2021) (1.47.22.14 D3D12, Overboost) | |
| Schenker XMG Core 17 (Early 2021) (1.47.22.14 D3D12, Overboost, TGP: 130 Watt) | |
| Schenker XMG Core 17 (Early 2021) (1.47.22.14 D3D12) | |
| Moyenne NVIDIA GeForce RTX 3060 Laptop GPU (75.4 - 118.4, n=17) | |
| 1920x1080 ultra AA:ultra AF:16 | |
| Moyenne de la classe Gaming (46.6 - 456, n=123, 2 dernières années) | |
| Schenker XMG Core 17 (Early 2021) (1.47.22.14 D3D12, Overboost, TGP: 130 Watt) | |
| Schenker XMG Core 17 (Early 2021) (1.47.22.14 D3D12, Overboost) | |
| Razer Blade 15 Base Edition 2021, i7-10750H RTX 3060 (1.47.22.14 D3D12) | |
| Moyenne NVIDIA GeForce RTX 3060 Laptop GPU (102.2 - 166.3, n=43) | |
| Schenker XMG Core 17 (Early 2021) (1.47.22.14 D3D12) | |
| Acer Aspire Nitro 5 AN515-55-57GF (1.47.22.14 D3D12) | |
| MSI GF65 Thin 10UE (1.47.22.14 D3D12) | |
| Shadow of the Tomb Raider | |
| 1920x1080 Highest Preset AA:T | |
| Moyenne de la classe Gaming (131 - 212, n=2, 2 dernières années) | |
| Schenker XMG Core 17 (Early 2021) | |
| Moyenne NVIDIA GeForce RTX 3060 Laptop GPU (84 - 95, n=4) | |
| Schenker XMG Core 17 (Early 2021, RTX 3060, 5800H) | |
| Schenker XMG Core 15 Ampere | |
| Acer Predator Helios 300 PH317-54-75G8 | |
| 2560x1440 Highest Preset AA:T | |
| Moyenne de la classe Gaming (86 - 176, n=2, 2 dernières années) | |
| Schenker XMG Core 15 Ampere | |
| Moyenne NVIDIA GeForce RTX 3060 Laptop GPU (66 - 71, n=3) | |
| Schenker XMG Core 17 (Early 2021, RTX 3060, 5800H) | |
| Schenker XMG Core 17 (Early 2021) | |
| Far Cry 5 | |
| 1920x1080 Ultra Preset AA:T | |
| Moyenne de la classe Gaming (70 - 174, n=35, 2 dernières années) | |
| Schenker XMG Core 17 (Early 2021) (Overboost, TGP: 130 Watt) | |
| Schenker XMG Core 17 (Early 2021) | |
| Moyenne NVIDIA GeForce RTX 3060 Laptop GPU (80 - 120, n=31) | |
| Schenker XMG Core 17 (Early 2021) (Overboost) | |
| Schenker XMG Core 15 Ampere | |
| MSI GF65 Thin 10UE | |
| Acer Aspire Nitro 5 AN515-55-57GF | |
| Schenker XMG Core 17 | |
| 2560x1440 Ultra Preset AA:T | |
| Moyenne de la classe Gaming (80 - 171, n=31, 2 dernières années) | |
| Schenker XMG Core 17 (Early 2021) (Overboost, TGP: 130 Watt) | |
| Schenker XMG Core 15 Ampere | |
| Schenker XMG Core 17 (Early 2021) (Overboost) | |
| Schenker XMG Core 17 (Early 2021) | |
| Moyenne NVIDIA GeForce RTX 3060 Laptop GPU (58 - 92, n=12) | |
| GTA V | |
| 1920x1080 Highest AA:4xMSAA + FX AF:16x | |
| Moyenne de la classe Gaming (26.8 - 186.9, n=125, 2 dernières années) | |
| Schenker XMG Core 17 (Early 2021, RTX 3060, 5800H) | |
| Schenker XMG Core 17 (Early 2021) (Overboost) | |
| Moyenne NVIDIA GeForce RTX 3060 Laptop GPU (69.2 - 109.8, n=46) | |
| Schenker XMG Core 17 (Early 2021) (Overboost, TGP: 130 Watt) | |
| Schenker XMG Core 17 (Early 2021) | |
| Razer Blade 15 Base Edition 2021, i7-10750H RTX 3060 | |
| Acer Aspire Nitro 5 AN515-55-57GF | |
| MSI GF65 Thin 10UE | |
| 2560x1440 Highest AA:4xMSAA + FX AF:16x | |
| Moyenne de la classe Gaming (36.9 - 183.9, n=93, 2 dernières années) | |
| Schenker XMG Core 17 (Early 2021) (Overboost, TGP: 130 Watt) | |
| Schenker XMG Core 17 (Early 2021) (Overboost) | |
| Schenker XMG Core 17 (Early 2021) | |
| Moyenne NVIDIA GeForce RTX 3060 Laptop GPU (52 - 86.5, n=23) | |
| Performance rating - Percent | |
| Moyenne de la classe Gaming | |
| Razer Blade 15 Base Edition 2021, i7-10750H RTX 3060 -7! | |
| Schenker XMG Core 17 (Early 2021) -5! | |
| Schenker XMG Core 17 (Early 2021, RTX 3060, 5800H) -7! | |
| Schenker XMG Core 17 (Early 2021) -2! | |
| Medion Erazer Beast X10 MD61804 -12! | |
| Schenker XMG Core 15 Ampere -6! | |
| Moyenne NVIDIA GeForce RTX 3060 Laptop GPU | |
| Schenker XMG Core 17 (Early 2021) | |
| Acer Aspire Nitro 5 AN515-55-57GF -6! | |
| Schenker XMG Core 17 Comet Lake -10! | |
| MSI GF65 Thin 10UE -5! | |
| Schenker XMG Core 17 -10! | |
| Acer Predator Helios 300 PH317-54-75G8 -11! | |
| MSI Alpha 17 A4DEK -9! | |
| The Witcher 3 - 1920x1080 Ultra Graphics & Postprocessing (HBAO+) | |
| Moyenne de la classe Gaming (29.6 - 240, n=44, 2 dernières années) | |
| Medion Erazer Beast X10 MD61804 | |
| Schenker XMG Core 15 Ampere | |
| Schenker XMG Core 17 (Early 2021) (Overboost) | |
| Razer Blade 15 Base Edition 2021, i7-10750H RTX 3060 | |
| Schenker XMG Core 17 (Early 2021) | |
| Schenker XMG Core 17 (Early 2021, RTX 3060, 5800H) | |
| Moyenne NVIDIA GeForce RTX 3060 Laptop GPU (58.2 - 91.5, n=48) | |
| Acer Aspire Nitro 5 AN515-55-57GF | |
| MSI GF65 Thin 10UE | |
| Acer Predator Helios 300 PH317-54-75G8 | |
| MSI Alpha 17 A4DEK | |
| Schenker XMG Core 17 | |
| Schenker XMG Core 17 Comet Lake | |
| Dota 2 Reborn - 1920x1080 ultra (3/3) best looking | |
| Moyenne de la classe Gaming (65.1 - 248, n=140, 2 dernières années) | |
| Moyenne NVIDIA GeForce RTX 3060 Laptop GPU (90.7 - 154.8, n=49) | |
| Schenker XMG Core 17 (Early 2021, RTX 3060, 5800H) | |
| Razer Blade 15 Base Edition 2021, i7-10750H RTX 3060 | |
| Schenker XMG Core 17 (Early 2021) | |
| Acer Aspire Nitro 5 AN515-55-57GF | |
| Schenker XMG Core 17 Comet Lake | |
| Schenker XMG Core 17 (Early 2021) (Overboost) | |
| MSI Alpha 17 A4DEK | |
| Schenker XMG Core 15 Ampere | |
| MSI GF65 Thin 10UE | |
| X-Plane 11.11 - 1920x1080 high (fps_test=3) | |
| Moyenne de la classe Gaming (33.4 - 150.2, n=143, 2 dernières années) | |
| Moyenne NVIDIA GeForce RTX 3060 Laptop GPU (61.9 - 109.3, n=48) | |
| Razer Blade 15 Base Edition 2021, i7-10750H RTX 3060 | |
| Schenker XMG Core 17 (Early 2021, RTX 3060, 5800H) | |
| Schenker XMG Core 17 Comet Lake | |
| Schenker XMG Core 17 (Early 2021) (Overboost) | |
| Schenker XMG Core 17 (Early 2021) | |
| Acer Aspire Nitro 5 AN515-55-57GF | |
| Schenker XMG Core 15 Ampere | |
| MSI GF65 Thin 10UE | |
| MSI Alpha 17 A4DEK | |
| Final Fantasy XV Benchmark | |
| 2560x1440 High Quality | |
| Moyenne de la classe Gaming (32.5 - 184.3, n=109, 2 dernières années) | |
| Schenker XMG Core 17 (Early 2021) (1.3, Overboost, TGP: 130 Watt) | |
| Schenker XMG Core 17 (Early 2021) (1.3, Overboost) | |
| Schenker XMG Core 17 (Early 2021) (1.3) | |
| Moyenne NVIDIA GeForce RTX 3060 Laptop GPU (41.1 - 73.7, n=25) | |
| MSI GF65 Thin 10UE (1.3) | |
| 1920x1080 High Quality | |
| Moyenne de la classe Gaming (28.2 - 215, n=134, 2 dernières années) | |
| Schenker XMG Core 17 (Early 2021) (1.3, Overboost, TGP: 130 Watt) | |
| Schenker XMG Core 17 (Early 2021) (1.3, Overboost) | |
| Razer Blade 15 Base Edition 2021, i7-10750H RTX 3060 (1.3) | |
| Schenker XMG Core 17 (Early 2021) (1.3) | |
| Moyenne NVIDIA GeForce RTX 3060 Laptop GPU (55 - 100.9, n=42) | |
| Acer Aspire Nitro 5 AN515-55-57GF (1.3) | |
| MSI GF65 Thin 10UE (1.3) | |
| Schenker XMG Core 17 | |
| MSI Alpha 17 A4DEK | |
| Strange Brigade | |
| 2560x1440 ultra AA:ultra AF:16 | |
| Moyenne de la classe Gaming (52.8 - 350, n=99, 2 dernières années) | |
| Schenker XMG Core 17 (Early 2021) (1.47.22.14 D3D12, Overboost) | |
| Schenker XMG Core 17 (Early 2021) (1.47.22.14 D3D12, Overboost, TGP: 130 Watt) | |
| Schenker XMG Core 17 (Early 2021) (1.47.22.14 D3D12) | |
| Moyenne NVIDIA GeForce RTX 3060 Laptop GPU (75.4 - 118.4, n=17) | |
| 1920x1080 ultra AA:ultra AF:16 | |
| Moyenne de la classe Gaming (46.6 - 456, n=123, 2 dernières années) | |
| Schenker XMG Core 17 (Early 2021) (1.47.22.14 D3D12, Overboost, TGP: 130 Watt) | |
| Schenker XMG Core 17 (Early 2021) (1.47.22.14 D3D12, Overboost) | |
| Razer Blade 15 Base Edition 2021, i7-10750H RTX 3060 (1.47.22.14 D3D12) | |
| Moyenne NVIDIA GeForce RTX 3060 Laptop GPU (102.2 - 166.3, n=43) | |
| Schenker XMG Core 17 (Early 2021) (1.47.22.14 D3D12) | |
| Acer Aspire Nitro 5 AN515-55-57GF (1.47.22.14 D3D12) | |
| MSI GF65 Thin 10UE (1.47.22.14 D3D12) | |
| Shadow of the Tomb Raider | |
| 1920x1080 Highest Preset AA:T | |
| Moyenne de la classe Gaming (131 - 212, n=2, 2 dernières années) | |
| Schenker XMG Core 17 (Early 2021) | |
| Moyenne NVIDIA GeForce RTX 3060 Laptop GPU (84 - 95, n=4) | |
| Schenker XMG Core 17 (Early 2021, RTX 3060, 5800H) | |
| Schenker XMG Core 15 Ampere | |
| Acer Predator Helios 300 PH317-54-75G8 | |
| 2560x1440 Highest Preset AA:T | |
| Moyenne de la classe Gaming (86 - 176, n=2, 2 dernières années) | |
| Schenker XMG Core 15 Ampere | |
| Moyenne NVIDIA GeForce RTX 3060 Laptop GPU (66 - 71, n=3) | |
| Schenker XMG Core 17 (Early 2021, RTX 3060, 5800H) | |
| Schenker XMG Core 17 (Early 2021) | |
| Far Cry 5 | |
| 1920x1080 Ultra Preset AA:T | |
| Moyenne de la classe Gaming (70 - 174, n=35, 2 dernières années) | |
| Schenker XMG Core 17 (Early 2021) (Overboost, TGP: 130 Watt) | |
| Schenker XMG Core 17 (Early 2021) | |
| Moyenne NVIDIA GeForce RTX 3060 Laptop GPU (80 - 120, n=31) | |
| Schenker XMG Core 17 (Early 2021) (Overboost) | |
| Schenker XMG Core 15 Ampere | |
| MSI GF65 Thin 10UE | |
| Acer Aspire Nitro 5 AN515-55-57GF | |
| Schenker XMG Core 17 | |
| 2560x1440 Ultra Preset AA:T | |
| Moyenne de la classe Gaming (80 - 171, n=31, 2 dernières années) | |
| Schenker XMG Core 17 (Early 2021) (Overboost, TGP: 130 Watt) | |
| Schenker XMG Core 15 Ampere | |
| Schenker XMG Core 17 (Early 2021) (Overboost) | |
| Schenker XMG Core 17 (Early 2021) | |
| Moyenne NVIDIA GeForce RTX 3060 Laptop GPU (58 - 92, n=12) | |
| GTA V | |
| 1920x1080 Highest AA:4xMSAA + FX AF:16x | |
| Moyenne de la classe Gaming (26.8 - 186.9, n=125, 2 dernières années) | |
| Schenker XMG Core 17 (Early 2021, RTX 3060, 5800H) | |
| Schenker XMG Core 17 (Early 2021) (Overboost) | |
| Moyenne NVIDIA GeForce RTX 3060 Laptop GPU (69.2 - 109.8, n=46) | |
| Schenker XMG Core 17 (Early 2021) (Overboost, TGP: 130 Watt) | |
| Schenker XMG Core 17 (Early 2021) | |
| Razer Blade 15 Base Edition 2021, i7-10750H RTX 3060 | |
| Acer Aspire Nitro 5 AN515-55-57GF | |
| MSI GF65 Thin 10UE | |
| 2560x1440 Highest AA:4xMSAA + FX AF:16x | |
| Moyenne de la classe Gaming (36.9 - 183.9, n=93, 2 dernières années) | |
| Schenker XMG Core 17 (Early 2021) (Overboost, TGP: 130 Watt) | |
| Schenker XMG Core 17 (Early 2021) (Overboost) | |
| Schenker XMG Core 17 (Early 2021) | |
| Moyenne NVIDIA GeForce RTX 3060 Laptop GPU (52 - 86.5, n=23) | |
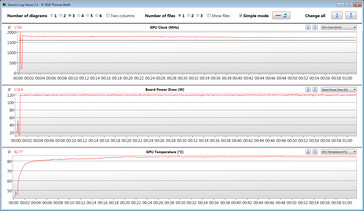
Afin d'évaluer si les fréquences d'images restent également constantes sur une plus longue période, nous avons lancé le jeu"The Witcher 3" pendant environ 60 minutes à la résolution Full-HD et aux paramètres de qualité maximum, sans déplacer le personnage du jeu. Nous ne remarquons aucune baisse des taux d'images.
| Bas | Moyen | Élevé | Ultra | QHD | |
|---|---|---|---|---|---|
| GTA V (2015) | 179 | 172 | 150 | 86.9 | 74.3 |
| The Witcher 3 (2015) | 302 | 229 | 144 | 79.5 | |
| Dota 2 Reborn (2015) | 146 | 136 | 124 | 118 | |
| Final Fantasy XV Benchmark (2018) | 141 | 105 | 79.9 | 59.6 | |
| X-Plane 11.11 (2018) | 89.5 | 81.7 | 68.7 | ||
| Far Cry 5 (2018) | 145 | 113 | 108 | 102 | 82 |
| Strange Brigade (2018) | 345 | 191 | 154 | 134 | 101 |
| Shadow of the Tomb Raider (2018) | 113 | 106 | 102 | 95 | 66 |
| Watch Dogs Legion (2020) | 82.1 | 77 | 70.7 | 50.8 | 33.9 |
| Dirt 5 (2020) | 140 | 102 | 89.1 | 71.5 | 56.1 |
| Yakuza Like a Dragon (2020) | 127 | 106 | 105 | 92.2 | 61.8 |
| Outriders (2021) | 122 | 103 | 98.9 | 90.1 | 65.1 |
| Resident Evil Village (2021) | 160 | 140 | 136 | 121 | 81.6 |
| Mass Effect Legendary Edition (2021) | 109 | 92.9 | 91.9 | ||
| Days Gone (2021) | 173 | 121 | 107 | 81.1 | 58.9 |
Emissions - L'ordinateur Schenker peut produire beaucoup de bruit
Émissions sonores
En fonctionnement au ralenti et sous faible charge, l'évolution du bruit reste dans les limites. Les ventilateurs fonctionnent alors généralement à faible vitesse. En charge, ils montent en régime et nous enregistrons un niveau sonore maximal de 54 dB(A) (test de stress) et 51 dB(A) (test"The Witcher 3"), ce qui rend l'utilisation d'un casque presque obligatoire
Degré de la nuisance sonore
| Au repos |
| 30 / 32 / 36 dB(A) |
| Fortement sollicité |
| 53 / 54 dB(A) |
 | ||
30 dB silencieux 40 dB(A) audible 50 dB(A) bruyant |
||
min: | ||
| Schenker XMG Core 17 (Early 2021) i7-10870H, GeForce RTX 3060 Laptop GPU | MSI Alpha 17 A4DEK R7 4800H, Radeon RX 5600M | Acer Predator Helios 300 PH317-54-75G8 i7-10750H, GeForce RTX 2060 Mobile | Medion Erazer Beast X10 MD61804 i7-10750H, GeForce RTX 2070 Super Max-Q | Schenker XMG Core 17 i7-9750H, GeForce GTX 1660 Ti Mobile | Schenker XMG Core 17 Comet Lake i7-10750H, GeForce GTX 1650 Ti Mobile | Moyenne de la classe Gaming | |
|---|---|---|---|---|---|---|---|
| Noise | 6% | 6% | 3% | 1% | 9% | 11% | |
| arrêt / environnement * (dB) | 25 | 25 -0% | 24 4% | 25 -0% | 30 -20% | 25 -0% | 24.2 ? 3% |
| Idle Minimum * (dB) | 30 | 31 -3% | 25 17% | 26 13% | 30 -0% | 25 17% | 26 ? 13% |
| Idle Average * (dB) | 32 | 32 -0% | 30 6% | 29 9% | 32 -0% | 31 3% | 27.6 ? 14% |
| Idle Maximum * (dB) | 36 | 33 8% | 37 -3% | 35 3% | 35 3% | 32 11% | 30.2 ? 16% |
| Load Average * (dB) | 53 | 38 28% | 48 9% | 52 2% | 47 11% | 48 9% | 43.1 ? 19% |
| Witcher 3 ultra * (dB) | 51 | 46 10% | 50 2% | 53 -4% | 48 6% | 44 14% | |
| Load Maximum * (dB) | 54 | 54 -0% | 52 4% | 55 -2% | 51 6% | 51 6% | 53.7 ? 1% |
* ... Moindre est la valeur, meilleures sont les performances
Températures
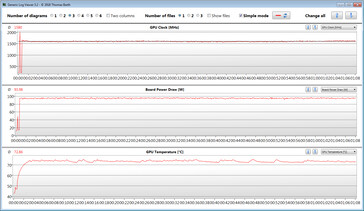
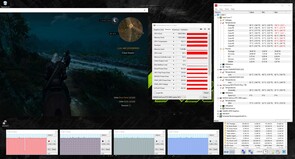
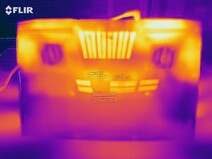
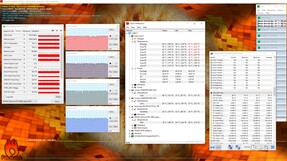
Le CPU et le GPU sont soumis à notre test de stress (Prime95 et Furmark fonctionnant pendant au moins une heure) à 3,2 GHz et 1327 MHz respectivement. Le test de stress représente un scénario extrême, et nous utilisons ce test pour évaluer si le système reste également stable en pleine charge
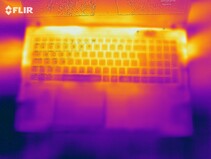
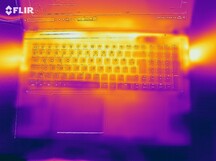
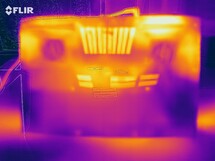
Compte tenu du matériel qu'il contient, l'ordinateur portable ne chauffe pas trop pendant le test de résistance. Le développement de chaleur est légèrement plus élevé lors de notre test"The Witcher 3". Dans les deux cas, vous ne devez pas faire fonctionner l'ordinateur portable sur vos genoux.
(±) La température maximale du côté supérieur est de 44 °C / 111 F, par rapport à la moyenne de 40.4 °C / 105 F, allant de 21.2 à 68.8 °C pour la classe Gaming.
(-) Le fond chauffe jusqu'à un maximum de 50 °C / 122 F, contre une moyenne de 43.3 °C / 110 F
(+) En utilisation inactive, la température moyenne du côté supérieur est de 28.9 °C / 84 F, par rapport à la moyenne du dispositif de 33.9 °C / 93 F.
(±) En jouant à The Witcher 3, la température moyenne du côté supérieur est de 37.3 °C / 99 F, alors que la moyenne de l'appareil est de 33.9 °C / 93 F.
(+) Les repose-poignets et le pavé tactile atteignent la température maximale de la peau (32 °C / 89.6 F) et ne sont donc pas chauds.
(-) La température moyenne de la zone de l'appui-paume de dispositifs similaires était de 28.8 °C / 83.8 F (-3.2 °C / #-5.8 F).
| Schenker XMG Core 17 (Early 2021) i7-10870H, GeForce RTX 3060 Laptop GPU | MSI Alpha 17 A4DEK R7 4800H, Radeon RX 5600M | Acer Predator Helios 300 PH317-54-75G8 i7-10750H, GeForce RTX 2060 Mobile | Medion Erazer Beast X10 MD61804 i7-10750H, GeForce RTX 2070 Super Max-Q | Schenker XMG Core 17 i7-9750H, GeForce GTX 1660 Ti Mobile | Schenker XMG Core 17 Comet Lake i7-10750H, GeForce GTX 1650 Ti Mobile | Moyenne de la classe Gaming | |
|---|---|---|---|---|---|---|---|
| Heat | 16% | -6% | -4% | -2% | 7% | -1% | |
| Maximum Upper Side * (°C) | 44 | 44 -0% | 53 -20% | 51 -16% | 47 -7% | 45 -2% | 45.8 ? -4% |
| Maximum Bottom * (°C) | 50 | 43 14% | 59 -18% | 56 -12% | 50 -0% | 48 4% | 48.8 ? 2% |
| Idle Upper Side * (°C) | 30 | 25 17% | 29 3% | 31 -3% | 34 -13% | 27 10% | 31.4 ? -5% |
| Idle Bottom * (°C) | 36 | 24 33% | 32 11% | 30 17% | 32 11% | 30 17% | 34.4 ? 4% |
* ... Moindre est la valeur, meilleures sont les performances
Haut-parleurs
Schenker XMG Core 17 (Early 2021) analyse audio
(+) | les haut-parleurs peuvent jouer relativement fort (82# dB)
Basses 100 - 315 Hz
(-) | presque aucune basse - en moyenne 27.5% plus bas que la médiane
(±) | la linéarité des basses est moyenne (12.8% delta à la fréquence précédente)
Médiums 400 - 2000 Hz
(+) | médiane équilibrée - seulement 2.3% de la médiane
(+) | les médiums sont linéaires (5.4% delta à la fréquence précédente)
Aiguës 2 - 16 kHz
(+) | des sommets équilibrés - à seulement 3.5% de la médiane
(±) | la linéarité des aigus est moyenne (9.9% delta à la fréquence précédente)
Globalement 100 - 16 000 Hz
(±) | la linéarité du son global est moyenne (17.5% de différence avec la médiane)
Par rapport à la même classe
» 48% de tous les appareils testés de cette catégorie étaient meilleurs, 12% similaires, 40% pires
» Le meilleur avait un delta de 6%, la moyenne était de 18%, le pire était de 132%.
Par rapport à tous les appareils testés
» 33% de tous les appareils testés étaient meilleurs, 9% similaires, 59% pires
» Le meilleur avait un delta de 4%, la moyenne était de 24%, le pire était de 134%.
Gestion de l'énergie - Le Core 17 offre une autonomie acceptable
Consommation d'énergie
Il n'y a rien de remarquable en termes de consommation d'énergie. Sur toute la gamme de charges, les valeurs restent à un niveau normal pour le matériel utilisé ici. L'alimentation électrique est évaluée à 180 watts
| Éteint/en veille | |
| Au repos | |
| Fortement sollicité |
|
Légende:
min: | |
| Schenker XMG Core 17 (Early 2021) i7-10870H, GeForce RTX 3060 Laptop GPU | MSI Alpha 17 A4DEK R7 4800H, Radeon RX 5600M | Acer Predator Helios 300 PH317-54-75G8 i7-10750H, GeForce RTX 2060 Mobile | Medion Erazer Beast X10 MD61804 i7-10750H, GeForce RTX 2070 Super Max-Q | Schenker XMG Core 17 i7-9750H, GeForce GTX 1660 Ti Mobile | Schenker XMG Core 17 Comet Lake i7-10750H, GeForce GTX 1650 Ti Mobile | Moyenne de la classe Gaming | |
|---|---|---|---|---|---|---|---|
| Power Consumption | 23% | 25% | -23% | 21% | 16% | -9% | |
| Idle Minimum * (Watt) | 13 | 9 31% | 6 54% | 19 -46% | 10 23% | 12 8% | 13.7 ? -5% |
| Idle Average * (Watt) | 16 | 12 25% | 11 31% | 22 -38% | 13 19% | 15 6% | 19.5 ? -22% |
| Idle Maximum * (Watt) | 29 | 18 38% | 19 34% | 30 -3% | 21 28% | 24 17% | 25.9 ? 11% |
| Load Average * (Watt) | 100 | 76 24% | 96 4% | 118 -18% | 89 11% | 105 -5% | 110.3 ? -10% |
| Witcher 3 ultra * (Watt) | 173 | 136 21% | 144 17% | 176 -2% | 128 26% | 93 46% | |
| Load Maximum * (Watt) | 213 | 222 -4% | 197 8% | 274 -29% | 177 17% | 168 21% | 258 ? -21% |
* ... Moindre est la valeur, meilleures sont les performances
Autonomie de la batterie
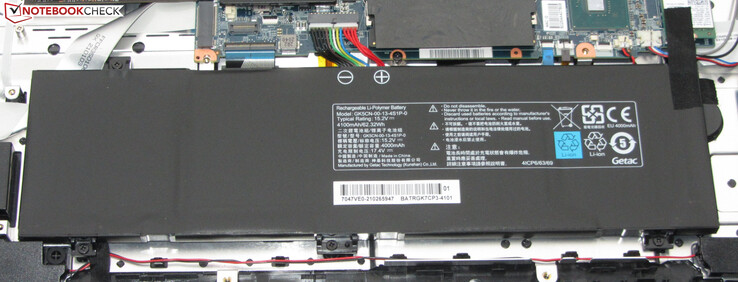
Dans le test WLAN (chargement de sites web via un script) et le test vidéo (court-métrage Big Buck Bunny tournant en boucle ; codage H.264, FHD), le Core 17 tient respectivement 4:53 heures et 4:43 heures. Pendant les deux tests, les fonctions d'économie d'énergie de l'ordinateur portable sont désactivées et la luminosité de l'écran est réduite à environ 150 cd/m². Pendant l'exécution du test vidéo, les modules de communication ont également été désactivés
| Schenker XMG Core 17 (Early 2021) i7-10870H, GeForce RTX 3060 Laptop GPU, 62 Wh | MSI Alpha 17 A4DEK R7 4800H, Radeon RX 5600M, 65 Wh | Acer Predator Helios 300 PH317-54-75G8 i7-10750H, GeForce RTX 2060 Mobile, 59 Wh | Medion Erazer Beast X10 MD61804 i7-10750H, GeForce RTX 2070 Super Max-Q, 91.2 Wh | Schenker XMG Core 17 i7-9750H, GeForce GTX 1660 Ti Mobile, 46.74 Wh | Schenker XMG Core 17 Comet Lake i7-10750H, GeForce GTX 1650 Ti Mobile, 62.3 Wh | Moyenne de la classe Gaming | |
|---|---|---|---|---|---|---|---|
| Autonomie de la batterie | 33% | 26% | 56% | 4% | 4% | 35% | |
| Reader / Idle (h) | 7.7 | 10.5 36% | 8.2 6% | 11.4 48% | 8.1 5% | 9.17 ? 19% | |
| H.264 (h) | 4.7 | 5.9 26% | 8.5 81% | 5.3 13% | 8.05 ? 71% | ||
| WiFi v1.3 (h) | 4.9 | 7.3 49% | 5.1 4% | 6.8 39% | 4.7 -4% | 5.1 4% | 6.73 ? 37% |
| Load (h) | 1.3 | 1.5 15% | 2.2 69% | 2 54% | 1.3 0% | 1.458 ? 12% |
Points positifs
Points négatifs
Verdict
Le CPUCore i7-10870H(maxPL1/2: 120 watts) et leGPUGeForce RTX-3060 pour ordinateur portable (maxTGP :130 watts) font apparaître à l'écran tous les jeux actuels en douceur. Vous n'aurez pas à vous soucier de l'étranglement, et le CPU et le GPU sont toujours en mesure de maintenir leurs performances constantes.
Avec le XMG Core 17 (début 2021), Schenker propose un ordinateur portable de jeu de milieu de gamme bien équilibré.
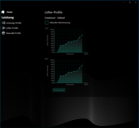
Bien que le contrôle automatique du ventilateur rende l'ordinateur portable très bruyant sous charge, vous pouvez faire quelques ajustements ici, et le Centre de contrôle offre un contrôle manuel des courbes du ventilateur. En particulier pendant le jeu (test"The Witcher 3"), il y a encore un certain potentiel d'optimisation par rapport aux autres portables RTX 3060.
L'écran (WQHD, IPS, 165 Hz) offre une bonne valeur de luminosité, des angles de vision stables, des temps de réponse courts, une bonne reproduction des couleurs et une couverture de l'espace colorimétrique très décente. Cependant, le contraste pourrait être plus élevé, et l'autonomie de la batterie n'inspire personne non plus.
Notez que certaines des évaluations des catégories individuelles sont différentes de celles du Core 17 de 2019, car nous avons mis à jour le système d'évaluation. Cela signifie que les évaluations des deux modèles Core 17 ne sont pas comparables.
Prix et disponibilité
Le Schenker XMG Core 17 (début 2021) peut être configuré individuellement sur le site Schenker (Bestware) boutique en ligne à partir d'environ 1450 Euros (~1773$). La configuration de l'équipement qui nous a été fournie pour les tests est disponible pour environ 1840 Euros (~$2250)
Schenker XMG Core 17 (Early 2021)
- 05/31/2021 v7 (old)
Sascha Mölck


